The potential of a herbicide resistant maize technology for Striga control in Africa
Field Crops Research 173 (2015) 22–29
Contents lists available at ScienceDirect
Field Crops Research
jou rn al hom ep age: www.elsev ier .com/ locate / fc r
Marker-assisted introgression improves Striga resistance in anEritrean Farmer-Preferred Sorghum Variety
Tadesse Yohannesa,f, Abraha Tesfamichaelb, Dan Kiambic, Rolf Folkertsmad,C. Tom Hashe, Kahiu Ngugi f, Eunice Mutitu f, Negusse Abrahaa, Mussie Weldetsiona,Charles Mugoyag, Clet W. Masigag, Santie de Villiersh,i,∗
a National Agricultural Research Institute, PO Box 4627, Asmara, Eritreab Hamelmalo Agricultural College, PO Box 397, Keren, Eritreac African Biodiversity Conservation and Innovations Centre, PO Box 100882-00101, Nairobi, Kenyad Monsanto Holland B.V., Bergschenhoek, The Netherlandse ICRISAT-Sahelian Center, BP 12404 Niamey, Nigerf University of Nairobi, PO Box 39063-00623, Nairobi, Kenyag Association for Strengthening Agricultural Research in Eastern and Central Africa, PO Box 765, Entebbe, Ugandah International Crops Research Institute for the Semi-Arid Tropics (ICRISAT), PO Box 39063-00623, Nairobi, Kenyai Pwani University, PO Box 195-80108, Kilifi, Kenya
a r t i c l e i n f o
Article history:Received 7 October 2014Received in revised form13 December 2014Accepted 13 December 2014
Keywords:Marker-assisted selectionSSRSorghumStrigaEritrea
a b s t r a c t
The parasitic weed Striga hermonthica hampers the production of sorghum, the most important cerealcrop in Eritrea. This weed has a complex mode of infestation that adapts to many hosts and environ-ments, complicating conventional breeding for resistance, which is the only form of crop improvementavailable to Eritrean breeders, but has failed. This study aimed at improving resistance against this par-asite by transferring 5 Striga resistant Quantitative Trait Loci (QTLs) from resistance donor N13 to Strigasusceptible Farmer-Preferred Sorghum Variety (FPSV) Hugurtay from Eritrea. The method involved back-crossing using marker-assisted selection (MAS) and evaluation of the best introgressed lines for Strigaresistance in artificially infested fields. Foreground selection was performed with up to 11 polymorphicsimple sequence repeat (SSR) markers linked to Striga resistance QTLs, while background selection wasconducted in the BC3F2 generation with 27 polymorphic unlinked SSR markers to identify the best recov-ery of the recurrent parent (RP) genetic background. Out of 84 BC3F3 lines, L2P3-B, L1P5-A and L2P5P35performed best with respect to both grain yield and reduced Striga infestation. These lines were moreresistant to Striga than Hugurtay, but less resistant than N13. The three lines yielded twice as much as N13,with Area Under Striga Number Progression Curve (AUSNPC) values on average 18% higher than that ofN13 and 38% lower than that of Hugurtay. This suggests that the introgressed QTLs conferred significantStriga resistance and yield advantage to these BC3F3 backcross progenies under Striga pressure. Theselines have good potential for future release and demonstrate that when MAS is available to conventionalbreeders, even in countries with no genotyping facilities, it is a useful tool for enhancement, expediencyand precision in crop improvement.
© 2015 Published by Elsevier B.V.
1. Introduction
Sorghum [Sorghum bicolor (L.) Moench] is the world’s fifthmost important cereal crop after wheat, maize, rice, and barley(FAOSTAT, 2011). Sorghum forms an important dietary componentof many people globally, especially in the arid and semi-arid parts
∗ Corresponding author at: Pwani University, PO Box 195-80108, Kilifi, Kenya.Tel.: +254 729369758.
E-mail address: [email protected] (S. de Villiers).
of Africa and Asia. In Eritrea sorghum grain is a major staple foodprepared as ‘enjera’ (leavened bread) or as thick porridge, and thestover is used for animal feed. Sorghum is widely grown in thelowland and mid-highland regions of Eritrea where rainfall is toolow for cultivation of most other cereals (Tesfamichael et al., 2013).Nationally, sorghum is grown on more than 200,000 ha annuallyand accounts for 50% of total food grain production, but with aver-age productivity of less than 1 t ha−1 (Ministry of Agriculture, 2010).
The major biotic constraint to sorghum production in Eritreais Striga hermonthica, which affects the majority of farmers in thewestern part of the country in areas such as Goluj and Shambiko
http://dx.doi.org/10.1016/j.fcr.2014.12.0080378-4290/© 2015 Published by Elsevier B.V.
Text

T. Yohannes et al. / Field Crops Research 173 (2015) 22–29 23
Fig. 1. Scheme of crossing, backcrossing, selfing and marker-assisted selection to generate Striga resistant introgression lines in Farmer Preferred Sorghum Variety, Hugurtay,background.
sub-regions. It is prevalent where continuous mono-cropping ispracticed and where wild sorghum is prevalent, and its infesta-tion is aggravated by frequent droughts. Yield losses due to Strigain Eritrea are estimated at 20–50% of annual sorghum productiondepending on the rainfall situation.
Efforts to control Striga by conventional breeding for resistantvarieties are time consuming and have met with few successesunless aided by laboratory screening methods in advanced labo-ratories (Ejeta and Gressel, 2007). MAS is a useful tool in plantbreeding programs for more efficient selection (Lammerts vanBueren et al., 2010) and involves the identification of genotypescarrying desirable alleles, using linked genetic markers. Breederspractice MAS when an important trait that is difficult to assessphenotypically, is tightly linked to a Mendelian trait or molec-ular markers that can be easily scored (Lammerts van Buerenet al., 2010). The use of molecular markers to breed for Strigaresistance in sorghum has recently been shown to be possible(Ejeta and Gressel, 2007; Gammar and Mohamed, 2013; Mohamedet al., 2014). Haussmann et al. (2004) identified molecular markerslinked to Striga resistance QTLs having mechanisms over and abovethe “low germination stimulant” trait. These authors reported 5genomic regions (QTLs) associated with stable Striga resistancefrom resistant variety N13 that were identified based on screeningacross a series of field trials in Mali and Kenya. Three QTLs wereidentified, one each on linkage groups SBI-01, SBI-02 and SBI-06and 2 QTLs on linkage group SBI-05 using the revised linkage groupdesignations proposed by Kim et al. (2004).
Although MAS is an accepted and often routine technology inmodern breeding programs with access to state-of-the-art geno-typing facilities, breeders in many developing countries includingEritrea improve crops using only phenotypic selection for a traitlike Striga resistance, this entails challenging every generation ininfested fields to identify superior individuals. Seeds of these indi-viduals then must be increased for replicated field trials to confirmthat the phenotype is true. Conventional backcross breeding takesat least 6 or more generations including the initial crossing genera-tion (Hospital and Charcosset, 1997), as well as two generations ofselfing following production of the BC6F1 generation (to produce
BC6F3 seed on BC6F2 individuals), and at least one generationof progeny-based testing to identify the desired introgression(s)homozygotes. An important advantage of MAS is that it can reducethe number of backcross generations needed to arrive at the targetvariety with the introgressed trait(s) (Hospital and Charcosset,1997; Frisch et al., 1999). For sorghum, with adequate numbers oflinked markers, the desired introgression can be achieved within2–4 backcross generations.
This study aimed to provide Eritrean breeders access to MAStechnology in a collaborative experimental design that made useof genotyping facilities and expertise at ICRISAT-Nairobi. All of thefield-based work of crossing and advancing generations was donein Eritrea and genotyping was done at ICRISAT-Nairobi with theultimate objective to transfer resistance alleles at the 5 identifiedStriga resistance QTLs from N13 to Hugurtay, a popular but Striga-susceptible Farmer-Preferred Sorghum Variety (FPSV) in Eritrea,using marker-assisted backcrossing (MABC) followed by evalua-tion of the introgressed lines for improved Striga resistance underartificially infested conditions in the field.
2. Materials and methods
Hugurtay (FPSV) was crossed with N13 (resistance donor) andthree backcross generations were generated with Hugurtay as RP(Fig. 1). All the breeding activities, selection and collection of tissuesamples for DNA extraction were done in Eritrea, and DNA sam-ple preparation and genotyping, and final field evaluation underenhanced Striga pressure, were done in Kenya.
2.1. SSR genotyping
Tissue samples were collected in Eritrea from individual plantsand shipped to ICRISAT-Nairobi for genotyping. DNA extraction wasperformed following Mace et al. (2003) with exclusion of the phe-nol extraction step. The DNA quantity and quality was checkedusing a Nanodrop® spectrophotometer (Thermo Scientific) andelectrophoresis on agarose gels (0.8%, w/v) stained with GelRed(Biotium, USA).
24 T. Yohannes et al. / Field Crops Research 173 (2015) 22–29
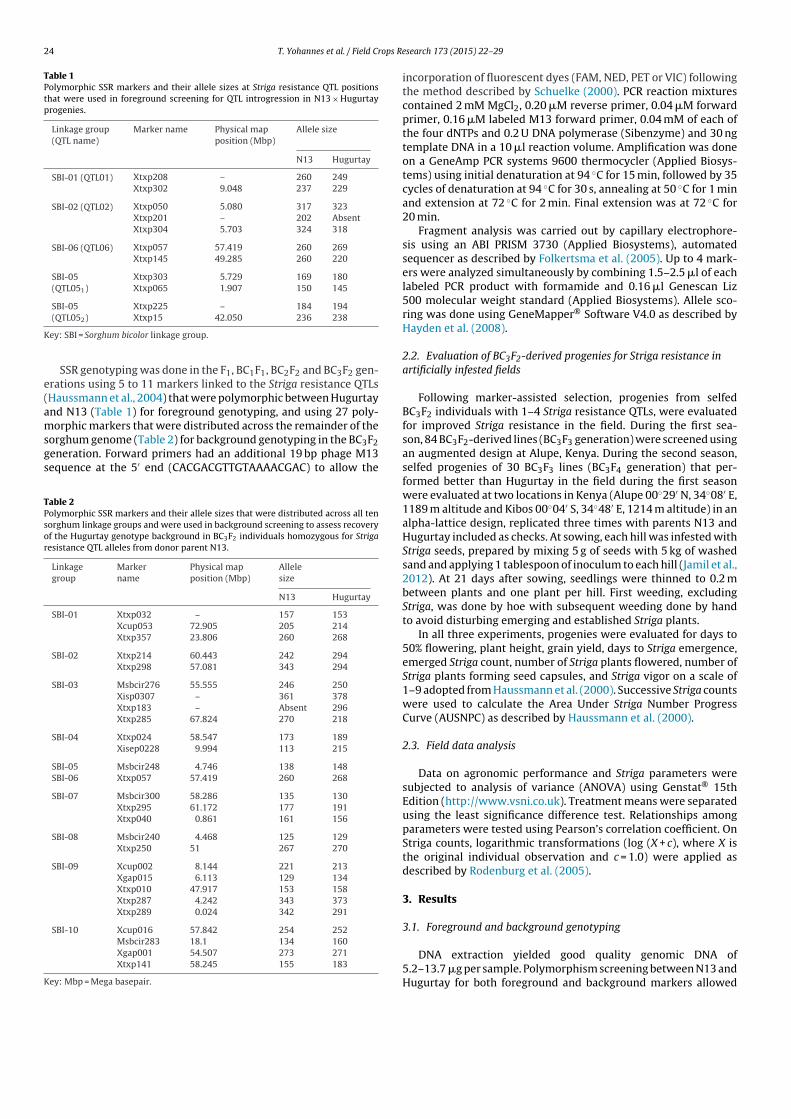
Table 1Polymorphic SSR markers and their allele sizes at Striga resistance QTL positionsthat were used in foreground screening for QTL introgression in N13 × Hugurtayprogenies.
Linkage group(QTL name)
Marker name Physical mapposition (Mbp)
Allele size
N13 Hugurtay
SBI-01 (QTL01) Xtxp208 – 260 249Xtxp302 9.048 237 229
SBI-02 (QTL02) Xtxp050 5.080 317 323Xtxp201 – 202 AbsentXtxp304 5.703 324 318
SBI-06 (QTL06) Xtxp057 57.419 260 269Xtxp145 49.285 260 220
SBI-05(QTL051)
Xtxp303 5.729 169 180Xtxp065 1.907 150 145
SBI-05(QTL052)
Xtxp225 – 184 194Xtxp15 42.050 236 238
Key: SBI = Sorghum bicolor linkage group.
SSR genotyping was done in the F1, BC1F1, BC2F2 and BC3F2 gen-erations using 5 to 11 markers linked to the Striga resistance QTLs(Haussmann et al., 2004) that were polymorphic between Hugurtayand N13 (Table 1) for foreground genotyping, and using 27 poly-morphic markers that were distributed across the remainder of thesorghum genome (Table 2) for background genotyping in the BC3F2generation. Forward primers had an additional 19 bp phage M13sequence at the 5′ end (CACGACGTTGTAAAACGAC) to allow the
Table 2Polymorphic SSR markers and their allele sizes that were distributed across all tensorghum linkage groups and were used in background screening to assess recoveryof the Hugurtay genotype background in BC3F2 individuals homozygous for Strigaresistance QTL alleles from donor parent N13.
Linkagegroup
Markername
Physical mapposition (Mbp)
Allelesize
N13 Hugurtay
SBI-01 Xtxp032 – 157 153Xcup053 72.905 205 214Xtxp357 23.806 260 268
SBI-02 Xtxp214 60.443 242 294Xtxp298 57.081 343 294
SBI-03 Msbcir276 55.555 246 250Xisp0307 – 361 378Xtxp183 – Absent 296Xtxp285 67.824 270 218
SBI-04 Xtxp024 58.547 173 189Xisep0228 9.994 113 215
SBI-05 Msbcir248 4.746 138 148SBI-06 Xtxp057 57.419 260 268
SBI-07 Msbcir300 58.286 135 130Xtxp295 61.172 177 191Xtxp040 0.861 161 156
SBI-08 Msbcir240 4.468 125 129Xtxp250 51 267 270
SBI-09 Xcup002 8.144 221 213Xgap015 6.113 129 134Xtxp010 47.917 153 158Xtxp287 4.242 343 373Xtxp289 0.024 342 291
SBI-10 Xcup016 57.842 254 252Msbcir283 18.1 134 160Xgap001 54.507 273 271Xtxp141 58.245 155 183
Key: Mbp = Mega basepair.
incorporation of fluorescent dyes (FAM, NED, PET or VIC) followingthe method described by Schuelke (2000). PCR reaction mixturescontained 2 mM MgCl2, 0.20 !M reverse primer, 0.04 !M forwardprimer, 0.16 !M labeled M13 forward primer, 0.04 mM of each ofthe four dNTPs and 0.2 U DNA polymerase (Sibenzyme) and 30 ngtemplate DNA in a 10 !l reaction volume. Amplification was doneon a GeneAmp PCR systems 9600 thermocycler (Applied Biosys-tems) using initial denaturation at 94 ◦C for 15 min, followed by 35cycles of denaturation at 94 ◦C for 30 s, annealing at 50 ◦C for 1 minand extension at 72 ◦C for 2 min. Final extension was at 72 ◦C for20 min.
Fragment analysis was carried out by capillary electrophore-sis using an ABI PRISM 3730 (Applied Biosystems), automatedsequencer as described by Folkertsma et al. (2005). Up to 4 mark-ers were analyzed simultaneously by combining 1.5–2.5 !l of eachlabeled PCR product with formamide and 0.16 !l Genescan Liz500 molecular weight standard (Applied Biosystems). Allele sco-ring was done using GeneMapper® Software V4.0 as described byHayden et al. (2008).
2.2. Evaluation of BC3F2-derived progenies for Striga resistance inartificially infested fields
Following marker-assisted selection, progenies from selfedBC3F2 individuals with 1–4 Striga resistance QTLs, were evaluatedfor improved Striga resistance in the field. During the first sea-son, 84 BC3F2-derived lines (BC3F3 generation) were screened usingan augmented design at Alupe, Kenya. During the second season,selfed progenies of 30 BC3F3 lines (BC3F4 generation) that per-formed better than Hugurtay in the field during the first seasonwere evaluated at two locations in Kenya (Alupe 00◦29′ N, 34◦08′ E,1189 m altitude and Kibos 00◦04′ S, 34◦48′ E, 1214 m altitude) in analpha-lattice design, replicated three times with parents N13 andHugurtay included as checks. At sowing, each hill was infested withStriga seeds, prepared by mixing 5 g of seeds with 5 kg of washedsand and applying 1 tablespoon of inoculum to each hill (Jamil et al.,2012). At 21 days after sowing, seedlings were thinned to 0.2 mbetween plants and one plant per hill. First weeding, excludingStriga, was done by hoe with subsequent weeding done by handto avoid disturbing emerging and established Striga plants.
In all three experiments, progenies were evaluated for days to50% flowering, plant height, grain yield, days to Striga emergence,emerged Striga count, number of Striga plants flowered, number ofStriga plants forming seed capsules, and Striga vigor on a scale of1–9 adopted from Haussmann et al. (2000). Successive Striga countswere used to calculate the Area Under Striga Number ProgressCurve (AUSNPC) as described by Haussmann et al. (2000).
2.3. Field data analysis
Data on agronomic performance and Striga parameters weresubjected to analysis of variance (ANOVA) using Genstat® 15thEdition (http://www.vsni.co.uk). Treatment means were separatedusing the least significance difference test. Relationships amongparameters were tested using Pearson’s correlation coefficient. OnStriga counts, logarithmic transformations (log (X + c), where X isthe original individual observation and c = 1.0) were applied asdescribed by Rodenburg et al. (2005).
3. Results
3.1. Foreground and background genotyping
DNA extraction yielded good quality genomic DNA of5.2–13.7 !g per sample. Polymorphism screening between N13 andHugurtay for both foreground and background markers allowed
T. Yohannes et al. / Field Crops Research 173 (2015) 22–29 25
Table 3Number of individuals genotyped in the F1 and subsequent backcross (BC)generations.
Generation Individualsgenotyped
Individuals with QTLsintrogressed
Individuals advancedto next generation
F1 10 10 4BC1F1 23 23 10BC2F1 0 – 17BC2F2 58 42 20BC3F1 0 – 11BC3F2 341 216 84
Key: QTL = quantitative trait locus.
selection of a total of 11 foreground SSRs (Table 1) and 27 back-ground SSR markers (Table 2), which were used to screen oneor more generations of the backcross progenies. Foreground SSRsare markers that are linked to the target QTL, which enableidentification and selection of plants having the alleles of the donorparent at the target loci. Background SSRs are markers that arespread across the genome and not linked to the target QTL, whichhelp to assess the recovery of the recurrent parent genotype.
For genotyping the F1, BC1F1 and BC2F2 generations, only 7polymorphic foreground SSR markers were identified that allowedindirect selection for 4 Striga resistance QTLs: Xtxp208 and Xtxp302(linked to QTL01), Xtxp050, Xtxp201 and Xtxp304 (linked toQTL02), Xtxp303 (linked to QTL051) and Xtxp225 (linked toQTL052). No markers were available to screen for QTL06. The num-ber of individuals genotyped and selected during each generation,excluding the parents, is shown in Table 3.
In F1, 10 plants were genotyped with 6 foreground markers toconfirm that they were true hybrids of N13 and Hugurtay. In theBC1F1 generation 23 plants were screened with the 7 polymorphicforeground markers, of which 12 BC1F1s showed introgression of 1QTL, 9 of 2 QTLs and 2 of 3 QTLs (Table 4). Ten representative BC1F1plants with different QTL introgression combinations were selectedand advanced to BC2F1. Seventeen plants of BC2F1 were selfed andsubsequently, foreground genotyping in BC2F2 was done on 58 indi-viduals with the same 7 markers as used for the BC1F1 plants. Fromthese, 42 plants were identified with introgressed QTLs of which23 plants showed homozygous donor QTL alleles (Table 4) and 20of these plants were selected for advance to BC3F1.
Selfed seeds from 11 BC3F1 plants were sent to ICRISAT-Kenyawhere the BC3F2 plants were genotyped for QTL introgressions
Table 4Summary of the various combinations of QTLs introgressed in heterozygous state inBC1F1 and in homozygous state in BC2F2.
QTL combinationsa Backcross generation
BC1F1 BC2F2
Single introgressionsQTL01 0 3QTL02 0 0QTL051 0 1QTL052 15 3
Double introgressionsQTL01, QTL02 0 3QTL01, QTL052 0 1QTL02, QTL052 5 0QTL051, QTL052 1 2
Triple introgressionsQTL01, QTL02, QTL051 0 1QTL01, QTL02, QTL052 0 1QTL01, QTL051, QTL052 0 8QTL02, QTL051, QTL052 1 0
4 QTLs introgressedQTL01, QTL02, QTL051, QTL052 1 0Total individuals with QTLs 23 23
a QTL combinations that were not identified in any individuals were not includedhere. QTL06 was not screened for as polymorphic markers linked to this locus werenot available at the time.
and recurrent parent genome background recovery. By this pointadditional polymorphic markers had been identified, of which atleast 2 were linked to each of the 5 QTLs, as indicated in Table 1.A total of 341 BC3F2 individuals were screened using the 11polymorphic foreground SSR markers. Of these, 216 were foundto have from 1 to 4 homozygous introgressed QTLs as shownin Table 5.
3.2. Field evaluation of BC3F3 lines under Striga infestation
Combined ANOVA for grain yield across the 2 locations inthe second season of field screening in Kenya under Striga-infested conditions revealed that genotypes, environments andgenotype × environment (G × E) interaction components of vari-ance were significant (Table 6). However, magnitude of the G × Einteraction variation was small compared to that for genotype.
Table 5Summary of QTL introgressions fixed in BC3F2 lines.
QTL combination No. of BC3F2 lines BC3F2 lines with QTLs introgressed
1 QTL 2 QTLs 3 QTLs 4 QTLs
QTL02 31QTL06 13QTL051 4QTL052 93 141QTL01, QTL02 1QTL01, QTL06 1QTL01, QTL052 3QTL02, QTL06 25QTL02, QTL052 13QTL06, QTL052 8QTL051, QTL052 5 56QTL01, QTL02, QTL06 3QTL01, QTL06, QTL052 4QTL01, QTL051, QTL052 3QTL02, QTL06, QTL052 5QTL02, QTL051, QTL052 2 17QTL01, QTL02, QTL06, QTL052 2 2
Sub-total 216Individuals with no introgressed QTLs 125Total genotyped BC3F2 individuals 341
26 T. Yohannes et al. / Field Crops Research 173 (2015) 22–29
Table 6Combined analysis of variance for grain yield across locations.
Fixed term Wald statistic n.d.f. F statistic d.d.f. F pr
Env 11.19 1 11.19 26.1 0.003Gen 10,515.9 31 334.57 90.9 <0.001Env × Gen 129.36 31 4.12 91 <0.001
Key: Env = Environment, Gen = Genotype, n.d.f. = numerator degrees of freedom,d.d.f. = denominator degrees of freedom, F pr = F probability.
Genotypes differed significantly (P < 0.05) for all the observedtraits (Table 7). The G × E interaction was also significant for param-eters like plant height, grain yield, days to Striga emergence,AUSNPC, number of Striga plants that flowered and Striga vigor.G × E interaction was not significant for days to 50% flowering andnumber of Striga plants forming capsules/seeds.
Parameters used to evaluate improved backcross genotypes forStriga resistance were grain yield under Striga pressure, followedby comparisons with resistant parent N13 in both locations forlow AUSNPC, days to Striga emergence and number of Striga seedcapsules formed, as presented in Table 7, following the recom-mendations of Haussmann et al. (2000). Taller plants and bettergrain yield as well as low AUSNPC, days to Striga emergence, daysto Striga flowering and number of capsules formed was observedfor genotypes 23 (L2P3-B), 12 (L2P5P35), 22 (L1P5-A), 24 (L2P6-A)and 25 (L2P7-A). All of these genotypes had either 3 or 4 QTLs fixed
Table 8Pearson’s correlation coefficients for various Striga resistance parameters measuredat Alupe and Kibos during September 2012–February 2013.
Correlated traits Alupe Kibos Combined
Days to Striga emergence vs AUSNPC −0.6028** −0.7865** −0.8172**
Days to Striga emergence vs grain yield 0.2482 0.5319* 0.4759*
Days to Striga emergence vs plant height 0.3708* 0.2172 0.3209AUSNPC vs grain yield −0.5402** −0.6006* −0.6118**
AUSNPC vs plant height −0.5737** −0.1489 −0.4104*
AUSNPC vs days to flowering −0.0200 −0.1565 −0.1366Plant height vs grain yield 0.3448 0.2408 0.3469AUSNPC vs Striga flowering 0.6613** 0.8234** 0.8448**
AUSNPC vs Striga capsules 0.8039** 0.8021** 0.8550**
* Significant.** Highly significant at P < 0.05.
in different combinations of QTLs 01, 02, 052 and 06 as indicatedin Table 7.
Days to Striga emergence was positively correlated with plantheight and grain yield in both locations (Table 8). Therefore, as thedays to Striga emergence was delayed, plant height and grain yieldincreased. On the other hand, days to Striga emergence showedstrong negative correlation with the number of Striga plants thatemerged so that, the earlier the Striga shoots emerged, the higherwas the eventual density of the Striga plants observed with a con-comitant increase in AUSNPC (Table 8). AUSNPC was negativelycorrelated with grain yield in both locations. Striga plants flowering
Table 7Across-location means for agronomic and Striga-related parameters from field trials at two locations, September 2012–February 2013.
No. Genotype QTL type NHRPLR DF PH GY DSE AUS NPC NSF NSC SV
1 L1P2P13 02, 06 18 70.7 143.3 0.95 43.8 55.9 10 7.7 5.72 L2P1P7 02, 06 12 69.7 130.7 1.05 48.2 50.4 9.2 7.2 5.73 L2P1P22 02, 052, 06 16 71.2 141.3 1.78 45 46.4 8.2 7 5.24 L2P2P4 02, 052 7 71.7 158.6 0.91 41.3 54.3 9.3 7.8 5.25 L2P2P8 02, 052 15 69.8 135.9 1.18 43 49.1 8.7 6.7 56 L2P2P16 2 17 71.2 140.5 1.44 43 57.4 9.3 7.5 6.37 L2P5P10 052, 06 18 70.2 129.7 1.37 46.2 53.9 9 6.8 58 L2P5P11 02, 052, 06 16 70.5 139.1 1.71 48.2 46.1 8.3 6.3 4.29 L2P5P15 02, 052, 16 70.2 133.6 1.47 47.8 51.0 8.5 6 5
10 L2P5P22 06, 052 19 70 148.2 1.48 48.8 50.2 7.5 6 511 L2P5P25 02, 052, 06 15 70.2 134.7 1.37 47.3 49.0 7.7 6.2 4.312 L2P5P35 02, 052, 06 19 70.2 138.3 2.06 49.3 44.7 6.5 5 4.213 L2P6P9 052, 06 18 72 140.3 1.8 48.7 39.9 8.5 6.5 4.814 L2P6P14 02, 052 15 68.7 153.8 1.45 45 49.2 9.8 7.2 515 L2P6P29 02, 052, 06 16 69.7 151.8 1.89 50 44.1 6.3 5 416 L2P6P38 02, 06 15 70.3 134.8 1.4 40.8 51.6 9.2 6.8 5.317 L3P1P4 02, 051, 052 14 68.5 150.5 1.04 51.3 43.8 6 5 4.218 L2P1P15 01, 02 16 70.7 151.5 1.25 45.2 51.5 6.8 5.5 5.219 L3P1P14 01, 051, 052 14 71.2 152.9 1.79 53 45.1 6.3 4.7 420 L3P1P23 02, 052 18 70.2 151 1.8 44.7 47.6 7.7 5.7 5.321 L1P2-A 01, 02, 06 12 70 132 1.04 49 41.4 5.7 4.3 4.522 L1P5-A 01, 02, 06 18 69.2 152.7 2.02 50.5 41.8 5.3 5 423 L2P3-B 01, 02, 052, 06 17 72 156.3 2.09 53.3 36.2 5.8 4.3 3.824 L2P6-A 01, 052, 06 18 73.3 146.7 1.95 54.2 40.1 5.5 4.5 4.225 L2P7-A 01, 02, 052, 06 15 69.7 154.7 1.91 54.3 36.5 6.2 4.5 3.826 L3P3-A 01, 051, 052, 18 71.1 146 1.93 50.7 44.7 7.8 5.7 4.327 L2P6P10 01, 052 18 71.7 152.9 1.42 44 48.3 8.3 7.2 5.228 L2P6P36 6 16 69.2 143.3 0.84 47.5 56.0 10.3 7.7 629 L2P4P31 06, 052 16 69.7 145.8 0.85 45 50.2 7.2 5.8 4.830 L2P5P30 06, 052 15 70.2 143.7 1.26 46.5 52.6 10.3 8.2 5.731 Hugurtay 70.5 123.2 0.69 40.8 62.6 14 11.1 7.532 N13 70.2 146 1.04 56.3 36.3 4 3.2 3.2
F.Pro.G 0.003 <0.001 <0.001 <0.001 <0.001 <0.001 <0.001 <0.001F.Pro.G × E 0.452 ns 0.036 <0.001 0.018 0.002 0.016 0.58 ns 0.046G.Mean 70.41 143.9 1.445 47.59 47.73 7.917 6.187 4.859CV (%) 2.11 8.4 3.355 10.339 10.15 23.01 27.51 12.719
Key: NHRPLR = number of homozygous recurrent parent loci recovered from 27 SSR background markers analyzed, QTL = quantitative trait locus, DF = days to 50% flowering,AUNSPC = area under striga number progress curve, PH = plant height in cm, GY = grain yield in tons/ha, DSE = days to Striga emergence, NSF = Number of Striga flowered,NSC = number of Striga capsule, SV = Striga vigor, F.pro.G = F probability of genotype, F.pro.G × E = F probability of genotype by environment interaction, G.mean = Grand mean,CV = coefficient of variation, ns = non-significant.Figures in bold indicate the introgression lines that performed best in terms of yield compared to the check varieties under Striga pressure.
T. Yohannes et al. / Field Crops Research 173 (2015) 22–29 27
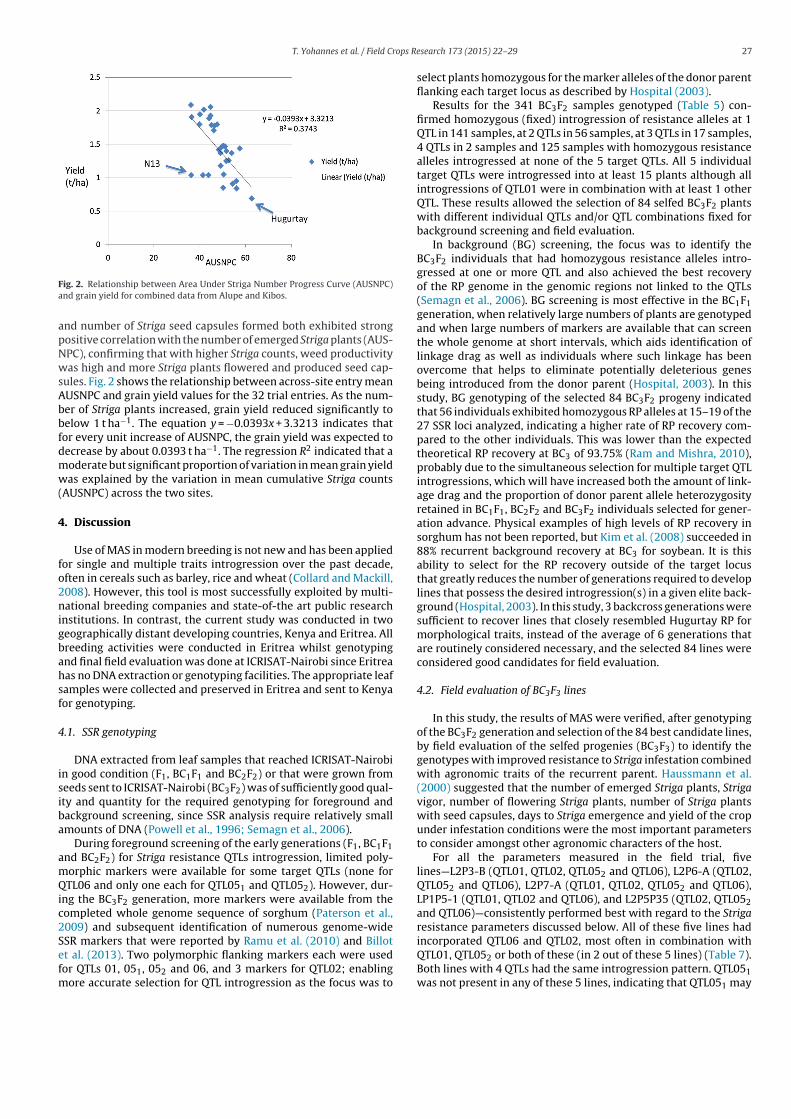
Fig. 2. Relationship between Area Under Striga Number Progress Curve (AUSNPC)and grain yield for combined data from Alupe and Kibos.
and number of Striga seed capsules formed both exhibited strongpositive correlation with the number of emerged Striga plants (AUS-NPC), confirming that with higher Striga counts, weed productivitywas high and more Striga plants flowered and produced seed cap-sules. Fig. 2 shows the relationship between across-site entry meanAUSNPC and grain yield values for the 32 trial entries. As the num-ber of Striga plants increased, grain yield reduced significantly tobelow 1 t ha−1. The equation y = −0.0393x + 3.3213 indicates thatfor every unit increase of AUSNPC, the grain yield was expected todecrease by about 0.0393 t ha−1. The regression R2 indicated that amoderate but significant proportion of variation in mean grain yieldwas explained by the variation in mean cumulative Striga counts(AUSNPC) across the two sites.
4. Discussion
Use of MAS in modern breeding is not new and has been appliedfor single and multiple traits introgression over the past decade,often in cereals such as barley, rice and wheat (Collard and Mackill,2008). However, this tool is most successfully exploited by multi-national breeding companies and state-of-the art public researchinstitutions. In contrast, the current study was conducted in twogeographically distant developing countries, Kenya and Eritrea. Allbreeding activities were conducted in Eritrea whilst genotypingand final field evaluation was done at ICRISAT-Nairobi since Eritreahas no DNA extraction or genotyping facilities. The appropriate leafsamples were collected and preserved in Eritrea and sent to Kenyafor genotyping.
4.1. SSR genotyping
DNA extracted from leaf samples that reached ICRISAT-Nairobiin good condition (F1, BC1F1 and BC2F2) or that were grown fromseeds sent to ICRISAT-Nairobi (BC3F2) was of sufficiently good qual-ity and quantity for the required genotyping for foreground andbackground screening, since SSR analysis require relatively smallamounts of DNA (Powell et al., 1996; Semagn et al., 2006).
During foreground screening of the early generations (F1, BC1F1and BC2F2) for Striga resistance QTLs introgression, limited poly-morphic markers were available for some target QTLs (none forQTL06 and only one each for QTL051 and QTL052). However, dur-ing the BC3F2 generation, more markers were available from thecompleted whole genome sequence of sorghum (Paterson et al.,2009) and subsequent identification of numerous genome-wideSSR markers that were reported by Ramu et al. (2010) and Billotet al. (2013). Two polymorphic flanking markers each were usedfor QTLs 01, 051, 052 and 06, and 3 markers for QTL02; enablingmore accurate selection for QTL introgression as the focus was to
select plants homozygous for the marker alleles of the donor parentflanking each target locus as described by Hospital (2003).
Results for the 341 BC3F2 samples genotyped (Table 5) con-firmed homozygous (fixed) introgression of resistance alleles at 1QTL in 141 samples, at 2 QTLs in 56 samples, at 3 QTLs in 17 samples,4 QTLs in 2 samples and 125 samples with homozygous resistancealleles introgressed at none of the 5 target QTLs. All 5 individualtarget QTLs were introgressed into at least 15 plants although allintrogressions of QTL01 were in combination with at least 1 otherQTL. These results allowed the selection of 84 selfed BC3F2 plantswith different individual QTLs and/or QTL combinations fixed forbackground screening and field evaluation.
In background (BG) screening, the focus was to identify theBC3F2 individuals that had homozygous resistance alleles intro-gressed at one or more QTL and also achieved the best recoveryof the RP genome in the genomic regions not linked to the QTLs(Semagn et al., 2006). BG screening is most effective in the BC1F1generation, when relatively large numbers of plants are genotypedand when large numbers of markers are available that can screenthe whole genome at short intervals, which aids identification oflinkage drag as well as individuals where such linkage has beenovercome that helps to eliminate potentially deleterious genesbeing introduced from the donor parent (Hospital, 2003). In thisstudy, BG genotyping of the selected 84 BC3F2 progeny indicatedthat 56 individuals exhibited homozygous RP alleles at 15–19 of the27 SSR loci analyzed, indicating a higher rate of RP recovery com-pared to the other individuals. This was lower than the expectedtheoretical RP recovery at BC3 of 93.75% (Ram and Mishra, 2010),probably due to the simultaneous selection for multiple target QTLintrogressions, which will have increased both the amount of link-age drag and the proportion of donor parent allele heterozygosityretained in BC1F1, BC2F2 and BC3F2 individuals selected for gener-ation advance. Physical examples of high levels of RP recovery insorghum has not been reported, but Kim et al. (2008) succeeded in88% recurrent background recovery at BC3 for soybean. It is thisability to select for the RP recovery outside of the target locusthat greatly reduces the number of generations required to developlines that possess the desired introgression(s) in a given elite back-ground (Hospital, 2003). In this study, 3 backcross generations weresufficient to recover lines that closely resembled Hugurtay RP formorphological traits, instead of the average of 6 generations thatare routinely considered necessary, and the selected 84 lines wereconsidered good candidates for field evaluation.
4.2. Field evaluation of BC3F3 lines
In this study, the results of MAS were verified, after genotypingof the BC3F2 generation and selection of the 84 best candidate lines,by field evaluation of the selfed progenies (BC3F3) to identify thegenotypes with improved resistance to Striga infestation combinedwith agronomic traits of the recurrent parent. Haussmann et al.(2000) suggested that the number of emerged Striga plants, Strigavigor, number of flowering Striga plants, number of Striga plantswith seed capsules, days to Striga emergence and yield of the cropunder infestation conditions were the most important parametersto consider amongst other agronomic characters of the host.
For all the parameters measured in the field trial, fivelines—L2P3-B (QTL01, QTL02, QTL052 and QTL06), L2P6-A (QTL02,QTL052 and QTL06), L2P7-A (QTL01, QTL02, QTL052 and QTL06),LP1P5-1 (QTL01, QTL02 and QTL06), and L2P5P35 (QTL02, QTL052and QTL06)—consistently performed best with regard to the Strigaresistance parameters discussed below. All of these five lines hadincorporated QTL06 and QTL02, most often in combination withQTL01, QTL052 or both of these (in 2 out of these 5 lines) (Table 7).Both lines with 4 QTLs had the same introgression pattern. QTL051was not present in any of these 5 lines, indicating that QTL051 may
28 T. Yohannes et al. / Field Crops Research 173 (2015) 22–29
contribute least to the resistance. Gammar and Mohamed (2013)reported that introgression of QTL051 and QTL052 improved fieldresistance more than the other QTLs in sorghum in Sudan.
Days to first Striga plant emergence was significantly differentamong the lines evaluated. Emergence of the parasite was slowand delayed by about two weeks in lines L2P3-B (QTL01, QTL02,QTL06 and QTL052), L2P6-A (QTL02, QTL06 and QTL052), and L2P7-A (QTL01, QTL02, QTL06 and QTL052) compared to the emergencein the susceptible control, Hugurtay (Table 7). Late Striga emer-gence may be an indication of late attachment of Striga to thesorghum host. Such late attachments could be attributed to themechanical resistance mechanism of the N13 donor conferred byits Striga resistance QTL alleles. Gebremedhin et al. (2000) alsoreported delayed emergence of Striga on resistant sorghum com-pared to a susceptible variety. The genetic differences betweenthe sorghum genotypes have been reported to affect the time ofparasite attachment, with resistant varieties showing later attach-ment and parasite emergence than susceptible cultivars (Ezeakuand Gupta, 2004; Rodenburg et al., 2006). The observed delay inStriga emergence may also be due to reduced or delayed haus-torium initiation and attachment. Alternatively, a less competentmatch between the parasite and the host roots may have resultedin the progeny with newly acquired resistance QTL, reducing thelikelihood of a successful parasitic relationship that manifested inthe later emergence of successful parasites.
The AUSNPC as described by Haussmann et al. (2000) is consid-ered an appropriate measure for Striga resistance as it incorporatesemergence time and numbers of emerged Striga. Omanya et al.(2004) previously noted that the AUSNPC is under strong geneticcontrol and offers a suitable measure of progressive Striga emer-gence in the field and the authors encouraged its use in screening.
In the current study, the combined ANOVA (Table 7) indicatedthat Striga infestation over the cropping season, expressed as theAUSNPC, was significantly reduced in the introgressed BC3F4 linescompared to the control variety, Hugurtay. Striga counts increasedsteadily for most lines during crop growth. However, lines L2P3-B, L2P7-A, which each had 4 QTLs fixed and lines L1P5-A, L2P6-A,L2P5P35, which each had 3 Striga resistance QTLs fixed, maintainedthe lowest Striga infestation levels compared to other backcrosslines. The RP (and susceptible check) variety, Hugurtay supportedthe highest number of Striga plants. Haussmann et al. (2000)considered genotypes as resistant when they supported signifi-cantly fewer emerged Striga plants than the susceptible check andRodenburg et al. (2006) reported that the number of emerged Strigaplants recorded above ground was significantly correlated withthe number of Striga plants attached to the roots in sorghum. Theresults of this study supported both these trends (Table 8).
Sorghum growth, measured by plant height and grain yield asindicated in the analysis (Table 7) was significantly different amongthe lines. In a previous report, Ayangowa et al. (2010) noted a reduc-tion of sorghum growth and stunting as dominant symptoms ofStriga infestation. Stunted growth is likely to result in reduced grainyield. In this study, the combined ANOVA for the two locationsshowed the highest mean grain yield of 2.09 t ha−1 was recordedfor line L2P3-B, followed by L2P5P35, L1P5-A and L2P6-A with2.06, 2.02 and 1.95 t ha−1 respectively. All of these lines, besideshaving three to four Striga resistance QTL alleles introgressed andfixed, also had a higher number of the recurrent parent homozy-gous alleles at the BG marker loci with lines L2P3-B, L1P5-A, L2P6-Athat exhibited 17–18 homozygous loci and line L2P5P35 that exhib-ited 19 out of 27 loci that were screened. These genotypes alsoclosely resembled Hugurtay morphologically, indicating successfulgenome recovery of the recurrent parent through the successivebackcrossing generations. However, Hugurtay yielded poorly at0.69 t ha−1, due to the Striga pressure and its susceptible nature.On the other hand, even though N13 supported fewer Striga shoots
(Figure 2) its lower yield could be due to its inherent low yieldpotential (Ejeta, 2007). Lines with entry numbers 23 (L2P3-B), 12(L2P5P35), 22 (L1P5-A) and 24 (L2P6-A) were the best performersthat also showed good stability across the two locations. In thesefour lines, the emergence of Striga was also delayed compared toHugurtay, possibly explaining the higher grain yields obtained.
The lower Striga counts and higher grain yields in the intro-gressed BC3F2-derived introgression lines compared to the RP,Hugurtay, demonstrated that MABC was successful for the intro-gression of the Striga resistance QTLs from the donor parent, N13. Itallowed precise identification of the individuals in each generationthat had resistance alleles of the QTLs introgressed and there-fore allowed targeted advance of only small numbers of selectedindividuals in each generation – without the need for pheno-typic screening of each generation. These introgressed QTLs inthe selected backcross progenies were correlated with delayedemergence, reduced numbers of Striga shoots and improved grainyield. Gammar and Mohamed (2013) also reported reduced Strigaemergence and increased sorghum yields after introgressing Strigaresistance QTL from N13 into Tabat, a FPSV in Sudan.
The number of Striga plants flowering and those forming cap-sules are vital to estimate the productivity of the parasite. In thisstudy, the number of Striga plants that flowered and those thatformed capsules on the introgressed lines were few compared tothe number of emerged Striga shoots in each plot (Table 7). Thiscould reduce the multiplication rate of the Striga and slow downthe accumulation of seeds in the soil. Rodenburg et al. (2006) alsoidentified host resistance as an important determinant of Strigareproduction. However, the very large seed production capacity ofStriga means that there may still be capacity for the Striga popula-tion to rapidly adapt to the resistance QTLs being deployed as eventhe reduced number of flowering plants may be enough to maintainsoil seed banks at levels sufficient for significant levels of infestationof a resistant host unless resistance deployment is accompanied byremoval of emerged Striga plants prior to seed dispersal, or otherweed management measures (Rodenburg et al., 2006).
Visual evaluation of Striga vigor at maturity varied from approxi-mately 4 (Striga height 21–30 cm and number of branches on Strigaplant ≤5) to 8 (Striga height >40 cm and number of branches onStriga plant ≤10) (Table 7). In the majority of backcross lines, Strigaplant vigor was on average, less than 40% of that of the recur-rent parent Hugurtay. Rodenburg et al. (2006) suggested that Strigaplant vigor influences mortality and seed production capacity. Inthis study Striga vigor and capsule number were positively corre-lated (Table 8).
5. Conclusions
The results of this study clearly demonstrated the potential ofusing exotic donor germplasm to improve adapted local materialin combination with marker-assisted selection and backcrossing.Up to four Striga resistance QTLs were fixed in genotypes L2P5P35,L2P3-B, L2P6-A, L1P5-A and L2P7-A, all of which had also recov-ered relatively high proportion of the recurrent parent, Hugurtay,genome at the background SSR loci analyzed. The identificationof these five genotypes is expected to have a positive impact onimproving sorghum productivity in the Striga prone areas of Eritrea,provided that the introgressed resistance QTLs are indeed effectiveagainst S. hermonthica populations in those regions.
QTL pyramiding can be done in the future by crossing the intro-gressed genotypes L2P3-B and L3P3A to incorporate the fifth Strigaresistance QTL051 to further improve the results obtained fromthis study. Genotype L2P3-B had introgressed four QTLs namelyQTL01, QTL02, QTL06 and QTL052 and genotype L3P3-A threeQTLs namely QTL01, QTL051 and QTL052. These genotypes also
T. Yohannes et al. / Field Crops Research 173 (2015) 22–29 29
performed among the best agronomically. Furthermore, the bestgenotypes in this study will in future be invaluable to plant breedersin the Eastern and Central Africa region in their sorghum improve-ment programs.
Acknowledgments
This work has been undertaken as part of the CGIAR ResearchProgram on Dryland Cereals and the ABCIC Striga Resistance Eval-uation Project with funding from BMZ and ASARECA.
Appendix A. Supplementary data
Supplementary data associated with this article can be found, inthe online version, at http://dx.doi.org/10.1016/j.fcr.2014.12.008.
References
Ayangowa, G.C., Stomph, T.J., Hoevers, R., Ngoumou, T.N., Kuyper, T.W., 2010. Strigainfestation in northern Cameroon: magnitude, dynamics and implications formanagement. Njas-Wageningen J. Life Sci. 57, 159–165.
Billot, C., Ramu, P., Bouchet, S., Chantereau, J., Deu, M., Gardes, L., Noyer, J.-L., Rami, J.-F., Rivallan, R., Li, Y., Lu, P., Wang, T., Folkertsma, R.T., Arnaud, E., Upadhyaya, H.D.,Glaszmann, J.-C., Hash, C.T., 2013. Massive sorghum collection genotyped withSSR markers to enhance use of global genetic resources. PLOS ONE 8, e59714,http://dx.doi.org/10.1371/journal.pone.0059714.
Collard, B.C.Y., Mackill, D.J., 2008. Marker-assisted selection: an approach for pre-cision plant breeding in the twenty-first century. Philos. Trans. R. Soc. B 363,557–572, http://dx.doi.org/10.1098/rstb.2007.2170.
Ejeta, G., 2007. Breeding for Striga resistance in sorghum: exploitation of an intricatehost–parasite biology. Crop Sci. 47, 216–227.
Ejeta, G., Gressel, J., 2007. Integrating New Technologies for Striga Control: TowardsEnding the Witch-hunt. World Scientific, River Edge, NJ, USA, pp. 27–29.
Ezeaku, I.E., Gupta, S.C., 2004. Development of sorghum populations for resistance toStriga hermonthica in the Nigerian Sudan Savanna. Afr. J. Biotechnol. 3, 324–329.
FAOSTAT, 2011, Retrieved from: http://faostat3.fao.org/faostat-gateway/go/to/download/Q/*/E (accessed 11.08.13).
Folkertsma, R.T., Rattunde, H.F.W., Chandra, S., Raju, G.S., Hash, C.T., 2005. The pat-tern of genetic diversity of Guinea-race Sorghum bicolor (L.) Moench landracesas revealed with SSR markers. Theor. Appl. Genet. 111, 399–409.
Frisch, M., Bohn, M., Melchinger, A.E., 1999. Comparison of selection strategies formarker-assisted backcrossing of a gene. Crop Sci. 39, 1295–1301.
Gammar, Y.A., Mohamed, A.H., 2013. Introgression of Striga resistance genes intoa Sudanese sorghum cultivar, Tabat, using marker-assisted selection (MAS).Greener J. Agric. Sci. 3, 550–556.
Gebremedhin, W., Goudriaan, J., Naber, H., 2000. Morphological, phenological andwater-use dynamics of sorghum varieties (Sorghum bicolor) under Striga her-monthica infestation. Crop Prot. 19, 61–68.
Haussmann, B.I.G., Hess, D.E., Reddy, B.V.S., Welz, H.G., Geiger, H.H., 2000. Analysisof resistance to Striga hermonthica in diallel crosses of sorghum. Euphytica 116,33–40.
Haussmann, B.I.G., Hess, D.E., Omanya, G.O., Folkertsma, R.T., Reddy, B.V.S., Kayentao,M., Geiger, H.H., 2004. Genomic regions influencing resistance to the parasiticweed Striga hermonthica in two recombinant inbred populations of sorghum.Theor. Appl. Genet. 109, 1005–1019.
Hayden, M., Nguyen, T., Waterman, A., Chalmers, K., 2008. Multiplex-ready PCR: anew method for multiplexed SSR and SNP genotyping. BMC Genomics 9, 80.
Hospital, F., 2003. Marker-assisted breeding. In: Newbury, H.J. (Ed.), Plant MolecularBreeding. Blackwell Publishing and CRC Press, Oxford and Boca Raton, pp. 30–59.
Hospital, F., Charcosset, A., 1997. Marker-assisted introgression of quantitative traitloci. Genetics 147, 1469–1485.
Jamil, M., Kanampiu, F.K., Karaya, H., Charnikhova, T., Bouwmeester, H.J., 2012. Strigahermonthica parasitism in response to N and P fertilisers. Field Crops Res. 134,1–10.
Kim, J.S., Childs, K.L., Islam-Faridi, M.N., Menz, M.A., Klein, R.R., Klein, P.E., Price,H.J., Mullet, J.E., Stelly, D.M., 2004. Integrated karyotyping of sorghum by in situhybridization of landed BACs. Genome 45, 402–412.
Kim, K.H., Kim, M.Y., Van, K., Moon, J.K., Kim, D.H., Lee, S., 2008. Marker-assistedforeground and background selection of near isogenic lines for bacterial leafpustule resistant gene in soybean. J. Crop Sci. Biotechnol. 11, 263–268.
Lammerts van Bueren, E.T., Backes, G., de Vriend, H., Ostergard, H., 2010. The roleof molecular markers and marker assisted selection in breeding for organicagriculture. Euphytica 175, 51–64.
Mace, E.S., Buhariwalla, H.K., Crouch, J.H., 2003. A high-throughput DNA extrac-tion protocol for tropical molecular breeding programs. Plant Mol. Biol. Rep. 21,459–460.
Ministry of Agriculture, Eritrea, 2010. Planning and Statistics Annual Report.Mohamed, A., Ali, R., Elhassan, O., Suliman, E., Mugoya, C., Masiga, C.W., Hash, C.T.,
2014. First products of DNA marker-assisted selection in sorghum releasedfor cultivation by farmers in sub-Saharan Africa. J. Plant Sci. Mol. Breed. 3,2050–2389 http://www.hoajonline.com/journals/pdf/2050-2389-2-4
Omanya, G.O., Haussmann, B.I.G., Hess, D.E., Reddy, B.V.S., Kayentao, M., Welz, H.G.,Geiger, H.H., 2004. Utility of indirect and direct selection traits for improvingStriga resistance in two sorghum recombinant inbred populations. Field CropsRes. 89, 237–252.
Paterson, A.H., Bowers, J.E., Bruggmann, R., Dubchak, I., Grimwood, J., Gundlach, H.,Haberer, G., Hellsten, U., Mitros, T., Poliakov, A., Schmutz, J., Spannagl, M., Tang,H., Wang, X., Wicker, T., Bharti, A.K., Chapman, J., Feltus, F.A., Gowik, U., Grigoriev,U.V., Lyons, E., Maher, C.A., Martis, M., Narechania, A., Otillar, R.P., Penning, B.W.,Salamov, A.A., Wang, Y., Zhang, L., Carpita, N.C., Freeling, M., Gingle, A.R., Hash,C.T., Keller, B., Klein, P., Kresovich, S., McCann, M.C., Ming, R., Peterson, D.G.,Mehboob-ur-Rahman, Ware, D., Westhoff, P., Mayer, K.F.X., Messing, J., Rokhsa,D.S., 2009. The Sorghum bicolor genome and the diversification of grass. Nature457, 551–556, http://dx.doi.org/10.1038/nature07723.
Powell, W., Machery, G.C., Pravan, J., 1996. Polymorphism revealed by simplesequence repeats. Trends Genet. 1, 76–83.
Ram, S., Mishra, B., 2010. Cereals: Processing and Nutritional Qualities. New IndiaPublishing Agency, Delhi, India, pp. 184.
Ramu, P., Deshpande, S.P., Senthilvel, S., Jayashree, B., Billot, C., Deu, M., AnandaReddy, L., Hash, C.T., 2010. In silico mapping of important genes and markersavailable in the public domain for efficient sorghum breeding. Mol. Breed. 26,409–418, http://dx.doi.org/10.1007/s11032-009-9365-9.
Rodenburg, J., Bastiaansa, L.E., Weltzienb, D., Hessc, E., 2005. How can field selectionfor Striga resistance and tolerance in sorghum be improved? Field Crops Res. 93,34–50.
Rodenburg, J., Bastiaans, L., Kropff, M.J., van Ast, A., 2006. Effects of host plant geno-type and seed bank density on Striga reproduction. Weed Res. 46, 251–263.
Schuelke, M., 2000. An economic method for the fluorescent labelling of PCR frag-ments. Nat. Biotechnol. 18, 233–234.
Semagn, K., Bjornstad, A., Ndijiondjop, M.N., 2006. An overview of molecular markermethods for plants. Afr. J. Biotechnol. 5, 2540–2568.
Tesfamichael, A., Nyende, A.B., Githiri, S.M., Kasili, R.W., Woldeamlak, A., 2013. Doc-umentation of sorghum (Sorghum bicolor L. Moench) landraces: production,utilization and challenges in Eritrea. J. Agric. Biol. Sci. 8, 498–508.
Copyright © 2022 FDOKUMEN