Regranulation: A granular algorithm enabling communication between granular worlds
Upload
khangminh22Category
view
1download
0
1
Penetration of granular materials by small-arms bullets
T. Børvika,b,*, S. Deyb and L. Olovssonc
a) Structural Impact Laboratory (SIMLab), Department of Structural Engineering, Norwegian University of
Science and Technology, NO-7491 Trondheim, Norway.
b) Norwegian Defence Estates Agency, Research and Development Department, NO-0015 Oslo, Norway.
c) IMPETUS Afea AB, Sördalavägen 22, SE-14160 Huddinge, Sweden.
Abstract
This paper presents an experimental and numerical study on the penetration of granular materials by small-arms
bullets. In the experimental tests, five different types of granular material (0-2 mm wet sand, 0-2 mm dry sand, 2-
8 mm gravel, 8-16 mm crushed stone and 16-22 mm crushed rock) were impacted by four different types of small-
arms bullets (7.62 mm Ball with a soft lead core, 7.62 mm AP with a hard steel core, 12.7 mm Ball with a soft
steel core and 12.7 mm AP with a tungsten carbide core). The tests were carried out using different rifles to fire
the projectiles, while the granular materials were randomly packed in a 320 mm diameter specially-designed steel
tube. In all tests, the initial projectile velocity and the depth of penetration in the granular material were measured
for each bullet type. In the numerical simulations, a discrete particle-based approach was used to model the
behaviour of sand during bullet impact. The method works with discrete particles that transfer forces between each
other through contact and elastic collisions, allowing for a simple and robust treatment of the interaction between
the sand particles and the bullet which is represented by finite elements. An important observation from the study
is that the penetration depth in dry sand is strongly influenced by deviation of the bullet from its original trajectory.
Good agreement between the available experimental results and the numerical predictions is also in general
obtained.
Keywords: Soil penetration; Small-arms bullets; Experimental tests; Discrete particles; Numerical simulations
1. Introduction
In international operations, long-distance transportation of protective elements is often
necessary, and the weight of the system becomes a critical parameter. This limits the use of
traditional structures made of steel or concrete, and a main challenge is to design barriers that
* Corresponding author. Tel.: + 47-73-59-46-47; fax: + 47-73-59-47-01.
E-mail address: [email protected] (T. Børvik).

2
have sufficiently low mass to be transported while at the same time having enough strength to
defeat the threat. Børvik et al. [1][2] proposed to use extruded aluminium panels as a light-
weight and mobile shelters. Such systems constitute a cheap, low-weight solution that quickly
can be installed in camps out-of-area. To increase the ballistic perforation resistance of the
protection, a local granular material is filled in the empty cavities between the panels. At
repatriation or if the protection has to be moved, the mass is simply emptied through a hatch
beneath the panels, and the system retains its low mass. However, ballistic tests have revealed
that the relation between the grain size of the granular material and the calibre of the bullet
significantly affects the perforation resistance of the protection, so a proper filling material is
crucial [1]. Thus, to understand the behaviour of granular materials during impact by small-
arms bullets is crucial for the design of such lightweight protective structures.
The study of projectile penetration in granular materials can be traced back to 1742 with
the Robin-Euler penetration depth formula. Since then, a number of empirical models, some of
which are still used today, have been proposed (see e.g. Young [3] and Corbett et al. [4]). Even
though the problem has been studied for centuries, the number of systematic and detailed
experimental studies available in the open literature is few. Allen et al. [5][6] presented some
test data and a theoretical model for the penetration of nonrotating projectiles in sand, while
Bai and Johnson [7] proposed a model to investigate the effects of impact velocity and sand
resistance during ricochet. Forrestal et al. [8]-[10] developed closed-form analytical equations
based on the cavity expansion theory and experimental tests for nonrotating pointed-nose
projectiles that penetrated soil targets after normal impact. However, these and similar methods
require tri-axial material data from samples cored from the actual target material to give an
accurate prediction of the depth of penetration, and such test data are not readily available. A
comprehensive review of the response of granular media to rapid penetration was recently
published by Omidvar et al. [11].
During the last decade, there have been numerous attempts at describing the constitutive
behaviour (e.g. [12]-[20]) and to develop numerical methods (e.g. [21]-[32]) for granular
materials under extreme dynamic loading conditions, partly motivated by impact cratering in
geophysics and landmine explosions in international operations. A review of the stress-strain
behaviour of sand at high strain rates was presented by Omidvar et al. [33]. Although advanced
numerical techniques like the coupled Lagrangian-Eulerian approach have allowed new insight
into the complex process of soil-structure interaction, their ability to describe sand particle-
particle contact and loose soil ejecta are very limited [16]. However, the recent approach of
using discrete particles to model real sand behaviour has shown to be promising (see e.g.

3
[25][32][34]). This method, which is based on a Lagrangian formulation, has several
advantages over coupled Lagrangian-Eulerian approaches as both numerical advection errors
and severe contact problems are avoided, while at the same time keeping the computational
time at a reasonable level.
The purpose of this study is two-fold. Firstly, a rather comprehensive experimental study on
the penetration of granular materials by small-arms bullets was carried out. In the experimental
tests, five different types of granular material (0-2 mm wet sand, 0-2 mm dry sand, 2-8 mm
gravel, 8-16 mm crushed stone and 16-22 mm crushed rock) were impacted by four different
types of small-arms bullets (7.62 mm Ball with a soft lead core, 7.62 mm AP with a hard steel
core, 12.7 mm Ball with a soft steel core and 12.7 mm AP with a tungsten-carbide core). A
number of tests were conducted for each combination of granular material and projectile type,
giving a total of 126 tests. The tests were carried out using different rifles to fire the projectiles,
while the granular materials were randomly packed in a 320 mm diameter specially-designed
steel tube. In all tests, the initial bullet velocity and the depth of penetration in the granular
material were measured, and the penetration depth was plotted as a function of bullet type and
filling material. This was done to study the behaviour of granular materials during bullet impact,
and at the same time establish an experimental database for validation of numerical methods.
Secondly, a discrete particle-based approach [35] was used to model sand and its interaction
with the bullet during penetration. The method has been implemented in the non-linear finite
element code IMPETUS Afea Solver [36]. It works with discrete, rigid, spherical particles that
transfer forces between each other through a penalty- based contact formulation. Modelling the
sand as discrete particles allows for a numerically simple and robust treatment of its interaction
with structural parts represented by finite elements (see [25] and [34]), and several parametric
studies for increased understanding of this particular penetration problem have been carried out.
As will be shown, good agreement between the experimental and predicted results is in general
obtained, especially when the complexity of the problem and the simplicity of the approach are
taken into account.
2. Experimental set-up
2.1 Test rig
The ballistic set-up used in the experimental study is similar to that described in Børvik et
al. [37][38]. Here, a 7.62 x 63 mm smooth-bore Mauser gun or a 12.7 x 99 mm McMillan sniper
rifle with barrel lengths of about 1 m was used to fire the different bullets. Note that the

4
McMillan rifle gives gyroscopic stability to the bullet by spinning it around its own axis of
symmetry, while spin is absent when using the smooth-bore Mauser gun. During testing, the
stock was removed and the weapon was mounted in a rigid rack inside a 16 m3 impact chamber.
This fixture guaranteed a well-defined impact point in all tests, and the various rifles could be
fired by a magnetic trigger from safe distance. Several independently operating optical velocity
measurement systems, shown to be accurate to within 1-2% [38], were used to measure the
initial velocity of the bullets just before impact with the target. Due to the opaque nature of the
granular materials, no high-speed cameras were used in these tests.
To be able to confine the granular materials during impact and to measure the penetration
depth after impact, the jig shown in Figure 1 was designed. It consists of a thick-walled steel
tube with inner diameter 320tD mm, wall thickness 12.5tH mm and length 1000tL
mm. The tube was mounted in a frame, making it possible to turn the tube around its own
midpoint into an upright position. In the upright position the tube was randomly packed with
the granular material to be tested. A steel disc (with a central hole of 30 mm) was used to close
the tube. The hole was sealed by a thin plastic film to hold the granular material in place before
testing. Due to the disc the granular material was marginally compressed inside the tube. The
distance from the muzzle of the rifle to the front of the tube was 500 mm in all tests.
After firing, the penetration depth was carefully determined by removing the granular
masses along the penetration channel. In most of the tests, the bullet left a trail of compressed
and partly fractured material that could be followed. Due to difficulties in finding all the
embedded bullet parts after a test, the granular material was also filtered as it was removed.
This was in several of the tests rather tedious, and even though this was done with great care
some experimental uncertainty must be expected. Advanced digital diagnostic techniques for
measurements during ballistic penetration of sand have been proposed (see e.g. [28][29][30]),
but such sophisticated approaches were not considered in these tests. After each test, the tube
was filled with new masses and a new test could be conducted.
It should finally be noticed that due to the limited diameter of the tube, the granular material
will be confined inside the rigid steel tube during penetration. The effect of this confinement
compared to naturally confined materials is not known. However, since the impact velocity is
high and the tube diameter is significantly larger than the diameter of the bullets this effect is
assumed negligible. In this study, all tests were carried out under identical impact conditions
using well defined boundary conditions. The effect of the boundary conditions will be studied
numerically in Section 4.
5
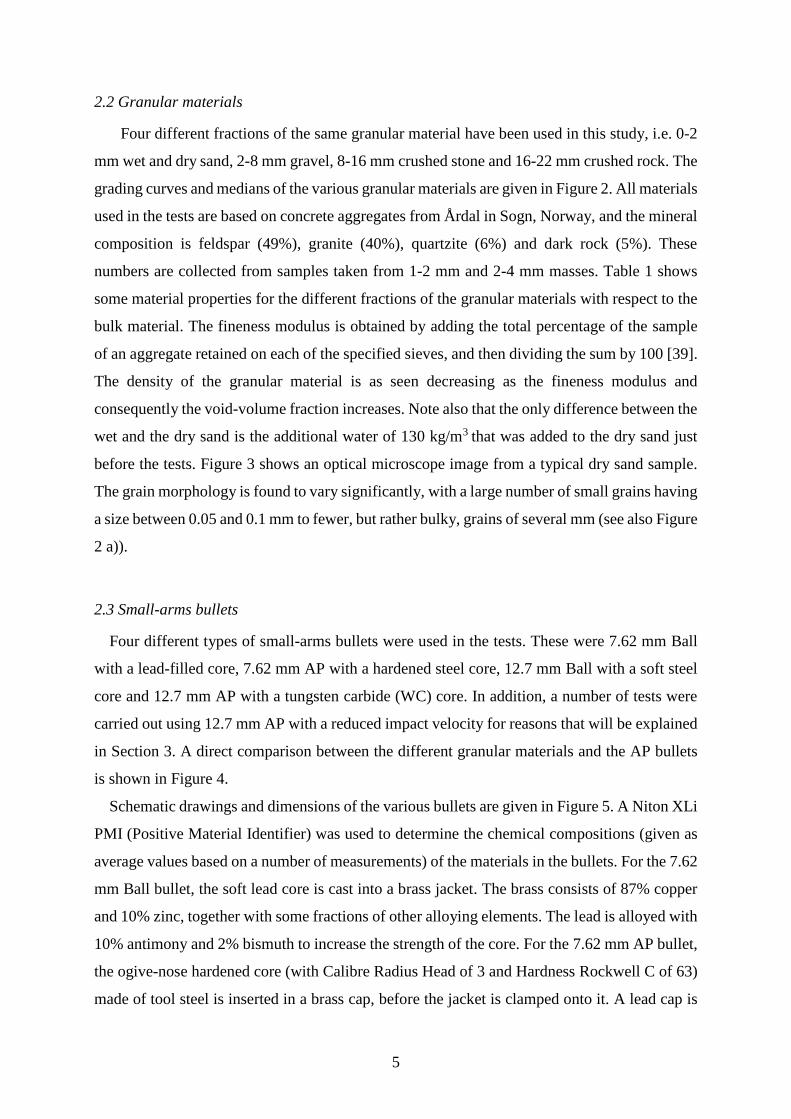
2.2 Granular materials
Four different fractions of the same granular material have been used in this study, i.e. 0-2
mm wet and dry sand, 2-8 mm gravel, 8-16 mm crushed stone and 16-22 mm crushed rock. The
grading curves and medians of the various granular materials are given in Figure 2. All materials
used in the tests are based on concrete aggregates from Årdal in Sogn, Norway, and the mineral
composition is feldspar (49%), granite (40%), quartzite (6%) and dark rock (5%). These
numbers are collected from samples taken from 1-2 mm and 2-4 mm masses. Table 1 shows
some material properties for the different fractions of the granular materials with respect to the
bulk material. The fineness modulus is obtained by adding the total percentage of the sample
of an aggregate retained on each of the specified sieves, and then dividing the sum by 100 [39].
The density of the granular material is as seen decreasing as the fineness modulus and
consequently the void-volume fraction increases. Note also that the only difference between the
wet and the dry sand is the additional water of 130 kg/m3 that was added to the dry sand just
before the tests. Figure 3 shows an optical microscope image from a typical dry sand sample.
The grain morphology is found to vary significantly, with a large number of small grains having
a size between 0.05 and 0.1 mm to fewer, but rather bulky, grains of several mm (see also Figure
2 a)).
2.3 Small-arms bullets
Four different types of small-arms bullets were used in the tests. These were 7.62 mm Ball
with a lead-filled core, 7.62 mm AP with a hardened steel core, 12.7 mm Ball with a soft steel
core and 12.7 mm AP with a tungsten carbide (WC) core. In addition, a number of tests were
carried out using 12.7 mm AP with a reduced impact velocity for reasons that will be explained
in Section 3. A direct comparison between the different granular materials and the AP bullets
is shown in Figure 4.
Schematic drawings and dimensions of the various bullets are given in Figure 5. A Niton XLi
PMI (Positive Material Identifier) was used to determine the chemical compositions (given as
average values based on a number of measurements) of the materials in the bullets. For the 7.62
mm Ball bullet, the soft lead core is cast into a brass jacket. The brass consists of 87% copper
and 10% zinc, together with some fractions of other alloying elements. The lead is alloyed with
10% antimony and 2% bismuth to increase the strength of the core. For the 7.62 mm AP bullet,
the ogive-nose hardened core (with Calibre Radius Head of 3 and Hardness Rockwell C of 63)
made of tool steel is inserted in a brass cap, before the jacket is clamped onto it. A lead cap is

6
placed in front of the core to stabilize the projectile during flight and in the initial stage of
penetration. Based on PMI measurements, the brass and lead used in the AP bullet were found
to be similar to those used in the Ball bullet. Geometries and masses of the different parts that
made up the 7.62 mm bullets are given in Table 2. Note that some variation in both length and
mass may occur, so the values should be considered as nominal values. The total mass of the
Ball projectile is about 9.5 grams, while the total mass of the AP projectile is about 10.5 grams.
The muzzle velocity of both bullets is roughly 900 m/s, so the initial kinetic energy is rather
similar. Thus, the main distinction in behaviour during penetration is caused by the difference
in core hardness. The PMI was also used to determine the chemical composition of the various
parts that made up the 12.7 mm bullets. Both the jacket and the lead consist of the same alloys
as for the 7.62 mm bullets. For the 12.7 mm Ball bullet, the steel core consists of 95% Fe, 2.7%
Mn, 0.9% Ni and some smaller fractions of other alloying elements. The average hardness of
the core was measured to 10180 HV (i.e. mild steel). In addition, end and front caps in lead are
used for stabilization. The core of the 12.7 mm AP bullet is made of two parts. The main
penetrator consists of tungsten carbide (WC) with 86% W, 7.3% Co, 1.8% Cu and 1.1% Fe.
WC has high density, high melting temperature and extreme hardness. The latter property
makes the core strong, but has the disadvantage that it may become brittle and fracture upon
impact. The WC part is inserted in a steel sabot. In addition, an end cap of lead and a polymer-
based front cap are used for stabilization. Geometries and masses of the different parts in the
12.7 mm bullets are also given in Table 2. As for the 7.62 mm bullets, the difference in
penetration ability is related to the core strength, since both the mass (42 versus 46 grams) and
muzzle velocity (about 830 m/s) are similar for the two bullets.
3. Experimental results
The experimental programme is given in Table 3. The various granular materials demanded
different number of tests due to uncertainties in measuring the penetration depth after firing.
Thus, a number of tests were conducted for each combination of granular material and bullet
type, giving a total of 126 tests. The impact velocity was kept constant at muzzle velocity for
the different bullets (i.e. no adjustment of the ammunitions was carried out). Even so, some
spread in the measured impact velocity was observed (typically 20 m/s ). This is illustrated
in Figure 6 showing the penetration depth by 7.62 mm AP bullets in wet and dry sand. Note
that the spread in penetration depth is random and not only caused by the variation in impact
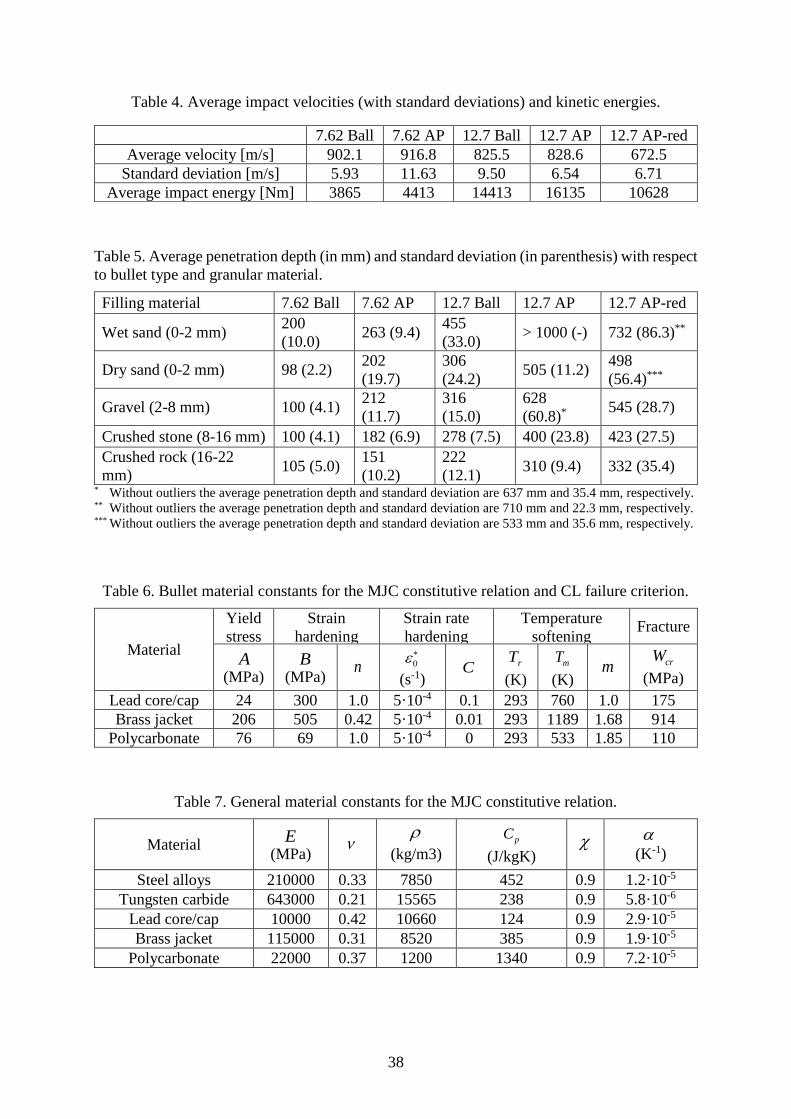
velocity. Measured average impact velocities and kinetic energies are given in Table 4 together

7
with calculated standard deviations based on the entire population. Since the 12.7 mm AP bullet
at muzzle velocity (830 m/s) perforated the 1 m long tube in Figure 1 when filled with wet sand,
it was decided to adjust this ammunition to a constant impact velocity of 670 m/s (termed 12.7
mm AP-red in the following). This impact velocity represents a firing distance of approximately
500 m, and gave a reduction in kinetic energy of about 35% compared to muzzle velocity (see
Table 4). To study the difference in performance between muzzle and reduced velocity, both
impact velocities were applied in the tests.
The main results in terms of average penetration depths are given in Table 5 and plotted in
Figure 7. In addition, calculated standard deviations are given in parenthesis in Table 5. The
rather large standard deviations seen in some of the test series are mainly caused by outliers
deviating considerably from the mean value. By omitting these outliers the standard deviation
is much reduced while the average penetration depth remains rather similar, as also shown in
Table 5. A direct comparison between penetration depths versus granular material for some
bullet types are shown in Figure 8, while pictures of damaged bullet parts after typical tests are
presented in Figure 9.
From these results, a number of interesting observations are made. First of all, it is clear
from Figure 7 that the penetration depth is considerably larger in wet sand than in dry sand
independent of bullet type. The penetration depth is actually more than twice in wet sand than
in dry sand for 7.62 mm Ball and 12.7 mm AP bullets. The reason for this is not fully
understood, but the increased penetration depth in wet sand at high impact velocities has been
observed by others. It seems to be due to a combination of reduced friction between the soil
grains, partly liquefaction, possible shock waves and increased pore pressure in wet sand [31].
It is also evident that the penetration depth increases exponentially with the expected bullet
performance and strength (i.e. penetration capability) for the smallest grain sizes. This confirms
that the relation between grain size and bullet performance is a vital parameter in the penetration
of granular materials [1]. One exception is the 7.62 mm Ball bullet. Here the penetration depth
is almost constant for all grain sizes as long as the material is dry. The reason may be that the
lead-core bullet is rather weak compared to the others, and it is completely crushed upon impact
with the target material, and thereby losing all of its penetration capability. For the largest grain
sizes, the penetration depth increases more linearly with bullet performance (at least for the
grain sizes used in this study). Thus, the difference (in mm) in penetration depth with grain size
increases with projectile performance and is most distinct for the 12.7 mm AP bullet. Note also
that the penetration depth in general is larger in gravel (2-8 mm) than in dry sand (0-2 mm),
especially for the 12.7 mm AP bullet.

8
Figure 8 a) gives a comparison of penetration depths versus granular material for 7.62 mm
bullets. The penetration depths for the ball bullet stay almost constant in dry materials, while
the AP bullet displays a distinct decrease in penetration depth with grain size. For the largest
grain size (16-22 mm), the penetration depths almost coincide. A similar behaviour is seen in
Figure 8 b), where a comparison of 12.7 mm bullets at muzzle velocity is given. In contrast to
the 7.62 mm Ball bullet, the 12.7 mm Ball bullet shows a rather steady decrease in penetration
depth with grain size, even though it is not as distinct as for the AP bullets. Keep in mind that
the core strength of the 12.7 mm Ball bullet is considerably higher than for the 7.62 mm Ball
bullet. Finally, Figure 8 c) shows a comparison between the penetration depths for the 12.7 AP
bullets (with an average impact velocity of 829 m/s) and the 12.7 mm AP-red bullets (having
an average impact velocity of 673 m/s). The reduction in impact velocity of the AP-red bullet
gives a considerable decrease in kinetic energy compared to muzzle velocity (Table 4). Even
so, the penetration depths are very similar for the two bullets (except for penetration in wet
sand). For the largest grain sizes, the penetration depth for the AP-red bullet is actually found
to be larger than for the AP bullet at muzzle velocity. This observation is in agreement with the
statement by Bless et al. [30] that for a given type of sand the total penetration depth depends
little on impact velocity. Measurements from Bless et al. [30] (using a PDV probe) also showed
that much penetration takes place at low velocities, indicating that measuring the penetration
depth is probably not the only way to characterize bullet performance. However, for wet sand
the penetration depth is very much a function of the impact velocity.
Some of the observations discussed above may be explained by studying the pictures in
Figure 9 of damaged bullets after typical tests. Pictures of the 7.62 mm Ball bullets are not
shown as these projectiles were completely demolished during impact. If we first compare
pictures of the 12.7 mm AP and AP-red bullets (i.e. the two columns to the right in Figure 9),
it is seen that the core of the bullet stays intact longer when the impact velocity is reduced. The
WC part of the core has separated from the steel sabot during impact in all granular materials
and it has fractured in a number of pieces at a grain size of 8-16 mm for the AP bullet. This is
in contrast to the AP-red bullet where separation and fragmentation first take place at a grain
size of 8-16 and 16-22 mm, respectively (except for wet sand where separation of the sabot
without fracture was seen). Thus, the delayed fragmentation of the AP-red bullet core seems to
compensate for the reduced impact velocity. Further, the 7.62 mm AP bullet is undamaged to a
grain size of 2-8 mm (i.e. the first column to the left in Figure 9), while it fractures into a number
of pieces for grain sizes larger than the bullet diameter. The mild steel core of the 12.7 mm Ball
bullet starts to erode at a grain size of 2-8 mm, and severe erosion is registered for larger grain

9
sizes. For penetration in wet and dry sand, all bullets seem to be more or less intact. An
exception is the 12.7 mm AP bullet, where both separation and some fragmentation are
observed. It is also assumed that the jacket has little effect on the penetration depth for the
various bullets, since it is ripped off early in the penetration process.
From these results, the main sources of energy redistribution and dissipation during impact
can be studied. Some of the bullet’s kinetic energy is transformed into elastic and kinetic
(ejecta) energy through contact and collision between grains during crater formation. Other
parts are dissipated by grain and bullet plastic deformation and fracture. However, for sand the
grain fracture process is assumed to dissipate little energy [16], and Figure 9 reveals that the
cores are essentially undamaged after impact. Huang et al. [20] further showed that the grain-
breakage extent under confined uniaxial dynamic tests in a modified SHPB is smaller than that
under quasi-static loading for the same stress level. In this study, possible fracture in the sand
grains and bullet cores are in any case neglected in the numerical models to be presented in
Section 4. For larger grain sizes these effects cannot be neglected, and more advanced
modelling is required (see e.g. [20]). For dry materials the most dominant energy-dissipation
mechanism seems to be friction due to particle-particle contact and body-grain sliding (see also
[11][22]). For wet materials, the effect of friction is considerably reduced and damping in the
sand mixture seems to be the most important energy-dissipation mechanism. Another very
important mechanism that controls the penetration depth in granular materials is the change of
bullet trajectory during penetration. The trajectory will be affected by several parameters, such
as the pitch/yaw at impact, the impact velocity, the diameter of the bullet, the water content in
the sand, the grain size of the granular material and possible sand grain/bullet core fracture.
From this study it seems like the larger the grain size, the more trajectory disturbance of the
bullet is obtained.
4. Numerical simulations
4.1. A particle-based method to model bullet penetration in sand
A discrete particle-based approach [25][35] has been developed to model the interaction
effects between various media and structural parts. To represent the soil, the method applies
discrete, rigid, spherical particles that transfer forces between each other through contact and
elastic collisions, while structural parts are represented by finite elements (see Figure 10 a)). In
[25] the particle-based soil parameters were calibrated to accurately represent an aggregate of
silica spheres representing a generic soil in mine blast applications. The spheres had a uniform

10
diameter of 200 μm and the parameters were tuned for both dry and fully saturated wet
conditions. The approach was validated against experimental test data where stainless steel
plates were subjected to the combined blast and soil impact loading from a buried charge [25].
A similar study on blast loaded extruded aluminium panel was conducted in [34].
There are essentially two reasons for using a particle-based approach when modelling soil.
Firstly, the method is based on a Lagrangian description of motion which, in contrast to
arbitrary Lagrangian-Eulerian (ALE) and Eulerian methods, is not associated with advection
related numerical errors [40]. Secondly, the framework allows for a simple, physically clear
and robust treatment of the interaction between the soil and the structural parts. This interaction
is numerically challenging when working with e.g. coupled Lagrangian-Eulerian methods. All
models applied in this study have been implemented in the non-linear finite element code
IMPETUS Afea Solver [36].
The same particle-based approach as described above has been used in the numerical
simulations in this study. The numerical approach is limited to 0-2 mm dry sand conditions
penetrated by AP bullets. As relevant mechanical properties were not available for the sand
used in the tests, it was decided to use the parameters for the generic dry soil from the studies
presented in [25] and [34]. The only modified input parameter is the initial density 0 , which
was adjusted from 1620 kg/m3 to 1726 kg/m3 to reflect the real sand density (see Table 1).
As already stated, one simplification with the suggested approach is that it neglects fracture
in the sand grains near the projectile. According to Parab et al. [41], grain failure in front of the
projectile is an important energy dissipating mechanism during sand penetration. Based on high
pressure compression testing under uniaxial and triaxial loading conditions, five different types
of damage and fracture mechanisms have been defined from microscopic observations of
individual sand particles – from single abrasion fracture to full pulverisation (see e.g.
[41][42][43]). Braslau [44] estimated that around 8 % of the projectile’s kinetic energy is
dissipated by pulverisation of sand grains, but in these tests the impact velocity was extremely
high (6.37 km/s). In this study, our primary focus is the loading on the projectile and to
accurately predict its deceleration and path when impacting a granular media. We do not
anticipate in capturing the micromechanics of the sand particles since we are using a
phenomenological model. A phenomenological model that can be made quite simple thanks to
the discrete particle starting point. Just as in a continuum mechanical model, grain fracture is
not modeled explicitly, but represented as inner friction in the material. Examples of more
advanced simulations using mesoscale models of the sand can be found in [45] and [46].
11
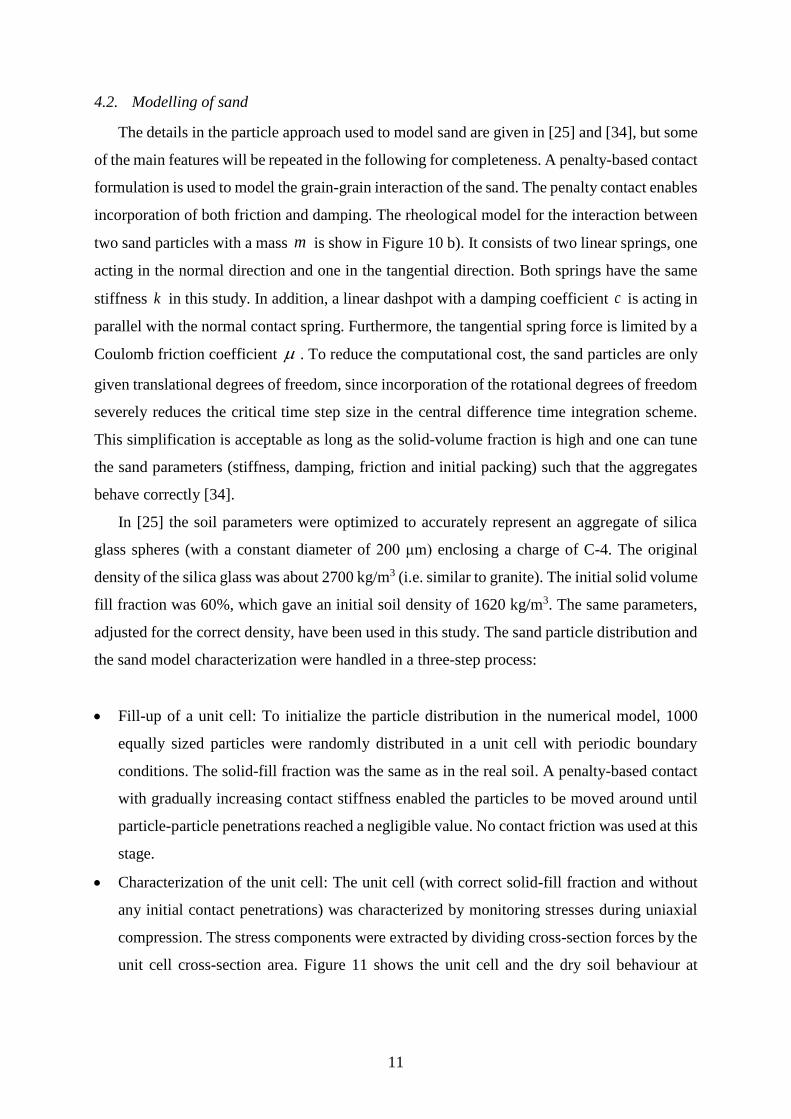
4.2. Modelling of sand
The details in the particle approach used to model sand are given in [25] and [34], but some
of the main features will be repeated in the following for completeness. A penalty-based contact
formulation is used to model the grain-grain interaction of the sand. The penalty contact enables
incorporation of both friction and damping. The rheological model for the interaction between
two sand particles with a mass m is show in Figure 10 b). It consists of two linear springs, one
acting in the normal direction and one in the tangential direction. Both springs have the same
stiffness k in this study. In addition, a linear dashpot with a damping coefficient c is acting in
parallel with the normal contact spring. Furthermore, the tangential spring force is limited by a
Coulomb friction coefficient . To reduce the computational cost, the sand particles are only
given translational degrees of freedom, since incorporation of the rotational degrees of freedom
severely reduces the critical time step size in the central difference time integration scheme.
This simplification is acceptable as long as the solid-volume fraction is high and one can tune
the sand parameters (stiffness, damping, friction and initial packing) such that the aggregates
behave correctly [34].
In [25] the soil parameters were optimized to accurately represent an aggregate of silica
glass spheres (with a constant diameter of 200 μm) enclosing a charge of C-4. The original
density of the silica glass was about 2700 kg/m3 (i.e. similar to granite). The initial solid volume
fill fraction was 60%, which gave an initial soil density of 1620 kg/m3. The same parameters,
adjusted for the correct density, have been used in this study. The sand particle distribution and
the sand model characterization were handled in a three-step process:
Fill-up of a unit cell: To initialize the particle distribution in the numerical model, 1000
equally sized particles were randomly distributed in a unit cell with periodic boundary
conditions. The solid-fill fraction was the same as in the real soil. A penalty-based contact
with gradually increasing contact stiffness enabled the particles to be moved around until
particle-particle penetrations reached a negligible value. No contact friction was used at this
stage.
Characterization of the unit cell: The unit cell (with correct solid-fill fraction and without
any initial contact penetrations) was characterized by monitoring stresses during uniaxial
compression. The stress components were extracted by dividing cross-section forces by the
unit cell cross-section area. Figure 11 shows the unit cell and the dry soil behaviour at

12
different particle-particle contact stiffness and coefficients of friction. In [25] the parameters
were coarsely adjusted to mimic a typical generic soil.
Optimization: The soil parameters were fine-tuned in an optimization process aiming at
matching the structural response based on a number of experimental tests. Note that any
given soil geometry can be defined by repeating the unit cell from the first step in the various
directions as many times as needed. As a result of the three-step process, it was decided to
model the dry soil conditions with a friction coefficient 0.1 and a contact stiffness
0 0( / )k L L k , where L is the unit cell length, 0 1 mL and ko = 0.4 GN/m. More details
regarding the model characterization of both dry and fully saturated wet soil can be found
in [25] and [34].
The particle-size sensitivity of the optimization procedure was checked by repeating the process
described above using 10,000 sand particles in the unit cell. No noticeable difference in the
final results was obtained.
4.3. Modelling of the bullets
The hard core of the AP bullets were modelled as rigid, while a modified version of the
Johnson-Cook constitutive relation (or the MJC model) was used to model the deformable parts
of the bullet. Thus, the constitutive behaviour of the deformable materials is assumed to be
isotropic and the von Mises equivalent stress is expressed as [41]
* *(1 ) (1 )n C m
eq eq eqA B T (1)
where eq is the equivalent plastic strain and , , , ,A B n C m are material constants. The
dimensionless plastic strain rate is given by *
0eq eq , where 0 is a user-defined reference
strain rate. The homologous temperature is defined as *
r m rT T T T T , where T is the
absolute temperature, rT is the ambient temperature and mT is the melting temperature. The
temperature change due to adiabatic heating is calculated as
0
eq
eq eq
p
dT
C
(2)

13
where is the material density, pC is the specific heat and is the Taylor-Quinney
coefficient that represents the proportion of plastic work converted into heat.
Fracture in the various bullet parts (except the rigid hard cores) was modelled using a
criterion proposed by Cockcroft and Latham (CL) [48] in which failure is assumed to occur
when the integral of the maximum principle tensile stress along the plastic strain path reaches
a critical value. The damage in an element is given as
1
0
1
eq
eq
cr cr
dWD
W W
(3)
where 1 is the major principal stress, 1 1 when 1 0 and 1 0 when
1 0 .
Therefore, damage does not grow, and fracture cannot occur, when there is no tensile stress
operating. It is further evident that the CL criterion includes the unilateral condition and further
depends on both the stress triaxiality and the Lode parameter through the positive part of the
major principal stress [49]. The critical value of W , denoted crW , can be determined from a
single uniaxial tensile test and is simple to implement in finite element codes. The CL failure
criterion has been found to give reliable results in ballistic perforation studies of steel and
aluminium plates (see e.g. [49][50]). Here, the deviatoric stresses in the element are set to zero
when W reaches its critical value crW at a specific integration point. This is defined as material
failure. However, the element continues to take compressive stresses until the time step size
drops below a critical level. The elements are eroded when falling below this critical level,
which in this study was set to 5 ns. Material constants for the bullet parts were taken from
Børvik et al. [38][51] and are listed in Table 6, while the physical constants for the various
materials summarized in Table 7 were given nominal values provided in the literature. The
polymer-based front cap of the 12.7 mm AP bullet was modelled as polycarbonate, with
material constants taken from [52].
4.4. Numerical models
All numerical simulations were carried out on a computer with 2 x Intel Xeon X5680 (3.33
GHz) CPUs and 4 x Nvida Tesla C2070 GPUs using the finite element code IMPETUS Afea
Solver [36]. This study is limited to the modelling of dry sand during penetration by hard-core

14
AP bullets, but several parametric studies for increased understanding of this particular
penetration problem have been carried out. The reason why only the sand, and not the larger
fractions of the granular materials, was modelled is that the interaction between particles and
the bullet becomes inaccurate if the particles are considerably larger than the finite elements
they are interacting with. Thus, the local contact conditions will not be accurate enough. Larger
grains must be represented by finite elements as in e.g. [20], and this requires a more
comprehensive modelling approach which is outside the scope of this study.
The geometry of the AP bullets and the sand target were similar to those used in the tests,
but some simulations using only the hard core of the bullet were carried out for comparison.
The bullets were modelled using fully integrated 3rd-order 64-node hexahedrons, with a typical
element size in the range 0.1 to 1 mm. This gave a total of 53,416 and 121,384 nodes in the
models for the 7.62 mm AP bullet and the 12.7 mm AP bullet, respectively. The impact
velocities were taken as 917 m/s for the 7.62 mm AP bullet and 673 m/s for the 12.7 mm AP
bullet. These values are the average velocities based on a large number of experimental tests,
(see Table 4). The reason why the 12.7 mm AP bullet was run with reduced impact velocity
was that core fracture occurred at muzzle velocity in the experimental tests as shown in Figure
9 b), and this is not accounted for in these simulations. The sand was modelled using particles
with different grain-size diameters stacked in a steel tube with varying dimensions to study the
effect of the boundary conditions. The chosen number of particles (from 250,000 to 16,000,000)
gave a grain-size diameter sd between 2.90 mm and 0.72 mm. This is larger than the smallest
grains seen in Figure 3, but of the same order as the median of 0.65 mm for the sand (as shown
in Figure 2 a)). Contact between the various parts was established using a penalty-based node-
to-surface algorithm. In the current work, all exterior nodes and element faces were active in
the contact. Typical computation times for a simulation using 7.62 mm bullets varied between
3 hours (250,000 particles) and 27 hours (16,000,000 particles). Typical numerical 3D models
of AP bullets and sand targets are shown in Figure 12.
5. Numerical results
Figure 13 gives predicted penetration depths versus time for the hard core of the 7.62 mm
AP bullet impacting dry sand with different grain size. Only the hard core of the bullet was
modelled in these simulations to save computational time, since the jacket is assumed to have
little effect on the total penetration depth (as discussed in Section 3). The tube was also

15
modelled with reduced dimensions of 300tL mm and 150tD mm to save computational
time. As shown in Figure 12 b), seven slightly different impact points were chosen for each
particle size to study the effect of random disturbances due to the particle stacking inside the
tube. Due to the packing of the particles the impact point has a significant effect on the
penetration depth, and justifies the large spread also seen experimentally (see Figure 6). Further,
the solution seems to coincide for a particle size less than 1.8 mm (i.e. more than 1,000,000
particles). For larger particles the predicted penetration depth becomes too small. It is also very
interesting to note that the scatter band in the numerical results is very similar to the scatter
band found experimentally. Note that if the full AP bullet and 2,000,000 particles are used in
the simulations, the average penetration depth based on 7 simulations was found to be 211 mm,
i.e. a slight increase compared to simulations with only the hard core where the average
penetration depth is 201 mm (which is practically identical to the average penetration depth
found experimentally).
To further study the particle-size sensitivity in the proposed approach, similar simulations
as those presented above were carried out using respectively 8,000,000 ( 0.95 mmsd ),
12,000,000 ( 0.83 mmsd ) and 16,000,000 ( 0.72 mmsd ) particles in the sand target. Also
these simulations were run with seven different impact points as shown in Figure 12 b). The
results from this sensitivity study are shown in Figure 14, and two important observations are
made. Firstly, some particle-size sensitivity is present in the simulations, but the penetration
depth seems to stabilize when the number of particles becomes large. Secondly, the scatter band
from the simulations seems to reduce as the number of particles increase. As the particle size is
reduced, the sand target becomes more and more uniform, and the important effect of bullet
trajectory change (as discussed in Section 3) during impact with larger particles are partly lost.
Thus, the particle size should be of the same order or somewhat larger than the median of the
real sand to give predictive results.
Figure 15 shows some plots from a typical simulation of the penetration process of a full
AP bullet in 2,000,000 particles of dry sand. In a similar way as seen experimentally, the jacket
is ripped off the core after some penetration, and is stopped at a much lower penetration depth.
The core starts to deviate from its trajectory after some penetration due to the many impacts
with the smaller particles, and this seems to be the major braking mechanism in the penetration
process. Due to this deviation, the core starts to rotate, and it rotates approximately 180º before
it is finally brought to rest at a penetration depth similar to that found experimentally.

16
The effect of the boundary conditions was checked by running simulations with 7.62 mm
AP bullets and a particle size of 1.8 mmsd . Both the full tube size ( 1000tL mm and
320tD mm) and a tube with reduced dimensions ( 300tL mm and 150tD mm) were
used in the simulations. No noticeable effect on the penetration depth with tube size was
registered. The reason for this is actually depictured in Figure 15, showing that the velocity
field in the sand has not reached the boundary before the penetration process is over. Based on
results like these, it was decided not to model the steel tube itself in the rest of the simulations
with 7.62 mm bullets to save computational time. However, as will be shown the 12.7 mm
bullet deviated more in the radial direction than the 7.62 mm bullet, so the steel tube had to be
modelled in the simulations involving 12.7 mm bullets.
As stated in Section 2.1, the 7.62 mm bullets are not able to spin due to the smooth barrel,
while the 12.7 mm bullets spin around their own axis of symmetry. During perforation of thin
steel or aluminium plates, this spin is not assumed to have any significant effect on the
penetration ability of the bullet. However, in deep penetration of a granular material like sand,
the spin may be important. To study the effect of this spin, some simulations were carried out
using both a full 7.62 mm AP bullet and only the hard core of the same bullet. A sand target
with reduced dimensions of 300tL mm and 200tD mm was used in these simulations. The
rotational speed (or spin) of the bullet was taken as 25000 Hz by assuming a tangential speed
of 100 m/s at a radial distance of 3.95 mm, and the results from the simulations based on seven
different impact points for each case are plotted in Figure 16. It is seen that when the full bullet
is simulated, there is a clear drop in penetration depth when the bullet is allowed to spin. The
average penetration depth without spin is 211 mm, while it is 181 mm with spin. In the
experimental tests (without spin) the average penetration depth was found to be 202 mm. For
the hard core only, the situation is different. Here the average penetration depth without spin is
201 mm, while it is 200 mm with spin. Also the general spread in the results is lower when only
the hard core of the bullet is used in the simulations. Thus, it seems like the deformation and
separation of the jacket inside the sand target is more important when the bullet is spinning.
This process dissipates energy and slows down the bullet, and the depth of penetration is
reduced, at least to some extent. This seems physical, but it remains to validate these results
experimentally.
Figure 17 shows the effect of the bullet trajectory on the penetration depth. When the
trajectory is constrained along the length of the tube (i.e. no rotations or deviations allowed),
the bullet penetrates very deep. Since the bullet core is very aerodynamic, it is not slowed down

17
by the sand in a similar way as if it is allowed to deviate from the initial trajectory. The force
that brakes the bullet is approximately proportional to the velocity squared. Thus, in a
frictionless material the penetration depth goes towards infinity at low velocities, but due to
frictional effects in the sand the bullet will eventually stop. Figure 17 further shows that if the
bullet is free to rotate and diverge from the initial trajectory, the penetration depth is
considerably reduced. Also the yaw angle at impact is important for the final penetration depth.
If the yaw angle is increased to 3°, the penetration depth is decreased by approximately 25%
compared to an impact without yaw.
Figure 13 showed an almost perfect comparison between the experimental results and the
numerical predictions. To further investigate the quantitative capability of the numerical
approach, it was decided to run the 12.7 mm AP bullets (Figure 12 a)) with reduced velocity
impacting dry sand. In these simulations the sand target was modelled by 4,000,000 particles
with a particle size of 2.1 mmsd confined inside a steel tube with dimensions 700tL mm
and 150tD mm. Figure 9 revealed that the WC part of the core may separate (without
fracture) from the steel sabot during penetration. To explore the effect of this separation,
simulations where the steel sabot was either loosely attached or fully fixed to the WC part of
the core were run. The predicted results are summarized in Figure 18. Only five simulations
were run for each case to save computational time. The average penetration depth based on
these simulations is as seen slightly lower than that found experimentally (460 mm for both the
loose and fixed steel sabot versus 498 mm in the experiments), but the predicted results fall
within the experimental scatter band. However, it should be noticed that the simulations with a
loose steel sabot were terminated after 2.5 ms, while the simulations with a fixed steel sabot
were run 4 times longer. It is seen from Figure 18 that the penetration process continues for a
long time at low velocities. This is in agreement with the experimental observations by Bless
et al. [30]. Thus, the average penetration depth for the loosely attached steel sabot would have
increased somewhat if the simulations were continued. For the fixed steel sabot, the penetration
depth increases by approximately 50 mm when the simulation time is increased from 2.5 ms to
10 ms. From this it may be anticipated that the penetration depth increases somewhat when the
steel sabot separates from the WC part, i.e. the steel sabot brakes the bullet due to a less
aerodynamic surface.
Also these results seem to confirm the prediction accuracy of the approach. Note that due
to the increased penetration depth and number of particles, the computational time increased
from 10-15 hours to more than 150 hours (for the loose steel sabot) and 450 hours (for the fixed

18
steel sabot). Some plots from a typical numerical simulation showing the penetration process
of a 12.7 mm AP bullet with a loose steel sabot impacting dry sand are shown in Figure 19,
while corresponding plots from the penetration process of a 12.7 mm AP bullet with a fixed
steel sabot are shown in Figure 20. If these plots are compared to those for the 7.62 mm AP
bullet shown in Figure 16, the penetration process is seen to be similar. The only main
difference is that the core of the 12.7 mm AP bullet seems to hit and slide along the steel tube
wall at low velocities. Thus, it was necessary to model the whole tube.
These simulations demonstrate the capability of the proposed numerical approach to do
both qualitative and quantitative predictions of the penetration process in sand by small-arms
bullets. It is now possible, using this type of numerical tools, to do a number of parametric
studies of small-arms bullets penetrating various types of sand-filled protective structures. One
study of particular interest is the effect of water content in the sand. However, due to the lack
of reliable material data for the sand used in this study, this is left for further studies.
6. Concluding remarks
This paper has presented an experimental and numerical study on the penetration of granular
materials by small-arms bullets. The tests were carried out using different rifles to fire the
bullets, while the granular materials were randomly packed in a 320 mm diameter steel tube. In
all tests, involving four different bullet types and five different granular materials, the initial
bullet velocity and the depth of penetration in the granular material were measured. The general
trends based on the experimental results are that the penetration depth is considerably larger in
wet sand than in dry sand independent of bullet type, that the penetration depth increases
exponentially with expected bullet performance for the smallest grain sizes (sand and gravel),
while for the largest grain sizes (crushed stone and rock) the penetration depth increases more
linearly with bullet performance and strength (at least for the grain sizes investigated in this
study). It was also shown that core fracture may give a reduction in penetration capability. The
main sources of energy dissipation during impact were found to be Coulomb friction due to
particle-particle contact and body-grain sliding and the change of bullet trajectory during
penetration. Also the plastic work in the jacket and the separation from the core were found to
absorb some of the kinetic energy, so the full bullet should be modelled.
In the numerical simulations, a discrete particle-based approach was used to model the
behaviour of dry sand during impact by 7.62 mm AP and 12.7 mm AP bullets. The method
works with discrete, rigid, spherical particles that transfer forces between each other through

19
contact and collisions, allowing for a simple and robust treatment of the interaction between the
sand particles and the bullet which is represented by finite elements. Based on the proposed
approach, several numerical studies have been carried out. Taking the simplicity of the
numerical simulations and the complexity of the investigated problem into account, good
agreement between the experimental results and the numerical predictions is in general
obtained. This validates the prediction accuracy of the proposed numerical approach.
Acknowledgements
The financial support of this work from the Structural Impact Laboratory (SIMLab), Centre
for Research-based Innovation (CRI), at the Norwegian University of Science and Technology
(NTNU) is gratefully acknowledged.
20
References
[1] Børvik T, Hanssen AG, Dey S, Langberg H, Langseth M. On the ballistic and blast load
response of a 20ft ISO container protected with aluminium panels filled with a local mass
– Phase I: Design of protective system. Engineering Structures 2008;30:1605-1620.
[2] Børvik T, Burbach A, Langberg H, Langseth M. On the ballistic and blast load response
of a 20ft ISO container protected with aluminium panels filled with a local mass – Phase
II: Validation of protective system. Engineering Structures 2008;30:1621-1631.
[3] Young CW. Depth predictions for earth-penetrating projectiles. ASCE Journal of the Soil
Mechanics and Foundations Division 1969;95:803-817.
[4] Corbett GG, Reid SR, Johnson W. Impact loading of plates and shells by free-flying
projectiles: A review. International Journal of Impact Engineering 1996;18:141-230.
[5] Allen WA, Mayfield EB, Morrison HL. Dynamics of a projectile penetrating sand. Journal
of Applied Physics 1957;28:370-376.
[6] Allen WA, Mayfield EB, Morrison HL. Dynamics of a projectile penetrating sand. Part II.
Journal of Applied Physics 1957;28:1331-1335.
[7] Bai YL, Johnson W. The effect of projectile speed and medium resistance in ricochet off
sand. Journal of Mechanical Engineering Science 1981;23:69-75.
[8] Forrestal MJ, Longcope DB. Closed-form solutions for forces on conical-nosed penetrators
into geological targets with constant shear strength. Mechanics of Materials 1982;1:285-
295.
[9] Forrestal MJ, Grady DE. Penetration experiments for normal impact into geological
targets. International Journal of Solids and Structures 1982;18:229-234.
[10] Forrestal MJ, Luk VK. Penetration into soil targets. International Journal of Impact
Engineering 1992;12:427-444.
[11] Omidvar M, Iskander M, Bless S. Repsonse of granular media to rapid penetration.
International Journal of Impact Engineering 2014;66:60-82.
[12] Laine L, Sandvik A. Derivation of Mechanical Properties for sand. Proceedings of 4th Asia-
Pacific Conference on Shock and Impact Loads on Structures, Singapore, November 2001,
pp. 361-368.
[13] Grujicic M, Pandurangan B, Cheeseman BA. The effect of degree of saturation of sand on
detonation phenomena associated with shallow-buried and ground-laid mines. Shock and
Vibration 2006;13:41-61.
[14] Grujicic M, Pandurangan B, Qiao R, Cheeseman BA, Roy WN, Skaggs RR, Gupta R.
Parameterization of the porous-material model for sand with different levels of water
saturation. Soil Dynamics and Earthquake Engineering 2008;28:20-35.
[15] Kharab A, Hudspeth RT, Guenther RB. Penetration of cylindrical projectiles into saturated
sandy media. Experimental Mechanics 2009;49:605-612.
[16] Deshpande VS, McMeeking RM, Wadley HNG, Evans AG. Constitutive model for
predicting dynamic interactions between soil ejecta and structural panels. Journal of the
Mechanics and Physics of Solids 2009;57:1139–1164.
[17] Arlery M, Gardou M, Fleureau JM, Mariotti. Dynamic behaviour of dry and water-
saturated sand under planar shock conditions. International Journal of Impact Engineering
2010;37:1-10.
[18] Zakrisson B, Häggblad H-Å, Jonsén P. Modelling and simulation of explosions in soil
interacting with deformable structures. Central European Journal of Engineering
2012;2:532-550.
[19] Park S, Uth T, Fleck NA, Wadley HNG, Deshpande VS. Sand column impact into a Kolsky
pressure bar. International Journal of Impact Engineering 2013;62:229-242.

21
[20] Huang J, Xu S, Hu S. Influence of particle breakage on the dynamic compression responses
of brittle granular materials. Mechanics of materials 2014;68:15-28.
[21] Luo H, Baum JD, Löhner R. On the computation of multi-material flows using ALE
formulation. Journal of Computational Physics 2004;194:304-328.
[22] Tsimring LS, Volfson D. Modeling of impact cratering in granular media. In: Powders and
Grains 2005 – Proceedings of the 5th International Conference on Micromechanics of
Granular Media 2005;2:1215-1218.
[23] Neuberger A, Peles S, Rittel D. Scaling the response of circular plates subjected to large
and close-range spherical explosions. Part II: Buried charges. International Journal of
Impact Engineering 2007;34:874-882.
[24] Grujicic M, Pandurangan B, Coutris N, Cheeseman BA, Roy WN, Skaggs RR. Computer-
simulations based development of a high-rate, large-deformation, high-pressure material
model for STANAG 4569 sandy gravel. Soil Dynamics and Earthquake Engineering
2008;28:1045-1062.
[25] Børvik T, Olovsson L, Hanssen AG, Dharmasena KP, Hansson H, Wadley HNG. A
discrete particle approach to simulate the combined effect of blast and sand impact loading
of steel plates. Journal of the Mechanics and Physics of Solids 2011;59:940-958.
[26] Johnson GR, Beissel SR, Gerlach CA. Another approach to a hybrid particle-finite element
algorithm for high-velocity impact. International Journal of Impact Engineering 2011;
38:397-405.
[27] Rimoli JJ, Talamini B, Wetzel JJ, Dharmasena KP, Radovitzky R, Wadley HNG. Wet-
sand impulse loading of metallic plates and corrugated core sandwich panels. International
Journal of Impact Engineering 2011;38:837-848.
[28] Collins AL, Addiss JW, Walley SM, Promratana K, Bobaru F, Proud WG, Williamson
DM. The effect of rode nose shape on the internal flow field during the ballistic penetration
of sand. International Journal of Impact Engineering 2011;38:951-963.
[29] Borg JP, Morrissey MP, Perich CA, Vogler TJ, Chhabildas LC. In situ velocity and stress
characterization of a projectile penetrating a sand target: Experimental measurements and
continuum simulations. International Journal of Impact Engineering 2013;51:23-35.
[30] Bless SJ, Berry TD, Pedersen B, Lawhorn W. Sand penetration by high-speed projectiles.
In: Shock compression of condensed matter - AIP Conference Proceedings 1195,
Nashville, USA, 28. June – 3. July 2009:1361-1364.
[31] Bless SJ. Private communication.
[32] Pingle SM, Fleck NA, Wadley HNG, Deshpande VS. Discrete element calculations of the
impact of a sand column against rigid structures. International Journal of Impact
Engineering 2012;45:74-89.
[33] Omidvar M, Iskander M, Bless S. Stress-strain behavior of sand at high strain rates.
International Journal of Impact Engineering 2012;49:192-213.
[34] Wadley HNG, Børvik T, Olovsson L, Wetzel JJ, Dharmasena KP, Hopperstad OS,
Deshpande VS, Hutchinson JW. Deformation and fracture of impulsively loaded sandwich
panels. Journal of the Mechanics and Physics of Solids 2013;61:674-699.
[35] Olovsson L, Hanssen AG, Børvik T, Langseth M. A particle-based approach to close-range
blast loads. European Journal of Mechanics – A/Solids 2010;29:1-6.
[36] www.impetus-afea.com [cited 10.03.2014].
[37] Børvik T, Langseth M, Hopperstad OS, Malo KA. Ballistic penetration of steel plates.
International Journal of Impact Engineering 1999;22:855-886.
[38] Børvik T, Dey S, Clausen AH. Perforation resistance of five different high-strength steel
plates subjected to small-arms projectiles. International Journal of Impact Engineering
2009;36:948-964.
[39] www.wikipedia.com [cited 10.03.2014].
22
[40] Børvik T, Hanssen AG, Langseth M, Olovsson L. Response of structures to planar blast
loads – A finite element engineering approach. Computers & Structures 2009;87:507-520.
[41] Parab ND, Claus B, Hudspeth MC, Black JT, Mondal A, Sun J, Fezzaa K, Xiao X, Luo
SN, Chen W. Experimental assessment of fracture of individual sand particles at different
loading rates. International Journal of Impact Engineering 2014;68:8-14.
[42] Nakata Y, Hyodo M, Hyde AFL, Kato Y, Murata H. Microscopic particle crushing of sand
subjected to high pressure one-dimensional compression. Soils and Foundations
2001;41:69-82.
[43] Karner SL, Chester FM, Kronenberg AK, Chester JS. Subcritical compaction and yielding
of granular quartz sand. Tectonophysics 2003;377:357-381.
[44] Braslau D. Partitioning of energy in hypervelocity impact against loose sand target. Journal
of Geophysical Research 1970;75:3987-3999.
[45] Lammi CJ, Vogler TJ. Mesoscale simulations of granular materials with peridynamics.
Shock Compression and Condensed Matter – 2011. AIP Conference Proceedings 1426,
2012:1467-1470.
[46] Borg JP, Vogler TJ. Rapid compaction of granular material: characterizing two- and three-
dimensional mesoscale simulations. Shock waves 2013;23:153-176.
[47] Børvik T, Hopperstad OS, Berstad T, Langseth M. A computational model of
viscoplasticity and ductile damage for impact and penetration. European Journal of
Mechanics – A/Solids 2001;20: 685-712.
[48] Cockcroft MG, Latham DJ. Ductility and workability of metals. Journal Institute of Metals
1968;96:33-39.
[49] Kane A, Børvik T, Berstad T, Hopperstad OS. Failure criteria with unilateral conditions
for simulation of plate perforation. European Journal of Mechanics A/Solids 2011;30:468-
476.
[50] Dey S, Børvik T, Hopperstad OS, Langseth M. On the influence of fracture criterion in
projectile impact of steel plates. Computational Materials Science 2006;38:176-191.
[51] Børvik T, Olovsson L, Dey S, Langseth M. Normal and oblique impact of small arms
bullets on AA6082-T4 aluminium protective plates. International Journal of Impact
Engineering 2011;38:577-589.
[52] Johnson GR. Material characterization for warhead computations. In: Carleone J, editor.
Tactical missile warheads, Progress in astronautics and aeronautics, vol. 155; 1993.

23
a) Empty tube in upright position b) Filled tube in closed position
c) Side view of tube d) Front view of tube
Figure 1. Schematic drawing of tube used to confine the granular materials during impact.

24
a) Sand (0-2 mm) b) Gravel (2-8 mm)
c) Crushed stone (8-16 mm) d) Crushed rock (16-22 mm)
Figure 2. Grading curves and median x for the various granular materials.
Figure 3. Optical microscope image of a typical sand sample. The red line across the largest
grain seen in the picture has a length of 0.65 mm.
0
10
20
30
40
50
60
70
80
90
100
3222,41611,284210,50,250,125
Sieve (mm)
Sie
ve
resi
du
e (%
)
0
10
20
30
40
50
60
70
80
90
100
3216820,50,125
Sieve (mm)
Sie
ve
resi
du
e (%
)
0
10
20
30
40
50
60
70
80
90
100
3222,41611,284210,50,250,125
Sieve (mm)
Sie
ve
resi
du
e (%
)
0
10
20
30
40
50
60
70
80
90
100
3222,41611,284210,50,250,125
Sieve (mm)
Sie
ve
resi
du
e (%
)
0.65 mmx 4.8 mmx
11.4 mmx 19 mmx

25
a) Sand (0-2 mm) b) Gravel (2-8 mm)
c) Crushed stone (8-16 mm) d) Crushed rock (16-22 mm)
Figure 4. Comparison between granular materials and bullets used in the tests.

26
a) b) c) d)
Figure 5. Schematic drawings and geometry of bullets: a) 7.62 mm Ball, b) 7.62 mm AP, c)
12.7 mm Ball and d) 12.7 mm AP.

27
Figure 6. Penetration depth versus impact velocity of 7.62 mm AP bullets in wet sand (left) and
dry sand (right).
7.62 Ball 7.62 AP 12.7 Ball 12.7 AP
0
100
200
300
400
500
600
700
800
900
1000
Pen
etra
tion
dep
th [
mm
]
Wet sand (0-2 mm)
Dry sand (0-2 mm)
Gravel (2-8 mm)
Crushed stone (8-16 mm)
Crushed rock (16-22 mm)
Figure 7. Average penetration depth versus bullet type.
900 910 920 930 940Impact velocity [m/s]
150
180
210
240
270
300
Pen
etra
tion
dep
th [
mm
] Average value mm
Wet sand (0-2 mm)
900 910 920 930 940Impact velocity [m/s]
150
180
210
240
270
300
Pen
etra
tion
dep
th [
mm
]
Average value mm
Dry sand (0-2 mm)

28
0-2 (wet) 0-2 (dry) 2-8 8-16 16-22
0
50
100
150
200
250
300
Pen
etra
tion
dep
th [
mm
]
7.62 mm AP
7.62 mm Ball
a) 7.62 mm Ball versus 7.62 mm AP
0-2 (wet) 0-2 (dry) 2-8 8-16 16-22
0
200
400
600
800
1000
Pen
etra
tion
dep
th [
mm
]
12.7 mm AP
12.7 mm Ball
b) 12.7 mm Ball versus 12.7 mm AP
0-2 (wet) 0-2 (dry) 2-8 8-16 16-22
0
200
400
600
800
1000
Pen
etra
tion
dep
th [
mm
]
12.7 mm AP
12.7 mm AP-red
c) 12.7 mm AP versus 12.7 mm AP-red
Figure 8. Average penetration depths versus granular material for various bullet types.

29
a) 0-2 mm wet sand
b) 0-2 mm dry sand
c) 2-8 mm gravel
d) 8-16 mm crushed stone
e) 16-22 mm crushed rock
Figure 9. Pictures of damaged bullets after typical tests. From left to right: 7.62 mm AP
( 917 m/s)avgv , 12.7 mm Ball ( 826 m/s)avgv , 12.7 mm AP ( 829 m/s)avgv and 12.7 mm
AP-red ( 673 m/s)avgv . The pictures are not in scale.

30
a) b)
Figure 10. a) Modelling principle of the discrete particle-based method for the interaction
between a penetrating AP bullet and the sand grains, and b) rheological model for the sand
interaction.
Figure 11. Pressures obtained in numerical simulations of the unit cell during compression tests
of dry sand [34]. Here, is the current density, 0 is the initial density and p is the applied
pressure in various directions.

31
a) Details of a 7.62 mm AP bullet (left) and a 12.7 mm AP bullet (right) impacting a sand target (not in scale).
b) Overview showing the 7.62 mm AP bullet impacting a sand target and the various impact points.
Figure 12. Typical numerical models of AP bullets and sand targets.
1
2mm
23
4
5
6
7
Dt

32
Figure 13. Predicted penetration depth versus time for the hard core of the 7.62 mm AP bullet
impacting sand particles of different size. Seven different impact points were used for each
particle size to study the effect of random disturbances due to the particle stacking in the tube
with dimensions 300 mmtL and 150 mmtD . The number of particles give a grain size of
2.90 mmsd (250,000 particles), 1.82 mmsd (1,000,000 particles) and 1.15 mmsd
(4,000,000 particles).
0 100 200 300 400 500
Time [s]
0
50
100
150
200
250
Pen
etr
ati
on
dep
th [
mm
]
Number of particles
250 000
1 000 000
4 000 000
Test results
Average test result mm
Min test result mm
Max test result mm

33
Figure 14. Particle-size sensitivity study.
Figure 15. Colour plots from a typical numerical simulation showing penetration of a 7.62 mm
AP bullet in 1,000,000 particles ( 1.82 mmsd ) of dry sand. The colours represent the velocity
field. Note that the pictures have been cropped from the right to better reflect the perforation
process (i.e. the full sand target is not shown).
0 4000000 8000000 12000000 16000000 20000000
Number of particles
100
125
150
175
200
225
250
Pen
etra
tion d
epth
[m
m]
Average DOP
Scatter band
Average test result ~ 202 mm
t = 20 μs t = 100 μs
t = 200 μs t = 500 μs

34
a) b)
Figure 16. Predicted penetration depth versus time for a) full AP bullet and b) only the hard
steel core of the 7.62 mm AP bullet with and without spin. Seven different impact points were
used for each particle size to study the effect of random disturbances due to the particle stacking
in the tube with reduced dimensions 300 mmtL and 200 mmtD . The number of particles
in these simulations was equal to 1,000,000 ( 1.82 mmsd ).
Figure 17. Plot showing the average penetration depth versus current bullet velocity of a 7.62
mm AP bullet in dry sand as a function of bullet trajectory (the bullet is either free to rotate or
constrained to its initial path) and yaw angle .
0 100 200 300 400 500
Time [s]
0
50
100
150
200
250
300
Pen
etr
atio
n d
epth
[m
m]
AP bullet
No spin
Spin
0 100 200 300 400 500
Time [s]
0
50
100
150
200
250
300
Pen
etr
atio
n d
epth
[m
m]
Hard core only
No spin
Spin
1000 800 600 400 200 0
Bullet velocity [m/s]
0
100
200
300
400
500
600
700
800
Pen
etr
ati
on
dep
th [
mm
]
Free trajectory (
Constrained trajectory (
Free trajectory (

35
a) b)
Figure 18. Predicted penetration depth versus time for the 12.7 mm AP-red bullet with a) loose
sabot and b) fixed sabot impacting particles with a size of 2.1sd mm. Five different impact
points were used for each particle size to study the effect of random disturbances due to the
particle stacking in the tube with reduced dimensions 700tL mm and 150tD mm.
Figure 19. Colour plots from a numerical simulation showing penetration of a 12.7 mm AP
bullet with a loose sabot in dry sand. The colours represent the velocity field. Note that the
pictures have been cropped from the right to better reflect the perforation process.
0 500 1000 1500 2000 2500
Time [s]
0
100
200
300
400
500
600P
enetr
atio
n d
epth
[m
m]
Loose sabot
12.7 mm AP-red
Test results
Average test result mm
Min test result mm
Max test result mm
0 2000 4000 6000 8000 10000
Time [s]
0
100
200
300
400
500
600
Pen
etr
atio
n d
epth
[m
m]
Fixed sabot
12.7 mm AP-red
Test results
Average test result mm
Min test result mm
Max test result mm
t = 100 μs t = 500 μs
t = 1000 μs t = 2000 μs

36
Figure 20. Colour plots from a numerical simulation showing penetration of a 12.7 mm AP
bullet with a fixed steel sabot in dry sand. The colours represent the velocity field. Note that the
pictures have been cropped from the right to better reflect the perforation process.
t = 2000 μs t = 500 μs

37
Table 1. Material properties of the granular materials.
Granular material Fineness
modulus
Young’s
modulus (MPa)
Density
(kg/m3)
Breaking
strength (MPa)
Wet sand (0-2 mm) 2.25 31800* 1856 232.6*
Dry sand (0-2 mm) 2.25 31800* 1726 232.6*
Gravel (2-8 mm) 5.03 31800* 1511 232.6*
Crushed stone (8-16 mm) 6.44 31800* 1508 232.6*
Crushed rock (16-22 mm) 7.35 31800* 1494 232.6*
* These numbers are taken from Årdal granite.
Table 2. Geometry and mass of the various bullet parts.
Calibre Part Material L
[mm]
dmax
[mm]
m
[g]
7.62 mm Ball Jacket Brass CuZn10 28.6 7.8 5.0
Core Antimony-alloyed lead 27.4 6.6 4.5
7.62 mm AP
Jacket Brass CuZn10 34.9 7.9 4.4
Core Hardened steel 27.6 6.1 5.0
Front cap Antimony-alloyed lead 9.3 5.1 0.7
End cap Brass CuZn10 4.0 6.2 0.4
12.7 mm Ball
Jacket Brass CuZn10 58.2 13.0 14.5
Core Mild steel 46.9 10.6 25.3
End cap Antimony-alloyed lead 4.4 7.8 1.6
12.7 mm AP
Jacket Brass CuZn10 58.1 13.0 14.3
Core Tungsten carbide 32.7 7.8 20.5
Sabot Mild steel 23.0 10.8 9.5
Front cap Polymer-based 16.2 10.8 0.6
End cap Antimony-alloyed lead 3.5 9.2 0.8
Table 3. Experimental programme (where the number indicates the number of repetitions within
each test series).
Granular material 7.62 Ball 7.62 AP 12.7 Ball 12.7 AP 12.7 AP-red
Wet sand (0-2 mm) 4 6 3 1 5
Dry sand (0-2 mm) 4 6 5 4 6
Gravel (2-8 mm) 3 5 5 8 4
Crushed stone (8-16 mm) 3 6 5 6 6
Crushed rock (16-22 mm) 6 6 6 8 5
38
Table 4. Average impact velocities (with standard deviations) and kinetic energies.
Table 5. Average penetration depth (in mm) and standard deviation (in parenthesis) with respect
to bullet type and granular material.
Filling material 7.62 Ball 7.62 AP 12.7 Ball 12.7 AP 12.7 AP-red
Wet sand (0-2 mm) 200
(10.0) 263 (9.4)
455
(33.0) > 1000 (-) 732 (86.3)**
Dry sand (0-2 mm) 98 (2.2) 202
(19.7)
306
(24.2) 505 (11.2)
498
(56.4)***
Gravel (2-8 mm) 100 (4.1) 212
(11.7)
316
(15.0)
628
(60.8)* 545 (28.7)
Crushed stone (8-16 mm) 100 (4.1) 182 (6.9) 278 (7.5) 400 (23.8) 423 (27.5)
Crushed rock (16-22
mm) 105 (5.0)
151
(10.2)
222
(12.1) 310 (9.4) 332 (35.4)
* Without outliers the average penetration depth and standard deviation are 637 mm and 35.4 mm, respectively. ** Without outliers the average penetration depth and standard deviation are 710 mm and 22.3 mm, respectively. *** Without outliers the average penetration depth and standard deviation are 533 mm and 35.6 mm, respectively.
Table 6. Bullet material constants for the MJC constitutive relation and CL failure criterion.
Material
Yield
stress
Strain
hardening
Strain rate
hardening
Temperature
softening Fracture
A (MPa)
B (MPa)
n 0
(s-1) C rT
(K)
mT
(K) m
crW
(MPa)
Lead core/cap 24 300 1.0 5·10-4 0.1 293 760 1.0 175
Brass jacket 206 505 0.42 5·10-4 0.01 293 1189 1.68 914
Polycarbonate 76 69 1.0 5·10-4 0 293 533 1.85 110
Table 7. General material constants for the MJC constitutive relation.
Material E
(MPa)
(kg/m3) pC
(J/kgK)
(K-1)
Steel alloys 210000 0.33 7850 452 0.9 1.2·10-5
Tungsten carbide 643000 0.21 15565 238 0.9 5.8·10-6
Lead core/cap 10000 0.42 10660 124 0.9 2.9·10-5
Brass jacket 115000 0.31 8520 385 0.9 1.9·10-5
Polycarbonate 22000 0.37 1200 1340 0.9 7.2·10-5
7.62 Ball 7.62 AP 12.7 Ball 12.7 AP 12.7 AP-red
Average velocity [m/s] 902.1 916.8 825.5 828.6 672.5
Standard deviation [m/s] 5.93 11.63 9.50 6.54 6.71
Average impact energy [Nm] 3865 4413 14413 16135 10628
Copyright © 2022 FDOKUMEN