design guides for high strength structural hollow sections ...
28
DESIGN GUIDES FOR HIGH STRENGTH STRUCTURAL HOLLOW SECTIONS MANUFACTURED BY SSAB - FOR EN 1090 APPLICATIONS SSAB produces a wide variety of hollow sections in different steel grades according to European standard EN 10219. The standard EN 10219 covers steel grades S235 – S460, but our offering goes beyond this up to steel grade S900. These design guides show how to make most of the high strength hollow sections produced by SSAB in design according to Eurocode 3. DESIGN GUIDE FOR COLD-FORMED S500MH – S700MH STRUCTURAL HOLLOW SECTIONS MANUFACTURED BY SSAB This document gives guidance on how to use the high strength grades in design despite they are lacking a product standard. Also material requirements given by Eurocode 3 are covered. The use of S500MH-S700MH structural hollow sections requires that the material properties should be specified in the component specification. The design guide can be used for the project-based approval of the high-strength structural hollow sections which are not covered by EN 10219, a reference standard in EN 1090. AXIAL RESISTANCE OF DOUBLE GRADE (S355, S420) HOLLOW SECTIONS MANUFACTURED BY SSAB In this study the buckling curve for double grade hollow section has been determined experimentally. It is shown that within speci- fied geometrical limits curve b instead of curve c according to Eurocode 3 can be utilized. A designer can utilize the improved buckling curve in the design and it is suggested to include this design guide in the design documentation. Both of these studies were conducted as a joint project between Tampere University of Technology and Lappeenranta University of Technology. The validity of results is verified by professors Timo Björk and Markku Heinisuo. These design guides are valid only to hollow sections manufactured by SSAB. For further information please contact SSAB sales or technical customer service.
-
Upload
khangminh22 -
Category
Documents
-
view
1 -
download
0
Transcript of design guides for high strength structural hollow sections ...

DESIGN GUIDES FOR HIGH STRENGTH STRUCTURAL HOLLOW SECTIONS MANUFACTURED BY SSAB - FOR EN 1090 APPLICATIONS
SSAB produces a wide variety of hollow sections in different steel grades according to European standard EN 10219. The standard EN 10219 covers steel grades S235 – S460, but our offering goes beyond this up to steel grade S900. These design guides show how to make most of the high strength hollow sections produced by SSAB in design according to Eurocode 3.
DESIGN GUIDE FOR COLD-FORMED S500MH – S700MH STRUCTURAL HOLLOW SECTIONS MANUFACTURED BY SSAB
This document gives guidance on how to use the high strength grades in design despite they are lacking a product standard. Also material requirements given by Eurocode 3 are covered. The use of S500MH-S700MH structural hollow sections requires that the material properties should be specified in the component specification. The design guide can be used for the project-based approval of the high-strength structural hollow sections which are not covered by EN 10219, a reference standard in EN 1090.
AXIAL RESISTANCE OF DOUBLE GRADE (S355, S420) HOLLOW SECTIONS MANUFACTURED BY SSAB
In this study the buckling curve for double grade hollow section has been determined experimentally. It is shown that within speci-fied geometrical limits curve b instead of curve c according to Eurocode 3 can be utilized. A designer can utilize the improved buckling curve in the design and it is suggested to include this design guide in the design documentation.
Both of these studies were conducted as a joint project between Tampere University of Technology and Lappeenranta University of Technology. The validity of results is verified by professors Timo Björk and Markku Heinisuo. These design guides are valid only to hollow sections manufactured by SSAB. For further information please contact SSAB sales or technical customer service.

2
DESIGN GUIDE FOR COLD-FORMED S500MH - S700MH STRUCTURAL HOLLOW SECTIONS MANUFACTURED BY SSAB

3
1 Faculty of business and built environment Department of Structural Engineeing 26.09.2014 Research Centre of Metal Structures _____________________________________________________________________________________________________
_________________________________________________________________________________________________________ Address: Email [email protected] Kampusranta 9 C 60320 Seinäjoki, Finland Mob. +358 40 596 5826
Design guide for cold-formed S500MH - S700MH structural hollow sections manufactured by SSAB
Contents
DESIGN GUIDE FOR COLD-FORMED S500MH - S700MH STRUCTURAL HOLLOW SECTIONS MANUFACTURED BY SSAB ............................................................................................................................................. 1
Introduction .................................................................................................................................... 2 Member design ............................................................................................................................... 2 Joint design .................................................................................................................................... 3
Welded joints of tubular structures ............................................................................................ 3 Weld design ................................................................................................................................ 5
Summary ........................................................................................................................................ 6 Signatures ....................................................................................................................................... 6 References ...................................................................................................................................... 7

4
2 Faculty of business and built environment Department of Structural Engineeing 26.09.2014 Research Centre of Metal Structures _____________________________________________________________________________________________________
_________________________________________________________________________________________________________ Address: Email [email protected] Kampusranta 9 C 60320 Seinäjoki, Finland Mob. +358 40 596 5826
Introduction This guide is needed because the standard for steel grades S500MH - S700MH does not exist. Also, all these steel materials do not meet the the requirement of EN 1993-1-12:
• Ultimate strain εu, yield strain εy = fy/E: εu ≥ 15 εy. which is connected to the plastic design. This guide is meant for project approvals when using these steel grades in constructions.
Member design Tubular structures can be designed using the global elastic analysis for the structures, frames. This means that the members and the joints are modeled using elastic stiffness for the global analysis. The plastic global analysis allowing redistribution of the stress resultants is not used for these structures. The resistance checks of members after running the global analysis can be done using elastic or plastic member properties depending on the cross-section class of the member as defined in EN 1993-1-1 and in EN 1993-1-12. By testing of beams in bending using the most critical cross-section for S700MH (at the upper limit of the cross-section class 2) it has been shown that the plastic bending moment can be reached safely at the ultimate limit state. The test report is the reference [1] and the corresponding summary of the tests is the reference [2]. Figure 1 illustrates the bending tests.
Figure 1. Bending test and corresponding failure mode for tubular S700MH member.

5
3 Faculty of business and built environment Department of Structural Engineeing 26.09.2014 Research Centre of Metal Structures _____________________________________________________________________________________________________
_________________________________________________________________________________________________________ Address: Email [email protected] Kampusranta 9 C 60320 Seinäjoki, Finland Mob. +358 40 596 5826
It can be seen, that the failure mode was as expected using the equations of the Eurocodes: Local buckling at the top chord of the member.
Joint design The global analysis is elastic, as stated above, meaning that we do not use the plastic hinge theory in the global analysis. When considering the joint design after the global analysis there exist two different situations:
• Bolted joints which are made using plates made of different steel grades than the tubular members and using bolts;
• Welded joints where tubular members are welded to tubular members, as in trusses.
It has been shown in the literature [3] that the component method of EN 1993-1-8 is suitable up to such steel grades as S690 in plates and M12.9 for bolts. In such cases the stiffness of the joints for the global analysis should be defined as stated in EN 1993-1-8.
Welded joints of tubular structures
Welded joints of tubular structures are modeled to the global analysis using hinges at the ends of joined members without any rotational stiffness and supposing that the joints are absolutely rigid with respect to other displacements. After the global analysis the resistances of the joints are checked using the equations which are mainly based on the yield line theory. This means that it is supposed, that at the joints there exist enough ductility so that the yield lines may develop at the joints. The proof of the latest hypothesis can be done using FEM analyses which are validated by the tests or purely based on tests, which is in the line with the general rules of Eurocodes. In recent tests completed in Lappeenranta University of Technology (LUT) under RFCS project “Rules on high strength steels” [4] have been shown the relevancy of the existing rules in EN 1993-1-8 and in EN 1993-1-12 for tubular structures made of S500MH - S700 MH steel grades.
There are many parameters in these joints. The most important are:
• Type of the joint, T-, K- and KT-joints being the most important in trusses.
• Gap g at the joint;
• Angle θ of the joined member to the main member;
• Ratio β = bi/b0 of the joined members;
• Ratio γ = b0/(2t0) of the main member;
• Cross-section slenderness ratios bi/ti and hi/ti for each member;
• Eccentricity of the joint.
There are many failure modes which should be checked in the design, such as:

6
4 Faculty of business and built environment Department of Structural Engineeing 26.09.2014 Research Centre of Metal Structures _____________________________________________________________________________________________________
_________________________________________________________________________________________________________ Address: Email [email protected] Kampusranta 9 C 60320 Seinäjoki, Finland Mob. +358 40 596 5826
• Chord face failure;
• Brace failure;
• Chord side wall buckling;
• Chord shear;
• Punching shear;
• Chord side wall crushing;
• Chord distortional failure.
All failure modes are not present in all joints. The resistance check of KT-joints is done using the checks of series of K-joints. The K-joint should be designed as two T-joints in some cases. T-joints and K-joints are the basic joint types to be considered. The potential failure modes which are not included in current design codes are not considered in this approval document.
The recent tests [4] dealt with 20 X-joints and 20 K-joints made of S500MH and S700MH steels. The parameters which varied in the tests were the gap g (minimum/maximum allowed), the ratio b (0.53-0.83). The ratio γ was in most of the tests 15 and in some tests 10. The ratio value γ = 15 is near by the upper limit of this ratio. The upper value means the most slender main member at the joint. The variations of these three parameters cover very well the values needed in the structural design of these joints.
The angle θ was a constant 60o at each test of K-joints. The brace angle θ = 60° is the lower limit value, which can be welded by using fillet welds. The gap side welds of brace members must be carried by using bevel groove welds, if the brace angle is smaller. The design rules for bevel groove welds are simple and thus were not included in the research work. Concerning the requirements for welds parallel to chord member, the brace angle θ = 60o is also a quite good choice. A little bit smaller angle θ ≈ 50° would obtain still higher requirement for throat thickness, but considering the capacity of the joint, the smaller the angle the higher the capacity. Consequently, the smaller angles (θ ≈ 40...50°) obtain more efficient joints and are therefore favorable but not so critical and interesting from research point of view and as compromise the investigation was focused on brace members with θ = 60°.
Almost all failure modes but punching shear were observed in the tests. In K-joint tests the observed failure load (Ftest) versus the failure load calculated based on EN 1993-1-8 (FEC) without “penalty” factor 0.8 for the high strength steel joints as stated in EN 1993-1-12 in mean 1.23 (variation 0.14) for S500MH and 1.05 (variation 0.08) for S700MH. The minimum ratio in these 20 tests was 0.95. In X-joint tests these ratios were much larger. The minimum ratio was 1.16, and many ratios were over 2.0, the largest being 3.35. Figure 2 illustrates the resistance from tests versus the expected resistance using EN 1993-1-8 for K-joints and S500MH steel. More results can be found in [4].

7

8
6 Faculty of business and built environment Department of Structural Engineeing 26.09.2014 Research Centre of Metal Structures _____________________________________________________________________________________________________
_________________________________________________________________________________________________________ Address: Email [email protected] Kampusranta 9 C 60320 Seinäjoki, Finland Mob. +358 40 596 5826
Summary The design rules for S500MH - S700 MH hollow sections manufactured by SSAB based on information available up today can be summarized as:
• Use elastic global analysis;
• Member resistance is checked using elastic or plastic moment of the member. Plastic moment can be used based the cross-section classification of EN 1993-1-1 and EN 1993-1-12;
• Bolted joints are calculated using EN 1993-1-8 and EN 1993-1-12 as they are;
• The resistances of tubular welded joints can be checked using the rules of EN 1993-1-8 and EN 1993-1-12 (with “penalty” factors). The need of “penalty” factors is currently under research.
• The global analysis of trusses can be done using hinges at the ends of braces as is recommended in EN 1993-1-8.
Signatures 26.09.2014
Tampere Lappeenranta
Markku Heinisuo Timo Björk
Professor of Metal Structures Professor of Steel Structures
Tampere University of Technology Lappeenranta University of Technology

9
7 Faculty of business and built environment Department of Structural Engineeing 26.09.2014 Research Centre of Metal Structures _____________________________________________________________________________________________________
_________________________________________________________________________________________________________ Address: Email [email protected] Kampusranta 9 C 60320 Seinäjoki, Finland Mob. +358 40 596 5826
References [1] Havula J., Hämeenlinna University of Applied Sciences, HAMK, Report 2014-19; Bending tests of S700 tubes, 06.05.2014.
[2] Heinisuo M., Björk T., Short summary of bending tests for Ruukki’s S700 tubes, Tampere University of Technology, 15.4.2014.
[3] Coelho A., Bijlaard F., Experimental behavior of high strength steel end-plate connections. Journal of Constructional Steel Research, Volume 66, Issue 10, October 2010. Pages 1261-1277.
[4] RFCS RUOSTE D3.1, Documentation on rules for K- and X-joints, 30.06.2014 (confidential).
[5] Sedlacek G., Műller C., High strength steels in steel construction, Institute of Steel Construction RWTH Aachen, 2002.
[6] Lähde T., The effect of parameters on capacity of K-joint made of high strength steel (under work), 2014.

10
AXIAL RESISTANCE OF DOUBLE GRADE (S355, S420) HOLLOW SECTIONS MANUFACTURED BY SSAB

11
Faculty of Business and Built Environment Department of Structural Engineering Research Centre of Metal Structures
Page 1 (17) 23.9.2014
_________________________________________________________________________________________________________
Address: Email [email protected] Kampusranta 9 C Laajamäentie 1 60320 Seinäjoki, Finland 13430 Hämeenlinna, Finland Mob. +358 40 596 5826
Axial resistance of double grade (S355, S420) hollow sections manufactured by SSAB Based on tests in LUT and statistical evaluation of the results based on EN 1990 the axial resistance of SSAB’s double grade hollow sections, which fulfill the requirements of steel grades S355J2H and S420MH, can be defined using the rules of EN 1993-1-1, fy = 420 MPa and
• t ≥ 3 mm, 50.1≤λ => Curve b (imperfection factor α = 0.34) with the factor γM1 = 1.0. Seinäjoki, Finland 23.9.2014 Markku Heinisuo Professor of Metal Structures Tampere University of Technology

12
Faculty of Business and Built Environment Department of Structural Engineering Research Centre of Metal Structures
Page 2 (17) 23.9.2014
_________________________________________________________________________________________________________
Address: Email [email protected] Kampusranta 9 C Laajamäentie 1 60320 Seinäjoki, Finland 13430 Hämeenlinna, Finland Mob. +358 40 596 5826
Axial resistance of double grade (S355, S420) hollow sections manufactured by SSAB, statistical evaluation based on tests
Contents AXIAL RESISTANCE OF DOUBLE GRADE (S355, S420) HOLLOW SECTIONS MANUFACTURED BY SSAB, STATISTICAL EVALUATION BASED ON TESTS .......................................................................................... 2
Contents ......................................................................................................................................... 2 Introduction and scope ................................................................................................................... 3 Statistical method of EN 1990 ....................................................................................................... 5 Statistical analysis of tests ............................................................................................................. 8
Column stub tests ....................................................................................................................... 8 Evaluation of the buckling curve ............................................................................................. 10 Hollow sections 50x50x2 ......................................................................................................... 16
Summary ...................................................................................................................................... 17 References .................................................................................................................................... 17

13
Faculty of Business and Built Environment Department of Structural Engineering Research Centre of Metal Structures
Page 3 (17) 23.9.2014
_________________________________________________________________________________________________________
Address: Email [email protected] Kampusranta 9 C Laajamäentie 1 60320 Seinäjoki, Finland 13430 Hämeenlinna, Finland Mob. +358 40 596 5826
Introduction and scope The structural design considered is based on the Eurocode system. The design of cold-formed hollow sections is based on EN 1993-1-1 [1] and its National Annexes. The buckling resistance of the hollow sections is defined using the rules of EN 1993-1-1 chapter 6.3: Buckling resistance of members. The buckling resistance Nb,Rd is calculated as:
1,
M
ybRdb
fAN
γ
χ ⋅⋅= (1)
or
1,
M
ybeffRdb
fAN
γ
χ ⋅⋅= (2)
where
• χ is the reduction factor for the relevant buckling curve; • A is the cross-section area of the cross-section in the cross-section classes 1, 2 and 3; • Aeff is the effective cross-section area of the cross-section in the cross-section class 4,
classification is done for compression only, effective width see EN 1993-1-5; • fyb is the basic yield strength of the material; • γM1 is the material factor for buckling, recommended value γM1 = 1.0.
The reduction factor χ is:
0.1122
≤−+
= χλφφ
χ but (3)
and
( )[ ]22.015.0 λλαφ +−⋅+⋅= (4)
cr
yb
NfA ⋅
=λ (5)
or
cr
ybeff
NfA ⋅
=λ (6)
where

14
Faculty of Business and Built Environment Department of Structural Engineering Research Centre of Metal Structures
Page 4 (17) 23.9.2014
_________________________________________________________________________________________________________
Address: Email [email protected] Kampusranta 9 C Laajamäentie 1 60320 Seinäjoki, Finland 13430 Hämeenlinna, Finland Mob. +358 40 596 5826
• α is an imperfection factor, buckling curve c meaning value α = 0.49 is given in EN 1993-1-1 for cold-formed hollow sections;
• Ncr is the elastic critical axial force for the relevant buckling mode. The different buckling curves are shown in Fig. 1.
Figure 1. Bucling curves of EN 1993-1-1.
It can be seen, that there exist a plateau in all curves with small slenderness 2.0≤λ . So, the plateau value Npl may be defined based on the tests, or the goal may be the proper buckling curve for the hollow sections. The critical axial force is
2
2
crcr L
IEN ⋅⋅=π (7)
where
• E is the elastic modulus of steel, E = 210000 MPa; • I is the moment of inertia of the gross-section; • Lcr is the buckling length of the member.
The scope of this study is to consider using the statistical evaluation of EN 1990 Annex D [2]:
• What buckling curve is the most suitable for SSAB’s double grade hollow sections which fulfill the requirements of steel grades S355J2H and S420MH, meaning the nominal yield strength 420 MPa?
• The target value for the safty factor in buckling is γM1 = 1.0.

15
Faculty of Business and Built Environment Department of Structural Engineering Research Centre of Metal Structures
Page 5 (17) 23.9.2014
_________________________________________________________________________________________________________
Address: Email [email protected] Kampusranta 9 C Laajamäentie 1 60320 Seinäjoki, Finland 13430 Hämeenlinna, Finland Mob. +358 40 596 5826
The statistical evaluation is done based on the tests completed in LUT [3]. The tests covered the range [0.10 ≤ λ ≤ 1.50]. The tested profiles were:
• 50x50x2; • 100x100x3; • 150x150x5; • 200x200x6; • 300x300x8.8.
Statistical method of EN 1990 The statistical evaluation is done following strictly EN 1990 Annex D. More theoretical background can be found in [4]. Practical examples demonstrating the effects of different amount of random variables and grouping of tests to the target safety factor γM1* in the flexural buckling can be found in [5]. In this study we consider three variables as random variables Xj (j = 1, 2, 3):
• X1 is the yield strength of steel; • X2 is the side length of the hollow section, only square rectangular hollow sections are
considered; • X3 is the wall thickness of the hollow section.
All these were measured in the real test specimen and they have been reported in [3]. Other properties are considered as deterministic, including the elastic modulus. In [5] it is shown that this assumption means only marginal effect to the result, target value γM1* and moreover, it is well-known that measuring of the elastic modulus is rather complicated. So, the elastic modulus was not measured in this study. Four values of axial forces are needed in the following:
• Experimental ultimate value of the axial load in the tests i (i = 1, …, n) re,i. • Theoretical values obtained from Eqs. (1) - (7) rt,i. These are calculated using the measured
values of yield strength, side length and wall thickness. • Theoretical values obtained from Eqs. (1) – (7) using the nominal values rnom,i. • Theoretical values (resistance function grt values) obtained from Eqs. (1) – (7) using the
mean values Xm for the measured variables Xj: grt(Xm). The regression line through the origin may be used to approximate the trend, however many such lines exist. By minimization the cumulative error ( )∑ ⋅−= 2
,,2
itie rbrε and assuming that the variance of the residual is constant, a least square calculation can be used based on the quadrature of the residual. By setting the derivative of ε2 with respect to b to zero, the linear regression coefficient b is found:

16
Faculty of Business and Built Environment Department of Structural Engineering Research Centre of Metal Structures
Page 6 (17) 23.9.2014
_________________________________________________________________________________________________________
Address: Email [email protected] Kampusranta 9 C Laajamäentie 1 60320 Seinäjoki, Finland 13430 Hämeenlinna, Finland Mob. +358 40 596 5826
( )∑
∑
=
=
⋅= n
iit
n
iitie
r
rrb
1
2,
1,,
(8)
where n is the amount of experiments. After this must be calculated
• Logarithm of the error term δi: iΔ ; • Estimated value for mean value ofΔ : Δ ; • Estimated value for the standard deviation σ: s; • Estimated value for the standard deviation Δσ : Δs ; • Estimator for the coefficient of variation of the error terms δi: Vδ;
and those are:
iit
ei rb
rδlnln
,
1, =⎟⎟⎠
⎞⎜⎜⎝
⎛
⋅=Δ (9)
∑=
Δ⋅=Δn
iin 1
1 (10)
( )∑=
Δ Δ−Δ⋅−
=n
iin
s1
22
11 (11)
1)exp( 2 −= ΔsVδ (12)
ending up to the coefficient of variation Vδ of the error terms δi. The sensitivity of the resistance function to the variability of the basic input variables is considered through the coefficient of the variation Vrt. The exact way to calculate this is supposing that the variables Xj are not dependent on each other:
( )( )
∑=
⎟⎟
⎠
⎞
⎜⎜
⎝
⎛
∂
∂=
3
1
22
22 1
jj
j
jrt
mrtrt X
XgXg
V σ (13)
The resistance function is rather complicated with respect to the variables Xj, so typically the values of Eq. (13) are calculated numerically using finite differences near by the mean values of the variables, as is done in [5]. However, it has bee shown in [5] that by calculating the error propagation term Vr,t based on variations of measured dimensions and yield strengths the

17
Faculty of Business and Built Environment Department of Structural Engineering Research Centre of Metal Structures
Page 7 (17) 23.9.2014
_________________________________________________________________________________________________________
Address: Email [email protected] Kampusranta 9 C Laajamäentie 1 60320 Seinäjoki, Finland 13430 Hämeenlinna, Finland Mob. +358 40 596 5826
difference is not large (below 3 % in the target value γM1*) when the variations of measured properties are used instead of Eq. (13). Moreover, it is shown in [5] that the use of measured properties means safe side solution in the flexural buckling case. So, in this study the simplified analysis is used, see [4]:
∑=
=3
1
22
jXjrt VV (14)
where VXj is the coefficient of variation of every random variable Xj:
2
22
jm
XjXj XV
σ= (15)
Often the conservative estimation Vrt = 0.1 is used. In [6] has been demostrated that it is essential to calculate the value of Vrt more exactly, so in this study Eq. (15) is used. Finally, the log-normal variation coefficients are:
( )1ln 2,, += trtr VQ (16)
( )1ln 2 += δδ VQ (17)
( )1ln 2 += rVQ (18)
22
,2
δVVV trr += (19) The design values of the resistance rd is in this case with the large amount of tests (n ≥ 30):
( ) )5.0exp( 2, QQkXgbr dmrtd ⋅−⋅−⋅⋅= ∞ (20)
where 04.3, =∞dk , as defined in EN 1990, Table D2.The required partial safety factor γM1*i for the test i is:
d
inomiM rr ,
*1 =γ (21)
It can be seen, that we get different safety factor for all tests i. The safety factor may be calculated by grouping (k = 1, …, m) the cases properly into m groups (or families) and by calculating the

18
Faculty of Business and Built Environment Department of Structural Engineering Research Centre of Metal Structures
Page 8 (17) 23.9.2014
_________________________________________________________________________________________________________
Address: Email [email protected] Kampusranta 9 C Laajamäentie 1 60320 Seinäjoki, Finland 13430 Hämeenlinna, Finland Mob. +358 40 596 5826
mean of the safety factors for the groups, as is stated in [1]. In [5] the groups are made based on different slenderness and this method is used in this study. Fig. 2 summarizes the statistical evaluation.
Figure 2. Statistical evaluation [5].
The final safety factor, applicable for the design based on nominal input data is the mean of the factors for the groups, i.e:
∑=
=m
kkMM
1** γγ (22)
and
∑=
=w
iiMkM
1** γγ (23)
if group k consists of w tests of all tests i. If all tests are put to one group then the result is conservative, as is shown in [5]. In [5] it is proposed the groups based on the nominal slenderness of the members. This method is used in this study. No strict rules for the slenderness limits of the groups can be found, so in this study the test cases are grouped based on the data available. The mean of coefficients bk for groups k should be near by one, so that the theoretical resistance function describes the test data as well as possible.
Statistical analysis of tests
Column stub tests When considering the buckling resistance of the column applying Fig.1, it can be seen that using the tests two way can be used to define the resistance:

19
Faculty of Business and Built Environment Department of Structural Engineering Research Centre of Metal Structures
Page 9 (17) 23.9.2014
_________________________________________________________________________________________________________
Address: Email [email protected] Kampusranta 9 C Laajamäentie 1 60320 Seinäjoki, Finland 13430 Hämeenlinna, Finland Mob. +358 40 596 5826
• Define plateau value (small slenderness) based on tests, or; • Define proper buckling curve based on tests.
The plateau value can be defined using column stub tests, meaning short columns when buckling is not the present. In this project 18 column stub tests were done. In this case the columns with the slenderness 30.0...10.0=λ are considered as column stub tests. The test results are given in Table 1. Index e refers to experiments and index t to theory. In the first column are given the cross-section classifications based measured dimensions and yield strength. PL4 means the cross-section class 4. The cross-section class for 100x100x3 and for 200x200x6 was 3 using the nominal dimensions and yield strength 420 MPa. Theoretical resistances based on measured or mean data were calculated for these cases based on the cross-section class 4, meaning the use of effective widths. For 100x100x3 the reduction factor for the cross-section area was 0.91 and for 200x200x6 the reduction was 0.93. The coding of the tests is the same as in [3]. Table 1. Column stub test results.
Classtest λnom Test fy,e Ee he be te Lcr re,i rt,i - - - MPa MPa mm mm mm mm kN kN
PL1-2 0,10 B15_1 522 210000 49,75 49,75 2,02 137,7 227 196 PL1-2 0,10 B15_2 522 210000 49,75 49,75 1,94 137,4 229 188 PL1-2 0,10 B15_3 522 210000 49,75 49,75 2,02 137,7 215 195 PL4 0,10 B11_1 528 210000 100,10 100,10 2,94 276 540 517 PL4 0,10 B11-2 528 210000 100,10 100,10 2,93 276 557 515 PL4 0,10 B11_3 528 210000 100,10 100,10 2,94 276 540 517 PL3 0,10 B7_1 519 210000 150,25 150,25 4,94 412 1570 1457 PL3 0,10 B7_2 519 210000 150,25 150,25 4,94 413 1545 1456 PL3 0,10 B7_3 519 210000 150,25 150,25 4,94 413 1514 1457 PL4 0,10 B3_1 496 210000 200,05 200,05 5,94 553 2307 2021 PL4 0,10 B3_2 496 210000 200,10 200,10 5,93 553 2229 2015 PL4 0,10 B3_3 496 210000 200,10 200,10 5,91 553 2168 2004 PL3 0,10 B1_1 461 210000 300,10 300,10 8,60 827 4341 4516 PL3 0,10 B1-2 461 210000 300,10 300,10 8,58 825 4536 4503 PL3 0,10 B1_3 461 210000 300,10 300,10 8,58 825,5 4453 4503 PL3 0,30 B0_1 461 210000 300,10 300,10 8,60 2498 4245 4317 PL3 0,30 B0_2 461 210000 300,10 300,10 8,58 2499 4161 4316 PL3 0,30 B0_3 461 210000 300,10 300,10 8,58 2498 4395 4317
The experimental values re,i divided by the theoretical values rt,i calculated using measured dimensions and yield strenght are given in Fig. 3.
20
21
Faculty of Business and Built Environment Department of Structural Engineering Research Centre of Metal Structures
Page 11 (17) 23.9.2014
_________________________________________________________________________________________________________
Address: Email [email protected] Kampusranta 9 C Laajamäentie 1 60320 Seinäjoki, Finland 13430 Hämeenlinna, Finland Mob. +358 40 596 5826
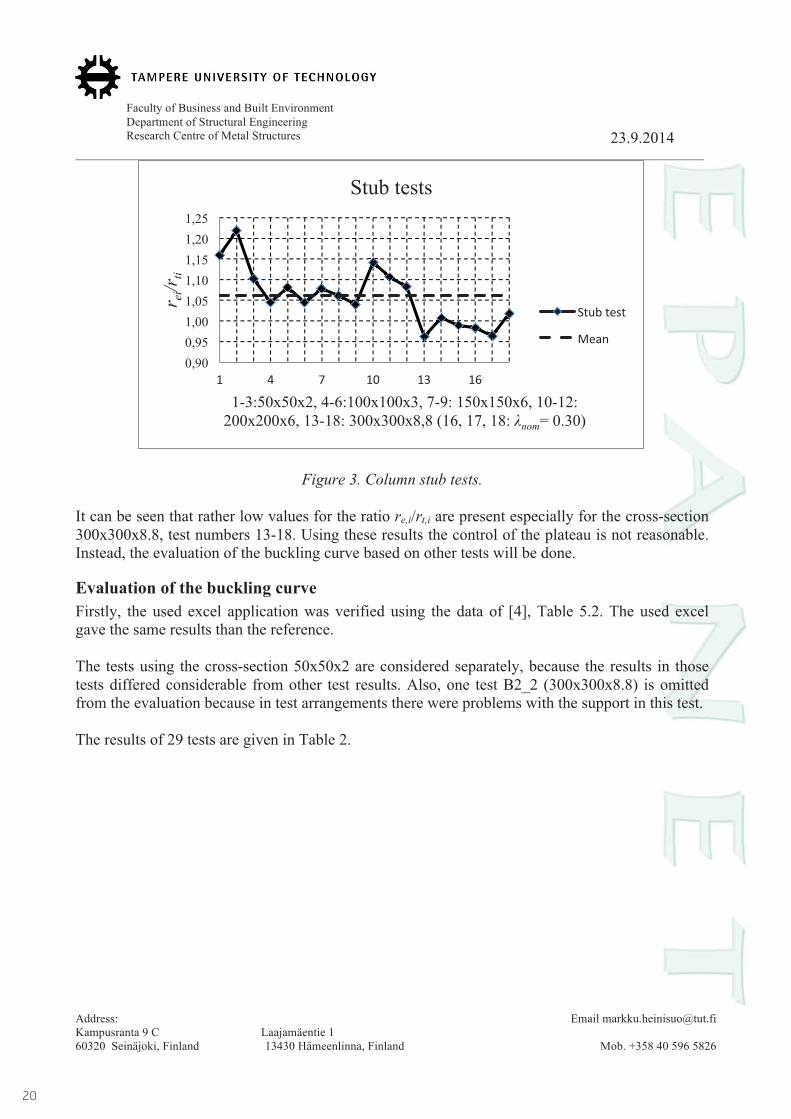
Table 2. Results of buckling tests. Classtest λnom Test fy,e Ee he be te Lcr re,i rt,i
- - - MPa MPa mm mm mm mm kN kN PL4 0,50 B12_1 528 210000 100,10 100,10 2,94 1382 520 452 PL4 0,50 B12_2 528 210000 100,10 100,10 2,93 1383 519 450 PL4 0,50 B12_3 528 210000 100,10 100,10 2,94 1383 515 453 PL4 1,00 B13_1 528 210000 100,20 100,20 2,93 2766 294 293 PL4 1,00 B13_2 528 210000 100,10 100,10 2,94 2766 306 294 PL4 1,00 B13_3 528 210000 100,20 100,20 2,93 2766 283 293 PL4 1,50 B14_1 528 210000 100,05 100,05 2,94 4150 172 164 PL4 1,50 B14_2 528 210000 100,10 100,10 2,93 4150 195 164 PL4 1,50 B14_3 528 210000 100,10 100,10 2,94 4149 171 165 PL3 0,50 B8_1 519 210000 150,25 150,25 4,94 2066 1372 1252 PL3 0,50 B8_2 519 210000 150,25 150,25 4,94 2066 1379 1252 PL3 0,50 B8_3 519 210000 150,25 150,25 4,94 2066 1370 1252 PL3 1,00 B9_1 519 210000 150,25 150,25 4,94 4134 790 772 PL3 1,00 B9_2 519 210000 150,25 150,25 4,94 4134 823 772 PL3 1,00 B9_3 519 210000 150,25 150,25 4,94 4134 797 772 PL3 1,50 B10_1 519 210000 150,25 150,25 4,94 6201 435 420 PL3 1,50 B10_2 519 210000 150,25 150,25 4,94 6201 459 420 PL3 1,50 B10_3 519 210000 150,25 150,25 4,94 6201 458 420 PL4 0,50 B4_1 496 210000 200,10 200,10 5,94 2767 2156 1773 PL4 0,50 B4_2 496 210000 200,10 200,10 5,93 2767 2185 1769 PL4 0,50 B4_3 496 210000 200,10 200,10 5,91 2767 2118 1759 PL4 0,71 B5_1 496 210000 200,10 200,10 5,91 3949 1837 1532 PL4 0,71 B5_2 496 210000 200,25 200,25 5,94 3949 1808 1544 PL4 0,71 B5_3 496 210000 200,10 200,10 5,94 3949 1804 1543 PL4 1,13 B6_1 496 210000 200,10 200,10 5,93 6249 1106 1005 PL4 1,13 B6_2 496 210000 200,10 200,10 5,94 6250 1084 1007 PL4 1,13 B6_3 496 210000 200,10 200,10 5,91 6250 1077 1001 PL3 0,48 B2_1 461 210000 300,10 300,10 8,60 3948 4310 3996 PL3 0,48 B2_3 461 210000 300,10 300,10 8,58 3948 4356 3984
Consider firstly the fitting of the test data to different buckling curves:
• Curve a: imperfection factor α = 0.21; • Curve b: imperfection factor α = 0.34; • Curve c: imperfection factor α = 0.49.
The measure for the fitting is the linear regression coefficient b as defined in Eq. (8). The results are given in Figs. 4 - 6.

22

23

24
25
Faculty of Business and Built Environment Department of Structural Engineering Research Centre of Metal Structures
Page 15 (17) 23.9.2014
_________________________________________________________________________________________________________
Address: Email [email protected] Kampusranta 9 C Laajamäentie 1 60320 Seinäjoki, Finland 13430 Hämeenlinna, Finland Mob. +358 40 596 5826
Consider next the evaluation of the results of Table 2 using the groups which are formed based on different slenderness, as in [5]. The groups which are used in this study are:
• Low slenderness: 71.048.0 −=λ ; • Medium slenderness: 50.100.1 −=λ .
The safety factors using these groups are as follows:
• Curve a: γM1* = 1.17;
• Curve b: γM1* = 1.05;
• Curve c: γM1* = 0.96.
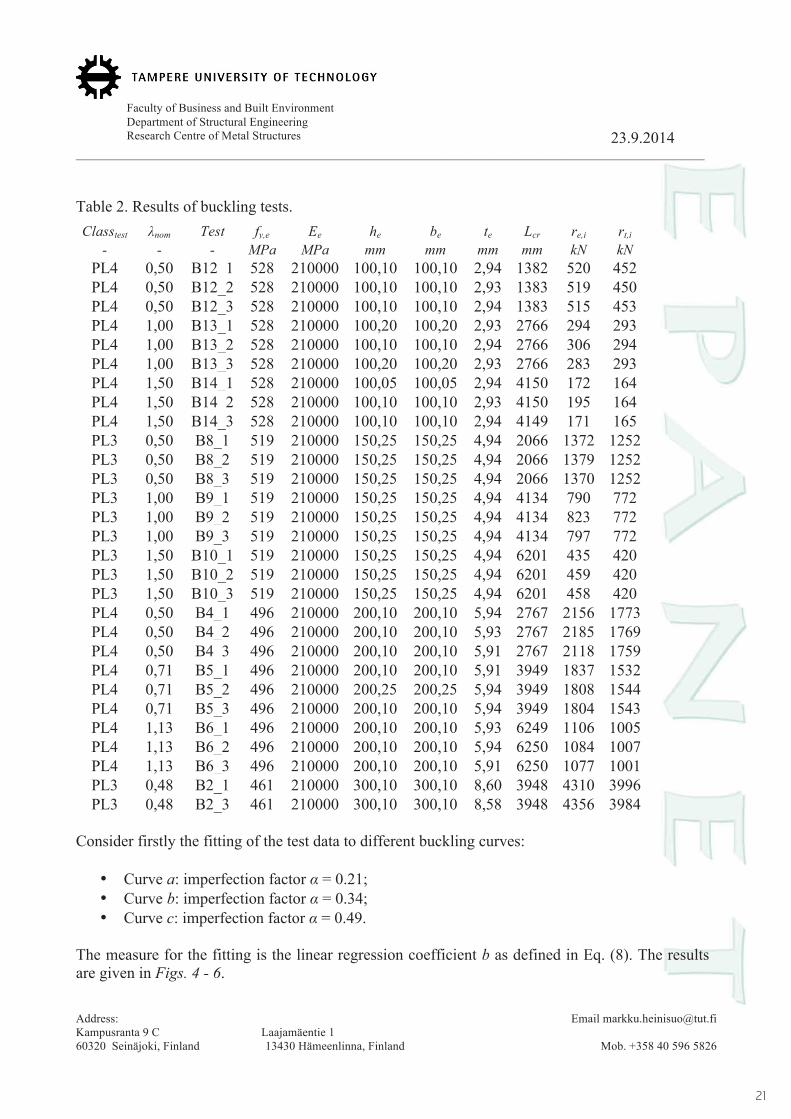
As explained above, the safety factor changes for each test. The results using curve b and grouping look as given in Fig.7 with different 29 tests.
Figure 7. Safety factor for separated tests. Using this grouping and varying the imperfection factor α the values for the regression coefficient b, coefficient of variation Vδ and safety factor γM1
* as got, as shown in Table 3. Table 3. Effect of factor α.
α 0.34 0.35 0.36 0.37 0.38 0.39 0.40 0.41 b 1.09 1.10 1.11 1.11 1.12 1.12 1.13 1.13 Vδ 0.05 0.05 0.05 0.05 0.05 0.05 0.05 0.05 γM1
* 1.05 1.04 1.03 1.03 1.02 1.01 1.01 1.00
0,00
0,20
0,40
0,60
0,80
1,00
1,20
1,40
gM*
100x100x3
150x150x5
200x200x6
300x300x8.8

26

27
Faculty of Business and Built Environment Department of Structural Engineering Research Centre of Metal Structures
Page 17 (17) 23.9.2014
_________________________________________________________________________________________________________
Address: Email [email protected] Kampusranta 9 C Laajamäentie 1 60320 Seinäjoki, Finland 13430 Hämeenlinna, Finland Mob. +358 40 596 5826
The safety factors using this data and grouping as above:
• Curve a: γM1* = 1.21;
• Curve b: γM1* = 1.09;
• Curve c: γM1* = 1.00.
Based on this the buckling curve c should be used for this case.
Summary 18 column stub tests, 29 buckling tests and 9 tests with 50x50x2 cross-section have been evaluated using EN 1990 Annex D. Tests were completed in LUT during 2014. The column stub tests were evaluated, but the result was that the buckling curve evaluation is the best way to do the analysis. With two cross-sections, 100x100x3 and 200x200x6 the resistance value rd had to be calculated in the cross-section class 4 but the nominal value rnom,i was calculated in the cross-section class 3. This means increase in the final γM1
* for these cases, as can be just seen in Fig. 7. However, in the major buckling cases the safety factor 1.05 using the buckling curve b was get meaning rounded value 1.00 for buckling. Best fit to the buckling curves was get for the buckling curve a, but the scatter in the test results did not show the use of the safety factor 1.0 for the curve a. If the resistance value was calculated without reduction due to the cross-section class 4 in these cases, the safety factor was 1.03 with the curve b. For the cross-section 50x50x2 the separate evaluation was done due to their test results. Based on these evaluations the axial resistance of SSAB’s double grade hollow sections, which fulfill the requirements of steel grades S355J2H and S420MH, can be defined using the rules of EN 1993-1-1, fy = 420 MPa and
• t ≥ 3 mm, 50.1≤λ => Curve b (new rule); • t < 3 mm, => Curve c (old rule);
with the factor γM1 = 1.0.
References [1] EN 1993-1-1. Eurocode 3: design of steel structures – Part 1-1: General rules and rules for buildings. CEN, Brussels, 2005. [2] EN 1990. Eurocode – Basis of structural design, CEN, Brussels, 2002. [3] Suikkanen J., Compression tests of Ruukki’s double grade tubes. Master’s Thesis (in Finnish) Lappenranta University of Technology, Department of Mechanical Engineering, 2014. [4] da Silva L., Tankova T., Marques L., Taras A., Rebelo C. Comparative assessment of semi-probabilistic methodologies for the safety assesment of stability design rules in the framework of Annex D of EN 1990. Document ECCS–TC8-2013–11–024, 2013. [5] da Silva L., Tankova T., Canha J., Marques L., Rebelo C. Safety assesment of EC3 stability design rules for lexural buckling of columns. Evolution Group EC3-1-1, CEN TC 250-SC3-EvG-1-1, TC8-Technical Committee 8, 2014.

www.ssab.com
SSAB is a Nordic and US-based steel company. SSAB offers value added products and services developed in close cooperation with its customers to create a stronger, lighter and more sustainable world. SSAB has employees in over 50 countries. SSAB has production facilities in Sweden, Finland and the US. SSAB is listed on the NASDAQ OMX Nordic Exchange in Stockholm and has a secondary listing on the NASDAQ OMX in Helsinki. www.ssab.com
SSABSuolakivenkatu 100810 Helsinki
T 020 5911
110
1-en
-Des
ign
guid
es fo
r hig
h st
reng
th s
truc
tura
l ho
llow
sect
ions
, V1-
20
14, A
nnel
ia