
“Re-discovering” an old material, Polyaniline, for modern ...
Upload
khangminh22Category
view
4download
0
Novel Polyaniline-based Ammonia Sensors on
Plastic Substrates
A thesis submitted to the University of Manchester for the degree of Doctor of
Philosophy in the Faculty of Engineering and Physical Sciences
2014
Ehsan Danesh
School of Chemical Engineering and Analytical Science

2
CONTENTS
ABSTRACT ................................................................................................................ 15
DECLARATION .......................................................................................................... 17
COPYRIGHT STATEMENT ........................................................................................ 18
DEDICATION ............................................................................................................. 19
ACKNOWLEDGMENTS ............................................................................................. 20
CHAPTER ONE
1. Introduction: FlexSmell project ............................................................................. 21
CHAPTER TWO
2. Background ......................................................................................................... 25
2.1. Food spoilage ............................................................................................... 25
2.2. Food quality indicators .................................................................................. 26
2.2.1. Examples of FQIs products currently available ...................................... 27
2.3. Selection of the target analyte: Ammonia ..................................................... 31
2.4. Ammonia sensing principles ......................................................................... 35
2.4.1. Metal oxide sensors ............................................................................... 36
2.4.2. Chem-FET sensors ............................................................................... 37
2.4.3. Conducting polymer sensors ................................................................. 38
2.5. Intrinsically conducting polymers .................................................................. 40
2.5.1. Background ........................................................................................... 40
2.5.2. Electrical conductivity in ICPs ................................................................ 43
2.5.3. Polyaniline ............................................................................................. 48
2.5.4. Polymerisation of aniline ........................................................................ 49
2.5.5. Polyaniline as an ammonia sensing material ......................................... 53
2.5.6. Solution processable PANI .................................................................... 55
2.6. References ................................................................................................... 59
CHAPTER THREE
3. Hybrid polyaniline sensors ................................................................................... 65
3.1. Introduction................................................................................................... 65
3.2. Materials and methods ................................................................................. 67
3.2.1. Materials ................................................................................................ 67
3.2.2. Preparation of doped PANI .................................................................... 67
3.2.3. PANI/CB hybrid composites .................................................................. 68
3.2.4. Thin film characterisation ....................................................................... 68
3.2.5. Fabrication of sensors ........................................................................... 70

3
3.2.6. Sensing chamber and circuit board ....................................................... 70
3.2.7. Ammonia sensing characterisation ........................................................ 72
3.3. Results ......................................................................................................... 75
3.3.1. UV-Vis spectroscopy ............................................................................. 75
3.3.2. Atomic force microscopy........................................................................ 79
3.3.3. X-ray photoelectron spectroscopy ......................................................... 81
3.3.4. Thermogravimetric analysis ................................................................... 85
3.3.5. Conductivity of polyaniline films ............................................................. 87
3.3.6. Ammonia sensing results....................................................................... 91
3.4. Discussion .................................................................................................... 99
3.5. References ................................................................................................. 102
CHAPTER FOUR
4. Vapour-phase deposition polymerisation ........................................................... 104
4.1. Introduction................................................................................................. 104
4.1.1. VDP process ....................................................................................... 105
4.1.2. Gas sensors made by VDP method ..................................................... 107
4.2. Materials and methods ............................................................................... 109
4.2.1. Materials .................................................................................................. 109
4.2.2. PANI sensing layer preparation ........................................................... 109
4.2.3. Characterisation .................................................................................. 110
4.3. Results ....................................................................................................... 111
4.3.1. PAA-doped PANI ..................................................................................... 111
4.3.2. PSSA-doped PANI .............................................................................. 114
4.3.3. Nafion-doped PANI.............................................................................. 119
4.3.4. Bio-immobilisation ............................................................................... 124
4.4. Discussion .................................................................................................. 126
4.5. References ................................................................................................. 128
CHAPTER FIVE
5. Polyaniline Ammonia Sensors on Printed Polymeric Hotplates .......................... 131
5.1. Introduction................................................................................................. 131
5.2. Experimental section .................................................................................. 134
5.2.1. Heaters ................................................................................................ 134
5.2.2. Dielectric layer and interdigitated electrodes........................................ 135
5.2.3. Preparation of the PANI sensing layer ................................................. 136
5.2.4. Characterisation .................................................................................. 137
5.3. RESULTS AND DISCUSSION ................................................................... 138
5.3.1. Thermal characteristics of the µ-hotplates ........................................... 138

4
5.3.2. PSSA-doped PANI thin films ............................................................... 139
5.3.3. Ammonia sensing properties ............................................................... 140
5.4. Discussion .................................................................................................. 149
5.5. References ................................................................................................. 150
CHAPTER SIX
6. CONCLUSIONS & FUTURE WORK .................................................................. 160
6.1. Conclusions ................................................................................................ 160
6.2. Future work ................................................................................................ 161
APPENDICES
APPENDIX I: Food spoilage ..................................................................................... 166
Microbial deterioration........................................................................................... 166
(Bio)chemical changes .......................................................................................... 168
References ........................................................................................................... 173
APPENDIX II: Dissemination .................................................................................... 174
Publications .......................................................................................................... 174
Conference presentations ..................................................................................... 174
Awards ................................................................................................................. 175

5
LIST OF TABLES
Table 2-1. Ammonia sensing requirements in different applications (Reproduced from ref. (Timmer and al., 2005)) ............................................................................... 32
Table 3-1. Atomic percentage in polyaniline samples extracted from XPS wide scan spectra. ............................................................................................................. 84
Table 3-2. TGA parameters extracted from the TGA graphs of three polyaniline samples. ............................................................................................................ 86
Table 3-3. Resistance measurements data for 4 samples of doped PANI and hybrid composites. ....................................................................................................... 88
Table 3-4. Resistivity and conductivity of polyaniline samples. ................................... 90
Table 3-5. Some important physical properties of the two substrates used in this study.
CTE and CHE are the coefficient of thermal expansion and coefficient of hydroscopic expansion, respectively (Adapted from (Thomas Kinkeldei et al., 2012)). ............................................................................................................... 96
Table 5-1. Effect of temperature on the 2nd generation sensor response to ammonia vapour in dry and humid air. ............................................................................ 145

6
LIST OF FIGURES
Figure 1-1. Overall picture of the FlexSmell training and transfer of knowledge (Adapted from the FlexSmell’s description of work, part B). ............................... 23
Figure 1-2. 2D grids of thematic work packages and methodical approaches with the
relevant tasks and groups in charge of the coordination (Adapted from the FlexSmell’s description of work, part B). ............................................................ 23
Figure 2-1. Freshpoint’s OnVu™ indicators accurately and consistently record and
display the freshness of the products, based on their time and temperature histories. Once packaged, the OnVu™ TTI is activated using an ultra violet (UV) light source. The evolution of the label colour as a function of time and temperature is demonstrated. ............................................................................ 26
Figure 2-2. Examples of food quality indicators available in the market: a) Freshness Guard (Smolander, 2008), b) FreshQ FQI label, c) Litmus FQI label. ................ 28
Figure 2-3. It's Fresh Inc.’s smart label products (from http://www.itsfresh.com/) ....... 29 Figure 2-4. RipeSense® ripeness indicator. ............................................................... 30
Figure 2-5. Ammonia content in water vs. pH of the solution ...................................... 35 Figure 2-6. Energy band diagram showing the Schottky barrier height (eVd and eVʹd) at
the grain boundary of TiO2 without and with a chemically reducing gas, R (Adapted from (Timmer and al., 2005)). Ec = conduction band, Ev = valence band, and Ef = Fermi level. .......................................................................................... 37
Figure 2-7. The structure of the two types of field-effect transistor sensors. a) TFT; b) IGFET. (Reproduced from (Janata and Josowicz, 2003)) .................................. 38
Figure 2-8. Sensing mechanism in conductive polymer composite sensors. The
vapour-induced expansion of the polymer composite causes an increase in the electrical resistance of the composite because the polymer expansion reduces the number of conducting pathways for charge carriers (Reproduced from Lewis research group website, Caltech, USA). ............................................................ 39
Figure 2-9. Electrical conductivity of halogen-doped polyacetylene as a function of
bromine and iodine concentration. Inset shows the structure of undoped trans-polyacetylene (up) and doped trans-polyacetylene with delocalised electrons (down). The former is an insulator, whereas the later can act as a metal (Reproduced from (Chiang et al., 1978)). .......................................................... 41
Figure 2-10. Chemical structures and conductivity range of some of the most popular conducting polymers (Adapted from (Terje A. Skotheim, 2007)). ....................... 42
Figure 2-11. Application fields of ICPs. (Reproduced from (Heeger, 2001)) ............... 43 Figure 2-12. Electronic band configuration in (a) metals, (b) insulators, and (c)
semiconductors from closely spaced atoms having quantized energy levels. .... 45 Figure 2-13. n-type (left) and p-type (right) conduction in semiconductors. ................ 46 Figure 2-14. (a) π-π* transition and (b) soliton (left) vs. polaron lattice (right) band gap
states. ................................................................................................................ 47 Figure 2-15. Proposed crystalline-amorphous (heterogeneous) structure of an ICP,
showing different conduction pathways: A: along the backbone, B: interchain and C: between metallic grains (Reproduced from (Hobday, 2009; Bhadra et al., 2009). ................................................................................................................ 47
Figure 2-16. Different forms of polyaniline, depicting the oxidative and protonic acid (non-oxidative) doping (Freund and Deore, 2007) ............................................. 48
Figure 2-17. Structure of EB after 50% protonation and formation of bipolarons (a),
unstable dication radicals (b) and stable polaron lattice (d) (Adapted from (Epstein et al., 1987; Bhadra et al., 2009)). ........................................................ 49
Figure 2-18. Electrophilic substitution reaction. .......................................................... 51

7
Figure 2-19. Polyaniline polymerisation mechanism. (Adapted from (Sapurina and Shishov, 2012)) ................................................................................................. 51
Figure 2-20. Effect of pH on the oxidation of aniline in the presence of a strong
oxidising agent and in a high ionic strength medium (Reproduced from (Sapurina and Shishov, 2012)). pKAn=3.5 and pKPANI=2.5 are marked by the blue dashed line. The black line and dashed line are representative of aniline and chain oxidation potentials, respectively. ...................................................................... 52
Figure 3-1. Samples used for conductivity measurements. Left: SSA-doped
PANI/coated-CB, and right: SPhA-doped PANI/coated-CB hybrid composites. Au electrodes were thermally evaporated on the thin films...................................... 69
Figure 3-2. Sensing chamber design. All dimensions and measures are in mm. ........ 71
Figure 3-3. Left: PTFE sensor chamber and its Viton® sealing; Right: Substrate holder, circuit board and the sub-miniature ceramic heater (shown by yellow arrow) ..... 72
Figure 3-4. Permeation tube structure and function.................................................... 73 Figure 3-5. Automatic ammonia-vapour generation system. ...................................... 73
Figure 3-6. Diluted solutions of a) SSA-doped PANI, b) SPhA-doped PANI and c) EB in NMP. ............................................................................................................. 75
Figure 3-7. Band structures of protonated polyaniline with (left) a coil-like conformation
and (right) an expanded coil-like conformation, respectively. Numbers are indicative of the major wavelengths where peaks appear in UV-Vis spectra. Reproduced from Ref. (Xia et al., 1995) ............................................................ 76
Figure 3-8. UV-Vis spectra of emeraldine base, SSA- and SPhA-doped PANI solutions in NMP. ............................................................................................................. 76
Figure 3-9. Evolution of UV-Vis spectra of protonated PANI solutions in NMP during a 1-year period: (top) SSA-doped and (bottom) SPhA-doped PANI. ..................... 78
Figure 3-10. AFM image of (a) 20 wt.% Black Pearls 2000 and (b-d) PANI-coated CB
with SSA-doped PANI composite, deposited from suspension in NMP (measurements were done in non-contact mode). Black arrow shows a dispersed particle with ~100 nm in diameter ...................................................................... 80
Figure 3-11. Polyaniline/carbon nanoparticle core-shell structure. (Reproduced from W. Xiaorong et al., US Patent application No. 20100004398 (2010)) ................. 81
Figure 3-12. XPS N 1s core-level spectra of (a) undoped and (b) SSA-doped PANI
layers on silicon wafer. The quinoid and benzoid nitrogen atoms in emeraldine base show peaks at 398.7 and 399.9 eV, respectively. Upon doping, the quinoid type peak is replaced by polaronic N with a corresponding peak at higher BE (around 402 eV). Comparison of doped (red) and undoped (green) N 1s spectra is shown in (c). There is a clear shift in binding energy to higher values when the multifunctional dopant is used to protonate polyaniline imine sites. ................... 83
Figure 3-13. The wide scan XPS of emeraldine base (top) and SSA-doped PANI (bottom). ............................................................................................................ 84
Figure 3-14. C 1s spectra of (a) undoped and (b) SSA-doped PANI after a curve fitting, demonstrating the spectral contribution of different functional groups ................ 85
Figure 3-15. TGA graphs of undoped and multifunctional doped PANI powders. ....... 86
Figure 3-16. I-V curves at different gap distances for a) SSA-doped PANI, b) SPhA-
doped PANI, c) SSA-doped PANI/coated CB composite, and d) SPhA-doped PANI/coated CB composite. G1=0.2 mm, G2=0.6 mm, G3=1.0 mm, G4=1.4 and G5=1.8 mm are gap sizes of consecutive parallel electrodes. Solid lines are the best linear fit to the data points for each measurement. ..................................... 87
Figure 3-17. Calculation of sheet resistance (R□) and contact resistance (Rc): a) SSA-
doped PANI, b) SPhA-doped PANI, c) SSA-doped PANI/coated CB composite, and d) SPhA-doped PANI/coated CB composite. The R□ is the slope of the RxW vs. G plot. The intercept is equal to 2xWxRc. ..................................................... 89

8
Figure 3-18. Examples of thickness measurement using AFM: a) SSA-doped PANI,
and b) SPhA-doped PANI/coated CB composite. The thin films on the glass slides were scratched by a scalpel to facilitate the measurement. ..................... 90
Figure 3-19. Transient response (as defined in Equation 3-4) of a SSA-PANI/coated-
CB dip coated sensor on Kapton toward 340, 550 and 1150 ppb at 80 °C. In all
cases exposure time is 300 sec (5 min), and the sensor has been given enough time to recover to the Rb. An off-set is applied to curves for clarification. The green and red arrows indicate the start and the end point of each exposure, respectively. ...................................................................................................... 92
Figure 3-20. Ammonia sensing behaviour of hybrid SSA-doped PANI/coate-CB sensor
(dip coated on Kapton; blue line) and Synkera’s MOS ammonia sensor (red line). The hybrid sensor kept at 80 °C with the sub-miniature ceramic heater. Ammonia
concentrations are indicated as bar graphs (black line) for each measurement. Exposure and recovery durations are 3 and 5 min, respectively. ....................... 94
Figure 3-21. Comparison of the relative response (as defined in Equation 3-5) between
the hybrid SSA-doped PANI/coated-CB sensor (dip coated on Kapton; blue bars) and Synkera’s MOS ammonia sensor (green bars). The hybrid sensor kept at 80 °C with the sub-miniature ceramic heater. The values are the average of five measurements. .................................................................................................. 95
Figure 3-22. Response of the spin coated SSA-doped/coated CB hybrid sensor to ammonia in air. The sensor is heated up to 80 ºC. ............................................ 95
Figure 3-23. Sensitivity enhancement by using spin coating instead of dip coating as
the deposition method. The intercept of the fitted lines has been fixed to zero. The error bars correspond to 5 measurements for the dip- and spin-coated devices and 3 repeats for the MOS sensor. ....................................................... 96
Figure 3-24. Effect of temperature and substrate material on the transient response of
a dip-coated SSA-doped PANI/coated-CB hybrid sensor toward 1 ppm ammonia. The zoom in area (b) shows the very beginning of the response. The exposure time is 3 min. ..................................................................................................... 97
Figure 3-25. The comparison of ammonia concentration measurements between a
commercial ammonia detector (red curve), and a spin-coated PANI/coated-CB hybrid nanocomposite sensor on PEN substrate working at 80 ºC. The response of the hybrid sensors is scaled to match the first point of the on-site sensing data. .......................................................................................................................... 98
Figure 3-26. Successful printing of a conducting ink: SSA-doped PANi in NMP, using MD-K-130 microdrop dispenser. The polymer concentration was 0.5 wt. %. The printing parameters were adjusted to produce a perfect droplet; a 320 mV pulse was applied to the piezo actuator for 72 µs. The droplet diameter in this image is ~ 80 µm corresponding to droplet volume of ~ 268 picolitres. .......................... 100
Figure 4-1. Two-step vapour-phase deposition polymerisation using solid-state oxidant and dopant. ..................................................................................................... 105
Figure 4-2. Illustration of a patterning example of conducting polyaniline using VDP-
mediated inkjet printing. (1) and (2) are the patterned polyaniline on plasma-treated PET (Reproduced from (Cho et al., 2010b)). ....................................... 107
Figure 4-3. Three different polymeric acids used as PANI dopant in the VDP process. ........................................................................................................................ 109
Figure 4-4. The homemade vapour-phase deposition polymerisation system used in
this study. During polymerisation, the colour of the coated substrates gradually changes to green, indicative of emeraldine salt formation. ............................... 110
Figure 4-5. UV-Vis transmittance spectrum of PAA-doped PANI layer fabricated by VDP on glass substrate. .................................................................................. 112

9
Figure 4-6. Left: the sensor substrate before and after vapour-phase deposition
polymerisation of PAA-doped PANI layer. Right: AFM images of the sensing layer (the scale bar in inset is 500 nm). .................................................................... 113
Figure 4-7. RT response of the PAA-doped PANI sensor to various concentrations of
ammonia vapour in synthetic dry air. The exposure and recovery times are 5 and 15 min, respectively. Ii is the initial value of the current passing through the sensor at time=0. ............................................................................................. 114
Figure 4-8. Calibration curve of the PAA-doped PANI sensor response under RT
conditions. Imax-Ib represents the maximum change in sensor current during the exposure (5 min) to each concentration. The reported values and error bars correspond to the average values over 3 repeats of each measurements. ...... 114
Figure 4-9. The sensor was dried under dry air flow (100 sccm). The red line shows the fitted line to data. I is current in µA and t is time in sec. .............................. 116
Figure 4-10. The thermal aging of the sensor at 80 ºC. The red line represents the fitted line to the data. I is current in µA and t is time in sec. .............................. 116
Figure 4-11. The transient variation in current of the PSSA-doped PANI sensor (raw
response) in exposure to ammonia at 80 ºC. The sensor is exposed to nine successive concentrations of ammonia, and this process is repeated 4 times.. The 2nd measurement cycle is marked by an orange square for clarification; the x-axis of this marked square has been magnified on the top x-axis; the corresponding concentration profile of each cycle is indicated on the right y-axis, showing ammonia concentrations from 175 ppb to 1.75 ppm in dry air. The applied potential was kept constant at 100 mV. The exposure and recovery durations were 5 and 15 min, respectively for each exposure. (The initial resistance value of the sensor is about 330 kΩ.) ............................................. 117
Figure 4-12. The raw response of the PSSA-doped PANI sensor in 5 cycles of
exposure to a series of ammonia concentrations from 175 ppb to 1.75 ppm in humid air (AH=3000 mg m-3). Similar to previous figure, the 3rd repeat cycle is marked by an orange square for clarification; the x-axis of this orange square is magnified and shown on the top x-axis. The sensor was heated to around 80 ºC to enhance the recovery. The applied potential was kept constant at 100 mV. The exposure and recovery durations were 5 and 15 min, respectively for each exposure. (The initial resistance value of the sensor is about 42 kΩ.) .............. 118
Figure 4-13. Effect of AH on the relative response of the PSSA-doped PANI after a 3-min exposure to ammonia vapour at ~80 ºC. ................................................... 119
Figure 4-14. Humidity sensing behaviour of the Nafion-doped PANI sensor at RT. The inset shows the response magnitude. .............................................................. 120
Figure 4-15. Ammonia sensing RT transient response of the Nafion-doped PANI
sensor at AH=5000 mg m-3. The sensor exposed to each concentration until it reaches equilibrium, and then left in clean air for complete recovery. .............. 121
Figure 4-16. Ammonia sensing RT transient response of the Nafion-doped PANI
sensor at AH=8000 mg m-3. The sensor exposed to each concentration until it reaches equilibrium, and then left in clean air for complete recovery. .............. 121
Figure 4-17. Effect of absolute humidity on the response magnitude and sensitivity of Nafion-doped PANI sensor. ............................................................................. 122
Figure 4-18. Repeatability test of the Nafion doped-PANI sensor to 1.0 ppm ammonia
is shown. The sensor at humid environment works better. The exposure and recovery duration were 1500 and 3000 sec, respectively. An offset in y-axis has been applied to the data for clarification. ......................................................... 123
Figure 4-19. Cross-sensitivity test for Nafion-doped PANI sensor toward ammonia and several VOCs in ppth concentration range. ...................................................... 123

10
Figure 4-20. The proposed mechanism for immobilisation of a biomolecule (shown by
blue circles) on a PAA-doped PANI (shown by green colour) using EDC-NHS coupling agent. ................................................................................................ 124
Figure 4-21. The immobilisation of GFP on PAA-doped PANI layer. Top left: the optical
image of the control sample under fluorescence microscope, top right and bottom left: the fluorescence microscopy images of the immobilised GFP on the surface in two difference magnifications, bottom right: AFM image of immobilised GFP showing the protein aggregates. ...................................................................... 125
Figure 5-1. Process flow of the micro-hotplates fabrication: (a) Inkjet printing of the
heater on the PEN substrate, (b) Lamination of a thin dielectric film on the heater for electrical isolation, (c) Inkjet printing of the comb electrode onto the thin dielectric and (d) Deposition of the polyaniline sensing layer. A dry film photoresist, 50 or 14 µm thick, was used as the dielectric film laminated onto the heater for the first and the second generations, respectively. Lamination was performed at 85 °C at 2 bar, at a speed of 2 m min-1. The IDE consisted of two interdigitated combs. The pitch of the electrodes was 120 μm, corresponding to a width of 68 ± 8 μm and an inter-finger spacing of 52 ± 8 μm. The electrodes’ total thickness was 260 ± 50 nm. ............................................................................ 133
Figure 5-2. Layout of the different designed heaters: the first generation (top) was
designed as a large meander with a total length of ~41 mm. Adjacent tracks had a pitch (centre-to-centre distance) of 600 µm, and 300 µm width on the design layout. The resulting printed lines were wider at 397 ± 6 µm due to the lateral spreading of the ink. The heater thickness was 1.2 ± 0.3 µm. The resistance of the heater was 25 ± 3 Ω and the resistivity was 22 ± 3 μΩ cm. The total surface area of the device was ~24 mm2. The second generation (bottom) was of a much smaller size (~1 mm2) and was designed as a square double meander of total length of ~7.75 mm for improved thermal performance. The line width after printing was 68 ± 8 μm, corresponding to a single drop-wide line. To further decrease the thermal gradient over the surface of the double meander heater, adjacent lines were placed closer to each other at the outermost part of the spiral than at the innermost part (160 µm pitch against 240 µm pitch), compensating for the larger heat dissipation occurring at the edge of the heater, compared to at its centre. A square shape was chosen because round shapes are challenging to inkjet print. The line thickness was 530 ± 90 nm and the measured resistivity of the line was 18 ± 7 μΩ cm. The total resistance of the second generation heaters was 95 ± 7 Ω. The contact pads of the second generation devices were 1.4 cm, to facilitate their connection using a zero insertion force (ZIF) connector. To minimise the heat dissipation on the long contact pads, they were designed to be much wider and thicker than the heater lines. The pad widths and thickness was 700 μm and 1 μm respectively. The average resistance of the pads was 2.3 ± 0.3 Ω, (negligible when compared to the heater resistance). ................................. 135
Figure 5-3. Optical images of µ-hotplates depicting examples of both generations,
including flexible arrays, close views of a single device and a device with gold-plated combed electrode. ................................................................................ 136
Figure 5-4. Temperature measured at the center of the micro-hotplate as a function of the heating power: Comparison between first and second generation. ............ 138
Figure 5-5. Thermal gradient at the surface of the second generation of heaters: (a)
thermographic simulation obtained by FEM and (b) thermal profile along x and y axis. ................................................................................................................. 139
Figure 5-6. Response of the 1st generation sensor towards various concentrations of
ammonia vapour from 250 ppb to 3.65 ppm in dry air, at four temperatures: RT, 40, 60 and 80 °C with exposure and recovery time of 10 min and 30 min, respectively. Here, the Ri is the resistance value of the sensor at time=0. ....... 140

11
Figure 5-7. Effect of µ-hotplate temperature on sensitivity (open square) and recovery
(closed circle) of the 1st generation sensors. The solid curve and dashed line show curve fits for sensitivity and recovery data, respectively. The error bars represent the standard deviation. .................................................................... 142
Figure 5-8. a) The 2nd generation sensor response magnitude (ΔRmax/Rb) to ammonia
during a 3 min exposure at RT (closed square) and 95 ºC (open circle; the heater power consumption was 35 mW). b) Enhancement of the recovery of the sensor at 95 ºC compared to that of RT. The sensor was purged with clean dry air for 15 min after each ammonia exposure. .................................................................. 143
Figure 5-9. Comparison of the humidity response of the 2nd generation sensors at RT
(closed square) and 95 ºC (open circle). The exposure time is 3 min in all cases. ........................................................................................................................ 144
Figure 5-10. Selectivity test of the 2nd generation sensors: resistance response in
exposure to: 1) acetic acid (3.19 ppth), 2) acetone (1.16 ppth), 3) chloroform (2.26 ppth), 4) n-butyl acetate (0.58 ppth), 5) ethanol (3.12 ppth), 6) methanol (4.51 ppth) and 7) ammonia (2.83 ppth). The ordinate on the inset was multiplied by a factor of 50 from the ordinate on the main plot of the figure. The value at the low end and high end of the ordinate of the inset are 3.12 and 4.12 MΩ, respectively. The baseline value in the inset is 3.87 MΩ. ................................. 146
Figure 5-11. Baseline drift of the sensors over an aging period of 21 days. The sensors
were heated to about 95 °C and dry air passed over them. R0 is the initial resistance on day 1. The inset shows the optical image of the electrodes’ surface on the 2nd generation sensors after 2 months: (a) an oxidised silver electrode and (b) an intact gold-electroplated electrode. ........................................................ 148
Figure 6-1. Conceptual design of the FlexSmell tag. ................................................ 163 Figure 6-2. Image of the RFID FlexSmell tag including the sensor chip for temperature
and humidity which connects to the tag by a standard ZIF connector. ............. 164 Figure 6-3. Schematic of the inkjet-printed multi-sensor chip platform, including two
capacitive sensors, two resistive sensors, a heater and a temperature sensor. 165

12
LIST OF ABBREVIATIONS
AFM Atomic Force Microscopy
AH Absolute Humidity
APS Ammonium Peroxydisulphate
AVGS Automatic Vapour Generation System
BE Binding Energy
CB Carbon Black
CHE Coefficient of Hydroscopic Expansion
Chem-FET Chemically Sensitive Field-effect Transistor
CNT Carbon Nanotube
CPC Conductive Polymer Composite
CSA Camphor Sulphonic Acid
CTE Coefficient of Thermal Expansion
DBSA Dodecylbenzene Sulphonic Acid
DMA Dimethylamine
DMF Dimethylformamide
DMMP Dimethyl methylphosphonate
DMPU n,n'-dimethylpropylene urea
DMSO Dimethylsulphoxide
EB Polyaniline Emeraldine Base
EDC 1-ethyl-3-(3-dimethylaminopropyl) carbodiimide
EDOT 3,4-ethylenedioxy thiophene
EKUT University of Tübingen
EPA USA Environmental Protection Agency
EPFL École Polytechnique Fédérale de Lausanne
ES Polyaniline Emeraldine Salt
FEM Finite Element Method
FP7 Seventh Framework Program
FQI Food Quality Indicator
GC-MS Gas Chromatography-Mass Spectroscopy
GFP Green Fluorescent Protein
ICP Intrinsically Conducting Polymer
IDE Interdigitated Gold Electrodes
IGFET Insulated Gate Field-effect Transistors
IPA 2-propanol
IPN Interpenetrating Polymer Network
ISA Instrument Association of America
ITN Initial Training Networks

13
MC m-cresol
MFC Mass Flow Controller
MOS Metal Oxide Semiconductor
MW Molecular Weight
MWNT Multi-walled Carbon Nanotube
NCTR USA National Centre for Toxicological Research
NHS n-hydroxysuccinimide
NMP n-methylpyrrolidone
oCVD Oxidative Chemical Vapour Deposition
OEL Occupational Exposure Limit
P3HT Poly(3-hexylthiophene-2,5-diyl)
PAA Poly(acrylic acid)
PANI Polyaniline
PDMS Poly(dimethylsiloxane)
PEDOT Poly(3,4-ethylenedioxythiophene)
PEN Poly(ethylene naphthalate)
PET Poly(ethylene terephthalate)
PMMA Poly(methyl methacrylate)
ppb Parts per Billion
ppm Parts per Billion
ppt Parts per Trillion
ppth Parts per Thousand
PPy Polypyrrole
PS Polystyrene
PSSA Poly(styrenesulphonic acid)
PTFE Polytetrafluoroethylene
PVA Poly(vinyl alcohol)
PVP Poly(4-vinylphenol)
PVSA Poly(vinylsulphonic acid)
RFID Radio Frequency Identification
RT Room Temperature
sccm Standard Cubic Centimetres per Minute
SDS Sodium Lauryl Sulphate
SPhA 4-sulphophthalic Acid
SSA Sulphosuccinic Acid
STEL Short Term Exposure Limit
SWNT Single-walled Carbon Nanotubes
TAN Total Ammonia Nitrogen

14
TBA 2-thiobarbituric Acid
TFT Thin Film Transistors
TGA Thermogravimetric Analysis
TIPS-pentacene 6,13-bis(triisopropylsilylethinyl)pentacene
TMA Trimethylamine
TTI Time Temperature Indicator
TNO Netherland’s Organisation for Applied Scientific Research
TVB-N Total Volatile Basic Nitrogen
UMAN University of Manchester
UNIBA University of Bari
USFD University of Sheffield
UV Ultraviolet
VDP Vapour-phase Deposition Polymerisation
VOC Volatile Organic Compound
VTT Finland’s Technical Research Centre
WF Work Function
WHO World Health Organisation
WRAP UK Waste and Resource Action Program
XPS X-ray Photoelectron Spectroscopy
ZIF Zero Insertion Force

15
ABSTRACT
The University of Manchester
Ehsan Danesh Doctor of Philosophy
Novel Polyaniline-based Ammonia Sensors on Plastic Substrates
| February 2014 |
This thesis describes the development of high performing low-cost and low-power
ammonia sensors on plastic substrates using solution processing techniques. As a part
of the Marie Curie Initial Training Networks, FlexSmell project aimed at the realisation
of such sensors as elements of a sensing system on flexible tags for wireless
compatible applications. Ammonia was selected as the target analyte due to its
importance in many application fields including food industry, air and water quality
monitoring. Polyaniline, a conjugated polymer, was used as the sensing layer for
chemiresistive detection of ammonia because of its well-known gas sensing properties.
Two distinctive strategies were adapted to tackle doped polyaniline’s lack of solution
processablity. Firstly, dopant engineering was utilised to prepare doped polyaniline
formulations in aprotic solvents such as n-methyl-2-pyrrolidone. Hybrid composites
were then prepared by simply mixing the polyaniline solutions and carbon
nanoparticles. Sensors made by spin coating the polyaniline hybrid composites on
plastic substrates operating at ~80 °C showed sensitivities more than 6 times higher
than that of a commercial metal oxide sensor when exposed to sub-ppm
concentrations of ammonia in air. The incompatibility of the multifunctional dopants
used in this method with printed electronics, as well as the high boiling point and
toxicity of the solvent led to the second approach. A two-step vapour-phase deposition
polymerisation method was exploited to in-situ polymerise different polymeric acid-
doped polyaniline thin films on plastic substrates. Polyaniline sensors doped with
poly(4-styrenesulphonic acid), demonstrated sensitive response to sub-ppm
concentrations of ammonia vapour under both dry and humid conditions. These
sensors showed enhanced recovery and repeatability when operated at elevated
temperatures. Moreover, room temperature ammonia sensors were realised using
Nafion as the dopant.
Finally, ammonia sensors were made on small (~1 mm2) printed polymeric micro-
hotplates using a vapour-phase deposited polyaniline sensing layer in order to allow

16
reliable operation at ~95 °C with power consumptions as low as 35 mW. Such low-
cost, low-power, sensitive and selective ammonia chemiresistors may be incorporated
in smart RFID tags for food, air and water quality monitoring.

17
DECLARATION
No portion of the work referred to in the thesis has been submitted in support of an
application for another degree or qualification of this or any other university or other
institute of learning.
Ehsan Danesh
March 2014

18
COPYRIGHT STATEMENT
i. The author of this thesis (including any appendices and/or schedules to this
thesis) owns certain copyright or related rights in it (the “Copyright”) and he
has given The University of Manchester certain rights to use such
Copyright, including for administrative purposes.
ii. Copies of this thesis, either in full or in extracts and whether in hard or
electronic copy, may be made only in accordance with the Copyright,
Design and Patents Act 1988 (as amended) and regulations issued under it
or, where appropriate, in accordance with licensing agreements which the
University has from time to time. This page must form part of any such
copies made.
iii. The ownership of certain Copyright, patents, designs, trademarks and other
intellectual property (the “Intellectual Property”) and any reproductions of
copyright work in the thesis, for example graphs and tables
(“Reproductions”), which may be described in this thesis, may not be owned
by the author and may be owned by third parties. Such Intellectual Property
and Reproductions cannot and must not be made available for use without
the prior written permission of the owner(s) of the relevant Intellectual
Property and/or Reproductions.
iv. Further information on the conditions under which disclosure, publication
and commercialisation of this thesis, the Copyright and any Intellectual
Property and/or Reproductions described in it may take place is available in
the University IP Policy (see
http://documents.manchester.ac.uk/display.aspx?DocID=487), in any
relevant thesis restriction declaration deposited in the University Library,
The University Library’s regulations (see
http://www.library.manchester.ac.uk/aboutus/regulations), and in The
University’s policy on presentation of Theses.

19
DEDICATION
Dedicated to
my wife, Kajal for her unconditional love and support

20
ACKNOWLEDGMENTS
This dissertation would not have been possible without the continued support and
guidance of my supervisor, Prof. Krishna Persaud. I sincerely thank him for his
unrelenting patience and enthusiasm which helped me throughout my studies. I have
been fortunate over the course of these three years to meet and work with a great deal
of talented and bright individuals. I would like to extend my gratitude and utmost
appreciation to the members of our research group, Elena Tuccori, Dr. Mara Bernabei
and Dr. Maria Daniela Angione for their encouragement and assistance during my
work. Special thanks to Dr. Anna Maria Pisanelli for her continued scientific guidance
and moral support.
I would like to acknowledge the FP7 EU Marie Curie Initial Training Network,
FlexSmell (grant n°238454) for funding this research. I am also grateful to all members
of the FlexSmell, especially Francisco Molina Lopez, Mohammad Yusuf Shafi Mulla,
and Dr. Danick Briand for their valuable inputs. I have thoroughly enjoyed collaborating
with all of them during the course of this project.
I would like to thank my Mum and my brothers, Omid and Armin for encouraging me,
supporting me and believing in me all my life. Finally, I would like to show my deep
appreciation to my wife, Kajal, and her parents, Kamyar and Kianeh for always
supporting my decisions and providing me with encouragement and faith in my
abilities.

21
CHAPTER I
1. Introduction: FlexSmell project
Waste is a major issue facing retail food and packaging industries all around the world.
According to the UK Waste and Resource Action Program (WRAP1), food and retail
sector produces more than 30% of all industrial waste in the UK. Approximately one
third of the total purchased food items are thrown away regardless of their quality or
condition, mostly because they have passed their ‘use by’ or ‘best before’ period on
date stamps. Interestingly, at least half of this food is edible. These figures
demonstrate the huge economic loss that can be avoided by understanding food
deterioration process and changing the food freshness/spoilage determination criteria.
Smart food packaging technologies open up new possibilities to monitor quality of food
and detect spoilage in its early stages, reducing the waste quantity and disposal cost.
Funded under the Seventh Framework Program (FP7), the FlexSmell project aims at
the design, investigation and realisation of printed chemical sensing systems on
flexible plastic substrates for wireless compatible applications. The focus will be on
very low-cost and low-power smart chemical sensing tags based on radio frequency
identification (RFID) for food freshness and quality traceability control through
packaging. The specific scientific objective is the development of a general platform,
implemented on a flexible substrate, for the detection of volatile compounds. The whole
platform development will be driven by the requirements for applications in wireless
systems, and in particular for manufacturing small RFID tags, providing services to the
individuals and to the community in the areas of food control though smart packaging,
as well as health, environment, communication and security.
Being a part of the Marie Curie Initial Training Networks (ITN), the training and
transfer of knowledge programme is an integral part of the FlexSmell initiative. The
1. www.wrap.org.uk (2007)

22
breadth and the innovation of the scientific scope of this project require the
development of totally novel teaching/training strategies, the creation of
interdisciplinary and intersectoral courses and curricula, and the extension of graduate
and continuing education programs. The interdisciplinary nature of the FlexSmell
research and training activities is mirrored by the composition of the consortium
comprising competences in: chemical sensors, sensing systems, printed organic
electronics, bio-inspired sensors, micro-electronics and microsystems, molecular
biology, analytical chemistry, material science, nanotechnology, device physics and
wireless communication. The intersectoral character is assured by the collaboration of
several partners from the University of Manchester (UMAN, UK), the University of Bari
(UNIBA, Italy), École Polytechnique Fédérale de Lausanne (EPFL, Switzerland), the
University of Tübingen (EKUT, Germany), the University of Sheffield (USFD, UK), the
Finland’s Technical Research Centre (VTT, Finland) and the Netherland’s Organisation
for Applied Scientific Research (TNO, Netherlands). Moreover, Carton Pack (Italy), an
industrial company active in the field of food packaging is involved in the project. Apart
from the specific scientific and technical objectives, the nature of this Marie Curie ITN
offers early-stage researchers the opportunity to improve their research skills, join
established research teams and enhance their career prospects.
The FlexSmell technology platform will be in principle suitable for different
applications such as in the field of logistics for monitoring perishable goods along their
transport and storage. Industries require such a system, where high performance
wireless technologies are combined with printed low-cost and low-power chemical
sensors, which is restricted to the detection of gaseous analytes. The FlexSmell is
focused on applications of such smart labels for food packaging to control the key
parameters connected to the food quality. The use of RFID tags enables the
identification and traceability of objects and goods. RFID, originally used in retail as a
security measure, is now widely used for smart stock control to identify the content of
shipments and to track goods through transit points. To achieve enhanced sensing
performance, a number of well-established transducers will be exploited, namely:
chemiresistors, organic field effect devices, and capacitors.
The UMAN is involved in the work tasks relating to the selection, synthesis and
deposition of organic polymers and odorant binding proteins as single or bilayers on
chosen transduction devices. As can be seen from Figure 1-1 and Figure 1-2, most of
the UMAN work falls into work package one (WP 1) which is: “organic semiconductors
and odorant receptors selection and deposition.”

23
Figure 1-1. Overall picture of the FlexSmell training and transfer of knowledge (Adapted from the FlexSmell’s description of work, part B).
Figure 1-2. 2D grids of thematic work packages and methodical approaches with the relevant tasks and groups in charge of the coordination (Adapted from the FlexSmell’s
description of work, part B).
The aim of the present work was to develop chemiresistors based on solution
processable conducting polymers on flexible substrates such as polyimide Kapton®,
polyethylene naphthalate (PEN) and polyethylene terephthalate (PET). Such flexible
sensors may be modified in order to detect chemicals related to the food
freshness/spoilage in very low concentrations. Special attention has been devoted to
minimise the cost (materials cost as well as manufacturing costs) and power
consumption.

24
To achieve these goals, it was essential to gain insight into the food spoilage
mechanisms and parameters affecting them. The major causes of deterioration of
different food categories, from fresh meat to vegetables, have been reviewed briefly in
Chapter II and Appendix I. Since the focus of the FlexSmell is on “gas” sensing, only
volatile compounds released during food decay were studied and ammonia was
selected as the target analyte. Intrinsically conducting polymers were introduced and
the research was focused on the properties of polyaniline (PANI) as an excellent
ammonia sensing material. The challenges regarding the fabrication of PANI-based
chemiresistors on plastic substrates were discussed.
Two distinctive approaches were adopted to tackle polyaniline’s inherent lack of
processability. In Chapter III, dopant engineering has been used to make solution-
processable PANI formulations. Hybrid composites of PANI and carbon nanoparticles
were then prepared and their electrical and sensing properties were investigated.
Having assessed the advantages and shortcomings of this approach, an alternative
method was used to directly synthesise polyaniline conducting layers on sensing
platforms. Vapour-phase deposition polymerisation (VDP) technique has been
described in Chapter IV. Chemiresistors were made based on the VDP method on
selected plastic substrates, and characterised for their ammonia sensing properties in
dry air as well as under humid conditions. Common organic acid dopants were
replaced by polymeric dopants in order to enhance the properties of the sensor.
Testing of both the hybrid nanocomposite and the VDP-made PANI sensors revealed
that the operation at elevated temperatures significantly improves the ammonia
sensing performance. Therefore, plastic micro-hotplates were designed and fabricated
in collaboration with other FlexSmell partners. These hotplates incorporated in the
sensor platform can be used to increase the PANI layer’s temperature during ammonia
sensing, with very low-power consumption. The development of plastic micro-hotplates
for polyaniline-based ammonia sensors has been reported in Chapter V. Both
aforementioned approaches, i.e. the solution-processable hybrid nanocomposites and
the VDP technique, are believed to be compatible with large-area fabrication of reliable
and high performing sensors, hence suitable for the FlexSmell’s aimed applications.

25
CHAPTER II
2. Background
2.1. Food spoilage
Food spoilage may refer to any changes that render the product unacceptable (and
possibly unsafe) for human consumption. Spoilage may occur at any stage of the food
supply chain and it affects the chemistry, aroma, texture and appearance of food.
Spoilage of food can be evident as physical damage, visible growth of microorganisms,
slime formation or insect damage. In general, food deterioration can be the result of:
a. Microbial activity (It is estimated that one-fourth of the world’s food supply is lost
through microbial activity (Huis in't Veld, 1996))
b. (Bio)chemical changes (including enzymatic reactions)
c. External conditions (also referred to as physical factors such as heat, light and
humidity)
Usually the (bio)chemical reactions caused by microorganisms, enzymes, etc.
produce several volatile organic compounds (VOCs), among other chemicals. There is
an overlap between (bio)chemical spoilage and microbial spoilage that gives rise to the
difficultly in modelling food spoilage and growth of microorganisms. Changes occurring
in the food depend on the chemical composition of the food as well as the
microorganisms present in it. Therefore, knowledge of the nutrient content of a food is
of great importance when predicting which type of chemicals will be released upon the
microbial/ enzymatic activity during food decay. For instance, fresh meats are rich in
proteins and lipids, while carbohydrates are abundant in vegetables and fruits.
Since the main objective of the FlexSmell project is to detect spoilage based on
direct headspace measurement inside the packaging (as a possible non-destructive
approach), it is crucial to focus only on the chemicals that are evolved in the vapour

26
phase over the food during deterioration process. Appendix I gives an overview of the
food spoilage process with a special focus on volatile compounds released at the early
stages of food decay.
2.2. Food quality indicators
Time Temperature Indicators (TTI) and Food Quality Indicators (FQI) are two enabling
technologies which their incorporation into smart labels is believed to considerably
increase the shelf-life of fresh food products (Rokka et al., 2004; Smolander, 2008). A
TTI device shows the accumulated time-temperature history of a product. TTIs employ
established concepts and mature technologies, and are commercially available with
low cost. A commercial TTI1 is shown in Figure 2-1.
However, there is no actual relationship between TTI output and food spoilage! A TTI is
concerned only with the external environment (i.e., temperature), so it has no method
of detecting the presence of bacteria and the chemicals corresponding to the spoiled
food. Additionally, a TTI label functions primarily with food stuffs that have to be kept at
a low and constant temperature (chilled items). FQIs, on the other hand, rely upon the
change in the headspace of the food, and often indicate the spoilage by change in
colour. One of the potential drawbacks of this technology is its sensitivity to spoilage. If
the lower limit of detection of the indicator is too high, then users may already be able
1. www.freshpoint-tti.com
Figure 2-1. Freshpoint’s OnVu™ indicators accurately and consistently record and display the freshness of the products, based on their time and temperature histories. Once packaged, the OnVu™ TTI is activated using an ultra violet (UV) light source. The evolution of the label colour as a function of time and
temperature is demonstrated.

27
to determine if the food is spoiled by visually checking it. On the other hand if the limit
is too low, then food that is edible would be deemed by the sensor to be unfit for
consumption. This also depends on the type of the product being labelled. Selectivity is
another issue, where the volatile has to be of the correct type and concentration to
react effectively with the sensing element on the FQI. FQI technology is still under
development, and research in this area focuses solely on meat, fish and some other
short shelf-life foods.
2.2.1. Examples of FQIs products currently available
FQIs are used to directly measure the changes in food items’ headspace which links to
the quality of the product. Many of the products that exist in this area claim to register
gas changes and inform the user of actual microbial growth. This compares to TTIs
which their operation depends on the deviations from the specified temperature.
Obviously, the added benefits of having actual data on food spoilage means that the
user would have better information on the quality and safety of the product. As
previously discussed, the difficulty of producing an effective FQI label is finding a
metabolite or gas that directly correlates to the quality of a specific food. Many FQIs
are similar in their function to TTIs in that they rely on a colour change to report
bacterial/(bio)chemical spoilage. The following is some examples of FQI products
currently available or on the latest stage of development1:
1. UPM Raflatac2, Finland: Freshness Guard
UPM’s Raflatac division is specialised in labels and labelling systems. The Freshness
Guard has been developed to be used as a detector of variations in the headspace
composition. This smart label is displayed in action in Figure 2-2-a. The company also
produces RFID labels and aims to combine both TTI and FQI technologies to monitor
the shelf-Life. Both of these label systems conform to the EU regulations and UPM
have shown interest in producing a similar system to be used for fish and seafood.
1. All the descriptions/specifications mentioned for the following products are based on the manufacturing company’s website, documentations and/or patents 2. http://www.upmraflatac.com/

28
Figure 2-2. Examples of food quality indicators available in the market: a) Freshness
Guard (Smolander, 2008), b) FreshQ FQI label, c) Litmus FQI label.
The label is manufactured to react with hydrogen sulphide using nanoscale silver
particles dispersed over the label surface. The original colour of the thin silver layer is
light brown; once silver sulphide is formed the layer becomes opaque and a warning
cross becomes visible on the layer.
2. Carrier Corp., USA: Fresh-Tag
The Fresh-Tag is a FQI used for the determination of seafood quality. The label is
designed to react to increased levels of amines as seafood spoils. The active sensor is
in the form of a wick that progressively changes colour as the amines build up inside
the packaging headspace. The technology present in the Fresh-Tag was developed by
the National Centre for Toxicological Research (NCTR, USA) and then licensed out to
Cox Recorders. Unfortunately, data regarding the product and the progress of research
has not been available as Cox Recorders was purchased by Sensitech in 2004, which
was then more recently acquired by Carrier Corp. These companies do not have any
records of the device.
3. Food Quality Sensor International (FQSI)1 Inc., USA: FreshQ
The FreshQ is designed by FQSI and incorporates research into using pH sensitive
dyes for the detection of volatile amines produced from food spoilage. The Figure 2-2-b
shows the design of the label which could be applied to the outside of fresh wrapped
meat and poultry packages and detects food-borne bacteriological levels right through
the wrap. The literature and the patent describe a device that changes colour to
1. www.fqsi.com

29
indicate spoilage, starting with an orange colour and changing to a grey shade once
bacteria have reached a critical level. The sensitivity of the label can be tuned by
adjusting the original pH of the dye when it is deposited on the label. Thus, the device
can also be used for detecting acidic compounds from spoilage if required (Hobday,
2009). The company is also working on a handheld device called SensorfreshQ for
meat and poultry freshness detection.
4. Litmus1 LLC., USA: LITMUS FQI
Litmus holds a breakthrough technology offering simple and quick methods for
determining the direct quality of food products. LITMUS FQI’s technology is based on a
substrate and an indicator compound provided on it. The indicator compound is
colourimetrically responsive to ammonia generated by food decomposition. LITMUS
FQI’s colour changing sensors provide an indication of the quality of a food product
inside a sealed container. Yellow is the “BEST” condition and when the sensor shows
any other colour, the decomposition gases have exceeded guidelines and the sensor
affirms “DO NOT EAT” (Figure 2-2-c).
5. It‘s Fresh Inc.2, USA: It‘s Fresh®
It‘s Fresh have a portfolio of products aimed at the food spoilage detection market.
Included within this collection they have developed a sensor that is only to be used by
the end consumers, the It‘s Fresh® indicator. The portfolio also contains a TTI for cold
chain purposes (Figure 2-3).
Figure 2-3. It's Fresh Inc.’s smart label products (from http://www.itsfresh.com/)
The It‘s Fresh® indicator is designed to be incorporated into either specially designed
food containers or sealable bags using them as the substrate. The sensor detects
extracellular enzyme activity by a colour change of the label. The drawbacks of this
system are the requirement of a sterile environment to function properly as well as a
need for the substrate to be in direct contact with the food stuff (Hobday, 2009).
1. http://litmusgti.com/FQI.html 2. www.foodfreshnesstechnology.com/

30
6. Toxin Alert Inc., Canada: Toxin Guard
This product is under development for commercial and military purposes. According to
company’s patent (Bodenhamer, 1998), the sensor is comprised of a polyethylene film
with immobilised labelled antibodies used to detect certain pathogenic bacteria, such
as Salmonella spp.; further applications of this technology include the capture and
detection of pesticide residues or genetically modified proteins.
7. Ripesense Limited1, New Zealand: RipeSense®
RipeSense® is reported to be the world’s first intelligent sensor label that changes
colour to indicate the ripeness of fruits. The RipeSense® sensor works by reacting to
the aromas released by a fruit as it ripens. The sensor is initially red and gradually
changes to orange and finally yellow (Figure 2-4).
Figure 2-4. RipeSense® ripeness indicator.
In spite of the great interest in food quality indicators both in academia and industry
over the past two decades, none of the products (including the ones from the
aforementioned companies) has become commercially successful. The development of
successful FQIs requires more complex knowledge of food properties and its
deterioration process. Efforts have been made to tackle main challenges in this domain
including reliability, cost effectiveness and compliance with the strict food safety
regulations. The future of such systems mainly depends on whether or not they can
appeal to both retailers and consumers as the main members of the supply chain. With
the advances in the development of nanotechnology-based sensors, and with the
emergence of printed electronics and RFID tags, realisation of food quality sensors
capable of monitoring food freshness based on direct evidence is feasible in near
future.
1. www.ripesense.com/

31
2.3. Selection of the target analyte: Ammonia
As discussed in Appendix I, the headspace of every rotten food consists of a complex
mixture of analytes from different chemical groups: aldehydes (e.g., hexanal) are often
released during the oxidation of unsaturated fatty acids, and are mainly responsible for
the rancid-smelling flavour in lipid-rich foods (Guillén-Sans and Guzmán-Chozas,
1995). Long-chain alcohols, like octanol and decanol, are emitted from gram-negative
enteric bacteria such as E. coli. Geosmin, a bicyclic alcohol, is the primary odorant
component associated with the presence of Penicillium expansum fungus which acts to
decay fruits such as apples, pears, and cherries (Roberts, 1992). Oct-1-en-3-one, a
ketone derived from the oxidation of fatty acids (linolenic and arachidonic acid)
(Wilkinson and Stark, 1967), is the compound mainly responsible for the “metallic”
flavour in the milk (Stark and Forss, 1962). The putrid odour of spoiled meat is caused
by the decomposition of proteins and sulphur-containing amino acids by bacteria (Huis
in't Veld, 1996), which releases sulphur compounds such as methanethiol and
hydrogen sulphide (Belitz H. D., 2004). 2-isopropyl-3-methoxypyrazine has been
identified as metabolic by-product of Pseudomonas perland and taetrolens. This
pyrazine is responsible for a musty/earthy off-flavour in eggs, dairy product and fish
(Belitz H. D., 2004). Volatile acids, esters, lactones, furans and phenols are among the
other classes of chemicals related to deterioration of different types of food stuffs.
Several studies have investigated the potential of using amines and biogenic amines
as potential markers of spoilage of meat, poultry and fish products. A close correlation
between biological spoilage and increased production of nitrogen-containing
compounds is suggested. Biogenic amines (e.g., histamine, cadaverine and
putrescine) are non-volatile organic bases of low molecular weight, mainly produced by
bacterial enzyme activity, through decarboxylation of free amino acids (Bulushi et al.,
2009). Volatile amines such as ammonia, dimethylamine (DMA) and trimethylamine
(TMA) are the result of the amino acid breakdown due to microbiological activity (esp.
Pseudomonas spp.), and are collectively known as total volatile basic nitrogen (TVB-
N). Hence, TVB-N levels are a potential indicator of the protein-rich food spoilage
(Kuswandi et al., 2012; Pacquit et al., 2007). Specifically, the European Commission
has specified that TVB-N levels may be used as indicators of seafood spoilage (Byrne
et al., 2002). Amino acids in meat products undergo microbial degradation and
ammonia, as well as TMA and DMA, are produced as the result (Newton and Gill,
1978; Falk and McGuire, 1919; Pacquit et al., 2006). TMA is also reported to be
responsible for the fishy odour in milk and other dairy products (Ampuero and Bosset,
2003). Kim et al. (Kim et al., 2009) have measured a list of unpleasant odorants

32
including nitrogenous compounds during the decay processes of several food products
(egg, fish and squid) during one month. The results showed that ammonia has the
largest odour release strength, followed by TMA.
As discussed earlier, the diversity and strength of odorants depend not only on the
type and composition of the food, but also on the spoilage mechanism (bacterial,
chemical or both). Historically, Gas Chromatography-Mass Spectroscopy (GC-MS) has
been used to analyse the complex mixtures in the headspace of foodstuffs during
spoilage. Though powerful, these systems are generally large and costly, suited to the
laboratory rather than low cost sensors aimed for smart packaging applications. It is
not feasible to realise a single detector for all of the analytes responsible for food
spoilage. Two different concepts may be applied to address this issue: a) the detection
of specific compounds, which are responsible for decaying process of a specific food
category, with highly selective sensors, or b) the characterisation of different odours by
patterns generated with sensor arrays (i.e., electronic nose) using sensor elements
with partly overlapping selectivities.
Here, we have selected ammonia as the representative of volatile amines group,
which is encountered in protein-rich food species. Hence, we have aimed at the design
of a sensitive and selective ammonia sensor. Apart from food, ammonia is a chemical
encountered in many different environments over a wide range of concentrations.
While substances like refrigerants, household cleaners, and industrial fertilisers are
among the main artificial sources of ammonia, the majority of ammonia in earth’s
atmosphere is produced in nature by the ammonification process from the degradation
of amino acids in animal cells, food putrefaction, and decomposition of waste and
sewage. Although there is much research into ammonia sensors with variety of
mechanisms, the different requirements for each application drive the need for
versatility. Timmer et al (Timmer and al., 2005) have summarised these necessities.
Five major areas that are of interest for measuring ammonia concentrations are:
environmental, automotive, chemical industry, medical diagnostics and food industries
which is described in Table 2-1.
Table 2-1. Ammonia sensing requirements in different applications (Reproduced from ref. (Timmer and al., 2005))

33
It is clear that concentration levels of interest are mostly dependant on the actual
application. This also determines the time resolution of the required analysis
equipment. For instance, ammonia levels in the natural atmosphere can be very low,
down to sub-ppb concentration. Hence, very accurate ammonia detectors with a
detection limit of 1 ppb or lower are required for measuring such concentrations. Near
intensive farming areas, ammonia concentrations are much higher, above 10 ppm. The
detection ranges required are as low as 50–2000 ppb in biomedical applications, such
Application Detection limit Required
response
time
Temperature
range
Remarks
Environmental
Monitoring ambient
conditions
0.1 ppb† to >200
ppm‡
Minutes 0-40˚C Reduce environmental
pollutions
Measure in stables/firms
1 to >25 ppm ~1 min 10-40˚C Protect livestock animals
and farmers
Water Quality (both
clean and waste water)
0.1 mg l-1
to
several tens of
mg l-1
Minutes Water acts as a strong
interference
Automotive
Measure NH3 emission
from vehicles
4-2000 g min-1
(concentration
unknown)
Seconds Upto300˚C NH3 emission is not
regulated at this time
Passenger cabinet air
control
50 ppm ~1 s 0-40˚C Automotive air quality
sensors mainly aim on NOx
and CO levels
Detect ammonia slip 1-100 ppm Seconds Upto600˚C Control urea injection in
SCR NOx reduction
Chemical
Leakage alarm (in
petrochemical plants,
production of industrial
refrigerants, fertilisers,
…)
20-1000 ppm Minutes Upto500˚C Concentrations may be very
high at NH3 plants (can
even be explosive)
Medical
Breath analysis 50-2000 ppb ~1 min 20-40˚C Diagnosis of peptic ulcer
caused by bacteria, small
gas volume
Food packaging
10 ppb to
several tens of
ppm
Minutes
Below0˚Cto
room
temperature
Very broad dynamic range
needed for general food
spoilage detection,
Compatibility of detector
with packaging should be
met
†ppb:partsperbillion
‡ppm:partspermillion

34
as for the detection of urea imbalance induced by renal problems or ulcers brought on
by infection by Helicobacter pylori (breath analysis), and as wide as 0.1 ppb to >200
ppm for environmental monitoring purposes. Natural levels of ammonia in groundwater
are usually below 0.2 mg l-1. Ammonia may be present in drinking water as a result of
disinfection with chloramines. According to World Health Organisation (WHO)1, the
threshold odour concentration of NH3 in water is ca. 1.5 mg l-1. USA Environmental
Protection Agency (EPA) (2013) recommends an acute criterion magnitude of 17 mg
Total Ammonia Nitrogen (TAN) per litre at pH 7 and 20 ºC for a 30-day average
duration, and a chronic criterion magnitude of 1.9 mg TAN at the same condition, for
aquatic life ambient water quality. From the varying samples encountered -clinical and
environmental, to those from the automotive industry and chemical industry- it is
obvious that each class of samples will have its own detection limits, potential
interferents, required operating temperature conditions, sample phase (aqueous or
gas) and response time. The Instrument Association of America (ISA) specifies that
ammonia detectors should reach a minimum of 50% of response within 90 seconds
(i.e. t50 < 90 s) on exposure to a fixed concentration of ammonia gas. Likewise for
recovery, a t50 of 90 s is specified when the detector is exposed to clean air.
The potential harm that ammonia can cause to human health is linked to its high
hydro-solubility. Exposure to high concentrations of ammonia is associated with
pulmonary oedema amongst other pulmonary related disorders, and temporary
blindness. In the UK, the time-weighted occupational exposure limit (OEL) for ammonia
is 25 ppm (18 mg m-3) over an 8 h period and the short term exposure limit (STEL) is
35 ppm (25 mg m-3) over a 15 min period. However the reported lower limit of human
perception of ammonia is highly variant within 1.5-50 ppm. The variance in these
figures highlights the requirement for sensors that can be used for continuous
monitoring of ammonia, in contrast to ‘one/off’ tests.
As the aquatic environments are subject to pollution by agricultural run-off and
natural decomposition of nitrogenous material, they require sensitive monitoring for the
protection of fish stocks. Furthermore, another potential source of aqueous ammonia
contamination comes from refrigerants and their potential leakage into the environment
(Crowley et al., 2008b). There is a trend to observe ammonia toxicity and water pH
relationship, where the higher the pH of the water, the more of the unionised form,
NH3(aq), is present (Figure 2-5). The pKa of ammonia is 9.2, and thus at pH values
below it, the ammonia will be present substantially as the ammonium ion, NH4+. NH3 is
considered the more toxic form as this is the form that can diffuse into biological
1. www.who.int/water_sanitation_health/dwq/ammonia.pdf

35
membranes. This is important when dealing with foodstuffs containing large amounts of
water, since pH affects the headspace during spoilage process.
Figure 2-5. Ammonia content in water vs. pH of the solution
2.4. Ammonia sensing principles
It is very difficult to find a good definition for sensors. Hársanyi (Harsányi, 1995) gives
the following simple definition for a sensor: “a sensor is a transducer that converts the
measurand into a signal”. This signal may be electrical or optical. However, the nature
of the output does not seem to be important. The important thing is that there is a
signal or a change in signal, which holds the information about the measurand and can
be directly transmitted by one of the information transmission channels. All chemical
gas sensors interact with the analyte to induce a physical and/or chemical change in
the sensing layer, which produces a signal. Usually, gas sensors are categorised
based on their transduction principle and sensing material.
Many different principles and technologies for measuring ammonia have been
described in literature. As discussed before, each application field has its own
requirements which thrust the development and exploitation of a specific technology. A
different sensor is used for measuring ultra-low concentrations of ambient ammonia for
environmental monitoring, than in the exhaust pipe of automobiles. This section aims to
give an overview of the three most common “solid-state” technologies being used for
ammonia sensing and a succinct list of their benefits and drawbacks. We focus only on
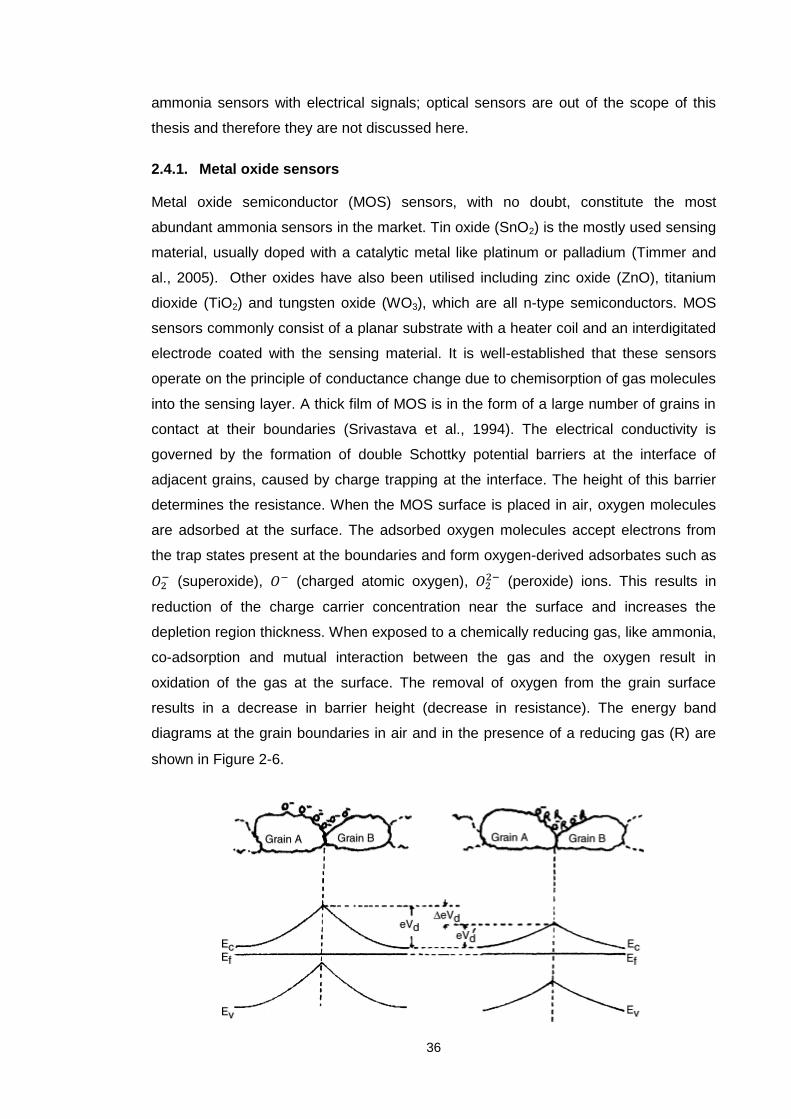
36
ammonia sensors with electrical signals; optical sensors are out of the scope of this
thesis and therefore they are not discussed here.
2.4.1. Metal oxide sensors
Metal oxide semiconductor (MOS) sensors, with no doubt, constitute the most
abundant ammonia sensors in the market. Tin oxide (SnO2) is the mostly used sensing
material, usually doped with a catalytic metal like platinum or palladium (Timmer and
al., 2005). Other oxides have also been utilised including zinc oxide (ZnO), titanium
dioxide (TiO2) and tungsten oxide (WO3), which are all n-type semiconductors. MOS
sensors commonly consist of a planar substrate with a heater coil and an interdigitated
electrode coated with the sensing material. It is well-established that these sensors
operate on the principle of conductance change due to chemisorption of gas molecules
into the sensing layer. A thick film of MOS is in the form of a large number of grains in
contact at their boundaries (Srivastava et al., 1994). The electrical conductivity is
governed by the formation of double Schottky potential barriers at the interface of
adjacent grains, caused by charge trapping at the interface. The height of this barrier
determines the resistance. When the MOS surface is placed in air, oxygen molecules
are adsorbed at the surface. The adsorbed oxygen molecules accept electrons from
the trap states present at the boundaries and form oxygen-derived adsorbates such as
(superoxide), (charged atomic oxygen),
(peroxide) ions. This results in
reduction of the charge carrier concentration near the surface and increases the
depletion region thickness. When exposed to a chemically reducing gas, like ammonia,
co-adsorption and mutual interaction between the gas and the oxygen result in
oxidation of the gas at the surface. The removal of oxygen from the grain surface
results in a decrease in barrier height (decrease in resistance). The energy band
diagrams at the grain boundaries in air and in the presence of a reducing gas (R) are
shown in Figure 2-6.

37
Figure 2-6. Energy band diagram showing the Schottky barrier height (eVd and eVʹd) at the grain boundary of TiO2 without and with a chemically reducing gas, R (Adapted from (Timmer and al., 2005)). Ec = conduction band, Ev = valence band, and Ef = Fermi level.
From this model, we can immediately infer that MOS sensors are not selective to a
particular gas, as long as it is a reducing agent. This is a serious drawback in practical
applications. One approach to increase the specificity of these sensors is using metals
or additives that enhance the chemisorption of specific gases. Known additives for
optimising the ammonia sensitivity of SnO2-based ammonia sensors are Pd, Bi and
AlSiO3 as well as Pt and SiO2 (Timmer and al., 2005). Ammonia detection limit of 1
ppm is reported using a WO3 sensor modified with Au and MoO3 additives,
accomplished by operation at above 400 °C (Xu et al., 2000). The limit of detection of
most MOS sensors is reported to range within 1-1000 ppm, and the operating
temperature is within the range of 200 to 500 °C. Below 200 °C, the chemisorption
kinetics is very slow, and as the temperature reaches ambient condition, water covers
the oxide surface, inhibiting gas adsorption. Furthermore, grain boundaries’ quality has
a crucial effect on MOS sensor sensitivity; the reproducibility of grain boundaries
requires accurately controlling the preparation parameters of the sensitive material
(Karunagaran et al., 2007). The high power consumption resulting from their high
operating temperature limits MOS sensor applications. In particular, MOS sensors
cannot be used in handheld devices where the power is supplied by a battery. Also,
common inexpensive plastic substrates (e.g., PET) cannot be used because of the risk
of thermal degradation at high temperatures.
2.4.2. Chem-FET sensors
A chemically sensitive field-effect transistor (Chem-FET) is an example of the sensors
that work based on the work function (WF) modulation (Janata and Josowicz, 2003;
Janata, 2004). In a field-effect transistor, the current is established between source and
drain electrodes, when a potential is applied to the metal gate. At the semiconductor-
dielectric interface, a channel allows the current of charge carriers (electrons or holes,
depending on the semiconductor type and work function). In these devices, interaction
of the sensing layer with an analyte modulates the work function of the layer. The
change in the WF shifts the transistor threshold voltage, which is a function of the gas
type and concentration (Domanský et al., 1998). Classically, Chem-FETs have been
made using a metal oxide as the semiconductor and a catalytic metal as the gate
material, in the so called MOSFET devices. Pt-gate Si-based FET sensors showed
sensitive response to ammonia concentrations as low as 10 ppm (Ross et al., 1987).
Much attention has been devoted to organic field-effect transistors, where the sensing

38
material is often an organic semiconductor (in thin film transistors (TFT)) or a
conducting polymer gate material (in insulated gate field-effect transistors (IGFET))
(Figure 2-7) (Janata and Josowicz, 2003).
Figure 2-7. The structure of the two types of field-effect transistor sensors. a) TFT; b) IGFET. (Reproduced from (Janata and Josowicz, 2003))
Yu et al. (Yu et al., 2012), have reported an ammonia sensitive TFT using pentacene
as an active layer and poly(methyl methacrylate) (PMMA) as an insulator. Recently,
sensitive gate dielectrics have also shown promising ammonia sensing properties
(Klug et al., 2013). Huang et al. (Huang et al., 2013), fabricated NH3 sensors based on
pentacene FETs on glass substrates with four different polymer dielectrics, including
polystyrene (PS), poly(vinyl alcohol) (PVA), poly(4-vinylphenol) (PVP) and PMMA.
They demonstrated that the dielectrics/pentacene interface diversities are mainly
responsible for the variations of the sensing properties. TIPS-pentacene-based organic
thin-film transistors fabricated on flexible substrates showed reliable response to
ammonia over the range of 10-100 ppm (Yu et al., 2013). A P3HT-based field effect
transistor has been reported showing sensitive response to ammonia in the range of
0.1–25 ppm at room temperature (Tiwari et al., 2012). Humidity interference is a big
concern in Chem-FETs. Also, the interpretation of the chemical response of these
sensors is difficult due to existence of various forms of modulation of conductivity and
work function in a simple interaction of a gas with the device. Moreover, device
complexity makes it difficult to fabricate Chem-FETs in large scale and with low cost, a
requirement for many sensing applications.
2.4.3. Conducting polymer sensors
Among different materials used in gas/vapour sensors, conducting polymers have been
increasingly employed over the past years, due to their great design flexibility and low
cost. Conducting polymers may refer to two distinctive categories:

39
a) Extrinsic conducting polymers or conductive polymer composites (CPCs), which
are comprised of an insulating matrix (polymer) and conductive fillers (e.g., metal
particles, carbon black (CB), carbon nanotubes (CNTs), graphene, etc.). As the
conductor content in the composite increases, a point is attained (called the percolation
threshold) at which the first connected conductive pathway extending through the
composite is created and consequently, the resistivity of the composite film drops
several orders of magnitude (Danesh et al., 2011; Molla-abbasi et al., 2011). Generally,
in a CPC vapour sensor, the response of the sensor to an analyte is measured as a
change in the resistance of the sensor, thus imparting the name “chemiresistor” to this
type of sensors (Figure 2-8). Swelling of the polymer upon exposure to various gases
and vapours causes the dispersed conductive particles to move farther apart from each
other. This disrupts the formerly formed conductive pathways in the film, which in turn
raises the resistance of the sensor providing a simple yet effective mean for monitoring
the presence of a vapour (Lonergan et al., 1996). Chemiresistors based on CPCs have
shown some advantages including great stability, ability to work at room temperature,
great processability, low power consumption, cost effectiveness, etc., that make them
attractive for use in commercial sensors (Albert et al., 2000). However, these sensors
suffer from low sensitivity and high detection limits, due to the nature of sensing
(swelling).
Figure 2-8. Sensing mechanism in conductive polymer composite sensors. The vapour-induced expansion of the polymer composite causes an increase in the electrical resistance of the composite because the polymer expansion reduces the number of conducting pathways for charge carriers (Reproduced from Lewis research group website
1, Caltech, USA).
1. http://nsl.caltech.edu/research:nose

40
b) Intrinsically conducting polymers (ICPs), including polyaniline, polypyrrole,
polythiophene, etc., which all have a conjugated π-electron system along their polymer
backbone. These polymers are semiconductors in their ground state, and upon doping,
they can conduct electricity with conductivities approaching those of metals. ICPs can
form selective layers in which the physical and/or chemical interaction between the
analyte gas and the conjugated polymer modulates the electronic properties.
Chemiresistors are the most common type of intrinsically conducting polymer sensors.
Due to the porous structure of ICP layers (compared to inorganic films), the
adsorption/desorption kinetics is high at room temperature (Janata and Josowicz,
2003; Yoon, 2013). Detection limits in sub-ppb range has been demonstrated using
ICP nanomaterials for detecting a chemical nerve agent (Kwon et al., 2012a). The
ammonia detection limit of pristine conducting polymers is usually over 1 ppm, with
response times over a minute. However, the sensing characteristics can be tailored by
altering the functional group chemistry of the polymer, dopant engineering,
microstructural modifications and incorporation of inorganic materials (Albert et al.,
2000; Kwon et al., 2012b). The poisoning of ICP sensors overtime is one of their major
drawbacks. Moreover, the sensing mechanism of this category of materials is not fully
understood. Understanding gas sensing behaviour of conducting polymers is
impossible without having an insight into their electrical conductance mechanism. We
will discuss the proposed mechanism of conductivity, their composition and fabrication
in more details in next section.
2.5. Intrinsically conducting polymers
2.5.1. Background
From the onset of their invention, synthetic polymers have been considered to be
excellent electrical insulators, and have been applied to applications such as anti-
corrosive coatings and cable insulations. However, the discovery of ICPs which
possess a variety of properties related to their electrochemical behaviour, opened new
perspectives in polymer science and technology. Although these materials are known
as new materials in terms of their properties, the first report on conducting polymer
synthesis goes back to the 19th century. At that time ‘aniline black’ was obtained as the
product of oxidation of aniline, however its electronic properties were not established
(Freund and Deore, 2007). In early 1970s, the evolution of conducting polymers began
with the discovery of poly(sulphur nitride) (polythiazyl) which becomes superconducting

41
at temperatures near zero Kelvin. Later, polyacetylene, a linear conjugated polymer
was accidentally1 found to have metallic properties. Over the last four decades,
research has shown that electrically conducting polymers can be produced with
conductivities approaching those of the metals such as copper, while having other
properties that are expected of an organic polymer. This work was recognised with the
2000 Nobel Prize in chemistry being awarded to Shirakawa, MacDiarmid and Heeger
for their discovery and subsequent research on high conductivity iodine-doped
polyacetylene (Figure 2-9) (Ngamna, 2006). The halogen dopant removes an electron
from the π-electron system, creating a hole (soliton) via p-type doping, allowing
charges to flow. Examples of ICPs include polyacetylene, polypyrrole (PPy),
polythiophene and polyaniline. ICPs often have spatially extended π-bonding systems
which allow the transfer of electrons or other charge carrying species, therefore
referred to as conjugated polymers.
Figure 2-9. Electrical conductivity of halogen-doped polyacetylene as a function of bromine and iodine concentration. Inset shows the structure of undoped trans-polyacetylene (up) and doped trans-polyacetylene with delocalised electrons (down). The former is an insulator, whereas the later can act as a metal (Reproduced from (Chiang et al., 1978)).
1. www.rsc.org/chemistryworld/2013/08/polyacetylene-organic-conducting-polymer-podcast

42
In the neutral (undoped) state, these polymers are only semiconducting. The
electronic conductivity appears when the material is doped, i.e., when electrons or
holes are injected into the conjugation system, via oxidation or reduction reactions.
Counter-ions called dopants are simultaneously inserted into the polymer matrix to
maintain electro-neutrality (Harsányi, 1995). Dopants may consist of a wide variety of
chemical groups ranging from simple anions such as Cl−, HSO4−, ClO4
−, NO3−, to
bulkier species such as p-toluenesulphonate or camphor-10-sulphonate, to large
polyanions such as poly(styrene sulphonate), as well as amino acids and biopolymers,
including proteins and DNA (Gordon G. Wallace, 2009). Doping can be either chemical
or electrochemical. The electrical conductivity of ICPs lies above that of insulators and
extends well into the region of common metals; therefore, they are often referred to as
‘synthetic Metals’1. Figure 2-10, shows the structures, along with electrical conductivity
in the doped state for a few conjugated polymers. Most of the examples utilise the
electron rich benzene rings in their mechanism of charge transfer. The aromatic ring
allows delocalisation of π electrons across the polymer chain2.
Figure 2-10. Chemical structures and conductivity range of some of the most popular conducting polymers (Adapted from (Terje A. Skotheim, 2007)).
1. So far, the highest reported value has been obtained for iodine-doped polyacetylene (≈10
5 S
cm-1
) and the predicted theoretical limit is about 2×10⁷, more than an order of magnitude higher
than that of copper. 2. Polyaniline has a range of different properties due to the overlap of pz orbitals from the nitrogen atoms in the chain.

43
Due to the growing amount of potential applications of this relatively new scientific
field, the area of conjugated polymers has received a great deal of interest. Potential
applications include polymer/oxide batteries, redox super capacitors, molecular
recognisers, sensors and light emitting diodes. Furthermore, conducting polymers can
be used in a wide variety of other applications (Figure 2-11). These vary depending on
the polymer characteristics and methods used for doping the polymer. The uniqueness
of these materials stems from the ability to conduct electricity and bearing the same
inherent properties of normal polymeric materials. However, Lack of processability of
common ICPs has been a major impediment to the commercial realisation of these
polymers.
Figure 2-11. Application fields of ICPs. (Reproduced from (Heeger, 2001))
2.5.2. Electrical conductivity in ICPs
ICPs are fundamentally different from CPCs, redox polymers and ionically conducting
polymers such as polymer/salt electrolytes. These polymers can act as semiconductors
or conductors. These terms refer to the formation of electron bands or shells within
compounds and elements. Band theory is the most reasonable theory used to explain
the mechanisms of conduction in solids. This theory is based on the formation of
energy bands in solid materials from discrete orbital energy levels found in single atom

44
systems. Bands form because of the effect of neighbouring nuclei in a 3D lattice on the
electronic energy levels. As soon as these bands are formed, they can facilitate
electrons passing from one quantum state to the next if there is an overlap between the
bands or sufficient energy to overcome any band gap. The “Fermi level” in a given
system represents the hypothetical energy level of electrons in a solid at which half of
the quantum states are occupied. In an insulator the Fermi level sits within the valance
band, whereas in a conductor, the Fermi level rests within the conduction band. For
semiconductors, the Fermi level lies within the band gap, i.e. the space between the
conduction and valance bands (Figure 2-12).
In terms of electronic configuration, the valence band has the outer most electrons. If
this band is full, there is nowhere for electrons to move to which means that the
material is an insulator. For electrons to be able to move, the Fermi level requires to be
within a partly filled band, known as a conductance band, which allows electrons to
transfer through these different quantum states. Most metals are good conductors
because the conduction band is not completely filled or there is sufficient overlap with
the valence band, allowing the conduction band to provide different electronic states. In
an insulator, there is no overlap of the valence and conduction bands and there is an
energy gap between the two bands. Electrons cannot easily move between the two
bands and therefore the flow of electrons is prohibited by this gap. The energy gap can
be made up of bands of forbidden electronic states or represent the gap between the
next available energy level for electrons. In an intrinsic semiconductor, this band gap is
much smaller than an insulator. Therefore, by providing enough energy to the solid via
a thermal change or disturbance in electronic field, electrons can jump and move from
the valence band into the conductance band, leaving behind a hole in the valence
band. At absolute zero the semiconductor would act like an insulator but at a given
temperature there is enough energy to allow electrons to transfer to the higher band
(Figure 2-12) (Atkins, 2001).

45
Figure 2-12. Electronic band configuration in (a) metals, (b) insulators, and (c) semiconductors from closely spaced atoms having quantized energy levels.
There is also a way to make semiconductors out of a material that would normally act
as an insulator. There are two types of semiconductors which are formed by placing
impurities into the original material. These are known as extrinsic semiconductors and
the band gap in these materials have foreign orbitals for electrons to use. In an
extrinsic semiconductor there are two types of mechanisms for conduction that occur.
Silicon for example, has a valence of four; that if doped with something of a higher
valance (for example arsenic) this creates an extra electron per atom. This allows
partially filling of the conduction band with these unpaired electrons. The resulting
material is called n-type semiconductor and uses electrons as the main charge carrier.
The other mechanism occurs when a material is doped by a chemical with a lower
valence, for instance silicon with boron (valence of three). Here, the valence band is
depleted of an electron, creating a hole for each electron missing from a bonding pair.
The main charge carriers therefore are the holes that are formed when the electrons
move out of the valence shell. These are known as p-type semiconductors. In ICPs,
dopant molecules act similar to impurities in silicon semiconductors. For most
conjugated polymers, n-type doping refers to a reduction whereas p-type doping refers
to an oxidation (Figure 2-13) (Atkins, 2001).

46
Figure 2-13. n-type (left) and p-type (right) conduction in semiconductors.
To better explain the electronic phenomena in ICPs, new concepts including solitons,
polarons and bipolarons have been introduced by solid-state physicists (Brédas and
Street, 1985). These structures are mainly differentiated by the changes they make in
the polymer backbone; in solid-state physics a charge associated with a boundary or
domain wall is called a soliton, because it has the properties of a solitary wave that can
move without deformation and dissipation. Solitons are the boundary separating two
regions of the polymer with different π-bond phases, while polarons (and bipolarons)
are the boundary between quinoid-type and non-quinoid (benzenoid) regions of
conjugation (i.e., they are mainly present in the π-conjugated systems based on
aromatic rings). A radical cation that is partially delocalised over a segment of the
polymer is called a polaron which is stabilised through the polarisation of the
surrounding medium (Freund and Deore, 2007). The energy diagrams of these
structures are different as well, as solitons result in only one mid-gap state, while two
adjacent polarons exhibit two mid-gap states with a secondary energy gap in between
(Figure 2-14).

47
Figure 2-14. (a) π-π* transition and (b) soliton (left) vs. polaron lattice (right) band gap states.
Generally ICPs are semi-crystalline, heterogeneous systems with a crystalline
(ordered) region dispersed in an amorphous (disordered) region. The crystalline
domains are metallic in nature, where conduction occurs through electron
delocalisation or hopping of the charge carriers through the polaron structure.
However, metallic grains are surrounded by an amorphous non-conducting region
consisting of disordered or folded chains. The overall conductivity of an ICP depends
on bridging among conductive regions by means of tunnelling (Figure 2-15) (Bhadra et
al., 2009).
Figure 2-15. Proposed crystalline-amorphous (heterogeneous) structure of an ICP, showing different conduction pathways: A: along the backbone, B: interchain and C: between metallic grains (Reproduced from (Hobday, 2009; Bhadra et al., 2009).

48
2.5.3. Polyaniline
Due to its interesting properties, polyaniline has attracted great attention in recent
years. Compared to other common ICPs, PANI has good thermal and environmental
stability, and provides reasonable conductivity values enough for most applications. In
terms of cost, aniline is more stable and far cheaper than any of the other monomers
used to synthesise conjugated polymers, making the use of this monomer much more
economic. The synthesis of polyaniline from aniline is also much easier compared to
methods required to produce the other conjugated polymers. The properties of
polyaniline can be tuned more easily than other conducting polymers. As an example,
PANI can be reversibly doped & undoped by either electrochemical or chemical
oxidation & reduction. These are some of the main reasons which make polyaniline
popular among research communities in this field. Depending on the redox potential
and the pH of the environment, PANI can exist in 4 different molecular structures.
Figure 2-16 shows the interconversion of these different forms.
Figure 2-16. Different forms of polyaniline, depicting the oxidative and protonic acid (non-oxidative) doping (Freund and Deore, 2007)
The undoped, insulating forms of PANI consist of: 1) transparent (or pale yellow) fully
reduced form (leucoemeraldine); 2) partially oxidised form which has an amine/imine
ratio of ~1.0 (emeraldine base, EB) with blue colour; and 3) fully oxidised form
(pernigraniline) which is violet. Out of all forms of polyaniline, only the emeraldine salt
(ES) which is the protonated form of PANI EB is electrically conducting. During the
protonation process (treating EB with protonic acids), the number of electrons
associated with the polymer remains unchanged. Hence, the protonation does not
affect the oxidation state of emeraldine base. However, upon doping, a polaron is
formed through the successive formation of localised bipolarons, the intermediate
virtual state of two polarons centred on adjacent N's structure, and more stable polaron
lattice (Figure 2-17) (Epstein et al., 1987).

49
Figure 2-17. Structure of EB after 50% protonation and formation of bipolarons (a), unstable dication radicals (b) and stable polaron lattice (d) (Adapted from (Epstein et al., 1987; Bhadra et al., 2009)).
In the polaron structure, the cation radical on a nitrogen acts as the hole and these
holes are the charge carriers. The electron from the adjacent nitrogen (neutral) jumps
to that hole and that hole becomes neutral. As a result, on the second nitrogen another
hole is created. Thus in the polaron structure an electron starts moving along the
polymer chain towards one particular direction and the corresponding hole is set into
motion along the chain length in the opposite direction leading to an electrical
conduction along the chain (Bhadra et al., 2009). However, in the case of a bipolaron
structure, this type of movement of the electron and hole is not possible since the two
holes are adjacently located. Moreover, in leucoemeraldine or pernigraniline structures,
the electronic environments of all the nitrogen atoms along the polymer chain are
similar. Protons from the dopant can be attracted by any nitrogen atom and there may
be a few (more than two) protonated nitrogen atoms or free nitrogen atoms situated
side by side across the chain. Hence, there is lower chance for chain regularity, and
thus lower chance for the formation of delocalised polarons which are responsible for
the conduction. As a result, protonated leucoemeraldine and pernigraniline forms are
insulating in nature.
2.5.4. Polymerisation of aniline
The polymerisation of aniline is believed to follow the oxidative polymerisation route.
Understanding the molecular mechanism of PANI synthesis helps in controlling the
supramolecular structure and physical properties of the polymer, especially regarding
its polyconjugation and electrical conductivity. Oxidative polymerisation is used for the
synthesis of oligomeric and polymeric products from a variety of monomer classes

50
including phenols, thiophenols, aromatic hydrocarbons, sulphur- and nitrogen-
containing heterocycles, and aromatic amines. Pronounced electron donor properties
and high oxidation tendency are inherent to these monomers. PANI synthesis consists
of two interrelated processes: during polymerisation, monomer undergoes a chain
reaction resulting in the formation of regular macromolecules, and growing chains are
simultaneously assembled into complex supramolecular structures with various
morphologies (Sapurina and Shishov, 2012).
2.5.4.1. The molecular mechanism of aniline polymerisation
Oxidative polymerisation of aniline is found to proceed according to the electrophilic
substitution mechanism (Sapurina and Shishov, 2012): the oxidised nitrogen-
containing structure attacks phenyl ring of another aniline molecule and substitutes one
H+ of the ring, producing a radical cation. Then both the nitrogen-containing structure
and the ring lose one proton, and monomer units bind to each other. In fact, the
polymerisation follows a chain-growth mechanism rather than a polycondensation. The
oxidising agent activates the dormant polymer chain (PANIm), converting it to PANIm+,
then an aniline molecule adds to yield a new deactivated chain with higher molecular
weight (MW):
→
→ Equation 2-1
In the initial step of polymerisation, the monomer is oxidised by the oxidant; however,
upon formation of oligomers, the terminal amino groups undergo oxidation due to their
lower oxidation potential. The oxidant is spent in every step of monomer addition, so
the molar concentration of the oxidising agent should be equal to the monomer
concentration. This is in contrast to other types of chain-growth polymerisation (e.g.,
radical polymerisation) where oxidant is only involved in the initiation step.
The most probable linkage between the two aniline monomers in the electrophilic
substitution is “head-to-tail”, since the electron donor nitrogen atom will most likely be
oxidised by a strong oxidising agent such as ammonium peroxydisulphate (APS). The
exact oxidation path of aniline in reaction with double-electron oxidant APS is still open
to discussion (Ćirić-Marjanović, 2013).

51
Figure 2-18. Electrophilic substitution reaction.
The electrophilic agent may attack hydrogen atoms on different positions in the phenyl
ring to produce units with ortho-, para- and meta- structure. As a result, the final PANI
may be heterogeneous.
The most widely accepted mechanism for oxidative polymerisation of aniline is
depicted in Figure 2-19. The aniline radical cations are formed by the oxidant in a slow
process called “induction period”. Radical cations then recombine according to the
electrophilic substitution mechanism to form the dimer, N-phenylphenylene-1,4-diamine
(p-semidine). The induction period is considered to be the rate-limiting step of the
polymerisation. It is then followed by a rapid exothermic step of chain propagation,
where the oxidised terminal amino group of oligomer/polymer attacks the monomer.
The oxidative polymerisation of aniline in acidic medium yields polymers with regular
structure containing more than 95% para-substituted units linked in the head-to-tail
fashion (Sapurina and Stejskal, 2008). The polymer oxidation state during
polymerisation oscillates between doped pernigraniline (violet) and emeraldine salt
(green).
Figure 2-19. Polyaniline polymerisation mechanism. (Adapted from (Sapurina and Shishov, 2012))

52
2.5.4.2. Effect of pH on the polymerisation of aniline
The acidity of the polymerisation mixture has a strong influence on the final PANI
product. A conducting polymer is produced only in pH < 2.5, while the reaction in mildly
acidic, neutral and alkaline media results in non-conducting oligomers. The effect of pH
on the polymerisation process of aniline is summarised in Figure 2-20.
Figure 2-20. Effect of pH on the oxidation of aniline in the presence of a strong oxidising agent and in a high ionic strength medium (Reproduced from (Sapurina and Shishov, 2012)). pKAn=3.5 and pKPANI=2.5 are marked by the blue dashed line. The black line and dashed line are representative of aniline and chain oxidation potentials, respectively.
Depending on the protonation constant1 of monomer (pKAn) and imino groups on the
chain (pKPANI) this process can be divided into three ranges:
pH > 3.5; here, all types of nitrogen-containing groups are deprotonated, and
oxidation process is similar to typical dielectric polymers, such as phenols, with
the formation of irregular chains having MW of up to 5000.
3.5 < pH < 2.5; monomer is protonated in this range, while imino groups on the
chains are not. The imbalance of the redox processes results in slow formation
of cyclic dimers with phenazine structure.
pH < 2.5; where all the nitrogen-containing groups are protonated, and the
balance of electron exchange between chain and monomer is restored. Para-
substitution is the major growth pattern, which leads to the formation of high
MW regular chains with long polyconjugation lengths.
1. Also known as acid dissociation constant, is often reported in logarithmic scale: ; and it depends on so many factors such as the solvation effect and ionic strength of
the medium.

53
2.5.5. Polyaniline as an ammonia sensing material
Perhaps, one of the most attractive properties of polyaniline is its reversible doping
behaviour through acids and bases. This property can be employed for realising gas
sensors. In fact, nanostructured PANI fabricated as nanofibers (Huang et al., 2002;
Huang et al., 2004), nanowires (Liu et al., 2004), core–shell particles (Wojkiewicz et al.,
2011), and nanocomposites (Gong et al., 2010; Wu et al., 2013; Danesh and Persaud,
2012) has recently received a lot of attention due to its superior gas sensing
characteristics. In particular, PANI is an excellent sensing material for ammonia (Kukla
et al., 1996; Wojkiewicz et al., 2011; Rizzo et al., 2010; Subramanian et al., 2013;
Crowley et al., 2008a; Crowley et al., 2008b; Dhawan et al., 1997; Nicolas-Debarnot
and Poncin-Epaillard, 2003), since basic NH3 deprotonates the amine group in
emeraldine salt, hence converts it to emeraldine base which may cause a drastic drop
in its conductivity:
This reaction can be classified as a reversible chemisorption, given by the following
equation:
Equation 2-2
In high enough concentrations of ammonia, a colour change from green to blue may
also occur which indicates the conversion of ES to EB. This property may be used for
making colourimetric sensors (Gu and Huang, 2013; Kuswandi et al., 2012). Kukla et
al. (Kukla et al., 1996), investigated sensing layers based on HClO4-doped PANI
deposited from a solution in dimethylformamide (DMF). They showed experimentally
that the resistance at equilibrium, R, of the PANI layer varies with ammonia
concentration, N, in the following way:
[( ) ] Equation 2-3

54
Here is the baseline resistance value (at a given temperature) in air; is the
dimensional coefficient (in their work ppm-1, where is in ppm); and
parameter equals 0.5. The kinetic adsorption and desorption curves of ammonia in
polyaniline has been fitted to a wide range of concentrations (10-1000 ppm) using the
Langmuir isotherm but considering heterogeneous adsorption sites on the doped PANI
surface (Hu et al., 2002). Following equation has been proposed for the adsorption
kinetics, considering two different adsorption sites:
( ) { (
)} { (
)} Equation 2-4
where correlates to the adsorption isotherm and is the inverse of the association
constant, in Equation 2-2. The adsorption isotherm is obtained when the system has
come to equilibrium, i.e., the rates of adsorption and desorption are equal, or in
Equation 2-4. A is defined based on Freundlich model, where is the equilibrium
response (proportional to the equilibrium concentration of gas molecules adsorbed on
PANI surface), and is the maximum possible response (proportional to the
concentration of total available adsorption sites):
Equation 2-5
here a and b are constants and 0 < b < 1. A approaches to at low concentrations,
and to 1 when concentration tends to infinity. The desorption process, considering two
different desorption sites, can also be written as:
( ) ( ) (
) ( ) (
) Equation 2-6
similarly,
, where is the dissociation constant in Equation 2-2. The thermal
dependence of both and can be described in terms of the Boltzmann factor:
( ) (
) Equation 2-7
where and are the activation free energy of adsorption and desorption,
respectively. The heat of adsorption is then defined as . According to these
kinetic equations, Hu et al. (Hu et al., 2002), have suggested a monolayer reversible
chemisorption process, where there are two energetically different types of adsorption
sites for ammonia molecules on the PANI backbone. It was proposed that the positive
charges of the doped polymeric chain become unequally distributed over all the
nitrogen atoms as well as on the benzenoid rings, where they will be partially
delocalised. The fraction of positive charge delocalised onto the benzenoid rings

55
affects the neighbour nitrogen atoms. Hence, at least two kinds of positive charges are
present on the nitrogen atoms of the polymeric chain in emeraldine salt state.
indicates high affinity of PANI for ammonia, which does have its drawbacks,
mainly with regards to sensor recovery where long timescales of minutes to hours are
required to return the sensor to its baseline. Baseline drift and irreversible reactions in
polyaniline-based sensors are among the most important issues that negatively affect
their long-term stability and impede their practical use.
2.5.6. Solution processable PANI
One of the major issues regarding the fabrication of sensors composed of PANI is the
difficulty in processing the polymer. PANI has been generally categorised as an
insoluble and infusible material (Wessling, 2010; Wessling, 1997; Liu, 1997). Melt
processing of PANI is not possible, since the polymer decomposes at temperatures
below a softening or melting point (Mark, 1999). Emeraldine base is only slightly
soluble in strong aprotic solvents such as n-methylpyrrolidone (NMP), n,n'-
dimethylpropylene urea (DMPU), dimethylsulphoxide (DMSO) and DMF (Tzou and
Gregory, 1993; Tzou and Gregory, 1994). Conventional conducting PANI (in doped
state) does not dissolve in common organic solvents. The origin of the difficulty for
solubilising PANI, like other conducting polymers, is its delocalised π-electron
structure, which leads to (1) a large electronic polarisability and (2) a stiff polymer
backbone. High electronic polarisability leads to strong inter-chain attraction forces
which favour aggregation instead of solvation of the polymer. The stiffness of the
polymer backbone contributes to unfavourable entropy changes of dissolution. An
additional problem comes from the fact that the conducting polymer is composed of
both hydrophobic hydrocarbon segments and ionic segments in a single polymer chain,
which practically makes PANI a copolymer. This problem leads to difficulty in selecting
a suitable solvent that can simultaneously solvate both segments. PANI in its
conductive form has high crystallinity, which may play a role in preventing conductive
PANI from dissolving in most solvents.
A great effort has been made to enhance the solution processability of polyaniline in
its doped state for sensor fabrication. Methods to improve solution processability of
polyaniline may be essentially reduced into two main categories: synthetic methods
and blending methods.
a) Synthetic methods
Synthetic methods are based on aniline polymerisation to in-situ form a conducting
layer on the target substrate (e.g., interdigitated electrodes), or to form emeraldine salt
dispersions in a suitable carrier solvent for further processing (e.g., aqueous PANI

56
nanoemulsions). In-situ chemical polymerisation (Herath et al., 2012; Grennan et al.,
2005), electropolymerisation (Arsat et al., 2009; Crowley et al., 2013) and vapour-
phase deposition polymerisation (Oh et al., 2013) have been employed to coat sensor
substrates with the desired polyaniline layer. However, reproducibility is a major
concern regarding these approaches, where polymerisation parameters have to be
controlled precisely for each batch. Emulsion polymerisation with the use of steric
stabilisers (referred to as surfactants) such as sodium lauryl sulphate (SDS) and
dodecylbenzene sulphonic acid (DBSA), results in the formation of spherical ES
nanoparticles in water (Ngamna et al., 2007). This dispersion could then be used to
deposit polyaniline on the substrate using a spin coater or an inkjet printer. Huang and
co-workers pioneered new methods of synthesising PANI nanofibers, namely
interfacial polymerisation (Huang et al., 2003) and "rapid mixing" (Huang, 2006), with
the potential for large-scale production of sensitive PANI-based chemical sensors.
Template-guided synthesis has been developed to fabricate polyelectrolyte:PANI
complexes (Liu, 1997). The polyelectrolyte component provides soluble functional
groups to the complex so that the processability for PANI is improved. The
polyelectrolyte also acts as a polymeric dopant in the complex so that the dopant
stability, and consequently stability for PANI in the conducting form is greatly enhanced
owing to the strong electrostatic binding between PANI and the polyelectrolyte. The
polyelectrolytes used are polyanions such as poly(styrenesulphonic acid) (PSSA),
poly(acrylic acid) (PAA) and poly(vinylsulphonic acid) (PVSA) (Sun et al., 1997).
Unfortunately, all the synthetic methods require contact with aniline, which is a
carcinogenic monomer. Moreover, aniline, similar to other conjugated monomers, is
subject to oxidisation in air and must be distilled prior to use.
b) Blending methods
On the other hand, in blending methods, a previously prepared emeraldine base is
mixed with specific dopants to make solution processable emeraldine salt. A big
progress in improving processability of ES is made by doping PANI with functional
protonic acids to render the resulting PANI complex soluble in common organic
solvents. The concept has been named “counterion-induced processability” (Cao et al.,
1992), which indicates that polyaniline can be processed in the doped state, provided
that appropriate functionalised dopants are used in the doping process. Historically, the
first dopants used for the improvement of solution processability of the conducting form
of PANI were surfactant anions such as DBSA (Heeger, 1993). DBSA interferes with
the polymer-polymer interactions and improves polymer-solvent interactions
simultaneously, through the large hydrophobic hydrocarbon tail attached to the
hydrophilic head. However, since surfactants are non-conducting, an increase in their

57
content can be associated with an increase in polymer resistivity. Polyaniline is also
dispersible in 80% acetic acid, 60% formic acid, pyridine and concentrated sulphuric
acid (Reece, 2003). Polyaniline in these solvents undergoes protonation with
simultaneous dissolution. However, the films cast from these mixtures show low
conductivities (0.1-0.5 S cm-1) and very poor mechanical properties. In addition, they
are not resistant against deprotonation (Olinga et al., 2000). Much higher conductivity
is obtained for the films cast from a three-component mixture: PANI, camphor
sulphonic acid (CSA) as the dopant, and m-cresol (MC) as the solvent. Non-oriented
films of PANI(CSA)0.5 show a conductivity exceeding 300 S cm-1 (MacDiarmid and
Epstein, 1994). Unfortunately, films processed from m-cresol also exhibit very poor
mechanical properties and have the tendency to slowly release the solvent, whose
large quantities (up to 15 wt.%) remain in the polymer film after casting. For
PANI/CSA/MC complex, a concept of “secondary doping” has been introduced: due to
molecular matching and H-bonding interactions, a molecular complex is formed
involving all three components of the processing system. The formation of this complex
facilitates the ordering of the polymer upon the removal of the solvent, and the resulting
PANI(CSA)0.5 films show enhanced crystallinity.
However, ES made by blending methods usually is not stable enough for practical
applications because of the ease of dedoping which leads to loss of the electrical
conductivity and change of optical properties. One of the causes for dedoping comes
from the fact that dopants are usually small molecules that can easily evaporate or
sublime out of PANI. Although employing large-molecule dopants may reduce the
possibility of dopant evaporation & sublimation, over time the dopants may undergo
phase segregation. This phenomenon is especially prominent at elevated
temperatures. Exposure to moisture or direct contact with water may also accelerate
dedoping. Conventional PANI is completely deprotonated even in a weak acidic
solution (pH > 4). One approach to solve this problem is to use macromolecular
dopants (e.g., polyelectrolytes) to from an interpenetrating polymer network (IPN)
which resists dedoping by water even at pH values above 9 (Tarver et al., 2008). A
similar approach has been introduced by Pron and co-workers (Olinga et al., 2000;
Dufour et al., 2001; Rannou et al., 2002; Dufour et al., 2003; Zagorska et al., 2003).
They have synthesised new macromolecular protonating agents for PANI, which
combine doping and plasticising properties simultaneously. These dopants are diesters
of 4-sulphophthalic acid (SPhA) and sulphosuccinic acid (SSA), and their use has led
to solution- and melt-processable conducting polyaniline with high conductivity,
enhanced mechanical properties and high environmental and thermal stability.

58
Obviously, each of these methods has its own advantages and limitations. The
crucial thing is that in the case of doped PANI, the main properties of the complex,
including processability, environmental stability, electrical conductivity, mechanical
properties and so on, depend very strongly not only on the chemical constitution of the
polymer chain and the dopant anion, but also on the supramolecular aggregation
induced by the presence of the dopant. The role of dopant in ICP-based sensors
becomes even more important, since it is shown that the dopant itself can alter sensing
behaviour and modify selectivity and specificity of the sensor (Anitha and
Subramanian, 2003; Cabala et al., 1997). Therefore, one can understand the
importance of “dopant engineering” in fabrication of polyaniline-based sensors. In the
following chapter we shall use special dopants to make solution processable
polyaniline formulations, based on ‘counterion-induced processability’ concept.
In summary, a brief description of food spoilage and its mechanisms in different food
categories are presented (see Appendix I). Microbial deterioration and (bio)chemical
changes are believed to be the major decaying processes in fresh food. Depending on
the food type and deterioration mechanism, various volatile organic compounds may
be released at the early stages of spoilage. Headspace measurement has been
demonstrated to be a practical way to monitor the quality/freshness of fresh food.
Several food quality indicators, employing this concept, are available commercially and
some more are under research and development to fit in smart packages. In order to
fabricate an indicator that meets the FlexSmell necessities, we need to narrow down
the selection of analytes. Having reviewed different aspects of our project, we
proposed ammonia as the target analyte. Ammonia is not only an important vapour in
food industry, but its sensors can also be used in air and water quality monitoring
applications. Currently, metal oxide semiconductors are the most commonly used
sensing materials in ammonia detectors. However, electrically conducting polymers
such as polyaniline have shown promising features for low-cost detection of ammonia
in ppb levels. Polyaniline is a conjugated polymer, and its electrical and sensing
properties can be altered by doping with acids. Unfortunately, polyaniline in its doped
(conducting) form lacks solution processability. A lot of effort has been devoted to
make solution processable polyaniline, and concepts such as counter-ion induced
processability have been proposed. In the following chapter, we exploit dopant
engineering to prepare polyaniline ammonia sensors based on solution processing
techniques.

59
2.6. References
(2013) Aquatic Life Ambient Water Quality Criteria for Ammonia - Freshwater (2013) US Environmental Protection Agency, Report No.: EPA-822-R-13-001.
Albert, K. J., Lewis, N. S., Schauer, C. L., Sotzing, G. A., Stitzel, S. E., Vaid, T. P. & Walt, D. R. (2000) Cross-Reactive Chemical Sensor Arrays. Chemical Reviews, 100(7), 2595-2626.
Ampuero, S. & Bosset, J. O. (2003) The electronic nose applied to dairy products: a review. Sensors and Actuators B: Chemical, 94(1), 1-12.
Anitha, G. & Subramanian, E. (2003) Dopant induced specificity in sensor behaviour of conducting polyaniline materials with organic solvents. Sensors and Actuators B: Chemical, 92(1-2), 49-59.
Arsat, R., Yu, X. F., Li, Y. X., Wlodarski, W. & Kalantar-zadeh, K. (2009) Hydrogen gas sensor based on highly ordered polyaniline nanofibers. Sensors and Actuators B: Chemical, 137(2), 529-532.
Atkins, P. W. (2006) Physical Chemistry (6th ed.). Oxford: Oxford University Press. 978-0198700722.
Belitz H. D., G. W., Schieberle P. (2004) Food Chemistry. Chapter 5, Springer-verlag. ISBN: 9783540699330.
Bhadra, S., Khastgir, D., Singha, N. K. & Lee, J. H. (2009) Progress in preparation, processing and applications of polyaniline. Progress in Polymer Science, 34(8), 783-810.
Bodenhamer, W. T. (1998) Method and apparatus for selective biological material detection. US patent application No.: US6051388 A.
Brédas, J. L. & Street, G. B. (1985) Polarons, bipolarons, and solitons in conducting polymers. Accounts of Chemical Research, 18(10), 309-315.
Bulushi, I. A., Poole, S., Deeth, H. C. & Dykes, G. A. (2009) Biogenic Amines in Fish: Roles in Intoxication, Spoilage, and Nitrosamine Formation- A Review. Critical Reviews in Food Science and Nutrition, 49(4), 369-377.
Byrne, L., Lau, K. T. & Diamond, D. (2002) Monitoring of headspace total volatile basic nitrogen from selected fish species using reflectance spectroscopic measurements of pH sensitive films. Analyst, 127(10), 1338-1341.
Cabala, R., Meister, V. & Potje-Kamloth, K. (1997) Effect of competitive doping on sensing properties of polypyrrole. Journal of the Chemical Society, Faraday Transactions, 93(1), 131-137.
Cao, Y., Smith, P. & Heeger, A. J. (1992) Counter-ion induced processibility of conducting polyaniline and of conducting polyblends of polyaniline in bulk polymers. Synthetic Metals, 48(1), 91-97.
Chiang, C. K., Park, Y. W., Heeger, A. J., Shirakawa, H., Louis, E. J. & MacDiarmid, A. G. (1978) Conducting polymers: Halogen doped polyacetylene. The Journal of Chemical Physics, 69(11), 5098-5104.
Ćirić-Marjanović, G. (2013) Recent advances in polyaniline research: Polymerization mechanisms, structural aspects, properties and applications. Synthetic Metals, 177(0), 1-47.
Crowley, K., Morrin, A., Hernandez, A., O'Malley, E., Whitten, P. G., Wallace, G. G., Smyth, M. R. & Killard, A. J. (2008a) Fabrication of an ammonia gas sensor using inkjet-printed polyaniline nanoparticles. Talanta, 77(2), 710-717.
Crowley, K., O'Malley, E., Morrin, A., Smyth, M. R. & Killard, A. J. (2008b) An aqueous ammonia sensor based on an inkjet-printed polyaniline nanoparticle-modified electrode. Analyst, 133(3), 391-399.
Crowley, K., Smyth, M., Killard, A. & Morrin, A. (2013) Printing polyaniline for sensor applications. Chemical Papers, 67(8), 771-780.
Danesh, E., Ghaffarian, S. R. & Molla-Abbasi, P. (2011) Non-solvent induced phase separation as a method for making high-performance chemiresistors based on

60
conductive polymer nanocomposites. Sensors and Actuators B: Chemical, 155(2), 562-567.
Danesh, E. & Persaud, K. C. (2012) Flexible Ammonia Sensor Based on Polyaniline/Carbon Black Composites Operating At Elevated Temperatures. In: 14th International Meeting on Chemical Sensors (IMCS 2012), Nürnberg/Nuremberg, Germany. AMA Science Proceedings, 1134 - 1136.
Dhawan, S. K., Kumar, D., Ram, M. K., Chandra, S. & Trivedi, D. C. (1997) Application of conducting polyaniline as sensor material for ammonia. Sensors and Actuators B: Chemical, 40(2-3), 99-103.
Domanský, K., Baldwin, D. L., Grate, J. W., Hall, T. B., Li, J., Josowicz, M. & Janata, J. (1998) Development and Calibration of Field-Effect Transistor-Based Sensor Array for Measurement of Hydrogen and Ammonia Gas Mixtures in Humid Air. Analytical Chemistry, 70(3), 473-481.
Dufour, B., Rannou, P., Djurado, D., Janeczek, H., Zagorska, M., de Geyer, A., Travers, J.-P. & Pron, A. (2003) Low Tg, Stretchable Polyaniline of Metallic-Type Conductivity: Role of Dopant Engineering in the Control of Polymer Supramolecular Organization and in the Tuning of Its Properties. Chemistry of Materials, 15(8), 1587-1592.
Dufour, B., Rannou, P., Fedorko, P., Djurado, D., Travers, J.-P. & Pron, A. (2001) Effect of Plasticizing Dopants on Spectroscopic Properties, Supramolecular Structure, and Electrical Transport in Metallic Polyaniline. Chemistry of Materials, 13(11), 4032-4040.
Epstein, A. J., Ginder, J. M., Zuo, F., Bigelow, R. W., Woo, H. S., Tanner, D. B., Richter, A. F., Huang, W. S. & MacDiarmid, A. G. (1987) Insulator-to-metal transition in polyaniline. Synthetic Metals, 18(1–3), 303-309.
Falk, K. G. & McGuire, G. (1919) Ammonia test for meat spoilage. Journal of Biological Chemistry, 37, 547-550.
Freund, M. S. & Deore, B. A. (2007) Self-Doped Conducting Polymers. Self-Doped Conducting Polymers. Chapter 2. John Wiley & Sons, Ltd. ISBN: 978-0-470-02969-5.
Gong, J., Li, Y., Hu, Z., Zhou, Z. & Deng, Y. (2010) Ultrasensitive NH3 Gas Sensor from Polyaniline Nanograin Enchased TiO2 Fibers. The Journal of Physical Chemistry C, 114(21), 9970-9974.
Gordon G. Wallace, P. R. T., Geoffrey M. Spinks, Leon A. P. Kane-Maguire. (2009) Conductive electroactive polymers : intelligent polymer systems (3rd Ed.), Boca Raton, FL: CRC Press, Taylor & Francis Group. ISBN: 978-1420067095.
Grennan, K., Killard, A. J. & Smyth, M. R. (2005) Chemically polymerized polyaniline films for the mass-production of biosensor devices. Electroanalysis, 17(15-16), 1360-1369.
Gu, Y. & Huang, J. (2013) Colorimetric detection of gaseous ammonia by polyaniline nanocoating of natural cellulose substances. Colloids and Surfaces A: Physicochemical and Engineering Aspects, 433(0), 166-172.
Guillén-Sans, R. & Guzmán-Chozas, M. (1995) Aldehydes in Food and its Relation with the TBA Test for Rancidity. European Journal of Lipid Science and Technology, 97(7-8), 285-286.
Harsányi, G. (1995) Polymer films in sensor applications: technology, materials, devices and their characteristics. Chapter 2. Lancaster, USA: Technomics Publishing Company. ISBN: 9781566762014.
Heeger, A. J. (1993) Polyaniline with surfactant counterions: Conducting polymer materials which are processible in the conducting form. Synthetic Metals, 57(1), 3471-3482.
Heeger, A. J. (2001) Semiconducting and metallic polymers: the fourth generation of polymeric materials. Synthetic Metals, 125(1), 23-42.
Herath, H. M. P. C. K., Pradeep, E. K. C., Jayananda, M. K., Jayanetti, J. K. D. S., Kapaklis, V. & Dissanayake, D. P. (2012) Glass surface functionalized with

61
polyaniline as a fast responding humidity sensor. Sensors and Transducers, 137(2), 137-144.
Hobday, D. S. (2009) Developement of polyaniline as a sensor for food quality and spoilage detection. EngD Thesis, Cranfield University, UK.
Hu, H., Trejo, M., Nicho, M. E., Saniger, . M. Garc a-Valenzuela, A. (2002) Adsorption kinetics of optochemical NH3 gas sensing with semiconductor polyaniline films. Sensors and Actuators B: Chemical, 82(1), 14-23.
Huang, J. (2006) Syntheses and applications of conducting polymer polyaniline nanofibers. Pure and Applied Chemistry, 78(1), 15-27.
Huang, ., Virji, S., Weiller, B. H. Kaner, R. B. (2002) Polyaniline Nanofibers: Facile Synthesis and Chemical Sensors. Journal of the American Chemical Society, 125(2), 314-315.
Huang, ., Virji, S., Weiller, B. H. Kaner, R. B. (2003) Polyaniline Nanofibers: Facile Synthesis and Chemical Sensors. Journal of the American Chemical Society, 125(2), 314-315.
Huang, J., Virji, S., Weiller, B. H. & Kaner, R. B. (2004) Nanostructured Polyaniline Sensors. Chemistry – A European Journal, 10(6), 1314-1319.
Huang, W., Yu, J., Yu, X. & Shi, W. (2013) Polymer dielectric layer functionality in organic field-effect transistor based ammonia gas sensor. Organic Electronics, 14(12), 3453–3459.
Huis in't Veld, J. H. J. (1996) Microbial and biochemical spoilage of foods: an overview. International Journal of Food Microbiology, 33(1), 1-18.
Janata, J. (2004) Thirty Years of CHEMFETs – A Personal View. Electroanalysis, 16(22), 1831-1835.
Janata, J. & Josowicz, M. (2003) Conducting polymers in electronic chemical sensors. Nature Materials, 2(1), 19-24.
Karunagaran, B., Uthirakumar, P., Chung, S. J., Velumani, S. & Suh, E. K. (2007) TiO2 thin film gas sensor for monitoring ammonia. Materials Characterization, 58(8–9), 680-684.
Kim, K.-H., Pal, R., Ahn, J.-W. & Kim, Y. H. (2009) Food decay and offensive odorants: A comparative analysis among three types of food. Waste Management, 29(4), 1265-1273.
Klug, A., Denk, M., Bauer, T., Sandholzer, M., Scherf, U., Slugovc, C. & List, E. J. W. (2013) Organic field-effect transistor based sensors with sensitive gate dielectrics used for low-concentration ammonia detection. Organic Electronics, 14(2), 500-504.
Kukla, A. L., Shirshov, Y. M. & Piletsky, S. A. (1996) Ammonia sensors based on sensitive polyaniline films. Sensors and Actuators B: Chemical, 37(3), 135-140.
Kuswandi, B., Jayus, Restyana, A., Abdullah, A., Heng, L. Y. & Ahmad, M. (2012) A novel colorimetric food package label for fish spoilage based on polyaniline film. Food Control, 25(1), 184-189.
Kwon, O. S., Park, S. J., Lee, J. S., Park, E., Kim, T., Park, H.-W., You, S. A., Yoon, H. & Jang, J. (2012a) Multidimensional Conducting Polymer Nanotubes for Ultrasensitive Chemical Nerve Agent Sensing. Nano Letters, 12(6), 2797-2802.
Kwon, O. S., Park, S. J., Yoon, H. & Jang, J. (2012b) Highly sensitive and selective chemiresistive sensors based on multidimensional polypyrrole nanotubes. Chemical Communications, 48(85), 10526-10528.
Liu, H. (1997) Interpolymer complexes of polyaniline and ionic copolymers: A design of conductive polymers for applications. PhD Thesis. University of Rhode Island. Rhode Island, United States.
Liu, H., Kameoka, J., Czaplewski, D. A. & Craighead, H. G. (2004) Polymeric Nanowire Chemical Sensor. Nano Letters, 4(4), 671-675.
Lonergan, M. C., Severin, E. J., Doleman, B. J., Beaber, S. A., Grubb, R. H. & Lewis, N. S. (1996) Array-based vapor sensing using chemically sensitive, carbon black-polymer resistors. Chemistry of Materials, 8(9), 2298-2312.

62
MacDiarmid, A. G. & Epstein, A. J. (1994) The concept of secondary doping as applied to polyaniline. Synthetic Metals, 65(2-3), 103-116.
Mark, J. E. (1999) Polymer Data Handbook. Oxford University Press, Inc. New York, NY. ISBN: 9780195107890.
Molla-abbasi, P., Ghaffarian, S. R., Danesh, E. (2011) Porous carbon nanotube/PMMA conductive composites as a sensitive layer in vapor sensors. Smart Materials and Structures, 20(10), 105012.
Newton, K. G. & Gill, C. O. (1978) Storage quality of dark, firm, dry meat. Applied and Environmental Microbiology, 36(2), 2.
Ngamna, O. (2006) Synthesis, characterisation and application of inherently conducting polymer nanoparticles. PhD Thesis, University of Wollongong.
Ngamna, O., Morrin, A., Killard, A. J., Moulton, S. E., Smyth, M. R. & Wallace, G. G. (2007) Inkjet Printable Polyaniline Nanoformulations. Langmuir, 23(16), 8569-8574.
Nicolas-Debarnot, D. & Poncin-Epaillard, F. (2003) Polyaniline as a new sensitive layer for gas sensors. Analytica Chimica Acta, 475(1–2), 1-15.
Oh, W.-K., Kim, S., Shin, K.-H., Jang, Y., Choi, M. & Jang, J. (2013) Inkjet-printed polyaniline patterns for exocytosed molecule detection from live cells. Talanta, 105(0), 333-339.
Olinga, T. E., Fraysse, J. r. m., Travers, J. P., Dufresne, A. & Pron, A. (2000) Highly Conducting and Solution-Processable Polyaniline Obtained via Protonation with a New Sulphonic Acid Containing Plasticizing Functional Groups. Macromolecules, 33(6), 2107-2113.
Pacquit, A., Frisby, J., Diamond, D., Lau, K. T., Farrell, A., Quilty, B. & Diamond, D. (2007) Development of a smart packaging for the monitoring of fish spoilage. Food Chemistry, 102(2), 466-470.
Pacquit, A., Lau, K. T., McLaughlin, H., Frisby, J., Quilty, B. & Diamond, D. (2006) Development of a volatile amine sensor for the monitoring of fish spoilage. Talanta, 69(2), 515-520.
Rannou, P., Dufour, B., Travers, J.-P., Pron, A., Djurado, D., Janeczek, H. & Sek, D. (2002) Temperature-Induced Transitions in Doped Polyaniline: Correlation between Glass Transition, Thermochromism and Electrical Transport. The Journal of Physical Chemistry B, 106(41), 10553-10559.
Reece, D. A. (2003) Development of conducting polymers for separations. PhD Thesis, University of Wollongong.
Rizzo, G., Arena, A., Donato, N., Latino, M., Saitta, G., Bonavita, A. & Neri, G. (2010) Flexible, all-organic ammonia sensor based on dodecylbenzene sulphonic acid-doped polyaniline films. Thin Solid Films, 518(23), 7133-7137.
Roberts, J. P. M. a. R. G. (1992) Identification of geosmin as a volatile metabolite of Penicillium expansum. Applied and Environmental Microbiology, 58(9), 2.
Rokka, M., Eerola, S., Smolander, M., Alakomi, H. L. & Ahvenainen, R. (2004) Monitoring of the quality of modified atmosphere packaged broiler chicken cuts stored in different temperature conditions B. Biogenic amines as quality-indicating metabolites. Food Control, 15(8), 601-607.
Ross, J. F., Robins, I. & Webb, B. C. (1987) The ammonia sensitivity of platinum-gate MOSFET devices: dependence on gate electrode morphology. Sensors and Actuators, 11(1), 73-90.
Sapurina, I. & Stejskal, J. (2008) The mechanism of the oxidative polymerization of aniline and the formation of supramolecular polyaniline structures. Polymer International, 57(12), 1295-1325.
Sapurina, I. Y. & Shishov, M. A. (2012) Oxidative Polymerization of Aniline: Molecular Synthesis of Polyaniline and the Formation of Supramolecular Structures. In: Gomes, D. A. D. S. (ed.) New Polymers for Special Applications. Chapter 9. InTech. ISBN: 978-953-51-0744-6.

63
Smolander, M. (2008) Freshness Indicators for Food Packaging: John Wiley & Sons, Ltd. ISBN: 9780470753699.
Srivastava, R. K., Lal, P., Dwivedi, R. & Srivastava, S. K. (1994) Sensing mechanism in tin oxide-based thick-film gas sensors. Sensors and Actuators B: Chemical, 21(3), 213-218.
Stark, W. & Forss, D. A. (1962) A compound responsible for metallic flavour in dairy products: I. Isolation and identification. Journal of Dairy Research, 29(02), 173-180.
Subramanian, R., Crowley, K., Morrin, A. & Killard, A. J. (2013) A sensor probe for the continuous in situ monitoring of ammonia leakage in secondary refrigerant systems. Analytical Methods, 5(1), 134-140.
Sun, L., Liu, H., Clark, R. & Yang, S. C. (1997) Double-strand polyaniline. Synthetic Metals, 84(1-3), 67-68.
Tarver, J., Yoo, J. E., Dennes, T. J., Schwartz, J. & Loo, Y.-L. (2008) Polymer Acid Doped Polyaniline Is Electrochemically Stable Beyond pH 9. Chemistry of Materials, 21(2), 280-286.
Terje A. Skotheim, J. R. (2007) Conjugated Polymers: Theory, Synthesis, Properties, and Characterization. Chapter 2. Boca Raton, FL: CRC Press. ISBN: 9781420043594.
Timmer, B. & al., e. (2005) Ammonia sensors and their applications- a review. Sensors and Actuators B: Chemical, 107(2), 666-677.
Tiwari, S., Singh, A. K., Joshi, L., Chakrabarti, P., Takashima, W., Kaneto, K. & Prakash, R. (2012) Poly-3-hexylthiophene based organic field-effect transistor: Detection of low concentration of ammonia. Sensors and Actuators B: Chemical, 171-172(0), 962-968.
Tzou, K. & Gregory, R. V. (1993) A method to prepare soluble polyaniline salt solutions- in situ doping of PANI base with organic dopants in polar solvents. Synthetic Metals, 53(3), 365-377.
Tzou, K. & Gregory, R. V. (1994) Improved solution stability and spinnabilitiy of concentrated polyaniline solutions by using DMPU solvent. In: International Conference on Science and Technology of Synthetic Metals, 1994 (ICSM 94), TUE POL6-4, 222.
Wessling, B. (1997) In: Nalwa, H. S. (ed.) Handbook of Organic Conductive Molecules and Polymers. New York: Wiley & Sons. ISBN: 978-0-471-96275-5.
Wessling, B. (2010) New Insight into Organic Metal Polyaniline Morphology and Structure. Polymers, 2(4), 786-798.
Wilkinson, R. A. & Stark, W. (1967) A compound responsible for metallic flavour in dairy products: II. Theoretical consideration of the mechanism of formation of oct-1-en-3-one. Journal of Dairy Research, 34(01), 89-102.
Wojkiewicz, J. L., Bliznyuk, V. N., Carquigny, S., Elkamchi, N., Redon, N., Lasri, T., Pud, A. A. & Reynaud, S. (2011) Nanostructured polyaniline-based composites for ppb range ammonia sensing. Sensors and Actuators B: Chemical, 160(1), 1394-1403.
Wu, Z., Chen, X., Zhu, S., Zhou, Z., Yao, Y., Quan, W. & Liu, B. (2013) Enhanced sensitivity of ammonia sensor using graphene/polyaniline nanocomposite. Sensors and Actuators B: Chemical, 178, 485-493.
Xu, C. N., Miura, N., Ishida, Y., Matsuda, K. & Yamazoe, N. (2000) Selective detection of NH3 over NO in combustion exhausts by using Au and MoO3 doubly promoted WO3 element. Sensors and Actuators B: Chemical, 65(1-3), 163-165.
Yoon, H. (2013) Current Trends in Sensors Based on Conducting Polymer Nanomaterials. Nanomaterials, 3(3), 524-549.
Yu, J., Yu, X., Zhang, L. & Zeng, H. (2012) Ammonia gas sensor based on pentacene organic field-effect transistor. Sensors and Actuators B: Chemical, 173, 133-138.

64
Yu, X., Zhou, N., Han, S., Lin, H., Buchholz, D. B., Yu, J., Chang, R. P. H., Marks, T. J. & Facchetti, A. (2013) Flexible spray-coated TIPS-pentacene organic thin-film transistors as ammonia gas sensors. Journal of Materials Chemistry C, 1(40), 6532-6535.
Zagorska, M., Kulszewicz-Bajer, I., Blet, O., Zawirska, P., Dufour, B., Rannou, P. & Pron, A. (2003) Solution processible poly(aniline) via doping with diesters of sulphosuccinic acid. Synthetic Metals, 138(3), 543-548.

65
CHAPTER III
3. Hybrid polyaniline sensors
3.1. Introduction
Although pristine polyaniline sensors have been developed for ammonia detection,
they are found to exhibit insufficient sensitivity (when sub-ppm concentrations in
vapour phase need to be detected), as well as poor reversibility (Chabukswar et al.,
2001). Different strategies have been adapted to enhance the sensing performance of
polyaniline gas sensors in general and ammonia and amine sensors in particular. One
of the most successful strategies is the employment of polyaniline-inorganic nano-
hybrid structures. Nanocomposites of polyaniline with inorganic materials, such as
carbon-based nanomaterials (Lu et al., 2010; Ting et al., 2009; Sotzing et al., 2000;
Jeon et al., 2010; Zhang et al., 2006; Lobotka et al., 2011; Wu et al., 2013; Ding et al.,
2011), metals (Sharma et al., 2002; Athawale et al., 2006) and metal oxides (Ram et
al., 2005; Gong et al., 2010), have been developed successfully for making highly
sensitive gas and vapour sensors.
Sotzing and co-workers (Sotzing et al., 2000) have reported highly sensitive and
selective sensors based on DBSA-doped PANI/CB composites for detection of
biogenic amines. The sensor response was reversible to exposures of n-butylamine at
vapour phase concentrations between 10 ppt (parts-per-trillion) and 700 ppb. The
response time was as low as 30 sec1. However, response at higher concentrations,
between 50 ppm and 1 ppth (parts-per-thousand) showed ‘pseudo-reversibility’. Feller
and co-workers (Lu et al., 2010) have shown that chemo-electrical properties of PANI
nanoparticles/multi-walled carbon nanotube (MWNT) hybrid nanocomposites could be
tuned by varying polyaniline concentration. Interestingly, only a small amount of MWNT
1. Here, the response time was defined as time sufficient for the sensor to produce 90% of the limiting value of the electrical resistivity response.

66
added to polyaniline nanoparticles could not only enhance the transducer’s
conductivity, but also switches the response from negative to positive in exposure to a
specific analyte. These hybrids showed higher sensitivity and selectivity than
formulations comprising of only PANI or only MWNT, demonstrating a positive synergy.
This synergy has been described by the formation of double percolated network inside
the composite. Chemical gas sensors using single-walled carbon nanotubes (SWNT)
electrochemically functionalised with polyaniline are reported by Zhang and co-workers
(Zhang et al., 2006). The results showed reproducible response to NH3 with sensitivity
of 2.44% ∆R/R per ppm. This value was more than 60 times higher than the sensitivity
of intrinsic SWNT based sensors. Moreover, detection limits as low as 50 ppb were
observed for this hybrid SWNT/PANI composite sensors. However, the typical
response time of the sensors at room temperature was on the order of minutes and the
recovery time was a few hours. Graphene/PANI nanocomposites showed linear
response to ammonia over the range of 1-6400 ppm, with 1 ppm detection limit (Wu et
al., 2013).
In an attempt to make high performing ammonia sensors, we decided to prepare
hybrid nanocomposites of polyaniline and carbon nanoparticles. The first step though is
to solubilise (disperse) the conducting polyaniline in a suitable solvent. Solution
processable PANI formulations are needed since the final target of the FlexSmell is to
use techniques which are compatible with large scale sensor fabrication methods (e.g.,
printing). Furthermore, effective dispersion and distribution of carbon nanoparticles is
much easier in a liquid medium. Without a homogenous mixture, it is not possible to
fabricate reproducibly uniform composite layers on the sensor substrate. “Counter-ion
induced processability” concept (Section 2.5.6) was acquired to prepare polyaniline
solutions in common organic solvents such as NMP. “Multifunctional dopants” which
have at least one sulphonic acid group and one carboxylic acid group are used. The
idea is to simultaneously dope and solubilise emeraldine base in the solvent. Selected
carbon nanoparticles will then be mixed with the conducting polyaniline mixture. We
then use this homogeneous mixture to deposit a hybrid PANI-based sensor on the
substrates for ammonia sensing characterisation.

67
3.2. Materials and methods
3.2.1. Materials
All chemicals used were reagent grade and purchased from Sigma-Aldrich (UK),
unless otherwise stated. Polyaniline used is in emeraldine base form with MW~10,000
g mol-1. Two multifunctional dopants, selected from the large family of sulphonic acids,
were:
a) Sulphosuccinic acid (70 wt.% solution in water; ρ=1.438 g cm-3):
b) 4-sulphophthalic acid (50 wt.% solution in water; ρ=1.292 g cm-3):
These dopants were selected because they have two types of functional groups in their
structure: one, which is a sulphonic acid group (SO3−), dopes the PANI’s imine sites
due to its strong acidity. The other one, which is a carboxylic acid group (COO−),
enables the interaction between dopant and polar solvents. Two conductive fillers were
used to make hybrid nanocomposites: (1) Carbon Black nanospheres (Black Pearls
2000, Cabot corp., USA) and (2) 20 wt.% polyaniline on carbon black, which is a
polyaniline-coated carbon nanoparticle supplied by Sigma-Aldrich. Apart from aniline
which was distilled prior to use, all reagents were used as received.
3.2.2. Preparation of doped PANI
Polyaniline protonated with multifunctional dopants were prepared as follows:
emeraldine base powder was dissolved in NMP to make 1.0 wt.% and 5.0 wt.% dark
blue mixtures at 50 °C, using a high shear mixer (RZR 2040, Heidolph overhead
stirrer). The mixtures were filtered using a 0.45 µm Nylon membrane (Millipore) to
remove unsolved particles and gels. These stock solutions were used to prepare
doped polyaniline compositions and hybrid mixtures. The reason for preparing two

68
different concentrations is to have the possibility of fabricating PANI layers with
different thicknesses using the same deposition technique.
Since both dopants are readily miscible with aprotic solvents (e.g., NMP) one can
easily prepare a doped solution by adding the dopant in required concentration to the
stock solution of EB in NMP. As discussed earlier in Chapter II, polyaniline is a
tetrameric polymer, basically comprised of four benzene rings and four nitrogen atoms.
In a fully-doped PANI, only two of the nitrogen atoms become protonated by the dopant
molecules to form polaronic structures (see Figure 2-16 and Figure 2-17). Any excess
dopant will not cause any further doping of the polymer. In other words, for a complete
doping process, two dopant molecules (units) are required for each tetramer of
polyaniline. To simplify this, we define a ‘doping unit’ for emeraldine base. Each doping
unit of EB corresponds to a polyaniline repeat unit containing two benzene rings and
two nitrogen atoms (the MW of the unit is 182 g mol-1):
thus, here we need one molecule of acidic dopant to fully dope this doping unit of
PANI. For instance, to prepare a solution of SSA-doped polyaniline, we added 1.0
mmol SSA to a typical EB/NMP solution containing 182.0 mg of emeraldine base (1
mmol doping unit). Doped-mixtures were filtered using a 0.22 µm
polytetrafluoroethylene (PTFE) syringe filter immediately before use.
3.2.3. PANI/CB hybrid composites
Composites of PANI and CB were prepared by mixing doped PANI solutions in NMP
with adequate amount of conductive filler. The Carbon:PANI mass ratio was fixed at
20:80. Mixtures were stirred overnight and placed in an ultrasonication bath for 1 hr
prior to use. From this point, we will use “CB” as nomenclature for the Black Pearls
2000 and “coated-CB” for the surface-treated carbon black particles.
3.2.4. Thin film characterisation
UV-visible spectroscopy (PerkinElmer lambda 35) was used to study the doping
behaviour of different polyaniline solutions/dispersions. Atomic force microscopy (AFM)
(Thermo Microscopes) in non-contact mode was used to characterise the topography
of hybrid polyaniline composite films prepared. X-ray photoelectron spectroscopy
(XPS) measurements were performed with a Theta Probe Thermo-VG Scientific

69
instrument (at the University of Bari, Italy) using an Al Kα monochromatic source (15
kV; X-ray spot size 300 mm; take-off angle 37°; base pressure 10-9 mbar). Wide-scan
survey (0–1200 eV binding energy, BE) and high-resolution spectra were acquired at
150 and 100 eV pass energy, respectively. Three distinct points were analysed per
sample; the resulting atomic percentage values were reported as the mean value with
associated standard deviation for each set of measurements. Data were analysed
using the Thermo Avantage software, version 4.75. Peak components were normalised
to the highest peak. Thermogravimetric analysis (TGA) was performed on a Mettler-
Toledo TGA DSC 1 under nitrogen to study thermal stability of doped samples. To
attain the doped PANI powders, NMP solutions of polyaniline were precipitated in
acetone, filtered and washed several times with acetone and dried at 65 ºC overnight.
The measurement was run from 30 to 600 °C, where the heating rate was 10 K min-1.
In order to investigate the electrical conductivity of the PANI and its hybrid composite
samples, the required amount of dopant (SSA or SPhA) was added to the 5 wt.% EB
stock solution to make a fully-doped PANI composition, and thin films of doped PANI
and PANI/coated-CB were deposited on glass slides. In the case of composites,
carbon nanoparticles were added to achieve final Carbon:PANI mass ratio of 20:80.
The clean glass slides were then spin coated with the mixture at 3000 rpm for 60 sec.
An IR heater at the distance of 15 cm from the substrate was used in the last 30 sec of
deposition, to ensure complete evaporation of the solvent. The samples were further
dried in oven at 65 ºC overnight. A series of gold contacts were thermally evaporated
on the films using a metallic mask. The micro-electrodes’ length, width and gap were
0.2 mm, 4 mm and 0.2 mm, respectively. Figure 3-1 shows two hybrid composite
samples used for conductivity measurements.
Figure 3-1. Samples used for conductivity measurements. Left: SSA-doped PANI/coated-CB, and right: SPhA-doped PANI/coated-CB hybrid composites. Au electrodes were thermally evaporated on the thin films.

70
Considering contact resistances between the gold contacts and the measuring micro-
probes, as well as between the composite layer and Au electrodes are crucial in
evaluating the accurate conductivity of thin films. Here, we have used Torsi and co-
workers’ method (Torsi et al., 2009): electrical current (I) vs. applied voltage (V) was
measured for parallel electrodes with various gap distances (G). The electrode width
(W) was constant for all electrodes. The electrical resistance, which based on the
Ohm’s law is the slope of the V vs. I curve for each measurement, is a function of G.
For each sample, both sheet resistance (R□) and contact resistance (Rc) values can be
calculated based on the relationship between R and G1. Using the average film
thicknesses (measured by AFM), we can then estimate the conductivity of the samples
in an accurate way. The thickness values are the average of at least 3 points on the
film surface.
3.2.5. Fabrication of sensors
The plastic substrates used were polyimide Kapton and PEN substrates incorporating
interdigitated gold electrodes (IDE). These were provided by IMT centre at EPFL
(partner of the FlexSmell project). The electrode gap was 20 µm and the sensing area
was ca. 20 mm2. The substrates were washed in sequence with methanol, water,
isopropanol (IPA), rinsed with Milli-Q water and dried under N2 flow prior to coating.
Two methods have been used in order to make sensitive layers made by hybrid
polyaniline/coated-CB composites:
a) Dip coating: hybrid compositions starting from 1 wt.% EB/NMP stock solution were
made in a 15 ml glass vials. Dip coating were done by immersing the IDE area of the
substrates into the solution, keeping for 15 sec. Sensors then removed from the
solution, kept in vertical position in air for 30 sec and then dried for 1 day inside a fume
cupboard at room temperature (RT), and finally annealed at 110 °C for 15 min;
b) Spin coating: all the substrate area other than IDE part were covered by Kapton tape
and aforementioned compositions were deposited on the substrates at 2000 rpm for 60
sec using a Chemat spin coater (model: KW-4A, Chemat Scientific, USA), and dried at
RT for 6 hr. Finally, the sensors were annealed at 110 °C for 15 min.
3.2.6. Sensing chamber and circuit board
A custom designed sensing chamber was made from PTFE to host the flexible
sensors. The effective sensing volume before putting the sensor and its connector is
less than 1000 mm3 (1 ml) (Figure 3-2).
1.

71
Figure 3-2. Sensing chamber design. All dimensions and measures are in mm.
A circuit board with zero insertion force (ZIF) connector (Molex 52207-0685) suitable
for holding the flexible substrates used in this study was designed. The sensor is then
connected to a proprietary interface board capable of measuring and recording real-
time resistance change of the sensor. A sub-miniature ceramic heater (model: DN505-
05, RS components, UK) was used for heating the sensor.

72
3.2.7. Ammonia sensing characterisation
A homemade automatic ammonia vapour generation system (AVGS) was designed
and utilised for characterising the sensing performance of prepared sensors. The
carrier air was filtered to remove moisture and dust particles, and produce a clean air.
Ammonia vapour source was a refilled ammonia permeation tube (Fine Permeation
Tubes, Italy) with recalibrated permeation rate of 548 ± 6 ng min-1 (at 25 °C). To
estimate the permeation rate at a different temperature from that of the calibration, one
can use following equation:
( ) Equation 3-1
where is the rate at (°C), is the new rate at (°C), and α is the temperature
coefficient which is 0.034 for the tube used here. (Reference conditions are defined as
25 °C and 760 mm Hg). To calculate the concentration of a gas generated by a
permeation tube in a dynamic carrier flow (Figure 3-4), we can use the following
equation:
(
)
Equation 3-2
Here, the analyte concentration in ppm by volume, the permeation rate in ng
min-1, the molecular weight of the analyte, the total flow of the calibration
mixture in ml min-1. The constant 24.04 is the molar volume at the ambient condition
(20 ºC, 760 mmHg). The laboratory temperature was 20 ± 2 ºC during the course of
measurements.
Figure 3-3. Left: PTFE sensor chamber and its Viton® sealing; Right: Substrate holder, circuit board and the sub-miniature ceramic heater (shown by yellow arrow)

73
Figure 3-4. Permeation tube structure and function.
Figure 3-5 depicts the AVGS system designed for preparing very low concentrations of
ammonia in a reliable, repeatable and precise manner. All the tubes are made of PTFE
and stainless steel. MKS mass flow controllers (MFCs) as well as the pressure control
system, and the 3-way solenoid valve were all controlled by computer. The output of
the air cylinder is filtered using an Agilent moisture trap filled with molecular sieves and
carbon active powder, in order to remove any residual water, oil or solvent from the
clean air stream. The carrier flow and the analyte flow from the permeation tube pass
through a microfilter prior to reach the sensor chamber, to ensure a uniform and
efficient mixing of analyte with carrier flow. The total flow through the sensor was
adjusted to 100 sccm.
Figure 3-5. Automatic ammonia-vapour generation system.

74
In order to investigate the capability of the hybrid sensors for use in real-life
applications, the sensor was placed in an Ammonia Monitor instrument (Multisensor
Systems1), and the ammonia concentration of treated water samples in Heigham water
treatment site (Norwich, UK) monitored continuously over one week. A 1 M sodium
hydroxide (NaOH) solution was used to evolve ammonia from the water samples, using
a proprietary auto sampling system. Data of an on-site electrochemical ammonia
detector (Aztec 600 ISE ammonia analyser, ABB) was used as a reference for
ammonia concentrations. The sampling interval was 15 min.
1 . http://www.multisensor.co.uk/

75
3.3. Results
Using dopant molecules containing polar groups in their structure increases the
interaction forces between dopant and polar solvents. If this interaction overcomes the
intermolecular forces between the chains, it may help the solubilisation of polymer
complex in the solvent. Here, by “solution” we actually mean a mixture that passes
through 0.22 µm PTFE membranes (which was the extent of our effort to filter out any
unsolved particles). However, we suspect that it is a ‘true solution’ on a molecular level
(Section 2.5.6). In this study, both SSA and SPhA contain two carboxylic substituents,
in addition to their strong acidic sulphonic group. These functional groups result in
strong forces between polymer/solvent rather than polymer/polymer interactions.
These interactions render doped salts more soluble in aprotic solvents such as NMP,
DMF and DMSO. This result is in agreement with Tzou and Gregory (Tzou and
Gregory, 1993), which have shown the positive effect of carboxyl groups on solubilising
PANI in NMP and DMSO. Figure 3-6 shows images of diluted solutions of EB, SSA-
and SPhA-doped PANI which were used for UV-Vis spectroscopy.
Figure 3-6. Diluted solutions of a) SSA-doped PANI, b) SPhA-doped PANI and c) EB in NMP.
3.3.1. UV-Vis spectroscopy
UV-Vis spectroscopy is an invaluable tool to examine the doping behaviour in
conjugated polymers both in solution and as thin films. The understanding of doping
state in polyaniline samples is essential in controlling their electrical (and also sensing)
properties. UV-Vis spectra of different forms of polyaniline are usually interpreted on
the basis of their ‘band structure’. The delocalised π bonds available in polyaniline are
responsible for the semi-conducting properties of the polymer. The π orbital produces
the valance band and the π* forms the conduction band (Figure 3-7). The value of the

76
difference in energy between π and π* orbitals (band gap or band energy) determines
both the electrical and optical properties of PANI in solution or solid state. Detailed
description of band theory, polaron and bipolaron formation in polyaniline, as well as
electron transport mechanisms in PANI can be found in (Section 2.5.2).
Figure 3-7. Band structures of protonated polyaniline with (left) a coil-like conformation and (right) an expanded coil-like conformation, respectively. Numbers are indicative of the major wavelengths where peaks appear in UV-Vis spectra. Reproduced from Ref. (Xia et al., 1995)
Figure 3-8. UV-Vis spectra of emeraldine base, SSA- and SPhA-doped PANI solutions in
NMP.
Figure 3-8 compares typical UV-Vis absorption spectra of EB form of PANI with SSA-
and SPhA-doped PANI solutions in NMP, used in this study. For emeraldine base, the
absorption band at ca. 635 nm is generally believed to be relate to the n-π* transition
or quinoid form structure, and the absorption band at ca. 328 nm is related to the π-π*

77
transition. For doped polyaniline the absorption at ca. 425 nm is due to the presence of
localised semiquinone population or the polaron absorption (equivalent to: polaron
band to π* transition in Figure 3-7). Usually there is also another absorption at ca. 800
nm is due to the trapped excitons centred on quinoid (imine) (Tzou and Gregory,
1993), equivalent to: π- to polaron band transition. However, as can be seen from
Figure 3-8, the peak at ca. 800 nm is absent in our case and it is replaced by a long
free tail extended to near IR region. This may be attributed to the highly delocalised
free electron state of polyaniline doped with these dopants. According to Xia and co-
workers (Xia et al., 1995), this may also be due to the expanded-coil conformation of
doped-PANI chains in this specific solvent. We have observed different spectra for
different PANI solutions, based on different solvents and dilution ratios. Further
characterisation by UV or other means is needed in order to fully clarify the effect of
different parameters on the final spectra in UV-Vis-Near IR range of polyaniline
solutions.
We believe that UV-Vis spectra can also be used to assess the stability of these
solutions. Figure 3-9 shows the evolution of the UV-Vis spectra of doped PANI over
time (i.e., the experiment has been done on the same sample in the whole period).
Both solutions are stable for at least two months with a slight decrease in intensity of
the peaks characteristic to doped state. In the case of SSA-doped PANI, the peak at
ca. 425 gradually disappears and the peak intensity at ca. 635 increases. Eventually
the solution turns into EB solution (undoped form) with a clear change in the colour
from dark green to purple. However, for SPhA-doped PANI, even after one year the
solutions remain doped (pale green in colour), in spite of the decrease in the polaron
absorption intensity. These changes may be correlated to the slightly basic nature of
the solvent (NMP), as well as its strong hydrogen bonding capability which causes
interaction with polyaniline and possibly deprotonation.

78
Nevertheless, both of the solutions are stable for a couple of months from the day of
preparation, without any significant change in properties which make them suitable for
use in our target application. As mentioned before, two different formulations were
prepared: 1 wt.% and 5 wt.% solutions of EB in NMP and their doped counterparts. All
the formulations are “solution-processable”. The former is useful when very thin layers
of PANI are needed or when the spin coating is not possible; so, dip coating can be
used instead. The latter on the other hand is more suitable for spin coating and in
Figure 3-9. Evolution of UV-Vis spectra of protonated PANI solutions in NMP during a 1-year period: (top) SSA-doped and (bottom) SPhA-doped PANI.
0.0
0.0
2.5
2.5

79
situations where films with larger thicknesses are required. This variety gives us
flexibility, especially in terms of deposition method selection.
Solution processability of PANI also enables us to make hybrid composites by simply
adding inorganic (nano)particles (e.g., carbon black) into PANI solutions and mixing the
suspension. As a starting point, Black Pearls 2000 was chosen as the conductive filler
due to its well-known physical/electrical properties and its compatibility with polymeric
matrices (Lonergan et al., 1996).
3.3.2. Atomic force microscopy
AFM is used to characterize the surface topography of hybrid composite thin films. It
can give an estimation of the uniformity of dispersion and distribution of nanoparticles
in the layer. The primary particle size of Black Pearls 2000 is reported to be as low as
~12 nm (Zhu et al., 2004). However, when used as an additive within a polymeric
matrix, nanoparticles tend to aggregate and form rather large agglomerations and
clusters from several hundred nanometers to few microns. As can be seen from the
AFM image (Figure 3-10-a), the composite of PANI/Black Pearls 2000 has a non-
uniform distribution of carbon black particles. Moreover, clusters as large as several
microns are present in the layer, in spite of extensive mixing used (1 day stirring plus 1
hr in sonication bath).

80
Figure 3-10. AFM image of (a) 20 wt.% Black Pearls 2000 and (b-d) PANI-coated CB with SSA-doped PANI composite, deposited from suspension in NMP (measurements were done in non-contact mode). Black arrow shows a dispersed particle with ~100 nm in diameter
Several methods have been suggested in the literature in order to enhance the
dispersability of carbon-based nanomaterials in polymeric matrices (Grossiord et al.,
2006); for instance: (a) employing ultra-high energy mixers (such as sonication probes,
Ultra-Turrax mixers, etc.); (b) surface functionalization and (c) using surfactants (and
also polymers (Lin et al., 2003)) to enhance compatibility between nanoparticle and
polymer matrix. The first two methods often significantly deteriorate electrical and
mechanical properties of the nanoparticle, mainly because of the reduction in its aspect
ratio. For example, in nanotubes or nanofibers, the high shear and strong acids can
break and shorten the long tubes/fibres, distorting the π-electron system. Although
using surfactants as a shell around the nanoparticle greatly improves the dispersion, it
adversely affects the electrical conductivity of nanocomposite because of the insulating
nature of common surfactants. Hence, we decided to exploit a new approach: using
carbon nanoparticles covered by a conducting polymer layer. In this manner, the
polymeric layer enhances the wettability of particles without sacrificing the electrical
properties at the interface layer. Such materials are commercially available (from
Sigma-Aldrich). Here, we have used a polyaniline-coated carbon nanoparticle (the
polymer to carbon ratio is 20:80 wt.:wt.). From the material description provided by the

81
manufacturer, we believe that these particles possess a “core-shell” structure; with
carbon nanoparticles as the core and polyaniline chains as the surrounding shell
(Figure 3-11). Polyaniline in the shell will provide maximum compatibility by means of
strong interactions with the polyaniline chains in the solution.
Figure 3-11. Polyaniline/carbon nanoparticle core-shell structure. Reproduced from W. Xiaorong et al., US Patent application No. 20100004398 (2010)
These nanoparticles were used to make hybrid polyaniline nanocomposites with
exactly the same mixing and deposition methods employed in the case of Black Pearls
2000. Figure 3-10-b to d show the AFM images of the layer, with successful dispersion
of nanoparticles. The distribution of nanoparticles is comparatively uniform across the
whole area of the deposited film prepared by spin coating on glass slides.
Improvement of dispersability and distributability of carbon nanoparticles in polyaniline
composites may improve the repeatability of device fabrication when using these
hybrid materials to make gas/vapour sensors. Hence, these additives were selected to
make the hybrid nanocomposite sensors.
3.3.3. X-ray photoelectron spectroscopy
XPS is another method that gives further information about the surface composition of
the samples. Figure 3-12 shows the N 1s core-level spectrum for the emeraldine base
and SSA-doped PANI obtained in the present work. The spectrum of undoped PANI is
deconvoluted into two major component peaks centred at 399.9 ± 0.1 and 398.7 ± 0.1
eV (Figure 3-12-a). The two peaks are assigned to the amine (-N-) and imine (-N=)
structure, respectively. The two major peak components in Figure 3-12-a are of about
the same area, suggesting that equal amounts of quinoid imine and benzoid amine
structure are present in the emeraldine base. This is consistent with the suggested

82
structure for EB (Yue and Epstein, 1991). The slightly lower amount of imine structure
observed is probably associated with the presence of a trace amount of positively
charged nitrogen, as indicated by the residual N 1s high BE tail. This is consistent with
the reports in literature that protonation occurs mainly at the imine units (Tan et al.,
1989). In the protonated polyaniline, the N 1s peak component due to the imine at
398.7 eV should have been shifted to a substantially higher BE (ca. 402 eV).
Figure 3-12-b shows the curve fitted N 1s spectrum of SSA-doped PANI. The imine
peak component has disappeared almost completely and a high-BE shoulder,
attributed to the positively charged nitrogen becomes prominent. There is another
shoulder visible at ca. 405 eV in Figure 3-12-b (shown by red arrow); however the
origin of this rather small peak is not known at this moment. For better discrimination,
the merged XPS N 1s peaks of both samples are shown in Figure 3-12-c. The wide
XPS spectra and the relevant average atomic percentages for the two samples are
shown in Figure 3-13 and Table 3-1, respectively.
The effect of doping can be further investigated by comparing C 1s core-level spectra
of emeraldine base (Figure 3-14-a) and SSA-doped PANI (Figure 3-14-b). The EB film
surface was smoothly fitted into two carbon peaks: aromatic carbon (C-Ar) and carbon
atom with a single bond to nitrogen (C-N) binding energies are very close together and
they are seen as a quasi-single peak at 284.8 ± 0.1 eV, and carbon atom with double
bonds to nitrogen (C=N) at 286 ± 0.1 eV (Figure 3-14-a). The presence of dopant can
be confirmed by the presence of the peak at 289.1 ± 0.2 eV in SSA-doped PANI
corresponding to carboxylic acid functionalities of the dopant, which is absent in the
undoped PANI spectrum. This high tail in the C 1s core level spectrum of doped PANI
(red arrow in Figure 3-14-b) is poorly defined; it has been attributed to the residual
NMP in the film, surface oxidation products, weakly charge-transfer complexed oxygen
on the film, or a shake-up satellite (Lee et al., 2000). The presence of dopant is also
supported by appearance of S 2s and S 2p in wide scan spectra of doped PANI layers
(Figure 3-13).

83
Figure 3-12. XPS N 1s core-level spectra of (a) undoped and (b) SSA-doped PANI layers on silicon wafer. The quinoid and benzoid nitrogen atoms in emeraldine base show peaks at 398.7 and 399.9 eV, respectively. Upon doping, the quinoid type peak is replaced by polaronic N with a corresponding peak at higher BE (around 402 eV). Comparison of doped (red) and undoped (green) N 1s spectra is shown in (c). There is a clear shift in binding energy to higher values when the multifunctional dopant is used to protonate polyaniline imine sites.

84
Figure 3-13. The wide scan XPS of emeraldine base (top) and SSA-doped PANI (bottom).
Table 3-1. Atomic percentage in polyaniline samples extracted from XPS wide scan spectra.
Average atomic percentage (%)
N O C S
Undoped PANI 12.05 7.21 80.74 0
SSA-doped PANI 6.45 37.33 49.69 6.53

85
3.3.4. Thermogravimetric analysis
A series of thermogravimetric analyses were done on polyaniline in its emeraldine base
and doped states, to evaluate the thermal properties. TGA also gives insight into the
effect of dopant on the thermal stability and thermal aging of the conducting polymer.
The thermograms of the three samples: EB, SSA- and SPhA-doped PANI are
compared in Figure 3-15. For clarification, the values of the major mass losses of all
three samples are summarised in Table 3-2. Clearly, EB has superior thermal stability
compared to emeraldine salt. The emeraldine base is stable up to around 300 ºC, while
doped samples undergo major weight losses above 100 ºC. EB shows only one major
weight loss starting from ca. 285 ºC with an inflection point at ca. 450 ºC (Table 3-2),
which can be attributed to structural decomposition of the polymer (Wei and Hsueh,
1989). Doping has a strong influence on the thermal stability of polyaniline (Kulkarni et
al., 1989). The thermogram of the SSA-doped sample demonstrates three stages of
weight loss with peaks at around 60, 260 and 490 ºC. The 2% weight loss at low
temperatures is related to the evaporation of volatiles (such as residual acetone) and
moisture from the sample. The mass reduction at 260 ºC can be assigned to the
decomposition of the dopant or its release from doped polyaniline. Finally, at ca. 490
ºC the polymer structural degradation happens. Similarly, a 1% change in mass is
observed for the SPhA-doped sample indicative of the release of volatiles and
Figure 3-14. C 1s spectra of (a) undoped and (b) SSA-doped PANI after a curve fitting, demonstrating the spectral contribution of different functional groups

86
hydrogen-bonded water molecules. The major loss at 233 ºC is attributed to the
thermal dedoping and dopant removal. However, the total mass loss of the SPhA-
doped PANI at 600 ºC, as well as its weight reduction rate at high temperatures is
lower than other two samples. We suggest that some cross-linking reactions could take
place between the dopant and PANI (and possibly between dopant molecules itself)
during the thermal aging. The absence of low temperature mass loss step for EB
shows that the moisture content in ES form is higher due to the presence of the
hydrophilic dopants (Chen, 2003).
Figure 3-15. TGA graphs of undoped and multifunctional doped PANI powders.
Table 3-2. TGA parameters extracted from the TGA graphs of three polyaniline samples.
Emeraldine
base SSA-doped
PANI SPhA-doped
PANI
1st major stage
Left limit (ºC) - 32.57 33.72
Right limit (ºC) - 98.45 104.56
Inflection point (ºC) - 60.64 68.06
Mass loss (%) - 2.07 0.98
2nd major stage
Left limit (ºC) - 136.71 126.33
Right limit (ºC) - 342.62 244.37
Inflection point (ºC) - 261.24 233.07
Mass loss (%) - 28.90 5.13

87
3rd major stage
Left limit (ºC) 285.33 398.76 324.04
Right limit (ºC) 588.46 588.66 590.06
Inflection point (ºC) 453.48 493.20 500.57
Mass loss (%) 54.83 29.90 23.48
3.3.5. Conductivity of polyaniline films
Figure 3-16 shows current versus applied voltage (I-V) curves for 4 polyaniline
samples. The results are summarised in Table 3-3. The R values are calculated based
on the slope of the fitted lines in Figure 3-16-a to d. The RxW values were then plotted
against the gap size to give the sheet resistance (R□) of the films. The R□ values,
derived from the slope of the fitted lines, together with the corresponding curves are
plotted in Figure 3-17. Moreover, the contact resistance (Rc) can be calculated from the
intercept of the fitted line, for each graph.
Figure 3-16. I-V curves at different gap distances for a) SSA-doped PANI, b) SPhA-doped PANI, c) SSA-doped PANI/coated CB composite, and d) SPhA-doped PANI/coated CB composite. G1=0.2 mm, G2=0.6 mm, G3=1.0 mm, G4=1.4 and G5=1.8 mm are gap sizes of consecutive parallel electrodes. Solid lines are the best linear fit to the data points for each measurement.

88
Table 3-3. Resistance measurements data for 4 samples of doped PANI and hybrid composites.
Samples Gap size (cm) 1/R (Ω-1
)† R (Ω) RxW
‡ (Ω cm)
SSA-doped PANI
0.02 5.79E-7 1.73E+6 6.90E+5
0.06 3.36E-7 2.98E+6 1.19E+6
0.1 2.36E-7 4.23E+6 1.69E+6
0.14 1.80E-7 5.55E+6 2.22E+6
0.18 1.48E-7 6.73E+6 2.69E+6
SPhA-doped PANI
0.02 7.05E-6 1.42E+5 5.67E+4
0.06 3.81E-6 2.62E+5 1.05E+5
0.1 2.69E-6 3.71E+5 1.48E+5
0.14 2.10E-6 4.75E+5 1.90E+5
0.18 1.73E-6 5.79E+5 2.31E+5
SSA-doped PANI/coated CB composite
0.02 7.63E-7 1.31E+6 5.24E+5
0.06 9.14E-7 1.09E+6 4.38E+5
0.1 5.54E-7 1.81E+6 7.22E+5
0.14 4.60E-7 2.17E+6 8.69E+5
0.18 3.59E-7 2.78E+6 1.11E+6
SPhA-doped PANI/coated CB composite
0.02 2.85E-5 3.51E+4 1.40E+4
0.06 1.75E-5 5.71E+4 2.29E+4
0.1 1.28E-5 7.78E+4 3.11E+4
0.14 1.03E-5 9.68E+4 3.87E+4
0.18 8.63E-6 1.16E+5 4.63E+4
†: The inverse of the resistance values are the slope of the fitted line in Figure 3-16.
‡: W, the width of the gold electrodes, is 4 mm in all cases.

89
Figure 3-17. Calculation of sheet resistance (R□) and contact resistance (Rc): a) SSA-doped PANI, b) SPhA-doped PANI, c) SSA-doped PANI/coated CB composite, and d) SPhA-doped PANI/coated CB composite. The R□ is the slope of the RxW vs. G plot. The intercept is equal to 2xWxRc.
The resistivity (ρ) of a thin film is the product of its sheet resistance and thickness (t):
Equation 3-3
AFM was used to measure the average thickness of the layers as shown in
Figure 3-18. The sheet and contact resistance values, as well as resistivity and
conductivity (σ) of the polyaniline layers are reported in Table 3-4. The conductivity of
polyaniline doped with SPhA is higher than that for SSA-doped PANI. This can be
explained by the higher acidity of the sulphonic group in SPhA compared to SSA due
to the resonance stabilisation effect of the benzene ring. This causes stronger
protonation effect on PANI, and hence higher conductivity. Both hybrid composites
show approximately an order of magnitude lower resistivity compared to their pristine
forms. This is evident since carbon particles at this concentration form continuous
pathways throughout the film, facilitating the flow of electrons.

90
Figure 3-18. Examples of thickness measurement using AFM: a) SSA-doped PANI, and b) SPhA-doped PANI/coated CB composite. The thin films on the glass slides were scratched by a scalpel to facilitate the measurement.
Table 3-4. Resistivity and conductivity of polyaniline samples.
Samples Rc (Ω) R□ (Ω) t (cm) ρ (Ω.cm) σ (S cm-1
)
SSA-doped PANI 5.48E+5 1.26E+7 1.66E-5 209.09 4.78E-3
SPhA-doped PANI 4.70E+4 1.09E+6 4.05E-5 43.99 2.27E-2
SSA-doped PANI/coated CB composite
4.14E+5 4.02E+6 4.91E-6 19.73 5.07E-2
SPhA-doped PANI/coated CB composite
1.31E+4 2.01E+5 1.86E-5 3.74 2.67E-1

91
3.3.6. Ammonia sensing results
Sensors made from hybrid composites of doped polyaniline and carbon black were
made on plastic substrates with interdigitated electrodes. Figure 3-19 shows the
response of a dip-coated sensor from the 1 wt.% SSA-doped PANI/coated-CB mixture
on flexible Kapton substrate toward 3 different concentrations of ammonia vapour. The
heater keeps the sensor temperature at 80 °C. The response is recorded as the
transient change in the resistance value of the sensor relative to an initial value (Ri):
Equation 3-4
where R is the resistance of the sensor and Ri is the initial resistance value usually
taken at the beginning of each experiment. The ‘response magnitude’ of each
exposure was calculated based on the relative change in the resistance during the
exposure period:
Equation 3-5
where Rmax is the maximum resistance of the sensor during the exposure period (e.g.,
if the sensor is exposed to ammonia for 5 min, the Rmax will be the resistance value of
the sensor after 5 min, irrespective of the equilibrium being reached or not during that
time), and and Rb is the baseline resistance of the sensor, immediately before starting
the exposure to ammonia. As can be seen, the response is fast, recoverable and
repeatable for all three concentrations. The exposure time is equal in all three cases;
however the recovery time (time needed for the sensor to recover back to its baseline
resistance value) varies with the concentration; as the concentration increases from
340 ppb to 1150 ppb, the recovery time increases from about 10 min to 15 min. The
SPhA-doped polyaniline hybrid sensor did not show a measurable response in the
concentration range studied here even at RT condition, so it was not investigated
further. More work is needed to find the optimum concentration of SPhA dopant in
order to achieve suitable sensing performance.

92
Figure 3-19. Transient response (as defined in Equation 3-4) of a SSA-PANI/coated-CB
dip coated sensor on Kapton toward 340, 550 and 1150 ppb at 80 °C. In all cases
exposure time is 300 sec (5 min), and the sensor has been given enough time to recover to the Rb. An off-set is applied to curves for clarification. The green and red arrows indicate the start and the end point of each exposure, respectively.
To better investigate the sensing performance of our sensor, we compared the
sensing results from the sensor with a commercial MOS ammonia sensor from
Synkera Technologies, Inc. (P/N 705, USA). Sensors were placed in series and
exposed to successive concentrations of ammonia vapour from 425 ppb to 2.25 ppm.
The exposure and recovery times were fixed to 180 and 300 sec, respectively. The
results are shown in Figure 3-20 and Figure 3-21. Obviously, the hybrid sensor
outperforms the commercial MOS sensor in terms of response intensity and sensitivity.
However, the MOS sensor is faster both in terms of response and recovery. Since the
recovery of the hybrid sensor is not complete in 300 sec (recovery period), a significant
baseline drift is observed. This issue can be solved easily by dedicating more time for
recovery to the polymeric sensor, as can be seen in Figure 3-19. Nevertheless, the
power consumption of the hybrid sensor is much lower than the MOS sensor, due to
their significantly lower operating temperature1.
The sensitivity of the hybrid sensors may be increased even more, using spin coating
instead of dip coating as the deposition methods. The response of the sensor operated
1 . Commercial MOS sensors’ minimum operating temperature is 200-300 ºC.

93
at 80 ºC to a series of ammonia concentrations is depicted in Figure 3-22. Figure 3-23
compares the sensitivity of a spin-coated and a dip-coated sensor based on SSA-
doped PANI/coated-CB on PEN substrate, with that of the commercial MOS sensor.
The sensitivity of the spin-coated device is about 2 times that of the dip-coated and
more than 6 times the response of MOS sensor. The higher response magnitude of the
spin coated sensor compared to the dip coated sensor may be explained by the
difference in the kinetics of ammonia sensing. The ammonia vapour is absorbed more
quickly into the thinner layer of polyaniline (spin coated), hence during a specific
exposure time, the relative response will be higher compared to a thicker layer (dip
coated). Moreover, spin coating is known to be a robust method for the fabrication of
repeatable and reproducible thin film sensors.
These figures demonstrate the great potential of these novel materials for use in real-
time ammonia sensing applications. The high sensitivity of these hybrid sensors is
attributed to two sensing mechanisms: (a) dedoping of the emeraldine salt by the basic
ammonia, and (b) disruption of carbon black conductive pathways throughout the
nanocomposite layer, upon absorption of ammonia molecules by the polymer. These
two simultaneous phenomena are believed to act in a synergistic way, decreasing the
electrical conductance of the composite layer (Sotzing et al., 2000; Lonergan et al.,
1996).
It is important to explore the effect of operating temperature and the substrate
material on the response behaviour of the hybrid sensors in exposure to ammonia. A
SSA-doped PANI/coated-CB mixture was dip coated on Kapton and PEN substrates
and the response to 1 ppm ammonia measured vs. time. These effects are depicted in
Figure 3-24. Although the response intensity is higher at RT, it takes hours for the
sensor to recover to its baseline value. Increasing the temperature to 80 °C decreases
the recovery time to minutes, in spite of reduction in the sensitivity. It seems that the
effect of substrate material is not significant in this case. However, when we zoom in
the very beginning of the response curve, a two-step process in response is observed:
an unexpected initial increase in conductivity followed by the expected increase in
resistance. The exact origin of this phenomenon is not known, however it may be due
to the sudden variation in pressure of the sensing chamber or condensation of trace
moisture present in the analyte vapour/carrier flow. Water vapour can be condensed on
the substrate, adsorbed by the polymeric layer, and increase the electrical
conductance either by (a) an increase in charge carrier density of polyaniline or by (b)
mobility enhancement due to the electrolytic properties of water. These two effects
both result in increase of total conductivity according to following equation:

94
Here, σ is the electrical conductivity, which in any system is proportional to the product
of the density of charge carriers (n), the charge carried by each carrier (e) and the
mobility of each carrier (μ); e is the unit electronic charge (1.6 × 10⁻¹⁹ C), ‘n’ is in m−3
and μ is in m2 (V.s)-1 (Bhadra et al., 2009). The extent of resistance reduction in the
initial stage is directly related to the amount of water condensation and hence the
physical properties of the substrate, mainly its hydrophobicity. Important physical
properties of the substrates used in this study have been summarized in Table 3-5.
PEN is known to be less hydrophilic than Kapton so the water condensation on it is
less than Kapton. This may rationalise the higher resistance reduction in the sensor
with Kapton substrate.
Figure 3-20. Ammonia sensing behaviour of hybrid SSA-doped PANI/coated-CB sensor (dip coated on Kapton; blue line) and Synkera’s MOS ammonia sensor (red line). The
hybrid sensor kept at 80 °C with the sub-miniature ceramic heater. Ammonia
concentrations are indicated as bar graphs (black line) for each measurement. Exposure and recovery durations are 3 and 5 min, respectively.

95
Figure 3-21. Comparison of the relative response (as defined in Equation 3-5) between the hybrid SSA-doped PANI/coated-CB sensor (dip coated on Kapton; blue bars) and Synkera’s MOS ammonia sensor (green bars). The hybrid sensor kept at 80 °C with the sub-miniature ceramic heater. The values are the average of five measurements.
Figure 3-22. Response of the spin coated SSA-doped/coated CB hybrid sensor to ammonia in air. The sensor is heated up to 80 ºC.

96
Figure 3-23. Sensitivity enhancement by using spin coating instead of dip coating as the deposition method. The intercept of the fitted lines has been fixed to zero. The error bars correspond to 5 measurements for the dip- and spin-coated devices and 3 repeats for the MOS sensor.
Table 3-5. Some important physical properties of the two substrates used in this study. CTE and CHE are the coefficient of thermal expansion and coefficient of hydroscopic expansion, respectively (Adapted from (Thomas Kinkeldei et al., 2012)).
Physical properties of the plastic substrates used in this study
Kapton PEN
Tg 354 ºC 121 ºC
Tm - 269 ºC
CTE 16 ppm/ ºC 18 ppm/ ºC
Solvent stability ++ ++
Transparency - transparent
CHE 8 ppm/%RH n.a.
Water absorption 1.8 % 0.3 %

97
The sensor performance was tested on-field to monitor water quality in terms of the ammonia concentration in treated water as a function of time. The response was compared to the data from a commercial electrochemical ammonia detector installed in
parallel, and the results are shown in Figure 3-25.
Response, Δ
R/R
i (%
) R
esp
on
se
, Δ
R/R
i (%
)
Figure 3-24. Effect of temperature and substrate material on the transient response of a dip-coated SSA-doped PANI/coated-CB hybrid sensor toward 1 ppm ammonia. The zoom in area (b) shows the very beginning of the response. The exposure time is 3 min.
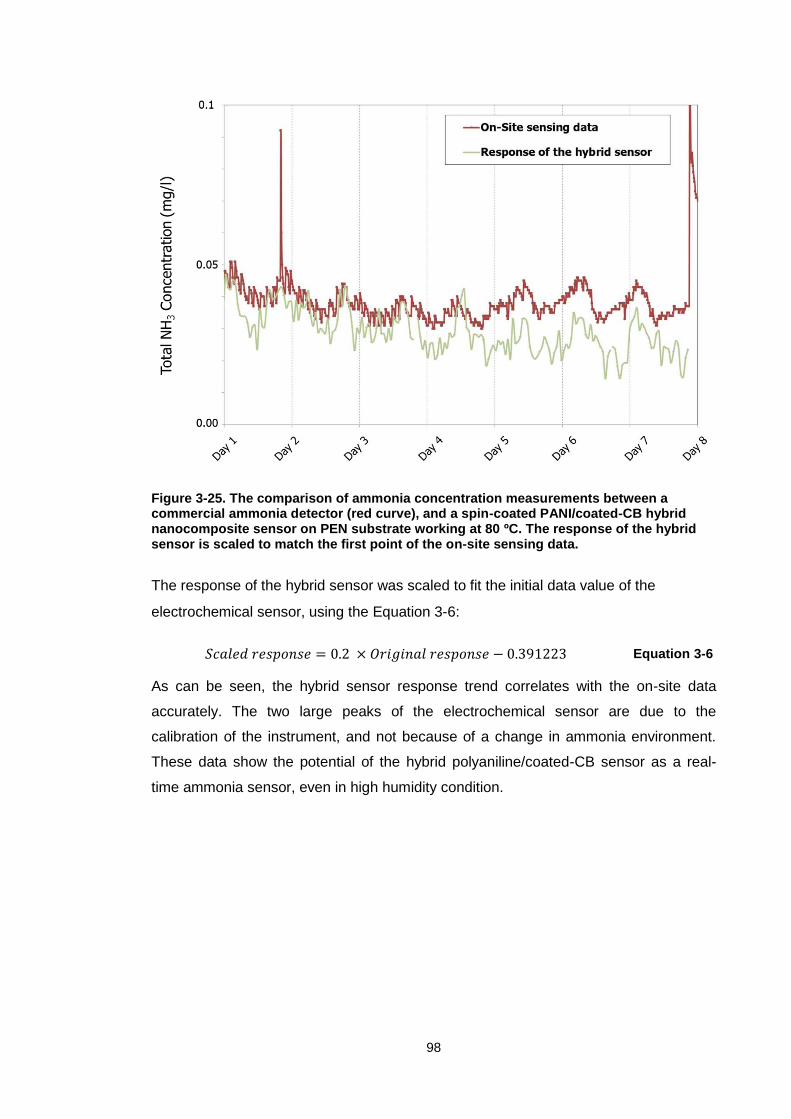
98
Figure 3-25. The comparison of ammonia concentration measurements between a commercial ammonia detector (red curve), and a spin-coated PANI/coated-CB hybrid nanocomposite sensor on PEN substrate working at 80 ºC. The response of the hybrid sensor is scaled to match the first point of the on-site sensing data.
The response of the hybrid sensor was scaled to fit the initial data value of the
electrochemical sensor, using the Equation 3-6:
Equation 3-6
As can be seen, the hybrid sensor response trend correlates with the on-site data
accurately. The two large peaks of the electrochemical sensor are due to the
calibration of the instrument, and not because of a change in ammonia environment.
These data show the potential of the hybrid polyaniline/coated-CB sensor as a real-
time ammonia sensor, even in high humidity condition.

99
3.4. Discussion
Solution-processable conductive polyaniline formulations have been successfully
prepared using ‘counter-ion induced processability’ concept. Two multifunctional
protonating agents, namely sulphosuccinic acid and 4-sulphophthalic acid, were
employed which have two functional group types: a sulphonic acid group which dopes
polyaniline (converting non-conducting emeraldine base to electrically conducting
emeraldine salt) and carboxylic acid groups which interact with the solvent molecules
and make the complex soluble in aprotic solvents such as NMP. Using the same
concept, other multifunctional materials may be synthesised and used to expand the
range of dopants for PANI. For example we expect the same advantages using
sulphosalicylic acid as the doping agent, since it contains both –COOH and –SO3H
substituents. We have demonstrated NMP as a suitable solvent for such doped PANI
structures. However, solvents like DMSO and DMF showed acceptable results, too. In
fact DMSO is more benign than NMP, so it can replace NMP when
environmental/health hazards are of concern. The only problem is that the solubility of
emeraldine base in DMSO is not as good as in NMP. Therefore, the long-term stability
of the solutions will be lower.
According to TGA, emeraldine salt made by these multifunctional dopants can be
heated to about 150 ºC without the risk of thermal dedoping. This is very important
since ammonia sensors based on polyaniline need to be operated at elevated
temperatures for optimum performance. Hence, using multifunctional dopant may
extend the life-time of the sensors.
Hybrid nanocomposites of polyaniline and surface-modified carbon black particles
were made using the aforementioned doped-PANI solutions in NMP. The proposed
core-shell structure of the surface-treated carbon black nanoparticles are believed to
be responsible for their fine dispersion and uniform distribution throughout the
composite. The same method can be adapted for other carbon additives, as well as
metallic and metal oxide nanoparticles. There are several publications demonstrating
improved properties of composites containing nanoparticles wrapped (physically or
chemically) with polyaniline in polymeric matrices (Xu et al., 2012; Zucolotto et al.,
2004).
Hybrid sensors were operated at an elevated temperature to enhance the recovery.
The responses were fast, recoverable and repeatable in the concentration range
studied between about 200 ppb to 2 ppm. The sensing behaviour at higher
concentrations is yet to be investigated in order to understand the real dynamic range
of the sensors. For the FlexSmell application though, the operation in exposure to sub-

100
ppm to several ppm concentration of ammonia vapour is enough. The substrate type
seems to be less effective on response behaviour, compared to temperature. At room
temperature the recovery is very slow and insufficient for real-time sensing. This is of
great concern since the sensor to be used in the FlexSmell needs to work with low
power consumption. One way to solve this problem is to fabricate low-power heaters.
This issue will be addressed in Chapter V.
The response intensity of the sensors was optimised by changing deposition method
from dip coating to spin coating. Spin-coated devices show sensitivity values 6 times
higher than that of a commercial MOS ammonia sensor, while consuming significantly
less power. Inkjet printing can be used to fabricate layers of the hybrid composite with
nanometric thicknesses on the sensing platform. We can then take advantage of the
enhanced performance of the sensor due to decrease in its thickness. We have
demonstrated the printability of SSA-doped PANI in NMP ink using a micro dispenser
(MD-K-130 dispenser head, Microdrop technologies GmbH) (Figure 3-26). However, to
be able to print the hybrid PANI-carbon nanomaterials inks, we need to assess the
long-term stability of the dispersions. Large agglomerations can clog the printer nozzle;
hence filtration of the ink is suggested immediately before use. The pore size of the
filter depends on the ink viscosity and size of the print-head orifice. This has to be
further investigated.
Figure 3-26. Successful printing of a conducting ink: SSA-doped PANi in NMP, using MD-K-130 microdrop dispenser. The polymer concentration was 0.5 wt. %. The printing parameters were adjusted to produce a perfect droplet; a 320 mV pulse was applied to the piezo actuator for 72 µs. The droplet diameter in this image is ~ 80 µm corresponding to droplet volume of ~ 268 picolitres.
A major drawback of using multifunctional dopants such as SSA is the strong acidity
of these materials, as well as the presence of the sulphonyl hydroxide moiety, which
make them highly corrosive and incompatible with some electrode metals and plastic
101
substrates. We have observed that the SSA-doped PANI layer attacks silver
interdigitated electrodes on plastic substrates. The reaction occurs immediately after
deposition, and quickly degrades the electrical conduction at the interface of sensing
layer and IDE. This problem becomes more prominent taking into account the
objectives of the FlexSmell project. In the FlexSmell, the primary goal is to reduce
manufacturing cost and complexity. One approach to achieve these goals is to use low
cost materials (such as silver instead of gold as the electrode, and PET instead of
Kapton as the substrate). Using commercially available silver inks and cheap plastic
foils allows us to exploit high throughput sensor fabrication technologies such as
printing. We will try to address this issue in the next chapters by using alternative
methods of synthesis and deposition of polyaniline sensing layers.
In spite of the aforementioned issues, the good sensing performance of the hybrid
sensors under humid condition shows the great potential of these novel materials for
use in real-time ammonia sensing applications such as air and water quality
monitoring.

102
3.5. References
Athawale, A. A., Bhagwat, S. V. & Katre, P. P. (2006) Nanocomposite of Pd–polyaniline as a selective methanol sensor. Sensors and Actuators B: Chemical, 114(1), 263-267.
Bhadra, S., Khastgir, D., Singha, N. K. & Lee, J. H. (2009) Progress in preparation, processing and applications of polyaniline. Progress in Polymer Science, 34(8), 783-810.
Chabukswar, V. V., Pethkar, S. & Athawale, A. A. (2001) Acrylic acid doped polyaniline as an ammonia sensor. Sensors and Actuators B: Chemical, 77(3), 657-663.
Chen, C.-H. (2003) Thermal and morphological studies of chemically prepared emeraldine-base-form polyaniline powder. Journal of Applied Polymer Science, 89(8), 2142-2148.
Ding, M., Tang, Y., Gou, P., Reber, M. J. & Star, A. (2011) Chemical Sensing with Polyaniline Coated Single-Walled Carbon Nanotubes. Advanced Materials, 23(4), 536-540.
Gong, J., Li, Y., Hu, Z., Zhou, Z. & Deng, Y. (2010) Ultrasensitive NH3 Gas Sensor from Polyaniline Nanograin Enchased TiO2 Fibers. The Journal of Physical Chemistry C, 114(21), 9970-9974.
Grossiord, N., Loos, J., Regev, O. & Koning, C. E. (2006) Toolbox for Dispersing Carbon Nanotubes into Polymers To Get Conductive Nanocomposites. Chemistry of Materials, 18(5), 1089-1099.
Jeon, I.-Y., Tan, L.-S. & Baek, J.-B. (2010) Synthesis and electrical properties of polyaniline/polyaniline grafted multiwalled carbon nanotube mixture via in situ static interfacial polymerization. Journal of Polymer Science Part A: Polymer Chemistry, 48(9), 1962-1972.
Kulkarni, V. G., Campbell, L. D. & Mathew, W. R. (1989) Thermal stability of polyaniline. Synthetic Metals, 30(3), 321-325.
Lee, Y. M., Kim, J. H., Kang, J. S. & Ha, S. Y. (2000) Annealing Effects of Dilute Polyaniline/NMP Solution. Macromolecules, 33(20), 7431-7439.
Lin, Y., Zhou, B., Shiral Fernando, K. A., Liu, P., Allard, L. F. & Sun, Y.-P. (2003) Polymeric Carbon Nanocomposites from Carbon Nanotubes Functionalized with Matrix Polymer. Macromolecules, 36(19), 7199-7204.
Lobotka, P., Kunzo, P., Kovacova, E., Vavra, I., Krizanova, Z., Smatko, V., Stejskal, J., Konyushenko, E. N., Omastova, M., Spitalsky, Z., Micusik, M. & Krupa, I. (2011) Thin polyaniline and polyaniline/carbon nanocomposite films for gas sensing. Thin Solid Films, 519(12), 4123-4127.
Lonergan, M. C., Severin, E. J., Doleman, B. J., Beaber, S. A., Grubb, R. H. & Lewis, N. S. (1996) Array-based vapor sensing using chemically sensitive, carbon black-polymer resistors. Chemistry of Materials, 8(9), 2298-2312.
Lu, J., Park, B. J., Kumar, B., Castro, M., Choi, H. J. & Feller, J.-F. (2010) Polyaniline nanoparticle -carbon nanotube hybrid network vapour sensors with switchable chemo-electrical polarity. Nanotechnology, 21(25), 255501.
Ram, M. K., Yavuz, Ö., Lahsangah, V. & Aldissi, M. (2005) CO gas sensing from ultrathin nano-composite conducting polymer film. Sensors and Actuators B: Chemical, 106(2), 750-757.
Sharma, S., Nirkhe, C., Pethkar, S. & Athawale, A. A. (2002) Chloroform vapour sensor based on copper/polyaniline nanocomposite. Sensors and Actuators B: Chemical, 85(1-2), 131-136.
Sotzing, G. A., Phend, J. N., Grubbs, R. H. & Lewis, N. S. (2000) Highly sensitive detection and discrimination of biogenic amines utilizing arrays of polyaniline/carbon black composite vapor detectors. Chemistry of Materials, 12(3), 3.

103
Tan, K. L., Tan, B. T. G., Kang, E. T. & Neoh, K. G. (1989) X-ray photoelectron spectroscopy studies of the chemical structure of polyaniline. Physical Review B, 39(11), 8070-8073.
Thomas Kinkeldei, Christoph Zysset & Tröster, N. M. G. (2012) Influence of Flexible Substrate Materials on the Performance of Polymer Composite Gas Sensors. In: IMCS 2012, Nuremberg, Germany. 537-540.
Ting, Z., Mubeen, S., Yoo, B., Myung, N. V. & Deshusses, M. A. (2009) A gas nanosensor unaffected by humidity. Nanotechnology, 20(25), 255501.
Torsi, L., Marinelli, F., Angione, M. D., Dell’Aquila, A., Cioffi, N., Giglio, E. D. Sabbatini, L. (2009) Contact effects in organic thin-film transistor sensors. Organic Electronics, 10(2), 233-239.
Tzou, K. & Gregory, R. V. (1993) A method to prepare soluble polyaniline salt solutions- in situ doping of PANI base with organic dopants in polar solvents. Synthetic Metals, 53(3), 365-377.
Wei, Y. & Hsueh, K. F. (1989) Thermal analysis of chemically synthesized polyaniline and effects of thermal aging on conductivity. Journal of Polymer Science Part A: Polymer Chemistry, 27(13), 4351-4363.
Wu, Z., Chen, X., Zhu, S., Zhou, Z., Yao, Y., Quan, W. & Liu, B. (2013) Enhanced sensitivity of ammonia sensor using graphene/polyaniline nanocomposite. Sensors and Actuators B: Chemical, 178(0), 485-493.
Xia, Y., Wiesinger, J. M., MacDiarmid, A. G. & Epstein, A. J. (1995) Camphorsulphonic Acid Fully Doped Polyaniline Emeraldine Salt: Conformations in Different Solvents Studied by an Ultraviolet/Visible/Near-Infrared Spectroscopic Method. Chemistry of Materials, 7(3), 443-445.
Xu, J., Yao, P., Jiang, Z., Liu, H., Li, X., Liu, L., Li, M. & Zheng, Y. (2012) Preparation, morphology, and properties of conducting polyaniline-grafted multiwalled carbon nanotubes/epoxy composites. Journal of Applied Polymer Science, 125(S1), E334-E341.
Yue, J. & Epstein, A. J. (1991) XPS study of self-doped conducting polyaniline and parent systems. Macromolecules, 24(15), 4441-4445.
Zhang, T., Nix, M. B., Yoo, B.-Y., Deshusses, M. A. & Myung, N. V. (2006) Electrochemically Functionalized Single-Walled Carbon Nanotube Gas Sensor. Electroanalysis, 18(12), 1153-1158.
Zhu, W., Miser, D. E., Geoffrey Chan, W. & Hajaligol, M. R. (2004) HRTEM investigation of some commercially available furnace carbon blacks. Carbon, 42(8–9), 1841-1845.
Zucolotto, V., Avlyanov, J., Gregorio, R. & Mattoso, L. H. C. (2004) Melt processing of composites of PVDF and carbon black modified with conducting polymers. Journal of Applied Polymer Science, 94(2), 553-557.

104
CHAPTER IV
4. Vapour-phase deposition polymerisation
4.1. Introduction
As discussed in section 2.5.4, one approach to produce conducting polyaniline layers
is in-situ oxidative polymerisation directly on the substrate. There are several ways to
in-situ polymerise aniline. Electropolymerisation can be used to deposit polyaniline on
conducting surfaces such as metallic electrodes. This method often gives uniform
coatings with high quality. However, it is not suitable for large-scale production and
cannot be used when dealing with non-conducting substrates, which is the case for
chemiresistor platforms. Furthermore, the electrochemical polymerisation of aniline is
often carried out in aqueous electrolytes, and less frequently in organic solvents like
acetonitrile (Gvo denović et al., 2011). The direct contact of the substrate with the
solvents during the polymerisation increases the potential of swelling or degradation of
the substrate by the solvents (Bhattacharyya et al., 2012). Conducting polyaniline
layers on insulating substrates can be obtained by direct chemical polymerisation from
the solvent, dopant and oxidant mixture, but the solvent-substrate incompatibility issue
remains. Moreover, the corrosive nature of the oxidising agents in the solution restricts
the fabrication process to a limited number of chemically-stable substrates. These
difficulties may be overcome by applying the oxidant and monomer separately. For
instance, the oxidant can be applied on the substrate by solvent coating and the coated
surface can be subsequently exposed to monomer vapour in the so-called vapour-
phase deposition polymerisation method (Winther-Jensen et al., 2004).
Chemical vapour deposition of ICPs was first reported in 1986 when PPy thin films
were prepared by exposing pyrrole monomer vapour to ferric chloride vapour under
vacuum condition (Mohammadi et al., 1986). It was later adapted for the formation of

105
high quality thin films of other conjugated polymers such as poly(3,4-
ethylenedioxythiophene) (PEDOT) and PANI (Fabretto et al., 2008; Winther-Jensen
and West, 2004; Lock et al., 2006; Bhattacharyya et al., 2012; Cho et al., 2010b; Kim
et al., 2003; Kim et al., 2007; Gozde et al., 2012). One of the major advantages of this
process is elimination of aggressive solvents associated with solution processing.
Since most of the oxidising agents like APS are water-soluble, one can easily employ
solution-based deposition techniques to coat/pattern the substrate with the precursor
layer. This makes a VDP technique compatible with printing technologies. Importantly,
there is no restriction on the type of substrate that can be used in a VDP process as
opposed to electrochemical polymerisation. Also, in contrast to direct oxidative
polymerisation from solution, the substrate is exposed for a much shorter time to
corrosive chemicals. Therefore, inexpensive plastic substrates and high throughput
fabrication technologies can be used. Another major advantage of this method is
elimination of toxic solvents that are usually used in solution-processable PANI
formulations.
4.1.1. VDP process
Vapour-phase polymerisation closely follows the oxidative polymerisation mechanism
in solution (Bhattacharyya et al., 2012) (Section 2.5.4). As mentioned, VDP is a two-
step process in which an oxidant/dopant mixture is first deposited onto a substrate, and
the coated substrate is exposed to monomer/dopant vapour in an enclosed chamber
(Figure 4-1). The polymerisation can proceed at ambient pressure or under vacuum
condition. The resulting polymer layer is then rinsed with a solvent to remove
unreacted monomers, oxidant and other by-products. The properties of the final film
are strongly dependent on the polymerisation time, temperature, humidity, oxidant
type, precursor layer thickness, monomer flow, presence of additives and the washing
step.
Figure 4-1. Two-step vapour-phase deposition polymerisation using solid-state oxidant and dopant.

106
Various oxidising agents have been employed in VDP of conducting polymers:
Iron(III) chloride (FeCl3) and Iron(III) p-toluenesulphonate (iron(III) tosylate) and APS
are among the major oxidants used for polymerising 3,4-ethylenedioxy thiophene
(EDOT), pyrrole and aniline. The ferric-based oxidants act as both the protonating
agent and the dopant, eliminating the need for external dopant. However, VDP using
APS results in a conducting polymer only when a dopant is present during the
synthesis. For instance, emeraldine salt has been formed using the VDP with APS as
the oxidant and HCl vapour as the dopant (Cho et al., 2010b). The washing step in
VDP method is crucial in a sense that any remained oxidant or monomer in the
polymeric layer may negatively affect the long-term stability of the conducting layer, as
well as its sensing properties. Bromine (Br2) in vapour phase has been demonstrated
as a novel oxidant/dopant for the formation of stable conducting PEDOT. Due to its
volatility, there is no need for post-processing rinsing step to remove excess oxidant
(Chelawat et al., 2010).
In addition to the synthesis of homopolymers, chemical vapour polymerisation
process has been successfully developed to produce copolymers of conjugated
polymers (Jang et al., 2010; Bhattacharyya and Gleason, 2011; Vaddiraju et al., 2008).
This further extends the possibilities of VDP method for making functional layers. Many
applications of ICP thin films often require patterning of layers. Patterned oxidant layers
have been successfully made on flexible PET substrates by an inkjet printer.
Conducting PPy (Cho et al., 2010a; Shin et al., 2012), PEDOT (Choi et al., 2010) and
PANI (Cho et al., 2010b) patterns are then formed when oxidant-coated substrates
were exposed to the monomer/dopant vapour (Figure 4-2).

107
Figure 4-2. Illustration of a patterning example of conducting polyaniline using VDP-mediated inkjet printing. (1) and (2) are the patterned polyaniline on plasma-treated PET (Reproduced from (Cho et al., 2010b)).
4.1.2. Gas sensors made by VDP method
There are a limited number of publications on ICP-based gas sensors made by VDP
method. Stussi and co-workers (Stussi et al., 1996) reported the first VDP conducting
polymer sensor for detecting C2-C4 alcohols in vapour phase by using patterned
poly(3,3ʹ-diphenoxy-2,2ʹ-bithiophene) on glass substrate. The same group performed
another experiment where VDP-made PPy films with different thicknesses, deposited
on alumina substrate were tested against 20,000 ppm toluene vapour. They observed
an 8-fold increase in relative resistive response upon decreasing the film thickness
from 3 µm to 500 nm (Stussi et al., 1997). Conducting polymer-metal nanoparticle
hybrid films were successfully developed using oxidative chemical vapour deposition
(oCVD)1 for selective sensing of acetone and toluene vapours (Vaddiraju and Gleason,
2010). Functionalised conducting copolymer films of EDOT and thiophene-3-acetic
acid (TAA), poly(EDOT-co-TAA), were deposited using oCVD. Carboxylic groups on
the films were then used to covalently attach palladium (Pd) and nickel (Ni)
nanoparticles by means of 4-aminothiophenol conjugated linker molecules. Used as
chemiresistors, detection limits of 10–20 ppm for toluene using Ni particles and 40–50
ppm for acetone using Pd particles were achieved by the hybrid sensors. Composites
of multi-walled carbon nanotubes and polypyrrole were prepared by vapour phase
polymerisation using FeCl3 as the oxidant. The composite sensor showed reversible
room temperature response to a broad range of ammonia vapour concentrations from
1. oCVD, developed by Gleason and co-workers in MIT is fundamentally similar to the VDP technique, the only difference being that the oxidant is also introduced from vapour phase.

108
250-12,500 ppm in N2 (Chen et al., 2007). Kwon et al (Kwon et al., 2012a) have
recently demonstrated the application of the VDP technique to realise ultrasensitive
sensors, based on hydroxylated PEDOT nanotubes on PET substrate. A detection limit
as low as 10 ppt was achieved for dimethyl methylphosphonate (DMMP) as a simulant
for sarin nerve agent. Rapid response times (less than 1 s), fast recovery (in 3−25 s)
and excellent flexibility made the sensor suitable for wearable applications. The same
concept was employed to produce chemiresistors based on conducting PPy nanotubes
on a custom polydimethylsiloxane (PDMS) substrate, capable of detecting ammonia
down to 10 ppb (Kwon et al., 2012b). However the device fabrication process was
rather complicated, requiring dry transfer of the VDP-deposited sensing layer to a
photolithographically patterned PDMS using dry-transfer method, and then depositing
microelectrodes by thermal evaporation on top of the polymeric film.
Here, we have used a two-step VDP technique to synthesise PANI-based sensing
layers in-situ on selected plastic substrates incorporating IDE. Water-soluble polymeric
acids including poly(4-styrenesulphonic acid), poly(acrylic acid) and Nafion® are used
as the dopant with the aim to enhance the thermal stability and film forming properties
(as well as mechanical stability) of the conducting polymer. In this manner, we
eliminate the need for solubilising polyaniline, reducing the environmental risks
associated with hazardous solvents such as NMP. Moreover, highly corrosive dopants
like SSA and SPhA can be replaced by benign polymeric dopants. The VDP process
employed is fully compatible with large scale fabrication methods including printing
technologies.

109
4.2. Materials and methods
4.2.1. Materials
Aniline was distilled using a Kugelrohr ball tube distiller (Büchi) and kept in fridge for
further use. The monomer was used for polymerisation up to 2 months following the
distillation. The oxidising agent used was APS which used as received. Three different
polymeric acids were used as protonating agents in the VDP process: poly(acrylic acid)
(MW ~100,000, 35 wt.% in H2O), poly(4-styrenesulphonic acid) (MW ~75,000, 18 wt.%
in H2O), and Nafion (5 wt.% perfluorinated resin solution in lower aliphatic alcohols and
water). All reagents were purchased from Sigma-Aldrich. The aqueous solutions were
made using ultrahigh purity water purified using a Milli-Q 50 system (Millipore Co.).
Figure 4-3. Three different polymeric acids used as PANI dopant in the VDP process.
4.2.2. PANI sensing layer preparation
The VDP method was developed to make thin polymeric acid-doped PANI sensing
layers on the target substrates. In the case of PAA and PSSA, a 5 wt.% aqueous
solution of each polymer was prepared by dilution from the commercial solution using
Milli-Q water. For Nafion, a 2.5 wt.% solution was prepared by mixing with Milli-Q
water. 60 mg of the oxidising agent, APS, was then added into 1 ml of each solution to
make homogenous mixture of dopant and oxidant (precursor). The substrates were the
same as the ones used in the Chapter III, unless otherwise stated. Substrates were
cleaned by sequential rinsing with acetone, methanol, isopropanol and water, and dried
with N2 flow. The IDE areas of the substrates were spin coated with the precursor
solution at 3000 rpm for 30 sec. Then, the coated substrates were transferred to a
custom-built VDP chamber (Figure 4-4) immediately, where they were exposed to
monomer vapour for 15 min. The reactants container (a 50 ml round-bottom flask) was
heated to 75 ºC during the VDP process using a heating mantel in order to facilitate
aniline evaporation. The optimised reactant contents were found to be 100 and 200 µl

110
of distilled water and aniline, respectively. Nitrogen flow (50 sccm) was used as the
carrier gas to transfer reactant vapours uniformly to the reaction chamber. The VDP
glass chamber was kept under ambient conditions (T~20 ºC). No other adjustment was
done for the VDP process. The resulting doped PANI film was removed from the VDP
chamber after the specified duration, rinsed with distilled water to remove unreacted
monomer, oxidant and excess dopant, and finally dried at 65 °C for 1 hr.
4.2.3. Characterisation
UV-visible spectroscopy and AFM were used to study the doping behaviour and
microstructure of PANI films deposited on cleaned glass substrates, respectively. The
same automatic ammonia vapour generation system in the previous chapter was used
to characterise the sensing behaviour of the sensors in dry air. A custom-built
humidifier was utilised to provide moist air in the system whenever needed. A high
precision potentiostat (EG&G 273A, Princeton Applied Research) was used to record
the current of sensor versus time at a constant applied potential.
Figure 4-4. The homemade vapour-phase deposition polymerisation system used in this study. During polymerisation, the colour of the coated substrates gradually changes to green, indicative of emeraldine salt formation.

111
4.3. Results
We observed that the presence of water vapour is essential in the VDP process.
Without H2O, the synthesis did not result in any conducting PANI. The role of water has
been already highlighted in several papers (Fabretto et al., 2008; Fabretto et al., 2009;
Mueller et al., 2012; Ha et al., 2004; Mohammadi et al., 1986) as an effective proton
scavenger in the polymerisation process of PEDOT and PPy. We believe the same
mechanism is operative for polyaniline, where water deprotonates dimers formed in the
early stages of polymerisation (Section 2.5.4). The stabilised dimers then participate in
polymer chain growth.
Usually, electrically conducting polyaniline is made by protonation of emeraldine
base with low molecular weight acids such as hydrochloric acid. However, the electrical
properties of these materials change abruptly with increasing temperature, due to
evaporation or segregation of the dopant (Nicolas-Debarnot and Poncin-Epaillard,
2003). Using macromolecular polymeric acids to protonate polyaniline can enhance the
heat stability and life-time of the layer (Lu et al., 2003). Here, PAA, PSSA and Nafion
are used in the VDP precursor solution to produce polymeric-doped conducting
polymer thin films with good uniformity and high stability.
4.3.1. PAA-doped PANI
UV-Vis transmittance spectrum (Figure 4-5) of a vapour-phase polymerised PAA-
doped PANI layer on glass clearly shows characteristic peaks of doped PANI structure:
the peak at ca. 435 nm is due to the presence of localised semiquinone population or
the polaron absorption (equivalent to: polaron band to π* transition). The peak at ca.
810 nm is due to the trapped excitons centred on quinoid (imine) (equivalent to: π- to
polaron band transition) (Tzou and Gregory, 1993; Xia et al., 1995).

112
Sensing area of the Kapton substrate with gold IDE (20 µm gap) was coated with a
PAA-doped PANI layer. The conducting layer’s surface was characterised by AFM
(Figure 4-6). The layer is highly porous with pore diameter around 500 nm. The pores
are believed to form during polymerisation where the APS molecules react with the
aniline monomer. Assuming there is no dopant involved, the reaction between aniline
and ammonium peroxydisulphate may proceed as follows (Sapurina and Shishov,
2012):
The by-products (sulphates, sulphites and acids) as well as unreacted compounds are
then washed away during the rinsing step, leaving behind semi-spherical pores. The
homogeneity of the pore size and distribution is therefore highly dependent on the
uniformity of the oxidant in the precursor layer. The same concept applies to other
sensing layers made by this method of film fabrication.
Figure 4-5. UV-Vis transmittance spectrum of PAA-doped PANI layer fabricated by VDP on glass substrate.
140
250

113
Figure 4-6. Left: the sensor substrate before and after vapour-phase deposition polymerisation of PAA-doped PANI layer. Right: AFM images of the sensing layer (the scale bar in inset is 500 nm).
The room temperature response of the sensor towards ammonia vapour in dry air is
shown in Figure 4-7. Here, the response is presented as the ‘absolute change’ in
electrical current passing through the sensor at a constant potential over time. The
response definition is the same as in Equation 3-4, only the resistance values are
replaced by current values (i.e., the response is shown as |(ΔI/Ii)| x 100% = |((I-Ii)/Ii)|x
100%, where I is the current and Ii is the initial value of current. Likewise, the relative
response of the sensor is defined as |(ΔImax/Ib)| x 100%, where Imax and Ib are the
current value at the end of the exposure period and current value immediately before
exposure, respectively. The sensor shows a sensitive and fast response, however the
recovery at room temperature is not complete in the course of this experiment (900 sec
for recovery) especially at the start of the exposure. However, after continuous test for
several hours, the response recovers back to baseline completely, giving enough time
for sensor regeneration. The relative response is linear in the range of 350 ppb to 3.0
ppm with the RT sensitivity equal to 0.734 % ppm-1 (Figure 4-8).

114
Figure 4-7. RT response of the PAA-doped PANI sensor to various concentrations of ammonia vapour in synthetic dry air. The exposure and recovery times are 5 and 15 min, respectively. Ii is the initial value of the current passing through the sensor at time=0.
Figure 4-8. Calibration curve of the PAA-doped PANI sensor response under RT conditions. Imax-Ib represents the maximum change in sensor current during the exposure (5 min) to each concentration. The reported values and error bars correspond to the average values over 3 repeats of each measurement.
4.3.2. PSSA-doped PANI
PSSA has been previously used in conducting polymer formulations, due to its high
thermal stability, good proton conduction and water-solubility. PEDOT:PSS is a well-
known example, which is commercialised under the name of CleviosTM (Heraeus,

115
Germany), and it is available in the form of aqueous dispersions. Here, we have
investigated the use of PSSA as the counter-ion in the PANI sensing layer deposited
by the VDP on Upilex® substrates incorporating gold IDE (20 µm gap). The sensor
was stabilised in dry air for 1800 sec (Figure 4-9), and then heated to ~80 ºC using the
sub-miniature ceramic heater (Figure 4-10). The air flow dries the sensor, decreasing
its current following a simple power law equation. The enhancement of the conductivity
by the sorption of water molecules at room temperature is a well-known phenomenon
(Angelopoulos et al., 1987; Matsuguchi et al., 2003; Javadi et al., 1988), which can be
explained based on the presence of “metallic islands” surrounded by an insulating
matrix in the emeraldine salt structure (Angelopoulos et al., 1987). The absorption of
water into the sensing layer greatly decreases the interparticle resistance between the
metallic grains where H2O molecules act as carriers to transfer charge from one chain
to another through a proton exchange mechanism. The hygroscopic nature of the
polymeric dopant plays an important role in this behaviour, since water molecules can
form hydrogen bonds with the dopant chains and PANI backbone itself (Matsuguchi et
al., 2003). Therefore, desorption of water molecules forced by dry air flow causes a
significant drop in conductivity.
Increasing temperature facilitates the charge mobility in the conducting polymer,
enhancing its conductivity. However, the variation in current by heating follows a much
more complex equation (Sakkopoulos et al., 1998) mainly due to the combination of
several phenomena involved in the process, including change in ICP’s grain si e,
proton conductivity of the dopant, water evaporation, structural aging of both polymers,
etc. The exact physical description of the fitted equations is yet to be determined.

116
Figure 4-9. The sensor was dried under dry air flow (100 sccm). The red line shows the fitted line to data. I is current in µA and t is time in sec.
Figure 4-10. The thermal aging of the sensor at 80 ºC. The red line represents the fitted line to the data. I is current in µA and t is time in sec.
In order to assess ammonia sensing performance of the sensors, a sequential
ammonia exposure test was designed and run by computer. Figure 4-11 shows the raw
response (transient current change) of the sensor to four cycles of successive
ammonia concentrations. Each cycle comprises of nine concentrations from 175 ppb to
1.75 ppm in dry air , and takes 12000 seconds to be completed. The sensor was kept

117
at ~80 ºC with an external heater as described before. The response is sensitive and
fast, however the recovery is not complete in 15 min and a baseline drift is observed.
Figure 4-11. The transient variation in current of the PSSA-doped PANI sensor (raw response) in exposure to ammonia at 80 ºC. The sensor is exposed to nine successive concentrations of ammonia, and this process is repeated 4 times.. The 2
nd measurement
cycle is marked by an orange square for clarification; the x-axis of this marked square has been magnified on the top x-axis; the corresponding concentration profile of each cycle is indicated on the right y-axis, showing ammonia concentrations from 175 ppb to 1.75 ppm in dry air. The applied potential was kept constant at 100 mV. The exposure and recovery durations were 5 and 15 min, respectively for each exposure. (The initial resistance value of the sensor is about 330 kΩ.)
The effect of humidity as a major interfering compound on electrical conductivity and
ammonia sensing properties of polymeric acid-doped PANI has to be investigated in
order to develop a reliable sensor. The sensor was exposed to humid air with different
absolute humidity (AH) levels of 1000 to 3000 mg m-3. The sequential response at
AH=3000 mg m-3 is demonstrated in Figure 4-12. Similar to the Figure 4-11, the
concentration range in each measurement cycle is from 175 ppb to 1.75 ppm; here, the
measurement is repeated 5 times. The sensor is responsive even under humid
conditiona. Interestingly, although a baseline drift is observed after repeating
exposures, the sensor can be fully regenerated by exposure to clean air for longer
periods.

118
Figure 4-12. The raw response of the PSSA-doped PANI sensor in 5 cycles of exposure to a series of ammonia concentrations from 175 ppb to 1.75 ppm in humid air (AH=3000 mg m
-3). Similar to previous figure, the 3
rd repeat cycle is marked by an orange square for
clarification; the x-axis of this orange square is magnified and shown on the top x-axis. The sensor was heated to around 80 ºC to enhance the recovery. The applied potential was kept constant at 100 mV. The exposure and recovery durations were 5 and 15 min, respectively for each exposure. (The initial resistance value of the sensor is about 42 kΩ.)
The initial electrical resistance of the sensor decreased with increase in the humidity
level, from ~330 kΩ in dry air to 42 kΩ in 3000 mg m-3 absolute humidity. Although
humidity enhances the conductivity of the layer, it negatively affects the sensing
properties. The response magnitude, (Imax-Ib)/Ib %, and sensitivity decrease with the
humidity rise (Figure 4-13). The response behaviour at this condition can be described
based on competitive sorption of NH3 and H2O molecules. During exposure to
ammonia, the NH3 molecules are able to displace weakly-sorbed H2O molecules,
directly interact with the polyaniline and deprotonate it. However, due to the opposite
effects of water vapour and ammonia on the conductivity, the overall sensitivity
remains lower in humid air compared to dry air (Matsuguchi et al., 2003). The change
in humidity from 1000 to 3000 mg m-3 did not alter the response significantly. The error

119
bars, representing the standard deviation of data, demonstrate the acceptable
repeatability of the sensor operating under dry and humid conditions.
Figure 4-13. Effect of AH on the relative response of the PSSA-doped PANI after a 3-min exposure to ammonia vapour at ~80 ºC.
4.3.3. Nafion-doped PANI
Nafion, a perfluorosulphonic acid polymer with PTFE backbone was selected as PANI
dopant due to its well-known thermal and chemical stability (Mauritz and Moore, 2004;
Barthet and Guglielmi, 1996). However, the Nafion-doped PANI composites have been
merely used in fuel cell applications (Tan and Belanger, 2005). Here, we take
advantage of the unique properties of Nafion to prepare room temperature polyaniline-
based ammonia sensor. Due to improved properties of the polyacid in the presence of
water molecules, we expect enhanced sensing properties in humid condition. The
response of the sensor to air at different absolute humidity is compared in Figure 4-14.
As described earlier, water vapour increases the current of doped PANI. The highly
hygroscopic nature of Nafion facilitates the absorption of H2O molecules inside the
sensing layer. The response is non-linear, and starts to level off at low humidity.

120
Figure 4-14. Humidity sensing behaviour of the Nafion-doped PANI sensor at RT. The inset shows the response magnitude.
It is crucial to investigate the effect of humidity on the ammonia sensing properties of
the sensor. The Figure 4-15 and Figure 4-16 demonstrate the good sensing
performance of the sensor toward low concentrations of ammonia in 5000 and 8000
mg m-3 absolute humidity, respectively. Both the response and recovery are fast at
room temperature. In contrast to PSSA-doped sensors, the presence of water
increases both the response magnitude and sensitivity Figure 4-17. The difference may
be attributed to the different microstructure of the two composite films. Cluster
networks are suggested to form in the hydrated Nafion (Mauritz and Moore, 2004).
These nano-channels can absorb and hold water molecules. The water molecules, pre-
sorbed in the sensing layer, result in an increase in conductivity. After introducing
ammonia, NH3 molecules not only interact with polyaniline, but also react with water in
the cluster networks and produce ammonium hydroxide:
Equation 4-1
consequently, produced hydroxide ions further deprotonate PANI and increase its
resistance. The higher Rb in dry air may attribute to its lower relative response.
However, there is a limit to this enhancement in response: increasing the humidity from
8000 to 15000 mg m-3 did not change the relative response significantly.

121
Figure 4-15. Ammonia sensing RT transient response of the Nafion-doped PANI sensor at AH=5000 mg m
-3. The sensor exposed to each concentration until it reaches equilibrium,
and then left in clean air for complete recovery.
Figure 4-16. Ammonia sensing RT transient response of the Nafion-doped PANI sensor at AH=8000 mg m
-3. The sensor exposed to each concentration until it reaches equilibrium,
and then left in clean air for complete recovery.

122
Figure 4-17. Effect of absolute humidity on the response magnitude and sensitivity of
Nafion-doped PANI sensor.
Repeatability of the sensor was examined by exposing it repeatedly to 1.0 ppm
ammonia vapour in dry and humid air over a long period. As can be seen from
Figure 4-18, both sensors show recoverable and repeatable behaviour. In fact, the
sensor working in humid condition outperforms the one in dry air: the average
response magnitude in humid air is about two times that in dry air. The standard
deviations were calculated to be 0.65 and 1.56 in dry and humid air, respectively. The
improved performance of the Nafion-doped PANI in high humid environment, together
with room temperature response of this material, makes it very suitable for the
FlexSmell application where the sensor has to operate inside food packaging with very
high humidity. Another important feature of the sensor is cross-sensitivity to other
VOCs. To assess the cross-sensitivity, the change in current of the sensor in exposure
to variety of VOCs in dry air was measured (Figure 4-19). The concentrations of all
analytes were kept in the range of 1 to 5 ppth and the relative changes in the current
were compared to that for 2.83 ppth ammonia vapour. The sensor showed only a slight
increase in current in exposure to high concentrations of chloroform, acetone, n-
butylacetate, ethanol and methanol, while the response to ammonia in comparable
concentrations was significantly higher and in the opposite direction. This results show
the high selectivity of the sensor to ammonia.

123
Figure 4-18. Repeatability test of the Nafion doped-PANI sensor to 1.0 ppm ammonia is shown. The sensor at humid environment works better. The exposure and recovery duration were 1500 and 3000 sec, respectively. An offset in y-axis has been applied to the data for clarification.
Figure 4-19. Cross-sensitivity test for Nafion-doped PANI sensor toward ammonia and
several VOCs in ppth concentration range.

124
4.3.4. Bio-immobilisation
Using polymeric dopants in the polyaniline can add functionality to the sensing layer.
For instance, the carboxylic acid group on the backbone of PAA can be easily activated
using standard carbodiimide chemistry (Fischer, 2010). We have demonstrated the use
of EDC-NHS1 coupling agent to immobilise biomolecules on the surface of a PAA-
doped polyaniline layer, as proof of concept (Figure 4-20).
Figure 4-20. The proposed mechanism for immobilisation of a biomolecule (shown by blue circles) on a PAA-doped PANI (shown by green colour) using EDC-NHS coupling
agent.
Here, we used recombinant Green Fluorescent Protein (GFP)2 as a model for
biomolecules in the immobilisation process. The GFP is visible under fluorescence
microscope, so the successful immobilisation can be easily tracked and confirmed. A
glass microscope slide was coated with a PAA-doped PANI by VDP method as
described previously. The carboxylic groups on the surface were activated by
immersion the layer in EDC-NHS solution for 5 hr at RT. The substrate was then
removed from the solution and immediately immersed in a buffer (acetic acid, pH=4.4)
containing GFP, and kept overnight. Finally, the substrate was rinsed with pure water
and dried under nitrogen. An unactivated PAA-doped PANI sample was used as the
control. Figure 4-21 shows the result of the immobilisation as observed by fluorescence
microscopy3 and AFM.
1. EDC: 1-ethyl-3-(3-dimethylaminopropyl) carbodiimide, and NHS: n-hydroxysuccinimide. 2. GFPs, isolated from the jellyfish Aequorea victoria, were expressed and purified in house. 3. The fluorescence images were obtained using an Olympus BH2-UMA vertical illuminator.

125
Figure 4-21. The immobilisation of GFP on PAA-doped PANI layer. Top left: the optical image of the control sample under fluorescence microscope, top right and bottom left: the fluorescence microscopy images of the immobilised GFP on the surface in two difference magnifications, bottom right: AFM image of immobilised GFP showing the protein aggregates.
Clearly, the GFPs are present on the surface as aggregates with several microns in
diameter, instead of single particles. The exact explanation for this phenomenon is yet
to be determined. However, the immobilisation parameters such as the buffer type and
pH, concentration of GFP, submersion duration and temperature, and the EDC-NHS
composition can be optimised in order to achieve better results. GFP can be simply
replaced by other biomolecules such as enzymes, antibodies, receptor proteins, etc. to
fabricate biosensors based on polyaniline with a diverse range of specificity toward
target analytes. The research is ongoing.

126
4.4. Discussion
We proposed vapour phase deposition polymerisation for making ammonia sensors on
plastic substrates, because this method offers several advantages over other methods
of polyaniline thin film fabrication. As opposed to conventional in-situ polymerisation
methods (e.g., electropolymerisation), low-cost plastic foils can be used as the
substrate in the VDP. Moreover, polymeric acids can be exploited as the doping agent.
Polymeric acids are less aggressive than strong multifunctional acids often used to
solubilise PANI in aprotic solvents. This expands the choice of electrode material for
the sensor (e.g., less expensive metals like Ag can be used). The possibility of using
silver as electrode, greatly simplifies the IDE fabrication process since silver inks are
commercially available and their printing process is well-established. As shown before,
the VDP process can be performed in ambient condition and there is no need for
complex, expensive high vacuum equipment. Although the sensors here are all made
in a batch process, there are publications that demonstrate the feasibility of a
continuous VDP process as proof of concept (Najar et al., 2007; Xu et al., 1995).
These characteristics make the VDP method fully compatible with low-cost, large scale
sensor fabrication on plastic foils.
The VDP has already been used to make gas/vapour sensors, however to our
knowledge; this is the first report on ammonia sensors based on vapour-polymerised
polyaniline incorporating polymeric dopants. We have shown that polymerisation can
be carried out in the presence of various polyanions including PAA, PSSA and Nafion
as the doping agents. In spite of difference in their chemistry, all sensors detected
ammonia vapour in sub-ppm range. In fact, we observed different sensing properties
by changing the dopant material. The most sensitive sensing layer was the one doped
with PSSA, with response magnitude (ΔImax/Ib) of ~20 % in exposure to 1.0 ppm
ammonia in dry air. However, the sensor had to be operated at elevated temperatures
(~80 ºC) for complete recovery. Using Nafion led to a sensor with faster response and
recovery at room temperature, although the response magnitude was much lower than
PSSA-doped PANI sensors. The presence of water vapour diminished the sensing
performance of the PSSA-based sensor, while it had a positive effect on the Nafion-
based sensor. The enhancement in the response of Nafion-doped PANI sensor to
ammonia under humid condition may be attributed to the microstructure of the
perfluorinated polymer. When hydrated, the sulphonic acid functional groups on the
backbone of Nafion are believed to self-organise into nanometric hydrophilic channels
(cylinders with diameter of ~2.4 nm) (Schmidt-Rohr and Chen, 2008). The interaction of
ammonia and the pre-sorbed water molecules inside these channels produce

127
hydroxide moieties which accelerate deprotonation of polyaniline and increase the
electrical resistance of the sensing layer. This property is of great significance in the
FlexSmell applications, where the sensor may be exposed to high humid
environments. In spite of its interesting ammonia sensing behaviour, working with
Nafion was not easy! The Nafion solution is very expensive compared to PAA and
PSSA solutions. The solution mainly consists of alcohols which are non-solvent for
APS. Thus, we faced some difficulties making homogeneous solutions of APS in
Nafion precursor. Although, these difficulties can be suppressed by adding water as
diluent to the solution or using alcohol-soluble oxidants, the final microstructure of dried
deposited layer is difficult to be controlled due to crystallisation of Nafion during spin
coating. This adversely affects the reproducibility of sensing layers based on Nafion-
doped polyaniline. PAA-based sensors showed the lowest sensitivity in exposure to
ammonia compared to that of PSSA- and Nafion-doped layers. However, the use of
poly(acrylic acid) is of great interest for functionalisation of the sensing layer especially
with biomolecules, in order to realise biosensors with improved specificity toward target
analytes.
Finally, the VDP method described here can be applied to other conjugated
monomers such as pyrrole and thiophene, in order to produce ICP-based sensors with
specificity toward various analytes. The choice of dopant material and oxidising agent
can significantly affect the final properties of the sensor.

128
4.5. References
Angelopoulos, M., Ray, A., Macdiarmid, A. G. & Epstein, A. J. (1987) Polyaniline: Processability from aqueous solutions and effect of water vapor on conductivity. Synthetic Metals, 21(1–3), 21-30.
Barthet, C. & Guglielmi, M. (1996) Aspects of the conducting properties of Nafion doped polyaniline. Electrochimica Acta, 41(18), 2791-2798.
Bhattacharyya, D. & Gleason, K. K. (2011) Single-Step Oxidative Chemical Vapor Deposition of −COOH Functional Conducting Copolymer and Immobili ation of Biomolecule for Sensor Application. Chemistry of Materials, 23(10), 2600-2605.
Bhattacharyya, D., Howden, R. M., Borrelli, D. C. & Gleason, K. K. (2012) Vapor phase oxidative synthesis of conjugated polymers and applications. Journal of Polymer Science Part B: Polymer Physics, 50(19), 1329-1351.
Chelawat, H., Vaddiraju, S. & Gleason, K. (2010) Conformal, Conducting Poly(3,4-ethylenedioxythiophene) Thin Films Deposited Using Bromine as the Oxidant in a Completely Dry Oxidative Chemical Vapor Deposition Process. Chemistry of Materials, 22(9), 2864-2868.
Chen, Y.-s., Li, Y., Wang, H.-c. & Yang, M.-j. (2007) Gas sensitivity of a composite of multi-walled carbon nanotubes and polypyrrole prepared by vapor phase polymerization. Carbon, 45(2), 357-363.
Cho, J., Shin, K.-H. & Jang, J. (2010a) Micropatterning of conducting polymer tracks on plasma treated flexible substrate using vapor phase polymerization-mediated inkjet printing. Synthetic Metals, 160(9–10), 1119-1125.
Cho, J., Shin, K.-H. & Jang, J. (2010b) Polyaniline micropattern onto flexible substrate by vapor deposition polymerization-mediated inkjet printing. Thin Solid Films, 518(18), 5066-5070.
Choi, J. S., Cho, K. Y. & Yim, J.-H. (2010) Micro-patterning of vapor-phase polymerized poly(3,4-ethylenedioxythiophene) (PEDOT) using ink-jet printing/soft lithography. European Polymer Journal, 46(3), 389-396.
Fabretto, M., Zuber, K., Hall, C. & Murphy, P. (2008) High Conductivity PEDOT Using Humidity Facilitated Vacuum Vapour Phase Polymerisation. Macromolecular Rapid Communications, 29(16), 1403-1409.
Fabretto, M., Zuber, K., Hall, C., Murphy, P. & Griesser, H. J. (2009) The role of water in the synthesis and performance of vapour phase polymerised PEDOT electrochromic devices. Journal of Materials Chemistry, 19(42), 7871-7878.
Fischer, M. E. (2010) Amine Coupling Through EDC/NHS: A Practical Approach. In: Mol, N. J. & Fischer, M. J. E. (eds.) Surface Plasmon Resonance. Humana Press.
Ozaydin-Ince, G., Coclite, A. M., Gleason, K. K. (2012) CVD of polymeric thin films: applications in sensors, biotechnology, microelectronics/organic electronics, microfluidics, MEMS, composites and membranes. Reports on Progress in Physics, 75(1), 016501.
Gvo denović, M. M., ugović, B. ., Stevanović, . S., Tri ović, T. L. Grgur, B. N. (2011) Electrochemical Polymerization of Aniline. In: Schab-Balcerzak, D. E. (ed.) Electropolymerization. InTech.
Ha, Y. H., Nikolov, N., Pollack, S. K., Mastrangelo, J., Martin, B. D. & Shashidhar, R. (2004) Towards a Transparent, Highly Conductive Poly(3,4-ethylenedioxythiophene). Advanced Functional Materials, 14(6), 615-622.
Jang, K.-S., Kim, D. O., Lee, J.-H., Hong, S.-C., Lee, T.-W., Lee, Y. & Nam, J.-D. (2010) Synchronous vapor-phase polymerization of poly(3,4-ethylenedioxythiophene) and poly(3-hexylthiophene) copolymer systems for tunable optoelectronic properties. Organic Electronics, 11(10), 1668-1675.

129
Javadi, H. H. S., Angelopoulos, M., MacDiarmid, A. G. & Epstein, A. J. (1988) Conduction mechanism of polyaniline: Effect of moisture. Synthetic Metals, 26(1), 1-8.
Kim, J.-Y., Lee, J.-H. & Kwon, S.-J. (2007) The manufacture and properties of polyaniline nano-films prepared through vapor-phase polymerization. Synthetic Metals, 157(8–9), 336-342.
Kim, J., Kim, E., Won, Y., Lee, H. & Suh, K. (2003) The preparation and characteristics of conductive poly(3,4-ethylenedioxythiophene) thin film by vapor-phase polymerization. Synthetic Metals, 139(2), 485-489.
Kwon, O. S., Park, S. J., Lee, J. S., Park, E., Kim, T., Park, H.-W., You, S. A., Yoon, H. & Jang, J. (2012a) Multidimensional Conducting Polymer Nanotubes for Ultrasensitive Chemical Nerve Agent Sensing. Nano Letters, 12(6), 2797-2802.
Kwon, O. S., Park, S. J., Yoon, H. & Jang, J. (2012b) Highly sensitive and selective chemiresistive sensors based on multidimensional polypyrrole nanotubes. Chemical Communications, 48(85), 10526-10528.
Lock, J. P., Im, S. G. & Gleason, K. K. (2006) Oxidative Chemical Vapor Deposition of Electrically Conducting Poly(3,4-ethylenedioxythiophene) Films. Macromolecules, 39(16), 5326-5329.
Lu, X., Tan, C. Y., Xu, J. & He, C. (2003) Thermal degradation of electrical conductivity of polyacrylic acid doped polyaniline: effect of molecular weight of the dopants. Synthetic Metals, 138(3), 429-440.
Matsuguchi, M., Okamoto, A. & Sakai, Y. (2003) Effect of humidity on NH3 gas sensitivity of polyaniline blend films. Sensors and Actuators B: Chemical, 94(1), 46-52.
Mauritz, K. A. & Moore, R. B. (2004) State of Understanding of Nafion. Chemical Reviews, 104(10), 4535-4586.
Mohammadi, A., Hasan, M. A., Liedberg, B., Lundstrom, I. & Salaneck, W. R. (1986) Chemical vapour deposition (CVD) of conducting polymers: Polypyrrole. Synthetic Metals, 14(3), 189-197.
Mueller, M., Fabretto, M., Evans, D., Hojati-Talemi, P., Gruber, C. & Murphy, P. (2012) Vacuum vapour phase polymerization of high conductivity PEDOT: Role of PEG-PPG-PEG, the origin of water, and choice of oxidant. Polymer, 53(11), 2146-2151.
Najar, S. S., Kaynak, A. & Foitzik, R. C. (2007) Conductive wool yarns by continuous vapour phase polymerization of pyrrole. Synthetic Metals, 157(1), 1-4.
Nicolas-Debarnot, D. & Poncin-Epaillard, F. (2003) Polyaniline as a new sensitive layer for gas sensors. Analytica Chimica Acta, 475(1–2), 1-15.
Sakkopoulos, S., Vitoratos, E. & Dalas, E. (1998) Conductivity degradation due to thermal aging in conducting polyaniline and polypyrrole. Synthetic Metals, 92(1), 63-67.
Sapurina, I. Y. & Shishov, M. A. (2012) Oxidative Polymerization of Aniline: Molecular Synthesis of Polyaniline and the Formation of Supramolecular Structures. In: Gomes, D. A. D. S. (ed.) New Polymers for Special Applications. InTech.
Schmidt-Rohr, K. & Chen, Q. (2008) Parallel cylindrical water nanochannels in Nafion fuel-cell membranes. Nature Materials, 7(1), 75-83.
Shin, K.-H., Cho, J., Jang, J., Jang, H. S., Park, E. S., Song, K. & Kim, S. H. (2012) Polypyrrole top-contact electrodes patterned by inkjet printing assisted vapor deposition polymerization in flexible organic thin-film transistors. Organic Electronics, 13(5), 715-720.
Stussi, E., Cella, S., Serra, G. & Venier, G. S. (1996) Fabrication of conducting polymer patterns for gas sensing by a dry technique. Materials Science and Engineering: C, 4(1), 27-33.
Stussi, E., Stella, R. & De Rossi, D. (1997) Chemoresistive conducting polymer-based odour sensors: influence of thickness changes on their sensing properties. Sensors and Actuators B: Chemical, 43(1–3), 180-185.

130
Tan, S. & Belanger, D. (2005) Characterization and Transport Properties of Nafion/Polyaniline Composite Membranes. The Journal of Physical Chemistry B, 109(49), 23480-23490.
Tzou, K. & Gregory, R. V. (1993) A method to prepare soluble polyaniline salt solutions- in situ doping of PANI base with organic dopants in polar solvents. Synthetic Metals, 53(3), 365-377.
Vaddiraju, S. & Gleason, K. K. (2010) Selective sensing of volatile organic compounds using novel conducting polymer–metal nanoparticle hybrids. Nanotechnology, 21(12), 125503.
Vaddiraju, S., Seneca, K. & Gleason, K. K. (2008) Novel Strategies for the Deposition of COOH Functionalized Conducting Copolymer Films and the Assembly of Inorganic Nanoparticles on Conducting Polymer Platforms. Advanced Functional Materials, 18(13), 1929-1938.
Winther-Jensen, B., Chen, J., West, K. & Wallace, G. (2004) Vapor Phase Polymerization of Pyrrole and Thiophene Using Iron(III) Sulphonates as Oxidizing Agents. Macromolecules, 37(16), 5930-5935.
Winther-Jensen, B. & West, K. (2004) Vapor-Phase Polymerization of 3,4-Ethylenedioxythiophene: A Route to Highly Conducting Polymer Surface Layers. Macromolecules, 37(12), 4538-4543.
Xia, Y., Wiesinger, J. M., MacDiarmid, A. G. & Epstein, A. J. (1995) Camphorsulphonic Acid Fully Doped Polyaniline Emeraldine Salt: Conformations in Different Solvents Studied by an Ultraviolet/Visible/Near-Infrared Spectroscopic Method. Chemistry of Materials, 7(3), 443-445.
Xu, C., Wang, P. & Bi, X. (1995) Continuous vapor phase polymerization of pyrrole. I. Electrically conductive composite fiber of polypyrrole with poly(p-phenylene terephthalamide). Journal of Applied Polymer Science, 58(12), 2155-2159.

131
CHAPTER V
5. Polyaniline Ammonia Sensors on Printed Polymeric Hotplates
5.1. Introduction
Low cost integrated-on-plastic chemiresistor devices for chemical sensing require the
development of novel materials suitable for low cost deposition technologies such as
inkjet printing (Briand et al., 2011; Claramunt et al., 2013). Here, we report the
development of printed µ-hotplates on inexpensive PEN polymeric substrate for
resistive detection of very low concentrations of ammonia in sub-ppm range. This work
has been done in collaboration with one of our FlexSmell partners, IMT (EPFL,
Switzerland), and a research group from FEMTO-ST institute (France). The exact
contribution of each partner to this research is given in the experimental section in
details.
For fabrication of inexpensive chemiresistors, intrinsically conducting polymers such
as PPy and PANI as well as their derivatives are attractive due to their high sensitivity,
ease of synthesis and ability to act as chemical vapour sensors under ambient
conditions (Janata and Josowicz, 2003; Persaud, 2005). Poor processability of ICPs
including PANI (Wessling, 1999) restricts the mass production of ICP-based sensors
exploiting common solution-based thin film fabrication methods such as spin coating
and inkjet printing. Hence, we investigated the deposition of thin films of conjugated
polymers by in-situ oxidative polymerisation directly onto a substrate using a VDP
method (Chapter IV). Since the precursors in the VDP process are water soluble, and
there is no restriction on the type of substrate that can be used in a VDP process as
opposed to electrochemical polymerisation, inexpensive plastic substrates and high
throughput fabrication technologies can be used to manufacture chemical sensors.

132
As described earlier in Chapter II, our target analyte was ammonia, since a great
need exists for robust and cheap systems for real-time measurement of ammonia at
ppb-ppm levels in environmental monitoring, food processing and medical applications
(Abel et al., 2012; Timmer et al., 2005). PANI has previously been well-characterised
for its sensitivity to ammonia gas (Hu et al., 2002; Wojkiewicz et al., 2011; Liu et al.,
2004). However, the high affinity of PANI for ammonia has drawbacks due to slow
desorption, so that recovery after exposure to ammonia may take a significant time.
This factor, together with baseline drift due to environmental influences, and the
possibility of irreversible reactions in PANI-based sensors, has hitherto impeded their
practical use for continuous monitoring applications. A strategy adapted by some
researchers is to maintain the sensing layer at a higher temperature using external
heaters (Crowley et al., 2008a; Danesh and Persaud, 2012), in order to enhance
recovery and reversibility of sensors based on PANI. This increase in operating
temperature affects the kinetics of binding between ammonia and the sensing layer
and facilitates desorption of ammonia from PANI. It is desirable for manufacture that
heaters be incorporated into the substrate. However fabrication of inexpensive
printable heaters that are reproducible is challenging (Briand et al., 2008; Courbat et
al., 2012).
A conducting polymer chemiresistor on printed polymeric micro-hotplates for
ammonia detection consisting of fully inkjet-printed silver heater and comb electrodes,
separated by a thin patternable dielectric film, and a polyaniline sensing layer was
developed (Figure 5-1).

133
Figure 5-1. Process flow of the micro-hotplates fabrication: (a) Inkjet printing of the heater on the PEN substrate, (b) Lamination of a thin dielectric film on the heater for electrical isolation, (c) Inkjet printing of the comb electrode onto the thin dielectric and (d) Deposition of the polyaniline sensing layer. A 50 or 14 µm thick dry film photoresist was used as the dielectric film laminated onto the heater for the first and the second generations, respectively. Lamination was performed at 85 °C at 2 bar, at a speed of 2 m min
-1. The IDE consisted of two interdigitated combs. The pitch of the electrodes was 120
μm, corresponding to a width of 68 ± 8 μm and an inter-finger spacing of 52 ± 8 μm. The electrodes’ total thickness was 260 ± 50 nm.

134
5.2. Experimental section
The sensor consisted of a PEN substrate, a meander-shaped metallic heater, a dry foil
dielectric, interdigitated metallic electrodes and a conducting polymer sensing layer.
Two different generations of µ-hotplates were designed and fabricated by inkjet printing
silver nanoparticle-based ink on PEN foil aiming to minimise the power consumption as
well as the thermal gradient over the sensing area. PEN was selected as a substrate
material because it presented the best trade-off between price and good heat stability,
with a glass transition of 155 °C and a maximum process temperature higher than 180
°C (Camara et al., 2013).
An initial development of a sensor that was 24 mm2 for test purposes, allowed
characterisation of both of the heater designs, the manufacturing process and the
sensor materials. This led to a 2nd generation sensor that was 24 times smaller (1
mm2), used thinner PEN substrate (50 μm instead of 125 μm) and also had a thinner
dielectric dry foil film between heater and combed electrodes (14 μm instead of 50 μm).
This reduction in device size and dielectric layer thickness reduced the power
consumption and the thermal inertia, and minimised heat dissipation.
5.2.1. Heaters
Figure 5-2 depicts the two generations of the heater designs that were fabricated in the
IMT, EPFL. The heaters from the 1st generation were designed as large meanders to
simplify printing, whereas the heater belonging to the improved second generation was
smaller in area and presented a symmetrical square double meander shape to
ameliorate thermal homogeneity. The thermal design of the heaters was supported by
finite element method (FEM) modelling done in the FEMTO-ST labs.
These were fabricated by inkjet printing (Dimatix DMP 2800 printer) of a silver
nanoparticles-based ink (SuntTronic et EMD506 from SunChemical) on 50 or 125 μm-
thick PEN (Teonex®Q65FA from Dupont Teijim Films). Figure 5-1 documents the
printed electrodes produced. Two layers were printed selecting a drop-to-drop distance
of 25 µm for the first generation of heaters, and three layers at a drop-to-drop distance
of 40 µm were printed to fabricate the second generation. The patterns were sintered in
a convection oven for 3 hr at 180 °C. Electrodeposition of a thin layer of gold on the
silver heater and electrodes for improved robustness was also carried out (Molina-
Lopez et al., 2013; De Koninck et al., 2012).

135
Figure 5-2. Layout of the different designed heaters: the first generation (top) was designed as a large meander with a total length of ~41 mm. Adjacent tracks had a pitch (centre-to-centre distance) of 600 µm, and 300 µm width on the design layout. The resulting printed lines were wider at 397 ± 6 µm due to the lateral spreading of the ink. The heater thickness was 1.2 ± 0.3 µm. The resistance of the heater was 25 ± 3 Ω and the resistivity was 22 ± 3 μΩ cm. The total surface area of the device was ~24 mm
2. The
second generation (bottom) was of a much smaller size (~1 mm2) and was designed as a
square double meander of total length of ~7.75 mm for improved thermal performance. The line width after printing was 68 ± 8 μm, corresponding to a single drop-wide line. To further decrease the thermal gradient over the surface of the double meander heater, adjacent lines were placed closer to each other at the outermost part of the spiral than at the innermost part (160 µm pitch against 240 µm pitch), compensating for the larger heat dissipation occurring at the edge of the heater, compared to at its centre. A square shape was chosen because round shapes are challenging to inkjet print. The line thickness was 530 ± 90 nm and the measured resistivity of the line was 18 ± 7 μΩ cm. The total resistance of the second generation heaters was 95 ± 7 Ω. The contact pads of the second generation devices were 1.4 cm, to facilitate their connection using a ZIF connector. To minimise the heat dissipation on the long contact pads, they were designed to be much wider and thicker than the heater lines. The pad widths and thickness was 700 μm and 1 μm respectively. The average resistance of the pads was 2.3 ± 0.3 Ω, (negligible when compared to the heater resistance).
5.2.2. Dielectric layer and interdigitated electrodes
Once the heater was fabricated, a dielectric film was laminated and patterned on top of
it by the EPFL partner. The film must be as thin as possible to optimise the heat
transfer from the heater to the sensing layer onto the film. Combed electrodes were
then printed on the dielectric film to complete the fabrication of the transducer
(Figure 5-1). Silver is known to oxidise which limits chemical compatibility with many
sensing layers. Therefore, electrodeposition of 400 ± 270 nm of gold on top of the
printed electrodes was adopted to enhance compatibility and stability.
A photo-patternable dry film photoresist (PerMX™ 3000 from DuPont™) (Figure 5-1-
b), was laminated onto the heater as a dielectric film. The dry photoresist was
patterned via photolithography to open contact windows on the pads of the device. The

136
electrodes were fabricated by inkjet printing over the dielectric with the same silver ink
and they were thermally annealed for 2 hr at 180 °C (Figure 5-1-c). Two layers were
printed to form the electrodes, using a drop-to-drop space of 40 µm.
Figure 5-3 shows optical images of µ-hotplate examples from both generations,
before deposition of the conductive PANI sensing layer. A device with combed
electrode plated with gold is also depicted.
Figure 5-3. Optical images of µ-hotplates depicting examples of both generations, including flexible arrays, close views of a single device and a device with gold-plated
combed electrode.
5.2.3. Preparation of the PANI sensing layer
Once the completed micro-hotplates were received, we deposited the sensing layer
onto the IDE area of the substrates in our lab (see Figure 5-1-d). The VDP method
adapted to make a thin polymeric acid-doped PANI sensing layer on the polymeric
hotplates. A 3 wt.% aqueous solution of PSSA was prepared by dilution from the
commercial solution (PSSA, MW ~75,000, 18 wt.% solution in water). 300 mg of the
oxidising agent, APS, was then added into 5 ml of the solution to make homogenous
mixture of dopant and oxidant. The substrate was spin coated with the precursor
solution and then exposed to monomer (freshly distilled aniline) vapour in a custom-
built VDP chamber for 1 hr. The monomer container was heated to 75 ºC during the
VDP process in order to facilitate its evaporation. The resulting PSSA-doped PANI film
on the µ-hotplate was removed from the VDP chamber, rinsed with distilled water and
dried at 65 °C. The process was the same for both generations of the µ-hotplates. All

137
the chemicals were purchased from Sigma-Aldrich. The aqueous solutions were made
using ultrahigh purity water purified using a Milli-Q 50 system (Millipore Co.).
5.2.4. Characterisation
The power consumption and the thermal distribution over the active area of the µ-
hotplates were characterised by the FEMTO-ST partner. The characterisation was
done using type S micro-thermocouples (1.3 µm diameter) mapping surface
temperature over the device area (Thiery et al., 2008; Bontempi et al., 2013), while
different DC currents were supplied to the heater. The results were compared to FEM
simulations carried out using COMSOL (version 4.2) software. For these simulations,
the thermal conductivity of both polymeric films (PEN substrate and dielectric layer
covering the heater) was fixed at 0.78 W m-1 K-1. The convection coefficient was
determined experimentally and fixed at 2.6 x 10⁷ W m-3 K-1. This value fitted well the
experimental results obtained for both generations of substrates.
UV-visible spectroscopy was used to study the doping behaviour of PANI films
deposited on cleaned glass substrates using the VDP method. The transmittance
spectrum was recorded using a Perkin-Elmer lambda 35 spectrometer with a scanning
velocity of 120 nm min−1. A homemade automatic ammonia vapour generation system
was designed and utilised for characterising the sensing performance of the sensors.
The electrical response of the fabricated sensors towards different NH3 vapour
concentrations in dry air was measured as the change in the resistance. Ammonia
vapour over the range of 250 ppb to 3.65 ppm was generated using a permeation tube
with calibrated permeation rate of 1042 ± 14 ng min-1 at 25 ºC. A custom-built
humidifier provided moist air whenever needed.
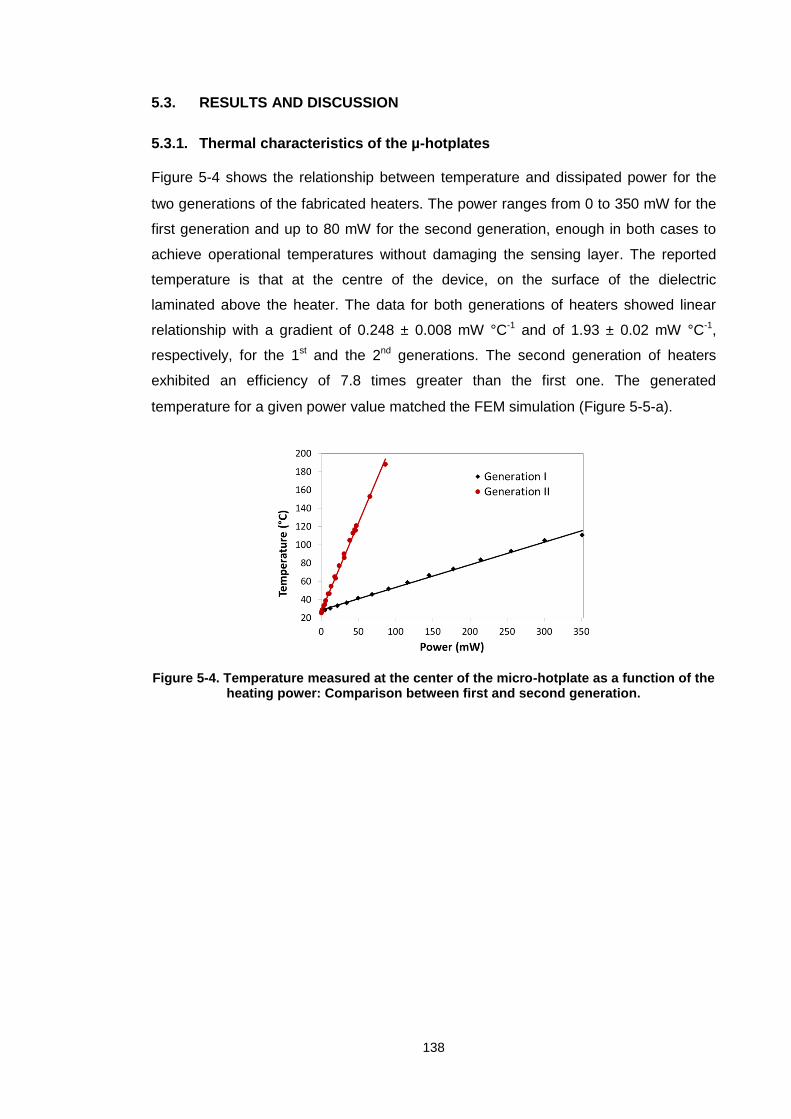
138
5.3. RESULTS AND DISCUSSION
5.3.1. Thermal characteristics of the µ-hotplates
Figure 5-4 shows the relationship between temperature and dissipated power for the
two generations of the fabricated heaters. The power ranges from 0 to 350 mW for the
first generation and up to 80 mW for the second generation, enough in both cases to
achieve operational temperatures without damaging the sensing layer. The reported
temperature is that at the centre of the device, on the surface of the dielectric
laminated above the heater. The data for both generations of heaters showed linear
relationship with a gradient of 0.248 ± 0.008 mW °C-1 and of 1.93 ± 0.02 mW °C-1,
respectively, for the 1st and the 2nd generations. The second generation of heaters
exhibited an efficiency of 7.8 times greater than the first one. The generated
temperature for a given power value matched the FEM simulation (Figure 5-5-a).
Figure 5-4. Temperature measured at the center of the micro-hotplate as a function of the heating power: Comparison between first and second generation.

139
Figure 5-5. Thermal gradient at the surface of the second generation of heaters: (a)
thermographic simulation obtained by FEM and (b) thermal profile along x and y axis.
Analysis of thermal distribution over the active area of the devices for the 2nd
generation device is reported in Figure 5-5-b. The surface temperature of the µ-
hotplates was registered following two perpendicular lines, along the x and y axes, that
cross the device and pass by its centre. For measurements at 40 mW, a good fit was
obtained between the experimental and simulated thermal profiles. The range of
temperatures along the x and the y axes was 90 °C to 105 °C and 83 °C to 105 °C,
respectively. The thermal gradient over the sensing area presents an almost flat profile
in the middle of the device along both x and y axes with a maximum temperature
difference of 2 °C (between 103 °C and 105 °C) in the x direction and of 4 °C (between
102 °C and 106 °C) in the y direction.
5.3.2. PSSA-doped PANI thin films
Polymeric acids such as PSSA are known to enhance the properties of doped PANI
(see Chapter IV). Here, the same concept has been employed to fabricate PANI
sensing layers by VDP on top of the micro-hotplates. UV-Vis transmittance spectrum of
the deposited PANI layer on glass showed characteristic peaks at 435 and 810 nm
which are entirely consistent with reports on the doped PANI structure: the peak at 435
nm is due to the presence of localised semiquinone population or the polaron
absorption (equivalent to: polaron band to π* transition). The peak at 810 nm is due to
the trapped excitons centred on quinoid (imine) (equivalent to: π- to polaron band
transition).

140
5.3.3. Ammonia sensing properties
5.3.3.1. The first generation sensors
As described before in section 2.5.3, emeraldine salt exhibits p-type semiconductor
characteristics; consequently, electron-supplying gases such as NH3 reduce the
charge-carrier (polaron) concentration and decrease the conductivity, in a reversible
chemisorption process (Equation 2-2). The 1st generation sensors were fabricated by
depositing thin films of PSSA-doped PANI on the sensing area of the first generation µ-
hotplates using VDP process. Figure 5-6 compares the response of the sensor
obtained for consecutive ammonia vapour concentrations over the range of 250 ppb to
3.65 ppm in dry air at different operating temperatures. The sensor was then purged
with air for recovery.
Figure 5-6. Response of the 1st
generation sensor towards various concentrations of ammonia vapour from 250 ppb to 3.65 ppm in dry air, at four temperatures: RT, 40, 60 and 80 °C with exposure and recovery time of 10 min and 30 min, respectively. Here, the Ri is the resistance value of the sensor at time=0.
The transient response is defined by the change in the resistance of the sensor
(Equation 3-5). Increase in the operating temperature from ~20 to ~80 ºC significantly
enhanced recovery of the response to initial value after exposure to ammonia. This can
be explained by the equilibrium interaction between doped PANI and ammonia
molecules as stated in Equation 2-2: heating increases the dissociation rate of
ammonium ion into ammonia and proton, shifting the equilibrium to the left. Hence, the

141
sensor resistance returns rapidly to its Rb due to reprotonation of PANI. The enhanced
recovery also diminishes the baseline drift over time due to faster regeneration of the
sensor at elevated temperatures. Nevertheless, less ammonia is absorbed by PANI
layer at elevated temperatures, so the response magnitude is reduced compared to
room temperature (~20 °C).
To ascertain the effect of temperature on the response performance of the 1st
generation sensors, sensitivity and recovery parameters at each temperature were
calculated, and the results are compared in Figure 5-7. Sensitivity, S, is defined as the
slope of the linear curve of the relative response vs. concentration for each
temperature (% ppb-1). Recovery, Rec, for each temperature was quantified based on
the average ratio of recovered response to maximum response ( ) for the
concentration range and time intervals studied here. As the temperature increases, S
decreases exponentially according to the equation obtained from curve fitting
(Figure 5-7, solid line): ( ), where T is the
temperature in degrees Celsius. Such behaviour is in agreement with Kukla and co-
workers’ report (Kukla et al., 1996) in which ammonia adsorption onto poly(methyl
methacrylate)-PANI composite was considered as a reversible chemisorption process.
On the other hand, Rec increases linearly from ~45 % at ambient temperature to ~90
% at 80 °C ( ( )) (Figure 5-7, dashed line). Thus, heating to 80
ºC results in desorption of the most of the tightly bound ions, followed by sensor
regeneration. Sensors operated at temperatures higher than 80 ºC showed no
measurable response up to 750 ppb.

142
Figure 5-7. Effect of µ-hotplate temperature on sensitivity (open square) and recovery (closed circle) of the 1
st generation sensors. The solid curve and dashed line show curve
fits for sensitivity and recovery data, respectively. The error bars represent the standard deviation.
5.3.3.2. The second generation sensors
The same procedure was used to deposit a thin PSSA-doped PANI on the 2nd
generation µ-hotplates’ sensing area. The sensor was exposed sequentially to
ammonia vapour and dry air for 5 min and 15 min, respectively, and the relative
change in resistance was compared at RT and 95 ºC (Figure 5-8-a). Although the
heated sensor showed a small drop in sensitivity compared to that of RT, it remained
operative in detection of ammonia at very low concentrations down to 300 ppb. The
average recovery of the heated sensor was improved by a factor greater than 2 when
compared to recovery of the sensor operated at RT (Figure 5-8-b). The 2nd generation
sensor showed a significant improvement in sensor performance at low concentrations
of ammonia in comparison to the 1st generation at comparable temperatures while
using much less power. In comparison to 1st generation, the response speed is much
higher in the 2nd generation sensors operated at 95 ºC, reaching equilibrium response
in approximately 5 min (the response of the 1st generation sensor at 80 ºC started to
level off after 10 min). The gold plating of the IDE did not result in any significant
change in response magnitude and response speed of the 2nd generation sensors.

143
Figure 5-8. a) The 2nd
generation sensor response magnitude (ΔRmax/Rb) to ammonia during a 3 min exposure at RT (closed square) and 95 ºC (open circle; the heater power consumption was 35 mW). b) Enhancement of the recovery of the sensor at 95 ºC compared to that of RT. The sensor was purged with clean dry air for 15 min after each ammonia exposure.
5.3.3.3. Effect of humidity
Humidity often affects many conducting polymer sensors, so the effect on electrical
conductivity and the ammonia sensing properties of the PSSA-doped PANI was
investigated. The 2nd generation sensor exposed to humid air with different absolute
humidity levels from 1000 to 8000 mg m-3 at RT and when heated (Figure 5-9). The
electrical resistance of the sensor decreased with increase in the humidity level, in both
conditions. The enhancement of the conductivity by the sorption of water molecules at
RT is already discussed in section 4.3.2. The hygroscopic nature of the polymeric
dopant plays an important role in this behaviour, since water molecules can form

144
hydrogen bonds with the dopant chains and PANI backbone itself (Matsuguchi et al.,
2003).
Figure 5-9. Comparison of the humidity response of the 2nd
generation sensors at RT (closed square) and 95 ºC (open circle). The exposure time is 3 min in all cases.
The response of the sensor during exposure to water vapour is much faster than
ammonia, reaching 90 % of the equilibrium value in less than 3 min, following by a
rapid recovery when purged with dry air. In general, the heated sensor shows higher
response magnitudes, while the sensitivity (slope) is lower than that observed at RT.
An explanation for this observation remains to be determined. However, it seems that
the moisture’s influence on the barrier potential between granular metallic emeraldine
salt particles is more pronounced at elevated temperatures, so the relative change in
the resistance is higher at a constant humidity level. This is consistent with Javadi and
co-workers’ report (Javadi et al., 1988) for HCl-doped PANI free standing films. Also,
sensor operation at higher temperatures decreases Rb which may further contribute to
the higher relative response, based on Equation 3-5. The reduced sensitivity may be
attributed to the significantly lower partition coefficient of water in the sensing layer at
95 ºC compared to that of RT.

145
Table 5-1. Effect of temperature on the 2nd generation sensor response to ammonia vapour in dry and humid air.
The effect of water vapour on the ammonia sensing of the sensor is summarised in
Table 5-1. The 2nd generation sensor was exposed to four different concentrations of
ammonia vapour in dry air and absolute humidity of 5000 mg m-3. At RT, the response
magnitude is greater for the sensor working in humid conditions. When operating in
humid air, water molecules sorbed in the sensing layer result in an increase in
conductivity. Following exposure to NH3 molecules, these not only interact with
polyaniline, but also react with water in the layer and produce ammonium hydroxide
(Equation 4-1). Hence, hydroxide ions produced further deprotonate PANI and
increase its resistance. Moreover, the higher Rb in dry air may attribute to its lower
relative response. Due to the opposing effects of water vapour and ammonia on the
conductivity, the overall sensitivity remains lower in humid air compared to dry air, in
spite of higher response magnitudes. When heater is operated at 95 ºC, the moisture
content is reduced in the sensing layer. The response behaviour at this condition can
be described based on competitive sorption of NH3 and H2O molecules. During
exposure to ammonia, the NH3 molecules are able to displace weakly sorbed H2O
molecules, directly interact with the PANI and deprotonate it. However, the
Equation 2-2 is shifted to the left at elevated temperatures and both the response
magnitude and sensitivity are lower compared to RT condition.
NH3 concentration
(ppb)
Relative Response† (ΔRmax/Rb, %)
Room Temperature 95 ºC (Heater Power=35 mW)
AH=0 AH=5000 (mg m-3
) AH=0 AH=5000 (mg m-3
)
350 1.87 (±0.42) 3.76 (±0.59) 1.59 (±0.56) 1.61 (±0.47)
500 2.89 (±0.56) 4.33 (±0.72) 2.26 (±1.20) 2.05 (±0.61)
1000 5.97 (±0.88) 7.51 (±0.45) 4.86 (±1.40) 3.14 (±0.64)
2000 10.94 (±2.65) 11.49 (±1.31) 8.89 (±1.65) 6.20 (±1.14)
Sensitivity‡
(%/ppb) 0.0053 (R
2=0.9963) 0.0047 (R
2=0.9885)
0.0044 (R
2=0.9964) 0.0028 (R
2=0.9952)
†: Average maximum response of the sensor over a 5-min exposure. The figures in parenthesis are the mean deviations.
‡: Sensitivity is calculated based on the slope of the linear regression fit to the relative response over the concentration range between 350 and 2000 ppb.
AH = absolute humidity

146
5.3.3.4. Cross-sensitivity
To assess the cross-sensitivity to other chemical vapours, the 2nd generation sensor
was characterized (Figure 5-10). The sensor showed only a slight increase in
conductivity in exposure to high concentrations of methanol, ethanol, chloroform,
acetone and n-butylacetate (Figure 5-10- inset), while the exposure to ammonia in
comparable concentrations (2.83 ppth) resulted in a drastic increase in resistance. This
results show the high selectivity of the sensor to ammonia. Although the sensor
response to these chemicals were fast and reversible, the regeneration of the sensor
after exposure to ammonia at such a high concentration was slow and it took 18 hr for
the sensor to recover to ~90 % of its original baseline resistance, even when heated.
The partial recovery indicates irreversible chemical reactions may have occurred in the
sensing layer at these high concentrations. Sensor poisoning was not observed for the
sensors exposed to low concentrations of ammonia (up to 5 ppm) even over extended
periods.
Figure 5-10. Selectivity test of the 2nd
generation sensors: resistance response in exposure to: 1) acetic acid (3.19 ppth), 2) acetone (1.16 ppth), 3) chloroform (2.26 ppth), 4) n-butyl acetate (0.58 ppth), 5) ethanol (3.12 ppth), 6) methanol (4.51 ppth) and 7) ammonia (2.83 ppth). The ordinate on the inset was multiplied by a factor of 50 from the ordinate on the main plot of the figure. The value at the low end and high end of the ordinate of the inset are 3.12 and 4.12 MΩ, respectively. The baseline value in the inset is 3.87 MΩ.

147
5.3.3.5. Sensor stability
The long term stability of the sensors was examined by monitoring their baseline drift
over a three-week period. The 1st generation sensors as well as the 2nd generation
sensors (with and without gold electroplating) were heated to around 95 °C and a flow
of dry air passed over the sensors at a constant rate. The data were recorded after an
initial 24 hr induction period and the results are compared in Figure 5-11. All the
sensors showed a continuous decrease in conductance over time. This is a common
phenomenon for conducting polymer-based sensors (Yoon, 2013; Crowley et al.,
2008a) and can be attributed to the gradual oxidation of PANI in the presence of
oxygen molecules in air which results in degradation of electrical conductivity. Besides,
dry air flow in combination with the elevated temperature accelerate the evaporation of
water molecules trapped in the bulk of sensing layer due to the hygroscopic nature of
the polymeric dopant, and cause further drop in conductivity. The baseline resistance
values remained comparatively stable up to 7 days for all three samples; however the
baseline resistance of the devices with silver IDE started to increase monotonically
after one week. Surface oxidation of the silver electrodes may cause this issue.
Moreover, the PSSA may slowly react with the silver at the interface of the sensing
layer and the electrodes, and convert it to silver sulphonate moieties (Figure 5-11-inset
a). Heating speeds up these processes which eventually increase the contact
resistance, and the measured conductance of the sensor drops. In contrast, the
chemically inert gold-plated IDE device showed no change in its surface (Figure 5-11-
inset b), and baseline resistance was significantly more stable with R/R0=1.928 after 21
days. However, in spite of the baseline drift, even the silver IDE sensors were
operational for at least 2 months.

148
Figure 5-11. Baseline drift of the sensors over an aging period of 21 days. The sensors were heated to about 95 °C and dry air passed over them. R0 is the initial resistance on day 1. The inset shows the optical image of the electrodes’ surface on the 2
nd generation
sensors after 2 months: (a) an oxidised silver electrode and (b) an intact gold-electroplated electrode.

149
5.4. Discussion
PSSA-doped polyaniline chemiresistors have been produced on inkjet-printed
polymeric µ-hotplates using vapour-phase deposition polymerisation method for robust
detection of ammonia vapour in sub-ppm concentration range in air. This work was
accomplished through the collaboration between three research groups from IMT in
EPFL, FEMTO-ST and the University of Manchester. The vapour-phase deposition
polymerisation employed here is a two-step method compatible with large scale
manufacturing. For instance, instead of spin coating, one can use printing methods to
deposit the precursor layer (oxidant/dopant) since both the oxidising and doping agents
are water-soluble. In fact there are several examples of such printed devices in
literature.
Two generations of printed micro-hotplates with different dimensions were developed
on PEN substrate. The hotplates were processed using a combination of silver ink-jet
printing and lamination processes compatible with large area manufacturing. The
second generation of devices outperformed the first due to their smaller size, thinner
substrate and thinner dielectric film used, demonstrating the crucial importance of good
printing resolution and structure design. Further reduction in hotplate dimension and
substrate/dielectric thickness can be achieved, which may result in enhanced thermal
and sensing performance of the device.
Both generations of micro-hotplates displayed improved sensing characteristics at
elevated temperatures. However, the devices based on the second generation of
heaters showed the best performance, achieving sensitive, fast and selective ammonia
detection when operated at about 95 °C. The sensors were operational even at a very
high humidity. The electrodeposition of gold on the silver seed patterns has been
demonstrated for improved long-term stability. Nickel is another possibility as modifying
coating for the electrodes.
Other sensing materials can also be made by the same method on the micro-
hotplates. Polypyrrole, polythiophene and other conjugated polymers doped with
various polymeric acids such as Nafion and poly(acrylic acid) can be developed to alter
the specificity of the sensor. Finally, an array of different sensors can be made on a
single plastic substrate with several micro-hotplate platforms in order to realize an
electronic nose for headspace analysis of complex mixtures.
150
5.5. References
(2013) Aquatic Life Ambient Water Quality Criteria for Ammonia - Freshwater (2013) US Environmental Protection Agency. Report Ref.: EPA 822-R-13-001
Abel, T., Ungerbock, B., Klimant, I. & Mayr, T. (2012) Fast responsive, optical trace level ammonia sensor for environmental monitoring. Chemistry Central Journal, 6(1), 124.
Albert, K. J., Lewis, N. S., Schauer, C. L., Sotzing, G. A., Stitzel, S. E., Vaid, T. P. & Walt, D. R. (2000) Cross-Reactive Chemical Sensor Arrays. Chemical Reviews, 100(7), 2595-2626.
Ampuero, S. & Bosset, J. O. (2003) The electronic nose applied to dairy products: a review. Sensors and Actuators B: Chemical, 94(1), 1-12.
Angelopoulos, M., Ray, A., Macdiarmid, A. G. & Epstein, A. J. (1987) Polyaniline: Processability from aqueous solutions and effect of water vapor on conductivity. Synthetic Metals, 21(1–3), 21-30.
Anitha, G. & Subramanian, E. (2003) Dopant induced specificity in sensor behaviour of conducting polyaniline materials with organic solvents. Sensors and Actuators B: Chemical, 92(1-2), 49-59.
Arsat, R., Yu, X. F., Li, Y. X., Wlodarski, W. & Kalantar-zadeh, K. (2009) Hydrogen gas sensor based on highly ordered polyaniline nanofibers. Sensors and Actuators B: Chemical, 137(2), 529-532.
Athawale, A. A., Bhagwat, S. V. & Katre, P. P. (2006) Nanocomposite of Pd–polyaniline as a selective methanol sensor. Sensors and Actuators B: Chemical, 114(1), 263-267.
Atkins, P. W. (2001) Physical Chemistry (6th ed.). Oxford: Oxford University Press. Barthet, C. & Guglielmi, M. (1996) Aspects of the conducting properties of nafion
doped polyaniline. Electrochimica Acta, 41(18), 2791-2798. Belitz H. D., G. W., Schieberle P. (2004) Food Chemistry. Chapter 5. Springer-verlag.
ISBN: 9783540699330. Bhadra, S., Khastgir, D., Singha, N. K. & Lee, J. H. (2009) Progress in preparation,
processing and applications of polyaniline. Progress in Polymer Science, 34(8), 783-810.
Bhattacharyya, D. & Gleason, K. K. (2011) Single-Step Oxidative Chemical Vapor Deposition of −COOH Functional Conducting Copolymer and Immobilization of Biomolecule for Sensor Application. Chemistry of Materials, 23(10), 2600-2605.
Bhattacharyya, D., Howden, R. M., Borrelli, D. C. & Gleason, K. K. (2012) Vapor phase oxidative synthesis of conjugated polymers and applications. Journal of Polymer Science Part B: Polymer Physics, 50(19), 1329-1351.
Bodenhamer, W. T. (1998) Method and apparatus for selective biological material detection. US patent application No.: US6051388 A.
Boerjesson, T. S., Stoellman, U. M. & Schnuerer, J. L. (1993) Off-odorous compounds produced by molds on oatmeal agar: Identification and relation to other growth characteristics. Journal of Agricultural and Food Chemistry, 41(11), 2104-2111.
Bontempi, A., Thiery, L., Teyssieux, D., Briand, D. & Vairac, P. (2013) Quantitative thermal microscopy using thermoelectric probe in passive mode. Review of Scientific Instruments, 84(103703), 1-7.
Borch, E., Kant-Muermans, M.-L. & Blixt, Y. (1996) Bacterial spoilage of meat and cured meat products. International Journal of Food Microbiology, 33(1), 103-120.
Brédas, J. L. & Street, G. B. (1985) Polarons, bipolarons, and solitons in conducting polymers. Accounts of Chemical Research, 18(10), 309-315.
Briand, D., Colin, S., Courbat, J., Raible, S., Kappler, J. & de Rooij, N. F. (2008) Integration of MOX gas sensors on polyimide hotplates. Sensors and Actuators B: Chemical, 130(1), 430-435.

151
Briand, D., Oprea, A., Courbat, J. & Bârsan, N. (2011) Making environmental sensors on plastic foil. Materials Today, 14(9), 416-423.
Bulushi, I. A., Poole, S., Deeth, H. C. & Dykes, G. A. (2009) Biogenic Amines in Fish: Roles in Intoxication, Spoilage, and Nitrosamine Formation—A Review. Critical Reviews in Food Science and Nutrition, 49(4), 369-377.
Byrne, L., Lau, K. T. & Diamond, D. (2002) Monitoring of headspace total volatile basic nitrogen from selected fish species using reflectance spectroscopic measurements of pH sensitive films. Analyst, 127(10), 1338-1341.
Cabala, R., Meister, V. & Potje-Kamloth, K. (1997) Effect of competitive doping on sensing properties of polypyrrole. Journal of the Chemical Society, Faraday Transactions, 93(1), 131-137.
Camara, M., Molina-Lopez, F., Danesh, E., Mattana, G., Bontempi, A., Teyssieux, D., Thiery, L., Breuil, P., Pijolat, C., Persaud, K., Briand, D. & de Rooij, N. F. (2013) Printed micro-hotplates on flexible substrates for gas sensing. In: Transducers & Eurosensors XXVII: The 17th International Conference on Solid-State Sensors, Actuators and Microsystem. 1059-1062.
Cao, Y., Smith, P. & Heeger, A. J. (1992) Counter-ion induced processibility of conducting polyaniline and of conducting polyblends of polyaniline in bulk polymers. Synthetic Metals, 48(1), 91-97.
Chabukswar, V. V., Pethkar, S. & Athawale, A. A. (2001) Acrylic acid doped polyaniline as an ammonia sensor. Sensors and Actuators B: Chemical, 77(3), 657-663.
Chelawat, H., Vaddiraju, S. & Gleason, K. (2010) Conformal, Conducting Poly(3,4-ethylenedioxythiophene) Thin Films Deposited Using Bromine as the Oxidant in a Completely Dry Oxidative Chemical Vapor Deposition Process. Chemistry of Materials, 22(9), 2864-2868.
Chen, C.-H. (2003) Thermal and morphological studies of chemically prepared emeraldine-base-form polyaniline powder. Journal of Applied Polymer Science, 89(8), 2142-2148.
Chen, Y.-s., Li, Y., Wang, H.-c. & Yang, M.-j. (2007) Gas sensitivity of a composite of multi-walled carbon nanotubes and polypyrrole prepared by vapor phase polymerization. Carbon, 45(2), 357-363.
Chiang, C. K., Park, Y. W., Heeger, A. J., Shirakawa, H., Louis, E. J. & MacDiarmid, A. G. (1978) Conducting polymers: Halogen doped polyacetylene. The Journal of Chemical Physics, 69(11), 5098-5104.
Chinivasagam, H. N., Bremner, H. A., Wood, A. F. & Nottingham, S. M. (1998) Volatile components associated with bacterial spoilage of tropical prawns. International Journal of Food Microbiology, 42(1-2), 45-55.
Cho, J., Shin, K.-H. & Jang, J. (2010a) Micropatterning of conducting polymer tracks on plasma treated flexible substrate using vapor phase polymerization-mediated inkjet printing. Synthetic Metals, 160(9–10), 1119-1125.
Cho, J., Shin, K.-H. & Jang, J. (2010b) Polyaniline micropattern onto flexible substrate by vapor deposition polymerization-mediated inkjet printing. Thin Solid Films, 518(18), 5066-5070.
Choi, J. S., Cho, K. Y. & Yim, J.-H. (2010) Micro-patterning of vapor-phase polymerized poly(3,4-ethylenedioxythiophene) (PEDOT) using ink-jet printing/soft lithography. European Polymer Journal, 46(3), 389-396.
Ćirić-Marjanović, G. (2013) Recent advances in polyaniline research: Polymerization mechanisms, structural aspects, properties and applications. Synthetic Metals, 177(0), 1-47.
Claramunt, S., Monereo, O., Boix, M., Leghrib, R., Prades, J. D., Cornet, A., Merino, P., Merino, C. & Cirera, A. (2013) Flexible gas sensor array with an embedded heater based on metal decorated carbon nanofibres. Sensors and Actuators B: Chemical, 187, 401-406.

152
Courbat, J., Briand, D., Yue, L., Raible, S. & de Rooij, N. F. (2012) Drop-coated metal-oxide gas sensor on polyimide foil with reduced power consumption for wireless applications. Sensors and Actuators B: Chemical, 161(1), 862-868.
Crowley, K., Morrin, A., Hernandez, A., O'Malley, E., Whitten, P. G., Wallace, G. G., Smyth, M. R. & Killard, A. J. (2008a) Fabrication of an ammonia gas sensor using inkjet-printed polyaniline nanoparticles. Talanta, 77(2), 710-717.
Crowley, K., O'Malley, E., Morrin, A., Smyth, M. R. & Killard, A. J. (2008b) An aqueous ammonia sensor based on an inkjet-printed polyaniline nanoparticle-modified electrode. Analyst, 133(3), 391-399.
Crowley, K., Smyth, M., Killard, A. & Morrin, A. (2013) Printing polyaniline for sensor applications. Chemical Papers, 67(8), 771-780.
Danesh, E., Ghaffarian, S. R. & Molla-Abbasi, P. (2011) Non-solvent induced phase separation as a method for making high-performance chemiresistors based on conductive polymer nanocomposites. Sensors and Actuators B: Chemical, 155(2), 562-567.
Danesh, E. & Persaud, K. C. (2012) Flexible Ammonia Sensor Based on Polyaniline/Carbon Black Composites Operating At Elevated Temperatures. In: 14th International Meeting on Chemical Sensors (IMCS 2012), Nürnberg/Nuremberg, Germany. AMA Science Proceedings, 1134 - 1136.
De Koninck, D. A., Lopez, F. M., Briand, D. & de Rooij, N. F. (2012) Foil-level fabrication of inkjet-printed pyroMEMS balloon actuators. In: 2012 IEEE 25th International Conference on Micro Electro Mechanical Systems (MEMS). 64-67.
Dhawan, S. K., Kumar, D., Ram, M. K., Chandra, S. & Trivedi, D. C. (1997) Application of conducting polyaniline as sensor material for ammonia. Sensors and Actuators B: Chemical, 40(2-3), 99-103.
Ding, M., Tang, Y., Gou, P., Reber, M. J. & Star, A. (2011) Chemical Sensing with Polyaniline Coated Single-Walled Carbon Nanotubes. Advanced Materials, 23(4), 536-540.
Domanský, K., Baldwin, D. L., Grate, J. W., Hall, T. B., Li, J., Josowicz, M. & Janata, J. (1998) Development and Calibration of Field-Effect Transistor-Based Sensor Array for Measurement of Hydrogen and Ammonia Gas Mixtures in Humid Air. Analytical Chemistry, 70(3), 473-481.
Dufour, B., Rannou, P., Djurado, D., Janeczek, H., Zagorska, M., de Geyer, A., Travers, J.-P. & Pron, A. (2003) Low Tg, Stretchable Polyaniline of Metallic-Type Conductivity: Role of Dopant Engineering in the Control of Polymer Supramolecular Organization and in the Tuning of Its Properties. Chemistry of Materials, 15(8), 1587-1592.
Dufour, B., Rannou, P., Fedorko, P., Djurado, D., Travers, J.-P. & Pron, A. (2001) Effect of Plasticizing Dopants on Spectroscopic Properties, Supramolecular Structure, and Electrical Transport in Metallic Polyaniline. Chemistry of Materials, 13(11), 4032-4040.
Epstein, A. J., Ginder, J. M., Zuo, F., Bigelow, R. W., Woo, H. S., Tanner, D. B., Richter, A. F., Huang, W. S. & MacDiarmid, A. G. (1987) Insulator-to-metal transition in polyaniline. Synthetic Metals, 18(1–3), 303-309.
Fabretto, M., Zuber, K., Hall, C. & Murphy, P. (2008) High Conductivity PEDOT Using Humidity Facilitated Vacuum Vapour Phase Polymerisation. Macromolecular Rapid Communications, 29(16), 1403-1409.
Fabretto, M., Zuber, K., Hall, C., Murphy, P. & Griesser, H. J. (2009) The role of water in the synthesis and performance of vapour phase polymerised PEDOT electrochromic devices. Journal of Materials Chemistry, 19(42), 7871-7878.
Falk, K. G. & McGuire, G. (1919) Ammonia test for meat spoilage. Journal of Biological Chemistry, 37, 547-550.
Filtenborg, O., Frisvad, J. C. & Thrane, U. (1996) Moulds in food spoilage. International Journal of Food Microbiology, 33(1), 85-102.

153
Fischer, M. E. (2010) Amine Coupling Through EDC/NHS: A Practical Approach. In: Mol, N. J. & Fischer, M. J. E. (eds.) Surface Plasmon Resonance. Humana Press. ISBN: 978-1-60761-670-2.
Freund, M. S. & Deore, B. A. (2007) Self-Doped Conducting Polymers. Self-Doped Conducting Polymers. Chapter 2. John Wiley & Sons, Ltd. ISBN: 978-0-470-02969-5.
Gibson, T. D., Prosser, O., Hulbert, J. N., Marshall, R. W., Corcoran, P., Lowery, P., Ruck-Keene, E. A. & Heron, S. (1997) Detection and simultaneous identification of microorganisms from headspace samples using an electronic nose. Sensors and Actuators B: Chemical, 44(1-3), 413-422.
Gong, J., Li, Y., Hu, Z., Zhou, Z. & Deng, Y. (2010) Ultrasensitive NH3 Gas Sensor from Polyaniline Nanograin Enchased TiO2 Fibers. The Journal of Physical Chemistry C, 114(21), 9970-9974.
Gordon G. Wallace, P. R. T., Geoffrey M. Spinks, Leon A. P. Kane-Maguire. (2009) Conductive electroactive polymers : intelligent polymer systems (3rd Ed.), Boca Raton, FL: CRC Press, Taylor & Francis Group. ISBN: 978-1420067095.
Gozde, O.-I., Anna Maria, C. & Karen, K. G. (2012) CVD of polymeric thin films: applications in sensors, biotechnology, microelectronics/organic electronics, microfluidics, MEMS, composites and membranes. Reports on Progress in Physics, 75(1), 016501.
Grennan, K., Killard, A. J. & Smyth, M. R. (2005) Chemically polymerized polyaniline films for the mass-production of biosensor devices. Electroanalysis, 17(15-16), 1360-1369.
Grossiord, N., Loos, J., Regev, O. & Koning, C. E. (2006) Toolbox for Dispersing Carbon Nanotubes into Polymers To Get Conductive Nanocomposites. Chemistry of Materials, 18(5), 1089-1099.
Gu, Y. & Huang, J. (2013) Colorimetric detection of gaseous ammonia by polyaniline nanocoating of natural cellulose substances. Colloids and Surfaces A: Physicochemical and Engineering Aspects, 433(0), 166-172.
Guillén-Sans, R. & Guzmán-Chozas, M. (1995) Aldehydes in Food and its Relation with the TBA Test for Rancidity. European Journal of Lipid Science and Technology, 97(7-8), 285-286.
Gvo denović, M. M., ugović, B. ., Stevanović, . S., Tri ović, T. L., Grgur, B. N. (2011) Electrochemical Polymerization of Aniline. In: Electropolymerization. Chapter 4,77-96. Schab-Balcerzak, D. E. (ed.) InTech. ISBN 978-953-307-693-5.
Ha, Y. H., Nikolov, N., Pollack, S. K., Mastrangelo, J., Martin, B. D. & Shashidhar, R. (2004) Towards a Transparent, Highly Conductive Poly(3,4-ethylenedioxythiophene). Advanced Functional Materials, 14(6), 615-622.
Harsányi, G. (1995) Polymer films in sensor applications: technology, materials, devices and their characteristics. Chapter 2. Lancaster, USA: Technomics Publishing Company. ISBN: 9781566762014.
Heeger, A. J. (1993) Polyaniline with surfactant counterions: Conducting polymer materials which are processible in the conducting form. Synthetic Metals, 57(1), 3471-3482.
Heeger, A. J. (2001) Semiconducting and metallic polymers: the fourth generation of polymeric materials. Synthetic Metals, 125(1), 23-42.
Herath, H. M. P. C. K., Pradeep, E. K. C., Jayananda, M. K., Jayanetti, J. K. D. S., Kapaklis, V. & Dissanayake, D. P. (2012) Glass surface functionalized with polyaniline as a fast responding humidity sensor. Sensors and Transducers, 137(2), 137-144.
Hobday, D. S. (2009) Developement of polyaniline as a sensor for food quality and spoilage detection. EngD Thesis, Cranfield University.
Hodgins, D. & Sirnmonds, D. (1995) The electronic nose and its application to the manufacture of food products. Journal of Automatic Chemistry, 17(5), 179-185.

154
Hu, H., Trejo, M., Nicho, M. E., Saniger, . M. Garc a-Valenzuela, A. (2002) Adsorption kinetics of optochemical NH3 gas sensing with semiconductor polyaniline films. Sensors and Actuators B: Chemical, 82(1), 14-23.
Huang, J. (2006) Syntheses and applications of conducting polymer polyaniline nanofibers. Pure and Applied Chemistry, 78(1), 15-27.
Huang, ., Virji, S., Weiller, B. H. Kaner, R. B. (2002) Polyaniline Nanofibers: Facile Synthesis and Chemical Sensors. Journal of the American Chemical Society, 125(2), 314-315.
Huang, J., Virji, S., Weiller, B. H. Kaner, R. B. (2003) Polyaniline Nanofibers: Facile Synthesis and Chemical Sensors. Journal of the American Chemical Society, 125(2), 314-315.
Huang, J., Virji, S., Weiller, B. H. & Kaner, R. B. (2004) Nanostructured Polyaniline Sensors. Chemistry – A European Journal, 10(6), 1314-1319.
Huang, W., Yu, J., Yu, X. & Shi, W. (2013) Polymer dielectric layer functionality in organic field-effect transistor based ammonia gas sensor. Organic Electronics, 14(12), 3453–3459.
Huis in't Veld, J. H. J. (1996) Microbial and biochemical spoilage of foods: an overview. International Journal of Food Microbiology, 33(1), 1-18.
Intarapichet, K.-O. (1996) Off-flavours in foods: 3. Chemical changes. Suranaree Journal of Science and Technology, 3(1), 9.
Janata, J. (2004) Thirty Years of CHEMFETs – A Personal View. Electroanalysis, 16(22), 1831-1835.
Janata, J. & Josowicz, M. (2003) Conducting polymers in electronic chemical sensors. Nat Mater, 2(1), 19-24.
Jang, K.-S., Kim, D. O., Lee, J.-H., Hong, S.-C., Lee, T.-W., Lee, Y. & Nam, J.-D. (2010) Synchronous vapor-phase polymerization of poly(3,4-ethylenedioxythiophene) and poly(3-hexylthiophene) copolymer systems for tunable optoelectronic properties. Organic Electronics, 11(10), 1668-1675.
Javadi, H. H. S., Angelopoulos, M., MacDiarmid, A. G. & Epstein, A. J. (1988) Conduction mechanism of polyaniline: Effect of moisture. Synthetic Metals, 26(1), 1-8.
Jeon, I.-Y., Tan, L.-S. & Baek, J.-B. (2010) Synthesis and electrical properties of polyaniline/polyaniline grafted multiwalled carbon nanotube mixture via in situ static interfacial polymerization. Journal of Polymer Science Part A: Polymer Chemistry, 48(9), 1962-1972.
Karunagaran, B., Uthirakumar, P., Chung, S. J., Velumani, S. & Suh, E. K. (2007) TiO2 thin film gas sensor for monitoring ammonia. Materials Characterization, 58(8–9), 680-684.
Kim, J.-Y., Lee, J.-H. & Kwon, S.-J. (2007) The manufacture and properties of polyaniline nano-films prepared through vapor-phase polymerization. Synthetic Metals, 157(8–9), 336-342.
Kim, J., Kim, E., Won, Y., Lee, H. & Suh, K. (2003) The preparation and characteristics of conductive poly(3,4-ethylenedioxythiophene) thin film by vapor-phase polymerization. Synthetic Metals, 139(2), 485-489.
Kim, K.-H., Pal, R., Ahn, J.-W. & Kim, Y. H. (2009) Food decay and offensive odorants: A comparative analysis among three types of food. Waste Management, 29(4), 1265-1273.
Klug, A., Denk, M., Bauer, T., Sandholzer, M., Scherf, U., Slugovc, C. & List, E. J. W. (2013) Organic field-effect transistor based sensors with sensitive gate dielectrics used for low-concentration ammonia detection. Organic Electronics, 14(2), 500-504.
Kukla, A. L., Shirshov, Y. M. & Piletsky, S. A. (1996) Ammonia sensors based on sensitive polyaniline films. Sensors and Actuators B: Chemical, 37(3), 135-140.
Kulkarni, V. G., Campbell, L. D. & Mathew, W. R. (1989) Thermal stability of polyaniline. Synthetic Metals, 30(3), 321-325.

155
Kuswandi, B., Jayus, Restyana, A., Abdullah, A., Heng, L. Y. & Ahmad, M. (2012) A novel colorimetric food package label for fish spoilage based on polyaniline film. Food Control, 25(1), 184-189.
Kwon, O. S., Park, S. J., Lee, J. S., Park, E., Kim, T., Park, H.-W., You, S. A., Yoon, H. & Jang, J. (2012a) Multidimensional Conducting Polymer Nanotubes for Ultrasensitive Chemical Nerve Agent Sensing. Nano Letters, 12(6), 2797-2802.
Kwon, O. S., Park, S. J., Yoon, H. & Jang, J. (2012b) Highly sensitive and selective chemiresistive sensors based on multidimensional polypyrrole nanotubes. Chemical Communications, 48(85), 10526-10528.
Lee, Y. M., Kim, J. H., Kang, J. S. & Ha, S. Y. (2000) Annealing Effects of Dilute Polyaniline/NMP Solution. Macromolecules, 33(20), 7431-7439.
Lin, Y., Zhou, B., Shiral Fernando, K. A., Liu, P., Allard, L. F. & Sun, Y.-P. (2003) Polymeric Carbon Nanocomposites from Carbon Nanotubes Functionalized with Matrix Polymer. Macromolecules, 36(19), 7199-7204.
Liu, H. (1997) Interpolymer complexes of polyaniline and ionic copolymers: A design of conductive polymers for applications. PhD Thesis. University of Rhode Island. Rhode Island, United States.
Liu, H., Kameoka, J., Czaplewski, D. A. & Craighead, H. G. (2004) Polymeric Nanowire Chemical Sensor. Nano Letters, 4(4), 671-675.
Lobotka, P., Kunzo, P., Kovacova, E., Vavra, I., Krizanova, Z., Smatko, V., Stejskal, J., Konyushenko, E. N., Omastova, M., Spitalsky, Z., Micusik, M. & Krupa, I. (2011) Thin polyaniline and polyaniline/carbon nanocomposite films for gas sensing. Thin Solid Films, 519(12), 4123-4127.
Lock, J. P., Im, S. G. & Gleason, K. K. (2006) Oxidative Chemical Vapor Deposition of Electrically Conducting Poly(3,4-ethylenedioxythiophene) Films. Macromolecules, 39(16), 5326-5329.
Lonergan, M. C., Severin, E. J., Doleman, B. J., Beaber, S. A., Grubb, R. H. & Lewis, N. S. (1996) Array-based vapor sensing using chemically sensitive, carbon black-polymer resistors. Chemistry of Materials, 8(9), 2298-2312.
Lu, J., Park, B. J., Kumar, B., Castro, M., Choi, H. J. & Feller, J.-F. (2010) Polyaniline nanoparticle -carbon nanotube hybrid network vapour sensors with switchable chemo-electrical polarity. Nanotechnology, 21(25), 255501.
Lu, X., Tan, C. Y., Xu, J. & He, C. (2003) Thermal degradation of electrical conductivity of polyacrylic acid doped polyaniline: effect of molecular weight of the dopants. Synthetic Metals, 138(3), 429-440.
MacDiarmid, A. G. & Epstein, A. J. (1994) The concept of secondary doping as applied to polyaniline. Synthetic Metals, 65(2-3), 103-116.
Mark, J. E. (1999) Polymer Data Handbook. New York, NY: Oxford University Press, Inc. ISBN: 9780195107890.
Matsuguchi, M., Okamoto, A. & Sakai, Y. (2003) Effect of humidity on NH3 gas sensitivity of polyaniline blend films. Sensors and Actuators B: Chemical, 94(1), 46-52.
Mauritz, K. A. & Moore, R. B. (2004) State of Understanding of Nafion. Chemical Reviews, 104(10), 4535-4586.
Mohammadi, A., Hasan, M. A., Liedberg, B., Lundstrom, I. & Salaneck, W. R. (1986) Chemical vapour deposition (CVD) of conducting polymers: Polypyrrole. Synthetic Metals, 14(3), 189-197.
Molina-Lopez, F., Quintero, A. V., Mattana, G., Briand, D. & Rooij, N. F. d. (2013) Large-area compatible fabrication and encapsulation of inkjet-printed humidity sensors on flexible foils with integrated thermal compensation. Journal of Micromechanics and Microengineering, 23(2), 025012.
Mueller, M., Fabretto, M., Evans, D., Hojati-Talemi, P., Gruber, C. & Murphy, P. (2012) Vacuum vapour phase polymerization of high conductivity PEDOT: Role of PEG-PPG-PEG, the origin of water, and choice of oxidant. Polymer, 53(11), 2146-2151.

156
Najar, S. S., Kaynak, A. & Foitzik, R. C. (2007) Conductive wool yarns by continuous vapour phase polymerization of pyrrole. Synthetic Metals, 157(1), 1-4.
Newton, K. G. & Gill, C. O. (1978) Storage quality of dark, firm, dry meat. Applied and Environmental Microbiology, 36(2), 2.
Ngamna, O. (2006) Synthesis, characterisation and application of inherently conducting polymer nanoparticles. PhD Thesis, University of Wollongong.
Ngamna, O., Morrin, A., Killard, A. J., Moulton, S. E., Smyth, M. R. & Wallace, G. G. (2007) Inkjet Printable Polyaniline Nanoformulations. Langmuir, 23(16), 8569-8574.
Nicolas-Debarnot, D. & Poncin-Epaillard, F. (2003) Polyaniline as a new sensitive layer for gas sensors. Analytica Chimica Acta, 475(1–2), 1-15.
Oh, W.-K., Kim, S., Shin, K.-H., Jang, Y., Choi, M. & Jang, J. (2013) Inkjet-printed polyaniline patterns for exocytosed molecule detection from live cells. Talanta, 105(0), 333-339.
Olinga, T. E., Fraysse, J. r. m., Travers, J. P., Dufresne, A. & Pron, A. (2000) Highly Conducting and Solution-Processable Polyaniline Obtained via Protonation with a New Sulphonic Acid Containing Plasticizing Functional Groups. Macromolecules, 33(6), 2107-2113.
Pacquit, A., Frisby, J., Diamond, D., Lau, K. T., Farrell, A., Quilty, B. & Diamond, D. (2007) Development of a smart packaging for the monitoring of fish spoilage. Food Chemistry, 102(2), 466-470.
Pacquit, A., Lau, K. T., McLaughlin, H., Frisby, J., Quilty, B. & Diamond, D. (2006) Development of a volatile amine sensor for the monitoring of fish spoilage. Talanta, 69(2), 515-520.
Pasanen, A. L., Lappalainen, S. & Pasanen, P. (1996) Volatile organic metabolites associated with some toxic fungi and their mycotoxins. Analyst, 121(12), 1949-1953.
Payam, M.-A., Seyed Reza, G. & Ehsan, D. (2011) Porous carbon nanotube/PMMA conductive composites as a sensitive layer in vapor sensors. Smart Materials and Structures, 20(10), 105012.
Persaud, K. C. (2005) Polymers for chemical sensing. Materials Today, 8(4), 38-44. Ram, M. K., Yavuz, Ö., Lahsangah, V. & Aldissi, M. (2005) CO gas sensing from
ultrathin nano-composite conducting polymer film. Sensors and Actuators B: Chemical, 106(2), 750-757.
Rannou, P., Dufour, B., Travers, J.-P., Pron, A., Djurado, D., Janeczek, H. & Sek, D. (2002) Temperature-Induced Transitions in Doped Polyaniline: Correlation between Glass Transition, Thermochromism and Electrical Transport. The Journal of Physical Chemistry B, 106(41), 10553-10559.
Reece, D. A. (2003) Development of conducting polymers for separations. PhD, University of Wollongong.
Rizzo, G., Arena, A., Donato, N., Latino, M., Saitta, G., Bonavita, A. & Neri, G. (2010) Flexible, all-organic ammonia sensor based on dodecylbenzene sulphonic acid-doped polyaniline films. Thin Solid Films, 518(23), 7133-7137.
Roberts, J. P. M. a. R. G. (1992) Identification of geosmin as a volatile metabolite of Penicillium expansum. Applied and Environmental Microbiology, 58(9), 2.
Rokka, M., Eerola, S., Smolander, M., Alakomi, H. L. & Ahvenainen, R. (2004) Monitoring of the quality of modified atmosphere packaged broiler chicken cuts stored in different temperature conditions B. Biogenic amines as quality-indicating metabolites. Food Control, 15(8), 601-607.
Ross, J. F., Robins, I. & Webb, B. C. (1987) The ammonia sensitivity of platinum-gate MOSFET devices: dependence on gate electrode morphology. Sensors and Actuators, 11(1), 73-90.
Sakkopoulos, S., Vitoratos, E. & Dalas, E. (1998) Conductivity degradation due to thermal aging in conducting polyaniline and polypyrrole. Synthetic Metals, 92(1), 63-67.

157
Sapurina, I. & Stejskal, J. (2008) The mechanism of the oxidative polymerization of aniline and the formation of supramolecular polyaniline structures. Polymer International, 57(12), 1295-1325.
Sapurina, I. Y. & Shishov, M. A. (2012) Oxidative Polymerization of Aniline: Molecular Synthesis of Polyaniline and the Formation of Supramolecular Structures. In: Gomes, D. A. D. S. (ed.) New Polymers for Special Applications. InTech.
Schmidt-Rohr, K. & Chen, Q. (2008) Parallel cylindrical water nanochannels in Nafion fuel-cell membranes. Nature Materials, 7(1), 75-83.
Schnürer, J., Olsson, J. & Börjesson, T. (1999) Fungal Volatiles as Indicators of Food and Feeds Spoilage. Fungal Genetics and Biology, 27(2-3), 209-217.
Sharma, S., Nirkhe, C., Pethkar, S. & Athawale, A. A. (2002) Chloroform vapour sensor based on copper/polyaniline nanocomposite. Sensors and Actuators B: Chemical, 85(1-2), 131-136.
Shin, K.-H., Cho, J., Jang, J., Jang, H. S., Park, E. S., Song, K. & Kim, S. H. (2012) Polypyrrole top-contact electrodes patterned by inkjet printing assisted vapor deposition polymerization in flexible organic thin-film transistors. Organic Electronics, 13(5), 715-720.
Smolander, M. (2008) Freshness Indicators for Food Packaging: John Wiley & Sons, Ltd.
Sotzing, G. A., Phend, J. N., Grubbs, R. H. & Lewis, N. S. (2000) Highly sensitive detection and discrimination of biogenic amines utilizing arrays of polyaniline/carbon black composite vapor detectors. Chemistry of Materials, 12(3), 3.
Srivastava, R. K., Lal, P., Dwivedi, R. & Srivastava, S. K. (1994) Sensing mechanism in tin oxide-based thick-film gas sensors. Sensors and Actuators B: Chemical, 21(3), 213-218.
Stark, W. & Forss, D. A. (1962) A compound responsible for metallic flavour in dairy products: I. Isolation and identification. Journal of Dairy Research, 29(02), 173-180.
Stussi, E., Cella, S., Serra, G. & Venier, G. S. (1996) Fabrication of conducting polymer patterns for gas sensing by a dry technique. Materials Science and Engineering: C, 4(1), 27-33.
Stussi, E., Stella, R. & De Rossi, D. (1997) Chemoresistive conducting polymer-based odour sensors: influence of thickness changes on their sensing properties. Sensors and Actuators B: Chemical, 43(1–3), 180-185.
Subramanian, R., Crowley, K., Morrin, A. & Killard, A. J. (2013) A sensor probe for the continuous in situ monitoring of ammonia leakage in secondary refrigerant systems. Analytical Methods, 5(1), 134-140.
Sun, L., Liu, H., Clark, R. & Yang, S. C. (1997) Double-strand polyaniline. Synthetic Metals, 84(1-3), 67-68.
Tan, K. L., Tan, B. T. G., Kang, E. T. & Neoh, K. G. (1989) X-ray photoelectron spectroscopy studies of the chemical structure of polyaniline. Physical Review B, 39(11), 8070-8073.
Tan, S. & Belanger, D. (2005) Characterization and Transport Properties of Nafion/Polyaniline Composite Membranes. The Journal of Physical Chemistry B, 109(49), 23480-23490.
Tarver, J., Yoo, J. E., Dennes, T. J., Schwartz, J. & Loo, Y.-L. (2008) Polymer Acid Doped Polyaniline Is Electrochemically Stable Beyond pH 9. Chemistry of Materials, 21(2), 280-286.
Terje A. Skotheim, J. R. (2007) Conjugated Polymers: Theory, Synthesis, Properties, and Characterization. Boca Raton, FL: CRC Press.
Thiery, L., Briand, D., Toullier, S. & Teyssieux, D. (2008) Thermal Contact Calibration Between a Thermocouple Probe and a Microhotplate. Journal of Heat Transfer, 130(9), 091601-091601.

158
Thomas Kinkeldei, Christoph Zysset & Tröster, N. M. G. (2012) Influence of Flexible Substrate Materials on the Performance of Polymer Composite Gas Sensors. In: IMCS 2012, Nuremberg, Germany. 537-540.
Timmer, B. & al., e. (2005) Ammonia sensors and their applications- a review. Sensors and Actuators B: Chemical, 107(2), 666-677.
Timmer, B., Olthuis, W. & van den Berg, A. (2005) Ammonia sensors and their applications- a review. Sensors and Actuators B: Chemical, 107(2), 666-677.
Ting, Z., Mubeen, S., Yoo, B., Myung, N. V. & Deshusses, M. A. (2009) A gas nanosensor unaffected by humidity. Nanotechnology, 20(25), 255501.
Tiwari, S., Singh, A. K., Joshi, L., Chakrabarti, P., Takashima, W., Kaneto, K. & Prakash, R. (2012) Poly-3-hexylthiophene based organic field-effect transistor: Detection of low concentration of ammonia. Sensors and Actuators B: Chemical, 171-172(0), 962-968.
Torsi, L., Marinelli, F., Angione, M. D., Dell’Aquila, A., Cioffi, N., Giglio, E. D. Sabbatini, L. (2009) Contact effects in organic thin-film transistor sensors. Organic Electronics, 10(2), 233-239.
Tzou, K. & Gregory, R. V. (1993) A method to prepare soluble polyaniline salt solutions- in situ doping of PANI base with organic dopants in polar solvents. Synthetic Metals, 53(3), 365-377.
Tzou, K. & Gregory, R. V. (1994) Improved solution stability and spinnabilitiy of concentrated polyaniline solutions by using DMPU solvent. In: International Conference on Science and Technology of Synthetic Metals, 1994 (ICSM '94) 222.
Vaddiraju, S. & Gleason, K. K. (2010) Selective sensing of volatile organic compounds using novel conducting polymer–metal nanoparticle hybrids. Nanotechnology, 21(12), 125503.
Vaddiraju, S., Seneca, K. & Gleason, K. K. (2008) Novel Strategies for the Deposition of COOH Functionalized Conducting Copolymer Films and the Assembly of Inorganic Nanoparticles on Conducting Polymer Platforms. Advanced Functional Materials, 18(13), 1929-1938.
Vichi, S., Romero, A., Tous, J., Tamames, E. L. & Buxaderas, S. (2008) Determination of volatile phenols in virgin olive oils and their sensory significance. Journal of Chromatography A, 1211(1-2), 1-7.
Wei, Y. & Hsueh, K. F. (1989) Thermal analysis of chemically synthesized polyaniline and effects of thermal aging on conductivity. Journal of Polymer Science Part A: Polymer Chemistry, 27(13), 4351-4363.
Wessling, B. (1997) In: Nalwa, H. S. (ed.) Handbook of Organic Conductive Molecules and Polymers. New York: Wiley & Sons. ISBN: 978-0-471-96275-5.
Wessling, B. (1999) Conductive Polymers as Organic Nanometals. In: Nalwa, H. S. (ed.) Handbook of Nanostructured Materials and Nanotechnology, Vol.5: Organics, Polymers and Biological materials. Academic Press. ISBN: 9780080533643.
Wessling, B. (2010) New Insight into Organic Metal Polyaniline Morphology and Structure. Polymers, 2(4), 786-798.
Wilkes, J. G., Conte, E. D., Kim, Y., Holcomb, M., Sutherland, J. B. & Miller, D. W. (2000) Sample preparation for the analysis of flavors and off-flavors in foods. Journal of Chromatography A, 880(1-2), 3-33.
Wilkinson, R. A. & Stark, W. (1967) A compound responsible for metallic flavour in dairy products: II. Theoretical consideration of the mechanism of formation of oct-1-en-3-one. Journal of Dairy Research, 34(01), 89-102.
Winther-Jensen, B., Chen, J., West, K. & Wallace, G. (2004) Vapor Phase Polymerization of Pyrrole and Thiophene Using Iron(III) Sulphonates as Oxidizing Agents. Macromolecules, 37(16), 5930-5935.

159
Winther-Jensen, B. & West, K. (2004) Vapor-Phase Polymerization of 3,4-Ethylenedioxythiophene: A Route to Highly Conducting Polymer Surface Layers. Macromolecules, 37(12), 4538-4543.
Wojkiewicz, J. L., Bliznyuk, V. N., Carquigny, S., Elkamchi, N., Redon, N., Lasri, T., Pud, A. A. & Reynaud, S. (2011) Nanostructured polyaniline-based composites for ppb range ammonia sensing. Sensors and Actuators B: Chemical, 160(1), 1394-1403.
Wu, Z., Chen, X., Zhu, S., Zhou, Z., Yao, Y., Quan, W. & Liu, B. (2013) Enhanced sensitivity of ammonia sensor using graphene/polyaniline nanocomposite. Sensors and Actuators B: Chemical, 178(0), 485-493.
Xia, Y., Wiesinger, J. M., MacDiarmid, A. G. & Epstein, A. J. (1995) Camphorsulphonic Acid Fully Doped Polyaniline Emeraldine Salt: Conformations in Different Solvents Studied by an Ultraviolet/Visible/Near-Infrared Spectroscopic Method. Chemistry of Materials, 7(3), 443-445.
Xu, C., Wang, P. & Bi, X. (1995) Continuous vapor phase polymerization of pyrrole. I. Electrically conductive composite fiber of polypyrrole with poly(p-phenylene terephthalamide). Journal of Applied Polymer Science, 58(12), 2155-2159.
Xu, C. N., Miura, N., Ishida, Y., Matsuda, K. & Yamazoe, N. (2000) Selective detection of NH3 over NO in combustion exhausts by using Au and MoO3 doubly promoted WO3 element. Sensors and Actuators B: Chemical, 65(1-3), 163-165.
Xu, J., Yao, P., Jiang, Z., Liu, H., Li, X., Liu, L., Li, M. & Zheng, Y. (2012) Preparation, morphology, and properties of conducting polyaniline-grafted multiwalled carbon nanotubes/epoxy composites. Journal of Applied Polymer Science, 125(S1), E334-E341.
Yoon, H. (2013) Current Trends in Sensors Based on Conducting Polymer Nanomaterials. Nanomaterials, 3(3), 524-549.
Yu, J., Yu, X., Zhang, L. & Zeng, H. (2012) Ammonia gas sensor based on pentacene organic field-effect transistor. Sensors and Actuators B: Chemical, 173(0), 133-138.
Yu, X., Zhou, N., Han, S., Lin, H., Buchholz, D. B., Yu, J., Chang, R. P. H., Marks, T. J. & Facchetti, A. (2013) Flexible spray-coated TIPS-pentacene organic thin-film transistors as ammonia gas sensors. Journal of Materials Chemistry C, 1(40), 6532-6535.
Yue, J. & Epstein, A. J. (1991) XPS study of self-doped conducting polyaniline and parent systems. Macromolecules, 24(15), 4441-4445.
Zagorska, M., Kulszewicz-Bajer, I., Blet, O., Zawirska, P., Dufour, B., Rannou, P. & Pron, A. (2003) Solution processible poly(aniline) via doping with diesters of sulphosuccinic acid. Synthetic Metals, 138(3), 543-548.
Zhang, T., Nix, M. B., Yoo, B.-Y., Deshusses, M. A. & Myung, N. V. (2006) Electrochemically Functionalized Single-Walled Carbon Nanotube Gas Sensor. Electroanalysis, 18(12), 1153-1158.
Zhu, W., Miser, D. E., Geoffrey Chan, W. & Hajaligol, M. R. (2004) HRTEM investigation of some commercially available furnace carbon blacks. Carbon, 42(8–9), 1841-1845.
Zucolotto, V., Avlyanov, J., Gregorio, R. & Mattoso, L. H. C. (2004) Melt processing of composites of PVDF and carbon black modified with conducting polymers. Journal of Applied Polymer Science, 94(2), 553-557.

160
CHAPTER VI
6. CONCLUSIONS & FUTURE WORK
6.1. Conclusions
The primary goal of the FlexSmell project was to realise printable chemical sensing
tags capable of remotely monitoring food quality by means of wireless technologies.
My role as a PhD candidate was to develop chemiresistors based on conducting
polymers on plastic substrates using solution processing methods which are
compatible with large-area manufacturing. The spoilage mechanisms in different food
categories were studied and the major chemical vapours produced during food decay
process were reviewed. Having done that, ammonia was selected as the target analyte
for this study.
Polyaniline-based chemiresistors were successfully made on plastic substrates for
detecting sub-ppm concentrations of ammonia vapour in air. As discussed in Chapter
II, the electrical resistance of emeraldine salt, the conducting form of PANI, changes
upon exposure to basic NH3 molecules due to their influence on charge carriers’
transport inside the polymer. This is the underlying principle which enables polyaniline
to be used as an ammonia sensing layer. However, ammonia detection using
conventional polyaniline sensors is limited to ppm level concentrations. This problem,
together with slow recovery of the sensors after exposure to ammonia, drives the need
for more sensitive and reliable polyaniline-based ammonia sensors. Moreover, like
other conjugated polymers, conducting PANI suffers from poor solution- and melt-
processability which hinders the manufacturing of PANI-based devices.
In this thesis, we have adopted two approaches to produce solution processable
polyaniline formulations that can be used to produce PANI sensing layers. The first
strategy, discussed in Chapter III, was to exploit multifunctional dopants such as
sulphosuccinic acid to simultaneously dope and solubilise polyaniline in NMP. In order

161
to enhance the conductivity and sensing performance of these formulations, carbon
nanoparticles were added to the system. Hybrid composites with uniform nanoparticle
dispersion were prepared by mixing a polyaniline solution and surface-modified carbon
nanoparticles. Spin coated PANI hybrid composites on Kapton and PEN substrates,
exposed to sub-ppm concentrations of ammonia in air, showed high sensitivity, rapid
response and recovery, and good repeatability when operated at elevated
temperatures. The sensor outperforms a commercial ammonia MOS sensor (Synkera
P/N 705) in terms of sensitivity, while consuming much less power.
In attempt to enhance the sensitivity even further, and to make the fabrication
process compatible with low-cost organic electronics manufacturing, a two-step
vapour-phase deposition polymerisation method was developed to produce polyaniline
sensing layers directly on a plastic substrate (Chapter IV). Poly(acrylic acid), poly(4-
styrenesulphonic acid) and Nafion were used as polymeric acid dopants in VDP-made
polyaniline sensing layers. All sensors showed sensitive response to NH3 vapour at
sub-ppm level. The PSSA-doped sensor operated at ~80 ºC demonstrated enhanced
recovery and repeatability under both dry and humid conditions. Using Nafion as the
dopant resulted in a sensor operational at room temperature.
Finally, the VDP method was utilised to make stable PSSA-doped PANI-based
ammonia sensors on printed polymeric micro-hotplates with ~1 mm2 sensing area. The
design and development of these devices which allowed reliable operation at ~95 °C
with power consumptions as low as 35 mW were described in Chapter V. The heated
sensor showed sensitive and rapid response in exposure to ammonia vapour over the
concentration range of 250 ppb-3.65 ppm. The effect of water vapour on ammonia
sensing was described based on the competitive sorption of NH3 and H2O molecules
into the sensing layer. The sensor was found to be highly specific to ammonia with
respect to several VOCs including methanol and ethanol.
The methods described in this thesis can be employed to fabricate versatile and high
performing ammonia detectors not only for food, but also for air and water quality
monitoring applications. Such devices may be incorporated in smart RFID tags where
low-cost, low-power consumption, flexibility and compatibility with printing processes
are of crucial importance.
6.2. Future work
Further work is needed to establish the exact dynamic range of both hybrid
composite and VDP-made ammonia sensors. The maximum studied exposure
concentrations were 2.25 and 3.65 ppm for SSA-doped PANI/CB hybrid

162
nanocomposite and PSSA-doped vapour-phase deposited PANI, respectively. Apart
from food quality, another potential application of special interest is the sensors’
response behaviour over the range of 10-100 ppm for water quality monitoring
applications. To achieve this, anhydrous ammonia cylinders with standard
concentration (100 or 1000 ppm) can replace somehow-limited permeation tubes in the
automatic vapour generation system. Moreover, the influence of higher humidity values
on the sensing behaviour has to be investigated. The maximum studied absolute
humidity was 15000 mg m-3 which corresponds to 80% relative humidity at 20 ºC. For
many applications where the headspace of a water sample needs to be tested, the
relative humidity values may reach 90-100%.
The optimum operating temperature for the sensors was found to be around 80 ºC.
This value gave a compromise between response magnitude and recovery rate.
Depending on the application, it is possible to establish different operating
temperatures. For instance, if recovery is not critical (e.g., when the sensor is meant to
be used in a disposable alarm system, like in the FlexSmell’s food spoilage detector
tag) the sensor can be operated at room temperature in order to achieve higher
response magnitude/sensitivity. Otherwise, the sensor can be heated to accelerate
sensor regeneration. The maximum operating temperature for the sensors was not
assessed. However, the PSSA-doped PANI made by VDP was operational even at 95
ºC for short term measurements. The good thermal stability of these materials in
comparison to conventional doped polyaniline was attributed to the presence of the
polymeric dopant in the complex. For hybrid composite sensors, the TGA curves of
multifunctional-doped PANI suggest that these materials are stable at temperatures
exceeding 100 ºC. Designed experiments are needed to determine the thermal stability
of the sensors.
The range of multifunctional dopants for hybrid PANI nanocomposites, as well as
polymeric dopants in the VDP process can be extended further. This may result in
enhanced sensing performance and/or specificity of the sensors. The hybrid composite
PANI sensors doped with 4-sulphophthalic acid did not show measureable response to
sub-ppm concentrations of ammonia vapour, while SSA-doped PANI hybrid composite
sensing layers showed sensitivity values of up to ~1.5 % ppm-1. Therefore, the dopant
nature can significantly influence the final sensing properties. A VDP-made PANI
sensor doped with PAA was used as a platform for biomolecules immobilisation as a
proof of concept to fabricate biosensor with high specificity. Although only GFP
immobilisation was realised, there is a huge potential for functionalising the sensing
layer with chemically-sensitive biomolecules, such as enzymes and receptor proteins.
Finally, the same fabrication concepts, i.e. dopant engineering and vapour-phase

163
deposition polymerisation can be used to produce sensing layers based on other
conjugated polymers including polypyrrole and polythiophene. Research is ongoing in
this area.
Our preliminary results of the headspace measurement on the raw salmon fish and
boiled egg samples clearly indicate that it is not practical to monitor food quality using a
‘single’ sensor. This is mainly due to the very complex nature of the volatile
composition of the headspace during food spoilage. Although ammonia is reported to
evolve as a result of the deterioration of aforementioned food samples, it is not yet
elucidated at what exact step(s) this volatile is being released; neither is clear the
influence of environmental parameters (like temperature and humidity), as well as the
pH of the medium, on the decay process and ammonia concentration in the
headspace. One approach to overcome this problem would be to utilise a sensing
array consisting of several sensing elements with different sensitive layers and various
transduction mechanisms. Such functionality is envisaged in the final FlexSmell
sensing tag.
In order to realise the final FlexSmell sensing tag, several partners including UMAN,
EPFL, TNO and EKUT have collaborated, and the outcome of the research at each
node has been integrated into the final device. Depicted in Figure 6-1 is the conceptual
layout of the FlexSmell platform tag which includes: one or more sensor chips (different
technologies and transducer principles), printed circuitry on flexible polymeric substrate
(PET and PEN), electronic read-out (circuitry, discrete component and silicon chips),
power supply (thin battery) and wireless communication (high frequency HF antenna).
Figure 6-1. Conceptual design of the FlexSmell tag.

164
Figure 6-2. Image of the RFID FlexSmell tag including the sensor chip for temperature
and humidity which connects to the tag by a standard ZIF connector.
The actual fabricated RFID FlexSmell tag (the 1st version), indicating its main
components, is shown in Figure 6-2. The main circuitry and antenna of the tag were
fabricated using screen printing of silver-based ink, while the discrete components and
chips were integrated using anisotropic conductive adhesives. The inkjet-printed chip
platform that includes temperature and humidity sensors has already been fabricated
and validated by EPFL and TNO nodes. At the moment, the next version of the multi-
sensing platform including the heater and two resistive sensors, two capacitive sensors
and a resistive temperature sensor is under development (Figure 6-3). On a 250 µm-
thick PET substrate the first metal layer (silver-based nanoparticles) including the
capacitors, heater, temperature sensor and resistive sensors (optional – they could be
printed in the second layer on top of heater) was inkjet-printed. Electrodeposition of
nickel was performed on the temperature sensor in order to increase the temperature
coefficient of resistance and passivate the silver. Next, a dielectric layer (dry film
photoresist PerMX 3014) of 14 µm of thickness was laminated at low temperatures (<
85 °C) in order to separate the heater from the sensing devices. The second metal
layer was inkjet-printed, which includes the resistive sensors on top of the dry film and
heater. The capacitive structures are envisaged to be used as differential humidity
sensors (one of them used as reference to remove the effect of the substrate). The
resistive structures are envisaged to be used to detect volatile compounds (e.g., for
detecting ammonia using a conducting PANI layer casted on top of the device). The
Reader
AntennaSensor chip
Read-out
ZIF
Batterycontacts
RFID

165
heater is foreseen to be used as a chemical reset, in order to bring the signal back to
the baseline after a specific test. The heater in combination with the resistive sensor for
ammonia detection has already been validated (Chapter V). Validation of more
analytes and analyte mixtures (using different conducting polymers/sensing layers) is
undergoing at EKUT and UMAN.
Figure 6-3. Schematic of the inkjet-printed multi-sensor chip platform, including two capacitive sensors, two resistive sensors, a heater and a temperature sensor.

166
APPENDICES
APPENDIX I: Food spoilage
As mentioned in Chapter I and II, it is crucial to understand the food deterioration
mechanisms as well as the volatile compounds evolving during this process in order to
develop a gas sensing system for detecting spoilage in its early stages. Here, we
intend to give a brief overview of the two main kinds of food spoilage: microbial
deterioration and (bio)chemical changes.
Microbial deterioration
Food spoilage due to contamination by microorganisms results in production of a wide
range of chemicals including volatile compounds such as alcohols, ketones, aldehydes,
esters, carboxylic acids, sulphur- and nitrogen- containing compounds (Pasanen et al.,
1996). These compounds represent both primary and secondary metabolites. The
microbial spoilage which can lead to putrid, ammoniacal, musty/mouldy odours in a
range of products is mainly due to sulphur-containing volatiles and volatile amines
(Hodgins and Sirnmonds, 1995). Meat and poultry serve as the growth media for many
microorganisms responsible for the food off-flavour. Many factors, such as substrate,
temperature, oxygen concentration, age of the culture and microbial species have been
observed to affect the composition of volatiles.
Volatile compounds can be characterised on the basis of the involved
microorganisms, which are mainly bacteria and fungi:
a) Bacterial volatiles
Volatiles produced by bacteria generally come from the proteolytic degradation of
proteins as well as carbohydrates. Released compounds are generally methylamine,
dimethylamine, trimethylamine and ammonia. They can also be sulphur-based like
hydrogen sulphide, methyl mercaptan, dimethyl disulphide, derived from sulphur

167
containing amino acids such as cysteine and methionine (Gibson et al., 1997). Several
types of volatile compounds, including ammonia, amines, indole, and sulphur
compounds are produced by microorganisms such as Pseudomonas spp. growing in
meats. Pseudomonas spp. are one the most common spoilage organisms for milk,
cheese, meat, and fish, due to their metabolic diversity and ability to grow at low
temperatures. Food spoilage due to Pseudomonas may occur in different ways: in
foods of animal origin the non-protein nitrogen fraction will be first metabolized.
Subsequently, the production of lipases or proteases will release fatty and amino acids
which can also result in off-odours, off-flavours and rancidity (Huis in't Veld, 1996).
Some anaerobic organisms such as Clostridium laramie can produce hydrogen
sulphide in beef even at low temperatures. Other bacteria, including Brochothrix
thermosphacta, Carnobacterium spp., Enterobacteriaceae and Shewanella
putrefaciens, produce a cheesy odour in refrigerated beef and pork, which is
associated with the formation of acetoin diacetyl and 3-methylbutanol (Borch et al.,
1996). Lactobacillus spp. and Leuconostoc spp. are lactic acid bacteria and they have
been identified as the major spoiling microorganisms of vacuum-packed meat and
poultry (Belitz H. D., 2004). Off-odours in ice-packed fish and seafood are produced
during spoilage by different microorganisms, including Pseudomonas spp.,
Acinetobacter spp., Moraxella spp. and Shewanella putrefaciens (Chinivasagam et al.,
1998).
Milk and other dairy products are excellent growth media for many types of off-flavour
microbes, such as Pseudomonas fluorescens, P. fragi, P. putida and P. aeruginosa
(Vichi et al., 2008). Pseudomonas fragi produces ethyl butyrate and ethyl hexanoate in
refrigerated milk with a strawberry-like odour. Psychrotrophic strains of Bacillus cereus,
which frequently survive pasteurization and grow in milk at 7 °C, produce a sweet
curdling and then a bitter off-flavour (Wilkes et al., 2000). Hydrogen sulphide,
methanethiol and esters are off-odours attributed to the vegetable spoilage. Not only
off-odours can indicate the presence of bacteria, but also they can be used to specify
the degree of spoilage.
b) Fungal volatiles
Contamination of foods and beverages by yeasts and moulds has been extensively
reported in fresh seafood, packaged meats, milk, cereals and fresh vegetable. The
deterioration of food properties is often due to the production of exoenzymes during
growth. Moulds can produce a vast number of enzymes: lipases, proteases, and
carbohydrases. Once inside the food, these enzymes may continue their activities
independent of destruction or removal of the mycelium. The enzymatic activities may
give rise to flavours like musty odours in wine and dried fruits. This is caused by the

168
fungal transformation of 2,4,6-trichlorophenol to trichloroanisole by Penicillium
brevicompactum, P. crustosum, Aspergillus flavus and other species.
Moulds can produce volatiles such as dimethyl disulphide, geosmin and 2-
methylisoborneol, which can affect the quality of foods and beverages even when
present in very small amounts (Filtenborg et al., 1996). The fungi tend to attack
foodstuffs with a high carbohydrate content producing alcohols and esters, such as
ethanol and ethyl acetate, which are considered to be pleasant smelling by humans.
Saccharomyces cerevisiae is one of the most commonly isolated food contaminating
yeasts. During branched chain amino acid catabolism, it forms alcohols like 3-methyl-1-
butanol from leucine and 2-methyl-1-propanol from valine catabolism. Pichia anomala
which is associated with the spoilage of cakes and pastry is further known to produce
large quantities of ethyl acetate which gives an off-odour.
Fungi can degrade triacylglycerols to free fatty acids which provide a carbon and
energy source. The important food spoilage fungi Aspergillus, Penicillium,
cladosporium, and Fusarium have all been shown to produce volatile methyl ketones
and secondary alcohols from medium chain fatty acids (Schnürer et al., 1999). Marked
differences in the production of volatile metabolites have been reported between
closely related species and even between strains of the same fungus (Boerjesson et
al., 1993; Gibson et al., 1997).
Moulds can also spoil food through the formation of toxic secondary metabolites,
mycotoxins. One mycotoxin may be produced by several species, while many different
mycotoxins may be produced by the same mould species. Some volatile compounds
are correlated to the presence of mycotoxins in food. For example, volatile terpenes
are released by Fusarium sporotrichoides during the formation of mycotoxins on cereal
grains and straw (Schnürer et al., 1999).
(Bio)chemical changes
Although microbial contamination is an important cause for food spoilage, natural food
decay occurs even in the absence of any microorganism. Foods contain a number of
constituents which may undergo (bio)chemical changes during preparation and
processing. These constituents may either react with other constituents or simply
degrade into off-flavour compounds. External harsh conditions such as extreme heat,
light and humidity accelerate these processes. The major reactions leading to off-
flavours include: lipid oxidation, photocatalysis reactions, non-enzymatic browning
(Maillard reaction) and enzymatic changes (Intarapichet, 1996).
a) Lipid oxidation

169
Edible oils and fats may be of vegetable or meat origin. The deterioration of fats is
usually described as “rancidity” which arises from partial decomposition due to the
action of heat, light, and contamination by certain metals or by the presence of
microorganisms. There are basically two kinds of rancidity known as “oxidative” and
“hydrolytic” (soapy rancidity). Oxidative rancidity arises from the action of oxygen (in
air) on the fats. The rate of non-enzymatic or chemical oxidation of fatty acids is related
to the number of double bounds in the carbon chain of the molecule. Thus fish and
vegetable oils with the greatest proportions of polyunsaturated fatty acids tend to be
less stable to rancidity. Chemical oxidation of fatty acids in food can be catalysed by
light and certain metals, especially iron and copper and the metallo-proteins (e.g.,
hemoglobin, myoglobin, etc.) and even metallo-enzymes (e.g., catalase, peroxidase,
etc.).
Phospholipids have also been shown to easily oxidise or discolour during heating or
prolonged storage. The highly unsaturated fatty acids in the phospholipid molecules
are susceptible to oxidation and lead to the formation of strongly flavoured
decomposition products at early stages of the oxidation process.
Lipid oxidation typically involves the reaction of the molecular oxygen with
unsaturated fatty acids via a free radical mechanism. Lipid hydroperoxides are
normally flavourless and very unstable and break down to produce short chain VOCs
like saturated and unsaturated aldehydes, ketones and alcohols (Intarapichet, 1996).
These primary reaction products can undergo further oxidation if unsaturated, or
secondary reactions to yield a host of off-flavour volatiles. The final products are
generally aldehydes, ketones, acids, alcohols, hydrocarbons, furans, lactones or
esters. The unsaturated aldehydes and ketones have the lowest sensory thresholds
and are therefore, most often cited with being responsible for oxidised flavours.
Methyl ketones, lactones and esters are also formed primarily by hydrolytic reactions.
Methyl ketones contribute a piercing sweet fruitiness. Some aliphatic acids contribute
to the flavour by being sour, fruity, cheesy or animal-like. Their contribution depends on
the number of carbons and their flavour threshold.
The off-flavour due to oxidative changes in meats following the cooking is generally
called “warmed-over flavour” and is basically the result of oxidation of the intramuscular
phospholipid. The compounds responsible for warmed-over flavour are n-hexanal and
2-pentyl furan. These chemicals are the source of the undesirable flavour of many lipid-
containing foods. The 2-thiobarbituric acid (TBA) test is often used to measure
oxidative deterioration of meat fats. An increase in TBA number is found to correlate
with a decrease in phospholipids and phospholipid polyunsaturated fatty acids.

170
The most commonly used terms to describe the oxidised flavours in milk are “cabby”,
“cardboard”, “metallic”, “oily” and “tallow”. The polyunsaturated fatty acids in the
phosphatides at the interface of the milk fat globules are considered as the precursors
of the flavours. Most of off-flavours in oxidised milk are from aldehydes group.
b) Photo-induced off-flavours
Off-flavours may be produced via photocatalysis reactions in food. “Skunky” or “sun-
struck” flavour in beer and “burnt feathers” in dairy products are two of the more unique
examples of off-flavours in food due to light exposure. Methional is found to be the
major compound responsible for the activated flavour in milk. Strecker degradation
plays a role in converting methionine into methional, ammonia and carbon dioxide
(Intarapichet, 1996). Free radicals from methionine, methional and cysteine are found
to combine to form methanethiol, dimethyl disulfide and dimethylsulfide.
Like dairy products, the photo-induced change in beer flavour is complex and
involves photo-oxidation of lipids, photocatalysed decarboxylation and deamination of
amino acids and hydrolysis of the isohumulones. Unlike dairy products, however, beer
will take on an initial off-flavour often characterised as being skunky. This skunky off-
odour is attributed to the photocatalysed degradation of the isohumulones in hops,
resulting in 3-methyl-2-butene-1-thiol.
c) Thermally-induced off-flavours
Many flavour compounds found in cooked food or processed foods occur as the result
of reactions common to all types of foods regardless of whether they are of animal,
plant or microbial origin. These reactions take place when suitable reactants are
present and appropriate conditions (heat, pH, and light) exist. The flavours derived
from thermally induced reactions may or may not be desirable. Thermal degradation is
often studied in association with non-enzymatic browning.
d) Non-enzymatic browning
While non-enzymatic browning is very important to the production of desirable flavour,
it is also a primary source of undesirable flavours in food. When food is heat processed
or stored for long periods of time, a number of chemical reactions occur. Among these
is the Maillard reaction. The Maillard reaction is the reaction of an aldehyde (usually a
reducing sugar) with an amino acid in its initial stages, which is promoted by heat. As a
result of the initial interaction of sugars and amines, volatiles are produced, and dark-
coloured polymeric materials arise. This reaction is responsible for many flavours and
colours in foods: the browning of steak, toasted bread and biscuits, chips and roasted
coffee. Generally, volatiles are formed in browning reactions from the interaction of α-
dicarbonyl compounds (intermediate compounds in the Maillard reaction) with amino
acids through the Strecker degradation reaction. Although some flavour compounds
171
are acyclic, many are heterocyclic, with nitrogen, sulphur, or oxygen substituent in
common. Some heterocyclic compounds associated with heating or browning of foods
are pyrazine, pyridine, trithiane, γ-pyrone, thiophene, furan, thiazole, trithiolane,
pyrrole, oxazole, 3- thiazoline and tetrahydrothiophene.
e) Enzymatic flavour changes
Direct enzymatic degradation is termed as autolysis and can cause undesirable
changes in colour, texture and flavour in uncooked foods rich lipids and proteins. Two
types of enzymes responsible for lipid degradation are lipoxygenases and lipases
(Wilkes et al., 2000). Lipoxygenase catalyses the hydro-peroxidation of
polyunsaturated fatty acids leading to the formation of hydro-peroxides, which are
subsequently degraded to form a variety of secondary products responsible for the off-
flavour. This enzyme is widely distributed in great variety of plants and animal tissues.
Soybean contains substantial amount of lipoxygenase enzymes. The grassy flavour of
soybeans is due to the linoleic acid hydro-peroxide produced by lipoxygenases
released in the damaged tissues of the bean. Lipoxygenase are present in fish and
meat and they can oxidise polyunsaturated fatty acids and produce short chain
carbonyls responsible for the oxidative off-flavour. Off-flavour can arise from lipase
activity in other types of foods as well. Lipolised flavour is due to the hydrolysis of fatty
acids from triglycerides. Lipases produce a significant off-flavour in foods containing
short chain fatty acid, such as dairy and oil products. The milk lipases catalyse the
hydrolysis of triglycerides and they cause the common flavour decrypted as rancid,
butyric or bitter.
Degradation of proteins by proteases has important implications for the quality of
many foods. These include beneficial effects in the development of desirable features,
such as texture and flavour, e.g. in cheese manufacturing, meat tenderisation, beer
brewing and fish manufacturing. However, protease can also produce unpleasant
flavours. Bitterness in foods is an off-flavour that may occur due the action of
proteinases. This is caused frequently by proteolysis of some peptide and amino acids,
eliciting bitter flavour in soy products, casein and cheddar cheese (Intarapichet, 1996).
In summary, food spoilage is indeed a complex phenomenon, in which a combination
of microbial and (bio)chemical activities may interact. The microbiology of food
spoilage has received considerable attention over the past years; however the major
problem is to find the relationship between the microbial composition and the presence
of microbial metabolites related to the microbial spoilage. Although the detection levels
for the compounds formed during (bio)chemical spoilage are generally low and thus
more accessible, a major disadvantage is that the (bio)chemical processes related to

172
food spoilage appear to be poorly understood. Even less is known about interactions
between microbial and chemical spoilage reactions.

173
References
Belitz H. D., G. W., Schieberle P. (2004) Food Chemistry. Chapter 5. Springer-verlag. ISBN: 9783540699330.
Boerjesson, T. S., Stoellman, U. M. & Schnuerer, J. L. (1993) Off-odorous compounds produced by molds on oatmeal agar: Identification and relation to other growth characteristics. Journal of Agricultural and Food Chemistry, 41(11), 2104-2111.
Borch, E., Kant-Muermans, M.-L. & Blixt, Y. (1996) Bacterial spoilage of meat and cured meat products. International Journal of Food Microbiology, 33(1), 103-120.
Chinivasagam, H. N., Bremner, H. A., Wood, A. F. & Nottingham, S. M. (1998) Volatile components associated with bacterial spoilage of tropical prawns. International Journal of Food Microbiology, 42(1-2), 45-55.
Filtenborg, O., Frisvad, J. C. & Thrane, U. (1996) Moulds in food spoilage. International Journal of Food Microbiology, 33(1), 85-102.
Gibson, T. D., Prosser, O., Hulbert, J. N., Marshall, R. W., Corcoran, P., Lowery, P., Ruck-Keene, E. A. & Heron, S. (1997) Detection and simultaneous identification of microorganisms from headspace samples using an electronic nose. Sensors and Actuators B: Chemical, 44(1-3), 413-422.
Hodgins, D. & Sirnmonds, D. (1995) The electronic nose and its application to the manufacture of food products. Journal of Automatic Chemistry, 17(5), 179-185.
Huis in't Veld, J. H. J. (1996) Microbial and biochemical spoilage of foods: an overview. International Journal of Food Microbiology, 33(1), 1-18.
Intarapichet, K.-O. (1996) Off-flavours in foods: 3. Chemical changes. Suranaree Journal of Science and Technology, 3(1), 9.
Pasanen, A. L., Lappalainen, S. & Pasanen, P. (1996) Volatile organic metabolites associated with some toxic fungi and their mycotoxins. Analyst, 121(12), 1949-1953.
Schnürer, J., Olsson, J. & Börjesson, T. (1999) Fungal Volatiles as Indicators of Food and Feeds Spoilage. Fungal Genetics and Biology, 27(2-3), 209-217.
Vichi, S., Romero, A., Tous, J., Tamames, E. L. & Buxaderas, S. (2008) Determination of volatile phenols in virgin olive oils and their sensory significance. Journal of Chromatography A, 1211(1-2), 1-7.
Wilkes, J. G., Conte, E. D., Kim, Y., Holcomb, M., Sutherland, J. B. & Miller, D. W. (2000) Sample preparation for the analysis of flavors and off-flavors in foods. Journal of Chromatography A, 880(1-2), 3-33.

174
APPENDIX II: Dissemination
Publications
“Development of a New Generation of Ammonia Sensors on Printed Polymeric
Hotplates”, Danesh, E., Molina-Lopez, F., Camara, M., Bontempi, A., Vásquez
Quintero, A., Teyssieux, D., Thiery, L., Briand, D., de Rooij, N. F., Persaud, K. C.;
Submitted to the Journal of Analytical Chemistry; (2014).
“Flexible Ammonia Sensors Based on Polyaniline/Carbon Black Composites
Operating at Elevated Temperatures”, Danesh, E. and Persaud, K. C.; AMA
Association Proceedings - The 14th International Meeting on Chemical Sensors
(IMCS 2012), Nuremberg, Germany; P1.8 (2012) 1134-1136.
[DOI:10.5162/IMCS2012/P1.8.9]
“Printed Micro-hotplates on Flexible Substrates for Gas Sensing”, Camara, M.,
Molina-Lopez, F., Danesh, E., Mattana, G., Bontempi, A., Teyssieux, D., Thiery, L.,
Breuil, P., Pijolat, C., Persaud, K., Briand, D., de Rooij, N.F.; Proceedings of the
17th International Conference on Solid-State Sensors, Actuators and Microsystems
(TRANSDUCERS & EUROSENSORS 2013), Barcelona, Spain; (2013) 1059 - 1062.
[DOI:10.1109/Transducers.2013.6626953]
Conference presentations
“Facile Fabrication of Highly Sensitive Nanoporous Polyaniline-based Ammonia
Sensors on Flexible Substrates by Vapour-phase Deposition Polymerisation”,
Danesh, E. and Persaud, K. C.; the 15th International Symposium on olfaction and
Electronic Nose (ISOEN 2013), EXCO, Daegu, South Korea; July 2013. [Talk]
“Hybrid Composites of Polyaniline/Modified Carbon Nanoparticles Employed as
Highly Sensitive Ammonia Sensors on Flexible Substrates”, Danesh, E; Angione, M.
D., Persaud, K. C.; the Nanosensor Technologies for Monitoring- materials and
methods, the Royal Society of Chemistry, London, UK; Nov. 2012. [Talk]
“Sensors for Volatile Chemicals: Room Temperature Ammonia and Humidity
Sensing”, Danesh, E. and Persaud, K. C., European Chemoreception Research
Organization conference (ECRO 2013), Leuven, Belgium; Aug. 2013 [Poster]
“Fabrication of Polyaniline-based Ammonia Sensors on Plastic µ-Hotplates”,
Danesh, E., Molina-Lopez, F., Camara, M., Bontempi, A., Vásquez Quintero, A.,
Teyssieux, D., Thiery, L., Briand, D., de Rooij, N. F., Persaud, K. C.; Air Quality

175
Monitoring: New Technologies, New Possibilities, the Royal Society of Chemistry,
London, UK; Dec. 2013. [Poster]
“Highly Sensitive Detection of Ammonia Using Solution Processable
Polyaniline/Carbon Black Composite Sensors”, Danesh, E. and Persaud, K. C.; The
International Symposium on Olfaction and Taste (ISOT 2012), Stockholm, Sweden;
June 2012 [Poster]
Awards
Winner of the Wolfgang Göpel Award; the International Society for Olfaction and
Chemical Sensing (ISOCS), July 2013.
Winner of the first prize in the oral presentations at the PGR 2013 conference; the
University of Manchester- School of Chemical Engineering & Analytical Science,
June 2013.
Copyright © 2022 FDOKUMEN