Image-Based Monitoring of Cracks: Effectiveness Analysis of ...

METALL OGRAPH Y 21: 77 -90 (1988) 77
Plastic Deformation Around Fatigue Cracks
YUCEL BIROL
Department of Materials Science and Engineering, Case Western Reserve University, Cleveland, Ohio 44106
The formation of a plastic deformation zone with fatigue crack propagation was observed and analyzed with surface roughness and etch-pit techniques on a macro scale. Both tech- niques were calibrated with respect to plastic strain in order to characterize the strain dis- tribution within the plastic zone. Side surfaces and interior longitudinal and transverse cross- sections were evaluated. The crack growth kinetics were correlated with the evolutional characteristics of the plastic zone.
Introduction
Within the framework of continuum mechanics, it has been assumed that fatigue crack propagation (FCP) is insensitive to microstructure when the crack length is larger than the microstructural characteristic dimension. This would indicate a monotonically increasing crack prop- agation rate until general instability is reached (Fig. la). In real life, how- ever, crack propagation is nonmonotonic and consists of brief periods of accelerations and decelerations (Fig. lb). The variations in FCP rates are possibly due to variations in microstructure whose deformability has to be exhausted at the crack tip for crack propagation to occur. Conse- quently, the crack tip plasticity is a governing factor in growth kinetics. For ductile materials, the ability to deform plastically prior to fracture allows a plastic zone to form at the crack tip before crack extension takes place. Cracks, therefore, propagate through a deformed region which has different structural and mechanical characteristics from the virgin ma- terial. The properties of the crack tip plastic zone are of fundamental importance for the characterization of the resistance to crack propagation.
© Elsevier Science Publishing Co., Inc., 1988 0026-0800/88/$3.50 52 Vanderbilt Ave., New York, NY 10017

78 Y. Birol
/_e . . . . . . . . . . . . . . . . . . . . . . I
E
no of cycles no of cycles A B
Fro. 1. Schematic illustration of(a) "smoothened" and (b) actual crack growth kinetics.
Various experimental techniques have been used to study crack tip plastic zones. Among these are etching [I-4], microhardness measure- ments [5-7], optical interferometry [8, 9], x-ray microbeam [10, 11], trans- mission electron microscopy [12, 13], electron channeling [14-17], re- crystallization [18], and metallographic [19] methods. These techniques allow direct or indirect observation of plastic zones. In the present study, the plastic deformation that accompanies fatigue crack propagation was analyzed on the surface and in the interior of fatigue specimens. Both stable and unstable growth regimes were evaluated. An effort was made to relate the evolutional characteristics of the plastic zone to the non- monotonic nature of crack growth kinetics.
Experimental
An iron-silicon alloy with 2.6 wt%Si was used. Annealing at 980°C for 2.5 hr produced a grain size of about 100 Ixm. In the annealed condition, it had a yield strength of 538 MPa and the elastic modulus was 207 GPa. Single-edge-notched specimens, with a length-to-width ratio of 4, were used for fatigue testing. The length and thickness dimensions were 70 mm and 2.3 mm, respectively. Notches were 1.5 mm deep and had a 60 ° opening angle.
Fatigue tests were conducted in laboratory air with a servo-hydraulic MTS machine. Crack propagation and plastic zone evolution were mon- itored with a travelling microscope and were recorded on a video tape. Specimens were cycled in tension-tension, at a frequency of 5 Hz, with
Plastic Deformation Around Fatigue Cracks 79
an R ratio (R = Pr, in/P~ax) of 0.1. The maximum load in a fatigue cycle w a s P m a x = 0.4Py (Py" yield load). Sinusoidal wave form was used.
Prior to fatigue testing, specimens were polished to obtain a mirror surface in order to be able to observe the evolution of the plastic zone during crack propagation. Plastic deformation is visible on the surface by slip-induced roughness which is referred to as "orange peel" structure [20]. This is a commonly observed deformation phenomenon due to the different flow properties of neighboring grains with different orientations. As the roughness develops on the surface of the specimens only when the yield stress of the material is exceeded, the boundary between the plastically and elastically deformed regions is easily distinguished. Such an analysis, however, provides information about the plasticity of the surface layer only. The geometry of the plastic zone (shape and size) is expected to change as the stress state goes from plane stress at the spec- imen surface to plane strain in the interior of a specimen. The etch-pit technique was employed to reveal the plastic zone on interior longitudinal and transverse cross-sections.
Information about the etching response of plastically deformed material was required in order to determine the strain distribution within the plastic zone. For this purpose, calibration studies were carried out. Strips of Fe- 2.6%Si were deformed in tension to plastic strains ranging from 0.02- 0.13. This range covers the entire uniform straining portion of the tensile curve. Calibration for higher strains (~p > 0.15) was carried out on necked regions of tensile specimens which were pulled until fracture. These re- gions have experienced plastic strains from about 0.15 at the start of necking to approximately 0.45 at fracture, as determined from cross-sec- tional area reduction. Since the material in the vicinity of a fatigue crack tip undergoes large deformations under a steep strain gradient, the necked portion of a tensile specimen is expected to closely represent the im- mediate vicinity of a crack tip. Unfortunately, however, it was not pos- sible to discriminate between these higher strains because of a lack of etching at plastic strains greater than % = 0.04.
The deformed calibration samples were aged at 160°C for 40 min to allow for decoration of dislocations by interstitials. They were then etched electrolytically with Morris etchant (133 ml CH3COOH; 25 g CrO3; 7 ml HzO) at 5 V for 30 min. The etching response of this material as a function of plastic strain was similar to those reported by other investigators [1, 2]. Individual dislocation etch pits and slip lines could be detected at low strains (~x, < 0.02). With increasing deformation (0.02 < % < 0.04), the etched surface became increasingly dark due to an increasing number of etch pits. However, as already noted, the etching of defects stopped after a plastic strain of e~, = 0.04. The calibration information was used to

80 Y. Birol
assign each volume element within the plastic zone an equivalent tensile strain. The same aging and electrolytic etching conditions as in the cal- ibration studies were used on the fatigued specimens.
Results and Discussion
Observations of crack propagation tests from video tapes reveal an important aspect of damage evolution during crack growth: a region ahead of the crack tip experiences damage accumulation only until the crack tip advances through that region. Accordingly, the damage layer around the crack can be said to consist of an active and a wake zone as illustrated in Fig. 2. The damage density (p) within both active and wake zones is higher than that of surrounding material. However, the rate of damage accumulation (15) is zero in the wake zone whereas it is a positive quantity in the active zone. As no plastic deformation can take place in volumes through which the crack already passed, the strains associated with vol- ume elements inside the wake zone represent the entire deformation his- tory of those elements. Hence, the plastic strain distribution inside the wake zone can be used to evaluate the plastic zone evolution with crack propagation.
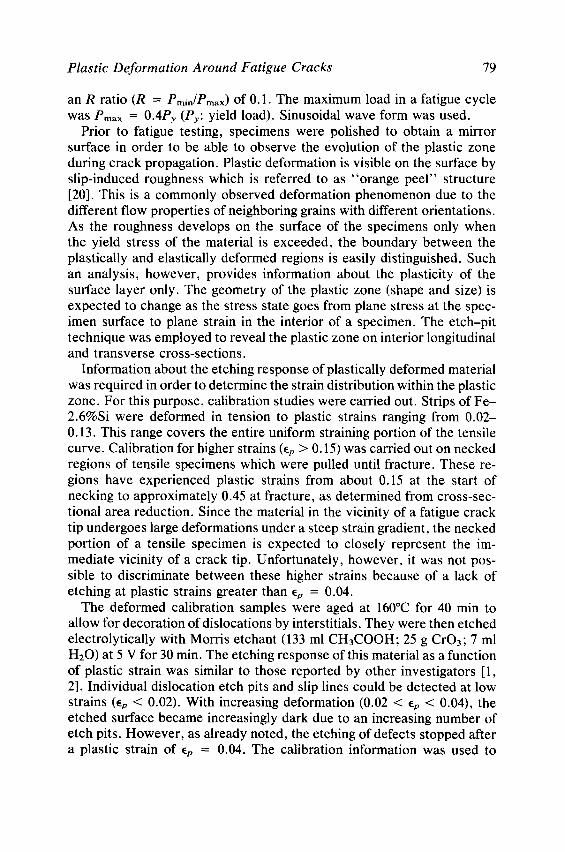
The plastic deformation that attends fatigue crack propagation produces a roughened surface as shown in Fig. 3. The degree of roughness can be considered as a measure of local plastic strain. It decreases from the crack line to the plastic zone boundary (PZB) and increases along the crack line with increasing crack length. The increase in surface roughness
WAKE ZONE
CRACK
15--0
FIG. 2. A schematic illustration of tile plastic deformation zone around a fatigue crack.
Plastic Deformation Around Fatigue Cracks 81
FIG. 3. Surface deformation introduced by fatigue crack propagation.
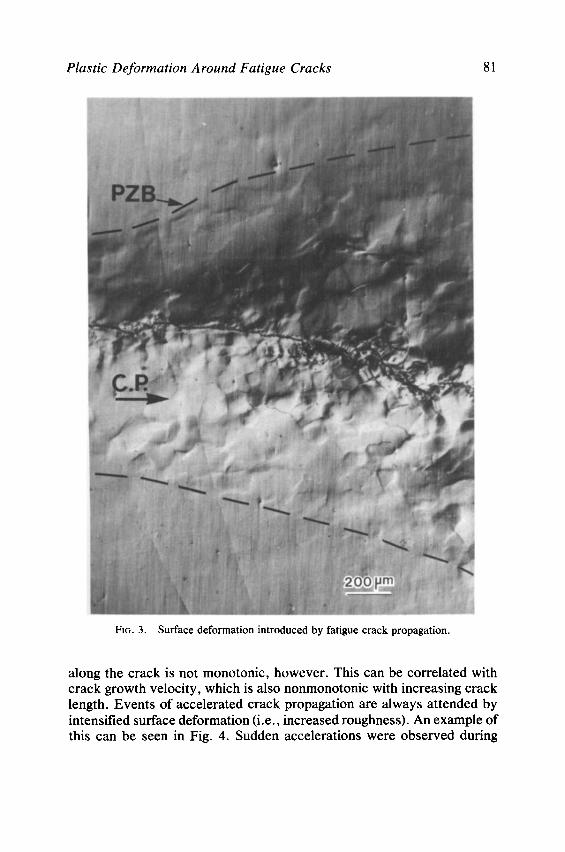
along the crack is not monotonic, however. This can be correlated with crack growth velocity, which is also nonmonotonic with increasing crack length. Events of accelerated crack propagation are always attended by intensified surface deformation (i.e., increased roughness). An example of this can be seen in Fig. 4. Sudden accelerations were observed during
82 Y. Birol
crack propagation at locations A and B (Fig. 4a), and these were accom- panied by an increased surface roughness (Fig. 4b).
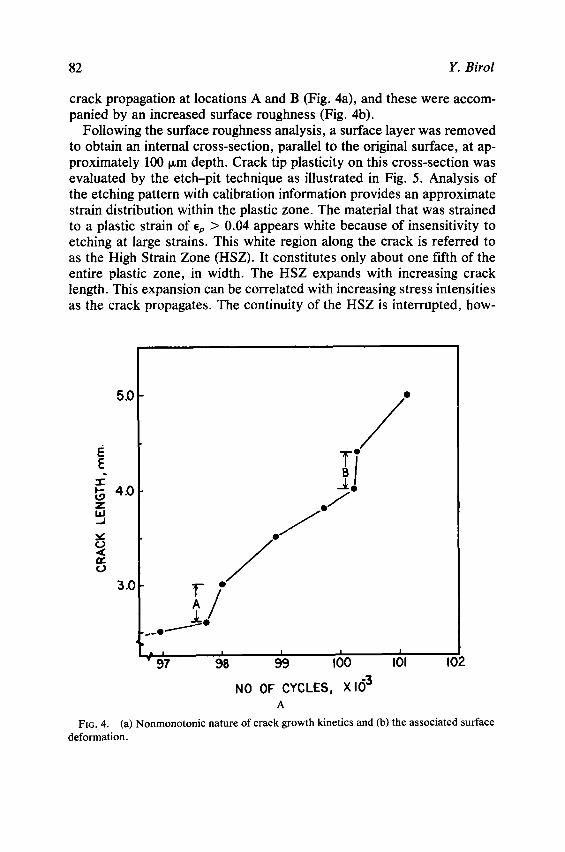
Following the surface roughness analysis, a surface layer was removed to obtain an internal cross-section, parallel to the original surface, at ap- proximately 100 ~m depth. Crack tip plasticity on this cross-section was evaluated by the etch-pit technique as illustrated in Fig. 5. Analysis of the etching pattern with calibration information provides an approximate strain distribution within the plastic zone. The material that was strained to a plastic strain of ~p > 0.04 appears white because of insensitivity to etching at large strains. This white region along the crack is referred to as the High Strain Zone (HSZ). It constitutes only about one fifth of the entire plastic zone, in width. The HSZ expands with increasing crack length. This expansion can be correlated with increasing stress intensities as the crack propagates. The continuity of the HSZ is interrupted, how-
50 •
ff ,~ 4o z , J J
° / 0
_ e /
~ i i I I I 97 98 99 100 101 102
NO OF CYCLES, X I(~ 3 A
FI~. 4. (a) Nonmonotonic nature of crack growth kinetics and (b) the associated surface deformation.

B
FiG
. 4.
(C
onti
nued
)
84 Y. Birol
FIG. 5. Distribution of plastic strain within the plastic zone of a fatigue crack.
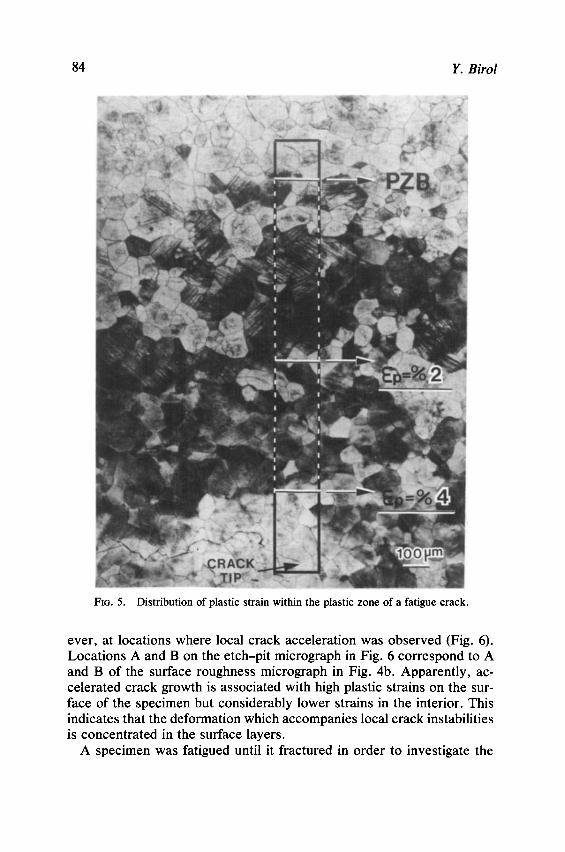
ever, at locations where local crack acceleration was observed (Fig. 6). Locat ions A and B on the etch-pit micrograph in Fig. 6 correspond to A and B of the surface roughness micrograph in Fig. 4b. Apparently, ac- celerated crack growth is associated with high plastic strains on the sur- face of the specimen but considerably lower strains in the interior. This indicates that the deformation which accompanies local crack instabilities is concentrated in the surface layers.
A specimen was fatigued until it fractured in order to investigate the
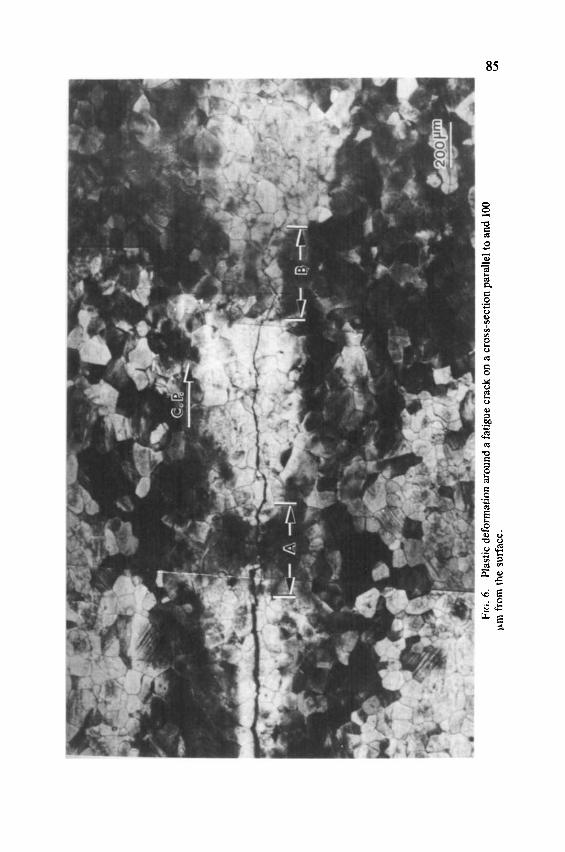
FIG
. 6.
P
last
ic d
efor
mat
ion
arou
nd a
fat
igue
cra
ck o
n a
cros
s-se
ctio
n pa
rall
el t
o an
d 10
0 oo
~
m f
rom
the
sur
face
, t.~
86 Y. Birol
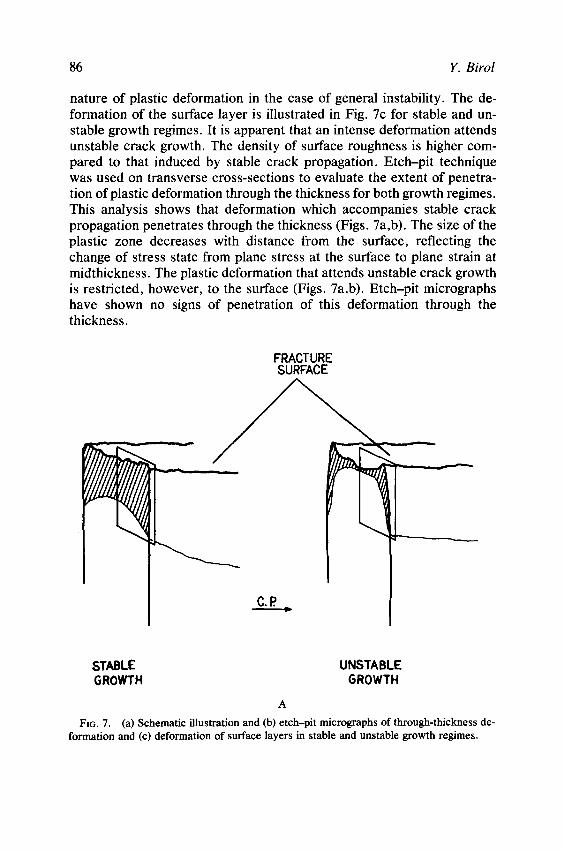
nature of plastic deformation in the case of general instability. The de- formation of the surface layer is illustrated in Fig. 7c for stable and un- stable growth regimes. It is apparent that an intense deformation attends unstable crack growth. The density of surface roughness is higher com- pared to that induced by stable crack propagation. Etch-pit technique was used on transverse cross-sections to evaluate the extent of penetra- tion of plastic deformation through the thickness for both growth regimes. This analysis shows that deformation which accompanies stable crack propagation penetrates through the thickness (Figs. 7a,b). The size of the plastic zone decreases with distance from the surface, reflecting the change of stress state from plane stress at the surface to plane strain at midthickness. The plastic deformation that attends unstable crack growth is restricted, however, to the surface (Figs. 7a,b). Etch-pit micrographs have shown no signs of penetration of this deformation through the thickness.
FRACTURE SURFACE
STABLE UNSTABLE GROWTH GROWTH
A
FIG. 7. (a) Schematic illustration and (b) etch-pit micrographs of through-thickness de- formation and (c) deformation of surface |aycrs in stable and unstable growth re~mcs.
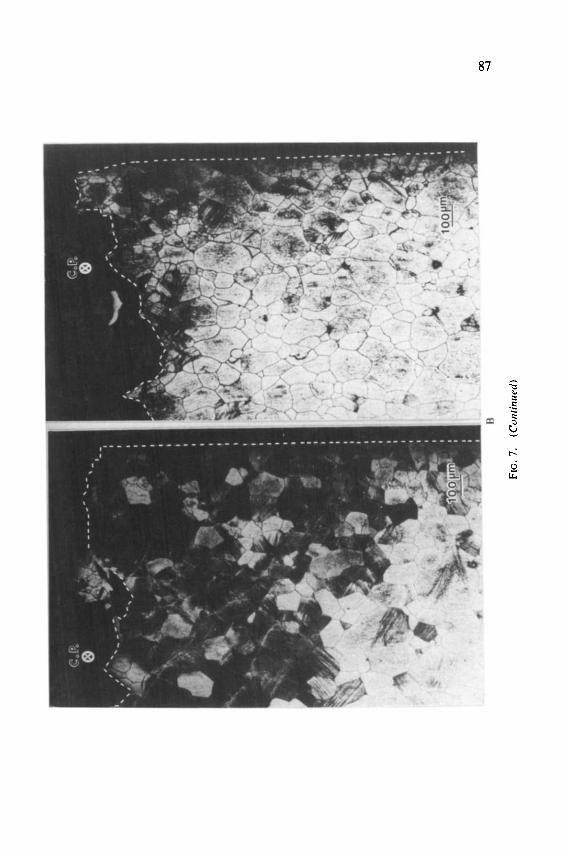
:~ i !
! :
~, ~
~ :, ~
:
i!~
",
: ~ ' i~
:" :'
~ !
~ C
~ B
~.
4
Fic
. 7.
(C
on
tin
ued
)

C
Fie
. 7.
(C
onti
nued
)

Plastic Deformation Around Fatigue Cracks 89
Conclusions
Surface roughness analysis and etch-pit techniques were employed to characterize the plastic deformation that accompanies fatigue crack prop- agation in both stable and unstable growth regimes. The latter was found to be associated with an intense surface deformation. This deformation, however, was restricted to the surface and did not penetrate through the thickness. The same observation was made for brief periods of accelerated crack growth in the stable regime. These results indicate that the evolution of plastic deformation zone is directly related to the kinetics of crack propagation.
References
1. G. T. Hahn, R. G. Hoagland, and A. R. Rosenfield, Local yielding attending fatigue crack growth, Met. Trans. 3:1189 (1972).
2. K. Tanaka, M. Hojo, and Y. Nakai, Plastic deformation around a fatigue crack near threshold in 3% Si-Fe, Mater. Sci. Eng. 55:85 (1982).
3. Y. Waku, T. Masumoto, and T. Ogura, Three-dimensional observation of plastic zones formed around fatigue cracks in an Fe-3%Si alloy, Trans. J. L M. 24:849 (1983).
4. M. Clavel, D. Fournier, and A. Pineau, Plastic zone sizes in fatigued specimens of INCO 718, Met. Trans. 6A:2305 (1975).
5. A. Pineau and R. M. Pelloux, Influence of strain-induced martensitic transformations on fatigue crack growth rates in stainless steels, Met. Trans. 5:1103 (1974).
6. A. Saxena and S. D. Antolovich, Low cycle fatigue, fatigue crack propagation and substructures in a series of polycrystalline Cu-AI alloys, Met. Trans. 6A: 1809 (1975).
7. C. Loye, C. Bathias, D. Retali, and J. C. Devaux, The plastic zone ahead of a fatigue crack in 316 stainless steel, ASTM STP 811:427 (1983).
8. H. W. Liu and N. Lino, A mechanical model for fatigue crack propagation, Proc. 2nd Int. Conf. Fracture, 812 (1969).
9. A. Ohta, M. Kosuge, and E. Sasaki, Measurement of strain distribution by the moire fringe multiplication method at a tip of propagating fatigue crack, Int. J. Fract. 13:289 (1977).
10. S. Karashima, H. Oikawa, and T. Ogura, Studies on substructures around a fatigue crack in fcc metals and alloys, Trans. J. 1. M. 9:205 (1968).
11. S. Taira and K. Tanaka, Study of fatigue crack propagation by x-ray diffraction ap- proach, Eng. Fract. Mech. 4:925 (1972).
12. M. Kiesnil and P. Lukas, Dislocation substructure associated with propagating fatigue crack, Proc. 2nd Int. Conf. Fracture, 725 (1969).
13. M. A. Wilkins and G. C. Smith, Dislocation structures near a propagating fatigue crack in an AI-1/2%Mg alloy, Acta Met. 18:1035 (1970).
14. D. L. Davidson and J. Lankford, Plastic strain distribution at the tips of propagating fatigue cracks, J. Eng. Mat. Tech. 98:24 (1976).
15. J. Lankford, D. L. Davidson, and T. S. Cook, Fatigue crack tip plasticity, ASTM STP 637, 36 (1977).
16. D. L. Davidson, The study of fatigue mechanisms with electron channeling, ASTM STP 675,254 (1979).

90 Y. Birol
17. J. S. Crompton and J. W. Martin, Study of the crack tip plastic strain in a nickel-based superalloy, Metallography 17:139 (1984).
18. E. Hornbogen, E. Minuth, and St. Stanzl, Quantitative analysis of plastic deformation at a crack tip by recrystallization, Mater. Sci. Eng. 43:145 (1980).
19. G. Chalant and L. Remy, A metallographic method for determining plastic strains at the tip of a fatigue crack, Mater. Sci. Eng. 50:253 (1981).
20. Metals Handbook, 9th Ed. vol. 9, ASM, Ohio (1985) p. 687.
Received February 1987; accepted August, 1987.
Copyright © 2022 FDOKUMEN