PREVENT MARINE PLASTIC LITTER - NOW!
47
PREVENT MARINE PLASTIC LITTER - NOW! AN ISWA FACILITATED PARTNERSHIP TO PREVENT MARINE LITTER, WITH A GLOBAL CALL TO ACTION FOR INVESTING IN SUSTAINABLE WASTE AND RESOURCES MANAGEMENT WORLDWIDE WITH SUPPORT FROM OUR PARTNER
-
Upload
khangminh22 -
Category
Documents
-
view
0 -
download
0
Transcript of PREVENT MARINE PLASTIC LITTER - NOW!

PREVENT MARINE PLASTIC LITTER - NOW!AN ISWA FACILITATED PARTNERSHIP TO PREVENT MARINE LITTER, WITH A GLOBAL CALL TO
ACTION FOR INVESTING IN SUSTAINABLE WASTE AND RESOURCES MANAGEMENT WORLDWIDE
WITH SUPPORT FROM OUR PARTNER

ABOUT THE INTERNATIONAL SOLID WASTE ASSOCIATIONVision and mission statement
ISWA’s vision is an Earth where no waste exists.
Waste should be reused and reduced to a mini-
mum, then collected, recycled and treated properly.
Residual matter should be disposed of in a safely
engineered way, ensuring a clean and healthy envi-
ronment. All people on earth should have the right to
enjoy an environment with clean air, water, seas and
soils. To be able to achieve this, we need to work
together.
The Marine Litter Task Force is an international
partnership led and facilitated by ISWA. The aim
is to explore and clearly establish the link between
efficient waste management and the prevention of
plastic waste reaching our oceans.
Sound waste management practices are the key to
reducing marine litter. The waste and resources sec-
tor is the core enabler of immediate, and long-term,
solutions for preventing marine litter.
We aim to:
Promoting resource efficiency through sustainable
production and consumption
Support to developing and emerging economies
Advancement of waste management through
education and training
Promoting appropriate and best available technol-
ogies and practices
Professionalism through its programme on profes-
sional qualifications.
Prevent the littering and dumping of waste items,
especially in areas where there is an absence of a
suitable collection infrastructure.
Develop and implement practices for sound collec-
tion, treatment and disposal of municipal waste.
Identify and demonstrate realistic best practices.
That can be adopted by local, regional, and national
authorities.
Promote a global evolution of efficient resource
management.
Promote the value of secondary plastics as part of
a resource efficient circular economy.
Our mission is to promote and develop sustainable
and professional waste management worldwide.
ISWA achieves its mission through:
THE MARINE LITTER TASK FORCE
THE PARTNERSHIP VISION
“Sound waste management is the key to reduc-ing marine littering. Our aim is to explore and clearly establish the link between sound waste management, and the prevention of plastic waste reaching our oceans”

iii iv
FROM THE ISWA PRESIDENTMarine litter is becoming a global
challenge similar to climate
change. Not only regarding its
vast health and environmental
impacts, but also because marine
litter, exactly like climate change,
is the global result of our local
actions and inactions.
Our oceans are already the big-
gest dumpsite for million tonnes
of used plastics per year. But, the
visible plastic pollution, so usual
in almost every shoreline in the
world, is a relatively small prob-
lem in comparison to the invisible
microplastics.
Microplastics are becoming an
‘integral’ part of marine ecosys-
tems. Apparently, they can be part
of the plankton’s food chain, as
recent research demonstrated.
They are already present, in small
but measurable concentrations, in
several commercial salts and bot-
tled water. They were identified in
Marianna trench, the deepest and
probably the most remote part of
the planet, 11 km below the sea
surface.
Welcome to our report on how
to prevent marine plastic litter –
now! It arrives at a critical mo-
ment in history where the global
community decided to stand firmly
behind a series of Sustainable
Development Goals (SDGs), aim-
ing at a better future for the entire
humanity and the planet. Indeed,
the work intersects major global
challenges: how to minimise and
eventually stop marine litter (part
of SDG 14), whilst addressing the
global crisis of inadequate waste
and resources management for all
(part of SDGs 11 and 12).
The case for marine litter is
already well made, as it is for a
circular economy. Many initiatives,
from local to global, are gaining
momentum. Our report casts new
light on these issues, outlining
how sound waste and resources
management around the World,
and in particular in low-income
countries, can make a major dif-
ference in mitigating marine litter,
achieving tangible effects within
the near, rather than distant, future
– hence, our focus on “Now!”.
Plastic, the most successful mate-
rial of our times, delivers unprec-
edented functionality and value to
our lives. However, it is also the
It seems that we are actually living
in a multidimensional and contin-
uously expanding plastic matrix.
This is a key element that seems
to be somehow underestimated in
the relevant debate. Our depend-
encies have led to a conflict.
On the one hand, we depend
too much on plastics to get rid
of them immediately. The pace
of increase in synthetic plastics
production and use has been ex-
ponential since 1950s and there
is no sign of change. On the other
hand, we, as humans, depend too
much on our oceans to let them
become ‘plasticized’ – laden with
plastic fragments.
There is no silver bullet, but the
urgent problem requires a rethink,
not only about plastics, but about
our economic models, develop-
ment strategies and the future of
consumption patterns.
In the meantime, better waste
management and the shift to
circular economy provide the
best way to deal with this conflict.
Investing in sustainable recycling
dominant material in marine litter.
The resources sector knows well
the major challenges associated
with capturing the value embed-
ded within plastics, whether as
an engineered material or as a
fuel. Indeed, the material that is
the most successful example of
closed loop recycling, the clear
PET water bottle, is also an
abundant type of marine litter - a
paradox and a major systemic
failure. It is such systemic failures
we focus upon here.
A lack of infrastructure and
unsound waste management
practices in low-income countries
is the key failure. If the 2 billion
people without access to sound
waste collection keep dumping
their waste, much of which goes
directly into aquatic environments,
we will never be able to eliminate
the marine litter crisis. And if the
plastic waste is not captured
upstream, before it fragments,
it will eventually transform into
innumerable micro- and nano-par-
ticles, which will be well beyond
our abilities to control.
We therefore argue that, to com-
plement all other major practical
and policy efforts, the international
community should join forces and
and waste management systems
is the best way to prevent marine
litter. It will also provide the nec-
essary time for shifting the supply
chains of plastics towards circular
economy.
This is why ISWA will make marine
litter a key-element of its activities
for the next years.
This report is just a key milestone in
an effort to build a global partner-
ship, able to identify and enable
the implementation of the most
appropriate preventive solutions for
keeping plastics out of our water-
ways, rivers, seas and oceans.
Along with our existing supporters,
we urge and invite you to align
forces behind this effort facilitated
by the International Solid Waste
Association’s Marine Litter Task
Force, developing disruptive, yet
effective, solutions – now!
concentrate on supporting the solid
waste and resources management
sector in its efforts to intercept the
marine litter upstream, preventing
the generation of marine litter in
the first place. The sector is ideally
placed, and possesses the neces-
sary knowledge, skills and hands-
on expertise, to deploy and operate
the missing critical infrastructure.
But such a massive undertaking
cannot be achieved alone –
cross-sectorial and intra-discipli-
nary solutions are needed – and
we are here to enable them by
assuming a cross-linking role.
In our report, we do not provide
definitive answers on each and
every aspect of plastics marine
litter – our aim is to substantiate a
bold statement: that the waste and
resources recovery sector has a
key role to play in addressing this
global challenge, through raising
awareness of the need for effec-
tive waste management for all, by
sharing and exchanging expertise,
and co-creating solutions with all
stakeholders, at a local level. Join
us – the moment is now!
Dr Costas Velis
University of LeedsLeader, ISWA Marine Litter Task Force
Antonis Mavropoulos
President, ISWA
PREFACE

v vi
Plastic marine litter is another reminder, alongside
climate change, of the serious global impacts that are
‘generated’ by millions of local inappropriate actions
and inactions. In this respect, plastic marine litter pro-
vides an opportunity to demonstrate and make easily
understood the impacts of improper waste manage-
ment and the urgent need for a shift to a sustainable
circular economy.
A global systemic challenge
Plastic marine litter is a challenge of planetary scale
and implications. It is associated with four key sys-
temic failures, which relate directly to the waste and
resources management sector:
The technical challenges and the restrictions of
material properties and the flows of plastics.
The effects of social consumption patterns
and littering behaviours on solid waste
generation.
a.
b.
Marine litter damages ecosystems, and marine-
based economic sectors such as tourism and
fisheries. It also impacts upon other aquatic envi-
ronments that are vital for human societies, such
as rivers. The extent of marine litter is now global,
with plastic particles having been detected in all
of the world’s oceans - even the most remote and
untouched environments. And it has entered the
food chain.
EXECUTIVE SUMMARY
Poor or absent solid waste management services
and infrastructure (mainly in low-income coun-
tries), and insufficient monitoring & law enforce-
ment (mainly in high-income countries).
Problematic and vulnerable markets for secondary
plastics, resulting in poor and very fragile incen-
tives for material recovery.
Lack of a systemic and in-depth understanding of:

DEVELOPED WORLD
DEVELOPING WORLD
vii viii

ix x
Can we control the sources of marine litter?
The majority of marine litter originates from unsus-
tainable waste management practices, particularly in
low and middle income countries. Sound solid waste
and resource management is the only major effective
prevention. It has the potential to significantly reduce
the quantities of plastics released into the marine
environment.
Why intervene upstream at macro-plastic item level?
The bigger plastics waste items are a huge
pool of future microplastics – after being de-
graded they cannot be effectively intercepted.
Preventing the leakage upstream is the best
place to take action.
Plastic litter undergoes transformations both before
and after entering the marine environment (i.e. large
plastic items fragment into smaller pieces) and is
transported to places well beyond its source (e.g.
into ocean gyres or the coastlines of other coun-
tries). As it is not readily biodegradable, it persists
and interacts with its environment, absorbing and
adsorbing persistent organic pollutants (POPs) from
the aqueous environment. The smaller and smaller
fragments carry these pollutants to new environments
and transfer them into living organisms and potential-
ly into the food chain.
How does the solid waste management sector relate to interception points at generation hotspots?
The solid waste management and resources
sector relates to all major sources and hot-
spots where interventions can be planned
and implemented.
The key land-based sources of plastic marine litter
are numerous. It includes plastics leaking into the
environment as a result of uncontrolled dumping
of waste from municipal sources (organised and
unorganised dumping, fly tipping) – a significant
problem in low-income countries, with direct dump-
ling into rivers or at/by the sea. The other key land-
based source is littering by members of the public
(e.g. through tourism, major public events, or in busy
areas of cities). There is even some limited escape of
plastics from existing waste management activities
during transport, handling, treatment or disposal.
Sustainable solid waste management also has a
role in controlling other major sources and hotspots.
Wastewater treatment related flows, if effectively in-
tercepted at treatment plants, are eventually handled
as biosolids in solid waste treatment plants. Lastly,
control of maritime sources of marine litter (fisher-
ies, shipping sectors (including cargo and leisure),
recreational activities) also depends on provision of
convenient and affordable solid waste management
facilities.
How can we know that relevant policies are suitable and work?
Polices to combat and eradicate marine litter
can be effective only if they are informed by
good monitoring information on solid waste
and resources management systems across
the world.
There is still considerable uncertainty about the
sources, pathways, transformations and final fate, es-
pecially at local/ regional level. This gap in knowledge
affects our ability to devise effective mitigating poli-
cies. To monitor progress, better data will be needed
on waste management systems and on the sources,
pathways and fate of micro- and macro-plastics.
So, what should we do?
The waste and resource recovery sector has
a key role to play in addressing this global
challenge by sharing expertise, and creating
solutions together with all stakeholders at a
local level.
Marine litter is an issue that requires a global re-
sponse from policy-makers, practitioners and the
wider public. The waste management sector can
significantly contribute with:
So, what we should do? The following list provides
the key elements and a call to action.
Technologies: The sector has cost-effective
technologies to deliver sustainable waste manage-
ment systems that will prevent marine litter.
Knowledge: The sector’s thousands of compa-
nies and organisations have extensive knowledge
and working experiences of applying successful
waste and resource management in all contexts.
Experts: The sector’s hundreds of thousands
of professionals cover a wide range of skills and
expertise, including engineering, chemistry, social
science, logistics and behaviour change.

xi xii
Prevent uncontrolled dumping by providing
collection services for all. Dumping of wastes
causes significant environmental, social and
economic impacts, particularly for low income
communities. It is estimated that over 2 billion
people globally still do not have access to ade-
quate waste collection services. These needs to
be provided as a matter of urgency.
Prevent littering and stop fly-tipping. Waste
items dropped by people ‘on the go’ or at major
events/ gatherings are a key source of plastics
that escape into the marine environment. Reduc-
ing littering will require proactive engagement
with communities, public awareness-raising, and
an enhanced understanding people’s needs and
behaviours.
Close dumpsites and provide waste treat-
ment and disposal facilities for all commu-
nities. It is estimated that over 3 billion people
globally still do not have access to appropriate
disposal facilities.
Work with the maritime sector to establish
effective take-back systems for recovering waste
and recyclable materials from the fishing, shipping
and touristic activities.
a.
b.
c.
d.
Call to Action for Effective Wins
Priority action is needed now to rapidly ad-
dress the issue. Intervention will also be need-
ed in the medium and long term to fully ad-
dress the issue of marine litter and its causes.
Marine litter and the Sustainable
Development Goals (SDG).
Goal 14 is to protect life below water. One of SDG
14’s component targets is to prevent and significan-
tly reduce marine debris. This cannot be achieved
without implementing effective waste and resource
management for all, which is also a key requirement
for achieving SDG 11 (creating sustainable cities
and communities) and SDG 12 (achieving responsi-
ble consumption and production).
ACTION ANd RESULTS NOW
Investing in effective waste management in
low-income countries is likely to represent the
most cost-effective and immediately practi-
cable solution to reducing marine litter in the
short term. Sound waste management practices
are the key to preventing and reducing marine litter.
However, there is no on-size fits all solution. Actions
need to be tailored to local situations.
To prioritise, design and implement effective
solutions, it is essential that we identify and
address key gaps in knowledge.
Our understanding of the issue has increased signifi-cantly over recent years. However, a detailed under-standing is lacking on many key aspects associated with plastics marine litter.
The flows of plastics in the environment are complex. Current estimates of quantities and sources are based on simplified assumptions and poor-quality
base data of very low spatial resolution. Proper sets
of indicators are not well established and they are not
available for policy and decision-making support.
Many factors influence the release, movement and
transformation of plastics. We need to understand
these issues in far more detail so as to understand
the most effective interventions to make. For exam-
ple, macroplastics represent a huge pool of potential
microplastics, but our insufficient understanding of
the process of macroplastics fragmentation, and
inability to control their multiple sources, are part of
the reasons why recent emphasis has been on the
engineered microplastics beads, rather on fragments
generated from macroplastics.
MId-TERM ACTION
Capturing and enhancing the value of waste
plastics. The waste and resources sector under-
stands the challenges surrounding value retention.
Action will need to include developing effective
collection systems that maximise and stabilise the
value of secondary plastics. These systems will need
to consider specific social and market conditions of
each municipality and region.
Properly functioning markets for recycled
plastics. We need a fundamental move away
from the current push markets (i.e. collecting
more waste for recycling than markets require) to pull
markets, driven by sufficient demand. We need to
address issues associated with global supply chains
and social and environmental justice, and reverse
the often unfair competition with primary raw mate-
rials. Only then will littering/dumpling and therefore
wasting used plastics becomes unthinkable. Better
data and information sharing on waste and recycled
materials at all stages of their use and end-of-life
cycle can enable properly functioning, stable markets
for secondary plastics.
Energy recovery and thermal processing: There
will be considerable part of plastics that, after first
use or cascades, may remain or become unsuitable
for a genuinely sustainable materials recovery. It is
important that the energy value of this fraction is cap-
tured through efficient and well-operated energy from
waste plants or quality assured solid recovered fuels.
We need to significantly reduce the ‘leakage’ of
plastics into the environment by intervening at
the source. This will require action to:

xiii xiv
The Partnership
ISWA is determined to work in close collaboration with the international community, the local
stakeholders and each individual motivated citizen around the world to implement effective and
permanent solutions.
ISWA, through the Task Force, will:
Identify and share best practices on how the
sector can offer preventative upstream solutions
in different socioeconomic contexts.
Contribute to addressing the knowledge
gaps in identifying intervention hotspots,
based on understanding the generation, flows and
transformations of plastics marine litter.
Actively participate in other major efforts
and international fora, including being present
in major international events.
Assess the level of investment needed: Align
efforts to obtain a detailed understanding of the
levels of investment needed in solid waste man-
agement infrastructure to combat plastics
marine litter.
Create a platform that facilitates the necessary
links, and organisational relationships to enable
actions and solutions through transfer of knowl-
edge and expertise worldwide.
Endorse the ISWA MLTF vision.
Join the Advisory Board of the Task Force.
Support delivery of outputs and dissemination.
Invite ISWA to be represented and participate and
inform your own initiatives.
Cocreate with ISWA localised
solutions.
The Partners, through the Task Force, will:
LONG-TERM ACTION
A step-change from the linear use of plastics to
a sustainable and proven circular and cascad-
ing system is needed. We need to move from the
current situation, where the majority of plastics are
used once - with much of the material escaping the
system - to a system based on the principles of sus-
tainable and effective circularity and clean material
cycles, where plastics are collected and cycled back
into the system as valuable raw materials. This will
require action on many fronts. The generic case has
been widely made, but a more detailed and opera-
tional approach needs to be developed.
We need to address the issue at the very
beginning: Innovate and invent at the materi-
als, design and processing level. Priority actions
could include reducing (i.e. rationalising) single-use
items as a matter of priority and developing materials
and designing products for recyclability and value
retention after the use phase. This requires a new in-
novation model that goes beyond cost-effectiveness,
functionality during useful life time, and narrowly
defined utility needs to one that incorporates com-
plex value. This will require a radical shift from today’s
practices, based on a cross-sector and intra-discipli-
nary scientific collaboration.

Introduction
Sources, pathways, transformations and fate of marine litter
From the ISWA President
Task Force Leader Preface
Executive Summary
Contents
1
2
5
6
4.
3
2.1
2.2
2.4
2.5
3.1
3.2
3.3
3.4
3.5
3.6
4.1
4.2
4.3
2.3
3.8
3.7
2.2.1
2.2.2
2.2.3
2.2.4
2.2.5
2.2.6
2.2.7
2.2.8
2.2.9
2.2.10
2.2.11
3.6.1
3.6.2
3.6.3
3.6.4
2.3.1
2.3.2
2.3.1
2.3.2
2.3.3
2.3.4
3.7.1
3.7.2
Overview
Uncontrolled dumping
Littering
Fly-tipping
Escape of plastics from mismanaged solid waste management activities
Industrial sources
Agricultural and horticultural sources
Fisheries and shipping in waterways
Sanitary items and consumer cosmetic products
Synthetic fibres from washing clothes
Micro-plastics from road vehicle tyres
Introduction
Sources
iii
iv
vi
xv
1
3
3
5
5
5
7
7
8
10
10
11
11
11
12
13
13
13
15
16
17
17
19
21
23
23
29
37
39
43
47
47
47
52
53
55
55
56
59
61
62
63
64
65
71Pathways
Policy & monitoring indicators
Introduction
Rivers: both a hotspot and a pathway
Drainage systems and flooding events
Sewers Overflow
Wind blown litter
Atmospheric Inputs
Reducing single-use items
Designing for recyclability and value retention
Transformations
Fate (final sinks and permanent stocks)
Stop the Leakage – Now!
Introduction
Providing waste collection for everyone
Preventing littering
Closing dumpsites by waterbodies
Working with the maritime sector
Capturing and enhancing plastic value
Introduction
Improving collection systems for waste plastics
Creating strong and stable markets for recycled plastics
Thermal recovery
References
The Marine Litter Task Force Core Team
Priority interventions
ISWA’s current activities
The Task Force’s next steps
Transition to circular approaches for manufacturing, using and recycling plastics
The next steps
CONTENTS

1 2
INTRODUCTION
Here we present a new reading of
the evidence and propose a reori-
entation about where the focus of
our immediate and concentrated
efforts should be. In particular,
this report explores how the
waste and resources manage-
ment sector can tackle marine
plastics. The sector has a key role
to play in significantly reducing
the leakage of plastics from the
system into the marine environ-
ment and enhancing the value of
waste plastics so that it can be
cycled back into the system as a
valuable raw material.
The case for action on marine litter has been well-made [1]. Whilst there
are still many gaps in our understanding of the issue, the evidence base
on marine litter is growing. It is clear that a significant quantity of waste
plastic is escaping into the aquatic environment, where it is causing
long-term damage, affecting ecosystems, entering the food chain, and
having a substantial negative impact upon the tourism and fisheries
industries. This paper does not seek to reiterate the case for action on
marine litter. That case has been made effectively and at length by many
researchers, practioners, policy makers and activists.
Section 2 of this document pre-
sents an overview of our current
understanding of marine litter
issues in terms of its sources,
pathways, transformations and
fate. Section 3 summarises prior-
ity intervention points for tackling
marine litter and Section 4 pre-
sents the Task Force’s proposed
next steps.

3 42SOURCES, PATHWAYS, TRANSFORMATIONS AND FATE OF MARINE LITTER
INTRODUCTION
Due to the poor quality of un-
derlying data and the necessity
to make a number of simplifying
assumptions, these figures can
only be considered to be or-
der-of-magnitude estimates. They
also do not include waste plas-
tics from industrial and maritime
sources and primary engineered
microplastics (e.g. from cosmet-
ics). Marine litter originating from
the maritime sector, for example,
is often cited to comprise on
average roughly 20% wt. of total
marine plastics, with the balance
of 80% coming from land-based
sources. However, it is important
to note that this is based on ex-
pert opinion rather than any empir-
ical analysis[4]. Overall, the scien-
tific community has an incomplete
understanding of the sources and
flows of waste plastics into the
It is estimated that between 4.8 and 12.7 million tonnes of
waste plastic was released into the marine environment from
costal populations in 2010 [2]. A further 1.2 to 2.4 million tonnes
(Mt) of plastic is estimated to reach the oceans from inland
sources via rivers[3]. To put this in perspective, approximately
380 Mt of plastic resins and fibres were produced in 2015, of
which about 275 Mt is thought to have become waste [2] sug-
gesting that if the quantity of plastic leaking into the ocean has
stayed relatively constant then, at the very least, 2% by weight
(wt.%) of total plastics production is ‘leaking’ into the environ-
ment each year.
environment and, in particular,
implications of material properties,
consumption patterns and littering
behaviours on solid waste gener-
ation, and the transport mecha-
nisms and transformations once it
has entered the environment.
Notwithstanding the uncertain-
ties surrounding these estimates,
waste plastic is clearly wide-
spread in the marine environment.
Plastic debris represents 50 to
80% of shoreline debris[5] and
plastic items are commonly re-
corded as some of the most com-
mon items collected during beach
surveys and clean-up efforts[6].
The detrimental impacts of waste
plastics on marine ecosystems
and the fisheries and tourism sec-
tors is widely documented[7],[8].
2.1
27.4
17
10
15
1
5 6
2.2.1 Overview
Land-based sources of plastic marine litter are nu-
merous and include both direct littering and dumping
of waste by those who generate it (e.g. household-
ers, members of the public and businesses), as well
as the release of plastic particles via wastewater and
effluent. With respect to waste and resource man-
agement, the key sources are:
Other potential sources of marine litter include:
release of plastics from agricultural and horticultural
activities, particularly polyethylene films which are
used extensively in both the livestock and horticultural
sectors; leakage of plastics particles from industry in
the form of leakage of pellets from plastic manufac-
turing; and potentially leakage of plastics from the
waste management system itself, particularly where
illegal and unregulated waste management activities
are taking place in poorly regulated systems.
Furthermore, there are also several sources of plastic
in the marine environment that, whilst they have a
land-based source, predominantly make their way
into the marine environment via wastewater, includ-
ing: sanitary items and consumer products; synthetic
fibres from washing clothes; and particles generated
Littering by members of the public, either in
their day-to-day activities or as a result of rec-
reational activities (e.g. tourism or major public
events). Littering is common in all parts of the
world, irrespective of income level.
Uncontrolled dumping of waste from munic-
ipal sources. Uncontrolled dumping, also often
referred to as mismanaged waste, fly-tipping or
illegal dumping, refers to the disposal of wastes
outside of a system for collecting the waste and
managing it in a way that protects the environ-
ment and human health. Uncontrolled dumping is
common in low and lower -middle income coun-
tries where there are insufficient waste collection
systems, particularly in unplanned areas of rapidly
urbanising areas[9], [10].
SOURCES by road vehicle tyre wear. Albeit, some of these ele-
ments might be captured and then enter the waste
management system at a later stage (for example,
sewage treatment plants might capture sanitary items
which are then removed for disposal within the solid
waste management system).
Maritime sources of marine litter comprise wastes
from the fisheries and shipping sectors (including
cargo and leisure) and recreational activities. Items
include equipment from the fisheries sector (e.g.
redundant nets) and wastes generated by shipping
activities, including municipal-type wastes.
2.2.2 Uncontrolled dumping
The deliberate disposal of wastes by house-
holders and business into the environment
is still widespread globally especially in the
developing world. Furthermore, illegal dumping
of waste by rogue waste operators still occurs
throughout the developing world.
The degree of uncontrolled dumping of wastes by
householders varies dramatically between, and also
within, countries, cities and towns. It is a critical issue
in low and middle-income countries where collection
systems for waste may be inadequate, leading to
householders having no option than to dispose of
their waste by dumping in a location within or close
to the community.
Whilst litter is a more critical issue in terms of
sources of marine litter in high and middle-income
countries, uncontrolled dumping still takes place. It is
often associated with illegal waste activity and lack of
effective regulation, than the absence of appropriate
waste collection systems.
River banks, waterways and open drains provide a
convenient location to dispose of waste so are com-
monly used for uncontrolled disposal and are often
chosen intentionally in order to allow the wastes to
be transported away by water flows. For example, in
the case of the Aboabo River in Kumasi, Ghana di-
rect dumping into or near the river represents almost
45% of the households’ waste disposal practices[13].
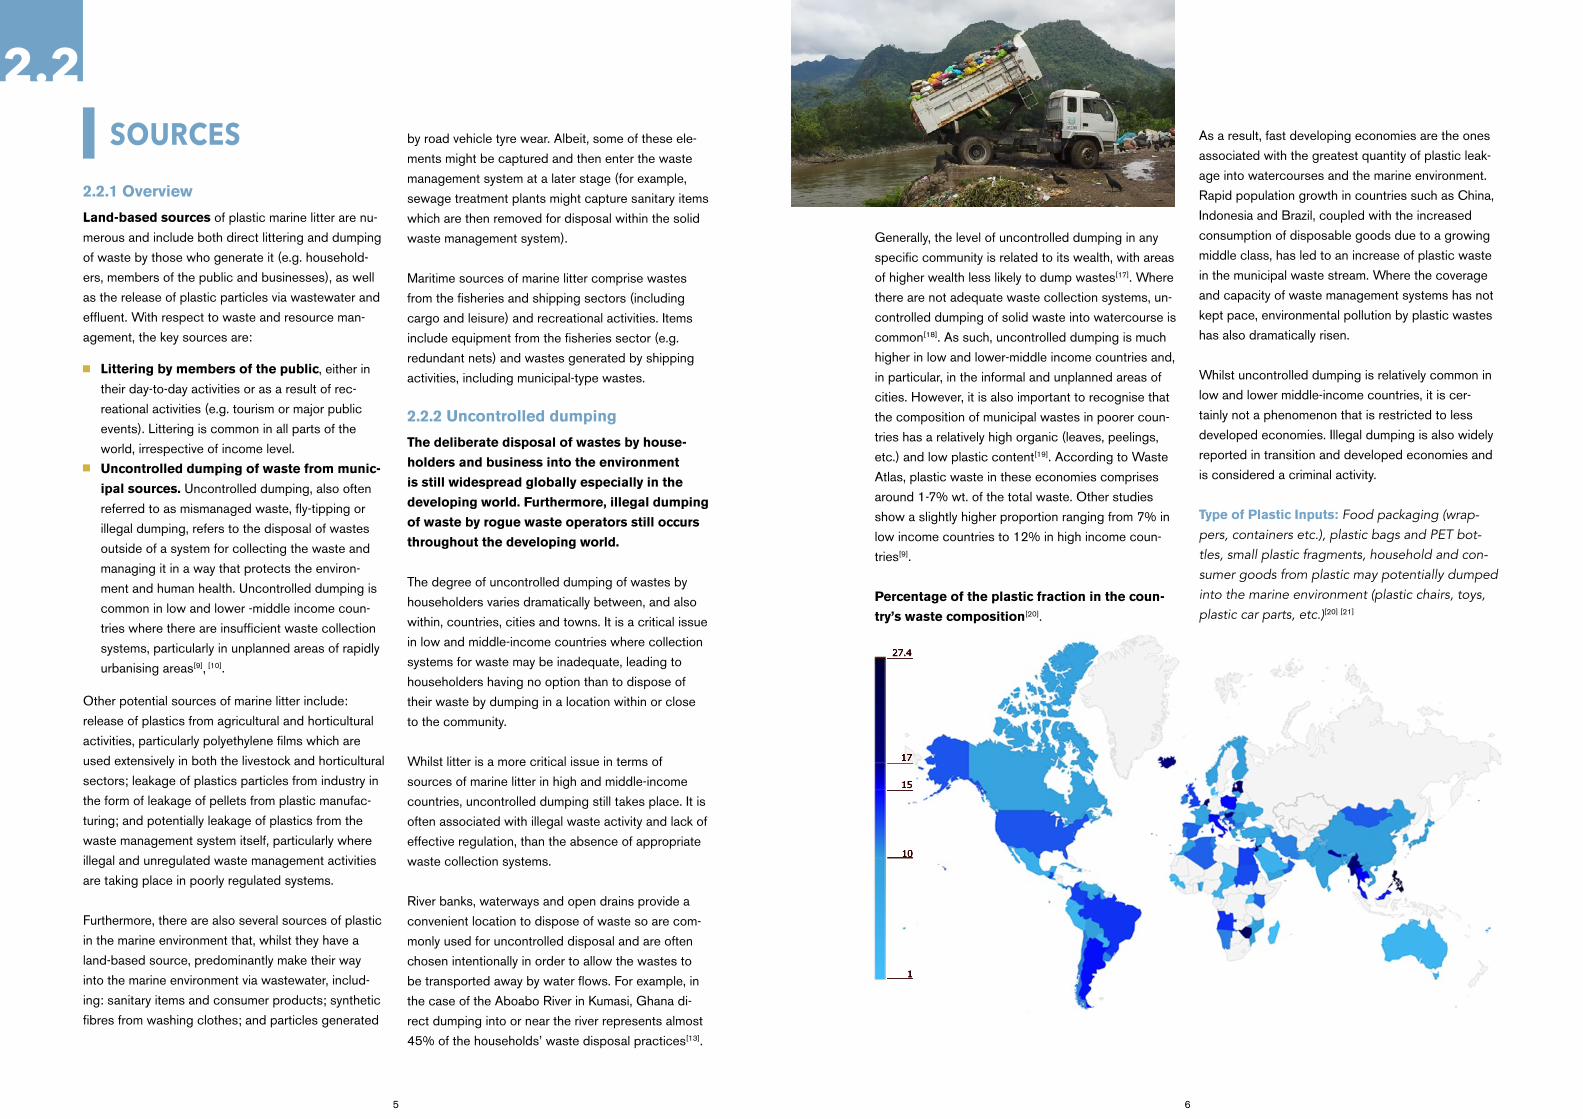
Generally, the level of uncontrolled dumping in any
specific community is related to its wealth, with areas
of higher wealth less likely to dump wastes[17]. Where
there are not adequate waste collection systems, un-
controlled dumping of solid waste into watercourse is
common[18]. As such, uncontrolled dumping is much
higher in low and lower-middle income countries and,
in particular, in the informal and unplanned areas of
cities. However, it is also important to recognise that
the composition of municipal wastes in poorer coun-
tries has a relatively high organic (leaves, peelings,
etc.) and low plastic content[19]. According to Waste
Atlas, plastic waste in these economies comprises
around 1-7% wt. of the total waste. Other studies
show a slightly higher proportion ranging from 7% in
low income countries to 12% in high income coun-
tries[9].
Percentage of the plastic fraction in the coun-
try’s waste composition[20].
As a result, fast developing economies are the ones
associated with the greatest quantity of plastic leak-
age into watercourses and the marine environment.
Rapid population growth in countries such as China,
Indonesia and Brazil, coupled with the increased
consumption of disposable goods due to a growing
middle class, has led to an increase of plastic waste
in the municipal waste stream. Where the coverage
and capacity of waste management systems has not
kept pace, environmental pollution by plastic wastes
has also dramatically risen.
Whilst uncontrolled dumping is relatively common in
low and lower middle-income countries, it is cer-
tainly not a phenomenon that is restricted to less
developed economies. Illegal dumping is also widely
reported in transition and developed economies and
is considered a criminal activity.
Type of Plastic Inputs: Food packaging (wrap-pers, containers etc.), plastic bags and PET bot-tles, small plastic fragments, household and con-sumer goods from plastic may potentially dumped into the marine environment (plastic chairs, toys, plastic car parts, etc.)[20] [21]
2.2

7 8
2.2.3 Littering
Littering by members of the public, either as
part of their day-to-day movements or during
specific leisure activities, is a key source of
plastics that eventually find their way into the
marine environment. It is a global phenomenon
but is more critical in this context in the devel-
oped world. Uncontrolled dumping is a more
critical issue, in relative terms, in low-income
countries.
Hotspots for litter deposition tend to be areas
where people congregate or pass through in large
numbers. For example, rivers and coastal areas are
popular places for leisure activities and public events.
Other public areas, such as recreational parks and
carparks, and areas where large numbers of peo-
ple gather or transit through (e.g. train stations) are
key hotspots for litter deposition. If not collected,
these littered materials often enter drains and, in
due course, streams and rivers[11]. They may also be
blown directly into rivers or, in the case of coastal
areas, directly into the sea.
However, the factors that affect the proportion of
litter items that ultimately reach the marine environ-
ment are complex. Litter hotspots in urban areas will
depend upon a mix of consumer behaviour, levels
of deprivation, population density, traffic levels, the
location of public events, and the number of visitors
to different areas. A recent extensive study under-
taken in Australia indicates that littering tends to be
greater in areas that people transited through (e.g.
retail parks, parking areas and shopping centres)
rather than areas that people tended to spend time
in, such as residential areas. Quantities of litter also
tended to be lower in areas where people placed an
amenity value on the area, such as a beach. This sug-
gests that beaches themselves, whilst clearly directly
associated with the sea, are not the dominant source
of marine litter[12].
Consumer behaviour is a critical factor that deter-
mines how much, and the type of, material that is
deposited on the ground and has the potential to
enter the marine environment. A number of studies
have suggested that litter attracts litter, indicating
that once the local environmental quality of an area is
affected by the presence of litter, this has a tendency
to become worse. Litter is also linked to other local
disamenities such as graffiti, uncontrolled dumping
and dog fouling[13].
The extent and efficacy of waste collection systems,
including the number and suitability of public bins
and street cleaning operations, will also determine
how much material is prevented from escaping into
the wider environment. For example, key public spac-
es that experience high levels of littering but have
regular street cleansing services may pose a low
risk. Conversely, areas with lower numbers of people
passing through but also a lower regularity of cleans-
ing services (e.g. more deprived areas of cities) may
actually experience higher levels of litter material and
pose a greater risk of marine litter.
Type of plastic inputs: Food wrappers, contain-ers, plastic bags, plastic cups, plastic straws, PET bottles, and other plastic litter [11], [14], [15].
2.2.4 Fly-tipping
In the UK fly-tipping is a significant cause of envi-
ronmental damage[18]. The costs to local authorities
to remove flytipped wastes in 2015/16 were £49.8
million [22]. In 2015/2016, there were a reported 936
thousand cases of fly-tipping incidences in England
in 2015/16, two thirds of which are related to waste
from households[22].
Fly-tipping is the illegal dumping of waste without a
waste management licence and in is a criminal of-
fence punishable by a fine in many developed coun-
tries. The size of plastic waste disposed this way may
vary from one plastic bag of waste, to plastic chairs,
tables and even plastic car compartments.
Type of Plastic inputs: plastic bags, bulky house-hold and consumer fgoods from plastic etc. [23], [24]
2.2.5 Escape of plastics from mismanaged solid waste management activities
Although the role of waste management is
aimed at controlling and managing waste and
recovering resources, some plastics can unin-
tentionally escape during transport, handling,
treatment or disposal. Furthermore, illegal
dumping of waste by rogue waste operators
still occurs throughout the world, in low, middle
and high income countries.
Waste management involves the movement of high
volumes of waste materials from households, busi-
nesses and institutions to treatment and disposal
facilities. Even as part of well-organised collection
systems of high-income countries, accidental spillag-
es may occur at collection, transportation or disposal
sites; of interest here are particularly those close
to watercourses[25]. Clearly, poorly managed waste
management facilities are likely to have much more
potential to be a source of marine litter, allowing ma-
terials to be transported away from the site via wind
or via water runoff[26].
Materials that escape during waste collection and
transportation may have a similar effect to littering.
However, there can be also leakage of plastic during
treatment of waste and the processing of secondary
materials.
2.2.5.1 Engineered Landfills
In landfills, as opposed to dumpsites, waste is dis-
posed of in specifically designed infrastructure that
involves environmental pollution abatement equip-
ment and where operational practices and waste
control are carefully implemented[27 ]. For example
daily cover of freshly placed municipal solid waste
at an engineered landfill facility is intended to con-
trol various health and nuisance factors and prevent
material being blown or washed away by wind and
surface run offs respectively.
Nevertheless, in transition countries landfills planned
as controlled engineered sites can end up being mis-
managed. At such dumpsites (e.g. missing cover soil
material) light plastic waste could escape through
wind or runoff, as explained above, and be released
to the surrounding environment. Also leachate, when
not properly managed, could release micro-plastics
that can enter waterways. Especially, when landfills
are located in a high rainfall country, a production
of leachate and surface runoff might be expected to
escape into waterways[28].
2.2.5.2 Organic waste treatment
Compost, digestate and sewage sludge that results
from the treatment of biowaste of municipal origin as
well as wastewater treatment residues are often con-
taminated with macro- and micro-plastics impurities,
which depend upon the source of the waste stream
(e.g. plastic bags, undigestable / uncompostable
food packaging mixed in food waste streams, or sani-
tary items from wastewater)[29].
Most organic waste treatment plants are equipped
with extensive mechanical processes (pre-treatment
and post-treatment around the biological reactor) to
remove and the safely dispose of any contamination.
However, the effectiveness of the equipment varies
and in practice, sorting limitations can leave some
impurities in the material that goes on for further
treatment or on-land application.
In the European Union (EU), fertilizer products based
on organic waste must meet quality standards, i.e.
demonstrate compliance with the requirements of
the fertilizer trade regulation in order to get into the
market. The regulation requires that foreign objects
(e.g. glass, metal, and plastic) in fertilizer products
made from organic waste over 4 mm in size should
not exceed 0.5% by weight of the dry matter prod-
uct[29]. However this is not the case in all countries
around the world. Further post-treatment processes
for compost and biogas digestate can be applied to
remove any impurities left to treated organic material,
but implementation also depends on costs.
2.2.5.3 Plastics recycling facilities
Usually, all plastic recycling facilities have a system
for sink/ float sorting of plastic waste according to
the specific gravity of different plastic types. It is
assumed that waste water of these facilities contain
plastic items or particles from the rough washing

9 10
and/or agglomeration processes. Also light plastic
pellets can be lost in the environment during the pro-
cess or storage phase and transported by wind and/
or surface runoffs to different waterways. Leakage
from mismanaged plastic recycling facilities could be
the case either in low-income countries or in high-in-
come countries.
However, the problem is greater in countries of
low-income countries, where plastic is recycled
mostly in small scale reprocessing facilities, that may
not operate to stringent standards, taking advantage
of poor levels of law enforcement of national environ-
mental policies.
For instance, in China some of the imported and
domestic plastics may end up at low-tech, uncon-
trolled plants. While there are many large licensed
reprocessing facilities, the industry is dominated by
small family-run enterprises. The size of these smaller
companies allows them to develop highly specialized,
niche services, making them the go-to destination
for specific recyclables. Further, their business costs
are far lower than licensed facilities because they are
often looser with safety and environmental concerns.
Licensed companies must responsibly dispose of
excess nonrecyclable waste, while unregulated firms
burn anything that cannot be recycled or dump them
in improvised dumpsites. These unregulated prac-
tices pollute heavily and often destroy local land and
waterways while introducing serious health issues
to workers and their communities. Open burning
or dumping of unrecyclable plastics residues is the
normal case[29],[30].
2.2.5.4 Paper recycling
Paper recycling factories receive large amounts of
paper, cardboard and corrugated board, which may
contain plastic elements that have the potential to
leak into the environment. For example, measure-
ments of the outlet of a Dutch paper recycling plant
demonstrated high concentrations of plastic content.
Based on Dutch effluent measurements this was
estimated to result in the release of microplastics of
60 t/year in 700,000 m3 waste water[32]
2.2.5.5 Food waste shredders
Food waste shredders installed into kitchen sinks on
ships and in institutions, used to grind food waste
before disposing of it with wastewater, are popular
in some countries. There might hence be a risk that
plastic film and food wrapping follows the food waste
through this maceration, and is then released as
macro or microplastics[29].
Type of plastic inputs: waste plastic items and materials of all types, including plastic pellets.
2.2.6 Industrial sources
The industrial sector is a key source of mi-
croplastic litter items in the marine environ-
ment[33]. The litter generated by the industrial sector
primarily comprises resin pellets, the virgin material
used within the plastic manufacturing process [34].
These materials can become marine litter during
disposal or transport [25].
Industrial micro-plastics can make up a surprisingly
large percentage of the total load of plastic in rivers
and the marine environment, particularly in industrial-
ised countries in Europe and North America, but also
fast growing economies in Asia. Industries such as
the automotive, furniture, clothing and large packag-
ing manufacturing companies are thought to be key
sources of microplastics in the marine environment.
86% of the Danube River’s plastic load originates
from the activities of plastics manufacturing and
processing companies operating near the banks of
the river[35 ].
Types of plastic inputs: microplastics
2.2.7 Agricultural and horticultural sources
Plastic materials used in agriculture and
horticulture, plastic particles contained in
sewage sludge and compost from municipal
sources are all potential sources of marine
microplastics.
In agriculture and horticulture, polyethylene films are
used extensively to increase yields, extend growing
seasons, reduce the usage of pesticides and her-
bicides, and help conserve water[36]. These plastics
comprise about 80% of the agricultural plastic waste.
Some plastic wastes, such as films for tunnels and
greenhouses, can be successfully collected and
recycled. Other thin film applications, such as mulch
films, the plastic waste collection is more difficult due
to contamination by soils and crop residues [37]. Farm-
ers facing high landfill taxes to dispose this type of
plastic, along with the difficulty to collect it, may pre-
fer to bury these materials on farm or to dump them
into rivers and other waterways [38]. Furthermore, a
significant part stays in the fields and fragments,
generating microplastics that end up in rivers with
water runoff[37].
Application of sewage sludge in agriculture as a fer-
tilizer may introduce large quantities of microplastics
that originated in sewerage and has become part of
sewage sludge. In Europe and North America ap-
proximately 50% of this sludge is reused as fertilizer.
According to Statistics Norway, about two thirds of
the sludge in the country is reused in this manner[39].
Nizzetto et al. estimate that between 110,000 and
730,000 tonnes of microplastics are transferred
every year to agricultural soils in Europe and North
America, comprehensively [36]. This is more than the
estimated total burden of microplastics currently
present in ocean water. Their studies, based on simu-
lation modelling, indicate that meteorological condi-
tions and river characteristics have a strong influence
over the export of microplastics from agricultural soils
and their transport via rivers to the ocean[39].
Macro and micro-plastic fragments shed from plas-
tic-coated paper products and other plastic that are
present in finished compost may disseminate into the
environment through the application of compost to
soils. These micro-plastics will eventually migrate into
other land and aquatic ecosystems through wind and
surface run-off[40].
Types of plastic inputs: Irrigation plastic pipes, pots, plastic mulch and other plastic films/sheets from agricultural have been reported as sources of riverine plastics[38] [41].

11 12
facilities are lacking[22]. Other examples of surveyed
cases include the East Lyn River in the UK where
survey data indicated that 2% of the litter was of
sewage related origins[23]. Also in the case of the
largest Welsh river, some 22% of the litter surveyed
comprised feminine hygiene products[23].
In a study of over 1000 people in Ireland, 3 in 10
admitted to flushing such items down the toilet. Of
these, 58% admitted to flushing baby wipes down
the toilet, 40% facial wipes, 26% cotton bud sticks,
24% tampons and 21% cigarette butts. More than
half of those who flush these items down the toilet
did so simply due to a lack of knowledge of the im-
pacts they would cause.
Types of plastic inputs:
Macroplastics: Sanitary related macroplastic litter from sewage consists of sanitary towels and backing strips, tampon applicators and residue, cotton bud sticks, facial scrubs, and condoms[11],[46].
Microplastics: Similar problems arise when microplastics are used within everyday life, such as cleaning synthetic clothes or using facewash with microbeads[47]. These materials are too small to be eradicated during wastewater treat-ment and remain within outflow water [47].
1.
2.
2.2.8 Fisheries and shipping in waterways
Whilst estimated to be a relatively small source in comparison to other sources, river fish-ing-related items from both recreational and commercial fishermen (e.g. nets, fishing line and bait boxes) have been found in rivers and are thought to make their way into the marine
environment.
During the Grays Harbor/Chehalis River Derelict
Fishing Gear Removal Project in 2011 a total of
50 derelict nets were removed from an area of less
than 2000 m2[39]. In both years almost half of the lost
fishing gear was collected near the harbour (i.e. in
transit to the marine environment). Net filaments from
recreational fishing have also been reported in the Po
and Rhine rivers[30].
Furthermore, shipping and boating activities that take
place on rivers may directly dump waste into the
water bodies. Materials are likely to include industrial
packaging, strapping, plastic containers, and plastics
from municipal-like sources. However. data on this as
a source is very limited.
Types of plastic inputs: nets, fishing line, bait boxes from fisheries; industrial plastic packaging, strapping, plastic containers etc. from shipping.
2.2.9 Sanitary items and consumer cosmetic products
Plastic items and microplastic beads from cos-
metics are commonly flushed down toilets, but
much of this materials passes through waste
water treatment systems and escapes into river
and marine environments.
Some of these particles are too small in size to be
captured at wastewater treatment plant (WWTPs)[43],[44]. Where facilities exist, larger items would
normally be captured by waste water treatment.
However, materials can bypass systems and enter
waterways when rain levels exceed sewage treat-
ment facility handling capacities[45].
One example where this is particularly common is in
Brazil where rainfall levels are high and/or treatment
2.2.10 Synthetic fibres from washing clothes
Microplastic fibres generated by washing synthetic
textiles in washing machine effluent are often not
captured by waste water treatment plants (WWTPs)
and so are released into river surface waters or the
sea[48]. According to Plymouth University, in the UK
each cycle of a washing machine could release more
than 700,000 microscopic plastic fibres into the
environment[49].
These microfibres pass through domestic wastewa-
ter into sewage treatment plants where some of the
tiny plastic fragments are captured as part of sew-
age sludge. The rest passes through into rivers and
eventually, oceans. Research has shown that waste-
water treatment effluent is a source of plastic fibres
to marine sediment[43], fibres and particles to coastal
waters[47], pellets to riverine sediment[51], and pellets,
fragments, and fibres to river surface waters[52]. A
paper published in 2011 found that microfibres made
up 85% of human-made debris on shorelines around
the world[43].
Types of plastic inputs: microfibres
2.2.11 Micro-plastics from road vehicle tyres
Secondary micro plastic particles generated
by road vehicle tyre wear are the largest single
source microplastics[53].
This comprises particles of rubber dust from tyre
wear (mainly <80 micrometers). Part of the dust
becomes airborne, and some lands directly on the
road or adjoining land. From there a proportion will
enter surface waters or drains. An unknown propor-
tion will be carried to the sea.[4] A study performed
by nova-Institut GmbH in 2015 estimates that in
Germany between 60,000 and 111,000 tonnes of
microplastics are caused each year by abrasion of
car tyres. The figure for Europe is between 375,000
and 693,750 tonnes. Thus, the debate on microplas-
tics cannot ignore car tyre abrasion as a source.
More investigation is required[54].
Types of plastic inputs: particles of rubber dust

13 14
Asia 86%
Africa 8%SOUTH AMERICA 5%
Central and NORTH
AMERICA 1%
EUROPE 0%
AUSTRALIA PACIFIC
REGION 0%
Food wrappers/
containers 25%
TobacCo packaging/
wrappers 19%
GENERAL PLASTICS 24%
SANITARY TOWELS
COMPONENTS 21%
CUPS, PLATES, FORKS,
KNIVES, SPOONS 5%
Others 4%
PLASTIC
BAGS 2%
4,60%
1,15%
1,15%
8,05%62,07 %
14,94 % 1,15%
3,45%
3,45%
PE
PP
PET
IPP/LPR
WOOL + PP = 3:2
OTHER
PS
ABS
NYLON - PA
River inputs
2.3.1 Introduction
Plastic fragments primarily reach the marine
environment through waterways, rivers (cov-
ering entire catchment areas) and storm/
wastewater discharges (including storm waste
and surface water drainage systems). Light
plastics can be also carried by the wind into
watercourses or directly to the sea, if discarded
or deposited in coastal areas. A proportion of
plastics from land-sources are also deposited
directly into rivers and the marine environment
through dumping on coastlines and, in some
cases, directly into the sea.
Once plastics are in the aquatic system, trans-
port mechanisms are complex and are currently
poorly understood. The movement of a plastic
item or fragment will depend upon a wide range of
interrelated factors including geographical location,
local meteorology and hydrodynamics, ecosystem
effects, and the properties of the plastic itself. They
can be transported over long distances before being
deposited onto shorelines or settling on the bottom
of the ocean[45] [55].
It is also important to recognise that a substantial
proportion of plastics that enter streams and rivers do
not reach the ocean, either accumulating within or on
the banks of rivers and estuaries. These plastics also
have adverse effects on the local environment and
ecosystems, and the fisheries and tourism sectors.
Depositional patterns of litter in rivers depend on a
range of factors density of vegetation, watercourse
obstructions and climatic conditions[56]. Movement
and depositional mechanisms of plastic marine litter
along rivers are not fully understood. Mobility studies
with tagged items showed the complexity of mecha-
nisms involved in the transport of litter to the sea[23], [57]. For examples, plastics may be ingested acciden-
tally by freshwater fish[58], cleaned away or picked up
by waste pickers[59],[60].
2.3.2 Rivers: both a hotspot and a pathway
Rivers are considered to be the main mech-
anism for transporting plastics litter to the
marine environment and are also considered to
be a final sink for a large proportion of plastic
litter[7], [23], [61]–[65].
Over 50% of the world’s population lives closer than
3 km to a surface freshwater body (i.e. river or lake),
and only 10% of the population lives further than 10
km away[66]. Rivers have therefore played a key role
in the development of cities and towns, but arguably
urbanization has come at a high cost. Most urban
rivers were channelled into canals and industrializa-
tion and increasing consumption patterns has led
to further degradation, with waterways becoming
dumping grounds for sewage, pollutants and other
wastewater[67].
Studies show that most land-based litter is carried by
water via rivers and storm-water[35], [68]. Large rivers
in particular are considered a major pathway for land-
based plastic litter reaching the marine environment.
Thompson et al (2009) suggest that rivers can act
as carriers for microplastic discharged from plastic
industry[5] and Williams and Simmons (1996) esti-
mated that some 80 % of the litter on the estuarine
beaches of South Wales comes from riverine sourc-
es. How ever this estimation might be outdated and
needs reconsideration.
Lebreton et al., 2017 estimate that between 1.2 and
2.4 million tonnes of plastic litter currently flows from
the world’s rivers into the oceans every year, and
that inland rivers are responsible for around 48% of
in-land marine litter while river systems within 50km
from the shoreline accounts for 20%. The study uses
a conservative approach that is based on plastics
concentrations sampled from river surface waters
in Europe, Asia, North and South America which do
not consider very large and very small plastics items
of fragments or fragments[3]. As such, Lebreton’s
estimate may be an underestimate.
The study indicated that almost 90% of plastic in
rivers is actually flowing into 119 rivers crossing low
income to upper middle-income countries around the
world -103 rivers in Asia, 8 in Africa and 8 in South
and Central America – representing 36% of global
population. More specifically, Asian rivers are respon-
sible for 86% of the total global input, 7.8% coming
from Africa, 4.8% from South America 0.95% from
Central and North America, 0.28% from Europe
and the remaining 0.02% from the Australia-Pacific
region.
A considerably high-population density in Asia com-
bined with relatively large plastic waste production
rates and episodes of heavy rainfalls has resulted in
this dominant contribution from the Asian continent.
Over 74% of most of the release of used plastics
from global rivers to the ocean takes place between
May to October from Asia[3] during the East Asia
Monsoon.
Land uses (e.g. residential, commercial or industri-
al) of the catchment area and stream area and the
socioeconomic behaviours and activities are influenc-
ing factors that determine the composition of litter
discharged within rivers[69], [70].
2.3
Litter items that are found in rivers can be whole
objects, but mostly parts or fragments of products[24], [33], [70]–[73]. For example, a study by Morritt et al.
(2014) reported on the composition of submerged
plastic litter flowing down the River Thames, UK[24].
Packaging plastic waste accounted for nearly 45%
while sanitary towels discharged with sewage ac-
counted for 21%. The study findings on plastic litter
composition are summarized in the following Figure.
Composition of submerged plastic litter in Thames
River[24].
Findings of another study in Brazil by Araujo and
Costa (2006) indicate a similar pattern of plastic
litter composition deposited on isolated beach along
dry and rainy seasons cycle where food packaging
and sewage related debris accounted for 48% and
17% respectively[74]. The majority of plastic items
found were related to household activities. Three
use-related categories - food, sewage/hygiene and
house cleaning - were the most frequently found and
accounted for more than 80% of total number of litter
items.
Comparison of the content of plastic materials among
European rivers for all plastic categories together
shows that polyethylene (PE) is the most prevalent
material in all rivers. In the Danube River the second
PATHWAYS

15 16
Asia 86%
Africa 8%SOUTH AMERICA 5%
Central and NORTH
AMERICA 1%
EUROPE 0%
AUSTRALIA PACIFIC
REGION 0%
Food wrappers/
containers 25%
TobacCo packaging/
wrappers 19%
GENERAL PLASTICS 24%
SANITARY TOWELS
COMPONENTS 21%
CUPS, PLATES, FORKS,
KNIVES, SPOONS 5%
Others 4%
PLASTIC
BAGS 2%
4,60%
1,15%
1,15%
8,05%62,07 %
14,94 % 1,15%
3,45%
3,45%
PE
PP
PET
IPP/LPR
WOOL + PP = 3:2
OTHER
PS
ABS
NYLON - PA
LOW-INCOME
COUNTRIES
LOWER MIDDLE-
INCOME COUNTRIES
UPPER MIDDLE-
INCOME COUNTRIES
HIGH-INCOME
COUNTRIES
36
46
31
92
72
62
3015
20
40
60
80
100
0
WASTE WATER TREATMENT (%)
UNTREATED WASTEWATER IN 2015 (BASELINE)
UNTREATED WASTEWATER IN 2030 (ASPIRATION)
Percentage of untreated wastewater in 2015 in countries with different income levels, and aspirations for 2030 (50% reduction over 2015 baseline) [76].
most prevalent material is polystyrene (PS) and the
third Nylon-PA. In the Po River the second most
prevalent material is polypropylene (PP) and the third
polyurethane (PU). The first and second samplings
on the River Rhine have the same content of plastic
material, which show that the second most populated
material is PP and the third is PS. In the Dalålven
River almost 40% of particles were not identified as
plastic material. The most prevalent material PE is
followed by Nylon-PA and PS.
Content of Plastic Litter in Danube River
2.3.1 Drainage systems and flooding events
Rainwater, particularly in urban areas, trans-
ports a wide range of waste materials into
drains and waterway, and onward into rivers
and the sea. Materials include street litter, mu-
nicipal solid waste, and waste from dumpsites/
landfills [34], [71], [75], [76].
In communities without storm water drainage sys-
tems, plastic waste disposed on sidewalks and
streets and in gutters flows directly into streams and
rivers during rain events. This issue is exacerbated
by flooding events which can serve to mobilise large
volumes of waste material, including large volumes
of waste material from dumpsites. In many cases,
plastic waste may choke drains and cause serious
flooding[77].
2.3.2 Sewers Overflow
During heavy rainfall episodes untreated
wastewater can find its way into streams and
rivers, either via combined sewer outfalls, or
directly into the sea[48]. Where there are no
waste water treatment plants sewage will pass
directly into waterways[78].
Flooding event in Lagos, Nigeria (Source: Margaret Oshadi)
In the River Thames, there are 57 ‘combined sewer
overflow’ (CSO) sites which overflow approximately
60 times a year, resulting in approximately 39 million
tonnes of raw sewage entering the watercourse. This
has been identified as an extreme problem for the
health of the River by the London Council, as well as
being identified as being in breach of the EU Urban
Waste Water Directive[80].
New York City has a combined sewer system. During
storm events, rain falling within the Bergen watershed
enters the storm drains and mixes with raw sewage in
the sanitary sewer system. During heavy rainfalls, the
combined sewage and stormwater overflow directly
into the Gowanus Canal, discharging over 1.1 million
cubic meters of combined sewage. Consequently,
the Gowanus Canal remains listed on the New York
State Section 303(d) list of impaired water bodies[81].
Percentage of untreated wastewater in 2015 in
countries with different income levels, and aspirations
for 2030 (50% reduction over 2015 baseline) [79].
Wastewater treatment (%)

17 18
2.3.3 Wind blown litter
Due to the lightweight nature, plastics are
particularly susceptible to being transported by
the wind. This can play a key role in distributing
plastic items, particularly bags and films, and
transporting them into rivers or directly into
the sea [73], [82]–[84]. Indeed, they often blow out of
litter bins, landfill sites and other waste management
facilities even after they have been collected. How-
ever, the surface tension of the water prevents them
blowing any further [85].
2.3.4 Atmospheric Inputs
Some studies indicate that
microplastics can be trans-
ported in the atmosphere.
A study by Galgani [86] identified
high densities of plastic particles
in a remote mountain lake in Mon-
golia distant from urban sources
and suggested that the likely
source was atmospheric deposi-
tion[87]. The concept of atmospher-
ic fallout has also been used to
explain fluxes of microplastics to
the watershed of the River Seine
in Paris[88]. Microplastics fallout
ranged from 29 to 280 particles
m-2 day-2 (average 118, fibers
accounting for 90% of the total
particles) depending on the peri-
od when rainfall occurred.

MACROPLASTIC
MICROPLASTIC
19 20
One critical factor that has not
yet been assessed in detail by
existing studies is the degree
to which macroplastic items
fragment and degrade during
their transport towards and
within the marine environ-
ment. Secondary microplastic,
resulting from the breakdown
of plastic litter caused by
weathering/erosion, and not
primary microplastic, is often
regarded as the dominating
contributor to microplastic in
the sea[89].
The change from a macroplastic
to a microplastic fragment has a
significant effect in terms of the
ease by which it can be captured
and collected (and its value), and
conversely, the ease by which it is
disperses in the aquatic envi-
ronment and ingested by marine
organisms. Clearly, larger plastic
items can be captured and poten-
tially valorised (i.e. of beneficial
value in material terms) whereas
small fragments are very difficult
to capture.
The rate and nature of fragmenta-
tion and degradation will depend
upon the polymer and its expo-
sure to sunlight and high temper-
atures. Light polymers such as
polyethylene (PE), polypropylene
(PP) and polystyrene (PS) are the
most common types of plastic
litter on surface waters. Denser
polymers, such as polyester (PL),
nylon (NYL) and polyvinyl chloride
(PVC), tend to sink but may be
transported in waterways due to
turbulent blending as a result of
wind and tidal streams causing
their re-suspension in the water
column [73].
Plastic debris degrades by be-
coming progressively more brittle
under the action of ultraviolet light
and heat, eventually fragmenting
under physical action from wind
and waves into small microplastic
pieces [90].
Compared to marine or riverine
litter, plastic litter on land under-
goes heat build-up due to UV
sunlight exposure, leading to
increased brittle fragmentation [91].
Due to the nature of litter trans-
portation, fragmentation is also
likely to occur before the debris
encounters the aquatic envi-
ronment. Litter can travel some
distance over land becoming
trapped in trees and branches for
short periods on the way, me-
chanically fragmenting into smaller
pieces [92]. There appears to be
a lack of studies that investigate
the effects of mechanical action
(abrasion) on plastic debris over
land (e.g. on pebbly beaches).
The majority of polymers are
resistant to biodegradation
within marine conditions, but will
break down gradually through
mechanical action. In a study
conducted by Browne et al in
2010, a substantial quantity of
the microplastic debris present
had formed from the breakdown
of larger items such as clothing,
packaging, and rope. Hence,
there is considerable potential
for large-scale accumulation of
microplastics [93].
The rate of degradation varies dramatically depend-
ent on the situation and type of plastic available [94].
LDPE breaks down rapidly when it enters the marine
environment, especially during the first week of expo-
sure [95]. By contrast, HDPE and other plastics break
down far less rapidly and so often persist in the form
of larger items.
The fragmentation rates are typically very slow and
vary greatly depending upon three main factors:
plastic properties, biotic properties, and geographical
features [25]. Note that a combination of environmental
factors and the additives within the plastic lead to
fragmentation, whilst other studies [88] identify that it
also occurs as a result of a high humidity that affects
the plasticising ability of plastic within water.
However, there are likely to be more factors that influ-
ence degradation as a whole to cause faster breakup
rates than estimated here. For example, Browne et
al. (2010) suggest that the sediment structure of
the clay affects the fragmentation rate of the debris
travelling along the riverbed [82]. Williams and Sim-
mons (1999) theorise that the mechanical action of
continuous contact with riverbanks and vegetation
may cause fragmentation of plastic debris [45].
LDPE is often ‘enhanced’ to photodegrade in a
short time period as this is viewed as being more
eco-friendly [96]. Once this with hypothesis was tested
by Andrady (1990), it was found that much of the
unenhanced plastic subjected to a marine environ-
ment contracted a thick layer of algae, weighing the
film down, it also failed to turn into a brittle state and
decompose as with its in-air counterparts [96].
O’Brine and Thompson (2010) also studied the deg-
radation of several types of plastic bags within the
marine environment. They concluded that polyester,
polyethylene and biodegradable LDPE significantly
reduced their tensile strength over time. As a result,
the authors argue that tensile strength is a useful
measure of degradation within plastics[98]. However,
it must be taken into account that this investiga-
tion aimed to model plastic flow within a riverine
environment as opposed to a marine one. The salt
water within a marine environment may contribute to
weathering effects through the minerals present in
the water, whereas this may not occur within a river-
ine environment as it will have a much lower mineral
content [96].
Photo-oxidation is said to occur within PP and PS,
after approximately 3000 hours, and this occurs in a
shorter timeframe compared to LDPE and HDPE af-
ter approximately 2000 hours [98]. A study conducted
by Weinstein et al. (2016) monitored the degradation
rates of strips of HDPE, PP and extruded PS within a
marsh environment with occasional water contact[99].
After 8 weeks, biofilm was found on all samples
and their layers of plastic film had begun to peel off
(delaminate). When samples were examined under
a microscope, the pitted surfaces resulting from the
delamination led them to conclude this was a result
of microplastic production and that this mechanism
began to occur after an 8 week period.
Weinstein et al. (2016) pointed to a combination
of both biotic and abiotic factors causing the break-
down of the plastic samples [99].
2.4TRANSFORMATIONS
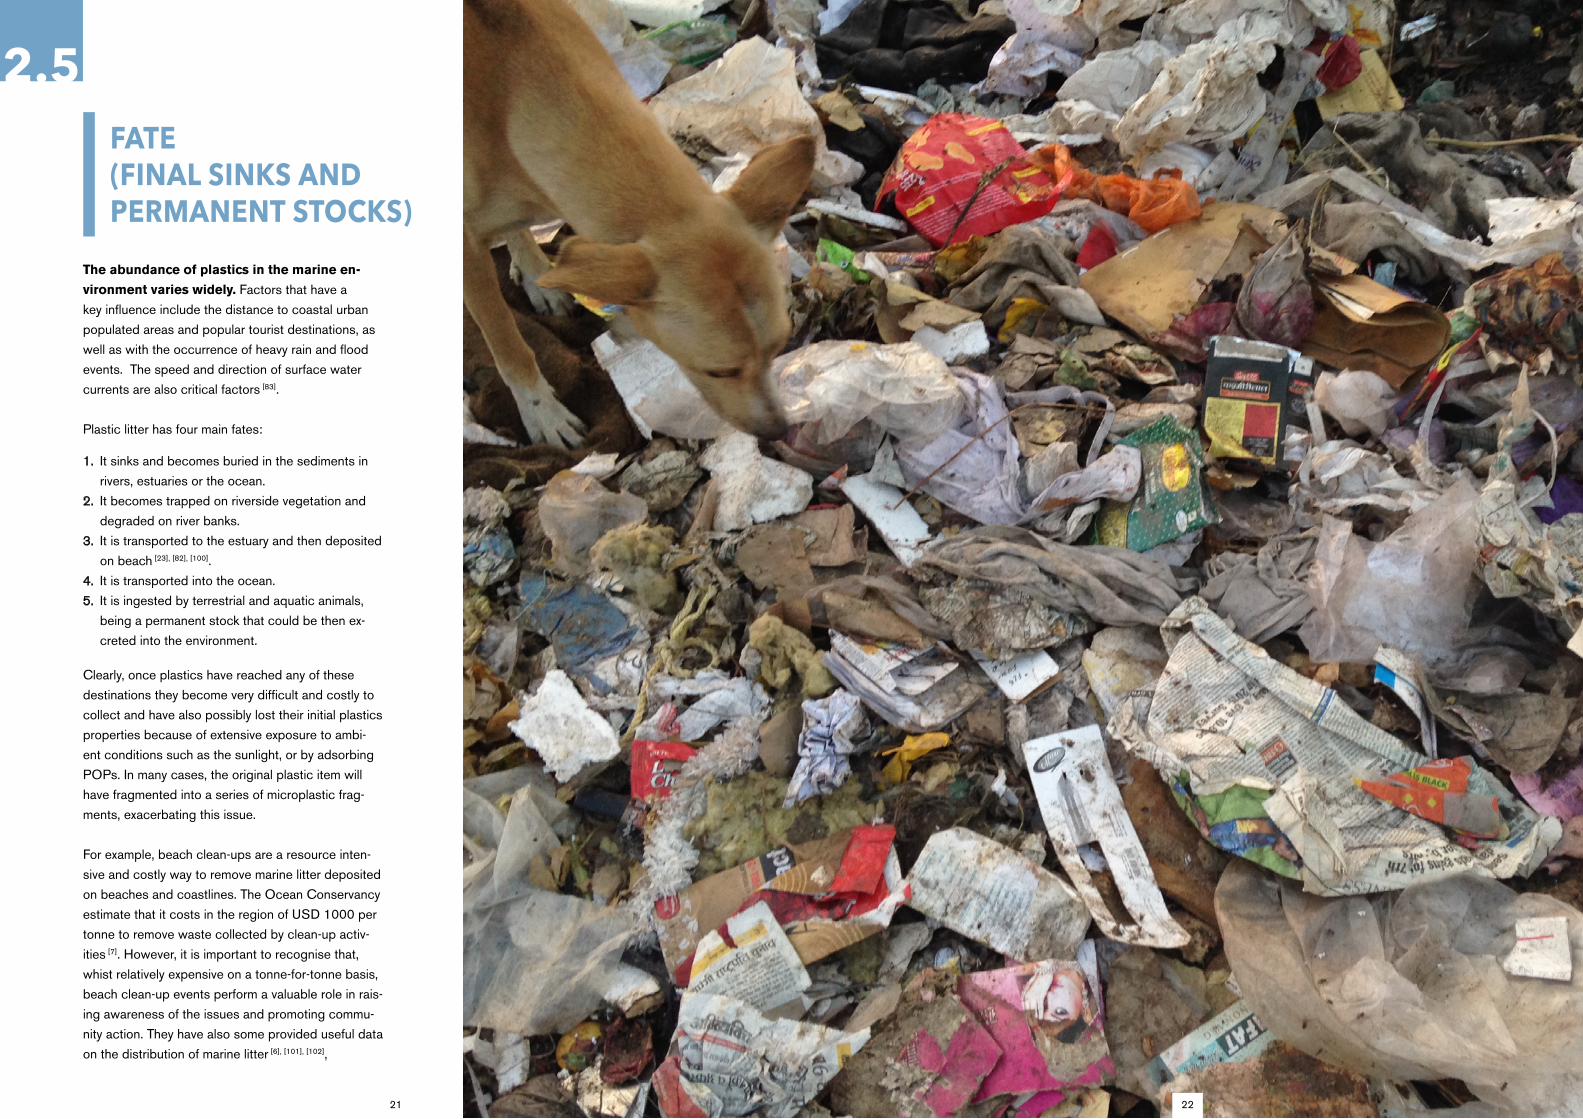
21 22
The abundance of plastics in the marine en-
vironment varies widely. Factors that have a
key influence include the distance to coastal urban
populated areas and popular tourist destinations, as
well as with the occurrence of heavy rain and flood
events. The speed and direction of surface water
currents are also critical factors [83].
Plastic litter has four main fates:
Clearly, once plastics have reached any of these
destinations they become very difficult and costly to
collect and have also possibly lost their initial plastics
properties because of extensive exposure to ambi-
ent conditions such as the sunlight, or by adsorbing
POPs. In many cases, the original plastic item will
have fragmented into a series of microplastic frag-
ments, exacerbating this issue.
For example, beach clean-ups are a resource inten-
sive and costly way to remove marine litter deposited
on beaches and coastlines. The Ocean Conservancy
estimate that it costs in the region of USD 1000 per
tonne to remove waste collected by clean-up activ-
ities [7]. However, it is important to recognise that,
whist relatively expensive on a tonne-for-tonne basis,
beach clean-up events perform a valuable role in rais-
ing awareness of the issues and promoting commu-
nity action. They have also some provided useful data
on the distribution of marine litter [6], [101], [102],
2.5
1.
2.
3.
4.
5.
It sinks and becomes buried in the sediments in
rivers, estuaries or the ocean.
It becomes trapped on riverside vegetation and
degraded on river banks.
It is transported to the estuary and then deposited
on beach [23], [82], [100].
It is transported into the ocean.
It is ingested by terrestrial and aquatic animals,
being a permanent stock that could be then ex-
creted into the environment.
FATE (FINAL SINKS AND PERMANENT STOCKS)

23 24
Waste and resource management is a local issue but, in the context of marine litter, local actions will add up to
global impact. The waste and resources sector, as custodians of the value embedded in materials and products
after their use, has the potential to play a key role in tacking this global challenge. This will require partnership
between all parts of the sector, including policy-makers, municipalities, private sector operators, the finance
sector and the informal sector. This will also necessitate cross- and intra-disciplinary scientific approaches.
A recent study has estimated that
75% of land based marine litter
in low to upper-middle income
economies comes from litter and
uncollected waste [7], [103], while
the remaining 25% of the land-
based sources is plastic which
leaks from within the waste man-
agement system [103].
It is estimated that in low income
countries, for every metric tonne
of uncollected waste near wa-
terways, almost 18 kilograms of
plastic enters the ocean—equiva-
lent to more than 1,500 PET bot-
tles. Also for every metric tonne
of plastic waste that is collected,
as much as 7 kilograms of plastic
waste are leaked to the ocean be-
tween collection and disposal [7].
Post collection leakage can be
caused by improper dumping,
as well as formal and informal
dumpsites that are poorly locat-
ed or lack proper controls [7]. Fly
tipping and waste crime also play
a key role in adding to the sourc-
es of waste that leaks into marine
environments.
Based on this initial review of the
marine litter challenge, we have
identified four priority areas for
intervention. These interventions
will be explored in more detail by
the task force over the coming
months.3STOP THE LEAKAGE – NOW!
Prevent uncontrolled
dumping by providing
waste collection for all,
including services for all
communities.
Preventing littering and
fly-tipping by engaging with
communities and the public.
Close dumpsites near
waterbodies and provide
waste treatment and dis-
posal facilities for all.
Work with the maritime
sector to establish effective
systems for recovering waste
and recyclable materials from
the fishing, shipping and tour-
ism sectors.
1.
2.
3.
4.
9 Average of five (5) focus countries: China, Indonesia, Philippines, Thailand and Vietnam
3.1
INTRODUCTION

25 26
Table 1: Sustainable waste management and the SGDs
Help make sure cities are inclusive, safe, resilient
and sustainable (SDG 11)
Facilitate the transition to production and con-
sumption systems that are based on the principles
of circularity, where wastes are minimised and
those that are produced are cycled back in the
production system as valuable secondary materi-
als (SDG 12).
Generate economic growth and create sustaina-
ble, decent livelihoods, particularly for the poorest
in society, many of whom work in providing waste
and recycling services (SDG 8).
Reduce greenhouse gases by cutting methane
emissions from uncontrolled dumps and landfills,
and off-setting emissions generated other sectors
by increasing the use of recycled materials and
generating energy from waste products (SDG 13).
Reduce harmful pollution by discouraging open
burning of wastes, preventing unsanitary condi-
tions in communities and the dumping of wastes
in the wider environment (SDGs 3, 6 and 15).
Sustainable Development Goal
The role of sustainable waste management
The waste and resources sector provides livelihoods for millions of people globally, ranging from street cleaning and waste collection (including numerous informal sector workers) to waste treatment and materials reprocessing. Right to access to basic services such as waste collection is include here.
No poverty
Zero hunger
Good health and well-being
Quality education
Gender equality
Clean water and sanitation
Affordable and clean energy
Decent work and economic growth
Industry, innovation and infrastructure
Reduced inequalities
Sustainable cities and communities
Responsible consumption and production
Climate action
Life below water
Life on land
Peace, justice and strong institutions
Partnerships for the goals
1.
2.
3.
4.
5.
6.
7.
8.
9.
10.
11.
12.
13.
14.
15.
16.
17.
Reducing food waste is a priority for reducing hunger amongst the world’s poorest people. The waste sector has the expertise to help reduce food waste and create value from unavoid-able food waste, through composting and anaerobic digestion, creating useful fertilisers and energy.
Poor waste management practices, such as open burning of waste and uncontrolled dump-ing causes serious health impacts, particularly amongst those living close to waste sites. Improving waste and resource management will reduce these health impacts.
Many informal waste sector workers are children. Working with the informal sector will help get out of this sector and into education.
The majority of informal waste sector workers are women. Working with the informal sector to improve their working conditions will have a strong benefit to women working in waste and resource management.
Effective solid waste management is a fundamental element of providing clean water and sanitary conditions for all.
The waste and resource management sector is a key employer and is essential for economic growth. Clean cities attract business and investment.
Waste and resource management is at the centre of innovation in the way that we use materials and consume services.
The poorest are harmed the most by poor waste management. Improving waste management will create benefits for those most in need.
Sustainable waste management is key to making sure cities are inclusive, safe, resilient and sustainable, where everyone has access to all the basic services.
Developing sustainable models of consumption and production requires that we reduce waste and develop models of production based on the principles of circularity.
Uncontrolled emissions from landfills and dumpsites are one of the main sources of global methane emissions, a powerful greenhouse gas. Effective waste and resource management will reduce these emissions and also off-set emissions from other sectors, including industrial production (by encouraging the use of secondary materials) and energy.
Effective waste and resource management is essential to prevent the leakage of waste materi-als, particularly plastics, into the world’s oceans.
Poor waste management leads to pollution of soils, rivers and waterbodies. Providing waste management services for all will eliminate these impacts.
Waste management is a critical issue at municipal level and can be used as an indicator of good governance. It is ranked amongst the most important issues by municipal officials.
The waste and resources sector is an excellent example of a sector that, when working ef-fectively, involves th ge of stakeholders, from government, the private sector and the informal sector, all working together.
Waste has excellent potential as a source of energy.
Note: The Sustainable Development Goals are the set of 17 global goals developed by the United Nations in partnership with its 193 Member States. They were adopted in September 2015 and are a “universal call to action end poverty, protect the planet and ensure that all people enjoy peace and prosperity”. For further info: http://www.undp.org/content/undp/en/home/sustainable-develop-ment-goals.html
In the medium term it will be important to
enhance and capture the value of used plastic,
including: reducing single-use items; designing for
recyclability; increasing effective collection and sep-
aration of waste plastics; and creating stable, strong
markets for secondary plastics.
Over the long term, it will be necessary to tran-
sition to circular approaches for manufacturing,
using and recycling plastics.
See figure below for an illustration of how these key
interventions can dramatically reduce the flow of
waste plastics into the marine environment.
These interventions have the potential to play a piv-
otal role in tackling marine litter and also contribute
towards the Sustainable Development Goals (SDG)
(see Table 1). Sustainable waste management is a
prerequisite for achieving SDG 14 (conserve and
sustainably use the oceans, seas and marine resourc-
es for sustainable development). Providing waste
management for all will:

27 28
Short-Term Action: Preventing littering
Short-Term: Providing waste collection for all
Long-Term: Innovative and invent at the materials and the processing level
Reducing single-use itemsDesign for recyclability and value retention
Mid-Term Action: Capturing and Enhancing used plastic value capture:
Improve collection systems for waste plasticsCreating strong and stable markets for recycled plasticsThermal Recovery
Short-Term: Providing adequate waste management for all
Short-Term: Closing dumpsites
Long-Term: Step-change from the liner use of plastics to a sustainable and proven circular and cascading system
Short-Term: Providing adequate waste management for all
Plastic Product
Properly Managed
Improperly Managed
Rensin
In use Discarded
Lost pellets DumpsiteCatastrophic
eventsWastewater discharge
Short Term: Working with the maritime sector
Waste Management
Facilities
Waterways, rivers, estuaries, beaches
OCEAN
Short, Mid and Long Term Actions Interventions within plastics life cycle
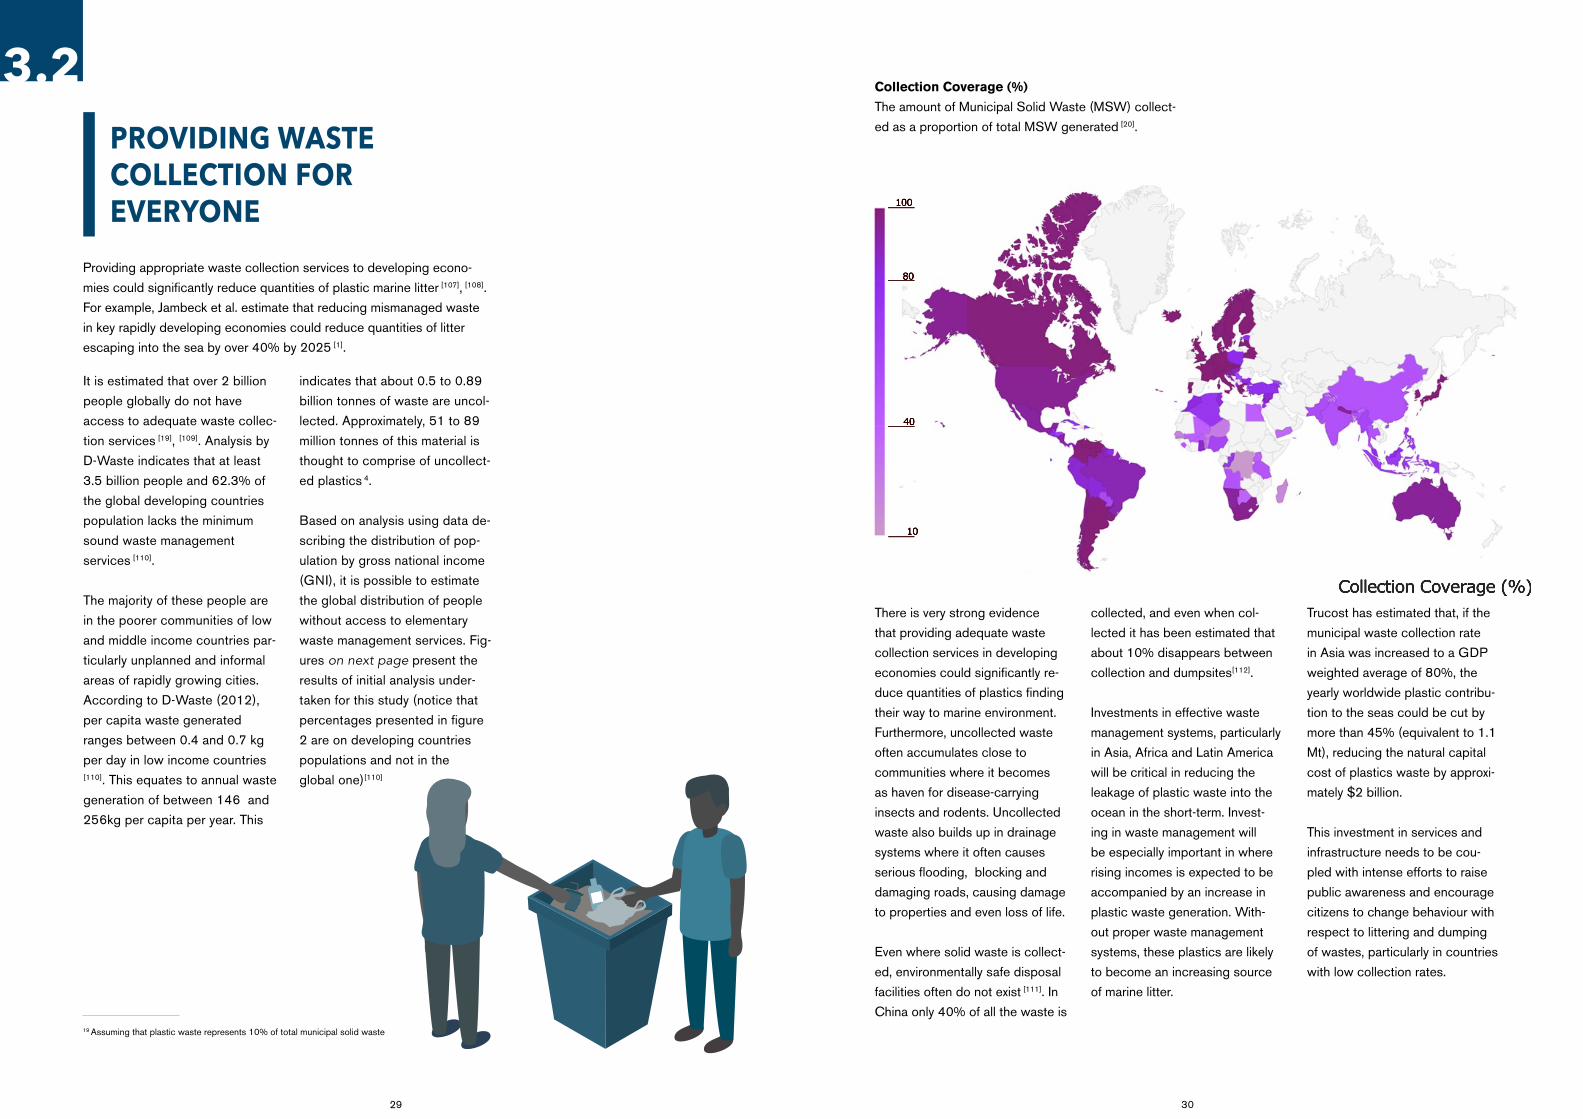
Collection Coverage (%)
100
80
40
10
29 30
Providing appropriate waste collection services to developing econo-
mies could significantly reduce quantities of plastic marine litter [107], [108].
For example, Jambeck et al. estimate that reducing mismanaged waste
in key rapidly developing economies could reduce quantities of litter
escaping into the sea by over 40% by 2025 [1].
PROVIDING WASTE COLLECTION FOR EVERYONE
It is estimated that over 2 billion
people globally do not have
access to adequate waste collec-
tion services [19], [109]. Analysis by
D-Waste indicates that at least
3.5 billion people and 62.3% of
the global developing countries
population lacks the minimum
sound waste management
services [110].
The majority of these people are
in the poorer communities of low
and middle income countries par-
ticularly unplanned and informal
areas of rapidly growing cities.
According to D-Waste (2012),
per capita waste generated
ranges between 0.4 and 0.7 kg
per day in low income countries
[110]. This equates to annual waste
generation of between 146 and
256kg per capita per year. This
indicates that about 0.5 to 0.89
billion tonnes of waste are uncol-
lected. Approximately, 51 to 89
million tonnes of this material is
thought to comprise of uncollect-
ed plastics 4.
Based on analysis using data de-
scribing the distribution of pop-
ulation by gross national income
(GNI), it is possible to estimate
the global distribution of people
without access to elementary
waste management services. Fig-
ures on next page present the
results of initial analysis under-
taken for this study (notice that
percentages presented in figure
2 are on developing countries
populations and not in the
global one)[110]
19 Assuming that plastic waste represents 10% of total municipal solid waste
3.2Collection Coverage (%)
The amount of Municipal Solid Waste (MSW) collect-
ed as a proportion of total MSW generated [20].
There is very strong evidence
that providing adequate waste
collection services in developing
economies could significantly re-
duce quantities of plastics finding
their way to marine environment.
Furthermore, uncollected waste
often accumulates close to
communities where it becomes
as haven for disease-carrying
insects and rodents. Uncollected
waste also builds up in drainage
systems where it often causes
serious flooding, blocking and
damaging roads, causing damage
to properties and even loss of life.
Even where solid waste is collect-
ed, environmentally safe disposal
facilities often do not exist [111]. In
China only 40% of all the waste is
collected, and even when col-
lected it has been estimated that
about 10% disappears between
collection and dumpsites[112].
Investments in effective waste
management systems, particularly
in Asia, Africa and Latin America
will be critical in reducing the
leakage of plastic waste into the
ocean in the short-term. Invest-
ing in waste management will
be especially important in where
rising incomes is expected to be
accompanied by an increase in
plastic waste generation. With-
out proper waste management
systems, these plastics are likely
to become an increasing source
of marine litter.
Trucost has estimated that, if the
municipal waste collection rate
in Asia was increased to a GDP
weighted average of 80%, the
yearly worldwide plastic contribu-
tion to the seas could be cut by
more than 45% (equivalent to 1.1
Mt), reducing the natural capital
cost of plastics waste by approxi-
mately $2 billion.
This investment in services and
infrastructure needs to be cou-
pled with intense efforts to raise
public awareness and encourage
citizens to change behaviour with
respect to littering and dumping
of wastes, particularly in countries
with low collection rates.

31 32
DISTRIBUTION OF POPULATION WITH NO ACCESS TO MINIMUM WASTE MANAGEMENT SERVICES
% OF POPULATION IN DEVELOPING COUNTRIES WITHOUT ACCESS TO MINIMUM WASTE MANAGEMENT SERVICES
40%
32%
19%4%
4%
1%
SOUTH ASIA
EAST ASIA & PACIFIC
SUB-SAHARAN AFRICA
LATIN AMERICA & THE CARIBBEAN
MIDDLE EAST & NORTH AFRICA
EUROPE AND CENTRAL ASIA
0102030405060708090
100
90,6885,84
57,27
7,79
24,76
41,22
62,34
MARPOL ANNEX V WASTE FROM MARITIME SHIPPING (IN M2
CoLLECTED IN PORT OF ANTWERP 2014
CARGO ASSOCIATED WASTE
SMALL HAZAR DOUS WASTES
FOOD WASTE
CARGO RESIDUES was water
PLASTICS
OTHER
East Asia &
Pacific
Europe &
Central
Asia
Latin
America &
the
Caribbean
Middle
East &
North
Africa
South
Asia
Sub-
Saharan
Africa
Total
Location: Nakuru Town, Kenya [113]
Nakuru town is the 4th largest town in Kenya after
Nairobi, Mombasa and Kisumu. It is located some
160 Km north west of Nairobi city and was founded
in 1904. The town is the capital of Nakuru County
and covers an area of 294 km2.
The Challenge:
The town’s population is about 308,000 (CBS
2010) and comprises an estimated 75,000 house-
holds, 60% of which are located low income areas.
The estimated waste generation rate for Nakuru town
is 250 tonnes/day. Prior to 2007, only 20% of the
waste generated in the city was collected.
Key Intervention:
In 2007, a decentralized solid waste management
model was introduced using a Public Private Partner-
ship (PPP) approach linked with local waste collec-
tion enterprises.
The new waste management system has significant-
ly improved collection which now cover nearly the
whole town (95%). An estimated 66% of all generat-
ed waste (approx. 160 tonnes/day) is being collect-
ed and disposed to a disposal facility. 15% of the
collected is recycled.
A total of 26 garbage collection SMEs are involved
in waste activities, including businesses collecting
plastics and paper for recycling, and bio-degradable
waste composting. These organisations received
support for developing their waste businesses, in-
cluding both technical and business development as-
sistance. The new system also contributes to Nakuru
County government’s local revenue collection in the
form of license fees. The system provides livelihoods
for over 400 local people who are involved in a range
of waste collection and recovery activities.
CASE STUDY: 46% increase of waste collection in Nakuru
Distribution of population with no access to
minimum waste management services. [110], [105]
% of population in developing countries
without access to minimum waste
management services. [110], [105]

33 34
Location: Jakarta, Indonesia
The Challenge:
Jakarta has experienced rapid urbanization and
population growth over the past three decades. The
volume of solid waste generated in the city has also
grown significantly – the volume of waste double
within 10 years, growing from less than 20,000m3
per day in 1985 to over 40,000m3 in 2005 [114].
Jakarta’s waste management system was not able
to cope with this increase in waste quantities. The
city’s waste collection vehicles were old and unable
to handle the increased volumes. Transportation of
waste took a long time due to traffic congestion.
Furthermore, the city did not have any modern waste
disposal facilities due to delays in the development of
planned landfill capacity.
In the absence of appropriate waste collection and
disposal systems, the majority of municipal waste
was discarded into the city’s canals and rivers, block-
ing important drainage channels and causing severe
flooding [115].
Key Intervention:
Since 2000, the Jakarta administration has imple-
mented a number of programmes to address this
issue and clean up the capital’s thirteen rivers, includ-
ing improved collection systems and a “Reduce-Re-
use-Recycle” initiative.
One particularly successful element of these pro-
grammes has been the development of locally-run
‘waste banks’. Households separate their recyclable
waste materials into different containers and then
take them to local collection points where they can
exchange the materials for money. The income can
be kept in an account at the waste bank or
withdrawn.
As of 2013, 55 municipalities and agencies in
Jakarta’s 17 provinces were operating around 1,100
waste banks, allowing local residents to separate
recyclables, generate some income and dispose of
their residual waste easily [116].
In 2014 the Jakarta capital city administration began
cleaning up the city’s thirteen rivers and canals.
About 4,000 workers were employed by the city ad-
ministration who removed an average of 400 tonnes
of waste each day [117].
By 2016, the programme had begun to show impres-
sive results. Several rivers in Jakarta, including the
capital’s longest and most polluted river, the Ciliwung
River, are now completely free of congestion from
waste.
CASE STUDY: Jakarta’s rivers come back to life
Whilst the waste management sector strives to oper-
ate in a professional manner, waste crime and waste
trafficking is still a significant issue. The illegal trade
of waste is estimated to be worth USD 10-12 billion
annually [118], with rogue operators avoiding waste
regulation and disposing of waste materials illegally
often at significant individual profit and great environ-
mental and societal cost.
Illegal dumping of waste is thought to be common in
many low and middle income countries, particularly
where controlled waste facilities are not available and
where enforcement of waste regulation is limited.
However, illegal waste activity is a global phenom-
enon and occurs in high countries as well. It is also
a pervasive element of the international trade in
secondary materials.
For example, even in a country where modern waste
management systems and regulatory enforcement is
well-established such as the UK, there were over 1
million cases of officially reported fly tippling in 2015
to 2016. This is estimated to have cost local authori-
ties £49.8 million [22].

35 36
Location: UK, Nationwide
The Challenge:
Cases of fly-tipping in England are increasing, with
the number of incidents in 2016 up for the third year
in a row. Councils across England reported over
936,000 cases, up 4% on the previous year accord-
ing to data from the Department of Environment,
Food and Rural Affairs (DEFRA).
Fly-tipping also has a huge financial impact on local
authorities. Clearing this waste cost local authori-
ties in England £50 million in the year up to March
2016. In the same year, local authorities carried out
494,000 enforcement actions to tackle the problem,
costing £16.9 million. Illegal and uncontrolled waste
disposal also significantly increases the risk of waste
reaching waterways and entering marine
environments.
In the UK, every individual and business has a ‘Duty
of Care’ over their waste, even after it has left their
home or premises. Failure to take reasonable steps
to ensure that your waste is managed and disposed
of appropriately risks prosecution and a £5,000 fine.
Legislation states that
“anyone who produces, imports, keeps, stores, transports, treats or disposes of waste must take all reasonable steps to ensure that waste is man-aged properly. This duty of care is imposed under section 34 of the Environmental Protection Act 1990.”
Fly tipping clearly goes against the duty of care, as
does passing the waste onto a waste carrier who
may dispose of the waste illegally.
Recent research suggests that 90% of those organ-
isations who are currently breaking the law are Small
and Medium-sized Enterprises (SMEs). The many
cases, this is because the producers of waste do not
know what they need to do to comply with its duty of
care obligations.
Key Intervention:
The ‘Right Waste, Right Place’ information cam-
paign was initiated to help small businesses and
establishments meet their Duty of Care obligations.
The campaign targets agricultural, land manage-
ment, construction and retail businesses. It raises
awareness of Duty of Care legislation and provides
practical information to help companies, partnerships,
family businesses and sole traders to comply and
help keep waste out of the hands of waste criminals.
An easy to use, interactive website[114] provides prac-
tical and useful information on UK legislation, types
of waste, disposal options and waste transfer notes.
1,200 businesses and 500 farmers were surveyed on
their understanding and compliance of Duty of Care
in order to best provide targeted information.
Outcome:
The website has had over 16,000 [119] hits, providing
information on Duty of Care and waste legislation to
a broad range of businesses and promoting legisla-
tive compliance to reduce the risk of fly tipping.
There have been eight Right Waste, Right Place
regional events, with 350 attendees. Media coverage
and radio interviews have potentially reached 10
million readers of regional and trade publications.
There are 37 Right Waste, Right Place ambassadors
from key individuals in the waste sector, who are
committed to promoting best practice. These ambas-
sadors have reached of over 500,000 customers and
supply chain partners.
The campaign has also sponsored further research
into fly tipping in order to help raise awareness of the
important impacts of waste crime.
CASE STUDY: Tackling uncontrolled waste dumping (‘flytipping’) in the UK

37 38
Waste items dropped by people ‘on the go’ or at major events are a key source of plastics that escape into
the marine environment. Data on the quantities associated with this type of leakage are very limited but, for
example, some recent studies suggest that litter comprises 2% of waste that does not enter the organised
waste collection system (i.e. that which is both litter and uncontrolled dumped waste) [2]. Taking action on
litter is a key intervention point that will address the issue of marine litter at the source and also help to raise
public awareness.
Individual behaviours play a cru-
cial role in getting waste plastics
into rivers and waterways and the
oceans. Whilst a large proportion
of plastics can be technically
recycled, or if they cannot, can be
valuable as secondary fuel, they
are still escaping from the system
due to littering - people dropping
of waste items whilst ‘on the go’.
As described above, littering
tends to be concentrated in areas
where large numbers of people
gather or pass through, such as
public spaces, tourist areas or
public transport hubs. There are
also clear correlations between
crime and litter. Key types of litter
include fast-food and beverage
packaging, cigarette butts, plastic
bags and, single-use sachets
used for water and household
products, particularly in Africa.
Littering can occur in the pres-
ence or absence of relevant
infrastructure – each would
require different approaches.
Public events, tourist areas, areas
adjacent to city centres, and rural
areas with very poor infrastruc-
ture for dealing with waste, may
all become littering grounds. The
large quantities of this plastic litter
which is deposited on beaches, is
a result of either direct littering, or
littering in urban and tourist areas,
which finds its way to the shore
via the marine environment.
Clearing littering poses a huge
cost to local governments and
communities. A recent study of
littering in the UK indicated that
littering costs local authorities
in the UK £800 million to clean-
up[104] and has a wider economic
cost of over £1 billion [105].
3.3 PREVENTING LITTERING
Location: US
The Challenge:
Litter is more than just a blight on our landscape.
Litter is costly to clean up, impacts our quality of life
and economic development, and eventually ends up
in our waterways and oceans.
Key Intervention:
Keep America Beautiful (KAB) is a non-profit organi-
zation dedicated to community improvement through
litter prevention, waste reduction/recycling, and
beautification.
KAB was founded in 1953 and has grown into the
nation’s leading community involvement organization,
with more than 1,200 local affiliates and participating
organizations. Much of the litter prevention work com-
pleted by KAB and its affiliates is based on seminal
research conducted in the 1960s and 1970s about
the sources and causes of litter.
In an effort to update and advance the research
foundation for their litter prevention activities, KAB
funded a series of studies in 2008 and 2009 with
financial support from Philip Morris USA. These stud-
ies focused on two broad topics: litter and littering
behavior. With regard to litter, the research team
explored the composition of litter across America:
its volume, locations and costs to local communities
and businesses. With regard to littering behavior, the
research team explored how often people litter, the
individual and contextual variables that contribute to
littering, and the effectiveness of various approaches
to reducing littering rates.
The research findings are detailed in the two tech-
nical reports available through the KAB website.The
Keep America Beautiful Litter Index and Community
Appearance Index are step-by-step methods of as-
sessing current litter conditions and other indicators
which is used in thousands of communities and by
municipalities nationwide.
The KAB has also driving the following campaigns:
CASE STUDY: Keep America Beautiful [103]
Great American Cleanup. The Keep America
Beautiful Great American Cleanup is the nation’s
largest community improvement program, engag-
ing more than 5 million volunteers and participants
every year to create positive change and lasting
impact in local communities.
Cigarette Litter Prevention Program The Ciga-
rette Litter Prevention Program, created by Keep
America Beautiful in 2002, is the nation’s largest
program aimed at eliminating cigarette litter.
America Recycles Day, a Keep America Beautiful
national initiative, is the only nationally-recognized
day dedicated to promoting and celebrating
recycling in the United States. Each year, on and
in the weeks leading into Nov. 15, thousands of
communities across the country participate by
promoting environmental citizenship and taking
action to increase and improve recycling in
America.
WORLD’S 50 BIGGEST DUMPSITES
Senegal (1)
Haiti (1)
Guatemala (1) Honduras (1)
Nicaragua (1)
Dominican Rep. (1)Mali (1)
Sierra Leone (1)
Peru (5)
Bolivia (1)
Mozambique (1)
Brazil (1)
Argentina (1)
Ghana (1)
Nigeria (6)
Ukraine (1)Kyrgyzstan (1)
Pakistan (2)Jordan (2)
Republic of South Sudan (2)
Kenya (2)
Tanzania (1)
Mozambique (1)
South Africa (3)
Gaza strip (3)
India (3)
Philippines (1)
Indonesia (2)
Timor-Leste (1)
Myanmar (2)
39 40
It is estimated that 3 billion people globally do not have access to environmentally sound treat-
ment or disposal facilities for their waste. Uncontrolled dumping is still commonplace in many
municipalities and regions across the globe. Dumpsites are a key source of marine litter. Taking
co-ordinated and considered action to close dumpsites will have a high-profile effect on reducing
the leakage of waste plastics into the oceans, and will also address the significant human health
and local environmental impacts created by these sites.
ISWA’s ‘Roadmap for Closing
Waste Dumpsites’ in 2016
indicated that most of the world’s
major dumpsites are located in
Africa, Latin America, the Caribbe-
an and Northern Asian countries.
These regions account for more
than two third of the Earth’s pop-
ulation. The study estimated that
the poor environmental conditions
of the world’s 50 largest dump-
sites affect the lives of 64 million
people [29]. See the box below for
more information.
In many cases dumpsites are
intentionally located near rivers
or on the coast in order for waste
to be carried away by heavy
rains or currents, refreshing the
capacity of the dump to receive
more waste [120]. Although there
is no clear data on the percent-
age of plastic entering the seas
and ocean from open dumpsites,
it is estimated that up to 30%
of the plastic waste disposed
at dumpsites could potentially
become marine litter. This repre-
sents approximately 114 million
tonnes of plastics. If we consider
the world’s largest dumpsites,
it is thought that between 1.65
and 1.9 million tonnes of plas-
tic litter are generated by 38 of
the biggest dumpsites that are
located less than 20 km from the
coastline.
3.4Dumpsites impact upon the health
and well-being of hundreds of
million people who live close to
them or, in some cases, within
their boundaries.
They are a key source of pollu-
tion. Dumpsites are a key source
of windblown litter (including
plastics), they generate leachate
which pollutes local watercours-
es, and they emit harmful air
pollutants from burning of mate-
rials. Dumpsites are also a major
emitter of methane, a powerful
greenhouse gas and also an
asphyxiation and explosion risk
to those living nearby. The recent
tragedies of collapses at dump-
sites in Ethiopia, Delhi and Sri
Lanka, where many lives were
lost, highlight the risk that these
sites pose to people working on
them or living nearby.
In order to draw attention to this
critical issue and promote action
ISWA’s Roadmap for Closing Waste Dumpsites: The World’s Most Polluted Places
to tackle dumpsites, in 2016
ISWA launched a ‘roadmap’ for
closing the world’s largest dump-
sites [29].
The Road Map identifies the
world’s 50 largest dumpsites and
sets out a framework for closing
or upgrading these sites by re-
placing them with sanitary landfills
and implementing measures to re-
duce waste and recover valuable
materials.
In many low income country
contexts, a rapid change from
an uncontrolled dump site to an
integrated waste management
system, incorporating sanitary
landfill, is likely to be beyond the
financial and technical resources
of the local authorities. In these
contexts, it will be necessary to
implement a long-term programme
to gradually improve the con-
trols at dumpsites, reducing the
risk they pose to human health
and the environment by initially
implementing simple measures
(e.g. stopping open burning at
sites, covering materials daily
to supress windblown litter and
reduce pests, fencing to restrict
unauthorised access, and slope
grading to help reduce thes risk of
slopes collapsing.
It is also critical that any improve-
ment programme engages with
the informal sector. In many parts
of the world, local people gather
valuable recyclable materials from
dump site. This is hazardous work
but is also their livelihood, so it is
essential that these individuals are
involved in developing a long-term
plan and are given alternative
ways to earn income.
CLOSING DUMPSITES BY WATERBODIES
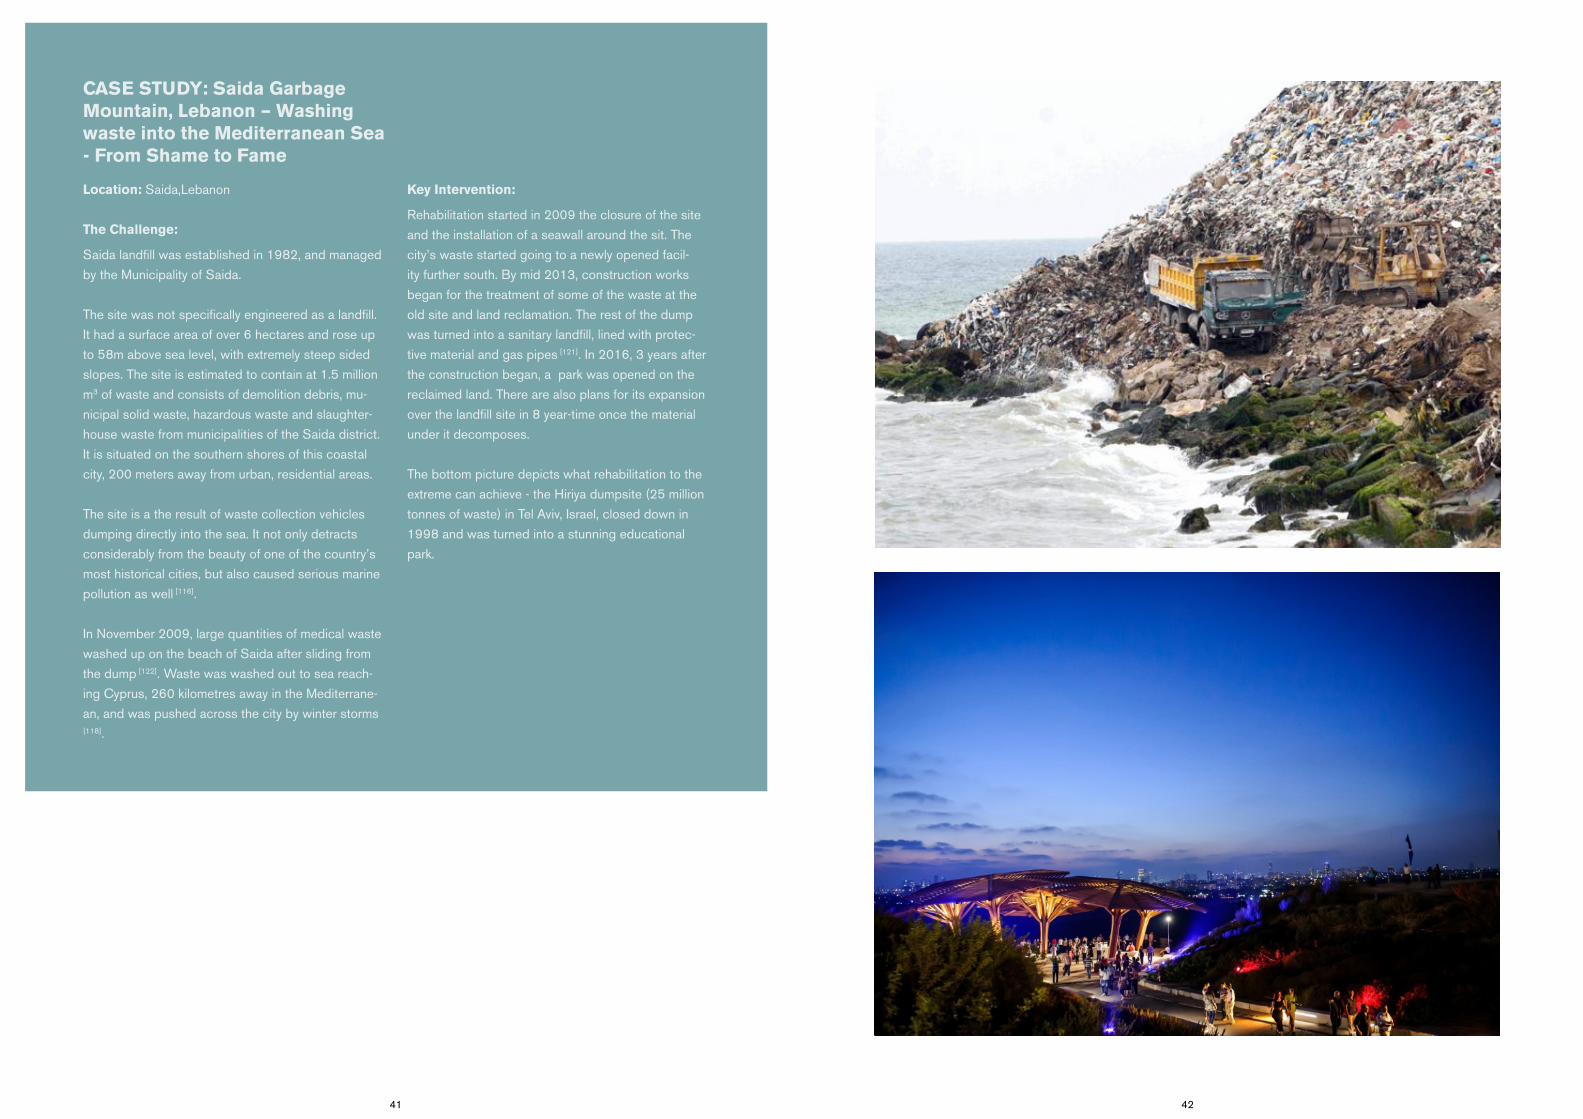
41 42
Location: Saida,Lebanon
The Challenge:
Saida landfill was established in 1982, and managed
by the Municipality of Saida.
The site was not specifically engineered as a landfill.
It had a surface area of over 6 hectares and rose up
to 58m above sea level, with extremely steep sided
slopes. The site is estimated to contain at 1.5 million
m3 of waste and consists of demolition debris, mu-
nicipal solid waste, hazardous waste and slaughter-
house waste from municipalities of the Saida district.
It is situated on the southern shores of this coastal
city, 200 meters away from urban, residential areas.
The site is a the result of waste collection vehicles
dumping directly into the sea. It not only detracts
considerably from the beauty of one of the country’s
most historical cities, but also caused serious marine
pollution as well [116].
In November 2009, large quantities of medical waste
washed up on the beach of Saida after sliding from
the dump [122]. Waste was washed out to sea reach-
ing Cyprus, 260 kilometres away in the Mediterrane-
an, and was pushed across the city by winter storms
[118].
CASE STUDY: Saida Garbage Mountain, Lebanon – Washing waste into the Mediterranean Sea - From Shame to Fame
Key Intervention:
Rehabilitation started in 2009 the closure of the site
and the installation of a seawall around the sit. The
city’s waste started going to a newly opened facil-
ity further south. By mid 2013, construction works
began for the treatment of some of the waste at the
old site and land reclamation. The rest of the dump
was turned into a sanitary landfill, lined with protec-
tive material and gas pipes [121]. In 2016, 3 years after
the construction began, a park was opened on the
reclaimed land. There are also plans for its expansion
over the landfill site in 8 year-time once the material
under it decomposes.
The bottom picture depicts what rehabilitation to the
extreme can achieve - the Hiriya dumpsite (25 million
tonnes of waste) in Tel Aviv, Israel, closed down in
1998 and was turned into a stunning educational
park.
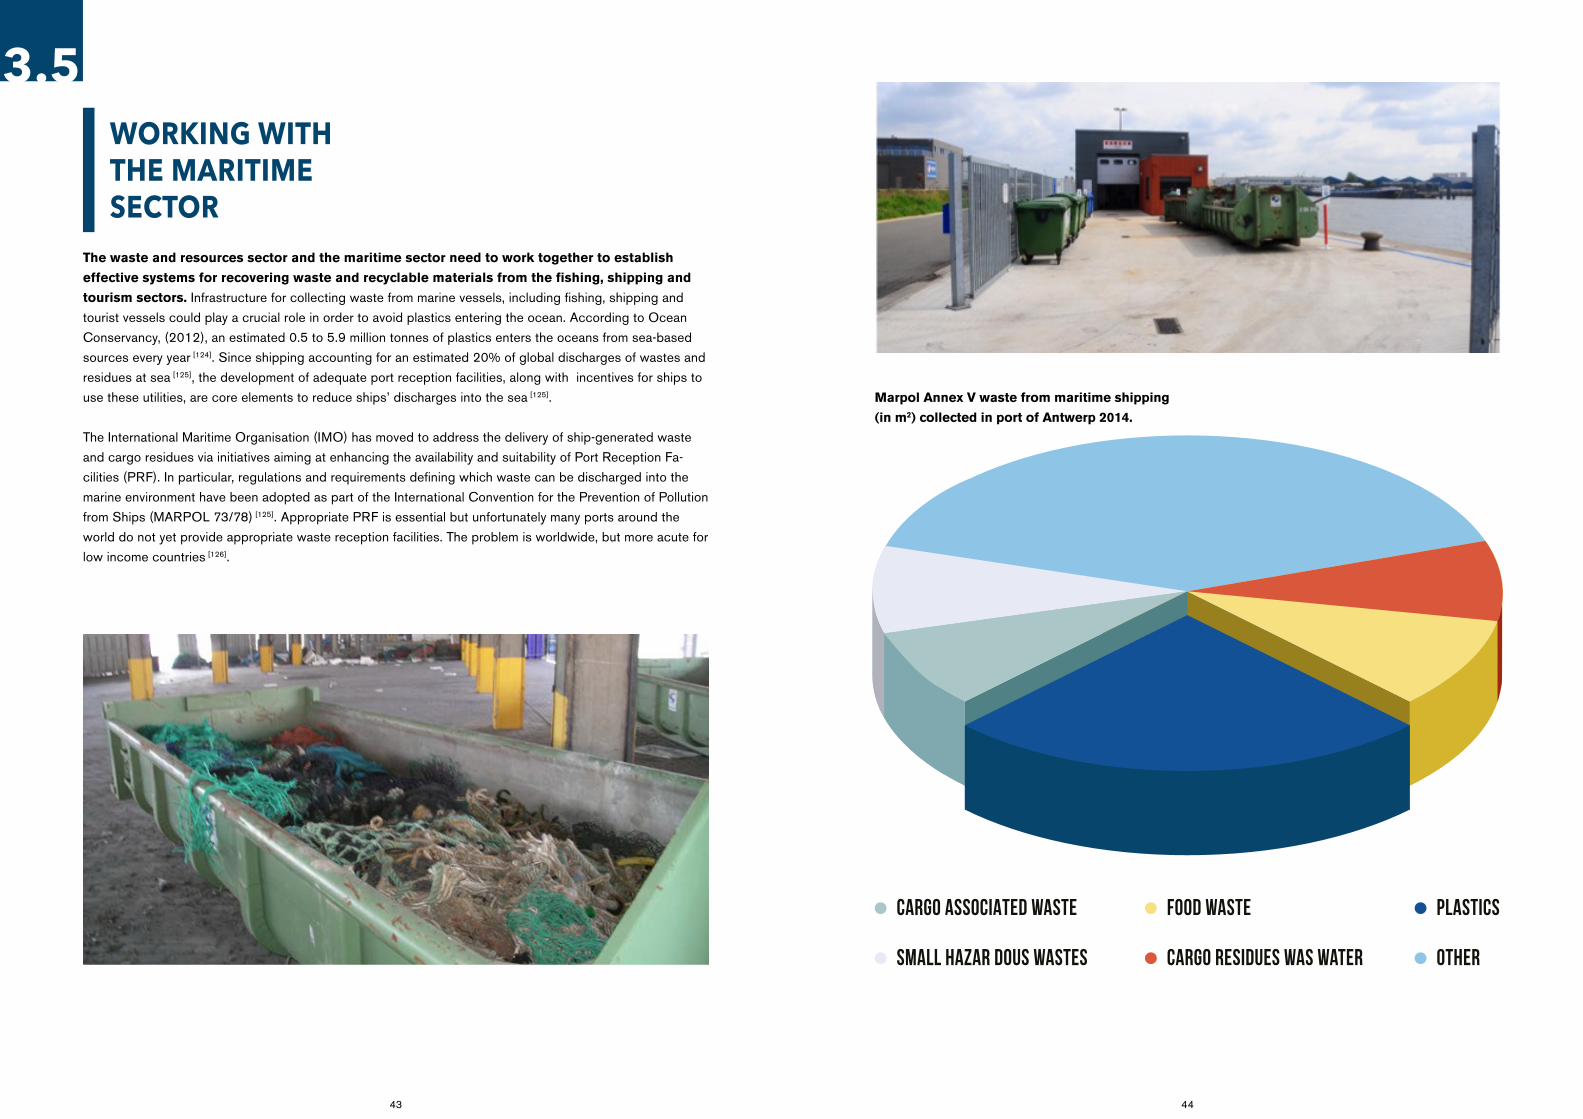
43 44
DISTRIBUTION OF POPULATION WITH NO ACCESS TO MINIMUM WASTE MANAGEMENT SERVICES
% OF POPULATION IN DEVELOPING COUNTRIES WITHOUT ACCESS TO MINIMUM WASTE MANAGEMENT SERVICES
40%
32%
19%4%
4%
1%
SOUTH ASIA
EAST ASIA & PACIFIC
SUB-SAHARAN AFRICA
LATIN AMERICA & THE CARIBBEAN
MIDDLE EAST & NORTH AFRICA
EUROPE AND CENTRAL ASIA
0102030405060708090
100
90,6885,84
57,27
7,79
24,76
41,22
62,34
MARPOL ANNEX V WASTE FROM MARITIME SHIPPING (IN M2
CoLLECTED IN PORT OF ANTWERP 2014
CARGO ASSOCIATED WASTE
SMALL HAZAR DOUS WASTES
FOOD WASTE
CARGO RESIDUES was water
PLASTICS
OTHER
East Asia &
Pacific
Europe &
Central
Asia
Latin
America &
the
Caribbean
Middle
East &
North
Africa
South
Asia
Sub-
Saharan
Africa
Total
3.5 WORKING WITH THE MARITIME SECTOR
The waste and resources sector and the maritime sector need to work together to establish
effective systems for recovering waste and recyclable materials from the fishing, shipping and
tourism sectors. Infrastructure for collecting waste from marine vessels, including fishing, shipping and
tourist vessels could play a crucial role in order to avoid plastics entering the ocean. According to Ocean
Conservancy, (2012), an estimated 0.5 to 5.9 million tonnes of plastics enters the oceans from sea-based
sources every year [124]. Since shipping accounting for an estimated 20% of global discharges of wastes and
residues at sea [125], the development of adequate port reception facilities, along with incentives for ships to
use these utilities, are core elements to reduce ships’ discharges into the sea [125].
The International Maritime Organisation (IMO) has moved to address the delivery of ship-generated waste
and cargo residues via initiatives aiming at enhancing the availability and suitability of Port Reception Fa-
cilities (PRF). In particular, regulations and requirements defining which waste can be discharged into the
marine environment have been adopted as part of the International Convention for the Prevention of Pollution
from Ships (MARPOL 73/78) [125]. Appropriate PRF is essential but unfortunately many ports around the
world do not yet provide appropriate waste reception facilities. The problem is worldwide, but more acute for
low income countries [126].
Marpol Annex V waste from maritime shipping
(in m2) collected in port of Antwerp 2014.

45 46
Location: Rotterdam and
Amesterdam
The Challenge:
Prevent plastic waste within the
ports of Rotterdam Rijnmond and
the North Sea Channel district
Key Intervention:
Since 2016, sea-going vessels
have be able to dispose of plastic
waste’ free of charge in the ports
of Rotterdam Rijnmond and the
North Sea Channel district. The
waste must be presented separat-
ed and clean. The port authorities
of Rotterdam and Amsterdam
agreed on this with the waste
collectors in the ports.
This action was implemented as
part of the Green Deal Ships’
Waste Supply Chain that the
Minister for Infrastructure and the
CASE STUDY: Free disposal of clean plastic waste in ports of Rotterdam and Amsterdam [127]
Environment, Schultz van Haegen,
entered into with the sector on
10 September 2014. Participants
in the Green Deal are the Port
of Rotterdam Authority, Port of
Amsterdam, Zeeland Seaports,
Groningen Seaports, Port of Den
Helder, NVVS (ships’ suppliers),
KVNR (ship owners), collectors of
ships’ waste, ILT and Stichting De
Noordzee.
The Green Deal has been oper-
ating for three years and the sep-
arate collection of plastic ships’
waste has grown steadily. Extra
quality requirements have been
incorporated into new and renew-
able licences for waste collectors
when it comes to collecting,
sorting and recycling plastic. In
addition, Dutch and Flemish ports
have agreed on a joint financing
system for the waste collection.

47 48
3.6 CAPTURING AND ENHANCING PLASTIC VALUE
3.6.1 Introduction
There is an urgent need to
find opportunities for creat-
ing more value from plastic.
Whilst recycling rates of
plastic packaging are stead-
ily increasing, more action is
needed to support these mar-
kets and also to create better
markets for low value plastics
such as plastic film, plastic
bags and hard plastics that do
not have the same financial
incentive to recycle.
3.6.2 Improving collection systems for waste plastics
Retaining and enhancing the
value of waste plastics will
require effective collection
systems that can segregate
high value materials. These
systems need to be tailored to the
local context to make the most
of the local technical and social
technologies that exist. Both the
formal and informal sectors have a
key role to play here and need to
work in partnership.
3.6.2.1 Collection services and
infrastructure
Increasing the supply of waste
plastics from post-consumer
sources, so that they can be recy-
cled into valuable input materials
for new products, will be a critical
element in reducing marine litter.
This will require development
of systems that maximise the
collection of high quality plastics.
Contaminants will need to be
minimised and the quantity of
individual polymers will need to be
maximised.
Providing people with appropriate
facilities for recycling a range of
plastics – both at home and ‘on
the go’ - is a crucial element for
ensuring that these materials are
returned into the system and for
maximising the value of waste
plastic. Developing the scope and
quality of collection and sorting at
source needs to be a key priority
for local authorities and those
organisations working with local
government to provide waste
collection services.
Developing and implementing the
necessary services and infrastruc-
ture to provide collection systems
will require substantial investment
and the development of sustaina-
ble financing streams. For at least
the short and medium term, it is
likely that market values for sec-
ondary plastics will be far below
the levels required to financially
support the costs of effective
collection systems, at least for all
but the most valuable polymers
(e.g. PET). As such, other reve-
nue sources will need be used to
finance recycling schemes, either
through direct fees on residents,
general taxation or producer re-
sponsibility schemes (i.e. placing
the cost back on the consumer via
the producer).
3.6.2.2 Supportive policy
Developing and sustaining these
systems requires supportive
policy and effective regulation.
A range of policy tools exist for
encouraging recycling. Setting
statutory recycling targets for
plastics has driven plastic recy-
cling rates in many regions (such
as in the European Union). Pro-
ducer responsibility legislation is
also well-established as a means
to encourage plastics recycling,
particularly plastics packaging.
Deposit refund systems for PET
bottles and other plastic beverage
packaging are a useful tool for
raising mono-stream collection
rates. The financial deposit levied
on packaging encourage consum-
ers to return empty packaging for
recycling, preventing the materials
finding their way into the munici-
pal waste stream or the environ-
ment [128]. In Sweden a deposit
system for PET bottles for on-way
containers has introduced in
1994 and it has reached recovery
rates of 77% [129]. Evidence also
suggests that phasing out the
landfilling of plastics is an ap-
proach that can stimulate plastics
recovery. Those nations in Europe
with the highest plastics recycling
rates all have landfill bans on
plastics [130].
Deposit systems for packages in European countries [129]

49 50
3.6.2.3 The informal recycling sector
The informal recycling sector has a major role on ma-
terial conservation delivering circular economy on the
ground, across the world. In low and upper middle-in-
come countries, and some high income countries
pickers extract plastics that are sold to recyclers [131].
It is estimated that almost 20% of the municipal plas-
tic-waste has high value and waste pickers collect it.
What remains is more likely to leak into the ocean[7].
In countries with no adequate waste infrastructure,
and also in some formal systems, the informal sector
waste pickers play an important role in waste collec-
tion, providing a constant supply of secondary raw
materials to the local manufacturing industries and
significantly reducing the quantity of waste to landfill
sites and in the sea. In Johannesburg, for example,
informal waste pickers provide at least 84 percent of
all recyclable materials through merchants, recyclers
and producers [132].
According to the Waste Atlas Report (www.at-
las.d-waste.com) more than 50,000 informal re-
cyclers make their living in the world’s 50 biggest
dumpsites. In many cases informal recyclers have
their homes nearby or even inside the dumpsites.
This informal sector has a tremendous potential to
serve as a barrier and prevent plastics marine litter. It
is crucial to engage and support the informal sector
in waste management by providing equipment, op-
portunities and incentives to enhance their collection
of low and high-value plastic waste.
Still, the informal sector encounters many challeng-
es. Informal sector workers are often marginalised
members of society and are typically exploited by
other organisations (e.g. waste merchants) occupy-
ing higher levels of the supply chain who can control
the value of materials. Waste pickers will also only
target the valuable components of the waste stream,
meaning that low value plastics such as films will also
typically become waste.
Location: Mumbai, India
The challenge:
In Mumbai, waste collection and recycling systems
are not sufficient, so litter is common. The problem is
particularly pronounced in India’s densely-populated
cities.
In Mumbai, as in other Indian cities, waste is mostly
collected by informal waste pickers. They are normal-
ly women. They make their living collecting plastic
waste and selling it to intermediaries. The problem
is that they collect and trade very small amounts
on a scale that is inadequate for commerially viable
recycling.
Key Interventions:
In 2013 on behalf of Germany’s Röchling Stiftung,
the German Association of Plastics Converters
(GKV) and the Organisation of Plastics Processors
of India (OPPI) conducted an analysis to assess the
conditions for plastics recycling in the Indian state of
Maharashtra and found that there was much scope
for improvement. They have realised that waste pick-
ers need to be involved in a well-structured waste
management system and that it would not be pos-
sible unless the solution has been beneficial to the
waste pickers themselves.
CASE STUDY: Mumbai - the plastics industries taking an approach that involves local people [133]
Since 2014, the Röchling Stiftung has been funding
SMS’ efforts to establish the local collecting and
sorting stations and to provide financial support for
involving waste pickers in a new established waste
management systemin Chembur-West and Mulund,
two districts of Mumbai. The local government has
contributed by providing adequate fleet to collect and
transport the waste land and storage areas.
In 2016 the following activities were underway in
order to improve waste collection and recliying:
1. raising people’s awareness towards the need for
adequate waste management;
2. encouraging local waste pickers participation;
3. Training waste pickers on better sorting of
materials;
4. purchasing waste from local pickers at fair prices
according to accurate weighing;
5. collecting waste using city waste transporters and
transferring it to one of the collection and storage
areas provided by the city; and
6. documenting waste collection and sales
As part of the project, the waste storage areas have
been improved. Safety and ventilation technology
was installed, and shredders and balers were ac-
quired. Accordingly, working conditions and econom-
ic prospects have improved for more than 70 waste
pickers in both districts. Furthermore the new infra-
structure has allowed for larger amount of plastic to
be collected and stored, and has increased recycling.
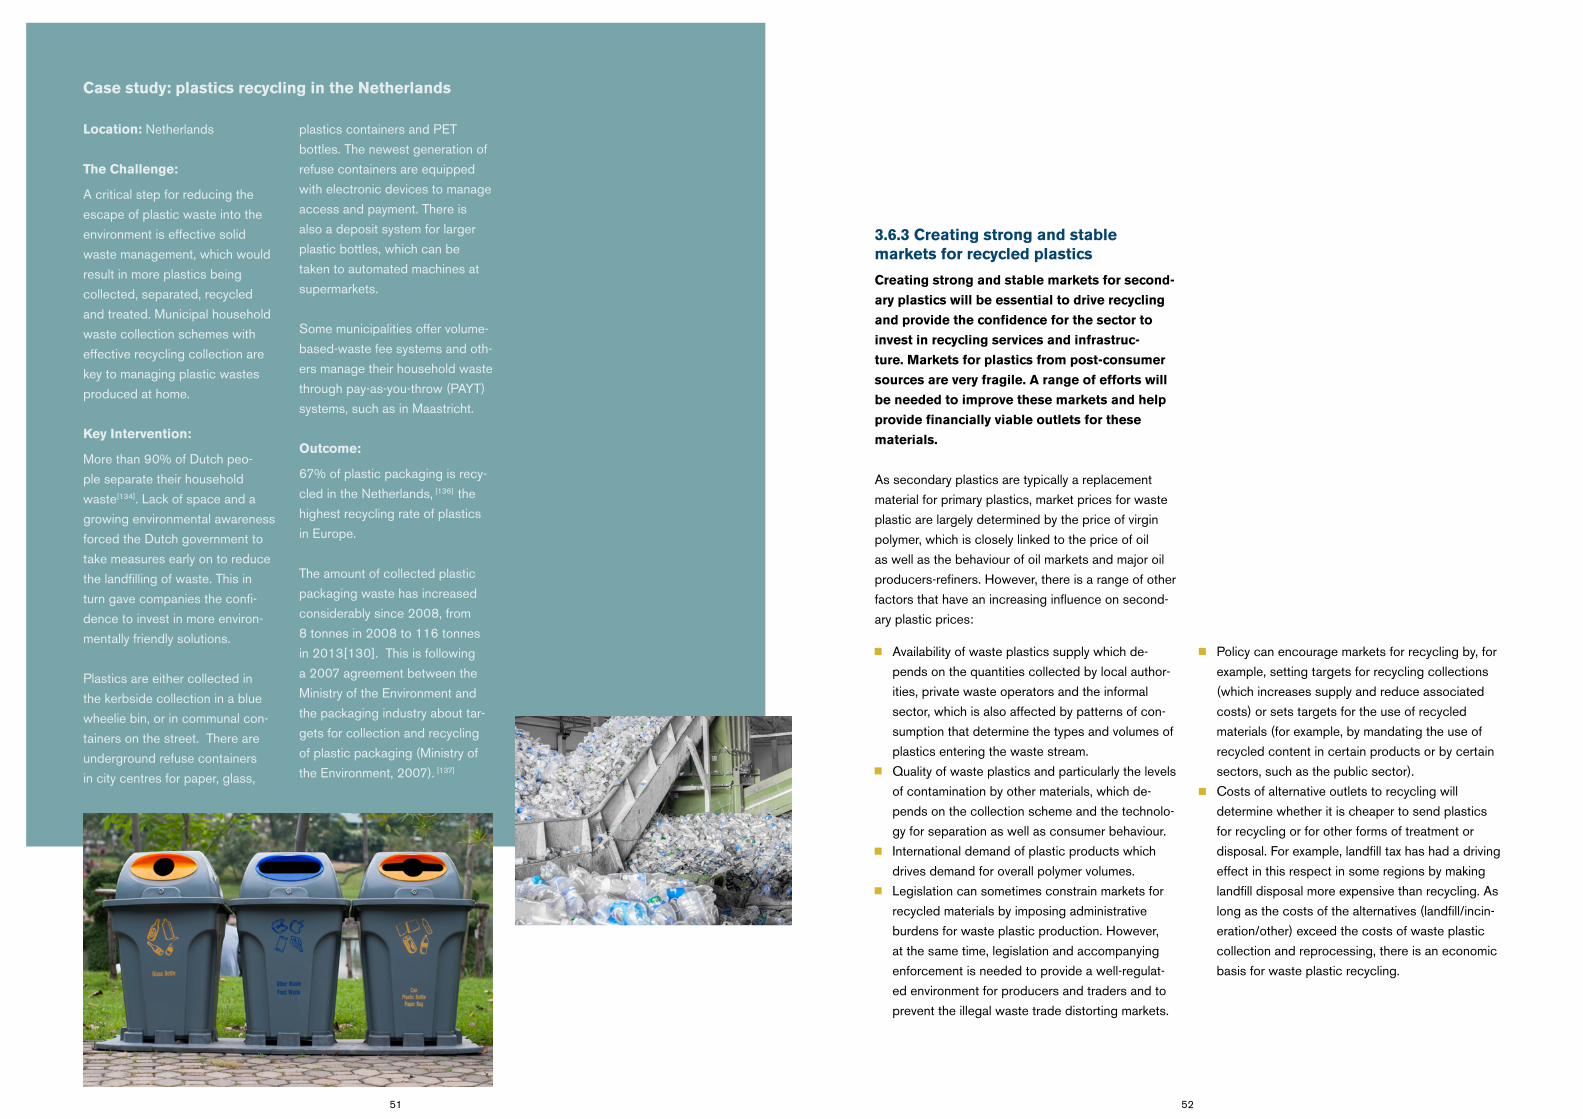
51 52
Location: Netherlands
The Challenge:
A critical step for reducing the
escape of plastic waste into the
environment is effective solid
waste management, which would
result in more plastics being
collected, separated, recycled
and treated. Municipal household
waste collection schemes with
effective recycling collection are
key to managing plastic wastes
produced at home.
Key Intervention:
More than 90% of Dutch peo-
ple separate their household
waste[134]. Lack of space and a
growing environmental awareness
forced the Dutch government to
take measures early on to reduce
the landfilling of waste. This in
turn gave companies the confi-
dence to invest in more environ-
mentally friendly solutions.
Plastics are either collected in
the kerbside collection in a blue
wheelie bin, or in communal con-
tainers on the street. There are
underground refuse containers
in city centres for paper, glass,
Case study: plastics recycling in the Netherlands
plastics containers and PET
bottles. The newest generation of
refuse containers are equipped
with electronic devices to manage
access and payment. There is
also a deposit system for larger
plastic bottles, which can be
taken to automated machines at
supermarkets.
Some municipalities offer volume-
based-waste fee systems and oth-
ers manage their household waste
through pay-as-you-throw (PAYT)
systems, such as in Maastricht.
Outcome:
67% of plastic packaging is recy-
cled in the Netherlands, [136] the
highest recycling rate of plastics
in Europe.
The amount of collected plastic
packaging waste has increased
considerably since 2008, from
8 tonnes in 2008 to 116 tonnes
in 2013[130]. This is following
a 2007 agreement between the
Ministry of the Environment and
the packaging industry about tar-
gets for collection and recycling
of plastic packaging (Ministry of
the Environment, 2007). [137]
3.6.3 Creating strong and stable markets for recycled plastics
Creating strong and stable markets for second-
ary plastics will be essential to drive recycling
and provide the confidence for the sector to
invest in recycling services and infrastruc-
ture. Markets for plastics from post-consumer
sources are very fragile. A range of efforts will
be needed to improve these markets and help
provide financially viable outlets for these
materials.
As secondary plastics are typically a replacement
material for primary plastics, market prices for waste
plastic are largely determined by the price of virgin
polymer, which is closely linked to the price of oil
as well as the behaviour of oil markets and major oil
producers-refiners. However, there is a range of other
factors that have an increasing influence on second-
ary plastic prices:
Availability of waste plastics supply which de-
pends on the quantities collected by local author-
ities, private waste operators and the informal
sector, which is also affected by patterns of con-
sumption that determine the types and volumes of
plastics entering the waste stream.
Quality of waste plastics and particularly the levels
of contamination by other materials, which de-
pends on the collection scheme and the technolo-
gy for separation as well as consumer behaviour.
International demand of plastic products which
drives demand for overall polymer volumes.
Legislation can sometimes constrain markets for
recycled materials by imposing administrative
burdens for waste plastic production. However,
at the same time, legislation and accompanying
enforcement is needed to provide a well-regulat-
ed environment for producers and traders and to
prevent the illegal waste trade distorting markets.
Policy can encourage markets for recycling by, for
example, setting targets for recycling collections
(which increases supply and reduce associated
costs) or sets targets for the use of recycled
materials (for example, by mandating the use of
recycled content in certain products or by certain
sectors, such as the public sector).
Costs of alternative outlets to recycling will
determine whether it is cheaper to send plastics
for recycling or for other forms of treatment or
disposal. For example, landfill tax has had a driving
effect in this respect in some regions by making
landfill disposal more expensive than recycling. As
long as the costs of the alternatives (landfill/incin-
eration/other) exceed the costs of waste plastic
collection and reprocessing, there is an economic
basis for waste plastic recycling.

53 54
The demand of given qualities of waste plastic
strongly depend on the targeted quality of the
plastic producer’s finished products, and the pro-
duction techniques. Reprocessors and merchants
are continuously looking for markets and good price
opportunities. In most cases, the profit margin and
the net price (delivered sales price minus outbound
transport costs) are the main drivers for deciding
where waste plastic is sold. Like any other com-
modity, waste plastic is delivered to the best bidder.
Other reasons for outlet management of waste
plastic include risk spread, optimisation of logistics
and exchange rate risk management. In some cases,
specific waste plastic grades can have limited
outlets because only a few plants can use it in their
plastic conversion process.
Whilst end markets for the main post-consumer pol-
ymers (PET, HDPE and LDPE) have gradually grown
over the last two decades, at present it is clear that
some plastics are only recycled in limited quantities
(e.g. polystyrene (PS) packaging from household
waste streams).
To grow and increase the sustainability of materials
recycling, we need a robust and well-established
reprocessing industry with high environmental stand-
ards. Various measures are needed including:
Setting globally accepted standards for recycled
materials.
Encouraging demand for recycled plastics by
encouraging consumer demand for products that
include recycled content.
Reducing the range of polymers and additives used.
Supporting the reprocessing sector, to help it
become more resilient to global market variation
and mark shocks.
Providing better market data to help recycled
plastic suppliers explore new markets and reduce
dependence upon single markets (e.g. China).
Overall, developing and enhancing recycling markets
is essential. Recycling is one of the most important
sectors in terms of employment creation and current-
ly employs 12 million people in just three countries
- Brazil, China and the United States [138]. Overall,
including the informal sector, the number of people
working in recycling is assessed to 15-20 millions.
3.6.4 Energy recovery and thermal processing
Mechanical recycling of post-use plastics into
new products can conserve resources and
reduce energy use and greenhouse gas emis-
sions. However, some plastics are not recycled
in commercial markets. These non-recycled
plastics (NRP), found in the municipal solid
waste (MSW) stream, could provide an abun-
dant source of alternative energy.
According to the Earth Engineering Center of Co-
lumbia University [139] only about 6.8% (2.66 million
tons) of post-use plastics in the U.S. were recycled in
2013 and 9.9% (3.9 million tons) were thermally con-
verted to energy at the 85 waste-to-energy facilities.
These facilities displace fossil energy and produce
useful heat and electricity from mixed, non-recycled
waste, including NRP. The majority of NRP in the US,
approximately 82.7% (32.5 million tons), is currently
landfilled. This represents a loss of a valuable alterna-
tive energy resource. In these contexts, there is a sig-
nificant opportunity to transform the abundant energy
in NRP into electricity and heat and to commercialize
new processes that produce higher value fuels and
chemical feedstocks [139].

55 56
3.7 TRANSITION TO CIRCULAR APPROACHES FOR MANUFACTURING, USING AND RECYCLING PLASTICS
We need a step-change from the liner use of plastics to a sustainable and proven circular and
cascading system. This needs to be supported by innovation at the materials and process level.
3.7.1 Reducing single-use items
The design and function of plastic products is a
fundamental determinant of their fate.
The ubiquity of single-use items produces a steady
stream of low value waste plastic items, of which
a significant proportion leak from the system and
eventually become marine litter. Reducing the use of
these items will make great gains in reducing marine
litter.
Location: UK, Europe
The Challenge:
Plastic cotton bud stems are the sixth
most common item found on UK beaches
in the latest survey by the Marine Con-
servation Society, and are often found
in the stomachs of marine mammals and
birds[147].
Key Intervention:
Initiatives to tackle specific items have
proven to be very effective in some areas,
with recent examples including campaigns
to change cotton bud stems from plastic
to paper construction and measures to
reduce the consumption of lightweight
plastic bags.
CASE STUDY: City to Sea and Fidra - Single-use item initiatives
In 2016 two UK-based campaigns, Fidra’s
The Cotton Bud Project and City to Sea’s
Switch the Stick, called for the plastic stem
to be replaced with a paper to reduce the
impact on the marine environment, whilst
reinforcing messages to consumers that
such items should never be flushed down
the toilet. The public pressure raised by
the campaigns led to commitments from
12 major retailers to change their cotton
buds to use paper stems.
The majority of retailers committed to
changing their products within a year,
demonstrating how quickly organisations
can respond to environmental issues even
when it affects manufacturing process-
es. The impact of the campaign extends
beyond the boundaries of the UK, most
notably as Johnson and Johnson, the
main producer of cotton buds in the UK,
announced in March 2016 that it would be
phasing out plastic stems across Europe
by the end of the year.
3.7.2 Designing for recyclability and value retention
The diversity of plastics materials is a con-
straint on their recyclability. Obtaining high val-
ues for secondary plastics requires large values
of single polymers but the range of polymers
in post-consumer waste streams currently
means that the volumes of individual polymers
collected is often relatively small, particularly
at municipal level. The numerous polymers
produced, and the additives that are used, are
also technical barrier to products being recy-
cled. For example, the use of black pigment
in polypropylene containers prevents it being
easily sorted from other material streams. This
is a polymer that is widely produced but is not
widely recycled.
Whilst the use of lighter plastics, particularly in pack-
aging, can result in an environmental benefit, due to
reduced energy and material use in production and
transportation, it means that these materials are less
valuable as secondary plastics and are less attractive
to the formal and informal recycling sectors. Lighter
plastics also more readily dispersed once they es-
cape into the aquatic environment. For example, the
polymers polyethylene, polystyrene and polypropyl-
ene float in water and are readily moved by wind and
currents. In contrast, polyester, nylon and polyvinyl
chloride sink and move differently through the aquatic
system, often becoming trapped in bottom sediments
and vegetation.
The design of the already existing products needs
to be enhanced by introduction of global eco-design
guidelines in order to improve the recyclability. This
will help to ensure that plastic waste is separated
from other waste at disposal and improve the quality
of recyclables by improving product design to facili-
tate material separation and recyclability.
To enable this change, we need to fundamentally
alter the way in which we consider the value of mate-
rials, products and services. We need to embed the
concept of complex value into the decisions about
materials; an approach that considers the wider
impacts on, and benefits to, society and the environ-
ment that are associated with different materials and
processes. This will require a new innovation model
that goes beyond cost-effectiveness, functionality
and narrowly defined utility needs, to one that incor-
porates complex value. This will require a radical shift
from today’s practices, based on a cross-sector and
intra-disciplinary scientific collaboration [145], [146].
Approaches such as reduction of single-use items as
a priority action and designing products for recycla-
bility and value retention after use will help address
the issue at source.
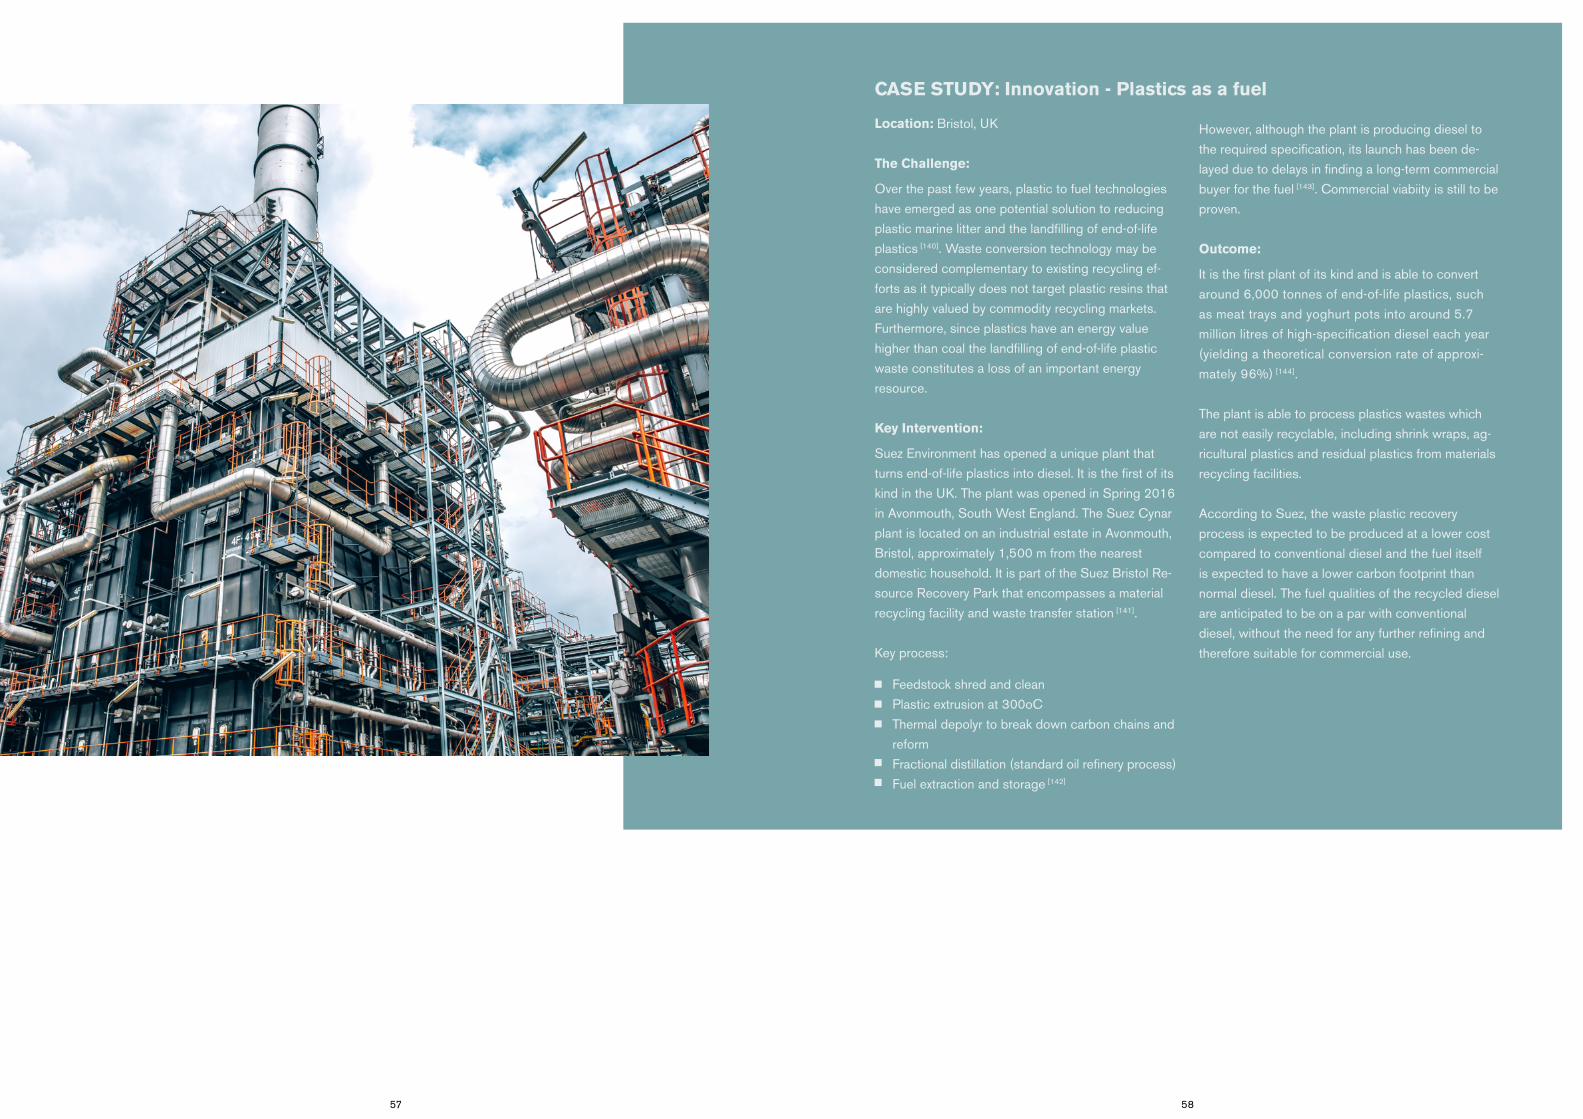
57 58
Location: Bristol, UK
The Challenge:
Over the past few years, plastic to fuel technologies
have emerged as one potential solution to reducing
plastic marine litter and the landfilling of end-of-life
plastics [140]. Waste conversion technology may be
considered complementary to existing recycling ef-
forts as it typically does not target plastic resins that
are highly valued by commodity recycling markets.
Furthermore, since plastics have an energy value
higher than coal the landfilling of end-of-life plastic
waste constitutes a loss of an important energy
resource.
Key Intervention:
Suez Environment has opened a unique plant that
turns end-of-life plastics into diesel. It is the first of its
kind in the UK. The plant was opened in Spring 2016
in Avonmouth, South West England. The Suez Cynar
plant is located on an industrial estate in Avonmouth,
Bristol, approximately 1,500 m from the nearest
domestic household. It is part of the Suez Bristol Re-
source Recovery Park that encompasses a material
recycling facility and waste transfer station [141].
Key process:
CASE STUDY: Innovation - Plastics as a fuel
Feedstock shred and clean
Plastic extrusion at 300oC
Thermal depolyr to break down carbon chains and
reform
Fractional distillation (standard oil refinery process)
Fuel extraction and storage [142]
However, although the plant is producing diesel to
the required specification, its launch has been de-
layed due to delays in finding a long-term commercial
buyer for the fuel [143]. Commercial viabiity is still to be
proven.
Outcome:
It is the first plant of its kind and is able to convert
around 6,000 tonnes of end-of-life plastics, such
as meat trays and yoghurt pots into around 5.7
million litres of high-specification diesel each year
(yielding a theoretical conversion rate of approxi-
mately 96%) [144].
The plant is able to process plastics wastes which
are not easily recyclable, including shrink wraps, ag-
ricultural plastics and residual plastics from materials
recycling facilities.
According to Suez, the waste plastic recovery
process is expected to be produced at a lower cost
compared to conventional diesel and the fuel itself
is expected to have a lower carbon footprint than
normal diesel. The fuel qualities of the recycled diesel
are anticipated to be on a par with conventional
diesel, without the need for any further refining and
therefore suitable for commercial use.

59 60
3.8 POLICY AND MONITORING INDICATORS
Effective monitoring of waste and resource manage-
ment practices, the nature and levels of marine litter,
and the links to the SDGs will be essential. Monitor-
ing needs can be described in terms of these three
interlinked sets of indicators and protocols:
Comprehensive data on waste manage-
ment practices that allow progress towards
providing effective waste management for
all (including collection systems and appro-
priate disposal) to be monitored. Data on
waste management practices and performance is
collected by numerous different actors for a wide
range of purposes.
For example, the vast majority municipalities
collect data on waste management performance.
National governments also typically collect data
on wastes management practices, and this data is
often used to report performance to international
agencies such as the United Nations, European
Union or OECD that publish collated datasets on
waste management performance. A wide range
of private sector actors, NGOs and development
agencies also collect data for project and pro-
gramme-specific purposes.
However, as a result of the wide range of stake-
holders involved in collecting data and there being
no clear internationally agreed protocol for data
collection and reporting, the quality and type of
data collected on waste management activities
varies significantly in terms of quality and scope.
This makes it very difficult to establish a clear
baseline; it makes is very challenging to monitor
changes in provision of effective waste manage-
ment; and almost impossible to track the effect
that changes in waste management provision
may be having on leakage of litter into the wider
environment.
1.
2. Consistent data on the quantities and movement
of marine litter. These data need to include:
3. Linking the monitoring data to the SDGs.
The monitoring indicators described above will
need to link clearly to the SDGs, particularly
SDG 14 1 but also other SDGs where waste and
resource management has a key contribution
to make, including SDG 112 and 12 3. This will
require a clear protocol for using the above data
and linking this to the goals and specific targets
that form the SDGs.
a.
b.
the quantities of marine litter leaking from
the system. As with existing estimates of the
quantities escaping into the marine environ-
ment (e.g. Jambech et al, 2015), these data
will well need to be derived from other sources,
such as waste management practices de-
scribed above;
the pathways and sinks for marine litter.
Collecting adequate data on the movement of
marine litter from its source and into the wider
environment will be a difficult challenge but this
information will be critical to help understand
the effectiveness of interventions and ensure
that the most cost-effective efforts are made
to tackle marine litter. One key source of this
information will be marine litter surveys. This is
already an extensive source of information on
the distribution and nature of marine litter (e.g.
Ocean Conservancy, Keep Australia Beau-
tiful, the National Oceanic and Atmospheric
Administration of the United States of Ameri-
ca, CSIRO, Arcadis and Nelms et al) but the
types of information vary considerably between
actors and regions. More consistent protocols
for collecting and sharing information will be
needed.
Litter survey data needs to be expanded from
the current focus on beaches to other key
areas that are sources and sinks of litter (e.g.
rivers, estuaries and the hinterlands around
these areas).
Clearly defined mechanisms will also be need-
ed to establish how this survey data can be
combined with other data to provide a clearer
picture of the movement, transformation and
build-up of litter into and within the marine
environment.
1 Conserve and sustainably use the oceans, seas and marine resources2 Make cities inclusive, safe, resilient and sustainable3 Ensure sustainable consumption and production patterns

61 62
THE NEXT STEPS4
4.1
This report describes four priority interventions that
are key to reducing and preventing the leakage of
marine litter into the environment:
PRIORITY INTERVENTIONS
Prevent uncontrolled dumping by providing
waste collection for all.
Prevent littering and stop fly-tipping.
Close dumpsites near waterbodies and pro-
vide waste treatment and disposal facilities
for all.
Working with the maritime sector to tackle
plastic waste from fishing, shipping
and tourism.
These interventions are ambitious and will require
co-ordinated action for a wide range of stakeholders.
Significant investment will be needed in services and
infrastructure to provide waste and resource manage-
ment services for all.
This needs to be supported by community and stake-
holder engagement to encourage behaviour change
and prevent littering and uncontrolled dumping.
Achieving the longer-term goals of enhancing plastic
value and applying the principals of circularity, will
require close engagement with the designers plastics
production and resource recovery supply chains.
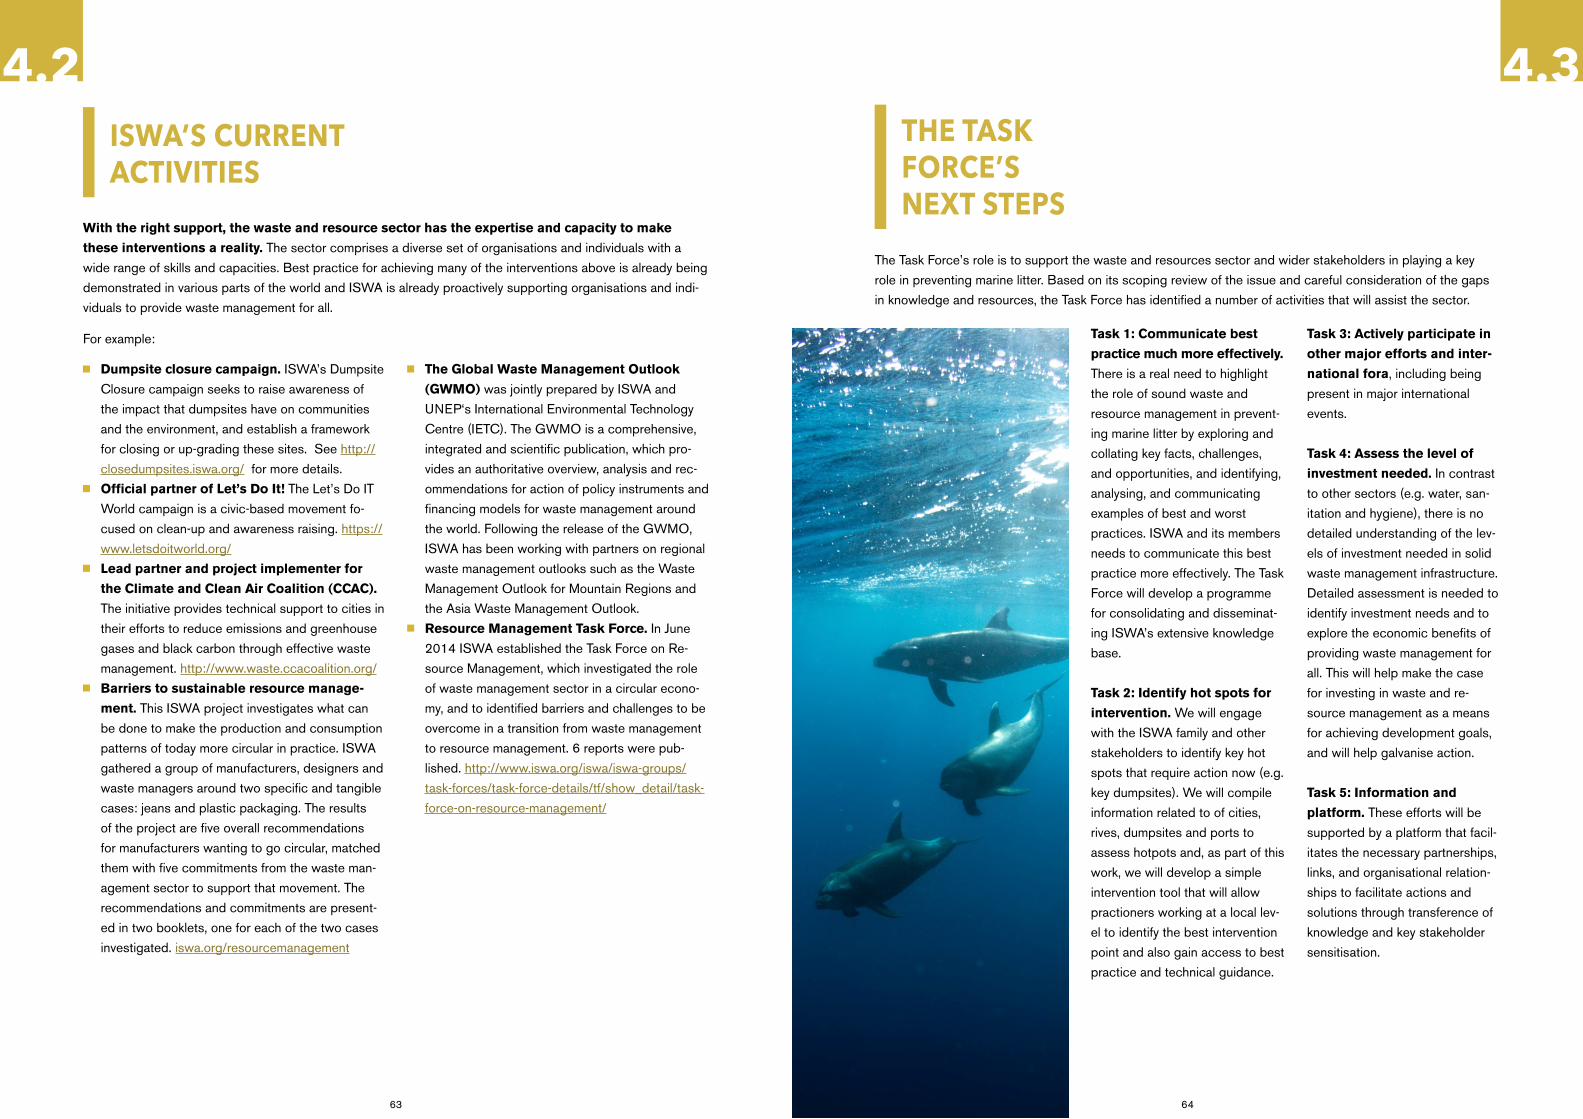
63 64
With the right support, the waste and resource sector has the expertise and capacity to make
these interventions a reality. The sector comprises a diverse set of organisations and individuals with a
wide range of skills and capacities. Best practice for achieving many of the interventions above is already being
demonstrated in various parts of the world and ISWA is already proactively supporting organisations and indi-
viduals to provide waste management for all.
The Task Force’s role is to support the waste and resources sector and wider stakeholders in playing a key
role in preventing marine litter. Based on its scoping review of the issue and careful consideration of the gaps
in knowledge and resources, the Task Force has identified a number of activities that will assist the sector.
4.2 ISWA’S CURRENT ACTIVITIES
Dumpsite closure campaign. ISWA’s Dumpsite
Closure campaign seeks to raise awareness of
the impact that dumpsites have on communities
and the environment, and establish a framework
for closing or up-grading these sites. See http://
closedumpsites.iswa.org/ for more details.
Official partner of Let’s Do It! The Let’s Do IT
World campaign is a civic-based movement fo-
cused on clean-up and awareness raising. https://
www.letsdoitworld.org/
Lead partner and project implementer for
the Climate and Clean Air Coalition (CCAC).
The initiative provides technical support to cities in
their efforts to reduce emissions and greenhouse
gases and black carbon through effective waste
management. http://www.waste.ccacoalition.org/
Barriers to sustainable resource manage-
ment. This ISWA project investigates what can
be done to make the production and consumption
patterns of today more circular in practice. ISWA
gathered a group of manufacturers, designers and
waste managers around two specific and tangible
cases: jeans and plastic packaging. The results
of the project are five overall recommendations
for manufacturers wanting to go circular, matched
them with five commitments from the waste man-
agement sector to support that movement. The
recommendations and commitments are present-
ed in two booklets, one for each of the two cases
investigated. iswa.org/resourcemanagement
For example:
4.3 THE TASK FORCE’S NEXT STEPS
Task 1: Communicate best
practice much more effectively.
There is a real need to highlight
the role of sound waste and
resource management in prevent-
ing marine litter by exploring and
collating key facts, challenges,
and opportunities, and identifying,
analysing, and communicating
examples of best and worst
practices. ISWA and its members
needs to communicate this best
practice more effectively. The Task
Force will develop a programme
for consolidating and disseminat-
ing ISWA’s extensive knowledge
base.
Task 2: Identify hot spots for
intervention. We will engage
with the ISWA family and other
stakeholders to identify key hot
spots that require action now (e.g.
key dumpsites). We will compile
information related to of cities,
rives, dumpsites and ports to
assess hotpots and, as part of this
work, we will develop a simple
intervention tool that will allow
practioners working at a local lev-
el to identify the best intervention
point and also gain access to best
practice and technical guidance.
Task 3: Actively participate in
other major efforts and inter-
national fora, including being
present in major international
events.
Task 4: Assess the level of
investment needed. In contrast
to other sectors (e.g. water, san-
itation and hygiene), there is no
detailed understanding of the lev-
els of investment needed in solid
waste management infrastructure.
Detailed assessment is needed to
identify investment needs and to
explore the economic benefits of
providing waste management for
all. This will help make the case
for investing in waste and re-
source management as a means
for achieving development goals,
and will help galvanise action.
Task 5: Information and
platform. These efforts will be
supported by a platform that facil-
itates the necessary partnerships,
links, and organisational relation-
ships to facilitate actions and
solutions through transference of
knowledge and key stakeholder
sensitisation.
The Global Waste Management Outlook
(GWMO) was jointly prepared by ISWA and
UNEP‘s International Environmental Technology
Centre (IETC). The GWMO is a comprehensive,
integrated and scientific publication, which pro-
vides an authoritative overview, analysis and rec-
ommendations for action of policy instruments and
financing models for waste management around
the world. Following the release of the GWMO,
ISWA has been working with partners on regional
waste management outlooks such as the Waste
Management Outlook for Mountain Regions and
the Asia Waste Management Outlook.
Resource Management Task Force. In June
2014 ISWA established the Task Force on Re-
source Management, which investigated the role
of waste management sector in a circular econo-
my, and to identified barriers and challenges to be
overcome in a transition from waste management
to resource management. 6 reports were pub-
lished. http://www.iswa.org/iswa/iswa-groups/
task-forces/task-force-details/tf/show_detail/task-
force-on-resource-management/
65 66
REFERENCES 5 [1] C. A. Velis, “Plastic waste in marine litter: Action now and at the source ”, Waste Management & Research vol. 32, no. 5,
p.251 , 2014.
[2] J. R. Jambeck, R. Geyer, C. Wilcox, T. R. Siegler, M. Perryman, A. Andrady, R. Narayan, and K. L. Law, “Plastic waste inputs from
land into the ocean”, Science,., vol. 347, no. 6223, pp. 768–770, 2015.
[3] L. C. M. Lebreton, J. Van Der Zwet, J. Damsteeg, B. Slat, A. Andrady, and J. Reisser, “River plastic emissions to the world’s
oceans”, Nature Communications , vol. 8, pp. 1–10, 2017.
[4] GESAMP, “Sources, fate and effects of microplastics in the marine environment: a global assessment”, Reports and Studies
GESAMP, vol. 90, p. 96, 2015.
[5] D. K. a Barnes, F. Galgani, R. C. Thompson, and M. Barlaz, “Accumulation and fragmentation of plastic debris in global environ-
ments”, Philosophical transactions of the Royal Society of London. Series B, Biological sciences , vol. 364, no. 1526, pp.
1985–1998, 2009.
[6] S. E.Nelms, C. Coombes, L. C. Foster, T. S. Galloway, B. J., Godley, P. K. Lindeque, and M. J.Witt, , “Marine anthropogenic
litter on British beaches: A 10-year nationwide assessment using citizen science data”, Science of the Total Environment, vol.
579, pp. 1399–1409, 2017.
[7] McKinsey Center and Ocean Conservancy, “Stemming the Tide. Land-based strategies for a plastic - free ocean”, p. 47, 2015.
[8] NOAA, “Impact of “Ghost Fishing“ via Derelict Fishing Gear”, p. 25p, 2015.
[9] “Global Waste Management Outlook”, United Nations Environment Programme (UNEP), 2015.
[10] D.C. Wilson, C.A. Velis, and Rodic, “Integrated sustainable waste management in developing countries,” Proceedings of the
Institute of Civil Engineers: Waste and Resource Management vol. 166, pp. 52–68, 2013.
[11] Environment Ageny, “River Avon, Bath -,” prepared by North Wessex Investigations Team, 2000.
[12] ‘CSIRO, “Understanding debris sources and transport from the coastal margin to the ocean”, 2017’.
[13] L. Brooks and S. Davoudi, “Litter and social practices”, Journal of litter and environmental quality, vol. 1, no. 1, pp. 16–25, 2017.
[14] “Health & Public Services Committee Transcript”, Appendix A, pp. 1–39, 2004. Available: https://www.london.gov.uk/modern-
gov/Data/Health%20and%20Public%20Services%20Committee/20041109/Agenda/3%20Appendix%20A%20PDF.pdf.
[Accessed: 18-Sep-2017].
[15] J. G. B. Derraik, “The pollution of the marine environment by plastic debris: A review”, Marine Pollution Bulletin, vol. 44, no. 9, pp.
842–852, 2002.
[16] L. Danquah, K. Abass, and A. A. Nikoi, “Anthropogenic Pollution of Inland Waters: the Case of the Aboabo River in Kumasi,
Ghana”, Journal of Sustainable Development, vol. 4, no. 6, pp. 103–115, 2011.
[17] B. Sedova, “On causes of illegal waste dumping in Slovakia”, Journal of Environmental Planning and Management, vol. 568, pp.
1–27, 2015.
[18] B. Franz and M. A. V Freitas, “Generation and impacts of floating litter on urban canals and rivers: Rio de Janeiro megacity case
study” WIT Transactions on Ecology and the Environment, vol. 167, pp. 321–3,32, 2012.
[19] T. Getahun, E. Mengistie ,A. Haddis, F. Wasie, E. Alemayehu , D. Dadi , T. Van Gerven and B. Van der Bruggen, “Municipal solid
waste generation in growing urban areas in Africa: current practices and relation to socioeconomic factors in Jimma, Ethiopia”,
Environmental Monitoring and Assessment, Springer Netherlands, vol. 184, no. 10, pp. 6337–6345.
[20] D-Waste, “Waste Atlas”. [Online]. Available: http://www.atlas.d-waste.com/. [Accessed: 16-Aug-2017].
[21] Y. Liu, F. Kong, and E. D. R. Santibanez Gonzalez, “Dumping, waste management and ecological security: Evidence from Eng-
land”, Journal of Cleaner Production, 2016.
[22] DEFRA, “Fly-tipping statistics for England, 2015/16”, vol. 33, pp. 1–14, 2017.
[23] A. T. Williams and S. L. Simmons, “Estuarine Litter at the River/Beach Interface in the Bristol Channel, United Kingdom”, Journal
of Coastal Research, vol. 13, no. 4, pp. 1159–1165, 1997.
[24] D. Morritt, P. V Stefanoudis, D. Pearce, O. A. Crimmen, and P. F. Clark, “Plastic in the Thames : A river runs through it”, Marine
Pollution Bulletin, vol. 78, no. 1–2, pp. 196–200, 2014.
[25] J. Mouat and R. L. Lozano, “Economic impacts of marine litter”, Kommunenes Internasjonale Miljøorganisasjon (KIMO), p. 105,
2009.
[26] S. B. Sheavly and K. M. Register, “Marine debris & plastics: Environmental concerns, sources, impacts and solutions”, Journal of
Polymers and the Environment, vol. 15, no. 4, pp. 301–305, 2007.
[27] A. Mavropoulos, D. Wilson, C.A Velis, J. Cooper and B Appelqvist., “Globalisation and Waste Management, Final Report”, ISWA
Task Force on Globalisation and Waste Management, 2014.
[28] D. Shira & Associates, “Trash or Treasure? Prospects for China’s Recycling Industry – China Business Review”, [Online]. Availa-
ble: https://www.chinabusinessreview.com/trash-or-treasure-prospects-for-chinas-recycling-industry/. [Accessed: 18-Sep-
2017].
[29] A. Mavropoulos, A., Cohen, P, Greedy, D, Plimakis, S, Marinheiro, L, Law, and J, Loureiro, “A Roadmap for closing Waste Dump-
sites”, ISWA., vol. 50, no. 7, pp. 109–116, 2016.

67 68
[30] A. Camba, S. González-García, A. Bala, P. Fullana-I-Palmer, M. T. Moreira, and G. Feijoo, “Modeling the leachate flow and aggre-
gated emissions from municipal waste landfills under life cycle thinking in the Oceanic region of the Iberian Peninsula”, Journal of
Cleaner Production, vol. 67, pp. 98–106, 2014.
[31] F. S. Peter Sundt and Per-Erik Schultze, “Sources of microplastic- pollution to the marine environment”, Mepex, Norwegian Envi-
ronment Agency, pp. 1–108, 2014.
[32] C. Lassen, “Microplastics Occurrence , effects and sources of releases” 2015.
[33] M. Van Der Wal, M. Van Der Meulen, M. Peterlin, A. Palatinus, and L. Coscia, “SFRA0025 : Identification and Assessment of
Riverine Input of ( Marine ) Litter Final Report for the European Commission DG Environment under Framework Contract No”,
2015.
[34] J. Woodley, “Assessing and monitoring floatable debris,” pp. 1–78, 2002.
[35] A. Lechner, H. Keckeis, F. Lumesberger-Loisl, B. Zens, R. Krusch, M.Tritthart, M. Glas, and E. Schludermann, “The Danube
so colourful: A potpourri of plastic litter outnumbers fish larvae in Europe’s second largest river,” Environmental Pollution, vol.
188, pp. 177–181, 2014.
[36] I. Kyrikou and D. Briassoulis, “Biodegradation of agricultural plastic films: A critical review”, Journal of Polymers and the Environ-
ment, vol. 15, no. 2, pp. 125–150, 2007.
[37] Bioplastics and EuropaBio, “Fertiliser regulation: Biodegradable mulch film”,position paper, 2016.
[38] J. Moore, “Plastic mulch in fruit and vegetable production : Challenges for disposal”, 2016.
[39] L. Nizzetto, G. Bussi, M. N. Futter, D. Butterfield, and P. G. Whitehead, “A theoretical assessment of microplastic transport in
river catchments and their retention by soils and river sediments,” Environ. Sci.: Processes Impacts, pp. 1050–1059, 2016.
[40] Woods End Laboratories and Eco-cycle, “Micro-plastics in Compost: Environmental hazards of plastic-coated paper products”, .
2016.
[41] C. Guerranti, S. Cannas, C. Scopetani, P. Fastelli, A. Cincinelli, and M. Renzi, “Plastic litter in aquatic environments of Maremma
Regional Park (Tyrrhenian Sea, Italy): Contribution by the Ombrone river and levels in marine sediments”, Marine Pollution Bulle-
tin, vol. 117, no. 1–2, pp. 366–370, 2017.
[42] E. Delvin, “Grays Harbor County Derelict Gear Removal Project – Annual Report December 16, 2013”, vol. 1, 2013.
[43] M. A. Browne, P. Crump, S. J. Niven, E. L. Teuten, A. Tonkin, T. Galloway, and R. Thompson, , “Accumulations of microplastic on
shorelines worldwide: sources and sinks”, Environmental science & technology, pp. 9175–9179, 2011.
[44] L. S. Fendall and M. A. Sewell, “Contributing to marine pollution by washing your face: Microplastics in facial cleansers”, Marine
Pollution Bulletin., vol. 58, no. 8, pp. 1225–1228, 2009.
[45] A. T. Williams and S. L. Simmons, “Sources of riverine litter: The river Taff, South Wales, UK”, Water. Air. Soil Pollution, vol. 112,
no. 1–2, pp. 197–216, 1999.
[46] L. Jeftic, S. Sheavly, and E. Adler, “Marine Litter : A Global Challenge”, UNEP2009.
[47] H. S. Auta, C. U. Emenike, and S. H. Fauziah, “Distribution and importance of microplastics in the marine environment.A review
of the sources, fate, effects, and potential solutions”, Environment International, vol. 102, pp. 165–176, 2017.
[48] A. R. McCormick, T. J. Hoellein, M. G. London, J. Hittie, J. W. Scott, and J. J. Kelly, “Microplastic in surface waters of urban rivers:
Concentration, sources, and associated bacterial assemblages”, Ecosphere, vol. 7, no. 11, 2016.
[49] I. E. Napper and R. C. Thompson, “Release of synthetic microplastic plastic fibres from domestic washing machines: Effects of
fabric type and washing conditions”, Marine Pollution Bulletin, vol. 112, no. 1–2, pp. 39–45, 2016.
[50] J. Talvitie, M. Heinonen, J.P. Pääkkönen, E. Vahtera, A. Mikola, O. Setälä, and R. Vahala, “Do wastewater treatment plants act as
a potential point source of microplastics? Preliminary study in the coastal Gulf of Finland, Baltic Sea”, Water Scienceand Tech-
nology, vol. 72, no. 9, pp. 1495–1504, 2015.
[51] R. A. Castañeda, S. Avlijas, M. A. Simard, A. Ricciardi, and R. Smith, “Microplastic pollution in St. Lawrence River sediments”,
Canadian Journal of Fisheries and Aquatic Sciences, vol. 71, no. 12, pp. 1767–1771, 2014.
[52] A. McCormick, T. J. Hoellein, S. A. Mason, J. Schluep, and J. J. Kelly, “Microplastic is an abundant and distinct microbial habitat
in an urban river”, Environmental Science and Technology, vol. 48, no. 20, pp. 11863–11871, 2014.
[53] RIVM, “Quick scan and prioritization of microplastic sources and emissions”, , 2016.
[54] R. Essel, L. Engel, and M. Carus, “Sources of microplastics relevant to marine protection in Germany” , Umweltbundesamt, vol.
64, p. 48, 2015.
[55] J.M. Veiga, D. Fleet, S. Kinsey, P. Nilsson, T. Vlachogianni, S. Werner, F. Galgani, R.C. Thompson, J. Dagevos, J.Gago, P.
Sobral, and R. Cronin, ,” Identifying sources of marine litter”, MSFD GES TG Marine Litter Thematic Report”,JRC Technical
Report, EUR 28309,2016.
[56] S. Rech, V. Macaya-Caquilpán, J. F. Pantoja, M. M. Rivadeneira, C. K. Campodónico, and M. Thiel, “Sampling of riverine litter with
citizen scientists: findings and recommendations” , Environmental Monitoring and Assessment , vol. 187, no. 6, 2015.
[57] J. A. Ivar do Sul, M. F. Costa, J. S. Silva-Cavalcanti, and M. C. B. Araújo, “Plastic debris retention and exportation by a mangrove
forest patch” ,Marine Pollution Bulletin, vol. 78, no. 1–2, pp. 252–257, 2014.
[58] U, Oliveira and M, Vieira, “Occurrence and Impacts of Microplastics in Freshwater Fish” , Journal of Aquaculture & Marine Biolo-
gy, vol. 5, no. 6, 2017.
[59] K.S. Devi, A. V.V.S. Swamy and R. H. Krishna , “Studies on the Solid Waste Collection by Rag Pickers at Greater Hyderabad
Municipal Corporation, India” , International Research Journal of Environment Sciences, vol. 3, no. 1, pp. 13–22, 2014.
[60] D. C. Wilson, C.A. Velis, and C. Cheeseman, “Role of informal sector recycling in waste management in developing countries”,
Habitat International, vol. 30, no. 4, pp. 797–808, 2006.
[61] M. H. Depledge, F. Galgani, C. Panti, I. Caliani, S. Casini, and M. C. Fossi, “Plastic litter in the sea” , Marine Environmental
Research, vol. 92, pp. 279–281, 2013.
[62] J. A. Ivar do Sul and M. F. Costa, “Marine debris review for Latin America and the Wider Caribbean Region: From the 1970s until
now, and where do we go from here?” , Marine Pollution Bulletin, vol. 54, no. 8, pp. 1087–1104, 2007.
[63] F. Galgani, J. P. Leaute, P. Moguedet, A. Souplet, Y. Verin, A. Carpentier, H. Goraguer, D. Latrouite, B. Andral, Y. Cadiou, J. C.
Mahe, J. C. Poulard and P. Nerisson, , “Litter on the sea floor along European coasts”, Marine Pollution Bulletin, vol. 40, no. 6,
pp. 516–527, 2000.
[64] UNEP/MAP MED POL Programme, “Marine Litter Assessment in the Mediterranean”, 2015.
[65] A. Stapley, “Riverine Plastic Litter: A Global Problem,” University of Leeds, 2017.
[66] M. Kummu, H. de Moel, P. J. Ward, and O. Varis, “How close do we live to water? a global analysis of population distance to
freshwater bodies,” PLoS One, vol. 6, no. 6, 2011.
[67] European Environment Agency, “Restoring European rivers and lakes in cities improves quality of life”, 2016. Available:
https://www.eea.europa.eu/highlights/restoring-european-rivers-and-lakes. [Accessed: 18-Sep-2017].
[68] P. G. Ryan, C. J. Moore, J. a van Franeker, and C. L. Moloney, “Monitoring the abundance of plastic debris in the marine envi-
ronment”, Philosophical transactions of the Royal Society of London. Series B, Biological sciences, vol. 364, no. 1526, pp.
1999–2012, 2009.
[69] N. Armitage and A. Rooseboom, “The removal of urban litter from stormwater conduits and streams: Paper 2 - Model studies of
potential trapping structures” Water SA, vol. 26, no. 2, pp. 189–194, 2000.
[70] S. Rech, V. Macaya-Caquilpán, J. F. Pantoja, M. M. Rivadeneira, D. Jofre Madariaga, and M. Thiel, “Rivers as a source of marine
litter - A study from the SE Pacific” , Marine Pollution Bulletin, vol. 82, no. 1–2, pp. 66–75, 2014.
[71] C. J. Moore, G. L. Lattin, and a. F. Zellers, “Quantity and type of plastic debris flowing from two urban rivers to coastal waters
and beaches of Southern California”, Revista de Gestão Costeira Integrada, vol. 11, no. 1, pp. 65–73, 2011.
[72] J. Gasperi, R. Dris, T. Bonin, V. Rocher, and B. Tassin, “Assessment of floating plastic debris in surface water along the Seine
River” , Environmental pollution, vol. 195, pp. 163–166, 2014.
[73] S. S. Sadri and R. C. Thompson, “On the quantity and composition of floating plastic debris entering and leaving the Tamar
Estuary, Southwest England”, Marine Pollution Bulletin, vol. 81, no. 1, pp. 55–60, 2014.
[74] M. C. B. Araújo and M. F. Da Costa, “The significance of solid wastes with land-based sources for a tourist beach : Pernambuco
, Brazil”, Pan-American Journal of Aquatic Sciences, vol. 1, pp. 28–34, 2006.
[75] E. van Sebille, C. Spathi, and A. Gilbert, “The ocean plastic pollution challenge: towards solutions in the UK” , Grantham Insti-
tute Briefing paper, No. 19, 2016.
[76] T. R. de Barros, S. D. Mancini, and J. L. Ferraz, “Composition and quantification of the anthropogenic and natural fractions of
wastes collected from the stormwater drainage system for discussions about the waste management and people behavior”
En,vironment, Development and Sustainability, vol. 16, no. 2, pp. 415–429, 2014.
[77] A. Van Leeuwen, “Plastic Bag Bans and Third World Countries”,,” 2013. Available: https://fighttheplasticbagban.files.wordpress.
com/2013/08/plastic-bags-and-third-world-nations.pdf [Accessed: 18-Sep-2017].
[78] A. M. Renn, “Wasted: How to fix America’s sewers”, 2016. [Online]. Available: http://www.infrastructureusa.org/wasted-how-to-
fix-americas-sewers/
[79] WWAP (United Nations World Water Assessment Programme), “The United Nations world water development re-
port 2017: wastewater: the untapped resource; facts and figures”, UNESCO, 2017. Available: http://unesdoc.unesco.org/
images/0024/002471/247153e.pdf [Accessed: 18-Sep-2017].
[80] S. J. Bell, “What Is The Thames Tideway Tunnel?”, Londonist. [Online]. Available: https://londonist.com/2015/08/what-is-the-
thames-tideway-tunnel. [Accessed: 18-Sep-2017].
[81] “ASLA 2010 Professional Awards | Gowanus Canal Sponge ParkTM”, [Online]. Available: https://www.asla.
org/2010awards/064.html. [Accessed: 18-Sep-2017].
[82] M. A. Browne, T. S. Galloway, and R. C. Thompson, “Spatial patterns of plastic debris along estuarine shorelines”, Environmental
Science and Technology, ., vol. 44, no. 9, pp. 3404–3409, 2010.
[83] T. Kukulka, G. Proskurowski, S. Morét-Ferguson, D. W. Meyer, and K. L. Law, “The effect of wind mixing on the vertical distribu-
tion of buoyant plastic debris”, Geophysical Research Letters, vol. 39, no. 7, 2012.
[84] M. Thiel, I. A. Hinojosa, T. Joschko, and L. Gutow, “Spatio-temporal distribution of floating objects in the German Bight (North
Sea)”, Journal of Sea Research, vol. 65, no. 3, pp. 368–379, 2011.
[85] Marine Conservation Society, “Marine plastics pollution policy and position statement”, Pollution policy and position statement,
p. 33, 2015.

69 70
[86] F. Galgani, “Marine litter, future prospects for research,” Frontiers in Marine Science, vol. 2, no. October, pp. 1–5, 2015.
[87] C. M. Free, O. P. Jensen, S. A. Mason, M. Eriksen, N. J. Williamson, and B. Boldgiv, “High-levels of microplastic pollution in a
large, remote, mountain lake” , Marine Pollution Bulletin, vol. 85, no. 1, pp. 156–163, 2014.
[88] R. Dris, J. Gasperi, V. Rocher, M. Saad, N. Renault, and B. Tassin, “Microplastic contamination in an urban area: A case study in
Greater Paris”, Environmental Chemistry, vol. 12, no. 5, pp. 592–599, 2015.
[89] J. Strand, “Marine Litter: Pollution with plastic debris in our aquatic environment”, Aarhus University, 2015.
[90] A. L. Andrady, “Plastics and Environmental Sustainability”, 2015.
[91] J. E. Pegram and A. L. Andrady, “Outdoor weathering of selected polymeric materials under marine exposure conditions”, Poly-
mer Degradation and Stability, , vol. 26, no. 4, pp. 333–345, 1989.
[92] D. A. Cooper and P. L. Corcoran, “Effects of mechanical and chemical processes on the degradation of plastic beach debris on
the island of Kauai, Hawaii,” Marine Pollution. Bulletin., vol. 60, no. 5, pp. 650–654, 2010.
[93] R. C. Thompson, “Lost at Sea: Where Is All the Plastic?” , Science., vol. 304, no. 5672, pp. 838, 2004.
[94] A. Cheshire and E. Adler, , “UNEP/IOC Guidelines on survey and monitoring of marine litter”, Regional Seas Reports and Stud-
ies no. 186. 2009.
[95] A. T. Williams and S. L. Simmons, “The degradation of plastic litter in rivers: Implications for beaches” , Journal of Coastal Con-
servation, vol. 2, no. 1, pp. 63–72, 1996.
[96] A. L. Andrady, “Weathering of polyethylene (LDPE) and enhanced photodegradable polyethylene in the marine environment”,
Journal of Applied Polymer Science, vol. 39, no. 2, pp. 363–370, 1990.
[97] T. O’ Brine and R. C. Thompson, “Degradation of plastic carrier bags in the marine environment”, Marine Pollution Bulletin, vol.
60, no. 12, pp. 2279–2283, 2010.
[98] D. Feldman, “Polymer weathering: Photo-oxidation”, Journal of Polymers and the Environment, vol. 10, no. 4, pp. 163–173, 2002.
[99] J. E. Weinstein, B. K. Crocker, and A. D. Gray, “From macroplastic to microplastic: Degradation of high-density polyethylene,
polypropylene, and polystyrene in a salt marsh habitat”, Environmental Toxicology and Chemistry, vol. 35, no. 7, pp. 1632–1640,
2016.
[100] N. Armitage, “The reduction of urban litter in the stormwater drains of South Africa”, Urban Water Journal, vol. 4, no. 3, pp.
151–172, 2007.
[101] B. D. Hardesty, Q. Schuyler, T. J. Lawson, K. Opie, and C. Wilcox, “Understanding debris sources and transport from the coastal
margin to the ocean”,, 2016.
[102] B.D. Hardesty, C. Wilcox, Q. Schuyler, T.J. Lawson and K. Opie , “Developing a baseline estimate of amounts , types , sources
and distribution of coastal litter – an analysis of US marine debris data Citation”, CSIRO: EP167399,2016.
[103] O. Campbell,A. Bushong, D. Gartman, S. Bhargava“ Identifying sources of ocean plastics : A methodology for supply chains”,
2017.
[104] Environmental Services Association, “The Role of Extended Producer Responsibility in Tackling Litter in the UK”, pp. 1–8, 2016.
[105] C. Sherrington, C. Darrah, and S. Hann, “Exploring the Indirect Costs of Litter in England”, pp. 1–92, 2014.
[106] P.W. S. R. Stein, “Litter in America: National findings and recomendations”, Executive Summary, 2009. Available: https://www.
kab.org/sites/default/files/News%26Info_Research_LitterinAmerica_ExecutiveSummary_Final.pdf. [Accessed: 18-Sep-2017].
[107] D.C. Wilson and C.A. Velis, “Waste management–still a global challenge in the 21st century: An evidence-based call for action”,
Waste Management & Research, no. 33(12): 1049-1051, 2015.
[108] D. Lerpiniere , C.D. Wilson, C.A. Velis, B. Evans, H. Voss and K. Moodley “Review of development co-operation in solid waste
management”, Report prepared by University of Leeds on behalf of ISWA Globalisation and Waste Management Task Force.
2014. International Solid Waste Association, 2014.
[109] F. C. Mihai, “One global map but different worlds: Worldwide survey of human access to basic utilities”, Human Ecology, vol. 45,
no. 3. pp. 425–429, 2017.
[110] D-Waste, “Waste management for everyone”, p. 24, 2012. Available: https://www.d-waste.com_ [Accessed: 18-Sep-2017].
[111] J. B. Nyakaana, “ Solid wste management in urban centers: the case of Kampala city - Uganda”, East African Geographical
Review,, vol. 19, no. 1, pp. 33–43, 1997.
[112] E. Kosior and I. Crescenzi, “ Solutions for ocean plastics and agenda for action”, Artists Project Earth ,2016.
[113] , “The solid waste collection in Nakuru , Kenya has improved”, 2016. Available: http://wash-alliance.org/wp-content/uploads/
sites/36/2016/08/Case-study-Kenya.pdf [Accessed: 18-Sep-2017].
[114] Indonesia Ministry of Settlement and Regional Infrastructure, “Jakarta Solid Waste Management System Improvement Project”,
pp. 1–17, 2005. Available: https://www.jica.go.jp/english/our_work/evaluation/oda_loan/post/2003/pdf/2-14_full.pdf [Ac-
cessed: 18-Sep-2017].
[115] R. Padawangi and M. Douglass, “Water, water everywhere: Toward participatory solutions to chronic urban flooding in Jakarta”,
vol. 88, no. 3. 2015.
[116] K. Menteri, “Indonesia ’ S Garbage Problem”, pp. 29–35, 2015. Availabe: http://www.ina.or.id/images/stories/maga-
zine/2015-July/29.pdf. [Accessed: 18-Sep-2017].
[117] C. A.Wijaya, “Jakarta seeing results with cleaner rivers - City - The Jakarta Post”, The Jakarta Post. [Online]. Available: http://
www.thejakartapost.com/news/2016/05/23/jakarta-seeing-results-with-cleaner-rivers.html. [Accessed: 18-Sep-2017].
[118] J. Cooper and B. Appelqvist, “Waste Trafficking, Challenges And Actions To Be Taken,” ISWA Task Force on Globalisation and
Waste Management, 2014.
[119] “Right Waste Right Place”, [Online]. Available: http://www.rightwasterightplace.com/#intro. [Accessed: 18-Sep-2017].
[120] J. Moss, E., Eidson, A., Jambeck, “Sea of opportunity”, Malaysian Bus., p. 14, 2017.
[121] Maurice Picow, “Lebanon Sidon Garbage Mound Becomes City Park | Green Prophet”, [Online]. Available: https://www.green-
prophet.com/2014/12/lebanons-sidon-garbage-mountain-to-become-city-park/. [Accessed: 18-Sep-2017].
[122] “Saida Garbage Mountain, Lebanon | EJAtlas”, [Online]. Available: https://ejatlas.org/conflict/garbage-mountain-saida. [Ac-
cessed: 18-Sep-2017].
[123] AFP, “In Lebanon, a garden blooms on former ‘trash mountain’ | Daily Mail Online.” [Online]. Available: http://www.dailymail.
co.uk/wires/afp/article-2869973/In-Lebanon-garden-blooms-former-trash-mountain.html. [Accessed: 18-Sep-2017].
[124] Ocean Conservancy, “The Ocean Trash Index - Results of the International Coastal Cleanup (ICC)-2012”,2012.
[125] A. A. Pallis, A. A. Papachristou, and C. Platias, “Environmental policies and practices in Cruise Ports : Waste reception facilities
in the Med”, vol. 67, no. 1, pp. 54–70, 2017.
[126] A. Hena and M. Mamun, “Feasibility study for the establishment of port waste reception facility in context of ports in South Asian
countries”, p. 132, 2000.
[127] “Free disposal of clean plastic waste in ports of Rotterdam and Amsterdam”, Waste Management World, 2016. [Online]. Availa-
ble: https://www.portofrotterdam.com/en/news-and-press-releases/free-disposal-of-clean-plastic-waste-in-ports-of-rotterdam-
and-amsterdam. [Accessed: 16-Aug-2017].
[128] “Deposit-refund system”, [Online]. Available: https://www.palpa.fi/beverage-container-recycling/deposit-refund-system/. [Ac-
cessed: 18-Sep-2017].
[129] “Germany deposit refund system – Zero Waste Europe”, [Online]. Available: https://www.zerowasteeurope.eu/tag/germany-de-
posit-refund-system/. [Accessed: 18-Sep-2017].
[130] Plastics Europe, “Plastic - the Facts 2016”, p. 38, 2016. Available: http://www.plasticseurope.org/documents/docu-
ment/20161014113313-plastics_the_facts_2016_final_version.pdf [Accessed: 18-Sep-2017].
[131] C.A. Velis, C.A., D.C. Wilson, O. Rocca, S.R. Smith, A. Mavropoulos and Cheeseman “An analytical framework and tool (‘In-
teRa’) for integrating the informal recycling sector into waste and resource management systems in developing countries”,
Waste Management & Research, no. 30(9 Suppl), pp. 43–66, 2012.
[132] D. Mamphitha, “the Role Played By Subsistence Waste Pickers in Recycling,”, pp. 1–110, 2012.
[133] O. Möllenstäd, “A systems for collecting waste”, ” [Online]. Available: https://www.dandc.eu/en/article/how-local-initiative-en-
couraging-waste-pickers-mumbai-contribute-date-plastics-recycling. [Accessed: 18-Sep-2017].
[134] G. Feller, “Dutch Successes”, Waste Management World, 2010. [Online]. Available: https://waste-management-world.com/a/
dutch-successes. [Accessed: 18-Sep-2017].
[135] J. Kennedy, “How The UK Compares At plastic recycling with Holland”, Plastic expert, 2016. [Online]. Available: http://www.
plasticexpert.co.uk/uk-plastic-recycling-holland-compare/. [Accessed: 18-Sep-2017].
[136] European Environment Agency, “Municipal waste management Netherlands”, p. 19, 2016.
[137] A. Hutchinson, “Recycling Statistics - Is recycling worth It”, 2008. [Online]. Available: http://www.popularmechanics.com/sci-
ence/environment/a3752/4291566/. [Accessed: 18-Sep-2017].
[138] UNEP, “Towards a Green Economy: Pathways to Sustainable Development and Poverty Eradication”, 2011. Available
www.unep.org/greeneconomy. [Accessed: 18-Sep-2017].
[139] N. J. Themelis and C. Mussche, “2014 Energy and Economic Value of Municipal Solid Waste (MSW), Including Non-Recycled
plastics (NRP), Currently landfilled in the fifty States”, Columbia University, p. 40, 2014.
[140] Ocean Recovery Alliance, “2015 Plastics-To-Fuel Project Developer’s Guide”, Ocean Recover. Alliance, p. 74, 2015.
[141] J. Sneddon, “Plastic to Fuel Market Review”, no. 2, 2017.
[142] James Pike, “Turning Waste into a Resource - James Pike, Suez Environement,” 2015. [Online]. Available: https://www.
slideshare.net/GoGreenBusiness/turning-waste-into-a-resource-james-pike-suez-environement. [Accessed: 18-Sep-2017].
[143] “Delay hits opening of unique plastics-to-diesel plant | ENDS Waste & Bioenergy”, 2015. [Online]. Available: http://www.
endswasteandbioenergy.com/article/1353764/delay-hits-opening-unique-plastics-to-diesel-plant. [Accessed: 18-Sep-2017].
[144] Ricardo-AEA, “Case Study 3: Cynar plastics to diesel”, Report for ZWSA”, no. 1, p. 8, 2013.
[145] M. Coronado and C.A. Velis, “Circular Economy: Closing the Loops”, Rep. Prep. by Univ. Leeds behalf ISWA Resource. Man-
agement Task Force. 2015. Int. Solid Waste Assoc. Vienna, Sept. 2015., p. 44, 2015.
[146] E. Iacovidou et al., “A pathway to circular economy: Developing a conceptual framework for complex value assessment of
resources recovered from waste”, Journal of Cleaner Production, 2017.
[147] Marine Conservation Society, “Great British Beach Clean 2016 Report”, p. 5, 2016. Available: https://www.mcsuk.org/down-
loads/gbbc/2016/487-2016%20Beachwatch%20GBBC%20Summary%2016pp%20A5%20WEB%20Spreads.pdf
[Accessed: 18-Sep-2017].

71 72
THE MARINE LITTER TASK FORCE CORE TEAM6
DR COSTAS VELIS
Task Force Leader
MS GUNILLA CARLSSON
Communications Coordinator
MS MARIA TSAKONA
Researcher – International Consultant
MS ADITI RAMOLA
Project ManagerMS JENNIFER MACDONALD
Project Coordinator
MR HÅKAN RYLANDER
Fundraiser
MR DAVID LERPINIERE
Principal Consultant, Resource Futures

73 74
THE MARINE LITTER TASK FORCE
An ISWA facilitated partnership to prevent marine lit-
ter, with a global call to action for investing in sustain-
able waste and resources management worldwide
TASK FORCE LEADER
Dr Costas Velis, University of Leeds
http://marinelitter.iswa.org
ISWA Task Force on Marine Litter
Auerspergstrasse 15, Top 411080, Wien, Austria
+43 1 253 6001
#004a70
Nav länk Nav länk Nav länk
Nav länk Nav länk Nav länk
Nav länk Nav länk Nav länk
#6aa1c1
#77a6ab
#d0b33f
#e8eeef
In partnership with
Supported by
Report powered by
A publication of
Cite as
Velis C., Lerpiniere D., Tsakona M. (2017). How to
prevent marine plastic litter - now! An ISWA facilitat-
ed partnership to prevent marine litter, with a global
call to action for investing in sustainable waste and
resources management worldwide. Report prepared
on behalf of the International Solid Waste Associa-
tion (ISWA). An output of ISWA Marine Litter Task
Force. ISWA September 2017. Vienna, pp.75 Obtain
from: http://marinelitter.iswa.org/marine-task-force-
report-2017/
Financial Support
The Task Force is grateful to the Partner organization
AVFALL SERVIGE for major financial support and to
is Supporter organizations SYSAV and DAKOFA. We
acknowledge the in-kind contribution of the University
of Leeds and Resource Futures.
Acknowledgments
The Task Force is grateful to the ISWA Scientific and
Technical Committee (STC), under the leadership of
Ms Bettina Kamuk, STC Chair, for sharing ideas and
constructive feedback in a co-development work-
shop, as part of the creation of this publication. The
opinions expressed here are the Authors’ alone.

KEEP PLASTIC WASTE OUT OF OUR OCEANS – NOW!