Plastic behavior of a nickel-based alloy under monotonic-tension and low-cycle-fatigue loading
17
Plastic behavior of a nickel-based alloy under monotonic-tension and low-cycle-fatigue loading E-Wen Huang a , Rozaliya I. Barabash b,c, * , Yandong Wang a,d , Bjørn Clausen e , Li Li a , Peter K. Liaw a , Gene E. Ice b , Yang Ren f , Hahn Choo a , Lee M. Pike g , Dwaine L. Klarstrom g a Department of Materials Science and Engineering, University of Tennessee, Knoxville, TN 37996, USA b Materials Science and Technology Division, Oak Ridge National Laboratory, Oak Ridge, TN 37831, USA c Center for Materials Processing, University of Tennessee, Knoxville, TN 37996, USA d Key Laboratory for Anisotropy and Texture of Materials, Ministry of Education, Northeastern University, Shenyang 110004, PR China e Los Alamos Neutron Science Center, Los Alamos National Laboratory, Los Alamos, NM 87545, USA f X-ray Science Division, Argonne National Laboratory, Argonne, IL 60439, USA g Department of Technology Engineering, Haynes International Inc., Kokomo, IN 46904, USA Received 25 July 2007; received in final revised form 1 October 2007 Available online 16 October 2007 Abstract The plastic behavior of an annealed HASTELLOY Ò C-22HS TM alloy, a face-centered cubic (FCC), nickel-based superalloy, was examined by in-situ neutron-diffraction measurements at room temperature. Both monotonic-tension and low-cycle-fatigue experiments were conducted. Mono- tonic-tension straining and cyclic-loading deformation were studied as a function of stress. The plas- tic behavior during deformation is discussed in light of the relationship between the stress and dislocation-density evolution. The calculated dislocation-density evolution within the alloy reflects the strain hardening and cyclic hardening/softening. Experimentally determined lattice strains are compared to verify the hardening mechanism at selected stress levels for tension and cyclic loadings. Combined with calculations of the dislocation densities, the neutron-diffraction experiments provide direct information about the strain and cyclic hardening of the alloy. Published by Elsevier Ltd. 0749-6419/$ - see front matter Published by Elsevier Ltd. doi:10.1016/j.ijplas.2007.10.001 * Corresponding author. Address: Materials Science and Technology Division, Oak Ridge National Laboratory, Oak Ridge, TN 37831, USA. Tel.: +1 865 241 7230. E-mail address: [email protected] (R.I. Barabash). Available online at www.sciencedirect.com International Journal of Plasticity 24 (2008) 1440–1456 www.elsevier.com/locate/ijplas
-
Upload
independent -
Category
Documents
-
view
2 -
download
0
Transcript of Plastic behavior of a nickel-based alloy under monotonic-tension and low-cycle-fatigue loading

Available online at www.sciencedirect.com
International Journal of Plasticity 24 (2008) 1440–1456
www.elsevier.com/locate/ijplas
Plastic behavior of a nickel-based alloy undermonotonic-tension and low-cycle-fatigue loading
E-Wen Huang a, Rozaliya I. Barabash b,c,*, Yandong Wang a,d,Bjørn Clausen e, Li Li a, Peter K. Liaw a, Gene E. Ice b, Yang Ren f,
Hahn Choo a, Lee M. Pike g, Dwaine L. Klarstrom g
a Department of Materials Science and Engineering, University of Tennessee, Knoxville, TN 37996, USAb Materials Science and Technology Division, Oak Ridge National Laboratory, Oak Ridge, TN 37831, USA
c Center for Materials Processing, University of Tennessee, Knoxville, TN 37996, USAd Key Laboratory for Anisotropy and Texture of Materials, Ministry of Education, Northeastern University,
Shenyang 110004, PR Chinae Los Alamos Neutron Science Center, Los Alamos National Laboratory, Los Alamos, NM 87545, USA
f X-ray Science Division, Argonne National Laboratory, Argonne, IL 60439, USAg Department of Technology Engineering, Haynes International Inc., Kokomo, IN 46904, USA
Received 25 July 2007; received in final revised form 1 October 2007Available online 16 October 2007
Abstract
The plastic behavior of an annealed HASTELLOY� C-22HSTM alloy, a face-centered cubic(FCC), nickel-based superalloy, was examined by in-situ neutron-diffraction measurements at roomtemperature. Both monotonic-tension and low-cycle-fatigue experiments were conducted. Mono-tonic-tension straining and cyclic-loading deformation were studied as a function of stress. The plas-tic behavior during deformation is discussed in light of the relationship between the stress anddislocation-density evolution. The calculated dislocation-density evolution within the alloy reflectsthe strain hardening and cyclic hardening/softening. Experimentally determined lattice strains arecompared to verify the hardening mechanism at selected stress levels for tension and cyclic loadings.Combined with calculations of the dislocation densities, the neutron-diffraction experiments providedirect information about the strain and cyclic hardening of the alloy.Published by Elsevier Ltd.
0749-6419/$ - see front matter Published by Elsevier Ltd.
doi:10.1016/j.ijplas.2007.10.001
* Corresponding author. Address: Materials Science and Technology Division, Oak Ridge NationalLaboratory, Oak Ridge, TN 37831, USA. Tel.: +1 865 241 7230.
E-mail address: [email protected] (R.I. Barabash).

E-Wen Huang et al. / International Journal of Plasticity 24 (2008) 1440–1456 1441
Keywords: Plasticity; Dislocations; In-situ neutron-diffraction; Fatigue
1. Introduction
The design of advanced metal alloys requires detailed information about the mechan-ical behavior and property evolution in service beyond elasticity, which is roughly inde-pendent of defects. Plasticity and the underlying deformation mechanisms evolve duringservice. In metals, dislocations are responsible for most of the plastic deformation. Duringdeformation, these dislocations multiply and self-organize into mesoscale structures thatstrongly influence future deformation. However, Guinier and Julien (1989) has pointedout the challenge of studying dislocations, especially for fatigue, in light of the samplepreparation required for electron microscopy. In the present work, monotonic-tensionand cyclic-loading during in-situ neutron experiments have been used to compare andstudy the fatigue behavior of a superalloy. Understanding the plastic behavior of thisnewly-designed nickel-based superalloy is important for applications in extreme environ-ments. In-situ neutron-diffraction experiments provide non-destructive, volume-averagedbulk characterization of the atomistic mechanisms with qualitative trends for studyingthe plastic deformation of the alloy. The focus of current research is associated with dis-location evolution during plastic deformation.
Transmission-electron-microscopy (TEM) (Hirsch and Whelan, 1960; Howie and Whe-lan, 1962) is well established for the study of local structures and the internal stresses contrib-uted by dislocations. However, with TEM, only a small amount of material is observed witheach thin specimen and the statistics and the response of the experimental are limited by thedemanding sample preparation. X-ray experiments provide an alternative method for study-ing dislocation structures, which complement TEM experiments. X-ray diffraction experi-ments with advanced analyses have characterized different types of dislocations(Mughrabi, 1983; Ungar et al., 1999; Barabash et al., 2003). Anisotropic strain accommoda-tions by different grains were considered by Stephens (1999). Recently, Jakobsen et al. (2006)and Levine et al. (2006) report the use of the synchrotron X-ray accompanying TEM resultsto study local dislocation behavior during plastic deformation. These studies illustrate thepotential of diffraction techniques for the investigations of dislocation behavior in plasticdeformation. The current study reports in-situ neutron-diffraction measurements that utilizethe advantage of the diffraction experiments for examining dislocation statistics associatedwith plastic deformation. The advantages of the present neutron measurements are:
� The high penetration of neutrons characterizes bulk behavior with large gauge volumes,and, hence, good statistics (Wang et al., 2003). Although the divergence of the neutronbeams is higher than that of high-energy synchrotron X-rays, the typically lower resolutionof neutron measurements is sufficient for our research, which focuses on statistical averages.� The Spectrometer for MAterials Research at Temperature and Stress (SMARTS)
(Bourke et al., 2002) at the Los Alamos Neutron Science Center (LANSCE) can be usedto conduct in-situ measurements to observe the behaviors of the deformation from asingle specimen. The in-situ measurement eliminates confusion from ex-situ experi-ments that require several specimens and associated sample preparations.

1442 E-Wen Huang et al. / International Journal of Plasticity 24 (2008) 1440–1456
The current study focuses on the plastic behavior of a nickel-based alloy under tensionand cyclic loadings. To address this problem, the in-situ neutron measurements weredesigned with these components:
[1] Tension experiments were conducted to study strain hardening mechanisms and theassociated dislocation-density evolution.
[2] Low-cycle-fatigue experiments were performed to study cyclic hardening and soften-ing, and the dislocation-density evolution.
[3] Dislocation densities as a function of the true stress from strain hardening, cyclichardening, and cyclic softening are compared with the lattice strain evolutions toexamine the plastic behavior of the alloy.
2. Test materials and experiments
The HASTELLOY� C-22HSTM alloy is a nickel-based superalloy (Ni–21Cr–17Mo inthe weight percentage). The alloy is intended to be used under corrosive environmentsand where high strength is demanded. The alloy is mill annealed at 1080 �C to minimizethe formation of precipitates and to achieve a single-phase, face-centered cubic (FCC)alloy, as characterized by transmission-electron-microscopy (TEM) (Lu et al., 2007).The average grain size of this alloy is about 90 lm.
Two sets of the specimens, one for tension and the other for fatigue were cut from thesame cylindrical alloy bar. The dimensions of the dog-bone shape specimens were selectedaccording to the standard ASTM/E 606 as shown in Fig. 1a. In-situ neutron measure-ments were used to monitor the monotonic-tension and low-cycle-fatigue experiments.A gauge volume of about 120 mm3 from the center of the specimen was used through boththe measurements of monotonic-tension and low-cycle-fatigue experiments. The tests werecarried out with the SMARTS beamline of LANSCE and the environment is at room tem-perature (Benson et al., 2006; Sun et al., 2007). The specimens were aligned 45� to the inci-dent neutron beam with two detector banks fixed at 2h = ±90�. Hence, one detector bankcollected diffraction data along the loading direction (Qk), and the other collected the dif-fraction data in the transverse direction (Q\) as shown in Fig. 1b. The Q directions areassociated with two distinct sets of grains: Qk measures lattice strain for {hk l} planes par-allel to the strain; and Q\ measures lattice strain perpendicular to tension load. Practicallygrains with surface normals in the interval of ±4� relative to the exact Bragg condition giveinput to the diffraction. Since the beam paths are slightly different for loading to transversedirections (Fig. 1b and c), we use reference points accordingly for peak-profile analyses.
For the tension experiment, the sample was loaded in strain control using a strain rateof 0.001 s�1 with intermittent holds at constant strain levels to allow for neutron-diffrac-tion measurements. The specimen was elongated to a strain of about 45% and then failure.The closest measurement before necking is at about 32% strain. The stress–strain curve ofthe in-situ tension experiments is presented in Fig. 2. The onset of the plastic deformationis marked in the green region and is enlarged as the inset plot. The 0.2% yield stress isaround 370 MPa, which will be a reference for the evolution of dislocations. Load dropsare seen in the plastic region during the constant strain holds due to room temperaturerelaxation. The count time for a single neutron-diffraction measurement is about 10 min.

Fig. 1. (a) The geometry of the specimen. (b) A schematic view of the neutron beam path for measurement. (c)The schematic plot shows that only the grains satisfying Bragg’s condition diffract the incident neutrons to thedetector banks. The grains with {hkl} planes along loading direction (Qk) are shown in gray. The grains with{hkl} planes in the transverse direction (Q\) are shown in red.
E-Wen Huang et al. / International Journal of Plasticity 24 (2008) 1440–1456 1443
The low-cycle-fatigue experiments were conducted with a minimum strain (emin.) andmaximum strain (emax.) of �1% and +1%, respectively (R = �1). The frequency of theloading cycle was 0.5 Hz. The neutron-diffraction data were collected at several selectedcycles during the fatigue experiments within 1500 cycles. The cyclic-loading sequence inFig. 3a shows the deformation status during the measurements. The specimen was loadedto a maximum engineering strain of 1% at Measurement 1. At Measurement 2, the samplewas unloaded to 0 MPa. At Measurement 3, the sample was compressed to a macro-strainof 0%. At Measurement 4, the sample was compressed to an engineering strain of �1%. AtMeasurement 5, the sample was unloaded from the compression to 0 MPa. At Measure-ment 6, the sample was loaded to 0% engineering strain. The 7th measurement (Measure-ment 7) is made at the 1% engineering strain again to compare with Measurement 1 forcyclic effects within one fatigue cycle. Neutron measurements were performed at theseseven measurement points as a function of fatigue cycles. The macroscopic stresses at

0.1 0.2 0.3
True stress-strain curve
0.000 0.002 0.004 0.006 0.0080
100
200
300
400
500
Experimental Linear elastic 0.2% Yield strength
True
str
ess
(MPa
)
True strain
370 Mpa
0.0 0.40
200
400
600
800
1000
1200
1400 True stress-strain curve
True
str
ess
(MPa
)
0.000 0.002 0.004 0.006 0.0080
100
200
300
400
500
Experimental Linear elastic 0.2% Yield strength
True
str
ess
(MPa
)
True strain
370 Mpa
0.000 0.002 0.004 0.006 0.0080
100
200
300
400
500
App
lied
stre
ss (M
Pa)
Engineering strain
ExperimentsLinear elastic 0.2% Yield strength
370 MPa
Monotonic tension experiments
True strain
Fig. 2. True stress–true strain curve of the alloy for the monotonic experiment. The intersection is theenlargement of the early straining curve to show the onset of the plastic deformation.
10 100 1000 10000
Cyclicfailure
Cyclicsoftening
Stre
ss (M
Pa) a
t 1%
stra
in
Fatigue cyles
Cyclichardening
In-situ neutron measurement
600
400
-0.01 0.00 0.01-400
6
5
43
2
Stre
ss (M
Pa)
Fatigue hystersis loop within 1 cycle
Macroscopic Strain (e)
Measurements
0
1&7400
(a) Seven Measurements (b) Cyclic loadings
Fig. 3. (a) Seven measurements of the low-cycle-fatigue experiments within one fatigue cycle. (b) Stress at 1%strain (Measurement 1) is plotted as a function of fatigue cycles. Several in-situ neutron experiments wereconducted within 1500 fatigue cycles. In the beginning, the stress increase as fatigue cycle increases until 600 MPaat 100th cycle, and then decreases.
1444 E-Wen Huang et al. / International Journal of Plasticity 24 (2008) 1440–1456
Measurement 1 as a function of the fatigue cycles are presented in Fig. 3b (Huang et al.,2007). The experiments conducted at Measurement 1 of the fatigue cycles mentionedabove are compared with the results from the monotonic-tension experiments.

(a) Undeformed (b) Tension-deformed (c) Cyclic-deformed
111200
220311
II)
Transverse Direction (Q )
Axial Direction (QII)
Transverse Direction (Q )
Fig. 4. The high-energy synchrotron-diffraction patterns collected from the (a) undeformed alloy, (b) tensile-deformed specimen, and (c) cyclic-deformed specimen. As the arrows depicted, the intensity of differentdiffraction rings can be compared with respect to the axial and transverse directions.
E-Wen Huang et al. / International Journal of Plasticity 24 (2008) 1440–1456 1445
Synchrotron X-ray diffraction (XRD) experiments were conducted to complement theneutron measurements. The high-energy (115 keV) X-ray diffraction experiments were per-formed at the 11-ID-C beamline of the Advanced Photon Source, Argonne National Lab-oratory. The size of the X-ray beam was controlled to 1.0 � 1.0 mm2 to collect diffractiondata with good statistics. Undeformed, tension-failed, and cyclic-failed specimens wereprepared for the synchrotron experiments. Slices were cut from the center of the mechan-ically-tested specimens, which were deformed under the monotonic tension and low-cycle-fatigue tests. The cut materials were then polished to remove the oxides and other addi-tives to eliminate contaminations associated with the sample preparation. The diffractionpatterns were recorded using a two-dimension (2D) image plate detector (Mar345). Thesymmetry of the diffraction rings, as shown in Fig. 4, indicates that the textures of theundeformed, tensioned, and cyclically-deformed specimens were symmetrical, and, hence,the depiction of the two detector banks data from the SMARTS measurements is repre-sentative for describing the evolution of the elastic/plastic response of the material duringthe deformation. The most distinguished difference from monotonic-tension to cyclicdeformation is that there is texture developed after the monotonic-tension (Wenk and Gri-gull, 2003) but texture development is not seen during cyclic deformation [compare solidand spotty characters of the diffraction rings in Fig. 4b and c]. Turkmen’s modeling work(Turkmen et al., 2002) also finds little texture evolution under cyclic loading.
3. Neutron-data analyses
The current in-situ neutron-diffraction profiles are refined by the General StructureAnalysis System (GSAS) (Von Dreele et al., 1982; Von Dreele, 2004) which is based onfull-pattern Rietveld analysis method (Rietveld, 1967). The changes in the peak positionsand the peak widths are determined from the diffraction patterns and presented as the lat-tice strain and full-width-half-maximum (FWHM), respectively.
For the profile analyses, there are several sources of diffraction peak broadening,such as instrument broadening, the size of the coherently-scattering domains, disloca-tions (defects) (Ungar et al., 1999; Balzar et al., 2004; Barabash, 2001; Ice and Bar-abash, 2007), and the anisotropic strain distribution (Stephens, 1999). For the

1446 E-Wen Huang et al. / International Journal of Plasticity 24 (2008) 1440–1456
current study, since the same alloys are tested with the same instruments, the instru-mental broadening was measured from the diffraction profile of a reference sample(before the deformation) and was used to remove instrumental broadening from thetotal broadening.
As shown in Fig. 1b, the diffracted beam path is shorter in the transverse-direction (Q\)than that in the loading direction (Qk). Since the difference of the beam path might alterthe diffracted peak-profile, the peak-profile analyses used different references with respectto different directions according to account for this geometry anisotropy. However, sincecorrelation between the neutron-beam path to the peak-width is not necessary linear, thereis no universal equation to normalize the geometrical anisotropy.
We use two distinct approaches to describe the appearance of line broadening: phenom-enological and atomistic lattice level. In the phenomenological approach, the shift of thepeak depends on the macroscopic stress, and the broadening of the peak is related tomicro-strains/stresses that change from grain to grain. Measurements of the peak shiftduring the deformation allow us to follow the evolutions of such phenomenologicalparameters as macro-stresses and -strains. There are several types of strains that couldcontribute to the peak-width broadening, such as intergranular and intragranular strains.Different types of strains arise from the various microstructures, such as different typesand densities of dislocations. The lattice or atomistic approach can be used to understandthe dependence of the broadening on the particular dislocation/defect distributions withinthe grain. Peak-profile analyses provide statistical information about the dislocation den-sity evolution under deformation.
To decompose the broadened asymmetric peaks into two broadened symmetric sub-peaks, the pseudo-Voigt function is applied to carry out single-peak fitting to distin-guish the different diffraction patterns by GSAS (Balzar et al., 2004). The Lorentzianand Gaussian peak-broadening components were de-convoluted by a pseudo-Voigtfunction in GSAS (Von Dreele, 2004). The FWHM of Gaussian (FWHMG) andLorentzian (FWHML) components were characterized as a function of the stress,respectively because the integrated intensities of these two sub-peaks (Gaussian andLorentzian) are related by random dislocations and dislocation walls, respectively.The procedure is similar to size/strain separation (Balzar et al., 2004). As a result,the smaller sub-peak is diffracted by the cell walls, and the larger one comes fromthe cell interiors as homogenously distributed dislocations (Levine et al., 2006).FWHMG represents the input which can be generated by the uniform randomly dis-tributed dislocations, while FWHML indicates the input from the non-uniform pat-terned dislocations substructures, such as the dislocation walls (Mughrabi, 1983;Barabash, 2001). The spacing between dislocation walls (D) is calculated accordingto the following equation (Barabash, 2001; Ice and Barabash, 2007):
D � pfFWHML
ð1Þ
Here f is the contrast factor, used to calculate the Lorentzian part, from the whole pow-der-pattern fitting of peak-profile. As a first approximation, the dislocation density is cal-culated, assuming equal dislocation activity for all primary slip systems. The density (n) ofthe randomly distributed dislocations is calculated according to the following equation(Barabash, 2001; Ice and Barabash, 2007):

E-Wen Huang et al. / International Journal of Plasticity 24 (2008) 1440–1456 1447
n � FWHMG � dhkl
C � jbj
� �2
ð2Þ
Here the Burgers vector (b), the contrast factor (C) for the Gaussian component, thedhkl-spacing for each {hk l} plane, and the FWHMG of all {hk l} planes areconsidered.
The lattice strains, ehkl, are calculated by the changes in the d-spacing, dhkl, at differentapplied loads during the monotonic-tension experiment or at different number of fatiguecycles for low-cycle-fatigue experiments with respect to that of the reference d-spacing,d0
hkl, as shown in the following equation (Daymond et al., 1997):
ehkl ¼dhkl � d0
hkl
d0hkl
ð3Þ
The reference lattice spacing, d0hkl, was determined from the measured lattice spacing be-
fore deformation.
4. Results
Plots of the FWHM versus 2p/d as a function of stress for tension experiments and low-cycle-fatigue experiments are shown in Fig. 5. Here d is the d-spacing. In the monotonicexperiments, correlations between the FWHM and 2p/d deviates from linearity as thestrain increased, while the applied stress increased. For the low-cycle-fatigue experiments,the correlations changed as a function of fatigue cycles, where the engineering strain wascontrolled at 1% at Measurement 1, the applied stress varies as a function of fatigue cycles.FWHM for both types of loading are markedly anisotropic depending on {h kl} which isin agreement with the previous observations of Ungar et al. (1999) and Sun et al. (2007).This is an indication of the formation of the patterned cell wall dislocation substructure.
4.1. Dislocation density and dislocation-wall spacing evolutions
For the monotonic-tension experiment, the dislocation density as a function of the truestress is shown in Fig. 6a. The following three regions are distinct:
� Stage I (0–370 MPa): the region of the elastic straining is a stage where stressesincreased as the strain increased, as shown in the stress–strain curve (Fig. 2), whilethe dislocation density practically does not change too much (Fig. 6a). The calculateddislocation-wall spacings are large (>1500 nm) and fluctuate in both Q\ and Qk direc-tions in Fig. 6b. However, the accuracy of the neutron-diffraction measurements isinadequate for characterizing cell size larger than 1500 nm, hence, larger symbol sizesare plotted for the calculated values at Stage I.� Stage II (370–750 MPa): the dislocation-strengthening region where the dislocation
density is proportional to the true stress. In this region, the stresses are high enoughso that dislocations start to multiply and pile-up, and, hence, increase the back stress,which resists the motion of additional dislocations. The dislocation density starts toincrease rapidly at about 370 MPa. At this stress value, the dislocation sources becameactivated meanwhile the dislocation-wall spacings decreased in Q\ and Qk directionssimultaneously and reached 800 nm.

Low-cycle-fatigue Monotonic-tension Q ⊥
Q ll
3 4 5 60.00200.00240.00280.00320.00360.00400.00440.0048 1st cycle (393 MPa)
8th cycle (441 MPa)12th cycle (456 MPa)30th cycle (540 MPa)100th cycle (590 MPa)
311220200
FWH
M (1
/A)
2ππππ/d
1113 4 5 6
0.00240.00280.00320.00360.00400.00440.00480.0052 Tensile stress (fatigue cycle at this stresss)
388 (1st cycle)440 (8th cycle)455 (12th cycle)536 (30th cycle)591 (100th cycle)
311220
200
FWH
M (1
/A)
2ππππ/d
111
3 4 5 60.0036
0.0040
0.0044
0.0048
0.0052 1st cycle (393 MPa)8th cycle (441 MPa) 12th cycle (456 MPa) 30th cycle (540 MPa) 100th cycle (590 MPa)
311220
200
FWH
M (1
/A)
2ππππ/d
111
3 4 5 60.00360.00400.00440.00480.00520.0056 Tensile stress (fatigue cycle at this stresss)
388 (1st cycle) 440 (8th cycle) 455 (12th cycle) 536 (30th cycle) 591 (100th cycle)
311220
200
FWH
M (1
/A)
2ππππ/d
111
Fig. 5. FWHM versus 2p/d for low-cycle-fatigue and monotonic-tension experiments in Q\ and Qk directions.
Monotonic tension experiments
(a) Dislocation density (b) Dislocation walls spacing
0 200 400 600 800 1000 1200
400
800
1600
2800
Loading direction (Q II)Transverse direction (Q )
Dis
loca
tion
spac
ings
(nm
)
True Stress (MPa) True Stress (MPa)
370 MPa,0.2% yield strength
Stage I Stage II Stage III
1200
2000
2400
II
)
370 MPa,0.2% yield strength
Stage I Stage II Stage III
0 200 400 600 800 1000 1200
1E7
1E8
1E9
1E10Stage IIIStage II
Loading direction (QII)Transverse direction (Q )
Dis
loca
tion
dens
ity, n
(cm
-2)
Log
[n] 370 MPa
,0.2% yield strength
Stage I
DD
Fig. 6. (a) The dislocation density versus true stress. The line between Stages I and II represents the macroscopic0.2% yield strength. The inset shows a scheme of the randomly distributed dislocations at the bottom-rightcorner. (b) Dislocation-wall spacing within dislocation walls as a function of the true stress. The dislocation-wallspacing (D) is shown in the inset of the upper-right corner. The larger legends of (b) shows the higher uncertaintyfor the size greater than 1500 nm. For clarity, the data is plotted for along (k) and (\) perpendicular to theloading direction.
1448 E-Wen Huang et al. / International Journal of Plasticity 24 (2008) 1440–1456

E-Wen Huang et al. / International Journal of Plasticity 24 (2008) 1440–1456 1449
� Stage III (above 750 MPa): the dislocation density gradually saturated with increasingstress in Q\ direction but not too much in Qk direction. The dislocation-wall spacing inQ\ and Qk directions decreased from 800 to 400 nm, where the sample is close to neck-ing. At the point of macro-yielding, the dislocation-wall spacings possess the essentialtrend of the stress–strain curve, which does not change slope from 370 to 1200 MPa(Fig. 2). The value of the domain size is 400 nm (30% strain of the stress–strain curve),which is comparable to what is observed by Valiev et al. (2000). The reasonable mech-anism is Mughrabi (1983) cell-wall structure, which views the evolution from homoge-neous dislocation distribution to the heterogeneous dislocation cell wall structureconsisting of the soft channels and the periodic array of the hard walls. The reasonfor this evolution trend is the compatibility to the changing shear strain fields, whichis a continuum manifestation of the change of the heterogeneous channel-cell wallstructure. It also suggests that the dislocation arrangements develop to lower-energyheterogeneous configurations compared to homogeneously distributed dislocations.
For low-cycle-fatigue experiments, at the 1% strain level, cyclic hardening startedaround 370 MPa until about 600 MPa, and is, then, followed by cyclic softening.Fig. 7a shows the dislocation density as a function of fatigue cycles. The dislocation den-sity increased as the stress increased and, then, saturated and mildly decreased as a func-tion of fatigue cycles. The dislocation density of low-cycle-fatigue experiments hasapproximately the same value as the monotonic experiments around the same true stresslevel as shown in Fig. 6a. The true stress region at 1% strain (Measurement 1) within 1500fatigue cycles (Fig. 3b) corresponds to the interval of 400–600 MPa. For comparisonbetween cyclic-loading and monotonic-tension, the same stress range is highlighted inthe Stage II of the monotonic experiments. A comparison of the two experiments willbe made within 400–600 MPa for lattice strain in the next section. The calculated disloca-tion-wall spacings evolved in a reverse relation to the dislocation density as shown in
Low-cycle-fatigue experiments
(a) Dislocation density (b) Dislocation walls spacing
1 10 100 1000 10000400800800
120016001600200024002400280032003200360040004000
Loading direction (QII) Transverse direction (Q )D
islo
catio
n sp
acin
gs (n
m)
Fatigue cycles1 10 100 1000 10000
1E7
1E8
1E9
393 MPaat 1st
cycle
Loading direction (QII)Transverse direction (Q )
Dis
loca
tion
dens
ity,n
,(cm
-2)
Log
[n]
Fatigue cycles
590 MPaat 100th
cycle
Fig. 7. (a) The dislocation density and (b) dislocation-wall spacings as a function of fatigue cycles at 1% strain.Note: The bigger legends of (b) in early fatigue cycles show the bigger fluctuations for the measured size greaterthan 1500 nm. For clarity, the data is plotted for along (k) and (\) perpendicular to the loading direction. Thetrue stress is 393 MPa at 1st and 590 MPa at 100th fatigue cycles.

1450 E-Wen Huang et al. / International Journal of Plasticity 24 (2008) 1440–1456
Fig. 7b. Again, for dislocation-wall spacings exceeding 1500 nm, the larger legend-symbolsize indicates larger error bars.
A clear anisotropic quantitative difference of dislocation density from the loading to thetransverse directions under tension is due to the fact that intensity distributions for loadingand transverse directions come from two orthogonal sets of grains as shown in Fig. 1c.Only grains which satisfy Bragg’s condition will contribute to diffraction. For example,grains with {20 0} planes perpendicular to loading direction will give {200}-diffractionpeaks into loading direction (Qk). Grains with the same planes {200} but oriented orthog-onally to the loading direction diffract neutrons into the transverse-direction (Q\) detec-tors. These two sets of grains are orthogonal to each other and have different Schmidtfactors where Schmidt factor is distinct to different slip system, and, hence, resulted in dif-ferent dislocation density in the grains with different orientations (Liu et al., 1998; Margu-lies et al., 2001; Hansen, 2001).
4.2. Lattice strain evolutions
Single-peak fitting was applied to study ‘‘lattice strain” evolution. The lattice strains ofthe monotonic-tension experiment, ehkl, are calculated from changes in the d-spacing, dhkl,at different applied loads with respect to the reference d-spacing, d0
hkl in Eq. (3). The ref-erence lattice spacing, d0
hkl, was determined from the measured lattice spacing before defor-mation (nominal tensile load of 0.099 MPa to ensure the sample did not sag in thehorizontal loading geometry):
ehkl ¼dhkl � d0
hkl
d0hkl
ð3Þ
The evolutions of the lattice strains of the monotonic-tension experiment showed thatthe response of the lattice strains in the elastic region of the applied load (region I inFig. 6a) followed Hooke’s relationship, and the stiffness of {111} plane is the largest,{200} is the least, and {22 0} and {311} are in between. Similar trends were observed dur-ing in-situ neutron-diffraction measurements on a face-centered cubic (FCC) stainless steelby Daymond et al. (1997). For the low-cycle-fatigue experiments, the lattice strains, ehkl,are calculated in the same fashion as the monotonic-tension experiment at different fatiguecycles with respect to that of the reference d-spacing, d0
hkl. The reference lattice spacing,d0
hkl, was determined from the measured lattice spacing before the cyclic-loading. A similarresponse was observed (Huang et al., 2007) from low-cycle-fatigue experiment althoughthe whole measurements were conducted at a 1% engineering strain. Lattice strainsincreased as the cyclic hardening continued until an apex stress at 600 MPa where thestress began to decrease as softening starts to take place, and, hence, the lattice strainsdecreased.
To clarify the effects of the plastic deformation from two experiments, the elastic por-tion of the lattice strains were subtracted from the lattice strains as in Fig. 8a for low-cycle-fatigue tests and Fig. 8b for monotonic-tension experiments, respectively. The {111} and{200} of two different experiments have the comparable trends and levels while the {220}and {311} are not as alike. This difference may be caused by the texture formation duringmonotonic-tension experiments, which is in agreement with our XRD results (Fig. 4).More details of the strain-related texture formation have been reported (Miller et al.,

(a) Low-cycle-fatigue (b) Monotonic-tension
1,500th 500th250th100th50th
30th
12th8th
4th
Stra
in ( μμ μμ
e) 1st
400 450 500 550 600-1000
-500
0
500
1000 111 200 220 311
Stra
in ( μμ μμ
e)
Stress (MPa)400 450 500 550 600
-1000
500
0
500
000
Stress (MPa)
Fig. 8. Intergranular strains as a function of true stress in the same stress levels (the elastic portion of the latticestrains were subtracted from the measured lattice strains) of (a) low-cycle-fatigue experiments at Measurement 1(fatigue cycles are marked along peak 200) and (b) monotonic-tension experiments.
E-Wen Huang et al. / International Journal of Plasticity 24 (2008) 1440–1456 1451
2005; Bernier and Miller, 2006). From current study, the evolutions of lattice strain duringboth cyclic-loading (up to 100th cycle) and tension experiment (Stage II) reached similarvalues at the same true stress levels, which suggests further study. Since the true stress levelof the Stage III of monotonic tension experiments was beyond that of the low-cycle-fatigueexperiments, more research is needed to discover the different failure mechanisms.
5. Discussions
For monotonic experiments, the dislocation density is a good reference for the deforma-tion process. The onset of Stage II is very close to the 0.2% yield strength, which supportsthe dislocation density calculation (Fig. 6a). The peak-broadening indicates intensive plas-tic deformation which resulted from an increase of the dislocation density. The inversebehavior between dislocation density (Fig. 6a) and dislocation-wall spacing (Fig. 6b) asa function of stress are similar to the observations of Hansen (2001 and 2005). Whenthe dislocation density as a function of the stress starts to transit to Stage III, there is aslowdown in the rate of the dislocation density multiplication in both directions. More-over, it saturates in Q\ direction (Fig. 6a) around 700 MPa, which indicates that the mul-tiplication of dislocation density decelerates. However, the dislocation-wall spacingsdecrease at the same rate in both Stages II and III, which indicates that the dislocationspile-up as stress increases and self-organize as a function of the stress. A similar statementhas been proposed by Kuhlmann-Wilsdorf’s TEM works (1962 and 1999), which suggeststhat the character of the dislocation distribution remains unchanged, and only the scale ofthe distribution changes. With further deformation, beyond Stage II, the number of freedislocations within the cells gradually keeps steady to the point where glide dislocationsmay move relatively unhindered from one cell wall to other cell walls (Kuhlmann-Wils-dorf, 1962, 1999).
For the low-cycle-fatigue experiments, since the cyclic hardening starts around400 MPa and is about to end at the 100th fatigue cycle around 600 MPa, the peak widthsbroaden accordingly, and, then, the widths reduce, with the cyclic softening. The calcu-
1452 E-Wen Huang et al. / International Journal of Plasticity 24 (2008) 1440–1456
lated dislocation density is shown in Fig. 7a. The dislocation density of the monotonic-ten-sion experiments under same true stress region is shown in Fig. 6a for comparison.
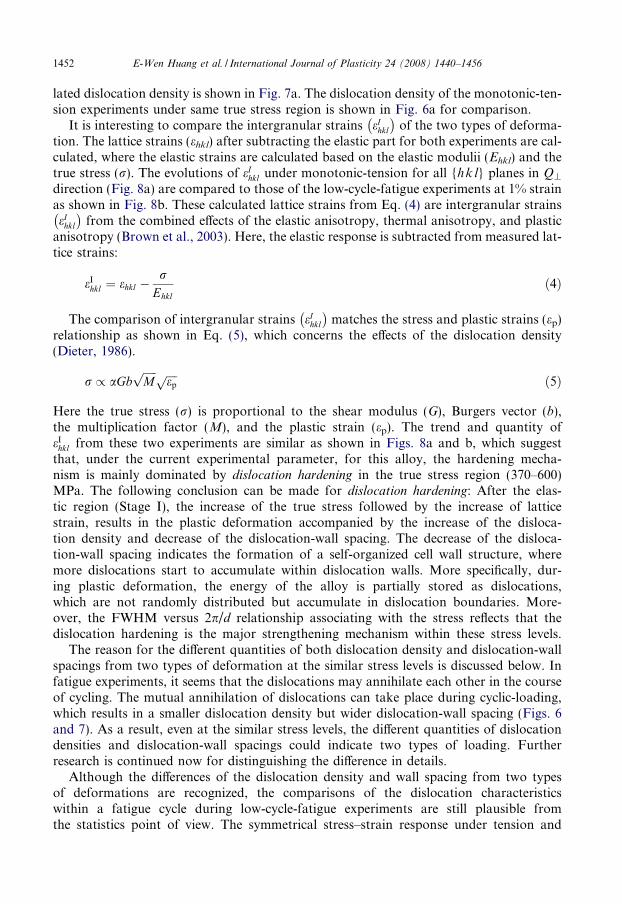
It is interesting to compare the intergranular strains eIhkl
� �of the two types of deforma-
tion. The lattice strains (ehkl) after subtracting the elastic part for both experiments are cal-culated, where the elastic strains are calculated based on the elastic modulii (Ehkl) and thetrue stress (r). The evolutions of eI
hkl under monotonic-tension for all {hk l} planes in Q\
direction (Fig. 8a) are compared to those of the low-cycle-fatigue experiments at 1% strainas shown in Fig. 8b. These calculated lattice strains from Eq. (4) are intergranular strainseI
hkl
� �from the combined effects of the elastic anisotropy, thermal anisotropy, and plastic
anisotropy (Brown et al., 2003). Here, the elastic response is subtracted from measured lat-tice strains:
eIhkl ¼ ehkl �
rEhkl
ð4Þ
The comparison of intergranular strains eIhkl
� �matches the stress and plastic strains (ep)
relationship as shown in Eq. (5), which concerns the effects of the dislocation density(Dieter, 1986).
r / aGbffiffiffiffiffiMp ffiffiffiffi
epp ð5Þ
Here the true stress (r) is proportional to the shear modulus (G), Burgers vector (b),the multiplication factor (M), and the plastic strain (ep). The trend and quantity ofeI
hkl from these two experiments are similar as shown in Figs. 8a and b, which suggestthat, under the current experimental parameter, for this alloy, the hardening mecha-nism is mainly dominated by dislocation hardening in the true stress region (370–600)MPa. The following conclusion can be made for dislocation hardening: After the elas-tic region (Stage I), the increase of the true stress followed by the increase of latticestrain, results in the plastic deformation accompanied by the increase of the disloca-tion density and decrease of the dislocation-wall spacing. The decrease of the disloca-tion-wall spacing indicates the formation of a self-organized cell wall structure, wheremore dislocations start to accumulate within dislocation walls. More specifically, dur-ing plastic deformation, the energy of the alloy is partially stored as dislocations,which are not randomly distributed but accumulate in dislocation boundaries. More-over, the FWHM versus 2p/d relationship associating with the stress reflects that thedislocation hardening is the major strengthening mechanism within these stress levels.
The reason for the different quantities of both dislocation density and dislocation-wallspacings from two types of deformation at the similar stress levels is discussed below. Infatigue experiments, it seems that the dislocations may annihilate each other in the courseof cycling. The mutual annihilation of dislocations can take place during cyclic-loading,which results in a smaller dislocation density but wider dislocation-wall spacing (Figs. 6and 7). As a result, even at the similar stress levels, the different quantities of dislocationdensities and dislocation-wall spacings could indicate two types of loading. Furtherresearch is continued now for distinguishing the difference in details.
Although the differences of the dislocation density and wall spacing from two typesof deformations are recognized, the comparisons of the dislocation characteristicswithin a fatigue cycle during low-cycle-fatigue experiments are still plausible fromthe statistics point of view. The symmetrical stress–strain response under tension and

E-Wen Huang et al. / International Journal of Plasticity 24 (2008) 1440–1456 1453
compression in the 1st fatigue cycle (Fig. 3a) for the low-cycle-fatigue experiments is inagreement with earlier observations of Mughrabi (1983) and Ungar et al. (1993).
For the dislocation characteristics from the low-cycle-fatigue experiments, the evolutionof the dislocation density and dislocation-wall spacing are shown in Figs. 9a and b, respec-tively. Seven measurements within one fatigue cycle are presented to address Guinier andJulien (1989) question of the atomic mechanisms during fatigue deformation. At the 1stcycle, the Measurements 1, 4, and 7 have the higher dislocation density than the othermeasurements, which are in proportion to their stress. And the Measurement 7 has ahigher dislocation density than that of the Measurement 1, which shows the dislocationhardening even within the 1st cycle. However, at the 100th fatigue cycle, where the cyclicsoftening was about to occur, the dislocation density decreases from Measurements 1–7within one fatigue cycle. A relative little decreasing of dislocation density of the 1500thcycle in Fig. 9a agrees with the very little cyclic softening, as shown in Fig. 3b. The com-parisons of the dislocation density at the seven measurements for three different fatiguecycles are shown in Fig. 9a. Although the same engineering strains/stresses were controlledfor the 1st, 100th, and 1500th fatigue cycles during the measurements, the observed dislo-cation density within the 1st cycle is several times less than that of the 100th and the 1500thcycles, which shows the accumulation of the dislocation density during the cyclic harden-ing. Fig. 9b shows the dislocation-wall spacing. The dash line and larger legend size inFig. 9b are used for the 1st fatigue cycle, where the calculated values are greater than1500 nm (similar to Figs. 6b and 7b). The evolutions of dislocation-wall spacing inFig. 9b shows the reverse trends where the spacing decreased during cyclic deformationafter the 100th and 1500th cycles. The similar inverse relationship between dislocationdensity and dislocation-wall spacing was reported by Hansen (2001 and 2005).
Low-cycle-fatigue experiments
(a) Dislocation density (b) Dislocation walls spacing
1 2 3 4 5 6 7
4000000
8000000
12000000
16000000
20000000 Q_ direction 1st cycle 100th cycle1,500th cycle
Measurements (Point)
Dis
loca
tion
dens
ity (c
m-2)
1 2 3 4 5 6 715002000250030003500400045005000 Q direction
1st cycle
100th cycle
1,500th cycle
Dis
loca
tion
spac
ings
(nm
)
Measurements (Point)
-0.01 0.00 0.01
Stre
ss (M
Pa)
Fatigue hystersis loop within 1 cycle
Macroscopic Strain (e)
Measurements
0
1&7
2
3
4
5
6
-0.01 0.00 0.01
Stre
ss (M
Pa)
Fatigue hystersis loop within 1 cycle
Macroscopic Strain (e)
Measurements
0
1&7
2
3
4
5
6
Fig. 9. (a) The dislocation density and (b) the dislocation-wall spacing evolutions within one fatigue cycle at 1st(black), 100th (red), and 1500th fatigue cycles in Q\ direction. The conditions of seven measurements are shownin Fig. 3a as the insert.

1454 E-Wen Huang et al. / International Journal of Plasticity 24 (2008) 1440–1456
Within one fatigue cycle, the dislocation-wall spacings of Measurements 1 (maxi-mum tension strain), 4 (maximum compression strain), and 7 (maximum tensionstrain) were smaller than those of the other measurements, which were the inversetrends of the dislocation density as shown in Fig. 9a. The inverse relationship dem-onstrates that, while the dislocation density increased under the cyclic effects in themost strained/compressed status, the accumulation of the dislocation density and theirrearrangement shortened the dislocation-wall spacing. The natural exception is the 1stmeasurement of the 1st fatigue cycle, where the monotonic-tension was just appliedfrom 0 MPa to 1% engineering strain, but the cyclic deformation did not start yet.The variation between different measurements gradually decreases as the number offatigue cycles increased. It seems that as the fatigue cycles increases within 1500cycles, dislocation-wall spacing between dislocation multiplication and annihilationgradually reaches an equilibrium.
6. Summary
In-situ neutron-diffraction results were refined by GSAS. The pseudo-Voigt functionwas applied to distinguish between Gaussian and Lorentzian peak components. The den-sity of dislocations and the average distance between dislocation walls were calculatedaccordingly to characterize the bulk response during the plastic deformation. Hence, theneutron-diffraction profiles were used to characterize the dislocation distributions. For thisalloy, there was practically no accumulation of dislocations in the elastic region (Stage I).Within 370–600 MPa, the dislocation hardening was the major strengthening mechanismof the monotonic-tension and low-cycle-fatigue experiments. The dislocation density andthe dislocation-wall spacing evolved accordingly within one fatigue cycle. Above 750 MPa,the dislocation-wall spacing evolved differently with dislocation density because themechanical properties of dislocations within the walls are stiffer than those inside the cells,as described by Mughrabi’s composite model. The same analysis method is applied tostudy the cyclically-deformed alloy. Different quantities of the dislocation density and dis-location-wall spacings demonstrate the ability of the diffraction profiles to distinguish dif-ferent types of loading at similar applied loads. For low-cycle-fatigue experiments, thecalculated dislocation density and dislocation-wall spacing are promising indicators forcharacterizing the cyclical hardening and early softening phenomena within 1500 fatiguecycles of the alloy.
Acknowledgements
This research is supported by the National Science Foundation (NSF), InternationalMaterials Institutes (IMI) Program (DMR-0231320). Dr. Carmen Huber is the Directorof the IMI program. Research (R.B. and G.I.) sponsored by the Division of Materials Sci-ence and Engineering, Office of Basic Energy Science, US Department of Energy, underContract DE-AC05-00OR22725 with UT-Battelle, LLC. The Lujan Neutron ScatteringCenter at LANSCE is funded by the Department of Energy’s Office of Basic Energy Sci-ence. The Los Alamos National Laboratory is operated by the Los Alamos National Secu-rity LLC under the DOE Contract DE-AC52-06NA25396. Use of the Advanced PhotonSource was supported by the US Department of Energy, Office of Science, Office of BasicEnergy Science, under Contract No. DE-AC02-CH11357.

E-Wen Huang et al. / International Journal of Plasticity 24 (2008) 1440–1456 1455
References
Balzar, D., Audebrand, N., Daymond, M.R., Fitch, A., Hewat, A., Langford, J.I., Le Bail, A., Louer, D.,
Masson, O., McCowan, C.N., Popa, N.C., Stephens, P.W., Toby, B.H., 2004. Size-strain line-broadening
analysis of the ceria round-robin sample. J. Appl. Cryst. 37, 911–924.
Barabash, R.I., 2001. X-ray and neutron scattering by different dislocation ensembles. Mater. Sci. Eng. A, 49–54.
Barabash, R.I., Ice, G.E., Walker, F., 2003. Quantitative microdiffraction from deformed crystals with unpaired
dislocations and dislocation walls. J. Appl. Phys. 93 (3), 1457–1464.
Benson, M.L., Liaw, P.K., Saleh, T.A., Choo, H., Brown, D.W., Daymond, M.R., Huang, E.-W., Wang, X.-L.,
Stoica, A.D., Buchanan, R.A., Klarstrom, D.L., 2006. Deformation-induced phase development in a cobalt-
based superalloy during monotonic and cyclic deformation. Physica B, 523–525.
Bernier, J.V., Miller, M.P., 2006. A direct method for determination of the mean orientation-dependent elastic
strains and stresses in polycrystalline materials from strain pole figures. J. Appl. Crystallogr. 39, 358–368.
Bourke, M.A.M., Dunand, D.C., Ustundag, E., 2002. SMARTS – a spectrometer for strain measurement in
engineering materials. Appl. Phys. A 74, 1707–1709.
Brown, D.W., Bourke, M.A.M., Clausen, B., Holden, T.M., Tome, C.N., Varma, R., 2003. A neutron diffraction
and modeling study of uniaxial deformation in polycrystalline beryllium. Metall. Mater. Trans. A 34, 1439–
1449.
Daymond, M.R., Bourke, M.A.M., Von Dreele, R.B., Clausen, B., Lorentzen, T., 1997. Use Rietveld refinement
for elastic macrostrain determination and for evaluation of plastic strain history from diffraction spectra. J.
Appl. Phys. 82 (4), 1554–1562.
Dieter, G.E., 1986. Mechanical Metallurgy, third ed. McGraw-Hill, New York, pp. 103–324.
Guinier, A., Julien, R., 1989. The Solid State from Superconductors to Superalloys. Oxford Science Publications,
New York, pp. 190–241.
Hansen, N., 2001. New discoveries in deformed metals. Metall. Mater. Trans. A 32, 2917–2935.
Hansen, N., 2005. Boundary strengthening over five length scales. Adv. Eng. Mater. A 32, 2917–2935.
Hirsch, P.B., Whelan, M.J., 1960. A kinematical theory of diffraction contrast of electron transmission
microscope images of dislocations and other defects. Philos. Trans. R. Soc. Lond. Ser. A 252, 499–529.
Howie, A., Whelan, M.J., 1962. Diffraction contrast of electron microscope images of crystal lattice defects. III.
Results and experimental confirmation of the dynamical theory of dislocation image contrast. Proc. R. Soc.
Lond. Ser. A 267, 206–230.
Huang, E-W., Clausen, B., Wang, Y.D., Choo, H., Liaw, P.K., Benson, M.L., Pike, L.M., Klarstrom, D.L., 2007.
A neutron-diffraction study of the low-cycle fatigue behavior of Hastelloy C-22HSTM alloy. Int. J. Fatigue 29,
1812–1819.
Ice, G.E., Barabash, R.I., 2007. White beam microdiffraction and dislocations gradients, in series. Dislocat. Solid
13 (79), 500–601.
Jakobsen, B., Lienert, U., Almer, J., Shastri, S.D., Sorensen, H.O., Gundlach, C., Pantleon, W., 2006. Formation
and subdivision of deformation structures during plastic deformation. Science 312, 889–892.
Kuhlmann-Wilsdorf, D., 1962. A new theory of work hardening. Trans. Met. Soc. AIME 224, 1047–1062.
Kuhlmann-Wilsdorf, D., 1999. The theory of dislocation-based crystal plasticity. Philos. Mag. A 79 (4), 955–
1008.
Levine, L.E., Larson, B.C., Yang, W., Kassner, M.E., Tischler, J.Z., Delos-Reyes, M.A., Fields, R.J., Liu, W.,
2006. X-ray microdiffraction measurements of individual dislocation cell elastic strains in deformed single-
crystal copper. Nat. Mater. 5, 619–622.
Liu, Q., Jensen, D.J., Hansen, N., 1998. Effect of grain orientation on deformation structure in cold-rolled
polycrystalline aluminum. Acta Mater. 46, 5819–5838.
Lu, Y.L., Pike, L.M., Brooks, C.R., Liaw, P.K., Klarstrom, D.L., 2007. Strengthening domains in a Ni–21Cr–
17Mo alloy. Scripta Mater. 56, 121–124.
Margulies, L., Winther, G., Poulsen, H.F., 2001. In situ measurement of grain rotation during deformation of
polycrystals. Science 291, 2392–2394.
Miller, M.P., Bernier, J.V., Park, J.-S., Kazimirov, 2005. Experimental measurement of lattice strain pole figures
using synchrotron X-rays. Rev. Sci. Instrum. 76, 113903.
Mughrabi, H., 1983. Dislocation wall and cell structures and long-range internal stresses in deformed metal
crystals. Acta Metall. 31 (9), 1367–1379.
Rietveld, H.M., 1967. Line profiles of neutron powder-diffraction peaks for structure refinement. Acta Cryst. 22,
151.

1456 E-Wen Huang et al. / International Journal of Plasticity 24 (2008) 1440–1456
Stephens, P.W., 1999. Phenomenological model of anisotropic peak broadening in powder diffraction. J. Appl.
Cryst. 32, 281–289.
Sun, Y., Barabash, R.I., Choo, H., Liaw, P.K., Lu, Y., Brown, D.W., Ice, G.E., 2007. Multiscale plastic
deformation near a fatigue crack from diffraction. Solid State Phenom. 129, 151–156.
Turkmen, H.S., Dawson, P.R., Miller, M.P., 2002. The evolution of crystalline stresses of a polycrystalline metal
during cyclic loading. Int. J. Plasticity 18, 941–969.
Ungar, T., Biermann, H., Mughrabi, H., 1993. Dislocation distributions as seen by X-ray line profiles. Mater. Sci.
Eng. A 164, 175–179.
Ungar, T., Dragomir, I., Revesz, A., Borbely, A., 1999. The contrast factors of dislocations in cubic crystals: the
dislocation model of strain anisotropy in practice. J. Appl. Cryst. 32, 992–1002.
Valiev, R.Z., Islamgaliev, R.K., Alexandrov, I.V., 2000. Bulk nanostructured materials from severe plastic
deformation. Prog. Mater. Sci. 45, 103–189.
Von Dreele, R.B., Jorgensen, J.D., Windsor, C.G., 1982. Rietveld refinement with spallation neutron powder
diffraction data. J. Appl. Cryst. 15, 581–589.
Von Dreele, R.B., 2004. General structure analysis system. Los Alamos National Laboratory Report LAUR 86-
748, pp. 160–165.
Wang, Y.-D., Tian, H., Stoica, A.D., Wang, X.-L., Liaw, P.K., Richardson, J.W., 2003. The development of
grain-orientation-dependent residual stresses in a cyclically deformed alloy. Nature Mater. 2, 101–106.
Wenk, H.R., Grigull, S., 2003. Synchrotron texture analysis with area detectors. J. Appl. Cryst. 36, 1040–1049.