
Araguaia Nickel Project FS - Horizonte Minerals
342
Horizonte Minerals Plc Amended NI 43-101 Technical Report Feasibility Study for the Araguaia Nickel Project Federative Republic of Brazil Project Number AU9867 November 2018
-
Upload
khangminh22 -
Category
Documents
-
view
0 -
download
0
Transcript of Araguaia Nickel Project FS - Horizonte Minerals

Horizonte Minerals Plc
Amended NI 43-101 Technical Report
Feasibility Study for the Araguaia Nickel Project
Federative Republic of Brazil
Project Number AU9867
November 2018
Horizonte Minerals Plc Araguaia Nickel Project Technical Report
Final November 2018 Page 2 of 342
OFFICE LOCATIONS
Perth
Level 6, 130 Stirling Street Perth WA 6000 AUSTRALIA
Tel: +61 8 9213 9213 ABN: 99 085 319 562 [email protected]
Brisbane
22 Cordelia Street South Brisbane QLD 4101 AUSTRALIA
Tel: +61 7 3026 6666 ABN: 99 085 319 562 [email protected]
Johannesburg
Technology House, Greenacres Office Park, Cnr. Victory and Rustenburg Roads, Victory Park Johannesburg 2195 SOUTH AFRICA
PO Box 2613, Parklands 2121 SOUTH AFRICA
Tel: +27 11 782 2379 Fax: +27 11 782 2396 Reg. No. 1998/023556/07 [email protected]
Website
www.snowdengroup.com
This report was prepared as a National Instrument 43-101 Technical Report, in accordance with Form 43-101F1, for Horizonte Minerals Plc by Snowden Mining Industry Consultants (Snowden). The quality of information, conclusions, and estimates contained herein is consistent with the level of effort involved in Snowden’s services, based on: (i) information available at the time of preparation; (ii) data supplied by outside sources; and (iii) the assumptions, conditions, and qualifications set forth in this report.
This report is intended to be used Horizonte Minerals Plc, subject to the terms and conditions of its contract with Snowden. That contract permits Horizonte Minerals Plc to file this report as a Technical Report with Canadian Securities Regulatory Authorities pursuant to provincial securities legislation. Except for the purposes legislated under provincial securities law, any other use of this report by any third party is at that party’s sole risk.
© 2021
Qualified Persons: Frank Blanchfield
B.Eng, FAusIMM
Andrew Ross
BSc (Hons), MSc, FAusIMM
Matheus Palmieri
BSc, MSc, MAusIMM CP(Geo)
Nicholas Adrian Barcza
BSc (Eng.), MSc (Eng.), PhD, Pr.Eng. (ECSA), HLFSAIMM
David Haughton
BSc (Met), CEng., MIOM3
Robin Kalanchey
BASc (Metals and Materials Eng), P.Eng.
Issued by: Perth Office
Number of copies
Snowden: 2 Horizonte Minerals Plc: 2

Horizonte Minerals Plc Araguaia Nickel Project Technical Report
Final November 2018 Page 3 of 342
Table of Contents
1 SUMMARY .......................................................................................................................... 18
1.1 Introduction ......................................................................................................................... 18
1.1 Property ownership and permitting .................................................................................... 18
1.2 Accessibility, infrastructure and physiography ................................................................... 19
1.3 Geology .............................................................................................................................. 21
1.4 Mineral Resource estimation ............................................................................................. 22
1.5 Mineral Reserve estimation ............................................................................................... 24
1.6 Mining ................................................................................................................................. 24
1.6.1 Mining method ............................................................................................................ 24
1.6.2 Mine design ................................................................................................................ 24
1.6.3 Mining geotechnical ................................................................................................... 25
1.6.4 Mine production schedules ........................................................................................ 25
1.7 Recovery methods ............................................................................................................. 25
1.8 Metallurgical testwork and process development .............................................................. 26
1.9 Environmental and social ................................................................................................... 26
1.9.1 Environmental ............................................................................................................ 26
1.9.2 Social .......................................................................................................................... 27
1.10 Infrastructure ...................................................................................................................... 28
1.10.1 Water cooling dam and pumping ............................................................................... 28
1.10.2 Water pipeline ............................................................................................................ 28
1.10.3 Slag storage facility .................................................................................................... 28
1.10.4 Road works ................................................................................................................ 28
1.10.5 Energy supply system ................................................................................................ 28
1.11 Project implementation and schedule ................................................................................ 30
1.12 Capital expenditure (capex) estimate ................................................................................ 30
1.13 Operating expenditure (opex) estimate ............................................................................. 31
1.14 Market studies .................................................................................................................... 31
1.14.1 Nickel market outlook and pricing .............................................................................. 31
1.14.2 Stainless steel demand .............................................................................................. 32
1.14.3 Nickel demand from Electric Vehicles (EV) ............................................................... 32
1.15 Financial analysis ............................................................................................................... 32
1.16 Recommendations and conclusions .................................................................................. 33
1.16.1 Conclusions ................................................................................................................ 33
1.16.2 Recommendations ..................................................................................................... 33
1.17 Summary of the project risks ............................................................................................. 34
1.17.1 Process and metallurgy – “high” risks ........................................................................ 34
1.17.2 Supply chain ............................................................................................................... 34
1.17.3 Social and environment .............................................................................................. 34

Horizonte Minerals Plc Araguaia Nickel Project Technical Report
Final November 2018 Page 4 of 342
1.17.4 Tenure and licensing .................................................................................................. 34
1.17.5 Outcome of the risk workshop.................................................................................... 35
1.18 Opportunities ...................................................................................................................... 35
1.18.1 Opportunities to improve the value of the FS case .................................................... 35
1.18.2 Increased plant capacity ............................................................................................ 36
1.18.3 Utilisation of the Limonite Resource........................................................................... 36
2 INTRODUCTION ................................................................................................................. 37
2.1 Overview ............................................................................................................................ 37
2.2 Issuer – Horizonte Minerals Plc (HZM) .............................................................................. 38
2.3 References ......................................................................................................................... 39
3 RELIANCE ON OTHER EXPERTS ..................................................................................... 40
4 PROPERTY DESCRIPTION AND LOCATION .................................................................... 41
4.1 Introduction ......................................................................................................................... 41
4.2 Location .............................................................................................................................. 41
4.3 Licences and tenure ........................................................................................................... 42
4.3.1 Mining legislation overview ........................................................................................ 42
4.3.2 Licensing details ......................................................................................................... 44
4.4 Agreements and encumbrances ........................................................................................ 46
4.5 Environmental obligations .................................................................................................. 46
4.5.1 Authorisations required for environmental licensing .................................................. 47
5 ACCESSIBILITY, CLIMATE, LOCAL RESOURCES, INFRASTRUCTURE AND PHYSIOGRAPHY ................................................................................................................ 51
5.1 Access ................................................................................................................................ 51
5.2 Proximity to population centres and transport ................................................................... 51
5.3 Climate and length of operating season ............................................................................ 53
5.4 Surface rights ..................................................................................................................... 54
5.5 Infrastructure ...................................................................................................................... 54
5.5.1 Power ......................................................................................................................... 54
5.5.2 Roads ......................................................................................................................... 54
5.5.3 Rail ............................................................................................................................. 55
5.5.4 Ports ........................................................................................................................... 55
5.5.5 Water .......................................................................................................................... 55
5.5.6 Mining personnel ........................................................................................................ 56
5.5.7 Slag and waste dumps ............................................................................................... 56
5.5.8 Communications ........................................................................................................ 56
5.6 Physiography ...................................................................................................................... 56
6 HISTORY ............................................................................................................................. 59
6.1 Prior ownership .................................................................................................................. 59
6.2 ANS – historical exploration work undertaken ................................................................... 59
6.2.1 Introduction ................................................................................................................. 59
6.2.2 Lontra ......................................................................................................................... 61
6.2.3 Teck ............................................................................................................................ 61
6.2.4 Lara ............................................................................................................................ 63

Horizonte Minerals Plc Araguaia Nickel Project Technical Report
Final November 2018 Page 5 of 342
6.3 ANN – historical exploration work undertaken ................................................................... 63
6.3.1 Diamond drilling ......................................................................................................... 63
6.3.2 Reverse circulation drilling ......................................................................................... 65
6.3.3 Glencore ..................................................................................................................... 65
6.3.4 Historical Mineral Resource, Mineral Reserve estimates and production ................. 65
6.4 Other ................................................................................................................................... 65
7 GEOLOGICAL SETTING AND MINERALISATION ............................................................ 66
7.1 Regional geology................................................................................................................ 66
7.2 Project geology – ANS section .......................................................................................... 66
7.2.1 Lithologies .................................................................................................................. 68
7.2.2 Mineralogical studies .................................................................................................. 69
7.2.3 Deposit geology ......................................................................................................... 72
7.3 Project geology – ANN ....................................................................................................... 77
7.3.1 Lithologies .................................................................................................................. 79
7.3.2 Mineralogical studies .................................................................................................. 81
7.3.3 Deposit geology ......................................................................................................... 81
8 DEPOSIT TYPES ................................................................................................................ 84
9 EXPLORATION ................................................................................................................... 87
9.1 Lontra area surface exploration and mapping ................................................................... 87
9.2 ANN .................................................................................................................................... 87
10 DRILLING ............................................................................................................................ 89
10.1 ANS .................................................................................................................................... 89
10.1.1 Auger drilling .............................................................................................................. 89
10.1.2 Wide diameter auger drilling ...................................................................................... 91
10.1.3 Diamond core drilling ................................................................................................. 91
10.1.4 Procedures ................................................................................................................. 94
10.1.5 Geotechnical .............................................................................................................. 95
10.1.6 Qualified Person’s comment on drilling procedures................................................... 97
10.2 ANN .................................................................................................................................... 97
10.2.1 Diamond drilling ......................................................................................................... 97
10.2.2 Core logging procedures ............................................................................................ 99
10.2.3 Reverse circulation drilling ....................................................................................... 100
10.2.4 Geotechnical ............................................................................................................ 100
10.2.1 Qualified Person’s comment on drilling procedures................................................. 100
11 SAMPLE PREPARATION, ANALYSES, AND SECURITY ............................................... 101
11.1 ANS .................................................................................................................................. 101
11.1.1 Sample preparation methods and quality control (QC) measures ........................... 101
11.1.2 Sample splitting ........................................................................................................ 101
11.1.3 Security measures ................................................................................................... 102
11.1.4 Bulk density measurements ..................................................................................... 102
11.1.5 Phase 3 sample preparation and analysis ............................................................... 103
11.1.6 Results of Phase 3 quality assurance/quality control .............................................. 105
11.1.7 Phase 3 results – umpire assay analysis ................................................................. 106
11.1.8 Phase 4 sample preparation and analysis ............................................................... 107

Horizonte Minerals Plc Araguaia Nickel Project Technical Report
Final November 2018 Page 6 of 342
11.1.9 Results of Phase 4 quality assurance/quality control .............................................. 109
11.1.10 Phase 4 results – umpire assay analysis ................................................................. 110
11.1.11 Author’s opinion ....................................................................................................... 110
11.1.12 PQZ test pit quality assurance/quality control .......................................................... 111
11.2 ANN .................................................................................................................................. 115
11.2.1 Sample preparation methods and QC measures ..................................................... 115
11.2.2 Sample splitting ........................................................................................................ 116
11.2.3 Security measures ................................................................................................... 116
11.2.4 Bulk density measurements ..................................................................................... 116
11.2.5 Sample preparation and analysis ............................................................................. 118
11.2.6 Results of quality assurance/quality control ............................................................. 119
11.2.7 Results – VDS umpire analysis ................................................................................ 121
11.2.8 Author’s opinion ....................................................................................................... 121
12 DATA VERIFICATION ....................................................................................................... 122
12.1 ANS data verification ........................................................................................................ 122
12.1.1 Phase 3 data verification .......................................................................................... 122
12.1.2 Phase 4 data verification .......................................................................................... 122
12.1.3 Qualified Person’s opinion ....................................................................................... 123
12.2 ANN data verification ....................................................................................................... 123
12.2.1 Diamond drillholes .................................................................................................... 123
12.2.2 Drillhole collar survey check ..................................................................................... 124
12.2.3 Comparison of core logs with drill core .................................................................... 124
12.2.4 Comparison of digital and original core logs ............................................................ 124
12.2.5 HZM conclusions ...................................................................................................... 124
12.2.6 Qualified Person’s opinion ....................................................................................... 124
13 MINERAL PROCESSING AND METALLURGICAL TESTING.......................................... 125
13.1 Previous laboratory scale testwork .................................................................................. 125
13.1.1 ANS ore .................................................................................................................... 125
13.1.2 ANN ore .................................................................................................................... 125
13.1.3 Sample selection ...................................................................................................... 126
13.1.4 Results of laboratory testwork .................................................................................. 127
13.2 Pilot testing of ANS ore in the RKEF process .................................................................. 128
13.2.1 Drying and agglomeration pre-pilot tests ................................................................. 128
13.2.2 Integrated pilot RKEF testing ................................................................................... 132
13.3 Pilot testing of ANN ore .................................................................................................... 148
13.3.1 Direct current smelting pilot test ............................................................................... 149
13.3.2 Results of pilot testing of ANN ore ........................................................................... 151
13.4 Material property test ....................................................................................................... 152
13.4.1 Introduction and scope ............................................................................................. 152
13.4.1 Samples ................................................................................................................... 153
13.4.2 Methodology ............................................................................................................. 153
13.4.3 Results ..................................................................................................................... 154
13.4.4 Jenike & Johanson flow property test samples ........................................................ 157
13.5 Conclusions and recommendations ................................................................................. 159

Horizonte Minerals Plc Araguaia Nickel Project Technical Report
Final November 2018 Page 7 of 342
14 MINERAL RESOURCE ESTIMATES ................................................................................ 161
14.1 Summary .......................................................................................................................... 161
14.2 Method.............................................................................................................................. 161
14.3 Drillhole data .................................................................................................................... 163
14.4 Geological interpretation and horizon modelling ............................................................. 163
14.4.1 ANS .......................................................................................................................... 163
14.4.2 ANN .......................................................................................................................... 164
14.4.3 General ..................................................................................................................... 164
14.5 Compositing of assay intervals ........................................................................................ 164
14.6 Exploratory data analysis – summary statistics ............................................................... 164
14.7 Variography ...................................................................................................................... 165
14.8 Estimation ......................................................................................................................... 167
14.8.1 Block model definitions ............................................................................................ 167
14.8.2 Estimation method ................................................................................................... 168
14.8.3 Search parameters ................................................................................................... 168
14.8.4 Estimation settings summary ................................................................................... 168
14.8.5 Model validation ....................................................................................................... 169
14.9 Calculation of dry density ................................................................................................. 170
14.10 Mineral Resource classification ....................................................................................... 170
14.10.1 Mineral Resource classification scheme .................................................................. 170
14.10.2 Mineral Resource reporting ...................................................................................... 176
14.11 Other deposits within the Project area ............................................................................. 180
15 MINERAL RESERVE ESTIMATES ................................................................................... 182
15.1 Summary .......................................................................................................................... 182
15.2 Disclosure ......................................................................................................................... 183
15.3 Assumptions, methods and parameters .......................................................................... 183
16 MINING METHODS ........................................................................................................... 192
16.1 Geotechnical investigation ............................................................................................... 192
16.1.1 Hydrogeology ........................................................................................................... 192
16.1.2 Engineering geology ................................................................................................ 193
16.1.3 Groundwater............................................................................................................. 194
16.1.4 Geotechnical model ................................................................................................. 194
16.2 Slope stability ................................................................................................................... 195
16.2.1 Slope recommendations .......................................................................................... 195
16.2.2 Waste dump slope design ........................................................................................ 196
16.2.3 Trafficability .............................................................................................................. 196
16.2.4 Geotechnical review of proposed pit design ............................................................ 196
16.3 Mine method ..................................................................................................................... 197
16.3.1 Grade control............................................................................................................ 197
16.3.2 Clearing and stripping .............................................................................................. 198
16.3.3 Drill and blast............................................................................................................ 198
16.3.4 Excavation guidance ................................................................................................ 198
16.3.5 Excavation ................................................................................................................ 199
16.3.6 Trafficability .............................................................................................................. 201

Horizonte Minerals Plc Araguaia Nickel Project Technical Report
Final November 2018 Page 8 of 342
16.3.7 Tipping ...................................................................................................................... 202
16.3.8 Mine to mill strategy ................................................................................................. 202
16.3.9 Rehabilitation............................................................................................................ 205
16.3.10 Weather management .............................................................................................. 206
16.3.11 Water management .................................................................................................. 206
16.3.12 Slag rehandle ........................................................................................................... 207
16.4 Mine design ...................................................................................................................... 207
16.4.1 Methodology ............................................................................................................. 207
16.4.2 Mining model ............................................................................................................ 207
16.4.3 Pit optimisation ......................................................................................................... 209
16.4.4 Pit design .................................................................................................................. 210
16.4.5 Mining inventory ....................................................................................................... 215
16.4.6 Site layout ................................................................................................................. 216
16.5 Life of mine (LOM) schedule ............................................................................................ 221
16.5.1 Methodology ............................................................................................................. 221
16.5.2 Parameters and constraints ..................................................................................... 221
16.5.3 Schedule results ....................................................................................................... 223
16.6 Mining requirements ......................................................................................................... 227
16.6.1 Battery limits ............................................................................................................. 227
16.6.2 Operating philosophy ............................................................................................... 228
16.6.3 Rosters ..................................................................................................................... 228
16.6.4 Equipment ................................................................................................................ 228
16.6.5 Manning .................................................................................................................... 229
16.6.6 Consumables ........................................................................................................... 229
16.7 Mining cost estimation ...................................................................................................... 230
16.7.1 Contractor responses ............................................................................................... 230
16.8 Risks and opportunities .................................................................................................... 231
16.8.1 Risks ......................................................................................................................... 231
16.8.2 Opportunities ............................................................................................................ 232
17 RECOVERY METHODS .................................................................................................... 233
17.1 Introduction ....................................................................................................................... 233
17.2 Process selection ............................................................................................................. 235
17.3 Process description .......................................................................................................... 235
17.3.1 ROM ore reception ................................................................................................... 237
17.3.2 Ore crushing and homogenization ........................................................................... 237
17.3.3 Ore drying and tertiary crushing ............................................................................... 238
17.3.4 Calcining ................................................................................................................... 239
17.3.5 Smelting ................................................................................................................... 241
17.3.6 Slag tapping temperature and ferronickel grade ...................................................... 241
17.3.7 Smelting process description ................................................................................... 241
17.3.8 Ferronickel refining ................................................................................................... 244
17.3.9 Metal shotting and product conditioning .................................................................. 246
17.3.10 Auxiliary process installations .................................................................................. 247
17.3.11 Coal preparation ....................................................................................................... 247
17.3.12 Dust handling systems ............................................................................................. 248
17.3.13 Utilities 248
17.3.14 Söderberg electrode paste handling ........................................................................ 252

Horizonte Minerals Plc Araguaia Nickel Project Technical Report
Final November 2018 Page 9 of 342
17.3.15 Refinery reagents handling ...................................................................................... 252
17.3.16 Compressed air ........................................................................................................ 252
17.3.17 Oxygen and nitrogen ................................................................................................ 252
17.3.18 Laboratory ................................................................................................................ 253
17.4 Project and process design criteria (PDC) ....................................................................... 255
17.4.1 Definitions ................................................................................................................. 255
17.4.2 Project design criteria (PDC) .................................................................................... 256
17.5 Mass and energy balances .............................................................................................. 257
17.5.1 Summary mass balance ........................................................................................... 257
17.5.2 Information on the Metsim model ............................................................................. 258
17.6 Process plant geotechnical study .................................................................................... 259
17.6.1 General plant area geology ...................................................................................... 259
17.6.2 Test pit program ....................................................................................................... 259
17.6.3 Drilling program ........................................................................................................ 260
17.6.4 Completed field program .......................................................................................... 260
17.6.5 Plant site geotechnical conditions ............................................................................ 261
17.6.6 Near-surface earthworks .......................................................................................... 261
17.6.7 Plant geotechnical recommendations ...................................................................... 261
18 PROJECT INFRASTRUCTURE ........................................................................................ 263
18.1 Summary .......................................................................................................................... 263
18.2 Logistics solution for ANP ................................................................................................ 263
18.2.1 Ground transportation .............................................................................................. 264
18.2.2 Regional information ................................................................................................ 264
18.2.3 Roadworks for the Project ........................................................................................ 266
18.2.4 Ports for FeNi product shipment and inbound coal .................................................. 269
18.2.5 Supply chain synergy ............................................................................................... 271
18.3 Water supply .................................................................................................................... 271
18.4 Coal storage facility .......................................................................................................... 272
18.5 Slag repository ................................................................................................................. 272
18.6 Water cooling facility ........................................................................................................ 273
18.7 Other ................................................................................................................................. 274
18.8 Energy supply for the Project ........................................................................................... 274
19 MARKET STUDIES AND CONTRACTS ........................................................................... 277
19.1 Introduction ....................................................................................................................... 277
19.2 Sources of nickel supply .................................................................................................. 277
19.3 Global market for ferronickel ............................................................................................ 277
19.3.1 Ferronickel supply .................................................................................................... 277
19.3.2 Ferronickel consumption and ANP FeNi product ..................................................... 278
19.4 Ferronickel pricing ............................................................................................................ 279
19.5 Current and forecast nickel demand ................................................................................ 280
19.6 Substitution ....................................................................................................................... 282
19.7 Economic evaluation price and iron credit forecast ......................................................... 282
19.8 Outlook and conclusions .................................................................................................. 282

Horizonte Minerals Plc Araguaia Nickel Project Technical Report
Final November 2018 Page 10 of 342
19.9 Offtake agreements and other material contracts ........................................................... 283
20 ENVIRONMENTAL STUDIES, PERMITTING AND SOCIAL OR COMMUNITY IMPACT . 284
20.1 Permitting ......................................................................................................................... 284
20.1.1 Opex and capex estimates for permitting ................................................................ 285
20.2 Environmental studies ...................................................................................................... 287
20.2.1 Capex and opex ....................................................................................................... 289
20.3 Social considerations ....................................................................................................... 289
20.4 Conclusions ...................................................................................................................... 291
20.4.1 Permitting ................................................................................................................. 291
20.4.2 Environmental .......................................................................................................... 292
20.4.3 Social ........................................................................................................................ 293
21 CAPITAL AND OPERATING COSTS ............................................................................... 294
21.1 Cost estimation overview ................................................................................................. 294
21.2 Capital expenditure (capex) ............................................................................................. 294
21.2.1 Basis of estimate ...................................................................................................... 294
21.2.2 Capex estimate assumptions ................................................................................... 295
21.2.3 Capex estimate exclusions ...................................................................................... 296
21.2.4 Process plant capital cost ........................................................................................ 296
21.2.5 Mining capital ........................................................................................................... 296
21.2.6 Other capital ............................................................................................................. 297
21.2.7 Initial capital summary .............................................................................................. 297
21.2.8 Sustaining capital ..................................................................................................... 297
21.2.9 Basis of quantities .................................................................................................... 298
21.2.10 Customs duties and taxes ........................................................................................ 299
21.2.11 Owner costs ............................................................................................................. 300
21.2.12 Closure costs............................................................................................................ 300
21.2.13 Contingency ............................................................................................................. 300
21.3 Operating expenditure (opex) .......................................................................................... 301
21.3.1 Exclusions ................................................................................................................ 301
21.3.2 Physicals .................................................................................................................. 301
21.3.3 Labour ...................................................................................................................... 301
21.3.4 Mining opex .............................................................................................................. 304
21.3.5 Process plant opex ................................................................................................... 305
21.3.6 External contract costs (HZM) .................................................................................. 306
21.3.7 Environmental, social and permitting ....................................................................... 307
21.3.8 Miscellaneous and other general and administration............................................... 307
21.3.9 Opex summary ......................................................................................................... 307
21.3.10 Royalties ................................................................................................................... 307
21.3.11 Taxation .................................................................................................................... 308
22 ECONOMIC ANALYSIS .................................................................................................... 310
22.1 Project economic headline results ................................................................................... 310
22.2 General criteria ................................................................................................................. 310
22.3 Economic model inputs .................................................................................................... 311
22.4 Economic model results ................................................................................................... 312
22.5 Production and cashflow summary .................................................................................. 312
Horizonte Minerals Plc Araguaia Nickel Project Technical Report
Final November 2018 Page 11 of 342
22.6 Key performance indicators ............................................................................................. 313
22.7 Sensitivity analysis ........................................................................................................... 313
22.8 Breakeven analysis .......................................................................................................... 314
22.9 Conclusion and recommendations ................................................................................... 315
23 ADJACENT PROPERTIES ............................................................................................... 316
24 OTHER RELEVANT DATA AND INFORMATION ............................................................. 317
24.1 Implementation plan ......................................................................................................... 317
24.1.1 Strategy .................................................................................................................... 317
24.1.2 Project drivers .......................................................................................................... 317
24.1.3 General ..................................................................................................................... 317
24.1.4 Project schedule ....................................................................................................... 318
24.1.5 Recommendations ................................................................................................... 319
24.2 Other relevant information................................................................................................ 319
25 INTERPRETATION AND CONCLUSIONS ........................................................................ 320
25.1 Conclusions ...................................................................................................................... 320
25.1.1 Mineral Resources ................................................................................................... 321
25.1.2 Metallurgical testing and process design ................................................................. 321
25.1.3 Mineral Reserves ..................................................................................................... 321
25.1.4 Project economics .................................................................................................... 321
25.1.5 Hydrology ................................................................................................................. 321
25.1.6 Hydrogeology ........................................................................................................... 321
25.1.7 Acid rock drainage and geochemistry ...................................................................... 322
25.1.8 Infrastructure and logistics ....................................................................................... 322
25.1.9 Environment ............................................................................................................. 322
25.1.10 Social ........................................................................................................................ 322
25.1.11 Permitting ................................................................................................................. 323
25.2 Risks ................................................................................................................................. 323
25.2.1 Risk workshop .......................................................................................................... 323
25.2.2 Hazard identification (HAZID) .................................................................................. 325
25.3 Opportunities .................................................................................................................... 326
25.3.1 Opportunities to increase the value of the FS Base Case ....................................... 327
25.3.2 Addition of a second RKEF line (Stage 2 Expansion) ............................................. 328
25.3.3 Utilisation of the limonite resources at ANP ............................................................. 328
26 RECOMMENDATIONS ..................................................................................................... 329
26.1 Recommendations prior to commencing operations ....................................................... 329
26.1.1 Project implementation ............................................................................................. 329
26.1.2 Mine geotechnical .................................................................................................... 329
26.1.3 Mining ....................................................................................................................... 330
26.1.4 Metallurgy ................................................................................................................. 330
26.1.5 Hydrology ................................................................................................................. 330
26.1.6 Permitting ................................................................................................................. 330
26.1.7 Social ........................................................................................................................ 331
26.1.8 Environment ............................................................................................................. 331
26.1.9 Risk and safety ......................................................................................................... 332
26.2 Operational recommendations ......................................................................................... 332

Horizonte Minerals Plc Araguaia Nickel Project Technical Report
Final November 2018 Page 12 of 342
27 REFERENCES .................................................................................................................. 333
27.1 General, geology and mining (sections 4 to 12 and 14 to 16) ......................................... 333
27.2 Testwork and process plant methodology (Section 13 and 17) ...................................... 334
27.3 Infrastructure (Section 18)................................................................................................ 335
27.4 Environmental, social and permitting (Section 20) .......................................................... 335
28 CERTIFICATES OF QUALIFIED PERSONS ..................................................................... 337
Figures
Figure 1-1 ANP location, showing ANS and ANN with associated infrastructure and the CMD ........................20
Figure 1-2 ANP Project showing the ANS deposits in the southern part of the Project .....................................21
Figure 1-3 ANP infrastructure layout ..................................................................................................................29 Figure 4-1 Project location – infrastructure and other nickel laterite deposits ....................................................42
Figure 4-2 Project licence map ..........................................................................................................................45
Figure 5-1 Project location and regional infrastructure ......................................................................................52 Figure 5-2 Maximum and minimum mean temperature by month .....................................................................53
Figure 5-3 Monthly precipitation mean by month ...............................................................................................53
Figure 5-4 Average relative humidity by month (1961 to 2013) .........................................................................54
Figure 5-5 View to the southeast over Pequizeiro (main zone) .........................................................................57 Figure 5-6 View over the north part of Pequizeiro (main zone) ..........................................................................57
Figure 5-7 Typical physiography of ANN licence area .......................................................................................58
Figure 6-1 ANS target map ................................................................................................................................60 Figure 6-2 ANN target map ................................................................................................................................64
Figure 7-1 Regional geological map ..................................................................................................................67
Figure 7-2 Mineralogical distribution in the principal mineralised facies ............................................................70 Figure 7-3 Mineralogical distribution by size fraction in blended sample (HM_51T_49S) .................................71
Figure 7-4 Mineralogical distribution by size fraction in the composite sample .................................................72
Figure 7-5 Bedrock structural geology map of JAC, VOW, VOI and VOE .........................................................73
Figure 7-6 Bedrock structural geology map of PQZ deposit ..............................................................................74 Figure 7-7 Updated bedrock PQZ geology map after 2014 drill program ..........................................................75
Figure 7-8 Updated bedrock BAI geology map ..................................................................................................76
Figure 7-9 Ultramafic unit within the rupture zone and silica ridge ....................................................................77 Figure 7-10 Simplified geology of ANN and surrounding area .............................................................................78
Figure 7-11 Bedrock geology map of VDS ...........................................................................................................82
Figure 7-12 Schematic vertical section of Serra do Tapa and VDS deposits ......................................................83 Figure 8-1 Chemical trends in schematic nickel laterite profile ..........................................................................85
Figure 8-2 Schematic laterite profile for ANS section ........................................................................................85
Figure 8-3 Schematic laterite profile for the ANN deposits including VDS .........................................................86
Figure 9-1 ANS Lontra licences soil geochemistry ............................................................................................88 Figure 10-1 ANS Lontra licence drill location map ...............................................................................................90
Figure 10-2 Collar location map of ANS for drilling up to March 2014 .................................................................93
Figure 10-3 Location of geotechnical drillholes and pits at plant and slag dump sites ........................................96 Figure 10-4 Drillhole locations for VDS ................................................................................................................99
Figure 11-1 SMUGC drillholes ...........................................................................................................................112
Figure 11-2 SMU ID ...........................................................................................................................................112 Figure 13-1 Particle size distribution for dryer feed and product (Condition No. 3) ...........................................131
Figure 13-2 Granulometry of the calcine, dryer feed and product (Condition No. 2) .........................................131
Figure 13-3 Typical granulometry of the dryer feed and product .......................................................................135
Figure 13-4 Moisture of the feed and product during the campaign ..................................................................136 Figure 13-5 Dryer product storage showing two of the three piles .....................................................................136
Figure 13-6 Typical granulometry of the rotary kiln feed and calcine .................................................................139
Figure 13-7 Calcine product ...............................................................................................................................139 Figure 13-8 Residual carbon in the calcine throughout the campaign ...............................................................140

Horizonte Minerals Plc Araguaia Nickel Project Technical Report
Final November 2018 Page 13 of 342
Figure 13-9 The degree of pre-reduction of iron in calcine throughout the campaign .......................................141 Figure 13-10 Typical average temperatures recorded by thermocouples ............................................................141
Figure 13-11 Slag temperature distribution ..........................................................................................................144
Figure 13-12 SiO2/MgO in calcine and slag versus date ......................................................................................144
Figure 13-13 wt% Ni in slag vs. wt% Ni in FeNi – testwork figures and commercial operation data ...................145 Figure 13-14 Wt% Ni and wt% Fe in slag as obtained during the testwork vs. date ............................................147
Figure 13-15 Assay wt% for GS-B grain size fractions ........................................................................................154
Figure 13-16 Assay wt% for TransAP grain size fractions ...................................................................................154 Figure 14-1 PQZ – plan view of example simulation (realisation 1) at node scale – nickel ...............................172
Figure 14-2 PQZ – plan view of example simulation (realisation 1) at node scale – thickness .........................172
Figure 14-3 PQZ – plan view of simulation variability at parent cell scale – nickel ............................................173 Figure 14-4 PQZ – plan view of simulation variability at parent cell – thickness ................................................174
Figure 14-5 PQZ – plan view of simulation variability at quarterly production scale – nickel .............................174
Figure 14-6 PQZ – plan view of simulation variability at quarterly production – thickness ................................175
Figure 14-7 Grade tonnage curve for Measured and Indicated Mineral Resource ............................................180 Figure 16-1 Basic mapping on the trial pit (located within Pequizeiro), looking west-southwest .......................193
Figure 16-2 Araguaia laterite profile showing rock types ...................................................................................199
Figure 16-3 Mining model with ore types ...........................................................................................................208 Figure 16-4 Grade-tonnage curves ....................................................................................................................208
Figure 16-5 Ultimate pit stages – Pequizeiro .....................................................................................................211
Figure 16-6 Ultimate pit stages – Pequizeiro West ............................................................................................212 Figure 16-7 Ultimate pit stages – Baião .............................................................................................................212
Figure 16-8 Ultimate pit stages – Jacutinga .......................................................................................................213
Figure 16-9 Ultimate pit stages – Vila Oito .........................................................................................................213
Figure 16-10 Ultimate pit stages – Vila Oito West................................................................................................214 Figure 16-11 Ultimate pit stages – Vila Oito East.................................................................................................214
Figure 16-12 Ultimate pit stages – Vale dos Sonhos ...........................................................................................215
Figure 16-13 Planned site layout – Baião ............................................................................................................217 Figure 16-14 Planned site layout – Vila Oito West, Vila Oito and Vila Oito East .................................................218
Figure 16-15 Total ex-pit movement by deposit ...................................................................................................223
Figure 16-16 Total ex-pit movement by type ........................................................................................................224 Figure 16-17 Total ex-pit movement by rock type ................................................................................................224
Figure 16-18 Sheeting balance by stockpile ........................................................................................................225
Figure 16-19 Long term stockpile balance and movements by material type ......................................................225
Figure 16-20 Ore feed by rock type .....................................................................................................................226 Figure 16-21 Ore feed by Reserve classification .................................................................................................226
Figure 16-22 Nickel feed grade, including Fe, SiO2:MgO ratio and Al2O3 ............................................................227
Figure 17-1 Plant site location layout .................................................................................................................234 Figure 17-2 Process flow ...................................................................................................................................236
Figure 17-3 Schematic diagram of smelting flowsheet ......................................................................................244
Figure 17-4 Schematic diagram of the arrangement of the FeNi refining process .............................................246 Figure 17-5 Schematic diagram for FeNi conditioning and product delivery ......................................................247
Figure 18-1 Road to ports and local roads .........................................................................................................265
Figure 18-2 Proposed roadworks for the Project ...............................................................................................267
Figure 18-3 Route from ANP to Conceicão do Araguaia ...................................................................................268 Figure 18-4 Satellite image of the port at Vila do Conde ...................................................................................270
Figure 18-5 Coal supply chain ...........................................................................................................................270
Figure 18-6 FeNi logistics solution .....................................................................................................................271 Figure 18-7 Proposed pipeline route from the Arraias river to the water cooling dam .......................................272
Figure 18-8 Water cooling dam ..........................................................................................................................274
Figure 18-9 Xinguara-Araguaia powerline route ................................................................................................276 Figure 19-1 Share of FeNi and NPI on world total nickel production .................................................................278
Figure 19-2 Realised FeNi prices .......................................................................................................................280
Figure 19-3 World nickel demand driven by China supported by the rest of Asia .............................................281
Figure 19-4 Nickel consumption in non-stainless first uses – EV batteries important over long term ................282

Horizonte Minerals Plc Araguaia Nickel Project Technical Report
Final November 2018 Page 14 of 342
Figure 20-1 Timeline of approved and expected major licences for ANP ..........................................................285 Figure 20-2 The Three ‘Pillars’ of the ANP’s socio-economic programs for the region .....................................291
Figure 21-1 High level Project organogram for management ............................................................................302
Figure 22-1 Sensitivity to NPV8 for changes in various key inputs .....................................................................314
Figure 25-1 Pre-mitigation "High" risk areas ......................................................................................................323 Figure 25-2 Events by area, impact along with the number of mitigations identified .........................................326
Tables
Table 1-1 ANS major permit summary to construction-ready phase ................................................................19
Table 1-2 Mineral Resources for ANS and ANN as of February 2017 by material type (0.90% Ni cut-off) ......23
Table 1-3 Open pit Mineral Reserves reported at October 2018 ......................................................................24
Table 1-4 Summary of Project capex ................................................................................................................30 Table 1-5 Summary of opex ..............................................................................................................................31
Table 1-6 Financial key performance indicators (after taxation) .......................................................................32
Table 1-7 Higher than Medium post-mitigation risks .........................................................................................35 Table 1-8 Additional resource available for the Project ....................................................................................36
Table 2-1 Responsibilities of each co-author ....................................................................................................38
Table 3-1 Other parties relied upon to provide technical content and review ...................................................40 Table 4-1 Licences relevant to the Project ........................................................................................................46
Table 4-2 ANS Major Permit summary to construction-ready phase ................................................................48
Table 4-3 ANP permitting status .......................................................................................................................49
Table 4-4 Additional ancillary licences for the construction and operational phases ........................................50 Table 7-1 Maximum and average thickness of laterite horizons to 2013 ..........................................................69
Table 7-2 Average composition of major constituents per horizon for VDS .....................................................81
Table 10-1 Summary of resource delineation drilling by HZM and Teck ............................................................92 Table 10-2 Phase 3 and 4 resource delineation drilling news releases ..............................................................94
Table 10-3 Phase 3 geotechnical core and pit samples test summary ...............................................................95
Table 10-4 Phase 4 geotechnical core sample test summary ............................................................................96 Table 10-5 Phase 5 geotechnical core sample test summary ............................................................................96
Table 10-6 Phase 3 and 5 geotechnical pit sample test summary .....................................................................97
Table 10-7 Drilling contractor summary for VDS.................................................................................................97
Table 11-1 Average bulk densities, moisture content and chemistry for ANS ..................................................103 Table 11-2 Suite of constituents for method XRF79C and PHY01E .................................................................104
Table 11-3 Suite of constituents for method ME-XRF12u and lower detection limits .......................................107
Table 11-4 OREAS standards with recommended values for key elements ....................................................109 Table 11-5 Summary of QC samples used for Phase 4 drilling ........................................................................109
Table 11-6 Sample summary ............................................................................................................................111
Table 11-7 Control sample summary DDH-SMUGC samples ..........................................................................113 Table 11-8 Bulk density values and moisture content for VDS .........................................................................117
Table 11-9 Standards with recommended values for key elements .................................................................120
Table 13-1 Laboratory testwork undertaken on Araguaia ore samples ............................................................125
Table 13-2 Laboratory testwork undertaken on ANN ore samples ...................................................................125 Table 13-3 Analysis of ANN ore samples (drill core sample blends) ................................................................126
Table 13-4 Summary of results of laboratory scale testwork (ANS ore) ...........................................................127
Table 13-5 Summary of results of laboratory scale testwork (ANN ore) ...........................................................127 Table 13-6 Conditions used in dryer/agglomerator test ....................................................................................129
Table 13-7 Kiln operating conditions for the pre-test ........................................................................................130
Table 13-8 Results of drying-agglomeration for the three conditions ...............................................................130 Table 13-9 Pilot testwork sample – target and average kiln feed assays .........................................................133
Table 13-10 Chemical composition of the ore over four of the blending operations ...........................................134
Table 13-11 Adjustments to the kiln feed rate and coal additions during the campaign .....................................137
Table 13-12 Initial kiln operating parameters (target 25% Ni in FeNi) ................................................................137 Table 13-13 Analysis of composite of coal used .................................................................................................138

Horizonte Minerals Plc Araguaia Nickel Project Technical Report
Final November 2018 Page 15 of 342
Table 13-14 Average of measured kiln shell temperatures along kiln length .....................................................141 Table 13-15 Rotary kiln feed and product (physical measurements) ..................................................................142
Table 13-16 Starting charge (Phase 1) for the electric furnace ..........................................................................142
Table 13-17 Typical initial electric furnace operating parameters (target 25 wt% Ni) .........................................142
Table 13-18 Data for Phase 1 and Phase 2 operation of electric furnace ..........................................................143 Table 13-19 Average composition of the feed material for the calculations (dry basis) ......................................145
Table 13-20 Process input data for model ..........................................................................................................146
Table 13-21 Process output data ........................................................................................................................146 Table 13-22 Composition of FeNi metal .............................................................................................................147
Table 13-23 Facie abundance/chemistry, Serra do Tapa deposit ......................................................................149
Table 13-24 Serra do Tapa drill core sample blend ............................................................................................149 Table 13-25 Pilot smelting test results vs. process design criteria (PDC) ..........................................................150
Table 13-26 Slag and FeNi composition .............................................................................................................151
Table 13-27 FeNi and slag composition in pilot testing of ANN ore ....................................................................151
Table 13-28 Morro Azul and Mintek ore assays comparison to design ore assay for FS ...................................152 Table 13-29 Summary of the conditions at which tests were performed ............................................................153
Table 13-30 Sample moisture results .................................................................................................................155
Table 13-31 AI test results – GS sample ............................................................................................................155 Table 13-32 AI test results – TransAP sample ...................................................................................................155
Table 13-33 Classes of abrasive wear potential .................................................................................................155
Table 13-34 Specific weight – samples GS and TransAP ..................................................................................156 Table 13-35 Bond Impact Work Index – samples GS and TransAP ...................................................................156
Table 13-36 PLT results ......................................................................................................................................156
Table 13-37 PLT results – GS sample ................................................................................................................156
Table 13-38 PLT results – TransAP sample .......................................................................................................157 Table 13-39 Summary of the conditions at which tests were performed ............................................................158
Table 13-40 Bulk mass density – bulk material 1 (TransAP) ...............................................................................158
Table 13-41 Bulk density test results summary ..................................................................................................158 Table 13-42 Angle of repose results summary (degrees from horizontal) ..........................................................159
Table 14-1 Mineral Resource for ANS and ANN as at February 2017, by material type ..................................162
Table 14-2 Top cuts applied during grade estimation .......................................................................................165 Table 14-3 Variogram parameters for Ni ..........................................................................................................166
Table 14-4 Block model definitions ...................................................................................................................167
Table 14-5 Estimation parameters – VOW, VOI, VOE, JAC, PQW and BAI ....................................................168
Table 14-6 Estimation parameters – PQZ.........................................................................................................169 Table 14-7 Estimation parameters – VDS ........................................................................................................169
Table 14-8 Mineral Resource estimate reported at 0.90% Ni cut-off for 2017 ANS and ANN ..........................177
Table 14-9 Non-FS Mineral Resource estimates reported at 0.90% Ni cut-off .................................................181 Table 15-1 CIM Definitions 2014 and JORC 2012 terminology ........................................................................182
Table 15-2 Araguaia North and South Mineral Reserve Estimates, as at 30 November 2018 .........................182
Table 15-3 ANS and ANN JORC Code (2012), Table 1, Section 4 ..................................................................183 Table 16-1 Summary of geotechnical domains .................................................................................................195
Table 16-2 Results of all sections analysed with corresponding acceptance criteria .......................................196
Table 16-3 Sheeting thickness by material type ...............................................................................................201
Table 16-4 Mining areas ...................................................................................................................................202 Table 16-5 Grade targets ..................................................................................................................................203
Table 16-6 Proposed ore types .........................................................................................................................203
Table 16-7 Planning horizons ...........................................................................................................................204 Table 16-8 Marginal cut-off grade by deposit ...................................................................................................209
Table 16-9 Pit optimisation – selected shells ....................................................................................................210
Table 16-10 Pit design parameters by sector .....................................................................................................211 Table 16-11 Mining inventory by deposit ............................................................................................................216
Table 16-12 Dump design parameters ...............................................................................................................219
Table 16-13 Dump capacities by deposit ............................................................................................................219
Table 16-14 Haul road lengths and volumes ......................................................................................................220

Horizonte Minerals Plc Araguaia Nickel Project Technical Report
Final November 2018 Page 16 of 342
Table 16-15 Rehabilitation areas and topsoil volume totals ...............................................................................220 Table 16-16 Scheduling inventory by material types ..........................................................................................221
Table 16-17 Scheduled grade constraints ..........................................................................................................222
Table 16-18 Contractor primary and ancillary mining fleet .................................................................................229
Table 16-19 Estimated manning levels ...............................................................................................................229 Table 16-20 Estimated annual fuel requirement .................................................................................................229
Table 16-21 Summary of contractor responses, first 10 years of operation .......................................................231
Table 17-1 Key criteria of crushing and dust recycling (crushing circuit – 6,570 h/a) .......................................237 Table 17-2 Key drying parameters ....................................................................................................................238
Table 17-3 Tertiary crushing key parameters ...................................................................................................239
Table 17-4 Calcining – key criteria ....................................................................................................................240 Table 17-5 Estimated furnace metal and slag temperatures ............................................................................241
Table 17-6 Smelting key parameters ................................................................................................................243
Table 17-7 FeNi metal characteristics ..............................................................................................................245
Table 17-8 Key design characteristics of the refining furnace ..........................................................................245 Table 17-9 Metal shotting – key characteristics ................................................................................................246
Table 17-10 Metal conditioning – key characteristics .........................................................................................247
Table 17-11 Coal preparation – key tonnage amounts .......................................................................................247 Table 17-12 Laboratory samples to be prepared and analysed .........................................................................253
Table 17-13 Sample preparation equipment required ........................................................................................254
Table 17-14 Laboratory equipment required .......................................................................................................254 Table 17-15 Process design criteria (PDC).........................................................................................................256
Table 17-16 Mass and nickel balance for the nominal ROM average ore grade ................................................257
Table 18-1 Tabulated distances ........................................................................................................................266
Table 18-2 Inbound and outbound volumes expected at for the ANP ..............................................................266 Table 18-3 Project road upgrade distances and cost estimate .........................................................................269
Table 18-4 Estimated electrical load – installed capacity and estimated consumption ....................................274
Table 20-1 Capex estimates for permitting .......................................................................................................286 Table 20-2 Environmental PCAs .......................................................................................................................288
Table 20-3 Summary of socio-economic impact management plans and programs ........................................290
Table 21-1 Cost estimate classification ............................................................................................................295 Table 21-2 Exchange rate and proportion of estimate ......................................................................................295
Table 21-3 Summary of plant capital cost .........................................................................................................296
Table 21-4 Summary of pre-production mining capital cost ..............................................................................297
Table 21-5 Summary of other capital ................................................................................................................297 Table 21-6 Initial capex summary .....................................................................................................................297
Table 21-7 Project sustaining and closure capex summary .............................................................................298
Table 21-8 Annual manpower costs by major departments ..............................................................................302 Table 21-9 Staffing per division ........................................................................................................................303
Table 21-10 Summary of mining budget estimate ..............................................................................................304
Table 21-11 Plant operating expenditure summary ............................................................................................305 Table 21-12 Plant coal consumption ...................................................................................................................306
Table 21-13 Opex estimate summary .................................................................................................................307
Table 22-1 Project economic model headline results before taxation ..............................................................310
Table 22-2 Project economic model headline results after taxation .................................................................310 Table 22-3 Model inputs ...................................................................................................................................311
Table 22-4 Project economic performance (post-tax) .......................................................................................312
Table 22-5 Project economic performance (pre-tax) ........................................................................................312 Table 22-6 Production physicals by period .......................................................................................................312
Table 22-7 Project financials by period – post-tax ............................................................................................313
Table 22-8 Project KPIs after taxation ..............................................................................................................313 Table 22-9 Sensitivity table for the Base Case (US$14,000/t) NPV8, after taxation .........................................314
Table 22-10 Breakeven analysis after taxation ...................................................................................................315
Table 24-1 Key milestones ...............................................................................................................................318
Table 25-1 Higher than Medium post-mitigation risks .......................................................................................325

Horizonte Minerals Plc Araguaia Nickel Project Technical Report
Final November 2018 Page 17 of 342
Table 25-2 Additional resource available for the Project ..................................................................................328

Horizonte Minerals Plc Araguaia Nickel Project Technical Report
Final November 2018 Page 18 of 342
1 SUMMARY
1.1 Introduction
This report is a National Instrument 43-101 (NI 43-101) Technical Report on the Feasibility Study (FS) of the Horizonte Minerals Plc (HZM or “the Company”) wholly owned Araguaia Nickel Project (ANP or “the Project”). The Project is located in the north-western Brazilian state of Pará, approximately 760 kilometres (km) south of the state capital Belém. The term “Feasibility Study” has the meaning ascribed by the Canadian Institute of Mining, Metallurgy and Petroleum (CIM), as the CIM Definition Standards on Mineral Resources and Mineral Reserves adopted by CIM Council, as amended. Under CIM guidelines, the Project is considered to be a “development property” – a property that is being prepared for mineral production and for which economic viability has been demonstrated by a Feasibility Study.
The Project comprises a planned open pit nickel laterite mining operation that mines a 27.5 million tonne (Mt) Mineral Reserve of a 119 Mt Mineral Resource to produce 52,000 tonnes of ferronickel (FeNi) (containing 14,500 tonnes of nickel) a year, for an initial 28-year LOM. The metallurgical process comprises a single line rotary kiln electric furnace (RKEF) to extract ferronickel (FeNi) from the laterite ore. The RKEF plant and project infrastructure will be constructed over a 31-month period. After an initial ramp-up period, the plant will reach full capacity of approximately 900,000 tonnes per annum (t/a) of dry ore feed. The FeNi product will be transported by road to the port of Vila do Conde for sale to overseas customers.
The process plant, mining, infrastructure and utilities engineering has been developed to support capital (capex) and operating expenditure (opex) estimates to the Association for the Advancement of Cost Engineering (AACE) class 3 standard. This means that capex and opex estimates have a combined accuracy of between -10% and +15% with a confidence level of 50%. The capex and opex are as of Q3 2018.
This report has been prepared in accordance with the terminology, definitions and guidelines in the Canadian Institute of Mining, Metallurgy and Petroleum (CIM) Definition Standards for Mineral Resources and Mineral Reserves (May 2014) NI 43-101 – Standards of Disclosure for Mineral Projects (NI 43-101).
Ausenco Pty Ltd (Ausenco), Snowden Mining and Industry Consultants (Snowden), Prime Resources Pty Ltd (Prime), C. Steinweg Group (Steinweg) and Environmental Resource Management Inc (ERM) were commissioned by HZM to produce the FS for the Project.
The FS concludes that the development property and associated Project planning is well advanced to secure the required permitting, and that the Project has sufficient Mineral Reserves to support an initial 28-year Life of Mine (LOM). The RKEF process is a proven technology. The Project returns an internal rate of return (IRR) of over 20.1% on an initial capital expenditure (capex) of US$445 million.
Metric units have been used throughout this report. All currency values are expressed in United States dollars (US$) exclusively.
1.1 Property ownership and permitting
The Project comprises two areas: Araguaia Nickel South (ANS) and Araguaia Nickel North (ANN).
The combined ANS and ANN areas comprise 16 exploration licences in four non-contiguous blocks, with a total area of approximately 1,100 km2 (110,000 hectares) all 100% owned by HZM. All licences are held under one Brazilian company, 100% owned by HZM.
ANP’s permit process is well advanced and the Project is on the pathway to the construction-ready phase. To move from the exploration and development phase through to the construction phase, HZM must continue permitting along two parallel pathways. These pathways are the mining permit and environmental permit, and each is managed by separate and independent public authorities: National Mining Agency (Agência Nacional de Mineração – ANM) formally known as DNPM for the mining permit; and the State Secretariat for Environment and Sustainability of Pará (SEMAS) for the environmental permit.

Horizonte Minerals Plc Araguaia Nickel Project Technical Report
Final November 2018 Page 19 of 342
ANS is further advanced along the permitting pathway than ANN, due to the relatively recent acquisition of ANN. ANN is currently being integrated into the overall permitting pathway for the project. Mining in ANN is scheduled to commence in Year 8 of the current mine plan. Table 1-1 shows a summary of the ANS permitting process and status.
Table 1-1 ANS major permit summary to construction-ready phase
Mining Permit Pathway to construction-ready Environmental Permit Pathway to construction-ready
The project will require the following mining permits/deeds, granted by ANM:
Mineral Prospecting Licences (granted)
Mineral Research Report approval (granted)
Economic Exploitation Plan approval (submitted, under review)
Mine Servitude Rights approval1 (submitted, under review)
Mine Concession grant.
The project will require the following environmental permits/deeds, granted by SEMAS:
Preliminary Licence (granted)
Preliminary Water Use Permit (granted)
Construction Licence or LI (submitted, under review)
Definitive Water Use permit (granted)
Water Dam Permit (granted)
Water Permit for pit dewatering (submitted, under review)
Vegetation Clearance Approval (submitted, under review)
Water pipeline Preliminary and Installation Licence (submitted, under review).
Source: ERM, 2018
There are no known impediments to HZM that may impede the award of any permits/licences/ approvals required for the Project.
1.2 Accessibility, infrastructure and physiography
The Project is located approximately 40 km northwest of the town of Conceição do Araguaia (population of 46,200) where the Company has its offices and approximately 25 km west of the north-south trending Araguaia River (Figure 1-1).
The Carajás Mining District (CMD), situated approximately 200 km northwest of the Project, is host to a number of world class iron, copper and nickel mines operated by Vale SA the world’s largest producer of iron ore and nickel. Carajás is the main centre of economic and mining activity in the Pará State resulting in well-developed infrastructure including rail direct to port, hydroelectric power and a network of surfaced roads. The principal towns of Paruapebas to the north and Canaá dos Carajás to the south offer good access to labour, technical services and construction equipment. Further to the north, Marabá is a major industrial city (population 262,000) serving the CMD.
1 Servitude rights, if needed, must pass by a first approval by ANM, following a procedure of damage assessment and restoration to the
impacted landowners. This procedure is regulated by common civil law and is not within ANM’s jurisdiction.

Horizonte Minerals Plc Araguaia Nickel Project Technical Report
Final November 2018 Page 20 of 342
Figure 1-1 ANP location, showing ANS and ANN with associated infrastructure and the CMD
Source: HZM, 2018
The Project has two principal mining centres; Araguaia Nickel South (ANS) and Araguaia Nickel North (ANN). ANS hosts seven deposits: Pequizeiro, Baiao, Pequizeiro West, Jacutinga, Vila Oito East, Vila Oito West and Vila Oito, while ANN hosts the Vale do Sonhos deposit (Figure 1-2).
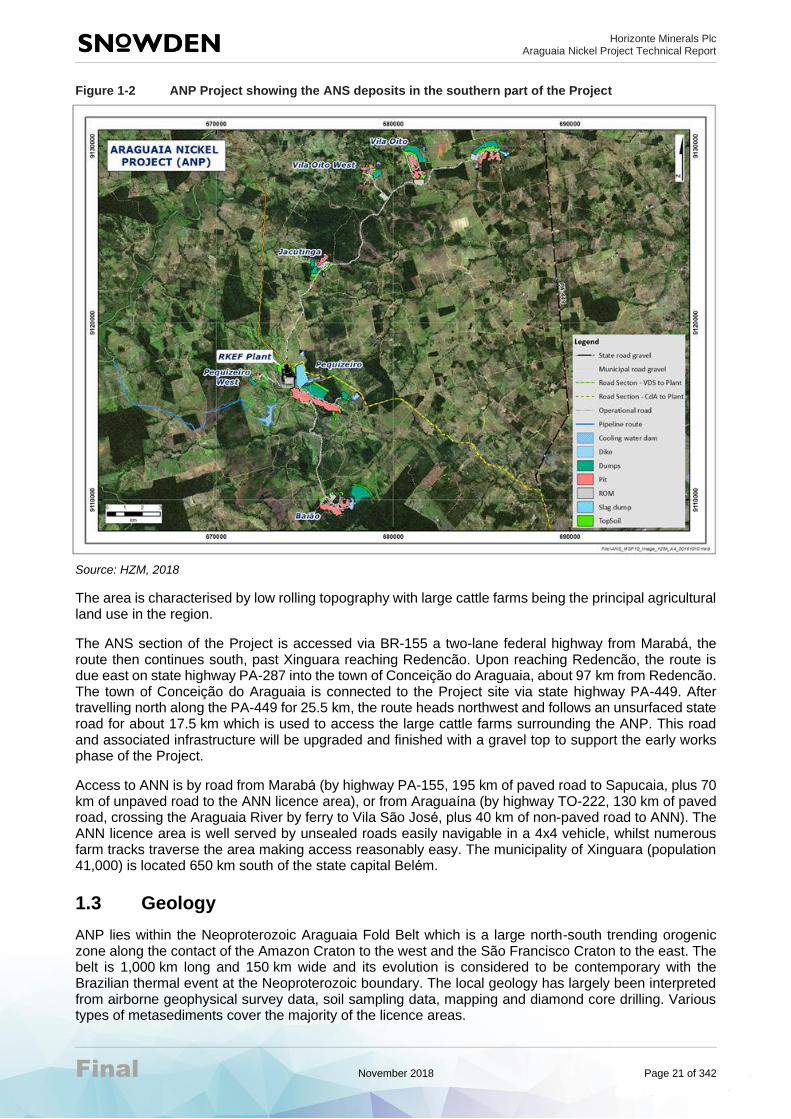
Horizonte Minerals Plc Araguaia Nickel Project Technical Report
Final November 2018 Page 21 of 342
Figure 1-2 ANP Project showing the ANS deposits in the southern part of the Project
Source: HZM, 2018
The area is characterised by low rolling topography with large cattle farms being the principal agricultural land use in the region.
The ANS section of the Project is accessed via BR-155 a two-lane federal highway from Marabá, the route then continues south, past Xinguara reaching Redencão. Upon reaching Redencão, the route is due east on state highway PA-287 into the town of Conceição do Araguaia, about 97 km from Redencão. The town of Conceição do Araguaia is connected to the Project site via state highway PA-449. After travelling north along the PA-449 for 25.5 km, the route heads northwest and follows an unsurfaced state road for about 17.5 km which is used to access the large cattle farms surrounding the ANP. This road and associated infrastructure will be upgraded and finished with a gravel top to support the early works phase of the Project.
Access to ANN is by road from Maraba (by highway PA-155, 195 km of paved road to Sapucaia, plus 70 km of unpaved road to the ANN licence area), or from Araguaina (by highway TO-222, 130 km of paved road, crossing the Araguaia River by ferry to Vila Sao Jose, plus 40 km of non-paved road to ANN). The ANN licence area is well served by unsealed roads easily navigable in a 4x4 vehicle, whilst numerous farm tracks traverse the area making access reasonably easy. The municipality of Xinguara (population 41,000) is located 650 km south of the state capital Belem.
1.3 Geology
ANP lies within the Neoproterozoic Araguaia Fold Belt which is a large north-south trending orogenic zone along the contact of the Amazon Craton to the west and the São Francisco Craton to the east. The belt is 1,000 km long and 150 km wide and its evolution is considered to be contemporary with the Brazilian thermal event at the Neoproterozoic boundary. The local geology has largely been interpreted from airborne geophysical survey data, soil sampling data, mapping and diamond core drilling. Various types of metasediments cover the majority of the licence areas.

Horizonte Minerals Plc Araguaia Nickel Project Technical Report
Final November 2018 Page 22 of 342
A distinctive lateritic sequence is developed over ultramafic and mafic rocks within the Project area and essentially the same sequence can be recognised at each of the deposits.
The mineralisation at both ANS and ANN is typical of nickel laterite deposits formed in a seasonally wet tropical climate on weathered and partially serpentinised ultramafic rocks.
A typical laterite profile contains three distinct horizons (limonite, transition and saprolite), as noted at the two ANS principal deposits, Baiao and Pequizeiro.
1.4 Mineral Resource estimation
A number of phases of diamond drilling have been completed across the ANP commencing in 2010. Drilling at ANS has been undertaken by HZM and Teck, with drilling at ANN by Xstrata. HZM has been active on the ANS project since the initial discovery in 2010, when it successfully completed the acquisition and integration of the Teck and Xstrata project areas; it has been the sole project operator since 2015. A total of 75,250 m of diamond drilling has been completed across 2,627 holes for the Project.
Mineral Resource estimates for the deposits under consideration for the FS are shown in Table 1-2. The Measured Mineral Resource estimated at a cut-off grade of 0.90% Ni, is 18 Mt at a grade of 1.44% Ni. The Indicated Mineral Resource is 101 Mt at a grade of 1.25% Ni. This gives a combined Mineral Resource of 119 Mt at a grade of 1.27% Ni for Measured and Indicated Mineral Resources at a cut-off grade of 0.90% Ni (inclusive of Mineral Reserves). A further 13 Mt at a grade of 1.19% Ni (at a cut-off grade of 0.90% Ni) is defined as an Inferred Mineral Resource.
Snowden is unaware of any issues that may materially affect the Mineral Resources.

Horizonte Minerals Plc Araguaia Nickel Project Technical Report
Final November 2018 Page 23 of 342
Table 1-2 Mineral Resources for ANS and ANN as of February 2017 by material type (0.90% Ni cut-off)
Araguaia Category Material type
Tonnage (kt)
Bulk density (t/m3)
Contained Ni metal
(kt)
Ni (%)
Co (%)
Fe (%)
MgO (%)
SiO2 (%)
Al2O3 (%)
Cr2O3 (%)
Subtotal Measured
Limonite 1,232 1.39 15 1.20 0.15 37.43 2.00 17.15 11.07 2.98
Transition 6,645 1.26 116 1.75 0.07 18.89 10.20 42.06 6.59 1.29
Saprolite 10,291 1.40 130 1.27 0.03 12.03 24.08 41.24 3.95 0.87
Total Measured All 18,168 1.35 261 1.44 0.05 16.26 17.51 39.91 5.40 1.17
Subtotal Indicated
Limonite 19,244 1.39 216 1.12 0.12 36.22 2.40 20.46 9.61 2.65
Transition 30,917 1.20 439 1.42 0.07 21.38 11.26 38.95 5.37 1.51
Saprolite 51,008 1.31 610 1.18 0.03 11.83 25.79 40.59 3.16 0.85
Total Indicated All 101,169 1.30 1,264 1.25 0.06 19.39 16.90 36.26 5.06 1.39
Total Measured + Indicated All 119,337 1.30 1,525 1.27 0.06 18.91 16.99 36.81 5.11 1.36
Subtotal Inferred
Limonite 2,751 1.37 30 1.08 0.10 34.92 3.04 22.84 9.23 2.50
Transition 4,771 1.20 62 1.30 0.07 21.23 11.04 39.09 5.62 1.40
Saprolite 5,398 1.35 62 1.15 0.03 11.80 24.36 41.81 3.69 0.82
Total Inferred All 12,920 1.30 154 1.19 0.06 20.21 14.90 36.77 5.58 1.39
Source: Snowden, 2018
Notes:
1. Mineral Resources are not Mineral Reserves and do not have demonstrated economic viability. All figures are rounded to reflect the relative accuracy of the estimate and have been used to derive subtotals, totals, and weighted averages. Such rounding consequently introduces a small margin of error. Where these occur, Snowden does not consider them to be material.
2. Mineral Resources are reported inclusive of Mineral Reserves.
3. The reporting standard adopted for the reporting of the Mineral Resource estimate uses the terminology, definitions and guidelines given in the CIM Standards on Mineral Resources and Mineral Reserves (May 2014) as required by NI 43-101.
4. Mineral Resources are reported on 100% basis for all Project areas.
5. Snowden completed a site inspection of the deposit by Mr Andrew Ross FAusIMM, who is an "independent Qualified Person" as defined in NI 43-101.
6. kt = thousand tonnes.

Horizonte Minerals Plc Araguaia Nickel Project Technical Report
Final November 2018 Page 24 of 342
1.5 Mineral Reserve estimation
The Mineral Reserve was estimated by Snowden in accordance with JORC (2012) guidelines.
All economic Indicated Mineral Resources within the pit designs were classified as Probable Mineral Reserves and all Measured Mineral Resources at Pequizeiro (ANS) were classified as Proven Mineral Reserves (this classification was tested and supported by the trial mining program completed in this pit in 2017). Measured Mineral Resources at Vale dos Sonhos (ANN) were classified as Probable Mineral Reserves. A summary is provided in Table 1-3. The Mineral Reserve of 27.2 Mt gives an initial 28-year LOM plan based on the annual ore throughput to the RKEF plant of 900,000 t/a.
Table 1-3 Open pit Mineral Reserves reported at October 2018
Category Ore (Mt) Ni (%) Fe (%) SiO2:MgO Al2O3 (%)
Proven 7.33 1.72 16.01 3.01 6.00
Probable 19.96 1.68 17.57 2.36 4.56
Total 27.29 1.69 17.15 2.52 4.94
Source: Snowden, 2018
Notes:
1. Mt – million dry metric tonnes.
2. Cut-off varies by deposit depending mainly on haul distance to the plant but averages 1.03% Ni.
3. Dilution was modelled as part of re-blocking, ore losses applied are 8%.
4. Snowden completed a site inspection on three occasions between March 2016 and May 2017 by Mr Frank Blanchfield FAusIMM, who is a “independent Qualified Person”, as defined in NI 43-101.
1.6 Mining
1.6.1 Mining method
Planned mining at ANP is to be completed with conventional open pit truck and excavator mining methods. No blasting will be necessary. The orebodies are flat lying and variable in composition. Waste overburden will be stripped on 4 m benches, and ore on 2 m benches for additional selectivity.
Reverse circulation (RC) grade control drilling will be completed at 10 m x 10 m spacing to define the waste/ore/ore type boundary ahead of mining. In addition, visual control at the boundary of the limonite and the transition ore will be used to minimise the amount of limonite being included in the ore feed.
Waste will be stored in external dumps nearby the pits. Ore will be transported to stockpile hubs near each deposit. Sheeting (using ferricrete won from the overburden) will be required to support trafficability in and around the mine during the wet season. Depending on plant demand, ore will be hauled from hub stockpiles or directly from the pits to the run of mine (ROM) at the RKEF process facility. Stockpiles on the (ROM) will be sheeted and classified according to ore type and chemistry for blending.
Due to the high rainfall in the wet season, mining (including stockpile rehandling) will be restricted to the Pequizeiro area between October and March. Mining rates are approximately three times higher in the dry season, which is typical in Brazilian open pit mining operations.
1.6.2 Mine design
The resource model was converted to a mining model to reflect the mining method and incorporate anticipated mining dilution and loss. The model was re-blocked to 6.25 m x 6.25 m x 2 m, with a 300 mm “skin” of transition (directly beneath the limonite boundary) treated as loss.
The pits were optimised to target the highest-grade material possible with a LOM of approximately 25 years. This resulted in a cut-off grade of 1.4% Ni being applied. The pits were then optimised using Whittle 4X to determine a shell to use for design.

Horizonte Minerals Plc Araguaia Nickel Project Technical Report
Final November 2018 Page 25 of 342
The pits were designed in multiple stages (of approximately 200 m x 200 m size) to expedite the mining of higher value areas. Waste and topsoil dumps were designed to store the necessary capacity. Deposit stockpiles are designed to handle up to 10 different ore types for blending.
1.6.3 Mining geotechnical
Snowden completed the geotechnical slope design for eight groups of open pits including the design of associated waste dumps. These pits are shallow (approximately 30 m deep) and laterally extensive and are mined in highly weathered and relatively weak materials. The design work was supported by 648 m of drill core, core logging, historical and current lab testing (91 samples), trial mining and a site visit.
Snowden considers that the current geotechnical study has reached a level of accuracy that is appropriate for a FS.
1.6.4 Mine production schedules
The mine production schedule was based upon a target processing rate of 900,000 t/a. The scheduling increments were monthly for the pre-production and first three years of production, and quarterly thereafter. Mining rates were varied monthly depending on the season, with much higher rates in the dry season. The schedule considered:
• Maximisation of nickel production
• Meeting of blend targets for SiO2:MgO (<2.6), Fe (<18%), Al2O3 (<5.5%) and Fe:Ni (>7.6)
• Minimisation the number of active deposits
• Supply of sufficient sheeting material to sustain trafficability
• Smoothing of the overall mining rates.
The annual mining rate peaks at 3.5 Mt/a between production years 2 and 7 before dropping down to 3.0 Mt/a for the remainder of the Project.
The mine supplies high nickel grades in the early mine life, reaching 2% in production Year 2. The Ni grade is above 1.8% for the majority of the first 10 years of production and reduces to average approximately 1.6% Ni for the remaining LOM.
1.7 Recovery methods
The Project will utilise a single RKEF processing line from ore receipts through to shotting of the FeNi product. The key steps in the RKEF flowsheet are:
• ROM ore, at an average moisture content of 34%, is first blended to meet metallurgical processing requirements, then transported to the primary crushing stage. Here the ore is sized using two stages of crushing to match the requirements of the subsequent steps. A mineral sizer with a 200 mm gap is used for primary sizing, while a mineral sizer with a 50 mm gap is used for the final stage.
• The ore is then homogenised, partially dried and agglomerated to an average moisture content of 18% in a rotary dryer (4.5 m diameter x 40 m long) and fired with pulverized coal.
• The dried agglomerated ore is then fed to the rotary kiln with the addition of reductant coal. In the kiln, the ore is completely dried, calcined to remove chemically-combined moisture, and the iron and nickel oxides are partially pre-reduced. Drier and rotary kiln dusts are recycled to the agglomeration process before the primary crushing stage ahead of the dryer.
• Calcine from the kiln is then transferred to the electric furnace where further reduction of the nickel and some of the iron is achieved, melting and separation of the metal and slag occurs at high temperature. Slag is tapped at a temperature of around 1,575°C, while FeNi metal is tapped at a temperature of close to 1,500°C.
• After tapping, the melt is transferred by ladle to the refining stage. The final FeNi product containing 30% Ni is shotted with water, screened, dried and stockpiled prior to dispatch to the port on trucks where it either bagged or loaded bulk into sea containers for shipping to customers.

Horizonte Minerals Plc Araguaia Nickel Project Technical Report
Final November 2018 Page 26 of 342
• The electric furnace slag is granulated and transferred to the slag repository by truck.
1.8 Metallurgical testwork and process development
Metallurgical testwork was completed on both the ANS and ANN ore. This included initial lab and bench scale testwork leading to a fully integrated pilot campaign which demonstrated the full RKEF flowsheet, on a representative bulk sample of 220 tonnes (wet) over a 10-day period operating 24 hours per day.
The conclusions from this pilot program and associated testwork were:
• For feed preparation, drying and agglomeration, very good agglomerated material was produced with low dust generation. Possible improvements to the drying and agglomeration circuits were also identified, for example:
− Crusher and screen sizing for primary, secondary and tertiary steps was reviewed and improved. Bulk samples from the trial mining pit were sent to two laboratories to confirm and update the ore property data which was then used for the FS designs
− Direct feeding the kiln from the dryer/agglomeration unit can be included in the plant design, fitted with a bypass for storage, reclamation and co-feeding from stockpile.
• The proposed RKEF process flowsheet for treating ANP ore proved to be successful in all aspects. At the higher temperatures tested, there was no visible sintering or sticking of the calcine. The kiln atmosphere was clear of particulate dust, and the calcine material maintained integrity through the kiln.
• The well-formed robust calcine material provided stable operation of the electric furnace over a range of voltages. Arcing was stable and shielded arc operation was successfully tested.
1.9 Environmental and social
ERM together with Integratio (social and land) and DBO Environmental Engineering (fauna) were retained to undertake the work for the LI covering both Environmental and Social streams. All work has been undertaken to IFC Performance Standards and 1, 2 and 5 and CONAMA environmental legislation. CONAMA is the acronym for Brazilian National Environmental Council. ERM and partners, involving approximately 60 professionals across multiple disciplines, conducted a number of new studies in 2017 and 2018 with ongoing programs active, these included:
• Environmental Control Plans (Planos de Controle Ambientais – PCAs)– elaboration and detailing of socio-environmental programs
• Inventories of fauna and flora
• Air dispersion modelling
• Hydrogeological modelling and water balance
• Water grants reports
• Visits by physical, biological and social analysts to site
• Air, noise and water monitoring – ongoing.
Key environmental and social risks and impacts have been reported in the FS, and include an HZM plan/ response to minimise, manage and mitigate these risks and monitor performance. This will be primarily undertaken through a system of PCAs, to be implemented before, during and after construction to meet Brazilian and international standards.
1.9.1 Environmental
Key environmental study outcomes include:
• Air quality: Dispersion modelling concluded that emissions of key pollutants and dust would be within national and international standards.

Horizonte Minerals Plc Araguaia Nickel Project Technical Report
Final November 2018 Page 27 of 342
• Greenhouse gasses (GHG) and climate risk: GHG emissions for the Project were estimated and an assessment of climate risks was undertaken. GHG emissions have been assessed to be in alignment with similar FeNi operations in Brazil, and HZM has committed to reporting on an annual basis.
• Soil and water quality: The Project has plans in place to avoid soil erosion, sedimentation and contamination of soil and water from fuels and chemicals.
• Water: HZM will manage water abstraction levels in response to seasonal changes, to safeguard flow in rivers particularly in the dry season.
• Wastes: Non-mineral wastes will be managed through the solid waste management plan.
• Habitat: The Project will primarily affect pasture land. HZM has developed a number of programs for management and monitoring of biodiversity, flora and fauna.
• Protected areas: The Project will not affect any internationally or nationally recognised conservation areas for habitats or species.
1.9.2 Social
Socio-economic baseline data collected across the Project area indicate the following:
• The Municipalities within the areas of influence include: Conceição do Araguaia (population ~45,000); Floresta do Araguaia (population ~19,000) and Xinguara (population ~45,000)
• The Project is located in sparsely populated areas, mostly on large farms a significant distance from the urban centres, and therefore a large resettlement process will not be required
• Whilst the areas are sparsely populated, approximately 37 families will be affected via the land acquisition, physical resettlement or economic resettlement process of ANP
• No Indigenous or State forest reserves are within the area of influence of ANP
• The communities demonstrate high rates of poverty, around 50%
• The majority of rural properties depend on wells and springs for water
• Each Municipality provides basic services, such as education, health, security and roads. A number of risks and opportunities are noted in all of these municipal areas.
The socio-economic impact assessment for ANP demonstrates the Project’s potential to generate lasting positive impacts for the region. The main social conclusions and recommendations include:
• In-migration: Given the possibility of attracting migrant work-seekers to the Project area, there are a number of strategies HZM will implement to reduce in-migration and manage impacts.
• Role of the project in the local context: HZM will take local context into consideration when developing local programs, to ensure that community expectations are realistic and that the mine is not seen as responsible for government initiatives.
• Mining operators: It is important that through its environmental and social mitigations and actions, HZM differentiates itself from other operators in the municipality as the “mining operator of choice”.
• Community engagement: Engagement is planned to intensify in line with project activities.
• Vulnerability: A number of groups were identified as vulnerable in relation to their ability to adapt to changes brought about by ANP activities and their needs have been considered in social programs.
• Resettlement and livelihoods restoration: Resettlement should be conducted in a manner that involves extensive consultation among project-affected persons.
• Water as a key ecosystem service: Monitoring and drilling additional deeper wells for houses within the pit dewatering drawdown zone forms part of the Resettlement Action Plan.
• Mine closure: will include the decommissioning and removal/clearance of all infrastructure/structures and equipment associated with the mine.

Horizonte Minerals Plc Araguaia Nickel Project Technical Report
Final November 2018 Page 28 of 342
1.10 Infrastructure
The site layout around the RKEF plant includes slag repository, incoming power line and roads, the water cooling dam and water delivery pipelines to the plant and to the Rio Arraias (Arraias River) to the east (see Figure 1-3).
1.10.1 Water cooling dam and pumping
A water cooling dam will be constructed to provide a constant source of water to the process plant and act as a heat sink for the furnace. The water cooling dam will be fed by rainfall, runoff, return water from the process plant and water abstracted from the Arraias River. The dam will consist of an earth core dam wall and spillway to retain 1.82 million cubic metres (Mm3) of water. Included in this facility is a pumping station and 3.7 km of 1,000 mm diameter high-density polyethylene (HDPE) pipe to pump water from the cooling dam to the plant (at a rate of approximately 350 m3/hr).
1.10.2 Water pipeline
The average water consumption for the Project was estimated at 220 m3/hour. To support this, HZM will construct a 11.1 km, 350 mm diameter, steel water pipeline including pumping from the Arraias river to the cooling dam. The system was designed to carry peak capacity of 350 m3/hour.
1.10.3 Slag storage facility
The slag material was classified as inert and non-hazardous and will therefore not require an impermeable barrier containment system. Because the slag is in the form of small spherical beads it is susceptible to granular flow and therefore cannot be stacked. It must be contained within a repository.
The slag repository will comprise an integrated slag disposal area and a drainage management system which has a total LOM footprint of approximately 60 hectares (ha). The life of the slag repository is for an initial 28-year LOM plan, with a total capacity of 20.44 Mt (dry) being total mass of slag that will be produced over the LOM.
1.10.4 Road works
High quality roads in and around the Project area are required, as all construction materials, personnel consumables and product shipment will be transported by road. HZM has planned for road upgrades and a new section of road including:
• Upgrade bridges, culverts and the road surface for 25.5 km of state road PA-449
• Upgrade 15.5 km of unsurfaced local road to access project area
• Construct an 11 km access road for the Arraias River water pipeline
• Upgrade of the 152 km of various regional roads between ANN (the Vale dos Sonhos pit) and the northern extent of ANS (the Vila Oita East pit) in Year 8 to enable haulage of ore approximately 5.4 Mt of ore from ANN to the plant at ANS.
1.10.5 Energy supply system
The power supply study concluded that the significant power requirements for the Project would be best served by connection to the Brazilian grid at Xinguara, and includes a construction of a 122 km 230 kiloVolt (kV) transmission line between the Xinguara II substation and the plant main substation.

Horizonte Minerals Plc Araguaia Nickel Project Technical Report
Final November 2018 Page 29 of 342
Figure 1-3 ANP infrastructure layout
Source: Ausenco, 2018

Horizonte Minerals Plc Araguaia Nickel Project Technical Report
Final November 2018 Page 30 of 342
1.11 Project implementation and schedule
The FS Project Implementation Plan (PIP) has been developed to meet the requirements of the mine plan. This plan will include two distinct construction phases:
• Phase 1 – Site preparation (including early works)
• Phase 2 – Plant implementation.
The detailed design will follow an Engineering Procurement and Construction Management (EPCM) approach. The main Project drivers are:
• Safe execution resulting in zero harm
• Economic and practical solutions – fit for purpose with no over-engineering, tried and tested processes
• Utilisation of local labour resources to the maximum extent practical
• Scheduled completion date
• Quality design and effective construction techniques
• Environmental protection.
A project schedule has been developed and discussed in Section 24.1.4. The Project construction is expected to take 31 months to complete. This plan requires that some limited interim engineering activities be conducted after completion of the FS, prior to approval for the Project to proceed.
1.12 Capital expenditure (capex) estimate
The capex estimate is based on an AACE class 3 standard, with an accuracy range between -10% and +15% of the final project cost (excluding contingency) with a base date of October 2018.
The capex includes all the direct and indirect costs, local taxes and duties and appropriate contingencies for the facilities required to bring the Project into production, including the process plant, power line, water pipelines and associated infrastructure as defined by a feasibility level engineering study. The estimate is based on an EPCM implementation approach and the Project contracting strategy outlined in Section 1.11.
The total estimated initial (pre-production) capex for the project is US$443.1 million (after tax, including growth and contingency, excluding escalation) and summarised in Table 1-4.
Table 1-4 Summary of Project capex
WBS # Area Capex estimate
(US$ million)
1000 Mine 6.0
3000 Ore preparation 39.0
4000 Pyrometallurgy 137.5
5000 Material supply 21.4
6000 Utilities and Infrastructure 106.9
7000 Buildings 9.1
8000 Indirect costs 82.4
Contingency 41.0
Total capex 443.1
Note: WBS – Work breakdown structure; rounding applied to WBS values
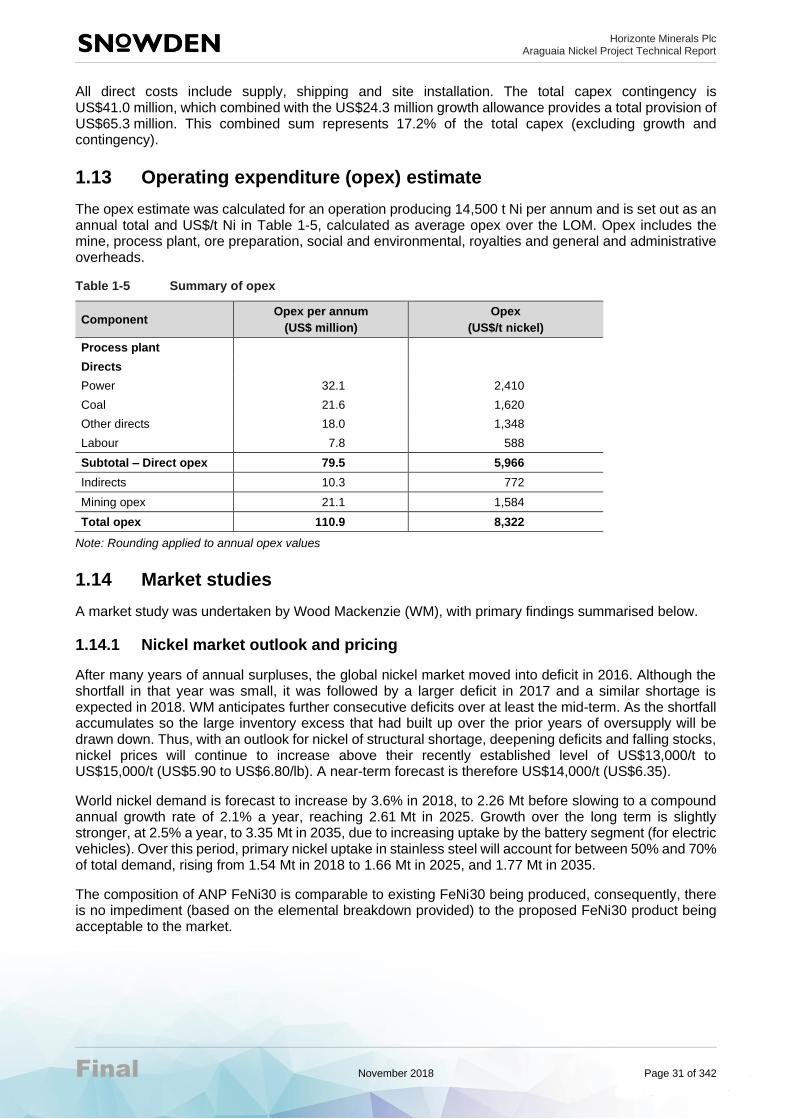
Horizonte Minerals Plc Araguaia Nickel Project Technical Report
Final November 2018 Page 31 of 342
All direct costs include supply, shipping and site installation. The total capex contingency is US$41.0 million, which combined with the US$24.3 million growth allowance provides a total provision of US$65.3 million. This combined sum represents 17.2% of the total capex (excluding growth and contingency).
1.13 Operating expenditure (opex) estimate
The opex estimate was calculated for an operation producing 14,500 t Ni per annum and is set out as an annual total and US$/t Ni in Table 1-5, calculated as average opex over the LOM. Opex includes the mine, process plant, ore preparation, social and environmental, royalties and general and administrative overheads.
Table 1-5 Summary of opex
Component Opex per annum
(US$ million)
Opex
(US$/t nickel)
Process plant
Directs
Power 32.1 2,410
Coal 21.6 1,620
Other directs 18.0 1,348
Labour 7.8 588
Subtotal – Direct opex 79.5 5,966
Indirects 10.3 772
Mining opex 21.1 1,584
Total opex 110.9 8,322
Note: Rounding applied to annual opex values
1.14 Market studies
A market study was undertaken by Wood Mackenzie (WM), with primary findings summarised below.
1.14.1 Nickel market outlook and pricing
After many years of annual surpluses, the global nickel market moved into deficit in 2016. Although the shortfall in that year was small, it was followed by a larger deficit in 2017 and a similar shortage is expected in 2018. WM anticipates further consecutive deficits over at least the mid-term. As the shortfall accumulates so the large inventory excess that had built up over the prior years of oversupply will be drawn down. Thus, with an outlook for nickel of structural shortage, deepening deficits and falling stocks, nickel prices will continue to increase above their recently established level of US$13,000/t to US$15,000/t (US$5.90 to US$6.80/lb). A near-term forecast is therefore US$14,000/t (US$6.35).
World nickel demand is forecast to increase by 3.6% in 2018, to 2.26 Mt before slowing to a compound annual growth rate of 2.1% a year, reaching 2.61 Mt in 2025. Growth over the long term is slightly stronger, at 2.5% a year, to 3.35 Mt in 2035, due to increasing uptake by the battery segment (for electric vehicles). Over this period, primary nickel uptake in stainless steel will account for between 50% and 70% of total demand, rising from 1.54 Mt in 2018 to 1.66 Mt in 2025, and 1.77 Mt in 2035.
The composition of ANP FeNi30 is comparable to existing FeNi30 being produced, consequently, there is no impediment (based on the elemental breakdown provided) to the proposed FeNi30 product being acceptable to the market.

Horizonte Minerals Plc Araguaia Nickel Project Technical Report
Final November 2018 Page 32 of 342
1.14.2 Stainless steel demand
World stainless steel production increased by 12 Mt between 2012 and 2017, mostly in China and to a lesser extent across the rest of Asia. Forecast production in 2018 is 50.8 Mt, an increase of 4.5% on 2017. This upward trend is likely to continue over the mid-term, before slowing after 2025. As future growth in stainless melting is expected to continue, the demand for FeNi should also increase. Consequently, WM forecasts long term FeNi production to be between 450 kt and 460 kt a year, compared with 433 kt in 2018. This suggests there could be a need for the development of new FeNi projects in the future. However, the actual requirement for FeNi over the long term will also depend on the availability of nickel pig iron (NPI) and stainless-steel scrap.
1.14.3 Nickel demand from Electric Vehicles (EV)
Demand for nickel in EV batteries is expected to become substantial over the long term. Whilst FeNi is not currently an acceptable raw material for NiSO4 production, FeNi demand could benefit indirectly from the expansion in EV batteries if Class 1 nickel consumption changes from stainless to battery sulphate making. With less Class 1 available to the stainless mills, they would have a greater requirement for nickel units in other raw materials, including FeNi, NPI and stainless scrap.
1.15 Financial analysis
HZM prepared a cash flow and financial analysis model (the model). The model is based on inputs derived from the mining and processing schedules and Project capex and opex estimates including applicable royalties (federal and state) for the Project. The mining schedule applied to the model was developed on a monthly basis for years 1 to 3, and a quarterly for the remainder of LOM. A monthly schedule was used for the construction period. All inputs are consolidated annually in this report.
The model assumes 100% equity. The Base Case was developed using a flat nickel price of US$14,000/t Ni. One other case was prepared; using a market consensus price of US$16,800/t Ni. This additional price forecast represents an upside scenario.
The ANP Base Case has a 4.2-year payback period with cumulative gross revenues of US$5,970 million (Table 1-6). The economic analysis indicates a post-tax NPV of US$401 million and an internal rate of return (IRR) of 20.1% using the Base Case forecast of US$14,000/t Ni which increases to US$1,906 million. A real discount rate of 8% has been applied to all cash flows.
A sensitivity analysis has shown the Project is more sensitive to nickel price and grade than it is to either opex or capex.
Table 1-6 Financial key performance indicators (after taxation)
Item Unit Base Case
(US$14,000/t Ni) Market consensus
(US$16,800/t Ni)
Gross revenue US$ million 5,970 7,164
Net cash flow US$ million 1,572 2,582
NPV8 US$ million 401 740
IRR % 20.1 28.1
Breakeven (NPV8) Ni price US$/t 10,766 10,766
C1 Ni price (Brooke Hunt) US$/t 8,193 8,193
Production year payback years 4.2 3.3

Horizonte Minerals Plc Araguaia Nickel Project Technical Report
Final November 2018 Page 33 of 342
1.16 Recommendations and conclusions
1.16.1 Conclusions
The geology is well understood, enabling good sample selection for test-work, which, in turn, gave good predictability and recovery in the process plant pilot campaign. Trial mining has demonstrated the integrity of the resource model and underpins the conversion of the Mineral Resources to Mineral Reserves as well as assumptions with respect to grade control, geotechnical assumptions and operability.
The conclusions for the study are derived from the individual study sections, which are detailed below, however overall it is concluded that:
• There are sufficient Mineral Resources, well supported by the data, to convert to Mineral Reserves to feed the processing plant for in excess or 30 years at a rate of 900 kt/a,
• The metallurgical testing, METSIM modelling and pilot plant program has demonstrated that the ANP ore performs well in the selected RKEF process route and will produce FeNi (at 30% Ni) to the nameplate design capacity,
• Social and environmental impacts of the study have been assessed and appropriate management plans developed to ensure compliance with Brazilian regulations and IFC standards,
• There is adequate water and power in the region to supply the process plant,
• Permitting for the project is advanced and is on target for construction to commence in 2019 and mining in 2021,
• The Project capex estimate was developed to AACE class 3 standard, with an accuracy range between -10% and +15% providing sufficient level of confidence around the basis of estimate.
• The Project economics are both robust and are well supported by detailed engineering, vendor quotes and cost estimates.
1.16.2 Recommendations
The key recommendations include:
• It is recommended that HZM proceed to project financing in order to fund early works, detailed design, and construction of ANP.
• Planned early works packages should be executed as soon as possible and include:
− Upgrade road access to the site to enable commencement of construction activities
− Establishment of temporary power to the site for construction
− Specification and vendor selection for EPCM or EPC supplier
− Detailed engineering for site preparation and Civil Works (earthworks, drainage, temporary infrastructure, etc.)
− Specification for long lead items and commencement of vendor engagement.
• Continue and intensify social engagement programs as project activities ramp-up
• Continue environment monitoring programs and continue developing environment management plans
• Complete construction permitting for ANS and continue permitting for ANN
• Undertake an additional hazard identification (HAZID) workshop on the process plant prior to detailed design
• Undertake hazard and operability study (HAZOP) prior to commencing operations
• Engage with mining contractors after project financing in order to refine contractor estimates and mining operation strategy

Horizonte Minerals Plc Araguaia Nickel Project Technical Report
Final November 2018 Page 34 of 342
• Undertake additional ore characterisation and agglomeration testing
• Continue updating the hydrological model with additional river, catchment, and rainfall data.
All recommendations are detailed in Section 26 of this report.
1.17 Summary of the project risks
A full risk and opportunity assessment and risk register was completed for the Project in 2014. In addition, an integrated risk workshop for the Project was undertaken as well as two hazard identification workshops, one run by ERM, the social and environment project leads, and one run by Ausenco, the process lead, over the July-August 2018 period.
The workshop identified a number of risks for each area (a total of 230 risks were reviewed). Each identified risk was evaluated, ranked, and a mitigation strategy developed then re-ranked after mitigation. This process resulted in a number of risks that were categorised as “high” – prior to mitigation. The largest number of “high” prior-to-mitigation risks was identified in the ore feed, process and metallurgy area. Social and environment had the second largest number of “high risks”, followed by tenure and licensing.
1.17.1 Process and metallurgy – “high” risks
The process and metallurgy risks of significance were concerned with consistency of feed to the process and the operating range of the furnace. The mitigation steps for these kinds of risks all lie within the grade-control and mine to mill strategy developed for the project. This strategy ensures that all ore grade control drilling is completed well in advance of planned mining (up to 12 months) and a detailed review of ore grades (via sampling) is completed as the ore is moved from face, to stockpile to plant feed. This is supported by further assays and homogenisation at various stages through the plant. It was determined as part of the risk assessment that this strategy would be appropriate to mitigate these kinds of risks and is consistent with industry best practice.
1.17.2 Supply chain
Due to the dependency of the project on a consistent supply of specialist consumables as well as coal, power, and heavy fuel oil (HFO) some of the project risks to the supply chain were examined. The mitigations in place for these events include:
• Multiple routes and trucking contractors to the project from the port and other logistics hubs
• Alternative ports for coal
• Appropriate buffers of critical spares and consumables at the site
• Identification of alternative suppliers for key consumables.
1.17.3 Social and environment
The social “high” risk areas highlighted the risks associated with a sharp increase in population and traffic in the area that both construction and operation would bring. Consequences may range from cultural change to social unrest. For the environmental area, the “high” risks were generally concerned with potential spills and emissions.
These risks are normal for large industrial projects in relatively remote locations and can be appropriately mitigated with targeted and well-established systems.
1.17.4 Tenure and licensing
There is a chance, however small, that the Project licences to operate either will not be granted or will be revoked. Mitigation of these risks generally focus on full compliance with due process and regulations and maintenance of good relations with all relevant agencies.

Horizonte Minerals Plc Araguaia Nickel Project Technical Report
Final November 2018 Page 35 of 342
1.17.5 Outcome of the risk workshop
Of the 230 risks identified and mitigated four remain above the Medium level. The mitigation strategies developed were either in place, currently being implemented or will be implemented at the appropriate stage of development. These risks are shown in Table 1-7.
Table 1-7 Higher than Medium post-mitigation risks
Risk Description Mitigation Likelihood Consequence Severity
Installation Licence (LI) delayed
LI not approved within critical pathway timeline
Regular meetings with agency. LI sign-off already reached with landowners. Submit environmental control plans and arrange agency visit to site.
2 5 Medium-
High
RFP not approved
Economic modelling with inadequate return
Enter new RFP as nickel price turns. Engage staff.
2 5 Medium-
High
PAE not issued (Economic mine plan) within time frame required
PAE not issued and/or mining agency requirements not met
Regular meetings with agency. LI sign-off already reached with landowners. Submit environmental control plans and arrange agency visit to site.
2 5 Medium-
High
Optimistic nickel prices
Prices selected are above current market
Independent Market Study with confirmed price assumptions that are realistic.
2 5 Medium-
High
As shown in Table 1-7 most of the post-mitigation medium-high risks are in the tenure and licensing area. HZM is progressing well with permitting and with a construction licence (LI) due late in 2018 or early Q1 2019. The other Medium-High risk is that of nickel price. To mitigate this risk, HZM has selected a conservative long-term price for the economic analysis (compared to that of HZM’s marketing advisors and peer group) and commissioned an independent report on nickel pricing to support the selection of this price.
1.18 Opportunities
During the study several opportunities to increase the value of the Project have presented themselves. Some of the higher value opportunities are outlined below.
1.18.1 Opportunities to improve the value of the FS case
• Utilisation of slag for other industries. HZM has partnered with SENAI (Brazilian Innovation Technology Centre) in the Pará State to study potential options for slag re-use, using samples of Araguaia slag produced in the 2015 pilot plant campaign from Araguaia bulk samples. Whilst studies are still in progress, early results indicate a good potential for the application of slag in the cement industry and also for road paving. Economic viability studies and potential quantities for slag re-use will be further investigated as the Project progresses.
• Direct tipping from mine to ROM bin. It is envisaged that after production commences the grade control systems put in place prior to mining will be viewed as sufficient (in some cases) and that material may be direct tipped from the mine face directly to the plant feed bin. This will result in significant savings in mining costs due to reduced rehandle of ore.
• Backfilling waste into old pits. The FS assumes that all waste is stockpiled outside the pits. This is because some mineralised material remains in the pit bottoms (considered un-economic under the FS assumptions). Such waste stockpiles consume land which incurs costs for acquisition and clearing, and in some cases requiring long hauls from the pit. As production commences it is envisaged that permission will be granted by the regulator to backfill pits with waste. This will result in significant cost savings over the life of the mine. No marginal-grade material will be backfilled as this will be retained in nickel-graded stockpiles for any potential future exploitation.
• Mining cost reductions. The FS developed mining costs are based on proposals from contract mining operators in Brazil. These proposals were solicited using the mine schedule and with no negotiation

Horizonte Minerals Plc Araguaia Nickel Project Technical Report
Final November 2018 Page 36 of 342
as there was no imminent contract. It has been recognised that when HZM is in position to award a large mining contract that negotiations should result in significant mining unit costs savings.
• Mine life extension by the Inclusion of additional resources owned by HZM in the area. HZM owns significant additional Mineral Resources (to those utilised in the FS) within trucking distance of the ANP all of which are in various stages of development. These resources may be used to extend the life of the plant for the Project or may be used to upgrade feed when and if they are developed. The resources are summarised in Table 1-8.
Table 1-8 Additional resource available for the Project
Resource name
CIM classification
Mineral Resource size (Mt)**
Cut-off used (Ni %)
Average nickel
grade (%)
Average cobalt
grade (%)
Report published
Issuer
PQNW, Lontra, Oito, Raimundo
Inferred 19.72 0.90 1.17 0.064 This report HZM
Pau Preto Inferred 13.63 1.0 1.38 0.081 2008 HZM-Xstrata - Historical
Serra do Tapa
Measured + Indicated
54.3 1.0 1.45 0.055 2008 HZM-Xstrata - Historical
Inferred 2.6 1.0 1.36 0.055 2008 HZM-Xstrata - Historical
Vermelho
Measured + Indicated
167.8 0.9NiEq 1.01 0.06 2018 HZM-Vale - Historical
Inferred 2.8 0.9NiEq 0.94 0.05 2018 HZM-Vale - Historical
Note: ** Includes Limonite, Saprolite and Transition
Additional opportunities are listed below.
1.18.2 Increased plant capacity
The highest value opportunity for the Project is to utilise more of the significant high-grade Mineral Resource from the existing eight ANP deposits by increasing the capacity.
1.18.3 Utilisation of the Limonite Resource
As part of the current mining schedule the upper 3 m to 4 m of the laterite profile (limonite material) will be mined and stockpiled for future use as it is not possible to process this material through the current RKEF flowsheet. A significant resource of high-grade limonite is available across the Project area, there may be the future possibility of implementing an acid leach circuit to recover the nickel and cobalt from this limonite material that can either be sold as mixed nickel-cobalt hydroxide precipitate (MHP) product or added into the refining process to produce additional nickel units. The current limonite resource for the ANP is 20.7 Mt grading 1.13% nickel and 0.12% cobalt (0.9% nickel cut off).

Horizonte Minerals Plc Araguaia Nickel Project Technical Report
Final November 2018 Page 37 of 342
2 INTRODUCTION
2.1 Overview
This report is a National Instrument 43-101 (NI 43-101) Technical Report on the Feasibility Study (FS) of the Horizonte Minerals Plc (HZM or “the Company”) wholly owned Araguaia Nickel Project (ANP or “the Project”). The Project is located in the north-western Brazilian state of Pará, approximately 760 kilometres (km) south of the state capital Belém.
This report has been compiled by Snowden Mining Industry Consultants (Snowden) for HZM. HZM is the Project owner and is currently developing the Project. This report provides Mineral Resource and Mineral Reserve estimates, and a classification of resources and reserves prepared in accordance with the Joint Ore Reserves Committee (JORC) 2012.
A Prefeasibility Study (PFS) was lodged with SEDAR by HZM in September 2016. Based on the outcome of the PFS, HZM decided to progress the Project to FS level and address the key recommendations and risks identified in the PFS. A PFS was lodged with SEDAR by HZM in October 2016.
Events that have occurred subsequent to the lodging of the PFS in September 2016 that are addressed in the FS, include:
• Completion of a trial mine program to assess mining modifying factors, grade control and geotechnical assumptions, and to extract a bulk sample
• Additional metallurgical testwork including testwork bulk samples in a pilot plant
• Geotech drilling and test pits on key infrastructure and process plant sites
• Detailed surveys of powerline and road routes
• Social and environmental programs, lab work, field campaigns and consultations
• Significant progress on project permits/approvals
• Detailed engineering and cost estimation appropriate for an FS
• Ferronickel (FeNi) market study.
Unless otherwise stated, information and data contained in this report or used in its preparation has been provided by HZM.
The information, conclusions, opinions, and estimates contained herein are based on:
• Information available to Snowden at the time of compiling this Technical Report including previous Technical Reports prepared on the Project and associated licences within the Project
• Assumptions, conditions, and qualifications as set forth in this Technical Report
• Data, reports, and other information supplied by HZM and other third-party sources.
The report contains capital and opex estimates with a combined accuracy of -10%/+15% with a confidence level of 50%.
The Qualified Persons have not carried out any independent exploration work, drilled any holes or carried out any sampling and assaying on the Project, other than examining/verifying mineralisation and rock conditions in drill cores. The Qualified Persons for preparation of the report are: Frank Blanchfield, who visited the Project site on three occasions between March 2016 and May 2017; Andrew Ross, who conducted a site visit in November 2012; Francis Roger Billington, who conducted a site visit in February 2014; and Nicholas Barcza, who conducted a site visit during March 2017.
The responsibilities of each author are provided in Table 2-1.

Horizonte Minerals Plc Araguaia Nickel Project Technical Report
Final November 2018 Page 38 of 342
Table 2-1 Responsibilities of each co-author
Author Employer Employee title
Responsible for section(s)
Site visit Site visit undertakings
Frank Blanchfield
Snowden Mining Industry Consultants (“Snowden’)
Principal Consultant
1, 2, 3, 4, 5, 15, 16, 18, 19, 20, 21, 22, 23, 24, 25, 26, 27
On three occasions between March 2016 and May 2017
Visit pit areas including VDS and stayed at Conceição do Araguaia in the south and the previous Xstrata camp near Vila Sao Jose in the north. Inspected core. Supervision of trial mining of test pit.
Andrew Ross
Snowden Executive Consultant
6*, 7*, 8*, 9*, 10*, 11*, 12*, 14
November 2012 The visit served as an introduction to the geological setting of the deposits and operating procedures of HZM in respect of core drilling, surveying, logging, security, transport, subsampling and density measurements.
Matheus Palmieri
Self-employed
Consultant 6^, 7^, 8^, 9^, 10^, 11^, 12^
ANS: Over 8 times from August 2018 – January 2020; ANN: 5 times from August 2018 – January 2020
ANS: On site visits as part of high-level supervision of all aspects of the geology exploration and evaluation programmes. ANN: On site visits as part of high-level supervision of all aspects of the geology exploration and evaluation programmes.
Nicholas Barcza
Self-employed
Independent Consultant
13 April 2015
March 2017
April 2015: Attended the pilot plant campaign at Morro Azul.
March 2017: Araguaia North site to see the location of the deposits and to Araguaia South and visit site of plant and mine and trial mining followed by wrap up meeting and review of potential risks.
David Haughton
Canadian Engineering Associates Ltd
Consultant 17.1 to 17.5 No site visit performed; as the focus of this QP was the plant flow sheet and process design.
N/A
Robin Kalanchey
Ausenco Engineering Canada Inc
Director, Minerals and Metals – Western Canada
21.2.4 and 21.3.5
July 2018 Reviewed core logging facility, visited process plant and water reservoir locations, traveled access roads, visited raw water supply location, stayed in community of Conceição do Araguaia
Note: * Qualified Person for the ANS portion of the chapter content
^ Qualified Person for the ANN portion of the chapter content
Unless otherwise stated, all currencies are expressed in US dollars (US$).
2.2 Issuer – Horizonte Minerals Plc (HZM)
HZM is an AIM and TSX-listed nickel development company focused on Brazil which wholly owns the advanced Araguaia ferronickel project. The Company is planning to develop the ANP into a major ferronickel mine in Brazil, with targeted production in 2021. ANP detail has been discussed extensively in this Technical Report.

Horizonte Minerals Plc Araguaia Nickel Project Technical Report
Final November 2018 Page 39 of 342
The Company also has a 100% interest in the Vermelho Project (acquired from Vale S.A. in December 2017). Vale S.A. completed a full FS which demonstrated a nameplate capacity of 46,000 tonnes of nickel per year and 2,500 tonnes of cobalt per year. In 2018, HZM plans to complete testwork to produce a battery grade product, advance permitting and deliver a Preliminary Economic Assessment. Vermelho is located in the Carajás region in the state of Pará, north-eastern Brazil, 70 km south of the Carajás region.
The Company was founded on January 16, 2006, with shares listed on the Alternative Investment Market of the London Stock Exchange (AIM) and on the Toronto Stock Exchange (TSX). The Company is incorporated and domiciled in the United Kingdom, with registered office at Rex House, 4-12 Regent Street, London SW1Y 4RG.
As of 30 November 2018, the Company’s institutional shareholder structure included Teck Resources Limited, Canaccord Genuity Group, Richard Griffiths, Lombard Odier Asset Management (Europe) Limited, JP Morgan, City Financial, Hargreaves Lansdown and Glencore.
2.3 References
All references are listed in Section 27.

Horizonte Minerals Plc Araguaia Nickel Project Technical Report
Final November 2018 Page 40 of 342
3 RELIANCE ON OTHER EXPERTS
For the purposes of this report, Snowden has relied on ownership and title information provided by HZM. Snowden has not researched property title or mineral rights for the Araguaia Nickel Project and expresses no opinion as to the ownership status of the property. The description of the property, and ownership thereof, as set out in Section 4 in this technical report, is provided for general information purposes only.
Snowden and the Qualified Persons are reliant on HZM for the financial model estimates and results and the disclosed nickel price of US$14,000/t Ni. The risks associated with the nickel pricing are disclosed analysed in Section 24 in the price sensitivity discussion.
Except for the purposes legislated under provincial securities laws, any use of this report by a third party is at that party’s sole risk.
Information sources and other parties relied upon to provide technical content and review are shown in Table 3-1.
Table 3-1 Other parties relied upon to provide technical content and review
Information supplied Other parties Sections
Ownership, title, social and environmental studies and information
ERM Brazil, HZM, London 4, 5, 6, 7, 8, 9, 10, 11, 12, 14, 15, 16, 20, 23, 24
Infrastructure capital and opex estimates
Prime Resources SA, Construserv Brazil. SM&A Brazil. Steinweg Logistics Brazil, Enecel Brazil
18, 21, 22
Marketing report Wood Mackenzie 19, 22
Financial modelling HZM 22
Taxation and royalties L&M Assessoria 21, 22

Horizonte Minerals Plc Araguaia Nickel Project Technical Report
Final November 2018 Page 41 of 342
4 PROPERTY DESCRIPTION AND LOCATION
4.1 Introduction
The Project can be divided into Araguaia Nickel North (ANN) and Araguaia Nickel South (ANS).
The ANN section comprises the Vale dos Sonhos (VDS) deposit.
ANS comprises the following deposits:
• Jacutinga (JAC)
• Vila Oito West (VOW)
• Vila Oito (VOI)
• Vila Oito East (VOE)
• Pequizeiro (PQZ)
• Pequizeiro West (PQW)
• Baião (BAI)
The combined ANS and ANN areas comprise 16 exploration licences in four non-contiguous blocks, with a total area of approximately 1,100 km2 (110,000 hectares) all 100% owned by HZM. All licences are held under one Brazilian company, 100% owned by HZM.
ANP’s permit process is well advanced and the Project is on the pathway to the construction-ready phase. To move from the exploration and development phase through to the construction phase, HZM must continue permitting along two parallel pathways. These pathways are the mining permit and environmental permit, and each is managed by separate and independent public authorities: National Mining Agency (Agência Nacional de Mineração – ANM); and the State Secretariat for Environment and Sustainability of Pará (SEMAS) for the environmental permit.
The ANS infrastructure is further advanced along the permitting pathway than ANN and supports mining operations for the initial eight years of the planned operations. Mining in ANN is scheduled to commence in Year 8 of the current mine plan.
4.2 Location
The Project is centred approximately 40 km northwest of the town of Conceição do Araguaia (population of 46,206), approximately 25 km west of the north-south trending Araguaia River (Figure 4-1) and 10 km east of the Arraias do Araguaia River.
ANS is centred about the following coordinates, for a SAD 69 Datum:
• LAT 07° 54’ 7.48” S / LON 49° 26’ 0.26” W
• UTM 22S 9126200 N /672700 E.
ANN is located approximately 80 km north of ANS, in the municipality of Xinguara, in south-eastern Pará state, northern Brazil, approximately 22 km west of Vila Sao José do Araguaia (Pará) and 70 km east of Xinguara’s urban area, with Maraba some 150 km to the north.
ANN is centred about the following coordinates, for a SAD 69 Datum:
• LAT 7°03’S / LON 49°21’W
• UTM 22S 9220400 N / 682250 E.
The Carajás mineral province (Mining District), situated approximately 200 km northwest of the Project and approximately 100 km northwest of ANN, is host to a number of world-class iron ore and nickel laterite deposits. Carajás is the main centre of mining activity in the Pará State (Figure 4-1).

Horizonte Minerals Plc Araguaia Nickel Project Technical Report
Final November 2018 Page 42 of 342
Figure 4-1 Project location – infrastructure and other nickel laterite deposits
Source: HZM, 2016
Marabá is a major industrial city (population 262,0002) serving the Carajás Mining District, and it occupies a strategic position being crossed by five major highways as well as having a large logistics infrastructure with a port on the Tocantins River.
4.3 Licences and tenure
Brazil has a well-established permitting process for major mining projects, with a Mining Code and environmental legislation framework (CONAMA), which provides the support for companies to operate legally in the country.
HZM has operated for many years in Brazil with current exploration licences from both mining and environmental agencies across all ANP target areas.
4.3.1 Mining legislation overview
The main sources of mining legislation in Brazil are the Federal Constitution and the Mining Code (Decree-law No. 227 of 28 February 1967). The Mining Code defines and classifies deposits and mines, sets requirements and conditions for obtaining authorisations, concessions, licences and permits, the rights and duties of holders of exploration licences and mining concessions. There are two main legal regimes under the Mining Code regulating exploration and mining, i.e. the “authorisation” for exploration and the “concession” for mining.
2 Source: Instituto Brasileiro de Geografia e Estatistica (IBGE), 2015
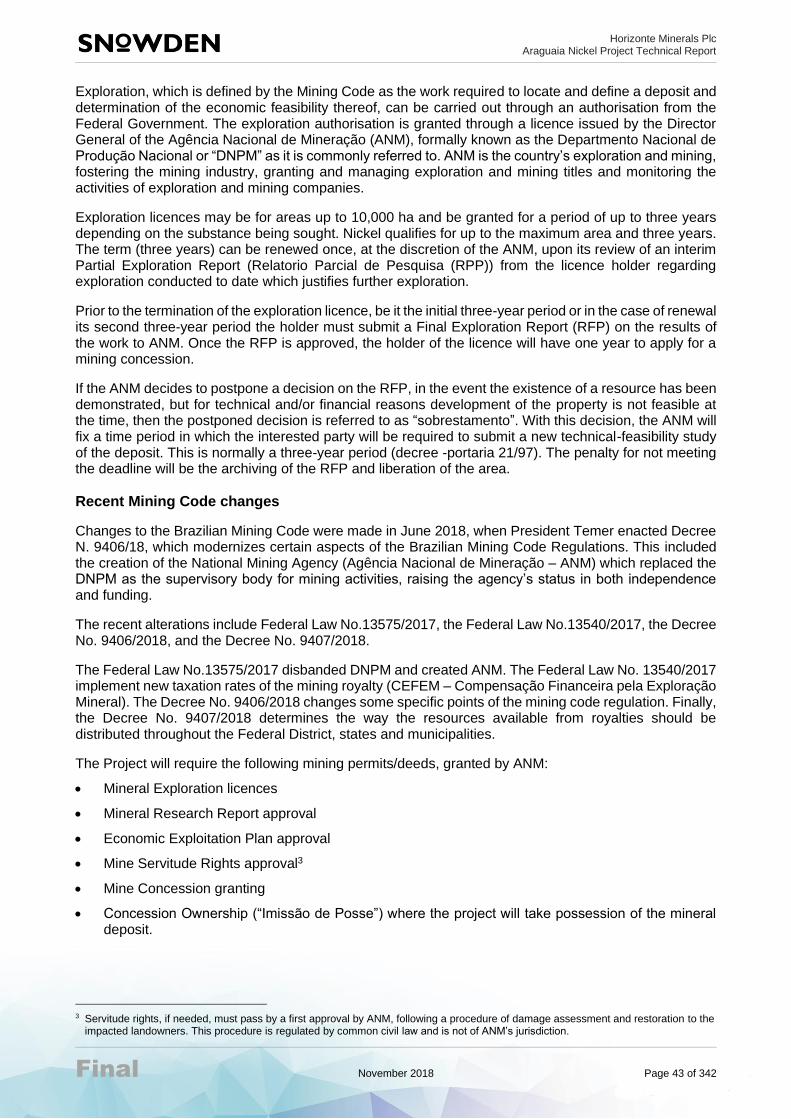
Horizonte Minerals Plc Araguaia Nickel Project Technical Report
Final November 2018 Page 43 of 342
Exploration, which is defined by the Mining Code as the work required to locate and define a deposit and determination of the economic feasibility thereof, can be carried out through an authorisation from the Federal Government. The exploration authorisation is granted through a licence issued by the Director General of the Agência Nacional de Mineração (ANM), formally known as the Departmento Nacional de Produçao Nacional or “DNPM” as it is commonly referred to. ANM is the country’s exploration and mining, fostering the mining industry, granting and managing exploration and mining titles and monitoring the activities of exploration and mining companies.
Exploration licences may be for areas up to 10,000 ha and be granted for a period of up to three years depending on the substance being sought. Nickel qualifies for up to the maximum area and three years. The term (three years) can be renewed once, at the discretion of the ANM, upon its review of an interim Partial Exploration Report (Relatorio Parcial de Pesquisa (RPP)) from the licence holder regarding exploration conducted to date which justifies further exploration.
Prior to the termination of the exploration licence, be it the initial three-year period or in the case of renewal its second three-year period the holder must submit a Final Exploration Report (RFP) on the results of the work to ANM. Once the RFP is approved, the holder of the licence will have one year to apply for a mining concession.
If the ANM decides to postpone a decision on the RFP, in the event the existence of a resource has been demonstrated, but for technical and/or financial reasons development of the property is not feasible at the time, then the postponed decision is referred to as “sobrestamento”. With this decision, the ANM will fix a time period in which the interested party will be required to submit a new technical-feasibility study of the deposit. This is normally a three-year period (decree -portaria 21/97). The penalty for not meeting the deadline will be the archiving of the RFP and liberation of the area.
Recent Mining Code changes
Changes to the Brazilian Mining Code were made in June 2018, when President Temer enacted Decree N. 9406/18, which modernizes certain aspects of the Brazilian Mining Code Regulations. This included the creation of the National Mining Agency (Agência Nacional de Mineração – ANM) which replaced the DNPM as the supervisory body for mining activities, raising the agency’s status in both independence and funding.
The recent alterations include Federal Law No.13575/2017, the Federal Law No.13540/2017, the Decree No. 9406/2018, and the Decree No. 9407/2018.
The Federal Law No.13575/2017 disbanded DNPM and created ANM. The Federal Law No. 13540/2017 implement new taxation rates of the mining royalty (CEFEM – Compensação Financeira pela Exploração Mineral). The Decree No. 9406/2018 changes some specific points of the mining code regulation. Finally, the Decree No. 9407/2018 determines the way the resources available from royalties should be distributed throughout the Federal District, states and municipalities.
The Project will require the following mining permits/deeds, granted by ANM:
• Mineral Exploration licences
• Mineral Research Report approval
• Economic Exploitation Plan approval
• Mine Servitude Rights approval3
• Mine Concession granting
• Concession Ownership (“Imissao de Posse”) where the project will take possession of the mineral deposit.
3 Servitude rights, if needed, must pass by a first approval by ANM, following a procedure of damage assessment and restoration to the
impacted landowners. This procedure is regulated by common civil law and is not of ANM’s jurisdiction.

Horizonte Minerals Plc Araguaia Nickel Project Technical Report
Final November 2018 Page 44 of 342
Under the Brazilian Mining Law, there is a compulsory land access mechanism granting surface land rights to mining projects in the event that suitable terms cannot be agreed between the landowner and Company. A Mining Servitude is required from ANM to implement this mechanism. HZM has submitted the Mining Servitude request together with the Mine Plan (Plano de Aproveitamento Econômico) to ANM. However, the Company intends to negotiate amicable agreements with all landowners, including families that reside on the land without any legal surface ownership rights according to Brazilian law. For that reason, a Land Access Strategy and Resettlement Action Plan were developed with guidelines to obtain surface rights in a fair and transparent manner.
4.3.2 Licensing details
ANP is wholly owned by HZM through its Brazilian subsidiaries, Araguaia Niquel Mineração Ltda., Typhon Brasil Mineração Ltda, and Trias Brasil Mineração Ltda. The licences HZM have that are relevant to the Project comprise five exploration licences encompassing an area of approximately 140 km2 that extends approximately 120 km in a north-south direction, and 20 km in an east-west direction.
The ANN licence is owned by HZM through its Brazilian subsidiary who acquired the licence on 28 September 2015.
In April 2017, HZM through its Brazilian subsidiary filed a new Final Exploration Report complementary study establishing economic viability of the Project and requesting approval of the Final Exploration Report. ANM published approval containing all the deposits to be mined in the FS on 3 November 2017. The Mine Plan, Mining Servitude and Mining Concession request for ANS have all been submitted to ANM.
Tenement details are presented in Figure 4-2 and Table 4-1 below.

Horizonte Minerals Plc Araguaia Nickel Project Technical Report
Final November 2018 Page 45 of 342
Figure 4-2 Project licence map
Source: HZM, 2017

Horizonte Minerals Plc Araguaia Nickel Project Technical Report
Final November 2018 Page 46 of 342
Table 4-1 Licences relevant to the Project
Process ID Title holder Area ha Licence
publication date Deadline Comment
850.421/2004 Araguaia Niquel Metais Ltda
567.90 23-Feb-2006 3-Nov-18 Plan for economic development filed on 25/09/2017
850.493/2005 Typhon Brasil Mineração Ltda
1598.89 24-Apr-2007 3-Nov-18 Plan for economic development filed on 31/10/2018
850.514/2004 Araguaia Niquel Metais Ltda
3079.48 17-Feb-2005 3-Nov-18 Plan for economic development filed on 25/09/2017
850.516/2004 Araguaia Niquel Metais Ltda
5401.66 17-Feb-2005 3-Nov-18 Plan for economic development filed on 25/09/2017
850.517/2004 Araguaia Niquel Metais Ltda
3210.28 17-Feb-2005 3-Nov-18 Plan for economic development filed on 25/09/2017
In Table 4-1, all licences are in good standing. The dates shown in column 5 represent the most recent ANM reporting or other action to be taken for each process. These were addressed by HZM as shown in the comment column.
HZM has not acquired any surface land rights for the Project but the company has agreements in place with the principal landowners for surface access rights covering the main deposits. Under the Brazilian Mining Law there is a compulsory purchase mechanism for surface land rights over mining projects in the event that suitable terms cannot be agreed between the landowner and Company. HZM currently has good working relationships with the principal landowners.
4.4 Agreements and encumbrances
Agreements are in place with local farm landholders that allows access to land and conduct exploration with the minimum of disturbance, and progress to the construction licence stage.
4.5 Environmental obligations
The Project will require three main environmental permits to be issued by SEMAS, under Federal Law No. 6938/1981:
• Preliminary Licence (Licença Prévia – LP): issued on approval of the project design and project environmental impact assessment/studies;
• Construction Licence (Licença de Instalação – LI): required prior to construction starting, issued on approval of management plans to control and mitigate social and environmental impacts;
• Operating Licence (Licença de Operação – LO): required prior to operations starting, issued on satisfactory discharge of licence conditions issued by the regulator.
For SEMAS, the maximum term for any type of licence (LP, LI or LO) cannot exceed five years. According to State Law 5887 of 9 May 1995 Article 94, § 2 – The Preliminary, Construction/Installation and Operation Licences shall be issued for a certain time, to be determined by the environmental agency, and in no case may exceed five years. The State Secretariat for Environment may visit and inspect the operation conditions to verify if the project and schedule comply with information formally presented to the agency. Whilst the LI for ANS consists of pits that will be opened beyond the fifth year, the mine plan forms part of the total licence process and new pits can be opened in accordance with the mine schedule submitted to SEMAS. These pits will be opened once the licence has moved to LO phase.
The LO must be periodically renewed throughout the life-of-mine operation. This process involves presenting Environmental Performance Assessment Reports (RADA).

Horizonte Minerals Plc Araguaia Nickel Project Technical Report
Final November 2018 Page 47 of 342
To obtain the LP, an assessment of environmental risks and impacts is required. This should be conducted in line with Brazilian regulations4. Most projects are required to prepare an Environmental Impact Study (Estudo de Impacto Ambiental – EIA) and an Environmental Impact Study summary report (Relatório de Impacto Ambiental – RIMA). The outcome of these reports is discussed in public hearings with affected parties and stakeholders. LP is issued when the EIA is approved by SEMAS.
The Environmental Agency may establish specific procedures for environmental licensing, depending on the site’s natural characteristics and on the peculiarities of the project. The Agency will also guarantee that each phase of the permitting will be compatible with the planning, construction, and operation stages of the licensed activity. Simplified procedures may be established for projects and activities that have a low potential for environmental impact, in which the EIA/RIMA is replaced by a Simplified Report (for instance, a Relatório Ambiental Simplificado – RAS).
4.5.1 Authorisations required for environmental licensing
A number of additional ancillary licences and/or certificates are required to be obtained as part of the Brazilian environmental licensing procedure. These include registrations with the local Municipal governments; approvals from IPHAN (Brazil’s National Historic and Artistic Heritage Institute) and state heritage agencies, and Health Surveillance Secretary (SVS/MS) when the activity or project is located in malaria area.
In the case of the ANP, FUNAI (Brazil’s National Indian Foundation) and the Palmares Foundation (Afro-Brazilian cultural foundation) are not relevant, as there are no Indigenous reserves within 10 km of the area. Additionally, no “Buffer Zone” Conservation Units, such as State/Federal forests are within the region of the Project.
To obtain the LI, a set of additional documents must be submitted. These may include the Socio-Environmental Control Plans (Planos de Controle Ambiental – PCAs).
Brazil’s National Historic and Artistic Heritage Institute (IPHAN - Instituto do Património Histórico e Artístico Nacional) is the legal agency responsible for approving archaeological studies and salvage works by its state divisions.
Activities relevant to the ANP environmental licence process include:
• Public hearing
• Environmental compensation
• Vegetation clearance
• Water licence
• Specific aspects of concession and environmental licensing for mining (Mining Servitude allowing legal rights to the Mining company for land access to exploit minerals)
• PCA (Planos de Controle Ambiental)
• Degraded Areas Recovery Plan or Project (PRAD) and Mine Closure Plans (PAFEM).
The four main parts of the Project (ANS, ANN, the water pipeline and transmission line) are at different stages of permitting. Mining operations will commence first at ANS hence permitting is furthest progressed there. The preliminary licence (LP) has been granted and applications for the mine LI and for approval of the mine plan and economic development plan (PAE) submitted for ANS. An application for the water pipeline LI has been submitted. Work to prepare the LP for ANN and both the LP and LI for the transmission line are underway.
HZM has obtained the necessary permits and authorisations to conduct exploration in ANS and ANN. The LO for exploration at ANS was renewed in 2017 for a period of five years and the LO for exploration at ANN was obtained for the first time since acquisition of the Glencore Araguaia Project in 2017.
4 Federal Constitution of 1988; Federal Law 6938/1981; CONAMA Resolution 01/86; CONAMA Resolution 237/ and other relevant
regulations.

Horizonte Minerals Plc Araguaia Nickel Project Technical Report
Final November 2018 Page 48 of 342
In April 2017, HZM through its Brazilian subsidiary filed a new Final Exploration Report complementary study establishing economic viability of the project and requesting approval of the Final Exploration Report. ANM published approval containing all of the deposits to be mined in the FS on 3 November 2017. The Mine Plan, Mining Servitude and Mining Concession reports/ request for ANS have all been submitted to ANM.
In 2014, HZM commenced the EIA through its Brazilian subsidiaries, Araguaia Niquel Mineração Ltda. The integrated EIA RIMA was the commencement of moving ANS from an exploration licence phase towards a project development phase within the environment agency. HZM was awarded the LP (14/0000016231) for the ANS infrastructure in 2016, including industrial plant and seven open-cast pits, all 100% within the Conceição do Araguaia Municipal. The preliminary water-permit for abstraction from the Arraias River was also granted as part of the LP process.
In 2017, HZM submitted the environmental contral plans (PCAs) through its Brazilian subsidiaries, Araguaia Niquel Mineração Ltda. ERM were the lead consultants responsible for drafting the PCAs and LI submission. The PCAs and LI submission signified the movement of ANS from a project development to a project construction phase.
HZM submitted the LI (17/0000030510) for the ANS infrastructure in 2017, including industrial plant and seven open-cast pits, all 100% within the Conceição do Araguaia Municipal. The definitive water permit (17/0000030422) was granted for abstraction of 350m3/hr from the Arraias river in 2018.
Permit summary
ANP’s permit process is advanced. The Project is on schedule towards construction-ready phase. All permits are either approved or anticipated for approval within the planned project schedule.
ANS permitting is well advanced, whilst mining and environmental permits for ANN infrastructure are on schedule for approvals prior to Year 8 of the mine schedule (Table 4-2). HZM is progressing the Transmission Line LP and LI together, with receipt of permits all scheduled for award in line with the implementation schedule.
Table 4-2 ANS Major Permit summary to construction-ready phase
Mining Permit Pathway to construction-ready Environmental Permit Pathway to construction-ready
The project will require the following mining permits/deeds, granted by ANM:
Mineral Prospecting Licences (granted)
Mineral Research Report approval (granted)
Economic Exploitation Plan approval (submitted, under review)
Mine Servitude Rights approval (submitted, under review)
Mine Concession grant.
The project will require the following environmental permits/deeds, granted by SEMAS:
Preliminary Licence (granted)
Preliminary Water Use Permit (granted)
Construction Licence or LI (submitted, under review)
Definitive Water Use permit (granted)
Water Dam Permit (granted)
Water Permit for pit dewatering (submitted, under review)
Vegetation Clearance Approval (submitted, under review)
Water pipeline Preliminary and Installation Licence (submitted, under review).
Source: ERM, 2018
Note: Servitude rights, if needed, must pass by a first approval by ANM, following a procedure of damage assessment and restoration to the impacted landowners. This procedure is regulated by common civil law and is not within ANM’s jurisdiction.
Table 4-3 summarises the current status of permit applications for the Project, by main project component.

Horizonte Minerals Plc Araguaia Nickel Project Technical Report
Final November 2018 Page 49 of 342
Table 4-3 ANP permitting status
Permit/Authorisation Agency Project component
Status
Exploration Licence (Alvará de Pesquisa)
ANM (850493/2005; 850514/2004; 850421/2004; 850517/2004; 850516/2004)
ANS and ANN Granted
Final Exploration Report (Relatório Final de Pesquisa Mineral)
ANM ANS Granted – Mineral Research Report approval in Nov/2017
Mine Plan (PAE) – Economic Exploitation Plan
(Requerimento de Lavra – Plano de Aproveitamento Econômico)
ANM
ANS
ANN
ANS
ANN
Submitted Q4 2017
To be submitted Q4 2018
Expected Q4 2018
Expected Q4 2019
Authorisation of the Mine Servitude Rights (Servidão Mineral)
ANM
ANS
ANN
ANS
ANN
Submitted Q4 2017
To be submitted in Q4 2018
Expected Q4 2018
Expected Q4 2019
Preliminary Licence (LP) (Licença Prévia) SEMAS
(14/0000016231) ANS Granted 2016
Construction Licence (LI) (Licença de Instalação)
SEMAS (17/0000030510)
ANS Submitted Sep 2017
Expected Q4 2018
Vegetation Clearance Authorization (ASV)
(Autorização para Supressão Vegetal) SEMAS ANS
Submitted
Expected Q4 2018
Fauna Rescue Authorization
(Autorização para Resgate de Fauna) SEMAS
ANS and water pipeline
Submitted
Expected Q4 2018
Fauna Monitoring Authorization
(Autorização para Monitoramento de Fauna) SEMAS
ANS and water pipeline
Submitted
Expected Q4 2018
Water abstraction grant (Outorga captação de água)
SEMAS (17/0000030422)
ANP Granted 2018
Water grants (Outorgas para uso de água) SEMAS Dewatering 7 pits
Submitted Q4 2017
Expected Q4 2018
Cooling dam Granted Q4 2018
Archaeological Project Approval
(Projeto de Arqueologia) IPHAN ANS Granted 2018
Mine Concession (Portaria de Lavra) ANM ANS Expected Q1 2019
Operating Licence (Licença de Operação) SEMAS ANS Expected during ramp-up 2021
LP and LI Water Pipeline
(Licença Prévia e Licença de Instalação para Adutora)
SEMAS ANP Submitted Q4 2017
Expected Q1 2019
LP and LI Energy Transmission Line
(Licença Prévia e Licença de Instalação para a Linha de Transmissão de Energia Elétrica)
SEMAS ANP
Environmental Study commenced June 2018
Submission Q1 2019
Expected Q4 2019
LP Araguaia North (Vale dos Sonhos pit)
(Licença Prévia cava Vale dos Sonhos) SEMAS ANN
Environmental Study commenced Q3 2018
Submission expected Q3 2019
Additional licences may be necessary at the construction and operational phases. These licences cover authorisations from the local municipality, authorisations to use restricted chemicals, and H&S licences including fire department authorisations and specific sanitary procedures (Table 4-4). Applications for these ancillary permits will commence upon award of the LI from SEMAS (anticipated Q4 2018/Q1 2109).

Horizonte Minerals Plc Araguaia Nickel Project Technical Report
Final November 2018 Page 50 of 342
Table 4-4 Additional ancillary licences for the construction and operational phases
Other permits (general list)
Required for Estimated time to award
(legal deadline)
INCRA’s authorisation Authorises the use of state-given farms for the venture installation
30–60 days *
Fuel deposits installation – Environmental Simplified Report (with its own LP/LI/LO) in SEMAS 11/2011
To build fuel tanks and fuel supply facilities for mining machinery
60 days average
Authorisation of Fuel Supply Facility Operation To operate fuel supply facilities 30–60 days*
Federal Technical Registration (CTF) To operate in conformity with environmental laws
Immediately
Registration at Federal Police (CRC) Chemical controlled products management
30–60 days *
Certificate of Operation Licence of Federal Police 30–60 days *
Certificate of Registry at Brazilian Army (CR) Controlled products management (including explosives and chemicals)
90 days
International Imports Certificate CII type
Controlled products management – chemical products that may be exported/imported
90 days
Licence to Operate Telecommunication Station To operate telecommunication station at the plant
30-60 days *
SISFLORA – Registry of Consumers and Explorers of Forestry Products
To use timber for civil construction and other forest obtained products
60 days average
Certificate of Conformity of Measurements and Scales Registry
To prove the scales used by the enterprise are calibrated (bulk commerce)
30–60 days *
Registry on Regional Engineering Council To operate in conformity with technical laws (mining and building)
30 days
Registry on Regional Medicine Council To operate in conformity with H&S rules – Company’s ambulance & clinic
15–30 days
Sanitary Authorization for Ambulance procedures 30–60 days *
Ambulance Inspection Pass 30–60 days*
Registry of Alternative Water Supply for Human Consumption
To operate in conformity with H&S rules – drinking water
30–60 days*
Attestation of Fire Department Inspection To operate in conformity with H&S rules – fire safety
30–60 days*
Environmental Rural Cadastre (CAR) Registration of land ownership and environmental protected areas
Immediately after internet registration. Owner is
responsible for the veracity of the inserted data
City Hall Authorisation of work Authorises the operations 30–60 days*
Note: * Legal Deadlines based on the Law N. 9784/1999 – federal administration rules.
OBS: Road access depends on ANM declaration of Servitude Rights needs and Servitude Rights civil law prosecution.

Horizonte Minerals Plc Araguaia Nickel Project Technical Report
Final November 2018 Page 51 of 342
5 ACCESSIBILITY, CLIMATE, LOCAL RESOURCES, INFRASTRUCTURE AND PHYSIOGRAPHY
5.1 Access
The Project is centred approximately 07°37’S and 49°24’E or 675000E-9120000N) (Figure 5-1) and extends towards the south-eastern border of Pará State with Tocantins State. This location is approximately 40 km north of Conceição do Araguaia (population of 46,206) and is accessed by a network of unsealed roads branching eastward from the unsealed Conceição do Araguaia–Floresta road (PA 449) that passes through the Project. The area has a close reticulated system of earth roads servicing numerous cattle properties. The Project can also be reached by local flights from airports at Palmas (Tocantins State), and Redenção or via Belém/Marabá.
The ANN section is centred at 6°59’S and 49°19’W, approximately 80 km north of ANS in the municipality of Xinguara, in south-eastern Pará state, northern Brazil, approximately 22 km west of Vila Sao José do Araguaia (Pará) and 70 km east of Xinguara, with Marabá some 150 km to the north.
Access to the ANN section is by plane from Brasilia, to Maraba (Para) or Araguaina (Tocantins), then by road from Maraba (by highway PA-155, 195 km of paved road to Sapucaia, plus 70 km of unpaved road to the licence), or from Araguaina (by highway TO-222, 130 km of paved road, crossing the Araguaia River by ferry to Vila Sao Jose, plus 40 km of non-paved road to the Property). The ANN licence area is well served by dirt roads easily navigable in a 4x4 vehicle, whilst numerous farm tracks traverse the area making access reasonably easy. The municipality of Xinguara (population 41,000) is located 650 km south of the state capital Belem.
5.2 Proximity to population centres and transport
Population density within the whole Project area is sparse and comprises solely of isolated farms. The Project’s principal deposits are centred approximately 45 km north of the town and municipality of Conceição do Araguaia which has a population of 46,206 (IBGE, 2015), which hosts commercial and municipal services required to support the town population including hospitals, hotels, restaurants, food markets and other such amenities.
The town and municipality of Redenção is 110 km west of ANS section. Redenção is considered the nearest business centre and supports a population of 79,010 (IBGE, 2015) with additional amenities required to support a larger population and business centre.
Carajás, some 200 km to the northwest, is the railhead and point of loading for iron ore to be embarked at the deep-water port facilities of Sao Luis. The Tocantins River is being developed as a water transport route allowing barging between Maraba and the shipping port of Barcarena on the mouth of the Amazon.
The city of Goiania is approximately 1,200 km to the south and is the traditional business centre for most activities in the region. Goiania is 170 km southwest from Brasilia which is the federal capital of Brazil.
Transport in the region is typically vehicular traffic which includes road haulage for supply of goods to and from the region. In addition, there is an existing rail system which was predominately developed for bulk material handling to support the iron ore industry together with other agricultural and commercial goods.
The locks at the Tucuruí dam on the Tocantins River were commissioned in late 2012 and are still functional. However, the locks are barely used since the work necessary to make the Tocantins River, above the dam, safe for transportation has not been completed.

Horizonte Minerals Plc Araguaia Nickel Project Technical Report
Final November 2018 Page 52 of 342
Figure 5-1 Project location and regional infrastructure
Source: HZM, 2016

Horizonte Minerals Plc Araguaia Nickel Project Technical Report
Final November 2018 Page 53 of 342
5.3 Climate and length of operating season
According to the Köppen classification, the climate in the ANS area is equatorial super-humid Am type, very near the transition boundary for Aw. The average annual temperature is 26.3°C (Figure 5-2), with relative high humidity fluctuations between very rainy and very dry seasons going from 90% to 52%. The dry season from June to October is followed by heavy rain from November to May, with an annual rainfall of around 2,000 mm.
Statistics for this section are reported for the 53-year period from 1961 to 2013.
According to the National Meteorological Institute (INMET), the lowest temperature registered in Conceição do Araguaia was 9.2°C on 3 June 1964 and the highest temperature of 41.3°C was registered on 15 September 2010. The highest accumulated rainfall in 24 hours, 164.6 mm, was registered on 11 December 2000.
The maximum and minimum mean temperatures are shown in Figure 5-2.
Figure 5-2 Maximum and minimum mean temperature by month
Source: INMET
Average monthly precipitation is lowest in June to August (Figure 5-3), and highest over the period December to March.
Figure 5-3 Monthly precipitation mean by month
Source: INMET
The lowest cloud cover is reported for the period June to September, with highest cloud cover from November to March.
Figure 5-4 represents the average relative humidity, with a marginal drop over the July to September period.

Horizonte Minerals Plc Araguaia Nickel Project Technical Report
Final November 2018 Page 54 of 342
Figure 5-4 Average relative humidity by month (1961 to 2013)
Source: INMET
The climate in the ANN region is similar to that of the ANS region (ANS approximately 80 km south of ANN). The ANN regional climate is tropical and humid with two well defined seasons; rainy (summer) and dry (winter), with average temperatures of approximately 25°C (maximum temperature around 32°C and minimum temperature around 21°C). The relative humidity is high (98% in the rainy season and 52% in the dry season), with an average of 75%. Annual rainfall is on average approximately 1,600 mm with at least 25% of the rain falling between February and April (the driest quarter is from June to August).
Consideration was given in the FS for the wetter periods that may affect mining and processing productivity.
5.4 Surface rights
As of the date of this report, HZM has not acquired any surface land rights for the Project. HZM has agreements in place with the principal landowners for surface access rights covering the area with the deposits and proposed plant site considered in the FS. Under the Brazilian Mining Code legislation, there is a compulsory purchase mechanism for surface land rights for mining projects in the event that suitable terms cannot be agreed between the landowner and Company. However, HZM has good working relationships with the principal landowners.
5.5 Infrastructure
5.5.1 Power
The area is well-serviced with a 500 kiloVolt (kV) transmission line currently linking the Tucurui power generation plant, which has a capacity of 8,300 megawatt (MW), to the national grid at Marabá, Imperatriz and Colinas. Colinas will connect to the Serra da Mesa power generation plant (with 1,300 MW generation capacity), and to the national grid in approximately five years. It will also link to Belo Monte power generation plant with an average generation capacity of 4,500 MW and the transmission line which currently has approximately 7,000 MW capacity and will expand to 11,000 MW.
Power for the whole Project will be via a grid connection at the Xinguara II and the construction of an approximately 122 km long, 230 kV transmission line from Xinguara II to the plant substation.
5.5.2 Roads
The main roads that connect the Amazonian region to the various waterways, ports, and train terminals throughout the country are the BR-153 (Belém-Brasília) and the BR-251. The BR-153 is a highway of approximate 4,335 km, connecting Rio Grande do Sul, in the south, to Pará in the north. Through the states of Goiás and Tocantins, the highway is paved and has good trafficability, except for a small stretch near Xambioá (TO), where the track is uneven. The BR-215 is a highway connecting Bahia to southern Mato Grosso state. This highway connects to BR-153 at Rialma (GO). In Goiás, the paved sections are discontinuous, with several areas occurring as graded natural bed.

Horizonte Minerals Plc Araguaia Nickel Project Technical Report
Final November 2018 Page 55 of 342
The ANS licence area is located some 150 km away from main BR-153 highway but is also supported by an existing road system. The Project area is supported by an existing infrastructure of dirt tracks used for access by local farms.
The ANN licence area is crossed by numerous unpaved roads that serve the local area and is some 60 km to the east of the main PA-155 highway running north-south between Marabá (to the north) and Redenção, via Xinguara, to the south.
In Year 8 of the Project, the 152 km route comprised of regional roads between ANS and ANN will be upgraded to enable haulage of approximately 5.4 million tonnes (Mt) of ore from VDS to the plant at ANS.
Marabá is a major industrial city (population 262,0005) serving the Carajás Mining District, and a strategic position being crossed by five major highways as well as having a large logistics infrastructure with a port on the Tocantins River.
5.5.3 Rail
Rail infrastructure consists of a network which is owned by VALEC-Engineering, Construction and Railways SA (Valec) which is a public company controlled by the Ministry of Transport.
The North–South railway (FNS) extends from Anápolis in the state of Goias to Açailandia in the state of Maranhão (see Figure 5-1). In Açailandia it is linked to the Carajás railway, which is used by Vale to transport iron ore to the port of Itaqui, in São Luis. The North-South (FNS) railway adds an additional 1,220 km to the rail system and passes approximately 180 km from the project site.
Currently the Carajas railway is used for transportation of pig iron, fertilisers, fuel and other goods as well as passengers between the towns of Paráuapebas and São Luis. There are three scheduled trains per week, along the distance of approximately 1,000 km, with travel time approximately 15 hours. However, delays of several hours are not uncommon.
5.5.4 Ports
Regionally, the Project is supported by existing port facilities at the port of Itaqui, in São Luis. This facility is well served by a railway and road infrastructure and is 1,150 km from the Project and is currently in use by Vale to support their Carajás operation.
The other major port is Vila do Conde located at Barcarena (PA), just southwest of Belem on the right
bank of the Para river, at Ponta Grossa, on the confluence of the Amazon, Tocantins, Guamá and Capim
rivers. This facility is well served by road infrastructure and is 880 km from the Project. Coke import and
export of alumina from Alunorte SA and Albras SA are among the major activities of the port.
Other port facilities exist but Itaqui and Vila do Conde provide the key location for inbound and outbound logistics for imports of bulk consumables, such as coal and potentially export of FeNi product.
5.5.5 Water
The provision of water for the project is described in Section 18.3. Water sources include river water, a closed-system for the plant and recycling effort from mine dewatering, water flows from waste and slag dumps and other catchments from facilities around the site. There are known periods of drought during the winter months. A water cooling dam will be constructed to provide a constant source of water to the process plant and act as a heat sink for the furnace. The water cooling dam will be fed by rainfall, runoff, return water from the process plant and water abstracted from the Arraias River. The dam will comprise of an earth core dam wall and spillway to retain 1.82 million cubic metres (Mm3) of water. Included in this facility is a pumping station and 3.7 km of 1,000 mm diameter high-density polyethylene (HDPE) pipe to pump water from the cooling dam to the plant (at a rate of approximately 3,500 m3/hr).
5 Source: IBGE, 2015
Horizonte Minerals Plc Araguaia Nickel Project Technical Report
Final November 2018 Page 56 of 342
It should be noted that less than half of the dwellings in Conceição do Araguaia have access to running water that meets World Health Organisation standards. The main water supply sources are wells or springs located on the properties. Other sources include rain water stored in cisterns, water trucks, dams or streams.
The Project does provide an opportunity for the proposed mine to provide technical assistance and counsel to the Municipal of Conceição do Araguaia for improving community access to clean water sources.
5.5.6 Mining personnel
It is anticipated that mining personnel for the proposed Project would be sourced from the population of Conceição do Araguaia and the general locale. The region already supports a mining community which provides an opportunity for the Project to attract a skilled workforce from operators through to technical and managerial staff. It is envisaged that additional skilled employees would be sourced throughout Brazil and internationally as the operational tolerances for processing and smelting will require a requisite high skillset.
5.5.7 Slag and waste dumps
The slag material was classified as inert and non-hazardous and will therefore not require an impermeable barrier containment system. Because the slag is in the form of small spherical beads it is susceptible to granular flow and therefore cannot be stacked. It must be contained within a repository.
The slag repository will comprise an integrated slag disposal area and a drainage management system which has a total LOM footprint of approximately 60 hectares (ha). The life of the slag repository is for an initial 28-year LOM plan, with a total capacity of 20.44 Mt (dry) being total mass of slag that will be produced over the LOM. This will be accommodated in a standalone dump with a separated drainage design. This is described in further detail in Section 18.
Waste rock from mining (defined as nickel grade less than 1.0%), is planned to be either disposed of in free standing external waste dumps 25% of the time or dumped by direct tipping in mined out pits. Each mining area has a planned waste dump sites. This is described in further detail in sections 16 and 18.
5.5.8 Communications
Cellular phone coverage is available in Conceição do Araguaia and the immediate surrounds but is intermittent to not available in the Project area. Internet connections are available at the HZM field office and in Conceição do Araguaia supported by local internet service providers.
5.6 Physiography
The Project area is characterised by undulating hill systems with elevated plateaus separated by shallow valleys with relief being typically in the region of 100 m to 200 m. The highest elevation of the Project area is 360 m (AMSL) and the lowest elevation is 150 m. The topography across the Project area is considered reasonably level with gentle gradients with a downward slope across the Project area, from west to east, towards the Araguaia River.
The original area is known as Cerrado and has never been considered part of the Amazon rainforest. Some of the plateaus are used for cash crops such as pineapple plantations with the lower lying areas predominantly used for cattle ranching.
Views of typical relief, vegetation and land use are presented in the following photographs Figure 5-5, Figure 5-6 and Figure 5-7 below.

Horizonte Minerals Plc Araguaia Nickel Project Technical Report
Final November 2018 Page 57 of 342
Figure 5-5 View to the southeast over Pequizeiro (main zone)
Source: Audet, MA, et al., 2012a
Figure 5-5 shows the large ferricrete plain surrounded by valleys (fault zones), contact to sediments to the west and east of the plain. The photo is taken from an elevated position (silicified zone) and shows semi-dense forest covering the centre zone of Pequizeiro (main).
Figure 5-6 View over the north part of Pequizeiro (main zone)
Source: Audet, MA, et al., 2012a
Figure 5-6 shows the view to the west, semi-dense forest at the border of mineralised zone, showing position of three drill rigs at the end of dry season (December 2010).

Horizonte Minerals Plc Araguaia Nickel Project Technical Report
Final November 2018 Page 58 of 342
Figure 5-7 Typical physiography of ANN licence area
Source: Osmond, JC, 2015

Horizonte Minerals Plc Araguaia Nickel Project Technical Report
Final November 2018 Page 59 of 342
6 HISTORY
6.1 Prior ownership
The Project area comprises two sectors: ANS located 25 km to the north of Conceição do Araguaia; and ANN a further 80 km to the north. The history of the mineral tenements that now comprise the Project are summarised as follows:
• HZM commenced exploration by way of regional stream sediment sampling in 2006. This resulted in the discovery of seven nickel targets and resulted in the awarding of three exploration licences in 2007, held 100% by HZM. Two contiguous licence areas then held by a private Brazilian company (LGA Mineração e Siderugia) were acquired in a partnership agreement with HZM in 2007. Collectively the five mineral tenements were known as the Lontra project covering 22,556 ha. The Lontra project included Northern Target, Raimundo Target, Southern and Morro Target (Figure 6-1).
• In July 2010, HZM entered into an agreement with Teck to acquire Teck Cominco Brasil S.A. which owned 100% of Teck’s Araguaia project. The merged Lontra and Araguaia tenements comprised 11 licences and licence applications covering 73,000 ha and eight significant mineralised zones. Around the same time HZM acquired the remaining 50% interest in the Lontra project not then held by HZM.
• In July 2011, in an agreement with Lara Exploration Ltd (Lara), HZM acquired 100% of the licences containing the Vila Oito West and Floresta discoveries.
• In September 2015, HZM concluded an agreement with Glencore to acquire the GAP licence area, containing VDS. This section comprised three exploration licences. On 15 October 2015, the DNPM approved the transfer of one of these licences (VDS licence) to a 100% owned subsidiary of HZM. This area comprises the ANN section.
Subsequent to the acquisition of the Teck Araguaia, Lara and Glencore VDS tenements, in excess of 16 targets are identified within the Project (Figure 6-1 and Figure 6-2).
6.2 ANS – historical exploration work undertaken
A general description of exploration work undertaken by previous owners or operators is discussed below. The following subsections 6.2.2 to 6.2.4 have been summarised from Audet, MA, et al (2012a).
6.2.1 Introduction
Exploration work for nickel laterite deposits historically consisted of geologic mapping, soil geochemical sampling (both surficial grab samples and/or shallow auger drilling); with subsequent reverse circulation (RC) and diamond core drilling (DDH).
The initial phases of exploration and discovery of nickel laterite mineralisation in the Araguaia Project area were reported by Lara (Barry, 2006). Subsequent to that report, exploration activities were carried out by Xstrata (formerly Falconbridge) until early 2007, Lara in 2007 and by Teck from September 2007 until November 2008.

Horizonte Minerals Plc Araguaia Nickel Project Technical Report
Final November 2018 Page 60 of 342
Figure 6-1 ANS target map
Source: HZM, 2018

Horizonte Minerals Plc Araguaia Nickel Project Technical Report
Final November 2018 Page 61 of 342
Xstrata, Lara and Teck all carried out regional geological mapping at various degrees of detail based on photo‐interpretation and geophysical image interpretation complimented by field reconnaissance. The outcrop in the region is generally poor, because of the widespread laterite hard cap cover and generally deep tropical weathering. The magnetic images proved to be particularly useful in this terrain as they readily outline the magnetic ultramafic bodies and late cross‐cutting mafic dyke structures that show a strong contrast with the regional non‐magnetic phyllite sequences.
The Xstrata airborne magnetics and radiometric survey covered the Vila Oito and Floresta blocks. This produced a high resolution, or high‐density survey, with flight lines flown at 100 m above the ground and with east-west orientated flight lines at 500 m spacing along the trend. The survey was flown in several stages (June 2004, February and June 2005) by Prospectors Ltd. In addition, Xstrata flew an area of 440 km2 in the Vila Oito Block using helicopter‐mounted Versatile Time Domain Electromagnetic (VTEM) survey system.
The data for the Vila Oito Block was made available to Lara when Xstrata pulled out of the joint venture. Lara was able to purchase the data for the Floresta Block and other areas of interest held in the region in early 2007. This data was an essential part of the database used by Lara to carry out an in‐house evaluation and target selection for priority nickel targets across some 300,000 ha of claims controlled by Lara in 2007. This data was made available to Teck on entering into a joint venture agreement with Lara and was also an integral component for their nickel laterite target definition program.
6.2.2 Lontra
The Lontra area had previously been claimed for phosphate and then iron ore, although to HZM’s knowledge no exploration was undertaken. While ultramafic bodies are known in the Araguaia Belt, the existing regional geologic maps had indicated that the Lontra area was underlain by packages of fine to coarse-grained clastic sediments.
6.2.3 Teck
Nickel exploration across the Teck Araguaia licence areas date back to the 1970s. During the period work conducted by CVRD (Docegeo) led to the discovery of a small ultramafic intrusive hosted nickel laterite deposit at Serra do Quatipuru.
In the 1990s, Rio Tinto Desenvolvimento Mineral (RTDM) conducted exploration for magmatic nickel mineralisation associated with ultramafic rocks in the region of Couto Magalhaes. Results of this work are unknown.
From 2006 until 2008, Teck completed five main stages of exploration, including geological sampling, airborne geophysical surveys, and drilling.
Auger and reverse circulation drilling
Teck completed 46 shallow auger drillholes for initial exploration purposes. Bottom-of-hole auger samples were typically less than 1 m due to limitations with auger penetration at depth (Bennell, 2010).
First pass irregular spaced exploratory RC drilling was undertaken by Teck in 2006 to test nickel-in-soil geochemical and airborne geophysical anomalies in identified target areas.
A total of 69 RC holes were drilled for 1,996 m testing five target areas at Baião, Pequizeiro, Jacutinga, Vila Oito West and Vila Oito. Positive drill results were returned for each target tested.
One-metre bulk RC samples were collected in marked plastic bags from the cyclone and transported to a RC receiving area on site. Bulk samples were chipped, with chipped 1.0 m intervals being stored in compartmentalised RC wood boxes similar to core boxes for logging and future reference.
At the RC receiving area 1.0 m samples were laid out on plastic sheets to sun-dry. Once dry samples were put through a Jones riffle splitter where 50% of the sample was spilt for dispatch to the laboratory for preparation and analysis.

Horizonte Minerals Plc Araguaia Nickel Project Technical Report
Final November 2018 Page 62 of 342
The remainder of the 1.0 m bulk sample was stored at the RC receiving facility on site or other Teck storage facility elsewhere. At present almost 100% of the Teck rejects, pulps and bulk samples, are stored in the HZM facility at Conceição do Araguaia.
Data from these drillholes have not been used in Mineral Resource estimates reported in this Technical Report.
Diamond drilling
Following positive results from the RC drill programs, 400 m x 400 m spaced diamond drilling took place at the Baião, Pequizeiro, Jacutinga, Vila Oito West and Vila Oito targets in 2007.
Where preliminary results from drill core were positive, 200 m x 200 m spaced diamond drilling was undertaken. In November 2008, having completed the diamond drilling over selected targets for a total of 489 holes and 11,404 m, Teck ceased exploration on the Project.
Teck diamond drillholes are included in the data subsequently provided by HZM to Snowden for Mineral Resource estimation. The average thicknesses of mineralised intercepts calculated at a 1.0% nickel cut-off-grade for the four main sectors range from 5.12 m to 7.55 m, with maximum thicknesses varying from 13.08 m to 21.30 m.
Teck drill core handling and processing involved similar steps to that described for HZM (Sections 10 and 11).
After sampling, remaining half drill core was retained and stored in the core box for future reference with sample intervals marked on the core box with the use of metal tags (Bennell, 2010).
In total, some 18,712 individual samples were taken and sent for preparation and analysis from the Teck drillholes comprising of 15,841 from DDHs and 470 from RC drillholes (numbers include quality control standards and blanks). The remaining 2,401 samples are believed to be from surface sampling.
Geological logging
Drill core was photographed and logged prior to sampling. Evidence suggests core was dry photographed only.
Drill core and RC geological logging intervals were determined by lithology rather than set intervals and recorded using hardcopy graphical logging sheets to capture pertinent geological information for each deposit including lithology, facies and texture.
Geological information recorded as handwritten sheets was then transferred to Microsoft Excel spreadsheets direct to an AcQuire database.
For geotechnical logging Teck recorded core recovery, rock-quality designation (RQD) and expansion.
Drill cores were routinely measured for magnetic susceptibility, using a Terraplus Inc. KT-9 digital magnetic susceptibility meter. Magnetic susceptibility was measured for all core at 20 cm intervals. This information was stored in the database for use in geological logging and further deposit analysis and interpretation.
Topographic survey
In 2006, Teck commissioned Prospectors Aerolevantamentos e Sistemas Ltda to undertake geophysical surveys across the Araguaia project area and as part of this survey a digital 10 m topographical coverage of the project area was also acquired. Data for the surveys were recorded using an RMS DGR 33A data acquisition system, a Magnavox/Leica MX 9212 twelve-channel GPS receiver mounted on a twin engine Piper Navajo/Chieftain PA31-350.
Teck drillholes were positioned with handheld GPS and surveyed using a differential global positioning system (DGPS).
No downhole surveys were conducted due to the short, vertical nature of the drillholes.

Horizonte Minerals Plc Araguaia Nickel Project Technical Report
Final November 2018 Page 63 of 342
6.2.4 Lara
Between 2006 and 2008, joint venture work with Falconbridge Ltd and, later Teck, resulted in the discovery of nickel laterite mineralisation at Vila Oito, between the Teck and Lontra discoveries, and at Floresta to the north.
In 2009, Lara reported that exploration programs on their Araguaia nickel project conducted since 2006 have identified bodies of nickel laterite mineralisation in the southern part of the Vila Oito licence block and in the southwest of the Floresta licence block, with 64 diamond drillholes and 55 auger drillholes completed to date (Lara, 2009).
Teck completed significant exploration immediately to the south and east of Vila Oito and in January 2009 presented a conceptual grade and tonnage estimate for the combined targets in their properties together with the Vila Oito target of Lara (now called Vila Oito West by HZM).
6.3 ANN – historical exploration work undertaken
A general description of exploration work undertaken by previous owners or operators is discussed below.
In 2003, Falconbridge Brazil Ltda (becoming Xstrata Nickel in August 2006) evaluated geological maps and geophysical images generated by Companhia de Pesquisa de Recursos Minerais (CPRM) in the 1970s. Based on this analysis, a series of areas were selected for reconnaissance work, including initially the Serra do Tapa and Pau Preto ranges before being expanded to include other areas including VDS. It should be noted that the licence area has no history of mining or intrusive exploration prior to 2003.
Xstrata Nickel continued the exploration with geological mapping and other nonintrusive forms of investigation (geochemical sampling, photo interpretation, geophysics etc.) in several areas along the orogenic Araguaia belt. The VDS deposit was discovered in 2004 by their exploration team at the foot of the prominent Cinzero UM ridge, where the Serra do Tapa deposit was subsequently discovered.
The potential for low land areas to host significant nickel laterite mineralisation was first recognised after analysing a thick ferricrete cover that was previously interpreted on government maps as a sedimentary formation. Following recommendations to proceed with detailed exploration work, soil/termite mound and rock chip geochemical surveys were completed along seven east-west oriented lines, and one line oriented north-south with 50 m point spacing. This work yielded encouraging results with nickel soil anomalies up to 10,000 ppm that supported continued exploration. Subsequently, magnetometric and radiometric surveys confirmed the presence of mafic-ultramafic bodies in the area and indicated regional continuity along the north-south direction.
6.3.1 Diamond drilling
At VDS, the discovery hole FCZ-04-24 was completed in November 2004 and intersected 14 m with an average grade of 1.9% Ni.
After 2004, Xstrata Nickel completed extensive drilling programs coupled with geological mapping. A total of 28,863 m was drilled in 839 diamond drillholes (HQ for 63.5 mm nominal diameter) and 20,829 samples generated (Figure 6-2).

Horizonte Minerals Plc Araguaia Nickel Project Technical Report
Final November 2018 Page 64 of 342
Figure 6-2 ANN target map
Source: HZM, 2018

Horizonte Minerals Plc Araguaia Nickel Project Technical Report
Final November 2018 Page 65 of 342
6.3.2 Reverse circulation drilling
A smaller RC drilling program was completed (July and August 2007) in selected “test zones” to evaluate different drilling techniques in terms of penetration rate, recovery and general performance in relation to the various geological facies encountered within the Araguaia deposits. These tests served as preliminary work for an infill drilling program on a 40 m x 40 m pattern. No significant variability was identified when compared to diamond drillholes.
6.3.3 Glencore
In May 2013, ownership of Xstrata was fully acquired by Glencore, initially becoming GlencoreXstrata plc. The Xstrata name was eventually phased out.
6.3.4 Historical Mineral Resource, Mineral Reserve estimates and production
At ANN, the historical Mineral Resource estimates were prepared in accordance with the CIM Definition Standards on Mineral Resources and Mineral Reserves as published in the GlencoreXstrata Resources and Reserves Report (31 December 2013) and compiled using geostatistical and/or classical methods, plus economic and mining parameters appropriate to each project.
The historic Mineral Resource estimates are now superseded (refer Section 14).
There are no historical Mineral Reserves or production to report in this section.
6.4 Other
Current and historical studies have been undertaken outside of the immediate Project area, which relate to the VDS road; general and bulk infrastructure; and environmental, logistics and social studies. Each has been discussed in the relevant sections of this Technical Report.

Horizonte Minerals Plc Araguaia Nickel Project Technical Report
Final November 2018 Page 66 of 342
7 GEOLOGICAL SETTING AND MINERALISATION
7.1 Regional geology
The Project lies within the north to south trending Neoproterozoic Araguaia Fold Belt (Figure 7-1).
The belt comprises metamorphosed and deformed marine-clastic sediments of the Tocantins Group and is split into two formations based on the degree of metamorphism present. The prospective areas of HZM are located in the western Couto de Magalhães Formation which contains weakly metamorphosed, marine pelites with local carbonate, iron-rich, and mafic to ultramafic bodies.
7.2 Project geology – ANS section
The local geology has largely been interpreted from airborne geophysical survey data, soil sampling data, mapping and core drilling by HZM and previous owners of the tenements. Various types of metasediments cover the vast majority of the licence area. Large plateau areas, varying in size from a few hundred square metres to several square kilometres, and generally capped with a hard iron-rich duricrust that is occasionally silicified are frequently developed over mafic and ultramafic bodies. These bodies and numerous northwest-southeast to north-south trending lineaments have been identified from magnetic data and outcrop. These bodies are often bounded by a siliceous breccia. Bodies of pillow lava and other volcanic material also exist. The area is cut by numerous mafic dykes.
A distinctive lateritic sequence is developed over ultramafic and mafic rocks within the Project area and the same sequence can be recognised at each of the target sites though the thickness and extent of each facies varies from location to location. The sequence can be split into six main facies types: soil, ferricrete, limonite, transition, saprolite and fresh rock, as well as numerous sub-facies.

Horizonte Minerals Plc Araguaia Nickel Project Technical Report
Final November 2018 Page 67 of 342
Figure 7-1 Regional geological map
Source: HZM, 2015

Horizonte Minerals Plc Araguaia Nickel Project Technical Report
Final November 2018 Page 68 of 342
7.2.1 Lithologies
The lithological facies of the laterite profile are described for ANS as follows:
Soil horizon
A dark brown layer rich in humus material constitutes the uppermost soil layer. This layer comprises occasional ironstones as well as organic material derived from the breakdown of plants and the networks of fine plant roots. The chemical composition of this layer is characterised by low nickel and magnesium oxide. The soil material forms a thin horizon that generally averages less than 1.0 m to 1.6 m in thickness and is absent in many places.
Ferricrete horizon
These facies comprise a hard, cohesive, red to yellow brown material, high in hematite/goethite and often containing magnetite with occasional chromite. Ferricrete is present as both an unconsolidated horizon with ubiquitous haematitic pisolites and a cemented goethite rich horizon containing distinctive worm burrows. Ferricrete is present in virtually all locations with thickness varying from absent to approximately 15 m; commonly 2 m to 3 m thick horizons are developed.
Limonite horizon
The limonite layer follows immediately below the soil or the ferricrete layer and consists of deeply weathered material. The upper part of the limonite, sometimes called “red limonite”, is a red-brown or more often, chocolate-brown clayey material with little internal structure although layering was observed. The material consists entirely of fine-grained minerals of silt to clay fractions, predominantly hydrated iron oxides.
The lower part of the limonite, sometimes called yellow limonite, is yellow-brown to orange coloured and generally has a more compact appearance than the red limonite. The yellow limonite rarely contains coarse fragments of weathered material. Both red and yellow limonite may be well developed; alternatively, only one sub-type may be present or occasionally neither.
Transitional horizon
Three sub-facies are recognised:
• The upper transition facies is a dark red to brown red, cohesive, soft, plastic, and fictile material, with fine granulation. Upper transition can contain up to 15% of disseminated green serpentine, which increases the nickel content in this horizon. Manganese oxide also considerably increases the cobalt and nickel content.
• The green transition facies predominately hosts nontronite/kaolinite minerals (approximately 85% to 90%) and approximately 5% manganese minerals, and is characterised by the association of green material and brown clayish material. Chlorite, vermiculite, manganese oxide (asbolane), and talc can also occur disseminated (> 1%). Free silica can be present in the form of millimetre-sized veins or pockets.
• The brown transition facies consists of approximately 40% nontronite/kaolinite, 30% manganese minerals and a portion of approximately 20% limonite/goethite, the latter responsible for the brownish, clayey fraction. Brown transition is the most common transition facies.
Saprolite horizon
Three sub-facies are recognised:
• Earthy saprolite is pervasively altered rock composed of hydrated iron oxides, serpentine and clays. Minor amounts of quartz, olivine and chromite are present.
• Rocky saprolite is hard saprolite and is a competent dark green to greyish rock of weathered peridotite with moderate saprolite alteration, occurring mostly along fractures.
• Silicified saprolite is a saprolitic material with high silica content.

Horizonte Minerals Plc Araguaia Nickel Project Technical Report
Final November 2018 Page 69 of 342
Bedrock
Bedrock has a dark green to dark brown colour and consists of massive to fractured, varyingly serpentinised peridotite, whose interface with the weathered profile can be highly irregular and undulating. Bedrock is commonly exposed along rivers and creeks and in major landslides.
Chemical criteria
Typical limonite facies laterite contains 0.78% Ni, 0.11% Co, 2.4% Cr2O3, less than 2% MgO, 36.5% Fe and 19.7% SiO2. The underlying transition material typically contains 1.20% Ni, 0.05% Co, 11.7% MgO, 18.3% Fe and 44.3% SiO2. The underlying earthy-rocky saprolite typically contains 1.29% to 0.92% Ni, 0.04% to 0.03% Co, 18.3% to 27.0% MgO, 14.8% to 9.7% Fe, and 41.8% to 42.2% SiO2.
Facies distribution
The deposits in ANS are heterogeneous as far as lateritic facies distribution is concerned (Table 7-1). The average thickness for the limonite facies ranges from 7.5 m to 11.6 m, while maximum thicknesses vary from 23.9 m to 45.0 m. The saprolite horizon shows similar average variations while the total thickness is highly variable. The transition horizon is thinner than limonite or saprolite and generally less continuous laterally, which is shown by the large variation in maximum thickness observed from one deposit to another.
Table 7-1 Maximum and average thickness of laterite horizons to 2013
Deposit No. of
drillholes
Thickness (m)
Limonite Transition Saprolite
Max. Average Max. Average Max. Average
Baião 361 23.90 7.46 17.83 4.12 28.11 6.74
Baião South
Pequizeiro*
265 44.99 8.97 33.63 5.86 36.94 9.57 Pequizeiro East
Pequizeiro West
Pequizeiro NW
Vila Oito East
444 32.10 8.71 48.65 5.72 54.05 10.04 Vila Oito
Vila Oito West
Jacutinga*
Oito 58 31.30 11.56 25.20 6.25 37.86 9.87
Oito West
North 144 30.55 10.38 10.25 3.15 23.70 5.16
Raimundo
Note: * Statistics do not include Phase 4 drilling
7.2.2 Mineralogical studies
In July 2011, SGS Mineral Services, Lakefield, Ontario, Canada (SGS) reported the result of a high-definition mineralogical study on four samples selected from remaining half core from the Baião and Pequizeiro targets. One sample of each of the mineralised yellow limonite, green transition, brown transition and saprolite facies was selected.
Techniques employed included QEMSCAN technology (Quantitative Evaluation of Materials by Scanning Electron Microscopy), x-ray diffraction (XRD), optical microscopy and electron microprobe (EMP) analyses. The main purpose of this test program was to identify the mineral assemblage and modal abundance of the various nickel-bearing horizons, as well as to determine the overall nickel deportment amongst the samples (SGS, 2011).

Horizonte Minerals Plc Araguaia Nickel Project Technical Report
Final November 2018 Page 70 of 342
The mineralogical distribution is shown in Figure 7-2 and the deportment of nickel in the principal mineralised facies is as follows:
• Limonite – limonite/ goethite (74%), nontronite/kaolinite (2%) and Mn minerals (23%)
• Saprolite – Serpentine (66%), limonite/goethite (11%), nontronite/kaolinite (8%), chlorite (4%) and Mn minerals (11%),
• Transition (green) – nontronite/kaolinite (89%), chlorite (4%) and Mn minerals (7%)
• Transition (brown) – nontronite/kaolinite (42%), limonite/goethite layer (23%), chlorite (4%) and Mn minerals (29%).
Figure 7-2 Mineralogical distribution in the principal mineralised facies
Source: SGS, 2011
In 2013, SGS reported the results of an additional high-definition mineralogical study on a sample split of the transition plus saprolite blend (sample HM_51T_49S, a blend of 51% transition ore and 49% saprolite ore) used in the metallurgical testwork completed at FLS. The techniques employed were identical to those used in the earlier work (SGS, 2013).
The mineralogical distribution by size fraction is shown in Figure 7-3, and the deportment of nickel in the principal mineral species in blended sample (HM_51T_49S) is as follows:
• Nontronite/montmorillonite – 55%
• Chlorite – 19%
• Serpentine – 13%
• Limonite/goethite – 8%
• Mn oxide/hydroxides – 3%
• Mn-Fe-Ni-silicate – 2%.

Horizonte Minerals Plc Araguaia Nickel Project Technical Report
Final November 2018 Page 71 of 342
Figure 7-3 Mineralogical distribution by size fraction in blended sample (HM_51T_49S)
Source: SGS, 2013
In 2015, SGS reported the results of a further high-definition mineralogical study on a composite sample collected to be representative of the total agglomerated feed to the RKEF pilot plant campaign undertaken at the Morro facility, Brazil by IGEO in April/May 2015. The techniques employed were identical to those used in the earlier studies (SGS, 2015).
The mineralogical distribution by size fraction is shown in Figure 7-4 and the deportment of nickel in the principal mineral species of the composite sample is as follows:
• Nontronite – 51%
• Chlorite – 19%
• Serpentine – 16%
• Asbolane – 9%
• Goethite – 3%
• Hematite-Cr – 1%.

Horizonte Minerals Plc Araguaia Nickel Project Technical Report
Final November 2018 Page 72 of 342
Figure 7-4 Mineralogical distribution by size fraction in the composite sample
Source SGS, 2015
7.2.3 Deposit geology
The following was excerpted from Audet, MA, et al (2012a) and updated where appropriate.
Jacutinga, Vila Oito West, Vila Oito, and Vila Oito East
Jacutinga (JAC): Vila Oito West (VOW), Vila Oito (VOI), and Vila Oito East (VOE), covers an area of approximately 10 km2 (Figure 7-5). Since VOI and VOE deposits are located in the flat areas with no discernible outcrop, only JAC and VOW have been surface mapped though the connection between these ultramafic bodies is unconfirmed.

Horizonte Minerals Plc Araguaia Nickel Project Technical Report
Final November 2018 Page 73 of 342
Figure 7-5 Bedrock structural geology map of JAC, VOW, VOI and VOE
Source: HZM, 2013
Northwest-southeast, northeast-southwest and north-south trending silica filled fault zones are found within the JAC area. A minor east-west trending steep fault cross-cuts the north-south trending fault and a northwest-southeast trending silica filled fault is the contact between ultramafic and sedimentary rocks. The conical hill is composed of both ultramafic and sedimentary rock, while the larger triangle shaped hill is mostly composed of massive silica and silicified sedimentary rocks.
In VOW, silica filled fault zones represent the sedimentary and ultramafic rock boundaries and trend northeast-southwest and east-west along the northwest and southern limits of the target respectively. Both are dislocated by northwest-southeast trending steep cross faults. Shear indicators indicate dextral movement.
A ridge, located north of VOW, exposes an oblique thrust fault zone filled by massive silica. The fault zone trends northwest-southeast and dips to the northeast at 55° to 80°. Sedimentary rocks occur on both sides of this zone, however, ultramafic rocks outcrop within the fault zone covering an area of 150 m x 1,000 m. A 3 km displacement separates this ultramafic outcrop from the closest similar body. Duricrust covers both sediment and ultramafic rocks in the far north-eastern area. Northeast-southwest trending, steep faults dislocate the silica ridges. Some north-south trending faults located in the southern rim dislocate northeast-southwest trending cross structures.
An east-west trending silica filled fault zone marks the only topographic high around VOI. This 200 m long hill is dislocated by a north-south trending cross fault in the middle and terminates with some north-south fractures in the eastern rim.
HZM provided Snowden with updated surface geology maps for each of the deposits, following the completion of the 2012 to 2013 drilling program. These maps and drillhole results were used by Snowden to guide the construction of 3D wireframe interpretations of the limonite, transition and saprolite horizon contacts.

Horizonte Minerals Plc Araguaia Nickel Project Technical Report
Final November 2018 Page 74 of 342
Pequizeiro (PQZ) and Pequizeiro West (PQW)
Three northwest trending mineralised bodies cover an area of approximately 3 km2 in this area. The deposits are enclosed by steeply dipping fault zones along north-eastern and south-western margins leading to their elongate outlines (Figure 7-6). The three main areas show the same style of mineralisation and characteristics and are therefore interpreted as one body of mineralisation that has subsequently been partitioned as a result of the major northwest trending fault system and later stage northeast trending cross-faults.
Sedimentary rocks show intense folding and silicification at the ultramafic contact where massive silica is absent.
A large prominent hill between PQZ and PQW demarks the intersection of three fault zones. The hill is composed of massive silica with pervasive iron oxide within the fault zones.
The small ultramafic bodies at Pequizeiro Northwest and Pequizeiro East currently have no Measured or Indicated Mineral Resources.
Figure 7-6 Bedrock structural geology map of PQZ deposit
Source: HZM, 2013
HZM provided Snowden with an updated surface geology map for PQW, following the completion of the 2012 to 2013 drilling program. This map and drillhole results were used by Snowden to guide the construction of 3D wireframe interpretations of the limonite, transition and saprolite horizon contacts. After review, Snowden elected to use the existing horizon wireframes for PQZ as there was no material change (Figure 7-7).

Horizonte Minerals Plc Araguaia Nickel Project Technical Report
Final November 2018 Page 75 of 342
Figure 7-7 Updated bedrock PQZ geology map after 2014 drill program
Source: HZM, 2015
Baião
The Baiao area contains three separate ultramafic bodies, the largest being Baião, and covers an area of around 8 km2 (Figure 7-8). No structures were identified from field mapping in the sector due to the flat topography, lack of exposure in the southern part and dense forest cover in the east.
A steeply dipping, silica filled fault zone is located along a north-northwest to south-southeast trending ridge in the north-eastern part of Baião and reaches up to a width of 250 m. The direction of the fault zone changes to west-northwest to east-southeast further north of the ridge. A 200 m wide fresh ultramafic outcrop is located within the rupture zone that is constrained between two steep northeast-southwest trending cross-cutting faults (Figure 7-9).
The western part of Baião is limited by a zone of massive silica and silicified sedimentary rock, almost 1 km wide. Steeply dipping structures trend north-northeast to south-southwest and northeast-southwest trending. These major trends are dislocated by cross-cutting faults. Contrary to the other cross faults in Pequizeiro and northeast of Baião, these are northwest-southeast trending and filled by silica instead of iron-oxide.
After review, Snowden elected to use the existing horizon wireframes for Baião as there was no material change.

Horizonte Minerals Plc Araguaia Nickel Project Technical Report
Final November 2018 Page 76 of 342
Figure 7-8 Updated bedrock BAI geology map
Source: HZM, 2013

Horizonte Minerals Plc Araguaia Nickel Project Technical Report
Final November 2018 Page 77 of 342
Figure 7-9 Ultramafic unit within the rupture zone and silica ridge
Note: Sl – silica; Um – ultramafic (not to scale)
Source: Audet, MA, et al., 2012a
7.3 Project geology – ANN
The Araguaia deposit geology comprises various types of metasediments that cover the vast majority of the licence area. Large areas of mafic and ultramafic plateau, varying in size from a few hundred square metres to several square kilometres, have been identified from magnetic data and outcrop. These are generally capped with a hard iron rich duricrust that is occasionally silicified and are often bounded by a siliceous breccia. Bodies of pillow lava and other volcanic material also exist, and the area is cut by numerous mafic dykes. Magnetic surveying also revealed the presence of numerous northwest-southeast to north-south trending lineaments that are believed to be traces of fault zones, interpreted as either thrust fronts with an east to west transport direction or later sub-vertical faults.
Ultramafic rocks are represented by serpentinised peridotites. Mylonitic serpentinites, tourmalinites and cherts also occur locally. It is common to find silexite crust formations, which protect the underlying ultramafic bodies from erosion. Diabase and gabbro dykes are frequently encountered.
The VDS deposit was discovered on the basis of geological observations due to the appearance of limonite crusts at surface, which were identified by Xstrata geologists as related to lateritisation of ultramafic rocks. VDS is an elongated body nearly 4,000 m long in the north-northwest to south-southeast direction with average width of 800 m (Figure 7-10). VDS is located in a relatively flat area, though altitudes range from 150 m ASL to 360 m ASL; the mean elevation is around 200 m ASL.

Horizonte Minerals Plc Araguaia Nickel Project Technical Report
Final November 2018 Page 78 of 342
Figure 7-10 Simplified geology of ANN and surrounding area
Source: AMEC, 2008

Horizonte Minerals Plc Araguaia Nickel Project Technical Report
Final November 2018 Page 79 of 342
7.3.1 Lithologies
Physical criteria
The lithological facies of the laterite profile described for ANN licence area are slightly different to the descriptions as those used for ANS licence area but still have the same broad lateritic profile of: soil, ferricrete, limonite, upper saprolite (this is called transition at ANS), lower saprolite (this is called saprolite at ANS) and bedrock. Lithological facies descriptions for ANN are described as follows:
Soil horizon
The soil layer is composed of organic and disaggregated material and is usually magnetic. The chemical composition of the layer is characterised by high iron and low nickel and magnesium oxide. The soil horizon has an average thickness of 0.2 m.
Ferricrete horizon
Dark brown to red in colour, the facies is formed by aggregated pisolites (iron oxy-hydroxides) that are often very hard and porous. The ferricrete horizon lies immediately below the soil horizon.
Limonite horizon
Below the soil and ferricrete horizons lies the limonite horizon which is made up of five distinct sub-facies – pisolite, red limonite, yellow limonite, red tapa and orange tapa:
• Pisolite sub-facies is dark brown to red in colour and comprises up to 70% loose pisolites (iron oxy-hydroxides). It also contains ferricrete fragments and may contain up to 30% of fine iron clay.
• Dark red-brown coloured, the red limonite sub-facies is plastic in texture and composed mainly of iron oxides and iron clays. White and black wisps and crusts of magnesium-manganese-cobalt hydroxides can also occur.
• Red tapa sub-facies is red-brown coloured with a plastic texture and contains less than 30% of smectitic clays or serpentine mixed in a matrix of iron oxides. The facies forms bands and laminations on a centimetre scale.
• Due to the dominance of goethite over hematite, the orange tapa sub-facies is orange-brown coloured. The facies contain less than 30% of smectitic clays or serpentine, is weakly plastic in texture and is frequently lightly banded.
Upper saprolite horizon
This is made up of four sub-facies – green tapa 1, green tapa 2, transitional 1 and transitional 2:
• Green tapa 1 is without the original rock texture and is green to dark green with minor brown clay bands of goethite, manganese oxy-hydroxides and silica veinlets. It is hard and composed of up to 90% smectitic clays.
• Green to brown in colour, the green tapa 2 sub-facies is soft and plastic in texture with 30% to 85% smectitic clay. Laminated with no protolith texture, it contains 6% to 60% iron oxy-hydroxides and up to 2% disseminated manganese oxy-hydroxides.
• Transitional 1 sub-facies is orange to brown soft and formed of millimetre to centimetre granules of green serpentine (up to 30%) immersed in an iron oxy-hydroxide matrix and also contains traces of magnesium oxide and talc. In the oxide phases, goethite is predominant over hematite.
• Transitional 2 sub-facies is green to brown, soft and poorly plastic in texture. It is formed from millimetre to centimetre granules of green serpentine (up to 30%) in a matrix of iron oxide.

Horizonte Minerals Plc Araguaia Nickel Project Technical Report
Final November 2018 Page 80 of 342
Lower saprolite
This consists of two sub-facies – green tapa 3 and saprock:
• The green tapa 3 is light green in colour, poorly plastic and contains up to 70% of serpentine granules with 5% to 10% talc. Traces of chlorite and magnesium oxide are also present.
• Consisting dominantly of serpentine, the saprock sub-facies also has minor amounts of smectitic clay and talc. It is light green and friable with original rock textures preserved and contains abundant amorphous silica and iron oxy-hydroxides.
Silicified saprolite and fault zone
There are three sub-facies for this unit – talc, silicified saprolite and silcrete:
• Talc is white to purple, soapy, soft but not plastic in texture and foliated in fault zones. It is very talc rich with less than 5% of serpentine, brown clay, free silica and manganese oxy-hydroxides.
• Pink to grey-green and hard, the silicified saprolite sub-facies is spatially associated with silcrete or silexite. An increase of silification is associated with an increase in hardness and change in colour to pink.
Bedrock facies
The bedrock facies is made up of three sub-facies – weathered harzburgite, harzburgite and silexite:
• Weathered harzburgite consists of grey-green friable weathered rock with blocks of unweathered hard rock, orange filled fractures and manganese oxy-hydroxides.
• Harzburgite is hard, grey-green and is formed of millimetre to centimetre pseudomorphic crystals of bastite resulting from orthopyroxene weathering in a dark green to grey-green mas of serpentine. Usually present are veinlets and fractures filled by light green serpentine, talc and small amounts of carbonate.
• Silexite sub-facies is a purple, brown or red competent silica rich breccia of green magnetic material commonly with silica veinlets.
Other facies
There are three other sub-facies recognised at ANN – gabbronorite/weathered gabbronorite, mafic saprolite and metasediment:
• Gabbronorite is brown with an ophitic texture
• Weathered gabbronorite becomes yellow and friable with distinct white plagioclase
• Mafic saprolite sub-facies is yellow-brown and friable with poor plasticity and has relict white plagioclase and an ophitic texture
• Metasediments are light yellow to grey, soft with weak foliation and are often absent from the geological column.
Chemical criteria
Discrimination between the geological horizons is made using mainly iron, magnesium oxide, silica, alumina and nickel grades. The mineralised geological horizons are designated 100 (Limonite), 200 (Transitional) and 300 (Saprolite). The average grades for each horizon are presented below in Table 7-2.

Horizonte Minerals Plc Araguaia Nickel Project Technical Report
Final November 2018 Page 81 of 342
Table 7-2 Average composition of major constituents per horizon for VDS
Component Average grade per horizon (%)
Horizon 100 Horizon 200 Horizon 300
Ni 0.67 1.62 0.83
Fe 34.22 25.45 10.11
MgO 0.93 9.16 30.54
SiO2 25.24 32.63 38.68
Al2O3 11.06 7.03 2.52
Facies distribution
The deposit facies have been characterised on the basis of the drill core analysis and facie characterisation performed as part of the geological exploration program. The VDS deposit is dominated by earthy saprolite and transitional laterite mineralisation. Only two of the facies exhibit a rocky texture; saprolite rock and green tapa 3.
7.3.2 Mineralogical studies
Mineralogical evaluation was undertaken by SGS Lakefield, Canada (this is the same lab used by ANS) using QEMSCAN, EPMA and XRD (SGS, 2006). The objective of the program was to provide basic mineralogical information on a sized composite as well as an evaluation of two low grade facies in the VDS deposit to assess for upgrading potential.
The mineralogy of the composite sample is dominated by serpentines, clays (15%) associated with the alteration of serpentine, iron-montmorillonites, chlorites, iron oxides and minor amounts of asbolane, quartz and talc. Higher oxide content in VDS composite suggests that weathered facies (limonitic and transitional) are more dominant.
With the exception of quartz and gibbsite (trace amounts), all other species identified in this study carry nickel. Sixteen nickel-bearing minerals were quantified by EPMA. The richest nickel-bearing species are nickel-serpentine and two variations of asbolane; low manganese asbolane and low nickel-cobalt asbolane. These three species carry an average of 4.8%, 12.0% and 3.5% nickel. However, there is a relatively minor amount of asbolane present. The majority of nickel within VDS is hosted by nickel-serpentine, chlorite, iron-montmorillonite, antigorite and oxide species.
Nickel grade drops slightly in very coarse size fractions due to an increase in antigorite content, and a corresponding drop in other species such as chlorite and iron- montmorillonite. Antigorite carries an average of 0.95% Ni, whereas the chlorites and iron-montmorillonites have nickel grades between 1.4% Ni and 1.74% Ni.
The distribution and textures associated with nickel deportment suggest that upgrading will be difficult. This conclusion is based on the fact that many mineral species contain nickel; they are observed throughout the size distribution and vein and rimming textures are extremely rare.
The transition 2 sample, submitted for upgrading evaluation, is lower grade than the composite samples analysed due to lower abundance of nickel-serpentine. The remaining mineral species contain low levels of nickel. In the coarse saprolitic samples, removal of quartz may improve the overall grade. However, some samples show an association of asbolane with quartz, thus removal of quartz in an upgrading program will also risk the loss of nickel and cobalt within asbolane locked with quartz.
7.3.3 Deposit geology
Vale dos Sonhos
The VDS deposit is orientated north-northwest to south-southeast and is approximately 4,000 m long and has an average width of 800 m. The deposit is enclosed on the west side by faults that dip between 30° and 60° to the east. On the east side the deposit is enclosed by meta-sediments.

Horizonte Minerals Plc Araguaia Nickel Project Technical Report
Final November 2018 Page 82 of 342
Figure 7-11 shows the drilling completed to date against the bedrock geology, and Figure 7-12 shows a schematic cross section of the local geology.
Figure 7-11 Bedrock geology map of VDS
Source: HZM, 2015

Horizonte Minerals Plc Araguaia Nickel Project Technical Report
Final November 2018 Page 83 of 342
Figure 7-12 Schematic vertical section of Serra do Tapa and VDS deposits
Note: Not to scale; the schematic vertical section shows the tectonic contact between main units
Source: AMEC, 2008

Horizonte Minerals Plc Araguaia Nickel Project Technical Report
Final November 2018 Page 84 of 342
8 DEPOSIT TYPES
The target mineralisation of the Project area is characteristic of typical nickel laterite deposits formed in a seasonally wet tropical climate, on weathered and partially serpentinised ultramafic rocks. Features of nickel laterites include:
• The nickel is derived from altered olivine, pyroxene and serpentine that constitute the bulk of tectonically emplaced ultramafic oceanic crust and upper mantle rocks.
• Lateritisation of serpentinised peridotite bodies occurred during the Tertiary period and the residual products have been preserved as laterite profiles over plateaus/amphitheatres, elevated terraces and ridges/spurs.
• The process of formation starts with hydration, oxidation, and hydrolysis, within the zone of oxidation, of the minerals comprising the ultramafic protore.
• The warm/hot climate and the circulation of meteoric water (the pH being neutral to acid and the Eh being neutral to oxidant) are essential to this process. Silicates are in part dissolved, and the soluble substances are carried out of the system.
• This process results in the concentration of nickel in the regolith in hydrated silicate minerals and hydrated iron oxides; nickel and cobalt also concentrate in manganese oxides. The regolith hosting nickel laterite deposits is typically 10 m to 50 m thick, but can exceed 100 m.
• Concentration of the nickel by leaching from the limonite zone and enrichment in the underlying saprolite zones is also common. Leaching of magnesium +/- silicon causes nickel and iron to become relatively concentrated in the limonite zone. Nickel is released by re-crystallisation and dehydration of iron oxy-hydrides and is slowly leached downwards through the profile, both vertically and laterally, re-precipitating at the base with silicon and magnesium to form an absolute concentration within the saprolite (Figure 8-1).
• The degree of the nickel concentration and the detailed type of regolith profile developed is determined by several factors including climate, geomorphology, drainage, lithology composition, and structures in the parent rock, acting over time.
• A typical laterite profile contains three distinct horizons (limonite, transition and saprolite). A schematic laterite profile for BAI and PQZ is shown in Figure 8-2 and VDS in Figure 8-3.
Exploration criteria is summarised from Brand et al (1996) as follows:
• Geological massifs with olivine-rich lithologies and their metamorphic derivatives, large enough to host nickel laterite deposits that will support low-cost, high-tonnage, open-cut mining operations, must initially be identified.
• Airborne magnetic surveys, regional mapping and known occurrences of lateritic nickel are useful to identify likely targets.
• Later, detailed geological and geophysical surveys may be needed to delineate olivine-rich lithologies and faulting that may represent sites for shallow, high-grade manganese-cobalt-nickel and garnierite mineralisation.
• Regolith landform mapping and reconnaissance drilling can be used to determine the nature and distribution of the regolith (i.e. whether in-situ, concealed or stripped) and those zones that host nickel enrichments.
• Regional drilling and possibly soil sampling of in-situ regolith can be used to identify nickel halos (>0.5% Ni), and target the most prospective parts of a weathered ultramafic sequence.
• Follow-up drilling to delineate nickel-enriched zones will, in association with geochemistry and mineralogy, provide valuable information on the geological and metallurgical characteristics of any nickel laterite. For metallurgical purposes, it is useful to maintain a consistent element suite when analysing drill samples (Ni, Co, Mn, Cr, Mg, Fe, Si, Al and ignition loss).

Horizonte Minerals Plc Araguaia Nickel Project Technical Report
Final November 2018 Page 85 of 342
Figure 8-1 Chemical trends in schematic nickel laterite profile
Source: MALA ground penetrating radar
Figure 8-2 Schematic laterite profile for ANS section
Source: Audet, MA, et al., 2012a

Horizonte Minerals Plc Araguaia Nickel Project Technical Report
Final November 2018 Page 86 of 342
Figure 8-3 Schematic laterite profile for the ANN deposits including VDS
Source: Xstrata

Horizonte Minerals Plc Araguaia Nickel Project Technical Report
Final November 2018 Page 87 of 342
9 EXPLORATION
Drilling programs are the main form of exploration conducted by HZM, and these are summarised in Section 10. This report section presents relevant exploration other than drilling conducted at ANS and ANN licence areas. Exploration and drilling conducted by prior owners and operators is summarised in Section 6 and details of their programs can be found in Audet, MA, et al (2012a); Barry, J.P. (2006).
9.1 Lontra area surface exploration and mapping
In 2006, HZM commenced exploration on the Lontra area which is in the northwest of ANS. Non-drilling work included stream sediment, mapping, and soil and rock sampling. A total of 2,024 stream sediment, soil and rock samples were taken. Garmin handheld GPS devices were used for field mapping control.
Exploration was initiated by HZM in late 2006 with a regional low threshold, multi-element, fine fraction stream sediment survey. This led to the definition of seven anomalous zones of which three were considered priority nickel targets. Initial field reconnaissance indicated the presence of previously unmapped ultramafic lithologies and produced a rock sample, from a laterite gravel pit being used to obtain road base, with visible garnierite indicating the potential for lateritic nickel. Ground magnetometry surveys assisted the geological mapping.
In 2007, after formalising the joint venture on the Lontra Project, the stream sediment targets were followed up by regional (400 m x 80 m grid) multi-element soil sampling programs.
HZM soil geochemical survey grids for the Lontra project area are shown in Figure 9-1.
Through this work three principal areas of ophiolite emplacement with associated laterite development were established, namely: Northern target; Raimundo target; and Southern and Morro targets.
The targets are shown in Figure 9-1 and brief descriptions of the three main geochemical anomalies over these targets discovered and developed by HZM are given below:
• Northern target: The Northern target is a 3 km x 1.5 km area containing four anomalies, of which the main target is a 1,600 m x 250 m soil geochemical anomaly. The soil anomaly is over undulating terrain with dark red soils and termite mounds and is truncated to the northeast by wide flat residual lateritic plateaus.
• Raimundo target: 2 km to the south of the Northern target the Raimundo target has a core zone of 1,600 m x 1,000 m which became the focus of diamond drilling.
• Southern and Morro target: This zone gave some of the best results in a shallow auger program despite the fact that many of the holes had to be abandoned before reaching the target depth due to the presence of silcrete or saprolite.
9.2 ANN
Focused exploration in the original concession was started by Falconbridge in 2003 following review of geological maps and geophysical data generated by CPRM in the 1970s.
VDS and the adjacent Serra do Tapa licence areas were covered by a magnetic and radiometric airborne (helicopter) geophysical survey, ground based VTEM geophysical survey (12 km2), and photo-geological interpretation as well as typical ground-based investigation methods such as soil and rock sampling, geochemical and mineralogical analyses, and drilling.
The discovery hole at VDS was drilled in November 2004 and revealed an intersection of 14.0 m with an average grade of 1.9% Ni.

Horizonte Minerals Plc Araguaia Nickel Project Technical Report
Final November 2018 Page 88 of 342
Figure 9-1 ANS Lontra licences soil geochemistry
Source: Audet, MA, et al., 2012a

Horizonte Minerals Plc Araguaia Nickel Project Technical Report
Final November 2018 Page 89 of 342
10 DRILLING
10.1 ANS
HZM has conducted several programs of auger drilling and diamond core drilling within the ANS licence area. Shallow auger drilling was undertaken, prior to 2009 to define some exploration targets, while wide diameter auger drilling was undertaken in 2011 and 2015 to obtain bulk samples of mineralisation for metallurgical testwork from one deposit. Core drilling was used to obtain samples for resource delineation in phased programs and, separately, for geotechnical assessment of a potential open pit and plant site.
As part of the test pit process at PQZ, a small section of the deposit was drilled for grade control purposes. A total of 30 diamond drillholes of 20 m length were drilled on a 5 m x 5 m spacing across six east-west sections. These drillholes were solely used for grade control purposes and have not been used for Mineral Resource estimation of the PQZ deposit.
10.1.1 Auger drilling
Shallow auger drilling
In late 2007, a 124-hole shallow auger drilling program was initiated by HZM at the Lontra licence to evaluate the principal soil anomalies at the Raimundo, Northern and Southern targets. Exploration success continued in 2007 with a number of mineralised nickel intervals being intersected in the auger drilling. However, the rising water table associated with the onset of the rainy season and the limited ability of the auger to penetrate to the saprock zone meant that many holes had to be abandoned above or within the mineralised interval.
Figure 10-1 shows HZM auger drillhole coverage for the Lontra licence. Holes were initially spaced on a 400 m x 80 m grid and few holes reached maximum depths beyond 12 m. Metres drilled totalled 921 m with an average depth of 7.4 m.
Data from these drillholes have not been used in Mineral Resource estimation.

Horizonte Minerals Plc Araguaia Nickel Project Technical Report
Final November 2018 Page 90 of 342
Figure 10-1 ANS Lontra licence drill location map
Source: Audet, MA, et al., 2012a

Horizonte Minerals Plc Araguaia Nickel Project Technical Report
Final November 2018 Page 91 of 342
10.1.2 Wide diameter auger drilling
September/October 2011
Audet et al (2012a) reported that wide diameter auger drilling was used to collect approximately 130 dry t of bulk sample from the PQZ deposit for metallurgical testwork.
Drilling was by way of a truck mounted auger drill capable of a maximum depth of 20 m with a variety of bits including a wide diameter 1 m bit to be used for the bulk sampling, in 1 m intervals. At each location the auger holes were drilled in close proximity (about 2 m) of an earlier core drillhole to ensure that the target geology/geochemistry was collected. Positioning of the auger hole was supervised by the Project Manager and Project Geologists and organised by the Operations Manager/Technicians.
The auger drill was incapable of passing through “blocky ferricrete” containing fist sized and greater cemented blocks. An initial reconnaissance by the geology/technical team determined if these blocks were present, and if required an excavator removed the ferricrete, which is only found to a maximum depth of about 4 m.
The author verified that the remainder of the samples not used in subsequent metallurgical tests are stored in 200-litre sealed plastic drums in a warehouse in Conceição do Araguaia.
February/March 2015
A second phase of wide diameter auger drilling for the collection of bulk samples for metallurgical testwork was completed on four selected sites on the PQZ deposit in February/March 2015 and was viewed by Qualified Person, Francis Roger Billington. The methodology was the same as for the earlier phase of drilling described above. A total of 260 t (wet) approximating to 156 t dry were collected. The majority of this material was used in the pilot plant testwork undertaken at Morro Azul.
10.1.3 Diamond core drilling
Phase 1
In 2008, HZM contracted the first of four phases of diamond drilling completed by HZM, i.e. post the historical drilling by Teck. In this phase of drilling 63 diamond drillholes were completed totalling 1,299.5 m to test the Northern (31 holes), Raimundo (31 holes) and Southern targets (one hole) in the Lontra area.
Within the program, vertical holes were drilled from 15 m to 25 m in depth, ensuring that the saprock-fresh rock interface was intersected. Drillhole spacing was as follows: on 400 m spaced lines with 80 m hole centres (for geological sections and interpretation); on 200 m x 200 m centres (for resource potential identification); and on 100 m x 100 m centres (in the Raimundo high grade zone for definition of grade variation).
The diamond drilling program was carried out with the objective of demonstrating the existence of lateritic nickel mineralisation over a significant area.
The first phase holes were drilled by drill contractor, Pacheco e Filhos Ltda of Rio Grande do Sul, using a “Sullivan” diamond drill rig with conventional drilling techniques. The second phase was drilled by Mariana Drilling Inc. of Goiania, Goias, using a “BBS-10” drill rig. The holes were drilled with HWT rods resulting in HQ core. Core recoveries were closely monitored, with less than 90% recovery being questioned and less than 80% requiring the hole to be redrilled.
Holes were drilled through the lateritic profile to fresh rock where, in general, the hole was stopped after 3 m to 5 m of bedrock in the first and subsequent phases. Holes were typically between 15 m and 25 m long but did reach over 30 m in depth.

Horizonte Minerals Plc Araguaia Nickel Project Technical Report
Final November 2018 Page 92 of 342
Phase 2
HZM recommenced exploration drilling on the Araguaia Nickel Project (combined Teck Araguaia and HZMA Lontra licences) in October 2010. The programs were designed to infill the previous core drilling completed by Teck. As well as establishing various field camps near the target sites to minimise travel for drill crews and field staff, HZM also established an exploration office in Conceição do Araguaia from September 2010 to coordinate all exploration activity.
An initial drilling program was designed to infill the 200 m x 200 m pattern on the PQW, PQZ and BAI targets. Geosonda Sondagens Geológicas Ltda drilled HQ3 core that was designed to first reduce the drill spacing to 141 m x 141 m (five-spot drilling) and then to further reduce the drill spacing on the PQZ and BAI targets to 100 m x 100 m. In addition, HZM conducted drilling at PQZ and BAI, at a spacing of 25 m x 25 m, to determine grade variability, geological continuity and the drill spacing required for Inferred and Indicated Resource definition. From October 2010 to December 2011, HZM completed 539 drillholes for 13,261 m as part of Phase 2.
Phase 3
From September 2012 to April 2013, HZM conducted a Phase 3 resource drilling program. This program was designed to complete infill drilling on 100 m x 100 m grids on the JAC, VOW, VOI, VOE and PQW targets in order to convert Inferred Resources to Indicated Resources. 321 holes (9,309 m) were completed including 35 holes (1,186 m) on JAC, 84 holes (1,669 m) on VOW, 133 holes (4,228 m) on VOI, 44 holes (1,509 m) on VOE and 25 holes (717 m) on PQW. HZM engaged drilling contractor, Servitec Foraco, to undertake core drilling with the provision of up to five rigs. Steven Heim PMP of Heim Consultoria acted as site Project Manager for HZM with technical support from Francis Roger Billington, P.Geo.
Phase 4
From October 2014 to March 2015, HZM conducted a Phase 4 resource drilling program. This program was designed to complete infill drilling on 50 m x 50 m grids on the JAC and PQZ targets in order to convert Indicated Resources to Measured Resources. A total of 374 holes (11,199 m) were completed including 49 holes (1,490 m) on JAC, and 325 holes (9,709 m) on PQZ. HZM engaged drilling contractor, Servitec Foraco, to undertake core drilling with the provision of up to five rigs. Steven Heim PMP of Heim Consultoria acted as site Project Manager for HZM with technical support from Francis Roger Billington, P.Geo.
A summary of resource delineation drilling for phases 1 to 4 inclusive (Including the original Teck drilling) for the seven targets at ANS is provided in Table 10-1; Figure 10-2 shows a plan view of the drilling at ANS up to the end of Phase 4 drilling in 2015. Drillhole locations and bedrock geology maps are provided in 7.
Table 10-1 Summary of resource delineation drilling by HZM and Teck
Target No. of holes Metres drilled
(m)
VOW 143 3,096.5
VOI 182 5,573.4
VOE 127 3,901.7
JAC 108 3,211.5
PQZ 544 15,823.5
PQW 60 1,626.0
BAI 330 7,098.0
Total 1,494 40,330.6

Horizonte Minerals Plc Araguaia Nickel Project Technical Report
Final November 2018 Page 93 of 342
Figure 10-2 Collar location map of ANS for drilling up to March 2014
Source: HZM, 2015
According to NI 43-101, HZM’s Project meets the definition of an “advanced property” because Mineral Resource estimates and a Preliminary Economic Assessment have been reported (Audet et al., 2012a and 2012b). In line with NI 43-101 F1 instructions for advanced properties, drilling results are therefore not provided in this Technical Report.

Horizonte Minerals Plc Araguaia Nickel Project Technical Report
Final November 2018 Page 94 of 342
HZM has provided drill results by way of six news releases for the Phase 3 and 4 infill drilling programs (Table 10-2). In these news releases, mineralised intervals are calculated by compositing the nickel grades in individual drillholes across geological boundaries using a cut-off of 1% Ni with a minimum intercept length of 2 m and a maximum length of internal waste of 2 m. All holes were vertical and as these nickel laterite deposits are essentially flat-lying, all widths reported are essentially true widths.
Table 10-2 Phase 3 and 4 resource delineation drilling news releases
Date Title
8 January 2013 Positive results from infill drilling program and successful metallurgical testing
14 March 2013 New high grade nickel results from infill drilling program
30 April 2013 New high grade nickel results from infill drilling program
10 September 2013 Final drill results from infill drilling program
16 April 2015 New high grade drill results from infill mineral resource drilling program at the Araguaia Nickel Project, Brazil
3 June 2015 Additional high grade results from Phase 4 infill mineral resource drilling program at the Araguaia Nickel Project, Brazil
10.1.4 Procedures
Procedures relevant to diamond core drilling for resource delineation are provided below and are summarised from HZM’s Standard Operating Procedures (Horizonte Minerals, 2012) and verified by the author:
• Drillhole programs are approved by HZM’s Project Manager in consultation with the Technical Advisor. Qualifications and experience for both roles are consistent with the definition of Qualified Person according to NI 43-101.
• Proposed drillhole locations are presented in an internal report accompanied by maps and sections with a cost estimate, together with target depths and objective.
• The HZM Project Manager leads a team comprising Operations Manager, Project Geologists, Technicians and Core Checkers.
• Proposed coordinates of drillholes are passed to the Operations Manager and Technicians for sighting in the field. The survey team instructed by the Operations Manager locates each position in the field using a total station system and identifies each position with a survey tag. The total station used is a Sokkia Stratus integrated GPS L1 system with an accuracy of 5 mm horizontal and 10 mm vertical.
• With a handheld GPS, Technicians locate the correct survey tag for the hole in question using the “known” drillhole coordinates supplied by the Project Manager.
• Where required, access tracks and drill pads are cleared in line with licence conditions and to ensure a safe working area. Earthworks and tree cutting is kept to the minimum required for a safe working area.
• Drill rig set-up, positioning and levelling is checked by HZM staff prior to drilling.
• The Operations Manager and Project Manager monitor health and safety at the drill site.
• Drill rig activity and progress is monitored by HZM and recorded in production reports and compared with the drilling contractor’s production record sheets at the end of each shift. Core Checkers record recovery/drill advance, hole completion and final depth, core box details, and drill platform assessment.
• HZM require that minimum recovery requirements are met by the drilling contractor and that holes finish in bedrock. Current requirements are a minimum recovery in mineralised zones of 85% over a 6 m run, and 3 m of bedrock drilled at the bottom of each hole. HQ triple tube coring systems are mandatory.

Horizonte Minerals Plc Araguaia Nickel Project Technical Report
Final November 2018 Page 95 of 342
• Technicians ensure, with Core Checkers, that the contractor correctly labels each core box with the following information: target name, hold identifier, box number, from and to. The direction of drill run and start and finish of the core in the box must also be marked. To ensure clarity, box identification data is marked on metal plaques using metal stamps. Core blocks showing the advance and recovery for each run are securely placed in the box and all core is wrapped in plastic.
• After drilling, the hole is sealed and marked with a concrete cap which includes hole identifier, date, contractor and final depth. Once drilling is completed and the hole has been capped, the survey team return and re-survey the capped position using a total station system as described above.
• HZM supervise core handling in the field and ensure that core boxes are properly secured and carefully transported from the field to the core shed. Core boxes are covered by a nailed lid and carefully transported to the core shed under a tarpaulin to protect the boxes from the weather.
10.1.5 Geotechnical
Proposed open pit mining areas
As part of the Phase 3 geotechnical data collection program, 12 diamond core drillholes designed by Snowden were drilled in 2013 in seven potential open pit mining areas (PQZ, PQW, BAI, JAC, VOI, VOE, VOW), totalling 386 m of HQ size diamond core.
All the holes were drilled vertically and cored from the surface with hole depths ranging from 20 m to 45 m. No oriented holes were drilled as it was considered that rock mass structure has no influence on preliminary slope design due to shallow depths of proposed pits limited mostly to the laterite profile.
This geotechnical program was continued in Phase 4 from January to April 2015. Five additional HQ size diamond core drillholes totalling 171 m were drilled in two potential open pit mining areas (PQZ, JAC). All holes were drilled vertically and cored from the surface with hole depths ranging from 21 m to 46 m.
This geotechnical program was continued in Phase 5 (FS) from April 2017 to June 2018. Three additional HQ size diamond core drillholes totalling 105 m were drilled in two potential open pit mining areas (BAI, VOI). All holes were drilled vertically and cored from the surface with hole depths ranging from 25 m to 42 m.
Geotechnical data collected included core interval data; lithology, degree of weathering, strength, rock quality designation, fracture frequency, core recovery and discontinuity data. These data have been entered into a geotechnical database for analysis and domain definition for the development of geotechnical models for the potential open pit areas.
Eighty core samples were selected for geotechnical testing at the Engesolo Engenharia Ltda laboratory in Belo Horizonte, Brazil in Phase 3. The tests requested are shown in Table 10-3.
Table 10-3 Phase 3 geotechnical core and pit samples test summary
Sample tests Test/ measurement types
69 PSD (+hydrometer analysis), grain density
69 Atterberg Limits – liquid limit, plastic limit and linear
11 UCS – Uniaxial compressive strength
4 In-situ moisture content
4 Consolidation test
Other sites
In Phase 3, eight diamond drillholes totalling 210 m and two pits were also completed at potential plant and slag deposit sites. In Phase 4, an additional eight drillholes totalling 160 m were drilled at the potential plant and slag deposit sites. In Phase 5, an additional 21 drillholes totalling 531 m were drilled at the potential plant, slag deposit, and cooling water reservoir dam sites. In addition, four standard penetration test (SPT) boreholes were drilled at the final plant site option. The holes varied in depth from 6.76 m to 22.05 m and totalled 54.07 m; these are shown in Figure 10-3.
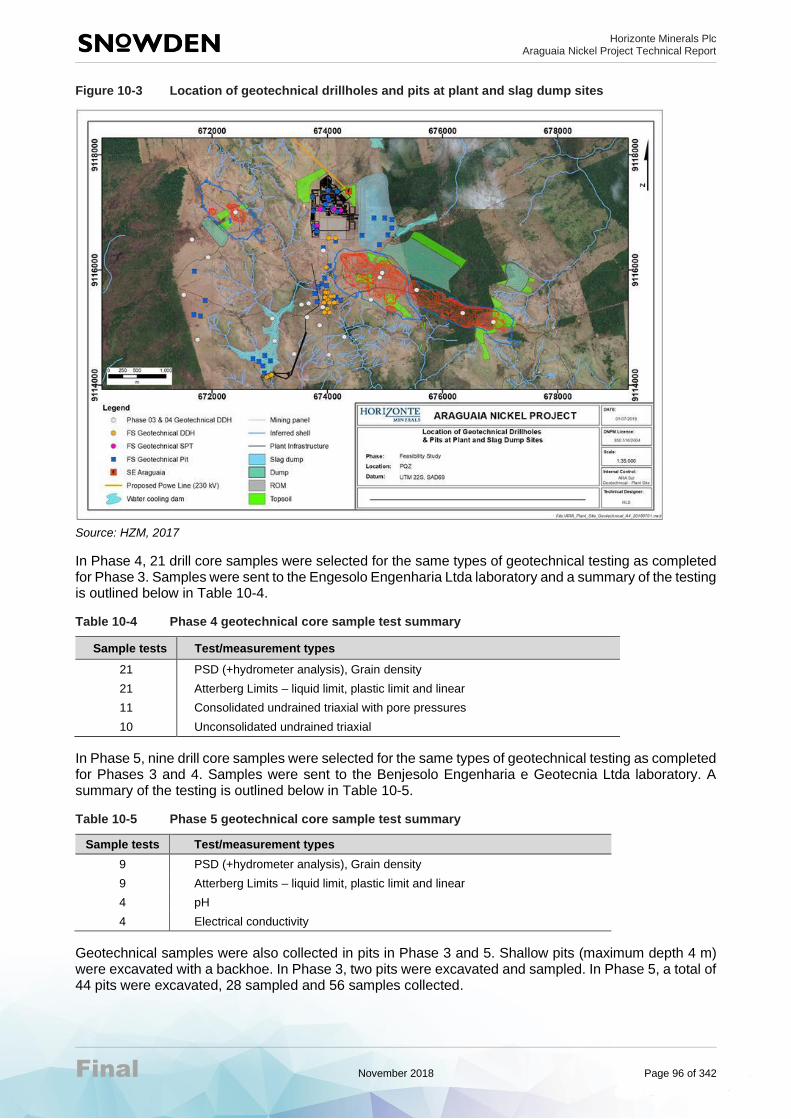
Horizonte Minerals Plc Araguaia Nickel Project Technical Report
Final November 2018 Page 96 of 342
Figure 10-3 Location of geotechnical drillholes and pits at plant and slag dump sites
Source: HZM, 2017
In Phase 4, 21 drill core samples were selected for the same types of geotechnical testing as completed for Phase 3. Samples were sent to the Engesolo Engenharia Ltda laboratory and a summary of the testing is outlined below in Table 10-4.
Table 10-4 Phase 4 geotechnical core sample test summary
Sample tests Test/measurement types
21 PSD (+hydrometer analysis), Grain density
21 Atterberg Limits – liquid limit, plastic limit and linear
11 Consolidated undrained triaxial with pore pressures
10 Unconsolidated undrained triaxial
In Phase 5, nine drill core samples were selected for the same types of geotechnical testing as completed for Phases 3 and 4. Samples were sent to the Benjesolo Engenharia e Geotecnia Ltda laboratory. A summary of the testing is outlined below in Table 10-5.
Table 10-5 Phase 5 geotechnical core sample test summary
Sample tests Test/measurement types
9 PSD (+hydrometer analysis), Grain density
9 Atterberg Limits – liquid limit, plastic limit and linear
4 pH
4 Electrical conductivity
Geotechnical samples were also collected in pits in Phase 3 and 5. Shallow pits (maximum depth 4 m) were excavated with a backhoe. In Phase 3, two pits were excavated and sampled. In Phase 5, a total of 44 pits were excavated, 28 sampled and 56 samples collected.

Horizonte Minerals Plc Araguaia Nickel Project Technical Report
Final November 2018 Page 97 of 342
Samples were sent to the Benjesolo Engenharia e Geotecnia Ltda laboratory for testing. A summary of the sample testing is outlined in Table 10-6.
Table 10-6 Phase 3 and 5 geotechnical pit sample test summary
Sample tests Test/measurement types
50 PSD (+hydrometer analysis), Grain density
50 Atterberg Limits – liquid limit, plastic limit and linear
19 Compacted at optimum water content
5 Permeability Variable Head
2 Dispersion (Pinhole or Crumb Test)
1 Consolidated Undrained Triaxial with Pore Pressures
4 Pressure and free swell potential
13 California Bearing Ratio (CBR)
30 In-situ moisture content
8 Consolidation (oedometer)
10.1.6 Qualified Person’s comment on drilling procedures
It is the author’s opinion that the procedures used by HZM for core drilling were thorough and provided the appropriate level and quality of information required to interpret the laterite profile and to form the basis for Mineral Resource estimates. There is no apparent drilling or recovery factor that would materially impact the accuracy and reliability of the diamond core drilling results.
10.2 ANN
No drilling was conducted by HZM at ANN. The description and results presented in this section have all been completed prior to ownership by HZM.
10.2.1 Diamond drilling
Drillholes were located within a geological outline defined by the thick development of lateritic profile. Diamond drilling (DD) was selected as the most appropriate drilling method. Geoserv was the main drilling contractor, although Servitec and Rede were also used in drilling campaigns at VDS (Table 10-7). Xstrata maintained permanent supervision of the drilling operations throughout.
Table 10-7 Drilling contractor summary for VDS
Drilling company No. of holes Metres drilled
Geoserv 468 15,970.9
Servitec 280 10,370.1
Rede 91 2,522.45
Total 839 28,863.0
A total of 839 HQ (63.5 mm) DD holes were completed at VDS for 28,863 m and a total of 20,829 samples collected for analysis. The drilling program started with a 320 m x 320 m spaced pattern and was followed up with drilling coverage to 160 m x 160 m. Further drilling was completed to 80 m x 80 m to delineate the deposit. All holes were drilled vertically and the maximum depth achieved at VDS was 119.15 m (SK28-400-640).
From 2006 to 2007, 30 holes for 1,092 m (771 samples) at varying spacings ranging from 3 m to 40 m were drilled for geostatistical analysis in a small area located within the later 40 m x 40 m drilling block. Between July and December 2007, a 500 m x 500 m block in the north of the deposit was infilled by drilling on a 40 m x 40 m grid.

Horizonte Minerals Plc Araguaia Nickel Project Technical Report
Final November 2018 Page 98 of 342
All drillhole collars were located based on the IBGE base datum SAD69. Surveyors used a total station to mark the location of proposed drillholes in the field. Upon completion of drilling, each hole was re-surveyed to record the actual drilled location. Drillholes are marked in the field using concrete or metal plinths labelled with the drill ID. The location of diamond drillholes is shown in Figure 10-4.
Core runs are consistently 1.6 m although shorter runs are used for zones with low recovery. Drill core was removed from the core barrel by water pressure to an angular channel-shaped steel stand. Core recovery is measured by drill run immediately after being removed from the core barrel and before being placed in 1.0 m long wooden core boxes wrapped in thick polyethylene sheets to maintain the original moisture. After encountering at least 5.0 m of fresh rock drilling was discontinued. Downhole surveys were completed on holes exceeding 100 m using an EZ-shot, taking readings every 30 m.
Core recovery is highly dependent on rock facies. Hard siliceous facies usually yield low recoveries, as low as 64%, but the mineralised facies show excellent recoveries, typically 93% to 100%.
Each box was identified with the drillhole ID, sequentially numbered and nailed shut with a wooden lid. Core boxes were collected at the end of each day or at the completion of a drillhole and transported by truck to the core logging facilities.

Horizonte Minerals Plc Araguaia Nickel Project Technical Report
Final November 2018 Page 99 of 342
Figure 10-4 Drillhole locations for VDS
Source: HZM, 2015
10.2.2 Core logging procedures
Xstrata followed a set of written procedures for logging and sampling.
At the core logging facility core was inspected, rocky saprolite and fresh rock intersections were cut into equal halves using a diamond saw. Limonite and earthy saprolite core was split into equal halves using a machete. Core was then laid out in order on logging tables using the meterage markers inserted by the drillers and logged

Horizonte Minerals Plc Araguaia Nickel Project Technical Report
Final November 2018 Page 100 of 342
Information recorded includes hole ID, collar coordinates, type of collar orientation (azimuth, dip), drilling company, start date, end date and the name of the geologist responsible for logging. Logging of core was completed on logging sheets where information regarding sampling intervals, sample numbers, main and secondary facies (in coded form) and mineralisation style were recorded.
Sampling intervals have a nominal length of 1 m and as a rule respect major facie contacts. Sample lengths range from 0.3 m to 1.5 m with two-thirds of the samples having lengths between 0.8 m and 1.2 m. Longer samples were allowed only in low-recovery intervals or in waste rock. Samples were taken from the right-hand side of the core with sample intervals marked on plastic sheets wrapping the cores.
After logging and sampling, trained personnel placed samples into plastic bags. The sample number is written on the outside of the bag, a thick paper tag with the sample number is inserted into the bag and the bag is tightly secured with a plastic strap. These samples were then placed into larger plastic bags, up to 50 kg, for transportation to the sample preparation facility at the main Xstrata camp near Vila Sao Jose. Chain of Custody forms were filled in when samples change custody. Core boxes, with the remaining core, were transferred on a monthly basis to the permanent storage facility, also located at the main camp.
10.2.3 Reverse circulation drilling
During July and August 2007, RC drilling was conducted at VDS. A total of seven holes totalling 232 m were drilled. The RC holes were drilled at an average distance of 7.9 m from previous diamond drillholes (reference holes) that were used to predict the composition of the material collected. The purpose of this drilling was to evaluate the suitability of RC drilling for later programs.
Upon review by Xstrata, no significant difference was seen to exist between the DD and RC hole results and it was concluded that RC drilling could provide acceptable results and could be used in future exploration programs.
However, no RC drilling was used for the Mineral Resource estimate.
10.2.4 Geotechnical
No geotechnical work was completed at VDS.
10.2.1 Qualified Person’s comment on drilling procedures
It is the author’s opinion that the procedures used by Falconbridge/ Xstrata for core drilling were thorough and provided the appropriate level and quality of information required to interpret the laterite profile and to form the basis for Mineral Resource estimates. There is no apparent drilling or recovery factor that would materially impact the accuracy and reliability of the diamond core drilling results.
Horizonte Minerals Plc Araguaia Nickel Project Technical Report
Final November 2018 Page 101 of 342
11 SAMPLE PREPARATION, ANALYSES, AND SECURITY
11.1 ANS
The following sections describe the preparation and analysis of samples and security of samples as carried out by HZM for the PQZ, JAC, PQW, VOW, VOI, VOE and BAI deposits.
11.1.1 Sample preparation methods and quality control (QC) measures
All core sampling procedures are undertaken by HZM technicians and supervised by project geologists who have a minimum two years’ experience in drill core and pit sampling, as follows:
• Details of new core boxes transported from the field are recorded in the core shed logbook
• Quick logging of core is undertaken to define the boundaries of the main facies
• Samples are selected for density measurement that is performed in the core shed
• Plastic covering is removed from the core
• Core is half-split with a spatula or sawn according to hardness
• Sample intervals are defined and marked by metal tags on the core box
• QAQC samples are defined
• Core is logged
• Density test samples are returned to the core box and cut
• Core is sampled and bagged
• Quality control (QC) samples (blanks, standards) are added to the batch
• Field duplicate samples are selected
• Core is photographed wet
• The sample submission sheet is prepared
• Procedures are checked prior to the packing and dispatch of samples.
11.1.2 Sample splitting
Sampling of core starts after a hole has been completed and all core boxes have been transferred to the core shed where bulk density samples are identified, removed, tested and returned and the core is logged in detail.
Half-core samples are taken for analysis; the other half-core remains in the box for reference. The nominal sample length is 1.0 m and can vary from 0.25 m minimum to a maximum of 1.50 m according to adjustments by the geologist so the intervals do not cross lithological boundaries. Relic fragments of unweathered bedrock of less than 10 cm in length within the saprolite facies are sampled together with the facies in which it occurs. If exceeding 10 cm, the fragment is sampled separately. Soft material is split using a paint scraper and hard core is cut with a diamond saw by HZM personnel.
Samples are double bagged in plastic, and the sample number is written on both bags. Numbered sample tickets are also added to the inner plastic bag; three tickets are placed in the bag with each sample and sent to the laboratory. In the laboratory, two tickets stay with the reject material produced at various stages of preparation while the third follows the pulp through to analysis. The sample number is recorded along with the hole number and sample interval.
The sample is then weighed and this information is also recorded. Project geologists are responsible for ensuring that information is correctly recorded. Sample intervals are marked in the boxes; a metal tag labelled with the sample number, and in the case of QC samples the type, and one ticket from the sample book are all placed at the start of the sample in consideration.

Horizonte Minerals Plc Araguaia Nickel Project Technical Report
Final November 2018 Page 102 of 342
All primary samples have a unique number and sampling of any medium is accompanied by application of sample numbers from the series of standard sampling books of the type that contain six tear-off tickets. All QC samples are also given primary sample numbers.
The numbers assigned to samples on the sampling cards are recorded on a spread sheet, along with drillhole identifier, sample interval, weight, sample batch and volume number. For QC samples the sample type is also recorded. Core samples are transferred from core boxes into sacks and placed on the sampling table. The sampling table is divided so that three batches may be produced at any one time but kept separate by taped lines. Samples are placed on the table in sequential order with sacks containing QC samples also placed in the batch at the correct point.
A batch consists of 42 samples including five control samples: a high nickel standard, a low nickel standard, a quartz blank, plus a pulp duplicate and in alternate batches, a crush duplicate or a field duplicate. Field duplicates are quarter-core samples. Instructions are sent to the sample preparation laboratory (SGS or ALS) to prepare, when required, crush and pulp duplicates at the relevant preparation stage.
11.1.3 Security measures
Standards are closely monitored, each standard has a colour assigned and each individual packet of that standard is marked with the same colour. The standards are placed in sacks which are not immediately sealed but left open for the geologist to verify the contents in the final checking procedure.
Once a batch is complete a final checking procedure is conducted. A HZM Project Geologist takes the sampling spreadsheet relevant for the batch to be packed; initially the number and type of QC samples are checked and verified, the presence of standards and their colours are checked and the standards are sealed in their sacks. The samples are packed in six large sacks (volumes) each containing seven samples. The Project Geologist counts off the seven samples for a volume checking that the initial and final sample numbers as well as the sequence between correspond with the data recorded in the spreadsheet for that volume.
Once the Project Geologist is satisfied that the volume is correct, the samples are double packed into two large sacks with company name, batch number and volume number written on the outside. This procedure is repeated for the six volumes and the geologist then signs off on the batch for dispatch to the sample preparation laboratory via HZM personnel.
The samples are transported by daily local transport and once samples arrive at the sample preparation laboratory custody passes to the laboratory.
Analytical results are received in digital format via email, using a pre-defined Microsoft Excel file format together with a signed analytical certificate in PDF format.
Reference core is stored in core boxes sequentially by hole and box number onsite in Conceição do Araguaia. Pulp and crush rejects are returned after a 90-day period at the sample preparation laboratory; pulp rejects are stored in wooden boxes and crush rejects in large plastic boxes sequentially batch by batch also on site.
11.1.4 Bulk density measurements
The amount of density tests conducted on each facies type is continually monitored to ensure that an even spread of samples is taken across all facies. Bulk density testing is completed as soon after the core arrives in the core shed from the field as possible to avoid drying out of samples and subsequent reduction in volume. One 10 cm to 15 cm length of core is taken every 3.0 m run for bulk density testing of consolidated material. Where possible, each density sample is taken in the first 10 cm to 15 cm of the analytical sample interval to avoid bias, and is not taken across facies boundaries.

Horizonte Minerals Plc Araguaia Nickel Project Technical Report
Final November 2018 Page 103 of 342
Core is weighed wet straight from the box, then in water (after the core is coated with wax) and after drying. Sample drying is by way of oven heating at 100°C for a minimum period of 12 hours. Sample position, number and length, facies type, as well as weight information are recorded. Prior to any weighing exercise the electronic scales are calibrated using a variety of checks. Five “standard samples” with known bulk density values are also tested along with the core samples in order to check both accuracy and precision of the equipment. Currently, two nylon samples, two aluminium samples and one PVC sample are used with known density values ranging from 1.15 g/cm3 to 2.72 g/cm3.
The standard samples approximate a core sample in terms of diameter and length and are weighed on the balance and in water in the same manner as core samples. One of the standard samples is chosen at random and tested with core samples to be tested on that day; the newly tested density value for the standard sample is immediately calculated in the core shed before the other core samples are placed in the oven for drying. If the newly tested density value is acceptably close to the known value for that standard sample, the test is accepted and the samples are sent for drying. If the result of the standard test is unacceptable all the core samples are retested. The standard test is accepted if the newly tested density value is calculated to within ±10%. The temperature of water is taken and recorded; a value significantly above or below 28°C is avoided.
It should be noted that no external, independent bulk density analysis was performed by HZM as it is considered that the results compare well to those from the Teck period of exploration and analysis. A combination of HZM and Teck bulk density measurements, now totalling approximately 11,800 representative samples from each of the major laterite facies, was to derive the dry and wet bulk densities as well as moisture content for resource estimation. The result of this work is summarised in Table 11-1.
Table 11-1 Average bulk densities, moisture content and chemistry for ANS
Facies No. of
samples
BD dry
(g/cm3)
BD wet
(g/cm3)
H2O
(%)
Ni
(%)
Co
(%)
Fe
(%)
SiO2
(%)
MgO
(%)
Al2O3
(%)
Cr2O3
(%)
Soil 791 1.72 2.10 19.62 0.15 0.04 27.52 27.87 0.15 18.22 1.40
Ferricrete 95 1.70 2.21 29.20 0.37 0.11 48.72 9.65 0.21 9.15 1.91
Limonite 1769 1.38 1.89 31.82 0.92 0.13 36.08 21.29 2.33 10.29 2.11
Transition 2446 1.24 1.68 33.25 1.33 0.05 17.94 44.66 11.54 5.13 1.18
Earthy saprolite 733 1.17 1.68 39.46 1.50 0.04 14.72 42.03 18.44 4.33 1.03
Rocky saprolite 2423 1.42 1.82 27.08 1.01 0.03 10.38 42.54 26.03 3.68 0.71
Silicified saprolite 129 1.58 1.95 24.06 0.52 0.03 8.84 66.99 8.10 3.99 0.55
Bedrock 1017 2.26 2.40 6.94 0.28 0.01 5.91 41.01 34.52 1.50 0.42
Diorite 445 1.58 1.95 20.70 0.21 0.02 12.13 47.09 4.46 17.02 0.27
Sediment 1802 1.63 1.98 18.51 0.05 0.01 8.74 58.65 1.82 15.93 0.16
CaO rich 17 2.86 2.91 1.72 0.06 0.01 3.70 16.26 17.46 0.62 0.20
Dyke Al-rich 169 1.74 2.01 13.74 0.13 0.01 5.46 61.14 3.50 15.76 0.07
Quartz vein 12 2.21 2.34 5.98 0.03 0.01 1.79 94.47 0.45 0.95 0.08
Total 11,848
Note: BD – bulk density
11.1.5 Phase 3 sample preparation and analysis
Half-split core samples are crushed and pulverised at SGS laboratory in Goiania and the resultant pulps analysed routinely at SGS Geosol laboratory in Belo Horizonte using tetraborate fusion XRF.
Routine sample preparation and analysis
The following procedures are used for sample preparation of the half core samples submitted (SGS method reference: “PREP_GY”):
• Weigh on receipt
• Dry for 12 hours at 105°C

Horizonte Minerals Plc Araguaia Nickel Project Technical Report
Final November 2018 Page 104 of 342
• Weigh to determine moisture content
• Crush to 95% passing 2 mm
• Weigh to evaluate loss of material during crushing stage
• Sieve at 2 mm size to evaluate performance of crushing stage
• Split to approximately 300 g size
• Weigh 300 g sample
• Pulverise 300 g sample using carbon steel bowl to 85% passing 75 micron screen (Tyler 200 mesh, US Std No. 200)
• Weigh to evaluate loss of material during pulverising stage
• Sieve at 75 micron size to evaluate performance of pulverising stage
• Split a 30 g aliquot that is sent to SGS Geosol, Belo Horizonte, for analysis
• The preparation laboratory also inserts eight QC samples.
Once the prepared samples are received at SGS Geosol, Belo Horizonte, they are re-dried at 105°C (±5°C) before being riffle split and a pulp sample removed for analysis.
A glass fused disc is then prepared using lithium tetraborate to enable XRF analysis to be conducted for Co, Ni, Cu, Pb, Zn and other major oxides, as well as LOI using thermogravimetric analysis by SGS method reference “PHY01E”.
Samples are analysed by method reference “XRF79C” which is one of the Nickel Laterite Packages offered by SGS. The suite of analysed elements and detection limits are given in Table 11-2.
Table 11-2 Suite of constituents for method XRF79C and PHY01E
Element Detection limit Element Detection limit Element Detection limit
Al2O3 0.1% Fe 0.007% Pb 0.01%
Cu 0.01% P2O5 0.01% Cr2O3 0.01%
Ni 0.008% Zn 0.01% MnO 0.01%
TiO2 0.01% Co 0.005% SiO2 0.1%
CaO 0.01% MgO 0.1% LOI -45%
Additional analysis for Co may be required for selected samples by four acid digestion ICP OES, but are only requested after receipt of results from XRF. In the event of the cobalt value in a sample exceeding 0.24%, the sample is re-analysed by SGS method reference “ICP41BB”. The suite of analysed elements and detection limits for this method has an increased upper detection limit for cobalt (8,000 ppm to 10,000 ppm).
Check sample umpire analysis
Where primary analysis has been undertaken at SGS Geosol in Belo Horizonte, check assays are conducted on selected samples at ACME laboratories in Canada.
Umpire samples comprising 30 g aliquots of the remaining pulp of the selected samples are analysed using an identical method to that used in the primary laboratory (i.e. tetraborate fusion/XRF). Umpire samples are submitted in batches of 40 to which two standard samples are added.
Laboratory certification
SGS is independent of HZM and the sample preparation and analytical laboratories are located as follows:
• Preparation:

Horizonte Minerals Plc Araguaia Nickel Project Technical Report
Final November 2018 Page 105 of 342
− SGS Geosol Goiânia Avenida Pedro Ludovico Teixeira Quadra 84, lote 07, galpão 2Parque Oeste Industrial Goiânia, GO, Brazil, 74.375-400
• Analysis:
− SGS Geosol Laboratorio Ltda Av Mario Fonseca Viana 120 Bairro Angicos, Vespasiano, MG
SGS Geosol operates with the following Quality Management System certification:
• ISO 9001:2008; ISO 14001:2004 (ABS 32982 and ABS 39911).
ACME is independent of HZM and its laboratories are located at:
• Acme Analytical Laboratories (Vancouver) Ltd 9050 Shaughnessy Street Vancouver BC V6P 6E5
ACME operates with the following Quality Management System certification:
• ISO 9001:2008 for provision of assays and geochemical analyses.
11.1.6 Results of Phase 3 quality assurance/quality control
Quality assurance (QA) describes the confidence in validity (i.e. data reflects what it is supposed to represent) and correct storage (i.e. data is stored accurately and may be recovered easily and without error) that is perceived for a given dataset. QC procedures are in place by HZM to ensure that a high level of QA is achieved.
Phase 3 results – standards, blanks, duplicates
Sampling of the resource drillhole core resulted in 9,178 samples to which 1,241 control samples were added for a total of 10,417 samples. Control samples account for 12% of the samples submitted for analysis.
Criteria for batch acceptance/rejection
Assay batches are passed or failed according to the following criteria based on analyses for nickel:
• Blank values must not exceed 200 ppm for Ni (2.5 x detection limit)
• Duplicate (pulp and crush) values must lie within ±10% of the primary sample.
Standard values fall within “boundary gates” as follows:
• OREAS standards – values must not exceed mean ±10%
• If a pass is not achieved, then the analysis will be considered to have failed.
A batch is accepted for entry into the database if all standards, blanks, and duplicates pass; or only a single Ni standard fails (exceed the boundary gates) – in this case only the standard is re-analysed. If the fail is repeated, the batch is deemed to have failed.
A batch will be rejected, not entered into the database, and submitted for re-assay if both standards fail; a blank fails or, a pulp/crush duplicate analysis fails.
If there is a discrepancy of ±10% for field duplicate results, it is reported to the HZM Project Manager who decides on either reporting it further to the Qualified Person or depending on all other samples in the batch whether to proceed to include the batch in the database.

Horizonte Minerals Plc Araguaia Nickel Project Technical Report
Final November 2018 Page 106 of 342
Failure of blank/standard samples could be due to errors in the analytical machine and should be investigated at the analytical laboratory. Failure of pulp/crush duplicates could be due to problems at the preparation laboratory which should be investigated.
If a batch passes based on the Ni pass criteria, the values for Fe, SiO2 and MgO from the standard samples submitted in the batch are reviewed. If one or more of the values for these oxides exceeds the mean ±10%, the results for the batch are flagged for critical examination and the Qualified Persons determine if the batch passes or if re-assay is required.
Results – batch criteria
The assay results under review were reported in 254 certificates of analysis. Out of the 254 certificates, nine were initially rejected. The reasons for rejection, actions taken, and current status are primarily the following:
• OREAS standards assay values incompatible with recommended values. On further analysis established that standards were switched. Accepted on switch reversal.
• Sample mix-up requiring repeat laboratory work. The re-analysis resolved the mix-up.
• Blank assay value incompatible with recommended value. On further analysis established that blank was switched with identifiable sample. Accepted on switch reversal.
Three of the certificates were subsequently accepted where sample identifier switches were identified and corrected. The re-analysis of the samples for nine certificates returned acceptable values for the samples in question and the new certificates were accepted.
Results – duplicates
HZM used three types of duplicate samples in the Phase 3 drilling campaign:
• Field duplicates: Field duplicate samples were designed to test the sample heterogeneity. They were taken at the rate of one every alternate batch dispatched, i.e. one in 74 samples. Where a sample interval was selected for a field duplicate, the remaining half-core from primary sample was further split in two, leaving a quarter-core material in core boxes.
• Crush duplicates: Crush duplicates tested the variability at the crusher stage and again were taken at the rate of one every alternate batch, i.e. one in 74 samples. Crush duplicates were not prepared on site but were produced following instruction given to the preparation laboratory. The preparation laboratory had to split the selected sample post crushing into two equal samples viz., a primary and duplicate sample.
• Pulp duplicates: Pulp duplicates tested the variability at the pulverisation stage and were taken at the rate of one every batch, i.e. one in 37 samples. As for the crush duplicates, the pulp duplicates were not prepared on site but by the preparation laboratory following instruction by HZM. The preparation laboratory had to split the selected sample post pulverising into two equal samples viz., a primary and duplicate sample.
A total of 497 duplicate samples were inserted in the HZM samples submitted during the Phase 3 drilling campaign for 4.8% of the total, which included 127 field duplicates, 124 crush duplicates and 246 pulp duplicates. With few exceptions, samples showed satisfactory re-assay precision statistics for the whole range of data values with assay pairs showing less than 10% absolute difference between first and second assays.
11.1.7 Phase 3 results – umpire assay analysis
After receipt of the primary assay results, 5% of the samples (from mineralised zones) were selected for umpire assay. A minimum protocol is that greater than 90% of the samples assayed at the umpire laboratory should give a less than 10% difference in nickel values relative to the primary laboratory.
In 2013, HZM dispatched 457 duplicate pulp samples (55 from JAC, 37 from PQW, 73 from VOE, 202 from VOI, and 90 from VOW) to ACME for umpire analysis.

Horizonte Minerals Plc Araguaia Nickel Project Technical Report
Final November 2018 Page 107 of 342
The author considers these results to be acceptable.
11.1.8 Phase 4 sample preparation and analysis
Half-split core samples are crushed and pulverised at the ALS sample preparation laboratory in Goiania and the resultant pulps analysed at ALS laboratory in Lima, Peru using tetraborate fusion XRF. The 100 kg subsamples from the bulk samples were riffle split to produce the aliquot for subsequent crushing and pulverising.
Routine sample preparation and analysis
Sample preparation procedures for the half core samples submitted are described below (and follow ALS method reference PREP-31):
• The sample is logged in the tracking system, a bar code attached and is weighed.
• Dry overnight at a maximum of 120oC.
• Crush to better than 70% passing a 2 mm (Tyler 9 mesh, US Std. No.10) screen:
− QC testing of crushing efficiency and material control is conducted on 3% of the samples in a sample batch. The first sample is always tested and generally the last. Intermediate samples are randomly selected to complete the 3% check.
• The sample is passed through a riffle splitter to produce a subsample of up to 250 g for pulverising and the remaining reject will be bagged and transferred to storage pending client instructions.
• The 250 g subsample is pulverised to better than 85% passing a 75 micron (Tyler 200 mesh, US Std. No. 200) screen:
− QC testing of pulverising efficiency and material control is conducted on 3% of the samples. Given that each pulverising station has two pulverisers, the first two batch samples are always tested and generally the last two tested. Intermediate samples are randomly selected to complete the 3% check.
A laboratory split of the sample pulp is required when analyses will be performed at a location different from where the samples were received and prepared. This split is typically 30 g but can vary depending on the type of analysis requested. For an XRF12u assay an aliquot of 0.66 g is required so the split sent to the assay laboratory is typically 20 g.
Once the laboratory pulp splits of the samples are received at ALS Peru, they are re-dried at 105°C (±5°C) before being riffle split and a 0.66 g aliquot removed for an XRF12u analysis.
During the analysis of 12,617 core, auger (100 kg) and HZM QC samples, ALS utilised 6,167 internal QC samples or approximately one control sample for every two samples in the analytical process. The ALS control samples included: 3,088 standards, 1,816 blanks and 1,263 duplicates.
The assays for the 6,167 control samples were reported in 302 certificates of analysis which works out to an average of 20 standard, blank and duplicate laboratory control samples per certificate. This combined with the five HZM QC samples totals an average of 25 control samples per 37 core samples.
Samples are analysed by method “ME-XRF12u” which is a Nickel Laterite Package offered by ALS. LOI analysis is provided by method “OA-GRA05x”. The suite of constituents analysed with lower limits are given in Table 11-3.
Table 11-3 Suite of constituents for method ME-XRF12u and lower detection limits
Element Detection limit Element Detection limit Element Detection limit
Al2O3 0.01% Fe2O3 0.01% P2O5 0.005%
BaO 0.01% K2O 0.01% Pb 0.005%
CaO 0.01% MgO 0.01% SiO2 0.05%
Co 0.001% MnO 0.005% TiO2 0.01%

Horizonte Minerals Plc Araguaia Nickel Project Technical Report
Final November 2018 Page 108 of 342
Cr2O3 0.005% Na2O 0.01% Zn 0.001%
Cu 0.001% Ni 0.005% ZrO2 0.01%
Check sample umpire analysis
Where primary analysis was undertaken at ALS in Lima (Peru), check analyses were conducted on selected samples at SGS Geosol in Belo Horizonte using an identical method.
Samples are analysed by method reference “XRF79C” and “PHY01E” (Table 11-2).
In the event of the cobalt value in a sample exceeding 0.24%, the sample is re-analysed by SGS method reference “ICP41BB”. The detection limits for this method has an increased upper detection limit for cobalt of 10,000 ppm. The suite of analysed elements and detection limits were recorded and reported accordingly.
Laboratory certification
ALS is independent of HZM and the sample preparation laboratories are located at:
• ALS Minerals Ltda Avenida Anhanguera Qd 25 Lt 11 ,nº15060,setor Santos Dumont Goiânia, Goiás, Brazil, 74463-350
• ALS Minerals Ltda Rua São Paulo, 685, Célvia Vespasiano Belo Horizonte, Minas Gerais Brazil, 33200-000
The analytical laboratories are located at:
• ALS Peru Calle 1 LT-1A Mz-D, esq. Calle A Urb. Industrial Bocanegra Callao 01 Lima, Peru
• ALS Minerals 2103 Dollarton Hwy North Vancouver, British Columbia Canada, V7H 0A7
All four ALS laboratories listed are ISO 9001 and ISO 17025 certified.
SGS Geosol is independent of HZM and the preparation laboratory is located at:
• SGS Geosol Goiânia Avenida Pedro Ludovico Teixeira, Quadra 84, lote 07, galpão 2 Parque Oeste Industrial, Goiânia, GO Brazil, 74.375-400
The analytical laboratory is located at:
• SGS Geosol Laboratorio Ltda Av Mario Fonseca Viana, 120 Bairro Angicos, Vespasiano, Minas Gerais, Brazil
SGS Geosol laboratories listed are ISO 9001:2008; ISO 14001:2004 (ABS 32982 and ABS 39911) certified.
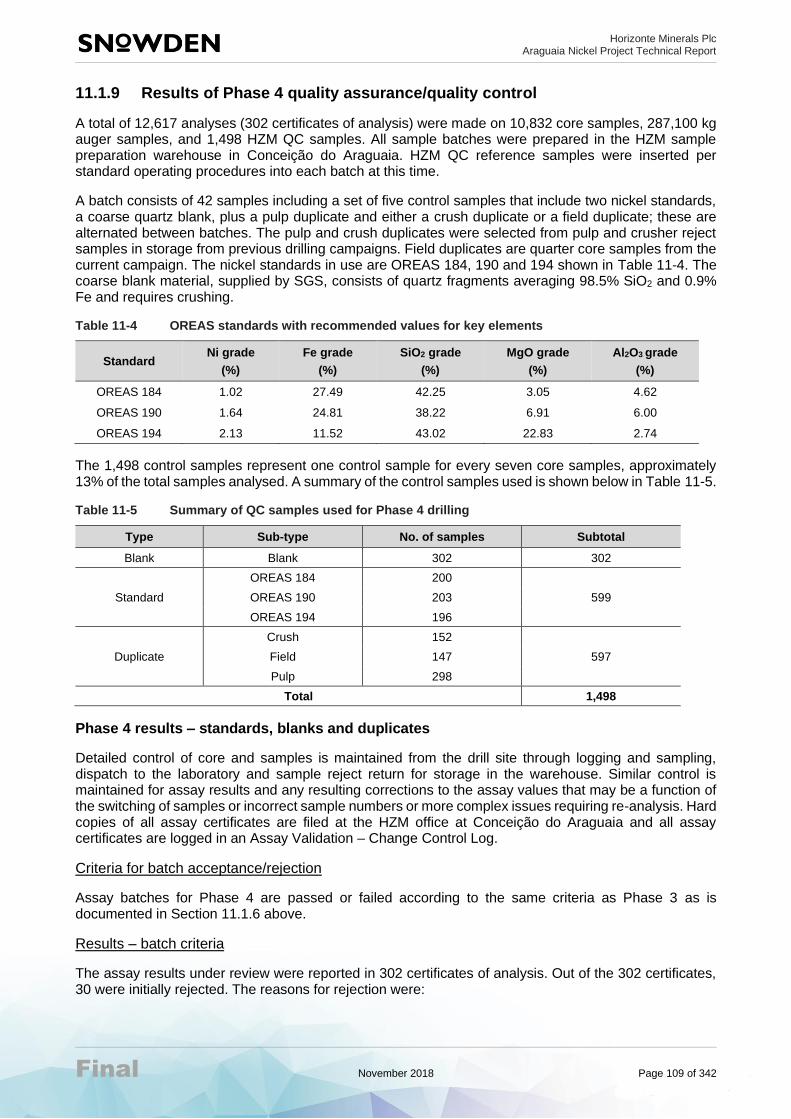
Horizonte Minerals Plc Araguaia Nickel Project Technical Report
Final November 2018 Page 109 of 342
11.1.9 Results of Phase 4 quality assurance/quality control
A total of 12,617 analyses (302 certificates of analysis) were made on 10,832 core samples, 287,100 kg auger samples, and 1,498 HZM QC samples. All sample batches were prepared in the HZM sample preparation warehouse in Conceição do Araguaia. HZM QC reference samples were inserted per standard operating procedures into each batch at this time.
A batch consists of 42 samples including a set of five control samples that include two nickel standards, a coarse quartz blank, plus a pulp duplicate and either a crush duplicate or a field duplicate; these are alternated between batches. The pulp and crush duplicates were selected from pulp and crusher reject samples in storage from previous drilling campaigns. Field duplicates are quarter core samples from the current campaign. The nickel standards in use are OREAS 184, 190 and 194 shown in Table 11-4. The coarse blank material, supplied by SGS, consists of quartz fragments averaging 98.5% SiO2 and 0.9% Fe and requires crushing.
Table 11-4 OREAS standards with recommended values for key elements
Standard Ni grade
(%)
Fe grade
(%)
SiO2 grade
(%)
MgO grade
(%)
Al2O3 grade
(%)
OREAS 184 1.02 27.49 42.25 3.05 4.62
OREAS 190 1.64 24.81 38.22 6.91 6.00
OREAS 194 2.13 11.52 43.02 22.83 2.74
The 1,498 control samples represent one control sample for every seven core samples, approximately 13% of the total samples analysed. A summary of the control samples used is shown below in Table 11-5.
Table 11-5 Summary of QC samples used for Phase 4 drilling
Type Sub-type No. of samples Subtotal
Blank Blank 302 302
Standard
OREAS 184 200
OREAS 190 203 599
OREAS 194 196
Duplicate
Crush 152
Field 147 597
Pulp 298
Total 1,498
Phase 4 results – standards, blanks and duplicates
Detailed control of core and samples is maintained from the drill site through logging and sampling, dispatch to the laboratory and sample reject return for storage in the warehouse. Similar control is maintained for assay results and any resulting corrections to the assay values that may be a function of the switching of samples or incorrect sample numbers or more complex issues requiring re-analysis. Hard copies of all assay certificates are filed at the HZM office at Conceição do Araguaia and all assay certificates are logged in an Assay Validation – Change Control Log.
Criteria for batch acceptance/rejection
Assay batches for Phase 4 are passed or failed according to the same criteria as Phase 3 as is documented in Section 11.1.6 above.
Results – batch criteria
The assay results under review were reported in 302 certificates of analysis. Out of the 302 certificates, 30 were initially rejected. The reasons for rejection were:

Horizonte Minerals Plc Araguaia Nickel Project Technical Report
Final November 2018 Page 110 of 342
• Crush duplicate pair outside acceptable limits. All duplicate values, except Ni within acceptable limits. Upon re-examination, certificate accepted.
• Field duplicate pair outside acceptable limits. All duplicate values, except one or more specific components within acceptable limits. Upon re-examination, certificate accepted.
• Field duplicate pair outside acceptable limits. On further analysis, established that duplicates had been switched. Accepted on switch reversal.
• Pulp duplicate pair incorrectly identified. This duplicate pair removed and certificate accepted.
• Standard value falls outside of acceptable limits. Standard value falls just outside the acceptable limits for specific component. Upon re-examination, certificate accepted.
Three of the certificates were subsequently accepted where sample identifier switches were identified and corrected. In the review of the 12 certificates with one primary element in excess of the mean ±3 standard deviations, none of the values exceeded the OREAS standard boundary gates of mean ±10%. Of the 17 certificates with flagged duplicates, all were accepted though three pairs were removed from charting because they could not be reconciled, even after re-analysis.
Results – duplicates
HZM used three types of duplicate samples in the Phase 4 drilling campaign:
• Field duplicate samples were designed to test the sample heterogeneity. They were taken at the rate of one every alternate batch dispatched, i.e. one in 74 samples. Where a sample interval was selected for a field duplicate, the remaining half core from primary sample was further split in two, leaving a quarter core sample in the core box.
• Crush duplicates tested the variability at the crusher stage and again were taken at the rate of one every alternate batch, i.e. one in 74 samples. Crush duplicates were selected from crusher reject samples in storage.
• Pulp duplicates tested the variability at the pulverisation stage and were taken at the rate of one every batch, i.e. one in 37 samples. As for the crush duplicates, the pulp duplicates were selected from pulp samples in storage.
With few exceptions, samples show satisfactory re-assay precision statistics for the whole range of data values with assay pairs showing less than 10% absolute difference between first and second assays.
11.1.10 Phase 4 results – umpire assay analysis
After receipt of the primary assay results 5% of the samples from mineralised zones with Ni assays ≥1% representing the principal mineralised facies were selected for umpire assay. The protocol for acceptable results is for more than 90% of the samples assayed at the umpire laboratory to show less than 10% difference in nickel values relative to the primary laboratory.
In 2015, HZM dispatched 210 duplicate pulp samples for umpire analysis (39 from JAC area and 171 from PQZ) to SGS.
The results of the umpire analyses for Ni, Fe, SiO2, MgO and Al2O3 are considered acceptable.
11.1.11 Author’s opinion
With regards to the adequacy of sample preparation, security, and analytical procedures; the author concludes that the procedures are acceptable and that the resulting records are suitable for use in Mineral Resource estimation.

Horizonte Minerals Plc Araguaia Nickel Project Technical Report
Final November 2018 Page 111 of 342
11.1.12 PQZ test pit quality assurance/quality control
Introduction
The results of the ANP QAQC program for core, channel and bulk sampling, and XRF assaying of material from the PQZ trial pit site in 2017 are reported below.
The trial pit is located at the western end of the PQZ deposit. A 25 m x 30 m block approximately centred on existing drillhole PCA DD 1776 was drilled at 5 m spacings. The block was divided into 5 m x 5 m x 2 m standard mining units (SMUs) and grade control (GC) drillholes were completed at the centre of each SMU (Figure 11-1 and Table 11-6).
The trial pit exposed the Core Zone: SMUs 13, 14, 18, and 19 for channel and bulk sample starting at level D (278 m to 280 m ASL) (Table 11-6 and Figure 11-2). In-situ channel samples, in W format and weighing approximately 60 kg were only taken off level D material due a high risk of wall collapse below level D. Following channel sampling the SMUs were excavated and stacked separately. Excavation of SMUs 13, 14, 18, and 19 continued to level F (274 m to 276 m ASL) but halted due to very poor ground conditions and abundant water. Homogenised bulk sample splits weighing approximately 215 kg were taken from each SMU.
A fourth set of samples were prepared for crushing and screening tests. They consisted of a 2,000 kg sample of essentially coarser grained saprolite and sap rock (sample GS), and a 2,000 kg sample of a SMU blend approximating the projected ROM feed (sample TransAP). Both samples were processed at the University of São Paulo (USP) material handling laboratory. These yielded two sets of size fraction samples for chemical analysis.
The trial pit excavation and sampling and the USP crushing and screening tests are detailed elsewhere in this FS and as such are only summarised here to establish the chain of custody of the samples analysed by ALS.
Twelve SMU W Channel and SMU Bulk samples were collected in the field. However, to better evaluate sample homogeneity a second set of samples was produced in the lab for each set of 12 collected in the field. Thus, the 24 SMU W Channel and SMU Bulk samples were analysed as indicated in Table 11-6.
A sample summary by type is shown in Table 11-6.
Table 11-6 Sample summary
Sample type Samples
DDH-SMUGC core 644
SMU W Channel 24
SMU Bulk 24
SMU Composited bulk coarse SAP grain size fractions 24
SMU Composited bulk 60T/40S grain size fractions 21
Total laterite samples 737
Following the completion of the assaying of all the above samples 70 pulp samples were selected for umpire check assaying at SGS in Belo Horizonte.
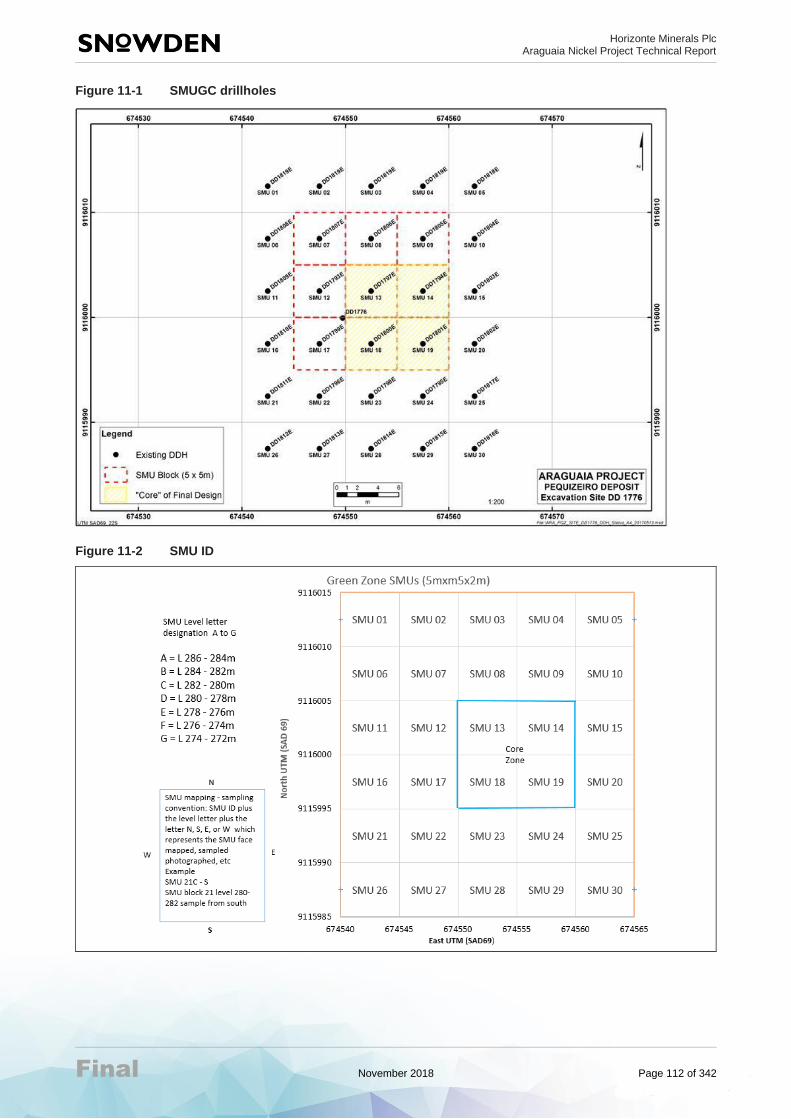
Horizonte Minerals Plc Araguaia Nickel Project Technical Report
Final November 2018 Page 112 of 342
Figure 11-1 SMUGC drillholes
Figure 11-2 SMU ID

Horizonte Minerals Plc Araguaia Nickel Project Technical Report
Final November 2018 Page 113 of 342
Sample preparation – HZM
Drill core sample preparation
A total of 18 sample batches consisting of 644 core samples, and 88 QC reference samples were prepared per HZM’s Standard Operating Procedures (SOPs) in HZM’s sample preparation warehouse in Conceição do Araguaia. The procedures are summarised here.
Detailed control of the core is maintained from the drill site through logging and sampling in the sample preparation warehouse in Conceição do Araguaia, dispatch to laboratory for preparation and analysis, and sample reject return the project for storage in the warehouse. Similar detailed control is maintained for assay results.
A standard batch consists of 37 core samples and a set of at least five control samples that include two nickel standards, a coarse quartz blank, plus a pulp duplicate and either a crush duplicate or a field duplicate, that are alternated between batches. The pulp and crush duplicates were selected from pulp and crusher reject samples in storage from previous drilling campaigns.
Field duplicates are quarter-core samples. The nickel standards in use are Ore Research & Exploration Pty Ltd Assay Standards (OREAS) 184, 190 and 194 (Table 11-4). The blank material, supplied by SGS, consists of coarse siliceous material in fragments which average 98.5% SiO2 and 0.9% Fe and require crushing.
The 88 control samples that were inserted in the batches represent one control sample for every seven core samples or 13%. A summary of the control samples used by type and ID is shown in Table 11-7.
Table 11-7 Control sample summary DDH-SMUGC samples
QC type QC ID Samples Total
Blank Parafusando 18 18
Standard
OREAS 184 11
35 OREAS 190 14
OREAS 194 10
Duplicate
Crush 9
35 Field 9
Pulp 17
Total 88
The samples were dispatched to the ALS Mineral laboratory in Goiania for preparation and subsequent analysis.
SMU W channel and bulk sample preparation
The samples were prepared and bagged in the field for shipment to ALS. At the sample preparation warehouse in Conceição do Araguaia each of the samples field IDs and number of bags per sample were verified. Labels and standard six-digit sample numbers were assigned to each of the samples. QC samples consisting of one blank, two standards, and four duplicates were added to each of the two batches consisting of 31 samples each. The samples were then dispatched to ALS Minerals sample preparation laboratory in Goiania.
Bulk composite coarse grained sample and 60T/40S samples
The samples were prepared and bagged in the field for shipment to USP. At the sample preparation warehouse the sample field IDs were confirmed and logged prior to shipping to USP in São Paulo. No standard six-digit sample numbers were assigned to these samples.

Horizonte Minerals Plc Araguaia Nickel Project Technical Report
Final November 2018 Page 114 of 342
At USP the two samples were processed. One of the products of the processing was a set of 45 micron size fraction samples from the two bulk composite samples, 24 from the coarse-grained saprolite dominant sample and 21 from the 60 Transition/40 Saprolite sample. USP dispatched the 45 samples, each weighing approximately 100 g, directly to ALS in Goiania for preparation and XRF analysis. At the ALS sample preparation facility, the samples were logged, given HZM standard six-digit sample numbers, quality control samples were inserted and work orders prepared by HZM.
ALS sample preparation
SMUGC drill core sample preparation
The half-split core samples are crushed and pulverised at the ALS laboratory in Goiania.
The sample pulp aliquots are then sent to the ALS laboratory in Lima, Peru for analysis using tetraborate fusion for XRF constituent determination, method “ME-XRF12u”, which is the ALS nickel laterite package (Table 11-3). LOI analysis is provided by method “OA-GRA05x”.
SMU W and bulk sample lab preparation
The 12 W channel and 12 bulk SMU samples were shipped to ALS Global in Goiania for sample preparation. Two 4 kg subsamples were requested for each of the 12 bulk samples to judge the degree of sample homogenisation. Both sets of field samples were treated identically in the sample preparation process described below.
On arrival the sample was logged in, weighed, dried and then crushed to 70% passing 2 mm. The crushed sample was then homogenised and quartered with a rotary splitter in four passes to produce a 4 kg subsample. Once the first subsample was taken the sample was reconstituted and run through the rotary splitter in four passes to obtain the second 4 kg subsample. The 4 kg subsamples of crushed material were then reduced to 1 kg using a riffle splitter and the entire sample pulverised to 85% passing 75 um. The aliquot for XRF-LOI analyses was split from the pulverised material and analysed at the ALS Global lab in Lima, Peru.
QC assay results
Criteria for batch acceptance or rejection
Assay batches are passed or failed according to the criteria listed below.
Analyses for nickel:
• Blank values must not exceed 200ppm for Ni (4 x detection limit)
• Duplicate (pulp and crush) values must lie within 10% of the primary sample.
• Standard values fall within “boundary gates” as follows:
− OREAS standards – values must not exceed mean ±10%
• If a pass is not achieved, then the analysis will be considered to have failed.
• A batch is accepted for entry into the database if:
− All standards, blanks, and duplicates pass, or
− Only a single Ni standard fails (exceed the boundary gates); in this case, only the standard is re-analysed
− If the fail is repeated, the batch is deemed to have failed.
• A batch will be rejected, not entered into the database, and submitted for re-assay if:
− Both standards fail
− A blank fails
− A pulp/crush duplicate analysis fails.

Horizonte Minerals Plc Araguaia Nickel Project Technical Report
Final November 2018 Page 115 of 342
Results
The assay results were reported in 24 certificates of analysis for 924 samples. The assay results for Ni, Fe, SiO2, MgO, and Al2O3 for OREAS standards 184, 190, and 194 were presented on Standard Control Charts. Blank assay results were also plotted for SiO2 and Fe. Duplicate pulp, field and crusher reject assay data were also plotted. Out of the 24 certificates, none were flagged for review. It is concluded that the descriptive statistics indicate that the ALS assay results are of good quality and acceptable.
Standards
Control charts for the OREAS standards 184, 190, and 194 assay results for Ni, Fe, SiO2, MgO, and Al2O3 were plotted. Eight assays outside of the mean ±3 standard deviations limits were noted. However, none of the values exceeds the respective mean by ±5% while the absolute limit is ±10%. Thus, the certificates were accepted.
Blanks
A total of 20 blank control samples were analysed. Based on the plotted results, and SiO2 and Fe assay control charts, no contamination or other issues was detected.
Duplicates
HZM inserted a total of 48 duplicate samples in the sample batches described above.
With no exceptions, samples show satisfactory re-assay precision statistics for the whole range of data values with assay pairs showing less than 10% absolute difference between first and second assays.
Check sample umpire analysis
On completion of the assay work described above a total of 70 pulp samples were selected from the
samples assayed by ALS in 2017 for check sample umpire analyses at SGS Geosol in Belo Horizonte
using an identical method. The sample selection criteria consisted of selecting approximately 10% of the
SMUGC samples from the mineralised zones with Ni assaying ≥0.9% Ni, and representing the principal
mineralised facies in the SMUGC sample set.
Samples were analysed by method reference “XRF79C” and “PHY01E” (Table 11-2).
The umpire pulp samples were submitted in two batches to which six OREAS standard samples were added. Comments on the OREAS standards are provided above.
A minimum protocol would be for >90 % of the samples assayed at the umpire laboratory should give <10 % difference in nickel values relative to the primary laboratory.
The results of the umpire analyses were plotted in ALS vs SGS scattergrams for Ni, Fe, SiO2, MgO and Al2O3. No data points fall outside of the fences, thus the minimum protocol for acceptance is clearly met. The results show a high degree of correlation with coefficients of determination (R2) varying from 0.9965 to 0.9997. The results are considered acceptable and endorsed by the author.
11.2 ANN
The following sections describe the preparation and analysis of samples and security of samples as carried out by Xstrata for VDS deposit.
11.2.1 Sample preparation methods and QC measures
Sample preparation methods and QC measures prior to dispatch of samples, is discussed below.

Horizonte Minerals Plc Araguaia Nickel Project Technical Report
Final November 2018 Page 116 of 342
Between 2004 and the end of 2005, core samples were submitted to SGS facilities in Parauapebas for preparation and dispatch to SGS Geosol for analysis. In January 2006, Xstrata built and commenced operation of a sample preparation facility at the field office near Vila Sao Jose with SGS Geosol providing direct supervision of sample preparation and dispatch for analysis.
11.2.2 Sample splitting
At the core logging facility core was inspected, rocky saprolite and fresh rock intersections were cut into equal halves using a diamond saw. Limonite and earthy saprolite core was split into equal halves using a machete. Core was then laid out in order on logging tables using the meterage markers inserted by the drillers and logged.
Sampling intervals have a nominal length of 1 m and as a rule respect major facie contacts. Sample lengths range from 0.3 m to 1.5 m with two-thirds of the samples having lengths between 0.8 m and 1.2 m. Longer samples were allowed only in low-recovery intervals or in waste rock. Samples were taken from the right hand side of the core with sample intervals marked on plastic sheets wrapping the cores.
After logging and sampling, trained personnel placed samples into plastic bags. The sample number is written on the outside of the bag, a thick paper tag with the sample number is inserted into the bag and the bag is tightly secured with a plastic strap. These samples were then placed into larger plastic bags, up to 50 kg, for transportation to the sample preparation facility at the main Xstrata camp near Vila Sao Jose. Chain of Custody forms were filled in when samples change custody. Core boxes, with the remaining core, were transferred on a monthly basis to the permanent storage facility, also located at the main camp.
11.2.3 Security measures
Sample and data collection are handled by Xstrata personnel on site. Drill core is wrapped in thick polyethylene sheets to maintain the original moisture then placed in wooden core boxes and nailed shut, reverse cycle samples are bagged and tied at the drill site ensuring every care is taken to eliminate contamination and security breaches in the transfer of core and reverse cycle samples from drill site to processing facility. Core boxes (and reverse cycle samples) are collected daily, at the end of each shift by Xstrata personnel and delivered to the Base Camp for subsequent logging and sampling.
Drill core logging is initially recorded by hand on paper logsheets before being transferred to electronic format and the project database. Both data records remain available for validation.
Prepared samples are transported in a company truck to the SGS Geosol laboratory in Paraupebas where custody of the samples is handed over to SGS. Dispatch sheets are used and signed to confirm dispatch and receipt of sample batches. SGS Geosol dispatch the samples to Belo Horizonte by TAM cargo from Maraba. Upon arrival at SGS Geosol in Belo Horizonte batch data are entered into the laboratory LIMS system. Analytical results are received from SGS in digital format via email as well as a hardcopy that has been signed.
All half core splits from the logging tables are sent to the Base Camp in Vila Sao Jose. They are stored in order by hole/box number in fabricated core rack modules. All drillholes are individually catalogued and their locations recorded in a logbook.
Reject samples are placed in bags then put in larger plastic boxes and stored at site. Pulp sample split for assaying is initially kept at the assaying facility of SGS in Belo Horizonte, Brazil. The remaining pulp samples are bagged and stored in the warehouse in Vila Sao Jose.
11.2.4 Bulk density measurements
Bulk density measurements are determined using the water displacement method, standard wet weight in air and in water, and dry weight method. Core is wrapped in plastic film to prevent water penetration into the core. Density is calculated using Archimedes’ principle. Bulk density testing is completed as soon as possible after the core arrives in the core shed from the field to avoid drying out of samples and subsequent reduction in volume. Wet and dry bulk density, and free moisture content formulae are in accordance with standard industry practice.
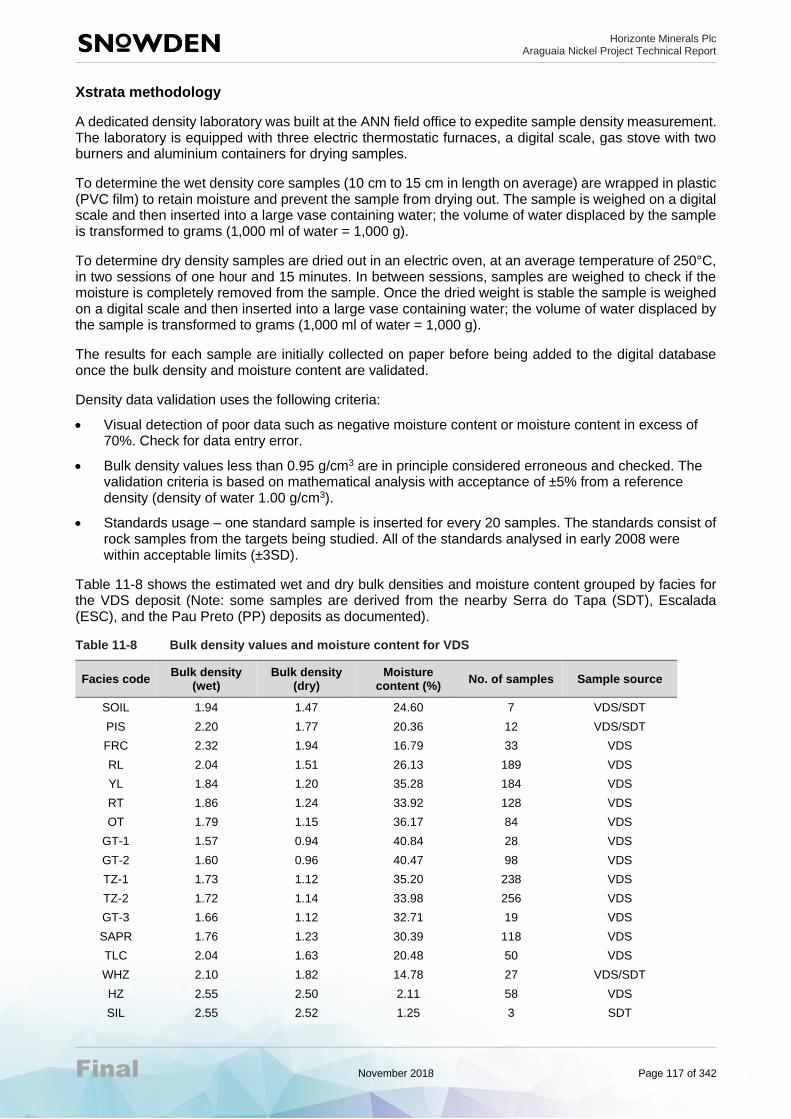
Horizonte Minerals Plc Araguaia Nickel Project Technical Report
Final November 2018 Page 117 of 342
Xstrata methodology
A dedicated density laboratory was built at the ANN field office to expedite sample density measurement. The laboratory is equipped with three electric thermostatic furnaces, a digital scale, gas stove with two burners and aluminium containers for drying samples.
To determine the wet density core samples (10 cm to 15 cm in length on average) are wrapped in plastic (PVC film) to retain moisture and prevent the sample from drying out. The sample is weighed on a digital scale and then inserted into a large vase containing water; the volume of water displaced by the sample is transformed to grams (1,000 ml of water = 1,000 g).
To determine dry density samples are dried out in an electric oven, at an average temperature of 250°C, in two sessions of one hour and 15 minutes. In between sessions, samples are weighed to check if the moisture is completely removed from the sample. Once the dried weight is stable the sample is weighed on a digital scale and then inserted into a large vase containing water; the volume of water displaced by the sample is transformed to grams (1,000 ml of water = 1,000 g).
The results for each sample are initially collected on paper before being added to the digital database once the bulk density and moisture content are validated.
Density data validation uses the following criteria:
• Visual detection of poor data such as negative moisture content or moisture content in excess of 70%. Check for data entry error.
• Bulk density values less than 0.95 g/cm3 are in principle considered erroneous and checked. The validation criteria is based on mathematical analysis with acceptance of ±5% from a reference density (density of water 1.00 g/cm3).
• Standards usage – one standard sample is inserted for every 20 samples. The standards consist of rock samples from the targets being studied. All of the standards analysed in early 2008 were within acceptable limits (±3SD).
Table 11-8 shows the estimated wet and dry bulk densities and moisture content grouped by facies for the VDS deposit (Note: some samples are derived from the nearby Serra do Tapa (SDT), Escalada (ESC), and the Pau Preto (PP) deposits as documented).
Table 11-8 Bulk density values and moisture content for VDS
Facies code Bulk density
(wet) Bulk density
(dry) Moisture
content (%) No. of samples Sample source
SOIL 1.94 1.47 24.60 7 VDS/SDT
PIS 2.20 1.77 20.36 12 VDS/SDT
FRC 2.32 1.94 16.79 33 VDS
RL 2.04 1.51 26.13 189 VDS
YL 1.84 1.20 35.28 184 VDS
RT 1.86 1.24 33.92 128 VDS
OT 1.79 1.15 36.17 84 VDS
GT-1 1.57 0.94 40.84 28 VDS
GT-2 1.60 0.96 40.47 98 VDS
TZ-1 1.73 1.12 35.20 238 VDS
TZ-2 1.72 1.14 33.98 256 VDS
GT-3 1.66 1.12 32.71 19 VDS
SAPR 1.76 1.23 30.39 118 VDS
TLC 2.04 1.63 20.48 50 VDS
WHZ 2.10 1.82 14.78 27 VDS/SDT
HZ 2.55 2.50 2.11 58 VDS
SIL 2.55 2.52 1.25 3 SDT
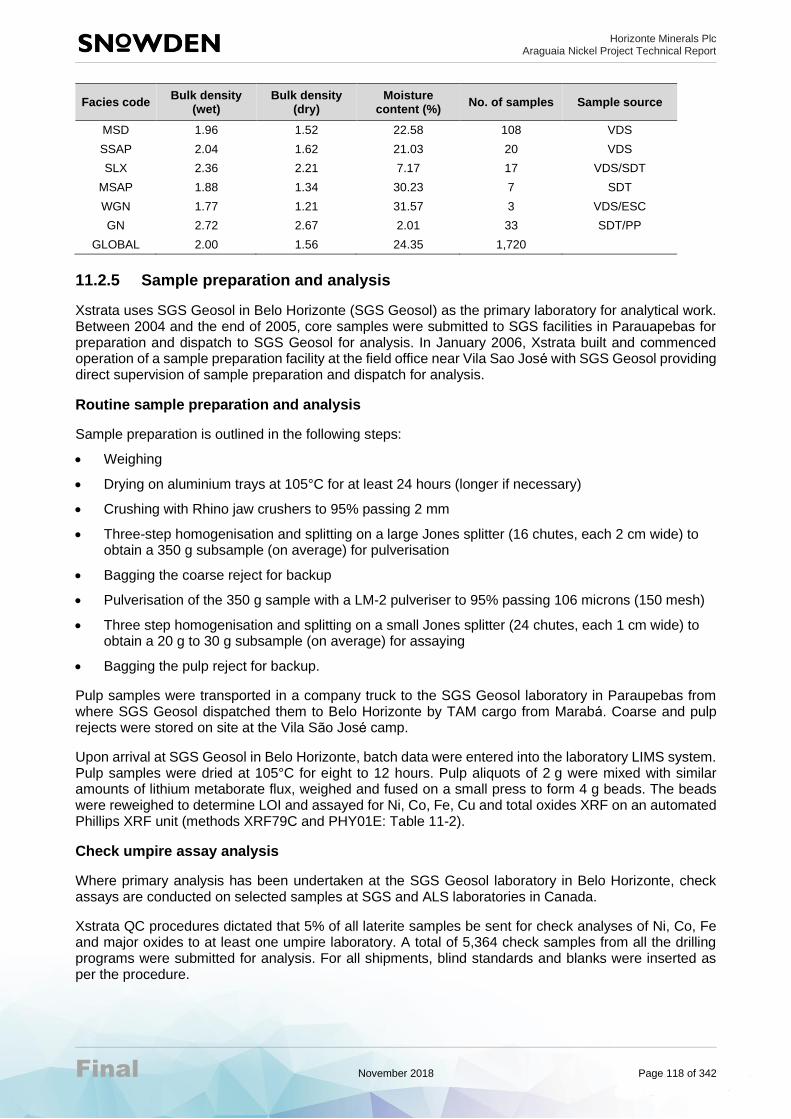
Horizonte Minerals Plc Araguaia Nickel Project Technical Report
Final November 2018 Page 118 of 342
Facies code Bulk density
(wet) Bulk density
(dry) Moisture
content (%) No. of samples Sample source
MSD 1.96 1.52 22.58 108 VDS
SSAP 2.04 1.62 21.03 20 VDS
SLX 2.36 2.21 7.17 17 VDS/SDT
MSAP 1.88 1.34 30.23 7 SDT
WGN 1.77 1.21 31.57 3 VDS/ESC
GN 2.72 2.67 2.01 33 SDT/PP
GLOBAL 2.00 1.56 24.35 1,720
11.2.5 Sample preparation and analysis
Xstrata uses SGS Geosol in Belo Horizonte (SGS Geosol) as the primary laboratory for analytical work. Between 2004 and the end of 2005, core samples were submitted to SGS facilities in Parauapebas for preparation and dispatch to SGS Geosol for analysis. In January 2006, Xstrata built and commenced operation of a sample preparation facility at the field office near Vila Sao Jose with SGS Geosol providing direct supervision of sample preparation and dispatch for analysis.
Routine sample preparation and analysis
Sample preparation is outlined in the following steps:
• Weighing
• Drying on aluminium trays at 105°C for at least 24 hours (longer if necessary)
• Crushing with Rhino jaw crushers to 95% passing 2 mm
• Three-step homogenisation and splitting on a large Jones splitter (16 chutes, each 2 cm wide) to obtain a 350 g subsample (on average) for pulverisation
• Bagging the coarse reject for backup
• Pulverisation of the 350 g sample with a LM-2 pulveriser to 95% passing 106 microns (150 mesh)
• Three step homogenisation and splitting on a small Jones splitter (24 chutes, each 1 cm wide) to obtain a 20 g to 30 g subsample (on average) for assaying
• Bagging the pulp reject for backup.
Pulp samples were transported in a company truck to the SGS Geosol laboratory in Paraupebas from where SGS Geosol dispatched them to Belo Horizonte by TAM cargo from Maraba. Coarse and pulp rejects were stored on site at the Vila Sao Jose camp.
Upon arrival at SGS Geosol in Belo Horizonte, batch data were entered into the laboratory LIMS system. Pulp samples were dried at 105°C for eight to 12 hours. Pulp aliquots of 2 g were mixed with similar amounts of lithium metaborate flux, weighed and fused on a small press to form 4 g beads. The beads were reweighed to determine LOI and assayed for Ni, Co, Fe, Cu and total oxides XRF on an automated Phillips XRF unit (methods XRF79C and PHY01E: Table 11-2).
Check umpire assay analysis
Where primary analysis has been undertaken at the SGS Geosol laboratory in Belo Horizonte, check assays are conducted on selected samples at SGS and ALS laboratories in Canada.
Xstrata QC procedures dictated that 5% of all laterite samples be sent for check analyses of Ni, Co, Fe and major oxides to at least one umpire laboratory. A total of 5,364 check samples from all the drilling programs were submitted for analysis. For all shipments, blind standards and blanks were inserted as per the procedure.

Horizonte Minerals Plc Araguaia Nickel Project Technical Report
Final November 2018 Page 119 of 342
Laboratory certification
SGS Geosol is independent of HZM and the sample preparation laboratory is located at:
• SGS Geosol Parauapebas Rua B, nº 50 Quadra 140 – Bairro Cidade Nova CEP: 68515-000 - Parauapebas/PA Tel: (94) 3346-1773/6644 Fax: (94) 3346-2301
SGS is independent of HZM and the analytical laboratory is located at:
• SGS Geosol Laboratorio Ltda Av Mario Fonseca Viana, 120 Bairro Angicos, Vespasiano, Minas Gerais Brazil
SGS Geosol laboratories listed are ISO 9001:2008; ISO 14001:2004 (ABS 32982 and ABS 39911) certified.
Umpire/lab check laboratory
• SGS Lakefield Research 185 Concession St, Lakefield, ON K0L 2H0 Canada
ALS is independent of HZM and its laboratories are located at:
• ALS MineralsLtda Rua São Paulo, 685, Célvia, Vespasiano Belo Horizonte, Minas Gerais Brazil, 33200-000
• ALS Minerals 2103 Dollarton Hwy North Vancouver, British Columbia Canada, V7H 0A7
All ALS laboratories listed are ISO 9001 and ISO 17025 certified.
11.2.6 Results of quality assurance/quality control
QA describes the confidence in validity (i.e. data reflects what it is supposed to represent) and correct storage (i.e. data is stored accurately and may be recovered easily and without error) that is perceived for a given dataset. QC procedures are in place by Xstrata to ensure that a high level of QA is achieved.
The first batch of standards used by Xstrata originated from the Koniambo nickel project in New Caledonia. Commencing in January 2006 Xstrata used standards prepared from material originating from ANN. Four standards were made and the average values for each standard were confirmed in 2006 by SGS Geosol with 15 analyses per standard and the results were compared with four other laboratories.
In February 2007, new standards were prepared by SGS Geosol in Belo Horizonte from material originating from the SDT and VDS deposits. The average values for each standard were confirmed in 2007 by SGS with eight analyses per standard and the results compared with four other laboratories. Extensive check analyses from a minimum of two additional laboratories were performed.
Table 11-9 shows the recommended values for all standards used by Xstrata. Standards and blanks are inserted at a rate of one every 20th sample.

Horizonte Minerals Plc Araguaia Nickel Project Technical Report
Final November 2018 Page 120 of 342
Table 11-9 Standards with recommended values for key elements
Date Source Standard Ni grade
(%)
Co grade
(%)
Fe grade
(%)
MgO grade
(%)
2004/ 2006
Koniambo, New
Caledonia
KLJA 1.68 0.334 48.9 0.66
KSDC 2.27 0.036 n/a n/a
KLJA-2 1.40 0.182 42.7 4.01
KSTB-2 2.50 0.083 15.26 22.06
2006/ 2007
Araguaia, Brazil
NILIM 1.13 0.158 40.99 2.45
NISONHO 1.55 0.042 13.43 24.92
NITAPA 1 1.48 0.039 16.07 17.16
NITAPA 2 1.47 0.041 16.19 16.95
2007 Araguaia,
Brazil
SYL 1.29 0.188 37.24 1.22
STZ-1 0.72 0.043 19.36 19.26
SGT-2 1.11 0.021 8.98 28.21
Results – standards, blanks and duplicates
A total of 4,383 standards and 4,409 duplicates were submitted for analysis.
Criteria for batch acceptance/rejection
Assay batches were passed or failed according to the following criteria:
• If one Ni or Co standard (but not both) fails between two and three standard deviations and no other failure occurs in the batch, the batch is accepted.
• If adjacent Ni or Co standards (but not both) fail between two and three standard deviations in a single batch, the standards are classed as failures. If the two standards occur in two different but adjacent batches, the laboratory is notified but the batches accepted.
• If more than two adjacent batches fail a Ni or Co standard, the laboratory is notified and all three (or more) standards are classed as failures.
• If both a Ni standard and a field blank fail in a single batch, both are classified as failures. Field blanks must show <300 ppm Ni.
• If a Ni standard fails beyond three standard deviations, the standard is classed as a failure.
• If a Co standard fails beyond three standard deviations, the standard is classified as a failure unless close to 0.005% Co.
• If both Ni and Co fail beyond two standard deviations, subject to item 6, the standard is classed as a failure.
• If a field blank fails in Ni in a minor way (between 50 ppm and 0.03% or 300 ppm), the analytical batch is examined for other QC failures in the same batch (Ni or Co more than two standard deviations). If no other failures no other action is necessary (contact the lab if failure occurs in multiple and successive batches).
• If a field blank shows a significant failure (>300 ppm) in Ni and other QC samples also fail in the same batch, the most likely cause is sample miss-ordering and appropriate action is taken to find the extent of the miss-ordering.
• If a field blank alone shows a significant failure in Ni (>300 ppm), the surrounding batches are classified as a failure. Verify whether the cause is sample miss-ordering of carry-over.
• If one standard in a batch fails beyond two standard deviations in any element other than Ni and Co, but Ni and Co are within two standard deviations, then the standard is accepted, but the laboratory is informed.

Horizonte Minerals Plc Araguaia Nickel Project Technical Report
Final November 2018 Page 121 of 342
• If a standard fails beyond three standard deviations in any element other than Ni and Co, and either the Ni and Co are between two and three standard deviations, or another standard in the same batch fails beyond three standard deviations in any element other than Ni and Co, then the batch is classified as a failure.
• If a batch passes based on the Ni pass criteria, the values for Fe, SiO2 and MgO from the standard samples submitted in the batch are reviewed. If one or more of the values for these oxides exceeds the mean by ±10% the results for the batch are flagged for examination to determine if the batch passes or if re-assay is required.
Results – duplicates
A total of 4,409 pulp duplicate pairs were analysed representing 4.27% of the total samples submitted by Xstrata from the global ANN (VDS and SDT). Examination of duplicate pairs showed no significant issues were found and the results were graphed. Results were deemed to be acceptable if more than 90% of duplicates lie within 10% of the original value for each duplicate. The results indicate no significant issues.
In October 2007, 27 RC duplicates were sent to SGS Geosol. Results were deemed to be acceptable if more than 90% of duplicates prepared from coarse reject material should lie within 10% of the original value for each duplicate. The results, based on this limited dataset, indicate no significant issues.
11.2.7 Results – VDS umpire analysis
All check analysis shipments were carefully chosen to represent mineralised holes with a wide geographical and temporal distribution. Overall, more than 5% of the total samples were sent for check analysis. The secondary laboratories were ALS Chemex (2004 to 2007) and SGS Lakefield (2007) both of which are in Canada.
Any discrepancies between SGS Geosol and the check laboratory results were investigated. The linear methodology was used to calculate the bias between the Primary and the Secondary laboratory (the bias should not exceed 10% to be considered acceptable).
A total of 466 laboratory check pulp samples from the VDS deposit covering the period of 2005 to 2007 were sent to ALS Chemex for analysis. A total of 16 assay pairs were rejected, thus 450 sample pairs (ALS Chemex vs. SGS Geosol) were charted for Ni, Fe, SiO2, MgO, Al2O3 and Co. The charts for Ni, Fe, SiO2, MgO, and Al2O3 show very good correlation between the paired assay values with Ni exhibiting a slight bias favouring the SGS Geosol assays. Cobalt, on the other hand, shows significant discrepancy with ALS Chemex assays, being systematically lower than SGS Geosol values with increasing Co grade. As a result of this large relative bias approximately 900 pulp samples were sent to SGS Lakefield for check analysis in 2007. Of this total, some 326 sample from the VDS deposit were included.
A total of 320 SGS Lakefield – SGS Geosol assay pairs for Co, Ni, Fe, SiO2, MgO, and Al2O3 assay pairs were analysed in 2007 and were graphed. Six pairs were rejected. Cobalt shows a high degree of correlation between the two sets of analyses. The SGS Geosol analyses for Co are considered to be acceptable. The Ni, Fe, SiO2, MgO, and Al2O3 charts all show a high degree of correlation and tight spread about the 1:1 correlation trace.
ALS Chemex subsequently demonstrated to Xstrata Brasil that the issue with Co analysis had been corrected and was under control to Xstrata’s satisfaction. ALS Chemex was used as the secondary laboratory for duplicate assays in 2008.
11.2.8 Author’s opinion
With regards the adequacy of sample preparation, security, and analytical procedures; the author concludes that the procedures are acceptable and that the resulting records are suitable for use in Mineral Resource estimation.
Horizonte Minerals Plc Araguaia Nickel Project Technical Report
Final November 2018 Page 122 of 342
12 DATA VERIFICATION
12.1 ANS data verification
12.1.1 Phase 3 data verification
The GEMS databases compiled and verified by Dr Marc-Antoine Audet were provided to Snowden on 12 October 2012. Snowden, under the supervision of Andrew Ross (Qualified Person), checked the databases and reconciled the drill data with the information presented in Audet, MA, et al (2012a).
Several field visits and reviews have been conducted by Snowden consultants. The first visit to the Project site occurred from 22 November 2012 to 24 November 2012 by Andrew Ross and Marcio Soares (both of Snowden at the time) when drilling was underway on the Vila Oito area. A subsequent site visit was performed by Marcio Soares from 8 April 2013 to 12 April 2013 where 27 of the Phase 3 drill collars were checked, representing 10% of the drillholes. Five drillhole cores in the logging facility were reviewed. The sample preparation and analytical facilities were also inspected by Marcio Soares: on 18 April 2013 the SGS Geosol sample preparation laboratory in Goiania was inspected; on 24 April 2013 the SGS Geosol analytical laboratory in Vespasiano was inspected. From 26 August 2013 to 30 August 2013, Asoka Herath of Snowden inspected geotechnical drilling underway at the potential plant site.
HZM provided Snowden with drillhole related information on several occasions throughout the duration of the Phase 3 drill program, including: standard operating procedures; geological, survey and sample data files; analytical certificates; QAQC results; and density measurements. In order to maintain consistency with the assigned facies defined by the chemical correlation matrix, Snowden requested HZM engage Dr Marc-Antoine Audet to complete that assessment.
Data verification work of Phase 3 drilling included:
• Collar locations – independent checking of 10% of collar locations
• Geological logging – independent checking of drill core logs
• Review of QAQC procedures and results
• Review of facies assignment from sample chemistry
• Review of density measurement procedures
• Review of data entry procedures and cross-check with analytical certificates
• Review of sample preparation and analytical laboratory procedures.
12.1.2 Phase 4 data verification
CSV files were compiled and verified by HZM were provided to Snowden in June 2015. Snowden ran validation routines inside Datamine Studio 3 to identify any discrepancies such as duplicate or missing records, and no significant issues were identified.
Frank Blanchfield visited the Phase 4 drilling locations for collar verification purposes on Jacutinga and Pequizeiro and inspected collar positions. Phase 4 drilling viewed on Pequizeiro was:
• A selection of infill resource holes between Eastings 674500 and 675500 and Northings 9115800 and 9116300. Many of these collars were disturbed by recent farming activities, but the holes were still open in some instances.
• The closed spaced drilling site between Eastings 675495 and 675515 and Northings 6115490 and 6115505 that was drilled for the pilot bulk sample testwork. The two holes viewed in the field as DD1484B and DD1480B were also laid out for inspection in the core shed.
Phase 4 drilling viewed on Jacutinga:
• A selection of new resource holes between Eastings 675500 and 676000 and Northings 9123000 and 9123500.

Horizonte Minerals Plc Araguaia Nickel Project Technical Report
Final November 2018 Page 123 of 342
HZM provided Snowden with drillhole related information on several occasions throughout the duration of the Phase 4 drill program, including: standard operating procedures; geological, survey and sample data files; analytical certificates; QAQC results; and density measurements.
HZM conducted its own internal data verification that included routine checks by the senior staff on the following:
• Geological logging
• QAQC procedures and results
• Facies assignment based in sample chemistry
• Bulk density measurement including the routine use of standards
• Data entry and cross-checking with laboratory certificates
• Sample preparation and analytical laboratory procedures.
Francis Roger Billington (Qualified Person) visited the project during the Phase 4 drilling program from 31 January 2015 to 4 February 2015, during which time he conducted a review of each of the items listed above and found all procedures to meet the criteria defined in the Project Standard Operating Procedures. Francis Roger Billington (Qualified Person) was also present at the collection of bulk samples in February 2015 when a second phase of wide diameter auger drilling for the collection of bulk samples for metallurgical testwork was completed on four selected sites on the PQZ deposit.
12.1.3 Qualified Person’s opinion
With regards the adequacy of the data for the purposes used in the technical report; the author concludes that the data verification results provide assurance that the data is reliable and adequate for use in Mineral Resource estimation. Together with the findings of the Qualified Person for Phase 1 and 2 data, Snowden concludes that the Project resource database meets industry standards and is compatible with the JORC and CIM codes for public reporting.
12.2 ANN data verification
HZM conducted a thorough due diligence of ANN during the first quarter of 2014 with particular focus on the VDS nickel laterite deposit as well as the Serra do Tapa and Pau Preto nickel laterite deposits. This work included an initial visit to the Xstrata office in Belo Horizonte to get an overview of the project, copy project files from the server, and arrange a field visit. Francis Roger Billington (Qualified Person) visited ANN between 3 May and 7 May 2014 to review the HZM due diligence exercise. In summary, the due diligence included:
• Collar locations – independent checking of 53 collar locations
• Comparison of drill core with core logs for 102 diamond drillholes and review of core storage facility
• Review of original drillhole collar survey files
• Review of digital drillhole logs against original records for 103 drillholes
• Review of database assay results and cross-check with analytical certificates
• Review of QAQC procedures and results
• Review of density measurement procedures
• Review of original airborne geophysical survey data and reports.
12.2.1 Diamond drillholes
A visit was made to the main core storage facility at the field office in Sao Jose do Araguaia to ensure the presence of all drill core by checking identification tags and associated information. With few exceptions all drill core was accounted for.
Horizonte Minerals Plc Araguaia Nickel Project Technical Report
Final November 2018 Page 124 of 342
12.2.2 Drillhole collar survey check
A total of 53 diamond drillhole locations were checked in the field. The check coordinate readings were taken using a Garmin 60 CSX handheld GPS. On average there was a difference of -6.34 m in the easting, 1.15 m in the northing and -5.40 m in the elevation. HZM concluded that based on the collar checks there is no reason to suggest that the total station topographic hole collar survey is not acceptable.
12.2.3 Comparison of core logs with drill core
A total of 102 holes (4,612 m and 4,914 samples) were selected to visually compare the core with the logs. The drill core boxes were laid out and the core compared with the logs.
Basic checks completed by HZM included:
• Core descriptions
• Sample ID and lengths
• Recovery
• Hole depth blocks and core box identification tags.
The logs were found to correlate well with the core, and the sampling, and the core box identification tags were seen to be complete.
12.2.4 Comparison of digital and original core logs
Digital core logs were compared with the original core logs for 103 drillholes and found to accurately reflect the original core log. During the examination of logging records HZM staff paid particular attention to the following:
• Borehole identification
• Logging of lithology
• Sampling intervals and numbering.
12.2.5 HZM conclusions
HZM has concluded the following from the due diligence of the data and core storage facility at ANN:
• The original drill logs were observed by HZM staff and were found to correlate well with the core and the sampling and the core box identification tags were seen to be complete.
• Based on the drillhole collar checks HZM staff believe the total station topographic hole collar survey data is representative and acceptable for use in resource estimation.
• Over 60,000 reject sample pulps are catalogued in the warehouses as well as reject samples. Given the volume of reject pulps and samples observed, HZM considers that the majority, if not all, of the core reject pulps and samples are still stored on site.
• HZM reviewed a total of 317 certificates of analysis (2,450 catalogued to date). Results for 859 QAQC samples identified in 288 certificates were compared to the corresponding digital results in the ANN master assay database as were the assay results for 1,022 core samples in an additional 24 certificates of analysis. The certificates cover a date range from December 2004 through September 2007. A total of 15 samples displayed database/digital assay results for one or more elements that did not match the certificate.
12.2.6 Qualified Person’s opinion
With regards to the adequacy of the data for the purposes used in the technical report; the author concludes that the data verification results of the ANN data provide assurance that the data is reliable and adequate for use in Mineral Resource estimation. The author also concludes that the Project resource database meets industry standards and is compatible with the JORC and CIM codes for public reporting.

Horizonte Minerals Plc Araguaia Nickel Project Technical Report
Final November 2018 Page 125 of 342
13 MINERAL PROCESSING AND METALLURGICAL TESTING
13.1 Previous laboratory scale testwork
13.1.1 ANS ore
Previous laboratory scale testwork carried out for ANS on Araguaia ore was reported in the 2014 PFS and was based on use of the RKEF process. Table 13-1 summarises that work.
Table 13-1 Laboratory testwork undertaken on Araguaia ore samples
No. Test laboratory Title/description of work Month/year
1 XPS Lab testing of smelting characteristics of Araguaia nickel laterite November 2011
2 KPM Slag chemistry for the smelting of Horizonte laterite July 2012
3 Feeco Studies on the agglomeration behaviour of the ore January 2013
4 KPM Liquidus measurement of FeNi slag under conditions corresponding to electric furnace smelting of Araguaia ore
April 2013
5 FLS Evaluation of the performance of Araguaia nickel laterite in rotary kiln processing
September 2012
6 Komarek Evaluation of briquetting behaviour October 2012
13.1.2 ANN ore
During the period 2007 to 2008, Xstrata (now Glencore) carried out a series of laboratory tests on samples of ANN ore (previously noted as GAP in the 2014 PFS) at the Xstrata Process Support (XPS) laboratory in Sudbury, Ontario, Canada, at the Pyrosearch-Pyrometallurgy Research Centre at the School of Engineering, University of Queensland, Australia, at the laboratories of FLSmidth in Allentown, PA, USA, and at the Polysius (now ThyssenKrupp Industrial Solutions) R&D Centre in Ennigerloh, Germany. Table 13-2 summarises the work carried out.
Table 13-2 Laboratory testwork undertaken on ANN ore samples
No. Test laboratory Title/description of work Year
1 XPS (i) Standard laboratory tests and measurements including moisture determination, crystalline water determination, particle size distribution, chemical screen analysis, Bond Work Index and Abrasion Index, thermo-gravimetric analysis (TGA) and differential thermal analysis (DTA). Slag liquidus computations were carried out using FactSage.
(ii) Sticking temperature determination under oxidising and reducing conditions.
(iii) Laboratory testing of smelting characteristics of ANN ore including reduction smelting behaviour as a function of both carbon addition and temperature.
2007-2008
2 Pyrosearch Liquidus measurement of FeNi ANN slag under conditions corresponding to electric furnace smelting.
2008
3 FLSmidth Pilot test program on ore upgrading. 2008
4 Polysius (now Thyssen Krupp)
Measurement of physical characteristics as noted in (i) above. 2008
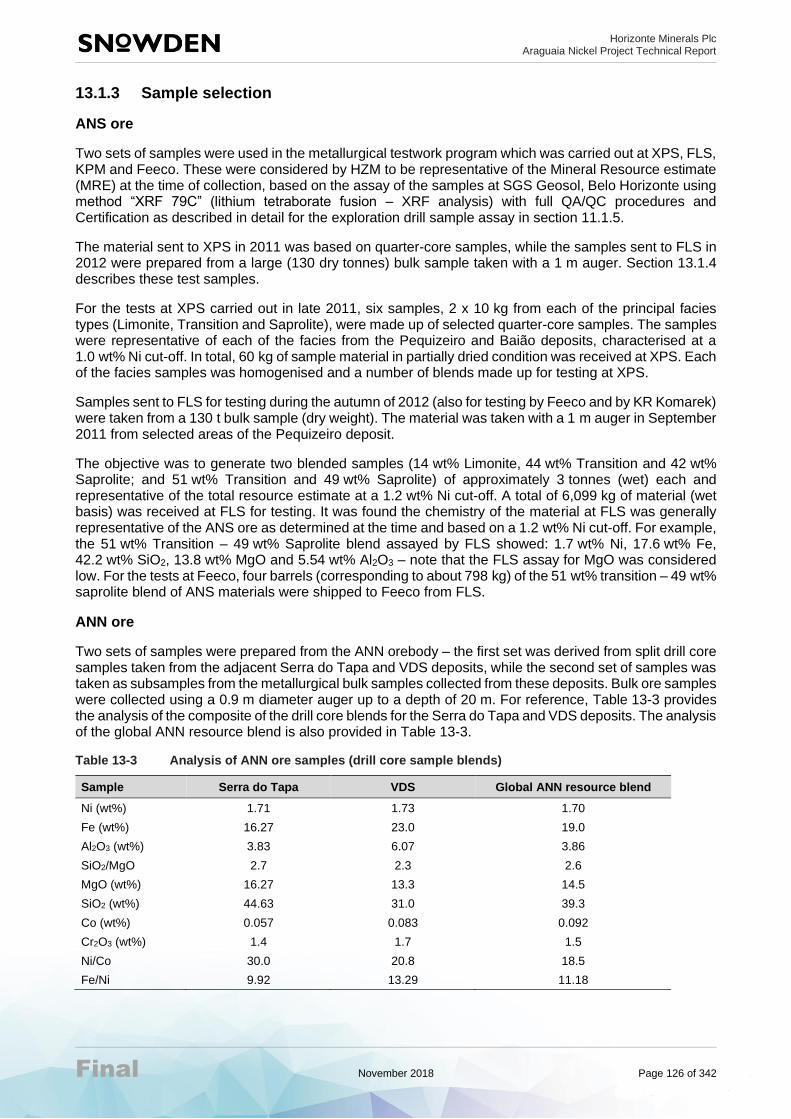
Horizonte Minerals Plc Araguaia Nickel Project Technical Report
Final November 2018 Page 126 of 342
13.1.3 Sample selection
ANS ore
Two sets of samples were used in the metallurgical testwork program which was carried out at XPS, FLS, KPM and Feeco. These were considered by HZM to be representative of the Mineral Resource estimate (MRE) at the time of collection, based on the assay of the samples at SGS Geosol, Belo Horizonte using method “XRF 79C” (lithium tetraborate fusion – XRF analysis) with full QA/QC procedures and Certification as described in detail for the exploration drill sample assay in section 11.1.5.
The material sent to XPS in 2011 was based on quarter-core samples, while the samples sent to FLS in 2012 were prepared from a large (130 dry tonnes) bulk sample taken with a 1 m auger. Section 13.1.4 describes these test samples.
For the tests at XPS carried out in late 2011, six samples, 2 x 10 kg from each of the principal facies types (Limonite, Transition and Saprolite), were made up of selected quarter-core samples. The samples were representative of each of the facies from the Pequizeiro and Baião deposits, characterised at a 1.0 wt% Ni cut-off. In total, 60 kg of sample material in partially dried condition was received at XPS. Each of the facies samples was homogenised and a number of blends made up for testing at XPS.
Samples sent to FLS for testing during the autumn of 2012 (also for testing by Feeco and by KR Komarek) were taken from a 130 t bulk sample (dry weight). The material was taken with a 1 m auger in September 2011 from selected areas of the Pequizeiro deposit.
The objective was to generate two blended samples (14 wt% Limonite, 44 wt% Transition and 42 wt% Saprolite; and 51 wt% Transition and 49 wt% Saprolite) of approximately 3 tonnes (wet) each and representative of the total resource estimate at a 1.2 wt% Ni cut-off. A total of 6,099 kg of material (wet basis) was received at FLS for testing. It was found the chemistry of the material at FLS was generally representative of the ANS ore as determined at the time and based on a 1.2 wt% Ni cut-off. For example, the 51 wt% Transition – 49 wt% Saprolite blend assayed by FLS showed: 1.7 wt% Ni, 17.6 wt% Fe, 42.2 wt% SiO2, 13.8 wt% MgO and 5.54 wt% Al2O3 – note that the FLS assay for MgO was considered low. For the tests at Feeco, four barrels (corresponding to about 798 kg) of the 51 wt% transition – 49 wt% saprolite blend of ANS materials were shipped to Feeco from FLS.
ANN ore
Two sets of samples were prepared from the ANN orebody – the first set was derived from split drill core samples taken from the adjacent Serra do Tapa and VDS deposits, while the second set of samples was taken as subsamples from the metallurgical bulk samples collected from these deposits. Bulk ore samples were collected using a 0.9 m diameter auger up to a depth of 20 m. For reference, Table 13-3 provides the analysis of the composite of the drill core blends for the Serra do Tapa and VDS deposits. The analysis of the global ANN resource blend is also provided in Table 13-3.
Table 13-3 Analysis of ANN ore samples (drill core sample blends)
Sample Serra do Tapa VDS Global ANN resource blend
Ni (wt%) 1.71 1.73 1.70
Fe (wt%) 16.27 23.0 19.0
Al2O3 (wt%) 3.83 6.07 3.86
SiO2/MgO 2.7 2.3 2.6
MgO (wt%) 16.27 13.3 14.5
SiO2 (wt%) 44.63 31.0 39.3
Co (wt%) 0.057 0.083 0.092
Cr2O3 (wt%) 1.4 1.7 1.5
Ni/Co 30.0 20.8 18.5
Fe/Ni 9.92 13.29 11.18

Horizonte Minerals Plc Araguaia Nickel Project Technical Report
Final November 2018 Page 127 of 342
13.1.4 Results of laboratory testwork
ANS ore
The laboratory tests carried out showed that the ANS ore was suitable for processing in the RKEF process. A summary of results of laboratory scale testwork is given in Table 13-4.
Pilot plant testing of the drying and agglomeration step and piloting of the full RKEF process flowsheet (excluding refining) to confirm final operating characteristics was recommended in the 2014 PFS report. This pilot testing was carried out in the first quarter of 2015 and is reported in Section 13.2.
Table 13-4 Summary of results of laboratory scale testwork (ANS ore)
No. Test laboratory Key results
1 XPS Particle size analysis indicated fine ore (agglomeration prior to kiln is desirable to minimise dusting); smelting tests confirmed the smeltability of ANS ore to produce FeNi over a range of grades of interest (in general range of 20 wt% Ni to 30 wt% Ni). The liquidus of the slag for a range of slag compositions was computed (e.g. ~1,400°C with SiO2/MgO = 2.36); a number of flowsheet options were developed.
2 KPM The quantitative effect of the ratio SiO2/MgO and wt% FeO and wt% Al2O3 on slag liquidus investigated; the liquidus temperatures for a range of ANS slags were determined.
3 Feeco Rotary drum agglomeration testing at drum rotation conditions simulating those of the commercial dryer demonstrated the ready production of robust agglomerates resistant to fines generation during tumbling.
4 KPM The effect of the ratio SiO2/MgO and the FeO and Al2O3 contents of the slag on the liquidus temperatures was determined. The liquidus measurements were made by DTA/TGA determinations on synthetic slag samples under an argon gas atmosphere.
5 FLS The results of this laboratory study suggest that the ANS ore is suited for rotary kiln processing in an RKEF system provided that proper agglomeration provisions are adopted and that appropriate calcine temperature (in the range 800°C to 825°C) and pre-reduction levels (60 wt% iron pre-reduction) are considered in the electric furnace design.
Specific test data as related to particle sintering and degree of pre-reduction of iron and nickel oxides were provided.
6 Komarek Briquetting was found to be a viable option for producing an agglomerated feed suitable for kiln processing to yield a granule calcine with acceptable dusting rates; an agglomerated feed was considered the preferred feed to the RKEF.
ANN ore
The summary of results of laboratory scale testwork on ANN ore is shown in Table 13-5.
Table 13-5 Summary of results of laboratory scale testwork (ANN ore)
No. Test laboratory Key results
1 XPS Particle size analysis indicated fine ore. The tests on the physical properties of the ore and the supporting laboratory smelting tests showed that ANN ore was amenable to smelting by the RKEF process which was included in the Xstrata Scoping Study. The liquidus of the slag for a range of slag compositions was computed.
2 Pyrosearch The effects of the SiO2/MgO ratio and the FeO and Al2O3 contents of slag corresponding to the slag produced by smelting ANN ore on the liquidus temperatures were determined. The results with ANN ore were quite similar to the liquidus range determined on ANS ore (also refer to reference: Zhao et al., 2009).
3 FLSmidth A number of grade-recovery curves were developed.
4 Polysius (now ThyssenKrupp Industrial Solutions)
The test results on the physical properties of ANN ore were similar to those results obtained on ANN ore at XPS noted above.

Horizonte Minerals Plc Araguaia Nickel Project Technical Report
Final November 2018 Page 128 of 342
It can be seen that in comparing the assays in Table 13-3 and those in Table 13-9 and a review of the results of the laboratory tests summarised in Table 13-4 and Table 13-5 that ANS ore and the ANN ore are similar in assay and physical properties. The slag characteristics (slag liquidus) produced in FeNi smelting were also similar. It was concluded that these two ores would perform sufficiently similarly in RKEF processing, for a suitably designed plant to be able to smelt blends of both ANS and ANN ores. Processing the ANN ore by the RKEF process was also included in the Glencore (then Xstrata) Scoping Study.
13.2 Pilot testing of ANS ore in the RKEF process
HZM completed the following pilot programs on ANS ore:
• A pilot pre-test of drying and agglomeration was carried out in January 2015 to assess the behaviour of the ANS ore for homogenisation, sizing, drying/agglomeration; a calcining pre-test was also undertaken
• A full integrated pilot test of the RKEF process comprising ore preparation, drying and agglomeration, calcination and electric furnace smelting including slag and metal granulation (but mostly metal ingot casting) was carried out in April/May 2015.
The independent pilot testwork facility at the Morro plant in the State of Minas Gerais in Brazil was as used for both these pilot tests. These test facilities comprised of:
• Feed preparation – small crusher with a 25 mm to 30 mm screen
• Dryer agglomerate – LPG fuelled 1.0 m x 14 m dryer agglomerator (~2.5 tph to 3 tph ore feed)
• Rotary kiln – diesel fuelled 1.3 m x 9.3 m rotary kiln (~0.5 revolutions per minute. 198 min residence time)
• Electric furnace – 1.6 m inside diameter x 1.5 high tiltable AC three-phase furnace which at a power value of 450 kW has a power density of 225 kW/m2.
13.2.1 Drying and agglomeration pre-pilot tests
The pre-test of pilot scale testing of drying and agglomeration was carried out to assess the behaviour of the ANS ore for drying and agglomeration. At the same time, a calcining pre-test was also conducted in the rotary kiln using the dryer product.
The present testwork was witnessed during the week of 26 January 2015 by Phillip Mackey and Francis Roger Billington, consultants to HZM, along with Gustavo Duran of IGEO, Sao Paulo, Brazil, and who were supported by the dedicated Morro staff.
The objectives of the pre-testwork were established as follows:
1) To test homogenisation procedures
1) Commissioning of the rotary drum dryer
2) To test the configuration of the drum internals – lifters and retention dam
3) To carry out a pre-calcining test on the dryer/agglomerator product in advance of the integrated RKEF test.
Pre-test ore sample selection and preparation at mine site
A 20 t (wet basis) bulk sample of ANS ore for the drying/agglomeration pilot testing was delivered to the Morro pilot plant on 22 January 2015 in advance of the agglomeration testing. The ore sample sent to Morro for this test had been collected by HZM using large diameter auger drilling in September 2011 and stored on site in sealed plastic barrels to preserve the original free moisture content (assay laboratory and method provided in Section 13.1.3). Some of this material had been used for calcining and agglomeration tests at FLS/Feeco as part of the scope of laboratory tests in preparation for the PFS.

Horizonte Minerals Plc Araguaia Nickel Project Technical Report
Final November 2018 Page 129 of 342
This particular bulk sample had been selected by HZM for the purpose of this particular drying/agglomeration and calcining commissioning/pre-testing as being nominally representative of a blend of 60 wt% saprolite and 40 wt% transition ore, i.e. the same proportions as the scheduled feed for the base case LOM in the PFS. The blend made up this way was found to be close to the average ore chemistry of the ANS ore at the time (refer assays in the next paragraph).
Ore preparation and homogenisation
The ore was trucked from the project site to Morro in 250 kg barrels. They were emptied and transferred to a jaw crusher and the product was then conveyed to a 25 mm aperture fixed grizzly. The oversize material was recycled by means of a front-end loader to a receiving bin and then the oversize material was crushed a second time with all feed then passing 25 mm. In this way, only material passing 25 mm reporting to the collecting bucket was used for the subsequent homogenisation step.
The homogenisation was effected by a front-end loader and after several movements in various directions, the material was piled and pipe sampled to obtain five samples for analysis. The samples were collected by means of a 75 mm diameter pipe which was inserted into the pile. The five samples were taken for chemical analysis and a composite was used to determine the wet granulometry. The spread in the assay expressed by the standard deviation of the assays for each element/oxide as a percent of the average was less than 5 wt% for Ni, Fe, SiO2 and Al2O3, and less than 10 wt% for MgO; this variation was considered acceptable.
The average assay of the five pipe samples taken after homogenisation of the 20-tonne sample was as follows: 1.60 wt% Ni, 19.13 wt% Fe, 34.17 wt% SiO2, 15.96 wt% (MgO + CaO) and 8.02 wt% Al2O3. Assuming 0.1 wt% CaO, the SiO2/MgO ratio was estimated to be 2.15, slightly lower than the 2.29 value in the PFS. The granulometry of the as-received feed material was assessed. The average moisture content was 30.2 wt%.
Pilot scale drying/agglomeration testing and calcining pre-test
Drying and agglomeration
The dryer operated for the pre-test for a total of two days during the day shift under three different conditions: Condition No. 1 was tested on Day 1; Condition No. 2 and Condition No. 3 were tested on Day 2 (refer Table 13-6). The dryer was preheated prior to commencing each test. The dryer product was temporarily stockpiled in three piles (one pile for each condition) and the kiln pre-test was carried out on Day 3, also shown in Table 13-6.
Table 13-6 Conditions used in dryer/agglomerator test
Condition no. Feed rate (t/h) Drum speed (rpm) Comment
1* 1.0 16 Completed Day 1 (27 January)
2 1.3 16 Completed Day 2 (28 January)
3 1.0 8 Completed Day 2 (28 January)
Kiln pre-test Kiln – treated dryer product Completed Day 3 (29 January)
Note: * Initial testing was carried out prior to commencing Condition No. 1
It is noted that at the drum rotation speed of 16 rpm, the calculated drum peripheral velocity was 50 m/minute, which corresponds approximately to that which would be achieved in a commercial dryer 4.4 m in diameter; this was also similar to the ranges tested at Feeco.
Pre-testing calcination
The dryer product which was obtained in each of the conditions used in the dryer were stored in separate temporary piles. From each of these piles, approximately 1 t of material, which is sufficient for two hours feeding of the kiln, was reclaimed. This material was spread on the ground in a clear area. Then, 6.5 wt.% of coal (wet basis) was added and the material was manually homogenised.

Horizonte Minerals Plc Araguaia Nickel Project Technical Report
Final November 2018 Page 130 of 342
It is noted that for the integrated RKEF pilot test, coal was added continuously using a coal feeder to the ore feed on the conveyer belt feeding the kiln. The conditions used for the rotary kiln in the pre-test are given in Table 13-7.
Table 13-7 Kiln operating conditions for the pre-test
Description Unit Value
Rotary kiln slope (pre-test) degrees (°) 2.58
Rotating speed rpm 0.5
Calcine angle of repose degrees (°) 30
Note: For the integrated test, the kiln slope was changed to 1°
Results – pilot scale drying/agglomeration and pre-testing calcination
Drying/agglomeration
In initial checks prior to commencing Condition No. 1, it was observed that the feed agglomerated well, typically producing 10 mm to 20 mm agglomerates. There was an absence of fine particles. Typical moisture levels were around the target of 18 wt% moisture. Several burner levels were tested. Based on these results, it was concluded that the ratio of the kg LPG/wet t of feed averaged 8.1+/- 1.5; the desired moisture in the product was obtained.
The average results for the three conditions are given in Table 13-8. It can be seen that the dryer performance was somewhat similar over these three particular conditions. The feed and product granulometry was also found to be similar for each condition; the results for Condition No. 3 were typical and are shown in Figure 13-1. It is seen that 80 wt% of the product passed 16 mm, with 50 wt% passing 4 mm; the fraction passing 0.2 mm was very small, less than about 1 wt%.
Table 13-8 Results of drying-agglomeration for the three conditions
Description Unit Condition
No. 1 No. 2 No. 3
Feed moisture wt % 28.7 25.5 28.1
Product moisture wt % 16.8 16.9 18.3
Off-gas temperature °C 42 46 49
Product temperature °C NA 39 37
LPG consumption kg/t feed 6.6 7.2 10.6

Horizonte Minerals Plc Araguaia Nickel Project Technical Report
Final November 2018 Page 131 of 342
Figure 13-1 Particle size distribution for dryer feed and product (Condition No. 3)
Note: Granulometry measurement of the feed is normally by wet screening, and the product by dry screening
Calcination pre-testing
The granulometry of the dryer feed, dryer/agglomerated product and calcine when treating dryer product for Condition No. 2 which was considered typical and are shown in Figure 13-2. Results for the other conditions were similar.
Figure 13-2 Granulometry of the calcine, dryer feed and product (Condition No. 2)
During the course of the six-hour test, a total of 12 calcine samples were taken, representing four samples taken for each dryer product condition.

Horizonte Minerals Plc Araguaia Nickel Project Technical Report
Final November 2018 Page 132 of 342
The levels of pre-reduction of iron in the 12 calcine sampes over the course of the six hours, as related to residual carbon in the calcine and also to the kiln temperature were monitored and rerpoted. The calcine temperatures that were measured during the campaign normally ranged between about 930°C and 1,000°C. In order to evaluate the behaviour of the material at higher temperatures, the temperature was intentionally increased up to about 1,053°C. No evidence of sintering or softening (or insipient melting) was observed under these conditions. The refractory bricks also remained clean and there was no ringing.
It was observed by viewing through the burner port that the atmosphere in the kiln during operation was completely clear of any smoke or dust.
The actual diesel oil firing rate at the kiln varied between 45 kg/h and 50 kg/h. The off-gas analysis at the kiln exit was typically as follows: CO2 = 15.1 wt% and O2 = 0 – 1.5 wt% (wt% by volume).
Conclusions
The following is noted:
• Ore preparation/ homogenisation. It was concluded that the material for the full RKEF pilot test should be first sized using a 30 mm gap at the manually-operated screen at the crusher to ensure a fairly sharp definition of the particle size distribution on the dryer feed (this was a small change from the 25 mm adopted in the pre-test).
• Granulometry of the calcine. The granulometry of the calcine was a positive indicator for its suitability for processing in the rotary kiln. The granulometry was considered superior to that observed at other RKEF operations. The fines (less than 0.2 mm) in the calcine was almost zero.
• Residual carbon. The residual carbon in the calcine (excluding the seventh and twelfth calcine samples where the temperature was changing), was fairly constant in the range of 1.5 wt% and 2 wt% carbon.
13.2.2 Integrated pilot RKEF testing
The integrated pilot RKEF testwork campaign at Morro was undertaken in April/May 2015, with the kiln and electric furnace operating from 22 April 2015 to 2 May 2015. The overall objective of the pilot RKEF testing was to evaluate the behaviour of ANS ore treated according to the process flowsheet which was developed during the PFS.
The following process steps were addressed in the RKEF pilot test: feed preparation and sizing, homogenisation of the ROM sample, drying/agglomeration in a rotary dryer, calcining in the rotary kiln, smelting in a three-phase, 1 MVA electric furnace with water granulation of slag, and ingot casting and granulation of metal.
In addition, facilities for materials handling and storage, as well as providing other requirements such as fuel, reductant, graphite electrodes, electrical energy, manpower and laboratory facilities were all available during the pilot test.
The objectives of the pilot RKEF testwork campaign were to validate the process flowsheet which was developed during the PFS, as well as develop and update the Process Design Criteria (PDC).
In this regard the stages of the metallurgical processing that were assessed were as follows:
1) Ore preparation – crushing and screening
2) Drying and agglomeration in the rotary dryer
3) Calcining – calcine granulometry and temperature, level of pre-reduction, residual LOI and information on off-gas and dust produced from the kiln
4) Smelting – slag characteristics, metal characteristics, operating philosophy and consumable requirements.

Horizonte Minerals Plc Araguaia Nickel Project Technical Report
Final November 2018 Page 133 of 342
The results of the pilot RKEF testwork campaign will be used to assist in reviewing and developing the process description/flowsheet and design criteria for the development of the current, updated PFS and later, and the FS.
Ore sample selection and preparation at mine site
Ore sample selection and preparation
The material for pilot RKEF piloting was selected from the Pequizeiro deposit based on drillhole information. The bulk sample was collected with the objective of matching the target plant feed for the first nine years of operation established in the PFS (dated March 2014).
A 1 m diameter auger was used to excavate the ore. Each of the 1 m auger samples were cone and quartered to obtain a sample for assay. Analysis were undertaken by the ALS Peru Lab. using method “ME-XRF12u” (lithium tetraborate fusion – XRF analysis) with full QA/QC procedures and Certification as described in detail for the exploration drill sample assay in Section 11.1.8. Different portions of each auger batch were then selected to obtain the target composition. A 135 t (dry basis) (220 t wet basis) bulk sample of ANS ore was trucked to the Morro pilot plant in early April 2015. The target assays are presented in Table 13-9 for reference purposes. Also included in this table are the average assays obtained on kiln feed samples. In practice the chemistry of the kiln feed material was found to be quite close, but not identical, to that of the target. In particular, the SiO2/MgO ratio at 2.36 was just slightly lower (by approximately 5 wt%) than the target of 2.49; however, this difference was considered acceptable and within the normal variability that can be expected for laterite ores.
Table 13-9 Pilot testwork sample – target and average kiln feed assays
Average (Years 2 to 9)
Transition Saprolite Total target Average kiln feed
wt% 40.22% 59.78% 100.00% 100.00%
Ni (wt%) 1.83 1.76 1.79 1.61
Fe (wt%) 19.55 12.93 15.62 15.64
Al2O3 (wt%) 6.25 4.16 5.00 4.71
SiO2/MgO 3.70 2.09 2.49 2.36
MgO (wt%) 10.80 20.52 16.64 17.17
SiO2 (wt%) 39.47 42.72 41.35 40.79
CaO (wt%) 0.09 0.08 0.08 0.16
Co (wt%) 0.070 0.043 0.054 0.053
Cr2O3 (wt%) 1.34 0.92 1.09 0.95
MnO (wt%) 0.49 0.29 0.37 0.40
LOI (wt%) 10.69 14.82 13.07 11.24
Ni/Co 25.93 40.81 33.19 30.56
Fe/Ni 10.71 7.35 8.74 9.72
Note: The kiln feed assays here are provided by Morro
Ore preparation at Morro – sampling, analysing and homogenisation
The bulk sample was delivered to the Morro pilot plant in large nylon bags (~1 t) in early April 2015. The bags were discharged and the as-received material (nominally around 40 wt% moisture) spread out and allowed to air dry naturally to approximately 30 wt% moisture. However, it is noted that the 30 wt% moisture content level does not represent an upper limit when designing equipment for the commercial process.
The material was then crushed in a jaw crusher with 30 mm discharge gap and screened on a fixed screen with 30 mm opening. The oversize, which comprised a minor portion of the total material, was recycled to the crusher feed material. Therefore, the plant feed material granulometry stockpiled after the crusher was 100 wt% passing 30 mm. The material was then thoroughly homogenised.

Horizonte Minerals Plc Araguaia Nickel Project Technical Report
Final November 2018 Page 134 of 342
The homogenisation was undertaken under the supervision of HZM Manager, Steve Heim. The crusher product was stacked with a 2.5 t front-end loader into 10, conical shaped piles with a capacity of 20 t to 25 t each. The front-end loader then prepared a number of horizontal rows which were then merged together. This general procedure was repeated five times to obtain good homogenisation of material for feeding the drying and agglomeration unit.
The crushed and homogenised material was stored undercover prior to feeding the dryer/agglomerator.
Integrated pilot RKEF testing
Drying and agglomeration
The drying and agglomeration operation commenced in mid-April 2015 and was completed prior to starting the rotary kiln and electric furnace thus producing sufficient agglomerated material. During this stage of processing, supervision and coordination was carried out by Gustavo Duran of IGEO.
The objective was to produce an agglomerated material having a moisture content averaging 18 wt%. The conditions for the dryer operation were based on the results of the drying and agglomeration pre-test conducted earlier. However, the feed rate was increased somewhat above the ranges used in the pre-test, but still within normal ranges, in part to ensure the pilot schedule could be maintained.
The dryer product was then temporarily stored in three piles (Figure 13-5).
RKEF
On 22 April 2015, the calcining and smelting stages started with the supervision of Phillip Mackey of HZM with Ronald Stewart and Gustavo Duran of IGEO. Nicholas Barcza (consultant to HZM) joined this team on 27 April 2015.
The smelting testwork continued from 22 April 2015 until 2 May 2015. Operating conditions and results are provided in the following sections.
Drying/agglomeration and RKEF pilot plant testing
Feed preparation and homogenisation
After the homogenisation operation, the chemical analysis of samples taken during four of the
homogenisation/blending steps is given in Table 13-10. The fairly small spread in the assays was
considered acceptable.
Table 13-10 Chemical composition of the ore over four of the blending operations
Elements/oxides Unit Homogenisation/blending
1 2 3 4
Ni wt% 1.54 1.57 1.62 1.58
Fe wt% 15.9 16.4 15.8 15.5
SiO2 wt% 40.47 41.29 41.46 40.70
MgO wt% 18.40 16.65 17.33 17.22
CaO wt% 0.13 0.14 0.18 0.12
Al2O3 wt% 4.64 4.92 5.03 4.67
TiO2 wt% 0.23 0.23 0.23 0.20
Cr2O3 wt% 0.92 0.97 0.97 0.93
MnO wt% 0.40 0.41 0.39 0.40
Co wt% 0.05 0.05 0.05 0.05
Cu wt% 0.01 0.01 0.01 0.01
Zn wt% 0.03 0.04 0.03 0.03
H2O wt% 31.44 31.18 31.87 32.34
SiO2/(MgO + CaO) wt% 2.20 2.46 2.38 2.36

Horizonte Minerals Plc Araguaia Nickel Project Technical Report
Final November 2018 Page 135 of 342
Drying and agglomeration
The dryer/agglomerator operated for five days to process all the material ahead of starting the kiln. A Metsim model that was customised for nickel laterite smelting was available to track the process performance of the dryer.
The granulometry of the dryer feed was quite constant throughout this operation, during time which the feed rate to the dryer (along with the firing rate) was varied somewhat.
The typical granulometry of the feed and also the product is illustrated in Figure 13-3. These results are quite similar to those obtained during the pilot drying and agglomeration pre-test.
Figure 13-3 Typical granulometry of the dryer feed and product
Note: Granulometry measurement of the feed by wet screening and the product by dry screening
In terms of feed processing, a number of points are noted below. With regards to the feed rate:
• The pilot drying and agglomerating test which was conducted in January 2015 showed that the dryer/agglomeration process was quite flexible in terms of feed rate while yielding good results as regards the dryer product.
• The variation in the feed rate was plotted, during the present drying and agglomerating campaign; the trend of the increase in feed rate is noted, followed by a lowering during the last two days.
In terms of moisture content, the results showed a tendency to increase towards the end of the drying campaign (Figure 13-4). This is considered to be the result in part due to the build-up of material near the dryer discharge. This condition arose in part due to the lower temperatures in the pilot unit, a condition which would not be expected to occur in a commercial dryer/agglomerator. It is also possible that the fuel rate may not have been adjusted sufficiently to reflect these changing conditions.

Horizonte Minerals Plc Araguaia Nickel Project Technical Report
Final November 2018 Page 136 of 342
Figure 13-4 Moisture of the feed and product during the campaign
Fuel consumption was obtained by hourly recordings of loss of weight shown by the LPG weigh scale. The average result for the dates 16th, 17th and 18th was 6.9 kg LPG/t of wet feed. The Metsim model corroborated these conditions using the following main input parameters: Feed rate (wet t/h and wt% moisture), product wt% moisture, steady state kiln heat losses, off-gas temperature and data on the LPG fuel.
The off-gas temperature varied between 49°C and 54°C during the campaign, with 52°C being the average.
The product showed the granulometry similar to that obtained in the earlier pilot dryer pre-test, with a typical result illustrated in Figure 13-3. The dryer product was stored in three piles as shown in Figure 13-5.
Figure 13-5 Dryer product storage showing two of the three piles
Rotary kiln
The product of the dryer was temporarily stored in three separate piles of nominally the same material. It was decided to take material from these piles using the 2.5 t front-end loader in the sequence Pile 1–Pile 2–Pile 3 and then repeated, in order to provide for some additional degree of blending. The integrated pilot RKEF calcining and smelting testwork commenced on 22 April 2015 and continued until 2 May 2015.
The calcining and electric furnace testwork was carried out in two phases, Phase 1 and Phase 2 with a furnace repair of the working lining completed at the end of Phase 1. The ore and coal feed rates used during the campaign for both Phase 1 and Phase 2 are presented in Table 13-11.

Horizonte Minerals Plc Araguaia Nickel Project Technical Report
Final November 2018 Page 137 of 342
The adjustment in the coal and ore feed rates was effected to obtain the targeted grade of FeNi. Initial operating parameters adopted at the kiln are given in Table 13-12. The supporting Metsim model calculations provided a basis for setting the initial kiln operating parameters.
Table 13-11 Adjustments to the kiln feed rate and coal additions during the campaign
Date (2015)
Time
Kiln feed rate target – wet kg/h
Dry coal as wt% of dry ore –
actual for period Comments
Ore Coal
Phase 1
22 Apr 10h00 600 28.7 5.7 Initial calculated coal for target 25 wt% Ni grade (slightly adjusted from the value in Table 13-13).
24 Apr 17h00 650 31.0 6.0 Compensate for increased ore feed rate and coal and ore moistures slightly different from original target.
25 Apr 08h00 650 41.0 8.0 Actual first metal grade too high at 43 wt% Ni. Was necessary to further compensate for coal losses and burn-off at electric furnace not contributing to reduction.
25-26 Apr 18h00 700 43.0
Increased ore feed rate for furnace slag temperature control.
Metal on 25th still high at 33 wt% Ni but trending down so maintained same wt% coal.
Final metal on 26th = 27 wt% Ni with target 25 wt%.
Phase 2
29 Apr 09h00 770 50.0 8.2 Consideration also given to final metal on 26th = 27 wt% Ni. Target still 25 wt% Ni.
30 Apr 16h00 770 40.0 6.5 Operating conditions changed to target 20 wt% Ni grade and considering also low grade of 17.3 wt% of metal tap for today and also influence of using metal of 27 wt% Ni in furnace for start-up.
1 May 08h00 770 40.0 6.5 Maintained conditions to await confirmation of achieving target 20 wt% Ni grade in tap for tomorrow, 2 May. Metal grade of 18.8 wt% for today (1 May) indicated upward trend.
2 May
Final metal tapped on 2 May was 24.6 wt% Ni.
Table 13-12 Initial kiln operating parameters (target 25% Ni in FeNi)
Items Units Data
Target dry coal addition (based on Metsim model) wt% of dry ore 5.5
Corresponding coal addition dry kg/h 26.95
Coal wt% H2O wt% 6.0
Coal addition wet kg/h 28.7
Furnace power kW 450
Kiln ore feed rate dry kg/h 490
Kiln ore feed moisture wt% 18.0
Kiln ore feed rate wet kg/h 600
Calculated calcine production kg/h 430
Established procedures at Morro were used for sample collection and assaying, the following additional notes provide further information pertaining to sampling:
• Kiln – calcine sampling:
− The procedure was modified from that used in the pre-test so that filling of the calcine sample pot was carried out with the kiln rotation temporarily stopped in the vertical position rather than slightly off vertical. This allowed effective collection of the calcine sample.
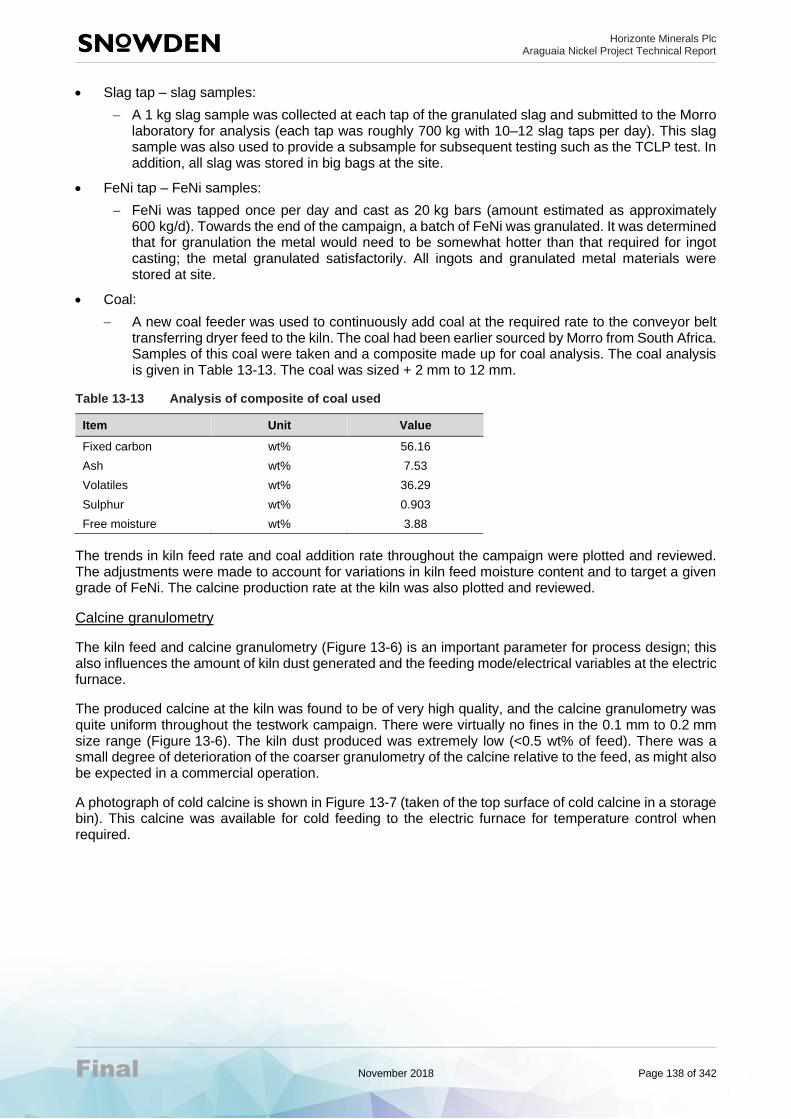
Horizonte Minerals Plc Araguaia Nickel Project Technical Report
Final November 2018 Page 138 of 342
• Slag tap – slag samples:
− A 1 kg slag sample was collected at each tap of the granulated slag and submitted to the Morro laboratory for analysis (each tap was roughly 700 kg with 10–12 slag taps per day). This slag sample was also used to provide a subsample for subsequent testing such as the TCLP test. In addition, all slag was stored in big bags at the site.
• FeNi tap – FeNi samples:
− FeNi was tapped once per day and cast as 20 kg bars (amount estimated as approximately 600 kg/d). Towards the end of the campaign, a batch of FeNi was granulated. It was determined that for granulation the metal would need to be somewhat hotter than that required for ingot casting; the metal granulated satisfactorily. All ingots and granulated metal materials were stored at site.
• Coal:
− A new coal feeder was used to continuously add coal at the required rate to the conveyor belt transferring dryer feed to the kiln. The coal had been earlier sourced by Morro from South Africa. Samples of this coal were taken and a composite made up for coal analysis. The coal analysis is given in Table 13-13. The coal was sized + 2 mm to 12 mm.
Table 13-13 Analysis of composite of coal used
Item Unit Value
Fixed carbon wt% 56.16
Ash wt% 7.53
Volatiles wt% 36.29
Sulphur wt% 0.903
Free moisture wt% 3.88
The trends in kiln feed rate and coal addition rate throughout the campaign were plotted and reviewed. The adjustments were made to account for variations in kiln feed moisture content and to target a given grade of FeNi. The calcine production rate at the kiln was also plotted and reviewed.
Calcine granulometry
The kiln feed and calcine granulometry (Figure 13-6) is an important parameter for process design; this also influences the amount of kiln dust generated and the feeding mode/electrical variables at the electric furnace.
The produced calcine at the kiln was found to be of very high quality, and the calcine granulometry was quite uniform throughout the testwork campaign. There were virtually no fines in the 0.1 mm to 0.2 mm size range (Figure 13-6). The kiln dust produced was extremely low (<0.5 wt% of feed). There was a small degree of deterioration of the coarser granulometry of the calcine relative to the feed, as might also be expected in a commercial operation.
A photograph of cold calcine is shown in Figure 13-7 (taken of the top surface of cold calcine in a storage bin). This calcine was available for cold feeding to the electric furnace for temperature control when required.

Horizonte Minerals Plc Araguaia Nickel Project Technical Report
Final November 2018 Page 139 of 342
Figure 13-6 Typical granulometry of the rotary kiln feed and calcine
Note: Granulometry measurement of the feed and the product by dry screening
Figure 13-7 Calcine product
Note: Photo taken of surface of cold calcine stored in a steel container
The calcine granulometry which was obtained during the present testwork may be said to be amongst the best seen in FeNi smelting according to observers present during the testwork.
Additional comments are:
• The almost complete absence of particulate material less than 0.2 mm helped provide a very uniform type of calcine (Figure 13-7). When charged onto the surface of the slag in the electric furnace, the material behaved as a fairly stable pile, without disturbing the furnace operation as can occur on those occasions when there is an excess of fines present in the material introduced into the furnace.
• The stability of the charge inside the furnace helped to allow a stable electric furnace operation – both with respect to the electrical performance and also generating less off-gas. This situation allows more effective and uniform power input.
• The stable operation increased the availability of the furnace and can potentially lower the maintenance requirements.
• Finally, stable calcine improves slag formation and can contribute to keeping the level of nickel in slag acceptably low (e.g. potentially less entrained metallic droplets), thus potentially improving nickel recovery; this is believed to be an added benefit of the improved calcine granulometry.

Horizonte Minerals Plc Araguaia Nickel Project Technical Report
Final November 2018 Page 140 of 342
Residual carbon
The residual carbon in the calcine throughout the campaign is shown in Figure 13-8.
Figure 13-8 Residual carbon in the calcine throughout the campaign
Figure 13-8 shows that there was considerable scatter in the values of wt% C in calcine; however, with less tendency for the larger swings towards the end of Phase 2. It is assumed that part of the reason for the observed variation in wt% C in calcine was due to variations in the wt% moisture in the dryer product/feed to the kiln. It is also thought that the actual conditions in the kiln itself were fairly steady (fairly constant temperatures in the kiln and quite uniform calcine temperatures), near-constant burner firing rate and regular rolling action of the material moving through the kiln); hence, the kiln itself is unlikely to have been a significant factor affecting variability in wt% C in calcine.
The observed trend of a lower wt% C in calcine towards the end of Phase 2 in Figure 13-8 was in response to a change in coal rate (a lowering of coal rate). The wt% C in calcine was reduced from around 2 wt% C to about 1.5 wt% C in calcine. The lower wt% C in calcine led to an increase in FeNi from around 18 wt% Ni to about 24.5 wt% Ni. It is seen that control of wt% C in calcine (by a lower coal rate) can be effectively used to control wt% Ni in FeNi.
Calcine temperature
The temperature of the calcine was measured by dipping an immersion thermocouple with a digital readout into the calcine sample. The calcine temperatures throughout the campaign were plotted and reviewed. The generally uniform temperatures reflect the good thermal control achieved at the kiln.
The pre-reduction of the calcine was determined based on the ratio of the measured amount of Fe2+ (FeO) compared to the total amount of Fe in calcine. That is, the degree of pre-reduction was calculated as per the equation below:
Degree of reduction (to FeO), as wt% = (wt%Fe2+/wt%Fetotal)* 100
The degree of reduction in calcine throughout the campaign is presented in Figure 13-9. This shows a trend of very gradual improvement in the degree of reduction over most of the campaign. The average of the degree of reduction for Period 1 and for Period 2 was 55.9 wt% and 57.1 wt% respectively.

Horizonte Minerals Plc Araguaia Nickel Project Technical Report
Final November 2018 Page 141 of 342
Figure 13-9 The degree of pre-reduction of iron in calcine throughout the campaign
The kiln exterior shell temperatures were measured during kiln operation at three different times during the day on 25 April 2015, with the average of these measurements presented in Table 13-14. The results indicate that an acceptable heat distribution/temperature profile was achieved along the length of the kiln. The observed temperatures here are also considered normal for this type of pilot operation.
The kiln temperature profile within the kiln refractory was measured by thermocouples inserted into specific locations in the refractory, along the length of the kiln. Each thermocouple was embedded to within about 20 mm from the inside (hot) surface of the refractory. The average measured refractory temperatures from these measurements are illustrated in Figure 13-10 (thermocouples were embedded with refractory brick along kiln length). These temperatures were fairly steady throughout the campaign.
Table 13-14 Average of measured kiln shell temperatures along kiln length
Item Location (zone) along kiln
Location Burner end Middle Off-gas end
Temperature (°C) 336.1 205.9 122.5
Note: The measurement point was at the horizontal mid-location of each zone along the kiln length
Figure 13-10 Typical average temperatures recorded by thermocouples
The kiln off-gas temperature and measured oxygen content of the gas, over the campaign period were monitored and reported. It indicates that there was some undue level of infiltrating air prior to the measurement point.
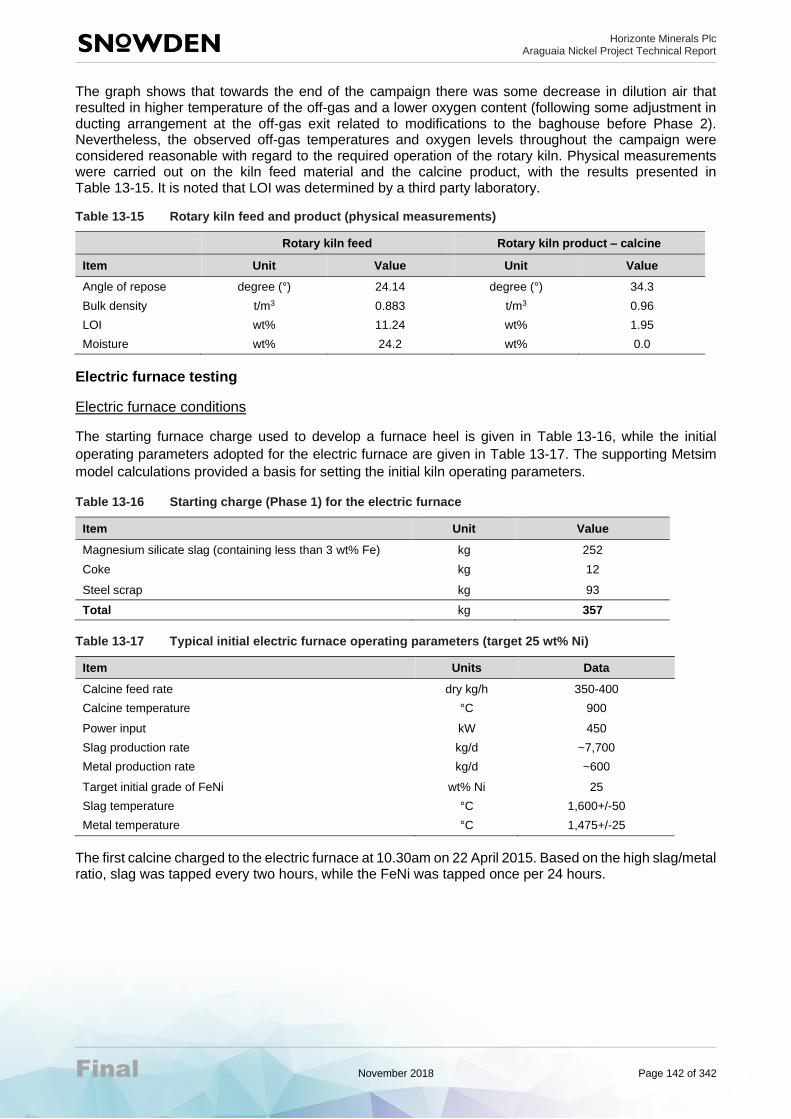
Horizonte Minerals Plc Araguaia Nickel Project Technical Report
Final November 2018 Page 142 of 342
The graph shows that towards the end of the campaign there was some decrease in dilution air that resulted in higher temperature of the off-gas and a lower oxygen content (following some adjustment in ducting arrangement at the off-gas exit related to modifications to the baghouse before Phase 2). Nevertheless, the observed off-gas temperatures and oxygen levels throughout the campaign were considered reasonable with regard to the required operation of the rotary kiln. Physical measurements were carried out on the kiln feed material and the calcine product, with the results presented in Table 13-15. It is noted that LOI was determined by a third party laboratory.
Table 13-15 Rotary kiln feed and product (physical measurements)
Rotary kiln feed Rotary kiln product – calcine
Item Unit Value Unit Value
Angle of repose degree (°) 24.14 degree (°) 34.3
Bulk density t/m3 0.883 t/m3 0.96
LOI wt% 11.24 wt% 1.95
Moisture wt% 24.2 wt% 0.0
Electric furnace testing
Electric furnace conditions
The starting furnace charge used to develop a furnace heel is given in Table 13-16, while the initial
operating parameters adopted for the electric furnace are given in Table 13-17. The supporting Metsim
model calculations provided a basis for setting the initial kiln operating parameters.
Table 13-16 Starting charge (Phase 1) for the electric furnace
Item Unit Value
Magnesium silicate slag (containing less than 3 wt% Fe) kg 252
Coke kg 12
Steel scrap kg 93
Total kg 357
Table 13-17 Typical initial electric furnace operating parameters (target 25 wt% Ni)
Item Units Data
Calcine feed rate dry kg/h 350-400
Calcine temperature °C 900
Power input kW 450
Slag production rate kg/d ~7,700
Metal production rate kg/d ~600
Target initial grade of FeNi wt% Ni 25
Slag temperature °C 1,600+/-50
Metal temperature °C 1,475+/-25
The first calcine charged to the electric furnace at 10.30am on 22 April 2015. Based on the high slag/metal ratio, slag was tapped every two hours, while the FeNi was tapped once per 24 hours.

Horizonte Minerals Plc Araguaia Nickel Project Technical Report
Final November 2018 Page 143 of 342
Electric furnace operation and feed rates
The operation of the electric furnace and kiln covered two phases – Phase 1 and Phase 2. Phase 1 covered the start-up and initial period from 22 April 2015 to 26 April 2015, while Phase 2 covered the period 29 April 2015 to 2 May 2015. A new working lining was installed at the end of Phase 1 to extend the furnace life. During most of Phase 1, the rate of feeding calcine was initially controlled by the kiln feed rate. However, this mode proved to be not straightforward and excursions to higher slag temperatures occurred at the necessary operating power level. Towards the end of Phase 1, the calcine feed rate to the electric furnace was kept more constant with the cold calcine that had been set aside and added as needed to help control slag temperature at the target level of around 1,575°C.
This mode of operation was then followed for Phase 2. This procedure proved to be adequate and slag temperature was better controlled. Information for each phase is summarised in Table 13-18.
Table 13-18 Data for Phase 1 and Phase 2 operation of electric furnace
Period Dates (2015)
Total hours of
operation
Calcine feed rate to furnace
Comments on furnace Total for period (kg)
Average rate (kg/h)
Phase 1 22-26 April
96 34,910 363.6
Calcine feed rate control at furnace via kiln feed.
Electric furnace operation typically arc and brush mode.
High slag temperatures (= reduced slag temperature philosophy)
Phase 2 29 April to
2 May 76 31,302 411.9
Calcine feed rate maintained steady with some cold calcine introduced as needed.
Electric furnace operation covered brush arc and shielded arc modes.
Lower and more steady slag temperatures (reduced slag temperature philosophy).
The average calcine feed rate as kg/h on a daily basis for Phase 1 and Phase 2 was monitored and reported; the calcine feed to the electric furnace was more uniform in Phase 2.
Calcine granulometry
The calcine granulometry was quite uniform and contained little fines. This calcine quality proved to be an excellent electric furnace feed and allowed stable arcing conditions in the furnace. Arcing conditions in the furnace were monitored (brush arc and shielded arc conditions) and effective arcing conditions were demonstrated during the operation of the electric furnace.
There were no incidents of “slag boil” in Phase 1 (a “slag boil” is an eruption of slag from the furnace bath and which can occur with sudden cooling such as with excess calcine and fines being fed onto the slag surface). This was considered due in part to the higher bath temperatures in Phase 1 which assisted good absorption of calcine into the bath. The two incidents of slag boil during Phase 2 were fairly easily controlled (by cutting back on feed and adjusting the power for a short period).
Furnace operating temperatures
The slag and metal temperatures during Phase 1 and Phase 2 as measured by immersion “dip” thermocouple at each tap was monitored and reported. This shows the higher and more variable slag temperatures observed in Phase 1, with the more uniform and lower slag temperatures observed in Phase 2 following the adoption of the improved strategy of controlling temperature by matching calcine feed rate to the power and bath operating conditions.
The distribution of slag temperature during the campaign is illustrated in Figure 13-11. It is noted that the x-axis in Figure 13-11 represents temperature values grouped in ranges, each representing a 10°C (e.g. 1,550–1,570°C, 1,570–1,590°C, etc.), while the y-axis represents % distribution values. The generally lower temperatures achieved in Phase 2 (the lower slag temperature philosophy approach) are evident.

Horizonte Minerals Plc Araguaia Nickel Project Technical Report
Final November 2018 Page 144 of 342
Figure 13-11 Slag temperature distribution
The power input to the furnace achieved during the campaign was monitored and reported; the power input during Phase 2 was more uniform.
Slag and metal amounts and analyses
The trend in the ratio, SiO2/MgO in calcine and slag is illustrated in Figure 13-12. The lower ratio at the beginning of the campaign reflected the use of Morro slag as part of the furnace start-up charge for the campaign; this slag was not used for Phase 2.
Figure 13-12 SiO2/MgO in calcine and slag versus date
Mass balance and operating data
Key metallurgical and operational data including metal during both phases of the ANS pilot plant campaign were monitored and reported. The nickel furnace recovery as calculated by the slag analyses and slag weights is adopted in the present work as a reasonable basis. This result is considered a reasonable estimate of the level of nickel recovery that could be also anticipated in the commercial plant.
The following additional points are noted:
• The calculations for nickel recovery are based on the weights of slag and corresponding analysis of each slag tap. The granulated slag also contained a small amount of free moisture (of approximately 5 wt% based on moisture determinations) so the computed dry weights were considered quite accurate.
• The theoretical nickel recovery for the target nickel grade in metal of 20 wt% Ni as calculated by the IGEO model is 93 wt%, similar to the observed results in the pilot plant campaign at higher Ni grades from 25 to 30 wt% based on the low Ni levels in the slag (between 0.11 to 0.14 wt%) as shown in Figure 13-13. The IGEO model is an Excel-based model using mainly empirical parameters and verified operating data/factors to compute technical data for the RKEF process given feed and other input conditions. Typical input data for the model are given in Table 13-19.

Horizonte Minerals Plc Araguaia Nickel Project Technical Report
Final November 2018 Page 145 of 342
• The average recovery as obtained by the actual mass of metal collected was lower at 86.2 wt%. This is considered to be reasonably acceptable in view of the amount of nickel handled, but not reflective of the true nickel recovery due to some unaccounted losses of metal (splashes, losses of metal etc probably mixed with slag when pouring from the ladle for ingot casting or granulation and, for example, as unrecovered pieces of ladle and other skulls) – particularly in view of fact that larger commercial-scale handling equipment was used with relatively small quantities of metal – the unaccounted loss of metal was estimated at approximately 280 kg FeNi metal, or 7 wt%.
• It was expected that the nickel recovery across the rotary kiln would be very high. Dust generation in the kiln was extremely low, and dust losses at the baghouse were virtually zero; the small amount of kiln dust was therefore effectively collected in the baghouse. The discrepancy between nickel in kiln feed and nickel in calcine produced is considered to be an “unaccounted” loss – this could have arisen from a possible inherent bias discrepancy in the feed belt weightometer instrument (but not confirmed). There was no visible dust generated at the calcine discharge, while the calcine discharge and container arrangement were quite well sealed. The other possible contributing factor may lie in variations and a possible bias (but not confirmed) in the moisture determinations of the kiln feed, thus influencing the calculated dry weights; moisture determinations on four-hourly composites varied between 21 wt% and 26 wt%.
Figure 13-13 wt% Ni in slag vs. wt% Ni in FeNi – testwork figures and commercial operation data
Note: Operating data are based on FeNi plants in Brazil
Table 13-19 Average composition of the feed material for the calculations (dry basis)
Component Unit Value
Ni wt% 1.59
Fe wt% 15.5
SiO2 wt% 40.8
MgO wt% 17.2
Al2O3 wt% 4.7
LOI wt% 11.2
H2O wt% 29.4
SiO2/MgO wt% 2.38
Note: These assays are virtually identical to those in Table 13-9. Assuming Fe as FeO and including analysed levels of TiO2, Cr2O3, MnO and CoO, and also including LOI, the assays totalled 98wt% which was considered acceptable.
Estimates of the energy balance for the pilot RKEF and electric furnace were monitored and reported. It
is noted that in pilot plant work such as the present campaign, due to the smaller size of equipment, the
heat losses are typically a larger component of the input heat when compared to that observed in large
commercial operations.

Horizonte Minerals Plc Araguaia Nickel Project Technical Report
Final November 2018 Page 146 of 342
Specific energy requirement and specific energy consummation
The specific energy requirement (SER) is calculated based on the IGEO model. The supporting Metsim model calculations were also used to establish the initial parameters such as the furnace calcine feed rate for the power of 450 kW, amount of slag and metal to be produced, etc. It is therefore a theoretical value which, when including the thermal efficiency, results in the specific energy consumption (SEC) value.
The ore composition used in this calculation was the average feed to the rotary kiln during the campaign (Table 13-19). Process input data (Table 13-20) for the model and process output data (Table 13-21) were reported.
Table 13-20 Process input data for model
Items Unit Value
Pre-reduction Ni wt% 10
Pre-reduction Fe wt% 56
Temperature °C 937
Coal – Fixed carbon wt% 55
Rotary kiln feed wt% H2O 22.6
Ni grade wt% 20
Metal temperature °C 1,480
Slag temperature °C 1,621
Slag Ni grade wt% 0.14
Table 13-21 Process output data
Item Unit Value
Coal requirement wt% 5.5
Calcine kWh/t of dry ore 872
FeNi kWh/t of dry ore 79.5
Slag kWh/t of dry ore 767.6
The level of pre-reduction may affect the energy consumption. The actual energy consumption as a function of the degree of pre-reduction (based on daily averages of pre-reduction), during the pilot campaign was monitored and reported. While showing some scatter, it is noted that the furnace operation was exceptionally steady in terms of bath behaviour and energy input.
Reduction and smelting correlations
The nickel grade in the final FeNi product is controlled by the addition of reductant which, through the calcining and smelting processes, will selectively reduce the nickel and the iron oxides to varying degrees. The degree to with which this selective reduction is achieved depends on a number of operating conditions prevailing in both the kiln and the furnace. A number of trends are plotted below to illustrate the effects of the impact of factors which in turn are mainly influenced by changes in the coal addition rate. The correlations of wt% Ni and wt% Fe in slag (influenced by the degree of reduction) and the nickel recovery are shown in Figure 13-14 and Figure 13-13.

Horizonte Minerals Plc Araguaia Nickel Project Technical Report
Final November 2018 Page 147 of 342
Figure 13-14 Wt% Ni and wt% Fe in slag as obtained during the testwork vs. date
The Ni content in the slag depends among other factors, on the FeNi grade. Figure 13-13 illustrates the trend of wt% Ni in slag vs. grade of FeNi. The nickel in slag was found to increase slightly as the wt% Fe in slag increased, as tends to be evident from the trends given in Figure 13-14.
FeNi metal quality
The analysis of samples of the metal taps presented in Table 13-22 shows that the metal produced was of good quality. The carbon, phosphorous and sulphur values are within acceptable levels for the refining process in the ladle furnace under reducing condition for S removal and oxidising for P removal; silicon levels were also quite low.
The ratios of Ni/Co and Ni/Cu are well above the normally accepted limits of Ni/Co >30 and Ni/Cu being well above the industry limit of 300 and therefore, match customer requirements.
Table 13-22 Composition of FeNi metal
Metal tap Day C
(wt%)
S
(wt%)
Ni
(wt%)
Si
(wt%)
Cu
(wt%)
P
(wt%)
Co
(wt%) Ni/Cu Ni/Co
Tap 1 23 Apr 0.057 0.248 14.63 0.0042 0.0583 0.197 0.599 251 24
Tap 2 24 Apr 0.068 0.238 43.28 0.0045 0.0817 0.147 1.02 530 42
Tap 3 25 Apr 0.085 0.272 33.4 0.0574 0.0664 0.228 0.855 503 39
Tap 3 25 Apr 0.09 0.308 33.7 0.0006 0.0707 0.225 0.89 477 38
Tap final phase 1 26 Apr 0.276 0.397 26.74 0.0075 0.0653 0.316 0.749 409 36
Clean up metal 27 Apr 0.025 0.14 27.36 0.0058 0.0548 0.136 0.752 499 36
Tap 5 30 Apr 0.491 0.274 17.29 0.2849 0.0478 0.253 0.542 362 32
Tap 6 5 Jan 0.5 0.239 18.81 0.0401 0.0489 0.215 0.554 385 34
Tap 7/1 5 Feb 0.051 0.267 24.6 0.0142 0.0623 0.284 0.71 395 35
Tap 7/2 5 Feb 0.092 0.214 24.53 0.0086 0.0616 0.229 0.701 398 35
Note: Assays by Morro laboratory except for Si. Cu, P and Co which were assayed at SGS
Refractory temperature trends in electric furnace
The lining temperature was monitored by thermocouples positioned within the furnace refractory wall – thermocouple No. 1 was used to monitor trends in the upper level of the furnace, while thermocouple No’s 2 to 4 provides the trend in lower part of the furnace.)
The trend of these temperatures during Phase 1 was plotted. The trend for Phase 2 was similar but trending to slightly lower temperatures at similar hours of operation.

Horizonte Minerals Plc Araguaia Nickel Project Technical Report
Final November 2018 Page 148 of 342
It is noted that once the thermocouples No’s 2 and 3 approached 500°C (on 26 April 2015), it was considered prudent to stop, empty the furnace and after cooling, replace the working brick lining. This is because this pilot furnace had no shell water or copper cooling as would be the case with the commercial furnace and refractory temperatures are therefore in the present case hotter and prone to slag corrosion. Phase 2 commenced on 29 April 2015 with wall temperatures similarly monitored.
Phase 2 was terminated when enlargement around the interior of the metal taphole was observed and it was considered unsafe to continue.
Laboratory analysis and verification of assay and test data
Samples for the pilot plant campaign were analysed at the Morro laboratory using the pressed powder – XRF method which is well equipped to handle and analyse materials in RKEF processing. The laboratory work also included physical measurements such as particle size distribution, bulk density and related. The present report is based on the Morro assays (with the exception that certain trace elements in FeNi as reported by SGS Canada and as noted below were used).
Duplicate samples of ore, rotary kiln feed, calcine and slag were prepared and sent to ALS, Brazil for cross-check analysis. The samples were analyszed at ALS, Peru using the XRF lithium tetraborate – lithium metaborate fused disk method. Duplicate samples of FeNi were sent to SGS Canada for cross-check analysis and for the analysis of a number of trace elements. Samples of calcine were sent to another FeNi plant in Brazil for LOI analysis (and included in the present report).
The comparisons of the cross-check analysis on kiln feed were undertaken. The following comments are made regarding these cross-check analayis:
• The nickel assays at Morro show a strong low bias but generally fall within a +/-10 wt% band
• The iron assays at Morro and ALS compare well
• The SiO2 assays at Morro and ALS compare well
• The MgO assays at Morro show a low bias with some limited scatter outside a +/-10 wt% band
• The SiO2/MgO ratio from the Morro assays is high compared to ALS (arising mainly from the MgO assays tending to be lower), with a scatter outside a +/-10 wt% band
• Al2O3 assays at Morro show a strong low bias and a scatter outside a +/-10 wt% band.
The weights of kiln feed were recorded on a weightometer while the rate of coal feeding was adjusted manually and separately checked regularly during the campaign. The amounts of calcine, FeNi and slag were weighed on the commercial scale at Morro.
Overall comment
The QP considers the Morro assays and other test data were adequate to support the pilot plant campaign and the resulting conclusions.
13.3 Pilot testing of ANN ore
A bulk sample of ANN Serra do Tapa ore was tested at the pilot plant Polysius R&D Centre in Ennigerloh, Germany and at the pilot facilities of Mintek in South Africa. Calcine was produced at the pilot plant in Germany and shipped to South Africa for smelting.
The process flowsheet tested was based on Glencore (previously Xstrata) proprietary technology, with a total of 28 wet t of Serra do Tapa ore processed in the pilot plant in Germany. Calcine was smelted in a 450 kW electric furnace at Mintek at a feed rate of about 300 kg/hr (same order of magnitude as the tests on ANS ore in Brazil) and in a similar size of furnace of DC design.
The Mintek pilot plant operated steadily over a five-day period with only minor interruptions and confirmed the preliminary process design parameters obtained from bench testing.

Horizonte Minerals Plc Araguaia Nickel Project Technical Report
Final November 2018 Page 149 of 342
Table 13-23 and Table 13-24 have been included in this section to provide the composition of the ANN Serra do Tapa material and the blended drill core samples used to produce the calcine that was smelted at Mintek in South Africa in 2008. The Mintek report includes a table of the calcine composition where all analysis is expressed as the elemental form for simplicity.
Table 13-23 Facie abundance/chemistry, Serra do Tapa deposit
Facies wt% of
total Ni
(wt%) Co
(wt%) Fe
(wt%) SiO2
(wt%) MgO (wt%)
Al2O3 (wt%)
Ni/Co SiO2/ MgO
GT-2 35 1.71 0.05 17 43 15 13.8 33 1.9
SAPR 18 1.59 0.03 10 43 26 2.2 63 1.7
GT-1 16 1.98 0.05 16 46 13 3.7 42 3.5
OT 9 1.60 0.08 28 34 6.0 5.2 19 5.7
GT-3 7 1.65 0.03 12 43 23 3.4 49 1.9
TZ-1 4 1.61 0.07 22 35 15 4.9 25 2.3
TZ-2 4 1.62 0.04 16 40 19 3.7 37 2.1
RT 4 1.54 0.12 29 34 4.2 6.3 13 8.1
Others 3 1.5 0.1 36 20 5 6.5 15 4
Total 100 1.60 0.05 18 41 16 3.8 31 2.6
Table 13-24 Serra do Tapa drill core sample blend
Facies Wt% of
total Ni
(wt%) Co
(wt%) Fe
(wt%) SiO2
(wt%) MgO (wt%)
Al2O3 (wt%)
Cr2O3
(wt%)
SiO2/ MgO
GT-1 16 1.86 0.035 14.5 44.7 11.3 3.87 1.5 3.96
GT-2 35 1.71 0.048 16.5 43.4 12.9 3.78 1.5 3.36
GT-3 7 1.56 0.028 11.3 41.5 18.7 2.64 0.96 2.22
OT 9 1.70 0.070 27.6 37.4 5.62 5.63 2.0 6.65
RT 4 1.68 0.123 28.4 35.3 3.96 6.35 1.8 8.91
SAPR 20 1.55 0.024 9.83 43.2 20.1 2.83 0.84 2.15
TZ-1 4 1.56 0.054 21.2 37.2 13.4 4.84 1.6 2.78
TZ-2 4 1.69 0.046 16.5 41.7 16.1 4.31 1.4 2.59
Composite 1.71 0.057 16.97 44.63 16.27 3.83 1.4 2.7
13.3.1 Direct current smelting pilot test
The Mintek pilot plant consisted of a single-electrode circular DC arc smelting furnace. The custom-designed furnace has an internal diameter of 1.0 m and features a continuous ring of water-cooled copper waffle coolers in the slag zone. Two tapholes separated by an angle of 90° are utilised for removing metal and slag from the furnace respectively. Two waffle coolers installed on either side of the metal taphole provide cooling of the tap blocks.
Slag is tapped through a removable copper insert. Both the hearth and the roof are constructed from castable refractory. The hearth includes a pin anode design for completing the electrical circuit through the molten bath. A single calcine feed pipe is located in the roof of the furnace adjacent to the electrode. The electrode diameter was 200 mm.
Calcine with the following weighted average estimated composition, namely: Al2O3 4.3 wt%, Cr2O3 1.4 wt%, Fe3O4 26 wt%, MgO 18 wt%, Ni 2 wt% and SiO2 48 wt% (calculated from the element based composition of the calcine) for smelting was metered out of a bin using a variable speed belt feeder to control the feed rate to the furnace and a trimming addition of coal was added manually enable the low carbon addition rate to be carefully controlled.
The furnace was operated based on the following strategy and methodology:
• The power level was set based on the target hearth power density
• The voltage level was set based on maintaining an arc length of 10–15 cm

Horizonte Minerals Plc Araguaia Nickel Project Technical Report
Final November 2018 Page 150 of 342
• The furnace power control system was used to set the operating current
• The calcine feed rate was determined based on the power level, specific energy requirement (SER) and total furnace heat losses.
The nominal capacity of the pilot furnace was 250 kg/hr at a power level of 450 kW.
The main objectives of the Mintek pilot plant test campaign are listed below:
• Validate the DC furnace PDC.
• Target hearth power density of 500 kW/m2.
• Target FeNi grade range of 30 to 45% with 35 wt% Ni average to evaluate the grade recovery relationship. (a similar range was tested in the Morro Azul pilot plant campaign).
• Target slag loss of 0.14 wt% Ni (corresponding to 92 wt% Ni recovery).
• Target slag tapping temperature of 1,600°C.
• Target maximum sidewall heat flux of 100 kW/m2.
Pilot testing of the smelting process took place during August 2008. The test campaign duration was five days with an equipment availability of 88 wt%. Despite the short duration, reliable furnace operation facilitated collection of sufficient process data to support and validate the metallurgical plant process design.
The calcine generated from Serra do Tapa ore was processed during the pilot test and although its chemistry has more challenging smelting conditions than VDS, the results confirmed the preliminary process design parameters obtained from the bench testing that were used as the basis for the conceptual design of the process plant.
The 15 t of calcine that were processed in 300 to 500 kg batches through the Mintek pilot DC furnace together with the heat used at the start of the campaign resulted in a total of three metal taps and 36 slag taps. Analysis of the results has confirmed that the Serra do Tapa deposit can be smelted according to the PDC assumed in the Metallurgical Plant design for the Xstrata (subsequently Glencore) ANP. The hearth power density value of 500 kW/m2 is much higher than the more appropriate conservative value of 175 kW/m2 used for the HZM FS. The slag temperature and nickel recovery are similar to those used in the FS allowing for the effect of scale on the latter and the effectiveness of the copper coolers used. This demonstrates what would have been expected in the Morro pilot plant furnace used in Brazil had a similar side-wall cooling system been available. The Mintek pilot furnace operated at a similar range of side-wall heat flux as proposed in the HZM FS, thus supporting this approach for a robust furnace design for treating ANS ore.
Table 13-25 Pilot smelting test results vs. process design criteria (PDC)
Process design parameter Pilot test result PDC
Hearth power density (kW/m2) 573 500
Slag temperature (°C) 1,603 1,600
Nickel recovery (wt%) 93 92
Sidewall heat flux (kWm2) 81 <100
The average composition of slag and ferronickel produced during the final 25 batches smelted in the Mintek furnace that relate to stable furnace operation period are shown in Table 13-26 below and compare reasonably well with the data from the Morro pilot furnace testwork.

Horizonte Minerals Plc Araguaia Nickel Project Technical Report
Final November 2018 Page 151 of 342
Table 13-26 Slag and FeNi composition
Slag (taps 23 to 38) FeNi (taps 23, 30 and 38)
Ni = 0.11 wt% Ni = 29 wt%
FeO = 17 wt% Fe = 70 wt%
SiO2 = 53 wt% Co = 0.4 wt%
MgO = 22 wt% Zn = 0.08 wt%
Al2O3= 4.6 wt% Cu = 0.06 wt%
Cr2O3 = 1.7 wt% S = 0.14 wt%
SiO2/MgO ratio = 2.4 P = 0.04 wt%
Upon review of the slag data in Table 13-26, it can be seen that the composition of the slag here is fairly similar to that for the slag produced in the 2015 pilot testwork on ANS ore – which itself was representative of LOM ore as described elsewhere in this FS report. As the slag in laterite smelting reflects the type of ore treated, the ANN ore tested by Xstrata and the ANS ore can also be seen to be representative of the LOM ore feed. Average furnace operating parameters during the stable operating period are listed below.
• Calcine feed rate = 300 kg/hr
• Coal addition = 3.7 wt% of calcine (corresponding to 2.1 wt% fixed carbon)
• Furnace power = 450 kW
• Total furnace heat loss = 215 kW (185 kW measured + 30 kW unmeasured)
• SER = 0.78 kWh per kg of calcine
• Electrode voltage = 300 Volts
• Electrode current = 1500
• Amps Arc length = 10 cm
• Slag depth = 20 cm (start of batch) to 40 cm (end of batch).
A total of 990 kg of FeNi was produced in the Mintek pilot plant smelting tests on the ANN calcine used. The conclusion that can be made is that ANN ore tested is amenable to smelting by both the RKEF and DC furnace process routes, the latter having been piloted by Glencore (previously Xstrata) and both options were considered in their Scoping Study report.
13.3.2 Results of pilot testing of ANN ore
A total of 990 kg of FeNi was produced in the pilot electric furnace testing. It was found that ANN ore was amenable to high temperature smelting. Since the chemistry of FeNi smelting is essentially independent of the type of furnace used, it is concluded that ANN ore is amenable to smelting by the RKEF process which process was included in the Glencore (previously Xstrata) Scoping Study.
The calcination of ANN ore was found to produce a calcine of acceptable quality. The composition of the FeNi and slag produced on pilot electric furnace smelting the calcine is summarised in Table 13-27.
Table 13-27 FeNi and slag composition in pilot testing of ANN ore
FeNi (wt.%) Slag (wt%)
Ni 29.0 Ni 0.11
Fe 70.0 FeO 17.0
Co 0.40 SiO2 53.0
S 0.14 MgO 22.0
P 0.04 Al2O3 4.6
Cu 0.06 Cr2O3 1.7
Zn 0.08 SiO2/MgO 2.4
Ni/Cu 363
Ni/Co 73

Horizonte Minerals Plc Araguaia Nickel Project Technical Report
Final November 2018 Page 152 of 342
Note: Relative to the Ni and Co levels in ANN ore (Table 13-27), and the known behaviour of Co in FeNi smelting, it is considered that the above reported Co assay by Glencore (then Xstrata) is likely low. A Ni/Co ratio in FeNi of about 35 was expected.
The assay of the ANN ore that provided the calcine used in the Mintek pilot test was computed from the calcine assay assuming an LOI value of 11%. This computed ore assay is presented in Table 6.40, along with the average kiln feed used in the 2015 Morro Azul pilot RKEF test and the design ore feed for the present FS (years 2 to 9). It can be seen that the assays compare reasonably well, thus further demonstrating that ANN ore will be compatible for smelting at the proposed Araguaia plant.
Table 13-28 Morro Azul and Mintek ore assays comparison to design ore assay for FS
Item Mintek testing
ANN ore 2015 Morro Azul pilot plant
(average kiln feed) Design ore FS
(Years 2–9)
Ni (wt%) 1.69 1.61 1.77
Fe (wt%) 18.9 15.64 17.73
Al2O3 (wt%) 3.75 4.71 5.34
SiO2/MgO 2.72 2.36 2.56
MgO (wt%) 15.76 17.17 15.37
SiO2 (wt%) 42.8 40.79 39.38
CaO (wt%) NA 0.16 0.07
Co (wt%) 0.05 0.053 0.08
Cr2O3 (wt%) 1.23 0.95 1.28
MnO (wt%) 0.34 0.4 0.42
LOI (wt%) 11.0 11.24 10.81
Ni/Co 33.8 30.56 26.8
Fe/Ni 11.5 9.72 10.0
Note: The above ore assay for Mintek testing represents the calculated ore based on the calcine smelted at Mintek.
13.4 Material property test
13.4.1 Introduction and scope
HDA was contracted to carry out testing and provide technological characterisation of two nickel ore samples designated as TransAP and GS. The basis for selecting these two samples was as follows
The TransAP was a sample of an average blend of Transition (±60%) and Saprolite (±40%) from the “Selective Mining Unit” (SMU) samples as taken from the lowest levels of the excavated trial mining pit6. The aim of this sampling was to replicate as best as possible the granulometry of the average plant feed.
The GS sample was collected from the SMU samples from the lowest levels of the trial mining pit with the aim of representing the largest fragments available at this level (i.e. the largest fragments the primary crusher would likely have to handle).
The scope of the testwork included the following:
• Particle size distribution
• Bond WI Crushing test
• Bond AI test
• Point load test (PLT)
• Staged crushing test
6 The Selective Mining Unit (SMU) is considered as the smallest size of mined material considered to be selected to meet feed parameters. For Araguaia, the SMU size was estimated as 5 m x 5 m x 2 m, or roughly 75 dry tonnes. The trial mining pit extended to a depth of about 14 m, roughly 10 m above the bed rock zone. The above TransAP and GS samples were taken from selected SMUs once on surface.

Horizonte Minerals Plc Araguaia Nickel Project Technical Report
Final November 2018 Page 153 of 342
• Final report describing all methods, equipment, experimental results and analysis of each test.
In addition, J&J was contracted to conduct a flow property test program on two samples of nickel ore: TransAP and GS.
The test program consisted of the tests listed below in the combinations described in Table 13-29:
• Compressibility – determines the bulk density vs. consolidating pressure relationship
• Loose and tapped density – determines the bulk density via ASTM tapping methods
• Particle density (SG) – liquid displacement method to determine the “true” density of the particles
• Bench scale angle of repose and drawdown.
Table 13-29 Summary of the conditions at which tests were performed
Material Moisture content [wt%]
Tested Tests conducted As received Saturation
Nickel Ore — GS, full size 23 wt% not measured 23 wt% 2
23 wt% 1, 3, 4
Nickel Ore — GS, -6.3 mm 23 wt% 36wt% 29 wt% 1, 3, 4
32 wt% 1, 3, 4
Nickel Ore — TransAP, full size 27 wt% not measured 27 wt% 2
26 wt% 1, 3, 4
Nickel Ore — TransAP, -6.3 mm 26 wt% 39wt% 31 wt% 1, 3, 4
35 wt% 1, 3, 4
Discussion of procedures, results and analysis related to sample characterisation tests follow for HDA (Sections 13.4.1 to 13.4.3), then for J&J (Sections 13.4.4).
13.4.1 Samples
Received samples included four 1-tonne big bags, two for each sample. The average net weight of the samples was approximately 2 tonnes.
13.4.2 Methodology
The two samples were handled independently and equally. First, the material was blended and homogenised in elongated piles, and then split in four subsamples.
One of these subsamples was sent to sieving, another was used in the characterisation tests, and the remaining two subsamples were blended together and used in the crushing tests. Details and results of each test can be found at Section 13.4.3.
To determine the sample’s particle size distribution, both samples were carefully staged sieved.
Following the screening sample splits weighing approximately 100 g were taken of each size fraction for the GS-B and TransAP samples and shipped to ALS Minerals in Goiania for chemical analysis. A total 45 grain size fraction samples, 24 from the GS_B sample and 21 from the TransAP sample. The samples were sent directly to ALS in Goiania for preparation, and XRF analysis. In Goiania the samples were logged, HZM sample tickets were added and QC reference samples inserted by HZM at the ALS sample preparation facility.
The samples were analysed per ALS Minerals XRF method for nickel laterite: XRF 12u which is the standard package used by HZM for all laterite samples. Total Carbon and Sulphur were also requested using ALS Minerals Leco packages IR07 and IR08 respectively.
The chemical analyses suggest that the ore mineralisation contains very little carbon and sulphur with total C and S assays near the limit of resolution of 0.01 wt%.

Horizonte Minerals Plc Araguaia Nickel Project Technical Report
Final November 2018 Page 154 of 342
Figure 13-15 and Figure 13-16 are plots of the SiO2, MgO, Fe, LOI, Al2O3, and Ni assay values for each size fraction for the GS-B and TransAP samples respectively.
Figure 13-15 Assay wt% for GS-B grain size fractions
Figure 13-16 Assay wt% for TransAP grain size fractions
13.4.3 Results
The particle size distributions show that the P80, i.e. the screen opening that 80 wt% of the material passes for the GS sample was 22.2 mm, while for TransAP sample the corresponding value was 1.98 mm. These results indicate a significantly finer size distribution for TransAP sample, as compared with GS sample. This information from the respective locations is used for the design of the feed materials handling stages and the design of the crushing and sizing equipment. The coarser fractions of over 200 mm require crushing down to less than 30 mm so that an indication of the proportions of these and the in-between size fractions is useful.
The sample moisture content is presented in Table 13-30.

Horizonte Minerals Plc Araguaia Nickel Project Technical Report
Final November 2018 Page 155 of 342
Table 13-30 Sample moisture results
Sample Weight at natural moisture (kg) Dry weight (kg) Moisture (wt%)
GS 22.4 17.5 22 wt%
TransAP 21.2 13.9 34 wt%
Bond Abrasion test
The GS sample experimental results for the Bond Abrasion test are summarised in Table 13-31, while the TransAP results are summarised in Table 13-32.
Table 13-31 AI test results – GS sample
Sample Particles weight (g) Paddle weight (g)
Ai Classification Set 01 Set 02 Set 03 Set 04 Initial Final
GS-1 400.6 400.4 400.6 400.6 96.7485 96.7458 0.003 Exceptionally Low
GS-2 400.6 400.6 400.4 400.4 96.7458 96.7420 0.004 Exceptionally Low
GS-3 400.4 400.4 400.3 400.5 96.5754 96.5726 0.003 Exceptionally Low
Average 0.003 Exceptionally Low
Table 13-32 AI test results – TransAP sample
Sample Particles weight (g) Paddle weight (g)
Ai Classification Set 01 Set 02 Set 03 Set 04 Initial Final
TransAP-1 400.6 400.4 400.6 400.6 96.5663 96.5640 0.002 Exceptionally Low
TransAP-2 400.7 400.7 400.7 400.7 96.9696 96.9650 0.005 Exceptionally Low
TransAP-3 400.6 400.4 400.5 400.6 96.9650 96.9607 0.004 Exceptionally Low
Average 0.004 Exceptionally Low
According to Table 13-31 and Table 13-32, the AI results obtained for GS and TransAP samples, respectively 0.003 and 0.004, indicate exceptionally low abrasiveness for triplicated test averages. Such a classification is based on Table 13-31.
The ranges of values used to classify the abrasive wear potential, is shown in Table 13-33.
Table 13-33 Classes of abrasive wear potential
Range of Bond Abrasion Index values Classification
Lower Higher
0.000 0.050 Exceptionally Low
0.051 0.100 Extremely Low
0.101 0.200 Low
0.201 0.300 Medium–Low
0.301 0.400 Medium
0.401 0.500 Medium–High
0.501 0.600 High
0.601 0.700 Very High
0.701 0.800 Extremely High
>0.800 Exceptionally High
Bond Impact Work Index test
The experimental results for the Specific Weight test are summarised in Table 13-34, while the Bond Impact Work Index test results are summarised in Table 13-35.

Horizonte Minerals Plc Araguaia Nickel Project Technical Report
Final November 2018 Page 156 of 342
Table 13-34 Specific weight – samples GS and TransAP
Specific weight (g/cm3)
Sample Median Standard deviation
GS 1.89 0.01
TransAP 1.93 0.04
Table 13-35 Bond Impact Work Index – samples GS and TransAP
Impact Work Index (kWh/t)
Sample Median Standard deviation
GS 2.71 1.37
TransAP 1.54 0.61
The Impact Work Index mean value for samples GS and TransAP, respectively 1.37 kWh/t and 0.61 kWh/t, are extremely low, which thus indicate extremely low crushing resistance. The relatively high standard deviation indicates a relatively high variability in such a property among the tested samples.
Point load test
GS-B and TransAP samples were also tested to estimate the respective UCS, in this case using PLT. The tests were conducted according to the standardised procedures, the latter described in Section 13.4.2.
Table 13-36 shows the consolidated results from the PLT tests, while Table 13-37 and Table 13-38 show the detailed results respectively for sample GS and TransAP.
It is important to emphasise that for many test specimens, especially for the TransAP sample, it was necessary to estimate the rupture load, given that those values were below equipment sensitivity.
Table 13-36 PLT results
Sample UCS (MPa)
Lower limit Mean value Upper limit
GS sample 7.8 8.8 9.8
TransAP sample 3.0 3.4 3.7
The estimated UCS for GS sample was 8.8 MPa, while for TransAP sample the calculated UCS was 3.4 MPa.
Table 13-37 PLT results – GS sample
Specimen no.
Area (mm2)
D3 (mm)
Failure load (kN)
F Is
(MPa) Is(50)
(MPa)
UCS (MPa)
Lower limit Mean value Upper limit
1 2,161 52.5 1.0 1.02 0.4 0.4 7.4 8.4 9.3
2 2,433 55.7 1.0 1.05 0.3 0.3 6.8 7.6 8.5
3 2,161 52.5 1.5 1.02 0.5 0.6 11.1 12.5 13.9
4 2,074 51.4 1.0 1.01 0.4 0.4 7.7 8.6 9.6
5 1,940 49.7 1.0 1.00 0.4 0.4 8.1 9.1 10.1
6 2,246 53.5 1.0 1.03 0.3 0.3 7.2 8.1 9.0
7 2,340 54.6 1.0 1.04 0.3 0.3 7.0 7.9 8.7
8 1,980 50.2 1.0 1.00 0.4 0.4 7.9 8.9 9.9
9 2,205 53.0 0.5 1.03 0.2 0.2 3.7 4.1 4.6
10 2,250 53.5 1.5 1.03 0.5 0.5 10.8 12.1 13.5
Average 7.8 8.8 9.8

Horizonte Minerals Plc Araguaia Nickel Project Technical Report
Final November 2018 Page 157 of 342
Table 13-38 PLT results – TransAP sample
Specimen no.
Area (mm2)
D3 (mm)
Failure load (kN)
F Is
(MPa) Is(50)
(MPa)
UCS (MPa)
Lower limit Mean value Upper limit
1 3,600 67.7 0.5 1.15 0.1 0.1 2.5 2.8 3.1
2 2,475 56.1 0.5 1.05 0.2 0.2 3.3 3.8 4.2
3 2,700 58.6 0.5 1.07 0.1 0.2 3.1 3.5 3.9
4 3,240 64.2 0.5 1.12 0.1 0.1 2.7 3.1 3.4
5 3,803 69.6 0.5 1.16 0.1 0.1 2.4 2.7 3.0
6 2,700 58.6 0.5 1.07 0.1 0.2 3.1 3.5 3.9
7 2,228 53.3 0.5 1.03 0.2 0.2 3.6 4.1 4.5
8 2,970 61.5 0.5 1.10 0.1 0.1 2.9 3.3 3.6
9 2,862 60.4 0.5 1.09 0.1 0.1 3.0 3.4 3.7
Average 3.0 3.4 3.7
Crushing test
The primary crusher’s Closed Side Setting (CSS) was 50 mm while the secondary crusher’s CSS was 20 mm. The tertiary stage was not necessary since secondary stage’s product was 100 wt% under 30 mm, as stated on Section 13.4.2.
The top size and P80 of each stage, for both samples, are:
• Feed (GS) – TS 152 mm; P80 22.2 mm
• BR 1 (GS) – TS 76.2 mm; P80 19.9 mm
• Class. O/S (GS) – TS 76.2 mm; P80 56.1 mm
• Class. U/S (GS) – TS 30.0 mm; P80 10.4 mm
• BR 2 (GS) – TS 25.4 mm; P80 20.9 mm
• Product (GS) – TS 25.4 mm; P80 9.27 mm
• Feed (TransAP) – TS 101.6 mm; P80 1.98 mm
• BR 1 (TransAP) – TS 76.2 mm; P80 3.45 mm
• Class. O/S (TransAP) – TS 76.2 mm; P80 48.4 mm
• Class. U/S (TransAP) – TS 30.0 mm; P80 0.779 mm
• BR 2 (TransAP) – TS 25.4 mm; P80 1.98 mm
• Product (TransAP) – TS 25.4 mm; P80 1.45 mm.
13.4.4 Jenike & Johanson flow property test samples
Tests were run on the bulk samples that were taken during the trial mining program (2017) (TransAP and GS). The results of the flow property testing were used for the equipment plant equipment design. Their as received and adjusted moisture contents’ (mc) are summarised in Table 13-39. The saturation moisture content at a 14 m Effective Head (EH), used to determine adjusted moisture contents for testing, is also provided in the table below.
Three buckets of each sample were received, with a total of 60.9 kg of nickel ore GS, and 59.77 kg of the nickel ore TransAP. After the tests at full size, each sample was sieved and only the fines fraction (-6.3 mm) was used for the remaining tests. The weight of the fine fraction was measured resulting in 46.1 kg of nickel ore GS, and 47.6 kg of nickel ore TransAP, corresponding to 76 wt% <6.3 mm and 80 wt% <6.3 mm, for each sample, respectively.
Moisture values were determined by drying small samples at 107°C for two hours in a forced convection oven. The loss in weight of each sample, divided by its original weight before drying, is denoted as the moisture.

Horizonte Minerals Plc Araguaia Nickel Project Technical Report
Final November 2018 Page 158 of 342
Table 13-39 Summary of the conditions at which tests were performed
Material Moisture content (wt%)
Tested Tests conducted As received Saturation
Nickel ore — GS, full size 23 wt% not measured 23 wt% 2
23 wt% 1, 3, 4
Nickel ore — GS, -6.3 mm 23 wt% 36 wt% 29 wt% 1, 3, 4
32 wt% 1, 3, 4
Nickel ore — TransAP, full size 27 wt% not measured 27 wt% 2
26 wt% 1, 3, 4
Nickel ore — TransAP, -6.3 mm 26 wt% 39 wt% 31 wt% 1, 3, 4
35 wt% 1, 3, 4
Summary of flow properties
Highlights of the test results are discussed below for illustration of the materials’ flow and/or particle properties.
Density tests
Particle density was measured by a liquid displacement method in water using a graduated cylinder. The bulk density of most bulk solids varies with consolidating pressure. Loose and tapped densities were measured for the full-size sample. Ranges of densities were measured via consolidation for the fine fractions at each moisture content level. Results are summarised in Table 13-40 and Table 13-41.
Table 13-40 Bulk mass density – bulk material 1 (TransAP)
Effective Head m 0.2 0.5 1 2.5 5 10
σ1 kPa 1.98 5.02 10.3 26.92 56.5 119.5
ρ kg/m3 1010 1020 1050 1100 1150 1220
Table 13-41 Bulk density test results summary
Material
Moisture Content
(Vo)
Measured range via consolidation
(kg/m3)
Particle density
(kg/m3)
Loose/Tapped density (kg/m3)
Nickel Ore – GS, full size 23 wt% n/a n/a 1,231 / 1,299
23 wt% 919 - 1,230 n/a
Nickel Ore – GS, -6.3 mm 29 wt% 740 - 1,370 2,156 n/a
32 wt% 696 - 1,460 n/a
Nickel Ore – TransAP, full size 27 wt% n/a n/a 1,025 / 1,195
26 wt% 950 - 1,220 n/a
Nickel Ore – TransAP, -6.3 mm 31 wt% 795 - 1,330 2,214 n/a
35 wt% 714 - 1,430 n/a
Angle of repose test
Table 13-42 provides the results from angle of repose tests for both materials. Note that a range has been provided; this reflects the change in angle from the base of the pile to its top, as well as around the pile’s circumference.

Horizonte Minerals Plc Araguaia Nickel Project Technical Report
Final November 2018 Page 159 of 342
Table 13-42 Angle of repose results summary (degrees from horizontal)
Material Moisture content Angle of repose (average) Angle of repose (range)
Nickel ore – GS, -6.3 mm
23 wt% 33° 31–34°
29 wt% 32° 30–34°
32 wt% 37° 34–42°
Nickel ore – TransAP, -6.3 mm
26 wt% 28° 25–32°
31 wt% 29° 28–30°
35 wt% 31° 30–35°
13.5 Conclusions and recommendations
The integrated RKEF pilot campaign safely and successfully processed through the pilot dryer/agglomerator, RKEF, a total of 119 wet tonnes of ANS ore, producing high-quality FeNi in two phases each, on a continuous and sustained basis to commercial specification (additional tonnages ore were also processed just through the dryer). The bulk sample used for this test was representative of the ore which the HZM anticipates will be processed during the life of Araguaia. The pilot campaign was considered representative of the planned commercial operation treating ANS ore. The pilot plant ran 24 hours/day over a period of approximately 10 days in two phases.
The main conclusions are as follows:
• The pilot plant campaign confirmed the production of high quality commercial FeNi from a representative ANS ore bulk sample; no critical flaws were identified in the proposed process flowsheet based on the testwork.
• Drying and agglomeration of the ore in the pilot dryer/agglomerator produced excellent dryer product containing very few fines for processing in the high temperature rotary kiln calciner and pre-reduction stage.
• Good quality calcine was continuously produced in the rotary kiln with very low dust generation and favourable pre-reduction levels of close to 60 wt%.
• Electric furnace smelting of the calcine produced high-quality FeNi over a target range of commercial nickel grades ranging from 17 wt% Ni to 34 wt% Ni (range after the first two taps). The average wt% Ni in slag ranged from 0.12 wt% Ni for 25 wt% Ni in FeNi to 0.15 wt% Ni for 30 wt% Ni in FeNi; these levels were also consistent with data from commercial FeNi plants in Brazil (Figure 13-13). Based on the average projected ore composition for the commercial plant for the first 10 years, considering a FeNi grade of 30 wt% Ni, and using the level of 0.15 wt% Ni in slag obtained in the testwork for this grade and also assuming minimal other losses based on the low dust levels observed in the testwork, the Ni recovery is then calculated to 93 wt%; both ingot casting and granulation of the FeNi product was successfully demonstrated in the pilot test.
• Glencore (previously Xstrata) carried out laboratory and pilot plant scale metallurgical testwork on a range of samples of Serra do Tapa and VDS ores. A review of the ANN and ANS ores show they have similar assays, composition and material properties. The pilot scale testwork on Serra do Tapa ore produced high quality commercial grade FeNi similar to the product from ANS.
• The slag liquidus range from the smelting slag produced by the smelting of these two nickel laterite ores was found to be similar and they have similar liquidus ranges. The testwork therefore showed that these ores have similar metallurgical characteristics and should behave in very much the same way under similar conditions in the commercial plant.
Two bulk samples were obtained from the trial mining pit in 2017 and sent to HDA and J&J for specific property testwork. The conclusions from this testwork follows:
• The moistures determined by HDA for the two bulk samples “GS” and “TransAP” was 22 wt% and 34 wt% respectively. Typically, the experience at existing operating plants is that moisture received at the plant is in the range of 30 wt% to 34 wt%. 34 wt% was assumed in the FS for the ROM at the plant, which is consistent with the TransAP sample moisture listed above.

Horizonte Minerals Plc Araguaia Nickel Project Technical Report
Final November 2018 Page 160 of 342
• Typically, moistures in situ at the mine at other laterite operations have been observed as up to 40 wt% moisture. The moisture saturation tests by J&J on the bulk mining samples showed 32 wt% moisture on the GS sample and 39 wt% moisture on the TransAP sample that is also consistent with expectations and assumptions made in the FS design.
• The size analysis of the two bulk samples from the test pit as determined at the HDA facility confirm that the ROM ore is somewhat finer than most other laterite ores. The GS sample had a p80 of ~22 mm and a p50 of ~2 mm; the TransAP sample was finer with a p80 of ~2 mm and a p50 of 0.04 mm. For example, this can be compared with equivalent laterite samples measured in Indonesia that had a p80 of ~15 mm and p50 of ~5 mm.
• The test pit samples exhibit exceptionally low abrasion index values which is good news for the materials handling and crushing equipment designed to handle this material.
• The Bond Impact Work Index tests for the two samples gave extremely low results which mean the rock components will break and crush easily. This was confirmed with the point load test results.
• The crushing tests for the two samples showed that the +25 mm in the primary crusher product was ~15 wt% of the overall sample for the GS sample and only about 5% of the sample for the TransAP sample. The FS design criteria has assumed 30 wt% +25 mm in this stream. However, in the FS design, the screen between the primary and secondary crusher was eliminated because of the concern that it will easily blind with the wet sticky laterite. As a result, the secondary crusher is sized to take the full ore flowrate.
• J&J measured solids density. The GS sample (-6.3 mm) at 32 wt% H2O had a density range of 0.7 t/m3 to 1.46 t/m3 after consolidation; the TransAP sample (-6.3 mm) at 31 wt% H2O had a density range of 0.8 t/m3 to 1.33 t/m3. The bulk densities assumed for the FS for ROM ore is 1.25 t/m3 nominal, 1.7 t/m3 design.
• The angle of repose tests for the two bulk samples gave ranges of 34 to 42 for the GS (-6.3 mm)
sample at 32 wt% H2O and 28 to 35 for the TransAP sample at 31 wt% to 35 wt% H2O. The FS
used a range of 38 to 41 based on information from other laterite operations which is acceptable based on the J&J test results.
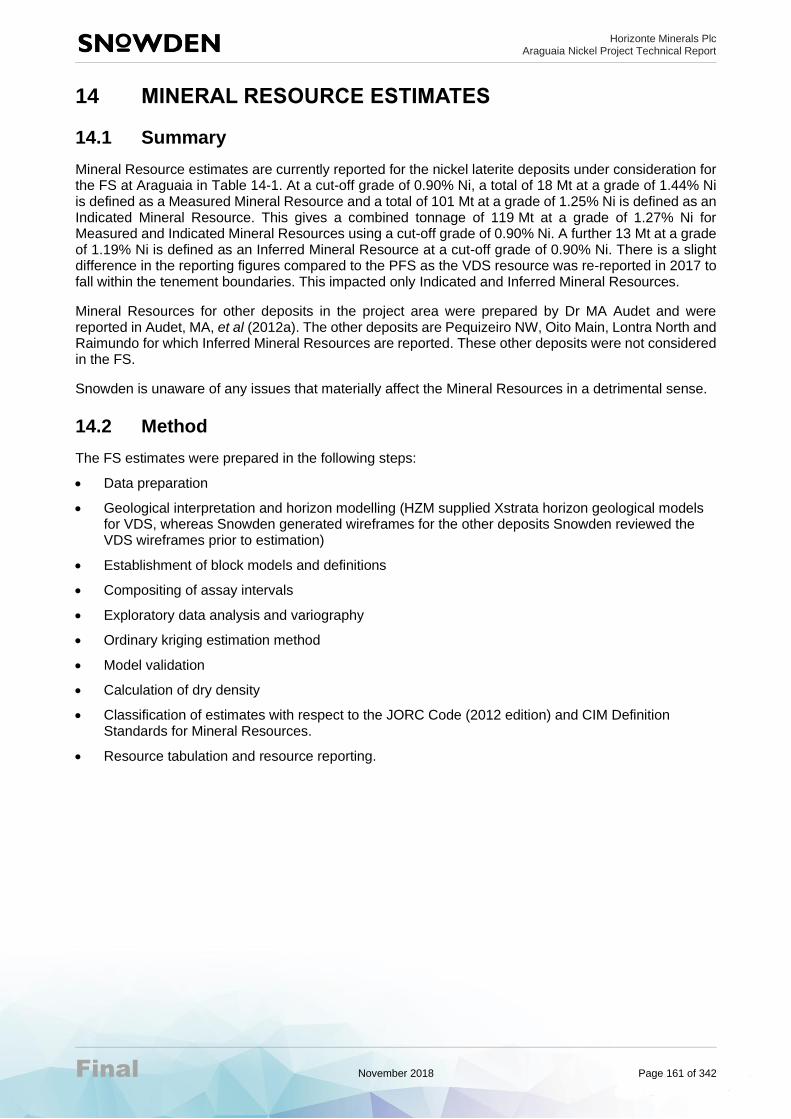
Horizonte Minerals Plc Araguaia Nickel Project Technical Report
Final November 2018 Page 161 of 342
14 MINERAL RESOURCE ESTIMATES
14.1 Summary
Mineral Resource estimates are currently reported for the nickel laterite deposits under consideration for the FS at Araguaia in Table 14-1. At a cut-off grade of 0.90% Ni, a total of 18 Mt at a grade of 1.44% Ni is defined as a Measured Mineral Resource and a total of 101 Mt at a grade of 1.25% Ni is defined as an Indicated Mineral Resource. This gives a combined tonnage of 119 Mt at a grade of 1.27% Ni for Measured and Indicated Mineral Resources using a cut-off grade of 0.90% Ni. A further 13 Mt at a grade of 1.19% Ni is defined as an Inferred Mineral Resource at a cut-off grade of 0.90% Ni. There is a slight difference in the reporting figures compared to the PFS as the VDS resource was re-reported in 2017 to fall within the tenement boundaries. This impacted only Indicated and Inferred Mineral Resources.
Mineral Resources for other deposits in the project area were prepared by Dr MA Audet and were reported in Audet, MA, et al (2012a). The other deposits are Pequizeiro NW, Oito Main, Lontra North and Raimundo for which Inferred Mineral Resources are reported. These other deposits were not considered in the FS.
Snowden is unaware of any issues that materially affect the Mineral Resources in a detrimental sense.
14.2 Method
The FS estimates were prepared in the following steps:
• Data preparation
• Geological interpretation and horizon modelling (HZM supplied Xstrata horizon geological models for VDS, whereas Snowden generated wireframes for the other deposits Snowden reviewed the VDS wireframes prior to estimation)
• Establishment of block models and definitions
• Compositing of assay intervals
• Exploratory data analysis and variography
• Ordinary kriging estimation method
• Model validation
• Calculation of dry density
• Classification of estimates with respect to the JORC Code (2012 edition) and CIM Definition Standards for Mineral Resources.
• Resource tabulation and resource reporting.
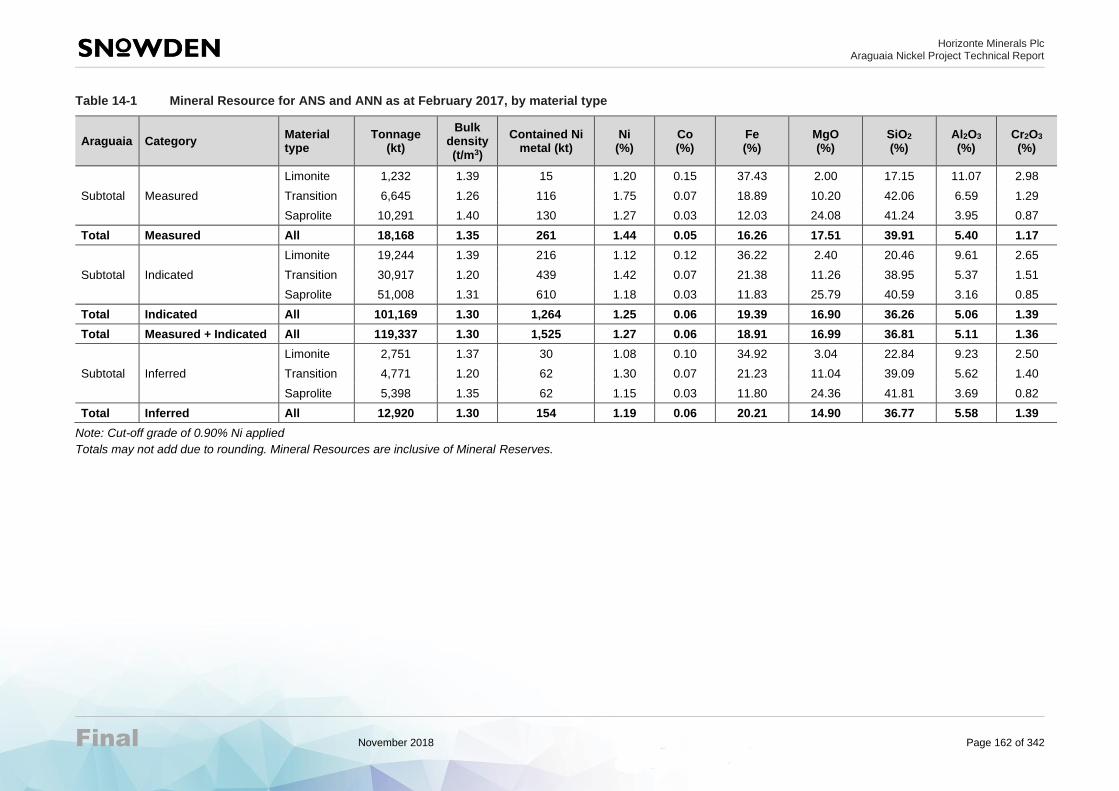
Horizonte Minerals Plc Araguaia Nickel Project Technical Report
Final November 2018 Page 162 of 342
Table 14-1 Mineral Resource for ANS and ANN as at February 2017, by material type
Araguaia Category Material type
Tonnage (kt)
Bulk density (t/m3)
Contained Ni metal (kt)
Ni (%)
Co (%)
Fe (%)
MgO (%)
SiO2 (%)
Al2O3 (%)
Cr2O3 (%)
Subtotal Measured
Limonite 1,232 1.39 15 1.20 0.15 37.43 2.00 17.15 11.07 2.98
Transition 6,645 1.26 116 1.75 0.07 18.89 10.20 42.06 6.59 1.29
Saprolite 10,291 1.40 130 1.27 0.03 12.03 24.08 41.24 3.95 0.87
Total Measured All 18,168 1.35 261 1.44 0.05 16.26 17.51 39.91 5.40 1.17
Subtotal Indicated
Limonite 19,244 1.39 216 1.12 0.12 36.22 2.40 20.46 9.61 2.65
Transition 30,917 1.20 439 1.42 0.07 21.38 11.26 38.95 5.37 1.51
Saprolite 51,008 1.31 610 1.18 0.03 11.83 25.79 40.59 3.16 0.85
Total Indicated All 101,169 1.30 1,264 1.25 0.06 19.39 16.90 36.26 5.06 1.39
Total Measured + Indicated All 119,337 1.30 1,525 1.27 0.06 18.91 16.99 36.81 5.11 1.36
Subtotal Inferred
Limonite 2,751 1.37 30 1.08 0.10 34.92 3.04 22.84 9.23 2.50
Transition 4,771 1.20 62 1.30 0.07 21.23 11.04 39.09 5.62 1.40
Saprolite 5,398 1.35 62 1.15 0.03 11.80 24.36 41.81 3.69 0.82
Total Inferred All 12,920 1.30 154 1.19 0.06 20.21 14.90 36.77 5.58 1.39
Note: Cut-off grade of 0.90% Ni applied
Totals may not add due to rounding. Mineral Resources are inclusive of Mineral Reserves.

Horizonte Minerals Plc Araguaia Nickel Project Technical Report
Final November 2018 Page 163 of 342
14.3 Drillhole data
HZM drillhole data from Phase 3 and Phase 4 programs were used in FS Mineral Resource Estimates at ANS.
The ANS Phase 4 drilling program resulted in updated databases for areas PQZ and JAC. Snowden updated the previous wireframes for these areas with the new drilling using Datamine Studio 3 software. The Phase 4 drilling databases were supplied by HZM in CSV format. Snowden updated the relevant tables by importing collar surveys, sample identifiers and assays. Validation routines were run inside Datamine Studio 3 to identify any discrepancies such as duplicate or missing records, and no significant issues were identified.
No Phase 4 drilling was completed for areas PQW, VOE, VOW and VOI; therefore, these databases have not been updated since the Phase 3 drilling. For this Phase 3 drilling data, HZM provided Snowden with a series of GEMS project databases that were compiled by Dr MA Audet. Snowden updated the relevant tables by importing collar surveys, sample identifiers and assays for the new infill drilling. Validation routines were run inside GEMS to identify any discrepancies such as duplicate or missing records, and no significant issues were identified.
No drilling was carried out by HZM in the BAI area since an earlier estimate reported in 2012. In 2013, for consistency, Snowden re-estimated the Mineral Resource for the BAI area using data supplied by HZM, prepared earlier by Dr MA Audet.
No drilling was carried by HZM for VDS, HZM supplied Snowden with data in an Access database complied by Glencore/Xstrata. Snowden imported the relevant tables into Datamine Studio 3 by importing collar surveys, sample identifiers and assays. Validation routines were run inside Datamine Studio 3 to identify any discrepancies such as duplicate or missing records, and no significant issues were identified.
For the ANS deposits, prior to interpretation verification was carried out of the supplied surveyed drillhole collar elevations against the surface topography digital terrain models (DTMs) provided by HZM. Any discrepancies were rectified by pressing the drillhole collar against the surface topography DTM. For the VDS (ANN) deposit, inspection of the surface topography wireframe revealed discrepancies with respect to the surveyed drillhole collar elevations. In this case, Snowden elected to generate a new surface topography wireframe from the surveyed drillhole collar elevations.
14.4 Geological interpretation and horizon modelling
14.4.1 ANS
The major constituent chemistry together with the supplied geological maps in PDF format were used to guide the 3D interpretation of digital surfaces to constrain the distribution of drilled limonite, transition and saprolite horizons between the surface topography and bedrock.
The major constituent chemistry of each sample was used by Dr MA Audet to assign a facies code (limonite, transition, saprolite or fresh rock) for each sample interval. The resultant codes were then grouped and internally adjusted by Snowden to ensure a logical sequence of horizons existed for each drillhole.
For PQW, VOW, VOI, and VOE areas the facies codes were imported by Snowden into a GEMS table and the base elevation of each horizon (limonite, transition and saprolite) was used to generate 3D surfaces by way of the Laplace algorithm provided by GEMS. The horizon surfaces and coded drillhole assays were exported from GEMS and then imported to Datamine Studio 3 software for compositing.
For PQZ and JAC areas following the Phase 4 drilling, Snowden generated surfaces in Datamine Studio 3 by sectional interpretation.

Horizonte Minerals Plc Araguaia Nickel Project Technical Report
Final November 2018 Page 164 of 342
14.4.2 ANN
For VDS, wireframes formerly generated by Glencore in GEMS were supplied by HZM. Snowden reviewed and validated the wireframes before use and found no significant issues.
14.4.3 General
Horizon surface extrapolations were constrained by a distance of 25 m from the perimeter drillholes. In the case of VOE, a 3D wireframe was interpreted for a barren dyke, based on the supplied geological map and drillhole information. For VDS wireframes for the barren silexite/metasediment/talc unit were supplied. These supplied wireframes needed some minor adjustments to get them into a usable format.
Snowden retained the triangulated horizon surfaces for BAI that were modelled by Dr MA Audet during 2011, since there are no additional Phase 3 or Phase 4 drillholes for this area.
A consistent set of codes was used to define limonite (100), transition (200), saprolite (300), fresh rock (500), dyke (450, at VOE) and a combination of silexite, metasediments and talc (600) at VDS. Only limonite, transition and saprolite are mineralised and hence grades were not estimated into the other domains.
14.5 Compositing of assay intervals
Compositing was run within the coded horizon fields to ensure that no composite intervals crossed any lithological or grade boundaries. To allow for uneven sample lengths within each of the horizons, the Datamine composite process was run using the variable sample length method. This adjusts the sample intervals, where necessary, to ensure all samples are included in the composite file (i.e. no residuals) while keeping the sample interval as close to the desired sample interval as possible.
The compositing process was checked by:
• Comparing the lists of horizon domain values in the raw and composite files, which matched.
• Comparing the sample length statistics in the raw and composite files. The two total length values matched and the mean composite interval was 1 m.
14.6 Exploratory data analysis – summary statistics
Basic statistical parameters for elements and oxides (as % grade) for each area were undertaken and reported. An assessment of the Coefficient of Variation (CV – ratio of the standard deviation to the mean) parameter resulted in the decision to top cut selected constituents (CaO, MgO, Co) during grade estimation for some horizons. The top cut values and percentage of sample cut are provided in Table 14-2.

Horizonte Minerals Plc Araguaia Nickel Project Technical Report
Final November 2018 Page 165 of 342
Table 14-2 Top cuts applied during grade estimation
Area Horizon CaO top-cut (%)
No. affected (%)
MgO top-cut (%)
No. affected (%)
Co top-cut (%)
No. affected (%)
VOW 100 0.14 0.50 10.00 1.50 - -
VOW 200 0.50 3.30 - - - -
VOW 300 0.35 2.80 - - - -
VOI 100 0.15 1.00 7.20 1.90 - -
VOI 300 0.70 1.90 - - - -
VOE 100 0.36 0.01 9.00 0.10 - -
VOE 300 0.80 2.70 - - - -
JAC 100 - - 12.50 1.11 - -
JAC 300 3.00 1.12 - - - -
PQZ 100 0.25 0.34 5.00 3.79 - -
PQZ 300 1.30 1.02 - - - -
PQW 100 0.14 1.50 4.00 - 0.30 0.20
PQW 200 0.50 2.20 - - - -
PQW 300 1.00 1.30 - - - -
BAI 100 0.30 0.40 15.00 0.50 - -
BAI 200 1.20 0.50 - - - -
BAI 300 4.00 0.60 - - - -
VDS 100 0.25 0.54 10.00 0.66 - -
VDS 200 0.35 1.07 - - - -
VDS 300 8.00 0.51 - - - -
14.7 Variography
Variograms were generated to assess the grade continuity of the various constituents and as inputs to the ordinary kriging algorithm used to interpolate grades. Snowden Supervisor v.8 software was used to generate and model the variograms.
Laterite deposits occur often as low-lying hills, with the laterite profile effectively following the profile of the hill and weathering fronts. This, together with variable thicknesses of individual horizons and vertical grade trends, results in undulating geometries which present issues for effective grade interpolation using traditional 3D methods. Snowden therefore elected to use the Datamine Unfold process to address the impact of the undulations on the modelling of variograms and the estimation of grades. Unfolding improves the grade estimation process as it transforms the sample coordinates to assist in preserving vertical grade trends. This allows variogram analysis and grade estimation to be carried out using the pre-folding coordinates, which are then converted back to the folded (local) coordinate system. The unfolding process results in more samples being available for variogram modelling and grade estimation than would have been the case if standard resource estimation methods were used.
Variograms for unfolded nickel (Ni), cobalt (Co), iron (Fe) and oxide constituents (Al2O3, CaO, Cr2O3, MgO, MnO, SiO2) were developed for each horizon and area, provided the data density was sufficient to support robust variograms. In the case of PQW, variograms were adopted from the adjacent PQZ deposit, with the major direction of continuity adjusted to 115° in line with the local geology. All variograms were modelled using the following general approach:
• The drillhole composites were unfolded and modelled using the unfolded coordinate fields.
• All variograms were standardised to a sill of one.
• Variograms were modelled using spherical variograms with a nugget effect and two structures. Snowden found that most nuggets derived from the downhole direction were exceedingly low which is expected in the nickel laterite environment.
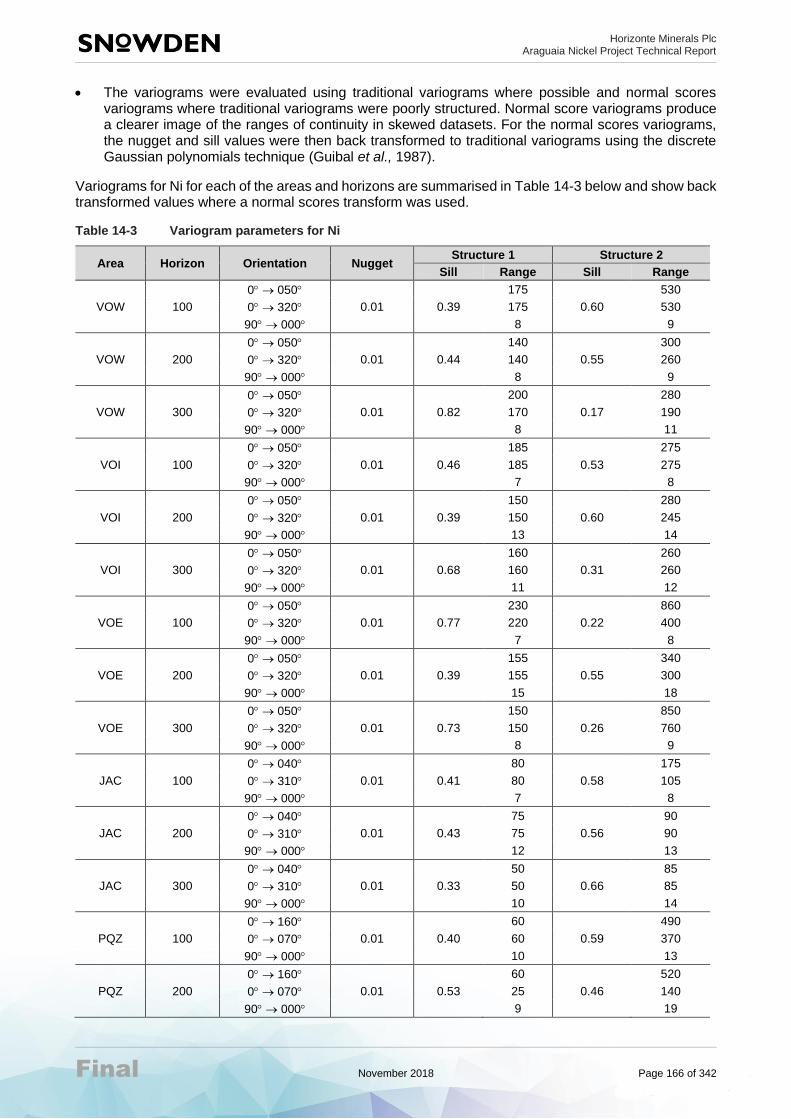
Horizonte Minerals Plc Araguaia Nickel Project Technical Report
Final November 2018 Page 166 of 342
• The variograms were evaluated using traditional variograms where possible and normal scores variograms where traditional variograms were poorly structured. Normal score variograms produce a clearer image of the ranges of continuity in skewed datasets. For the normal scores variograms, the nugget and sill values were then back transformed to traditional variograms using the discrete Gaussian polynomials technique (Guibal et al., 1987).
Variograms for Ni for each of the areas and horizons are summarised in Table 14-3 below and show back transformed values where a normal scores transform was used.
Table 14-3 Variogram parameters for Ni
Area Horizon Orientation Nugget Structure 1 Structure 2
Sill Range Sill Range
0 → 050 175 530
VOW 100 0 → 320 0.01 0.39 175 0.60 530
90 → 000 8 9
0 → 050 140 300
VOW 200 0 → 320 0.01 0.44 140 0.55 260
90 → 000 8 9
0 → 050 200 280
VOW 300 0 → 320 0.01 0.82 170 0.17 190
90 → 000 8 11
0 → 050 185 275
VOI 100 0 → 320 0.01 0.46 185 0.53 275
90 → 000 7 8
0 → 050 150 280
VOI 200 0 → 320 0.01 0.39 150 0.60 245
90 → 000 13 14
0 → 050 160 260
VOI 300 0 → 320 0.01 0.68 160 0.31 260
90 → 000 11 12
0 → 050 230 860
VOE 100 0 → 320 0.01 0.77 220 0.22 400
90 → 000 7 8
0 → 050 155 340
VOE 200 0 → 320 0.01 0.39 155 0.55 300
90 → 000 15 18
0 → 050 150 850
VOE 300 0 → 320 0.01 0.73 150 0.26 760
90 → 000 8 9
0 → 040 80 175
JAC 100 0 → 310 0.01 0.41 80 0.58 105
90 → 000 7 8
0 → 040 75 90
JAC 200 0 → 310 0.01 0.43 75 0.56 90
90 → 000 12 13
0 → 040 50 85
JAC 300 0 → 310 0.01 0.33 50 0.66 85
90 → 000 10 14
0 → 160 60 490
PQZ 100 0 → 070 0.01 0.40 60 0.59 370
90 → 000 10 13
0 → 160 60 520
PQZ 200 0 → 070 0.01 0.53 25 0.46 140
90 → 000 9 19

Horizonte Minerals Plc Araguaia Nickel Project Technical Report
Final November 2018 Page 167 of 342
Area Horizon Orientation Nugget Structure 1 Structure 2
Sill Range Sill Range
0 → 160 25 180
PQZ 300 0 → 070 0.01 0.51 20 0.48 100
90 → 000 7 9
0 → 115 155 800
PQW 100 0 → 025 0.01 0.47 155 0.52 300
90 → 000 8 9
0 → 115 70 540
PQW 200 0 → 025 0.03 0.67 30 175 0.30
90 → 000 8 9
0 → 115 110 630
PQW 300 0 → 025 0.01 0.65 45 0.34 135
90 → 000 9 10
0 → 140 55 135
BAI 100 0 → 050 0.01 0.89 50 0.10 135
90 → 000 6 7
0 → 140 35 500
BAI 200 0 → 050 0.29 0.55 35 0.16 500
90 → 000 6 12
0 → 140 40 140
BAI 300 0 → 050 0.01 0.72 40 0.27 140
90 → 000 4 18
0 → 160 10 75
VDS 100 0 → 070 0.01 0.50 10 0.49 75
90 → 000 5 6
0 → 160 100 1450
VDS 200 0 → 070 0.01 0.51 100 0.48 450
90 → 000 14 16
0 → 160 50 425
VDS 300 0 → 070 0.01 0.81 50 0.18 130
90 → 000 10 11
14.8 Estimation
14.8.1 Block model definitions
The final model extents are listed in Table 14-4. The sample density (drillhole spacing 100 mE x 100 mN at VOW, VOI, VOE, PQW and BAI, 50 mE x 50 mN at PQZ and JAC, 40 mE x 40 mN at VDS) was considered when selecting the parent cell size of 25 m x 25 m x 2 m (XYZ). In the vertical direction, the parent cell size of 2 mRL reflects the likely mining bench height.
Table 14-4 Block model definitions
Model definition VOW VOI VOE JAC PQZ PQW BAI VDS
X origin (mE) 677300 680500 684600 675400 673700 671700 675000 687300
Y origin (mN) 9127000 9127600 9128800 9123050 9114300 9116500 9108900 9226700
Z origin (mRL) 200 100 150 150 200 220 180 100
Maximum easting (mE) 679700 683600 686200 676500 678100 672900 677700 690750
Maximum northing (mN) 9129400 9129800 9130000 9124100 9116600 9117600 9113300 9232000
Maximum elevation (mRL) 400 400 300 350 310 310 400 400
Sub-celling to 6.25 mE x 6.25 mN x 0.5 mRL was employed to honour the horizon wireframes.

Horizonte Minerals Plc Araguaia Nickel Project Technical Report
Final November 2018 Page 168 of 342
14.8.2 Estimation method
Datamine software was used to unfold the composite data and estimate grades using ordinary kriging. Grades were estimated using variogram models for each attribute grouped by horizon. Hard boundary conditions were used to preserve the chemistry of each horizon.
14.8.3 Search parameters
For each area, the same search ellipse ranges and axis rotations were used with each of the grade estimates in order to maintain the ratios of the various constituents (metal balance) as consistent as possible. The search ellipse axis lengths were derived from the variogram modelling.
The distribution and density of the various attribute values within each of the domains are quite variable in areas around the edges of the mineralisation and for the transition horizon which is often thin and highly variable in thickness. As such if a single search ellipse was applied for the estimation process then a significant proportion of cells within the interpreted horizons would not be informed for all of the grade fields. To ensure that each cell within the horizons includes an estimated grade value, a dynamic search volume approach using three search passes was used as described in the following section.
14.8.4 Estimation settings summary
The key search ellipse and estimation parameters have been summarised in Table 14-5, to Table 14-7.
Table 14-5 Estimation parameters – VOW, VOI, VOE, JAC, PQW and BAI
Estimation setting Description/setting
Drillholes Unfolded and coded drilling data in Datamine format with top cuts applied for selected variables
Boundary conditions Hard horizon boundaries for all estimates
Top cuts Applied to CaO, MgO and Co (Section 14.6)
Search ellipsoid Based on variograms ranges
Method Ordinary kriging (parent cell estimation) with unfolding)
Variograms See Section 14.7
Dynamic search volumes Yes
Minimum no. of samples – volume 1 5
Maximum no. of samples – volume 1 30
Search volume 2 factor 1
Minimum no. of samples – volume 2 2
Maximum no. of samples – volume 2 30
Search volume 3 factor 2
Minimum no. of samples – volume 3 1
Maximum no. of samples – volume 3 30
Octant searching No
Block discretisation (XYZ) 8 x 8 x 1

Horizonte Minerals Plc Araguaia Nickel Project Technical Report
Final November 2018 Page 169 of 342
Table 14-6 Estimation parameters – PQZ
Estimation setting Description/setting
Drillholes Unfolded and coded drilling data in Datamine format with top cuts applied for selected variables
Boundary conditions Hard horizon boundaries for all estimates
Top cuts Applied to CaO and MgO (Section 14.6)
Search ellipsoid Based on variograms ranges
Method Ordinary kriging (parent cell estimation) with unfolding)
Variograms See Section 14.7
Dynamic search volumes Yes
Minimum no. of samples – volume 1 5
Maximum no. of samples – volume 1 35
Search volume 2 factor 1
Minimum no. of samples – volume 2 2
Maximum no. of samples – volume 2 30
Search volume 3 factor 2
Minimum no. of samples – volume 3 1
Maximum no. of samples – volume 3 30
Octant searching No
Block discretisation (XYZ) 8 x 8 x 2
Table 14-7 Estimation parameters – VDS
Estimation setting Description/setting
Drillholes Unfolded and coded drilling data in Datamine format with top cuts applied for selected variables
Boundary conditions Hard horizon boundaries for all estimates
Top cuts Applied to CaO and MgO (Section 14.6)
Search ellipsoid Based on variograms ranges
Method Ordinary kriging (parent cell estimation) with unfolding)
Variograms See Section 14.7
Dynamic search volumes Yes
Minimum no. of samples – volume 1 5
Maximum no. of samples – volume 1 20
Search volume 2 factor 1
Minimum no. of samples – volume 2 2
Maximum no. of samples – volume 2 20
Search volume 3 factor 2
Minimum no. of samples – volume 3 1
Maximum no. of samples – volume 3 20
Octant searching No
Block discretisation (XYZ) 8 x 8 x 2
14.8.5 Model validation
The estimates were validated using:
• A visual comparison of the block grade estimates and the drillhole composite data.
• Generation of vertical section and plan view plots of the estimates, naïve composite and declustered composite grades (where required), along with the number of composite samples available (slice or swath plots).
• A global comparison of the average composite (naïve and declustered) and estimated grades.

Horizonte Minerals Plc Araguaia Nickel Project Technical Report
Final November 2018 Page 170 of 342
• A comparison of the correlations between constituents within the input composite data and the block model grade estimates.
The conclusions from the model validation work are:
• Inspection of the slice plots shows, for regions where there are substantive input composite numbers, good agreement in grade trends.
• Visual comparison of the model grades and the corresponding drillhole composite grades shows a good outcome (<11% difference) for almost all constituents. The exceptions are for non-critical constituents: JAC 300 for CaO; VDS 100 for MgO and CaO; VOE 100 for CaO; BAI 100 for CaO and MgO, 200 for CaO; which all have high CVs.
• The estimated models adequately preserve the correlations observed in the input statistics.
14.9 Calculation of dry density
A combination of ANS (11,848) and ANN (1,720) density measurements, now totalling approximately 13,500 representative samples from each of the major laterite facies is summarised in Table 11-1 for ANS and Table 11-8 for ANN.
Snowden investigated the relationship between measured density and major chemistry of the density samples and derived formulae to allow block dry density to be calculated from major chemistry block estimates. Samples were sorted by horizon and Microsoft Excel’s LINEST (multiple linear regression) formula was then applied to create an equation for each horizon. The regression prediction was checked by calculating the regressed density values from actual assays: checking that the average calculated results were equal to the average of the density measurements; and comparing the predicted values with the actual density measurements by scatterplots.
14.10 Mineral Resource classification
14.10.1 Mineral Resource classification scheme
The Mineral Resource estimates were classified and reported in accordance with the 2012 Australasian Code for Reporting of Exploration Results, Mineral Resources and Ore Reserves (the JORC Code). The Mineral Resource estimates are reported at a nickel cut-off grade of 0.90% which compares with the mining cut-off grade of 1.28% determined in this FS.
Reasonable prospects for metal recovery by current technologies were reported by HZM:
• In Q1 2013, HZM reported the completion of an 18-month comprehensive metallurgical test program, which included work by FLS, the global leader in high temperature kiln technology, XPS, and KPM. The test program was designed to evaluate the expected ore performance in RKEF processing, and HZM were pleased to report that Araguaia ore was found to be suitable for treatment using this proven technology. Rotary kiln processing is a key step in the well-established RKEF pyro-metallurgical process that HZM are aiming to utilise at Araguaia and ANN. Smelting tests carried out by XPS on a number of ore blends showed that smelting Araguaia laterite can produce FeNi alloy and a low nickel slag. This work and additional testing by KPM confirmed the electric furnace conditions when producing a 15% Ni to 20% Ni grade of FeNi, and further confirmed the suitability of the RKEF process for producing a marketable grade of FeNi.
• An integrated RKEF pilot plant was successfully carried out on Araguaia ore in April-May 2015 confirming the suitability of the RKEF process for the treatment of this material, and at the same time providing technical process design data. The pilot plant located at the Morro nickel plant in Brazil processed about 160 t (wet) for a total of 10 days operating 24 hours/day, producing high-quality FeNi over a range of nickel grades and averaging about 30% Ni. The following process steps were piloted: feed preparation, drying and agglomeration, calcining in the rotary kiln producing good quality calcine, electric furnace smelting producing FeNi and slag, while a demonstrating a high nickel recovery. The campaign also successfully confirmed existing information established in small-scale testing, while providing a full range of technical data that has been incorporated in the FS.

Horizonte Minerals Plc Araguaia Nickel Project Technical Report
Final November 2018 Page 171 of 342
The Mineral Resource classification criteria were developed based on an assessment of the following items:
• Nature and quality of the drilling and sampling
• Drilling density
• Confidence in the understanding of the underlying geological and nickel grade continuity
• Analysis of the QAQC data
• Confidence in the estimate of the mineralised volume
• The results of model validation
• The criteria listed in Table 1 Section 1 and Section 3 of the JORC Code.
The resource classification scheme (whether Measured, Indicated or Inferred) adopted by Snowden for the 2017 ANS and ANN Mineral Resource estimate was based on the following.
For all deposits except VDS:
• Mineralisation was classified as a Measured Resource where the drilling density was 50 mE x 50 mN (or less)
• Mineralisation was classified as an Indicated Resource where the drilling density was 100 mE x 100 mN (or less)
• Mineralisation delineated using a drilling density larger than 100 mE x 100 mN and up to about 150 m spacing was classified as an Inferred Resource
• Mineralisation delineated using sparse drillhole spacings or outside of the mineralised envelope was not classified.
For VDS:
• Mineralisation was classified as a Measured Resource where the drilling density was 40 mE x 40 mN (or less)
• Mineralisation was classified as an Indicated Resource where the drilling density was 80 mE x 80 mN (or less)
• Mineralisation delineated using a drilling density up to about 160 mE x 160 mN spacing was classified as an Inferred Resource
• Mineralisation outside of the mineralised envelope was not classified
• The southern end of the VDS deposit where the 200 horizon mineralisation did not validate well, due to few samples below the 350 mRL, has been classified as an Inferred Resource.
Conditional simulation
Snowden completed conditional simulations for PQZ, VOI and JAC in order to understand the risk of estimates for grade and tonnage of several of the Araguaia nickel laterite deposits. The study is reported in the Snowden Araguaia Simulation Study completed in 2017 (Snowden, 2017).
The methodology involved running two-dimensional conditional simulations of nickel and thickness for each deposit. A 0.9% Ni cut-off was used to select the mineralised intervals for simulation. The simulations were re-blocked to an approximate quarterly production scale and the variability at the 90% confidence limits assessed. The results were analysed with respect to the classification applied to the Mineral Resource in each deposit.
Analysis from PQZ is presented in Figure 14-1 and Figure 14-2 to illustrate an example realisation for nickel and thickness.

Horizonte Minerals Plc Araguaia Nickel Project Technical Report
Final November 2018 Page 172 of 342
Figure 14-1 PQZ – plan view of example simulation (realisation 1) at node scale – nickel
Figure 14-2 PQZ – plan view of example simulation (realisation 1) at node scale – thickness
The results of analyses for each simulated deposit are summarised below:
PQZ:
• The PQZ Mineral Resource is classified as Measured Resources in areas with 50 m x 50 m drilling and Indicated Resources in areas with 100 m x 100 m drilling. Snowden considers that the current drillhole spacing adequately defines the nickel grade and that the grade variability presents a relatively low risk. The results show that at the 90% confidence limits, nickel grades within the Measured Resource area are typically within +/-10% to 15% of the mean at the quarterly production scale, which Snowden considers acceptable for a Measured Resource.
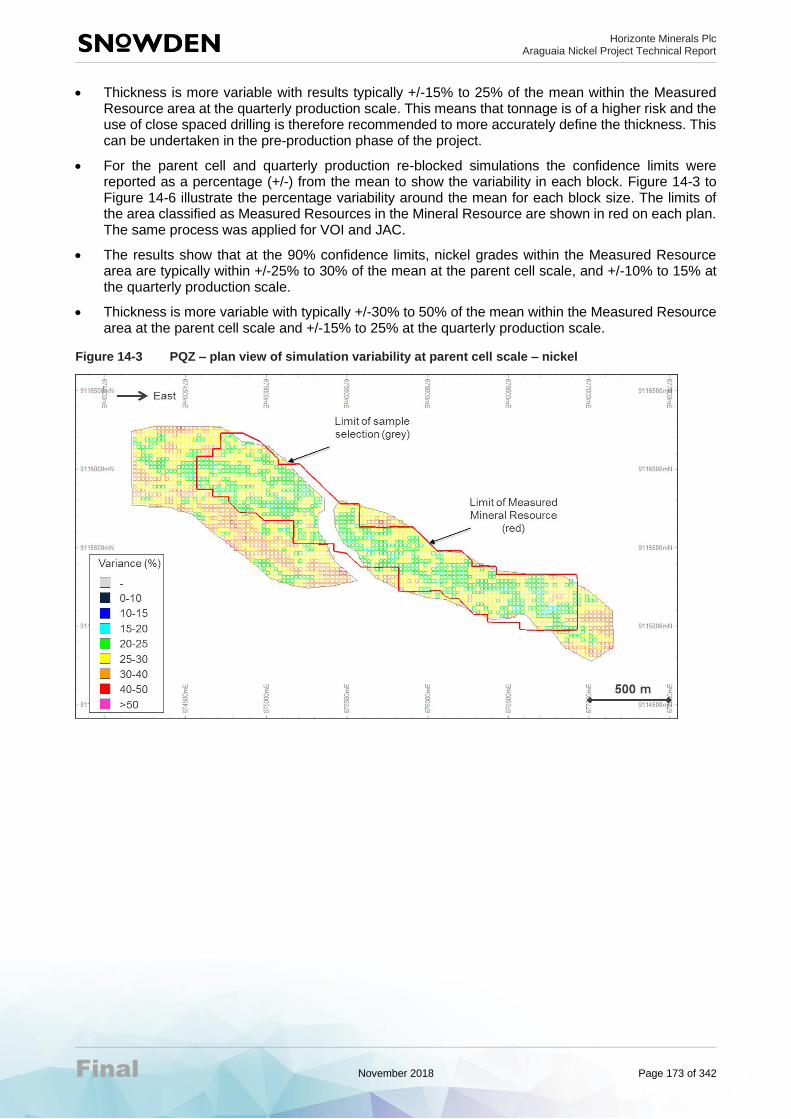
Horizonte Minerals Plc Araguaia Nickel Project Technical Report
Final November 2018 Page 173 of 342
• Thickness is more variable with results typically +/-15% to 25% of the mean within the Measured Resource area at the quarterly production scale. This means that tonnage is of a higher risk and the use of close spaced drilling is therefore recommended to more accurately define the thickness. This can be undertaken in the pre-production phase of the project.
• For the parent cell and quarterly production re-blocked simulations the confidence limits were reported as a percentage (+/-) from the mean to show the variability in each block. Figure 14-3 to Figure 14-6 illustrate the percentage variability around the mean for each block size. The limits of the area classified as Measured Resources in the Mineral Resource are shown in red on each plan. The same process was applied for VOI and JAC.
• The results show that at the 90% confidence limits, nickel grades within the Measured Resource area are typically within +/-25% to 30% of the mean at the parent cell scale, and +/-10% to 15% at the quarterly production scale.
• Thickness is more variable with typically +/-30% to 50% of the mean within the Measured Resource area at the parent cell scale and +/-15% to 25% at the quarterly production scale.
Figure 14-3 PQZ – plan view of simulation variability at parent cell scale – nickel

Horizonte Minerals Plc Araguaia Nickel Project Technical Report
Final November 2018 Page 174 of 342
Figure 14-4 PQZ – plan view of simulation variability at parent cell – thickness
Figure 14-5 PQZ – plan view of simulation variability at quarterly production scale – nickel

Horizonte Minerals Plc Araguaia Nickel Project Technical Report
Final November 2018 Page 175 of 342
Figure 14-6 PQZ – plan view of simulation variability at quarterly production – thickness
VOI:
• The VOI Mineral Resource is classified mostly as an Indicated Resource, with some Inferred Resources around the edges. Drillhole spacing at VOI is greater than at PQZ with a grid of 100 m x 100 m used in the Indicated areas and 200 m x 200 m in the Inferred areas. However, Snowden considers that the current drillhole spacing adequately defines the nickel grade and that the grade variability presents a relatively low risk. The results show that at the 90% confidence limits, nickel grades within the Indicated Resource area are typically within +/-10% to 20% of the mean at the quarterly production scale, which Snowden considers acceptable for an Indicated Resource.
• Thickness is more variable with results typically +/-25% to 50% of the mean within the Indicated Resource area at the quarterly production scale. This means that tonnage is of a higher risk and therefore close spaced drilling is required to more accurately define the thickness. This can be undertaken in the pre-production phase of the project.
JAC:
• The JAC Mineral Resource is a small deposit which is classified mostly as an Indicated Resource, with some minor areas of Inferred Resources around the edges. Drillhole spacing ranges from 50 m x 50 m to 100 m x 100 m in the Indicated areas. Snowden considers that the current drillhole spacing adequately defines the nickel grade and that the grade variability presents a relatively low risk. The results show that at the 90% confidence limits, nickel grades within the Indicated Resource area are typically within +/-10% to 20% of the mean at the quarterly production scale, which Snowden considers acceptable for an Indicated Resource.
• Thickness is more variable with results typically +/-25% to 50% of the mean within the Indicated Resource area at the quarterly production scale. This means that tonnage is of a higher risk and the use of close spaced drilling is required to more accurately define the thickness. This can be undertaken in the pre-production phase of the project.
All areas show low levels of risk in the nickel grade with respect to the classification. However, all areas show higher variability in the thickness. The use of close spaced drilling is required to more accurately define the thickness. Snowden recommends implementing detailed drilling a year in advance of production and increasing the number of mining faces (exposed ore) available for production to reduce this risk.

Horizonte Minerals Plc Araguaia Nickel Project Technical Report
Final November 2018 Page 176 of 342
14.10.2 Mineral Resource reporting
The classified 2017 ANS and ANN Mineral Resource has been reported using a 0.90% nickel cut-off grade and is provided in Table 14-8.

Horizonte Minerals Plc Araguaia Nickel Project Technical Report
Final November 2018 Page 177 of 342
Table 14-8 Mineral Resource estimate reported at 0.90% Ni cut-off for 2017 ANS and ANN
FS area Category Material type Tonnage
(kt) Bulk density
(t/m3) Contained Ni metal (t)
Ni
(%)
Co
(%)
Fe
(%)
MgO
(%)
SiO2
(%)
Al2O3 (%)
Cr2O3 (%)
PQZ Measured Limonite 294 1.32 3,173 1.08 0.14 35.18 2.30 18.97 11.77 2.10
PQZ Measured Transition 5,812 1.28 99,855 1.72 0.06 17.65 10.21 44.10 6.49 1.17
PQZ Measured Saprolite 8,121 1.44 104,352 1.28 0.03 12.20 22.68 42.23 4.16 0.86
PQZ Indicated Limonite 548 1.32 5,944 1.09 0.12 36.23 2.95 17.94 10.66 2.28
PQZ Indicated Transition 3,197 1.28 48,575 1.52 0.06 19.61 12.97 38.93 5.94 1.34
PQZ Indicated Saprolite 6,201 1.46 77,399 1.25 0.03 11.82 24.94 40.76 3.83 0.85
PQZ Inferred Limonite 166 1.36 1,722 1.04 0.10 32.94 2.59 17.12 14.92 2.28
PQZ Inferred Transition 889 1.28 13,607 1.53 0.06 20.06 13.72 35.71 7.53 1.34
PQZ Inferred Saprolite 1,282 1.48 15,318 1.19 0.03 11.81 23.73 41.17 4.58 0.83
VDS Measured Limonite 938 1.41 11,631 1.24 0.16 38.1 1.91 16.6 10.84 3.26
VDS Measured Transition 833 1.15 16,160 1.94 0.1 27.5 10.2 27.8 7.35 2.18
VDS Measured Saprolite 2,170 1.22 26,040 1.2 0.03 11.4 29.32 37.5 3.14 0.87
VDS Indicated Limonite 6,739 1.45 72,781 1.08 0.11 35.1 1.89 23.1 9.78 2.62
VDS Indicated Transition 8,001 1.18 125,616 1.57 0.09 25.4 9.86 32.8 6.59 1.88
VDS Indicated Saprolite 17,387 1.23 194,734 1.12 0.04 11.9 28.12 37.9 2.99 0.89
VDS Inferred Limonite 525 1.48 5,565 1.06 0.11 35.6 1.64 22.9 9.12 2.01
VDS Inferred Transition 1,088 1.22 14,253 1.31 0.1 24.3 10.37 33.2 7.01 1.56
VDS Inferred Saprolite 1,089 1.20 13,177 1.21 0.04 12.2 25.03 40.1 3.52 0.83
JAC Indicated Limonite 427 1.33 4,855 1.14 0.15 37.31 2.20 21.56 8.47 2.35
JAC Indicated Transition 973 1.27 15,237 1.57 0.07 22.17 12.47 38.61 3.91 1.41
JAC Indicated Saprolite 2,016 1.46 25,616 1.27 0.04 11.83 25.11 42.75 2.22 0.78
JAC Inferred Limonite 4 1.32 42 1.05 0.23 37.81 1.35 19.96 8.96 2.27
JAC Inferred Transition 94 1.27 1,288 1.37 0.07 19.09 13.19 42.47 4.77 1.06
JAC Inferred Saprolite 273 1.44 3,350 1.23 0.04 11.27 21.11 49.86 1.94 0.82

Horizonte Minerals Plc Araguaia Nickel Project Technical Report
Final November 2018 Page 178 of 342
FS area Category Material type Tonnage
(kt) Bulk density
(t/m3) Contained Ni metal (t)
Ni
(%)
Co
(%)
Fe
(%)
MgO
(%)
SiO2
(%)
Al2O3 (%)
Cr2O3 (%)
BAI
Indicated
Limonite 6,666 1.38 74,744 1.12 0.11 37.05 2.96 16.99 10.47 2.87
Transition 6,631 1.23 91,102 1.37 0.06 18.96 13.84 40.22 5.11 1.44
Saprolite 7,450 1.31 88,280 1.18 0.03 12.20 23.56 42.60 3.45 0.92
Inferred
Limonite 1,082 1.32 11,190 1.03 0.08 33.49 4.52 23.90 9.59 2.67
Transition 355 1.19 3,891 1.10 0.05 24.17 12.56 33.42 6.04 1.61
Saprolite 212 1.29 2,228 1.05 0.03 12.70 24.19 39.07 4.90 1.00
PQW
Indicated
Limonite N/A N/A N/A N/A N/A N/A N/A N/A N/A N/A
Transition 2,893 1.14 34,441 1.19 0.06 21.80 6.58 43.27 5.48 1.41
Saprolite 842 1.35 9,470 1.12 0.04 11.40 19.88 46.78 4.02 0.84
Inferred
Limonite N/A N/A N/A N/A N/A N/A N/A N/A N/A N/A
Transition 355 1.12 3,813 1.07 0.06 22.76 6.47 41.66 5.21 1.34
Saprolite 61 1.30 612 1.01 0.05 12.51 18.64 45.43 4.73 0.78
VOE
Indicated
Limonite 590 1.33 6,874 1.16 0.16 37.62 1.91 22.38 7.85 2.16
Transition 3,304 1.16 44,581 1.35 0.06 20.71 9.95 42.51 4.38 1.37
Saprolite 5,818 1.34 70,430 1.21 0.03 11.24 24.45 42.71 3.13 0.79
Inferred
Limonite 8 1.18 102 1.25 0.06 30.78 2.39 38.49 4.60 1.60
Transition 439 1.17 5,667 1.29 0.07 19.20 7.27 48.24 4.38 1.28
Saprolite 362 1.31 3,986 1.10 0.03 12.37 17.88 45.32 5.48 0.73
VOI
Indicated
Limonite 1,470 1.35 16,941 1.15 0.19 38.52 2.39 19.23 8.04 2.08
Transition 3,053 1.21 41,722 1.37 0.06 20.09 12.28 40.81 4.84 1.18
Saprolite 8,981 1.34 113,519 1.26 0.03 11.77 25.77 41.09 3.04 0.74
Inferred
Limonite 286 1.33 3,172 1.11 0.12 33.91 2.63 27.14 7.53 1.97
Transition 558 1.19 7,007 1.26 0.05 20.55 11.39 41.37 4.51 1.22
Saprolite 958 1.37 11,511 1.20 0.03 11.77 24.39 42.36 3.70 0.73

Horizonte Minerals Plc Araguaia Nickel Project Technical Report
Final November 2018 Page 179 of 342
FS area Category Material type Tonnage
(kt) Bulk density
(t/m3) Contained Ni metal (t)
Ni
(%)
Co
(%)
Fe
(%)
MgO
(%)
SiO2
(%)
Al2O3 (%)
Cr2O3 (%)
VOW
Indicated
Limonite 2,804 1.35 34,025 1.21 0.12 35.26 2.32 22.90 8.30 2.69
Transition 2,865 1.18 38,350 1.34 0.05 19.16 12.06 42.85 3.97 1.43
Saprolite 2,313 1.28 25,538 1.10 0.03 12.02 23.86 42.52 2.86 0.95
Inferred
Limonite 680 1.38 7,982 1.17 0.13 37.62 2.08 20.51 8.13 2.90
Transition 993 1.17 12,306 1.24 0.06 18.82 11.75 44.05 3.65 1.42
Saprolite 1,161 1.35 12,048 1.04 0.03 11.18 27.53 41.01 2.45 0.88
Total Measured All 18,168 1.35 261,202 1.44 0.05 16.26 17.51 39.91 5.40 1.17
Indicated All 101,169 1.30 1,264,612 1.25 0.06 19.39 16.90 36.26 5.06 1.39
Total Measured +
Indicated All 119,337 1.30 1,525,814 1.27 0.06 18.91 16.99 36.81 5.11 1.36
Total Inferred All 12,920 1.30 153,748 1.19 0.06 20.21 14.90 36.77 5.58 1.39
Note: Mineral Resources are inclusive of Mineral Reserves. Totals may not add due to rounding.

Horizonte Minerals Plc Araguaia Nickel Project Technical Report
Final November 2018 Page 180 of 342
Figure 14-7 provides a grade-tonnage curve for a range of nickel cut-offs for the Measured and Indicated Mineral Resource.
Figure 14-7 Grade tonnage curve for Measured and Indicated Mineral Resource
Source: Snowden, 2016
14.11 Other deposits within the Project area
Other estimated deposits within the Project area include Pequizeiro NW (PQNW), Oito Main (Oito), Lontra North (Lontra 1–4 or Northern) and Raimundo. The locations of these deposits are shown in Sections 7 and 10.
Mineral Resources were estimated for these deposits by Dr MA Audet using block estimation by inverse distance weighted estimation at the power of 2 (ID2) on 25 m x 25 m x 2 m blocks (Audet, MA, et al., 2012a).
A geochemical correlation matrix was defined in order to assign a “GeoFacies” to each individual sample in the database. Bulk density values (wet and dry) and moisture content were assigned based on facies.
3D models of these deposits were created using surveyed drillholes. The models integrate the concept of geological horizons (limonite, transition and saprolite) to create a 3D block model. For each deposit, a surface geological constraining envelope was generated using drillhole data as well as information from geological mapping.
The estimates were previously reported in Audet, MA, et al (2012a) and are classified as Inferred Mineral Resources (Table 14-9). These resources are not considered in the FS discussed in this Technical Report.
There are no Mineral Resource estimates for other prospects (Morro, Southern, Oito West and Pequizeiro East) due to insufficient drill sample information.

Horizonte Minerals Plc Araguaia Nickel Project Technical Report
Final November 2018 Page 181 of 342
Table 14-9 Non-FS Mineral Resource estimates reported at 0.90% Ni cut-off
Area (non-FS) Category Material
type Tonnage
(kt) Density (t/m3)
Contained Ni metal (t)
Ni
(%)
Co
(%)
Fe
(%)
MgO
(%)
SiO2
(%)
Al2O3
(%)
Cr2O3
(%)
PQNW Inferred
Limonite 1,271 1.35 13,583 1.07 0.083 36.31 4.45 17.82 9.74 2.49
Transition 697 1.34 9,225 1.32 0.050 21.19 14.00 33.46 7.05 1.58
Saprolite 424 1.56 4,428 1.05 0.035 14.39 23.75 38.08 3.48 1.10
Oito Inferred
Limonite 3,377 1.34 36,625 1.08 0.124 37.70 2.53 18.39 10.51 2.29
Transition 3,784 1.35 50,686 1.34 0.051 19.36 13.92 40.46 5.09 1.23
Saprolite 3,804 1.47 41,615 1.09 0.030 11.99 23.41 42.19 4.63 0.76
Lontra 1 Inferred
Limonite 578 1.32 6,284 1.09 0.055 31.05 6.79 25.51 7.84 0.49
Transition 48 1.28 467 0.98 0.040 23.28 17.34 31.64 3.73 0.87
Saprolite - - - - - - - - - -
Lontra 2 Inferred
Limonite 391 1.33 4,629 1.18 0.075 38.35 3.14 14.05 8.89 3.56
Transition 112 1.31 1,213 1.09 0.038 19.33 20.41 29.10 4.24 5.18
Saprolite 18 1.47 200 1.09 0.029 14.16 26.17 35.27 3.53 1.34
Lontra 3 Inferred
Limonite 1,043 1.33 11,976 1.15 0.081 34.93 4.53 19.80 9.40 0.15
Transition 727 1.28 8,783 1.21 0.053 21.08 18.33 30.09 5.89 0.68
Saprolite 31 1.45 312 1.01 0.039 13.74 25.72 34.76 3.52 1.00
Lontra 4 Inferred
Limonite 250 1.32 3,029 1.21 0.082 38.08 5.27 16.58 7.64 0.12
Transition 170 1.30 2,148 1.26 0.053 19.85 20.08 31.03 5.53 0.68
Saprolite 246 1.47 2,884 1.17 0.044 14.88 26.28 33.65 3.33 0.71
Raimundo Inferred
Limonite 1,205 1.32 13,741 1.14 0.071 35.28 5.01 20.12 9.45 0.18
Transition 1,425 1.28 17,106 1.20 0.045 21.46 17.56 31.50 5.84 0.59
Saprolite 123 1.35 1,269 1.03 0.034 15.01 26.51 34.56 3.55 0.70
Total Inferred All 19,724 1.36 230,202 1.17 0.064 25.01 12.62 30.33 6.99 1.24

Horizonte Minerals Plc Araguaia Nickel Project Technical Report
Final November 2018 Page 182 of 342
15 MINERAL RESERVE ESTIMATES
Mineral Reserves, which are inclusive of the identified economic portion of the Mineral Resources described in Section 14, were prepared by Snowden for the Project as part of the PFS. The CIM terms “Mineral Reserve”, “Probable Mineral Reserve” and “Proven Mineral Reserve” have the meanings ascribed to those terms by the Canadian Institute of Mining, Metallurgy and Petroleum, as the CIM Definition Standards on Mineral Resources and Mineral Reserves, as adopted by CIM Council, as amended 2014.
As provided for under the NI 43-101 instrument, Snowden has used an acceptable foreign code as the “Australasian Code for Reporting of Exploration Results, Mineral Resources and Ore Reserves” as the JORC 2012 Edition for the ANS and ANN Mineral Reserve estimates. The CIM definitions 2014 and JORC 2012 use slightly different terminology to describe ore classifications and the terminology is aligned as provided in Table 15-1.
Table 15-1 CIM Definitions 2014 and JORC 2012 terminology
JORC (2012 edition) CIM Definitions 2014
Ore Reserves Mineral Reserves
Probable Ore Reserves Probable Mineral Reserves
Proved Ore Reserves Proven Mineral Reserves
Competent Person Qualified Person
There are no material differences between the tonnes and grade estimates as defined using the reserve categories between these codes.
The Reserves use the assumptions, designs and parameters defined predominantly in Section 16 and from other relevant sections of this report, applied as modifying factors.
In accordance with the CIM Definition Standards on Mineral Resources and Mineral Reserves (as adopted and amended), Mineral Reserves are classified as either “Probable” or “Proven” Mineral Reserves and are based on Indicated and Measured Mineral Resources only in conjunction “estimation of Mineral Resource and Mineral Reserve best practice guidelines” as provided by the CIM. No Mineral Reserves have been estimated using Inferred Mineral Resources.
15.1 Summary
The estimation of Mineral Reserves used the recently completed estimate of Measured and Indicated Mineral Resources for the Project as reported in Section 14 of this report.
All economic Indicated Resources within the pit designs were classified as Probable Reserves and all Measured Resources at Pequizeiro were classified as Proven Reserves. Measured Resources at Vale dos Sonhos were classified as Probable Reserves due to higher levels of uncertainty around the modifying factors for this pit. A summary of the Mineral Reserves is provided in Table 15-2.
Table 15-2 Araguaia North and South Mineral Reserve Estimates, as at 30 November 2018
Component Proven Probable Total
Ore (Mt) 7.33 19.96 27.29
Ni (%) 1.72 1.68 1.69
Fe (%) 16.01 17.57 17.15
SiO2:MgO 3.01 2.36 2.52
Al2O3 (%) 6.00 4.56 4.94

Horizonte Minerals Plc Araguaia Nickel Project Technical Report
Final November 2018 Page 183 of 342
15.2 Disclosure
The Mineral Reserves were based on the FS undertaken Qualified Persons and the Ore Reserves were estimated and reported using the guidelines of the JORC Code (2012 Edition), under the supervision of Mr Frank Blanchfield who is a Qualified Person as defined in NI 43-101, an employee of Snowden. Snowden is independent of HZM. The JORC estimated Ore Reserves are equivalent to similar categories and upheld by the definitions of the CIM so the Mineral Reserves are reported using CIM standards as required by NI 43–101. In addition, Mr Nicholas Barcza acts as the Qualified Person for metallurgical testwork and metallurgical parameters including plant recoveries and operating and capital costs. The abovementioned QPs relied on other experts and HZM for other items such as permitting, in country social engagement capital costs, marketing, metal pricing and financial modelling.
The Mineral Reserves could be affected by changes in metal price, capital and operating costs, metallurgical performance, infrastructure requirements, permitting or other factors. These factors are discussed in other sections of this report. The major risks to the Mineral Reserves are factors that either effect the costs to exploit resource or the revenues received for the products produced.
The metallurgical testwork has indicated that the minerals can be economically recovered using existing technology and methodology. Metallurgical performance and metal price have a direct effect on the revenue received and increase or decreases in plant performance will change the amount of metal recovered and hence the revenue received. Lower nickel prices will also reduce revenue.
Permitting is not expected to be a material risk to the project as there have been no indications to date that there are any social, regulatory or community issues that cannot be managed through best practice operating standards and/or risk management planning and mitigation measures. Permitting remains a risk to the reserves until the granting of the mining licence as part of the outcomes of the feasibility studies and the successful submission of the permitting and licence to operate requirements that will be outcomes of the final social, environmental and community studies.
There are no perceived infrastructure risks that hinder the estimation of a Mineral Reserve. The infrastructure is either existing or of a relatively standard type to install during construction of the project.
15.3 Assumptions, methods and parameters
Snowden used a process of mine planning to estimate a mineral inventory for the Project. Snowden identified a mining inventory based on the Araguaia Mineral Resource estimates that was reported by Snowden in accordance with the JORC Code 2012. The Mineral Resources are owned by HZM.
The mine design and accompanying schedules, detailed herein, are based upon on a planned open pit nickel laterite mining operation that mines a 27.5 Mt Mineral Reserve, to produce 52,000 tonnes of ferronickel (FeNi) (containing 14,500 tonnes of nickel) a year, for an initial 28 year LOM.
The basis of the Mineral Reserve is provided in Table 15-3.
Table 15-3 ANS and ANN JORC Code (2012), Table 1, Section 4
Criteria JORC Code explanation Comments
Mineral
Resource
for
conversion
to Mineral
Reserves
Description of the Mineral Resource estimate used as a basis for the conversion to an Ore Reserve.
Clear statement as to whether the Mineral Resources are reported additional to, or inclusive of, the Ore Reserves.
The Mineral Resource model was re-blocked to create a mining model. Each of the
resource models had parent cell size of 25 mE x 25 mN x 2 mRL with a minimum
sub-cell of 6.25 mE x 6.25 mN x 0.5 mRL. Snowden re-blocked the models to the
parent cell size of 6.25 mE x 6.25 mN x 2 mRL.
The re-blocked Measured and Indicated Resource summary at 1% Ni cut-off
(Transition and Saprolite material only) is reported with the variance to the Mineral
Resource model in the following table.

Horizonte Minerals Plc Araguaia Nickel Project Technical Report
Final November 2018 Page 184 of 342
Criteria JORC Code explanation Comments
Site visits Comment on any site visits undertaken by the Competent Person and the outcome of those visits.
If no site visits have been undertaken indicate why this is the case.
Site visits were completed by the following Competent Persons:
Study
status
The type and level of study undertaken to enable Mineral Resources to be converted to Ore Reserves.
The Code requires that a study to at least PFS level has been undertaken to convert Mineral Resources to Ore Reserves. Such studies will have been carried out and will have determined a mine plan that is technically achievable and economically viable, and that material Modifying Factors have been considered.
A FS was completed for the Project in October 2018.
Cut-off
parameter
s
The basis of the cut-off grade(s) or quality parameters applied.
The pit optimisation was completed at a raised cut-off grade of 1.4% Ni to target the
highest grade 25 Mt of ore. The marginal cut-off grade varies between 1.01 and
1.16.
The higher cut-off at Vale do Sonhos (VDS) is from the long haul.
The ultimate Ore Reserve is based on the marginal cut-off grade applied to the
raised cut-off grade pit optimisation.
Mining
factors
and
assump-
tions
The method and assumptions used as reported in the PFS or FS to convert the Mineral Resource to an Ore Reserve (i.e. either by application of appropriate factors by optimisation or by preliminary or detailed design).
The choice, nature and appropriateness of the selected mining method(s) and other mining parameters including associated design issues such as pre-strip, access, etc.
The assumptions made regarding geotechnical parameters (eg pit slopes, stope sizes, etc), grade control and pre-production drilling.
The major assumptions made and Mineral Resource model used for pit and stope optimisation (if appropriate).
The mining dilution factors used.
Snowden Mining Industry Consultants (Snowden) completed the work for the
Araguaia FS mining study.
The planning process incorporated the re-blocking of the mineral resource block
model, pit optimisation using Whittle software, mine production scheduling and
supply of mining data to mining contractors in Brazil who provided current pricing.
Conventional open pit mining methods will be used, and the selective mining of the
orebodies will use suitably sized equipment. Groundwater and rainfall will be
managed during mining by shedding water across pit floors designed at a 1%
crossfall, pit sumps and pumping, increased pit development enabling drier mining
options and restricting the mining rate during the wet season from October to March.
The following Modifying Factors were considered in relation to the development of
the Araguaia Ore Reserves:
• Geotechnical: Overall wall angles of between 28° and 34° was applied for pit
optimisation and used as the basis for pit designs.
• Dilution and ore loss: The resource was re-blocked to 6.25 mE x 6.25 mN x
2 mRL with 300 mm loss at the top of the transition, and an additional 2% ore
loss for sheeting, resulting in:
− a decrease of 8% tonnes of ore and the nickel grade was unchanged
− increases in grade for Fe, Al2O3, SiO2:MgO ratio.
• The mining method utilises conventional offroad truck and excavator with drill
and blast used for harder ore types. Highway trucks will be used to transport the
VDS material to the plant at Pequizerio Mining faces are developed to provide
dry mining options and mining activity is slowed during the high rainfall months.

Horizonte Minerals Plc Araguaia Nickel Project Technical Report
Final November 2018 Page 185 of 342
Criteria JORC Code explanation Comments
The mining recovery factors used.
Any minimum mining widths used.
The manner in which Inferred Mineral Resources are utilised in mining studies and the sensitivity of the outcome to their inclusion.
The infrastructure requirements of the selected mining methods
Pit optimisations were completed based on parameters derived from the PFS in
2016. These parameters are detailed below. Subsequent to the mine planning work,
the parameters were updated. Snowden completed optimisations to check the
validity of the pit shells derived, and these were found to be valid and conservative.
There may be some opportunity to explore improvements to the inventory in future
mine planning.
Mining
A mining cost of US$5/dmt for waste. The incremental ore mining cost (including
grade control, reclaim costs, surface haulage and stockpile management) varied by
deposit:
• US$10/t for Pequizeiro and Pequizeiro West
• US$11/t for Baião and Jacutinga
• US$12/t for Vila Oito, Vila Oito East and Vila Oito West
• US$25/t for VDS.
Process
Based on PFS modelling, a processing cost of US$90/dmt was estimated. A
process recovery rate of 92% was applied to all ore meeting specification.
Sales
A nickel price of US$11,000/t Ni was applied for pit optimisation. No revenue was
attributed to the iron content of the ferronickel (FeNi) product. A royalty cost of 2%
was applied for the pit optimisation.
Metallurgic
al factors
and
assump-
tions
The metallurgical process proposed and the appropriateness of that process to the style of factors or mineralisation.
Whether the metallurgical process is well-tested technology or novel in nature.
The nature, amount and representativeness of metallurgical testwork undertaken, the nature of the metallurgical domaining applied and the corresponding metallurgical recovery factors applied.
Any assumptions or allowances made for deleterious elements.
The existence of any bulk sample or pilot scale testwork and the degree to which such samples are considered representative of the orebody as a whole.
For minerals that are defined by a specification, has the ore reserve estimation been based on the appropriate mineralogy to meet the specifications?
Araguaia ore will be treated pyrometallurgically by the rotary kiln-electric furnace
process (RKEF). The product is a FeNi alloy having a 30% Ni content. Based on
laboratory and pilot testing and supported by published technical data, a nickel
recovery of 93% to nickel in FeNi in the electric furnace was adopted. Mineralogy
examination of the ANS nickel ore showed the bulk of the ore consisted on
nontronite with moderate levels of serpentine, chlorite and montmorillonite. The
nickel was found to occur in all the above minerals.
Laboratory testing
Laboratory testing of agglomeration, chemical reduction and smelting aspects on
samples of ANS ore was carried out at XPS (Canada), FLS (USA), Feeco (USA)
and Komarek (USA).
The 60 kg (partly dry) of material sent to XPS in 2011 was based on quarter-core
samples from each of the principal facies types (Limonite, Transition and Saprolite).
For testing, a number of blends were prepared. The samples sent to FLS in 2012
were prepared from a large (130 dry tonnes) bulk sample taken with a 1 m auger
from selected areas of the Pequizeiro deposit and were nominally representative of
the Pequizeiro and Baião deposits, characterised at a 1.0 wt.% Ni cut-off. The
material tested at Feeco and Komarek was a subsample of the same material at
FLS.
Laboratory tests on samples of ANN material were carried out by the former Xstrata
in 2007–2008 at XPS (Canada), Pyrosearch (Australia), FLS (USA) and Polysius
(Germany).
The material for these tests were samples taken from split drill core from the Serra
do Tapa (SdT) and VDS deposits.
Pilot plant testing – ANS
Pilot testwork on ANS ore was at carried out at the Morro Azul pilot plant in the State
of Minas Gerais in Brazil, incorporating: A pilot pre-test (20 wet tonnes treated) of
drying and agglomeration was carried out in January 2015, a calcining pre-test was
also undertaken.
A fully integrated pilot test using ANS ore (220 wet tonnes treated, nominal kiln
capacity 550 kg/hr) of the RKEF process comprising ore preparation, drying and
agglomeration, calcination and electric furnace smelting. The pilot test was carried
out in April–May 2015. Tapped electric furnace slag was granulated, while the
tapped FeNi was cast as ingots, with some heats also granulated.
The bulk sample for the pilot testing at Morro Azul was collected by Horizonte with
the target of matching the plant feed for the first nine years of operation established
in the PFS. The chemistry of the bulk sample was close to but not identical to that of
the target.
Pilot plant testing – ANN

Horizonte Minerals Plc Araguaia Nickel Project Technical Report
Final November 2018 Page 186 of 342
Criteria JORC Code explanation Comments
Pilot testwork on ANN ore was at carried out in 2008 by the former Xstrata at the
pilot plant the Polysius R&D Centre (now ThyssenKrupp Industrial Solutions) in
Ennigerloh, Germany and at the pilot facilities of Mintek in South Africa. Calcine was
produced at the pilot plant in Germany and shipped to South Africa for smelting.
The process flowsheet tested was based on Glencore (previously Xstrata)
proprietary technology, with a total of 28 wet tonnes of ore processed in the pilot
plant in Germany. Calcine was smelted in a 450kW single graphite electrode direct
current (DC) electric furnace pilot plant at Mintek at a feed rate of about 300–
450 kg/h (same order of magnitude as the tests on ANS ore at Morro in Brazil), and
in a similar size of furnace.
The samples of ANN ore for pilot testing were taken from the Serra do Tapa deposit.
The characteristics of the ANN ore were found to be similar to those of ANS ore.
Trial mining
Samples of ore selected from the trial mining operation carried out in 2017 at ANS
were tested to examine ore handling, ore characteristics and granulometry of the
ore. It was found that at the mining depths reached, there were no large rocky
pieces. However, only the top of the rocky saprolite was be reached in the trial mine.
Process design
The process design is based on the well-established RKEF technology. The pilot
plant campaign was carried out under the supervision of IGEO on the flowsheet that
confirmed the following parameters. Ore preparation including sampling, blending
and homogenisation of Araguaia ore as well as agglomeration in the dryer is
achieved to optimise the granulometry and size of the feed to the kiln to minimise
fines and reduce kiln dust. Calcining is part of the RKEF process and to carry out
partial pre-reduction of iron and nickel to produce the required grade of FeNi in the
electric furnace. Coal is added as the reducing agent for the iron and nickel oxides.
Pilot testing covered a range of Ni grades in the FeNi, slag quality and Ni level in
slag and provided process data to assist in the design of the commercial plant
Project parameters. The slag composition produced demonstrated that the
composition of the blended feed is within the tolerances specified in the mine-to-mill
strategy and that the granulated slag is suitable for disposal in a suitably designed
tailings dam. Good quality FeNi was produced, which after conventional refining
(simulated, not tested) will meet all market specifications for FeNi product.
The current project parameters are:
Environ-
mental
The status of studies of potential environmental impacts of the mining and processing operation. Details of waste rock characterisation and the consideration of potential sites, status of design options considered and, where applicable, the status of approvals for process residue storage and waste drums should be reported.
Planos de Controle Ambiental (PCAs) are the Company’s social and environmental
commitments and 15 of these include environmental (both physical and biological)
PCAs.
An acid rock drainage (ARD) study was conducted by ERM in 2017 and results
demonstrate that ARD is unlikely to occur in the ANP.
HZM has reviewed alternatives to the project design and made changes to take
account of environmental and social considerations. At the beginning of FS, an
integrated visit to site was done by a multidisciplinary professional team, including
engineers and ERM consultants, to assess and optimise infrastructure locations
considering the best economic, technical and socio-environmental locations. These
changes helped to avoid some areas of protected vegetation (canga) and helped to
reduce the number springs that would be affected directly. The volume of water
required to be abstracted from the Arraias River was refined during this time to
match seasonality of the region. The environmental and social risks and impacts of
layout changes have been notified to the regulator SEMAS.
The mining system was designed for closure.
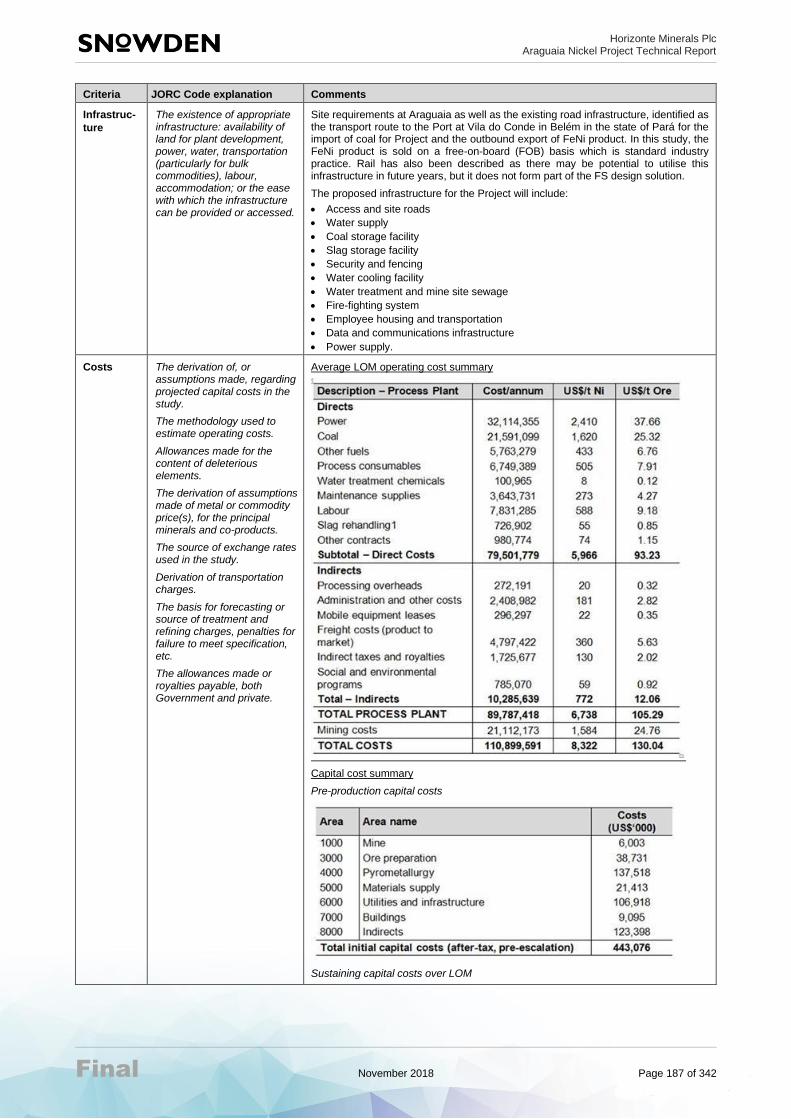
Horizonte Minerals Plc Araguaia Nickel Project Technical Report
Final November 2018 Page 187 of 342
Criteria JORC Code explanation Comments
Infrastruc-
ture
The existence of appropriate infrastructure: availability of land for plant development, power, water, transportation (particularly for bulk commodities), labour, accommodation; or the ease with which the infrastructure can be provided or accessed.
Site requirements at Araguaia as well as the existing road infrastructure, identified as the transport route to the Port at Vila do Conde in Belém in the state of Pará for the import of coal for Project and the outbound export of FeNi product. In this study, the FeNi product is sold on a free-on-board (FOB) basis which is standard industry practice. Rail has also been described as there may be potential to utilise this infrastructure in future years, but it does not form part of the FS design solution.
The proposed infrastructure for the Project will include:
• Access and site roads
• Water supply
• Coal storage facility
• Slag storage facility
• Security and fencing
• Water cooling facility
• Water treatment and mine site sewage
• Fire-fighting system
• Employee housing and transportation
• Data and communications infrastructure
• Power supply.
Costs The derivation of, or assumptions made, regarding projected capital costs in the study.
The methodology used to estimate operating costs.
Allowances made for the content of deleterious elements.
The derivation of assumptions made of metal or commodity price(s), for the principal minerals and co-products.
The source of exchange rates used in the study.
Derivation of transportation charges.
The basis for forecasting or source of treatment and refining charges, penalties for failure to meet specification, etc.
The allowances made or royalties payable, both Government and private.
Average LOM operating cost summary
Capital cost summary
Pre-production capital costs
Sustaining capital costs over LOM
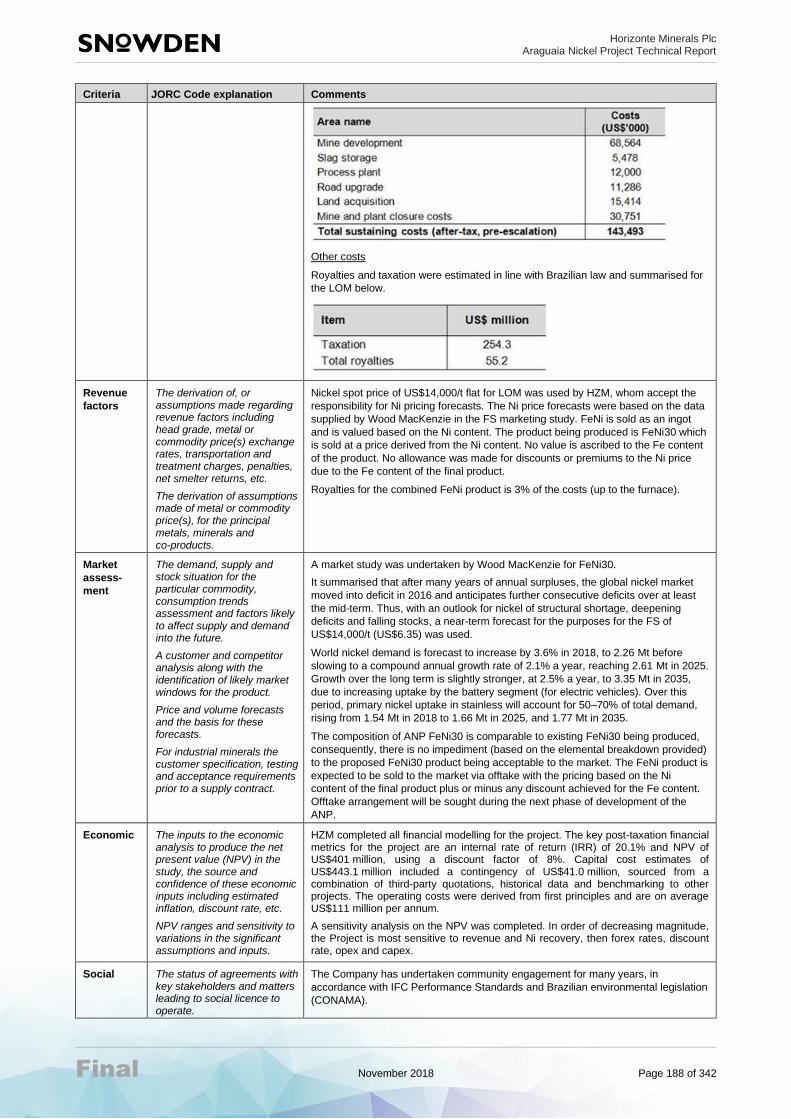
Horizonte Minerals Plc Araguaia Nickel Project Technical Report
Final November 2018 Page 188 of 342
Criteria JORC Code explanation Comments
Other costs
Royalties and taxation were estimated in line with Brazilian law and summarised for
the LOM below.
Revenue
factors
The derivation of, or assumptions made regarding revenue factors including head grade, metal or commodity price(s) exchange rates, transportation and treatment charges, penalties, net smelter returns, etc.
The derivation of assumptions made of metal or commodity price(s), for the principal metals, minerals and co-products.
Nickel spot price of US$14,000/t flat for LOM was used by HZM, whom accept the
responsibility for Ni pricing forecasts. The Ni price forecasts were based on the data
supplied by Wood MacKenzie in the FS marketing study. FeNi is sold as an ingot
and is valued based on the Ni content. The product being produced is FeNi30 which
is sold at a price derived from the Ni content. No value is ascribed to the Fe content
of the product. No allowance was made for discounts or premiums to the Ni price
due to the Fe content of the final product.
Royalties for the combined FeNi product is 3% of the costs (up to the furnace).
Market
assess-
ment
The demand, supply and stock situation for the particular commodity, consumption trends assessment and factors likely to affect supply and demand into the future.
A customer and competitor analysis along with the identification of likely market windows for the product.
Price and volume forecasts and the basis for these forecasts.
For industrial minerals the customer specification, testing and acceptance requirements prior to a supply contract.
A market study was undertaken by Wood MacKenzie for FeNi30.
It summarised that after many years of annual surpluses, the global nickel market
moved into deficit in 2016 and anticipates further consecutive deficits over at least
the mid-term. Thus, with an outlook for nickel of structural shortage, deepening
deficits and falling stocks, a near-term forecast for the purposes for the FS of
US$14,000/t (US$6.35) was used.
World nickel demand is forecast to increase by 3.6% in 2018, to 2.26 Mt before
slowing to a compound annual growth rate of 2.1% a year, reaching 2.61 Mt in 2025.
Growth over the long term is slightly stronger, at 2.5% a year, to 3.35 Mt in 2035,
due to increasing uptake by the battery segment (for electric vehicles). Over this
period, primary nickel uptake in stainless will account for 50–70% of total demand,
rising from 1.54 Mt in 2018 to 1.66 Mt in 2025, and 1.77 Mt in 2035.
The composition of ANP FeNi30 is comparable to existing FeNi30 being produced,
consequently, there is no impediment (based on the elemental breakdown provided)
to the proposed FeNi30 product being acceptable to the market. The FeNi product is
expected to be sold to the market via offtake with the pricing based on the Ni
content of the final product plus or minus any discount achieved for the Fe content.
Offtake arrangement will be sought during the next phase of development of the
ANP.
Economic The inputs to the economic analysis to produce the net present value (NPV) in the study, the source and confidence of these economic inputs including estimated inflation, discount rate, etc.
NPV ranges and sensitivity to variations in the significant assumptions and inputs.
HZM completed all financial modelling for the project. The key post-taxation financial metrics for the project are an internal rate of return (IRR) of 20.1% and NPV of US$401 million, using a discount factor of 8%. Capital cost estimates of US$443.1 million included a contingency of US$41.0 million, sourced from a combination of third-party quotations, historical data and benchmarking to other projects. The operating costs were derived from first principles and are on average US$111 million per annum.
A sensitivity analysis on the NPV was completed. In order of decreasing magnitude, the Project is most sensitive to revenue and Ni recovery, then forex rates, discount rate, opex and capex.
Social The status of agreements with key stakeholders and matters leading to social licence to operate.
The Company has undertaken community engagement for many years, in
accordance with IFC Performance Standards and Brazilian environmental legislation
(CONAMA).

Horizonte Minerals Plc Araguaia Nickel Project Technical Report
Final November 2018 Page 189 of 342
Criteria JORC Code explanation Comments
The environmental management/control plans (PCAs) include the Company’s social
and environmental commitments or agreements with key stakeholders, and 12
social PCAs have been submitted to SEMAS for ANS. These are expected to be
agreed upon the approval of the construction licence (LI) in Q4 2018.
The identification of socio-economic risks, impact assessment and programs are
based on the permitting programs set out in ANS. These are likely to be similar in
ANN due to its similar region and social characteristics. ANN socio-economic
programs will be developed in further detail through consultations with community
and government over coming years as permits progress.
Land Acquisition
The Company intends to undertake a land acquisition and resettlement program to
obtain surface rights to lands where infrastructure will be placed. The intention of the
Company is to undertake amicable land negotiations wherever possible. The
Mineral Servitude, once approved, provides HZM with the legal rights to access
Mineral Reserves as these are assets of the Brazilian Union. In the case that
amicable agreements are not reached, HZM may enact legal mechanisms through
the Mineral Servitude; however, this is the less preferred position of the Company.
At present, resettlement and land acquisition has focused on the ANS part of the
project. In ANN, one large farm contains the entire pit area, and this will enter the
mine plan in Year 8. As of August 2018, the planned footprint for the ANS part of the
project – including pits, processing plant, tailings dam, access roads, and related
facilities – is projected to impact 37 families which can be segregated into four
distinct groups, including:
• Nine families for resettlement in conjunction with the Union land authority
(INCRA) post Year 10 of the mine plan
• Nine families considered potentially vulnerable and eligible for Company
resettlement/monitoring
• Nine farm owners who will participate in the process of free negotiation with the
Company
• 10 farm workers and their families eligible for economic displacement
compensation.
The Union land authority (INCRA) was consulted throughout this process, as two
INCRA settlements may be affected in the second Installation Licence phase. No
INCRA lands are within the first 10 years of the mine plan.
Other To the extent relevant, the impact of the following on the project and/or on the estimation and classification of the Ore Reserves:
Any identified material naturally occurring risks.
The status of material legal agreements and marketing arrangements.
The status of governmental agreements and approvals critical to the viability of the project, such as mineral tenement status, and government and statutory approvals. There must be reasonable grounds to expect that all necessary Government approvals will be received within the timeframes anticipated in the PFS or FS. Highlight and discuss the materiality of any unresolved matter that is dependent on a third party on which extraction of the reserve is contingent.
Water in pits
To manage water inflows, it will be necessary to mine pit floors on a slight gradient
(1%) and/or keep the trucks and excavators off the pit floor when water is
encountered. Water will need to be removed from the pit floor via floor drains and
directed to a sump where it can be pumped from the pit.
Where vehicles are required to travel across a pit floor that is wet, sheeting will be
used to provide a dry and trafficable running surface. Multiple mining faces will be
kept open in the pits to provide alternative working areas in the event a wet mining
face is encountered and presents trafficability problems.
Ground water in the pits can occur as perched tables, with the more substantial
aquifer interface closer to the bedrock. This will generally be several metres below
the pit floor. The perched water tables (if and when they occur) will be of variable
size and volume. Small perched are expected to drain fully within a couple of days.
Dewatering will be required to allow progress of mining. It is anticipated that
pumping from up to 10 locations with capacity for 2 litres per second for each pump
will be required for the first 10 years.
Wall stability in the pit in highly saturated and potentially slumping soft clay
formations will be an important issue which needs to be addressed. Consideration
will need to be given to wall drainage and impact of “delayed yield” water release
when the pit progresses 20 m or more below standing water level. This late stage
release of water has high impact on stability of wall toe zones at or near pit floor
level.
While mitigation actions have been identified for managing pit dewatering, the
understanding of dewatering of the pits will increase as the mining operation
continues.
Permitting

Horizonte Minerals Plc Araguaia Nickel Project Technical Report
Final November 2018 Page 190 of 342
Criteria JORC Code explanation Comments
ANP’s permit process is well advanced and the Project is on the pathway to the
construction-ready phase. To move from the exploration and development phase
through to the construction phase, HZM must continue permitting along two parallel
pathways. These pathways are the mining permit and the environmental permit, and
each is managed by separate and independent public authorities: National Mining
Agency (Agência Nacional de Mineração – ANM) formally known as DNPM for the
mining permit; and the State Secretariat for Environment and Sustainability of Pará
(SEMAS) for the environmental permit.
ANS is further advanced along the permitting pathway than ANN, due to the
relatively recent acquisition of ANN. ANN is currently being integrated into the
overall permitting pathway for the project. Mining in ANN is scheduled to commence
mining in year8 of the current mine plan. There are no known impediments that
would appear to threaten the award of any permits/licences/ approvals required for
the Project to proceed.
Classifica-
tion
The basis for the classification of the Ore Reserves into varying confidence categories.
Whether the result appropriately reflects the Competent Person's view of the deposit.
The proportion of Probable Ore Reserves that have been derived from Measured Mineral Resources (if any).
All economic Indicated Resources within the pit designs were classified as Probable Reserves and all Measured Resources at Pequizeiro were classified as Proven Reserves. Measured Resources at Vale dos Sonhos were classified as Probable Reserves due to higher levels of uncertainty around the modifying factors for this pit.
Audits or
reviews
The results of any audits or reviews of Ore Reserve estimates.
There have been no external audits or reviews of this study. However, HZM has undertaken various external peer reviews of the FS content in order to confirm the accuracy and appropriateness of the FS conclusions and recommendations.
Relative
accuracy/
confidence
Where appropriate a statement of the relative accuracy and confidence level in the Ore Reserve estimate using an approach or procedure deemed appropriate by the Competent Person. For example, the application of statistical or geostatistical procedures to quantify the relative accuracy of the reserve within stated confidence limits, or, if such an approach is not deemed appropriate, a qualitative discussion of the factors which could affect the relative accuracy and confidence of the estimate.
The statement should specify whether it relates to global or local estimates, and, if local, state the relevant tonnages, which should be relevant to technical and economic evaluation. Documentation should include assumptions made and the procedures used.
Accuracy and confidence discussions should extend to specific discussions of any applied Modifying Factors that may have a material impact on Ore Reserve viability, or for which there are remaining areas of uncertainty at the current study stage.
The estimates in this study relating to mining, processing and cost performance are underpinned by a comprehensive FS which has a confidence range of -10%/+15%.

Horizonte Minerals Plc Araguaia Nickel Project Technical Report
Final November 2018 Page 191 of 342
Criteria JORC Code explanation Comments
It is recognised that this may not be possible or appropriate in all circumstances. These statements of relative accuracy and confidence of the estimate should be compared with production data, where available.

Horizonte Minerals Plc Araguaia Nickel Project Technical Report
Final November 2018 Page 192 of 342
16 MINING METHODS
The mining study was completed by Snowden under the supervision of Mr Frank Blanchfield, Qualified Person for Mineral Reserves and overall QP for the study. Mr Blanchfield attended the Araguaia site on three occasions between March 2016 and May 2017, for a total of approximately five weeks.
In May 2017, a test pit was completed under Mr Blanchfield’s supervision. The test pit was a 14 m deep excavation removing approximately 20 kt of material compromising all major rock types anticipated in operations. The excavation was used to take measurements and observe the performance of the geology and mining operations. These observations were used to furnish and provide credibility and confidence to the mining strategy and design criteria.
The mine design and accompanying schedules, detailed herein, are based upon on a planned open pit nickel laterite mining operation that mines a 27.5 Mt Mineral Reserve, to produce 52,000 tonnes of ferronickel (FeNi) (containing 14,500 tonnes of nickel) a year, for an initial 28-year LOM plan.
16.1 Geotechnical investigation
The ANP pits are shallow (approximately 30 m deep) and laterally extensive and are mined in highly weathered and relatively weak soil type materials. The design work was supported by 648 m of drill core, core logging, historical and current lab testing (91 samples), trial mining and a site visit.
In February 2013, Snowden was engaged by HZM to undertake geotechnical evaluation for the PFS. The geotechnical study was completed in November 2013 for seven deposits in ANP, including preliminary waste damp designs and trafficability assessment.
In 2014, a geotechnical review was undertaken, which included a recommendation for a geotechnical diamond drilling program. The drilling campaign started in 2015 and was completed in 2017. A geotechnical review was undertaken after the drilling program was completed.
Snowden geotechnical personnel visited the ANP site in May 2017 and preliminary slope design recommendations were then submitted to Snowden’s Mining Division. Snowden then provided a new pit shell design based on these recommendations. Snowden then completed the geotechnical evaluation between July and August 2017.
A number of technical reports; current geological, topographic and pit design wire frames; current information on the geological setting; and hydrogeological information was used in the FS geotechnical work.
Snowden considers that the current geotechnical study has reached a level of accuracy that is appropriate for a FS.
16.1.1 Hydrogeology
Baseline hydrogeological study using a steady state catchment model was completed. Ground water Resource Management completed studies by collecting and using data on the wet season high water and dry season low water levels. This data was not modelled into three dimensional surfaces however, based on dipping of resource and exploration holes, HZM estimates the natural groundwater level generally lies within the saprolite zone in the laterite plateau areas, and rises to the top of transition or into the limonite in the wet season. Subsequently, the highly fractured and weathered rock zone below the saprolite will be the main storage aquifer in this project. The ERM modflow data was supplied after the geotechnical modelling was completed and an initial static groundwater surface was provided by ERM.
As observed in the trial pit, the local climate and high rainfall within the area have created a perched groundwater level due to fine-grained soil horizons within the laterite profile as illustrated in Figure 16-1. In this excavation, it was shown that the perched water tables are relatively thin and dewater rapidly once intersected.
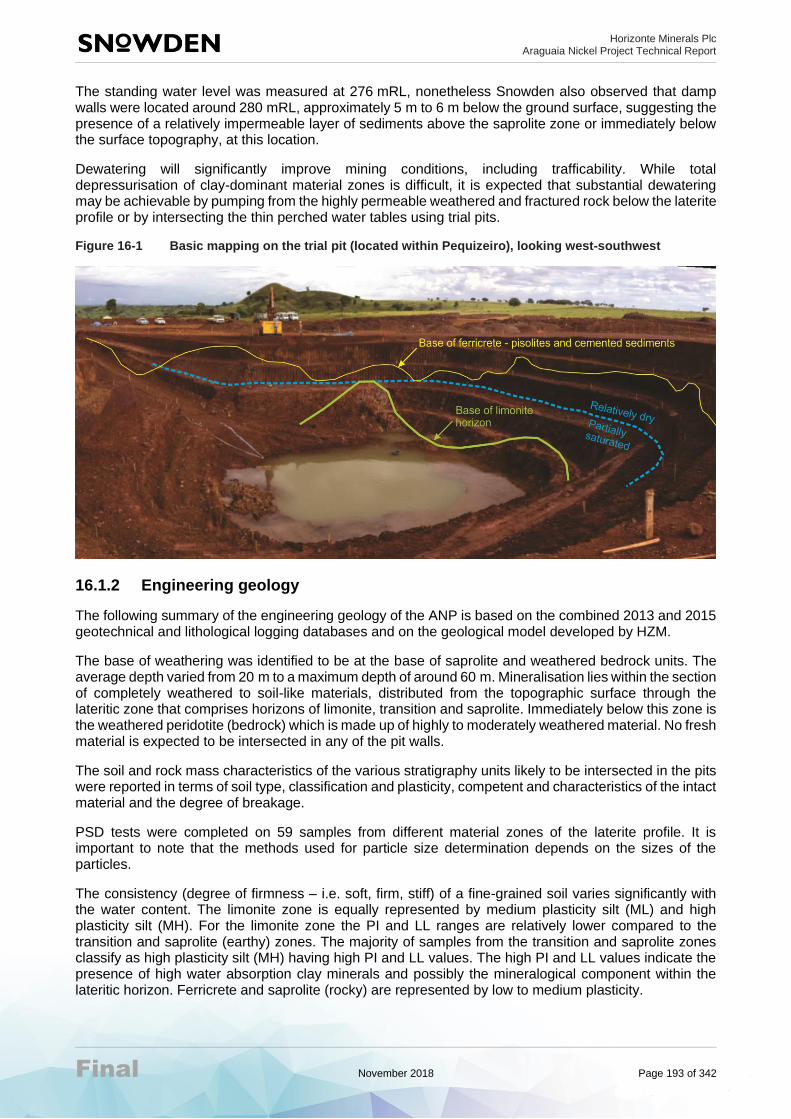
Horizonte Minerals Plc Araguaia Nickel Project Technical Report
Final November 2018 Page 193 of 342
The standing water level was measured at 276 mRL, nonetheless Snowden also observed that damp walls were located around 280 mRL, approximately 5 m to 6 m below the ground surface, suggesting the presence of a relatively impermeable layer of sediments above the saprolite zone or immediately below the surface topography, at this location.
Dewatering will significantly improve mining conditions, including trafficability. While total depressurisation of clay-dominant material zones is difficult, it is expected that substantial dewatering may be achievable by pumping from the highly permeable weathered and fractured rock below the laterite profile or by intersecting the thin perched water tables using trial pits.
Figure 16-1 Basic mapping on the trial pit (located within Pequizeiro), looking west-southwest
16.1.2 Engineering geology
The following summary of the engineering geology of the ANP is based on the combined 2013 and 2015 geotechnical and lithological logging databases and on the geological model developed by HZM.
The base of weathering was identified to be at the base of saprolite and weathered bedrock units. The average depth varied from 20 m to a maximum depth of around 60 m. Mineralisation lies within the section of completely weathered to soil-like materials, distributed from the topographic surface through the lateritic zone that comprises horizons of limonite, transition and saprolite. Immediately below this zone is the weathered peridotite (bedrock) which is made up of highly to moderately weathered material. No fresh material is expected to be intersected in any of the pit walls.
The soil and rock mass characteristics of the various stratigraphy units likely to be intersected in the pits were reported in terms of soil type, classification and plasticity, competent and characteristics of the intact material and the degree of breakage.
PSD tests were completed on 59 samples from different material zones of the laterite profile. It is important to note that the methods used for particle size determination depends on the sizes of the particles.
The consistency (degree of firmness – i.e. soft, firm, stiff) of a fine-grained soil varies significantly with the water content. The limonite zone is equally represented by medium plasticity silt (ML) and high plasticity silt (MH). For the limonite zone the PI and LL ranges are relatively lower compared to the transition and saprolite (earthy) zones. The majority of samples from the transition and saprolite zones classify as high plasticity silt (MH) having high PI and LL values. The high PI and LL values indicate the presence of high water absorption clay minerals and possibly the mineralogical component within the lateritic horizon. Ferricrete and saprolite (rocky) are represented by low to medium plasticity.

Horizonte Minerals Plc Araguaia Nickel Project Technical Report
Final November 2018 Page 194 of 342
Snowden identified two zones within the saprolite horizon: earthy saprolite and rocky saprolite. The earthy saprolite is a pervasively altered rock which comprises mostly clay minerals as described above. While the rocky saprolite is hard and described as competent, dark green to greyish, weathered peridotite with moderate saprolitic alteration, occurring mostly along fractures.
This unit lies at the bottom of the laterite profile and exhibits a dark green to dark brown colour and consist of massive to fractured, interlayered of ultramafic mostly serpentinised peridotite. It is expected that a minor amount of this material will be exposed at the bottom of some of the pits.
Magnetic surveying techniques revealed the presence of numerous northwest-southeast to north-south trending lineaments that are believed to be traces of fault zones. The faults are interpreted as either thrust fronts with an east to west transport direction, or later sub-vertical faults.
Most of the deposits contain several northwest and north-south trending faults which dip from shallow to steep angles coincident with the boundaries of the mineralised zones. The deposits are also intersected by mafic dykes. In most places, the fault zones are either filled by massive silica or the zones are silicified while preserving their primary texture. Iron oxidation is also very common, particularly along the crosscutting fault zone which developed at a later stage.
Although the geology of the region is structurally controlled, there were no major structures identified and/or logged within the laterite profile and the bedrock intervals assessed in this review and no major structures modelled by HZM. Hence, there are no data available on which to base the engineering geological characteristics of faults or shear zones.
Therefore, the presence of major structures and their influence on pit stability are not considered further in the geotechnical modelling. If future data suggests any structural features in the deposit, it can be incorporated it into the geotechnical model at the time.
16.1.3 Groundwater
The regional water table generally lies within the saprolite horizon. Clay-rich zones can be erratically developed in the saprolite (common in laterite profiles), and therefore there is potential to develop perched water tables above the regional water table, within the weathered profile during the rainy season.
A baseline hydrogeological study was completed using a steady state catchment model. No transient modelling of dewatering or phreatic surface drawdown ahead of mining has been completed to date. Other than the base line study, Snowden also used information obtained during the site visit to estimate the groundwater surface across the entire project area. As agreed by HZM and Snowden, Snowden has used experience and best practice to develop groundwater assumptions for use in the slope stability analyses.
Dewatering will significantly improve mining conditions including trafficability. Although total depressurisation of clay dominant material zones may not be possible, it is expected that substantial dewatering may be achievable by pumping from the highly transmissive weathered/fractured rock mass below the laterite profile.
16.1.4 Geotechnical model
Principal geotechnical domains have been identified and defined in terms of soil or rock mass characteristics (these domains are summarised in Table 16-1):
• Typically, residual lateritic clays have formed beneath a hard ferricrete cap. At depth, the weathering profile consists of rocky saprolite above the fresh ultramafic bedrock.
• The weathering profile above the fresh ultramafic rock mass is highly variable, consisting of a mixture of weak and harder material that can be classified into three broad geotechnical domains, namely an upper ferruginous zone, lateritic-clay zone and a basal ultramafic saprolite zone.
• The lateritic zone can be delineated into three separate geotechnical domains, based on their grain size and index properties namely; a limonite domain consisting of sandy, silty clay (classified as ML and MH on plasticity characteristics), transition domain consisting of sandy, clayey silt (MH) and

Horizonte Minerals Plc Araguaia Nickel Project Technical Report
Final November 2018 Page 195 of 342
saprolite domain consisting of sandy, clayey silt (MH). The latter two domains have increased amounts of smectite clays and active clays. They are expected to deteriorate under wet-dry cycles due to potential swelling and shrinking.
The rapid changes in material types and the large spacing between the diamond drillholes used to capture geotechnical information, result in increased uncertainties in the geotechnical model. The confidence level of the geotechnical model is considered to be adequate for the FS.
Table 16-1 Summary of geotechnical domains
Geotechnical domain
Thickness Strength Description
Topsoil and ferricrete (hard-cap)
Average 3 m Soft to medium strong
Topsoil: Reddish brown, loose to medium dense ferruginous gravelly sand with some silt and clay. Organic matter and plant roots present.
Ferricrete: Reddish brown, loose to medium dense, mostly cemented, vuggy ferruginous gravelly sands (scree) with some silt and clay.
Limonite Between 10 m and
45 m
Very soft to stiff
Reddish brown to yellowish brown, soft to stiff, sandy clayey silt. PI average is 20 and LL average is 56, high plasticity. Classes OL, CL and ML. Mostly inactive clays.
Transition Between 5 m and 60 m
Very soft to stiff
Light green, green and brown colour depending on smectite content. Soft to stiff, sometimes friable, sandy silt clay. PI average is 48 and LL average is 104, high plasticity. Classes OH and MH. Mostly normal clays.
Saprolite (earthy) Between 8 m and 60 m
Soft to stiff and very
weak
Brown to reddish to green, mostly altered serpentine rock. High in smectite. Fine grained zones and classified as sandy silty clay. Average PI and LL is 38 and 85 respectively, high plasticity. Classes range from ML to MH. Mostly normal clays with significant amount of active clays.
Saprolite (rocky) Variable Very weak to weak
Highly fracture and weathered rock masses, consist mostly of extremely weathered material. High alteration along fractures. Believe where groundwater aquifer sits.
Bedrock Variable Strong Generally massive serpentinite.
Note: * Maximum thickness range in different deposits
16.2 Slope stability
Potential modes of instability in the laterite and weathered ultramafic domains forming the interim and final slopes of both pits, will depend on the scale of the slope. The most likely failure mode in the inter-ramp and/or overall slope scale is likely to be rotational sliding through the laterite and weak rock mass.
16.2.1 Slope recommendations
Deterministic stability analyses have been undertaken for rotational sliding for batter scale and overall slope scale. Sensitivity analyses were conducted for different groundwater conditions. At the current FS level of study, the slopes were designed for a target factor of safety of 1.2. The slope angles can be adjusted in the next phase of study when the shear strength parameters for different geotechnical domains are better defined.
Given the weak nature of the materials it is advisable to develop the pit slopes with short batters. Steeper batter face angles can be achieved with reduced batter heights. Depending on the choice of batter height for the optimisation of productivity and the prevailing groundwater conditions, following batter face angles are recommended for design. Overall design slope angles depend on the slope height and achievable depressurisation. It is expected that some depressurisation would occur adjacent to the slope.
The conclusions from the batter scale analysis were as follows:
• For the ferricrete, limonite, transition and saprolite (earthy and rocky) batters, maximum BFA of >80° is acceptable for 2 m, 4 m and 6 m high batter respectively

Horizonte Minerals Plc Araguaia Nickel Project Technical Report
Final November 2018 Page 196 of 342
• For 20 m high batter, the charts provide maximum BFA of 50° for limonite and saprolite (rocky), BFA of 55° for transition, BFA of 60° for saprolite (earthy) and 65° BFA for ferricrete.
Table 16-2 summarises all stability results for the modified slopes for the two groundwater pressure models adopted for this study. Note that the shear strength parameters and groundwater conditions used for the circular auto-refine analyses were the basis of slope design recommendations. FoS values shown in Table 16-2 are the maximum and minimum, after modification.
Table 16-2 Results of all sections analysed with corresponding acceptance criteria
Deposit Slope height
(m)
IRA
(°)
Groundwater condition
FoS, circular auto
FoS, non-circular auto
Baião 12-24 33-40 Expected 1.23-1.34 1.17-1.31
Worst case 0.88-1.13 0.86-1.09
Jacutinga 19-23 40
Expected 1.21-1.32 1.19-1.29
Worst case 0.88-1.05 0.88-1.01
Pequizeiro West 16-21 34-40
Expected 1.21-1.23 1.16-1.17
Worst case 1.02-1.06 0.99-1.02
Pequizeiro 20-43 28-40
Expected 1.21-1.39 1.18-1.36
Worst case 0.87-1.28 0.86-1.23
Vila Oito East 17-23 36-40
Expected 1.22-1.37 1.18-1.35
Worst case 0.99-1.14 0.95-1.13
Vila Oito 20-32 30-38
Expected 1.21-1.29 1.16-1.26
Worst case 0.96-1.09 0.95-1.05
Vila Oito West 12-21 30-40
Expected 1.22-1.55 1.14-1.42
Worst case 0.98-1.43 0.95-1.32
Vale dos Sonhos 12-26 40
Expected 1.20-1.31 1.15-1.24
Worst case 0.88-1.10 0.87-1.04
16.2.2 Waste dump slope design
The waste dumps will consist predominantly of limonite material. The dump stability assessment indicates that a 19° overall slope over 30 m height will be stable under worst case conditions. However, due to the uncertainties associated with the adopted shear strength parameters, the overall slope angle used in the current design; 3H:1V (18.4°) is endorsed for a 30 m dump height.
16.2.3 Trafficability
A trafficability study was undertaken on suitable types of mined materials and recommendations for haul road sheeting thicknesses provided in the report:
The transition material appears to be the poorest of the domains, and any difficulties in trafficability will depend on the scale and distribution of very poor zones within the domain. Sheeting is likely to be required for adequate trafficability in wet conditions.
The remaining materials should perform satisfactorily in dry conditions. Some planned maintenance will be required in poor zones encountered within the domain.
The ferricrete appears to be a potential sheeting material and the amount of ferricrete to be used for sheeting purposes was estimated in the mining study. There is sufficient ferricrete available for sheeting in-pit roads, inter-pit haulage roads and the process ROM pad. Further laboratory compaction and California bearing ratio (CBR) tests on ferricrete material may be necessary at the operational stage to ensure full understanding of the amount of routine maintenance that may be required for an adequate running surface and prevent rutting and pothole formation This would support its performance in practice as a sheeting material and aid in the identification of good quality deposits of ferricrete.
16.2.4 Geotechnical review of proposed pit design
Design checks for the slopes in each pit have been conducted using the “Factor of Safety – Overall slope angle” design charts developed using typical sections.

Horizonte Minerals Plc Araguaia Nickel Project Technical Report
Final November 2018 Page 197 of 342
The following factors should be considered when reviewing and applying the slope design recommendations:
• Where slope design modifications have been recommended, these are in relation to the elevation and position of the current ultimate slope toe as modelled on each of the pit wall cross-sections analysed.
• The recommended IRAs for the soil mass domains are controlled by the recommended batter design angles and berm widths. These designs are based on the stratigraphic and hydrogeological environment as currently modelled and/or assumed on the basis of available information. If this model changes with the incorporation of new data, then this may impact on batter and overall designs.
The batter heights used are 2 m,4 m and 6 m. Batter face angles for these shallow batters are formed by the scoop of the excavator buckets and are therefore assumed to be subvertical. The inter ramp angles (IRAs) in these relatively weak materials range from 30° to a maximum of 40°. The shallowest zones occur when there is a large exposure of the weak transition layer in a relatively deep portion of the pit.
Snowden therefore emphasises that if as the result of further work the geological/geotechnical model changes, and/or if there are major changes to the pit design, then provision should be made for a review of the geotechnical profiles and the slope stability of the resulting pit designs to ensure they meet the design acceptance criteria.
The slope design recommendations resulting from this geotechnical design study for the eight deposits
at the ANP were reported. Corresponding slope design parameters were also tabulated. The following
points should be noted when considering implementation of these recommendations:
• Design recommendations vary according to the batter height options available for mine planning
• Design recommendations are suitable for the purposes of pit optimisation and for both short and long term mine planning
• Once pit designs have been generated with these recommendations, it is strongly recommended the new designs undergo further geotechnical assessment
• IRAs are specified as batter crest to batter crest, or toe to toe
The majority of the slopes checked have met the target FoS of 1.2 and are conservatively designed.
Recommendations for further work is discussed in Section 26.
16.3 Mine method
The proposed mining cycle would include the following primary activities:
• Grade control
• Pit optimisation, design and scheduling
• Clearing; stripping, stockpiling and rehandling of topsoil
• Haulage, stockpiling and rehandling of ferricrete and ore.
Except for an extra ore rehandle step required for the satellite deposits, mining activities at Pequizeiro and the satellite deposits are essentially the same.
16.3.1 Grade control
Due to the local variability of the orebody contacts, grade control drilling and assaying will be necessary to define the ore prior to presentation to the plant.
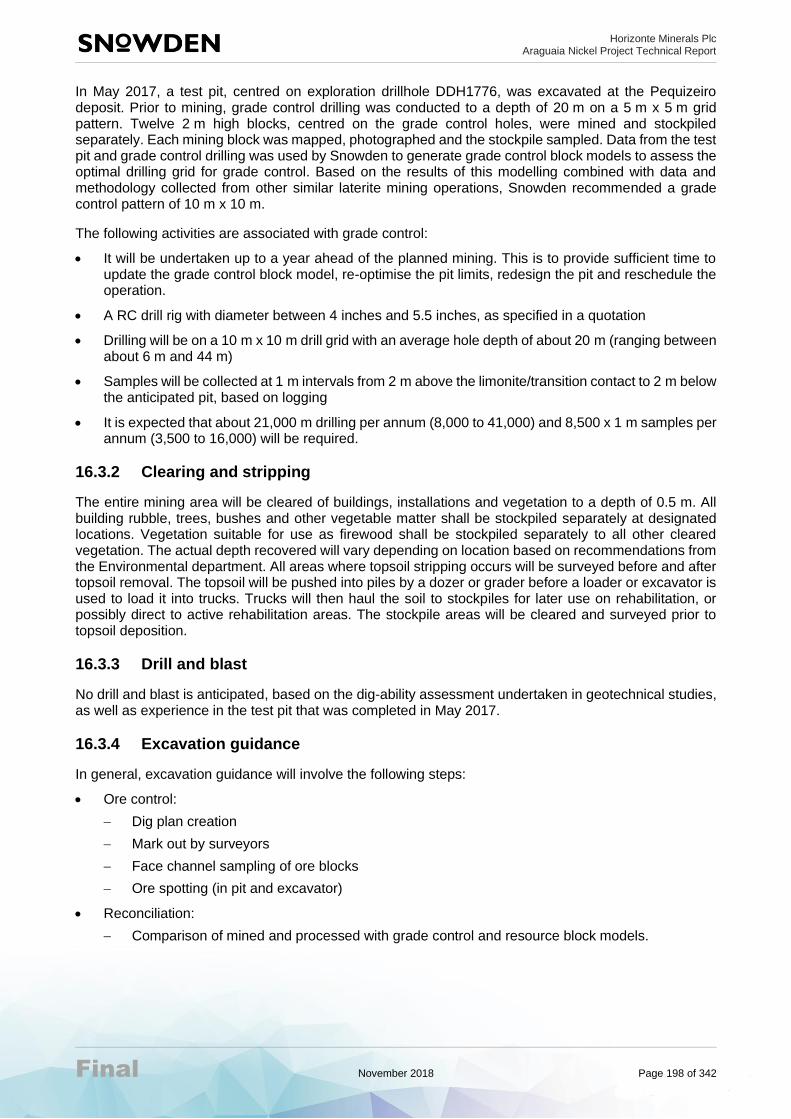
Horizonte Minerals Plc Araguaia Nickel Project Technical Report
Final November 2018 Page 198 of 342
In May 2017, a test pit, centred on exploration drillhole DDH1776, was excavated at the Pequizeiro deposit. Prior to mining, grade control drilling was conducted to a depth of 20 m on a 5 m x 5 m grid pattern. Twelve 2 m high blocks, centred on the grade control holes, were mined and stockpiled separately. Each mining block was mapped, photographed and the stockpile sampled. Data from the test pit and grade control drilling was used by Snowden to generate grade control block models to assess the optimal drilling grid for grade control. Based on the results of this modelling combined with data and methodology collected from other similar laterite mining operations, Snowden recommended a grade control pattern of 10 m x 10 m.
The following activities are associated with grade control:
• It will be undertaken up to a year ahead of the planned mining. This is to provide sufficient time to update the grade control block model, re-optimise the pit limits, redesign the pit and reschedule the operation.
• A RC drill rig with diameter between 4 inches and 5.5 inches, as specified in a quotation
• Drilling will be on a 10 m x 10 m drill grid with an average hole depth of about 20 m (ranging between about 6 m and 44 m)
• Samples will be collected at 1 m intervals from 2 m above the limonite/transition contact to 2 m below the anticipated pit, based on logging
• It is expected that about 21,000 m drilling per annum (8,000 to 41,000) and 8,500 x 1 m samples per annum (3,500 to 16,000) will be required.
16.3.2 Clearing and stripping
The entire mining area will be cleared of buildings, installations and vegetation to a depth of 0.5 m. All building rubble, trees, bushes and other vegetable matter shall be stockpiled separately at designated locations. Vegetation suitable for use as firewood shall be stockpiled separately to all other cleared vegetation. The actual depth recovered will vary depending on location based on recommendations from the Environmental department. All areas where topsoil stripping occurs will be surveyed before and after topsoil removal. The topsoil will be pushed into piles by a dozer or grader before a loader or excavator is used to load it into trucks. Trucks will then haul the soil to stockpiles for later use on rehabilitation, or possibly direct to active rehabilitation areas. The stockpile areas will be cleared and surveyed prior to topsoil deposition.
16.3.3 Drill and blast
No drill and blast is anticipated, based on the dig-ability assessment undertaken in geotechnical studies, as well as experience in the test pit that was completed in May 2017.
16.3.4 Excavation guidance
In general, excavation guidance will involve the following steps:
• Ore control:
− Dig plan creation
− Mark out by surveyors
− Face channel sampling of ore blocks
− Ore spotting (in pit and excavator)
• Reconciliation:
− Comparison of mined and processed with grade control and resource block models.

Horizonte Minerals Plc Araguaia Nickel Project Technical Report
Final November 2018 Page 199 of 342
16.3.5 Excavation
All deposits are proposed to be mined with typical truck and excavator mining using contractors. Snowden’s opinion is that other options (such as scraper/dozer systems or surface miners and similar) are unlikely to give a material improvement in project economics and are non-standard practice in Brazil. There are typically five horizons within the laterite profile located above the bedrock. The typical nickel laterite deposit profile at Araguaia is shown in Figure 16-2.
Figure 16-2 Araguaia laterite profile showing rock types
Ferricrete
Immediately below the soil is an iron cap layer (iron cap) which is brittle. This layer may be discontinuous and so the second ferricrete layer, known as pisolitic ferricrete (PF), is sometimes exposed. This layer contains unconsolidated individual pisolites. The lower ferricrete layer, below the PF, is called limonitic ferricrete (LF). This layer contains fused pisolites and exhibits increased goethite.
An investigation of the ferricrete was undertaken to determine potential drill and blast or ripping requirements, as well as the presence of significant oversize. During the test pitting program, a small number of ferricrete boulders were exposed. All were of a size that could be managed by the proposed mining fleet. The current assessment is that the ferricrete will not require drill and blast and any rock fracturing could be accomplished by track dozer. There was no other presentation of rock in any of the other ore or waste profiles.
Beneath the cap, there is often a more granular unconsolidated pisolitic iron-rich material that can be excavated with the iron cap. In the pits, the iron-rich layer averages about 4 m thick and varies between 0 m and 13.5 m. It closely follows the geomorphology of the land surface.

Horizonte Minerals Plc Araguaia Nickel Project Technical Report
Final November 2018 Page 200 of 342
The excavator and trucks can traffic directly on the iron cap which comfortably supports the machines. Hence there are little required roadworks.
The unconsolidated PF will be used as construction material. It will often be hauled directly to a construction site for use as platforms, roadways, and water control embankments. If there is any surplus it will be stockpiled for later construction use.
Due to a distinct change in colour, hardness, and texture the excavator operator can readily see the contact between the iron material and the underlying limonitic clays.
Limonite
The next layer in the profile is a limonite rich clay. The limonite was logged as upper yellow limonite (YL) that is more goethitic than the lower red limonite (RL) layer. This material typically increases in nickel grade and water content with depth and is freely dug with an excavator. The limonite layer inside the pits averages about 8 m in depth (it varies between 0 m and 33 m).
While the top of the limonite may be marginally trafficable with machinery, it is rarely possible towards the bottom. Accordingly, sheeted “finger” roads will be required to allow trucks to travel to and from the digging face. Generally, the loading unit will operate from the bench above and load into the trucks on the bench below. In some situations, dozers will be engaged to push material to the loading units.
The lower surface of the limonite is usually visually recognisable due to a change in colour (confirmed during bulk sample mining). As the limonite is typically low in nickel and high in silica to magnesia ratio, iron and alumina, it is treated as waste. To avoid limonite in the ore feed, the limonite/transition boundary will require moderately selective mining methods and an average of 300 mm of transition is assumed to be taken with the limonite, which is considered mining loss. The higher-grade limonite will be stockpiled in clearly demarcated areas for potential future use.
Transition
Transition is predominately ore. In the pits, it averages 6.5 m thick and varies between 0 m and 26 m. The transition lower contact pinches and swells into the saprolite, and thus does not appear everywhere. Low spots are generally where ground water concentrates and are thus very wet.
While the contact with the overlying limonite is fairly clear, the lower contact with saprolite is more gradational. The nickel concentration of the limonite (above) and the saprolite (below) is often similar at their boundary so there will be insignificant nickel dilution. However, the other elements often change over a short vertical interval and are of greater concern from a plant feed perspective. It is typically higher in nickel, iron, alumina, silica to magnesia ratio and iron to nickel ratio when compared to the saprolite. Where the transition is less than a full bench height (2 m) it will be mined with the underlying saprolite. This is accommodated in mine planning through the re-blocking of the grades at these boundaries.
Transition material is generally of high water content and not trafficable without sheeting. Accordingly, in most cases transition material will be mined predominantly from the bottom limonite bench. This implies that the excavator is reaching down and removing the last of the limonite and then the transition from more or less the same position. Where mining downwards from the last limonite bench is not safe or practical, it will be necessary to establish finger roads and bench access just below the transition in the top levels of the saprolite. The excavator will then be scraping down the face and loading trucks on the same level. Dozers will often be utilised to help feed the loading unit and clean off the limonite and transition layers appropriately.
Saprolite
Saprolite is predominately ore and averages about 6.5 m in thickness inside the pits (it varies between 0 m and 20 m). The pit floor in some instances reaches the bedrock contact. In most cases this occurs to satisfy pit geometry constraints (e.g. ramps, minimum widths).

Horizonte Minerals Plc Araguaia Nickel Project Technical Report
Final November 2018 Page 201 of 342
The saprolite is a variable mix of particle sizes from fines to larger rocks. The presence of these rocks increases with depth and is captured in the drill logs as “earthy saprolite”, which contains more clays, and “rocky saprolite” which contains less clays. The saprolite has a very high water content and will be mined with finger roads established on the bench. It is typically lower in nickel, iron, alumina, silica to magnesia ratio and iron to nickel ratio when compared to the transition.
The pit floor will likely be an uneven non-planar surface, possibly with some pinnacles and troughs. This may pose operational difficulties with access and water management and it is likely loading of trucks will occur with both the digger and truck on the bench above the pit floor level.
At the time of this report, exploration drilling had not encountered barren “core stones” or pinnacles typical of some other nickel laterite deposits which tend to increase towards the bedrock interface. Boulder sized core stones and pinnacles, should they occur, can cause a number of operating challenges from mining to processing. The test pitting that was undertaken at Pequizeiro did not find any evidence of core stones, however the test pit only penetrated to half the depth of the saprolite. Snowden considers that the risk of barren boulders occurring in the ore profile was reduced as demonstrated by the test pit outcome but remains a risk. Similarly, high-grade nickel occurrences in thin cracks and altered faces of rocks near the bedrock contact have not been encountered. Should core stones be encountered they would be removed from the pit and set dumped in the waste areas.
16.3.6 Trafficability
A preliminary assessment of the trafficability of the materials indicates that sheeting is required to traffic the pit.
Sheeting will be sourced from the unconsolidated PF which is present above the limonite over much of the deposit. The test pitting program produced stockpiles of clean pisoltic “pea” gravel with deeper horizons producing rocks of fused pisolitic material (<0.5 m). These materials, after geotechnical testwork, were deemed to be suitable for road construction and sheeting in-pit areas. It is possible that slag could be used an alternate/supplemental sheeting supply in the future, but has not been considered in this study.
The quantity of PF was estimated from surfaces and solids coded into the mining model. The amount of PF material available is sufficient to supply the sheeting requirements of the mine and provide some excess material for aiding in construction of main haulage roads and improving stockpile and waste dump trafficability. It is likely the LF will also be used as a substrate below the PF. LF has not been estimated in the block models and quantities were estimated based on the drillhole logging.
Based on the trafficability assessment, for in-pit purposes with a 40-t capacity truck, sheeting quantities were estimated using the thicknesses in Table 16-3. Mining slices were estimated at approximately 20 m wide based on the dig envelope of a 48 t excavator. With a finger road width of 7 m in each mining slice, this equates to 35% of the bench surface being sheeted. The final mining fleet as evaluated in the current tender process uses slightly smaller trucks and excavators, being 25 t trucks and 40 t excavators, as a result there may be an opportunity to reduce the sheeting thickness.
Table 16-3 Sheeting thickness by material type
Material type Sheeting thickness (m)
Limonite 0.38
Transition 0.61
Saprolite 0.72
Bedrock 0.30
For ex-pit roads, sheeting quantities were 1 m thick for all season roads (Pequizeiro) and 0.6 m for dry season roads (satellite deposits).
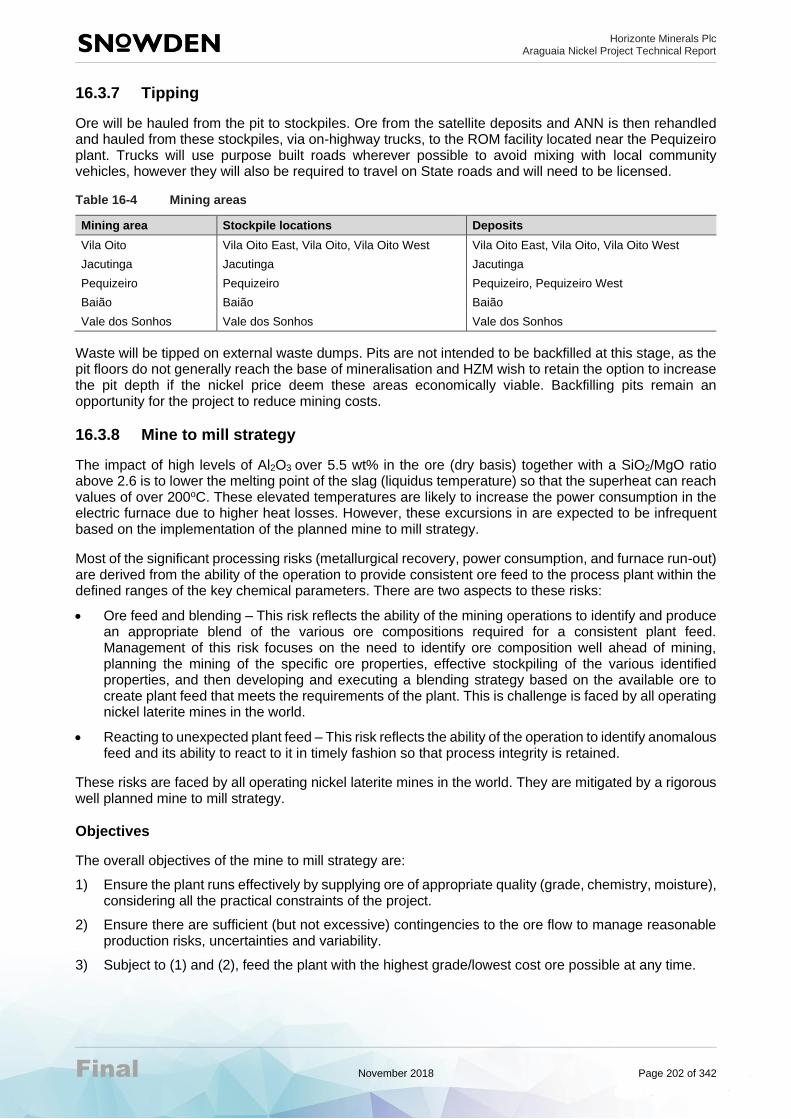
Horizonte Minerals Plc Araguaia Nickel Project Technical Report
Final November 2018 Page 202 of 342
16.3.7 Tipping
Ore will be hauled from the pit to stockpiles. Ore from the satellite deposits and ANN is then rehandled and hauled from these stockpiles, via on-highway trucks, to the ROM facility located near the Pequizeiro plant. Trucks will use purpose built roads wherever possible to avoid mixing with local community vehicles, however they will also be required to travel on State roads and will need to be licensed.
Table 16-4 Mining areas
Mining area Stockpile locations Deposits
Vila Oito Vila Oito East, Vila Oito, Vila Oito West Vila Oito East, Vila Oito, Vila Oito West
Jacutinga Jacutinga Jacutinga
Pequizeiro Pequizeiro Pequizeiro, Pequizeiro West
Baião Baião Baião
Vale dos Sonhos Vale dos Sonhos Vale dos Sonhos
Waste will be tipped on external waste dumps. Pits are not intended to be backfilled at this stage, as the pit floors do not generally reach the base of mineralisation and HZM wish to retain the option to increase the pit depth if the nickel price deem these areas economically viable. Backfilling pits remain an opportunity for the project to reduce mining costs.
16.3.8 Mine to mill strategy
The impact of high levels of Al2O3 over 5.5 wt% in the ore (dry basis) together with a SiO2/MgO ratio above 2.6 is to lower the melting point of the slag (liquidus temperature) so that the superheat can reach values of over 200oC. These elevated temperatures are likely to increase the power consumption in the electric furnace due to higher heat losses. However, these excursions in are expected to be infrequent based on the implementation of the planned mine to mill strategy.
Most of the significant processing risks (metallurgical recovery, power consumption, and furnace run-out) are derived from the ability of the operation to provide consistent ore feed to the process plant within the defined ranges of the key chemical parameters. There are two aspects to these risks:
• Ore feed and blending – This risk reflects the ability of the mining operations to identify and produce an appropriate blend of the various ore compositions required for a consistent plant feed. Management of this risk focuses on the need to identify ore composition well ahead of mining, planning the mining of the specific ore properties, effective stockpiling of the various identified properties, and then developing and executing a blending strategy based on the available ore to create plant feed that meets the requirements of the plant. This is challenge is faced by all operating nickel laterite mines in the world.
• Reacting to unexpected plant feed – This risk reflects the ability of the operation to identify anomalous feed and its ability to react to it in timely fashion so that process integrity is retained.
These risks are faced by all operating nickel laterite mines in the world. They are mitigated by a rigorous well planned mine to mill strategy.
Objectives
The overall objectives of the mine to mill strategy are:
1) Ensure the plant runs effectively by supplying ore of appropriate quality (grade, chemistry, moisture), considering all the practical constraints of the project.
2) Ensure there are sufficient (but not excessive) contingencies to the ore flow to manage reasonable production risks, uncertainties and variability.
3) Subject to (1) and (2), feed the plant with the highest grade/lowest cost ore possible at any time.

Horizonte Minerals Plc Araguaia Nickel Project Technical Report
Final November 2018 Page 203 of 342
Plant requirement
The plant has a number of grade constraints to ensure it runs effectively. These are shown, against the average LOM grades in Table 16-5. The SiO2:MgO is most constraining to the project, followed by iron and Al2O3. The SiO2:MgO ratio is highly correlated Fe and Al2O3, so managing SiO2:MgO should help to manage this less constrained elements. However, with only 3% tolerance on SiO2:MgO, grade control, planning and operations must be well coordinated in order to ensure the plant performs as intended.
Table 16-5 Grade targets
Grade Target LOM average Percent difference
SiO2/MgO Maximum 2.6% 2.52% 3%
Fe Maximum 18.5% 17.5% 7%
Fe/Ni Minimum 7.6 10.15 34%
Al2O3 Maximum 5.5% 4.94 10%
Material classification
To simplify the mine planning and operations, material is classified into bins according to SiO2/MgO ratio and nickel grade (Table 16-6). This supports the management of both SiO2/MgO ratio and maximising nickel grade (and revenue). Stockpiles will be separated into these classifications.
Table 16-6 Proposed ore types
Type Nickel bin SiO2:MgO bin
SiO2:MgO ≥ 2.6 SiO2:MgO < 2.6
Marginal Ore
Ni % ≥ cut-off Mineralised Waste, High SiO2:MgO
(MWH) Mineralised Waste, Low SiO2:MgO (MWL)
Ni % ≥ 1.2 Sub-Grade, High SiO2:MgO (SGH) Sub-Grade, Low SiO2:MgO (SGL)
Ore
Ni % ≥ 1.4 Low Grade, High SiO2:MgO (LGH) Low Grade, Low SiO2:MgO (LGL)
Ni % ≥ 1.6 Medium Grade, High SiO2:MgO (MGH) Medium Grade, Low SiO2:MgO (MGL)
Ni % ≥ 1.8 High Grade, High SiO2:MgO (HGH) High Grade, Low SiO2:MgO (HGL)
The ability to separate ore into high and low SiO2:MgO ensures there are numerous sources of high and low material to assist with any blend mitigations, assuming that material has been classified correctly through grade control modelling.
Mining strategy
The ROM pad is approximately 500 m x 700 m. In addition to pit side grade stockpiles, there are eight stockpiles on the ROM of 100 klcm size to manage the grade feed tolerances. The mining strategy involves gathering sufficient information to predict block grades, through grade control, followed by storage of ore into bins classified by SiO2:MgO and nickel grade. At all times, the intent is to separate and track grade, rather than to homogenise. This will allow ore to be blended within the process flows (i.e. post-crusher) where sampling can be used to identify compliance to grade targets.
ROM material flow
The proposed solution allows for two piles on the ROM: high and low SiO2/MgO. Material on these piles will have grades tracked as based on grade control and stockpile grab samples. Material will be fed from these ROM piles to the crusher based on demand from the plant, ideally this would be a consistent blend of material (as close to the target grade as possible) on an hourly basis. However, there may be calls to increase or decrease the SiO2/MgO (based on feedback from the plant).
Crushed ore is conveyed to the homogenisation shed sampled regularly and produces a shift composite for assaying.
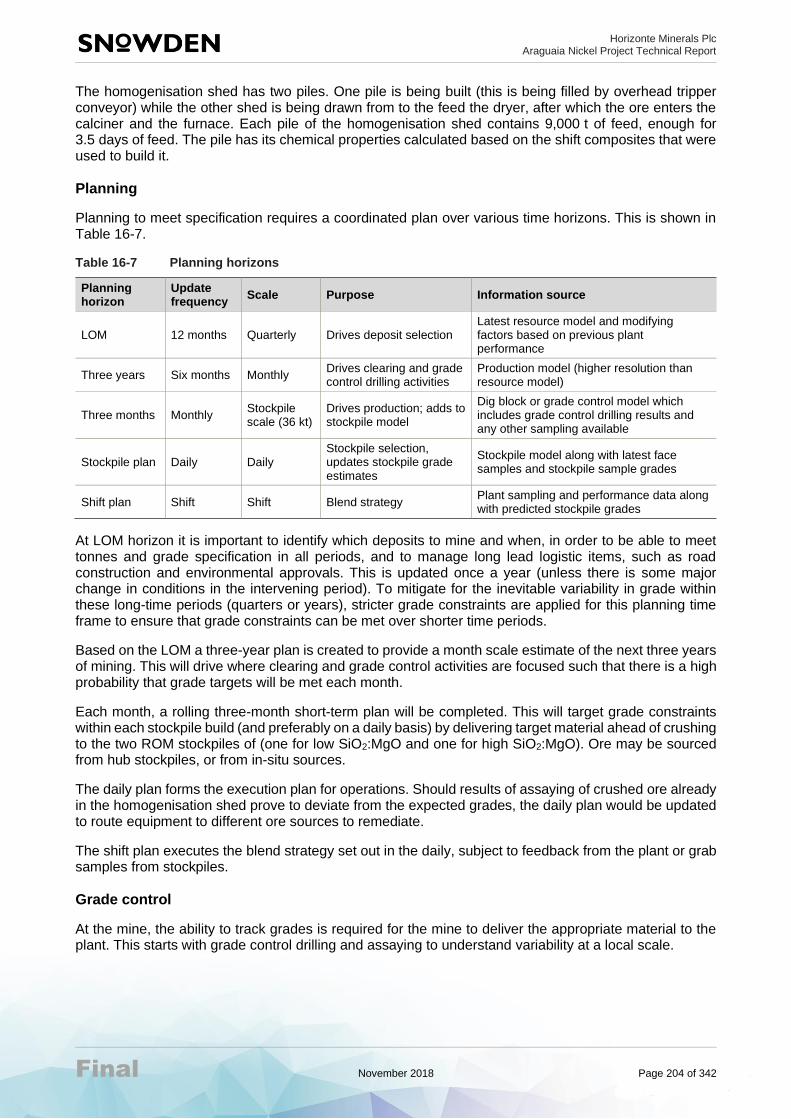
Horizonte Minerals Plc Araguaia Nickel Project Technical Report
Final November 2018 Page 204 of 342
The homogenisation shed has two piles. One pile is being built (this is being filled by overhead tripper conveyor) while the other shed is being drawn from to the feed the dryer, after which the ore enters the calciner and the furnace. Each pile of the homogenisation shed contains 9,000 t of feed, enough for 3.5 days of feed. The pile has its chemical properties calculated based on the shift composites that were used to build it.
Planning
Planning to meet specification requires a coordinated plan over various time horizons. This is shown in Table 16-7.
Table 16-7 Planning horizons
Planning horizon
Update frequency
Scale Purpose Information source
LOM 12 months Quarterly Drives deposit selection Latest resource model and modifying factors based on previous plant performance
Three years Six months Monthly Drives clearing and grade control drilling activities
Production model (higher resolution than resource model)
Three months Monthly Stockpile scale (36 kt)
Drives production; adds to stockpile model
Dig block or grade control model which includes grade control drilling results and any other sampling available
Stockpile plan Daily Daily Stockpile selection, updates stockpile grade estimates
Stockpile model along with latest face samples and stockpile sample grades
Shift plan Shift Shift Blend strategy Plant sampling and performance data along with predicted stockpile grades
At LOM horizon it is important to identify which deposits to mine and when, in order to be able to meet tonnes and grade specification in all periods, and to manage long lead logistic items, such as road construction and environmental approvals. This is updated once a year (unless there is some major change in conditions in the intervening period). To mitigate for the inevitable variability in grade within these long-time periods (quarters or years), stricter grade constraints are applied for this planning time frame to ensure that grade constraints can be met over shorter time periods.
Based on the LOM a three-year plan is created to provide a month scale estimate of the next three years of mining. This will drive where clearing and grade control activities are focused such that there is a high probability that grade targets will be met each month.
Each month, a rolling three-month short-term plan will be completed. This will target grade constraints within each stockpile build (and preferably on a daily basis) by delivering target material ahead of crushing to the two ROM stockpiles of (one for low SiO2:MgO and one for high SiO2:MgO). Ore may be sourced from hub stockpiles, or from in-situ sources.
The daily plan forms the execution plan for operations. Should results of assaying of crushed ore already in the homogenisation shed prove to deviate from the expected grades, the daily plan would be updated to route equipment to different ore sources to remediate.
The shift plan executes the blend strategy set out in the daily, subject to feedback from the plant or grab samples from stockpiles.
Grade control
At the mine, the ability to track grades is required for the mine to deliver the appropriate material to the plant. This starts with grade control drilling and assaying to understand variability at a local scale.

Horizonte Minerals Plc Araguaia Nickel Project Technical Report
Final November 2018 Page 205 of 342
The following activities are associated with grade control:
• Drilling will be on a 10 m x10 m drill grid with an average hole depth of about 20 m (ranging between about 6 m and 44 m). Drilling will be with a RC drill rig with diameter between 4 inches and 5.5 inches, as specified in a quotation. About 21,000 m drilling per annum (8,000 to 41,000) is expected.
• Samples will be collected at 1 m intervals from 2 m above the limonite/transition contact to 2 m below the anticipated pit, based on logging. It is expected that about 8,500 x 1 m samples per annum (3,500 to 16,000) will be required.
Grade control drilling will be undertaken up to a year ahead of the planned mining. This is to provide sufficient time to update the grade control block model, re-optimise the pit limits, redesign the pit and reschedule the operation.
The grade control block model will detail the block grades to a 5 m x 5 m x 1 m resolution. This model will be used to flag ore into its relevant materials classifications. The grades will be tracked through the mining chain using a commercially available package. Regular reconciliation of grades is recommended to understand any bias in the model, and for effective mitigations to be applied to improve the confidence of this estimate.
Grab samples will be taken from the ROM stockpiles as they are being built. These will be used to validate the predicted feed from the mine and allow for corrective action to be taken.
In the plant, the shift composite will be used to validate feed from the ROM and provide an opportunity for corrective action to be taken.
Corrective action
For the mine, should sample results deviate from target during a ROM stockpile build, there are a number of corrective actions available to regain grade:
• Adjust proportion pulled from the ROM stockpiles to achieve desired chemistry in the feed
• The subsequent ROM stockpile build schedule can be adjusted to replenish ROM stockpiles appropriately
• Failing having viable material from the HUB stockpile, specific material can be targeted within a day from: (a) PQZ stockpiles, (b) other stockpiles, (c) direct from any active pit.
For the plant, if the shift composite shows deviation from plan, the following corrective actions can be taken:
• Adjust blend from ROM stockpiles to correct the homogenisation pile
• Source specialist corrective ores (set aside for this kind of thing)
• Create a blend at the homogenisation shed using recently fed ores.
16.3.9 Rehabilitation
Surface waste dump landforms at each of the various mining locations will be progressively rehabilitated during their construction. Once the mining location is completed, the upper surface of the waste dump will be rehabilitated. Topsoil will be sourced directly from the mining areas or from topsoil stockpiles.
The following activities were allowed for the rehabilitation of waste dumps:
• Push down waste dump batters to final formation
• Form waste dump top to final formation
• Load topsoil and dump at rehabilitation area within 1,000 m of source
• Spread topsoil onto battered slopes to minimum thickness of 300 mm
• Rip and seed waste dump battered slopes
Horizonte Minerals Plc Araguaia Nickel Project Technical Report
Final November 2018 Page 206 of 342
• Spread topsoil onto waste dump top to minimum thickness of 300 mm
• Rip and seed waste dump topsoil.
16.3.10 Weather management
Mining at Araguaia will be impacted heavily by wet weather during the wet season (October to March). Nearby operations typically reduce mining activities during this time, building a sizable stockpile at the plant during the dry season in order to mitigate its impact. At Araguaia, the measures taken to ensure continuity of operations during the wet season are:
• Only the Pequizeiro pits will be mined during the wet season. The roads in this area (and around the plant) will be designed to handle wet conditions.
• Ore will not be hauled from hub stockpiles during the wet season. All ore material will be hauled during the dry season and stockpiled on the Pequizeiro ROM stockpiles.
• Sufficient stockpiles will be held at Pequizeiro and in the ROM pad area to ensure that the entire wet season plant feed can be sourced from stockpiles if required.
• Stockpiles on the ROM pad area will be covered in plastic sheets to minimise erosion and moisture update during the wet season.
• Haulage from ANN will be use the on highway trucks and operate with the seasonal restrictions similar to the ore from satellite pits and stockpiles.
16.3.11 Water management
Groundwater and rainfall will contribute to the accumulation of water in the pits. The effect of rainfall will be mitigated by a number of measures:
• Mining of the various satellite deposits will be mostly carried out in the dry season
• Moving ore stockpiles from the satellite deposit hub stockpiles to the ROM prior to the onset of the wet season
• At Pequizeiro, during the wet season, compacted sheeting material will be used in trafficable areas of the pit and on roads to the ROM pad
• The mining rate will be increased during in dry weather
• The mining schedule will ensure the establishment of in-pit sumps to reduce water levels ahead of mining.
Analysis has shown that water drains quickly through the pisolitic and ferricrete horizons and more slowly through the limonitic horizons. All these material types are considered reasonably permeable. Perched water will not be encountered until the transition material (below the limonite) is reached. This material is less permeable with very shallow lenses of water accumulating.
To manage water inflows, it will be necessary to mine pit floors on a slight gradient (1%) and/or keep the trucks and excavators off the pit floor when water is encountered. Water will need to be removed from the pit floor via floor drains and directed to a sump where it can be pumped from the pit.
Where vehicles are required to travel across a pit floor that is wet, sheeting will be used to provide a dry and trafficable running surface. Multiple mining faces will be kept open in the pits to provide alternative working areas in the event a wet mining face is encountered and presents trafficability problems.
Ground water in the pits can occur as perched tables, with the more substantial aquifer interface closer to the bedrock. This will generally be several metres below the pit floor. The perched water tables (if and when they occur) will be of variable size and volume. Small perched are expected to drain fully within a couple of days. A model of the perched water was completed and the expected wet season average pumping requirements (in litres per second) were estimated. It is anticipated that pumping from up to 10 locations with capacity for 2 litres per second for each pump will be required for the first 10 years.

Horizonte Minerals Plc Araguaia Nickel Project Technical Report
Final November 2018 Page 207 of 342
16.3.12 Slag rehandle
Approximately 25 Mt of slag rejects will be produced by the process plant over the LOM. This will be stockpiled in the slag storage facility adjacent to the plant. Slag will be stockpiled rather than added to the waste piles as it may have commercial uses either within the project or in the region (e.g. as road sheeting).
16.4 Mine design
16.4.1 Methodology
All eight deposits underwent a standard process of pit optimisation, waste dump design and pit design.
Pit optimisations were completed in Whittle Four-X™ software, an industry standard package. This software determines the economic limits of each deposit after accounting for estimated revenues and costs associated with mining each block and the maximum allowable slope angles. Nested pit shells produced by the pit optimisation were used in the selection of the “optimum” pit shell and guiding the location of pit stages.
Using the selected pit shells, pit designs for the final pit limits and stages were undertaken in MineSight®. The pit designs were used to derive volumes for waste dump placement. Feedback from all relevant stakeholders was used to determine a waste disposal concept for each deposit, including both ex-pit and in-pit options. After calculating the volumes of each waste type, waste dumps were designed to contain this material and minimise required haulage distances.
16.4.2 Mining model
The following steps were undertaken on the resource models to derive the mining models:
• Field names were standardised.
• Re-blocking to 6.25 m x 6.25 m x 2 m high. When grade control drilling is undertaken at 10 m x 10 m scale, the selective mining unit (SMU) should be able to be adjusted to 5 m x 5 m x 2 m. However, as the sub-cell resolution of the geology model was 6.25 m x 6.25 m x 0.5 m, this size was used for the FS.
• The top 300 mm of transition at the top of each SMU was reassigned to limonite.
• The other rock type boundaries (limonite to ferricrete, transition to saprolite, saprolite to basement) continued to be re-blocked to 2 m, as the trade-off between simpler mining and grade contaminants is not as pronounced. No further dilution or loss was applied in the model.
• PF wireframes were coded into the mining model based on the SMU size.
• Exclusion areas (e.g. off lease) were coded into the models.
• Material types for scheduling were assigned (Figure 16-3).
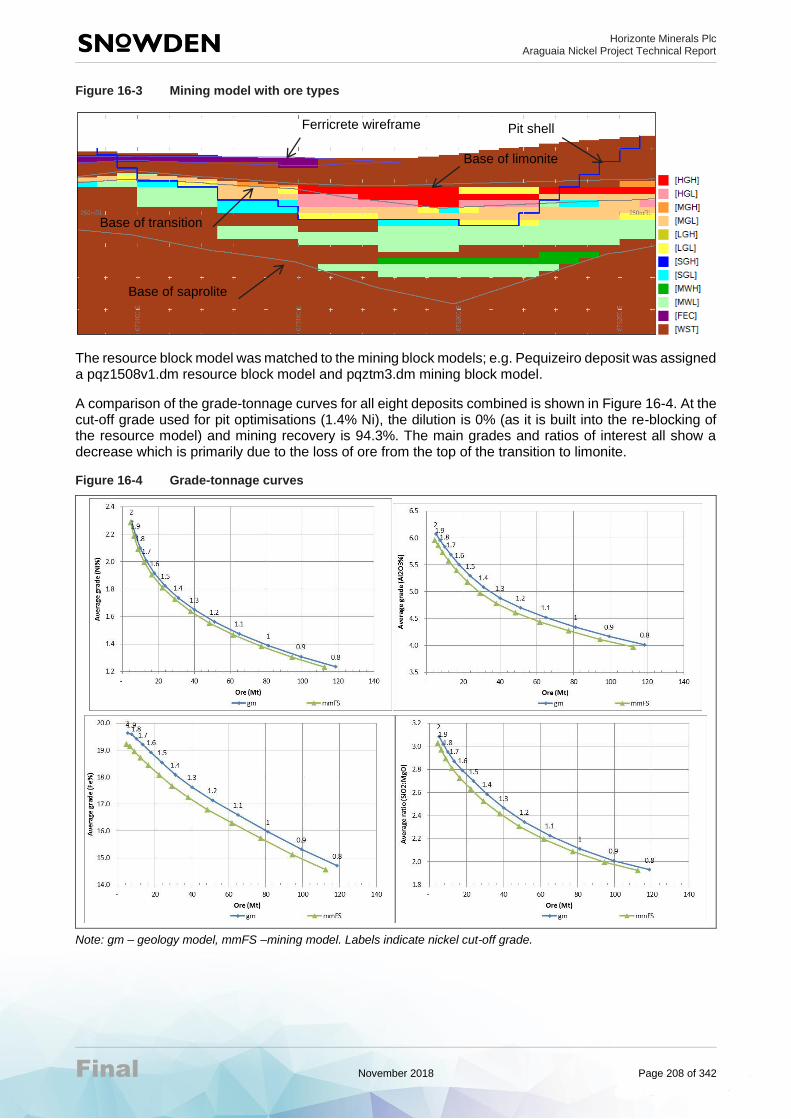
Horizonte Minerals Plc Araguaia Nickel Project Technical Report
Final November 2018 Page 208 of 342
Figure 16-3 Mining model with ore types
The resource block model was matched to the mining block models; e.g. Pequizeiro deposit was assigned a pqz1508v1.dm resource block model and pqztm3.dm mining block model.
A comparison of the grade-tonnage curves for all eight deposits combined is shown in Figure 16-4. At the cut-off grade used for pit optimisations (1.4% Ni), the dilution is 0% (as it is built into the re-blocking of the resource model) and mining recovery is 94.3%. The main grades and ratios of interest all show a decrease which is primarily due to the loss of ore from the top of the transition to limonite.
Figure 16-4 Grade-tonnage curves
Note: gm – geology model, mmFS –mining model. Labels indicate nickel cut-off grade.
Base of transition
Base of saprolite
Base of limonite
Pit shell Ferricrete wireframe

Horizonte Minerals Plc Araguaia Nickel Project Technical Report
Final November 2018 Page 209 of 342
16.4.3 Pit optimisation
Parameters and modifying factors
Pit optimisations were completed based on parameters derived from the PFS in 2016. These parameters are detailed below. Subsequent to the mine planning work, the parameters were updated. Snowden completed optimisations to check the validity of the pit shells derived, and these were found to be valid and conservative. There may be some opportunity to explore improvements to the inventory in future mine planning.
The following primary considerations are noted:
• Only Measured and Indicated Resources were considered for pit optimisation. Inferred Resources within the final pits were reported, but not included as potential plant feed
• All deposit starting surfaces were the topographies used to generate the resource models
• The only deposit impacted by lease boundaries is Vale dos Sonhos. An offset of 10 m was applied to allow access around the pit
• A 30° overall wall angle was applied for pit optimisation based on information derived during the PFS. Subsequent geotechnical studies undertaken as part of the FS resulted in sectors with varying slope angles. However, the 30° overall wall angle was acceptable in the vast majority of mining sectors.
• Dilution and mining recovery were determined in the mining mode
• A process rate of 900 kt/a (dry) was applied; and a process recovery rate of 92% applied to all ore meeting specification
• A mining cost of US$5/ dmt was applied to all blocks. An incremental ore premium of US$10/ dmt ore was applied to cover grade control, stockpile management and fixed mining costs. Incremental costs for ore haulage from each deposit were:
− US$1/t for Baião and Jacutinga
− US$2/t for Vila Oito, Vila Oito East and Vila Oito West
− US$15/t for Vale dos Sonhos.
These costs were based on contract quotations sourced from the PFS.
• A process cost of US$90/t was applied for all ore, based on costing completed during the PFS.
• A royalty cost of 2% was applied for the pit optimisation.
• A nickel price of US$11,000/t Ni was applied for pit optimisation. No revenue was attributed to the iron content of the ferronickel (FeNi) product.
The marginal cut-off grade (based on the above parameters) is approximately 1% Ni and summarised by deposit in Table 16-8. However, in order to target the highest 25 Mt of material the cut-off grade was raised to 1.4% Ni for pit optimisation.
Table 16-8 Marginal cut-off grade by deposit
Deposit PQZ PQW JAC BAI VOI VOE VOW VDS
Ni (%) 1.01 1.01 1.02 1.02 1.03 1.03 1.03 1.16
Optimisation results
Pit shells were selected on the basis of meeting a target of 25 Mt of high-grade ore (>1.4% Ni). This occurs midway between the 0.85 and 0.90 revenue factor pit shells. A summary of the selected pit shells is shown in Table 16-9. Both sets of pit shells were selected for pit design, with the higher SiO2:MgO areas between the two pits shells omitted to improve the overall SiO2:MgO grade.

Horizonte Minerals Plc Araguaia Nickel Project Technical Report
Final November 2018 Page 210 of 342
Table 16-9 Pit optimisation – selected shells
Deposit Pit
shell
Rev.
factor
Pit
size
(kt)
Strip ratio
(w:o)
Waste
(kt)
Ore
(Mt)
Ni
(%)
Fe
(%)
Al2O3
(%)
SiO2
(%)
MgO
(%)
SiO2:
MgO
Rec
nickel
(kt)
PQZ 9 0.85 26.0 1.66 16.3 9.8 1.76 16.3 5.73 41.6 15.0 2.77 158.0
PQW 5 0.85 1.2 3.10 0.9 0.3 1.61 20.1 4.59 42.9 10.7 4.03 4.3
JAC 9 0.85 2.7 1.87 1.8 0.9 1.86 16.5 3.08 40.6 18.8 2.15 16.1
BAI 12 0.85 12.2 3.49 9.5 2.7 1.75 16.7 4.53 41.0 16.0 2.56 43.7
VOI 8 0.85 10.0 3.02 7.6 2.5 1.75 14.3 3.43 42.4 20.3 2.09 40.3
VOE 5 0.85 7.3 2.96 5.5 1.8 1.62 15.9 3.72 40.7 18.4 2.21 27.5
VOW 6 0.85 2.7 3.26 2.0 0.6 1.69 18.3 4.12 42.8 12.8 3.33 9.7
VDS 8 0.85 15.2 2.09 10.3 4.9 1.85 22.1 5.82 33.6 13.5 2.50 83.6
Total 0.85 77.3 2.28 53.7 23.6 1.76 17.4 5.05 39.9 15.7 2.54 383.2
PQZ 10 0.90 26.8 1.71 16.9 9.9 1.76 16.3 5.73 41.6 15.0 2.77 159.9
PQW 6 0.90 1.4 3.29 1.1 0.3 1.59 20.4 4.64 42.9 10.2 4.21 4.9
JAC 10 0.90 2.9 1.94 1.9 1.0 1.85 16.5 3.09 40.6 18.8 2.16 16.5
BAI 13 0.90 14.4 3.71 11.4 3.1 1.73 16.7 4.53 41.1 15.9 2.58 48.6
VOI 9 0.90 11.5 3.18 8.8 2.8 1.73 14.3 3.44 42.3 20.2 2.09 43.8
VOE 6 0.90 8.7 3.16 6.6 2.1 1.61 16.1 3.69 40.8 18.1 2.25 30.8
VOW 7 0.90 3.4 3.58 2.6 0.7 1.67 18.4 4.12 42.5 12.8 3.31 11.3
VDS 9 0.90 18.1 2.18 12.4 5.7 1.81 21.9 5.72 33.6 14.1 2.39 94.9
Total 0.90 87.2 2.41 61.6 25.5 1.75 17.5 5.01 39.8 15.8 2.53 410.5
Sensitivity results
Deterministic pit optimisation sensitivities (at a range of prices) were run on the following scenarios:
• No raised cut-off (INDU)
• Inclusion of Inferred material as ore feed (INF)
• Combination of the above (INFU).
The sensitivities indicate that:
• Removing the raised nickel cut-off (i.e. using marginal cut-off grades) would result in a nearly 50% increase in ore for less than a 20% increase in pit size. The Pequizeiro deposit had the largest potential increase in ore tonnes.
• Including Inferred material only increases the ore and pit size by about 6%.
• The combination of inferred material and no raised cut-off plus a doubling of the input price (i.e. revenue factor 2 instead of 0.9 increases the ore by 200% with a 300% increase in pit size.
Removing either the raised nickel cut-off grade (additional ore is primarily from pit floor) or including the Inferred material does not significantly increase the pit areas. However, significant increases occur when the nickel price is also increased (INFU RF2).
16.4.4 Pit design
Snowden used the design criteria listed in Table 16-10 for the pit designs. All roads and ramps are 20 m wide with a maximum angle of 10% for internal pit roads and 5% for inter-pit roads (e.g. Pequizeiro to Baião). The minimum width for all stages was 30 m with a minimum mining width of 20 m. Pit floors were designed flat but will need to be inclined at Pequizeiro, to aid drainage in the wet season, once grade control and final limits are determined.

Horizonte Minerals Plc Araguaia Nickel Project Technical Report
Final November 2018 Page 211 of 342
Table 16-10 Pit design parameters by sector
Deposit Sector Batter angle
(°) Batter height
(m) Berm width
(m) Inter-ramp slope (toe to
toe, no ramp) (°)
Pequizeiro
1 80 4 5.3 33.7
2 80 4 6.9 27.7
3 80 4 6.3 29.7
Pequizeiro West All 80 4 5.3 33.7
Baião 1 and 2 80 4 5.3 33.7
3 80 4 5.5 32.8
Jacutinga All 80 4 5.3 33.7
Vila Oito 1 80 4 6.3 29.7
2 80 4 5.3 33.7
Vila Oito West 1 and 3 80 4 5.3 33.7
2 80 4 6.3 29.7
Vila Oito East All 80 4 5.3 33.7
Vale dos Sonhos All 80 4 5.3 33.7
Geotechnical design slope sectors in relation to the 0.9 revenue factor pit shells from the pit optimisation were completed.
Pequizeiro
Figure 16-5 shows the ultimate Pequizeiro pit split into 46 stages. The stages were ordered so that water could be directed into the deeper areas of the ultimate pit (red arrows show the generalised water flow) whilst targeting higher nickel grades. The designs allow mining to commence independently in stages 1, 23, 27 or 46.
Figure 16-5 Ultimate pit stages – Pequizeiro
Pequizeiro West
Figure 16-6 shows the ultimate Pequizeiro West pit split into three stages. The two stages in the larger pit were ordered to allow water to be drained into stage 1 which is deeper. Mining can commence independently in stages 1 or 3.

Horizonte Minerals Plc Araguaia Nickel Project Technical Report
Final November 2018 Page 212 of 342
Figure 16-6 Ultimate pit stages – Pequizeiro West
Baião
Figure 16-7 shows the ultimate Baião pit split into 24 stages. The stages were ordered so that water could be directed into the deeper areas of the ultimate pit (red arrows show the generalised water flow) whilst targeting higher nickel grades. The designs allow mining to commence independently in stages 1, 5, 6, 7, 8, 13, 14, 21, 22, 23 or 24.
Figure 16-7 Ultimate pit stages – Baião
Jacutinga
Figure 16-8 shows the ultimate Jacutinga pit split into seven stages. The stages were ordered so that water could be directed into the deeper area of the ultimate pit (red arrows show the generalised water flow) whilst targeting higher nickel grades. Mining can only commence independently in stage 1.

Horizonte Minerals Plc Araguaia Nickel Project Technical Report
Final November 2018 Page 213 of 342
Figure 16-8 Ultimate pit stages – Jacutinga
Vila Oito
Figure 16-9 shows the ultimate Vila Oito pit split into 15 stages. The stages were ordered so that water could be directed into the deeper areas of the ultimate pit (red arrows show the generalised water flow) whilst generally targeting higher nickel grades. The designs allow mining to commence independently in stages 1, 2 or 6. The walls in stages 6 to 15 are about 4° steeper than the final geotechnical parameters recommend and will need to be redesigned before mining. This will result in a minor increase in the overall pit volume.
Figure 16-9 Ultimate pit stages – Vila Oito
Vila Oito West
Figure 16-10 shows the ultimate Vila Oito West pit split into 10 stages. With the exception of stages 7 and 8, the designs are independent of each other.

Horizonte Minerals Plc Araguaia Nickel Project Technical Report
Final November 2018 Page 214 of 342
Figure 16-10 Ultimate pit stages – Vila Oito West
Vila Oito East
Figure 16-11 shows the ultimate Vila Oito East pit split into 10 stages. The stages were ordered so that water could be directed into the deeper areas of the ultimate pit (red arrows show the generalised water flow) whilst generally targeting higher nickel grades. The designs allow mining to commence independently in stages 1 and 7. Stage 6 could also be started independently but has a lower value than stage 4.
Figure 16-11 Ultimate pit stages – Vila Oito East
Vale dos Sonhos
Figure 16-12 shows the ultimate Vale dos Sonhos pit split into 39 stages. The stages were ordered so that water could be directed into the deeper areas of the ultimate pit (red arrows show the generalised water flow) whilst generally targeting higher nickel grades. The designs allow mining to commence independently in stages 1, 2, 4, 11, 18, 22, 26, 20, 32, 33, 25, 36 and 39.

Horizonte Minerals Plc Araguaia Nickel Project Technical Report
Final November 2018 Page 215 of 342
Figure 16-12 Ultimate pit stages – Vale dos Sonhos
16.4.5 Mining inventory
Table 16-11 summarises the mining inventory by deposit. An additional 2% of ore was re-assigned as waste to account for anticipated ore loss associated with recovering the in-pit sheeting which will have a high SiO2:MgO ratio.
• Pequizeiro is the largest contributor to the total ore quantity at the lowest strip ratio with generally acceptable grades.
• Pequizeiro West is the smallest contributor to the total ore quantity with poor quality ore (low nickel, high iron and silica to magnesia ratio) compared to the other deposits. It also has one of the higher strip ratios.
• Baião has a near average ore quality at the second worst strip ratio.
• Jacutinga is one of the smaller contributors to total ore quantity; however, the ore is good quality (high nickel, low iron, alumina and silica to magnesia ratio) compared to the other deposits. It also has the second lowest strip ratio.
• Vila Oito has one of the better ore qualities at an unfavourable strip ratio compared to other deposits.

Horizonte Minerals Plc Araguaia Nickel Project Technical Report
Final November 2018 Page 216 of 342
• Vila Oito West is one of the smaller contributors to total ore quantity with generally unfavourable grades and the highest strip ratio.
• Vila Oito East has one of the better ore qualities, however has one of the lowest nickel grades at an unfavourable strip ratio compared to other deposits.
• Vale dos Sonhos is the second largest contributor to ore quantity at a mixed quality (highest average nickel grade and low silica to magnesia ratio but high iron and alumina).
Table 16-11 Mining inventory by deposit
Deposit Pequizeiro Pequizeiro
West Baião Jacutinga
Vila Oito
Vila Oito West
Vila Oito East
Vale dos Sonhos
Total
Ore ≥1.4%Ni (Mdmt)
9.6 0.3 2.7 0.9 2.5 0.6 1.9 5.0 23.6
Ore marginal (Mdmt)
1.3 0.1 0.5 0.2 0.6 0.2 0.5 0.3 3.7
Total ore (Mbcm)
8.3 0.3 2.7 0.8 2.5 0.7 2.0 4.7 21.9
Total ore (Mdmt) 10.9 0.4 3.2 1.1 3.2 0.8 2.4 5.4 27.3
Total ore (%) 40 1 12 5 12 3 9 20 100
Ni (%) 1.70 1.53 1.66 1.76 1.65 1.60 1.54 1.80 1.69
Fe (%) 16.15 20.50 16.56 16.15 14.37 18.09 15.81 21.63 17.15
Al2O3 (%) 5.63 4.83 4.42 3.02 3.49 4.38 3.86 5.68 4.94
SiO2 (%) 41.83 42.84 41.59 41.3 42.57 43.11 40.82 33.86 40.26
MgO (%) 15.21 9.86 16.27 19.02 20.15 12.68 18.37 14.25 16.00
SiO2:MgO 2.75 4.35 2.56 2.17 2.11 3.40 2.22 2.38 2.52
Fe:Ni 9.51 13.39 9.96 9.19 8.73 11.33 10.29 12.05 10.15
Total waste (Mbcm)
10.8 0.6 6.1 1.5 4.9 1.6 3.6 7.4 36.5
Total waste (Mdmt)
16.3 0.9 9.9 2.1 7.9 2.4 5.8 11.3 56.7
Total (Mbcm) 19.1 0.9 8.8 2.3 7.4 2.3 5.5 12.1 58.4
Total (Mdmt) 27.2 1.3 13.1 3.2 11.1 3.2 8.1 16.7 84.0
Strip ratio (waste:ore)
1.5 2.5 3.1 1.9 2.5 3.1 2.4 2.1 2.1
Note: Mdmt – million dry metric tonnes
A ferricrete inventory, by deposit, was estimated. The inventory included PF and LF volumes. Total ferricrete is 12.3 million m3 (Mm3) over LOM, with major inventories estimated at Pequizeiro (3.7 Mm3), (Baião (2.2 Mm3), Vila Oito (2.0 Mm3), Vila Oito East (1.8 Mm3).
16.4.6 Site layout
Overall site layout
Roads, dumps and stockpiles were preferentially located on pastoral areas (i.e. already cleared). Where this was not possible, the impact to forest areas was minimised by increasing the dump height or using indirect haul routes. HZM further indicated some forest areas contained sensitive habitat and could not be cleared and avoidance of some pastoral areas was also directed. In addition, dumps were located outside the revenue factor 2 unconstrained inferred optimisation pit shell, to ensure potential future resources are not sterilised.
General site layouts for two of the deposits are shown in Figure 16-13 and Figure 16-14. The topography is coloured from low to high elevations (light to dark).

Horizonte Minerals Plc Araguaia Nickel Project Technical Report
Final November 2018 Page 217 of 342
Figure 16-13 Planned site layout – Baião
Roads
Pit
Waste
dump
Pit
to Pequizeiro
ROM pad
Ore
stockpiles
LMW
dump

Horizonte Minerals Plc Araguaia Nickel Project Technical Report
Final November 2018 Page 218 of 342
Figure 16-14 Planned site layout – Vila Oito West, Vila Oito and Vila Oito East
Waste
dump
Waste
dump
Waste
dump
Limonite
mineralised
waste dump
Limonite
mineralised
waste dump
Limonite
mineralised
waste dump
Ore
stockpiles
Ore
stockpiles
Ore
stockpiles
Pit
Pit
Pit
Topsoil
stockpiles
to Jacutinga
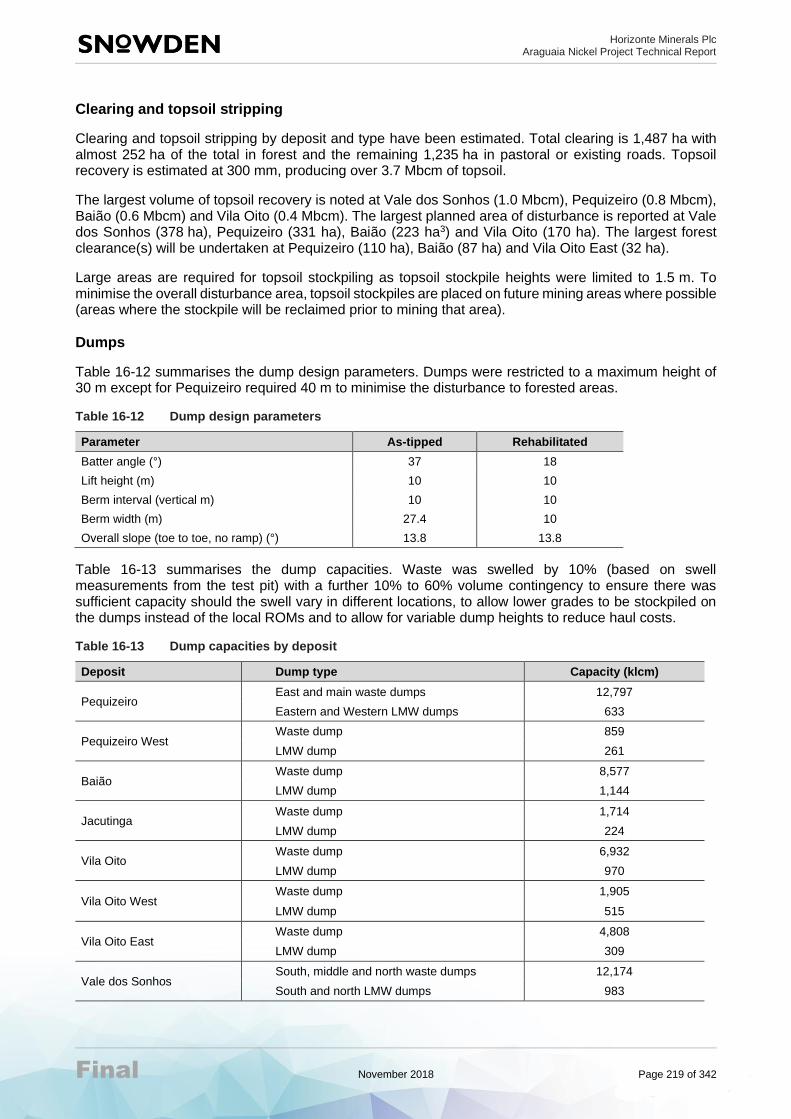
Horizonte Minerals Plc Araguaia Nickel Project Technical Report
Final November 2018 Page 219 of 342
Clearing and topsoil stripping
Clearing and topsoil stripping by deposit and type have been estimated. Total clearing is 1,487 ha with almost 252 ha of the total in forest and the remaining 1,235 ha in pastoral or existing roads. Topsoil recovery is estimated at 300 mm, producing over 3.7 Mbcm of topsoil.
The largest volume of topsoil recovery is noted at Vale dos Sonhos (1.0 Mbcm), Pequizeiro (0.8 Mbcm), Baião (0.6 Mbcm) and Vila Oito (0.4 Mbcm). The largest planned area of disturbance is reported at Vale dos Sonhos (378 ha), Pequizeiro (331 ha), Baião (223 ha3) and Vila Oito (170 ha). The largest forest clearance(s) will be undertaken at Pequizeiro (110 ha), Baião (87 ha) and Vila Oito East (32 ha).
Large areas are required for topsoil stockpiling as topsoil stockpile heights were limited to 1.5 m. To minimise the overall disturbance area, topsoil stockpiles are placed on future mining areas where possible (areas where the stockpile will be reclaimed prior to mining that area).
Dumps
Table 16-12 summarises the dump design parameters. Dumps were restricted to a maximum height of 30 m except for Pequizeiro required 40 m to minimise the disturbance to forested areas.
Table 16-12 Dump design parameters
Parameter As-tipped Rehabilitated
Batter angle (°) 37 18
Lift height (m) 10 10
Berm interval (vertical m) 10 10
Berm width (m) 27.4 10
Overall slope (toe to toe, no ramp) (°) 13.8 13.8
Table 16-13 summarises the dump capacities. Waste was swelled by 10% (based on swell measurements from the test pit) with a further 10% to 60% volume contingency to ensure there was sufficient capacity should the swell vary in different locations, to allow lower grades to be stockpiled on the dumps instead of the local ROMs and to allow for variable dump heights to reduce haul costs.
Table 16-13 Dump capacities by deposit
Deposit Dump type Capacity (klcm)
Pequizeiro East and main waste dumps 12,797
Eastern and Western LMW dumps 633
Pequizeiro West Waste dump 859
LMW dump 261
Baião Waste dump 8,577
LMW dump 1,144
Jacutinga Waste dump 1,714
LMW dump 224
Vila Oito Waste dump 6,932
LMW dump 970
Vila Oito West Waste dump 1,905
LMW dump 515
Vila Oito East Waste dump 4,808
LMW dump 309
Vale dos Sonhos South, middle and north waste dumps 12,174
South and north LMW dumps 983
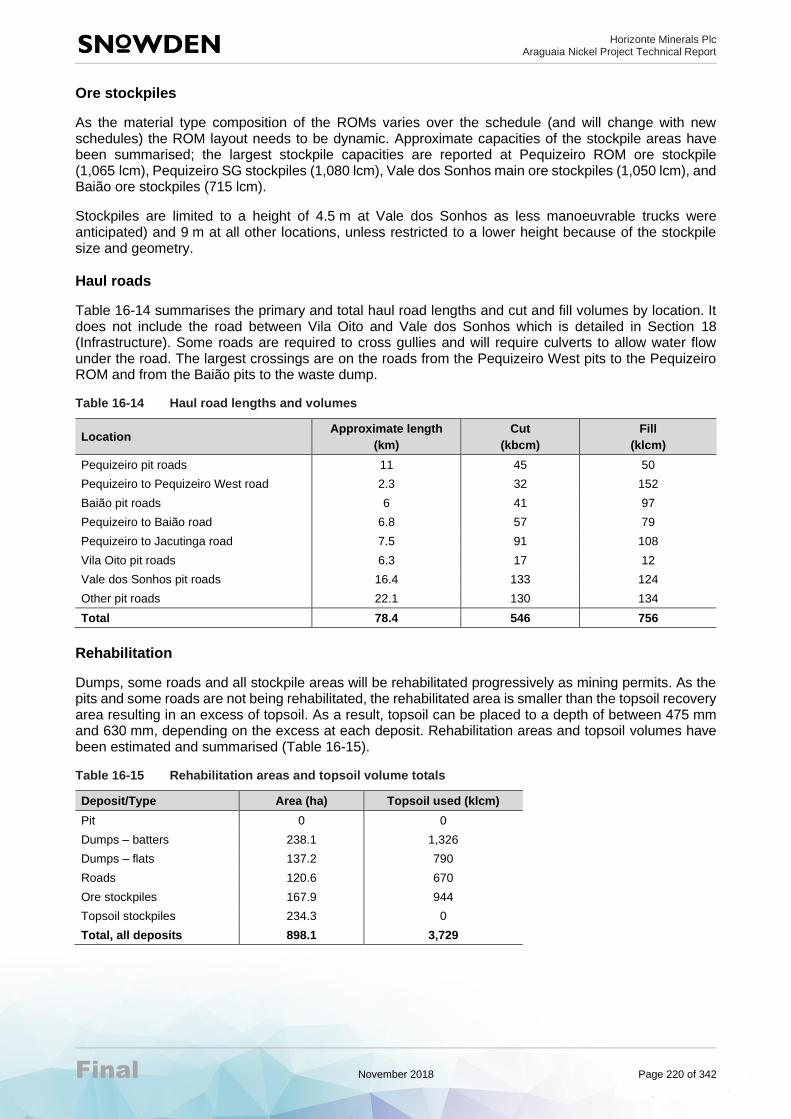
Horizonte Minerals Plc Araguaia Nickel Project Technical Report
Final November 2018 Page 220 of 342
Ore stockpiles
As the material type composition of the ROMs varies over the schedule (and will change with new schedules) the ROM layout needs to be dynamic. Approximate capacities of the stockpile areas have been summarised; the largest stockpile capacities are reported at Pequizeiro ROM ore stockpile (1,065 lcm), Pequizeiro SG stockpiles (1,080 lcm), Vale dos Sonhos main ore stockpiles (1,050 lcm), and Baião ore stockpiles (715 lcm).
Stockpiles are limited to a height of 4.5 m at Vale dos Sonhos as less manoeuvrable trucks were anticipated) and 9 m at all other locations, unless restricted to a lower height because of the stockpile size and geometry.
Haul roads
Table 16-14 summarises the primary and total haul road lengths and cut and fill volumes by location. It does not include the road between Vila Oito and Vale dos Sonhos which is detailed in Section 18 (Infrastructure). Some roads are required to cross gullies and will require culverts to allow water flow under the road. The largest crossings are on the roads from the Pequizeiro West pits to the Pequizeiro ROM and from the Baião pits to the waste dump.
Table 16-14 Haul road lengths and volumes
Location Approximate length
(km)
Cut
(kbcm)
Fill
(klcm)
Pequizeiro pit roads 11 45 50
Pequizeiro to Pequizeiro West road 2.3 32 152
Baião pit roads 6 41 97
Pequizeiro to Baião road 6.8 57 79
Pequizeiro to Jacutinga road 7.5 91 108
Vila Oito pit roads 6.3 17 12
Vale dos Sonhos pit roads 16.4 133 124
Other pit roads 22.1 130 134
Total 78.4 546 756
Rehabilitation
Dumps, some roads and all stockpile areas will be rehabilitated progressively as mining permits. As the pits and some roads are not being rehabilitated, the rehabilitated area is smaller than the topsoil recovery area resulting in an excess of topsoil. As a result, topsoil can be placed to a depth of between 475 mm and 630 mm, depending on the excess at each deposit. Rehabilitation areas and topsoil volumes have been estimated and summarised (Table 16-15).
Table 16-15 Rehabilitation areas and topsoil volume totals
Deposit/Type Area (ha) Topsoil used (klcm)
Pit 0 0
Dumps – batters 238.1 1,326
Dumps – flats 137.2 790
Roads 120.6 670
Ore stockpiles 167.9 944
Topsoil stockpiles 234.3 0
Total, all deposits 898.1 3,729

Horizonte Minerals Plc Araguaia Nickel Project Technical Report
Final November 2018 Page 221 of 342
16.5 Life of mine (LOM) schedule
16.5.1 Methodology
The mining schedule was completed in Snowden’s Evaluator scheduling software, which is a Mixed Integer Linear programming-based tool. It is driven by the maximisation of net present value (NPV) in the presence of physical quantity and grade constraints.
16.5.2 Parameters and constraints
Material types
The mining model was coded with material types to allow ore and waste scheduling selectivity (e.g. stockpiling lower grades, tracking PF). Furthermore, an additional 2% of ore was re-assigned to waste to account for potential ore loss associated with recovering in-pit sheeting which will have a high silica to magnesia ratio (SiO2:MgO). Material types have been coded, with specific criteria for nickel content, SiO2:MgO ratio, ore/waste categorisation and Resource class. Table 16-16 shows the corresponding schedule inventory for the criteria applied. For the MWH material, the marginal cut-off varies by deposit.
Table 16-16 Scheduling inventory by material types
Material type Mass (Mt) Ni (%) Fe (%) Al2O3 (%) SiO2:MgO Fe:Ni
HGH 5.2 2.11 20.44 6.26 3.87 9.69
HGL 3.0 2.05 16.26 4.81 1.99 7.94
MGH 3.2 1.69 19.56 5.61 3.93 11.54
MGL 3.4 1.69 15.50 4.34 1.87 9.17
LGH 3.3 1.51 18.89 5.23 3.93 12.54
LGL 5.5 1.50 14.17 3.89 1.78 9.47
Subtotal ore Ni≥1.4% 23.6 1.76 17.40 5.02 2.53 9.90
SGH 1.2 1.31 18.39 5.33 4.19 14.03
SGL 1.5 1.32 13.40 3.83 1.73 10.17
MWH 0.6 1.12 17.96 5.17 4.22 16.09
MWL 0.5 1.12 12.68 3.55 1.77 11.33
Subtotal ore Ni≥0.8<1.4% 3.7 1.26 15.57 4.47 2.44 12.34
Subtotal all ore 27.3 1.69 17.15 4.94 2.52 10.15
PFC 12.4 0.40 36.07 14.81 41.48 89.33
LMW 4.2 1.35 34.13 8.90 5.60 25.33
IMW 0.2 1.62 17.46 4.60 2.81 10.78
WST 39.8 0.52 34.28 13.11 13.91 66.28
Subtotal waste 56.7 - - - - -
Total 84.0 - - - - -
The schedule was completed in months for the pre-production period and first two years of production. The remainder of the schedule was completed in quarterly increments over the life of the project. As plant shutdowns were not scheduled all months and quarters were considered the same (e.g. all quarters were 91¼ days long).
The mining inventory was separated into pit stages and 4 m vertical benches for scheduling. Within each bench, material was separated into the material types for grade maximisation or blending purposes.
All benches within a stage were dependent on the bench above being mined out. In addition, benches from subsequent, connected stages were prevented from mining below the current stage.
Sequencing of the pit stages was orientated around managing water (Figure 16-5 to Figure 16-12 in Section 16.4.4 provide guidance on the orientation for each deposit).

Horizonte Minerals Plc Araguaia Nickel Project Technical Report
Final November 2018 Page 222 of 342
Active mining areas
The schedule attempted to minimise the number of mining areas (or hubs) mined in any period to simplify the mining operation and reduce overheads.
The timing of each mining area was determined by first running an unconstrained schedule (with no limit on active mining areas) and analysing the results. The mining areas and deposits were then restricted to specific timeframes (e.g. mining at Jacutinga was grouped into one contiguous period so that the mining portion could be completed despite two small stages naturally occurring much later in the schedule due to their grade). It is believed that three active areas provide the appropriate balance for blending and simplified operations.
Bench turnover
A vertical rate of advance of approximately 20 m per year (five benches) was applied for scheduling. This varied based on the estimated dig height and was primarily due to the sheeting requirements for the different digging heights. The splits are reasonably consistent between deposits, but larger dig heights are expected to be more common in waste areas (predominately limonite).
Mining
A maximum mining rate of 3.5 dmt/a was determined through scenario analysis. This varies significantly by month, due to the weather experiences of similar regional operations. The ex-pit limit range in the wet season (October to March) is between 108,500 dmt to 315,000 dmt, and in the dry season (April to September) between 304,500 dmt to 465,500 dmt. An overall theoretical total of 3.59 million dmt is reported, with the dry season volumes accounting for 68% of this overall annual production limit.
Production was further limited during the first year of mining. The mine production ramp-up to 3.5 Mdt/a incorporates the monthly variation associated with the seasonal rainfall. Initial mining is set to commence in June 2020 so that it occurs during the dry season and sufficient waste can be mined for various construction activities (e.g. roads, slag dump retaining wall, ROM). Additional waste required for plant construction (161 kbcm comprising at least 80 kbcm of PF and any associated mining activities) was excised from the schedule (periods 1 and 2).
Additionally, it was assumed that only Pequizeiro and Pequizeiro West deposits were to be mined in the wet season with no dry season mining permitted after quarter two in 2026 (Year 6). The annual capacity was split roughly evenly between the active mining areas (e.g. wet season hub maximum of 1.22 Mdt/a and two dry season hubs totalling a maximum of 2.28 Mdt/a).
Processing throughput and ramp-up
The process throughput is 900 dkt/a. First metal production is planned for March 2021 with cold commissioning in December 2020. During the ramp-up period, nickel feed grade was moderated so that the best grades would not be lost due to lower recovery.
Grade constraints
For scheduling the supplied grade constraints were tightened to reflect the longer period durations (i.e. to allow shorter term targets to be met), these are summarised in Table 16-17.
Table 16-17 Scheduled grade constraints
Grade COS process limit Monthly schedule limit Quarterly schedule limit
Al2O3 (%) ≤5.5 ≤5.47 ≤5.45
Fe (%) ≤18 ≤17.91 ≤17.82
SiO2:MgO ratio ≤2.6 ≤2.59 ≤2.57
Fe:Ni ratio ≥7.6 ≥7.64 ≥7.68
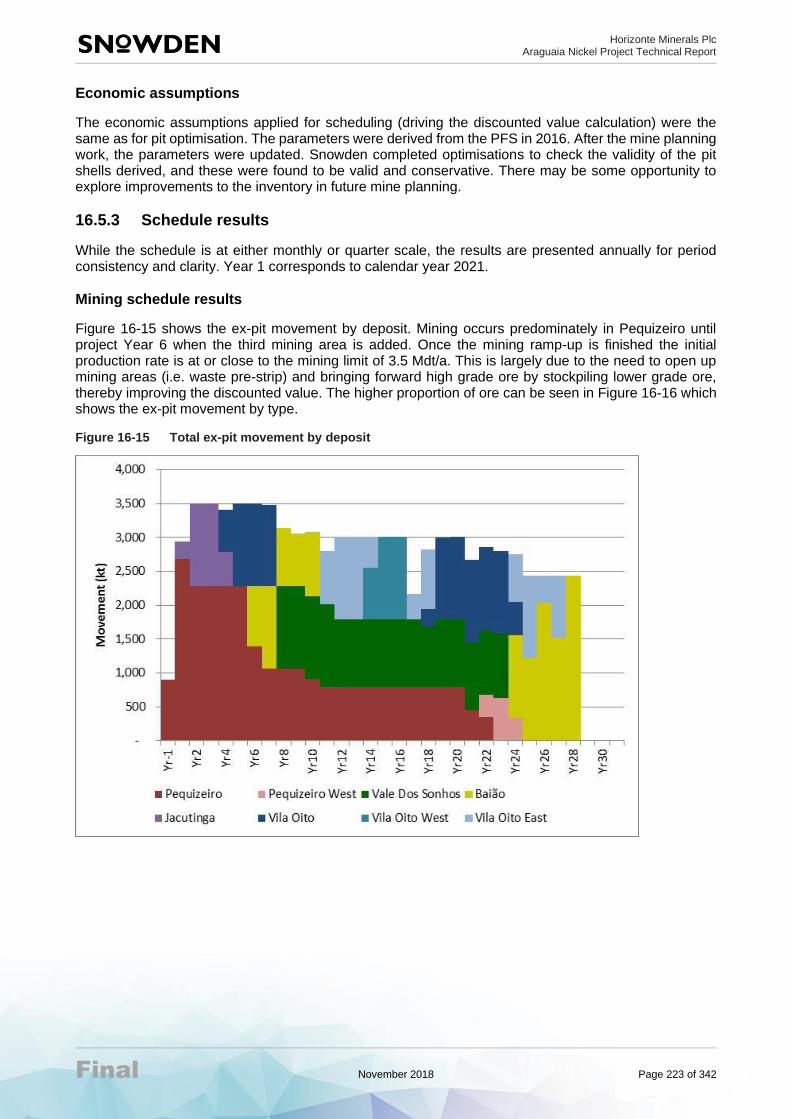
Horizonte Minerals Plc Araguaia Nickel Project Technical Report
Final November 2018 Page 223 of 342
Economic assumptions
The economic assumptions applied for scheduling (driving the discounted value calculation) were the same as for pit optimisation. The parameters were derived from the PFS in 2016. After the mine planning work, the parameters were updated. Snowden completed optimisations to check the validity of the pit shells derived, and these were found to be valid and conservative. There may be some opportunity to explore improvements to the inventory in future mine planning.
16.5.3 Schedule results
While the schedule is at either monthly or quarter scale, the results are presented annually for period consistency and clarity. Year 1 corresponds to calendar year 2021.
Mining schedule results
Figure 16-15 shows the ex-pit movement by deposit. Mining occurs predominately in Pequizeiro until project Year 6 when the third mining area is added. Once the mining ramp-up is finished the initial production rate is at or close to the mining limit of 3.5 Mdt/a. This is largely due to the need to open up mining areas (i.e. waste pre-strip) and bringing forward high grade ore by stockpiling lower grade ore, thereby improving the discounted value. The higher proportion of ore can be seen in Figure 16-16 which shows the ex-pit movement by type.
Figure 16-15 Total ex-pit movement by deposit

Horizonte Minerals Plc Araguaia Nickel Project Technical Report
Final November 2018 Page 224 of 342
Figure 16-16 Total ex-pit movement by type
Figure 16-17 shows the ex-pit movement by rock type. The split between rock types is relatively consistent over the project life.
Figure 16-17 Total ex-pit movement by rock type
The active mining areas were maintained to three at any time. In some years, the number of active deposits increases to four, due to movement between deposits during the year.
Ancillary activity scheduling results
A study on the clearing areas, topsoil stripping, topsoil spreading by deposit was undertaken. Peaks coincide with the start of mining at a new deposit due to the requirement to clear additional areas for the ROM, dumps, and roads. The topsoil stockpile balance by deposit, peaks at almost 2 Mbcm in Year 15.
Figure 16-18 shows the sheeting balance (includes PF and LF) by stockpile. All areas initially have difficulty in sourcing sufficient sheeting material before building large excesses.

Horizonte Minerals Plc Araguaia Nickel Project Technical Report
Final November 2018 Page 225 of 342
This is primarily due to the upfront requirement to build surface haul roads and inter-pit haul roads, which is most evident at Jacutinga and Vila Oito West where it may be necessary to build some of these roads with ferricrete from Pequizeiro.
Figure 16-18 Sheeting balance by stockpile
Long term stockpile scheduling results
A long-term stockpile balance by stockpile location study was undertaken (i.e. satellite deposits rehandled to Pequizeiro report to Pequizeiro). This is a strategic stockpile; it allows high-grade material to be preferentially processed and in the short term allows deleterious material to be blended. The combined project peak of 4.1 million dry metric tonne (Mdmt) at 1.4% nickel occurs in quarter 3, 2034 (project Year 14) and is within 10% of this peak for numerous periods from quarter 3, 2032 to quarter 3, 2042.
Figure 16-19 shows the long-term stockpile balance by material type. In general the higher-grade ore that is stockpiled tends to be the high SiO2:MgO ratio material type and predominately occurs at the start of Pequizeiro and Vale dos Sonhos. Over the project life the lower grade material types become a higher proportion of the stockpiles.
Figure 16-19 Long term stockpile balance and movements by material type

Horizonte Minerals Plc Araguaia Nickel Project Technical Report
Final November 2018 Page 226 of 342
In general, the stockpile grades are fairly consistent with the exception of nickel which shows a decreasing trend.
Processing schedule results
Figure 16-20 shows the ore feed to the processing plant by rock type. Although not a requirement, the split between transition and saprolite is fairly consistent on an annual scale at about 50% as in general the higher SiO2:MgO ratio in the transition is blended with the lower ratio in the saprolite. There is more variation at the quarterly level where the proportion of transition is as high as about 85% and as low as 35%.
Figure 16-20 Ore feed by rock type
Figure 16-21 shows the ore feed to the processing plant by Reserve classification.
Figure 16-21 Ore feed by Reserve classification
Figure 16-22 shows the nickel feed grade which rapidly ramps up (with the processing recovery) to a peak in February 2022 (project Year 2) from which point it declines until the end of the Project.

Horizonte Minerals Plc Araguaia Nickel Project Technical Report
Final November 2018 Page 227 of 342
Figure 16-22 Nickel feed grade, including Fe, SiO2:MgO ratio and Al2O3
From plant commissioning until 2041 (project Year 21) and half of the remaining quarters the silica to magnesia ratio is at the scheduled limit and as a result is the primary blending concern. The alumina feed grade scheduling limit is reached in several years most commonly in the first half of the project life and occurs more regularly at the smaller scheduled time periods. The scheduling limit for the iron feed grade is reached in several years most commonly in the second half of the project life and occurs more regularly at the smaller scheduled time periods. The iron to nickel ratio is not a schedule driver with the limit only reached for seven months in project years 1 and 2 when nickel feed grades are at or near their peak.
Despite the majority of the grades and ratios reaching their respective limits during the project life, this occurs primarily as a result of maximising the nickel grade. The risk of being unable to achieve the feed limits is mitigated by the availability of many ore sources (stockpiles or active pits).
In terms of the nickel produced, coinciding with the peak nickel grade, project Year 2 has the highest nickel production of the Project of approximately 18 kt.
16.6 Mining requirements
16.6.1 Battery limits
Battery limits for the mining study were limited to those activities required to define, excavate and transport ore to the process plant:
• Grade control drilling and assaying of the orebody ahead of excavation
• Constructing mine haul roads from Pequizeiro to the various mining hubs
• Clearing of vegetation from forests and paddocks within the footprint of the mining workings
• Removing and stockpiling topsoil
• Excavating waste material and stockpiling in permanent surface waste dumps
• Excavating ore and trucking to a surface stockpile adjacent to the excavation
• Rehandling ore from the surface stockpile to the Pequizeiro stockpile
• Rehandling ore from the Pequizeiro stockpile to the ROM stockpile
• Re-shaping waste dumps to create a stable landform
• Rehandling topsoil from topsoil and spreading on reshaped waste dumps

Horizonte Minerals Plc Araguaia Nickel Project Technical Report
Final November 2018 Page 228 of 342
• Managing and coordinating the excavation activities to provide the process plant with ore feed within specified limits.
In addition to the above, provision was included for the transport of slag from the process plant to the slag storage facility.
There were many operational interfaces that were excluded from the mining studies, including:
• Construction of the haul road from VDS-VOI
• Ex-pit dewatering
• HZM mining team buildings and infrastructure, and general administration of the site.
16.6.2 Operating philosophy
To mitigate production risk and initial capital burden, the mining operations will be outsourced to an experienced mining contractor. It was envisaged the contractor would operate under a conventional Schedule of Rates style contract which may include both fixed and variable components. The contract would be structured around achieving the mining schedule or revisions advised by HZM from time to time throughout the project execution, as well as a variety of non-commercial objectives associated with safety, environment and quality. The details of this arrangement were not considered in this study.
Budget proposals for the Araguaia mining work were received by three contractors.
HZM will employ a small mining team comprising of senior management and technical services. The mining team will oversee and coordinate the execution of the work and manage the performance contractor on a daily basis.
16.6.3 Rosters
A variety of rosters for the mining operation were proposed by the mining contractor in response to the RFQ process (Section 16.7), reflecting the various operating strategies proposed:
• 1 x 10-hour shift per day, six days per week
• 3 x 8-hour shifts per day, seven days per week
• 2x 10-hour shifts and 1 x 6-hour shift per day, seven days per week.
The 1 x 10-hour shift per day, six days per week roster was adopted as the Base Case for this study, as this roster was associated with the contractor pricing used in the cost estimate.
The HZM mining team propose to operate under the following roster:
• Monday to Thursday: 08:00 to 18:00 (with lunch from 12:00 to 13:00)
• Friday: 08:00 to 17:00 (with lunch from 12:00 to 13:00).
The mining fleet dispatch operator, field dispatch operator, surveyor and surveyor assistant will work 1 x 10-hour shift per day for six days per week.
16.6.4 Equipment
A variety of fleet configurations were proposed in response to the RFQ. The equipment deployed on the mining operations will be dependent on the mining contractor awarded the work. All proposed configurations were considered reasonable over the RFQ timeframe; however detailed analysis of the age and condition of the fleet is yet to be evaluated.
Primary
The primary and ancillary mining fleet proposed by each of the contractors is presented in Table 16-18.

Horizonte Minerals Plc Araguaia Nickel Project Technical Report
Final November 2018 Page 229 of 342
Table 16-18 Contractor primary and ancillary mining fleet
Component Contractor A Contractor B Contractor C
Primary mining fleet
Excavator 40-50 t 2 - 4
Excavator 30-40 t 1 9 1
Excavator 20-30 t - - 1
Dump trucks 6x6 (40-50 t) 8 - -
Dump trucks 6x4 (25 t) 8 69^* 24
Wheel loader (20-25 t) 2 1 1
Ancillary mining fleet
Dozer 40 t 2 - -
Dozer 20 t - 7 3
Grader 14 ft 2 1 2
Water truck 20-30 kl 1 - -
Water truck 15-20 kl - 1 2
Fuel truck (15-20 kl) 1 1 1
Grade control drill** 1 1 1
Note: ^ Maximum potential, same fleet is proposed to carry out ore haulage from mining hub stockpiles to PQZ stockpile
* Contractor B proposed to operate on 1 x 10-hour shift per day, six days per week; hence, fleet numbers are substantially higher than contractor A and C which have higher operating hours.
** Not specified by contractor. Number assumed based on drilling requirement and expected productivity
16.6.5 Manning
The manning levels proposed by HZM and each of the mining contractors are provided in Table 16-19.
Table 16-19 Estimated manning levels
Manning component Contractor A Contractor B Contractor C
HZM staff 17 17 17
Contractor staff 21 75 14
Contractor operators 113 151 115
Contractor maintenance 32 63 17
Grade control 2 2 2
Total 185 308 165
16.6.6 Consumables
Primary consumable components are fuel, explosives and grade control drilling samples.
As part of the RFQ the contractors were requested to provide an estimate of their fuel requirements. In addition, provision was made for fuel required for the HZM mining team light vehicles. Fuel consumption is summarised in Table 16-20.
Table 16-20 Estimated annual fuel requirement
Machine Contractor A Contractor B Contractor C
HZM Mining Team* (kl) 60 60 60
Contractor (kl) 1,500 700 2,000
Grade Control Drill** (kl) 50 50 50
Total (kl) 1,610 810 2,110
Note: * Based on 1000 litres per vehicle per month
** Assumption based on average 25,000 m/yr, 25 m/hr and 50 litres per hour

Horizonte Minerals Plc Araguaia Nickel Project Technical Report
Final November 2018 Page 230 of 342
No provision was made for the use of explosives on this project for blasting in-situ material or reducing oversize. In the event oversize material is generated from mining, a rock-breaker will be used that will be provided and operated by the mining contractor on daywork.
Grade control drilling samples were estimated on the basis of 1 m samples over 105% of the ore and 5% of the waste drilled. Ad-hoc grab samples from the pits were estimated on the basis of 100 per month during each month that ore mining occurs.
16.7 Mining cost estimation
A Mining Budget Estimate was prepared for the Project. Mining costs were estimated from budget quotations from Mining Contractors for the Araguaia Project, and cost estimates provided by HZM (e.g. labour costs).
All mining related costs are shown in US$. The exchange rates used to convert any costs based in to Brazilian Real is provided is 3.5.
A request for budget quotation (RFQ) was issued to a select group of earthmoving contractors following responses to and expression of interest (EOI) drafted by Snowden and issued and evaluated by HZM. Responses to the RFQ were received from three contractors operating in-country.
A detailed scope of work was undertaken, from mobilisation and contractor site establishment, construction earthworks, pre-production and mine establishment, dewatering of mining areas, ore and waste mining, through to ore rehandle, site rehabilitation works, demobilisation and site cleaning. The scope of work considered the pre-production period and the first 10 years of operation and was based on a draft schedule.
The contracting style proposed a fixed and variable pricing structure to mitigate the risks associated with seasonal variation in the mining rates as well as significant design and production schedule changes. A preliminary material movement schedule was developed for the purposes of the RFQ. The schedule reported quantity requirements on a seasonal basis.
Variable bench heights are proposed for the Araguaia operations. To minimise risk loading in the priced responses, a range of variable height benches were requested in the pricing schedule for each material type. Due to the complexity of the haulage routes over the large time scale, an equivalent haulage set of haulage profiles were provided to the contractors to assist with their pricing.
The base units for pricing considered the practicalities of the methods of measurement. To that end, all pit excavation and pit haulage were based on bcm and would be measured from survey pickup. All ex-pit haulage would be based on wet-metric-tonnes and would be measured using Loadrite systems installed on loading and hauling units or weighbridge located at the Pequizeiro plant for truck tonnage validation.
16.7.1 Contractor responses
A summary of the contractor evaluation for the first 10 years is provided in Table 16-21. A variety of operating scenarios were submitted by the contractors as described in Section 16.6. None of the contractors provided conforming responses. Total variable cost pricing was provided in lieu of fixed and variable pricing. In some instances, assumptions were required to be made by Snowden in order to evaluate pricing on an equivalent basis.

Horizonte Minerals Plc Araguaia Nickel Project Technical Report
Final November 2018 Page 231 of 342
Table 16-21 Summary of contractor responses, first 10 years of operation
Cost area Contractor A (US $M) Contractor B (US$ M) Contractor C (US$ M)
Mobilisation and site establishment 2.2 2.0 9.0
Demobilise and restore site 0.5 1.4 0.9
Site works 43.5 30.5 19.9
Load and haul 156.1 148.8 112.3
Contractor fixed costs - - -
Contractor dayworks 6.4 6.3 6.3
Total 208.8 189.1 148.4
Variance to median pricing +10% 0% -22%
All operating scenarios submitted by the contractors were considered reasonable for the Project; however, further detailed assessment of operational impacts and resourcing levels is recommended to define their impacts on the projects mining schedule and cost. For example, contractor B proposed higher resource levels with reduced operating hours (i.e. not operating 24x7). The median price option (Contractor B) was adopted as the basis for the preparation of the Mining Budget Estimate.
LOM opex and capex have been discussed in Section 21.
16.8 Risks and opportunities
16.8.1 Risks
A list of key mining-related risks is provided below.
The trial mining exercise highlighted the possibility of encountering perched water tables during mining. This possibility implies that as far as practicable pits should be dewatered ahead of mining. The implication and management of the perched water tables and water in general have been mitigated with hydrological assessment conclusions/ recommended measures. Generally, operations need to focus on mitigating this through a thorough operating plan to manage this water if it is encountered as it occurs.
The plant calls for a tight set of grade limits, relative to the average grade of the project, particularly the SiO2:MgO ratio. Several operational mitigations are in place to be able to manage this, such as the stack and reclaim of the crushed ore stockpile, regular sampling and assaying, grade control and multiple ore sources and stockpiles at any time. However, if the global resource estimate is shown to be biased in a negative direction (even slightly) then the overall tonnage available to process may be less than anticipated. It will be important to understand this through a thorough reconciliation process (e.g. resource model to grade control model, grade control model to plant feed, resource model to plant feed).
The mining operation has many complexities, which may not be properly understood by contractors at this budget quotation stage. There is a risk that the mining cost may increase when the understanding of the project by contractors improves, or latent conditions become apparent. This can be mitigated through close engagement with contractors prior to tender.
Sheeting is required in order to traffic the pits and external haul roads. There is a risk that there will be insufficient sheeting to support operations resulting in production losses or reduced productivities. This can be mitigated by logging of sheeting amounts in grade control and good planning of sheeting inventories. Where shortfalls exist, external sources of sheeting should be identified. It is possible that slag could be used for this purpose.
Whilst not a major issue during trial mining, there is the potential for the increased presence of rocks and boulders in other areas of the mine, which may require some light blasting or lower excavator productivities. This should be reviewed during the pre-production grade control program and early operations.

Horizonte Minerals Plc Araguaia Nickel Project Technical Report
Final November 2018 Page 232 of 342
16.8.2 Opportunities
As the pits were staged with a focus on facilitating pit dewatering, the stage order is favourable for backfilling. Backfilling the pits with waste would reduce the waste haulage costs and reduce the environmental footprint of the mine; however, this would also sterilise nickel bearing material below the ultimate pit (predominately below the marginal cut-off), which could become profitable if the nickel price was higher.
There will be opportunities to either direct tip on the ROM blending stockpiles from the Pequizeiro pits, or direct tip to the crushers from the PQ ROM stockpiles. This would remove one or two rehandle steps and the associated costs. This can be explored as the mine operates and builds confidence in the ability to blend.
The mining contractors favour smaller equipment and there may be an opportunity to reduce the amount of sheeting required and hence the associated costs. With greater engagement, there is the possibility that contractors would provide cheaper pricing leading to the award of a contract. Additionally, there may be cost benefits derived through splitting the mining activities by contractors with speciality areas (e.g. separate contract for long-distance haulage).
The seasonal, and monthly, mining production rate variation, makes the mining cost higher than it possibly needs to be. These assumptions should be tested with mining contractors, to determine the best way to operate the mine.
Only Measured and Indicated Resources were considered for mining. The pit optimisation sensitivity with Inferred Resources indicated that the mining inventory could be increased slightly if the resource confidence was increased by additional drilling. This can be deferred until after production has commenced.
The current mining operation targets the highest-grade material available. There exists a substantial amount of lower grade material (both adjacent to the mined pits and at the base) which could be used to extend the LOM, if the economics were favourable in the future. This lower grade material is not viable for the current project economic justification, but demonstrates the potential longevity of the project subject to better commodity prices.
It may be more cost effective to use slag as a sheeting material rather than ferricrete. This can be determined after the mining operation fully understands the cost of slag and ferricrete handling.
Snowden recommendations have been discussed in Section 26.

Horizonte Minerals Plc Araguaia Nickel Project Technical Report
Final November 2018 Page 233 of 342
17 RECOVERY METHODS
17.1 Introduction
Based on the metallurgical testwork, the mine schedule and other supporting data, Ausenco Pty Ltd (Ausenco) developed detailed engineering drawings along with capital and opex estimates for the plant in addition to a detailed project implementation plan. An overall estimate of the plant cost and time to construct and commission the plant was completed.
The plant layout developed by Ausenco is shown in Figure 17-1.

Horizonte Minerals Plc Araguaia Nickel Project Technical Report
Final November 2018 Page 234 of 342
Figure 17-1 Plant site location layout
Source: Ausenco, 2018

Horizonte Minerals Plc Araguaia Nickel Project Technical Report
Final November 2018 Page 235 of 342
17.2 Process selection
Based on metallurgical testwork undertaken on the ANP ore, including full bench scale leading to an integrated pilot plant campaign carried out during the first and second quarters of 2015 (discussed in Section 13), confirmed the suitability of the conventional RKEF process for the treatment of the ANP ores to produce FeNi.
17.3 Process description
The proposed process is a single line 0.9 Mt/a RKEF installation, producing approximately 15 kt/a nickel as FeNi.
The process description, together with block flow diagrams and key design criteria of each process section, are presented to provide the project scope and main characteristics of the metallurgical process. The main features of the proposed plant are presented in Figure 17-2.
The Base Case mass balance for the study is based on the weighted average ROM ore composition taken from the mining schedule developed in April 2017. The difference between the April 2017 and Q3 2018 mining schedule is negligible and covered by the PDC.
The first stage of the process involves reception of ROM ore for blending to meet metallurgical processing requirements, then ore preparation, where the ore is sized to match the requirements of the subsequent metallurgical processing steps. The ore is then homogenized, partially dried and agglomerated in a rotary drier and fed to the rotary kiln with the addition of reductant material. In the kiln, the ore is completely dried, calcined to remove chemically-combined moisture, and partially pre-reduced. Drier and rotary kiln dusts are recycled to the agglomerator process before the primary crushing stage ahead of the dryer.
Calcine from the kiln is then transferred to the electric furnace where final reduction, melting and separation of the metal and slag occurs at high temperature. After tapping, the metal is transferred by ladle to the refining stage. The final FeNi product containing 30% Ni is shotted with water, screened, dried and stockpiled prior to dispatch to the market. The electric furnace slag is granulated and transferred to the slag repository. The oxidised FeNi refining slag and the reducing FeNi refining slag are handled separately.

Horizonte Minerals Plc Araguaia Nickel Project Technical Report
Final November 2018 Page 236 of 342
Figure 17-2 Process flow

Horizonte Minerals Plc Araguaia Nickel Project Technical Report
Final November 2018 Page 237 of 342
17.3.1 ROM ore reception
The ROM will be stockpiled within the plant area on the ROM reception pads prior to entering the process plant for the purpose of initial blending of the different ore types so as to ensure the plant feed material has the pre-established metallurgical characteristics for feeding the plant. The individual ROM piles within the plant area will be sheeted to avoid excessive moisture build up. The ROM material will be reclaimed by excavator and loaded onto trucks, which will convey the material to a ROM shed or open stockpile in the same area. The ROM shed will have a capacity for approximately four days storage of wet ore. The ore will be reclaimed by front-end loader (FEL) for feeding onto a fixed grizzly positioned over an apron feeder. Alternatively, mine trucks will be able to dump directly over the fixed grizzly for direct feeding from the mine. This concept was developed in order to maintain ROM flexibility and at the same time, allow a crusher availability of 75% to be achieved.
17.3.2 Ore crushing and homogenization
The fixed grizzly is sized with a 500 mm x 500 mm gap. The oversize material will be removed with the aid of a FEL. The undersize (-500 mm) stream will be discharged onto an apron feeder from which it will be transferred by a conveyor belt and discharged into a primary crusher (mineral sizer) of 200 mm gap. A cross-stream sampler will be used at a suitable transfer point to sample the stream going to primary crusher for quality control purposes. The crushed material will be discharged onto a conveyor belt to the secondary crusher.
Dryer, rotary kiln, electric furnace and hygiene baghouse dusts will be transferred to a dust storage bin. The combined dust will be discharged from the bin and fed to a pug mill where it will be mixed with water to approximately 20% moisture. The wetted dust is added to the ore as it is fed into the primary crusher. This concept provides a relatively inexpensive yet very effective means of handling dust and helps in minimising the potential adhesion of sticky ore fines onto downstream conveyor belts.
The ore mixed with dust is then crushed by a secondary double mineral sizer with a 50 mm gap. The crushed product with the dust combined will be conveyed to a tripper for deposition onto the designated homogenization pile stored in the covered homogenization shed. The covered homogenization shed will feature two piles, each one with a capacity of approximately four days of wet ore. When one pile is being created, the other is feeding the plant. The homogenization of ore is a critical process function required to minimise variations in ore chemistry and provide consistent feed to the kiln and smelting furnace. Key criteria of the ore preparation section are shown in Table 17-1, with hours per annum (h/a) shown.
Table 17-1 Key criteria of crushing and dust recycling (crushing circuit – 6,570 h/a)
Item Unit Value
Fresh ore feed rate dt/h 137.0
Fresh ore feed rate wet t/h 207.5
Moisture % 34.0
Dust recycled dt/h 33
Dust moisture content after pugmill % 20
Total feed to primary crusher ore + dust wet t/h 249
Primary crusher type - Sizer
Secondary crusher type - Toothed double roll
Dust recycling equipment - Pug mill
Ore homogenization shed number 1
Ore homogenization capacity days/each 8
Ore homogenization capacity wet t/each 36,000
Ore handling for homogenization Trippers – reclaim by loader

Horizonte Minerals Plc Araguaia Nickel Project Technical Report
Final November 2018 Page 238 of 342
17.3.3 Ore drying and tertiary crushing
Reclamation of wet ore from the homogenization piles within the covered homogenization shed will be by means of a FEL and will be conveyed to the rotary dryer feed hopper. From here it will be extracted from the hopper by a variable speed apron feeder on to a belt conveyor and then transferred to the dryer feed chute. Feedback from the belt scales to the apron feeder is used to maintain a steady feed rate to the dryer. A dribble conveyor will be located under the apron feeder to catch any spillage. A steady controlled feed rate is required for good operational control of the drying process, which is a key requirement for optimising energy utilisation, facilitating material agglomeration and producing dried ore at a dust free moisture level of approximately 18% H2O (ore feed is greater than 30%). The dryer has a series of special internal lifters to help promote agglomeration.
The dryer operates with the feed moving co-currently with the flow of combustion gases. The unit is fitted with a combustion chamber designed for burning pulverised coal, and also has the capability of burning fuel oil for start-up, during those times when a small amount of oil is also burned with coal, and also as a back-up fuel. In the current report, all dryer fuel is supplied by pulverised coal. The dryer will also feature a retention dam at the discharge end to allow for the optimum degree of filling. The off-gas temperature will be such that it avoids condensation in the off-gas ducting and the electrostatic precipitator used for collecting dust present in the dryer off-gas. The dryer will be fitted with full process control features.
A bolometer will be used in the dryer off gas duct to detect dust generation and thereby allowing combustion controls to achieve the desired dust free product that is free flowing. A 30 mm trommel is located in the end of the dryer. The oversize from the dryer trommel will feed through the tertiary cone crusher and thereafter will join the trommel undersize dried ore and will be conveyed to the kiln feed bin (directly) or to a covered dried ore stockpile building with a capacity of approximately 10,000 wet t of dried ore. The dried ore stockpile will maximise the availability of feed to the kiln and allow for the continued operation of the kiln during dryer maintenance. The dried ore stockpile will be reclaimed by means of a FEL and a hopper for charging the kiln feed bin.
The target moisture of the dryer product will be nominally 18%, with a range of 18% to 22%. The final dryer product, at approximately 30 mm, can divert material into the rotary kiln feed bin or to the dried ore storage facility.
Key criteria of ore drying and tertiary crushing are presented in Table 17-2 and Table 17-3.
Table 17-2 Key drying parameters
Item Unit Value
Ore feed rate wet t/h 207.6
Ore moisture content % 34
Ore + dust feed rate wet t/h 219.3
Ore + dust feed rate dt/h 149.8
Feed moisture content % 31.7
Rotary dryer
Nominal diameter m 4.4
Nominal length m 38.0
Installed power kW 550
Note: Based on dryer operation 7,446 hours per annum

Horizonte Minerals Plc Araguaia Nickel Project Technical Report
Final November 2018 Page 239 of 342
Table 17-3 Tertiary crushing key parameters
Item Unit Value
Trommel oversize to crusher wet t/h 49.5
Crusher type Cone crusher
Trommel undersize wet t/h 131.5
Total drying kiln product (DKP) wet t/h 181.0
Dryer product moisture % 18
Nominal mantle diameter mm 1,000
Nominal feed opening mm 270
Installed power kW 150
Note: Based on 7,884 hours per annum
17.3.4 Calcining
The kiln operates counter-currently with the flow of solid material from the feed end running opposite to the direction of combustion gases.
The kiln will be fed from the kiln feed bin which receives dried ore (including recycle dusts) from the dryer directly after the tertiary crusher and from Dried Ore Storage (DOS). A designated combustion coal supply system will be installed to provide pulverised coal to the kiln burner. The Reduction Kiln Feed (RKF) and reductant coal are fed to the kiln in a specified weight ratio. Low coal addition results in high-nickel grade product FeNi, and subsequently high nickel losses in furnace slag (unreduced NiO), in which case the ratio of reductant coal is increased. The kiln operators will also look at the assays of the furnace product FeNi nickel grade and if the nickel grade is too low, this indicates too much iron has been reduced and the operators will lower the reductant addition in the first section of the kiln. In essence, the carbon addition control is initially made in proportion to the ore composition and the corresponding reduction requirement, both of which are known before the feed addition to the rotary kiln. The fine adjustments of reductant addition are made from a consideration of the calcine assay. All remaining free moisture is removed, and all the crystalline water is subsequently removed from the dried ore before being discharged from the kiln as reduced calcine. At the hot end of the kiln, nickel and iron oxides are partially reduced.
The kiln will be constructed with three retention dams – one at the drying section, the second near the end of the calcining stage, and the last one at the calcine discharge end. These features provide for the maximum residence time in the kiln. Consequently, the material will interact for a longer period of time, thereby enhancing the metallurgical processes in the rotary kiln, as well as minimising the generation of excess fines. The solids residence time in the kiln is expected to be approximately three hours.
The kiln will be equipped with lifters towards the feed end and designed to improve heat transfer from the hot combustion gases to the tumbling solids. This lifter arrangement will be designed, however, to minimise break up of agglomerates and also to minimise dust carry over by the off-gas stream. The heat required for the kiln operation will be supplied by a pulverised coal burner of specialised design located at the calcine discharge end of the kiln, thus providing counter current heating for attaining the required temperature profile along the length of the kiln. The burner is designed for 100% pulverised coal or 100% oil, or any variation in between.
The target calcine temperature at the kiln discharge is typically within the range of 850°C to 900°C. Temperatures above the target range result in excessive accretion ring formation in the kiln interior that results in downtime and requires more maintenance and cleaning.

Horizonte Minerals Plc Araguaia Nickel Project Technical Report
Final November 2018 Page 240 of 342
Heat is generated at the kiln discharge end by combustion of coal and/or heavy fuel oil (HFO) during start up in the kiln burner. Operators maintain a fixed fuel rate at the main burner which typically represents 30% to 35% of the overall fuel requirement for heating. The burner operates under sub-stoichiometric conditions. The resultant combustion gas contains carbon monoxide, forming as a result of the incomplete combustion of the fuel. The carbon monoxide is essential for the maintenance of the reduction conditions at the high temperature and calcine discharge zone of the rotary kiln. The balance of the heat requirement for the rotary kiln is supplied by from the reductant coal that comes with the feed and is also added through the shell in the hot zone through coal scoops. Kiln air pipes provide the necessary air to combust the volatiles from the coal and from the carbon monoxide (CO) and hydrogen gas (H2) formed from the combustion of the coal. The coal added through the coal scoop supplements the heat input and participates in the reduction reactions. The addition rate through the coal scoop is adjusted to control the calcine and off-gas temperatures.
The main burner primary air consists of radial air (which influences flame swirl direction) and axial air (which influences flame length). Secondary air is added through the firing hood to combust a portion of the fuel fume generated by the sub-stoichiometric operation of the main burner.
The balance of the air required for the complete combustion of the main burner fuel, reductant coal volatiles and fines, is added by four on-board tertiary air fans through air pipes installed through the kiln shell. The flow added by each tertiary air fan is adjusted to control the temperature and reduction profiles along the kiln and the overall kiln aeration to ensure all combustibles are consumed before the kiln gases exit into the electrostatic precipitator (ESP).
The hot calcine at the kiln discharge will pass through a grizzly for removing any oversize material that may cause blockages in downstream equipment. The undersize material will then be discharged into a refractory-lined bin, from where it will be extracted through a transfer chute into a number of refractory-lined, 15 m3 containers, which will be located on a transfer car.
The kiln off-gas at approximately 300°C is treated in a dedicated ESP. The dust is collected and pneumatically conveyed back to the dust recycling bin at the front end of the process. The cleaned gas discharges to atmosphere through its own stack.
Key criteria of this section are presented in Table 17-4.
Table 17-4 Calcining – key criteria
Item Units Value
Fresh ore feed rate wet t/h 153.0
Dry ore feed rate dry t/h 125.5
Ore plus dust feed rate wet t/h 189.7
Ore plus dust feed rate dt/h 155.6
Product ore plus dust H2O % 18.0
Reductant coal feed rate dt/h 8.4
Coal moisture content % 11.5
Reductant coal wet t/h 9.5
Calcine production to electric furnace dt/h 117.2
Degree of iron pre-reduction % 60
Degree of nickel pre-reduction % 10
Rotary kiln dimension
Diameter m 5.5
Length m 120
Installed power kW 1096
Note: Based on 7,446 hours per annum

Horizonte Minerals Plc Araguaia Nickel Project Technical Report
Final November 2018 Page 241 of 342
The observed dusting rate in the rotary kiln in pilot plant testing was quite low, of the order of 0.5% of kiln feed probably as a result of the well agglomerated characteristics of the dried Araguaia ore charged to the pilot plant rotary kiln. Nevertheless, for the purposes of design, a dust rate of 17.4% of kiln feed (dry basis) excluding coal has been adopted, which is based on benchmarking other nickel laterite kiln operations some of which do not process agglomerated ore.
Regarding kiln temperatures, in pilot plant testing, the average calcine discharge temperature was 900°C to 925°C without any sintering occurring. Temperatures above the target range can possibly in some cases result in excessive accretion ring formation in the kiln interior that results in downtime and requires more maintenance and cleaning. Ring formation was not observed in the pilot test campaign, even up to temperatures of approximately 1,050°C.
For the purposes of design, a target temperature of 875°C for the kiln discharge calcine and 850°C for the calcine feed to the furnace was adopted here. This selection of kiln temperatures allows for good conditions for achieving the required levels of pre-reduction, yet also ensures that the calcine in the kiln will not exceed high temperatures where the onset of sintering could occur.
17.3.5 Smelting
The furnace is a rectangular furnace having a 32 m shell length and an 9 m shell width for the processing of calcine obtained from treating the ANP ore at the rate 0.9 Mt/a (dry). The furnace power rating is approximately 57 MW.
17.3.6 Slag tapping temperature and ferronickel grade
Based on previous test results, including pilot testing carried out during the first and second quarters of 2015, a slag skimming temperature of 1,575°C to 1,600°C was adopted. The FeNi product specification is 30% Ni content, based on testing and market demand. The estimated furnace metal and slag temperatures are provided in Table 17-5.
Table 17-5 Estimated furnace metal and slag temperatures
Item Project criteria
Ore blend LOM Plan blend
Target crude FeNi grade (% Ni) 30
Metal liquidus (°C) 1,460
Slag liquidus (°C) 1,380
Metal tapping temperature (°C) 1,500
Slag tapping temperature (°C) 1,575–1,600
Metal tap – slag tap delta temperature (°C) 75–100
Metal superheat (°C) 40
Slag superheat (°C) 150 -200
Nickel – overall plant recovery (%) 92.8
The slag liquidus temperature corresponds to the PDC slag composition. Due to some anticipated variability in ore feed within established limits, slag composition will vary, and slag properties will also be subject to some variability. The process will be designed to handle such variability.
17.3.7 Smelting process description
The calcine surge bin receives the calcine produced by the rotary reduction kiln and periodically discharges a batch into a calcine transfer container by opening the arc gate beneath the bin. The calcine transfer car carries the loaded container to the hoist well. The calcine transfer crane lowers an empty calcine transfer container onto the calcine transfer car, and then lifts the full container to the furnace feed floor for discharging into the furnace feed bins.

Horizonte Minerals Plc Araguaia Nickel Project Technical Report
Final November 2018 Page 242 of 342
A calcine container vent hood is located above the loading calcine container to provide ventilation and dust extraction. The vent gas is discharged to the furnace baghouse system. Furnace feed bin hoods are located above the furnace feed bins to collect the dust when the calcine container feeds to the furnace feed bins. The vent gas is discharged to the spray chamber and then to furnace baghouse system.
The hot calcine is fed to the furnace by gravity from 12 furnace feed bins via 36 feed tubes strategically positioned to obtain a suitable distribution on side-wall banks of the charge. Each feed tube is equipped with a discharge valve to control the feed rate.
In the furnace, six electrodes in line with each pair having their power supplied by three single-phase transformers that are arranged in a parallel pattern to provide the overall smelting power. The electrodes are automatically raised and lowered relative to the slag height to regulate impedance/current. The transformer tap is also adjusted via the tap changer to regulate and control furnace power. The furnace power set point is based on the calcine feed rate and specific smelting energy requirement to achieve the desired bath (metal and slag) temperatures.
The hot calcine is heated further by thermal energy generated from electrical arcs formed between the furnace electrodes and due largely to resistance heating of the slag. The slag also provides most of the heat transfer to the calcine from the molten furnace bath, resulting in calcine melting and carbothermic reduction to form molten FeNi, which is composed of the molten nickel and iron obtained from the calcine. The calcine contains partly reduced iron oxide and partially metallised nickel that are further reduced to metallic phases by reductant coal added at the kiln. The extent of reduction of the iron oxide to metal is controlled by varying the amount of reductant added at the kiln that together with the easier to reduce nickel allows the desired nickel grade (30 wt% Ni) in the FeNi to be achieved.
The other components of the calcine, principally oxides of iron, silica and magnesia comprise the molten slag that is formed. A SiO2 to MgO ratio (S/M) of 2.6 is the expected ratio in the slag phase, which is determined largely by the ore composition.
The molten FeNi metal and slag separate in the furnace to form different layers. The molten crude FeNi is tapped via FeNi tap hole at one side of the furnace into the 50-t ladle, approximately 3 to 4 times per day. The ladle is transported by the ladle transfer car to the refining plant.
Slag is semi-continuously skimmed from the furnace via one of two water cooled slag launders near the metal tap holes. Molten slag from the skimming launder falls through water jets (ratio up to 25:1 water/slag) into a sluice and then into a sloped pit to allow a FEL to remove slag after skimming and granulation is completed. The granulated slag is trucked to the slag repository. Water for granulation is supplied from the raw/fire water pond having a capacity of 11,000 m3. Overflow water from the pit flows to one of two settling tanks, for fines removal, and then is returned to the water cooling dam.
Energy balance calculations indicate that the specific power consumption is approximately 506 kWh per metric tonne of calcine. On this basis, the required power rating for the furnace will be approximately 56.6 MW for smelting 117.1 tonnes per hour calcine. This power consumption is calculated based on a slag tapping temperature of 1,575°C, a metal tapping temperature of 1,500°C, a freeboard temperature of 1,000°C and a heat loss of 6 MW. However, the heat losses could increase by up to 3 MW if the freeboard temperature exceeds 1200°C and the slag superheat is at above the 200 °C level for an extended operating period of several hours. This higher heat loss condition would result in a decrease in the production of FeNi over that period as a result of less power being available for smelting. Control of the Al2O3 content at below 7wt% and the SiO2/MgO ratio below 2.6 in the slag by meeting the specified blending composition criteria would largely mitigate the abovementioned excursion in furnace operating conditions.
The furnace cooling system carries out effective cooling of the refractory lining by applying an appropriate cooling technology. For the electric furnace designed by China ENFI Engineering Corporation (ENFI), formerly known as the China Nonferrous Engineering and Research Institute, red copper (pure copper) blocks with high heat conductivity are used for cooling of the refractory lining. The copper blocks are in various structures and are designed for different locations within the furnace sidewall.

Horizonte Minerals Plc Araguaia Nickel Project Technical Report
Final November 2018 Page 243 of 342
Three layers of copper plate block, called “horizontal block”, are laid horizontally into the refractory in the slag layer fluctuation zone to minimize erosion of refractory lining at the slag zone. Vertical blocks are provided in the bath zone and are set vertically between the furnace shell and the refractory lining. The vertical blocks provide a large cooling area and are capable of effectively cooling the refractory lining of the furnace wall in the bath zone. Cooling the refractory lining will create a frozen slag layer on the surface of the refractory which will protect it from erosion.
Primary furnace process off-gas leaves the furnace and is collected by a dedicated system at a temperature of approximately 1,000°C at the furnace roof outlet. Residual carbon monoxide is combusted by drawing in cold ambient air through a circumferential air gap. The gas is cooled in a spray chamber, before being passed through a baghouse for dust removal designed for achieving high-efficiency particulate collection that will comply with the environmental design criteria. An induced draft fan is installed to ensure negative pressure is maintained along the off-gas train. The furnace off-gas exits the furnace and is then discharged through a stack.
An emergency off-gas system will discharge the off-gas to the atmosphere under conditions when the furnace power is reduced during an outage situation such as a power trip.
Ventilation around the furnace is by a smoke hood over the furnace roof. The various hot calcine discharge transfer points will also have a dedicated (secondary) ventilation system. De-dusted gases collected from the metal and slag tapping locations will be used for cooling the primary off-gas. Metal spills or solidified metal from the launders or ladles is collected for recycle. Dust captured from the baghouse is pneumatically conveyed back into the existing dust system for recycling to the dust bins.
Key characteristics of the furnace, metal, slag and de-dusting systems are shown in Table 17-6 and Figure 17-3.
Table 17-6 Smelting key parameters
Item Unit Value
Furnace feed material
Calcine feed rate t/h 117.1
Calcine temperature at furnace °C 800
Furnace characteristics
Geometry Rectangular
Shell length m 32
Shell width m 9
Electrodes configuration 6 – in line
Electrode diameter m 1.4
Number of transformers 3 x single phase
Power (average/maximum) MW 56.6 (average)/68 (maximum)
Heat loss MW 6 (nominal)
Slag region cooling Horizontal block (three layers of copper plate block)
Metal characteristics
Metal production – design t/h 7.6
Tapping temperature °C 1,500
Liquidus temperature °C 1,460
Metal super-heat °C 40
Ni content % 30
Slag characteristics
Average slag production rate t/h 103.1
Skimming mode h/day 15 to 20
Skimming temperature °C 1,575 to 1600
Liquidus temperature °C 1,380
Slag super-heat °C ~200
De-dusting systems
Type (both systems) Spray chamber + Baghouse

Horizonte Minerals Plc Araguaia Nickel Project Technical Report
Final November 2018 Page 244 of 342
Figure 17-3 Schematic diagram of smelting flowsheet
17.3.8 Ferronickel refining
The crude FeNi tapped from the primary smelting furnace contains reasonably low levels of undesirable tramp elements such as sulphur and phosphorous and also limited amounts of carbon and silicon. These have to be reduced to meet the required product specification, which means it is necessary to refine the hot metal in a refining plant to achieve the commercially required FeNi quality prior to shotting.
The FeNi refining is conducted in a refractory lined ladle which is equipped with porous plugs for bottom stirring. Chemically, the two-stage refining process can be characterised as: oxidation and reduction. Oxygen blowing is performed together with a slagging agent addition mainly to remove P, C, and Si in the oxidation process. In the reduction process, reductant and slagging agent are introduced into the ladle to remove S and O.
Crude metal will be tapped in 50 t batches from the smelting electric furnace at about 1,500°C via one of the two tapholes into a preheated refractory-lined ladle. The FeNi in ladle is transferred by ladle transfer
car to electric refining ladle furnace area where the metal temperature is raised to around 1,630 ℃ for refining in the oxygen blowing station. At the blowing station, powder reagent and oxygen are injected into the molten FeNi by lance to remove C, Si and P in FeNi. Meanwhile, the dephosphorization slag is formed in the ladle. The ladle transfer car is equipped with a hydraulically actuated tilting frame to allow for de-slagging. Then the dephosphorization slag is skimmed in the blowing station by a skimming machine. Temperature is the key parameter to desulphurization. Al grain and CaSi grain are added into the molten FeNi, to make FeNi metal temperature increased about 150°C. Then powder reagent is blown into the molten FeNi by an injection lance again to remove S and the desulphurization slag is formed. The desulphurization slag is skimmed. Finally, the ladle will be transferred to blowing station to skimming the slag followed by metal shotting.

Horizonte Minerals Plc Araguaia Nickel Project Technical Report
Final November 2018 Page 245 of 342
During the refining process, the oxidising and reducing slag will be cast on the ground and then ripped up when cool and stored temporarily in piles. The refinery slags will be subsequently treated to recover valuable metals through crushing and gravity separation. The refined molten FeNi will be transferred to the product shotting and subsequent drying area to complete the production the final FeNi shot for handling and storage prior to shipment to markets.
Figure 17-3 presents a schematic diagram of the arrangement for FeNi refining. Some of the individual refining steps using the reagents are carried out sequentially and are included in the schematic arrangement in Figure 17-3.
Based on the quality of the FeNi obtained in the pilot testing, the expected composition of the crude FeNi product is given in Table 17-7.
Table 17-7 FeNi metal characteristics
Element Unit Crude metal Refined metal
Ni wt % 30 30
Fe wt % Balance – minor elements Balance – minor elements
Si wt % 0.01 to 0.2 <0.04
C wt % 0.05 to 0.2 <0.04
P wt % 0.2 to 0.3 <0.03
S wt % 0.2 to 0.5 <0.04
Cu wt % 0.05 0.05
Co wt % <0.8 <0.8
Cu Ni/Cu >300 ~300
Co Ni/Co >30 >30
The refining station design criteria are indicated in Table 17-8. A schematic arrangement of the FeNi refining process is illustrated in Figure 17-4.
Table 17-8 Key design characteristics of the refining furnace
Item Unit Value
Type - Ladle furnace
Ladle capacity t 50
Crude metal temperature °C 1,500
Temperature of desulphurization °C 1,630
Refined metal temperature °C 1,630
Reagents
Powder reagent consumption kg/t FeNi 116
Reagent consumption kg/t FeNi 20
Al grain consumption kg/t FeNi 2.6
CaSi grain consumption kg/t FeNi 3
Oxygen Nm3/t FeNi 15
Nitrogen Nm3/t FeNi 21

Horizonte Minerals Plc Araguaia Nickel Project Technical Report
Final November 2018 Page 246 of 342
Figure 17-4 Schematic diagram of the arrangement of the FeNi refining process
Note: Ladle capacity is 50 t/ladle (ENFI, 2018)
17.3.9 Metal shotting and product conditioning
From the refining area, the hot FeNi refined metal (nominally at 1,630°C) is transported to the shotting area in the refining ladle equipped with a bottom pouring spout. The ladle is positioned above the shotting tank by an overhead crane. From the ladle, the molten FeNi metal is tapped by a sliding gate in the bottom of the ladle at a controlled flow rate generally in the range of 1 t/minute to 1.5 t/minute, into a rotating tundish located above the shotting tank. The drive unit ensures controlled rotation of the tundish.
The rotating tundish allows for larger granules, less fines and better control of the shotting process. The tundish is heated prior to shotting with liquefied petroleum gas (LPG). In the shotting tank, the hot metal stream from the rotating tundish disintegrates into droplets and granules are formed on quenching. A counter flow of cold water (~700 m3/h) from the elevated water reservoir rapidly cools the granules while sinking through the tank due to gravity. To avoid steam bursting during shotting, temperature of cooling water in the shotting tank must be constantly kept less than 50°C. The shot collected at the bottom of the water tank is discharged from the tank by an air/water ejector pump into the inlet box on the dewatering unit where the shot is screened to remove some residual water and sediment. The dewatered shot is transferred by a conveyor to a rotary dryer.
The dried material will then be screened into product sizes as required by the market. The sized material is transferred to a covered stockpile area for subsequent dispatching. If there are any size fractions of <2 mm or >50 mm, this product is not usually accepted by clients and would therefore be normally recycled directly to the ladle at the furnace heating station for re-melting together with the hot metal feed. Table 17-10 provides the key design and operating criteria for these process steps. Figure 17-5 provides a schematic arrangement of the FeNi product conditioning step (with all fines greater than 2 mm).
Table 17-9 Metal shotting – key characteristics
Item Unit Value (average)
Metal shotting
Shotting speed t/minute 1.5
Shotting time minute 30 ~ 35
Metal temperature °C 1,630
LADLE REFINING
SLAG DUMPCRUSHING &
GRAVITY
SEPARATIONDISCARD
SLAGRECOVERED
METAL TO
RECYCLE
REAGENTS
OXYGEN
LANCE
CRUDE
FeNi
REFINED
FeNi to
SHOTTING
FLOWRATE*TEMPERATURE
6.94 avg1500
LEGEND
FLOWRATE*
* Nominal values
t/h or
NM3/h
TEMPERATURE °C
STACK
DUST FOR
RECYCLING
FLOWRATE*TEMPERATURE
7.06 avg.1630
FLOWRATE*TEMPERATURE
4.2 t/heat1600
FLOWRATE*TEMPERATURE
150,000 Nm3/h
70
NITROGEN FOR STIRRING
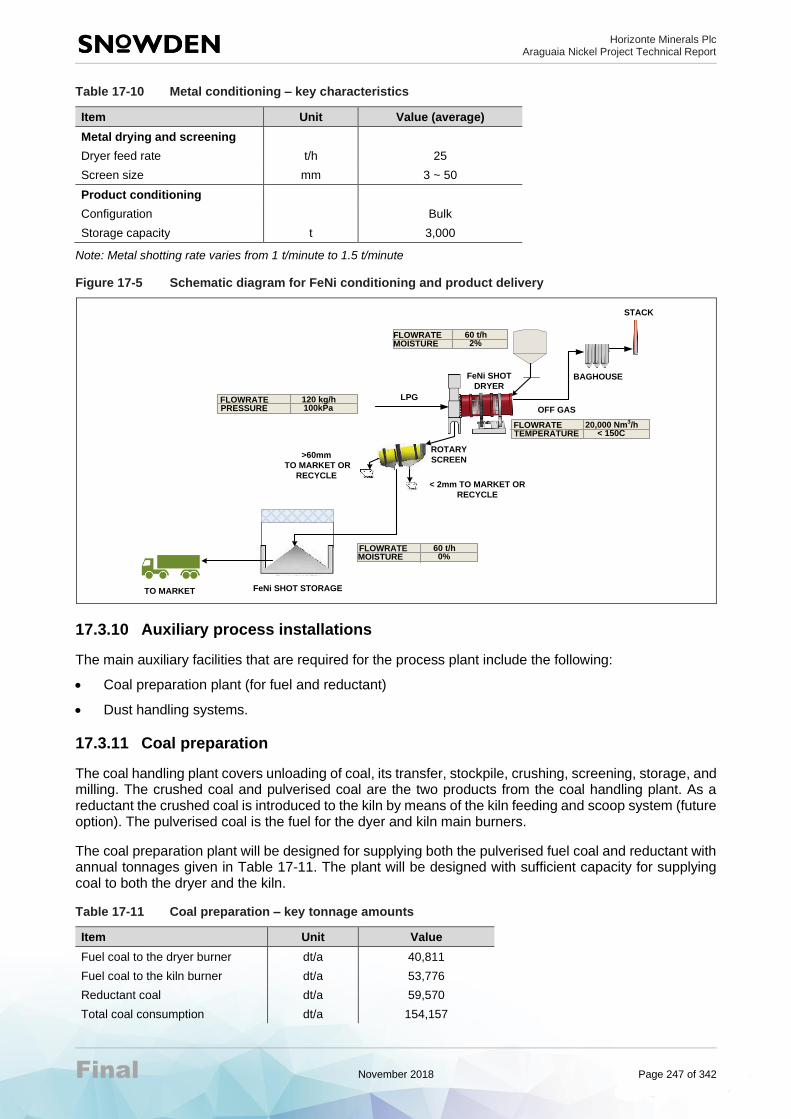
Horizonte Minerals Plc Araguaia Nickel Project Technical Report
Final November 2018 Page 247 of 342
Table 17-10 Metal conditioning – key characteristics
Item Unit Value (average)
Metal drying and screening
Dryer feed rate t/h 25
Screen size mm 3 ~ 50
Product conditioning
Configuration Bulk
Storage capacity t 3,000
Note: Metal shotting rate varies from 1 t/minute to 1.5 t/minute
Figure 17-5 Schematic diagram for FeNi conditioning and product delivery
17.3.10 Auxiliary process installations
The main auxiliary facilities that are required for the process plant include the following:
• Coal preparation plant (for fuel and reductant)
• Dust handling systems.
17.3.11 Coal preparation
The coal handling plant covers unloading of coal, its transfer, stockpile, crushing, screening, storage, and milling. The crushed coal and pulverised coal are the two products from the coal handling plant. As a reductant the crushed coal is introduced to the kiln by means of the kiln feeding and scoop system (future option). The pulverised coal is the fuel for the dyer and kiln main burners.
The coal preparation plant will be designed for supplying both the pulverised fuel coal and reductant with annual tonnages given in Table 17-11. The plant will be designed with sufficient capacity for supplying coal to both the dryer and the kiln.
Table 17-11 Coal preparation – key tonnage amounts
Item Unit Value
Fuel coal to the dryer burner dt/a 40,811
Fuel coal to the kiln burner dt/a 53,776
Reductant coal dt/a 59,570
Total coal consumption dt/a 154,157
FeNi SHOT STORAGETO MARKET
< 2mm TO MARKET OR
RECYCLE
FeNi SHOT
DRYER
ROTARY
SCREEN>60mm
TO MARKET OR
RECYCLE
FLOWRATEMOISTURE
60 t/h0%
LPG
BAGHOUSE
STACK
OFF GAS
FLOWRATEPRESSURE
120 kg/h100kPa
FLOWRATETEMPERATURE
20,000 Nm3/h
< 150C
FLOWRATE 60 t/h2%MOISTURE

Horizonte Minerals Plc Araguaia Nickel Project Technical Report
Final November 2018 Page 248 of 342
Total coal consumption wet t/a 184,619
Coal will be received by road trucks and stockpiled. The stockpile provides a surge capacity of seven days (~3,600 wet t) and allows the raw coal to be fed at a lower, constant rate to the primary coal crusher. A FEL will reclaim the coal and discharge it into the coal crusher feed hopper from where it is delivered by the coal crusher feed conveyor to the primary coal crusher which will reduce the as-received coal to less than 30 mm.
The primary crusher discharges the crushed coal into the coal screen via the coal screen conveyor. The undersize coal from the screen is conveyed to the coal pulverising plant feed bin by the coal pulverising plant feed conveyor which is fitted with belt scales.
The oversize coal from the screen is discharged to the reductant coal bin and the reductant scoop bin by a diverter and the coal scoop transfer conveyor. A portion of the oversize coal from the coal bin is allowed to be discharged to the coal pulverising plant feed bin.
The air heater will be fired with pulverized coal. The air heater will be equipped with one combustion air fan and one dilution air fan. The air heater will operate under sub-stoichiometric firing conditions (90% aeration) and the hot blast exit temperature will be controlled at 800°C. The hot gases will pass through a mixing chamber where they will mix with a fraction of cleaned coal mill exhaust gases (extracted after baghouse). The mixing chamber outlet temperature will be approximately 250°C. The raw coal will be milled in a vertical roller mill with an integral dynamic classifier. The mill exit temperature will be controlled at 85°C. The pulverised coal will be blown to the baghouse.
The baghouse hopper screw conveyors will discharge the pulverized coal in to pumps that will pneumatically convey the pulverised coal to two local coal bins adjacent to the dryer and the rotary kiln. From these feed bins, Coriolis/Pfister-type dosing pumps will feed the dryer and kiln burners respectively.
17.3.12 Dust handling systems
Dust is generated at the dryer, kiln, electric furnace and refinery and will be collected at the following points: dryer ESP, kiln ESP, furnace spray cooler and baghouse, refinery baghouse and hygiene baghouse. The dust typically contains relatively high nickel levels and therefore to minimise any nickel losses, it is important to design a proven and reliable dust handling and recovery system. Collected dusts will be conveyed to the main dust storage bin located in the primary crusher area.
17.3.13 Utilities
The utilities areas and services incorporated for the Project are:
• Fuel oil storage
• Diesel oil storage
• LPG storage/distribution
• Water systems
• Söderberg electrode paste handling
• Refinery reagents handling
• Compressed air generation
• Oxygen and nitrogen storage/generation.
Fuel oil storage
Fuel oil will be used at the dryer and the kiln for burner start-up and as supplementary fuel to help flame stabilisation conditions as required at these units. For this study the pulverised coal to HFO ratio at both the dryer and kiln burners is set to 90:10.

Horizonte Minerals Plc Araguaia Nickel Project Technical Report
Final November 2018 Page 249 of 342
The HFO fuel is unloaded into the 500 t HFO storage tank from the HFO tanker by the HFO unloading pump. HFO storage tank heaters are installed to heat the HFO to the desired storage temperature. The heaters are located on a recirculation loop operated by the storage tank pumps. HFO at the desired temperature is distributed from the storage tank to the users by the supply pumps installed in parallel with a manual duty/standby mode. A duplex filter is installed at the inlet of the HFO supply pumps.
Diesel storage
The diesel fuel is unloaded into the 60 t diesel storage tank from a diesel tanker by a diesel truck unloading pump. From the diesel storage tank, diesel fuel is delivered by a diesel supply pump to several diesel generators that provide emergency electricity during a power failure. Diesel fuel is also supplied to the standby diesel-powered furnace cooling circuit pump, standby diesel powered cooling tower pump, and the standby fire water pumps. Diesel fuel is also supplied to various plant outlets and to the vehicle fuel station tank.
The mixture of diesel and water collected from the containment area sumps is directed to the oil water separation tank where the oil and water are separated by gravity and the water is discharged to the surface water collection pond. There are three containment area sumps: vehicle fuel station containment area sump, diesel storage containment area sump, and HFO fuel storage containment area sump.
LPG storage
LPG is unloaded to the 20.4 t (total) LPG storage tanks from the LPG truck. From the LPG storage tank, LPG is delivered to the various users and outlets such as the dryer burner pilot, kiln burner pilot, shotting product dryer burner, ladle pre-heat, refinery, and coal pulverising.
Water systems
The plant water system consists of the following circuits:
• Water cooling dam
• Raw/Fire water pond
• Fire water system
• Slag granulation
• Metal shotting
• Cooling water
• Potable water
• Surface water.
The source of supply for all the plant process and firefighting water will be the water cooling dam. Water that is discharged from the Process Plant is returned to this dam with the exception of the discharge water from the sewage treatment plant. The water cooling dam is sized to provide an adequate supply of water to the plant throughout the year, including through the dry season.
Losses from the water cooling dam include seepage, evaporation, and water losses from the various plant processes that are not recycled back to the dam. Make-up water to the dam is from the Arraias River.
The plant process and firefighting water, pumped from the water cooling dam, will be stored in an 11,000 m3 water pond, which will supply process, slag granulation, product shotting, fire hydrant and deluge and foam system. The outlet nozzles from this reservoir will be located in order to ensure the minimum reserve required by each system as follows:
• The outlet nozzle for the fire hydrant system shall be located as low as possible
• The outlet nozzle for the deluge and foam system shall be located above the level that ensures the minimum reserve required by the hydrant system

Horizonte Minerals Plc Araguaia Nickel Project Technical Report
Final November 2018 Page 250 of 342
• The outlet nozzles for the granulation, shotting and process use shall be located above the level that ensures the minimum reserve required by the fire hydrant system plus the minimum reserve required by the deluge and foam system.
The volume of firefighting water shall consider at least one hour of firefighting, which results in 108 m3 of firefighting water.
The raw/fire water pond will be provided with:
• An appropriate drain and overflow systems.
• Level indication and control to:
− ensure adequate water levels are available in the pond for granulation and shotting requirements, and firefighting
− alarm low water levels
− control the pump from the water cooling dam.
This reservoir will receive water from the water cooling dam through the main process water supply pumps. A set of two pumps, located on barges will pump the water from the water cooling dam to the raw/fire water pond. In addition to this system, there is diesel power generator (genset) at the water cooling dam in case of a power outage.
The fire water system comprises the following:
• One electric powered main pump
• One diesel powered spare pump
• One Jokey pump to maintain a pressure in the fire water system.
The capacities of these pumps shall be as follows:
• 108 m3/h for the main and spare pumps of the hydrant system.
Process water system includes the pug mill, vehicle and road wash, hose stations, water to the softened plant, slag granulation and metal shotting.
The recycle dust from the dryer and RKEF will be wetted in a pug mill to about 20 wt% moisture. This water will be lost to evaporation in the dryer. Design flow to the pug mill will be approximately 8.2 m3/h.
An estimated 50 m3/h of process water will be used for vehicle washing and for dust suppression along the plant roads. Water from the vehicle wash and maintenance shops will be collected in an oil/water separator before discharge to the plant surface water collection pond.
An estimated 30 m3/h of process water will be consumed from the various hose stations located around the plant. Most of this water will drain back to the plant surface water collection pond.
Make-up water to the cooling circuit will be treated in a water softening and demineralisation plant. Blowdown water from the plant will be directed to plant surface water collection pond. The treated softened water will be stored in a 440 m3 tank and pumped to the cooling tower as required. Softened water flow is expected to be approximately 40 m3/h.
Slag granulation will make up the bulk of the water usage, requiring a nominal 2,577 m3/h for about 20 hours per day. The granulation water is sprayed at high flow (25 t water: t slag) and at a minimum pressure of 7 bar over the molten slag to produce a granulated slag 6 mm in size or less. The water from the granulation sluice is allowed to drain away from the slag pile and flows by gravity to a slag granulation bay settling pond. Any fines carry over from the granulation system will settle in this pond. The water is allowed to overflow from this pond and flows by gravity back to the water cooling dam. The solids in the granulation bay settling pond are removed periodically.

Horizonte Minerals Plc Araguaia Nickel Project Technical Report
Final November 2018 Page 251 of 342
Metal shotting is the second largest consumer of water in the plant requiring about 700 m3/h of water. Refined metal at 1,630°C is poured into a water tank, through a rotating tundish to produce a metal shot of between 2 mm and 60 mm in size. Overflow water from this tank is collected in a bunded area and is pumped to a lamella clarifier to remove any metal fines carried over in the water from the shotting system. The clarifier overflow will drain into the plant surface water collection pond. The clarifier underflow is filtered, with the filter cake solids recycled back to the refinery and the filtrate sent to the plant surface water collection pond.
Cooling water system
The cooling water system consists of a cooling tower, make-up tank, filter, heat exchangers and recirculation pumps for both the open (cooling tower) circuit and the closed (furnace) circuit.
The cooling tower receives return cooling water from the closed loop cooling heat exchangers and cools it through a counter flow type cooling tower. Make-up water to the cold well is from the softened water system.
The cooling tower water supply pumps (two operating) pump from the cold well through an inline cooling water filter and back to the furnace cooling water heat exchangers (one operating and one standby). The filter has an automated backwash function. Blowdown from the cooling tower occurs as backwash from the strainer. The blowdown at a design flow of 9.6 m3/h is directed to the surface water collection pond.
Reagents are added to the cooling tower cold well to prevent the growth of algae and reduce corrosion. The design evaporation and drift loss from the cooling tower is approximately 21 m3/h.
The furnace cooling circuit pumps (two operating and an emergency diesel generator) water from the heat exchangers through the copper coolers in the furnace side walls and electrode clamps cooling circuits back to the cooling water make-up tank. Softened water is added to the make-up tank, as required along with reagents to inhibit corrosion and algae growth in the circuit. A sight glass is located on the make-up tank as well as a level indication. The sight glass is used to visually verify the water level in the system and to determine if any leaks are present.
Since this circuit operates as a closed loop, natural water loss is very low. Any significant loss is usually a sign of a leak, which will require appropriate action to prevent damage to the furnace. Water from the firewater system can be directed directly to the furnace cooling circuits to maintain an emergency supply of cooling water should all the cooling circuit pumps fail.
A cooling water branch line from the cooling tower pumps directs water in multiple parallel cooling circuit loops to the dryer and kiln bearings, gear reducers, and the ID fan bearings for the dryer, kiln and furnace. Cooling water is also directed to the refinery furnace. Return cooling water from these circuits is returned to the cooling tower.
Softened water is required for the evaporative cooling of the furnace off-gas. This is to prevent the build-up of scale on the spray nozzles. Therefore, a design flow of 9.25 m3/h of softened water is pumped from the cooling tower cold well to the furnace spray chamber and is lost to evaporation.
Water for the potable use will be sourced from the Arraias River and treated for potable use in a separate water treatment plant. This water will be distributed to sanitary facilities throughout the plant, administrative buildings, restaurant, industrial kitchen and all safety showers/eyewash stations.
Waste water collected from these facilities will be conveyed via underground sewers to lift stations, from which the wastewater is pumped via a common header to the sewage wastewater treatment plant. Submersible sewage grinder pumps are provided at each lift station. The sewage treatment plant effluent is to meet Brazilian sanitary standards and State of Pará standards.
Surface water is rainwater that flows across outside surfaces into the surface water system. The surface water system includes gutters, drains, and channels that transport the rainwater outside the plant area to the surface water collection pond. Water from the surface water collection pond is decanted and flows by gravity to the water cooling dam. This pond also has the ability to divert water to the environment (rather than to the water cooling dam) to reduce the risk of overfilling the dam.

Horizonte Minerals Plc Araguaia Nickel Project Technical Report
Final November 2018 Page 252 of 342
Surface water may become potentially contaminated with pollutants such as litter, wastes, grease, oil, or nickel ore. As such it is important to keep pollutants out of the surface water system, to minimise the surface water treatment (e.g. settlement ponds, oil/water separator).
Cr6+ levels in the surface water will be monitored at the surface water collection pond, and if necessary, the decant water from the surface water collection pond will be treated to remove Cr6+ before discharge to the water cooling dam.
A number of operational efforts to avoid pollutants entering the surface water drainage system are listed below:
• Activities with the potential to pollute water (e.g. processing, manufacturing, workshop activities) are conducted within roofed and bunded areas. Liquid wastes and wastewater from these processes are separated from surface water drains and are either:
− Recycled on-site (e.g. cooling water); or
− Collected in drums or tanks and removed by a licensed waste contractor for treatment and disposal at a licensed waste facility (e.g. waste oil)
− Rainwater from roofs, yard areas, car parks, etc. is directed to the surface water system
− Footpath, gutter and external areas are to be kept free of litter.
• Install diversion drains or bunds (e.g. speed humps) to divert clean surface water away from relatively dirty areas to minimise the amount of potentially contaminated water requiring treatment, and where practical, provide roof cover over and bund around any relatively dirty areas.
• Collect and manage dirty wash water with a separated collection system (e.g. maintenance shop water and bunded water from the fuel tank areas are treated in oil/water separators and filtered before discharge to the surface water collection tank or water cooling dam.
17.3.14 Söderberg electrode paste handling
Söderberg paste for the electric furnace electrodes will be hoisted to the electrode floor for handling and addition into the electrode casing segments.
17.3.15 Refinery reagents handling
Refinery reagents/consumables will be transported to site in bulk bags or pallets.
17.3.16 Compressed air
Compressed air will be used for instrumentation, dust conveying and general-purpose use. Conveying systems will be independent from instrument/plant air systems.
Five rotary screw air compressor packages will compress the air to allow for a minimum plant air pressure between 600 kPa(g) and 850 kPa(g). The compressed air is routed through the air filters to the air receivers. From the air receiver, most of the plant air is delivered to the various plant users while the remainder feeds the instrument air system.
The instrument air system consists of two dryer pre-filters, two instrument air dryers, one operating, one standby, two dryer post filters and an instrument air receiver which supplies the instrument air at a dew point of 3°C to the various plant users.
17.3.17 Oxygen and nitrogen
Oxygen is used for metal and slag tapping and also for lancing at the FeNi refinery. Nitrogen is used for porous plug stirring, for emergency lancing during ladle refining and providing an inert atmosphere at the coal bins.
Liquid oxygen is unloaded from the liquid oxygen truck to the 40,000 litre liquid oxygen storage tank and vaporiser. From the vaporiser, oxygen gas is transferred to the FeNi refining section.

Horizonte Minerals Plc Araguaia Nickel Project Technical Report
Final November 2018 Page 253 of 342
Liquid nitrogen is unloaded from the liquid nitrogen truck to the 15,000 litre liquid nitrogen storage tank and vaporiser. From the vaporiser, nitrogen gas is transferred to the FeNi refining section, coal preparation, reductant coal baghouse, coal pulverisation plant, kiln combustion coal bin and hopper, and dryer combustion coal bin and hopper.
17.3.18 Laboratory
A sample preparation area (sample house) and laboratory are mandatory components for the economic operation of the mines and process plant. For the Araguaia project, exploration samples and environmental samples will be sent to an external laboratory for analysis. Table 17-12 summarises a definition of samples that the laboratory has to prepare and analyse.
Table 17-12 Laboratory samples to be prepared and analysed
No. Sample Frequency No. of
samples per week
Sample preparation equipment
Analysis equipment
1 Exploration samples 0 XRF
2 Mine operation samples
250 XRF
3 Environmental samples
50 (0 at
plant lab) External lab to analyse samples.
XRF; water samples to be analysed via specific equipment
4 HBF (homogenization building feed)
Shift composite from cross belt sampler
21 shift composites
Drying, screening, crushing, rolling, splitting, pulverising.
XRF
5 DKF (drying kiln feed) Shift composite from hourly manual samples
21 shift composites
Drying, screening, crushing, rolling, splitting, pulverising.
XRF
6 DKP (drying kiln product)
Shift composite from hourly manual samples
21 shift composites
Drying, screening, crushing, rolling, splitting, pulverising.
XRF
7 PMD (pug mill dust) Manual shift sample 21 Drying, rolling, splitting, pulverising.
XRF
8 RKF/DOS (reduction kiln feed/ dried ore storage)
Shift composite from hourly manual samples
21 shift composites
Drying, screening, crushing, rolling, splitting, pulverising.
XRF; carbon analysis; pre-reduction by wet assay
9 EFF (electric furnace feed)
Every 4 hours (manual sample)
42 Crushing, blending, rolling, splitting, pulverising.
XRF; LECO
10 EFM (electric furnace metal)
Every tap (refining batch)
32
Metal sample preparation.
Sample collected at metal launder via spoon and mould.
AAS; LECO
11 EFS (electric furnace slag)
Slag skim shift composite from hourly samples while skimming
21 Crushing, blending, rolling, splitting, pulverising.
XRF
12 Refined FeNi samples from refining; also market sample
1/batch + duplicate (total of 2)
64
Metal sample preparation (polishing and drilling).
Sample via manual immersion samplers at ladle.
AAS; LECO; electro-gravimetry for Ni
The sample preparation area and laboratory must be adequate to house the following preliminary list of equipment as shown in Table 17-13 and Table 17-14.

Horizonte Minerals Plc Araguaia Nickel Project Technical Report
Final November 2018 Page 254 of 342
The laboratory is required to operate on a 24 hours/day, seven-day basis (three shifts), with the lab supervisor on dayshift and the shifts led by the shift supervisors. On dayshift, there will be a limited number of analysts reporting to the lab supervisor responsible for analysis the final product samples for shipping, and other special samples.
Table 17-13 Sample preparation equipment required
Area Equipment No. required
Model/Make (used elsewhere)
Vendor suggestions
Sample preparation area
Dryer 1 Yamato – DN-63 (forced convection type)
LaSalle Scientific in Guelph. This is DKN 602Cl. 220V 0r 115V
Dryer 1 Yamato – DS (free convection type)
Same supplier as above. DS is not valid any longer. Substitute with DVS6023 162L
Jaw crusher 10 mesh 1 Yoshida Seisakusho
Typically, material that is minus 2 inches. Feed to the kiln is about 2–3 inches maximum. Substitute with Herzog BB200
Blender (cement mixer type)
0 For ore samples
Blender (cone type) 0 For process samples
Pulveriser 2 BICO Inc. BICO or similar. May substitute with suitable Herzog refurbished units if available
CRM/Disc mill 0 Kawasaki Heavy Industries Denver lab equipment
Boyd crusher 1 IMP inventory (refurbished)
Balance/Pan scale 2 METTLER PM 4600 Denver lab equipment (Marshall)
Sample reduction equipment (riffles etc.)
3 Pascal Engineering Co. Ltd Denver lab equipment (Gilson)
Vibrating screen 1 For ore samples
Ro-tap sieve shaker 1 IIDA SEISAKUSHO VWR or similar
Workstations with dust hoods
2 IMP inventory
Dust collection system 1 IIDA SEISAKUSHO Donaldson Torit (including all cartridges, frames for access, mounted panel)
Herzog hydraulic press 0 For pressing powders for XRF
Table 17-14 Laboratory equipment required
Area Equipment No. required
Model/Make (used elsewhere)
Vendor suggestions
Laboratory area
Fume hoods in laboratory wet area
1 Fisher Scientific
Fume hood for electro gravimetric apparatus
1 Fisher Scientific
Laboratory furniture 1 lot All chairs, unattached tables, stands, sample trolleys
Water purifier to make distilled water or equivalent
1 E-Pure Water System (Fisher)
Off-gas scrubber 1 Included in building
Laboratory bench with sinks and Bunsen burner outlets
2 Included in building
Safety shower and eye wash 3 Fisher Scientific
Gas cylinder storage 1 Off-the-shelf
HVAC 1 Included in building

Horizonte Minerals Plc Araguaia Nickel Project Technical Report
Final November 2018 Page 255 of 342
Area Equipment No. required
Model/Make (used elsewhere)
Vendor suggestions
Liquid effluent treatment system
1 Holding tank system with level float alarms
Laboratory
pH meter 1 Horiba F-51 Similar model to be specified
Electric balance 1 Mettler AT 250 Marshall
Electric balance 1 Mettler AT 261 Marshall
Pan scale 1 Mettler PM 4600 Marshall
Modutemp fusion furnace 1 Modutemp SC 142-BM Vulcan or Herzog model to suit
Atomic absorption-photometer 1 Varian Spectr AA-220FS Shimadzu AA-7000
CS analyser 1 Leco CS-632 Eltra CS2000$
Automatic titrator 1 Kyoto Denshi AT- 610 Hamilton series (Fisher) or similar model to be specified
Electrolytic analyser 0 Yanaco AES-2D
XRF Spectrometer 1 Panalytical Bruker Tiger Sequential XRF
Hot plates (in fume hoods) 3 Dalton Similar model to be spec'd
Oxygen analyser 0 Leco RO-600
Sulphur analyser 0 Horiba EMIA-522
Glass ware and reagents etc. 1 lot Fisher Scientific Canada standard lab start-up package
Portable density/SG meter 1 Kyoto Denshi DA-130-N Similar model to be spec'd
Electric balance 1 Mettler AT-200 Fisher Scientific
17.4 Project and process design criteria (PDC)
The PDC describes all the high-level requirements of the project, which includes the requirements of the facility being built. Examples include plant capacity, product type(s), and feed source(s).
The PDC summarises the parameters and criteria to be used in the design of the Project, such as:
• Process data and assumptions to be used in the process design
• Design allowances
• Selected equipment design criteria that are critical to the process are included.
The environmental design criteria establish the environmental requirements for the process plant.
This document has been assembled from different sources such as mass and energy balance calculations, industry practices and supplier data as well as client information.
17.4.1 Definitions
The following definitions are used in these criteria.
• Design and nominal values. Design values reflect the design limit or range for a particular parameter, whereas “nominal” values are intended to reflect a typical or average value. PDC example: a product specification parameter with a “design” value representing the upper/lower spec, and a “nominal” value indicating the typical level.
• Availability. The availability of a piece of equipment or system is defined as the percentage of the year the piece of equipment is “available” to operate at any throughput. Availability is determined based on scheduled and unscheduled maintenance that require the piece of equipment to be completely shut down. Equipment is considered available for operation when it is not undergoing maintenance.

Horizonte Minerals Plc Araguaia Nickel Project Technical Report
Final November 2018 Page 256 of 342
• Operating factor. The operating factor defines the equivalent percentage of the year that the facility can be expected to operate at full production. The operating factor takes into account normal planned and unplanned process downtime, utilisation (i.e. operating at any throughput and capacity factor less than design).
• Annual production = Nominal production rate x 8760 hours per year x operating factor.
17.4.2 Project design criteria (PDC)
The PDC are presented in Table 17-15. The nickel ore is based on the initial 28-year LOM.
Table 17-15 Process design criteria (PDC)
Description Units Data Source
Plant operating summary
Mine design basis
Annual ore treatment, nominal dry t/y 900,000 3
Mine method - Open pit 3
Life of mine y 31 1
Nickel in the ore, nominal % 1.77 3
Nickel in the ore, design % 1.11 - 2.16 1
Overall nickel recovery in rotary kiln electric furnace product, nominal % 92.71 3
Nickel in the finished rotary kiln electric furnace product, nominal dry t/y 14,749 10
Plant operating basis
Operating days per year d/y 365 1
Shift roster, days on/off d 6/2 1
Shifts per day # 3 1
Hours per shift h 8 1
Primary and secondary crushing schedule
Crushing circuit availability % 75.0
Operating hours per year h 6,570 10
Kiln dust recycling schedule – from dust storage (3300)
Operating factor % 75.0
Operating hours per year h 6,570 10
Rotary dryer and tertiary screening schedule (3600, 3620, 3700)
Operating factor % 85.0
Operating hours per year h 7,446 10
Rotary (reduction) kiln schedule (4100) (individually)
Availability % 90.0
Operating hours per year h 7,884 10
Electric furnace schedule (4200) (individually)
Availability % 90.0
Operating hours per year h 7,884 10
Rotary kiln and electric furnace combined schedule (4100, 4200)
Operating factor % 85.0 1
Operating hours per year h 7,446 10
PDCs have been completed for the following:
• Ore receipt, crushing and homogenizing
• Rotary dryer and tertiary screening
• Rotary kiln – calcining area 4100

Horizonte Minerals Plc Araguaia Nickel Project Technical Report
Final November 2018 Page 257 of 342
• Consumables (coal treatment and fuel oil)
• Electric furnace and associated equipment
• Refining – electric furnace, metal shotting and drying
• Other utilities (air and water)
• Environmental design criteria for the process plant.
17.5 Mass and energy balances
The process mass balances have been developed using Metsim software. The HZM Metsim model was developed by KPM. The information in these balances conforms to the level of accuracy required for this FS.
17.5.1 Summary mass balance
The mass and nickel balance from the Metsim model for the Project is shown in Table 17-16.
Table 17-16 Mass and nickel balance for the nominal ROM average ore grade
Mass and nickel balance
Stream dt/a % Ni t/a Ni
Primary/secondary crushing + dust mixing
Inputs
ROM 900,000 1.77 15,910
Dryer dust recycle + Misc BH 12,579 1.84 232
Kiln dust recycle 192,934 2.17 4,193
Furnace + refining dust recycle 10,248 2.57 264
Water to pugmill 0 0.00 0
Total 1,115,761 20,598
Outputs
Ore to homogenized pile 1,115,546 1.85 20,594
Losses 216 2.17 5
Total 1,115,761 20,599
Drying
Inputs
Rotary dryer feed 1,115,546 1.85 20,594
Coal ash 1,546 0.00 0
Water from combustion 0 0.00 0
Water from air in leakage 0 0.00 0
Total 1,117,092 20,594
Outputs
Rotary dryer discharge 1,103,827 1.84 20,342
Handling losses 1,105 1.84 20
Dryer dust + crusher BH dust 12,579 1.84 232
Dusts losses to off-gas 25 1.84 0
Water to off-gas 0 0.00 0
Total 1,117,535 20,594
Calcining
Inputs
Rotary kiln feed 1,103,827 1.84 20,342
Reductant coal (total) including scoop) 59,566 0.00 0
Water from air pipe flow 0 0.00 0
Water from combustion 0 0.00 0
Water from air in leakage off-gas handling 0 0.00 0
Total 1,163,393 20,342
Outputs Calcine to furnace 831,179 1.94 16,145

Horizonte Minerals Plc Araguaia Nickel Project Technical Report
Final November 2018 Page 258 of 342
Mass and nickel balance
Stream dt/a % Ni t/a Ni
Kiln dust 192,934 2.17 4,194
Dusts losses to off-gas 135 2.17 3
Water to off-gas 0 0.00 0
Total 1,024,248 20,342
Smelting
Inputs
Electric furnace feed 831,179 1.94 16,145
Water in leakage air into furnace 0 0.00 0
Water to spray chamber 0 0.00 0
Water in air to air gap 0 0.00 0
Water in vent gas (before BH) 0 0.00 0
Water from air in leakage off-gas handling 0 0.00 0
Total 831,179 16,145
Outputs
Slag out of furnace 731,262 0.15 1,097
Crude FeNi to refining 49,223 30.00 14,767
Crude FeNi ladle skull 49 30.00 15
Furnace dust 10,248 2.57 264
Dusts losses to off-gas 104 2.57 3
Water to off-gas 0 0.00 0
Total 790,886 65.30 16,145
Refining 30 t batches; 1,640.8 batches/a
Inputs
Crude FeNi to refining 49,223 30 14,767
Water in lime 0 0 0
Total 49,223 14,767
Outputs
Refined FeNi to market 48,558 30.37 14,749
Shotting losses 5 30.37 2
Oxidising slag losses 1,302 0.27 4
Reducing slag losses 5,395 0.24 13
Total 14,767
17.5.2 Information on the Metsim model
The Metsim model for the FS was developed utilising experience in modelling other RKEF operations, but is specific to the Project. The FS model is designed so that each unit operation is operating at its correct operating factor and refining is being run on a batch basis. It also has included dust handling and ventilation systems.
A Microsoft Excel datasheet containing all the inputs and assumptions is used to interface with Metsim using the dynamic data exchange function in Metsim.
The design basis is for a nominal ROM ore of 900,000 t/a at an average grade of 1.77% Ni. The minerals in the ore were developed to be self-consistent with the ore element chemical analysis and was provided by HZM. It is consistent with the mineralogy used in the previous PFS.
The Metsim model for this study was carried out by Kingston Process Metallurgy (KPM) and HZM and has 10 pages as follows, with the nominal operating hours applied to each unit operation:
1) Compositions
2) Homogenised ore
3) Rotary dryer
4) Dried ore handling

Horizonte Minerals Plc Araguaia Nickel Project Technical Report
Final November 2018 Page 259 of 342
5) Rotary kiln
6) Electric furnace
7) Dust handling
8) Refining batch
9) Shotting – batch
10) Refining slag treatment – batch.
The stream tables used in the Metsim model match the stream numbers in the PFDs of this FS.
17.6 Process plant geotechnical study
Ausenco undertook a geotechnical investigation of the proposed process plant area so that costs for earthworks and foundations for the process plant could be estimated. The scope of this program included:
• Review of previous work and current project specifications and design criteria
• Develop supplemental geotechnical field program to be conducted including test pitting and drilling along with Standard Penetration Test (SPT)
• Logging of test pits and bore-holes
• Develop laboratory testing program of soils
• Develop recommendations for foundation design of low and high bearing infrastructure for the Project.
Based on this scope, a campaign of test pits and drillholes was developed.
Geotechnical reports and data supplied include:
• Test pit logs
• Bore-hole logs
• Photographic logs
• Laboratory testing results
• Engineering calculations.
17.6.1 General plant area geology
The plant is on relatively flat terrain with a mild slope in a westerly direction. The vegetation is mostly comprised of grasses and bushes, with many of the trees having been removed by the previous landowner.
The geology underlying the general plant area is typically comprised of laterite deposits of zones of various thicknesses, typically including a topsoil horizon, ferricrete horizon, residual limonite horizon (red and yellow), transition horizon and saprolite horizon.
17.6.2 Test pit program
The identification of the test pits in the field was performed by HZM team using a global positioning system (GPS) unit. As previously stated, only 12 of the 17 test pits were excavated with a Case 580M to depths ranging from 3.20 m to 4.00 m, with a target depth of 4.0 m. A few of the test pits were excavated to shallower depths due to refusal in hard materials. The exposed test pit side walls were logged according ASTM Unified Soil Classification System USCS (2011). Selected disturbed samples were obtained from the pit test and placed in clear heavy-duty plastic bags and labelled for laboratory testing. The test pits were backfilled on completion with the excavated material and nominally compacted.

Horizonte Minerals Plc Araguaia Nickel Project Technical Report
Final November 2018 Page 260 of 342
The test pit program identified the near surface soils as clayey and gravely clay. The investigation also identified groundwater, approximately 3.7 m to 3.8 m below the surface in TP-14 and TP-16 near the office and electrical substation. The remainder of the test pits were dry.
A photographic record of selected pits and surface features was completed. The test pit logs and the positions of the test pits were also recorded.
This program was used along with the drilling program, to determine near surface foundation conditions.
17.6.3 Drilling program
The drilling program included the diamond core drilling of vertical boreholes with SPT performed at specified intervals in each hole. The drilling was undertaken by Geominas, with a drill rig fitted with SPT equipment in the plant area. Boreholes were positioned at proposed heavy load facilities, such as the dryer, rotary kiln, electric furnace and primary crusher). The depths of the boreholes were specified at 30 m or 2 m to 4 m into competent bedrock, to characterize soil and rock strata and to determine depth to bedrock for possible pile foundations for heavy load facilities.
The site investigation identified bedrock ranging from 3.5 m to 19.5 m below the surface, with the deepest bedrock located at the dryer. The investigation also identified groundwater approximately 8 m to 9 m below the surface, over the proposed areas for the dryer, rotary kiln and electric furnace. The borehole at the primary crusher was dry.
The drill cores were wrapped in plastic by the drilling contractor to retain moisture and placed in core boxes for later logging. Each core run was labelled with run length and recovery length. The cores were logged according ASTM USCS (2011). Detailed core logs were completed.
The equipment used to perform a subsurface geotechnical program included geotechnical drill rig, capable of diamond core drilling and Standard Penetration Testing. The SPT is conducted at the bottom of a soil boring that was prepared using coring method with water. At regular depth intervals, the drilling process is interrupted to perform the SPT.
17.6.4 Completed field program
The test pit program was carried out by HZM in May 2018. HZM was able to complete 12 of the 17 recommended test pits, due to lack of permission from the landowner to complete test pits TP-1, TP-2, TP-3, TP-4 and TP-15.
The drilling program was carried out by HZM in June 2018. HZM were able to complete four of the five recommended bore-holes. BH-5 was not completed since the electrical substation was moved close to BH-01.
Laboratory program
The samples collected from the test pits program were transported to the Benjesolo Engenharia LTDA Geotechnical testing laboratory in Belo Horizonte, Brazil. The testing program selected test pit soil samples to determine their mechanical properties.
The USCS, a standardised and frequently used soil classification was used to communicate the soil properties. The test program selected for the test pit samples, to determine near surface soil conditions and their respective results, was completed. The results along with the SPT data was used in the foundation design recommendations.
The laboratory test results indicate that the near surface materials are clayey soils with medium plasticity and clayey gravels. The results from the drilling program, along with the SPT data, were later used in the development of the foundation design recommendations.
Based on the drilling program, the bedrock is near the surface (i.e. 4 m to 9 m below the surface), at the primary crusher, kiln and electric furnace and deeper at the dryer (i.e. 19 m below the surface). The results of the SPT showed the near surface soils were soft to hard increasing with depth from compacted to dense until bedrock was encountered, at full test depth.

Horizonte Minerals Plc Araguaia Nickel Project Technical Report
Final November 2018 Page 261 of 342
17.6.5 Plant site geotechnical conditions
The geotechnical profiles for each of the heavy load processing plant areas have been assessed and characterised for the following areas:
• Primary crusher area
• Dryer area
• Rotary kiln and electric furnace area.
Near surface groundwater seepage was observed in two test pits (TP-14 and TP-16), both located towards north end of the plant area near the electrical substation. The ingress of groundwater into these pits were observed at approximately 3.7 m below the surface. Bore-hole logs -01, -02 and -03 indicated groundwater tables approximately 8–9 m below the surface.
17.6.6 Near-surface earthworks
In 2017, Prime undertook a surface geotechnical program. On behalf of HZM, findings from that program related to the near-surface earthworks are applicable to the plant area and are summarised below.
The test pits over the ore processing area showed excavatable near-surface profile with dense gravelly transported layers and stiff residual horizons. In general, the soil over this area is considered suitable for easy excavation with standard earthmoving equipment. Limited use of pneumatic tools may be required at selected positions where cemented limonitic ferricrete (LF) is encountered.
It is recommended that in general cut slopes have a maximum gradient of 26° in soil horizons and 60° in rock horizons to be confirmed on site during the construction with the geotechnical engineer. The recommended safe excavation slopes of temporary excavations for the construction of shallow foundations can be at 45° (1V:1H).
17.6.7 Plant geotechnical recommendations
The bulk of the infrastructure areas will include light to medium heavy structures, and some areas will include infrastructure requiring deeper foundations (primary crusher, dryer, rotary kiln and electric furnace areas).
Shallow founding conditions
Following the geotechnical site investigation and laboratory testing, the near-surface soil conditions were assessed for foundation types per infrastructure area. Recommendations are presented below:
• Reinforced pad or spread footings are recommended for the founding of light to medium heavy structures.
• The founding level of pad or strip foundations for light structures must be below the organic (i.e. the loose topsoil layer).
• Deeper foundations for heavier structures must be founded on a competent horizon such as the stiff residual layer.
• Provision of drainage is required during the construction of the foundations since most of the near-surface soils tested have a liquid limit greater than 50%. These soils have the potential for swell.
Deeper foundations
As a result of the expected heavy loads and the nature of the soils, end-bearing piles are recommended for founding down to the soft to medium hard rock strata, which is 5.45 to 19.45 m below the surface. Based on the geotechnical program, the boreholes did not appear to collapse, even with the presence of groundwater; therefore, Ausenco is recommending Continuous Flight Auger (CFA) piles, which are widely used in Brazil.

Horizonte Minerals Plc Araguaia Nickel Project Technical Report
Final November 2018 Page 262 of 342
For heavy load structures that require pilings, the STP data for bore-holes 01 through 04, were utilised on the development of foundation design parameters. The design for pilings for heavy load structures was completed by Ausenco.
Horizonte Minerals Plc Araguaia Nickel Project Technical Report
Final November 2018 Page 263 of 342
18 PROJECT INFRASTRUCTURE
18.1 Summary
The scope of infrastructure described within this section includes the Project site requirements for ANP as well as the existing road infrastructure, identified as the transport route to the Port at Vila do Conde in Belém in the state of Pará for the import of coal for Project, and the outbound export of FeNi product. In this study, the FeNi product is sold on a free-on-board (FOB) basis which is standard industry practice. Rail has also been described as there may be potential to utilise this infrastructure in future years, although it does not form part of the FS design solution.
The proposed infrastructure for the Project will include:
• Access and site roads
• Water supply, water cooling dam, water treatment and mine site sewage
• Power supply
• Coal storage facility and slag repository
• Security and fencing
• Fire-fighting system
• Supply chain
• Administration and maintenance buildings, including laboratory
• Waste management
• Data and communications infrastructure.
The mining area is expansive and key infrastructure is associated with the processing plant and smelter facilities. The process plant site layout is presented in Figure 17-1.
18.2 Logistics solution for ANP
A comprehensive logistics study was completed by C. Steinweg Handelsveem (Latin America) S.A. The study aimed to identify the most cost-effective method to transport the following items:
• Coal from selected port to the plant site
• FeNi product from plant site to a port of export
• Other consumables (Table 18-2) to the Project.
The logistics study objectives included the development of an integrated transport solution utilising inbound and outbound transport synergies.
The FeNi product will be shipped to clients in Europe, USA and to Asia in containers. Bulk and break-bulk shipments do not apply for FeNi. Depending on the selected market and client, FeNi will be transported in big bags or bulk, always in sea containers. Parcel volumes will be negotiated with each client and can be shipped in lots of one to 60 containers, which is the maximum parcel that ship-owners may allocate per vessel in the port of Vila do Conde.
The logistics chain was divided into three stages:
• Ground transportation
• Port operations (reception, warehousing, loading)
• Ocean freight transportation.

Horizonte Minerals Plc Araguaia Nickel Project Technical Report
Final November 2018 Page 264 of 342
18.2.1 Ground transportation
The transport of the inbound coal from port to plant and outbound transport of FeNi product from the plant to the port, as well as most of the plant consumables, will be by road haulage utilising conventional single or double trailer trucks.
18.2.2 Regional information
Relevant roads for the Project and road distances are reported below and in Table 18-1 and Figure 18-1:
• PA-449 (between Conceição do Araguaia, PA and Rio Maria, PA)
• PA-287 (between Conceição do Araguaia, PA and Redencao, PA)
• TO-335 (between Conceição do Araguaia, PA and Palmeirante, TO)
• BR-155 (between Redencao, PA and Marabá, PA)
• BR-150 (between Marabá, PA and Goianesia do Para, PA)
• PA-475 (between Goianesia do Para, PA and Tailandia, PA)
• PA-252 (between Tailandia, PA and Barcarena, PA)

Horizonte Minerals Plc Araguaia Nickel Project Technical Report
Final November 2018 Page 265 of 342
Figure 18-1 Road to ports and local roads
Source: HZM, 2018
Horizonte Minerals Plc Araguaia Nickel Project Technical Report
Final November 2018 Page 266 of 342
Table 18-1 Tabulated distances
Origin Destination Cumulative distance
(km)
ANP, PA Conceição do Araguaia, PA 44
ANP, PA Palmeirante Railway Station, TO 204
ANP, PA Marabá, PA 451
ANP, PA Parauapebas, PA 393
ANP, PA Vila do Conde, Barcarena, PA 913
Source: Steinweg, 2017
The expected main material movements inbound and outbound to the ANP are shown in Table 18-2.
Table 18-2 Inbound and outbound volumes expected at for the ANP
Description Unit Annual Monthly Week Maximum truck movement
Year Month Week
Heavy fuel oil t 8,203 684 158 273.4 22.8 5.26
LPG t 294 25 6 32.7 2.7 0.63
Diesel oil t 1,486 124 29 49.5 4.1 0.95
Coal wet t 167,739 13,978 3,226 6,212.6 517.7 119.47
Electrode paste t 1,114 93 21 44.6 3.7 0.86
Lime t 4,480 373 86 179.2 14.9 3.45
Fluorspar t 628 52 12 25.1 2.1 0.48
Deox. aluminium wire t 126 11 2 5.1 0.4 0.10
CaSi wire t 146 12 3 5.8 0.5 0.11
Oxygen Nm³ 747,173 62,264 14,369 49.8 4.2 0.96
Nitrogen Nm³ 102,556 8,546 1,972 5.7 0.5 0.11
Refractories t 186 16 4 7.4 0.6 0.14
FeNi wet t 49,223 4,102 947 1,823.1 151.9 35.06
Total 8,714 726 168
Source: HZM, 2018
The main logistical challenges for the Project include:
• Poor road conditions in the southern part of the Pará State
• Lack of multimodal infrastructure
• Large distances to the port.
18.2.3 Roadworks for the Project
An engineering cost estimate covering the upgrade to roads necessary to meet ANP’s requirements for the construction phase and commercial operations was completed by Construserv Servicos e Construcoes Ltda. This cost estimate covered upgrades required to existing roads and new road construction, including bridges, culverts, drainage and road surfacing as appropriate. The study also covered the access road required to install the water abstraction pipeline and for its future maintenance.
The route selected by Construserv to go from Vila do Conde Port to the town of Conceicão do Araguaia is about 917 km. The town of Conceicão do Araguaia is connected to the Project site via state highway PA-449. Part of this route, linking the town of Xinguara to Conceicão do Araguaia is shown in Figure 18-2.

Horizonte Minerals Plc Araguaia Nickel Project Technical Report
Final November 2018 Page 267 of 342
Figure 18-2 Proposed roadworks for the Project
Source: HZM, 2018

Horizonte Minerals Plc Araguaia Nickel Project Technical Report
Final November 2018 Page 268 of 342
In addition to bridges, sections of PA-449 will require upgrading for the safe transport of material to the ANP. The 25.5 km section of PA-449 that requires upgrading is shown in yellow on Figure 18-3. A regional road (approximately 17.5 km) connects the site to PA-449. This road will also be upgraded as part of the Project and shown in brown in Figure 18-3.
Figure 18-3 Route from ANP to Conceicão do Araguaia
Note: Two sections of road, in brown and yellow (PA-449), will be upgraded

Horizonte Minerals Plc Araguaia Nickel Project Technical Report
Final November 2018 Page 269 of 342
The Pará State agency (SETRAN) has issued the tender 033/2018 regarding the bridge upgrade work on the section of PA-449 relevant to the project with an expected start date of November 2018. However, as part of the FS capex build-up, HZM has included the full upgrade costs for this section of road, so that project construction and won’t be delayed and the project capex estimate will reflect the worst-case scenario (that the state sponsored upgrade does not proceed when required).
In Year 8 of the Project, the roads from ANS to ANN will be upgraded to cater for the haulage of ore from VDS to the plant. The route selected is shown in Figure 18-2. The route is approximately 152 km and the work will comprise upgrades to local roads and some new roads. The work is scheduled to commence in Year 8 of the Project.
Water pipeline road
The road study conducted by Construserv includes building 13.5 km of un-sealed gravel road along the route of the water abstraction pipeline, linking the Rio Arrais river to the water-cooling reservoir at the process plant facility. The purpose of this road is to allow the construction and maintenance of the water pipeline and is shown in Figure 18-2.
Road upgrade costs
Table 18-3 shows the estimated costs prepared by Construserv that will be required to upgrade the road network to service the ANP.
Table 18-3 Project road upgrade distances and cost estimate
Road Length (km) Cost estimate (US$ M) Timing
PA-449 25.53 1.94 Initial
Local road 17.51 2.12 Initial
Water abstraction 13.48 0.86 Initial
Total Initial 56.52 4.91
ANS to ANN 152.00 11.2 Year 8
18.2.4 Ports for FeNi product shipment and inbound coal
FeNi product
The closest active ports to the ANP are Vila do Conde, PA and Itaqui, MA. Both are public ports. For container exports, Vila do Conde, PA represents the only suitable option for FeNi shipment because Itaqui currently has no container capability.
Vila do Conde is located in Barcarena (PA) on the right bank of the Para River, at Ponta Grossa, on the confluence of the Amazon, Tocantins, Guama and Capim rivers. The wharf is constructed in a “T” shape with four berthing cradles (Figure 18-4): one for dry bulk materials, one for general cargo, one for caustic soda and one for liquid materials. The berths are aligned with the flow of the Para River and they are connected to the land by a bridge access 378 m in length.
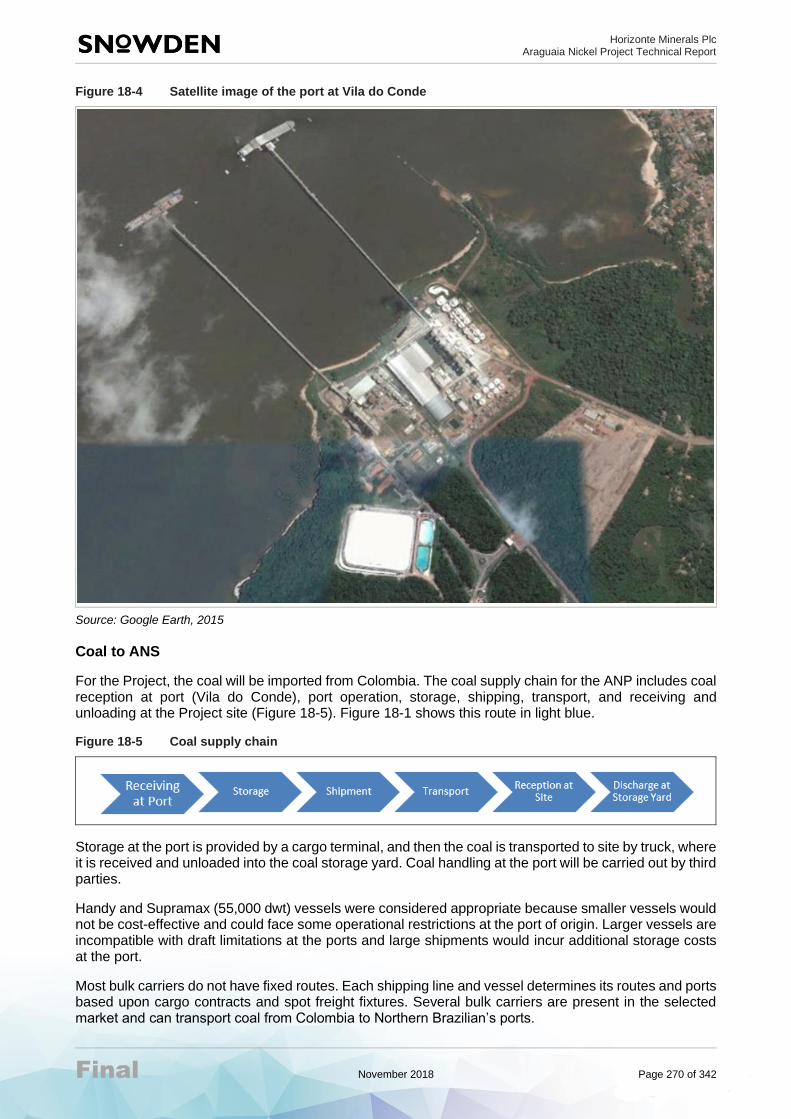
Horizonte Minerals Plc Araguaia Nickel Project Technical Report
Final November 2018 Page 270 of 342
Figure 18-4 Satellite image of the port at Vila do Conde
Source: Google Earth, 2015
Coal to ANS
For the Project, the coal will be imported from Colombia. The coal supply chain for the ANP includes coal reception at port (Vila do Conde), port operation, storage, shipping, transport, and receiving and unloading at the Project site (Figure 18-5). Figure 18-1 shows this route in light blue.
Figure 18-5 Coal supply chain
Storage at the port is provided by a cargo terminal, and then the coal is transported to site by truck, where it is received and unloaded into the coal storage yard. Coal handling at the port will be carried out by third parties.
Handy and Supramax (55,000 dwt) vessels were considered appropriate because smaller vessels would not be cost-effective and could face some operational restrictions at the port of origin. Larger vessels are incompatible with draft limitations at the ports and large shipments would incur additional storage costs at the port.
Most bulk carriers do not have fixed routes. Each shipping line and vessel determines its routes and ports based upon cargo contracts and spot freight fixtures. Several bulk carriers are present in the selected market and can transport coal from Colombia to Northern Brazilian’s ports.

Horizonte Minerals Plc Araguaia Nickel Project Technical Report
Final November 2018 Page 271 of 342
For coal imports, both Vila do Conde and Itaqui ports are currently receiving coal shipments and were evaluated as to their suitability.
Overall strategy
The solution selected for HZM coal and FeNi product transport comprises:
• Inbound coal is imported through Vila do Conde’s Port and transported by truck to the Plant site
• Outbound FeNi in bulk is backhauled by cleaned coal truck to Vila do Conde
• FeNi product will be stored in an ANP rented facility close to the Port and the product can either be
loaded into big bags (if required) or loaded in bulk into containers prior to dispatch to the should
port.
This solution removes the complexity of handling containers or big bags of product at ANP and allows for synergies between coal transport and product transport. Figure 18-6 shows an overview of the the FeNi logistics and Figure 18-1 shows this route in light blue.
Figure 18-6 FeNi logistics solution
18.2.5 Supply chain synergy
The coal will be received and unloaded at the port, transported to the cargo terminal, where the coal is stored and then loaded onto trucks, and transported to the site. At the project site, the coal is unloaded into coal storage facility; the truck is washed to prevent contamination, loaded with FeNi and then taken to the cargo terminal at the port of Vila do Conde.
18.3 Water supply
The current water balance provided by HZM, shows that an average 216 m³/hr is required from the river to support mine operations. The abstraction system was designed for 350 m³/hr (97.2 l/s), which is the permitted flow rate.
The pipeline route follows existing farm access roads and farm boundaries along the entire extent (Figure 18-7). The decision to constrain the route to these features means useful farmland is not divided and current easements may be used, greatly decreasing installation cost, installation time and impact on existing land use.
Water is abstracted from the Arraias River by the barge pump station, which is a floating installation comprising vertical spindle pumps. The barge pump station transfers river water to a tank at the high lift pump station by means of a 250 mm nominal diameter steel pipeline. The pumps at the high lift pump station draw water from this tank and transfer it though a pipeline approximately 11.1 km in length. The pipeline comprises a 350 mm nominal diameter steel pipeline, installed on concrete pipe plinths. A small section of the pipeline comprises a 200 mm nominal diameter pipeline where the flow is driven by gravity.
The design of the barge considers the seasonality of the river and characteristics of the Arraias abstraction point (FW33).

Horizonte Minerals Plc Araguaia Nickel Project Technical Report
Final November 2018 Page 272 of 342
Figure 18-7 Proposed pipeline route from the Arraias river to the water cooling dam
Power for the abstraction pump station will be supplied by means of an overhead line, fed from the mine site. Power is reticulated from a dedicated 13.8 kV medium voltage feeder located at the main substation of the mining operation. The routing of the line from the substation to the abstraction station follows the same route as that of the abstraction pipeline.
Capex for the abstraction pipeline is estimated at US$11.1 million, with piping US$9.9 million comprising the primary component. Opex for the pipeline was estimated at US$0.25 million per annum, with maintenance of the pipeline (US$0.19 million) the largest component, followed by electricity for pumping (US$0.07 million).
18.4 Coal storage facility
A coal storage facility will be provided and will consist of a flat area for the containment of 3,600 m3 of coal (approximately seven days). This designated area will be compacted and engineered to accommodate a drainage scheme, appropriate bunding and containment to accommodate and mitigate potential pollution from coal runoff into the immediate environment.
Coal will be transported to site and discharged into stockpiles. A front-end loader will reclaim the coal and discharge it into the coal crusher feed hopper from where it is delivered by the coal crusher feed conveyor to the primary coal crusher which will reduce the as-received coal to less than 30 mm.
18.5 Slag repository
Because the slag is small, spherical beads, it is subject to granular flow and therefore cannot be stacked. It has to be contained within a repository. A low permeability compacted clay and a cemented limonitic ferricrete (code LF) layer on the site will further prevent any unlikely contamination of groundwater resources.

Horizonte Minerals Plc Araguaia Nickel Project Technical Report
Final November 2018 Page 273 of 342
The slag repository will comprise of an integrated slag disposal area and drainage management system which has a total LOM footprint of approximately 60 ha. The life of the slag repository is for an initial 28-year LOM plan, and the total capacity is 20.44 Mt (dry) the total mass of slag expected to be produced over the LOM. This assumes that all slag generated by the plant is deposited in this facility and not utilised elsewhere (either off-site or on-site). If slag were to be utilised for road building or other purposes the proposed repository could be reduced in size with consequential savings. The slag repository is designed to have a maximum height of 36 m at the end of the LOM, with a final overall slope with step-in berms of approximately 1V:4H for easy rehabilitation. Due to the large total footprint of the slag repository, the construction will be staged.
The selected site is located east of the proposed plant and run of mine (ROM) area and north of the Pequizeiro (PQZ) pit (Figure 18-8 – red lined oblong structure).
The capex based on in-country rates for Phase 1 are estimated at US$6.09 million for Phase 1 and US$5.48 million for Phase 2. Phase 2 of the slag repository will be commissioned in Year 12. The construction activities will be undertaken during Year 11.
The estimated average annual pumping, maintenance and development costs for the slag repository (Phase 1 and Phase 2) are:
• Year 0 to Year 11: US$1.57 million
• Year 12 to Year 31: US$1.25 million.
18.6 Water cooling facility
A water cooling dam will be constructed to provide a constant source of water to the process plant and act as a heat sink for the furnace. The water cooling dam will be fed by rainfall, runoff, return water from the process plant and water abstracted from the Rio Arraias do Araguaia (Arraias River). The proposed water cooling dam is in a north-south trending valley southwest of the process plant (Figure 18-8).
The site fulfils the storage capacity requirements (1.82 Mm3), is nearest to the Arraias River (lowest costs of river water abstraction), is located a safe distance from the proposed surface infrastructure (low flooding risk), has a relatively low embankment wall requirement (lower construction costs) and has a smaller surface area (reduced environmental impact).
A surface geotechnical investigation was undertaken during 2017, focusing on the project areas related to various infrastructure units including the water cooling dam. Test pits were excavated, and boreholes drilled to obtain soil samples for testing.
A detailed design of the cooling dam embankment, spillway and other infrastructure was completed.
The capex based on in-country rates for the water cooling dam have been estimated to be US$1.90 million. The annual cost of the operation, inspection and maintenance activities are estimated at US$85,000 per annum.

Horizonte Minerals Plc Araguaia Nickel Project Technical Report
Final November 2018 Page 274 of 342
Figure 18-8 Water cooling dam
Source: Prime, 2018
Note: Water cooling dam denoted in blue, southwest of PQZ pit, slag repository in red lines (oblong shape) east of PQZ pit.
18.7 Other
Firefighting systems, administration and maintenance buildings, fencing, waste management, data and communications infrastructure have been designed and costed in the FS. A site hazardous locations identification study was also completed.
18.8 Energy supply for the Project
The electrical demand for sizing of the substation and the transmission line was established from the estimated electrical load; a summary is shown in Table 18-4.
Table 18-4 Estimated electrical load – installed capacity and estimated consumption
Item Installed capacity
(kW)
Annual consumption
(MWh)
Ore preparation 2,882 17,581
Pyrometallurgy 78,007 477,980
Material Supply 1,828 12,214
Utilities & infrastructure 6,359 30,418
Total 89,075 538,193

Horizonte Minerals Plc Araguaia Nickel Project Technical Report
Final November 2018 Page 275 of 342
SM&A completed a study for the supply of power to the ANP. SM&A concluded that there is sufficient supply of hydroelectric power in the region to meet the demands of the Project along with considerable local infrastructure to support it, they also concluded that power can be sourced for the from either Xinguara or Colinas. Focussing on these locations, three alternatives were examined in detail:
• CELPA electric power company – Xinguara substation – 138 kV
• Xinguara II substation (regional network) – 230 kV
• Colinas substation (regional network) – 500 kV.
The study examined the capability of these networks (via simulations) to meet the projects demands (which they all met comfortably) and then undertook a detailed review of the quantitative and qualitative aspects of the three alternatives so that a preferred solution could be determined. The study concluded that Option 2 – the 230kv line from Xinauara II substation was the preferred option. This involves the construction of an approximately 122 km long, 230 kV transmission line from Xinguara II to the plant substation; and the construction of a 230/13.8 kV substation at the Project site (Figure 18-9).
The cost of the power supply solution (line and substations) is US$26.3 million.

Horizonte Minerals Plc Araguaia Nickel Project Technical Report
Final November 2018 Page 276 of 342
Figure 18-9 Xinguara-Araguaia powerline route
Source: HZM, 2018
Horizonte Minerals Plc Araguaia Nickel Project Technical Report
Final November 2018 Page 277 of 342
19 MARKET STUDIES AND CONTRACTS
19.1 Introduction
Nickel is a silvery-white lustrous metal with a slight golden tinge. Nickel belongs to the transition metals and is hard and ductile. Pure nickel, powdered to maximize the reactive surface area, shows a significant chemical activity, but larger pieces are slow to react with air, under standard conditions because an oxide layer forms on the surface and prevents further corrosion.
The metal is valuable chiefly in alloys, and in deceasing magnitude of production: stainless steel production, then nickel-based and copper-based alloys, steel alloys, foundries, plating and the battery sector. As a compound, nickel has a number of niche chemical manufacturing uses, such as a catalyst for hydrogenation, cathodes for batteries, pigments and metal surface treatments.
19.2 Sources of nickel supply
According to Wood Mackenzie, global mined nickel production in 2017 was 2.13 Mt (of contained nickel). About 60% originates from sulphide ores and 40% from laterites. Sulphide ores account for about 30% of global resources and as the larger nickel sulphide deposits deplete, the proportion of FeNi as a source of nickel units in the market is forecast to increase, because most of the new projects coming on stream are predominantly nickel laterite, processed through either hydro- or pyro-metallurgical routes, the latter primarily producing FeNi.
19.3 Global market for ferronickel
19.3.1 Ferronickel supply
FeNi is a nickel-iron alloy that is almost exclusively used as a raw material in stainless steelmaking. Unlike pure nickel metal products (e.g. cathode), which are graded as “Class I” by the London Metal Exchange (LME), FeNi is a Class II nickel product which, by definition, means that it contains less than 99.8% Ni. FeNi may contain between 15% Ni and 40% Ni, with the balance being iron, and is not LME deliverable. As a result, FeNi has no “market of last resort” – that is, producers cannot store it in an LME warehouse and benefit directly from the use of traders and the futures market. Consequently, FeNi is sold to stainless steel melt shops directly.
Towards the end of 2005, global supply of nickel-iron raw materials for stainless steel began to expand with the addition of nickel pig iron (NPI) production in China. Nickel laterite ore was used as a feedstock and imported from the Philippines initially, and subsequently Indonesia, and elsewhere. NPI was originally a poor-quality material containing as little as 2% Ni. However, the combination of high nickel prices through 2006 to 2007 and strong demand from a rapidly expanding domestic stainless steel industry, resulted in the rapid evolution of NPI production (Figure 19-1). While NPI grades of less than 2% Ni are still available in the market, more typical grades are between 8% and 12% Ni. Thus, NPI is broadly compatible with the lowest grades of FeNi that are produced elsewhere in the world. Indonesia’s ban on nickel ore exports in 2014 precipitated investment in NPI facilities in Indonesia. The raw materials export ban removed approximately 300,000 annual tonnes of nickel from the market.

Horizonte Minerals Plc Araguaia Nickel Project Technical Report
Final November 2018 Page 278 of 342
Figure 19-1 Share of FeNi and NPI on world total nickel production
Since 2011, global FeNi production has equated to approximately 20% of world finished nickel supply, increasing from 302 kt (contained nickel) in that year, to 398 kt in 2017 and an anticipated 433 kt in 2018. Wood Mackenzie’s Base Case expects that FeNi production will remain close to 20% of world nickel supply over the long term, at approximately 450 to 460 kt/a through to 2030.
In contrast, the portion of world supply that is NPI, increased to 25% in 2013 before decreasing in 2014 because of Indonesia’s ore export ban. However, the relaxation of the ban from January 2017, as well as the interim ramp-up of NPI production in Indonesia, enabled NPI penetration to rebound to nearly 30% of global nickel supply in 2017. Thus, nickel in NPI production increased to nearly 500 kt in 2013, before falling back through 2014 to 2016 and then rising again to 603 kt in 2017.
Combined FeNi and NPI production of 1.0 Mt (of which 60% was NPI) accounted for 47% of world nickel production in 2017. Wood Mackenzie forecasts that combined FeNi/NPI production will increase to 1.10 Mt in 2018 (50% of global nickel supply), and 1.22 Mt in 2021. At that time, permitted ore exports from Indonesia that restarted in 2017 are expected to come to an end. Consequently, Chinese NPI will be deprived of some of its feed and is predicted to decline.
Three FeNi plants have closed in recent years, most recently Ferronikeli (12 ktpa) in Kosovo, earlier in 2018. Together with YuzhUralnickel (15 ktap) in Russia and Loma do Niquel (20 ktpa) in Venezuela, these three plants could theoretically return to production should market conditions permit. In addition, both Onça-Puma (Brazil) and Falcondo (Dominican Republic) have second lines that are currently idle, amounting to approximately 45 ktpa of additional capacity.
Regarding projects that could increase FeNi or NPI supply in the future, these would include Indo-Chinese NPI facilities. In addition to Tsingshan's expansion at Morowali (50 kt nickel) and its new Weda Bay project (30 kt in phase 1 potentially with another 30 kt to follow), Wood Mackenzie reports three other Indonesian projects that could add a total of 50 kt by 2021. With the exception of ANP, the only FeNi project outside the sphere of NPI is PT Antam's Halmahera (14 ktpa), which is planned to start in 2019.
19.3.2 Ferronickel consumption and ANP FeNi product
World stainless steel melt production has increased by 12 Mt over the past five years, from 36.0 Mt in 2012 to 48.6 Mt in 2017, with 75% (9 Mt) of that expansion taking place in China, and most of the balance in the rest of Asia. This pattern is also expected to define the market over the mid-term, with world production increasing to 50.8 Mt in 2018 and then to 56.83 Mt in 2022. Beyond that, growth of less than 1% a year will increase global output to 58.7 Mt in 2025 and 62.5 Mt in 2035.
0%
5%
10%
15%
20%
25%
30%
35%
40%
0
500
1000
1500
2000
2500
30002005
2006
2007
2008
2009
2010
2011
2012
2013
2014
2015
2016
2017
2018
2019
2020
2021
2022
2023
2024
2025
Sh
are
of Fe
Ni a
nd
NP
I
Pro
du
cti
on (k
t) N
i
Other FeNi NPI %FeNi %NPI
Source: Wood Mackenzie

Horizonte Minerals Plc Araguaia Nickel Project Technical Report
Final November 2018 Page 279 of 342
Nickel consumption in stainless steel is determined by three factors: the austenitic ratio – i.e. portion of the product mix that comprises austenitic stainless (300 and 200 series), which contains nickel, as opposed to ferritic grades (400 series) that contain no nickel; the average nickel content in the grades of austenitic stainless that are produced (typically 8 to 10% Ni in 300 series; ≤4.5% Ni in 200 series); and the portion of the total nickel unit requirement that is obtained from recycling stainless steel scrap (the austenitic scrap ratio).
Wood Mackenzie estimates primary nickel consumption (i.e. excluding scrap) in stainless steel has increased from 1.06 Mt in 2012 to 1.5 Mt in 2017, and Wood Mackenzie expect this to increase to 1.54 Mt in 2018 and then 1.66 Mt in 2025. As total world nickel demand is expected to increase from 1.63 Mt to 2.61 Mt over the same period, the stainless steel industry accounts for 65% to 70% of consumption.
As world production of FeNi/NPI in 2017 was 1.0 Mt, the ferroalloy potentially constituted around two thirds of the primary nickel used in stainless steel making in that year. There is scope for new FeNi supply to enter the market, but there is a limit. While the cost differential between Class I and Class II nickel is important, it would not be technically possible to completely displace the more expensive Class I from stainless raw material streams.
ANP FeNi product
The list of potential buyers of ANP FeNi product is limited to the large number of stainless steel producers that are vertically integrated with melt shops. Regional and company differences and requirements will help determine the level of interest in ANP FeNi.
Nominally, ANP FeNi will contain 28% to 32% Ni. This is a relatively high nickel content and closely resembles other Latin American FeNi produced by Anglo American (at Codemin, average 33% Ni, and Barro Alto, 30% Ni) and Vale (at Onça-Puma, 30%), in Brazil, and South32 (at Cerro Matoso, 31% Ni) in Colombia. Trade data indicates that FeNi from both countries is currently going to buyers in the USA, Europe and China, with Colombian FeNi also being taken by customers in Japan, South Korea and Taiwan. Therefore, on nickel grade alone, ANP FeNi is likely to be of similar interest to those same consumers.
Typically, large-scale melt shops comprise two or three melting stations: an initial electric arc furnace (EAF) or blast furnace (BOF) and a combination of follow-up “trimming stations” such as an argon oxygen degassing (AOD) converter and/or vacuum oxygen degassing unit (VOD). The EAF/BOF’s function is to provide a melt for the subsequent AOD or VOD: the EAF melts several different bulk raw materials – such as carbon scrap, stainless steel scrap and high alloy scrap, chrome products, and small amounts of other alloying elements, such as molybdenum, as well Class II nickel – to make a melt with an initial chemistry that is close to the desired end chemistry.
A second factor that may affect interest in ANP FeNi from one customer to another is the nickel-iron balance. ANP FeNi has a relatively high nickel grade. One benefit of this is lower per nickel unit shipping costs for the producer. Secondly, higher nickel content might imply a higher quality that could in turn be expected to attract a higher price. Pushing up the nickel grade comes at the expense of iron content, and this changes the mix chemistry of the melt.
19.4 Ferronickel pricing
While the LME nickel price does guide the value of nickel units contained in FeNi, the real driving force behind the daily changes in value is more likely to be the stainless 304 (standard commodity austenitic) scrap price. This is because scrap is the biggest competitor material to FeNi due to the ways in which both scrap and FeNi are used in the main melting point of production, the EAF. Consequently, the availability of quality scrap locally has the biggest single influence on spot FeNi sales prices, with operator preference for raw materials being scrap product first, then Class II and Class I nickel units.
The value of scrap (i.e. the value of the nickel units contained in stainless steel scrap) can therefore range between 10% and 40% less than the value of primary nickel on the LME – hence the melt shop’s preference for obtaining these scrap nickel units. Advantages of scrap to the stainless melter are that it has a beneficial “cooling” effect on the melt when added to the furnace, and it consumes less energy, because of the lower required residence time in the furnace.

Horizonte Minerals Plc Araguaia Nickel Project Technical Report
Final November 2018 Page 280 of 342
Since the nickel price escalation post-2006, all mills have focused intensely on using more scrap and Class II nickel by studying which stainless product grades can be made best with scrap units. The sales price of FeNi is dictated by the prevailing market conditions. However, there are swings between selling at a discount and obtaining a premium, the latter being helped in most recent cases by iron credits. Wood Mackenzie’s evaluation of FeNi prices is consistent with the historic range, with average annual realisation prices for three producers, between 2011 and 2015, receiving discounts of between 2% and 10%. Only since 2016 did their realised prices move toward premiums, which ranged between 1% and 5% in 2017 (Figure 19-2).
Figure 19-2 Realised FeNi prices
19.5 Current and forecast nickel demand
After many years of annual surpluses, the global nickel market moved into deficit in 2016. Although the shortfall in that year was small, it was followed by a larger deficit in 2017 and a similar shortage is expected in 2018. Wood Mackenzie anticipates further consecutive deficits over at least the mid-term. As the shortfall accumulates so the large inventory excess that had built up over the prior years of oversupply will be drawn down. This is most visibly represented by the ongoing decline in exchange nickel stocks on the LME and SHFE. Thus, with an outlook for nickel of structural shortage, deepening deficits and falling stocks, nickel prices will continue to increase above their recently established level of US$13,000 to 15,000/t (US$5.90 to 6.80/lb).
World nickel demand is forecast to increase by 3.6% in 2018, to 2.26 Mt before slowing to a compounded annual growth rate (CAGR) of 2.1% a year, reaching 2.61 Mt in 2025. Growth over the long term is slightly stronger, at 2.5% a year, to 3.35 Mt in 2035, due to increasing uptake by the battery segment (for electric vehicles). Over this period, primary nickel uptake in stainless will account for 50% to 70% of total demand, rising from 1.54 Mt in 2018 to 1.66 Mt in 2025, and 1.77 Mt in 2035.
China will remain the main driver of demand over the long term, by virtue of its stainless steel industry, supported by the development of a new stainless steel industry in Indonesia, where Tsingshan recently switched on 2 Mt/a of stainless melting capacity. A third 1 Mt/a production line was commissioned in June 2018. Asian demand for nickel will receive a further boost from the expansion in demand for nickel sulphate (NiSO4) in battery cathode materials, chiefly for electric vehicle (EV) batteries. Currently, Wood Mackenzie estimates that Asian companies account for approximately 75% of global NiSO4 production (Figure 19-3).
-12.00%
-10.00%
-8.00%
-6.00%
-4.00%
-2.00%
0.00%
2.00%
4.00%
6.00%
2007 2008 2009 2010 2011 2012 2013 2014 2015 2016 2017
Dis
co
un
t o
r p
rem
ium
to
th
e L
ME n
ick
iel p
rice
Cerro Matoso Anglo American Antam
Source: Wood Mackenzie; company reports

Horizonte Minerals Plc Araguaia Nickel Project Technical Report
Final November 2018 Page 281 of 342
Figure 19-3 World nickel demand driven by China supported by the rest of Asia
In other regions, demand for nickel over the mid-term is forecast to show only modest growth. In the USA, Wood Mackenzie anticipates small but stable growth of 1% to 2% a year. In contrast, European stainless production may contract slightly, partly due to the usual stocking and de-stocking cycle, and partly due to uncertainties stemming from Brexit, which is due in March 2019. At the same time, European producers are continuing to struggle against competitively priced imports, chiefly from Asia. Anti-dumping duties against Chinese and Taiwanese origin cold-rolled material have helped to a point, but further duties against hot-rolled stainless (for which shipments from China to Europe have increased) are now under consideration.
The main risk to Wood Mackenzie’s demand outlook is the impact of Tsingshan ramping up 3 Mt/a of stainless melting capacity in Indonesia. Ultimately, the impact of this large mill reaching capacity will be offset by adjustments in output elsewhere, as product from Tsingshan’s Indonesian operation is destined for export. Tsingshan is one of the lowest cost stainless producers in China by virtue of its vertical integration of stainless melting with NPI smelting.
Wood Mackenzie’s forecast of nickel demand in non-stainless first use highlights that the EV sector will be a key consumer of nickel over the long term (Figure 19-4).
0
500
1000
1500
2000
2500
3000
3500
0
200
400
600
800
1000
1200
1400
1600
2007 2010 2013 2016 2019 2022 2025 2028
Glo
ba
l d
em
an
d (
kt)
Reg
ion
al d
em
an
d (
kt)
Global China Europe Americas Asia ex-China
Source: Wood Mackenzie

Horizonte Minerals Plc Araguaia Nickel Project Technical Report
Final November 2018 Page 282 of 342
Figure 19-4 Nickel consumption in non-stainless first uses – EV batteries important over long term
Total nickel non-stainless demand of 720 kt in 2018 is projected to increase by CAGR of 4%, to 950 kt in 2025, and then by 5.2% a year, to 1.58 Mt in 2035. In contrast, Wood Mackenzie forecasts the growth of nickel demand in EV batteries to be very much stronger, at 13.9% a year, from 100 kt in 2018 to 250 kt in 2025, and then 12% a year over the longer term, to approximately 775 kt in 2035.
19.6 Substitution
While there is no substitute for nickel units in stainless steel and other applications, a number of primary nickel unit types are interchangeable – FeNi competes with stainless steel scrap and other forms of Class I and Class II nickel, including cathode, briquettes, nickel oxide sinter and utility nickel. The mix of materials that is used varies considerably from mill to mill and depends on locally available resources, plant and material handling configurations, and the range of stainless products that are made. But in the broadest sense, it is largely a matter of cost.
19.7 Economic evaluation price and iron credit forecast
Wood Mackenzie considers a reasonable near-term forecast for the purposes for the FS is, therefore, US$14,000/t (US$6.35) – this was applied in the Base Case model.
In selecting the Base Case nickel price of US$14,000/t, a conservative approach was adopted.
A fixed price for nickel was applied over the LOM.
The Qualified Person has reviewed the above and that the results support the assumptions in this Technical Report.
19.8 Outlook and conclusions
The composition of ANP FeNi is comparable to existing FeNi produced currently. The sales price of FeNi is dictated by the prevailing market conditions and as such may command a premium or discount to the LME price.
The Project’s FeNi product can only be sold to stainless steel producers with melt shop capability. Current Brazilian producers sell material into China, Europa and the USA, and it is planned that the Project’s FeNi product will be sold in the same areas (and indeed elsewhere). The Project may have to “prove” its capabilities before the product is fully accepted as a viable alternative/supplement to current production.
0
100
200
300
400
500
600
1995 1997 1999 2001 2003 2005 2007 2009 2011 2013 2015 2017 2019 2021 2023 2025 2027 2029
Dem
an
d (
kt)
EV Batteries Alloy Steel Non-Ferrous Alloys Plating Foundry Other
Source: Wood Mackenzie

Horizonte Minerals Plc Araguaia Nickel Project Technical Report
Final November 2018 Page 283 of 342
World stainless steel melt production increased by 12 Mt between 2012 and 2017, mostly in China and to a lesser extent across the rest of Asia. Forecast production in 2018 is 50.8 Mt, up 4.5% on 2017. This upward trend is likely to continue over the mid-term, before slowing after 2025. As future growth in stainless melting is expected to continue, the demand for FeNi should also increase.
The Wood Mackenzie forecast of long term FeNi production is 450 to 460 kt a year, compared with 433 kt in 2018. As stainless production is forecast to increase over the long term, this suggests there may be a need for the development of new FeNi projects in the future. However, the actual requirement for FeNi over the long term will also depend on the availability of NPI and stainless steel scrap.
Future supply is most likely to come from China and Indonesia as NPI, where expansion in production is continuing. Idle capacity at three closed plants and two others with unused second lines could theoretically add a further 90 kt of nickel in FeNi to global supply, should market conditions permit.
Demand for nickel in EV batteries is expected to become substantial over the long term. However, FeNi is not currently an acceptable raw material for NiSO4 production, the main raw material in the manufacture of battery cathode containing nickel. Therefore, FeNi demand is unlikely to benefit directly from expansion of the EV battery segment.
However, FeNi demand could benefit indirectly from the expansion in EV batteries if Class 1 nickel use switches from stainless to battery sulphate making. With less Class 1 available to the stainless mills, they would have a greater requirement for nickel units in other raw materials, including FeNi, NPI and stainless scrap.
19.9 Offtake agreements and other material contracts
The Company has no offtake agreements in place.
The Company has not entered into any contracts with regards to property development, mining, concentrating, smelting, refining, transportation, product handling and sales for the Project.
The Company will enter into contract negotiations after project financing has been finalised.
Horizonte Minerals Plc Araguaia Nickel Project Technical Report
Final November 2018 Page 284 of 342
20 ENVIRONMENTAL STUDIES, PERMITTING AND SOCIAL OR COMMUNITY IMPACT
Permitting, environmental studies and social considerations are addressed in the sub-sections below.
20.1 Permitting
Brazil has a well-established permitting process for major mining projects, with a Mining Code and environmental legislation framework (CONAMA), along with Brazilian and Pará State legislation, which provides the support for companies to operate legally in the country.
International standards that the Company aims to uphold, include the International Finance Corporation Performance Standards; World Bank Group Environmental, Health and Safety Guidelines; Equator Principles; and the Performance Requirements of the European Bank for Reconstruction and Development.
To move from the exploration and development phase through to the construction phase, ANP must continue permitting along two parallel pathways. These pathways are the mining permit (direitos minerários) and environmental permit (licenciamento ambiental) pathways and each is managed by separate and independent public authorities: National Mining Agency (Agência Nacional de Mineração – ANM) formally known as DNPM; and the State Secretariat for Environment and Sustainability of Pará – SEMAS). As the ANP does not cross state borders, IBAMA is not directly involved with environmental permitting.
The comprehensive list of relevant permitting agencies is provided in Table 4-3 to Table 4-2. The timeline for approved and expected major licences for ANP is shown in Figure 20-1. The ANS infrastructure is further advanced along the permitting pathway (Table 4-2) than ANN and supports mining operations for the initial eight years of the planned operations. ANN infrastructure (mineral rights purchased from Glencore in 2016) is currently being integrated into the overall permitting pathway for the project.
Both mining and environmental permits for ANN infrastructure are on schedule for construction-ready approvals prior to commencement of mining in ANN, which is planned for Year 8 in the mine schedule, estimated for 2029.
A simplified environmental impact assessment (Relatório Ambiental Simplificado – RAS) is required for the Transmission Line environmental permit. HZM is progressing the Transmission Line Preliminary Licence and Installation Licence together as one process as basic engineering is complete for the powerline. Receipt of permits for the Transmission Line is anticipated in Q3 2019 ahead of the commissioning and ramp-up phase.
ANP’s permit process is well advanced. The Project is on the pathway to construction-ready phase. A number of recommendations have been made and these are summarised below:
• HZM to maintain existing permitting timeline and continue reporting to development schedule
• HZM to continue to engage with permitting agencies for submitted applications, with the objective of securing approvals within Q4 2018 and Q1 2019 for ANS construction-ready permits
• HZM continues to progress new permit applications in line with ANP schedule, including permits for the Transmission Line and the ANN component of the project
• HZM should implement an integrated management system in 2019 to maintain electronic registers of all licences and licence conditions
• A review of the overall mine project schedule to be conducted post-publication of the FS with updates to permitting processes post Q4 2018.

Horizonte Minerals Plc Araguaia Nickel Project Technical Report
Final November 2018 Page 285 of 342
Figure 20-1 Timeline of approved and expected major licences for ANP
Section 4.3 (Licence and tenure) and Section 4.5 (Environmental obligations) provides a comprehensive review of required permits, and current Company standing.
20.1.1 Opex and capex estimates for permitting
An Environment, Social, Land, Resettlement and Permit budget estimate of capex and opex was prepared for the ANP. Environmental costs were estimated from a variety of sources for the various topics. The source of these costs were Environment Resources Management (ERM), Brandt Meio Ambiente and Ramboll.
Permit (including social and environmental) costs took into consideration the HZM owners team structure, including:
• HSE Manager and HSS Technician
• Environment Analyst and Site Nurse
• Sustainability Supervisor
• 2 x Community Relations Analysts.
Other mining-related costs considered were vegetation clearance, soil removal and relocation of top-soil. Capex and opex estimates were collected for the implementation and ongoing maintenance and reporting to agencies on socio-economic PCAs, and physical and biological PCAs. Permitting costs include those relating to the VOI/VDS roads; however, there is no acquisition costs estimated for these roads as they follow existing communal roads.
All permit-related costs are shown in Brazilian Reais (BRL) with exchange rates used of US$1:3.5 BRL.
Capex permitting estimates for the Project are shown in Table 20-1.

Horizonte Minerals Plc Araguaia Nickel Project Technical Report
Final November 2018 Page 286 of 342
Table 20-1 Capex estimates for permitting
Component Value in US$ million
Year 1 Year 2
ANS area and water pipeline 4.33 6.34
ANN area and transmission line 0.50 0.41
Electronic support systems and consultants 0.57 0.22
Closure cost estimate
Mined out areas will be reclaimed as a continual process as part of mine planning and production. Topsoil stockpiles will be maintained throughout LOM. The remaining material, including the slag disposal facility, will be stabilised and vegetated on the surface. Open pits will remain and will fill with water. At the end of the Project, industrial structures will be decommissioned, roads and infrastructure will be removed, and areas will be revegetated, unless an alternate arrangement has been made with authorities. The mine site will be made safe with fencing where necessary, to ensure the safety of people and livestock. A water retention dam will remain after mine closure for containment of any seepage water from the slag disposal facility. ERM conducted a detailed cost analysis for the closure related costs based on Araguaia’s facility, including costs such as steel and cement removal, social and environmental costs and all other closure-related cost elements. The total closure costs came to BRL137.6 million (US$39.3 million). Brandt Consulting identified similar plant size closures in Brazil with costs ranging from BRL100 million to BRL150 million.
Opex (permitting)
Opex are essentially an extension of the PCAs. In general, the opex included the following activities:
• Site management and supervision (HZM owner’s team)
• Social, Physical and Biological PCAs
• All socio-environment costs estimated for ANN and TL components of the Project.
Opex costs for permits (no land) continue at approximately BRL1.9 million per annum, with up to BRL2.2 million in some years where additional consulting fees are required to update the mine closure plan and other social-environmental control plans.
Direct social investment is estimated at BRL0.50 million per annum for the LOM. Additionally, beyond the payback period, the mine will be able to enact ‘Lei do Rouanet’ which is a Brazilian law enabling Companies to allocate up to 4% of income tax to social and cultural projects in the region. Direct social investment requirements will be continually reassessed in parallel with community consultation and social-management systems.
Environmental compensation capex / opex
Environmental compensation is an instrument of public policy. This instrument aims to guarantee to society a compensation for the losses caused to the biodiversity by projects that have environmental impacts. Major mining/infrastructure projects are generally required to pay an Environmental Compensation fee to the environmental licensing agency. The objective of this compensation is to fund the preservation of biomes and/or ecosystems, preferably similar to that in the region of the impact, ensuring the continuity of the country’s natural resources through the protection of Conservation Units. The Law No. 9985/2000, sets out the requirements for this compensation.
In the State of Pará, in addition to federal legislation, Decree No. 2033/2009 disciplines and adapts the environmental compensation for projects of environmental impact establishing the percentage of degree of environmental impact, which varies from 0% to 2%.

Horizonte Minerals Plc Araguaia Nickel Project Technical Report
Final November 2018 Page 287 of 342
ANS environmental compensation was estimated by WALM consultants (responsible for the EIA/RIMA of ANS) at 0.842% of ANS capex infrastructure, including the water pipeline direct areas of influence. Therefore, the total ANS environmental compensation is estimated at BRL10.28 million to be paid in three instalments over Year 2 of construction and Year 1 of operation. The first compensation instalment has already been budgeted within HZM’s FS budget and therefore is not included in capex or opex estimates.
The ANN capex infrastructure component, including road from ANS to ANN, is estimated at BRL77.36 million to be paid in three instalments in Year 6, 7 and 8 of operational mine plan. In summary, the total nominal value of environmental compensation estimated over the LOM of ANP is BRL10.93 million (US$3.12 million); however, discount and inflation factors will apply.
Community contributions are expected to total over R$2,5B (over US$700 million) during the LOM, including:
• ~BRL1.5 billion in Company taxes
− Of which a proportion will be allocated via ‘Lei do Rouanet’ directly into regional social and cultural projects
− Of which a proportion will be allocated via mineral royalties (CFEM) to local Municipal governments
− Of which ~2-5% of construction contracts will be paid directly to local Municipal governments;
• ~BRL10.9 million in environmental compensation to SEMAS for ANS and ANN;
• ~BRL1 billion estimated to be paid in employee and contractor wages, with the majority of employees and contractors expected to live locally;
• ~BRL17 million to be invested directly into social programs throughout LOM, of which over BRL1.5 million will be invested into a community development fund in the first two years of construction and managed via the Municipal Development Agenda PCA.
Land-related values and resettlement programs have been included in the overall capex of the project and are available for due diligence purposes. Values are spread in line with the mine schedule.
20.2 Environmental studies
This section considers the environmental aspects of the Project, based upon work completed to date, with the objective to comply with international best practice and Brazilian regulations for permitting and licensing.
It highlights key environmental baseline data, environmental risks and impacts identified for the ANP and sets out how HZM plans to manage those risks and impacts as the project progressed through construction to operation and then closure.
Environmental baseline data have been obtained from published sources and primary data gathered by HZM and its consultants. Key points are:
• The ANP and its area of influence is not located within internationally recognised conservation areas for habitats or species, or any Brazilian national conservation area classified under the National System of Conservation Units Law (Federal Law No. 9985/00).
• The project (ANN and a small portion of ANS) is located in the Médio Araguaia area earmarked for improvement in conservation. There are a number of small permanent preservation areas (APP in Portuguese) in the project area that are designated to protect watercourses and their surrounds.
• The land within the ANS and ANN project areas is most commonly used for cattle grazing. 70% of the area is classified as farmland.
• Notable habitats in and around the project area are Brazilian savannah (bush), forest and aquatic habitats. Flora and fauna found here are typical of these habitats and the transitional area between Amazon and Cerrado vegetation. There is no primary forest in the area directly affected by the project. The savannah habitat located on ironstone outcrops (metallophile savannah or canga) is of importance for biodiversity and supports some flora and fauna species that are threatened, new to

Horizonte Minerals Plc Araguaia Nickel Project Technical Report
Final November 2018 Page 288 of 342
science or that have a restricted range. This would be classified as “critical habitat” under international (IFC) guidelines.
• Air quality monitoring indicates that levels are generally within the standards set by government. Elevated levels of dust (total suspended particulates, inhalable particulates) were identified at two locations in ANS. This could be associated with traffic on local roads and burning of pastures.
• Noise monitoring indicates that levels of noise in some places are higher than those set out in Brazilian standards, likely to be a result of the presence of animals, vehicles and other community activities. This is not uncommon for Brazilian rural communities.
• There are four main types of soil in the ANS part of the project. They have been degraded over time by erosion and farming practices. Their agricultural potential is considered moderate. Further investigation of soils within the ANN area will be conducted as part of the permitting process.
As with similar developments of this nature, the construction, operation and decommissioning of the ANP will come with environmental risks and impacts. Impacts for the ANS part of the project were originally identified and assessed in 2013 within the integrated social-environmental impact assessment (known as “EIA RIMA” in Brazil). Additional environmental studies were undertaken in 2017 and 2018, including air quality dispersion modelling and an assessment of critical habitat. Risks and impacts associated with changes in design of the ANS and for the water pipeline have been identified and notified to government. An EIA-RIMA for the ANN part of the project and a simplified environmental impact assessment for the transmission line are under way by Brandt Meio Ambiente Consultants.
The key environmental risks and impacts will be minimised, monitored, managed and mitigated through a system of social-environmental control plans (Planos de Controle Ambiental – PCAs). Pará State, Brazilian and international standards have been considered when developing the PCAs. These were developed by ERM in 2017 in response to impacts, risks and opportunities identified in the social-environmental impact assessment process. PCAs were submitted to the State Environmental Agency (SEMAS) as part of the request for the project’s construction licence (Licença de Instalaçao – LI). PCAs were divided into Physical Environment, Biological Environment and Socio-Economic sections. Socio-Economic PCAs can be found in Section 20.3 of this document. This section describes the Physical and Biological Environment PCAs which will be implemented before, during and after construction to meet Brazilian environmental licence conditions as well as international standards, such as IFC Performance Standards.
The environmental PCAs are listed in Table 20-2.
Table 20-2 Environmental PCAs
Program/Plan Description
Physical
Environmental Plan for Construction (PAC)
Provides guidance on managing environmental matters throughout the construction.
Accident Prevention and Control Program (PCPA)
Defines management actions to minimise and control risks. Includes actions related to health, safety and the environment.
Emergency Action Plan (EAP) Sets out procedures to be adopted by the Project during emergency situations.
Mine Closure Plan (PFM) Describes closure plans, taking into account the need to protect the environment, safety and health. Includes provisions to restore the site and offer a beneficial legacy for the communities.
Air Quality Management Program (PGQAr); Mine Closure Plan
Provides guidance on reducing emissions to air, including managing emissions from vehicles, use of emission control and dust suppression techniques.
Noise Management and Noise Level Monitoring Program
Provides guidance on controlling and monitoring noise.
Morphodynamic (soils and erosion) Process Monitoring Program
Sets out guidance for avoiding and minimising soil erosion and sedimentation (managing vegetation cover, use of engineering controls) and avoiding contamination to soils (secondary containment, workforce training).
Water Resources Management Plan (PRGH)
Provides measures to manage surface and underground water resources.
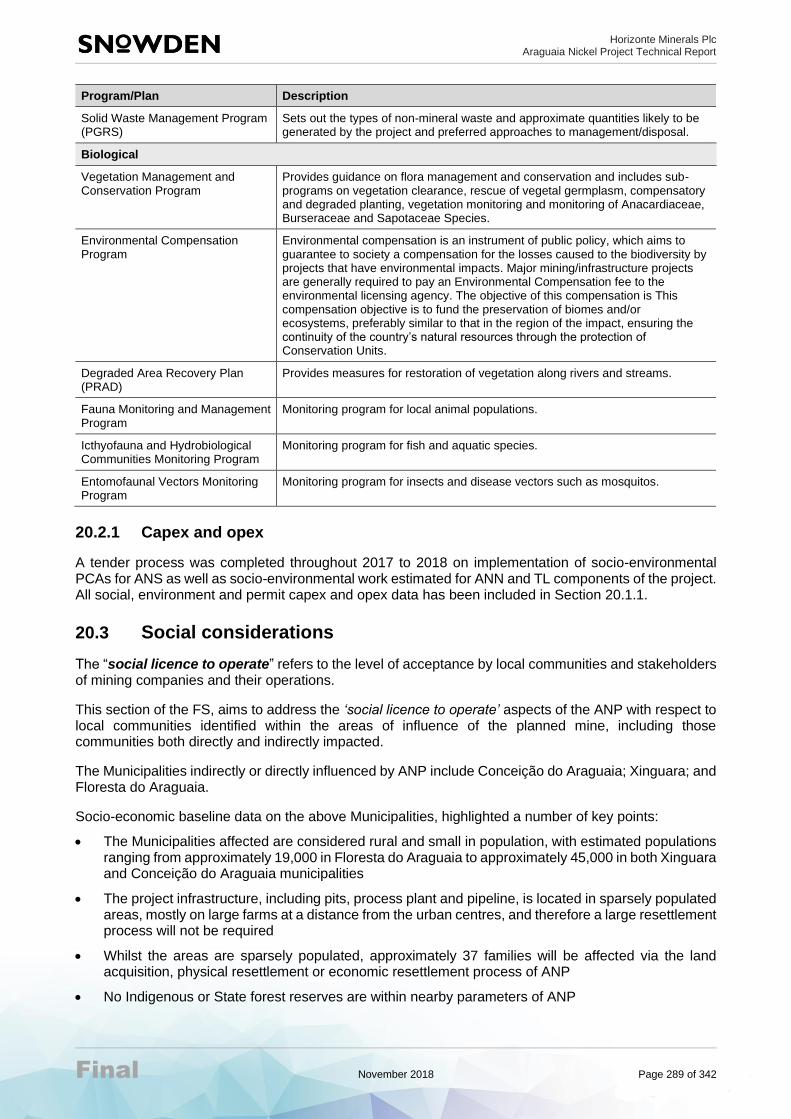
Horizonte Minerals Plc Araguaia Nickel Project Technical Report
Final November 2018 Page 289 of 342
Program/Plan Description
Solid Waste Management Program (PGRS)
Sets out the types of non-mineral waste and approximate quantities likely to be generated by the project and preferred approaches to management/disposal.
Biological
Vegetation Management and Conservation Program
Provides guidance on flora management and conservation and includes sub-programs on vegetation clearance, rescue of vegetal germplasm, compensatory and degraded planting, vegetation monitoring and monitoring of Anacardiaceae, Burseraceae and Sapotaceae Species.
Environmental Compensation Program
Environmental compensation is an instrument of public policy, which aims to guarantee to society a compensation for the losses caused to the biodiversity by projects that have environmental impacts. Major mining/infrastructure projects are generally required to pay an Environmental Compensation fee to the environmental licensing agency. The objective of this compensation is This compensation objective is to fund the preservation of biomes and/or ecosystems, preferably similar to that in the region of the impact, ensuring the continuity of the country’s natural resources through the protection of Conservation Units.
Degraded Area Recovery Plan (PRAD)
Provides measures for restoration of vegetation along rivers and streams.
Fauna Monitoring and Management Program
Monitoring program for local animal populations.
Icthyofauna and Hydrobiological Communities Monitoring Program
Monitoring program for fish and aquatic species.
Entomofaunal Vectors Monitoring Program
Monitoring program for insects and disease vectors such as mosquitos.
20.2.1 Capex and opex
A tender process was completed throughout 2017 to 2018 on implementation of socio-environmental PCAs for ANS as well as socio-environmental work estimated for ANN and TL components of the project. All social, environment and permit capex and opex data has been included in Section 20.1.1.
20.3 Social considerations
The “social licence to operate” refers to the level of acceptance by local communities and stakeholders of mining companies and their operations.
This section of the FS, aims to address the ‘social licence to operate’ aspects of the ANP with respect to local communities identified within the areas of influence of the planned mine, including those communities both directly and indirectly impacted.
The Municipalities indirectly or directly influenced by ANP include Conceição do Araguaia; Xinguara; and Floresta do Araguaia.
Socio-economic baseline data on the above Municipalities, highlighted a number of key points:
• The Municipalities affected are considered rural and small in population, with estimated populations ranging from approximately 19,000 in Floresta do Araguaia to approximately 45,000 in both Xinguara and Conceição do Araguaia municipalities
• The project infrastructure, including pits, process plant and pipeline, is located in sparsely populated areas, mostly on large farms at a distance from the urban centres, and therefore a large resettlement process will not be required
• Whilst the areas are sparsely populated, approximately 37 families will be affected via the land acquisition, physical resettlement or economic resettlement process of ANP
• No Indigenous or State forest reserves are within nearby parameters of ANP

Horizonte Minerals Plc Araguaia Nickel Project Technical Report
Final November 2018 Page 290 of 342
• Some small cultural artefacts have been identified within the ANP footprint and have either been removed to a local museum or are in the process of removal by end of 2018
• The communities demonstrate high rates of poverty, around 50% with the median rural family in Conceição do Araguaia living on less than US$2/day
• Most houses have access to energy sources
• The majority of rural properties depend on wells and springs for water
• Each municipality provides basic services, such as education, health, security and roads; however, Human Development Indexes and Social Progress Indexes along with community consultations, demonstrate a number of risks and opportunities in areas such as health, education and other basic services.
Extensive community engagement was undertaken in the southern part of ANP and a number of procedures and processes for future engagement are outlined in the complete FS Social chapter.
The socio-economic impact assessment for ANP demonstrates the project’s potential to generate lasting positive impacts for a region in need for economic and social development. However, the need for development poses both risks and opportunities for ANP, which is why impact management plans/control plans form an important part of the FS.
Pará State, Brazilian and international standards have been considered when developing the social-environmental control plans. Social-environmental control plans (Planos de Controle Ambiental – PCAs) were developed by ERM in 2017 in response to impacts, risks and opportunities identified in the social environmental impact assessment process (known as “EIA RIMA” in Brazil). Detailed PCAs were submitted to the State Environmental Agency (SEMAS) as part of the request for the project’s construction licence (Licença de Instalação – LI). PCAs were divided into Physical Environment, Biological Environment and Socio-Economic sections. Physical and Biological PCAs can be found in Section 20.2. PCAs will be implemented before, during and after construction to meet Brazilian environmental licence conditions as well as international standards, such as IFC Performance Standards. The social PCAs are listed in Table 20-3.
Table 20-3 Summary of socio-economic impact management plans and programs
Program/Plan Description
Socioeconomic Environment
Access Road Rehabilitation Program
Adapt the road network so that it has the capacity to absorb the increase in volumes of people and traffic induced by project activities.
Program for the Promotion of Tourism Potential
Contribute to development of the local tourism sector through actions to strengthen local institutions responsible for development of the sector, such as the municipal secretariats and councils, and look to build and develop the capacity of the local population to initiate and work in tourism-related economic activity.
Impact Mitigation Plan for School Community Located alongside the PA-449
Safeguard the safety of PA-449 road users, namely parents, workers and students that frequent the two schools situated along this road, throughout the life of the project.
Local Supplier Program Maximise of use of goods and services from local suppliers.
Local Workforce Training Program Promote and maximise local employment, accrual of economic/employment benefits and tax revenue within the municipalities throughout the project lifecycle through hiring, training and employability actions and measures.
Social Communication Program Define the tools and actions to be used in stakeholder engagement and communications throughout the project lifecycle.
Environmental Education Program Information, education and communication program aimed at the population in the area of influence to support the mitigation of social and environmental impacts of the project through its lifecycle.
Workforce and Population Health Monitoring Program
Monitor key health indicators for the project workforce (employees and contractors) and population in the municipalities.

Horizonte Minerals Plc Araguaia Nickel Project Technical Report
Final November 2018 Page 291 of 342
Program/Plan Description
Monitoring Program for In-Migration and Impact on Public Services
Map the profile of the project’s workforce (those from within and outside the area of influence) and monitor indicators related to public health, education and security services in the municipalities.
Local Development Agenda (Municipal) Program
Develop a consensus among all actors/stakeholders involved in implementing the Local Development Agenda actions and programs in terms of their responsibilities with respect to technical, operational, staffing and financial aspects and contributions. This plan aims to improve local governance and transparency measures.
Cultural heritage education program
Promote knowledge and awareness of the cultural heritage of the municipalities to encourage the local population to value its importance and to ensure its preservation.
Land Acquisition and Resettlement Action Plan
Ensure all project-affected Persons (PAPs) receive compensation in line with local law and international best practice. Put in place measures to restore livelihoods and quality of life to a level that is the same or better than before displacement, in relation to housing, economic activities, relationship with the area, cultural practices, social ties and sense of community.
HZM considers the socio-economic programs under three key pillars which form the foundations of the Company’s Social Licence to Operate (Figure 20-2).
Figure 20-2 The Three ‘Pillars’ of the ANP’s socio-economic programs for the region
Economic Development Pillar
Social Development Pillar
Care and Respect Pillar
• Maximising local employment opportunities
• Developing local suppliers who can provide services to the Company and others in the region
• Developing small and medium enterprises, particularly in the rural area.
• Providing capacity building programs to the local government and communities where the Company operates
• Investing in education/cultural activities once the project moves to operation.
• Supporting public health program, including sexual health education
• Providing environmental education
• Delivering a resettlement program aligned with IFC guidelines
• Planning for mine closure and managing environmental impact
• Engaging with stakeholders and continuous communication.
20.4 Conclusions
20.4.1 Permitting
ANP’s permit process is well advanced and the project is on schedule towards construction-ready phase. All permits are either approved or anticipated for approval within the planned project schedule.
ANS permitting is well advanced, whilst mining and environmental permits for ANN infrastructure are on schedule for approvals prior to Year 8 of the mine schedule. There is no acquisition required for the road between ANS and ANN as it follows existing community roads. HZM is progressing the Transmission Line LP and LI together, with receipt of permits all scheduled for award in line with the implementation schedule.

Horizonte Minerals Plc Araguaia Nickel Project Technical Report
Final November 2018 Page 292 of 342
20.4.2 Environmental
Based on the environmental baseline data and impacts and mitigations associated with ANP, and further work to be advanced post the FS prior to construction, the following conclusions have been drawn:
• Air quality: Particulate and gas emissions will be generated by the project. Dispersion modelling concluded that emissions of key pollutants (nitrogen dioxide, sulphur dioxide and carbon monoxide) from vehicles and the processing facility would be in compliance with national air quality standards CONAMA 03/90 and international IFC guidelines. Emissions of dust (total suspended particulates and inhalable particles – PM10) would, on occasion, be above national standards within the boundary of the site. Levels at a small number of households living close the facility would be in line with air quality standards. Emissions control technologies will be installed for the furnace, dryers and kiln. Emissions will be generated by diesel-powered vehicles. These will be maintained in accordance with manufacturers’ manuals. Dust will be generated by the project. This will be managed through the use of good practice dust suppression techniques such as the use of covers, vehicle speed limits and wetting.
• Greenhouse gas: Although the major source of electricity is from renewably resource hydro energy, parts of ANP will inevitably produce Greenhouse gas emissions. Greenhouse gas emissions from ANS will be approximately 480,000 t of carbon dioxide equivalent, of which around half come from the rotary kiln. These levels are similar to other FeNi industries around the world. HZM will continuously evaluate machine/vehicle upgrades to make small reductions in greenhouse gas emissions and has committed to assessing these emissions annually and submitting the findings to the national system for registration of emissions.
• Climate risk: HZM has considered the risks and impacts of climate change, including drought, heat waves, heavy rain and lightning to the project and are considering a range of adaptation measures for the Project. The impact of climate change on water availability is likely to be negligible. A risk is the security of electricity supply, given that over 60% of power in Brazil is derived from hydroelectricity; however, this is evaluated as a low risk at this stage.
• Noise: Noise will be generated from traffic / handling of heavy vehicles, machinery and equipment during construction. During operation noise will be from mobile and stationary sources. Movement of backhoe loaders on faces of piles and ore transport trucks represent main emission sources. The metallurgical plant represents the largest stationary source of noise, particularly the ventilation system. The noise management plan includes provisions to minimise noise, such as selecting less noisy equipment, preventative maintenance and reduction in night-time operations.
• Soil: soil erosion by wind and rain can result from construction activities such as vegetation stripping, operation of stockpiles and waste dumps and during decommissioning and closure. Soil impacts may also be caused by fuel and chemical spills and leaks. The project has programs in place to help minimise soil erosion through, for example, minimising removal of vegetation and use of engineering controls and to prevent contamination through, for example, use of secondary containment in fuel and chemical storage.
• Surface and groundwater: The Project will affect the water regime in the area, its inputs and outputs including rainfall, underground water level, saturation of soils. The project may also change sedimentation in water bodies and morphology in river beds. During construction, potable water will be trucked or potentially obtained from wells. Once an 11 km pipeline is in place, water will be abstracted from the river. HZM has worked with government to manage water abstraction levels in response to seasonal changes, to safeguard flow in rivers particularly in the dry season. The project may also affect the availability of water in springs used for domestic consumption and agriculture, the project has amended its design to minimise the number of springs affected. Springs currently identified as likely to be affected lie within the area of land to be acquired by the project. HZM has a water resources management plan to measure and manage water resources.
• Visual impact: The project is remote, but some parts of it will be visible from a small number of households. HZM’s team is considering the use of vegetation to help screen the project. On closure, project infrastructure will be removed, and mine pits restored and revegetated.
• Waste: Non-mineral wastes will be managed through the solid waste management plan. Details of the contractors to transport wastes and facilities to manage and dispose of the waste are being confirmed.

Horizonte Minerals Plc Araguaia Nickel Project Technical Report
Final November 2018 Page 293 of 342
• Protected areas: The project will not affect internationally or nationally recognised conservation areas for habitats or species. It will affect some areas designated for protection of watercourses (permanent preservation areas -APP in Portuguese), many of which are already degraded. HZM has committed to rehabilitating the APPs within the project footprint.
• Habitats: The project will primarily affect pasture land. The ANS part of the project will also affect a small area of natural habitat. None if this is primary forest, but some metallophile savannah (canga) classified as of particular biodiversity importance as “critical habitat” will be lost. The project design has been changed to reduce the footprint on critical habitat canga areas and will now affect some 296 ha of natural habitat and 53 ha of critical habitat. HZM has developed a number of programs for management and monitoring of biodiversity, flora and fauna and will develop a biodiversity action plan to set out how to deliver no net loss of natural habitat and net gain for critical habitat.
20.4.3 Social
Based on the analysis of the socio-economic landscape, impacts and mitigations associated with ANP and further work to be advanced post the FS prior to construction, the following conclusions can be drawn:
• In-migration: Based on the existence of in-migration during tourist seasons and given the possibility of attracting migrant work-seekers to the Area of Indirect Influence (AII), there are both lessons to be learnt and pre-emptive measures that can be taken by the ANP to avoid or mitigate similar negative social impacts during the construction phase.
• Role of the project in the local context: HZM will take the local context into consideration when developing the Local Municipal Development Agenda program further, to ensure that community expectations are realistic and that the mine is not seen as responsible for local government initiatives.
• Mining operators: It is important that through its environmental and social mitigations and actions, HZM differentiates itself from other operators in the municipality as the “mining operator of choice”, thus helping to secure its long-term social licence to operate.
• Community engagement: Given uncertainty about continuity of operations and mining projects in the region, it is important that engagement intensifies in line with project schedules and is adapted in proportion to levels of activity to manage expectations and perceptions.
• Vulnerability: A number of groups were identified as vulnerable in relation to their ability to adapt to changes brought about by ANP activities. Programs to upskill and build the capacity of the local workforce should be frontloaded to ensure locals have the ability to compete for jobs, in both construction and operational phases.
• Resettlement and livelihoods restoration: Resettlement should be conducted in a manner that involves extensive consultation among project-affected persons in order for it to have broad-based support, with particular attention given to those assessed as vulnerable.
• Water as a key ecosystem service: Associated with resettlement and livelihood restoration is the impact that mine pit dewatering and water level drawdown will have on the water levels in wells and springs used for domestic consumption by households in the Area Directly Impacted (ADI) by the project. Monitoring and drilling additional deeper wells for those impacted is a component of the Resettlement Action Plan.
• Mine Closure: Mine closure activities are important in the social and environmental aspects of ANP and Mine Closure plans will be updated each three years to meet permit conditions
Recommendations have been discussed in Section 26.

Horizonte Minerals Plc Araguaia Nickel Project Technical Report
Final November 2018 Page 294 of 342
21 CAPITAL AND OPERATING COSTS
All monetary values reported in this section are in US$.
21.1 Cost estimation overview
This study assumes an ore processing rate of 0.9 Mt/a after an initial ramp-up period. Ore is being sourced from the Araguaia Project area for the life of the mine and supplemented with higher grade ore from ANN approximately 100 km to the north in Project Year 8. The ore processing methodology is the pyro-metallurgical conversion of a nickel bearing laterite ore into a FeNi product using the RKEF process. The product will be transported by road to Vila do Conde Port for sale to customers FOB.
The pre-production capex in the cash flow model have been allocated 30% in Year 1 and 70% in Year 2 of the two years of construction. An allocation was made in Project Year 5 to upgrade the road between Araguaia and ANN and also provide mining infrastructure. Deposits for equipment will be required on the high value long lead items in Year 1 and the balance of the purchase price will be required in Year 2.
Cost studies were undertaken in Q3 2018, Q1 2016 and for the 2014 PFS.
Allocations have been made for government bonds prior to commencing production and also first fills and spares as well as a contingency of 9% on all capex.
The capital and opex estimates were prepared or advised by the following groups:
• Mining: Snowden Mining Industry Consultants Pty Ltd (Snowden)
• Process Plant: Ausenco (reviewed by HZM)
• Process Consumables Steinweg Logistics and others (Reviewed by HZM)
• Labour Ausenco (reviewed by HZM)
• Power Ausenco /Enecel (reviewed by HZM)
• Environmental: ERM
• Social: ERM
• Closure cost ERM
• Corporate G&A: HZM
• Royalties: L&M Assessoria
• Taxation: L&M Assessoria
21.2 Capital expenditure (capex)
21.2.1 Basis of estimate
The estimate is based on the Association for the Advancement of Cost Engineering (AACE) class 3 standard, with an accuracy range between -10% and +15% (Table 21-1), of the final project cost (excluding contingency).
The capex estimate was based on detailed engineering for all areas of the Project and is supported by detailed mechanical equipment lists and engineering drawings from which material take offs have been calculated. The costs for these items have been derived from vendor quotes for the equipment and materials. The capex estimate is after tax, including growth and contingency and excluding escalation.

Horizonte Minerals Plc Araguaia Nickel Project Technical Report
Final November 2018 Page 295 of 342
Table 21-1 Cost estimate classification
Estimate class
Engineering definition of
accuracy End usage Methodology Expected accuracy range
Class 5 0% – 2% Concept screening Capacity factored, parametric models, judgment, or analogy
L: -20% to -50%
H: +30% to +100%
Class 4 1% – 15% Study or feasibility Equipment factored or parametric models
L: -15% to -30%
H: +20% to +50%
Class 3 10% – 40% Budget authorisation or control
Semi-detailed unit costs with assembly level line items
L: -10% to -20%
H: +10% to +0%
Class 2 30% – 75% Control or bid/tender Detailed unit cost with forced detailed take-off
L: -5% to - 15%
H: +5% to +20%
Class 1 65% – 100% Check estimate or bid/tender
Detailed unit cost with detailed take-off
L: -3% to -10%
H: +3% to +15%
All costs are in 2018 United States dollars (US$); where the original estimated currency is other than US$, the rates used and their proportion of the estimate is shown in Table 21-2.
Table 21-2 Exchange rate and proportion of estimate
Currency Exchange rate (1 US$) Proportion of estimate
BRL 3.5 48%
CAD 1.25 4%
CNY 6.3 12%
EUY 0.845 7%
US$ 1.00 29%
No allowances are made for hedging of foreign currency variability between estimate date and the settlement of the order.
The capex estimate includes all the direct and indirect costs, local taxes and duties and appropriate contingencies for the facilities required to bring the Project into production, as defined by a feasibility level engineering study. The estimate is based on an Engineering Procurement and Construction Management (EPCM) implementation approach and the Project contracting strategy outlined in Section 24.1.
21.2.2 Capex estimate assumptions
The following assumptions are made in preparing the estimate:
• Required statutory permits are in place according to the scheduled milestones
• EPCM are completed in accordance with the Project schedule
• site access is granted, as per the timeline shown in the Project schedule
• Land acquisition and right-of-way have been established for construction
• Weather conditions are not of extreme proportions that may disrupt the continuance of safe work. A nominal allowance for inclement weather is made in the labour productivity assessment, based on the contractors proposal which are included in the informed unit costs/rates.
• Project delivery will not be constrained because of concurrent projects
• Suitable fabrication shops are available locally or identified by contractors during their bidding process
• Special cranes and special freight services, as required for heavy/difficult lifts or oversized goods for transport, are available locally
• Pre-commissioning check-outs prior to mechanical completion are included

Horizonte Minerals Plc Araguaia Nickel Project Technical Report
Final November 2018 Page 296 of 342
• Mining equipment, as well as temporary and standby power generation equipment, is to be leased and not purchased.
21.2.3 Capex estimate exclusions
The following items are excluded from the capex:
• Any scope variations and deferred capex (addressed with sustaining capital)
• Changes to industrial relations laws; and extended periods of industrial unrest
• Finance and interest charges for Project duration
• Salvage value for equipment and the refuse of material demolished during construction
• Any environmental requirement not identified in this estimate
• Abnormal weather conditions
• Soil remediation for any in situ hazardous contaminants
• Cost of delays associated with obtaining statutory approvals (e.g. building or development approval)
• Sunk costs (e.g. cost of this study and previous ones, etc.)
• Market forces related to the imbalance of supply and demand beyond the expected annual rate of inflation of prime commodities, such as steel, copper and pipe
• Effect of related concurrent projects on the availability of construction labour and materials
• Fuel price and foreign exchange variations
• Acts of God.
21.2.4 Process plant capital cost
The plant capital cost estimate is summarised Table 21-3 in with a base date of 3rd Quarter 2018 and with no provision for forward escalation.
Table 21-3 Summary of plant capital cost
WBS Level 1 WBS description Total cost (US$ million)
3000 Ore preparation 38.8
4000 Pyrometallurgy 137.9
5000 Material supply 21.7
6000 Utilities and infrastructure 50.7
7000 Buildings 9.0
Subtotal direct capex 258.1
8000 Indirect costs (including growth) 73.7*
Contingency 41.o
Subtotal indirect capex 114.7
Plant capex total 372.8
Note: * Includes US$1.7 million for a construction camp located on the site of the Stage 2 slag storage facility. No permanent camp is envisioned for the Project.
21.2.5 Mining capital
Mining related capex for the Project are presented in two broad categories: equipment and infrastructure for mining operations (mine capital equipment) and capital development for the establishment of operations at the various mining locations. In addition, there will be opex incurred during the pre-production period that will contribute to working capital. Mining capex is summarised in Table 21-4.

Horizonte Minerals Plc Araguaia Nickel Project Technical Report
Final November 2018 Page 297 of 342
Table 21-4 Summary of pre-production mining capital cost
Description Pre-production (US$ million)
Capital equipment 1.9
Mine development capital 4.9
Pre-production opex contributing to working capital* 4.4
Total mining capex 11.3
Note: * Covers only the seven months of expenses prior to the first production period. It does not allow for initial lag in revenue from Araguaia product delivery and sale which may further increase working capital.
21.2.6 Other capital
Other capital includes infrastructure such as powerline, slag storage, water cooling dam, road upgrades, and the river abstraction pipeline (Table 21-5). Other indirect costs represent land acquisition, social and environment programs and other owners’ costs.
Table 21-5 Summary of other capital
WBS # Area Capex estimate
(US$ million)
6000 Utilities and Infrastructure 55.9
8000 Indirect Costs 8.8
Total other capex (after taxes, pre-escalation) 64.7
21.2.7 Initial capital summary
A summary of the Project’s initial capex estimate is shown in Table 21-6.
Table 21-6 Initial capex summary
Area Area name Costs
(US$‘000)
No. of items included in
estimate
1000 Mine 6,003 1
3000 Ore Preparation 38,731 650
4000 Pyrometallurgy 137,518 1,104
5000 Materials Supply 21,413 397
6000 Utilities and Infrastructure 106,918 722
7000 Buildings 9,095 64
8000 Indirects (includes contingency and growth) 123,398 52
Total initial capex (after-tax, pre-escalation) 443,076 2,991
21.2.8 Sustaining capital
The LOM sustaining capital requirement of the ANP is estimated to be US$143.5 million, comprising contract mining costs associated with mine development, slag storage facility stages, relining of the furnace on a periodic basis in line with manufacturers proposals, upgrades of the road infrastructure in order to access additional deposits and completion of the acquisition of certain land rights to enable access to additional deposits in line with the mine plan (Table 21-7).

Horizonte Minerals Plc Araguaia Nickel Project Technical Report
Final November 2018 Page 298 of 342
Table 21-7 Project sustaining and closure capex summary
Area name Capex
(US$ million) Responsible
Ongoing mine development 68.6 Snowden
Slag storage 5.5 Prime
Process plant 12.0 Ausenco
ANS to VDS road upgrade 11.3 Construserve
Land acquisition 15.4 ERM
Subtotal sustaining 112.7
Mine and plant closure capex 30.8 ERM
Total sustaining and closure capex (after-tax, pre-escalation) 143.5
21.2.9 Basis of quantities
Engineering drawings of the plant were prepared by Ausenco, which include detail on:
• The location and size of mechanical equipment
• Critical piping (200 mm and above)
• Primary steel beams and columns
• Major electrical and instrument equipment locations.
The balance of quantities is either calculated based on layouts and general arrangements or factored based on engineering judgement. All quantities exclude allowances and incorporated civil, structural, architectural, mechanical, piping, electrical and instrumentation and control aspects.
Procurement
Firm or budgetary prices were obtained for the majority of packages (more than 83% for mechanical and 77% for electrical equipment, by value), with the balance estimated in-house. Ex-works pricing was sought for the major mechanical equipment packages using competitive pricing submissions from equipment suppliers. Where budget quotes were not obtained, existing third-party pricing was used. For minor equipment, in-house historical pricing and estimates were used. Equipment costed using prices from previous studies for the Project that were considered current were tagged in as “preliminary quotes” to delineate.
Growth (design) allowances
A growth allowance has then been allocated to each element in the estimate to reflect the level of definition of design (quantity/design maturity) and pricing strategy (pricing basis).
Estimated growth allows for:
• Items that cannot be quantified based on current engineering status but empirically known to appear
• The accuracy of quantity take-offs and engineering lists based on the level of engineering and design undertaken at FS level
• Cost growth for the potential increase in cost due to development and refinement of specifications as well as re-pricing after initial budget quotations and after finalisation of commercial terms and conditions to be used on the Project.
Where an allowance was used which is the result of factoring, no growth was applied. The total growth allowance included in the capex estimate is US$24.3 million, which represents 6% of the total capex excluding contingency.

Horizonte Minerals Plc Araguaia Nickel Project Technical Report
Final November 2018 Page 299 of 342
Mining costs
The mining costs capitalised represent contract mining costs associated with the initial stages of development of the mine site.
Direct field labour
The prefabrication and installation costs are based on budgetary data obtained from local contractors. Labour costs were provided per unit material take off (MTO) quantity. As such, labour rates were not directly used for calculating labour costs. Labour hours were provided by the contractors in the form of histograms and validated against in-house data. This information was used to determine the size of the construction accommodations and others indirect costs such as meals supply.
Contractors’ distributables
Contractors’ distributables are included in their respective crew rates. These rates cover construction equipment and expenses to support and deploy installation labour. Cost components covered by these rates include mobilisation and demobilisation, construction facilities, construction equipment, material transportation from warehouse to job site, construction supervision support, manual indirects, home office costs and contractors’ fees.
Labour productivity
The direct field labour hours are based on information received from local suppliers in the form of histograms. As such, the labour productivity is 1.0. This information was used to size the construction camp accommodations which will be in the area designated for the slag facility (stage 2). Operational labour will be sourced from local municipalities.
Freight costs
International freight costs (plus insurance) were requested from all suppliers as delivered duty paid (DDP) to the Port of São Luis or Vila do Conde (Barcarena). Where international freight costs were not available, they are calculated at 6.5% of the equipment/materials costs. The domestic freight portion of the international items (between port of Vila do Conde and the project site) is estimated at 2% of the equipment/materials costs. International shipping insurance is estimated at 0.3% of the equipment/materials costs.
The domestic freight costs (between the state of origin and the Project site) for those items that are supplied within Brazil are estimated at 4.8% of the equipment/materials costs (equipment and piping), for the other bulks, freight is estimated at 2% of the material cost.
21.2.10 Customs duties and taxes
The applicable local taxes, customs duties and fees for all equipment, materials and services are calculated by a Brazilian third-party tax specialist (L&M Assessoria Empresaria), retained by HZM and added to the estimate. A study on the taxation basis for calculation of the initial and sustaining capex taxes was undertaken.
The following is noted:
• EPCM services costs. EPCM services are estimated based on a build-up of man-hours using a deliverables-based approach, organisation charts, and the EPCM schedule (excluding taxes and escalation). Provision was made in the EPCM estimate for pre-operational testing and pre-commissioning punch lists to mechanical completion. This includes construction crews, commissioning manager, field commissioning engineers, field planners and post-handover personnel. Provision has also been included for commission and start-up assistance.
• Spare parts. Major mechanical spares for construction and commissioning have been identified from the vendor returned quotes where provided. To supplement the major spares list, factors of 1.5% for commissioning spares and 3.0% for operational spares have been taken from all the mechanical and electrical equipment not represented on the major spares list.

Horizonte Minerals Plc Araguaia Nickel Project Technical Report
Final November 2018 Page 300 of 342
• Vendors representatives on site. Vendors representatives will be required to supervise installation and start-up of certain equipment. Costs for vendors representatives for construction and commissioning have been allowed for as factors from the supply cost of the mechanical and electrical equipment – construction vendors at 2.5% of equipment supply cost and commissioning vendors at 2.0% of equipment supply costs (excluding taxes, freight and escalation).
21.2.11 Owner costs
The following costs items have been provided by HZM:
• Owner’s team: This is the client team, responsible for execution of the project and includes the project management, operational readiness, commissioning, and the performance testing teams. It excludes the mine/processing plant operations team, which will be accounted for under opex. This portion of the cost is included in the EPCM integrated team costs.
• Communication: All communication activities including internal and external disclosure, institutional material, training, internal communication vehicles, press, audiovisual records, etc.
• Health and Safety (including security): All services required for the deployment and operation of the Project, including risk control, accident prevention, continuous improvement, loss prevention and security.
• Administration: Funds allocated to corporate areas that are borne by the Project.
• Insurance (excluding freight): Insurance costs for engineering and construction activities and civil liability.
• Pre-operational expenses: The operating expenses until the end of the commissioning and performance testing periods, including the pre-operations team, first fills, power, fuel, water, etc.
• Environmental: All costs associated with environmental studies, assessment, compensatory measures and remediation of environmental liabilities.
• Community: Costs associated with community engagement activities such as social impact management, social investment, social dialogue, etc.
• Sustainability. All services related to sustainability that are not included in the environment, community relations or communication; in particular, investments for carrying out voluntary actions.
21.2.12 Closure costs
Mined out areas will be reclaimed as a continual process as part of mine planning and production. Topsoil stockpiles will be maintained throughout LOM. At the end of the project, industrial structures will be decommissioned, roads and infrastructure will be removed, and areas will be revegetated, unless an alternate arrangement has been made with authorities. The mine site will be made safe with fencing where necessary, to ensure the safety of people and livestock. A water retention dam will remain after mine closure for containment of any seepage water from the slag disposal facility. Included in the cost assumption of the closure is the estimated salvage value based on the tonnes of metal and prevailing scrap metal price.
21.2.13 Contingency
Contingency is a provision for unforeseen or inestimable costs within the defined project scope relating to the level of engineering effort undertaken and estimate/engineering accuracy and applied to provide an overall level of confidence in costs and schedule outcomes (in this case, targeting an 50% confidence level). The contingency is meant to cover events or incidents that occur during the course of the Project which cannot be quantified during the estimate preparation and does not include any allowance for Project risk.
Contingency does not cover scope changes, force majeure, adverse weather conditions, changes in government policies, currency fluctuations, escalation and other project risks. The recommended amount for contingency was developed using a probabilistic model based on the quality of the information and level of engineering.

Horizonte Minerals Plc Araguaia Nickel Project Technical Report
Final November 2018 Page 301 of 342
The total contingency carried in the capex estimate is US$41.0 million, which combined with the US$24.3 million Growth Allowance, which provides a total provision of US$65.3 million. This total represents 17.2% of the capex estimate (excluding Growth Allowance and Contingency).
To develop the contingency value a cost risk analysis (CRA) workshop was held. The estimate was summarised and presented at level 2 WBS and major disciplines such as concrete, steel, contractor labour, mechanical equipment, etc. Through experience, judgement, discussion and reviews the relevant stakeholders attending the workshop analysed the major cost components in terms of minimum and maximum ranges for potential underrun/overrun of quantities, pricing and productivity from the values contained in the estimate. Minimum and maximum values are subjective estimates of how low and how high an item could go.
The inputs are applied as percentages to the base estimate and then run in a Monte Carlo model using the @Risk program. The outputs of this program would indicate the probability of the Project having negative and positive annual net cash flows.
21.3 Operating expenditure (opex)
Opex for the Project have been prepared based on the Project physicals, detailed estimates of the consumption of key consumables based on those physicals, and the unit cost of consumables. The estimate is supported by detailed engineering, benchmarking and market pricing of key consumables and costs. Royalties and taxes, we calculated based on the advice of the HZM Brazilian mining tax advisor L&M Assessoria (L&M).
All financial values in this section are in US dollars (US$) unless otherwise stated. Brazilian Reals (BRL) is shown as R$. A summary of the opex is provided in Table 21-13.
Opex is comprised of physicals, labour, operating consumables, freight and power costs, mobile equipment, utilities, maintenance and mining contract costs, external contractor costs, environmental, and miscellaneous/other General and Administration (G&A) costs.
Opex estimates were prepared or advised by the groups discussed in Section 21.1.
No contingency was applied to the opex.
21.3.1 Exclusions
The following items are not included in the opex estimations:
• Cost of studies and work prior to commencing equipment purchase and construction. However, an estimated cost has been included to be written off in the taxation section.
• Foreign currencies exchange rate fluctuations although these have been reviewed in the sensitivity analysis
• Forward escalation beyond the estimate base date of (October 2018) to the project completion
• Risks due to potential government policy changes, labour disputes or permitting delays.
21.3.2 Physicals
Physicals for the opex estimate was derived from the mining schedule, and heat and mass balances developed from the Basis of Design and PDC.
21.3.3 Labour
The organisation charts and manpower cost studies have been completed. The manpower costs include a taxes multiplier of 1.77 over the base salary to include all local taxes payable. The organisation structure for the Project is divided into three main groups, namely management, operational (mines and geology, plant and plant maintenance) and supporting groups (safety, health, environmental, security, medical, IT, accounting, procurement, warehousing, general administration, marketing, sales, external relations).

Horizonte Minerals Plc Araguaia Nickel Project Technical Report
Final November 2018 Page 302 of 342
The normal work week in Brazil is 44 hours. One hour for lunch per day is not included in the 44 hours. For 24-hour coverage, there will be four teams working on 8.5-hour shifts. Three teams working and one on leave. This arrangement will allow an overlap period of 30 minutes in each shift change to ensure proper operational exchange at the various work positions.
The annual manpower costs are summarised by department in Table 21-8. These costs are total costs and include tax multipliers. A high level Project organogram for management is shown in Figure 21-1.
Table 21-8 Annual manpower costs by major departments
Departments No. of people BRL/a US$/a
Management 6 3,151,138 900,325
Mining 12 1,791,054 511,730
Plant Operations 122 13,441,992 3,840,570
Plant Maintenance 51 6,504,003 1,858,287
SHE + Admin departments 46 5,246,576 1,499,022
Total 237 30,134,763 8,609,934
Figure 21-1 High level Project organogram for management
The organisational organogram for permanent staff has been split into management or “M” (6 persons), co-ordination or “C” (23) and support staff or “S” (208), as shown in Table 21-9.
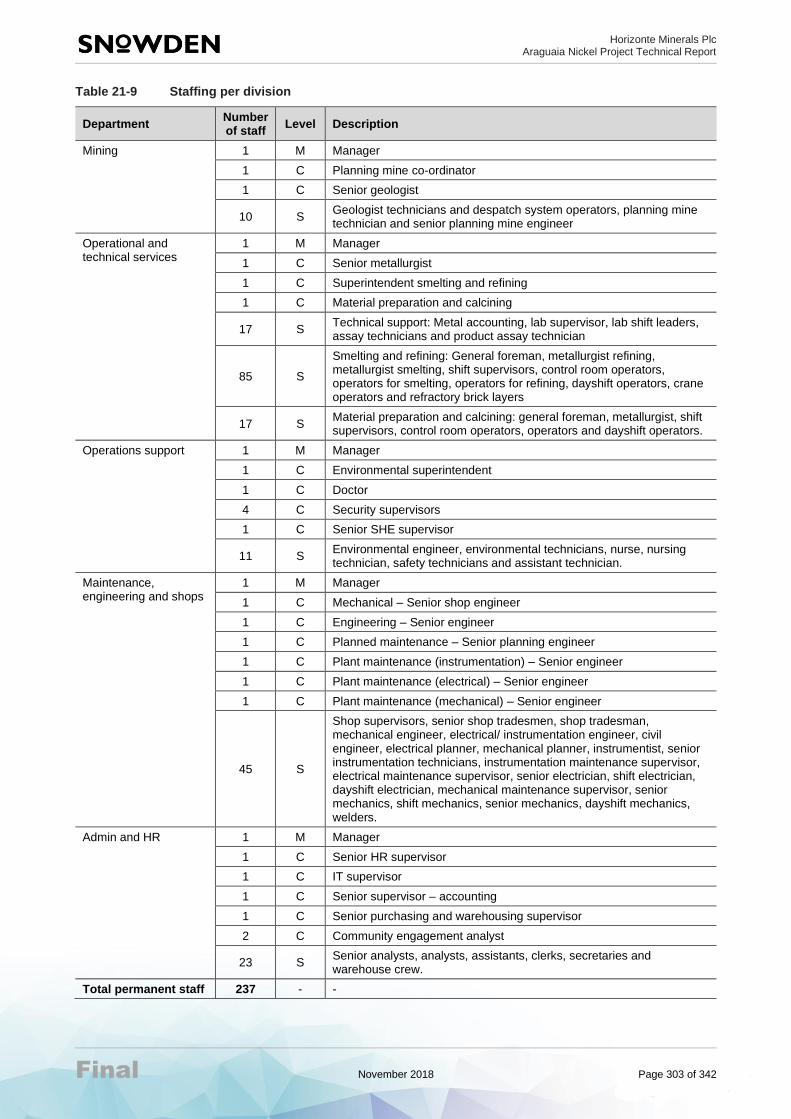
Horizonte Minerals Plc Araguaia Nickel Project Technical Report
Final November 2018 Page 303 of 342
Table 21-9 Staffing per division
Department Number of staff
Level Description
Mining 1 M Manager
1 C Planning mine co-ordinator
1 C Senior geologist
10 S Geologist technicians and despatch system operators, planning mine technician and senior planning mine engineer
Operational and technical services
1 M Manager
1 C Senior metallurgist
1 C Superintendent smelting and refining
1 C Material preparation and calcining
17 S Technical support: Metal accounting, lab supervisor, lab shift leaders, assay technicians and product assay technician
85 S
Smelting and refining: General foreman, metallurgist refining, metallurgist smelting, shift supervisors, control room operators, operators for smelting, operators for refining, dayshift operators, crane operators and refractory brick layers
17 S Material preparation and calcining: general foreman, metallurgist, shift supervisors, control room operators, operators and dayshift operators.
Operations support 1 M Manager
1 C Environmental superintendent
1 C Doctor
4 C Security supervisors
1 C Senior SHE supervisor
11 S Environmental engineer, environmental technicians, nurse, nursing technician, safety technicians and assistant technician.
Maintenance, engineering and shops
1 M Manager
1 C Mechanical – Senior shop engineer
1 C Engineering – Senior engineer
1 C Planned maintenance – Senior planning engineer
1 C Plant maintenance (instrumentation) – Senior engineer
1 C Plant maintenance (electrical) – Senior engineer
1 C Plant maintenance (mechanical) – Senior engineer
45 S
Shop supervisors, senior shop tradesmen, shop tradesman, mechanical engineer, electrical/ instrumentation engineer, civil engineer, electrical planner, mechanical planner, instrumentist, senior instrumentation technicians, instrumentation maintenance supervisor, electrical maintenance supervisor, senior electrician, shift electrician, dayshift electrician, mechanical maintenance supervisor, senior mechanics, shift mechanics, senior mechanics, dayshift mechanics, welders.
Admin and HR 1 M Manager
1 C Senior HR supervisor
1 C IT supervisor
1 C Senior supervisor – accounting
1 C Senior purchasing and warehousing supervisor
2 C Community engagement analyst
23 S Senior analysts, analysts, assistants, clerks, secretaries and warehouse crew.
Total permanent staff 237 - -

Horizonte Minerals Plc Araguaia Nickel Project Technical Report
Final November 2018 Page 304 of 342
21.3.4 Mining opex
All mining for the Project will be undertaken by the contractor (which is the standard practice in Brazil). A request for budget quotation (RFQ) was issued to a select group of earthmoving contractors following responses to and expression of interest (EOI) drafted by Snowden and issued and evaluated by HZM. The RFQ included Scope of work, material movement and quantity schedules, estimates of haulage requirements and pricing schedules. Responses to the RFQ were received from three contractors operating in-country. Unit variable rates from the contractor submissions were used to develop a mining cost estimate based on the final LOM schedule. Table 21-10 summarises the mining contractor costs used in the FS.
Table 21-10 Summary of mining budget estimate
Cost area Contractor opex
(US$ million)
Unit opex
(US$/t ore)
Mobilisation and site establishment 6.4 0.23
Demobilise and restore site 5.8 0.21
Site works 89.9 3.30
Load and haul 609.5 22.34
Contractor fixed costs -
Contractor dayworks 17.2 0.63
Total mining opex 728.8 26.72
Owners costs were added, and all mining costs were split into capital and operating costs, where appropriate. The lowest cost quotation which satisfied all the technical requirements was selected. Unit variable rates from the contractor submissions were used to develop a mining budget estimate based on the final LOM schedule.
The contractors were requested to supply fixed costs to mitigate risk from seasonal fluctuations in the mining schedule. All contractors elected to include their fixed costs within variable pricing. It is recommended that further discussion with the contractors during the next phase of the Project be undertaken to ensure the risks of this approach are appreciated.
The following is noted:
• Unit mining costs. The unit mining costs for the Project were estimated for each mining location. An average direct unit mining cost of US$13.79/wet metric tonne ore (wmt.ore), indirect mining cost of US$4.12/wmt.ore and a total unit cost of US$17.91/wmt.ore is reported. Contractor fixed charges were requested to transfer production and scheduling risk away from the contractor to HZM where they are best controlled. No fixed costs were quoted by the contractors; rather fixed costs were distributed across the variable costs.
• Grade control drilling. Grade control drilling will be carried out using RC drills. The hole spacing will be 10 m x 10 m and will be drilled from the surface. The estimated annual drill requirement will be between 20,000 m and 25,000 m per year, depending on the mining rate. The number of assays from RC drilling was estimated based on sampling 1 m intervals within the ore zone for 105% of the ore zones drilled, plus an additional 100 grab samples per month for each month ore is being mined. Contract drilling costs were provided by HZM and totalled US$37.0 million, with RC drilling (US$30.4 million) and sampling and assaying (US$5.6 million) the primary components.
• Drill and blast. No allowance was made for drill and blast of any of the above material types.
• Load and haul costs. Haul profiles were calculated for each period, material type, source and destination combination. Each segment height change was then converted to an equivalent haul comprising 1:10 gradient distance with the remaining distance as a horizontal haul. The LOM load and haul costs are summarised as US$3.34/bcm in dry season and US$4.56/bcm in wet season.

Horizonte Minerals Plc Araguaia Nickel Project Technical Report
Final November 2018 Page 305 of 342
• ROM operating costs. ROM operations account for loading and hauling ore from the various mining locations to the PQZ stockpile via the main arterial haul roads. Included in the ROM opex is rehandling of the ore from the PQZ stockpile to the ROM blending stockpiles adjacent to the feed hoppers, as well as provisions for rehandle for road train stockpiles onto the main PQZ stockpile. The total ROM operation costs are US$373.1 million, of which Vale dos Sonhos (US$235.5 million), ROM pad preparation (US$71.5 million) and Vila Oitio (US$42.5 million) are the major components.
• Slag load and haul. The costs of load and haul for slag from the plant to the slag storage facility are captured in this cost centre. The cost to load and haul slag from the process plant to the slag dump was estimated to be US$0.96/wmt of slag.
• Waste dump rehabilitation. The consolidated cost of rehabilitating the waste dumps was estimated to be US$0.79/bcm of waste mined, with a total rehabilitation cost of US$28.9 million, which includes top soil loading for the final formation, and rip and seeding of waste dump top and sides. No allowance was made for the ongoing monitoring and management of the landform once it was completed in the mining costs. These costs are included in the project closure costs (Section 20.1.1).
• Dayworks. A nominal provision for daywork was included in the estimate. Dayworks will cover for miscellaneous works not specified in the scope that will arise from time to time during the normal course of operations. The LOM provision for dayworks was estimated to be US$19.4 million and represents approximately 2.5% of the mine opex. Dayworks typically contributes 2% to 4% of mining costs, hence the provision was considered adequate.
21.3.5 Process plant opex
An opex estimate was developed for the plant based on the consumption rate of key commodities derived from the energy and mass balances along with equipment manufacturers recommendations and industry best practice (Table 21-11) and the cost of those commodities which are based on written quotes from suppliers or marketing companies for those commodities (Table 21-11). The two largest components of the opex are power and coal.
Table 21-11 Plant operating expenditure summary
Description Opex per annum
(US$ million)
Unit opex
(US$/t Ni)
Directs
Power 29.40 1,993.58
Coal 23.30 1,579.64
Other fuels 6.22 421.65
Process consumables 7.28 493.80
Water treatment chemicals 0.11 7.39
Maintenance supplies 4.18 283.70
Labour 7.96 539.39
Other contracts 1.00 67.55
Subtotal – Direct Costs 79.45 5,386.70
Indirects
Processing overheads 0.28 18.75
Administration and other costs 2.45 165.92
Mobile equipment leases 0.30 20.41
Freight costs (product to market) 5.31 360.03
Indirect taxes and royalties - -
Total – Indirects 8.33 565.11
Total process plant 87.78 5,951.81
Power consumption
Based on the electrical load list and the planned utilisation of the loads the calculated power consumption per year 538 GWh. Primary power consumption will be smelting (88%), water supply (3%), calcining (3%), refining (2%), ore drying (2%) and other (2%).

Horizonte Minerals Plc Araguaia Nickel Project Technical Report
Final November 2018 Page 306 of 342
Power represents almost one-third of the opex – HZM commissioned a power cost study to review power generation options. This was prepared by Enercel (http://www.enecel.com.br/) a large energy marketing company. The result of the study is that the long-term power cost for the Project is predicted to be 0.19 BRL/kWh (including taxes). This value was used in the opex estimation.
Plant coal consumption
Coal represents about one-third of the opex. Coal is consumed in four areas. It was calculated based on MetSim modelling and international best practice for the process. The breakdown of their calculated annual consumption is shown in Table 21-12.
Table 21-12 Plant coal consumption
Area Consumption (dt/a)
Ore dryer burner 17,700
Kiln burner 76,430
Reductant coal 55,000
Coal for drying coal milling 2,064
Total 151,194
HZM has sought independent advice on the cost of coal for the Project as well as freight to the site from the port of Villa de Conde. The consensus opinion was that coal of the appropriate specification in 2021 would cost US$70/t to US$75/t FOB Columbia. For the opex calculation, Ausenco used US$75/t.
HZM sought estimates from JFR Logistics for the freight of coal from Columbia to the port of Villa De Conde, the unit cost was US$27.94/t, including port charges. Road freight from Villa de Conde to ANP was BRL199/t. HZM commissioned a study in 2017 by Steinweg logistics to determine the purchase and freight cost of key plant consumables for ANP. This along with vendor quotes, and costs derived from a database of consumables in Brazil, was used as the basis for the costs derived for the FS.
Mobile equipment
Vehicles include all mobile equipment chargeable to the Process Plant and management. A list of mobile equipment required for the Project has been developed and defines which equipment will be capitalised and which equipment will be leased. Eleven individual items of mobile equipment are assumed to be leased over a 36-month term with an underlying value of US$900,000. Quotes were obtained from local vendors. The fuel consumption rates were based on engine size and database values and the utilisation of the equipment was estimated to calculate the annual mobile equipment diesel fuel costs. Similarly, annual maintenance costs were obtained from the vendors for purchased equipment. Equipment costs for leased equipment includes the maintenance costs.
Maintenance
Maintenance was calculated based on a percentage of the installed equipment cost and is intended to cover the cost of all maintenance items required for the process plant. Mining equipment maintenance is not part of this element and is included in the contract mining rate. The maintenance cost covers regular maintenance on equipment, spare parts and replacement cost, lubrication, planned shutdowns and emergency repairs.
21.3.6 External contract costs (HZM)
External contract costs includes all contracts, except mining. It would include security, cleaning services, diesel and gasoline fuel station, conveyor maintenance, a canteen and garbage collection.

Horizonte Minerals Plc Araguaia Nickel Project Technical Report
Final November 2018 Page 307 of 342
21.3.7 Environmental, social and permitting
This item comprises the annual cost of environmental assessments and monitoring (air, water, waste, noise, sedimentation and ecology) and was included in the overhead costs. Associated site management and supervision (HZM owner’s team); social, physical and biological PCAs; and all socio-environment costs for ANP and the power transmission line of the Project are included in this cost item.
21.3.8 Miscellaneous and other general and administration
This includes miscellaneous and other costs, for example miscellaneous processing/operation costs; administration and other costs such as insurance, IT, management and technical assistance fees, legal and other fees, Government charges, community relations, community development, indirect taxes and royalties, consultants, software licences, travel expenses, etc.
21.3.9 Opex summary
Opex drivers have been developed on completion of the opex estimate. A variable and fixed component was applied to opex. This enables the opex to be adjusted to meet the annual mine plan forecast, including nickel grade, for the purposes of the economic evaluation. The opex cost estimate is based on an underlying US$1:3.5BRL exchange rate. The opex summary is shown in Table 21-13.
Table 21-13 Opex estimate summary
Description Opex per annum**
(US$ million)
Opex
(US$/t nickel)
Process plant
Directs
Power 32.1 2,410
Coal 21.6 1,620
Other directs 18.0 1,348
Labour 7.8 588
Subtotal – Direct opex 79.5 5,966
Indirects 10.3 772
Mining opex 21.1 1,584
Total opex 110.9 8,322
Note: ** Costs shown here represent an average over the life of mine, actual costs for these components vary from year-
to-year depending on the physicals.
21.3.10 Royalties
In terms of royalties, the following is noted:
• Compensation for Exploitation of Mineral Resources (CFEM). The CFEM is payable by legal entities in the mining industry that exploit or extract mineral resources and is payable upon sale of the mining product. The CFEM rate is usually applied to the entity’s net revenues and varies in accordance with the mining product, but cannot exceed 3% of gross revenues, after deducting insurance, tax, and transportation costs.
• For nickel, the applicable CFEM rate is 2% although when combined with the Landowner rights of 1% a rate of 3% was applied throughout ANP LOM. In the case of the Project, the calculation of the CFEM includes the following costs: mining, stockpiling, crushing, coal preparation, administration, maintenance and some environmental costs up to and including calcining. The sum of these costs gives a value that will be multiplied by 3%.
• Landowner rights of participation. Mining entities are also required to pay financial compensation to land owners of 50% of the CFEM. Therefore, the total CFEM cost to be borne by the ANP is 3% (2% + 1%), equivalent to a LOM royalty of US$53.7 million.

Horizonte Minerals Plc Araguaia Nickel Project Technical Report
Final November 2018 Page 308 of 342
21.3.11 Taxation
The tax treatment adopted in the financial evaluation was based upon advice taken from L&M. Import duties, withholding and purchase taxes are based on advice from L&M who advised that certain available exemptions, indirect taxation incentives and taxation credits be applied to the cash flow model.
Most direct taxation incentives apply to new investments and are offered by Federal, State or Municipal governments. These generally include substantial reductions in taxes (mainly State value-added tax (VAT), ICMS, as well as corporation tax), utility charges and other expenses. Federal incentives (generally income tax reductions) are available for investments in less developed areas such as where the Project is located.
The Project has been assessed as eligible for the various existing fiscal incentives available and these have been assumed where applicable in quantifying the tax burden on the Project.
The total tax paid over the LOM is calculated at US$293.2 million. Summarised below are the principal taxes relevant to the Project.
Federal corporate income taxes
There are two income taxes – the corporate income tax and the social contribution tax on profits (which are imposed on similar taxable bases):
• Brazilian corporate income tax (IPRJ) is charged at a 15.25% rate, with a surtax of 10% applicable to profits exceeding R$240,000 a year, a small nominal amount; currently US$68,500.
• Social contribution tax (CSLL) on corporate profits. The social contribution tax works similarly to income tax and it is charged at a 9% rate. Ordinary tax losses may be carried forward with no time limit for offset against future operating profits.
Application of SUDAM incentive to IPRJ (25% corporate income tax)
A 75% reduction in the 25% rate IPRJ would be available to the project through application to the Superintendência do Desenvolvimento do Amazônia – the Development Superintendency for the Amazonia Region (SUDAM), valid for the life of the Project. Coupled with the 9% social contribution tax on corporate profits, this has the net effect of reducing the effective rate of corporation tax from 34% to 15.25% over the duration of the Project. The corporation taxation regime applied in the cash flow model allows for a taxation rate of 15.25% of the taxable income.
Gross revenues and import taxes
Current Program of Social Integration (PIS) and Contribution for the Financing of Social Security (COFINS) are federal taxes charged on gross revenues, on a monthly basis, under two regimes: cumulative and non-cumulative.
PIS and COFINS tax provisions were implemented in December 2002 (Law 10,637/02) and December 2003 (Law 10,833/03). As a result of such rules, the PIS and COFINS rates were set at 1.65% and 7.6% respectively and a credit mechanism introduced. PIS and COFINS are generally imposed on the import of goods and services at a combined rate of 9.25%.
Indirect taxes
Both the Federal and State governments impose VAT-type taxes in Brazil. Each manufacturing plant or branch of a Brazilian company is generally considered an autonomous tax unit for both federal and state VAT purposes.
Federal VAT (Imposto sobre Produtos Industrializados or IPI) is charged on imports of goods, on the first sale of imported goods and on transactions involving manufactured goods. Exports are tax exempt. The tax rate varies depending on the product traded and ranges from 0% to 365%. IPI paid on an import transaction or on local acquisitions generally becomes a tax credit to offset IPI charged on subsequent transactions. Special rules apply to the import and sale of fixed assets.

Horizonte Minerals Plc Araguaia Nickel Project Technical Report
Final November 2018 Page 309 of 342
State VAT (ICMS): (Imposto sobre operações relativas à circulação de mercadorias e sobre prestações de serviços de transporte interestadual e intermunicipal e de comunicações) is levied on the import of goods and on the movement out of imported and manufactured goods, even if between branches of the same legal entity. Exports are tax exempt. ICMS paid on imports as well as on local acquisitions generally becomes a tax credit to offset ICMS due on subsequent transactions. Special rules apply to the offset of ICMS tax credits associated with the acquisition of fixed assets.
ICMS tax rates vary according to the state where the company and the acquirer of the goods are located. Imports are generally subject to a 17% or 18% rate, while local transactions are subject to rates varying from 7% to 18%. Transactions involving taxpayers located in the states of the North, Northeast and Centre-West regions and Espírito Santo are subject to a 7% rate, while a 12% rate applies to transactions involving companies located in states of the Southeast and South regions.
ICMS is also charged on the provision of transportation services, communication and electricity.
Application of indirect taxes – capital and operating expenses
Where benefits and special regimes exist for indirect taxes, it was assumed that these are applicable to the Project. It was assumed in this FS that any credits built up on input taxes are offset against taxes on outputs.
Other taxes relevant to the Project
It is assumed that most of the capital equipment will be sourced in Brazil. In the eventuality of items being imported where these are not available in Brazil, it is assumed that the “Ex Tarifario” benefit is granted. This reduces the rate of import duty usually to 2%, or 0% where the Government considers that the fixed assets are of high importance for the development of the Brazilian economy. The 0% rate was assumed.
Furthermore, the rate can be reduced to 0% if the fixed assets are imported from a country which has a trade agreement with Brazil (such as MERCOSUR – the Mercado Común del Sur or Southern Common Market) and provided that the goods have certificate of origin with an also 0% taxation in the country of origin. For this Project an initial value of US$30 million was allowed, which represents the total expenditure on the ANP to date.
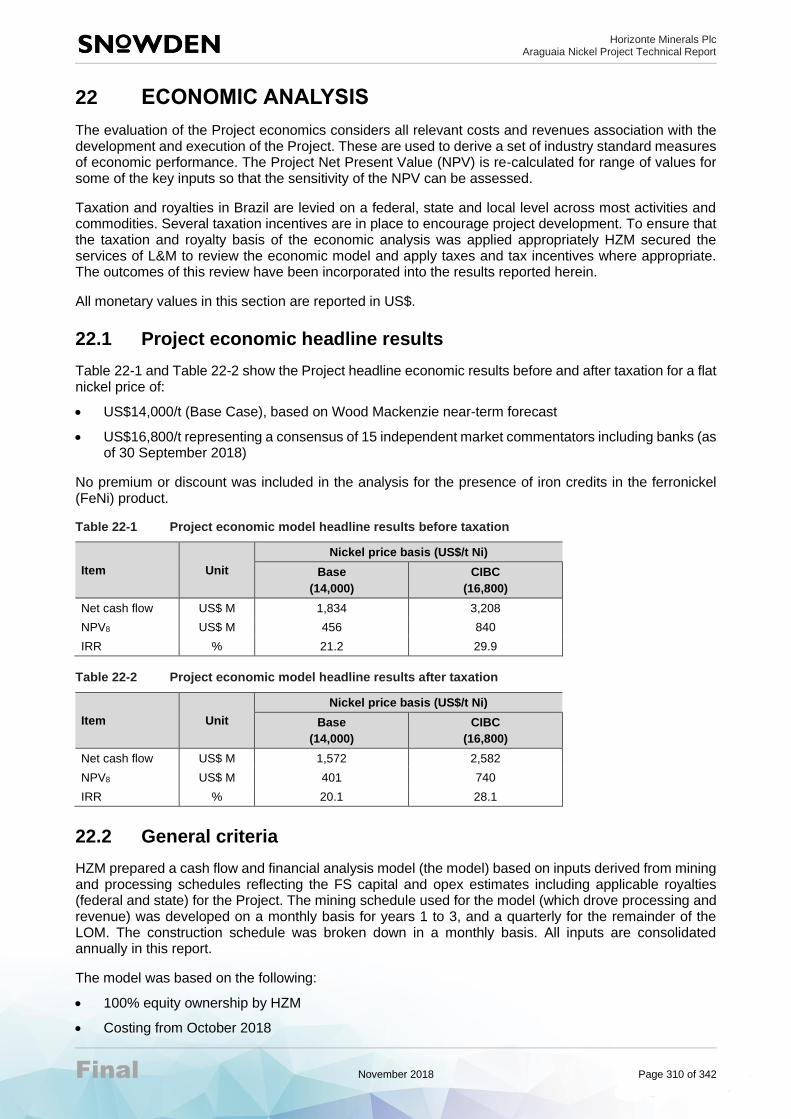
Horizonte Minerals Plc Araguaia Nickel Project Technical Report
Final November 2018 Page 310 of 342
22 ECONOMIC ANALYSIS
The evaluation of the Project economics considers all relevant costs and revenues association with the development and execution of the Project. These are used to derive a set of industry standard measures of economic performance. The Project Net Present Value (NPV) is re-calculated for range of values for some of the key inputs so that the sensitivity of the NPV can be assessed.
Taxation and royalties in Brazil are levied on a federal, state and local level across most activities and commodities. Several taxation incentives are in place to encourage project development. To ensure that the taxation and royalty basis of the economic analysis was applied appropriately HZM secured the services of L&M to review the economic model and apply taxes and tax incentives where appropriate. The outcomes of this review have been incorporated into the results reported herein.
All monetary values in this section are reported in US$.
22.1 Project economic headline results
Table 22-1 and Table 22-2 show the Project headline economic results before and after taxation for a flat nickel price of:
• US$14,000/t (Base Case), based on Wood Mackenzie near-term forecast
• US$16,800/t representing a consensus of 15 independent market commentators including banks (as of 30 September 2018)
No premium or discount was included in the analysis for the presence of iron credits in the ferronickel (FeNi) product.
Table 22-1 Project economic model headline results before taxation
Item Unit
Nickel price basis (US$/t Ni)
Base
(14,000)
CIBC
(16,800)
Net cash flow US$ M 1,834 3,208
NPV8 US$ M 456 840
IRR % 21.2 29.9
Table 22-2 Project economic model headline results after taxation
Item Unit
Nickel price basis (US$/t Ni)
Base
(14,000)
CIBC
(16,800)
Net cash flow US$ M 1,572 2,582
NPV8 US$ M 401 740
IRR % 20.1 28.1
22.2 General criteria
HZM prepared a cash flow and financial analysis model (the model) based on inputs derived from mining and processing schedules reflecting the FS capital and opex estimates including applicable royalties (federal and state) for the Project. The mining schedule used for the model (which drove processing and revenue) was developed on a monthly basis for years 1 to 3, and a quarterly for the remainder of the LOM. The construction schedule was broken down in a monthly basis. All inputs are consolidated annually in this report.
The model was based on the following:
• 100% equity ownership by HZM
• Costing from October 2018
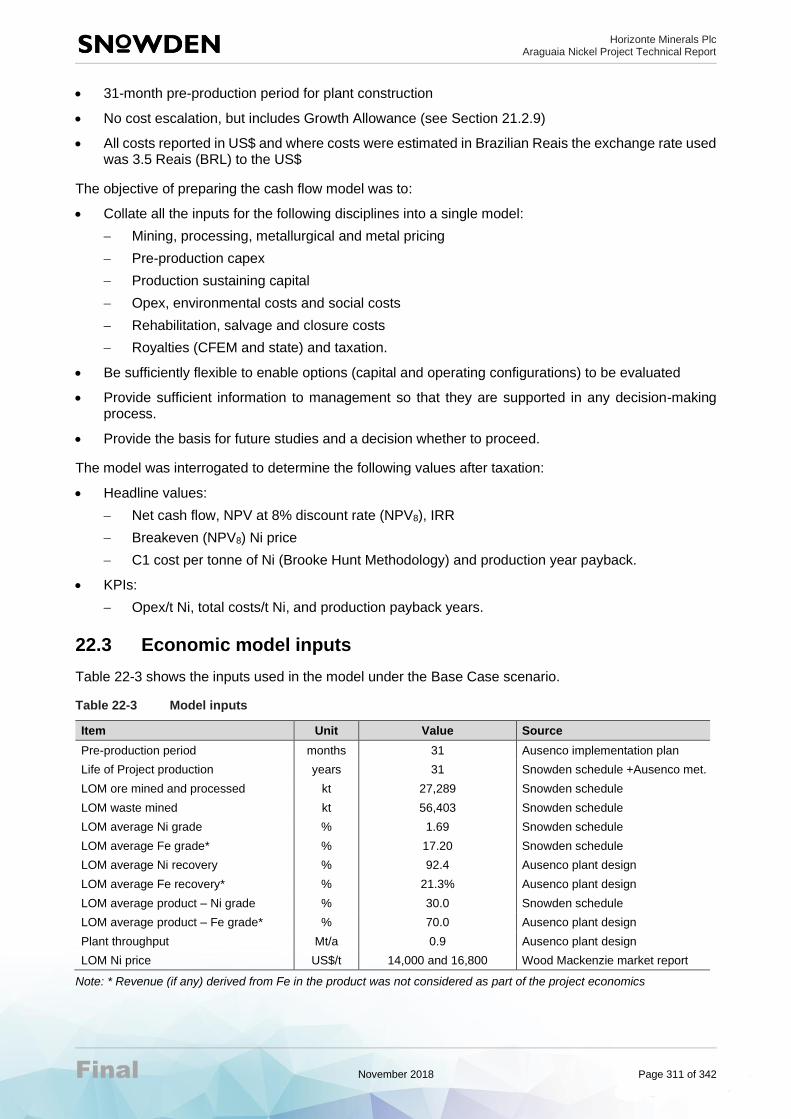
Horizonte Minerals Plc Araguaia Nickel Project Technical Report
Final November 2018 Page 311 of 342
• 31-month pre-production period for plant construction
• No cost escalation, but includes Growth Allowance (see Section 21.2.9)
• All costs reported in US$ and where costs were estimated in Brazilian Reais the exchange rate used was 3.5 Reais (BRL) to the US$
The objective of preparing the cash flow model was to:
• Collate all the inputs for the following disciplines into a single model:
− Mining, processing, metallurgical and metal pricing
− Pre-production capex
− Production sustaining capital
− Opex, environmental costs and social costs
− Rehabilitation, salvage and closure costs
− Royalties (CFEM and state) and taxation.
• Be sufficiently flexible to enable options (capital and operating configurations) to be evaluated
• Provide sufficient information to management so that they are supported in any decision-making process.
• Provide the basis for future studies and a decision whether to proceed.
The model was interrogated to determine the following values after taxation:
• Headline values:
− Net cash flow, NPV at 8% discount rate (NPV8), IRR
− Breakeven (NPV8) Ni price
− C1 cost per tonne of Ni (Brooke Hunt Methodology) and production year payback.
• KPIs:
− Opex/t Ni, total costs/t Ni, and production payback years.
22.3 Economic model inputs
Table 22-3 shows the inputs used in the model under the Base Case scenario.
Table 22-3 Model inputs
Item Unit Value Source
Pre-production period months 31 Ausenco implementation plan
Life of Project production years 31 Snowden schedule +Ausenco met.
LOM ore mined and processed kt 27,289 Snowden schedule
LOM waste mined kt 56,403 Snowden schedule
LOM average Ni grade % 1.69 Snowden schedule
LOM average Fe grade* % 17.20 Snowden schedule
LOM average Ni recovery % 92.4 Ausenco plant design
LOM average Fe recovery* % 21.3% Ausenco plant design
LOM average product – Ni grade % 30.0 Snowden schedule
LOM average product – Fe grade* % 70.0 Ausenco plant design
Plant throughput Mt/a 0.9 Ausenco plant design
LOM Ni price US$/t 14,000 and 16,800 Wood Mackenzie market report
Note: * Revenue (if any) derived from Fe in the product was not considered as part of the project economics
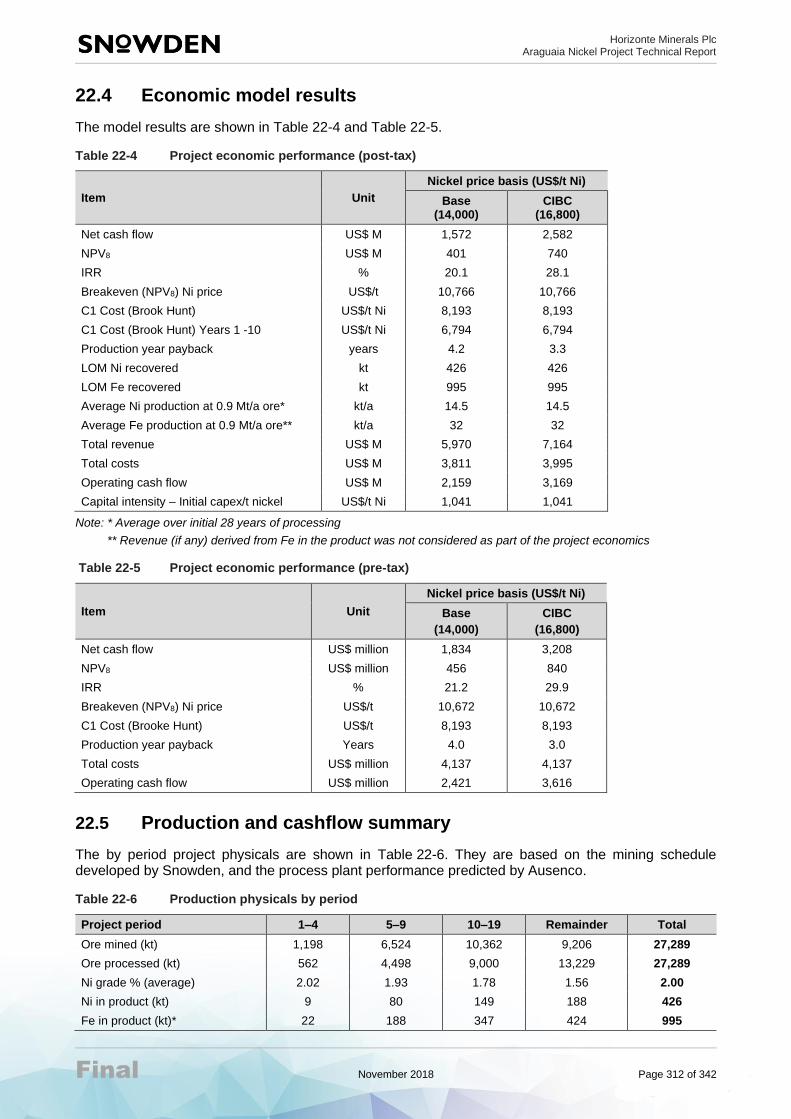
Horizonte Minerals Plc Araguaia Nickel Project Technical Report
Final November 2018 Page 312 of 342
22.4 Economic model results
The model results are shown in Table 22-4 and Table 22-5.
Table 22-4 Project economic performance (post-tax)
Item Unit
Nickel price basis (US$/t Ni)
Base (14,000)
CIBC (16,800)
Net cash flow US$ M 1,572 2,582
NPV8 US$ M 401 740
IRR % 20.1 28.1
Breakeven (NPV8) Ni price US$/t 10,766 10,766
C1 Cost (Brook Hunt) US$/t Ni 8,193 8,193
C1 Cost (Brook Hunt) Years 1 -10 US$/t Ni 6,794 6,794
Production year payback years 4.2 3.3
LOM Ni recovered kt 426 426
LOM Fe recovered kt 995 995
Average Ni production at 0.9 Mt/a ore* kt/a 14.5 14.5
Average Fe production at 0.9 Mt/a ore** kt/a 32 32
Total revenue US$ M 5,970 7,164
Total costs US$ M 3,811 3,995
Operating cash flow US$ M 2,159 3,169
Capital intensity – Initial capex/t nickel US$/t Ni 1,041 1,041
Note: * Average over initial 28 years of processing
** Revenue (if any) derived from Fe in the product was not considered as part of the project economics
Table 22-5 Project economic performance (pre-tax)
Item Unit
Nickel price basis (US$/t Ni)
Base
(14,000)
CIBC
(16,800)
Net cash flow US$ million 1,834 3,208
NPV8 US$ million 456 840
IRR % 21.2 29.9
Breakeven (NPV8) Ni price US$/t 10,672 10,672
C1 Cost (Brooke Hunt) US$/t 8,193 8,193
Production year payback Years 4.0 3.0
Total costs US$ million 4,137 4,137
Operating cash flow US$ million 2,421 3,616
22.5 Production and cashflow summary
The by period project physicals are shown in Table 22-6. They are based on the mining schedule developed by Snowden, and the process plant performance predicted by Ausenco.
Table 22-6 Production physicals by period
Project period 1–4 5–9 10–19 Remainder Total
Ore mined (kt) 1,198 6,524 10,362 9,206 27,289
Ore processed (kt) 562 4,498 9,000 13,229 27,289
Ni grade % (average) 2.02 1.93 1.78 1.56 2.00
Ni in product (kt) 9 80 149 188 426
Fe in product (kt)* 22 188 347 424 995

Horizonte Minerals Plc Araguaia Nickel Project Technical Report
Final November 2018 Page 313 of 342
Note: * Revenue (if any) derived from Fe in the product was not considered as part of the project economics
The by period after-tax cash flow generated in the model based on the physicals are shown in Table 22-7.
Table 22-7 Project financials by period – post-tax
Project period 1–4 5–9 10–19 Remainder Total
Revenue (US$ M) 171 1,121 2,078 2,600 5,970
Operating costs (US$ M) (83) (559) (1,285) (1,884) (3,811)
Capital expenditure (US$ M) (447) (20) (63) (57) (587)
Net cash flow (US$ M) (359) 542 730 659 1,572
Pro-rata cash cost (US$/lb) 3.00 3.00 3.53 4.39 3.75
Pro-rata cash cost (US$/t Ni) 6,623 6,624 7,772 9,681 8,264
22.6 Key performance indicators
The Project LOM KPIs after taxation are presented in Table 22-8.
Table 22-8 Project KPIs after taxation
Item Unit
Nickel price basis (US$/t Ni)
Base
(14,000)
CIBC
(16,800)
Value of product sold US$/t ore 218.75 262.50
Cash cost US$/t ore 129.13 129.13
Total cost US$/t ore 141.95 135.22
Production year payback year 4.2 3.3
Pro-rata cash cost* US$/lb Ni 3.75 3.75
Pro-rata cash cost US$/t Ni 8,264 8,264
Pro-rata total cost** US$/lb Ni 4.12 3.93
Pro-rata total cost US$/t Ni 9,085 8,654
Brooke Hunt methodology C1 cost^ US$/lb Ni 3.72 3.72
Brooke Hunt methodology C1 cost US$/t Ni 8,193 8,193
Note: * The pro-rata cash costs include all direct opex plus royalties
** The pro-rata total costs include pro-rata cash costs plus capital costs and taxation
^ The Brooke Hunt methodology C1 costs include all direct operating expenses excluding royalties.
The costs are allocated in proportion to the value of Ni to the total value of the product produced.
22.7 Sensitivity analysis
The model was used to prepare a sensitivity analysis for the NPV8 for the Project after taxation. The sensitivity analysis was completed on the following variables:
• Grade, recovery and price of Ni
• Pre-production and production capital
• Mining, processing and overhead cost.
The sensitivity analysis determines how the NPV8 is affected with changes to one variable at a time while holding the other variables constant. The results of the sensitivity analysis are presented in Table 22-9. The breakeven (B/E) value indicates the change in the variable that will bring the project NPV8 to US$0.000 if all other variables remain unchanged. For example, if the grade of Ni reduces by 23.3% the Project will break even on NPV8.

Horizonte Minerals Plc Araguaia Nickel Project Technical Report
Final November 2018 Page 314 of 342
Table 22-9 Sensitivity table for the Base Case (US$14,000/t) NPV8, after taxation
Component -20% -10% -5% 0% 5% 10% 20% B/E*
Grade Ni 65 234 317 401 483 566 731 -23.7%
Recovery Ni 65 234 317 401 483 566 731 -23.7%
Price Ni 56 230 315 401 485 570 740 -23.1%
Pre-production capital 469 435 418 401 383 366 331 110.2%
Production capital 403 402 401 401 400 399 397 -
Mining cost 436 418 409 401 391 383 365 222.6%
Processing cost 531 466 433 401 367 335 269 59.8%
US$/BRL FX rate 222 321 363 401 434 465 519 -35.4%
Overhead cost 447 424 412 401 389 377 353 167.2%
Note: * The breakeven change for the variable if all other variables remain unchanged. For example, if the grade of Ni reduces by 23.3% the Project will break even on NPV8.
The sensitivity chart is shown in Figure 22-1 and it covers a range of variable changes from -20% to +20%. The flat line in the recovery of Ni indicates that the recovery cannot exceed 100%. As the variable line increases towards the vertical it indicates the Project is more sensitive to changes of the variable.
Figure 22-1 Sensitivity to NPV8 for changes in various key inputs
Figure 22-1 shows that the Project’s NPV8 is most sensitive to nickel price, nickel recovery and nickel grade. This is expected as these three factors directly affect revenue. The Base Case nickel price for the Project is US$14,000/t which is below the market consensus of US$16,800/t. The nickel feed grade is well supported by Geology and Mining Engineering studies undertaken. The nickel recovery in the plant is well supported by metallurgical testwork and detailed plant design completed.
The next most sensitive factor is the exchange rate. The US$/BRL rate of 3.5 used for the operating and capex build up is below the prevailing market rate of 3.85 as at the date of this study. Figure 22-1 shows that the Project’s NPV8 is relatively insensitive to the other factors considered.
22.8 Breakeven analysis
An after taxation breakeven analysis was undertaken for both NPV8 and net cash flow. This analysis is conducted on the sensitivity analysis data and provides the nickel price which will bring either the NPV8 or net cash flow to US$0. The results of this analysis are presented in Table 22-10.

Horizonte Minerals Plc Araguaia Nickel Project Technical Report
Final November 2018 Page 315 of 342
Table 22-10 Breakeven analysis after taxation
Item Unit Breakeven price
Net cash flow US$/t Ni 9,750
NPV8 US$/t Ni 10,766
22.9 Conclusion and recommendations
The economic analysis demonstrates that the FS presents a positive economic case for the development and execution of the project using a nickel price of US$14,000/t for the initial 28-year life of the Project (below the consensus long term nickel price of US$16,800/t). In view of the predicted strengthening of the commodity price, the case presented is regarded as robust with significant upside. It is therefore recommended that the Project progress to detailed design and construction.

Horizonte Minerals Plc Araguaia Nickel Project Technical Report
Final November 2018 Page 316 of 342
23 ADJACENT PROPERTIES
There is no information from adjacent properties applicable to the Project for disclosure in this report.

Horizonte Minerals Plc Araguaia Nickel Project Technical Report
Final November 2018 Page 317 of 342
24 OTHER RELEVANT DATA AND INFORMATION
24.1 Implementation plan
The Project is a cost driven project that incorporates a wide range of complexities, including:
• Semi-remote location
• Weather restrictions
• Limited communication and infrastructure (despite limited infrastructure around the site, several similar projects have been implemented close to the project site in the last few years, which is positive for the project)
• Complex multidiscipline concurrent site developments (e.g. roads, powerline, water line, water dam, mine, Process Plant, etc.).
The project execution will follow an EPCM approach for the two distinct construction phases:
• Phase 1 – Site Preparation. This includes early works, initial infrastructure development and procurement activities.
• Phase 2 – Plant Implementation.
During the site preparation and development, the prime activities will include the construction of a process plant and further development of associated infrastructure scope.
24.1.1 Strategy
Engineering, procurement and project management will be conducted from an HZM Project office. All work packages will be coordinated from the Project office.
Site management and all construction activities will be conducted from a temporary site office constructed at the site near the entrance to the process plant. Area specific sub-offices (e.g. mine) may be developed as the need develops. To support the site preparation program in the implementation schedule, the development of the temporary construction facilities has a high level of importance. A construction camp will be established at the site of the slag storage facility. No permanent camp will be established for the Project as operational labour will be sourced from local municipalities.
Permanent facilities such as administrative offices, medical centre, fire protection building, warehouse and maintenance shop will be implemented during the site preparation phase with aim to be used as EPCM offices and construction warehouse (specially for bulk materials and equipment)
24.1.2 Project drivers
The main Project drivers are:
• Safe execution resulting in zero harm
• Economical and practical solutions – fit for purpose with no over-engineering, tried and tested processes
• Utilisation of local labour resources to the maximum extent practical
• Schedule
• Quality design and effective construction techniques
• Environmental protection.
24.1.3 General
The implementation plan study prepared by Ausenco, addresses the following:
• Engineering (early works, detailed design and critical engineering schedule activities)

Horizonte Minerals Plc Araguaia Nickel Project Technical Report
Final November 2018 Page 318 of 342
• Procurement strategy
• Inspection
• Traffic and logistics
• Estimated construction quantities
• Materials management
• Contracting strategy and contractor interface management
• Construction management and programme
• Temporary and permanent construction facilities
• Pre-commissioning, commissioning and handover
• Operational readiness, including spare parts inventory model, planned maintenance procedures and training
• Project staffing
24.1.4 Project schedule
The preliminary implementation schedule, with key milestones is shown Table 24-1. Full implementation is expected to start in mid-2019, pending authorisation from the HZM Board of Directors and the receipt of Installation Licence (LI); however, early works engineering and procurement activities will commence as soon as possible to support procurement of long-lead equipment, including the dryer, kiln, furnace, and ladle refining. The development of the earthworks detailed design to support the award of early works site contracts will also occur. The schedule is constrained by the receipt of one principle permit, the LI, which is required to commence site-based construction.
Table 24-1 Key milestones
Milestone Date
Preliminary Licence (LP) Environmental (GHG) Issued
Offsite roads and bridges upgrade complete TBC
Project full funding 03-May-2019
Award contracts for Long Lead Components 28-Aug-2019
Installation Licence (LI) permits start of construction Q4 2018 -Q1 2019
Licence to Operate (LO) 03-Sep-2019
Powerline construction complete (by others) 28-Oct-2019
Earth works construction complete 11-Feb-2020
Area 3100 Mechanical Complete Transfer Care, Custody and Control 14-Apr-2021
Area 3500 Mechanical Complete Transfer Care, Custody and Control 28-Jul-2021
Area 3600 Mechanical Complete Transfer Care, Custody and Control 02-Aug-2021
Area 6000 Mechanical Complete Transfer Care, Custody and Control 10-Aug-2021
Area 4100 Mechanical Complete Transfer Care, Custody and Control 12-Aug-2021
Area 4300 Mechanical Complete Transfer Care, Custody and Control 16-Jul-2021
Area 4200 Mechanical Complete Transfer Care, Custody and Control 25-Aug-2021
Are 5000 Mechanical Complete Transfer Care, Custody and Control 09-Aug-2021
First Metal 10-Jan-2022
The activity durations included in the implementation schedule are based on the following:
• Direct field labour man-hours from the estimate
• The build-up of work crews by trade from local Brazilian contractors. Contractors’ proposals have included permitted shift hours for electromechanical and civil installation packages.

Horizonte Minerals Plc Araguaia Nickel Project Technical Report
Final November 2018 Page 319 of 342
Equipment delivery dates are based on quotations received from vendors.
Where quotations do not include delivery to site, shipping and customs durations have been added and are based on information provided by the project team. Equipment outside of Brazil is estimated to take six to 12 weeks to ship. Shipments within Brazil are estimated to take four weeks. All areas except utilities (6000) are assumed to have equipment coming from outside Brazil and, hence, have longer delivery times and customs time included.
In the Ausenco implementation schedule, the critical path centres on the procurement of the long-lead items with sufficient engineering received from vendors to define the foundation designs, installation of furnace piles and foundations and delivery and installation of the furnace. It is imperative that the purchase orders for the long-lead items be placed upon HZM sanction of full funding.
24.1.5 Recommendations
Recommendations and opportunities as part of the implementation plan include:
• Dryer, kiln, furnace, ladle refinery plant lead times. These packages range from 12 to 16 months from receipt of order to deliver last pieces of equipment. Bearing in mind the complexity and cost of these packages and the necessary time to properly bid and evaluate this equipment, engineering needs to start as soon as project is approved by HZM
• Construction management. Construction of the Araguaia Nickel Project will be performed by contractors under the direction of the EPCM Construction management team. . The Construction Management team will administer all site-based construction contracts. Further details of service supply responsibility should be developed during the next phase of project development. To achieve a successful civil/earthworks program, it is imperative that the water diversion and construction area water management be carefully planned and implemented early. The control of naturally occurring water and the resulting runoff is the key to success during the first year of construction activities. The schedule was developed to reflect the installation of both permanent and temporary water control systems before any new area or specific platform is developed.
• Piping – off-site pre-fabrication. There exists an opportunity to move a large portion of the piping fabrication work off site through the utilisation of contractor supplied mobile pipe fabrication facilities located nearby. During the next phase of Project development, this option will need to be explored.
• Predictive maintenance platform. HZM will consider and implement a predictive maintenance platform for the process plant. Such platform aims to reduce maintenance costs providing more effective maintenance pattern.
• Spare parts inventory model. As part of the engineering, vendors of the equipment to be supplied would be asked to provide spare part requirement lists.
24.2 Other relevant information
The authors and Qualified Persons are unaware of any other data or information that would be relevant to this Technical Report.

Horizonte Minerals Plc Araguaia Nickel Project Technical Report
Final November 2018 Page 320 of 342
25 INTERPRETATION AND CONCLUSIONS
The FS includes key data that has optimised the Project and has increased the confidence of the Project by including:
• Reserves from the VDS deposit of ANN
• A test pit that was completed in May 2017
• Metallurgical testwork data from ANS ore used in the pilot plant results in Q3 2015
• Drilling results of Q2 2015 of infill drilling program
• The progression of environmental licence permits
• Updated capex and opex inputs.
25.1 Conclusions
The ANP compares favourably with other producing nickel laterite operations, specifically, that:
• At a nickel price of US$14,000/t, the project economics are robust showing an internal rate of return (IRR) of over 20%, an NPV8 of over US$401 million and a payback of 4.2 years on initial capital of US$443.1 million
• The C1 costs are US$8,193/t Ni
• The Measured and Indicated Mineral Resource is over 118 Mt at 1.3% Ni
• The Project capital cost estimate was developed to AACE class 3 with an accuracy range between -10% and +15% providing a high level of confidence for the economics.
The conclusions for the study are derived from the individual detailed study sections, which are detailed below; however, overall it is concluded that:
• The geology is well understood, enabling good sample selection for testwork, which, in turn, gave good predictability and recovery in the process plant pilot campaign
• Trial mining has demonstrated the integrity of the resource model and underpins the conversion of the Mineral Resources to Mineral Reserves as well as assumptions with respect to grade control, geotechnical factors and operability
• There are sufficient Mineral Resources, well supported by the data, to convert to Mineral Reserves to feed the processing plant for in excess or 30 years at a rate of 900 kt/a
• The metallurgical testing, METSIM modelling and pilot plant program have demonstrated that the ANP ore performs well in the selected RKEF process route and will produce FeNi (at 30% Ni) to the nameplate design capacity
• Social and environmental impacts of the study have been assessed and appropriate management plans developed to mitigate them and ensure compliance with Brazilian regulations and IFC standards
• There is adequate water and power in the region to supply the process plant
• Permitting for the Project is advanced and is on target for construction to commence in 2019 and mining in 2021
• The Project economics are both robust and are well supported by detailed engineering, vendor quotes and cost estimates.

Horizonte Minerals Plc Araguaia Nickel Project Technical Report
Final November 2018 Page 321 of 342
25.1.1 Mineral Resources
Core drilling programs, including surveying, logging, sampling, assaying, quality assurance/quality control, and density measurements have been undertaken in accordance with HZM Standard Operating Procedures (SOPs) and reviewed by Competent/Qualified Persons. Mineral Resource estimates have been conducted in accordance with industry practice using accepted methods and reviewed by Competent/Qualified Persons.
The Mineral Resource for the project is well supported by the data. Trial mining has demonstrated that the Mineral Resource estimate reconciles with the mined material.
25.1.2 Metallurgical testing and process design
The integrated RKEF pilot campaign safely and successfully processed a total of 119 wet tonnes of ANS ore, which was considered representative. The two phases of the pilot plant campaign produced high-quality FeNi on a continuous and sustained basis to commercial specification.
This program combined with other metallurgical testing and with METSIM modelling demonstrated the commercial viability of the process route and was used to develop the process design criteria which were used for the design of the process pant and for the specification of mechanical equipment.
25.1.3 Mineral Reserves
The mine can safely and economically supply the necessary processing capacity in all seasons by mining more intensively in the dry season to build up stockpiles which will form the basis of mill feed in the wet season where mining is limited to one pit (Pequizeiro).
The mine is able to supply high nickel grades in the early mine life, reaching 2% in production year 2. The nickel grade is above 1.8% for the majority of the first 10 years of production and reduces to average approximately 1.6% Ni for the remaining mine life.
Trial mining demonstrated that the chosen grade control strategy would be appropriate to selectively mine and stockpile the 10 material types that are defined in the blending strategy. The trial mining also confirmed the geotechnical, mineability and trafficability assumptions that underpin the mining operation.
25.1.4 Project economics
The economic analysis, which is underpinned by FS level capital and operating costs estimates, demonstrates that FS presents a positive economic case for the development and execution of the ANP using a nickel price of US$14,000/t for the life of the Project. In view of the predicted strengthening of the commodity price, the case presented is regarded as robust with significant upside.
25.1.5 Hydrology
On the basis of the data used, the water balance suggests a low risk to the Project from water availability. Analysis of climate change risks in this region suggests some variability in rainfall intensity but overall the changes are considered unlikely to present a significant risk to Project water availability.
25.1.6 Hydrogeology
The outcomes of the hydrogeology study conclude that:
• Dewatering will be required, on a progressive basis in accordance with the mine plan.
• In situations where dewatering bores have proven ineffective in draining fine-grained rocks, drainage may be successfully achieved through other means, such as the use of horizontal drain holes.
• Based on groundwater levels pre-mining, it is estimated that the final pit water level will be approximately 5 m below current ground level. The data suggests that pit lakes will reach their final water level elevations in two to seven years following completion of mining.

Horizonte Minerals Plc Araguaia Nickel Project Technical Report
Final November 2018 Page 322 of 342
25.1.7 Acid rock drainage and geochemistry
The following is noted:
• Acid rock drainage. On the basis of the results of testwork, the risk of acid rock drainage and/or metal leaching is considered to be low.
• Water geochemistry. Water to be used by the mine includes river water, groundwater, surface runoff, rainwater, slag pile runoff/leachate, and process water and each has a different chemical composition. The water quality in the water cooling dam was modelled showing that the geochemical quality of the water is largely dependent upon the quality of the plant’s return water.
• Slag geochemistry. The classification of slag as inert and non-dangerous, as demonstrated in tests by the SGS Geosol laboratory is consistent with Brazilian ABNT NBR 10004:2004 for solid waste. This also meets international standards classifications for waste.
25.1.8 Infrastructure and logistics
The Project is near The Carajás mineral province (Mining District), which is the main centre of mining activity in the Pará State and is well served by roads, power and ports. For the project to proceed some infrastructure upgrades, are required including:
• Upgrade of the road surface, culverts and bridges of 22.5 km of state road PA-449 and upgrade 17.5 km of a local road from PA-449 to site
• Construction of a 11.1 km of access road and water pipeline and barge pumps from the Arraias River to the water cooling dam near the plant
• Construction of a 122 km powerline from Xinguara II substation to the plant site
• Construction of a 1.82 Mm3 water cooling dam for the plant along with pump and pipework to the plant from the dam.
• In Year 8 of the Project, upgrade the 152 km of road between ANS and ANN.
The logistics study determined that the port of Ville do Conde, near Belém, offered the best logistic solution for both coal and FeNi product transport. The study examined the supply of all other consumables for the operation and determined that their availability in the region and in Brazil would be adequate to serve the needs of the Project.
25.1.9 Environment
The environmental impacts of the Project have been assessed along with appropriate management plans so that the Project minimises any potential negative impacts and complies with Brazilian regulations and meets IFC standards. The areas considered in the environmental study and management plans include:
• Air quality and greenhouse gas
• Noise
• Soil
• Surface and groundwater
• Visual impact
• Waste
• Protected areas and habitats.
25.1.10 Social
HZM has completed studies on the social impact of the Project. The studies resulted in management plans that address the following potential social impacts:
• In-migration

Horizonte Minerals Plc Araguaia Nickel Project Technical Report
Final November 2018 Page 323 of 342
• Role of the project in the local context
• Mining operators
• Community engagement
• Vulnerability
• Resettlement and livelihoods restoration
• Water as a key ecosystem service
• Mine closure.
The management plans will minimise and negative impacts on the social environment and are consistent with industry standards in Brazil and they will form part of HZM’s social engagement policy as the ANP moves into construction and operation.
25.1.11 Permitting
ANP’s permit process is well advanced and the Project is on schedule towards the construction-ready phase. All permits are either approved or anticipated for approval within the planned project schedule.
25.2 Risks
An integrated risk workshop for the project was undertaken as well as two hazard identification workshops, one run by ERM, the social and environment project leads, and one run by Ausenco, the process lead.
25.2.1 Risk workshop
A project risk workshop was held on July 4, 2018 and attended by 15 stakeholders. The workshop identified a number of risks for each area (230 in total). Each identified risk was evaluated, ranked, and a mitigation strategy developed then re-ranked after mitigation. This process resulted in a number of risks that were categorised as “high” – prior to mitigation (Figure 25-1).
Figure 25-1 Pre-mitigation "High" risk areas
The largest number of “high” pre-mitigation risks was identified in the ore feed, process and metallurgy area. social and environment, had the second largest number of “high risks”, followed by tenure and licensing.

Horizonte Minerals Plc Araguaia Nickel Project Technical Report
Final November 2018 Page 324 of 342
Process and metallurgy – “high” risks
The process and metallurgy risks of significance were concerned with consistency of feed to the process and the operating range of the furnace. They are discussed below.
1) Ore feed
Most of the significant processing risks are derived from the ability of the operation to provide consistent ore feed to the process plant within the defined ranges of the key chemical parameter. There are two aspects to these risks:
• Ore feed and blending risk. This risk reflects the ability of the mining operations to identify and produce an appropriate blend of the various ore compositions required for a consistent plant feed. Management of this risk focusses on the means to identify ore composition well ahead of mining, planning the mining of the specific ore properties, effective stockpiling of the various identified properties, and then developing and executing a blending strategy based on the available ore to create plant feed that meets the requirements of the plant. This challenge is faced by all operating nickel laterite mines in the world.
• Reacting to anomalies plant feed risk. This risk reflects the ability of the operation to identify anomalous feed and its ability to react to it in timely fashion so that process integrity is retained.
These are normal risks for RKEF plants that are mitigated by a rigorous well planned out mine to mill strategy. Such a strategy was developed for the Project and includes grade control drilling, long and short-term mine planning, dig plans, stockpiling strategies, stockpile sampling and assays, as well as sampling, assaying and homogenising as part of the process plant operations. The strategy developed is considered best practice and it was deemed that it adequately mitigated this risk.
2) Furnace run-out
• Insufficient furnace side wall cooling. This risk reflects the high superheat of the Araguaia ore compared to some other laterites. The calculated superheat defines the intensity of the intensive sidewall cooling designed into the furnace. The risk is mitigated by ensuring there is sufficient side wall cooling (~ 50 kW/m2) capability designed into the furnace. The temperature at which the furnace needs to be operated must ensure that the FeNi can be tapped at least at 40 to 50oC above its melting point (liquidus temperature) to minimise skull formation. The liquidus of the slag resulting from smelting the Araguaia laterite ore is significantly lower than that of the operating temperature because of its composition comprising a SiO2/MgO ratio of around 2.6 together with an Al2O3 content of close to 7%. This results in the slag having a high superheat temperature of between 150 and 200oC compared with many other laterites with temperatures less than 100oC.
• Furnace loss of cooling. The furnace would be critically damaged if cooling is lost. Cooling is provided by high volumes of water flowing around the copper coolers. The water flow is maintained by large electric pumps which would stop if power failed or there was a mechanical failure. The mitigation for this risk comprises redundant pumping systems and emergency power for pumping. These systems have been designed into the Araguaia plant.
Supply chain
Due to the dependency of the project on a consistent supply of specialist consumables as well as coal, power, and HFO some of the project risks to the supply chain were examined. These were specifically the risk associated with:
• Sabotage or other criminal activity
• Natural events causing loss of critical infrastructure – floods/slides/quakes
• Market events – critical supply shortages of things like coal, HFO, and
• Concerted action by workers – truckers; port workers etc.
The mitigations in place for these events include:
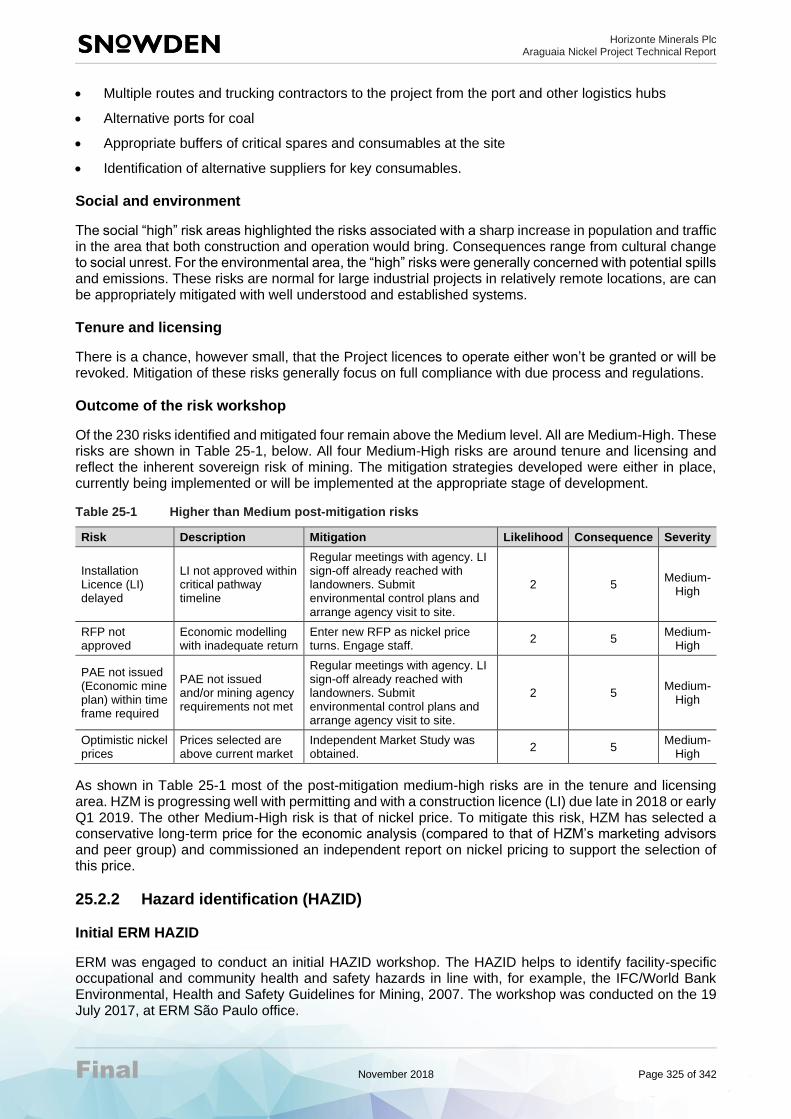
Horizonte Minerals Plc Araguaia Nickel Project Technical Report
Final November 2018 Page 325 of 342
• Multiple routes and trucking contractors to the project from the port and other logistics hubs
• Alternative ports for coal
• Appropriate buffers of critical spares and consumables at the site
• Identification of alternative suppliers for key consumables.
Social and environment
The social “high” risk areas highlighted the risks associated with a sharp increase in population and traffic in the area that both construction and operation would bring. Consequences range from cultural change to social unrest. For the environmental area, the “high” risks were generally concerned with potential spills and emissions. These risks are normal for large industrial projects in relatively remote locations, are can be appropriately mitigated with well understood and established systems.
Tenure and licensing
There is a chance, however small, that the Project licences to operate either won’t be granted or will be revoked. Mitigation of these risks generally focus on full compliance with due process and regulations.
Outcome of the risk workshop
Of the 230 risks identified and mitigated four remain above the Medium level. All are Medium-High. These risks are shown in Table 25-1, below. All four Medium-High risks are around tenure and licensing and reflect the inherent sovereign risk of mining. The mitigation strategies developed were either in place, currently being implemented or will be implemented at the appropriate stage of development.
Table 25-1 Higher than Medium post-mitigation risks
Risk Description Mitigation Likelihood Consequence Severity
Installation Licence (LI) delayed
LI not approved within critical pathway timeline
Regular meetings with agency. LI sign-off already reached with landowners. Submit environmental control plans and arrange agency visit to site.
2 5 Medium-
High
RFP not approved
Economic modelling with inadequate return
Enter new RFP as nickel price turns. Engage staff.
2 5 Medium-
High
PAE not issued (Economic mine plan) within time frame required
PAE not issued and/or mining agency requirements not met
Regular meetings with agency. LI sign-off already reached with landowners. Submit environmental control plans and arrange agency visit to site.
2 5 Medium-
High
Optimistic nickel prices
Prices selected are above current market
Independent Market Study was obtained.
2 5 Medium-
High
As shown in Table 25-1 most of the post-mitigation medium-high risks are in the tenure and licensing area. HZM is progressing well with permitting and with a construction licence (LI) due late in 2018 or early Q1 2019. The other Medium-High risk is that of nickel price. To mitigate this risk, HZM has selected a conservative long-term price for the economic analysis (compared to that of HZM’s marketing advisors and peer group) and commissioned an independent report on nickel pricing to support the selection of this price.
25.2.2 Hazard identification (HAZID)
Initial ERM HAZID
ERM was engaged to conduct an initial HAZID workshop. The HAZID helps to identify facility-specific occupational and community health and safety hazards in line with, for example, the IFC/World Bank Environmental, Health and Safety Guidelines for Mining, 2007. The workshop was conducted on the 19 July 2017, at ERM São Paulo office.

Horizonte Minerals Plc Araguaia Nickel Project Technical Report
Final November 2018 Page 326 of 342
The workshop identified 106 potentially harmful events across 22 areas and developed 236 controls. It is noted that harmful events identified that were determined to present no harmful consequence, are not included in this summary.
Ausenco advanced HAZID
A second advanced HAZID workshop was undertaken towards the final stages of the FS on August 23, 2018 in the Vancouver offices of Ausenco facilitated by Ausenco.
The workshop built on the initial ERM HAZID and identified 182 potentially harmful events across 23 areas of operations. A summary is shown in Figure 25-2. It is noted that harmful events identified that were determined to present no harmful consequence, are not included in this summary.
Figure 25-2 Events by area, impact along with the number of mitigations identified
Outcomes of HAZID
The two HAZID exercises were beneficial to project designers in that they identified no critical safety issues in the design and proposed operation of the plant. Prior to the detailed design stage it is recommended that this exercise is repeated with the team that will execute the Project. It is also recommended that prior to commencement of operations a HAZOP exercise be embarked on to identify and mitigate the hazards associated with operations; this is standard practice in moving to the operational readiness phase.
25.3 Opportunities
This FS demonstrates that the Project is technically and economically robust and should be progressed to financing, detailed design and construction. However, during the course of developing the FS a number of opportunities have presented themselves. Some of the higher potential opportunities are discussed below.

Horizonte Minerals Plc Araguaia Nickel Project Technical Report
Final November 2018 Page 327 of 342
25.3.1 Opportunities to increase the value of the FS Base Case
Utilisation of slag for other industries
HZM has partnered with SENAI (Brazilian Innovation Technology Centre) in the Pará State to study potential options for slag re-use, using samples of Araguaia slag produced in the 2015 pilot plant campaign from Araguaia bulk samples. Whilst studies are still in progress, early results indicate a good potential for the application of slag in the cement industry and also for road paving. Economic viability studies and potential quantities for slag re-use will be further investigated as the Project progresses.
Direct tipping from mine to ROM hopper
It is envisaged that after production commences the grade control processes put in place prior to mining will be viewed as sufficient to predict the mined grade (in some cases) and that material may be direct tipped from the mine face directly to the plant feed bin. This will result in significant savings in mining costs by reducing rehandle.
Backfilling waste into old pits
The FS assumes that all waste is stockpiled outside the pits. This is because some mineralised material remains in the pit bottoms (considered un-economic under the FS assumptions). Such waste stockpiles consume land which incurs costs for acquisition and clearing and in some cases requiring long hauls from the pit. As production commences it is envisaged that permission will be granted by the regulator to backfill pits with low grade waste. This will result in significant cost savings over the life of the mine. No marginal-grade material will be backfilled as this will be retained in nickel-graded stockpiles for any potential future exploitation.
Mining cost reductions
The FS developed mining costs are based on proposals from contract mining operators in Brazil. These proposals were solicited using the mine schedule and with no negotiation as there was no imminent contract. It has been recognised that when HZM is in position to award a large mining contract that negotiations should result in significant mining unit costs savings.
Inclusion of additional Mineral Resources owned by HZM in overall project area
HZM owns significant additional Mineral Resources (to those utilised in the FS) within trucking distance of the ANP all of which are in various stages of development. Section 14.11 discloses some of those resources. Other Mineral Resources have been disclosed in other Technical Reports, some are still in early stages of development. These resources may be used to extend the life of the plant for the Project or may be used to upgrade feed when and if they are developed. The resources are summarised in Table 25-2.

Horizonte Minerals Plc Araguaia Nickel Project Technical Report
Final November 2018 Page 328 of 342
Table 25-2 Additional resource available for the Project
Resource Name
CIM classification
Mineral Resource size (Mt)**
Cut-off used (Ni%)
Average nickel
grade (%)
Average cobalt
grade (%)
Report published
Issuer
PQNW, Lontra, Oito, Raimundo
Inferred 19.72 0.90 1.17 0.064 This report HZM
Pau Preto Inferred 13.63 1.0 1.38 0.081 2008 HZM- Xstrata -
Historical
Serra do Tapa
Measured + Indicated
54.3 1.0 1.45 0.055 2008 HZM- Xstrata -
Historical
Inferred 2.6 1.0 1.36 0.055 2008 HZM- Xstrata -
Historical
Vermelho
Measured + Indicated
167.8 0.9NiEq 1.01 0.06 2018 HZM – Vale -
Historical
Inferred 2.8 0.9NiEq 0.94 0.05 2018 HZM - Vale -
Historical
Note: ** Includes Limonite, Saprolite and Transition
25.3.2 Addition of a second RKEF line (Stage 2 Expansion)
The FS ore feed rate of 900 kt/a is based on a single line RKEF plant (Stage 1). This size plant represents the optimal capacity for an achievable capital cost for project financing for a single project junior development company. However, the Stage 1 plant capacity underutilises the significant Mineral Resource that HZM has under its control within the project area (~119 Mt Measured and Indicated grading at 1.27% Ni, see Section 14 of this Techincal Report). In the FS the cut-off grade is elevated to 1.4% and represents a “high-grade” option. The marginal cut-off grade for the Project is closer to 1.0% Ni. This means that there is a significant quantity of potentially economic material that would not be mined or processed in the current Stage 1 FS schedule. Accordingly, the opportunity contemplated here is that the Stage 1 production scenario (the FS Base Case) that produces at an initial production level 14,500 t/a of nickel, and that the Stage 2 expansion is implemented as the Project starts generating cash flows, increasing total production to 29,000 t/a Nickel.
25.3.3 Utilisation of the limonite resources at ANP
As part of the current mining schedule the upper 3 to 4 meters of the laterite profile (limonite material) will be mined and stockpiled in nickel graded piles for future use as it is not possible to process this material through the current RKEF flow sheet. A significant resource of high grade limonite is available across the project area, there may be the future possibility of implementing an acid leach circuit to recover the nickel and cobalt from this limonite material that can either be sold as mixed nickel-cobalt hydroxide precipitate (MHP) product or added into the refining process to produce additional nickel units. The current limonite resource for the ANP is 20.7 Mt grading 1.13% nickel and 0.12% cobalt (0.9% nickel cut off).

Horizonte Minerals Plc Araguaia Nickel Project Technical Report
Final November 2018 Page 329 of 342
26 RECOMMENDATIONS
It is recommended that HZM proceed to project financing in order to fund early works, detailed design, and construction of ANP.
There were several recommendations developed in the FS that cover all project stages from detailed design to operation. Key recommendations include:
• Early works packages should be executed as soon as possible, with the following items:
− Upgrade road access to the site to enable commencement of construction activities
− Establishment of temporary power to the site for construction
− Specification and vendor selection for EPCM or EPC supplier
− Detailed engineering for site preparation and civil works (earthworks, drainage, temporary infrastructure, etc.)
− Specification for long-lead items and commencement of vendor engagement.
• Continue and intensify social engagement programs as project activities ramp-up
• Continue environment monitoring programs and developing environment management plans
• Complete construction permitting for ANS and continue permitting for ANN
• Undertake an additional HAZID on the process plant prior to detailed design
• Undertake hazard and operability study (HAZOP) prior to commencing operations
• Engage with mining contractors after project financing in order to refine contractor estimates and mining operations strategies and procedures
• Undertake additional ore characterisation and agglomeration testing
• Continue updating the hydrological model with additional river, catchment, and rainfall data.
26.1 Recommendations prior to commencing operations
The following recommendations are relevant to detailed design, pre-production and the construction phase of the Project.
26.1.1 Project implementation
Specific early works packages are executed so that commissioning delays are not experienced, including:
• Upgrade road access to the site
• Establishment of temporary power for construction of the site
• Specification and vendor selection for EPCM or EPC supplier
• Detailed engineering for site preparation and civil works (earthworks, drainage, temporary infrastructure, etc.)
• Site preparation engineering (i.e. earthworks in process plant, site access, water dam, temporary facilities, vendor selection, and contract formation
• Long lead items specification, vendor selection and contract award should be expedited for the dryer, kiln, electric furnace and ladle refining furnace.
26.1.2 Mine geotechnical
Any future diamond drilling must include collecting core samples for laboratory testing using multi-stage consolidated undrained Triaxial testing methods, with pore water pressure measurement. This will improve the definition of the shear strength parameters of the soil-like domains.

Horizonte Minerals Plc Araguaia Nickel Project Technical Report
Final November 2018 Page 330 of 342
26.1.3 Mining
The following activities should be completed prior to production:
• Contractor engagement: Further engagement with the mining contractors on project scope and budget pricing to reduce variability in costs between the contractors. This should include definition of a preferred mining operations scenario.
• Grade control drilling: Drilling of the first 900 kt of ore should be completed to provide confidence to planning of ore and sheeting requirements. This can be completed during the construction period.
• Detailed mine design: After the grade control drilling is completed, detailed mine designs for the first 12 months of production should be completed which should incorporate updated geotechnical and hydrogeological data.
26.1.4 Metallurgy
In terms of metallurgy the following recommendations are noted:
• Ore characterisation, which would include: 1) assess various liner materials that can be installed in hoppers and chutes to optimise material flow; 2) complete testing and develop recommendations for hopper/surge bin geometries; and 3) test the implications of time at rest in the dryer feed bin so that hang-ups and material compaction issues can be avoided.
• Agglomeration. Testing to identify key design parameters within dryer which result in the optimal agglomeration of the ore and how these contribute to the persistence of the agglomerates during calcining.
• Furnace. Examine the impact of flux additions to provide an extra degree of freedom in the control of the ROM composition and blending strategy and operation.
26.1.5 Hydrology
It is recommended that:
• A 12-month water flow monitoring program in the cooling dam catchment should be undertaken and that this is used to update the water balance.
• Water quality monitoring should be undertaken in the cooling dam catchment and for all water supplies considered in the water balance. This data should then be used to assess potential changes in water quality.
• Flow gauging on the Arraias River be enhanced to include automated measurements of at least hourly flows in order to gain a better understanding of the full flow regime and hence low flow limits which may need to be applied to the abstraction regime.
26.1.6 Permitting
Continue to engage with relevant permitting agencies with regard to applications which are already submitted, with the objective of securing approvals within Q4 2018 and Q1 2019 for ANS construction-ready permits, including:
• Mining Agency (ANM) – Economic Exploitation Plan approval
• Mining Agency (ANM) – Mine Servitude Rights approval
• Environment Agency (SEMAS) – Construction Licence (LI)
• Environment Agency (SEMAS) – Water Permit for pit dewatering
• Environment Agency (SEMAS) – Vegetation Clearance Approval (and other fauna/flora related permits)
• Environment Agency (SEMAS) – Water Pipeline Preliminary and Installation Licence.

Horizonte Minerals Plc Araguaia Nickel Project Technical Report
Final November 2018 Page 331 of 342
HZM continues to progress new permit applications in line with ANP schedule, including the Transmission Line LP and LI; and the ANN EIA RIMA, LP (environmental) and Economic Exploitation Plan (mining).
HZM implements an integrated management system in 2019 to maintain electronic registers of all licences and licence conditions. The system should enable company executives to produce real-time reports on permits and sustainability teams to have automated reminder systems for licence reporting requirements/notifications to agencies.
A review of the overall mine project schedule, including third-party gap analysis, should be conducted post publication of the FS with updates made to permitting status. HZM’s project implementation team to produce regular reports (at least monthly) on schedule and reminders for upcoming permit milestones.
26.1.7 Social
Based on the analysis of the socio-economic landscape, impacts and mitigations associated with ANP and further work to be advanced prior to construction, the following are recommended:
• In-migration: HZM should a) prioritise local inhabitants for employment to minimise and discourage in-migration of work-seekers and b) monitor levels and impacts of influx within the affected areas to enable actions to be taken if needed.
• Role of the project in the local context: HZM should consider undertaking programs that build the institutional capacity of local government to deliver social development projects as part of its community development program.
• Mining operators: HZM should choose to differentiate itself from other operators in the municipality as the “mining operator of choice”, thus helping to secure its long-term social licence to operate.
• Community engagement: Community engagement should intensify in proportion to levels of activity to manage expectations and perceptions.
• Vulnerability: Programs to upskill and build the capacity of the local workforce should be prioritised to ensure their ability to compete for jobs, especially during construction when the workforce size will be largest.
• Resettlement and livelihoods restoration: This should be completed in a manner that involves extensive consultation among project-affected persons.
• Water as a key ecosystem service: HZM drill deeper wells for those potentially impacted in the Resettlement Action Plan.
26.1.8 Environment
It is recommended that:
• HZM finalise the process of identifying environmental risks and impacts for ANN and transmission line through ANN EIA-RIMA and transmission line preliminary licence.
• To further develop HZM’s environmental management system (staffing, training, procedures and plans). This will provide the framework for implementing HZMs plans and programs.
• HZM implement social-environmental control plans (Planos de Controle Ambiental – PCAs), including ongoing monitoring to confirm potential impacts and whether mitigation measures identified are suitable. To extend these plans where necessary, including:
− Identifying suitable waste management and disposal facilities and approved collection contractors
− Adding measures for management of emissions of direct and indirect greenhouse gasses
− Reviewing measures to monitor climate risk
− Assess the need for any visual screening.
• To develop a biodiversity action plan to manage and offset impacts to natural and critical habitat.

Horizonte Minerals Plc Araguaia Nickel Project Technical Report
Final November 2018 Page 332 of 342
26.1.9 Risk and safety
As a consequence of the risk workshop and the two HAZID workshops, the following activities are recommended:
• A comprehensive HAZID is completed prior to commencing detailed design to identify hazards that should be mitigated as part of the design.
• Prior to commencing commissioning a HAZOP study should be completed so that operational hazards can be identified and mitigated.
• To mitigate the risks associated with ore feed, it is recommended that:
− Systems are established for the management and monitoring of ore feed to support the mine to mill process
− Strategies are developed, with appropriate resourcing, to react to anomalous ore-feed
• Stockpiles developed of critical consumables to mitigate the supply chain risk.
• Comprehensive operator training is completed, and detailed procedures are developed so that the risk of furnace run-out is appropriately mitigated.
• A comprehensive site-wide safety management system is put in place and all site personnel are trained in its use.
26.2 Operational recommendations
The following recommendations should be implemented when the Project transitions to the operational phase:
• Mine geotechnical. Slope design recommendations have been made for all the deposits at the ANP based on the designs used for the FS. When final production pit designs have been generated it is recommended these undergo further geotechnical assessment.
• Acid rock drainage. It is recommended that as mining exposes any geological units/materials with different compositions to those evaluated in this work, samples of these materials should be scrutinised for ARD/ML risk using a process consistent with the approach taken here.
• Permitting. It is recommended that HZM maintains:
− Exploration Licences (mining and environmental) through reporting to ANM/SEMAS as per conditions of each licence and request renewal of Operational Licence for exploration at SEMAS no later than 120 days prior to expiry to ensure licences remain current
− Municipal Licences, registrations at agencies/industry bodies, certificates etc., to ensure HZM remains compliant with local and regional jurisdictions
− Monthly reporting of sustainability objectives to Company executives, including permit register and notifications registers.
• Risk and safety. Safety monitoring and safety programs should be a part of everyday operations. HZM should embrace a “safety before everything” work culture at the site. These programs should be supported by appropriate systems and resources.
Horizonte Minerals Plc Araguaia Nickel Project Technical Report
Final November 2018 Page 333 of 342
27 REFERENCES
Primary documents associated with this Technical Report are referenced below.
27.1 General, geology and mining (sections 4 to 12 and 14 to 16)
• AMEC (2008). Scoping Study, stage gate report, Xstrata Nickel Araguaia Project, Brazil.
• Audet, M.A., Osmond, J.C., Pilcher, B., Mitchell, A., and Allen, A. (2012a). Geology and Mineral Resources of the Araguaia Nickel Project, Brazil, NI 43-101 Technical Report for Horizonte Minerals prepared by Wardell Armstrong. 23 February 2012. Ref ZT61-0947 MM640.
• Barry, J.P. (2006). Technical Report Araguaia Nickel Exploration Project, Pará State, Brazil. NI 43-101 Technical Report prepared by Irus Consulting for Lara Exploration Limited and Pan Brazilian Mineracao Ltda. 16 February 2006.
• Bennell, M. (2010). Technical Report on the Araguaia Nickel Exploration Project, Pará State, Brazil. NI 43-101 Technical Report for Lara Exploration Limited.
• Brand, N.W., Butt, C.R.M., and Elias, M. (1996). Classification and features of nickel laterites. Paper submitted to the Jubilee Volume of the Australian Geological Survey Organisation.
• CIM (2014). CIM Definition Standards for Mineral Resources and Mineral Reserves.
• DMP (1999). Geotechnical Considerations in Open Pit Mines – Guideline. Department of Minerals and Energy, State of Western Australia dated August 1999. ISBN 0 7309 7807 9.
• Duncan J.M., Wright S.G. (2005). Soil strength and slope stability, John Willy and Sons Inc., Hoboken, NJ, USA.
• EC Terra (2011). Report on the structural mapping study of the Araguaia Niquel project, Para, Brazil. Report submitted to HZM dated May 2011.
• ERM (2018). https://www.usgs.gov/centers/wisconsin-water-science-center/science/swb-modified-thornthwaite-mather-soil-water-balance?qt-science_center_objects=1#qt-science_center_objects.
• Guibal, D. (1987). Recoverable Reserves Estimation in an Australian gold project, in Geostatistical Case Studies, Matheron G., and Armstrong M. (eds) pp149-168, (D. Reidel Publishing).
• Hoek E., Kaiser P.K., and Bawden, W.F. (1995). Support of underground excavation in rock, Balkema, Rotterdam.
• Hoek, E., and Karzulovic, A. (2000). “Rock mass properties for surface mines”, in Slope Stability for Surface Mines edited by Hustrulid, W., McCarter, M. and Van Zyl, D. Society for Mining Metallurgy and Exploration Inc (SME) publisher.
• Horizonte Minerals Plc nickel laterite field procedures (2012); memorandums and internal documents (2014, 2015 and 2016); request for proposal for Araguaia Nickel Project – Feasibility Study (2016).
• INMET (2018) – Instituto Nacional de Meteorologia, www.inmet.gov.br.
• Integratio (2013). Scenario assessment, risk analysis and stakeholders mapping, April 2013 [English translation; original compiled in Portuguese].
• JORC (2012). The Australasian Code for Reporting of Exploration Results, Mineral Resources and Ore Reserves, The JORC Code 2012 Edition, the Joint Ore Reserves Committee of the Australasian Institute of Mining and Metallurgy, Australian Institute of Geoscientists and Mineral Council of Australia (JORC).
• Lara (2009). Lara Exploration Limited nickel laterite exploration results.
• Marinos, P., and Hoek, E. (2000). GSI A geologically friendly tool for rock mass strength estimation. Proc. GeoEng 2000.
• Osmond (2015). NI 43-101 Technical Report on the Vale dos Sonhos Project. Prepared for Horizonte Minerals Plc.

Horizonte Minerals Plc Araguaia Nickel Project Technical Report
Final November 2018 Page 334 of 342
• Read and Stacey (2009). Guidelines for open pit slope design. CSIRO Publishing.
• Ryan, T.M., and Pryor, P.R. (2000). Designing catch benches and inter-ramp slopes. In Slope Stability in Surface Mining (eds WA Hustrulid, MK McCarter & DJA Van Zyl), pp. 27-38. SME, Colorado.
• SGS (2011). SGS Canada Inc. – An Investigation by High Definition Mineralogy into the Mineralogical Characteristics of Four Ni-Laterite Horizons from the Araguaia Deposit, Brazil prepared for Horizonte Minerals Plc.
• SGS (2013). SGS Canada Inc., documentation prepared for Horizonte Minerals
• SGS (2015). SGS Canada Inc., documentation prepared for Horizonte Minerals
• Snowden internal memorandum (2007), workshop notes (2012), geotechnical appraisal (2013), Phase 3 Mineral Resource Estimates (2013), NI43-101 Technical Report – Prefeasibility Study (2014), NI43-101 Technical Report – Mineral Resource estimate (2016), site visit report (2017).
• Stark T.D., Hangseok C., McCone S. (2005). Drained shear strength parameters for analysis of landslides, Jour. Geotech. And Env. Eng. ASCE, May 2005., 575-588.
• Wardell (2012). Horizonte Minerals, geology and mineral resources of the Araguaia Nickel project, Brazil, NI 43 101 Technical report. Report submitted to HZM dated 23 February 2012.
27.2 Testwork and process plant methodology (Section 13 and 17)
• Ausenco (2018). Internal Ausenco RKEF Metsim model (confidential)
• China ENFI Engineering Corp. (2018). Five documents - S/M ratio in Horizonte Araguaia Nickel Project; power requirements for furnace, refining station and metal shotting system; process description for the furnace system and the refining system; unit consumption for operating of furnace system and refining system; datasheets of smelting & refining, Z1642-3.1.008-010_1
• China ENFI Engineering Corp. (2018). Process description for the furnace system and refining system, Z1642-3.1.008-011_1
• Dalvi, A., and others (2004). The past and the future of nickel laterites (PDAC 2004)
• Eramet (2018). Eramet SLN 25 ferronickel shot specifications
• Horizonte Minerals Plc (2012 to 2016). Ontario’s ambient air quality criteria (2012); Araguaia Project metallurgical plant process description (2013); IGEO PFS environmental design criteria (2014); NI 43-101 Technical Report Prefeasibility Study for the Araguaia Project (2016)
• Horizonte Minerals Plc (2017). Communique, presentations, emails, workshops and notes regarding oil analysis; coal conversion; reduction kiln design specification; smelters; Araguaia Project feed chemistry by quarter.xlsx; design review register ; dust management study; feed schedule by year (VDS delayed to year 9).xlsx; fire protection specifications; free moisture estimate; FS Metsim model: RKEF-FS coal configuration; PDCs; EF feed parameters; UHT shotting; water treatment specification.
• Horizonte Minerals Plc (2018). Communique, presentations, emails, workshops and notes regarding product coal specification; kiln specification; EF design specification; NI 43-101 Feasibility Study basis of design; coal analysis; crushers; dryer design specification; environmental design criteria in this PDC document; furnace drawings and quotes; HSC heat and mass balance for electric furnace; process feed by schedule by year; process flow diagram PFS for calcining, furnace feed system, smelting; specification for porous plugs; test pit screening test results.
• Solar, M., and Mostaghel, S. (2015). Smelting of difficult laterite ores, Mineral Processing and Extractive Metallurgy 2015, Vol 124
• SGS Canada (2015). An investigation by high definition mineralogy into the mineralogical characteristics of a nickel-laterite composite sample from the Araguaia deposit in Brazil.
• The Isosceles Group (2014). Brazil Environment, Health and Safety profile and checklist 2014.

Horizonte Minerals Plc Araguaia Nickel Project Technical Report
Final November 2018 Page 335 of 342
• Voermann, N., and others (2004). Developments in furnace technology for ferro-nickel production Proceedings 10th International ferroalloys conference, February 2004
• Warner, A.E.M., Diaz, C.M., Dalvi, A.D., Mackey, P.J., and Tarasov, A.V. (2006). JOM World Nonferrous Smelter Survey, Part lll Nickel Laterite.
• Worley Parsons (2017). Recommendations by WorleyParsons in FS 2017
27.3 Infrastructure (Section 18)
• COMPASS (2013). Brazilian energy sector overview. February 2013. Technical Report.
• EPE (2013). Ten-year power supply expansion plan (PDE 2021). Obtained from http://www.epe.gov.br/pdee/forms/epeestudo.aspx. Accessed on 1 October 2013.
• Horizonte Minerals Plc (2017, 2018). Communique, presenrtations, emails, workshops and notes regarding transport, general infrastructure, site plans, bulk infrastrucutre.
• IGEO (2016). Internal report supplied to Horizonte Minerals.
• Prime (2014), in Snowden report of 2014. Horizonte Minerals Plc Araguaia Nickel Project Project No. L566 Prefeasibility Study.
27.4 Environmental, social and permitting (Section 20)
• Agencia IBGE Noticias (2017). ‘Contas Regionais: queda no PIB atinge todas as unidades da federação pela primeira vez na serie’. https://agenciadenoticias.ibge.gov.br/agencia-sala-de-imprensa/2013-agencia-de-noticias/releases/17999-contas-regionais-2015-queda-no-pib-atinge-todas-as-unidades-da-federacao-pela-primeira-vez-na-serie.html
• Census (2000 and 2010). Tabela 200, População residente, por sexo, situação e grupos de idade - Amostra - Características Gerais da População
• Census (2010). Brazilian Institute of Geography and Statistics (Instituto Brasileiro de Geografia e Estatística, IBGE) census (2010). Tabela 3324, Pessoas de 5 anos ou mais de idade, por situação do domicílio, condição de alfabetização e sexo, segundo a idade
• CNSA PA02602, (2017). http://portal.iphan.gov.br/sgpa/cnsa_detalhes.php?26590.
• Cordes, K.Y., Östensson, O., Toledano, P. (2016, 2017). Employment from mining and agricultural investments: How much myth, How much reality?, Columbia Center on Sustainable Investment, Columbia University, http://ccsi.columbia.edu/files/2016/07/Jobs-Paper-Aug-2.pdf.
• ERM (2018). https://www.usgs.gov/centers/wisconsin-water-science-center/science/swb-modified-thornthwaite-mather-soil-water-balance?qt-science_center_objects=1#qt-science_center_objects.
• GDP database (2018). ftp://ftp.ibge.gov.br/Pib_Municipios/2015/base.
• Globo (2018). https://g1.globo.com/economia/noticia/trabalho-sem-carteira-assinada-e-por-conta-propria-supera-pela-1-vez-emprego-formal-em-2017-aponta-ibge.ghtml.And associated link: https://oglobo.globo.com/economia/para-sera-unico-estado-sem-recessao-aponta-estudo-17779291.
• Government of Brazil website (2018). http://www.brasil.gov.br/governo/2009/11/governo-federal-e-formado-por-ministerios-secretarias-e-orgaos-especiais
• Human Development Indicators (Maps) (2017). http://hdr.undp.org/en/countries.
• IBGE (2017). http://cod.ibge.gov.br/2V79J
• IBGE (2018). https://cidades.ibge.gov.br
• IBGE (2018). https://g1.globo.com/economia/noticia/salario-minimo-em-2018-veja-o-valor.ghtml
• Informe mineral do estado do Pará (2017). DNPM, 2017.

Horizonte Minerals Plc Araguaia Nickel Project Technical Report
Final November 2018 Page 336 of 342
• Integratio Social & Stakeholder Assessment (2013). Section 6. Communication plan.
• Integratio Social & Stakeholder Consultants (2013). PCS, Assessment.
• Istoe Dinheiro website (2018). https://www.istoedinheiro.com.br/noticias/economia/20160310/para-contramao-crise/349402.
• Otempo.com website (2018). https://www.otempo.com.br/infogr%C3%A1ficos/riqueza-que-vem-dos-minerais-1.1863826.
• Plumlee G.S., Smith K.S., Montour M.R., Ficklin W.H., and Mosier E.L. (1999). Chapter 19. Geologic controls on the composition of natural waters and mine waters draining diverse mineral-deposit types. Reviews in Economic Geology. V6A and V6B.
• Secretaria de Transportes, Governo do Pará (2017). http://setran.pa.gov.br/doc/PELT/tranporte/arquivos/evol_futura_transp.pdf and http://setran.pa.gov.br/doc/PELT/arquivos/cap03_com_fichas.pdf
• SEMAS, 2018. Secretariat of Environment and Sustainability from Pará State – No 5074 / GEMIM / CMINA / DLA /SAGRA (2018).
• United Nations Development Program (2017) and associated Human Development Report (2016.).
• WALM (2014). The social-environmental impact assessment (EIA-RIMA) for the ANS part of the project, approved by the regulator SEMAS (Secretariat of Environment and Sustainability from Pará State) in 2016.
• Xinguara municipality official website, (2018). https://www.xinguara.pa.gov.br/capital-do-boi-gordo/.

Horizonte Minerals Plc Araguaia Nickel Project Technical Report
Final November 2018 Page 337 of 342
28 CERTIFICATES OF QUALIFIED PERSONS
Andrew F. Ross
I, Andrew F. Ross, Executive Consultant of Snowden Mining Industry Consultants Pty Ltd, Level 5, 580
Hay Street, Perth, Western Australia, do hereby certify that:
a) I am a co-author of the technical report titled “Amended NI 43-101 Technical Report Feasibility Study for the Araguaia Nickel Project Federative Republic of Brazil Project Number AU9867”, dated 30 November 2018, amended 31 March 2021, with an effective date of 30 November 2018 (the “Technical Report”) prepared for Horizonte Minerals Plc (HZM).
b) I graduated with an Honours Degree in Bachelor of Science in Geology from the University of Adelaide in 1972. In 1985 I graduated with a Master of Science degree in Mining and Exploration Geology from James Cook University of North Queensland. I am a Fellow of the Australasian Institute of Mining and Metallurgy. I have worked as a geologist almost continuously for a total of 44 years since graduation. I have been involved in resource evaluation consulting for 22 years, including resource estimation of nickel laterite deposits for at least five years.
c) I have read the definition of “Qualified Person” set out in NI 43-101 (“the Instrument”) and certify that by reason of my education, affiliation with a professional association and past relevant work experience, I fulfil the requirements of a “Qualified Person” for the purposes of the Instrument.
d) I visited the Araguaia Nickel Property from 22 to 24 November 2012.
e) I am responsible for the preparation of sections 6 (except 6.2.5), 7.1, 8, 9.1, 10.1, 11.1, 12.1, and 14 of the Technical Report, and contributed to preparation of sections 1, 2, 25 and 26 of the Technical Report.
f) I am independent of the issuer as defined in section 1.5 of the Instrument.
g) I have no prior involvement with the property that is the subject of the Technical Report apart from the co-authorship of the earlier Technical Report dated 2013.
h) I have read the Instrument and Form 43-101F1, and the Technical Report has been prepared in compliance with that instrument and form.
i) As of the effective date of this Technical Report, to the best of my knowledge, information and belief, the Technical Report contains all the scientific and technical information that is required to be disclosed to make the Technical Report not misleading.
Dated at Perth, Western Australia, on 31 March 2021
Original signed
____________________________________
Andrew F. Ross
BSc (Hons), MSc, FAusIMM
Executive Consultant
Snowden Mining Industry Consultants
Horizonte Minerals Plc Araguaia Nickel Project Technical Report
Final November 2018 Page 338 of 342
Frank Blanchfield
I, Frank Blanchfield, Principal Consultant at Snowden Mining Industry Consultants Pty Ltd, Level 5, 580
Hay Street, Perth, Western Australia, do hereby certify that:
a) I am a co-author of the technical report titled “Amended NI 43-101 Technical Report Feasibility Study for the Araguaia Nickel Project Federative Republic of Brazil Project Number AU9867”, dated 30 November 2018, amended 31 March 2021, with an effective date of 30 November 2018 (the “Technical Report”) prepared for Horizonte Minerals Plc (HZM).
b) I graduated with a Bachelor’s degree in Mining Engineering from the University of New South Wales. I am a Fellow of AusIMM. I have worked as a Mining Engineer continuously for a total of 28 years since my graduation from university. I have worked in mine planning and operations of nickel laterite projects for at least five years.
c) I have read the definition of “Qualified Person” set out in National Instrument 43-101 (“the Instrument”) and certify that by reason of my education, affiliation with a professional association and past relevant work experience, I fulfil the requirements of a “Qualified Person” for the purposes of the Instrument. I have been employed in mining and metallurgy related consulting practice for 13 years, including development and review of nickel laterite projects such as the Koniambo and the Dutwa laterite projects.
d) I visited the Araguaia Nickel Property and VDS properties in March 2016 and twice in 2017.
e) I am responsible for the preparation of sections 15 and 16 of the Technical Report, and accept responsibility for currency and completeness of all sections of the report.
f) I am independent of the issuer as defined in section 1.5 of the Instrument.
g) I have not had prior involvement with the property that is the subject of the Technical Report.
h) I have read the Instrument and Form 43-101F1, and the Technical Report has been prepared in compliance with that instrument and form.
i) As of the effective date of this Technical Report, to the best of my knowledge, information and belief, the Technical Report contains all the scientific and technical information that is required to be disclosed to make the Technical Report not misleading.
Dated at Perth, Western Australia, on 31 March 2021
Original signed
_________________________________________
Frank Blanchfield
BEng, FAusIMM
Principal Consultant
Snowden Mining Industry Consultants

Horizonte Minerals Plc Araguaia Nickel Project Technical Report
Final November 2018 Page 339 of 342
Matheus Palmieri
I, Matheus Palmieri, Consulting Geologist of Apto. 201, Rua Muzambinho n°32, Bairro Anchieta, Belo
Horizonte, Minas Gerais – Brazil, do hereby certify that:
(a) I am a co-author of the technical report titled “Amended NI 43-101 Technical Report Feasibility
Study for the Araguaia Nickel Project Federative Republic of Brazil Project Number AU9867”, dated 30 November 2018, amended March 2021, with an effective date of 30 November 2018 (the
“Technical Report”) prepared for Horizonte Minerals Plc (HZM).
(a) I graduated in Geology, from the Universidade Estadual Paulista - Unesp (BR) in 2003 and have a
Master’s Degree in Economic Geology and Prospecting from the Universidade de Brasilia - UnB
(BR) in 2011. I am a Chartered Professional registered with the Australasian Institute of Mining and Metallurgy in the discipline of Geology, Australia (#309256). I have been a practising geologist for
17 years including the exploration and evaluation of nickel laterites over the last 10 years.
(b) I have read the definition of “Qualified Person” set out in NI 43-101 (“the Instrument”) and certify that by reason of my education, affiliation with a professional association and past relevant work
experience, I fulfil the requirements of a “Qualified Person” for the purposes of the Instrument.
(c) I visited the ANS area of the ANP over 8 times from August 2018; most recently from 24 to 27 January 2020; and I visited ANN area 5 times, most recently from 27 to 30 January 2020.
(d) I am responsible for the preparation of parts of sections 6 to 12 (inclusive) of the Technical Report.
(e) I am independent of the issuer as defined in section 1.5 of the Instrument.
(f) I have consulted to HZM on the ANP, the property that is the subject of this Technical Report, since July 2018.
(g) I have read the Instrument and Form 43-101F1, and the Technical Report has been prepared in
compliance with that instrument and form.
(h) As of the effective date of this Technical Report, to the best of my knowledge, information and belief, the Technical Report contains all the scientific and technical information that is required to
be disclosed to make the Technical Report not misleading.
Dated at Belo, Brazil on 31 March 2021
Original signed
________________________________________
Matheus Palmieri
BSc, MSc, MAusIMM CP(Geo)
Horizonte Minerals Plc Araguaia Nickel Project Technical Report
Final November 2018 Page 340 of 342
Nicholas Adrian Barcza
I, Nicholas Adrian Barcza, Metallurgical Engineering Consultant, 116 Eighteenth Street, Parkhurst,
Johannesburg, South Africa, do hereby certify that:
a) I am a co-author of the technical report titled “Amended NI 43-101 Technical Report Feasibility Study for the Araguaia Nickel Project Federative Republic of Brazil Project Number AU9867” , dated 30 November 2018, amended 31 March 2021, with an effective date of 30 November 2018 (the “Technical Report”) prepared for Horizonte Minerals Plc (HZM).
b) I graduated with a Bachelor Degree in Metallurgical Engineering from the University of the Witwatersrand in 1969, a Masters Degree in Engineering from the University of Witwatersrand in Johannesburg in 1971 and a PhD from the University of Witwatersrand in Johannesburg in 1977. I am an Honorary Life Fellow of the South African Institute of Mining and Metallurgy and a Professional Engineer. I have worked as a metallurgical engineer and consultant to the mining and metallurgical industry, continuously for a total of 45 years since graduation. I have been involved in international metallurgical engineering consulting work for the last 12 years.
c) I have read the definition of “Qualified Person” set out in NI 43-101 (“the Instrument”) and certify that by reason of my education, affiliation with a professional association and past relevant work experience, I fulfil the requirements of a “Qualified Person” for the purposes of the Instrument.
d) I attended the pilot plant testwork carried out on the bulk sample of Araguaia ore carried out at Morro Azul in Brazil from 27 April 2015 to 5 May 2015 and attended a site visit in March 2017
e) I am responsible for 13 of the Technical Report, and contributed to preparation of sections 1, 2, 17, 25 and 26 of the Technical Report.
f) I am independent of the issuer as defined in section 1.5 of the Instrument.
g) I have no prior involvement with the property that is the subject of the Technical Report.
h) I have read the Instrument and Form 43-101F1, and the Technical Report has been prepared in compliance with that instrument and form.
i) As of the effective date of this Technical Report, to the best of my knowledge, information and belief, the Technical Report contains all the scientific and technical information that is required to be disclosed to make the Technical Report not misleading.
Dated at Johannesburg, South Africa, on 31 March 2021
Original signed
_______________________________________
Nicholas Adrian Barcza

Horizonte Minerals Plc Araguaia Nickel Project Technical Report
Final November 2018 Page 341 of 342
David John Haughton
I, David John Haughton, Process Engineering Consultant representing Canadian Engineering Associates Ltd of 5 Cudworth Place, Etobicoke, Ontario, M9A3R5, Canada, do hereby certify that:
a) I am a co-author of the technical report titled “Amended NI 43-101 Technical Report Feasibility Study for the Araguaia Nickel Project Federative Republic of Brazil Project Number AU9867”, dated 30 November 2018, amended 31 March 2021, with an effective date of 30 November 2018 (the “Technical Report”) prepared for Horizonte Minerals Plc (HZM).
b) I graduated with a Bachelor Degree in Science (Metallurgy) from the University of the Aston in Birmingham. I am member of the Institute of Mining and Metallurgy and a Chartered Engineer. I have worked as a metallurgical engineer and consultant to the mining and metallurgical industry, continuously for a total of 45 years since graduation. I have been involved in international metallurgical engineering consulting work for the last 15 years.
c) I have read the definition of “Qualified Person” set out in NI 43-101 (“the Instrument”) and certify that by reason of my education, affiliation with a professional association and past relevant work experience, I fulfil the requirements of a “Qualified Person” for the purposes of the Instrument.
d) I am responsible for Sections 17.1 to 17.5 relating to the process plant of the Technical Report.
e) I am independent of the issuer as defined in section 1.5 of the Instrument.
f) I have no prior involvement with the property that is the subject of the Technical Report.
g) I have read the Instrument and Form 43-101F1, and the Technical Report has been prepared in compliance with that instrument and form.
h) As of the effective date of this Technical Report, to the best of my knowledge, information and belief, the Technical Report contains all the scientific and technical information that is required to be disclosed to make the Technical Report not misleading.
Dated at Ringwood, UK, on 31 March 2021
Original signed
_______________________________________
David John Haughton
B Sc.(Met), MIMM, C Eng.

Horizonte Minerals Plc Araguaia Nickel Project Technical Report
Final November 2018 Page 342 of 342
Robin M. Kalanchey
I, Robin M Kalanchey, Director, Minerals and Metals – Ausenco Western Canada, Ausenco 855 Homer
Street | Vancouver, BC Canada do hereby certify that:
a) I am a co-author of the technical report titled “Amended NI 43-101 Technical Report Feasibility Study for the Araguaia Nickel Project Federative Republic of Brazil Project Number AU9867” , dated 30 November 2018, amended 31 March 2021, with an effective date of 30 November 2018 (the “Technical Report”) prepared for Horizonte Minerals Plc (HZM).
b) I am a member of the Association of Professional Engineers and Geoscientists of Alberta. I graduated from the University of British Columbia with a Bachelor of Applied Science degree in Metals and Materials engineering in 1996. I have practiced my profession continuously since 1996 and have been involved in: mineral processing and metallurgical testing, metallurgical process plant design and engineering, and metallurgical project evaluations for gold, nickel, cobalt, copper, zinc and molybdenum projects in Canada, Australia, Bolivia, Bulgaria, Brazil, Chile, China, Columbia, Ecuador, Greece, Indonesia, Kazakhstan, Madagascar, Peru, Philippines, Romania, South Africa, the United States and Zimbabwe.
c) I have read the definition of “Qualified Person” set out in NI 43-101 (“the Instrument”) and certify that by reason of my education, affiliation with a professional association and past relevant work experience, I fulfil the requirements of a “Qualified Person” for the purposes of the Instrument.
d) I am responsible for Sections 21.2.4 and 21.3.5 relating to the process plant of the Technical Report.
e) I am independent of the issuer as defined in section 1.5 of the Instrument.
f) I have no prior involvement with the property that is the subject of the Technical Report.
g) I have read the Instrument and Form 43-101F1, and the Technical Report has been prepared in compliance with that instrument and form.
h) As of the effective date of this Technical Report, to the best of my knowledge, information and belief, the Technical Report contains all the scientific and technical information that is required to be disclosed to make the Technical Report not misleading.
Dated at Vancouver, Canada, on 31 March 2021
Original signed
_______________________________________
Robin M Kalanchey
BA Sc.(MMAT), P Eng