Removal of Cd(II), Pb(II) and Cr(III) from water using modified ...
21
Vol.:(0123456789) 1 3 Applied Water Science (2018) 8:96 https://doi.org/10.1007/s13201-018-0724-8 ORIGINAL ARTICLE Removal of Cd(II), Pb(II) and Cr(III) from water using modified residues of Anacardium occidentale L. Gustavo Ferreira Coelho 1 · Affonso Celso Gonçalves Jr. 2 · Daniel Schwantes 3 · Esperanza Álvarez Rodríguez 4 · César Ricardo Teixeira Tarley 5 · Douglas Dragunski 2 · Élio Conradi Junior 2 Received: 4 April 2017 / Accepted: 9 May 2018 / Published online: 8 June 2018 © The Author(s) 2018 Abstract The pollution of water has been one of the greatest problems faced by the modern society, due to industrialization and urban growth. Rivers, lakes and seas have been continually suffering from the rising concentration of various pollutants, especially toxic elements. This study aimed to evaluate the use of cashew nut shell (Anacardium occidentale) (CNS), after chemical modification with H 2 O 2 , H 2 SO 4 and NaOH, as an new and renewable adsorbent material, for the removal of metals Cd 2+ , Pb 2+ and Cr 3+ in aqueous medium. The adsorbents were characterized by its chemical constitution, structure, infrared spectroscopy, morphology, by means of scanning electron microscopy, determination of the point of zero charge, thermogravimetrical analysis and porosimetry assessments. Tests were conducted to determine the optimal conditions (pH vs. adsorbent mass) for adsorption, by means of multivariate analysis using a central composite design. The adsorption kinetics was evaluated by models of pseudo-first order, pseudo-second order, Elovich and intraparticle diffusion, while adsorption isotherms were linearized by Langmuir, Freundlich and Dubinin–Radushkevich. The effect of initial concentration, temperature and desorp- tion was also performed. The adsorbents exhibited irregular, spongy and heterogeneous structure. FTIR analysis confirms the presence of hydroxyl, aliphatic, phenolic and carboxylic acid groups, which are favorable adsorption characteristics. The pH PZC of adsorbent is 4.35, 2.50 e 6.92, respectively, for CNS H 2 O 2 , H 2 SO 4 and NaOH. The optimum adsorption condi- tions were as follows: pH 5.0; relation of adsorbent mass/volume of water: 4 g L −1 ; 40 min of contact time for reaching the equilibration. Results suggest the predominance of chemisorption of Cd 2+ and Cr 3+ . Most of biosorbents exhibited good fit by Langmuir and Freundlich, suggesting the occurrence of adsorption on mono- and multilayers. The adsorbents of cashew nut shell exhibited high removal efficiency of Cd, Pb and Cr from waters. Keywords Biosorbent · Biosorption · Metal adsorption · Remediation · Water pollution Introduction Daily, toxic metals are released into the environment, whether in the form of mining waste, fertilizers and pes- ticides, or through domestic and industrial waste, as well as activities of tanning leather, wood preservation, paints, textiles and metallurgy, among others. These metals, in most part, are accumulative and characterized by latent toxicity, causing numerous damages into the biological cycles and trophic chain (Perugini et al. 2011; Nacke et al. 2013). Cadmium (Cd), lead (Pb) and chromium (Cr), for exam- ple, are harmful to human health. Cd accumulates easily in the circulatory system, kidney (renal cortex mainly), lung and heart, it is toxic to bones and gonads, while Pb has car- cinogenic properties damaging the digestive and respira- tory and immune systems; in children it mainly affects the * Affonso Celso Gonçalves Jr. aff[email protected] 1 Pontifical Catholic University of Paraná (PUCPR), Union Aveniue, nº 500, Toledo, State of Paraná, Brazil 2 State University of Western Paraná (UNIOESTE), Pernambuco Street, nº 1777, Marechal Cândido Rondon, State of Paraná, Brazil 3 Federal University of Paraná (UFPR), Pioneiro Street, nº 2153, Palotina, State of Paraná, Brazil 4 University of Santiago de Compostela (USC), University Campus, Lugo, Spain 5 Londrina State University (UEL), University Campus, Celso Garcia Cid Highway, Km 380, Londrina, State of Paraná, Brazil
-
Upload
khangminh22 -
Category
Documents
-
view
3 -
download
0
Transcript of Removal of Cd(II), Pb(II) and Cr(III) from water using modified ...

Vol.:(0123456789)1 3
Applied Water Science (2018) 8:96 https://doi.org/10.1007/s13201-018-0724-8
ORIGINAL ARTICLE
Removal of Cd(II), Pb(II) and Cr(III) from water using modified residues of Anacardium occidentale L.
Gustavo Ferreira Coelho1 · Affonso Celso Gonçalves Jr.2 · Daniel Schwantes3 · Esperanza Álvarez Rodríguez4 · César Ricardo Teixeira Tarley5 · Douglas Dragunski2 · Élio Conradi Junior2
Received: 4 April 2017 / Accepted: 9 May 2018 / Published online: 8 June 2018 © The Author(s) 2018
AbstractThe pollution of water has been one of the greatest problems faced by the modern society, due to industrialization and urban growth. Rivers, lakes and seas have been continually suffering from the rising concentration of various pollutants, especially toxic elements. This study aimed to evaluate the use of cashew nut shell (Anacardium occidentale) (CNS), after chemical modification with H2O2, H2SO4 and NaOH, as an new and renewable adsorbent material, for the removal of metals Cd2+, Pb2+ and Cr3+ in aqueous medium. The adsorbents were characterized by its chemical constitution, structure, infrared spectroscopy, morphology, by means of scanning electron microscopy, determination of the point of zero charge, thermogravimetrical analysis and porosimetry assessments. Tests were conducted to determine the optimal conditions (pH vs. adsorbent mass) for adsorption, by means of multivariate analysis using a central composite design. The adsorption kinetics was evaluated by models of pseudo-first order, pseudo-second order, Elovich and intraparticle diffusion, while adsorption isotherms were linearized by Langmuir, Freundlich and Dubinin–Radushkevich. The effect of initial concentration, temperature and desorp-tion was also performed. The adsorbents exhibited irregular, spongy and heterogeneous structure. FTIR analysis confirms the presence of hydroxyl, aliphatic, phenolic and carboxylic acid groups, which are favorable adsorption characteristics. The pHPZC of adsorbent is 4.35, 2.50 e 6.92, respectively, for CNS H2O2, H2SO4 and NaOH. The optimum adsorption condi-tions were as follows: pH 5.0; relation of adsorbent mass/volume of water: 4 g L−1; 40 min of contact time for reaching the equilibration. Results suggest the predominance of chemisorption of Cd2+ and Cr3+. Most of biosorbents exhibited good fit by Langmuir and Freundlich, suggesting the occurrence of adsorption on mono- and multilayers. The adsorbents of cashew nut shell exhibited high removal efficiency of Cd, Pb and Cr from waters.
Keywords Biosorbent · Biosorption · Metal adsorption · Remediation · Water pollution
Introduction
Daily, toxic metals are released into the environment, whether in the form of mining waste, fertilizers and pes-ticides, or through domestic and industrial waste, as well as activities of tanning leather, wood preservation, paints, textiles and metallurgy, among others. These metals, in most part, are accumulative and characterized by latent toxicity, causing numerous damages into the biological cycles and trophic chain (Perugini et al. 2011; Nacke et al. 2013).
Cadmium (Cd), lead (Pb) and chromium (Cr), for exam-ple, are harmful to human health. Cd accumulates easily in the circulatory system, kidney (renal cortex mainly), lung and heart, it is toxic to bones and gonads, while Pb has car-cinogenic properties damaging the digestive and respira-tory and immune systems; in children it mainly affects the
* Affonso Celso Gonçalves Jr. [email protected]
1 Pontifical Catholic University of Paraná (PUCPR), Union Aveniue, nº 500, Toledo, State of Paraná, Brazil
2 State University of Western Paraná (UNIOESTE), Pernambuco Street, nº 1777, Marechal Cândido Rondon, State of Paraná, Brazil
3 Federal University of Paraná (UFPR), Pioneiro Street, nº 2153, Palotina, State of Paraná, Brazil
4 University of Santiago de Compostela (USC), University Campus, Lugo, Spain
5 Londrina State University (UEL), University Campus, Celso Garcia Cid Highway, Km 380, Londrina, State of Paraná, Brazil

Applied Water Science (2018) 8:96
1 3
96 Page 2 of 21
intelligence and the nervous system (Zhong et al. 2016). Cr can exist in various states of oxidation (Apte et al. 2005), in conditions of pH > 6.0, predominantly at the form of Cr(OH)3. Cr(III) is involved in maintaining levels of glu-cose, cholesterol and triglycerides, performing, therefore, essential role as a nutrient to living organisms (Apte et al. 2005; Frois et al. 2011). However, under certain conditions it can be oxidized to Cr(VI), causing serious environmental consequences, due to its high solubility and mobility, as well as being harmful to the skin, liver, kidney and respiratory organs, causing diseases such as dermatitis, renal tubular necrosis, perforation of the nasal septum and lung cancer (Apte et al. 2005; Frois et al. 2011; Zhong et al. 2016).
Treatment techniques and processes have been used for the removal of pollutants from water, such as: precipita-tion, ion exchange, electrochemical treatment, flocculation, filtration and ozonization, which are used for wastewater decontamination with toxic metals. Generally, these tech-niques are limited by its eventually high costs or its technical viability, especially when used to remove dissolved metals in large volumes of water, generating large amounts of solid wastes, which are maintained and stored, causing another serious problem (Kanitz Junior et al. 2009). One of the most popular methods is adsorption, especially when using acti-vated carbon, although its high cost restricts its usage. In this way, the use of natural adsorbents can represent an excellent alternative, providing in many cases the same efficiency that activated carbon with lower costs (Zhao et al. 2011).
The use of biosorbent is a promising technology for the removal of toxic metals and other pollutants from aqueous solutions, as observed by the solid wastes from cassava industry (Schwantes et al. 2013), pie of Crambe abyssinca Hochst (Gonçalves Jr. et al. Gonçalves et al. 2013; Rubio et al. 2013a, b), pie of Moringa oleifera Lam. (Gonçalves Jr. et al. 2013b; Meneghel et al. 2013), biomass of Jatropha (Jatropha curcas) (Nacke et al. 2016), wheat straw (Coe-lho et al. 2016), mussel shell, pinus ashes, oak ash, pinus bark and hemp residues (Quintans-Fondo et al. 2016a, b, c). Although the economic benefits of nontransformation of biomass, studies are being carried out in order to increase the potential of biosorbents removal capacity, with the goal of giving new functional groups on the adsorbent surface through superficial chemical modifications on adsorbents mostly from vegetable origin (Wan Ngah and Hanafiah 2008; Schwantes et al. 2015, 2016).
The cashew areas (Anacardium occidentale L.) are expanding mainly by its great agronomic potential in Bra-zil and for its potential use of co-products (Moreira et al. 2013). The cashew tree is a tree native from Tropical Amer-ica, producer of edible nuts and succulent stems (pseudo-fruits) widely consumed by the population of many countries (Leitão et al. 2013; Muianga et al. 2016).
The world production of cashew nuts is estimated of 4,280,000 tons, in which 20% of the fruit consists of shell, with world annual bark production estimated of 856,000 tons, being in Brazil 54,000 tons (Coelho et al. 2014).
After obtaining the shell of cashew nut (CNS) and its oil, the solid wastes are disposed inappropriately in the soil, causing environmental problems. As a result, Coelho et al. (2014) evaluated the removal of Cd2+, Pb2+ and Cr3+ from aqueous solutions by natural cashew nut as a biosorbent, i.e., with no chemical modification, obtaining good results for the removal of these metals from aqueous solutions. Despite the use of biosorbents, many studies highlight that after simple chemical modifications most part of natural adsorbents may have its adsorption capacity increased with little or insignificant increase in costs. In addition, there is still very little information about the efficiency of CNS biosorbent after chemical modifications and its efficiency on the removal of pollutants. In this way, this work aimed to evaluate the increased efficiency of CNS chemically modi-fied for the removal of Cd2+, Pb2+ and Cr3+.
Materials and methods
Sampling and preparation of adsorbents
The adsorbents produced from the shells of cashew nut (Anacardium occidentale L.) were obtained at Curionópolis (PA), which were transported to the Laboratory of Environ-mental and Instrumental Chemistry of State University of Western Paraná—UNIOESTE, campus of Marechal Cândido Rondon.
The shells of cashews (CNS) were separated from the almonds, crushed in a blender and dried at 60 °C for 36 h. Subsequently, the oil from the shell was extracted through the Soxhlet-type system with n-hexane (C6H14, nuclear). The materials were again dried at 60 °C for 48 h and sieved in mesh 14 and 65, for the standardization of particles size between 0.212 and 1.40 mm, resulting in the in natura mate-rial. Chemical modifications were carried out by immersing the in natura material in 1.0 mol L−1 of H2O2, H2SO4 and NaOH, at a rate of 1:10 (m/v) with constant stirring 150 rpm for 6 h at 60 °C. Then, the modified adsorbents were washed with ultrapure water to remove the excess of modifying solu-tion and finally were dried at 60 °C, until constant weight.
Characterization of adsorbent materials
The concentration of metal elements (K, Ca, Mg, Cu, Fe, Mn, Zn, Cd, Pb and Cr) was determined through nitroper-cloric digestion (AOAC 2005), followed by determination

Applied Water Science (2018) 8:96
1 3
Page 3 of 21 96
by FAAS, with certified standard curves of all metals (GBC 932 AA).
The analysis of scanning electron microscopy (SEM), infrared spectroscopy (FTIR), thermogravimetry (TG/DTG), specific surface area, pore diameter and volume, was carried out in the Department of Chemistry of the Londrina State University (UEL) at Londrina, Paraná.
The surface morphology of the materials was obtained by scanning electron microscopy (SEM), with a microscope JEOL KAL 6360-LV, equipped with energy-dispersive microscopy.
In order to determine the main functional groups in adsor-bents, infrared spectroscopy analysis was performed, with a spectrometer FTIR-Fourier Transform 8300 (Infrared Spec-trophotometer, Shimadzu), in the region between 400 and 4000 cm−1 with a resolution of 4 cm−1, in which the spectra were obtained by using transmittance KBr pellets.
For the determination of the point of zero charge (pHPZC) of the adsorbent, 500 mg of mass was added at 50-mL erlen-meyer, containing KCl solution of 0.5 mol L−1. The solu-tions had pH adjusted ranging from 2.0 to 9.0, resulting in eight samples per adsorbent. After 24-h stirring (200 rpm), the final pH values were obtained (pHf) in function of the initial pH (pHi), being the pHPZC corresponding to the point of null pH variation (Mimura et al. 2010).
The thermal stability of adsorbents was determined by thermogravimetric analyzer (TGA 4000 PerkinElmer), where samples were heated from 30 to 900 °C with heating rate of 10 °C min−1, under N2 atmosphere. In order to verify the pore structure of adsorbents were determined the specific surface area (SSA), volume and pore size of the adsorbent materials using the equipment Quantachrome NOVA 1200e. To this end, 500 mg of materials was heated to 200 °C under vacuum for about 4 h, followed by adsorption and desorp-tion of nitrogen. The surface size and pore volume were calculated using the standard Brunauer, Emmett and Teller (BET), and a pore size was obtained using the method of Barrett–Joyner–Halenda (BJH), according to Eqs. 1 and 2:
where p and p0 are the equilibrium and the saturation pres-sure of adsorbates at the temperature of adsorption, v is the adsorbed gas quantity, and vm is the monolayer adsorbed gas quantity. c is the BET constant, adapted from Barrett, Joyner and Halenda (1951).
where γ is the surface tension of liquid nitrogen; v1 is the molar volume of the liquid; R is the universal gas constant,
(1)1
v[
p0
p− 1
] =c − 1
vmc
(
p
po
)
+1
vmc
(2)lnp
p0=
2�v1
RT
1
rm
T is the temperature (77 K), rm is the radius of the menis-cus, and p/po is the relative pressure, adapted from Brunauer et al. (1938).
Multivariable analysis for the influence of mass and pH
The ideal conditions of adsorption were defined with the use of a central composite design (CCD). Tests of adsor-bent mass and pH were performed with 5 increasing val-ues (250.0, 396.4, 750.0, 1103.6 and 1250.0 mg) and 5 pH conditions (3.0, 3.6, 5.0, 6.4 and 7.0), adjusted with HCl or NaOH solutions (0.1 mol L−1) (Table 1). These values are combined with fixed volumes of 50 mL containing 10 mg L−1 monoelementary water solutions of Cd2+, Pb2+ or Cr3+, prepared from cadmium nitrate salts [Cd(NO3)24H2O], lead nitrate [Pb(NO3)2] and chromium(III) nitrate [Cr(NO3)3 9H2O]. Then, they were stirred in thermostatic shaker (200 rpm at 25 °C) for 90 min.
From the obtained values for final concentration, graph-ics were built using the sorbed amount of metal calculated by Eq. 3.
in which Qads is the amount of adsorbed metal per gram of adsorbent (mg g−1), m is the mass of adsorbents (g), C0 corresponds to the initial concentration of ion in solution (mg L−1), Cf is the ion concentration in solution (mg L−1), and V is the volume of solution (L).
(3)Qads =
(
C0 − Cf
)
mV
Table 1 Real and coded values for the planning of the central com-posite rotatable design (CCRD)
Experimental conditions: volume: 50 mL, concentration of Cd2+, Pb2+ and 3+ Cr (10 mg L−1), stirring time: 90 min, rotation: 200 rpm; temperature: 25 °C. X1: encoding for the variable mass; X2: encoding for the variable pH
Test Variable
X1 Mass (mg) X2 pH
1 − 1.00 396.39 − 1.00 3.602 1.00 1103.61 − 1.00 3.603 − 1.00 396.39 1.00 6.404 1.00 1103.61 1.00 6.405 0.00 750.00 0.00 5.006 − 1.41 250.00 0.00 5.007 0.00 750.00 1.41 7.008 1.41 1250.00 0.00 5.009 0.00 750.00 − 1.41 3.0010 0.00 750.00 0.00 5.0011 0.00 750.00 0.00 5.0012 0.00 750.0 0.00 5.00
Applied Water Science (2018) 8:96
1 3
96 Page 4 of 21
Kinetic mechanism of adsorption
With the obtained results from previous tests, we deter-mined the optimal time of sorption of metals. Thus, 200 mg adsorbents were stirred for 12 different time intervals (5, 20, 30, 40, 50, 60, 80, 100, 120, 140, 160 and 180 min) containing 50 mL monoelementary water solutions at 10 mg L−1 and pH 5.0. Solutions were filtered through qualitative filter paper, and the equilibrium con-centration was found by FAAS determination. To evalu-ate the kinetic mechanism that controls the adsorption process, pseudo-first-order (Eq. 4), pseudo-second-order (Eq. 5), Elovich (Eq. 6) and intraparticle diffusion models (Eq. 7) were used (Ibrahim 2010; Han et al. 2010; Witek-Krowiak et al. 2011).
in which Qeq (mg g−1) and Qt (mg g−1) are the quantities of adsorbate retained per gram of adsorbent in equilibrium and in time t, respectively, and K1 (min−1) is the rate constant of pseudo-first order ().
in which K2 (g mg−1 min−1) is the rate constant of pseudo-second order. Unlike the pseudo-first-order model, this model predicts the kinetic behavior over the entire range of adsorption time (Ho and Mckay 1999).
in which A and B are constants, and A corresponds to the speed of initial chemisorption (mg g−1 h−1) and B is the number of suitable sites for adsorption, which is related to the extent of surface coverage and the activation energy of the chemisorption (g mg−1) (Witek-Krowiak et al. 2011).
in which Kid is diffusion intraparticle constant (g mg−1 min−1/2) and C(i) suggests the thickness of the boundary layer effect (mg g−1) (Han et al. 2010).
Efficiency of adsorption and desorption
The experimental conditions were based on results of mass, pH and time obtained in the previous tests. Thus, 200 mg adsorbents containing plus 50 mL of rising con-centrations of monoelementary water solutions of Cd2+, Pb2+ and Cr3+ (5, 20, 40, 60, 80, 100, 120, 140, 160 and 200 mg L−1), at pH 5.0, were stirred at 25 °C and 200 rpm
(4)log(
Qeq − Qt
)
= logQeq −
(
K1
2303
)
t
(5)t
Qt
=1
K2Qeq2+
1
Qeq
t
(6)Qeq = A + BInt
(7)Qeq = Kidt1∕2 + Ci
for 40 min. The solutions were then filtered through quali-tative filter paper, and the equilibrium concentration was determined by FAAS. The Qads was calculated according to Eq. 1, and the percentage of removal of metals was calculated according to Eq. 8:
in which %R is the percentage of ion removal by adsorbent, Cf is the final concentration of ion (mg L−1), and C0 is the initial ion concentration in solution (mg L−1).
In order to check the reusability of adsorbents, the already used adsorbents were separated from the aqueous solution by filtration, through a quantitative filter paper and oven-dried at 60 °C for 24 h. The obtained mass was placed with 50 mL HCl solution (0.1 mol L−1) and then stirred for more 40 min (200 rpm at 25 °C). After that, the samples were filtered and the final solution was used for determining the final concen-trations of desorbed metal. The desorption percentage was calculated using Eq. 9:
in which Ceq(des) (mg L−1) and Ceq(ads) (mg L−1) are desorbed concentration and adsorbed concentration, respectively.
Adsorption equilibrium
By the influence of initial concentration, adsorption iso-therms were constructed by linear mathematical models of Langmuir (Langmuir 1916), Freundlich (Freundlich 1906) and Dubinin and Radushkevich (1947), respectively, accord-ing to Eqs. 10, 11, 12, 13 and 14, being the standard error (SE) determined by the method of least squares.
in which Ce and Ceq represent the concentration at equi-librium and Qe or qeq the amount adsorbed at equilibrium per unit of mass of the adsorbent. The two parameters of the Langmuir isotherm KL or b and Cm reflect properly the nature of the adsorbent material and can be used to compare the performance of adsorption. Langmuir parameter Cm is related to the maximum capacity of adsorption and KL or b with adsorbent–adsorbate interaction forces.
(8)%R = 100 −
(
Cf
C0
× 100
)
(9)D =
(
ceq(des)
ceq(ads)
)
× 100
(10)1
Qe
=1
Cm
+1
KLCmCe
(11)Ceq
qeq=
1
qmb+
Ceq
qm
(12)log qeq = log Kf +(
1
n
)
logCeq

Applied Water Science (2018) 8:96
1 3
Page 5 of 21 96
in which Ceq or Ce is concentration on balance and qeq or Qe is the amount adsorbed at equilibrium per unit of adsorbent mass; KF and n are the two parameters of Freundlich.
in which Qeq is the amount adsorbed ion per unit of adsor-bent mass (mol g−1), Qd is the adsorption capacity (mol L−1), Bd is an coefficient related to the sorption energy (mol2 J−2), and “ε” is the potential of Polanyi (Eq. 14).
in which R is the universal gas constant (kJ mol−1 K−1), T is the temperature (K), and Ceq is in liquid-phase equilibrium concentration (mol L−1) (Dubinin and Radushkevich 1947; Njoku et al. 2011).
Influence of temperature
Tests aiming to study the influence of temperature on adsorp-tion were performed. For this purpose, 200 mg adsorbent material plus 50 mL solution containing 50 mg L−1 Cd2+, Pb2+ and Cr3+, at pH 5.0, was shaken at 200 rpm at different temperatures (15, 25, 35, 45 and 55 °C).
With the results, we calculated the parameters of Gibbs free energy (ΔG), enthalpy (ΔH) and entropy (ΔS), in order to evaluate the thermodynamic parameters and investigate the nature of the process (Sari et al. 2007).
in which Kd corresponds to the ratio of the quantity adsorbed per unit of adsorbent (Qeq) and solution concen-tration in equilibrium (Ceq), R is the universal gas constant (8.314 J mol−1 K−1), and T is the temperature (K). The val-ues of ΔH and ΔS were obtained from the graph of ln Kd in function of 1/T.
(13)ln Qeq = ln Qd − Bd �2
(14)� = RT ln(
1 + 1∕Ceq
)
(15)ΔG = −RT ln Kd
(16)ln Kd =ΔS
R−
ΔH
RT
Results and discussion
Characterization of adsorbent materials
The characterization of the total chemical elements of adsor-bents is exhibited in Table 2.
The decrease in amount of K, Ca, Mg, Cu, Zn, Fe and Mn by the solutions H2O2, H2SO4 and NaOH is observed, i.e., the solutions caused modification on chemical composition of the adsorbent materials. This can be explained by the characteristics of each modifying agents, such as oxidation (H2O2), solubilization of organic groups (NaOH) and dehy-dration (H2SO4) (Schwantes et al. 2016). The levels of Cd, Pb and Cr were not detected in CNS in natura. There was an increase for the concentration of Cd, Mn and Cr after modi-fication, which might have occurred through contamination of materials due to the modifying agent itself, which in its composition contains low levels of these elements.
The microstructures of CNS in natura were observed at 160×, 1200× and 12,000× of amplification and modified adsorbents in resolutions of 50×, 400× and 1600× (Fig. 1). The CNS in natura surface, according to Fig. 1a–c, pre-sented lamellar aspect, irregular and heterogeneous struc-ture, which according to Rubio et al. (2013a) and Coelho et al. (2014) favor the adsorption of metal ions.
For the CNS H2O2 (Fig. 1d–f) can be observed irregu-larities on the adsorbent surface, which after modification exhibits sponge-shaped aspect, with cavities in the form of pores due to the oxidizing power of H2O2. The CNS H2SO4 also configured irregularities, heterogeneous sur-face with cracks and pore-shaped cavities, probably due to the dehydrating action of sulfuric acid H2SO4 (1.0 mol L−1) (Fig. 1g–i). The CNS NaOH presented irregular surface, with heterogeneous surface and cavities (Fig. 1j–l), possi-ble in function to the high solubility of NaOH, which is also a strong base. According to the characteristics observed by micrographs, it can be stated that the adsorbents may have conditions to adsorb metals, in function the modifications on their surfaces.
Table 2 Characterization of the total chemicals of cashew nut shell (CNS) in natura, modified with H2O2, H2SO4 and NaOH
LQ (quantitation limit): K = 0.01; Ca = 0.005; Mg = 0.005 (g kg−1); Cu = 0.005; Fe = 0.01; Mn = 0.01; Zn = 0.005; Cd = 0.005; Pb = 0.01; Cr = 0.01 (mg kg−1)*Source: Coelho et al. (2014)
Adsorbent K Ca Mg Cu Zn Mn Fe Cd Pb Crg kg−1 mg kg−1
CNS in natura* 7.65 9.23 1.67 6.73 13.40 52.60 19.30 < LQ < LQ < LQCNS NaOH 1.30 1.97 1.06 5.20 13.90 21.00 7.70 0.80 33.40 8.10CNS H2SO4 0.81 1.38 0.43 5.40 12.30 1.80 7.00 0.60 11.60 3.70CNS H2O2 2.57 1.91 1.15 9.80 18.00 38.50 4.60 0.50 13.50 7.30

Applied Water Science (2018) 8:96
1 3
96 Page 6 of 21
The FTIR spectra in the range of 400–4000 cm−1 for the bark of A. occidentale L. in natura and modified with H2O2, H2SO4 and NaOH (Fig. 2; Table 3) exhibit the possible pres-ence of anionic functional groups (hydroxyl, carboxylic acid and amines) on the adsorbent surface as well as the modifi-cation of the surface of CNS by modifying agents.
The band at 3400 cm−1 can be attributed to the vibrational stretch of O–H bond, suggesting the presence of hydroxyl groups (OH−) from cellulose, lignin, amine groups (NH2
−) and amides (Munagapati et al. 2010; Rubio et al. 2013a; Coelho et al. 2014). The vibrational stretching at 2925 and 1380 cm−1 may be from C-H bonds of alkanes and aliphatic
acid groups as described by Coelho et al. (2014) for the shell of cashews in natura, and this stretch also found in other biomass adsorbents like the pie of Crambe abyssinica H. (Rubio et al. 2013a, b).
The carboxylic groups and amides can also be found in bark of cashews at 1640 cm−1 assigned to the stretching vibrational bonds C=O (Monier et al. 2010; Han et al. 2010).
The band at 1076 cm−1 suggests the presence of C-O from aromatic groups (Garg et al. 2007), confirming the presence of lignin structure in the shell of the cashew nut. Smaller wavelength at 800 cm−1 can also be attributed to N containing bio-binders (Barka et al. 2010).
(g) (h) (i)
(j) (k) (l)
(b) (a) (c)
(d) (e) (f)
Fig. 1 Scanning electron microscopy to shell of cashew nut (CNS) in natura with magnifications of 160 (a), 5000 (b) and c 12,000 times (source: COELHO et al. 2014) and chemically modified with H2O2
with magnification of 50 (d), 400 (e), 1600 (f). H2SO4 with magnifi-cation of 50 (g), 400 (h), 1600 (i), and NaOH with 50 magnification (j), 400 (k), 1600 (l) times (source: the author)

Applied Water Science (2018) 8:96
1 3
Page 7 of 21 96
Vibrational elongation of bond C-N can also be found by the presence of a band at 700 and 667 cm−1 (Salem and Awwad 2011).
The CNS that received modificant solutions with H2O2, H2SO4 and NaOH presented, respectively, vibrational stretches at the region of 3405, 3392 and 3389 cm−1, assigned to O–H bonds of primary amides, amines and carboxylic acids and hydroxylic found in lignins, cellu-lose and water (Smidt and Meissl 2007; Movasaghi et al. 2008; Pavia et al. 2010). The spectra at 2926 cm−1 for CNS H2O2, 2933 cm−1 for H2SO4 and 2920 cm−1 for NaOH assigned to C-H bonds in alkanes, aliphatic acid groups and aldehydes or CH2 assigned to lipids.
The 2855 cm−1 group found only for CNS H2O2 and CNS H2SO4 and also refers to the presence of lipids or bonds CH2. These groups, according to Pavia et al. (2010), are directly related to the carboxylic acid groups encoun-tered by vibrational stretches at 1723 and 1730 cm−1, respectively, for CNS H2O2 and CNS H2SO4. According to the same author, when acids or peroxides are diluted in solvents the modification of C=O may occur, releasing carboxylic acids in the material. This may have occured due to the adsorbent being modified with H2SO4 and H2O2. Other vegetable residues have presented the same func-tional groups as pie of Crambe abyssnica H. and Jatropha
curcas L. (Rubio et al. 2013a, b; Coelho et al. 2014; Nacke et al. 2016).
For modification with NaOH, it is observed a vibrational stretch in the region of 2144 cm−1, related to the presence of hydrocarbons, alkynes nonterminal groups, with bonds C≡C (Pavia et al. 2010), which may have been produced through saponification reaction due to the presence of derivatives of the LCNS (net of the shell of the cashew nut) (Mazzeto et al. 2009).
The spectra at 1387, 1380 for CNS H2O2, H2SO4 and NaOH can be related to N–H bonds of amines, CH3, C–O or CH (Smidt and Meissl 2007; Pavia et al. 2010).
Only for the adsorbents CNS in natura and CNS H2SO4 are observed a stretch at the region of 1153 and 1103 cm−1 and demonstrate the presence of polysaccharides of bonds C–O–P (Pavia et al. 2010). This group is absent in modi-fied adsorbents with H2O2 and NaOH, suggesting that the reaction with H2SO4 is weaker in comparison with the other modifying agents.
The region stretches from 1061 cm−1 for CNS H2O2 to 1064 cm−1 for CNS NaOH, suggesting the presence of sul-foxides bonds S=O, C–O from polysaccharides (Movasaghi et al. 2008; Smidt and Meissl 2007). The groups at 671, 618, 621 cm−1 for CNS H2O2, H2SO4 and NaOH can be related to S–O bonds of inorganic sulfate (Movasaghi et al. 2008; Smidt and Meissl 2007).
The value of pHPZC for the cashew nut (CNS) in natura is 3.69 (Fig. 3). It is observed, after the modifications (Fig. 3), the occurrence of alterations on the point of zero charge for CNS H2O2, H2SO4 and NaOH, being, respectively, 4.35, 2.50 and 6.92. This change already was expected, since the variation of pHPZC occurs according to power of alkaliniza-tion or acidification of each modifying solution, protonation, deprotonation or hydroxylation of chemical groups of the CNS (Schwantes et al. 2016).
500 1000 1500 2000 2500 3000 3500 4000
Tran
smita
nce
(u.a
.)
618
10311103
1387
16201723
28552933
3392
673
10611387
1620
1730
2855
2926
3405
667771
1076
11531380
1640
2927
3440
621
10641380 1646
2144
2920 3389
Wavenumber (cm-1)
in natura H2O2
H2SO
4
NaOH
Fig. 2 Infrared spectrum of CNS in natura (source: COELHO et al. 2014) and chemically modified with H2O2, H2SO4 and NaOH
Table 3 Surface area, volume of pore and pore radius for the shell of the cashew nut shell (CNS) chemically modified with H2O2, H2SO4 and NaOH
Parameters CNS H2O2 CNS H2SO4 CNS NaOH
Surface area (m2 g−1) 0.5093 0.0915 0.2612Pore volume (cm3 g−1) 4.609e−4 1.370e−3 1.850e−3
Pore radius (nm) 1.731 1.722 2.836
0 1 2 3 4 5 6 7 8 9 10
-6
-5
-4
-3
-2
-1
0
1
CNS in natura CNS NaOH CNS H2SO4
CNS H2O2
pH
pH (initial)
∆
Fig. 3 Point of zero charge (pHPZC) of CNS in natura (Coelho et al. 2014) and modified with H2O2, H2SO4 and NaOH

Applied Water Science (2018) 8:96
1 3
96 Page 8 of 21
This way when the pH > pHPZC, the surface of the adsor-bent is electronegative, favoring the adsorption of Cd2+, Pb2+ and Cr3+. If the pH < pHPZC, the surface of the adsor-bent is electropositive; in this state, H+ ions compete with the metal cations, repelling them from possible interactions with the adsorbents surface.
Thermogravimetric analysis (TG) was performed to ver-ify the thermal stability of the adsorbents from CNS after treatment with H2O2, H2SO4 and NaOH (Fig. 4).
For the adsorbents CNS modified with H2O2 (Fig. 4a), H2SO4 (Fig. 4b) and NaOH (Fig. 4c), the first mass loss, related to the release of moisture in the adsorbents, is bounded by the surface tension and started at higher temper-atures for CNS H2O2 (81.53–100 °C) when compared with others, 71.43–150 °C for CNS H2SO4 and 73.33–100 °C for CNS NaOH.
The DTG curve for decomposition of hemicellulose, which demonstrates the thermal stability of materials, exhibits the beginning of mass loss at 230, 200 and 230 °C for CNS H2O2, CNS H2SO4 and CNS NaOH, respectively. Already for cellulose, the step where more mass is lost occurred to 370.64 °C for CNS H2O2 and CNS H2SO4 and 362.90 °C for CNS NaOH. The decomposition of lignin and other compounds occurred above 400 °C for CNS H2O2, above 350 °C for CNS H2SO4 and above 400 °C for
CNS NaOH (Melzer et al. 2013; Moreira et al. 2017). It is observed in Fig. 4 the loss of about 80% of masses of CNS H2O2, CNS H2SO4 and CNS NaOH. These results demon-strate that the modified adsorbent materials are similar when it comes to its thermal stability.
The adsorption and desorption isotherms of BET for CNS adsorbents have the purpose of determining the specific sur-face area, as well as volume and pore diameter (Fig. 5).
Figure 5 shows a behavior of the BET type II adsorption isotherm with the negative concavity, characteristic of non-porous or low porous systems, representing the monolayer formation, in this step high energy demand (Khafaloui et al. 2003).
According to Table 3, the specific surface area of adsor-bents followed the order CNS H2O2 > CNS NaOH > CNS H2SO4, being their values, respectively, 0.5093, 0.2612 and 0.0915 m2 g−1, which represent low values when compared to commercial activated carbon, with 894 m2 g−1 (Merck®), and nonsilicated clay minerals, such as goethite, 41.73 m2 g−1, and hematite, 38.36 m2 g−1 (Cessa et al. 2009). The pore volume (cm3 g−1) found was 5.268 e−4, 5.074 e−4 and 3.330 e−4 for the adsorbents CNS NaOH > CNS H2SO4 > CNS H2O2, with pore diameter greater for CNS NaOH (2.836 nm) > CNS H2O2 (1.731 nm) > CNS H2SO4 (1.722 nm). These results demonstrate that adsorption may
100 200 300 400 500 600 700 800 9000
20
40
60
80
100
% of massDerived weight
Temperature (ºC)
% M
ass
-10-9-8-7-6-5-4-3-2-10
272.93 ºC
370.64 ºC Der
ived
wei
ght (
%/m
in)
81.53 ºC
(a)
100 200 300 400 500 600 700 800 9000
20
40
60
80
100
% of mass Derived weight
Temperature (ºC)
% M
ass
-5
-4
-3
-2
-1
0
264.54 ºC
370.64 ºC Der
ived
wei
gth
(%/m
in)
71.43 ºC
(b)
100 200 300 400 500 600 700 800 9000
20
40
60
80
100
% of Mass Derived weight
Temperature (ºC)
% M
ass
-10-9-8-7-6-5-4-3-2-10
269.65 ºC
362.29 ºC Der
ived
wei
ght (
%/m
in)
78.33 ºC
(c)
Fig. 4 Loss of mass (TG) and derived weight (DTG) of CNS chemically modified with H2O2 (a), H2SO4 (b) and NaOH (c)
0.0 0.1 0.2 0.3 0.4 0.5 0.6 0.7 0.8 0.9 1.0 1.10.0
0.1
0.2
0.3
0.4
0.5
0.6
0.7
0.8
0.9 Adsorption/Desorptiono
Vol
ume
(cc/
g)
Relative pressure (P/Po)(a)
0.0 0.1 0.2 0.3 0.4 0.5 0.6 0.7 0.8 0.9 1.0 1.10.0
0.2
0.4
0.6
0.8
1.0
1.2
1.4
1.6
1.8
2.0 Adsorption/Desorption
Vol
ume
(cc/
g)
Relative pressure (P/Po)
(b)
0.0 0.1 0.2 0.3 0.4 0.5 0.6 0.7 0.8 0.9 1.0 1.10.000.050.100.150.200.250.300.350.400.450.500.55
Adsoption/Desorption
Vol
ume
(cc/
g)
Relative pressure (P/Po)(c)
Fig. 5 Adsorption and desorption isotherms of BET to CNS chemically modified with NaOH (a), H2SO4 (b) and H2O2 (c)

Applied Water Science (2018) 8:96
1 3
Page 9 of 21 96
occur predominantly superficially, with low possibility of intraparticle diffusion.
The results in Table 3 suggest that the adsorbents have been effectively changed, showing that the modification pro-cess, in certain temperatures, can change the CNS biomass differently and may be favorable or not to the adsorption of metal ions.
Multivariate analysis of the influence of adsorbent mass and solution pH
According to Tables 4 and 5, there was a significant differ-ence at 5% of significance for the variable mass, for all the
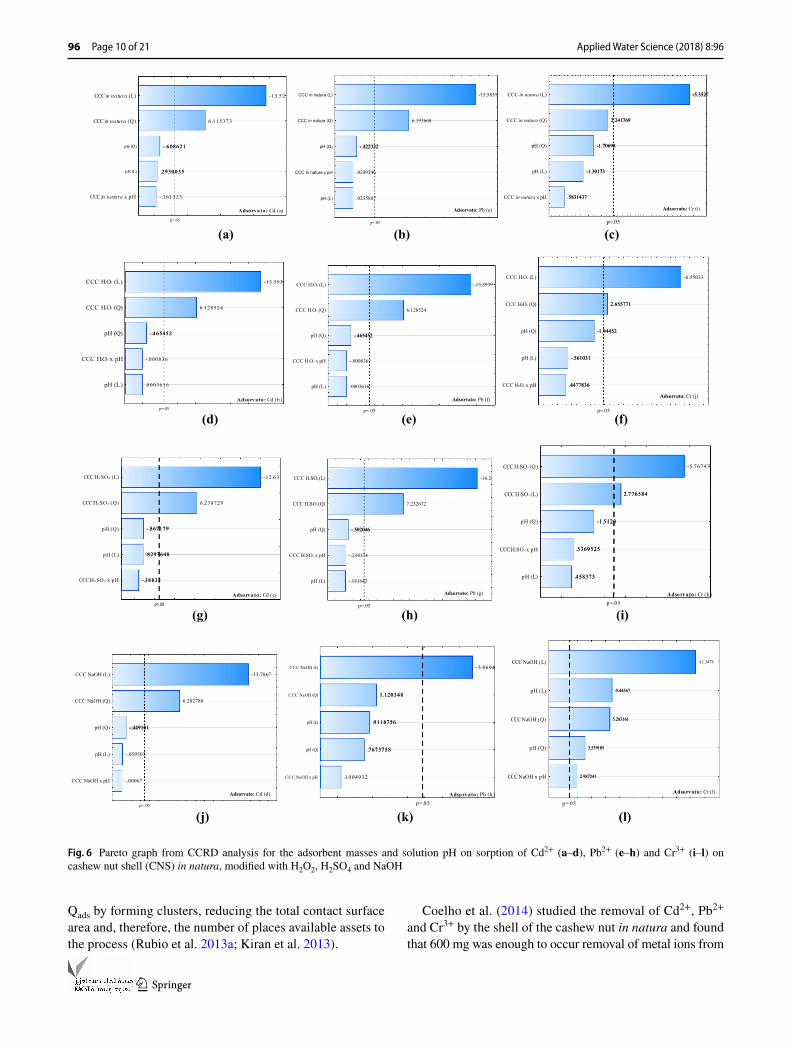
adsorbents at all cases. For Cr3+ adsorption on CNS NaOH, significant differences for the variable mass, pH and interac-tion between both variables were found, and the same can be observed by Pareto graphs (Fig. 6).
The Pareto graph (Fig. 6) also exhibits the results for vari-ables mass and pH on adsorption of CNS adsorbents, high-lighting the significance for both variables, except for Pb2+ by CNS NaOH (Fig. 6 h). Table 6 expresses the mathemati-cal equations from the graphs exhibited in Fig. 7.
Higher values of Qeq occurred with lower quantities of adsorbent material, i.e., 200 mg, or 4 g L−1, CNS in natura and chemically modified with H2O2, H2SO4 and NaOH. The increase in adsorbent mass can even in some cases decrease
Table 4 CCRD planning matrix with triplicate in central point in their coded values and real values for absorption of Cd2+, Pb2+ and Cr3+ by adsorbents in natura and modified with H2O2, H2SO4 and NaOH
Qads: amount sorbed of metal ions (mg g−1). Experimental conditions: volume of 50 mL, concentration of Cd2+, Pb2+ and 3+ Cr (10 mg L−1), stirring time of 90 min, rotation of 200 rpm; temperature of 25 °C
Variable Qads (mg g−1) Cd2+ Qads (mg g−1) Pb2+ Qads (mg g−1) Cr3+
Test Mass (mg) pH CNSin natura
CNSH2O2
CNSH2SO4
CNSNaOH
CNSin natura
CNSH2O2
CNSH2SO4
CNSNaOH
CNSin natura
CNSH2O2
CNSH2SO4
CNSNaOH
1 396.39 3.60 1.155 1.167 0.911 1.240 1.234 1.261 1.263 0.293 1.071 1.003 0.935 1.1272 1103.61 3.60 0.426 0.428 0.281 0.439 0.440 0.452 0.453 0.103 0.426 0.363 0.306 0.2123 396.39 6.40 1.185 1.189 0.987 1.235 1.226 1.260 1.258 0.305 0.591 0.734 0.763 0.3964 1103.61 6.40 0.428 0.430 0.288 0.436 0.439 0.453 0.411 0.134 0.181 0.242 0.342 0.0225 750.00 5.00 0.630 0.632 0.473 0.647 0.648 0.666 0.648 0.180 0.618 0.620 0.557 0.1426 250.00 5.00 1.843 1.863 1.587 1.950 1.939 1.994 1.931 0.586 1.768 1.718 1.812 1.1417 750.00 7.00 0.631 0.635 0.436 0.645 0.654 0.664 0.652 0.399 0.438 0.496 0.558 0.2798 1250.00 5.00 0.377 0.381 0.219 0.387 0.387 0.400 0.392 0.125 0.367 0.372 0.335 0.0009 750.00 3.00 0.601 0.592 0.345 0.653 0.645 0.666 0.651 0.261 0.448 0.405 0.287 0.61310 750.00 5.00 0.627 0.631 0.427 0.647 0.644 0.664 0.651 0.224 0.619 0.611 0.559 0.17211 750.00. 5.00 0.626 0.635 0.428 0.648 0.644 0.664 0.660 0.192 0.618 0.625 0.582 0.17612 750.00 5.00 0.628 0.627 0.422 0.647 0.647 0.664 0.656 0.229 0.618 0.624 0.584 0.142
Table 5 Analysis of variance (ANOVA) for cashew nut shell (CNS) in natura, CB H2O2, CNS H2SO4 and CNS NaOH and pH on the removal of Cd2+, Pb2+ and Cr3+
FV factors of variation, DF degrees of freedom, L linear, Q quadratic*Significant at 5% probability for Fisher’s test, obtained through degrees of freedom and treatment of error (Barros et al. 2010)ns No significant at 5% probability by Fisher’s test
FV DF Cd(II) Pb(II) Cr(III)
CNSin natura
CNSH2O2
CNSH2SO4
CNSNaOH
CNSin natura
CNSH2O2
CNSH2SO4
CNSNaOH
CNSin natura
CNSH2O2
CNSH2SO4
CNSNaOH
Mass (L) 1 1.581* 1.869* 1.3295* 1.8123* 1.7795* 1.8696* 1.8343* 0.1280* 1.1502* 1.149* 1.229* 1.051*Mass (Q) 1 0.323* 0.391* 0.3241* 0.3764* 0.3700* 0.3914* 0.3641* 0.0107 0.2017 0.189* 0.284* 0.227*pH (L) 1 0.0007 0.0000 0.0057 0.0000 0.0000 0.0000 0.0002 0.0071 0.0680 0.0084 0.0077 0.241*pH (Q) 1 0.0032 0.0022 0.0062 0.0019 0.0017 0.0022 0.0017 0.0050 0.1169 0.1013 0.0845 0.102*Mass × pH 1 0.0002 0.0000 0.0012 0.0000 0.0000 0.0000 0.0003 0.0008 0.0136 0.0053 0.0106 0.078*Error 6 0.0086 0.0104 0.0083 0.0095 0.0096 0.0104 0.0069 0.0085 0.0401 0.0267 0.0369 0.0081Total 11
Applied Water Science (2018) 8:96
1 3
96 Page 10 of 21
Qads by forming clusters, reducing the total contact surface area and, therefore, the number of places available assets to the process (Rubio et al. 2013a; Kiran et al. 2013).
Coelho et al. (2014) studied the removal of Cd2+, Pb2+ and Cr3+ by the shell of the cashew nut in natura and found that 600 mg was enough to occur removal of metal ions from
-.161323
.2930035
-.608621
6.115373
-13.52
p=.05
CCC in natura x pH
pH (L)
pH (Q)
CCC in natura (Q)
CCC in natura (L)
.2930035
-.608621
Adsorvato: Cd (a)
.0235887
.0249546
-.422322
6.193668
-13.5831
p=.05
pH (L)
CCC In natura x pH
pH (Q)
CCC in natura (Q)
CCC in natura (L)
-.422322
Adsorvato: Pb (e)
.5831437
-1.30173
-1.70698
2.241769
-5.352
p=.05
CCC in natura x pH
pH (L)
pH (Q)
CCC in natura (Q)
CCC in natura (L)
.5831437
-1.30173
-1.70698
2.241769
-5.3527
Adsorvato: Cr (i)
.0003616
-.000836
-.465452
6.128524
-13.393
p=.05
pH (L)
CCC H2O2 x pH
pH (Q)
CCC H2O2 (Q)
CCC H2O2 (L)
-.465452
Adsorvato: Cd (b)
.0003616
-.000836
-.465452
6.128524
-13.3939
p=.05
pH (L)
CCC H2O2 x pH
pH (Q)
CCC H2O2 (Q)
CCC H2O2 (L)
-.465452
Adsorvato: Pb (f)
.4477836
-.561031
-1.94452
2.655771
-6.55033
p=.05
CCC H2O2 x pH
pH (L)
pH (Q)
CCC H2O2 (Q)
CCC H2O2 (L)
.4477836
-.561031
-1.94452
2.655771
Adsorvato: Cr (j)
-.38832
.8297648
-.867179
6.238729
-12.63
p=.05
CCC H2 SO4 x pH
pH (L)
pH (Q)
CCC H2 SO4 (Q)
CCC H2 SO4 (L)
-.38832
.8297648
-.867179
Adsorvato: Cd (c)
-.181643
-.234174
-.502046
7.232672
-16.2
p=.05
pH (L)
CCC H2SO4 x pH
pH (Q)
CCC H2SO4 (Q)
CCC H2SO4 (L)
-.502046
Adsorvato: Pb (g)
.458373
.5369525
-1.5123
2.776584
-5.76747
p=.05
pH (L)
CCC H2SO4 x pH
pH (Q)
CCC H2SO4 (L)
CCC H2SO4 (Q)
.458373
.5369525
-1.5123
2.776584
Adsorvato: Cr (k)
-.00067
-.059503
-.449101
6.282788
-13.7867
p=.05
CCC NaOH x pH
pH (L)
pH (Q)
CCC NaOH (Q)
CCC NaOH (L)
-.449101
Adsorvato: Cd (d)
.1004932
.7673758
.9118756
1.120348
-3.8694
p=.05
CCC NaOH x pH
pH (Q)
pH (L)
CCC NaOH (Q)
CCC NaOH (L)
.7673758
.9118756
1.120348
Adsorvato: Pb (h)
2.987241
3.539105
5.283161
-5.44367
-11.3476
p=.05
CCC NaOH x pH
pH (Q)
CCC NaOH (Q)
pH (L)
CCC NaOH (L)
2.987241
3.539105
5.283161
-5.44367
Adsorvato: Cr (l)
(a) (b) (c)
(d) (e) (f)
(g) (h) (i)
(j) (k) (l)
Fig. 6 Pareto graph from CCRD analysis for the adsorbent masses and solution pH on sorption of Cd2+ (a–d), Pb2+ (e–h) and Cr3+ (i–l) on cashew nut shell (CNS) in natura, modified with H2O2, H2SO4 and NaOH

Applied Water Science (2018) 8:96
1 3
Page 11 of 21 96
water. Nacke et al. (2016) and Gonçalves Jr. et al. (2016) checked different amounts of Jatropha curcas L. in natura and lump of Acai in natura, respectively, on adsorption of Cu2+ and Zn2+ and found that 8 g L−1 was enough to achieve high removal efficiency. Schwantes et al. (2015) and Schwantes et al. (2016) performed, respectively, the chemi-cal modification, with solutions of H2O2, H2SO4 and NaOH,
in crambe pie and cassava peel, and found that 5 g L−1 was the ideal proportion adsorbent/adsorbate solution, for remov-ing Cd2+, Pb2+ and Cr3+ from aqueous solution at pH 5.0.
Regarding metals adsorption, it is recommended to be carried with pH values lower than 5.0, in function of the possibility of precipitation (Yang and Al-Duri 2005; Ercan and Aydin 2013). Coelho et al. (2014) studying the shell of
Table 6 Equation for adsorbed quantity (Qads) of Cd2+, Pb2+ and Cr3+ by CNS adsorbents
CNS Cashew nut shell, Qads sorbed amount (mg g−1), adj. R2 adjusted coefficient of determination
CNS Qads Adj. R2
Cd2+
in natura: 2.21458 + 0.12968x − 0.011165x2 − 0.00388y + 0.0000017y2 − 0.00001495xy 0.974 H2O2 2.57000 + 0.093847x − 0.009377x2 − 0.004335y + 0.0000019y2 − 0.000000085xy 0.974 H2SO4 1.69901 + 0.20156x − 0.01561x2 − 0.003677y + 0.0000017y2 − 0.0000353xy 0.974 NaOH 2.54068 + 0.08514x − 0.008654x2 − 0.00425y + 0.0000019y2 − 0.000000065xy 0.974
Pb2+
in natura: 2.53173 + 0.080597x − 0.00818x2 − 0.004232y + 0.0000019y2 + 0.0000024xy 0.974 H2O2 2.57000 + 0.09384x − 0.009377x2 − 0.004335y + 0.0000019y2 − 0.000000085xy 0.973 H2SO4 2.48390 + 0.09349x − 0.008266x2 − 0.004119y + 0.0000019y2 − 0.000019xy 0.981 NaOH 0.9391 − 0.1259x + 0.01400x2 − 0.000895y + 0.00000032y2 + 0.0000092xy 0.743
Cr3+
in natura: 1.2984 + 0.5224x − 0.0674x2 − 0.003786y + 0.000001419y2 + 0.0001165xy 0.871 H2O2 1.01747 + 0.5504x − 0.06282x2 − 0.00350y + 0.0000013y2 + 0.00007309xy 0.904 H2SO4 1.19506 + 0.51846x − 0.05737x2 − 0.004155y + 0.00000168y2 + 0.000102917xy 0.884 NaOH 4.9784 − 0.9557x + 0.0631x2 − 0.00463y + 0.0000015y2 + 0.0002691xy 0.971
Fig. 7 Graph of response surface for multivariate analysis for adsorbent masses and pH of the solution by the amount adsorbed (Qads) of Cd2+ (a–d), Pb2+ (e–h) and Cr3+ (i–l) on the shell of cashews (CNS) in natura, modified with H2O2 (b), H2SO4 (c) and NaOH (d)

Applied Water Science (2018) 8:96
1 3
96 Page 12 of 21
cashews for the removal of Cd2+, Pb2+ and Cr3+ also used pH 5.0. As in the present work there was no significant dif-ference for the variable pH, and the experiment was carried out at pH 5.0.
Influence of contact time and evaluation of the kinetic mechanism of adsorption
The influence of the contact time of ions Cd2+, Pb2+ and Cr3+ on the adsorbents CNS H2O2, CNS H2SO4 and CNS NaOH features fast adsorption, decreasing with the increase in time (Fig. 8).
For CNS H2O2, the occurrence of equilibrium in adsorp-tion process at 40 min of stirring, with insignificant varia-tions at higher periods of time, is observed in Fig. 8a. For CNS H2SO4 (Fig. 8b), the equilibrium also occurs at 40 min, with little variations among 160–180 min. For CNS NaOH (Fig. 8c), the equilibrium is again observed at 40 min, with insignificant variations after this period. There is a tendency of depletion of the adsorption sites, suggesting that peri-ods higher than 40 min may be impractical for large-scale systems.
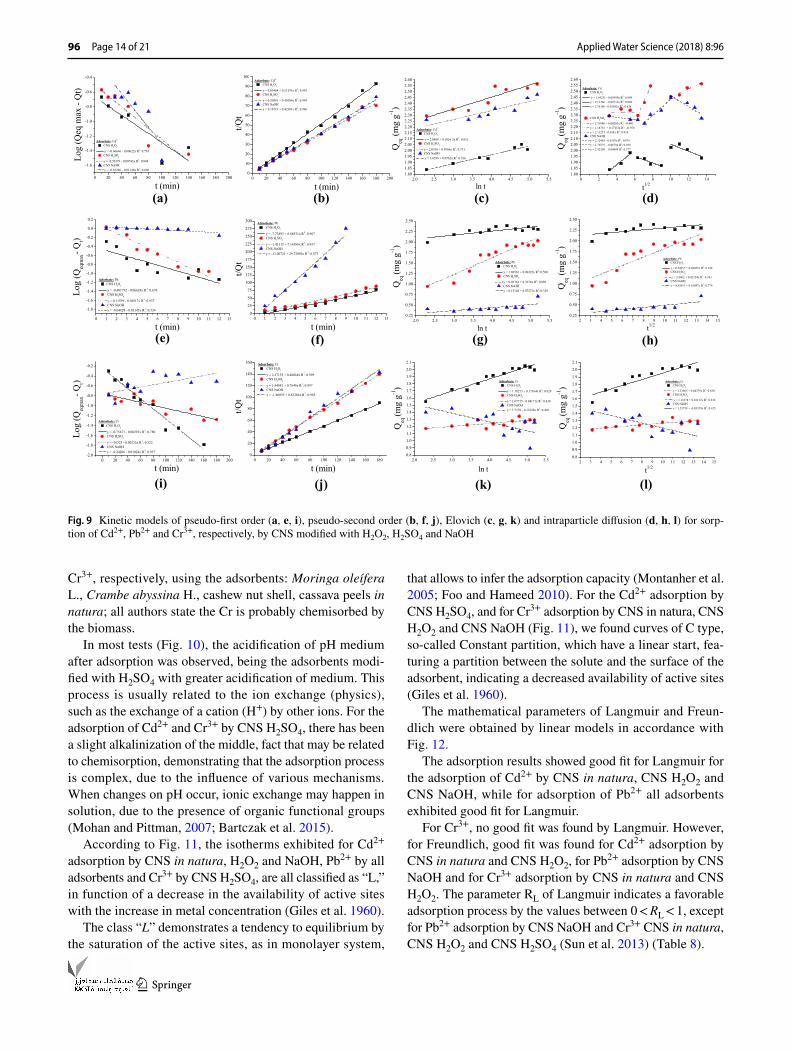
The parameters of pseudo-first and second order, Elovich and intraparticle diffusion for Cd2+, Pb2+ and Cr3+ on the CNS modified with H2O2, H2SO4 and NaOH are exhibited in Table 7 and Fig. 9.
The pseudo-first-order, Elovich and intraparticle diffusion models not exhibited good fit to experimental data. Only the model of pseudo-second-order model exhibited good fit-ting, with values of Qeq(exp.) and Qeq(calc.) next to each other, suggesting the occurrence of chemisorption (Feng et al. 2011). Only for Pb, the pseudo-second order did not exhib-ited values of Qeq (exp.) and Qeq (calc.) next to each other, and we cannot infer the same. Several experiments report good fits for pseudo-second-order models like Gonçalves Jr. et al. (2016) and Nacke et al. (2016), when studying the kinetics of adsorption of the lump of Acai in natura and Jatropha curcas for Cu2+, Zn2+. Also Schwantes et al. (2015) and
Schwantes et al. (2016) for Cd2+, Pb2+ and Cr3+ in crambe pie and cassava peel chemically modified found similar results.
Efficiency of adsorption and desorption
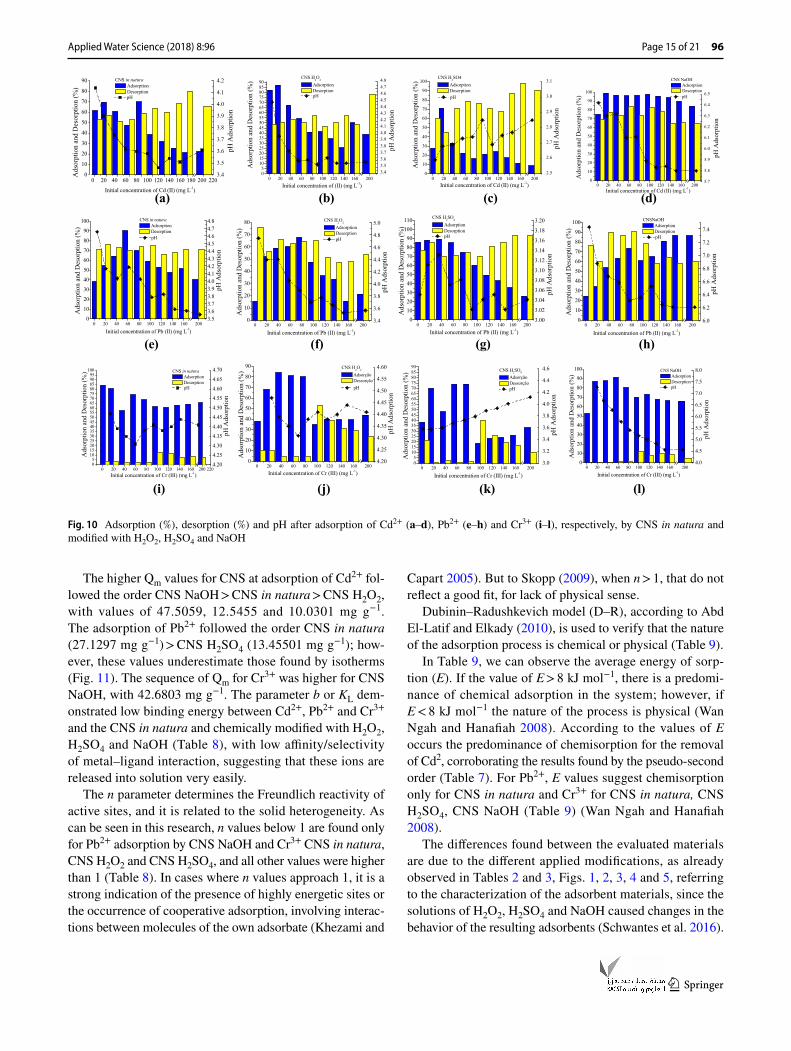
The adsorbents in natura and H2O2 exhibited a tendency to decrease the adsorption efficiency (%) of Pb with the increase in initial concentration of lead. For the adsorption of Cd by CNS H2SO4 initially occurred adsorption increase, leading to a decrease soon followed, which may be related to the fact that the higher energy sites become saturated with the increase in the metal concentration and, only then, occur adsorption in lower energy sites, resulting in a decrease in adsorption efficiency (Bhattacharya et al. 2006). The afore-mentioned result occurred for all evaluated cases, except for the adsorption of Pb by CNS NaOH, where there has been an increase in the removal efficiency, a fact that can be explained by the change of pH by the adsorbent material that alkalined the middle which may have precipitated the Pb.
In the case of Cd2+ adsorption by CNS in natura, CNS H2O2, CNS H2SO4 and CNS NaOH, the efficiency of adsorp-tion was, respectively, 69, 87, 85, 99%; in the case of Pb2+ CNS in natura, CNS H2O2, CNS H2SO4 and CNS NaOH , respectively, 54, 51, 88 and 34%, in the case of Cr3+ by CNS in natura, CNS H2O2, CNS H2SO4 and CNS NaOH, respec-tively, 80, 68, 69 and 86%. In this way, Fig. 10 demonstrates that there has been an increase in the rate of adsorption for Cd2+ when the CNS was with H2O2 and NaOH.
The percentages of desorption for Cd2+ CNS in natura, CNS H2O2, CNS H2SO4 and CNS NaOH were 56, 50, 97 and 77%; for Pb2+ CNS in natura, CNS H2O2, CNS H2SO4 and CNS NaOH the desorption rates were 76, 55, 85 and 60%. For Cr3+ were found lower desorption rates such as 2.9, 9.9, 2 and 0.7%, respectively, for CNS in natura, CNS H2O2, CNS H2SO4 and CNS NaOH (Fig. 10i–l). Meneghel et al. (2013), Rubio et al. (2013b), Coelho et al. (2014) and Schwantes et al. (2015) also found lower desorption rates for
0 20 40 60 80 100 120 140 160 1800.000.250.500.751.001.251.501.752.002.252.502.753.00
CNS in natura CNS H
2O
2
CNS H2SO
4
CNS NaOHQeq
(mg
g-1)
Time (min)
(a)
0 20 40 60 80 100 120 140 160 180 2000.00.20.40.60.81.01.21.41.61.82.02.22.42.62.83.0 CNS in natura
CNS H2O
2
CNS H2SO
4
CNS NaOH
Qeq
(mg
g-1)
Time (min)
(b)
0 20 40 60 80 100 120 140 160 180 2000.00.20.40.60.81.01.21.41.61.82.02.2
CNS in natura CNS H2O2
CNS H2SO4
CNS NaOH
Qeq
(mg
g-1)
Time (min)
(c)
Fig. 8 Effect of contact time of CNS in natura (Coelho et al. 2014) and modified with H2O2, H2SO4 and NaOH in the removal of Cd2+ (a), Pb2+ (b) and Cr3+ (c)

Applied Water Science (2018) 8:96
1 3
Page 13 of 21 96
Tabl
e 7
Kin
etic
par
amet
ers
of p
seud
o-fir
st or
der,
pseu
do-s
econ
d or
der,
Elov
ich,
intra
parti
cle
diffu
sion
and
qua
ntity
of m
etal
ads
orbe
d at
equ
ilibr
ium
(Qeq
(exp
.)) o
btai
ned
for a
dsor
ptio
n of
Cd2+
, Pb
2+ a
nd C
r3+ o
n C
NS
in n
atur
a an
d ch
emic
ally
mod
ified
with
H2O
2, H
2SO
4 and
NaO
H
K1:
first
orde
r rat
e co
nsta
nt; Q
eq: q
uant
ities
of a
dsor
bate
reta
ined
per
gra
m o
f ads
orbe
nt a
t equ
ilibr
ium
; K2:
seco
nd o
rder
rate
con
stan
t; A:
con
stan
t tha
t ind
icat
es th
e sp
eed
of in
itial
che
mis
orp-
tion;
B: n
umbe
r of s
uita
ble
site
s for
ads
orpt
ion,
rela
ted
to th
e ex
tens
ion
of c
over
age
of th
e su
rface
and
the
activ
atio
n en
ergy
of c
hem
isor
ptio
n; A
dj. R
2 : adj
uste
d co
effici
ent o
f det
erm
inat
ion;
Kid
: in
trapa
rticl
e di
ffusi
on c
onst
ant;
Ci:
sugg
ests
the
thic
knes
s of t
he b
ound
ary
laye
r effe
ct*S
ourc
e: C
oelh
o et
al.
(201
4)Pseu
do-fi
rst o
rder
Pseu
do-s
econ
d or
der
Elov
ich
K1 (
min
−1 )
Qeq
(cal
.) (m
g g−
1 )A
dj. R
2K
2 (g
mg−
1 min
−1 )
Qeq
(cal
.) (m
g g−
1 )A
dj. R
2A
(mg
g−1 h
−1 )
B (g
mg−
1 )A
dj. R
2
Cd2+
In n
atur
a*−
0.0
109
0.02
330.
406
4.89
910.
7166
0.99
90.
6590
0.01
210.
776
H2O
2−
0.0
143
0.21
550.
754
7.59
461.
9497
0.99
52.
0469
0.10
170.
821
H2S
O4
− 0
.017
10.
3149
0.86
80.
3181
2.49
320.
994
2.03
360.
0766
0.73
1N
aOH
− 0
.026
40.
6873
0.69
00.
9559
2.36
400.
996
1.65
990.
0762
0.91
3Pb
2+In
nat
ura*
− 0
.014
40.
0855
0.81
50.
6810
0.76
900.
999
0.61
980.
0283
0.86
7H
2O2
− 0
.152
60.
3820
0.67
6−
5.7
751
0.14
960.
967
1.88
560.
0942
0.58
0H
2SO
4−
0.2
491
1.30
610.
937
− 3
5.66
00.
1400
0.95
70.
0376
0.39
780.
889
NaO
H−
0.0
263
1.11
760.
524
− 6
7.91
10.
0336
0.97
30.
1510
0.07
270.
329
Cr3+
In n
atur
a*−
0.0
118
0.05
510.
320
1.51
670.
6856
0.99
90.
4962
0.04
030.
580
H2O
2−
0.0
067
0.17
510.
780
0.10
152.
0823
0.99
91.
1827
0.17
160.
929
H2S
O4
0.00
530.
1725
0.32
20.
3165
1.30
740.
997
1.07
710.
0417
0.43
8N
aOH
− 0
.023
00.
5727
0.95
7−
0.3
729
1.20
070.
986
1.75
78−
0.1
234
0.41
0
Intra
parti
cle
diffu
sion
Kid
(g m
g−1 m
in−
1/2 )
Ci (
mg
g−1 )
Adj
. R2
Qeq
(exp
.) (m
g g−
1 )
Line
ALi
ne B
Line
CLi
ne A
Line
BLi
ne C
Line
ALi
ne B
Line
C
Cd2+
In n
atur
a*0.
0112
0.00
310.
0028
0.64
740.
6895
0.67
900.
945
0.99
80.
461
0.71
74H
2O2
0.05
99−
0.0
273
− 0
.029
81.
6423
2.11
372.
3519
0.89
80.
802
0.62
41.
9367
H2S
O4
0.00
200.
1740
0.03
402.
3110
1.18
702.
1130
− 0
.487
0.97
80.
910
2.42
399
NaO
H−
0.0
110
0.06
79−
0.0
460
2.32
461.
7558
2.92
300.
879
0.92
90.
778
2.33
34Pb
2+In
nat
ura*
0.02
760.
0080
0.00
930.
5954
0.67
730.
6457
0.36
70.
627
0.83
10.
7323
H2O
20.
0249
0.02
420.
524
2.23
72H
2SO
40.
0215
2.09
020.
393
1.67
46N
aOH
0.82
010.
1005
0.77
60.
5855
Cr3+
In n
atur
a*0.
0427
0.00
290.
0045
0.43
950.
6671
0.62
440.
546
0.56
60.
249
0.65
60H
2O2
0.04
371.
5166
0.83
01.
8890
H2S
O4
0.01
111.
1537
0.43
71.
2487
NaO
H−
0.0
335
1.53
740.
415
1.26
95
Applied Water Science (2018) 8:96
1 3
96 Page 14 of 21
Cr3+, respectively, using the adsorbents: Moringa oleífera L., Crambe abyssina H., cashew nut shell, cassava peels in natura; all authors state the Cr is probably chemisorbed by the biomass.
In most tests (Fig. 10), the acidification of pH medium after adsorption was observed, being the adsorbents modi-fied with H2SO4 with greater acidification of medium. This process is usually related to the ion exchange (physics), such as the exchange of a cation (H+) by other ions. For the adsorption of Cd2+ and Cr3+ by CNS H2SO4, there has been a slight alkalinization of the middle, fact that may be related to chemisorption, demonstrating that the adsorption process is complex, due to the influence of various mechanisms. When changes on pH occur, ionic exchange may happen in solution, due to the presence of organic functional groups (Mohan and Pittman, 2007; Bartczak et al. 2015).
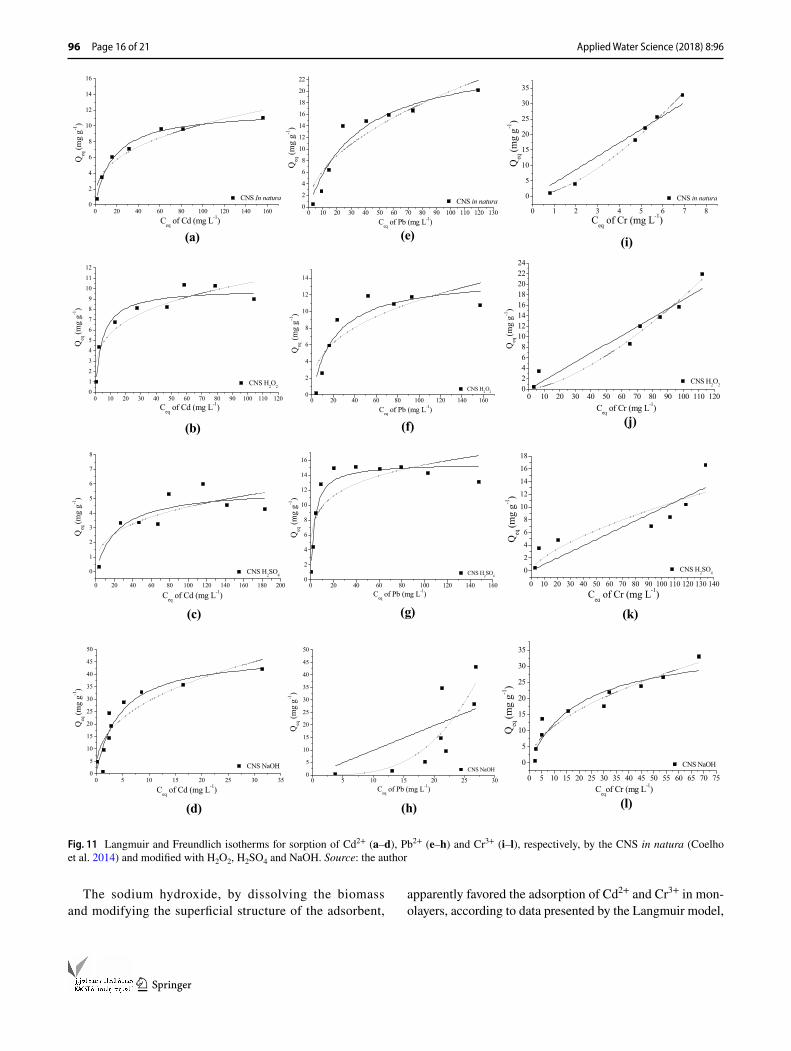
According to Fig. 11, the isotherms exhibited for Cd2+ adsorption by CNS in natura, H2O2 and NaOH, Pb2+ by all adsorbents and Cr3+ by CNS H2SO4, are all classified as “L,” in function of a decrease in the availability of active sites with the increase in metal concentration (Giles et al. 1960).
The class “L” demonstrates a tendency to equilibrium by the saturation of the active sites, as in monolayer system,
that allows to infer the adsorption capacity (Montanher et al. 2005; Foo and Hameed 2010). For the Cd2+ adsorption by CNS H2SO4, and for Cr3+ adsorption by CNS in natura, CNS H2O2 and CNS NaOH (Fig. 11), we found curves of C type, so-called Constant partition, which have a linear start, fea-turing a partition between the solute and the surface of the adsorbent, indicating a decreased availability of active sites (Giles et al. 1960).
The mathematical parameters of Langmuir and Freun-dlich were obtained by linear models in accordance with Fig. 12.
The adsorption results showed good fit for Langmuir for the adsorption of Cd2+ by CNS in natura, CNS H2O2 and CNS NaOH, while for adsorption of Pb2+ all adsorbents exhibited good fit for Langmuir.
For Cr3+, no good fit was found by Langmuir. However, for Freundlich, good fit was found for Cd2+ adsorption by CNS in natura and CNS H2O2, for Pb2+ adsorption by CNS NaOH and for Cr3+ adsorption by CNS in natura and CNS H2O2. The parameter RL of Langmuir indicates a favorable adsorption process by the values between 0 < RL < 1, except for Pb2+ adsorption by CNS NaOH and Cr3+ CNS in natura, CNS H2O2 and CNS H2SO4 (Sun et al. 2013) (Table 8).
0 20 40 60 80 100 120 140 160 180 200
-1.6
-1.4
-1.2
-1.0
-0.8
-0.6
-0.4
(a)
Adsorbate: Cd2+
CNS H2O2
y = -0.66646 - 0.00622x R2: 0.754CNS H
2SO
4
y = -0.50179 - 0.00743x R2: 0.868CNS NaOH y = -0.16286 - 0.01146x R2: 0.690
Log
(Qeq
max
- Q
t)
t (min)0 20 40 60 80 100 120 140 160 180 200
0
10
20
30
40
50
60
70
80
90
100
(b)
Adsorbate: Cd2+
CNS H2O
2
y = 0.03464 + 0.51291x R2: 0.995 CNS H2SO4
y = 0.50581 + 0.40109x R2: 0.994 CNS NaOH y = 0.18719 + 0.42301x R2: 0.996
t/Qt
t (min)2.0 2.5 3.0 3.5 4.0 4.5 5.0 5.5
1.801.851.901.952.002.052.102.152.202.252.302.352.402.452.502.552.60
(c)
Adsorbate: Cd2+
CNS H2O2
y = 2.0468 + 0.1016 2x R2: 0.821CNS H
2SO
4
y = 2.0336 + 0.0766x R2: 0.731CNS NaOH y = 1.6599 + 0.0762x R2: 0.916
Qeq
(mg
g-1)
ln t0 2 4 6 8 10 12 14
1.801.851.901.952.002.052.102.152.202.252.302.352.402.452.502.552.60
t1/2
Qeq
(mg
g-1)
(d)
Adsorbate: Cd CNS H2O2
y = 1.64231 - 0.05995x R2: 0.898 y = 2.11366 - 0.02731x R2: 0.802 y = 2.35186 - 0.02982x R2: 0.624
CNS H2SO4
y = 2.31086 + 0.00203x R2: -0.486 y = 1.18735 + 0.17433x R2: -0..978 y = 2.11251 - 0.034x R2: 0.910 CNS NaOH y = 2.32463 - 0.0107x R2: 0.879 y = 1.75575 - 0.0679x R2: 0.929 y = 2.92309 - 0.04609 R2: 0.777
0 1 2 3 4 5 6 7 8 9 10 11 12 13
-1.8
-1.6
-1.4
-1.2
-1.0
-0.8
-0.6
-0.4
-0.2
0.0
0.2
(e)
Log
(Qeq
max
- Qt)
Adorbate: PbCNS H
2O
2
y = -0.401792 - 0.06628x R2: 0.676 CNS H2SO4
y = 0.11599 - 0.10817x R2: 0.937 CNS NaOH y = -0.04828 - 0.01143x R2: 0.524
t (min)0 1 2 3 4 5 6 7 8 9 10 11 12 13
0
25
50
75
100
125
150
175
200
225
250
275
300
(f)
Adsorbate: Pb CNS H2O2
y = -7.73893 + 6.68531x R2: 0.967 CNS H
2SO
4
y = -1.43115 + 7.14388x R2: 0.957 CNS NaOH y = -13.00721 + 29.72092x R2: 0.973
t/Qt
t (min)2.0 2.5 3.0 3.5 4.0 4.5 5.0 5.5
0.25
0.50
0.75
1.00
1.25
1.50
1.75
2.00
2.25
2.50
(g)
Adsorbate: Pb CNS H
2O
2
y = 1.88563 + 0.09422x R2: 0.580 CNS H2SO4
y = 0.03763 + 0.3978x R2: 0.889 CNS NaOH y = 0.15102 + 0.07273x R2: 0.329
Qeq
(mg
g-1)
ln t2 3 4 5 6 7 8 9 10 11 12 13 14 15
0.25
0.50
0.75
1.00
1.25
1.50
1.75
2.00
2.25
2.50
(h)t1/2
Qeq
(mg
g-1)
Adsorbate: Pb CNS H2O2
y = 0.24917 + 0.02425x R2: 0.524 CNS H2SO4
y = 2.0902 + 0.02154x R2: 0.393 CNS NaOH y = 0.82011 + 0.10047x R2: 0.776
0 20 40 60 80 100 120 140 160 180 200-2.0
-1.8
-1.6
-1.4
-1.2
-1.0
-0.8
-0.6
-0.4
-0.2
(i)
Log
(Qeq
max
- Qt)
Adsorbate: CrCNS H
2O
2
y = -0.75671 - 0.00292x R2: 0.780 CNS H2SO4
y = -76323 - 0.00232x R2: 0.322 CNS NaOH y = -0.24206 - 0.01024x R2: 0.957
t (min)0 20 40 60 80 100 120 140 160 180
0
20
40
60
80
100
120
140
160
(j)
Adsorbate: Cr CNS H2O2
y = 2.27155 + 0.48024x R2: 0.999 CNS H2SO4
y = 1.84881 + 0.7649x R2: 0.997 CNS NaOH y = -1.86039 + 0.83286x R2: 0.985
t/Qt
t (min)2.0 2.5 3.0 3.5 4.0 4.5 5.0 5.5
0.8
0.91.01.1
1.21.31.4
1.51.61.7
1.81.92.0
2.1
(k)
Adsorbate: Cr CNS H
2O
2
y = 1.18273 + 0.17164x R2: 0.929 CNS H2SO4
y = 1.07715 - 0.04171x R2: 0.438 CNS NaOH y = 1.7578 - 0.12328x R2: 0.410
Qeq
(mg
g-1)
ln t2 3 4 5 6 7 8 9 10 11 12 13 14 15
0.8
0.9
1.0
1.1
1.2
1.3
1.4
1.5
1.6
1.7
1.8
1.9
2.0
2.1
(l)
Adsorbate: Cr CNS H2O2
y = 1.51665 + 0.04379x R2: 0.830 CNS H2SO4
y = 1.15378 + 0.01117x R2: 0.436 CNS NaOH y = 1.53739 + -0.03359x R2: 0.415
t1/2
Qeq
(mg
g-1)
Fig. 9 Kinetic models of pseudo-first order (a, e, i), pseudo-second order (b, f, j), Elovich (c, g, k) and intraparticle diffusion (d, h, l) for sorp-tion of Cd2+, Pb2+ and Cr3+, respectively, by CNS modified with H2O2, H2SO4 and NaOH
Applied Water Science (2018) 8:96
1 3
Page 15 of 21 96
The higher Qm values for CNS at adsorption of Cd2+ fol-lowed the order CNS NaOH > CNS in natura > CNS H2O2, with values of 47.5059, 12.5455 and 10.0301 mg g−1. The adsorption of Pb2+ followed the order CNS in natura (27.1297 mg g−1) > CNS H2SO4 (13.45501 mg g−1); how-ever, these values underestimate those found by isotherms (Fig. 11). The sequence of Qm for Cr3+ was higher for CNS NaOH, with 42.6803 mg g−1. The parameter b or KL dem-onstrated low binding energy between Cd2+, Pb2+ and Cr3+ and the CNS in natura and chemically modified with H2O2, H2SO4 and NaOH (Table 8), with low affinity/selectivity of metal–ligand interaction, suggesting that these ions are released into solution very easily.
The n parameter determines the Freundlich reactivity of active sites, and it is related to the solid heterogeneity. As can be seen in this research, n values below 1 are found only for Pb2+ adsorption by CNS NaOH and Cr3+ CNS in natura, CNS H2O2 and CNS H2SO4, and all other values were higher than 1 (Table 8). In cases where n values approach 1, it is a strong indication of the presence of highly energetic sites or the occurrence of cooperative adsorption, involving interac-tions between molecules of the own adsorbate (Khezami and
Capart 2005). But to Skopp (2009), when n > 1, that do not reflect a good fit, for lack of physical sense.
Dubinin–Radushkevich model (D–R), according to Abd El-Latif and Elkady (2010), is used to verify that the nature of the adsorption process is chemical or physical (Table 9).
In Table 9, we can observe the average energy of sorp-tion (E). If the value of E > 8 kJ mol−1, there is a predomi-nance of chemical adsorption in the system; however, if E < 8 kJ mol−1 the nature of the process is physical (Wan Ngah and Hanafiah 2008). According to the values of E occurs the predominance of chemisorption for the removal of Cd2, corroborating the results found by the pseudo-second order (Table 7). For Pb2+, E values suggest chemisorption only for CNS in natura and Cr3+ for CNS in natura, CNS H2SO4, CNS NaOH (Table 9) (Wan Ngah and Hanafiah 2008).
The differences found between the evaluated materials are due to the different applied modifications, as already observed in Tables 2 and 3, Figs. 1, 2, 3, 4 and 5, referring to the characterization of the adsorbent materials, since the solutions of H2O2, H2SO4 and NaOH caused changes in the behavior of the resulting adsorbents (Schwantes et al. 2016).
0 20 40 60 80 100 120 140 160 180 200 2203.4
3.5
3.6
3.7
3.8
3.9
4.0
4.1
4.2
0
10
20
30
40
50
60
70
80
90A
dsor
ptio
n an
d D
esor
ptio
n (%
)CNS in natura
Adsorption Desorption
(a)
pH A
dsor
ptio
n
pH
Initial concentration of Cd (II) (mg L-1)
3.43.53.63.73.83.94.04.14.24.34.44.54.64.74.8
0 20 40 60 80 100 120 140 160 20005
1015202530354045505560657075808590
Initial concentration of (II) (mg L-1)
CNS H2O
2
Adsorption Desorption
Ads
orpt
ion
and
Des
orpt
ion
(%)
pH
pH A
dsor
ptio
n
(b)
2.5
2.6
2.7
2.8
2.9
3.0
3.1
0 20 40 60 80 100 120 140 160 2000
10
20
30
40
50
60
70
80
90
100
Ads
orpt
ion
and
Des
orpt
ion
(%)
CNS H2SO4
Adsorption Desorption
Initial concentration of Cd (II) (mg L-1)
pH A
dsor
ptio
n
pH
(c)5.7
5.8
5.9
6.0
6.1
6.2
6.3
6.4
6.5
0 20 40 60 80 100 120 140 160 2000
10
20
30
40
50
60
70
80
90
100
Ads
orpt
ion
and
Des
orpt
ion
(%)
Initial concentration of Cd (II) (mg L-1)
CNS NaOH Adsorption Desorption
(d)
pH A
dsor
ptio
n
pH
3.53.63.73.83.94.04.14.24.34.44.54.64.74.8
0 20 40 60 80 100 120 140 160 2000
10
20
30
40
50
60
70
80
90
100 CNS in natura Adsorption Desorption
Ads
orpt
ion
and
Des
orpt
ion
(%)
Initial concentration of Pb (II) (mg L-1)
pH
pH A
dsor
ptio
n
(e)
3.4
3.6
3.8
4.0
4.2
4.4
4.6
4.8
5.0
0 20 40 60 80 100 120 140 160 2000
10
20
30
40
50
60
70
80
(f)
Ads
orpt
ion
and
Des
orpt
ion
(%)
Initial concentration of Pb (II) (mg L-1)
CNS H2O
2
Adsorption Desorption pH
pH A
dsor
ptio
n
3.00
3.02
3.04
3.06
3.08
3.10
3.12
3.14
3.16
3.18
3.20
0 20 40 60 80 100 120 140 160 2000
102030405060708090
100110
Ads
orpt
ion
and
Des
orpt
ion
(%)
Initial concentration of Pb (II) (mg L-1)
CNS H2SO4
Adsorption Desorption
(g)
pH
pH A
dsor
ptio
n
6.0
6.2
6.4
6.6
6.8
7.0
7.2
7.4
0 20 40 60 80 100 120 140 160 2000
10
20
30
40
50
60
70
80
90
100
Ads
orpt
ion
and
Des
orpt
ion
(%)
Initial concentration of Pb (II) (mg L-1)
CNSNaOH Adsorption Desorption
(h)
pH
pH A
dsor
ptio
n
0 20 40 60 80 100 120 140 160 200 22005
101520253035404550556065707580859095
100
4.20
4.25
4.30
4.35
4.40
4.45
4.50
4.55
4.60
4.65
4.70CNS in natura Adsorption Desorption
Ads
orpt
ion
and
Des
orpt
ion
(%)
Initial concentration of Cr (III) (mg L-1)
pH A
dsor
ptio
n
(i)
pH
4.20
4.25
4.30
4.35
4.40
4.45
4.50
4.55
4.60
0 20 40 60 80 100 120 140 160 2000
10
20
30
40
50
60
70
80
90
Initial concentration of Cr (III) (mg L-1)
Ads
orpt
ion
and
Des
orpt
ion
(%)
CNS H2O
2
Adsorção Dessorção
(j)
pH A
dsor
ptio
n pH
3.0
3.2
3.4
3.6
3.8
4.0
4.2
4.4
4.6
0 20 40 60 80 100 120 140 160 20005
1015202530354045505560657075808590
CNS H2SO4
Adsorção Dessorção
Ads
orpt
ion
and
Des
orpt
ion
(%)
Initial concentration of Cr (III) (mg L-1)
(k)
pH
pH A
dsor
ptio
n
4.0
4.5
5.0
5.5
6.0
6.5
7.0
7.5
8.0
0 20 40 60 80 100 120 140 160 2000
10
20
30
40
50
60
70
80
90
100 CNS NaOHAdsorptionDesorption
Ads
orpt
ion
and
Des
orpt
ion
(%)
Initial concentration of Cr (III) (mg L-1)
pH A
dsor
ptio
n
pH
(l)
Fig. 10 Adsorption (%), desorption (%) and pH after adsorption of Cd2+ (a–d), Pb2+ (e–h) and Cr3+ (i–l), respectively, by CNS in natura and modified with H2O2, H2SO4 and NaOH
Applied Water Science (2018) 8:96
1 3
96 Page 16 of 21
The sodium hydroxide, by dissolving the biomass and modifying the superficial structure of the adsorbent,
apparently favored the adsorption of Cd2+ and Cr3+ in mon-olayers, according to data presented by the Langmuir model,
0 20 40 60 80 100 120 140 1600
2
4
6
8
10
12
14
16
(a)
CNS In natura
Ceq of Cd (mg L-1)
Qeq
(mg
g-1)
0 10 20 30 40 50 60 70 80 90 100 110 120 1300
2
4
6
8
10
12
14
16
18
20
22
(e)
CNS in natura
Ceq
of Pb (mg L-1)
Qeq
(mg
g-1)
0 1 2 3 4 5 6 7 8
0
5
10
15
20
25
30
35
(i)
CNS in natura
Ceq of Cr (mg L-1)
Qeq
(mg
g-1)
0 10 20 30 40 50 60 70 80 90 100 110 12001
2
3
45
6
7
89
10
11
12
(b)
CNS H2O2
Ceq
of Cd (mg L-1)
Qeq
(mg
g-1)
0 20 40 60 80 100 120 140 1600
2
4
6
8
10
12
14
(f)
CNS H2O2
Ceq
of Pb (mg L-1)
Qeq
(mg
g-1)
0 10 20 30 40 50 60 70 80 90 100 110 12002468
1012141618202224
(j)
CNS H2O2
Ceq of Cr (mg L-1)
Qeq
(mg
g-1)
0 20 40 60 80 100 120 140 160 180 200
0
1
2
3
4
5
6
7
8
(c)
CNS H2SO4
Ceq of Cd (mg L-1)
Qeq
(mg
g-1)
0 20 40 60 80 100 120 140 1600
2
4
6
8
10
12
14
16
(g)
CNS H2SO4
Ceq of Pb (mg L-1)
Qeq
(mg
g-1)
0 10 20 30 40 50 60 70 80 90 100 110 120 130 140
0
2
4
6
8
10
12
14
16
18
(k)
CNS H2SO4
Ceq of Cr (mg L-1)
Qeq
(mg
g-1)
0 5 10 15 20 25 30 350
5
10
15
20
25
30
35
40
45
50
(d)
CNS NaOH
Ceq of Cd (mg L-1)
Qeq
(mg
g-1)
0 5 10 15 20 25 300
5
10
15
20
25
30
35
40
45
50
(h)
CNS NaOH
Ceq of Pb (mg L-1)
Qeq
(mg
g-1)
0 5 10 15 20 25 30 35 40 45 50 55 60 65 70 75
0
5
10
15
20
25
30
35
(l)
CNS NaOH
Ceq
of Cr (mg L-1)
Qeq
(mg
g-1)
Fig. 11 Langmuir and Freundlich isotherms for sorption of Cd2+ (a–d), Pb2+ (e–h) and Cr3+ (i–l), respectively, by the CNS in natura (Coelho et al. 2014) and modified with H2O2, H2SO4 and NaOH. Source: the author

Applied Water Science (2018) 8:96
1 3
Page 17 of 21 96
increasing the estimated adsorption capacity by 370× when compared to the biosorbent values.
Adsorption thermodynamics
In Table 10 can be observed the thermodynamics parameters for adsorption of Cd2+, Pb2+ and Cr3+ on the shell of cash-ews (CNS) in natura and chemically modified with H2O2, H2SO4 and NaOH.
As can be observed in Table 10, for Cd2+ on CNS H2O2, CNS H2SO4 and CNS NaOH, for Pb2+ adsorption for all studied adsorbents and for Cr3+ adsorption by CNS in
natura, CNS H2O2 and CNS H2SO4, the values of ΔG were positive in all studied temperatures, suggesting a nonspon-taneous and nonfavorable adsorption process. The opposite was observed for Cr3+ adsorption by CNS NaOH. For Cd2+ adsorption by CNS in natura, it is found a spontaneous pro-cess at temperatures between 15 and 25 °C, becoming nega-tive above 25 °C.
The values of enthalpy (ΔH) predict if the system is endo-thermic, when ΔH is positive, or exothermic, when ΔH is negative (Wan Ngah and Fatinathan 2010). We can observe positive values of ΔH (endothermic system) for all adsor-bents, except for Cd2+ adsorption by CNS in natura. Also,
0 20 40 60 80 100 120 140 160 180 20005
101520253035404550 CNS in natura
y = 1,72225 + 0,07971x R2= 0,990CNS H2O2
y= 0,5276 + 0,0997x R2= 0,977CNS H2SO4
y= 0,9756 + 0,20942x R2= 0,900CNS NaOH y= 0,0906 + 0,02105x R2= 0,984
Ceq
/Qeq
Ceq of Cd2+ (mg L-1)
(a)
0 20 40 60 80 100 120 140 1600
2
4
6
8
10
12
14
16 CNS in natura y= 1,52463 + 0,03686x R2 = 0,978CNS H
2O
2
y= 0,55117 + 0,08604x R2= 0,977CNS H2SO4
y= -0,15788 + 0,0738x R2= 0,991CNS NaOH y= 13,17861 - 0,47539x R2= 0926
Ceq
/Qeq
Ceq of Pb2+ (mg L-1)
(b)
0 10 20 30 40 50 60 70 80 90 100 110 120 130 1400123456789
1011121314
CNS in natura y= 0,73546 - 0,08817x R2= 0.858CNS H
2O
2
y= 10,54398 - 0,04769x R2= 0,904CNS H
2SO
4
y= 25,28811 - 0,12384x R2= 0,829 CNS NaOH y= 0,70719 + 0,02343x R2= 0,861
Ceq
/Qeq
Ceq of Cr3+ (mg L-1)
(c)
-0.8 -0.4 0.0 0.4 0.8 1.2 1.6 2.0
-0.5
0.0
0.5
1.0
1.5
2.0
CNS in natura y= 0,3127 + 0,35291x R2= 0,940 CNS H2O2
y= 0,54192 + 0,24966x R2 = 0,958 CNS H2SO4
y= -0,66866 + 0,66702x R2= 0,818 CNS NaOH y= 1,03814 + 0,45053x R2= 0,891
Log
Qeq
Log Ceq of Cd2+
(d)
0.6 0.8 1.0 1.2 1.4 1.6 1.8 2.0 2.2
0.2
0.4
0.6
0.8
1.0
1.2
1.4
1.6
1.8
CNS in natura y= -0.03875 + 0,70012x R2= 0,772 CNS H2O2
y= -0,05213 + 0,62633x R2= 0,730 CNS H
2SO
4
y= 0,91316 + 0,15429x R2= 0,633 CNS NaOH y= -4,66027 + 4,3446x R2= 0,964
Log
Qeq
Log Ceq of Pb2+
(e)
-0.2 0.0 0.2 0.4 0.6 0.8 1.0 1.2 1.4 1.6 1.8 2.0 2.2
-0.4
-0.2
0.0
0.2
0.4
0.6
0.8
1.0
1.2
1.4
1.6
CNS in natura y= 0,16402 + 1,62323 x R2= 0,998 CNS H2O2
y= -1,78305 + 1,51529 x R2 = 0,934 CNS H2SO4
y= -3,67143 + 2,28178 x R2= 0,896 CNS NaOH y= 0,51793 + 0,53346 R2= 0,856
Log
Qeq
Log Ceq of Cr3+
(f)
Fig. 12 Linearization of the mathematical models of adsorbent materials: CNS in natura (Coelho et al. 2014) and modified with H2O2, H2SO4 and NaOH by Langmuir for Cd2+ (a), Pb2+ (b), Cr3+ (c) and Freundlich for Cd2+ (d), Pb2+ (e) and Cr3+ (f)

Applied Water Science (2018) 8:96
1 3
96 Page 18 of 21
the results exhibit values of ΔH higher than 40 kJ mol−1, suggesting possible chemisorption of Pb2+ by CNS H2SO4 (84.77 kJ mol−1) and physisorption for all other processes (Mimura et al. 2010).
Positive values of entropy (ΔS), as observed for Pb2+ adsorption by CNS NaOH, and Cr3+ adsorption by CNS in natura and CNS NaOH (Table 10), suggest a system disor-der, probably due to an increase in the disorder of solid–solu-tion interface, indicating randomness on solid–solution interface (Rao and Khan 2009).
Conclusion
The adsorbents from the cashew nut shell (CNS) chemi-cally modified with NaOH, H2SO4 and H2O2, exhibited differences between the presence of chemical elements,
morphology, porosity, point of zero charge, except for ther-mal stability.
The infrared spectra demonstrated the existence of anionic functional groups (hydroxyl, carboxylic acid and amines) with differences in structure between the modified adsorbents, such as the presence of polysaccharides of bonds C–O–P for CNS H2SO4, carboxylic acids to CNS H2O2 and CNS H2SO4 and hydrocarbons to CNS NaOH.
The variation of pH caused little influence in adsorp-tion tests; however, the mass of 200 mg (4 g L−1) demon-strated the best adsorption rate, occurring in time of 40-min balance.
The kinetic models of pseudo-first order, Elovich and intraparticle diffusion did not fit to experimental data, and good fiting was only found by the model of pseudo-second order, suggesting chemisorption.
The parameters of Langmuir were satisfactory for Cd2+ adsorption by CNS in natura, CNS H2O2 and CNS NaOH,
Table 8 Parameters of Langmuir and Freundlich adsorption parameters on the shell of cashews (CNS) in natura and modified with H2O2, H2SO4 and NaOH
Qm: adsorption capacity; b or KL: constant interaction forces-related adsorbent/adsorbate; RL: Langmuir constant; Adj. R2: adjusted coefficient of determination; Kf: related to the adsorption capacity; n: related to the heterogeneity of the solid, SE standard error*Source: Coelho et al. (2014)
Experimental conditions
Langmuir constants Freundlich constants
Qm (mg g−1) SE b ou KL (L mg−1) SE RL Adj. R2 Kf (mg g−1) SE n SE Adj. R2
Cd2+ in natura* 12.545 0.229 0.137 0.003 0.035 0.990 2.054 0.064 2.834 0.039 0.940H2O2 10.030 0.309 0.052 0.005 0.086 0.977 3.482 0.033 4.005 0.249 0.958H2SO4 4.775 3.461 0.204 0.030 0.023 0.900 0.214 0.211 1.499 0.117 0.818NaOH 47.505 0.014 0.001 0.001 0.723 0.985 10.917 0.050 2.220 0.058 0.891
Pb2+ in natura* 27.129 0.1933 0.056 0.002 0.081 0.978 0.914 0.240 1.428 0.151 0.772H2O2 11.622 0.4900 0.047 0.005 0.095 0.977 0.886 0.272 1.597 0.182 0.730H2SO4 13.550 0.1959 0.011 0.002 0.751 0.991 8.187 0.076 6.481 0.054 0.633NaOH 0.230 0.5499 − 2.024 0.417 − 0.000 0.926 0.012 0.408 0.456 0.337 0.964
Cr3+ in natura* 11.341 0.0746 − 0.064 0.015 − 0.083 0.858 1.458 0.016 0.616 0.026 0.998H2O2 20.968 0.8037 − 0.502 0.008 − 0.502 0.904 0.016 0.384 0.660 0.199 0.934H2SO4 8.074 3.5660 − 3.131 0.031 − 0.001 0.829 0.000 0.900 0.438 0.439 0.864NaOH 42.680 0.1743 0.016 0.004 0.231 0.861 3.295 0.207 1.875 0.122 0.856
Table 9 Parameters of Dubinin–Radushkevich (D–R) related to adsorption of Cd2+, Pb2+ and Cr3+ on the shell of the cashew nut (CNS) in natura and modified with H2O2, H2SO4 and NaOH
Qd: maximum capacity of adsorption (mol g−1); E: average energy of sorption (kJ mol−1); adj. R2: adjusted coefficient of determination*Source: Coelho et al. (2014)
D–R CNSin natura*
CNSH2O2
CNSH2SO4
CNSNaOH
CNSin natura*
CNSH2O2
CNSH2SO4
CNSNaOH
CNSin natura*
CNSH2O2
CNSH2SO4
CNSNaOH
Cd Pb Cr
Qd 2.89e−3 2.0e−6 3.2e−6 10.9e−5 1.41e−2 2.06e−4 6.01e−5 0.0804 6.66e−3 1.84e−4 5.19e−5 7.72e−5
E 10.435 12.539 8.214 12.109 8.513 7.240 10.494 5.654 9.834 7.344 8.305 10.648Adj. R2 0.989 0.706 0.933 0.907 0.992 0.692 0.808 0.910 0.985 0.986 0.879 0.875

Applied Water Science (2018) 8:96
1 3
Page 19 of 21 96
just as for Pb2+ adsorption by CNS in natura, CNS H2O2 and CNS H2SO4, and for Cr3+ adsorption tests we found no good fit. For Freundlich, good fit was found for Cd2+ adsorption by CNS in natura and CNS H2O2, for Pb2+ adsorption by CNS NaOH and for Cr3+ adsorption by CNS in natura and CNS H2O2.
The model of Dubinin–Radushkevich suggested the pre-dominance of chemisorption, according to the values of energy sorption (E) for the adsorption of Cd2+ on all studied adsorbents. D-R suggests also the chemisorption of Pb2+ by CNS in natura and for the Cr3+ adsorption by CNS in natura, CNS H2SO4, CNS NaOH.
When compared to CNS in natura, the shell of the cashew nut modified with H2O2 and H2SO4 and NaOH has potential for high efficiency removal of metal from water, being the best adsorption rates of Cd2+ obtained after modification with H2O2 and NaOH, and for Pb2+ adsorption best results were found for CNS H2SO4 and for Cr3+ with CNS NaOH.
Acknowledgements To Capes and CNPq for the funding of this research.
Open Access This article is distributed under the terms of the Crea-tive Commons Attribution 4.0 International License (http://creat iveco mmons .org/licen ses/by/4.0/), which permits unrestricted use,
distribution, and reproduction in any medium, provided you give appro-priate credit to the original author(s) and the source, provide a link to the Creative Commons license, and indicate if changes were made.
References
Abd El-Latif MM, Elkadym MF (2010) Equilibrium isotherms for harmful ions sorption using nano zirconium vanadate ion exchanger. Desalin Water Treat 255(1–3):21–43. https ://doi.org/10.1016/j.desal .2010.01.020
AOAC (Association of Official Analytical Chemist) (2005) Official methods of analysis, 8th ed. Maryland
Apte AD, Tare V, Bose P (2005) Oxidation of Cr(III) in tannery sludge to Cr(VI): field observations and theoretical assessment. J Hazard Mater 121:215–222. https ://doi.org/10.1016/j.jhazm at.2005.02.010
Barka N, Ouzaouit K, Abdennouri M, El MakhfoukM, Qourzal S, Ass-abbane A, Ait-Ichou Y, Nounah A (2010) Biosorption character-istics of Cadmium(II) onto Scolymus hispanicus L. as low-cost natural biosorbent. Desalin. Water Treat 258(1–3):66–71. https ://doi.org/10.1016/j.desal .2010.03.046
Barrett EP, Joyner LG, Halenda PP (1951) The determination of pore volume and area distributions in porous substances I. Computation from nitrogen isotherms. J Am Chem Soc 73(1):373–380. https ://doi.org/10.1021/ja011 45a12 6
Barros, NB, Bruns RE, Scarminio IS (2010) How do experiments—applications in science and industry, Bookman, 4
Table 10 Qeq obtained values and thermodynamic parameters for adsorption of Cd2+, Pb2+, Cr3+ on the shell of the cashew nut (CNS) in natura and chemically modified with H2O2, H2SO4 and NaOH
Qeq: amount adsorbed per unit of adsorbent (mg g−1); ΔG: Gibbs free energy variation (kJ mol−1); ΔH: variation of enthalpy (kJ mol−1); ΔS: variation of entropy (J mol−1 K−1); T: temperature (°C)
T °C Cd2+ Pb2+ Cr3+
Qeq ΔG ΔH ΔS Adj. R2 Qeq ΔG ΔH ΔS Adj. R2 Qeq ΔG ΔH ΔS Adj. R2
CNSin natura
15 3.85 − 0.32 3.072 3.44 2.18 5.6925 3.84 − 0.06 3.11 3.53 1.85 5.6235 3.81 0.19 − 7.84 − 26.10 0.99 3.08 3.62 0.79 − 9.18 1.00 1.77 5.55 7.76 7.18 0.9745 3.79 0.45 3.18 3.72 2.52 5.4755 3.76 0.71 3.08 3.81 3.06 5.40
CNSH2O2
15 7.15 54.87 11.31 15.80 0.15 62.5425 7.09 55.94 9.94 16.12 0.08 63.8135 7.20 57.02 24.04 − 107.1 0.53 11.86 16.45 6.37 − 32.71 0.84 0.06 65.07 26.03 − 126.7 0.9745 6.95 58.09 3.62 16.78 0.04 66.3455 0.00 59.16 11.08 17.10 0.04 67.61
CNSH2SO4
15 2.17 14.34 8.09 166.90 6.23 31.3725 2.13 14.54 3.72 169.76 7.06 31.5535 1.23 14.73 8.75 − 19.39 0.75 10.91 172.60 84.77 − 285.2 0.99 7.01 31.73 26.17 − 18.06 0.9945 1.65 14.93 5.41 175.46 6.88 31.9155 7.72 15.12 6.15 178.31 8.67 32.09
CNSNaOH
15 11.43 2.52 6.61 6.15 11.4 − 2.5225 11.03 2.56 0.05 5.55 11.7 − 3.1135 11.36 2.60 1.457 − 3.69 0.05 10.66 4.96 23.38 59.80 1.00 11.6 − 3.69 14.32 58.46 1.0045 11.92 2.63 5.64 4.36 12.0 − 4.2855 10.78 2.67 5.69 3.76 12.0 − 4.86

Applied Water Science (2018) 8:96
1 3
96 Page 20 of 21
Bartczak P, Norman M, Klapszewski L, Karwanska N, Kawalec M, Bavzynska M, Wysokowski M, Zardta J, Ciesielczyk F, Jesionow-ski T (2015) Removal of nickel(II) and lead(II) ions from aque-ous solution using peat as a low-cost adsorbent: a kinetic and equilibrium study. Arab J Chem. https ://doi.org/10.1016/j.arabj c.2015.07.018
Bhattacharya AK, Mandal SN, Das SK (2006) Adsorption of Zn(II) from aqueous solution by using different adsorbents. Chem Eng J 123(1–2):43–51. https ://doi.org/10.1016/j.cej.2006.06.012
Brunauer S, Emmett PH, Teller E (1938) Adsorption of gases in mul-timolecular layers. J Am Chem Soc 60(2):309–319. https ://doi.org/10.1021/ja012 69a02 3
Cessa RMA, Celi L, Vitorino ACT, Novelino JO, Barberis E (2009) Specific surface área and porosity of the clay fraction and phos-phorus adsorption in two rhodic ferralsols. R Bras Ci Solo 33(1):1153–1162. https ://doi.org/10.1590/S0100 -06832 00900 05000 09
Coelho GF, JrAC Conçalves, Tarley CRT, Casarin J, Nacke N, Franc-ziskowski MA (2014) Removal of metal ions Cd(II), Pb(II) and Cr(III) from water by the cashew nut shell Anarcadium occden-tale L. Ecol Eng 73:514–525. https ://doi.org/10.1016/j.ecole ng.2014.09.103
Coelho GF, JrAC Gonçalves, Nóvoa-Muñoz JC, Fernández-Calvinõ D, Arias-Estévez M, Fernández-Sanjurjo MJ, Álvarez-Rodríguez E, Núñez-Delgado A (2016) Competitive and non-competitive cádmium, copper and lead sorption/desorption on wheat straw affecting sustainability in vineyards. J Clean Prod 139:1496–1503. https ://doi.org/10.1016/j.jclep ro.2016.09.021
Dubinin MM, Radushkevich LV (1947) The equation of the charac-teristic curve of the activated charcoal. Proc Natl Acad Sci USSR Phys Chem Sect 55:331–337
Ercan Ö, Aydin A (2013) Removal of mercury, antimony, cadmium and lead from aqueous solution using 1,3,5-trithiane as an adsorbent. J Braz Chem Soc 24(5):865–872. https ://doi.org/10.5935/0103-5053.20130 114
Feng N, Guo X, Liang S, Zhu Y, Liu J (2011) Biosorption of heavy metals from aqueous solutions by chemically modified orange peel. J Hazard Mater 185(1):49–54. https ://doi.org/10.1016/j.jhazm at.2010.08.114
Foo KY, Hameed BH (2010) Insights into the modeling of adsorp-tion isotherm systems. Chem Eng J 156:2–10. https ://doi.org/10.1016/j.cej.2009.09.013
Freundlich HMF (1906) Over the adsorption in solution. J Phys Chem 57:385–471
Frois SR, Grassi MT, Fernandes TC, Barreto RAS, Abate G (2011) Preconcentration of Cr(III) and speciation analysis of chromium employing montmorillonite saturated with potassium ions. Quim Nova 34(3):462–467. https ://doi.org/10.1590/S0100 -40422 01100 03000 18
Garg UK, Kaur MP, Garg VK, Suda D (2007) Removal of hexava-lent chromium from aqueous solution by agricultural waste bio-mass. J Hazard Mater 140:60–68. https ://doi.org/10.1016/j.jhazm at.2006.06.056
Giles CH, Macewan TH, Nakhwa SN, Smith D (1960) Studies in adsorption. Part XI. A system of classification of solution adsorp-tion isotherms, and its use in diagnosis of adsorption mechanisms and in measurement of specific surface areas of solids. J Chem Soc 111:3973–3993
Gonçalves AC Jr, Meneghel AP, Rubio F, Strey L, Dragunski DC, Coelho GF (2013) Applicability of Moringa oleifera Lam. pie as an adsorbent for removal of heavy metals from waters. Rev Bras Eng Agríc 17(1):94–99. https ://doi.org/10.1590/s1415 -43662 01300 01000 13
Gonçalves AC Jr, Coelho GF, Schwantes D, Rech AL, Campag-nolo MA, Miola A Jr (2016) Biosorption of Cu(II) and Zn(II) with açaí endocarp Euterpe oleracea M. in contaminated
aqueous solution. Acta Sci Technol 38(3):361–370. https ://doi.org/10.4025/actas citec hnol.v38i3 .28294
Han R, Zhang L, Song C, Zhang M, Zhu H, Zhang L (2010) Char-acterization of modified wheat straw, kinetic and equilib-rium study about copper ion and methylene blue adsorption in batch mode. Carbohydr Polym 79:1140–1149. https ://doi.org/10.1016/j.carbp ol.2009.10.054
Ho YS, Mckay G (1999) Pseudo-second-order model for sorp-tion process. Process Biochem 34(5):451–465. https ://doi.org/10.1016/S0032 -9592(98)00112 -5
Ibrahim NM (2010) A novel agricultural waste adsorbent for the removal of lead(II) ions from aqueous solutions. J Hazard Mater 182(1–3):377–385. https ://doi.org/10.1016/j.jhazm at.2010.06.044
JrAC Gonçalves, Rubio F, Meneghel AP, Coelho GF, Dragunski DC, Strey L (2013) The use of Crambe abyssinica seeds as adsor-bent in the removal of metals from waters. Rev Bras Eng Agríc 17(3):306–311. https ://doi.org/10.1590/S1415 -43662 01300 03000 09
Kanitiz Júnior O, Gurgel LVA, De Freitas RP, Gil LF (2009) Adsorp-tion of Cu(II), Cd(II) and Pb(II) from aqueous single metal solutions by mercerized cellulose and mercerized sugarcane bagasse chemically modified with EDTA dianhydride (EDTAD). Carbohydr Polym 77:643–650. https ://doi.org/10.1016/j.carbp ol.2009.02.016
Khafaloui M, Knani S, Hachicha MA, Ben Lamine A (2003) New theoretical expressions for the five adsorption type isotherms classified by BET based on statistical physics treatment. J Col-loid Interface Sci 263(2):350–356. https ://doi.org/10.1016/S0021 -9797(03)00139 -5
Khezami L, Capart R (2005) Removal of chromium(VI) from aqueous solution by activated carbons: kinetic and equilibrium studies. J Hazard Mater 123(1–3):223–231. https ://doi.org/10.1016/j.jhazm at.2005.04.012
Kiran BM, Srikantaswamy S, Pallavi HV, Manoj V, Tasneem TA (2013) Study on utilization of groundnut shell as biosorbant for heavy metals removal. JECET 2(1):173–186
Langmuir I (1916) The constitution and fundamental properties of sol-ids and liquids. JACS 38(11):2221–2295. https ://doi.org/10.1021/ja022 68a00 2
Leitão NCMCS, Prado GHC, Veggi PC, Meireles MAA, Pereira CG (2013) Anacardium occidentale L. leaves extraction via SFE: global yields, extraction kinetics, mathematical modeling and economic evaluation. J Supercrit Fluids 78:114–123. https ://doi.org/10.1016/j.supfl u.2013.03.024
Mazzeto SE, Lomonaco D, Mele G (2009) Cashew nut oil: opportuni-ties and challenges in the context of sustainable industrial devel-opment. Quim Nova 32(3):732–741
Melzer M, Blina J, Bensakhira A, Valette J, Broust F (2013) Pyroly-sis of extractive rich agroindustrial residues. J Anal Appl Pyrol 104:448–460. https ://doi.org/10.1016/j.jaap.2013.05.027
Meneghel AP, AC Gonçalves Jr, Strey L, Rubio F, Schwantes D, Casa-rin J (2013) Biosorption and removal of chromium from water by using moringa seed cake (Moringa oleifera Lam.). Quim Nova 36(8):1104–1110. https ://doi.org/10.1590/s0100 -40422 01300 08000 05
Mimura AMS, Vieira TVA, Martelli PB, Gorgulho HF (2010) Utiliza-tion of rice husk to remove Cu2+, Al3+, Ni2+ and Zn2+ from waste-water. Quim Nova 33(6):1279–1284. https ://doi.org/10.1590/S0100 -40422 01000 06000 12
Mohan D, JrCU Pittman (2007) Arsenic removal from water/wastewa-ter using adsorbents—a critical review. J Hazard Mater 142:1–53. https ://doi.org/10.1016/j.jhazm at.2007.01.006
Monier M, Nawar N, Adbel-Latif DA (2010) Preparation and charac-terization of chelating fibers based on natural wool for removal of Hg(II), Cu(II) and Co(II) metal ions from aqueous solutions. J

Applied Water Science (2018) 8:96
1 3
Page 21 of 21 96
Hazard Mater 184(1–3):118–125. https ://doi.org/10.1016/j.jhazm at.2010.08.013
Montanher SF, Oliveira EA, Rollemberg MC (2005) Removal of metal ions from aqueous solutions by sorption onto rice bran. J Hazard Mater 117:207–211. https ://doi.org/10.1016/j.jhazm at.2004.09.015
Moreira RC, Lima JS, Silva GC, Cardoso JE (2013) Resistance to gum-mosis in wild cashew genotypes in northern Brazil. Crop Prot 52(10):10–13. https ://doi.org/10.1016/j.cropr o.2013.04.008
Moreira R, Orsini RR, Vaz JM, Penteado JC, Spinacé EV (2017) Pro-duction of biochar, bio-oil and synthesis gas from cashew nut shell by slow pyrolysis. Waste Biomass Valori 8(1):217–224. https ://doi.org/10.1007/s1264 9-016-9569-2
Movasaghi Z, Rehman S, Rehman I (2008) Fourier transform infrared (FTIR) spectroscopy of biological tissues. Appl Spectrosc Rev 43:134–179. https ://doi.org/10.1080/05704 92070 18290 43
Muianga CA, Muniz JA, Nascimengto MS, Fernandes TJ, Savian TV (2016) Description of the growth curve of cashew fruits in nonlinear models. Rev Bras Frutic 38(1):22–32. https ://doi.org/10.1590/0100-2945-271/14
Munagapati VS, Yarramuthi V, Nadavala SK (2010) Biosorption of Cu(II) and Pb(II) by Acacia leucocephala bark powder: kinetics, equilib-rium and thermodynamics. Chem Eng J 157:357–365. https ://doi.org/10.1016/j.cej.2009.11.015
Nacke H, JrAC Gonçalves, Schwantes D, Nava IA, Strey L, Coelho GF (2013) Availability of heavy metals (Cd, Pb and Cr) in agriculture from commercial fertilizers. Arch Environ Con Tox 64:371–379. https ://doi.org/10.1007/s0024 4-012-9867-z
Nacke H, JrAC Gonçalves, Campagnolo MA, Coelho GF, Schwantes D, Santos MG, Briesch DL Jr, Zimmermann J (2016) Adsorption of Cu(II) and Zn(II) from Water by Jatropha curcas L. as biosorbent. Open Chem 14:103–177. https ://doi.org/10.1515/chem-2016-0010
Njoku VO, Oguzie EE, Bi C, Bello OS, Ayuk AA (2011) Adsorption of copper(II) and lead(II) from aqueous solutions onto a nigerian natural clay. Aust J Basic Appl Sci 5(5):346–353
Pavia DL, Lampman GM, Kriz GS, Vyvyan JR (2010) Introdução à espectroscopia, 4th edn. Cengage Learning, São Paulo
Perugini M, Manera M, Grotta L, Cesarina MA, Tarasco R, Amorena M (2011) Heavy metal (Hg, Cr, Cd and Pb) contamination in urban areas and wildlife reserves: honeybees as bioindicators. Biol Trace Elem Res 140:170–176. https ://doi.org/10.1007/s1201 1-010-8688-z
Quintans-Fondo A, Ferreira-Coelho G, Paradelo-Núñez R, Nóvoa-Muñoz JC, Ariaz-Estevez M, Fernandez-Sanjurjo MJ, Álvarez-Rodríguez E, Núñez-Delgado A (2016a) As(V)/Cr(VI) pollution control in soils, hemp waste, and other by-products: competitive sorption trials. ESPR 23(9):19182–19192. https ://doi.org/10.1007/s1201 1-010-8688-z
Quintans-Fondo A, Ferreira-Coelho G, Paradelo-Nunez R, Nóvoa-Muñoz JC, Arias-Estevez M, Fernández-Sanjurjo MJ, Álvarez-Rodríguez E, Núñez-Delgado A (2016b) F sorption/desorption on two soils and on different by-products and waste materials. ESPR 23(14):14676–14685. https ://doi.org/10.1007/s1135 6-016-6959-8
Quintáns-Fondo A, Ferreira-Coelho G, Paradelo-Núñez R, Nóvoa-Muñoz JC, Arias-Estévez M, Fernández-Sanjurjo MJ, Álvarez-Rodríguez E, Núñez-Delgado A (2016) Promoting sustainability in the mussel industry: mussel shell recycling to fight fluoride pollution. J Clean Prod 131(10):1–6. https ://doi.org/10.1016/j.jclep ro.2016.04.154
Rao RAK, Khan MA (2009) Biosorption of bivalent metal ions from aqueous solution by an agricultural waste: kinetics, thermodynam-ics and environmental effects. Colloids Surf A Physicochem Eng Asp 332(1):121–128. https ://doi.org/10.1016/j.colsu rfa.2008.09.005
Rubio F, Gonçalves AC Jr, Strey L, Meneghel AP, Coelho GF, Nacke H (2013a) Applicability of Crambe abyssinica Hochst. byproduct as biosorbent in the removal of chromium from water. SJRD 4(1):25–40. https ://doi.org/10.5261/2013.gen1.03
Rubio F, JrAC Gonçalves, Meneghel AP, Tarley CRT, Schwantes D, Coe-lho GF (2013b) Removal of cadmium from water using by-product
Crambe abyssinica Hochst seeds as biosorbent material. Water Sci Technol 68(1):227–233. https ://doi.org/10.2166/wst.2013.233
Salem NM, Awwad AM (2011) Biosorption of Ni(II) from electro-plating wastewater by modified (Eriobotrya japonica) loquat bark. J Saudi Chem Soc 18(5):379–386. https ://doi.org/10.1016/j.jscs.2011.07.008
Sari A, Tuzen M, Citak D, Soylak M (2007) Equilibrium, kinetic and thermodynamic studies of adsorption of Pb(II) from aqueous solu-tion onto Turkish kaolinite clay. J Hazard Mater 149(2):283–291. https ://doi.org/10.1016/j.jhazm at.2007.03.078
Schwantes D, Gonçalves AC Jr, Strey L, Schwantes V, Nacke H (2013) Reuse and recycling techniques: kinetics, equilibrium and thermo-dynamics of the adsorption process of lead using cassava industry wastes, in: Helena Bártolo; José Pinto Duarte. (Org.). Green design, materials and manufacturing processes. 1st edn. CRC Press Tay-lor & Francis Group, Boca Raton, vol 1, pp 417–422. https ://doi.org/10.1201/b1500 2-81
Schwantes D, JrAC Gonçalves, Coelho GF, Campgnolo MA, Santos MG, Miola A Jr, Leismann EAV (2015) Crambe pie modified for removal of cádmium, lead and chromium from aqueous solution. IJCR 7(10):21658–21669
Schwantes D, Gonçalves AC Jr, Coelho GF, Campagnolo MA, Dragunski DC, Tarley CRT, Miola AJ, Leismann EAV (2016) Chemical modi-fications of cassava peel as adsorbent material for metals ions from wastewater. J Chem 2016:1–15. https ://doi.org/10.1155/2016/36941 74
Skopp J (2009) Derivation of the Freundlich adsorption isotherm from kinetics. J Chem Educ 86:1341–1343. https ://doi.org/10.1021/ed086 p1341
Smidt W, Meissl K (2007) The applicability of Fourier transform infrared (FT-IR) spectroscopy in waste management. Waste Manag 27:268–276. https ://doi.org/10.1016/j.wasma n.2006.01.016
Sun C-J, Sun L-Z, Sun X-X (2013) Graphical evaluation of the favorabil-ity of adsorption processes by using conditional Langmuir constant. Ind Eng Chem Res 52:14251–14260. https ://doi.org/10.1021/ie401 571p
Wan Ngah WS, Fatinathan S (2010) Adsorption characterization of Pb(II) and Cu(II) ions onto chitosan-tripolyphosphate beads: kinetic, equi-librium and thermodynamic studies. J Environ Manag 91(4):958–969. https ://doi.org/10.1016/j.jenvm an.2009.12.003
Wan Ngah WS, Hanafiah MAKM (2008) Removal of heavy metal ions from wastewater by chemically modified plant wastes as adsor-bents: a review. Bioresour Technol 99(10):3935–3948. https ://doi.org/10.1016/j.biort ech.2007.06.011
Witek-Krowiak A, Szafran RG, Modelski S (2011) Biosorption of heavy metals from aqueous solutions onto peanut shell as a low-cost biosorbent. Desalination 265(1–3):126–134. https ://doi.org/10.1016/j.desal .2010.07.042
Yang X, Al-Duri B (2005) Kinetic modeling of liquid-phase adsorp-tion of reactive dyes on activated carbon. J Colloid Interface Sci 287(1):25–34. https ://doi.org/10.1016/j.jcis.2005.01.093
Zhao G, Wu X, Tan X, Wang X (2011) Sorption of heavy metals ions from aqueous solution: a review. Open Colloid Sci J 4:19–31
Zhong WS, Ren T, Zhao LJ (2016) Determination of Pb (lead), Cd (cad-mium), Cr (chromium), Cu (copper), and Ni (nickel) in Chinese tea with high-resolution continuum source graphite furnace atomic absorption spectrometry. J Food Drug Anal 24:46–55. https ://doi.org/10.1016/j.jfda.2015.04.010
Publisher’s Note Springer Nature remains neutral with regard to jurisdictional claims in published maps and institutional affiliations.