Guidance for Reporting Sulfuric Acid (acid aerosols including ...
Upload
khangminh22Category
view
1download
0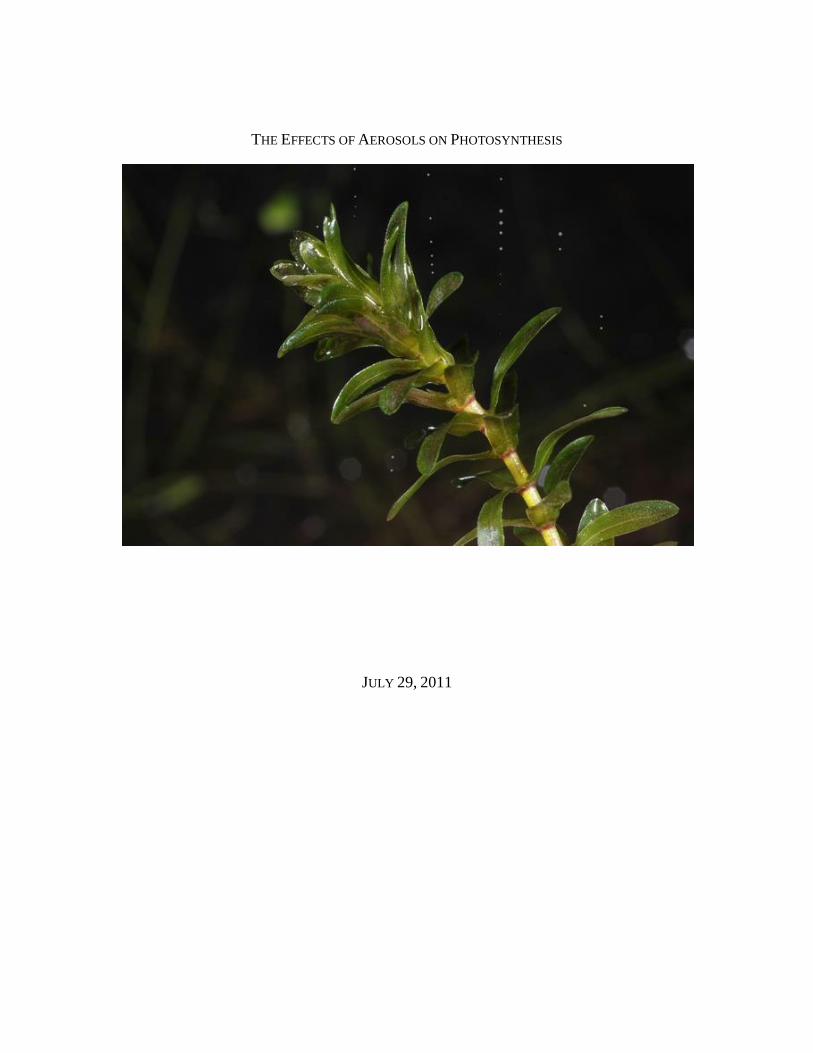
THE EFFECTS OF AEROSOLS ON PHOTOSYNTHESIS
JULY 29, 2011
1
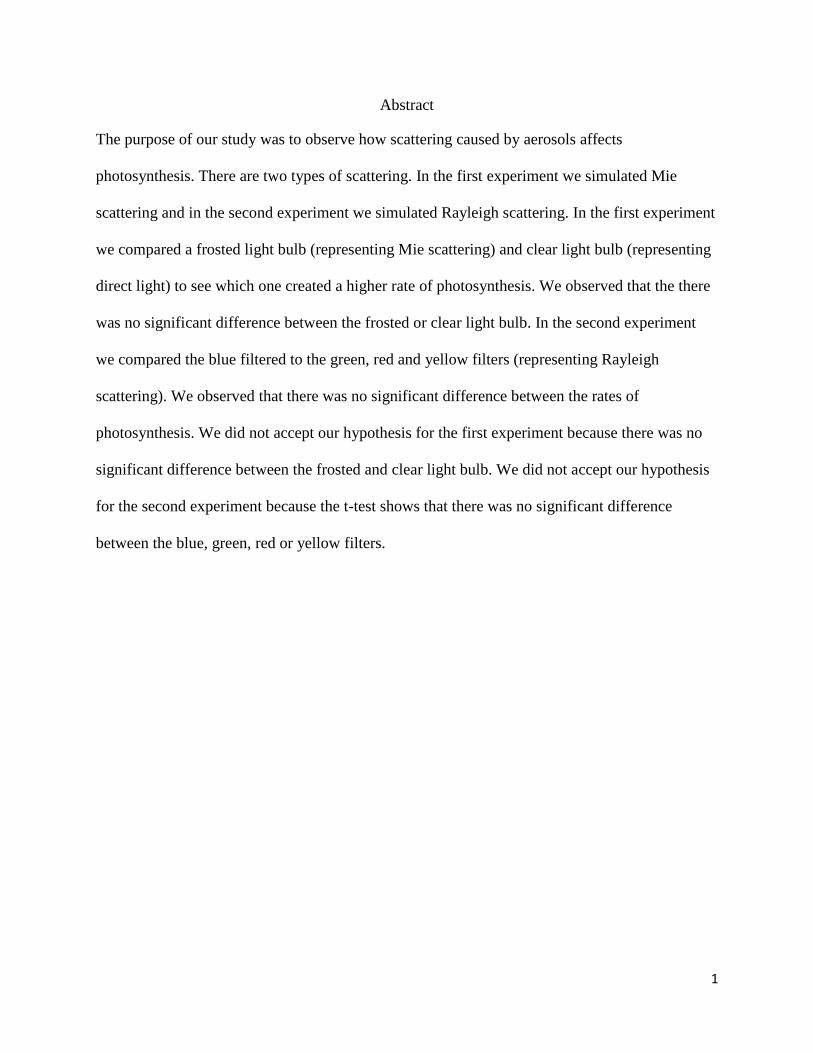
Abstract
The purpose of our study was to observe how scattering caused by aerosols affects
photosynthesis. There are two types of scattering. In the first experiment we simulated Mie
scattering and in the second experiment we simulated Rayleigh scattering. In the first experiment
we compared a frosted light bulb (representing Mie scattering) and clear light bulb (representing
direct light) to see which one created a higher rate of photosynthesis. We observed that the there
was no significant difference between the frosted or clear light bulb. In the second experiment
we compared the blue filtered to the green, red and yellow filters (representing Rayleigh
scattering). We observed that there was no significant difference between the rates of
photosynthesis. We did not accept our hypothesis for the first experiment because there was no
significant difference between the frosted and clear light bulb. We did not accept our hypothesis
for the second experiment because the t-test shows that there was no significant difference
between the blue, green, red or yellow filters.
2
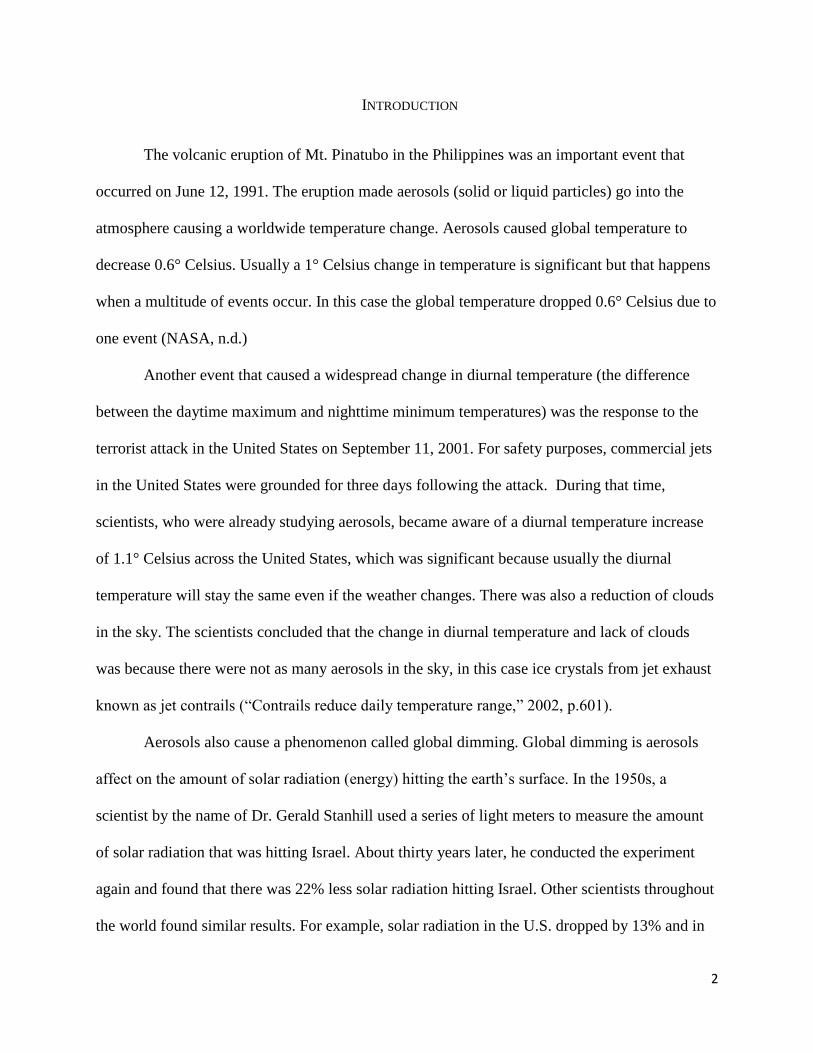
INTRODUCTION
The volcanic eruption of Mt. Pinatubo in the Philippines was an important event that
occurred on June 12, 1991. The eruption made aerosols (solid or liquid particles) go into the
atmosphere causing a worldwide temperature change. Aerosols caused global temperature to
decrease 0.6° Celsius. Usually a 1° Celsius change in temperature is significant but that happens
when a multitude of events occur. In this case the global temperature dropped 0.6° Celsius due to
one event (NASA, n.d.)
Another event that caused a widespread change in diurnal temperature (the difference
between the daytime maximum and nighttime minimum temperatures) was the response to the
terrorist attack in the United States on September 11, 2001. For safety purposes, commercial jets
in the United States were grounded for three days following the attack. During that time,
scientists, who were already studying aerosols, became aware of a diurnal temperature increase
of 1.1° Celsius across the United States, which was significant because usually the diurnal
temperature will stay the same even if the weather changes. There was also a reduction of clouds
in the sky. The scientists concluded that the change in diurnal temperature and lack of clouds
was because there were not as many aerosols in the sky, in this case ice crystals from jet exhaust
known as jet contrails (“Contrails reduce daily temperature range,” 2002, p.601).
Aerosols also cause a phenomenon called global dimming. Global dimming is aerosols
affect on the amount of solar radiation (energy) hitting the earth’s surface. In the 1950s, a
scientist by the name of Dr. Gerald Stanhill used a series of light meters to measure the amount
of solar radiation that was hitting Israel. About thirty years later, he conducted the experiment
again and found that there was 22% less solar radiation hitting Israel. Other scientists throughout
the world found similar results. For example, solar radiation in the U.S. dropped by 13% and in
3
Russia by about 30%. In addition, scientists in Southern Australia discovered a decrease in the
rate of evaporation of water over time. This decrease in evaporation corresponded with the drop
of solar radiation. Solar radiation causes water to evaporate, and with less light, there would be
less evaporation. Aerosols prevent light from hitting the earth’s surface, causing global dimming
(Nova, 2009; Liljegren, 2004).
Aerosols are liquid and solid particles in the atmosphere that are different shapes and
sizes (National Earth Science Teachers Association. 2007).There are two main types of aerosols;
anthropogenic (man-made) and natural aerosols. Natural aerosols are larger than the
anthropogenic aerosols (NASA). Aerosols are continuously entering and departing the
atmosphere but some linger for hours or even years depending on their size. Average size
aerosols remain suspended in the atmosphere for four to seven days and these aerosols can travel
thousands of kilometers in a week (NASA).
Aerosols are classified as primary or secondary aerosols. Primary aerosols are the solid
and liquid particles that are directly projected into the atmosphere (National Earth Science
Teachers Association. 2007). Secondary aerosols are formed when substances like gases are
emitted into the atmosphere, and then have a chemical reaction that transforms them into
aerosols (National Earth Science Teachers Association, 2007).
Aerosols are all over the earth but they are not dispersed evenly around the world. Some
places have more anthropogenic aerosols than natural aerosols. Urban areas and places where
industrial factories are located produce large amounts of anthropogenic aerosols. Natural
aerosols can be found in large numbers in the deserts and oceans areas, where dust and sea salt
become aerosols.
4
Aerosols can become cloud condensation nuclei, meaning water vapor connects with
aerosols creating water droplets. Clouds form when these water droplets increase in size. In an
area with a high number of aerosols, there would be more small cloud droplets making the cloud
thicker and denser compared to the clouds with a low amount of aerosols.
Aerosols and the clouds that they create, can absorb, reflect, or scatter sunlight (Voiland,
2010). Depending on the color of the aerosols or density and color of the clouds, light is
absorbed, reflected, and scattered at varying degrees (Reyes, 1997). When sunlight is absorbed,
the Earth cools because it is obtaining less solar radiation (Voiland, 2010) Soot and black carbon
are examples of dark colored aerosols that absorb sunlight (National Earth Science Teachers
Association, 2010) When sunlight is reflected, the Earth’s temperature drops because more solar
radiation is redirected back into space rather than towards the Earth’s surface (Voiland, 2010).
Ice crystals that make up jet contrails and sea salt are examples of bright colored aerosols that
can either reflect or scatter sunlight (Reyes, 1997). When sunlight is scattered, visible light is
sent in many directions resulting in more of the Earth’s surface receiving more light whereas
with direct sunlight, only surfaces within direct view of the sunlight receive light (Voiland,
2010).
Scattering is when aerosols redirect sunlight in multiple directions. There are two types of
scattering, Rayleigh and Mie (Reyes, 1997). Rayleigh scattering is when a greater amount of
blue and violet wavelengths are redirected into space while the other wavelengths from the
visible light spectrum such as red, yellow, and orange are redirected to the surface of the earth.
The aerosols that cause Rayleigh scattering are smaller than the wavelengths of visible light, less
than 400nm (Fig. 1). An example of Rayleigh scattering is the reddish clouds that are present in
the sky after volcanic eruptions. The ash sent into the atmosphere from the volcano is what
5
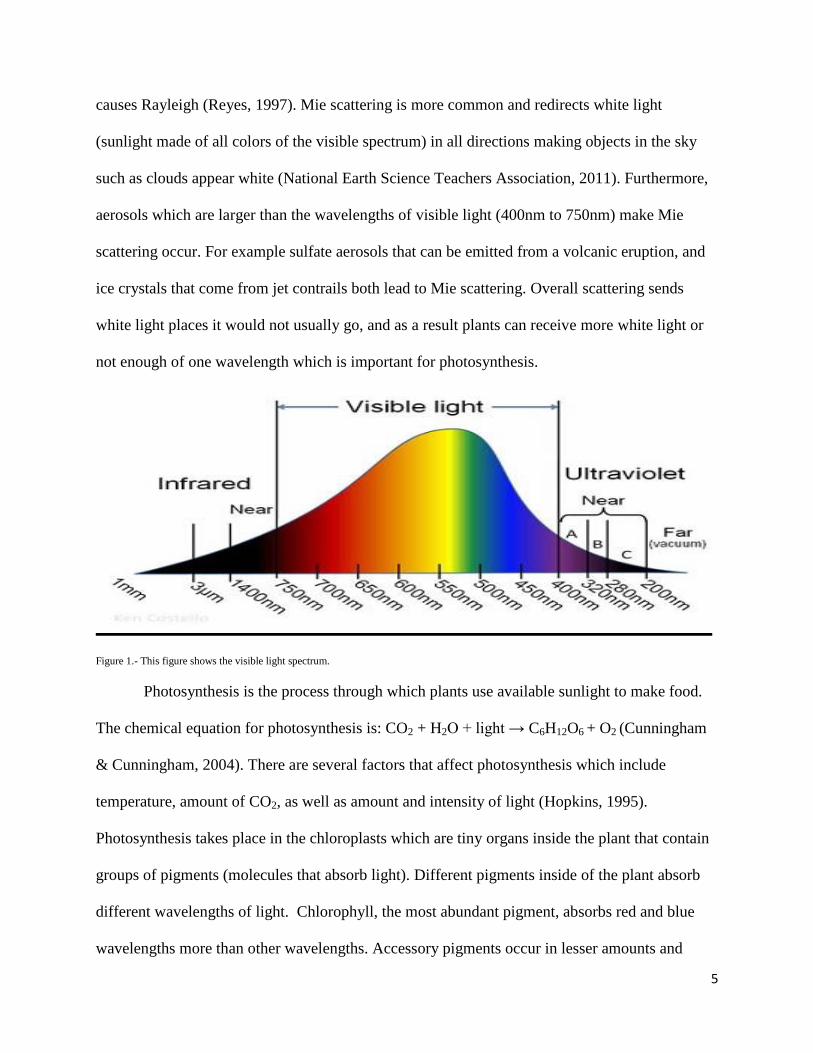
causes Rayleigh (Reyes, 1997). Mie scattering is more common and redirects white light
(sunlight made of all colors of the visible spectrum) in all directions making objects in the sky
such as clouds appear white (National Earth Science Teachers Association, 2011). Furthermore,
aerosols which are larger than the wavelengths of visible light (400nm to 750nm) make Mie
scattering occur. For example sulfate aerosols that can be emitted from a volcanic eruption, and
ice crystals that come from jet contrails both lead to Mie scattering. Overall scattering sends
white light places it would not usually go, and as a result plants can receive more white light or
not enough of one wavelength which is important for photosynthesis.
Figure 1.- This figure shows the visible light spectrum.
Photosynthesis is the process through which plants use available sunlight to make food.
The chemical equation for photosynthesis is: CO2 + H2O + light → C6H12O6 + O2 (Cunningham
& Cunningham, 2004). There are several factors that affect photosynthesis which include
temperature, amount of CO2, as well as amount and intensity of light (Hopkins, 1995).
Photosynthesis takes place in the chloroplasts which are tiny organs inside the plant that contain
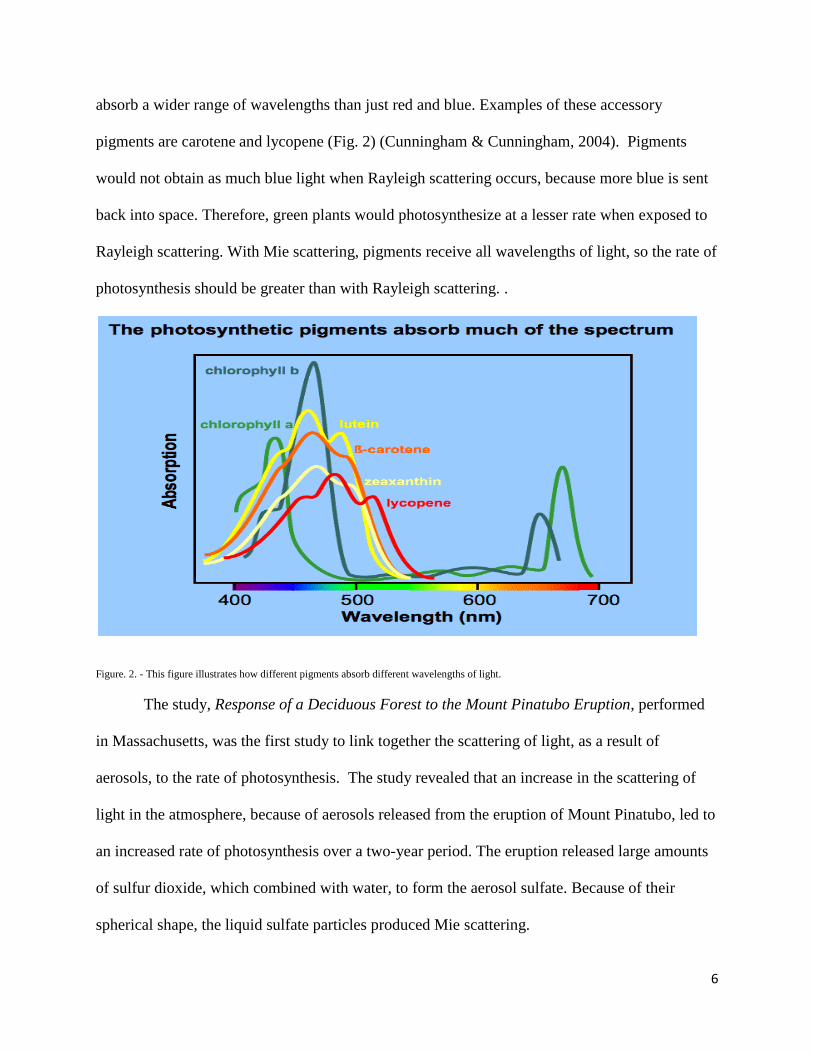
groups of pigments (molecules that absorb light). Different pigments inside of the plant absorb
different wavelengths of light. Chlorophyll, the most abundant pigment, absorbs red and blue
wavelengths more than other wavelengths. Accessory pigments occur in lesser amounts and
6
absorb a wider range of wavelengths than just red and blue. Examples of these accessory
pigments are carotene and lycopene (Fig. 2) (Cunningham & Cunningham, 2004). Pigments
would not obtain as much blue light when Rayleigh scattering occurs, because more blue is sent
back into space. Therefore, green plants would photosynthesize at a lesser rate when exposed to
Rayleigh scattering. With Mie scattering, pigments receive all wavelengths of light, so the rate of
photosynthesis should be greater than with Rayleigh scattering. .
Figure. 2. - This figure illustrates how different pigments absorb different wavelengths of light.
The study, Response of a Deciduous Forest to the Mount Pinatubo Eruption, performed
in Massachusetts, was the first study to link together the scattering of light, as a result of
aerosols, to the rate of photosynthesis. The study revealed that an increase in the scattering of
light in the atmosphere, because of aerosols released from the eruption of Mount Pinatubo, led to
an increased rate of photosynthesis over a two-year period. The eruption released large amounts
of sulfur dioxide, which combined with water, to form the aerosol sulfate. Because of their
spherical shape, the liquid sulfate particles produced Mie scattering.
7
The purpose of our study was to understand how Mie scattering and Rayleigh scattering
as a result of aerosols affect the rate of photosynthesis in Elodea. We investigated the effects of
Mie scattering by using frosted and clear light bulbs to represent scattered sunlight and direct
sunlight. Light bulbs were used to eliminate atmospheric variables. We investigated the effects
of Rayleigh scattering by using blue, red, green, and yellow colored cellophane filters. These
filters represented single wavelengths of the electromagnetic spectrum and were used to test the
rate of photosynthesis in Elodea when exposed to these individual colors. We used the blue filter
to test the rate of photosynthesis in Elodea as if there was no Rayleigh scattering and we used the
red, green, and yellow filters to test the rate of photosynthesis in Elodea as if there was Rayleigh
scattering. Because Elodea is an aquatic plant, oxygen bubbles produced from the stem of the
plant as a result of photosynthesis were able to be counted easily.
The group came up with two hypotheses. For the first experiment we compared a frosted
light bulb to a clear one. We hypothesized that Elodea exposed to light from a frosted light bulb
will have a greater rate of photosynthesis compared to Elodea exposed to light from a clear light
bulb. In the second experiment we compared a blue filtered light to a red, yellow and green
filtered light. For the second experiment we hypothesized that Elodea exposed to blue filtered
light will have a greater rate of photosynthesis than the Elodea exposed to red, yellow or green
filtered light.
8
METHODS
We conducted the study comparing the rate of photosynthesis in Elodea when exposed to
frosted and clear light bulbs on the morning of July 7, 2011 in Compton Hall at Frostburg State
University. We used two different 60-watt Sylvania Double life Multiuse bulbs, one frosted and
the other clear. We used Elodea, an aquatic plant that produces oxygen bubbles when it goes
through photosynthesis. We made sure each of the dried Elodea had a length of 3.5 inches and
selected the Elodea that had a mass of 0.8 grams so that they would be all the same. We slightly
crushed the tip of the stem so the oxygen bubbles could be released. We placed the plant in a
test tube filled with sodium bicarbonate solution (1.2 grams sodium bicarbonate and 125mL
deionized water) and then placed the test tube in a water bath to keep the Elodea cool.
We divided our groups into seven pairs; each pair conducted the experiment. We
randomly selected a lamp containing either a frosted or clear light bulb from a set of lights with
the reflector faced down on the counter so that we could not see the light bulb. We turned out
the lights and closed all doors and shades to try to keep the room dark. Then we placed the
beaker with the Elodea near the light bulb and measured six inches between the two. Next we
randomly selected one group and measured the light intensity with a Fisher Scientific light
meter. The light intensity was a lux of 346, so we adjusted the distance between the rest of the
groups’ beakers and the lamps, to ensure all the groups had the same lux. Once oxygen bubbles
constantly appeared from the stem, we started to count each bubble. After ten minutes of
counting, we switch lamps and repeated the process.
We started another experiment on July 12, 2011, in Compton Science Center. We
conducted this experiment to measure the rate of photosynthesis when Elodea receives a specific
wavelength of light. We conducted the experiment similarly to the first study; however, in this
9
study we used blue, red, green, and yellow colored filters to get one individual wavelength of
light at a time. Blue, yellow, green, or red cellophane filters completely covered beakers in our
experiment. We also had one set-up with no filter as a control. We arranged our Elodea exactly
like the first experiment except we also used the four different filters, covering each beaker with
one filter at a time. After measuring one group’s light intensity, we made sure all experiments
had 395 lux to match. Once the oxygen bubbles were produced consistently from the stem of the
Elodea, we started to count the number of oxygen bubbles produced for the next ten minutes.
After ten minutes, we switched the beaker set up with one of the other colored filters and made
one without a filter; the same plant from the beginning and frosted light bulb were never
removed. Then we repeated the process.
To display our data, we used bar graphs to compare the number of oxygen bubbles
produced per minute during photosynthesis in Elodea when exposed to different light sources.
The 1.5 interquartile range rule takes the difference between the first and third quartiles
of the data and multiplies it by 1.5. Once found, 1.5IQR is subtracted from the first quartile and
1.5IQR is added to the third quartile to determine if there were any outliers. If an outlier was
found, that piece of data was not used in the bar graphs or statistical tests.. We analyzed our data
using two-tailed t-tests to determine whether there were significant differences between the rates
of photosynthesis in Elodea when exposed to different light sources. We had a 95% confidence
that our means would fall between the two points of our confidence intervals.
10
RESULTS
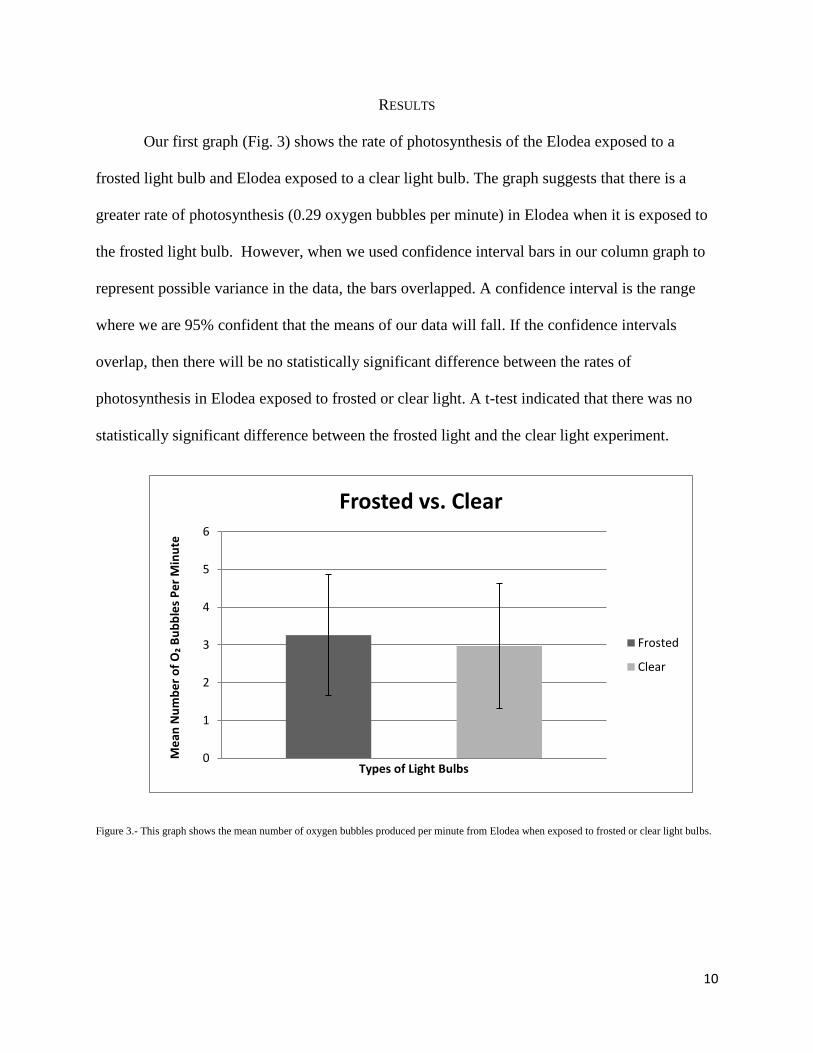
Our first graph (Fig. 3) shows the rate of photosynthesis of the Elodea exposed to a
frosted light bulb and Elodea exposed to a clear light bulb. The graph suggests that there is a
greater rate of photosynthesis (0.29 oxygen bubbles per minute) in Elodea when it is exposed to
the frosted light bulb. However, when we used confidence interval bars in our column graph to
represent possible variance in the data, the bars overlapped. A confidence interval is the range
where we are 95% confident that the means of our data will fall. If the confidence intervals
overlap, then there will be no statistically significant difference between the rates of
photosynthesis in Elodea exposed to frosted or clear light. A t-test indicated that there was no
statistically significant difference between the frosted light and the clear light experiment.
Figure 3.- This graph shows the mean number of oxygen bubbles produced per minute from Elodea when exposed to frosted or clear light bulbs.
0
1
2
3
4
5
6
Me
an N
um
be
r o
f O
₂ B
ub
ble
s P
er
Min
ute
Types of Light Bulbs
Frosted vs. Clear
Frosted
Clear
11
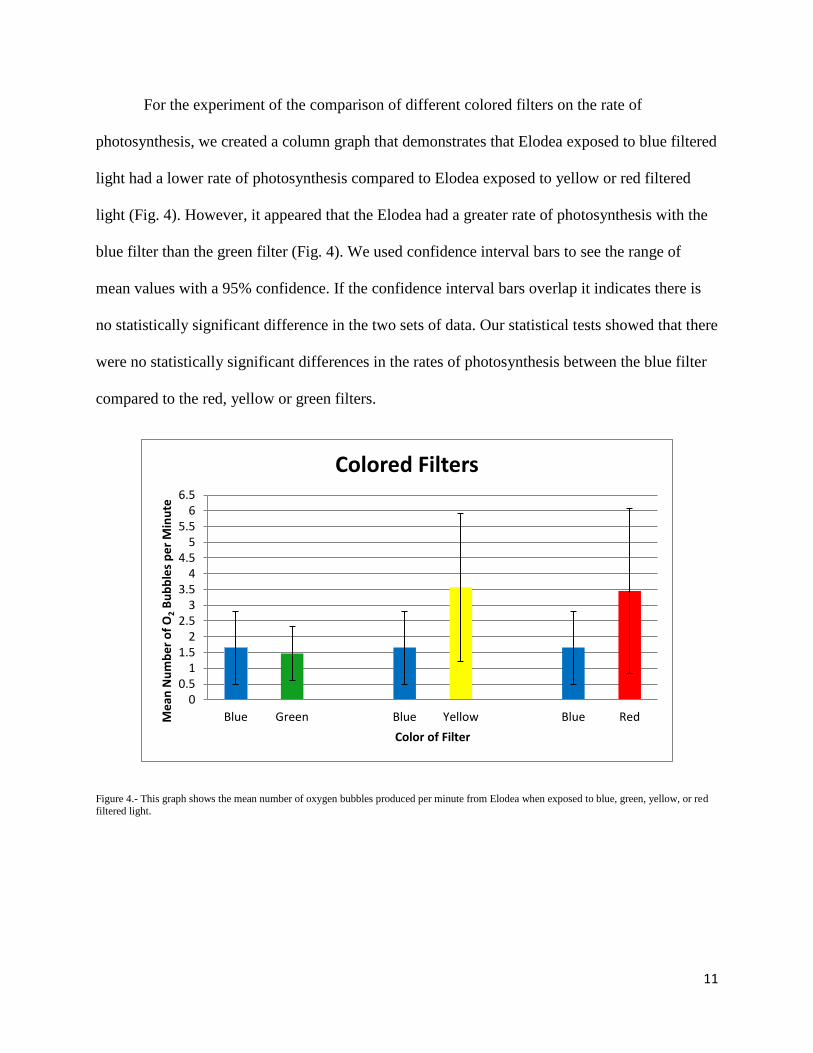
For the experiment of the comparison of different colored filters on the rate of
photosynthesis, we created a column graph that demonstrates that Elodea exposed to blue filtered
light had a lower rate of photosynthesis compared to Elodea exposed to yellow or red filtered
light (Fig. 4). However, it appeared that the Elodea had a greater rate of photosynthesis with the
blue filter than the green filter (Fig. 4). We used confidence interval bars to see the range of
mean values with a 95% confidence. If the confidence interval bars overlap it indicates there is
no statistically significant difference in the two sets of data. Our statistical tests showed that there
were no statistically significant differences in the rates of photosynthesis between the blue filter
compared to the red, yellow or green filters.
Figure 4.- This graph shows the mean number of oxygen bubbles produced per minute from Elodea when exposed to blue, green, yellow, or red
filtered light.
00.5
11.5
22.5
33.5
44.5
55.5
66.5
Blue Green Blue Yellow Blue RedMe
an N
um
be
r o
f O
2 B
ub
ble
s p
er
Min
ute
Color of Filter
Colored Filters
12
CONCLUSIONS AND DISCUSSIONS
We rejected our hypothesis that Elodea exposed to frosted light will have a greater rate of
photosynthesis as compared to the Elodea exposed to clear light, because the t-test confirmed
that there was no statistically significant difference between the means of our data set. This
indicates that scattering light does not cause plants to perform photosynthesis at a greater rate
than plants exposed to direct light.
Based on the results of the t-tests, there is no significant difference in the means of the
data sets leading us to reject our hypothesis that the Elodea exposed to blue filtered light will
have a greater rate of photosynthesis than the Elodea exposed to red, yellow or green filtered
light. We also cannot conclude that aerosols have an effect on photosynthesis.
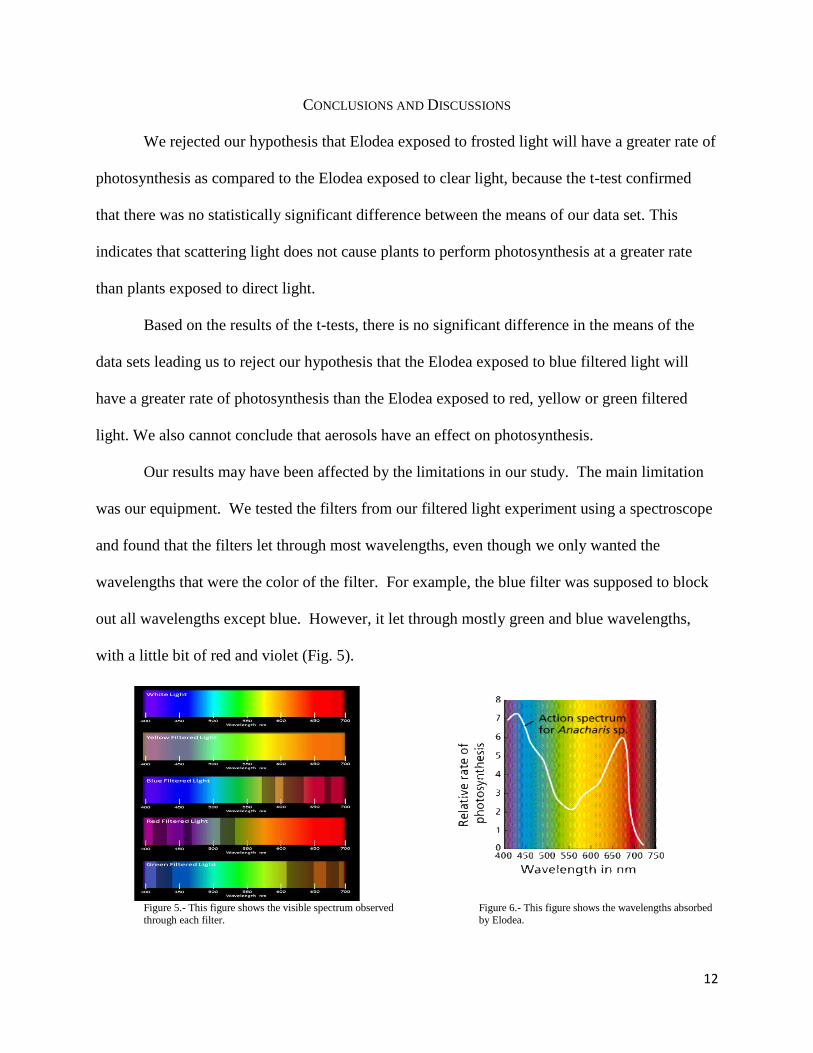
Our results may have been affected by the limitations in our study. The main limitation
was our equipment. We tested the filters from our filtered light experiment using a spectroscope
and found that the filters let through most wavelengths, even though we only wanted the
wavelengths that were the color of the filter. For example, the blue filter was supposed to block
out all wavelengths except blue. However, it let through mostly green and blue wavelengths,
with a little bit of red and violet (Fig. 5).
Figure 5.- This figure shows the visible spectrum observed Figure 6.- This figure shows the wavelengths absorbed
through each filter. by Elodea.
13
This discovery explains why the light that passed through the blue filter caused such a
low rate of photosynthesis (Fig. 4). Elodea absorbs violet, red, and yellow wavelengths more
than any other wavelengths (Fig. 6). Since the violet, red, and yellow wavelengths were filtered
out by the blue filter, there was a slow rate of photosynthesis in the Elodea.
The yellow filter, instead of letting through only yellow wavelengths, did not block any
colors completely (Fig. 5). This may explain why the light that passed through the yellow filter
appeared to cause a higher rate of photosynthesis than the light passing through the other filters.
In fact, a t-test comparing the rate of photosynthesis for the yellow filter to the rate of
photosynthesis for no filter showed no significant difference between the data sets. This means
that the yellow filter acted as if there was no filter. Additionally, Elodea absorbs yellow
wavelengths but at a lesser amount than violet and red wavelengths (Fig. 6). This could be
another reason the yellow filter caused a high rate of photosynthesis in the Elodea.
The red and green filters only allowed small amounts of wavelengths that were not the
filters’ color (red or green) to pass through the filters (Fig. 5). Therefore, most of the light
passing through the red filter was red and most of the light passing through the green filter was
green. Thus, the rates of photosynthesis for these filters were good representations for the rates
of photosynthesis a plant would undergo if only exposed to red or green wavelengths.
If scientists repeat the filtered light experiment, they will have to find ways that guarantee only
certain wavelengths of light will reach the Elodea. One of the options is to use multiple layers of
filters. However, doing this may make it difficult to count the bubbles produced by the Elodea.
A better option is to use gas tubes as the light source, because they only emit certain wavelengths
of light. The third option is to use colored light bulbs; although we would have to test the
14
wavelengths of light they produce to determine whether they would be appropriate for our
experiment.
Other limitations are related to Elodea. First, there were numerous differences between
Elodea plants for example, the number and size of leaves for each plant were different, and some
leaves had a brown tint. This is important because photosynthesis occurs at a greater rate in the
leaves. Second, the method in which we measured the rate of photosynthesis in the Elodea,
counting oxygen bubbles, provided imprecise results. Some students observed that their Elodea
plant produced large and small oxygen bubbles. The oxygen bubbles that were larger were
generated at a slower rate than the oxygen bubbles that were smaller. The plant that produced the
smaller oxygen bubbles were identified as outliers because they produced many more oxygen
bubbles than the plants the produced larger oxygen bubbles. Lastly, not all stems of the Elodea
plants were crushed evenly, altering where the oxygen bubbles came out of the plant.
Time was also a restriction. We did not have a lot of time for training on this experiment
resulting in human errors. If we had more time, we would have done the experiment over again,
being able to have more accurate results.
The study of aerosols and photosynthesis is important because we do not know how
aerosols affect different places all around the world, but we know that aerosols are everywhere.
For example, the Harvard study explored how the eruption of Mt. Pinatubo in the Philippines,
affected the rate of photosynthesis in the Harvard Forest located in Massachusetts. The study
found that the rate of photosynthesis increased over a two year period. This is the only study that
we could find that relates photosynthesis and aerosols. Aerosols affect temperatures on both
global and regional scale. Aerosols affect us in a lot of ways yet our knowledge of them is
15
minuscule. Scientists should further investigate so that they can expand our knowledge of this
subject.
After conducting our experiments, we had several questions. We wondered what would
have been the outcome if another plant, such as a dark-water aquatic plant, had been used instead
of Elodea. We also would like to inquire if aerosols will have an impact on photosynthesis in the
future. We would like to find out if aerosols lower the rate of photosynthesis, will there be less
oxygen in the atmosphere. Further studies could investigate what would happen if both
anthropogenic and natural aerosols did not occur. Lastly, scientists could research how
absorption as a result of aerosols affects photosynthesis.
16
REFERENCES CITED
Aerosols: Tiny Particles, Big Impact. (2007).
http://earthobservatory.nasa.gov/Features/Aerosols/printall.php.
Argonne National Laboratory. (2004, July). Global Dimming: A Hot Climate Topic. Southern
Great Plain Newsletter, 1-4.
Cunningham, W. P. (2004). Principles of Environmental Science. Boston. McGraw Hill.
Environmental Protection Agency. (2000, September). Aircraft Contrails Fact Sheet.
Gu, L., Baldicchi, D.,Wofsy, S., Munger, J., Michalsky, J., Urbanski, S., & Boden, T. Response
of a Deciduous forest to the mount Pinatubo Eruption: Enhanced Photosynthesis. Science,
299, 2035-2038. Www.sciencemag.org.
Hopkins, W. (1995) Introduction to Plant Physiology. New York: John Wiley & Sons Inc.
NASA. (n.d.) Global Temperature.
http://earthobservatory.nasa.gov/Feature/WorldOfChange/decadaitemp.php
National Earth Science Teachers Association. (2010). Aerosols, Cloud Nucleation and Global
Dimming. http://www.window2universe.org/earth/atmosphere/aerosols_clouds_n.com.
Nova. (2009, January 10). Global Dimming Documentary Part 1-3/5.
http://www.youtube/watch?v=bLfBXRPoHRc.
Reyes, (1997, August). National Aeronautics and Space Administration.
http://icp.giss.nasa,gov/research/ppa1997/reyes.com.
Travis, D. (2002, August). Contrails reduce Daily Temperature Range. www.nature.com/nature.
Wright. (2011). In Aftermath of Volcanic Eruption, Photosynthesis Waxes, Carbon Dioxide
Wanes. Scientific American.
http://www.scientificamerica.com./article.cfm?id=in=aftermath-of-volcanic.
Copyright © 2022 FDOKUMEN