Improving Maize Productivity Under Abiotic Stresses
225
-
Upload
khangminh22 -
Category
Documents
-
view
1 -
download
0
Transcript of Improving Maize Productivity Under Abiotic Stresses

Improving Maize Productivity Under Abiotic Stresses
P. Zaidi, K. Harrington, J. de Meyer and N.N. Singh, eds.

CIMMYT® (www.cimmyt.org) is an internationally funded, nonprofit, scientific research and training organization. Headquartered in Mexico, CIMMYT works with agricultural research institutions worldwide to improve the productivity, profitability, and sustainability of maize and wheat systems for poor farmers in developing countries. It is one of 16 food and environmental organizations known as the Future Harvest Centers. Located around the world, the Future Harvest Centers conduct research in partnership with farmers, scientists, and policymakers to help alleviate poverty and increase food security while protecting natural resources. The centers are supported by the Consultative Group on International Agricultural Research (CGIAR) (www.cgiar.org), whose members include nearly 60 countries, private foundations, and regional and international organizations. Financial support for CIMMYT's research agenda also comes from many other sources, including foundations, development banks, and public and private agencies. Future Harvest® builds awareness and support for food and environmental research for a world with less poverty, a healthier human family, well-nourished children, and a better environment (www.futureharvest.org). © International Maize and Wheat Improvement Center (CIMMYT) 2003. All rights reserved. The opinions expressed in this publication are the sole responsibility of the authors. The designations employed in the presentation of materials in this publication do not imply the expression of any opinion whatsoever on the part of CIMMYT or its contributory organizations concerning the legal status of any country, territory, city, or area, or of its authorities, or concerning the delimitation of its frontiers or boundaries. CIMMYT encourages fair use of this material. Proper citation is requested. Correct citation: Zaidi, P., K. Harrington, J. de Meyer and N.N. Singh, eds. Improving maize productivity under abiotic stresses.

Contents
Physiology of Drought and Low Nitrogen Tolerance in Crop Plants R. Khanna-Chopra 1 Crop Management Strategies for Improved Maize Productivity Under Marginal Environment R.K. Gupta, R.P. Singh, P.K. Rai and S. Singh 23 Maize (Zea mays L.) Under Excessive Moisture (Waterlogging) Stress P.H. Zaidi, P. Maniselvan, P. Yadav, R.P. Singh and N.N. Singh 45 Screening Technique and Selection Criteria for Maize (Zea mays L.) Genotypes Tolerant to Excessive Moisture Stress P.H. Zaidi, P. Maniselvan, P. Yadav, R.P. Singh, N.N. Singh and G. Srinivasan 83 Breeding Strategies for Excessive Moisture Tolerance in Maize (Zea may L.) M.Z.K.Warsi 109 Molecular Approaches for Improving Drought Tolerance in Tropical Maize B.M. Prasanna and J.-M. Ribaut 125 Agronomic Options for Reducing Yield Losses Under Drought Stress K.P.R. Vittal 137 Field Demonstration and Evaluation of Germplasm Under Marginal Environment: A Practical Guide to Implementation J. de Meyer, M. Mwala and M. Bänziger 143 Breeding for Drought and Low Nitrogen Tolerance in Maize – Indian Experience S. Dass, D. Pal, Meena, P. Arora, S. Kukreja, G. Yadav, K.S. Dhanju and J.C. Mahla 171 Annex – Hand Notes for Presentation by José Crossa José Crossa 187


Physiology of Drought and Low Nitrogen Tolerance in Crop Plants
Renu Khanna-Chopra Water Technology Centre, IARI, New Delhi Drought is the most common adverse environmental factor, which limits crop production in different parts of the world. Drought is a meteorological term involving rainfall deficit and shows variation in intensity, duration and occurrence annually. The rainfall deficit must translate to plant water deficit to affect plant growth, development and finally productivity. Drought resistance is the generic term used to cover a range of mechanisms whereby plants withstand periods of dry weather. It includes drought escape and drought tolerance with high or low tissue water potential. Drought escape is characterized by rapid phenological development and developmental plasticity, which enables the plants to complete its life cycle before the onset of drought. In fact in agricultural crops, selection for rapid phenological development has been most rewarding approach in breeding for drought resistance. Deeper root system and reduction in leaf area contributes towards better water relations and hence growth during water stress. As growth and growth related processes are dependent on turgor pressure, hence the ability of tissue to maintain turgor pressure, as water potential declines is an important mechanism of drought resistance. Osmotic adjustment or accumulations of solutes has been identified as an important mechanism contributing towards turgor pressure maintenance under mild to medium stress intensity. Sugars, amino acids and ions contribute towards osmotic adjustment which has been observed in many crops such as cotton, wheat, sorghum, millets etc. In order to understand the terms “drought” and “drought resistance” it is necessary to understand the basis of water relations in plants. Water potential is the term used for expressing the status of water in plant tissues, the concept of which is explained below.
Concept of Water Potential Growth, differentiation and development leading to productivity of desirable yield components such as seeds are characterized by high energy content per unit volume. These yield components are rich in carbohydrates, proteins, fats, and other constituents, but poor in water content. However, during growth the cells and tissues are rich in water content per unit volume. It is the free energy of water which is responsible for maintenance of growth. It would be inconceivable that there is genetic regulation of free energy of water, because the former is a biological process and the latter a physical phenomenon. Nevertheless, in a biological system, the functional activities are due to molecules and ions which, while being biologically important, are physical entities. For example, a change in chemical constituents, particularly organic molecules and inorganic ions, could change the free energy of water without any change in water content. Let us consider a tissue which contains 0.1 M sucrose and, 0.1 M KNO3. This means that the tissue has 68.4 mg sucrose and 10.1 mg KNO3 per cm3 of water. The free energy of water of such a tissue would be 0.94 MPa. However, let us assume that due to
1

respiration, half of the sucrose is consumed and its molarity is reduced to 0.1 M sucrose, whereas as a result of this respiratory activity there is an influx of KNO3 changing its molarity to 0.1 M. As a consequence of these changes, the free energy of water in terms of solute potential and water potential changes to 1.08 MPa. Thus it should be obvious from this example that biological activity which has a genetic basis could have a profound effect on free energy of water. In turn a change in free energy of water could cause changes in metabolism and growth. Therefore, water relations of a plant are unique in their interaction at physical, chemical, and biological levels in a living system. Water Relations of Plants The water relations of a plant are a sum of the relationships at cellular, tissue, organ and whole plant levels. However, a basic functional unit for water relations is an individual cell. This relationship is expressed by the following equation:
- ψ = - ψ s - ψ m - ψg +ψp (1) where, ψ, ψs, ψm, ψg, ψp represent water potential, solute potential, matric potential, gravimetric potential, and pressure potential. When water potential of a plant or an organ is expressed in terms of its components, it is not of an individual cell. In fact, most of the cells may vary from each other to a small extent, but possibly a majority of them have reasonably equal water potential or its components which we record. However, despite, this similarity at a given position of the plant, say the uppermost mature leaf, there exists a gradient in the plant. The roots normally maintain the highest water potential and the transpiring leaves maintain the lowest water potential. As indicated by Equation 1, the water potential is a sum of various components among which the important ones are solute potential and pressure potential or turgor pressure. In addition, an important component which has been recognized is the modulus of elasticity of cell walls (Turner, 1979). Since the cell walls are made of chemical components which could marginally or substantially differ from each other, they could constitute the basis of genetic variation in water relations of cells and plants. Development of Water Stress in Plants It is difficult to describe accurately the water status of a plant so as to assess the extent of water stress experienced by it. In higher plants, the soil serves as the reservoir and a source of water for the plant, and the atmosphere is the “sink” for water vapor lost by the plant through transpiration. Therefore, a plant serves as a transport channel for the transfer of water from the soil to the atmosphere, depending upon the evaporative demand caused by the difference in water potential of the soil and the atmosphere. The resistance offered at different steps by plant parts, such as roots, stem, leaves, stomata, and leaf surface, regulates the transfer of water from soil to the atmosphere. All these steps may be genetically controlled because they involve biosynthesis of constituents, differentiation, and development of cells and organs. Therefore, there is a possibility of evaluating genetic variability in hydraulic resistance in roots, stem, and leaves. Evidence of genetic variability has started accumulating on these aspects. When water absorbed by
2

roots and lost by leaves through transpiration remains in equilibrium because of the various resistances in the plants, the plant functions normally. However, because of the depletion of soil moisture and also a high evaporative demand of the atmosphere, the equilibrium between water uptake and water loss may be disturbed. This causes a water deficit in the plant leading to water stress and finally to strain in different plant systems. The drop of water potential, lowering of relative water content (RWC), and wilting of leaves and plants are all symptoms of water deficit. Among these, water potential and RWC can be quantified and used as criteria for water stress (Hsiao, 1973). Unfortunately, several studies in annual herbaceous plants have shown that water potential varies according to the stage of plant growth. For example, a plant at –0.6 to – 0.8 MPa leaf water potential might exhibit wilting in the seedling stage, but the same plant might appear fully turgid at –0.1 to –1.5 MPa in a later stage (Aggarwal et al. 1984). In view of the above discussion, it is clear that a number of factors including soil and atmosphere determine water relations of plants. Consequently, environmental variation must contribute greatly to the expression of plant characters associated with water relations. While it must be acknowledged that there is a genetic basis of water relations in plant, still it would be very difficult to establish any simple genetic mechanism for this plant process. Drought Resistance in Crops There are more than 50 definitions of drought based on the effects of precipitation, distribution, evaporation, temperature, soil water storage, and other factors on weekly, monthly, and annual periodicity. However, an effort was made by Sinha (1986) to define drought and drought resistance in the context of agriculture. These definitions are as follows: Drought is defined as the inadequacy of water availability, including precipitation and soil moisture storage capacity, in quantity and distribution during the life cycle of the crop, to restrict expression of its full genetic yield potential; while drought resistance is defined as the mechanism causing minimum loss of yield in water deficit environment relative to the maximum yield in a water-constraint-free management of the crop. We are, therefore, dealing with at least two dynamic components. One is water availability through precipitation or otherwise with the uncertainties in time, distribution and amount, and the other is the plant itself going through all stages of growth and development starting from seed germination to grain development. Matching these two dynamic processes in a manner that the influence of water deficit on yield is minimized becomes a matter of probability. This is unlike disease or pest resistance where a genetic relationship between the host and the parasite can be established and utilized through both conventional methods of plant breeding or molecular tools and genetic engineering with a higher degree of success. While there could be different perceptions of drought resistance by scientists in different fields of investigation, the above definition reasonably meets the requirements of agriculture. An important aspects of this definition is the productivity of economically
3

important parts of the plant. This could be assessed in cereals as grain yield, where considerable work has been done. Assessment of Drought Resistance A. Statistical Method Finlay and Wilkinson (1963) and Eberhart and Russell (1966) developed statistical methods for assessing drought resistance of different varieties of a crop. Several varieties of a crop are grown at different locations which presumably differ in precipitation. The stability of a variety is judged by the least variation in yield across the environments. This stability index is taken as a measure of drought resistance. A limitation of this method is that a short duration variety may complete its life cycle without experiencing drought and yet be identified as drought resistant. An example of this was the barley variety Bankuti Korai studied by Finlay and Wilkinson (1963). Subsequently, Fischer and Maurer (1978) developed a drought susceptibility index based on relative performance of wheat varieties in water sufficient and water deficient environments. Using some of these criteria, many cultivars of wheat, sorghum, barley, and others have been evaluated for drought resistance based on crop yield (Figure 1). However, the important question is whether statistically characterized drought resistance could be related to physiological, biochemical, or molecular traits. If this could be done, then selection criteria in early stages of a breeding program could be developed. B. Physiological Criteria Regulation of water use and maintenance of growth are important physiological attributes for assessing drought resistance. Crops are generally exposed to either intermittent or terminal drought of varying intensity. Therefore, depending upon the nature of drought, different kinds of adaptations could be advantageous. The following criteria have been used to assess drought resistance: 1. Temperature difference between crop canopies and the ambient atmosphere (Blum et
al. 1982). 2. Water retention in excised leaves at specified temperatures (Clarke, 1987) 3. Root characteristics (O’Toole and Bland, 1987) 4. Maintenance of higher water potential and turgor (O’ Toole and Moya, 1978) 5. Maintenance of growth during periods of water deficiency and achievement of
accelerated growth in water-stressed plants on resumption of water supply (Rao, 1988)
6. Osmoregulation (Morgan, 1984) 7. Matching the phenology with water availability pattern 8. 13C/12C ratio (Farquhar and Richards, 1984; Richards et al., 2002) The above mentioned criteria are essentially physiological, but some of them could be manipulated through morphological traits such as leaf characteristics. Furthermore, several of the criteria listed above are themselves related. For example, maintenance of higher water potential and turgor potential are dependent upon water uptake (root characteristics), water loss (stomatal control and leaf area), canopy temperature,
4

osmoregulation, and growth. How much do these individual characters contribute towards drought resistance? It is difficult to estimate, but a few studies suggest their importance. Richards (1987) reported development of isolines for glaucousness in wheat, which reduced water loss and contributed to enhanced yield by 8% under unirrigated conditions. Clarke (1987) reported a close relation between water loss characteristics of excised leaves and field performance of wheat varieties. Therefore, they could justifiably suggest these characters as selection criteria. But are they effective irrespective of a group of varieties, crops, and locations? Passioura (1977) showed that the amount of water used after anthesis determines grain yield in wheat. Subsequently other workers also showed that excessive water use in the parenthesis phase reduced grain yield, or availability of water in the postanthesis period determined grain yield. This suggests that leaf area in the preanthesis period should be regulated so as to reduce water loss. Consequently, it is almost impossible to partition the effects of individual characters, physiological or morphological.
C. Biochemical Criteria Water stress affects many biochemical processes which are both assimilatory and dis-similatory. For example, nitrate assimilation, protein synthesis, and nucleic acid metabolism are influenced by water stress. In addition, photosynthesis rate is reduced and could be completely inhibited. There is usually accumulation of carbohydrates including polyols and amino acids, particularly proline, betaines, and others. There is accumulation of abscisic acid and generation of ethylene. Which of these responses are protective and hence the basis of drought resistance, and which of these responses are expressions of damage at cellular and biochemical level? Are there any threshold levels for various biochemical responses for protective vs. destructive or damaged systems? For example, proline accumulation has been claimed to be an advantageous character as it protects enzymes and proteins during stress. However in some plants proline accumulated only under severe stress and so it was concluded that it represented a damaged state of plant cells and tissues. Abscisic acid is known to be involved in abscission of different plants parts, including leaves, flower buds, flowers, fruits, etc., but it is also known to accumulate in water-stressed tissues. Since this plant hormone is involved in the regulation of stomatal function, it is suggested that it could regulate water loss. Hence, is accumulation of abscisic acid to be taken as an index of drought resistance or a step towards abscission of various plant parts? It could be that there is a threshold for stomatal regulation and hence advantageous during water stress, but that beyond the threshold it leads to senescence and abscission. What determines the threshold? Is root growth in any way involved in determining this threshold?
Osmotic Adjustment
Osmotic adjustment refers to the passive accumulation of solutes within plant cells during episodes of water stress leading to partial or complete maintenance of turgor. The term “osmoregulation”, although often used interchangeably with “osmotic adjustment”, describes the active regulation of solute concentration to maintain volume of turgor as observed in some bacteria and marine blue green algae. Hence osmotic adjustment is a
5

more appropriate term to describe the lowering of osmotic potential arising from the net accumulation of solutes in response to water deficits or salinity in higher plants (Khanna-Chopra and Sinha, 1991). The degree of turgor maintenance that results from osmotic adjustment depends on cell wall properties, i.e., elasticity of the cell wall. When cell walls are more elastic and have a low modulus of elasticity, the rate of loss of turgor with a fall in water potential is less. In higher plants and more specifically crop plants, osmotic adjustment has been mostly shown in leaves. Genetic variation in osmotic adjustment has been observed in wheat, cotton, millet, brassica, and sorghum. However, lately, studies on osmotic adjustment have been extended to roots as well. Roots of pea, maize, and cotton have been shown to adjust osmotically in response to water stress. Under identical water stress situations/treatment, cotton roots adjusted osmotically more than the leaves. Since root tips in the soil profile may act as sensors of soil dehydration, it is logical to observe osmotic adjustment in roots prior to leaves which may enhance root growth during water deficit and this may help in maintaining the balance of phytohormones regulating shoot growth. Osmotic adjustment, although observed in a number of crop plants, is not a universal phenomenon, since some legume crops like soybeans and cowpeas do not adjust osmotically under stress. Besides leaves, apical meristems in wheat when water stressed have the ability to accumulate solutes such as sugars, amino acids, and ions, and hence tolerate desiccation. Although in a true sense, osmotic adjustment has not been demonstrated in meristematic tissues such as apical meristems, it has been amply demonstrated in leaf meristems.
Osmotic adjustment helps in maintaining turgor and thus influences turgor-dependent processes such as stomatal opening, growth of roots, and maintenance of leaf firmness. Maintenance of CO2 influx prevents the occurrence of photoinhibition in the water stressed leaf. Some indirect benefits of osmotic adjustment could be to reduce water stress induced pollen sterility leading to poor grain setting. Water-stressed leaves, on loss of turgor, produce abscisic acid, which could induce pollen sterility by affecting meiosis in pollen mother cells. However, osmotic adjustment in leaves supporting grain development could reduce or delay the onset of turgor loss and hence influence the process of seed set. In wheat and sorghum it has been shown that lines or cultivars that adjusted osmotically have higher yield under water-limited conditions compared to those that do not. The higher yield in sorghum was associated with higher root length densities and higher water extraction.
Osmolytes and Metabolism
Osmotic adjustment in higher plants is due to the accumulation of sugars, amino acids (including proline), and ions particularly K+. There are relatively few studies on the contribution of organic and inorganic solutes to osmotic adjustment in crop plants as compared to lower plants. In lower plants organic solutes responsible for osmotic adjustment include free amino acids, sugar alcohols, and quarternary ammonium compounds and sugars. Inorganic ions have also been shown to have a key role in turgor
6

regulation in lower plants. In crop plants, the capacity for osmotic adjustment varies with the age of the leaf. Young expanding leaves have a relatively higher capacity for osmotic adjustment than fully expanded leaves. The relative contribution of different osmolytes varies in different species and in young and mature leaves of the same species. Thus sugars contribute 50% towards osmotic adjustment in fully expanded sorghum leaves, while they do not contribute to decrease in osmotic potential in fully expanded sunflower leaves. In contrast, the levels of sugars decreased in partly expanded sunflower leaves subjected to severe stress. In sorghum, both glucose and fructose increased in water-stressed leaves. Similar results have been obtained in wheat, sorghum, chickpea and cotton. Amino acids and particularly proline play a very important role in osmotic adjustment in bacteria and lower plants. Free amino acids contributed only about 8% in both fully expanded and partly expanded sunflower leaves. Among amino acids, proline has attracted a considerable attention. Accumulation of proline increases in water-stressed leaves of several crops such as barley, bean, sunflower, chickpea and cotton. However, large increases in proline occur at moderate to severe stress levels. Proline has other advantages besides being an osmolyte and is considered a compatible solute. It has often been observed that although the concentration of proline increases during stress, its contribution towards total change in osmotic potential is insignificant (Khanna-Chopra and Sinha, 1998). Thus in higher plants a wide range of solutes are important in the osmotic adjustment (Table 1, Khanna-Chopra et al., 1994). Most of these are involved in growth processes and possibly accumulate because normal growth is prevented by water stress. On recovery, these accumulated osmolytes serve as ready substrate for growth, leading to growth rates higher than the irrigated control. Hence osmotic adjustment can help the plant to survive moderate stress of short duration. However, if the stress is severe and occurs over a longer duration, stomatal closure occurs, and photosynthesis rate declines due to nonstomatal factors leading to nonavailability of the substrates for osmotic adjustment. Similarly, ion uptake is also inhibited at severe stress level, causing a limitation in the availability of osmolytes for osmotic adjustment. Hence, osmotic adjustment is finite and is operational only within a range of leaf ψ. Moreover, studies on osmotic adjustment need to be extended to the postflowering period wherein the developing grains would act as competitive sinks for the metabolites and ions. Studies on osmotic adjustment in wheat genotypes and species in the flag leaf during post anthesis stage showed considerable genetic variation and correlated significantly with yield stability in water variable environments (Fig 1, Khanna-Chopra, 1999) The genetics of osmoregulation in prokaryotes has been worked out in considerable detail. Genes regulated by the osmotic strength of the medium have been identified. These genes have been cloned also. In eukaryotes, very few studies have been conducted on the genetics of osmoregulation. Morgan (1984) identified wheat lines contrasting in osmoregulation and studied inheritance in the offspring. He found simple inheritance probably under a single gene control. Furthermore, the wheat lines showing high osmoregulation also yielded higher than the corresponding low osmoregulating lines
7

under a water stress environment. The above results are indicative of osmoregulation as a metabolic character linked with drought resistance and amenable to breeding. However, studies on genetics of any character studied under a particular nonchanging or fixed environment should be extended with caution to plants under natural environments. Thus a variety which showed considerable osmoregulation in one particular year failed to do so another year. Antioxidative Defense and Drought Resistance Drought stress is an important abiotic stress, which causes significant crop losses and a common effect of drought stress is to cause oxidative damage (Smirnoff, 1998). Generation of reactive oxygen species (ROS), such as superoxide radicals (O2
-.), hydrogen peroxide (H2O2), and hydroxyl radicals (.OH), within the cell may increase in water stressed leaves, leading to lipid peroxidation which ultimately causes membrane damage (Tambussi et al., 2000). ROS scavenging is a common response to most stresses and it depends on the detoxification mechanism provided by an integrated system of non-enzymic reduced molecules like ascorbate and glutathione as well as enzymatic antioxidants (Asada, 1994). These enzymes include superoxide dismutase (SOD), which reacts with superoxide radicals and converts them to O2 and H2O2. H2O2 is then detoxified by catalase (CAT) and ascorbate peroxidase (APX) (Scandalios, 1990). Glutathione, an intermediary redox metabolite in the ascorbate- glutathione cycle of scavenging H2O2 is maintained in the reduced state by glutathione reductase (GR). In addition, non-specific (guaiacol) peroxidases (POX) also play an important role in the antioxidative protection. Drought stress increases the specific activity of these antioxidant enzymes and may induce new isozymes to overcome the increased oxidative stress (Foyer et al., 1997). However, water stress treatments have been imposed in different modes which influence the antioxidative response thus limiting their comparisons (Beltrano et al., 1997). Drought acclimation or drought hardening occurs within a single life cycle of many crop species, i.e., exposure to a mild form of drought makes the plant less sensitive to a second cycle of drought of a more severe nature. Plants are normally able to minimize oxidative damage during acclimation as sublethal amounts of ROS acclimate plants to both biotic and abiotic stress conditions and reduce plant growth as part of an acclimatory mechanism (Vranová et al., 2002). The molecular and biochemical mechanisms of acclimation however, are still not understood and the signaling pathways remain elusive. To identify the processes involved in acclimation, a comprehensive analysis of gene expression was done in tobacco leaves, acclimated to oxidative stress (pretreatment was done using methyl viologen) and 95 genes were identified, of which 83% were induced and 17% were repressed (Vranová et al., 2002). During acclimation 2 distinct groups of co-regulated genes (‘early’- and ‘late response’ gene regulons) were observed of which the expression of the late response genes were enhanced in the acclimated leaf tissues. These included antioxidant genes and genes involved in cellular protection. There is a dearth of information of oxidative stress management in relation to drought acclimation. Such a study was undertaken in upland rice cultivars in our laboratory and it was observed that the co-ordinated defense of the anti-oxidant enzymes helped the plants
8

to recover in terms of growth on rewatering after stress cycles (Srivalli et al., 2003). In rice plants, an early increase in H2O2 in the first cycle of water stress and recovery (WSR I) induced antioxidant activity and prevented the accumulation of H2O2 during acclimation i.e. the second more severe cycle of water stress and recovery. There was an increase in the activity of superoxide dismutase and CAT isoforms during stress which declined on rewatering and a new CAT isoform was also induced in the third cycle of stress showing its importance in the scavenging of ROS which was important for the plants to survive and resume growth (Fig. 2). The activity of the GR isoform was higher in the stressed plants as compared to the controls in WSR I and was retained on rewatering thereafter. Along with a better antioxidant management, drought acclimation also led to reduced superoxide levels and lipid peroxidation as was observed in wheat seedlings (Selote et al., 2004). Thus, reduced ROS and better antioxidant management led the plants to acclimate towards drought stress and thus contributed towards drought tolerance. Breeding for Drought Resistance From Wheat Cross WL711 x C306 Using Physiological Criteria Combining drought resistance with higher yield is an important objective in national and international crop improvement programmes. Using Triticum aestivum, Triticum durum and Triticale cultivars, Sinha et al (1986) showed cv. C306 to be drought resistant based on yield stability in water variable environments. In order to transfer drought resistance traits from cv. C306 to high yielding wheat cultivars, crosses were made by plant breeders but the attempts were unsuccessful due to hybrid necrosis resulting in death of F1 plants at the seedling stage itself. Hence, a programme was initiated, in which, a drought resistant wheat cultivar C306 was crossed with several high yielding cultivars like WL711, Kalyansona, J24, HD2329, HD2285, Sonalika and Lok1. All the crosses produced necrotic hybrids with varying intensity and died at different stages of growth. Among these, hybrid of WL711 x C306 survived up to flag leaf stage, but died before ear emergence. The ear enclosed in leaf sheaths from this cross were excised and cultured in a medium containing sucrose, glutamine and antioxidants at 25°C for 40 days. The hybrid ears produced few grains. Thus ear culture technique provided a simple and efficient method for overcoming hybrid necrosis and obtaining recombinants. The F2 plants showed segregation for necrosis in 9:7 ratio (Necrotic: Healthy). Data was recorded on surviving healthy F2 plants only. The surviving healthy F2 plants exhibited some unique combination of traits (Table 2). The mean values of the F2 individuals for some or all morpho-physiological traits were significantly superior to either of the parent or over both the parents. Some morphological traits like early vigour, spreading or semi-spreading habit was observed in most of the F2 individuals. Up to 40% of available water may be lost by evaporation directly from the soil (Loss and Siddique, 1994, Richards, 1996), so high early ground cover and biomass production may permit more efficient use of soil water. Leaf area measured between 45-50 days after emergence was between 9.2-603.4 cm2. Though, more than half of the plants died because of necrosis, some of the surviving F2 individuals provided the
9

opportunity to select some desirable recombinants from this cross. The highest coefficient of variability was exhibited by leaf area followed by cell membrane stability, yield and biomass. The variation exhibited by parents for almost all the characters under study indicates that selection for several of these characters may be effective. However, selection efficiency is related to magnitude of heritability and genetic advance. The relative variability for any quantitative trait in any segregating generation, particularly in F2 is generally related with degree of divergence of two compatible parents. If so, then it would be possible to recover transgressive segregants with improved performance for a character under consideration, which in advanced generation could be established as homozygous lines. Among the physiological traits, cell membrane stability showed large coefficient of variation. Cellular membrane dysfunction due to stress is well expressed in its increased permeability for ions and electrolytes, which can be measured by the efflux of electrolytes. Hence, the estimation of membrane damage under stress by measuring cellular leakage from the affected tissue is finding a growing use as a measure of cell membrane stability and as a screen for drought resistance. CMS in terms of relative injury of F2 individuals ranged between 37.8 to 87.3%, while cv. C306 showed stronger membrane as it showed less relative injury of 60.8% as compared with 78.4% of WL711. Though, coefficient of variation for RWC and ELRWC was low, but the range of these traits was quite higher, upon which selection can be acted in subsequent generations. The RWC was 80.4% in cv. C306 and 69.5% in WL711. RWC of the F2 individuals was in the range of 52 to 90.8%. The RWC was associated with leaf rolling. Individuals with higher RWC did not show any rolling or they were partially rolled. Similar to RWC, F2 showed large range of ELRWC (34.6 to 86.3%). The water relation capacity of WL711 was higher as it showed less water loss (58.2%) as compared with C306 (77.6%). The traits affected by water relations like RWC and ELRWC can give indications of water extraction patterns from soil. Morpho-physiological traits like vigour, habit, phenology, CMS, RWC, ELRWC and canopy temperature depression (CTD) etc. served as selection criteria for drought resistance. In F5 and F6 generation, 27 RILs, thus selected, were sown as plots under irrigated and unirrigated conditions. These lines were screened for all the above mentioned characters. In both the years (F5 and F6), there was little variation in mean values of these traits, indicating their stability over seasons and may be because of homozygosity attained by the RILs. CMS ranged between 27.3 to 73.3% in F6 generation. CMS showed significant correlation (R2=0.4118 p>0.01) with grain yield under water stress condition (Fig. 3a). The high yielding RILs HT9, BR10, BL10, W12 showed higher membrane stability as they showed less electrolytic leakage of 43.7, 41.1, 39.9 and 41.5% respectively. The relative injury (RI) of C306 was 44.1% and 55.7% in WL711. The selected RILs maintained lower canopy temperature by 0.57 to 1.70ºC during water stress. The canopy temperature depression showed significant correlation with biomass production under water stress (R2 = 0.3235, p>0.01, Fig. 3b). Similar to CTD, ELRWC also showed significant correlation with biomass (R2 = 0.2628, p>0.01).
10

In the F6 and F7 generation, better performing lines were grown under different levels of water availability regimes created by Line-Source sprinkler irrigation system. Some lines combined higher grain yield with higher biomass under water variable environments and showed higher stability for yield (Table 3). The yield stability (bi) showed high and significant correlation with drought susceptibility index (r= 0.72, p>0.002). The selected lines also showed bold amber grains. The desirable RILs are early maturing like WL711 and showed cellular traits and water relations like C306. Hence the present study shows that screening techniques based on physiological traits can be adopted for the identification of the best parents to be used in crossing programmes and applied directly to the segregating population (Blum, 1988; Winter et al, 1988). Response to Low Nitrogen Availability Nitrogen is the most expensive fertilizer nutrient used to raise crop plants. Extensive use of nitrogen (N) fertilizers besides raising farm-input costs has also resulted in environmental degradation. Therefore plant breeders need to develop cultivars that have improved N use efficiency so that they can respond to both conditions of high and low N fertility. Nitrogen use efficiency (NUE) has been defined by Moll et al. (1982) as grain yield per unit of available N (soil + fertilizer N). They also proposed that NUE can be partitioned into the components of N uptake efficiency (UPE) and N utilization efficiency (UTE). Hence, NUE = UPE x UTE (1) Nutrient use efficiency Uptake efficiency Utilization efficiency Grain yield Total nutrient in the plant Grain yield (2) Nutrient supplied = Nutrient supplied Total Nutrient in the plant Utilization efficiency can again be divided into 2 sub components UTE = Harvest Index x Biomass production efficiency Total Nutrient in the plant Total Plant biomass Total nutrient in the plant
It is well known that modern semi-dwarf cultivars of wheat respond more to available nitrogen than old tall cultivars by producing more yield. A comparison of N response of old tall cultivars and modern semi dwarf cultivars at varying N levels has clearly shown that grain yield did not differ between the groups at zero N treatment but at high N levels the semi dwarfs out yielded tall cultivars (Fischer, 1981, Sinha et al., 1981). Studies on genetic progress in wheat yields and nitrogen use efficiency have clearly shown that considerable progress in NUE has been achieved due to improvement in both the N uptake efficiency and N utilization efficiency (Ortiz-Monasterio et al., 1977). However, the relative importance of these components is affected by the level of applied nitrogen. UPE is more important at low N levels while UPE is the major determinant at higher levels of nitrogen application.
11

Most high yielding wheats have a nitrogen harvest index of 75%. As wheat yields have increased, the protein concentration in the grain has decreased (Calderini et al. 1995). This reduction in protein N has been associated with higher N utilization efficiency. Hence the challenge lies in improving nitrogen use efficiency and yet maintaining nutrient content of wheat grain so that bread making quality is not affected. Currently breeding strategies have been developed at CIMMYT so that genotypes which are both efficient and responsive to applied N can be identified (Van Ginkel et al. 2001). Nitrogen use efficiency is a complex trait as it encompasses the process of nitrogen assimilation and partitioning. Selection of nutrient efficient genotypes requires a deep understanding of the genetic basis of nitrogen assimilation and N use at different stages of plant development. The structural elements of nitrogen assimilation pathway are known but the signals and the transduction pathway that govern the activities of the enzymes in the pathway need to be identified. Attempts to isolate regulatory mutants by genetic approaches led to the isolation of some mutants in Arabidopsis and E.Coli affected in NO3 uptake and nitrate reductase gene expression but failed to isolate new genes that could be involved in the regulation of at least one step of the pathway. Loudet et al. (2003) have done an extensive study on the QTL analysis of nitrogen use efficiency using Arabidopsis as a model genetic system and have taken advantage of the natural variation available among ecotypes. They have mapped QTLs for traits such as shoot growth, total N, nitrate, free amino acid contents under low and high nitrate availability in the soil. They have identified 18 loci that are polymorphic between parents and four loci, which could have regulatory function for total nitrogen. In future molecular marker technology may complement the traditional breeding approaches in selecting for higher nitrogen use efficiency among genotypes and in segregating populations.
12

References Aggarwal, P.K., Khanna-Chopra, R., and Sinha, S.K., 1984. Changes in leaf water
potential in relation to growth and dry matter production. Ind. J. Expt. Biol., 22: 98-101.
Asada, K., 1994. Production and action of active oxygen species in photosynthetic
tissues. In: Foyer, C.H., Mullineaux, P.M. (Eds.) Causes of photooxidative stress and amelioration of defense system in plants. CRC Press, Florida, pp. 77-103.
Beltrano, J., Montaldi, E., Bartoli, C., and Carbone, A., 1997. Emission of water-stress
ethylene in wheat (Triticum aestivum L.) ears.: Effects of rewatering. Plant Growth Reg., 21: 121-126.
Blum, A., 1988. (Ed.) Plant breeding for stress environments. CRC Press, Boca Raton
Florida pp. 223. Blum, A., Mayer, J., and Gozlan, G., 1982. Infra-red thermal sensing of plant canopies as
a screening technique for dehydration avoidance in wheat. Field Crops Res. 5: 137-146.
Calderini, D.F., Torres-Leon, S., and Slafer, G.A., 1995. Consequences of wheat
breeding on nitrogen and phophorus yield, grain nitrogen and phosphorus concentration and associated traits. Ann. Bot. 76: 315-322.
Clarke, J.M., 1987. Use of physiological and morphological traits in breeding
programmes to improve drought resistance of cereals. In: Srivastava, J.P., Porceddu, E., Acevedo, E., and Varma, S (Eds.) Drought Tolerance in Winter Cereals John Wiley & Sons, Chichester, pp. 171-189.
Eberhart, S.A., and Russell, W.A., 1966. Stability parameters for comparing varieties.
Crop Sci. 6: 36-40. Farquhar, G.D., and Richards, R.A., 1984. Isotopic composition of plant carbon
correlates with water use efficiency of wheat genotypes. Aust. J. Plant Physiol. 11: 539-
Finley, K.W. and Wilkinson, G.N., 1963. The analysis of adaptation in a plant-breeding
programme. Aust. J. Agric. Res. 14: 742-754. Fischer, R.A., 1981. Optimizing the use of water and nitrogen through breeding of crops.
Plant and Soil., 58: 249-278. Fischer, R.A. and Maurer, R., 1978. Drought resistance in spring wheat cultivars. I. Grain
yield responses. Aust. J. Agric. Res. 29: 897-912.
13

Foyer, C.H., Lopez-Delgrado, H., Dat, J.F, and Scott, I.M., 1997 Hydrogen peroxide and glutathione-associated mechanisms of acclimatory stress tolerance and signaling. Physiol. Plant., 100: 241-254.
Hsiao, T.C., 1973. Plant responses to water stress. Annu. Rev. Plant Physiol. 24: 519-
570. Khanna-Chopra, R., 1999. Osmotic adjustment and yield stability in wheat genotypes and
species grown in water limited environments. J. Plant Biol., 26: 173-178. Khanna-Chopra, R., Moinuddin, Vasudev, S., Maheswari, M., Srivastava, A., and
Bahukhandi, D., 1994. K+, osmotic adjustment and drought tolerance-An overview. Proc. Ind. Natl. Sci. Acad., 61: 51-56.
Khanna-Chopra, R., and Sinha, S.K., 1991. Genetic aspects of water relations and
drought resistance in crops. In: Khanna, K.R. (Ed.), Biochemical Aspects of Crop Improvement. CRC Press, Florida, pp. 153-175
Khanna-Chopra, R., and Sinha, S.K., 1998. Prospects of success of biotechnological
approaches for improving tolerance to drought stress in crop plants. Curr. Sci., 74: 25-34.
Loss, S.P., and Siddique, K.H.M. 1994. Morphological and physiological traits associated
with wheat yield increases in Mediterranean environment. Adv. Agron., 52: 229-276.
Loudet, O., Chaillou, S., Merigout, P,. Talbotec, J., and Daniel-Vedele, F., 2003.
Quantitative trait loci analysis of nitrogen use efficiency in Arabidopsis. Plant Physiol., 131: 345-358.
Moll, R.H., Kamprath, E.J., Jackson, W.A., 1982. Analysis and interpretation of factors
which contribute to efficiency of nitrogen utilization. Agron. J., 74: 562-564. Morgan, J.M., 1984. Osmoregulation and water stress in higher plants. Annu. Rev. Plant
Physiol., 35: 299-319. Ortiz-Monasterio, J.I., Sayre, K.D., Rajaram, S., and McMahon, M., 1997. Genetic
progress in wheat yield and nitrogen use efficiency under four nitrogen rates. Crop Sci., 37: 898-904.
O’Toole, J.C., and Bland, W.L., 1987. Genotypic variation in crop plant root systems.
Adv. Agron., 41: 91-145. O’Toole, J.C., and Moya, T.B., 1978. Genotypic variation in maintenance of leaf water
potential in rice. Crop Sci. 18: 873-876.
14

Passioura, J.B., 1977. Grain yield, harvest index and water use of wheat. J. Aust. Inst. Agric. Sci. 43: 117-120.
Rao, D.G., 1988. Response of sorghum hybrids and their parents to water stress and
recovery. Ph.D. thesis, IARI, New Delhi. Richards, R.A., 1987. Physiology and breeding of winter-grown cereals for dry areas. In:
Srivastava, J.P., Porceddu, E., Acevedo, E., and Varma, S (Eds.) Drought Tolerance in Winter Cereals. John Wiley & Sons, Chichester, pp. 133-150.
Richards, R.A., 1996. Defining selection criteria to improve yield under drought. Plant
Growth Reg., 20: 157-166. Richards, R.A., Rebetzke, G.J,. Condon, A.G,. van Herwaarden, A.F., 2002. Breeding
opportunities for increasing the efficiency of water use and crop yield in temperate cereals. Crop Sci., 42: 111-121.
Scandalios, J.G., 1990. Response of plant antioxidant defense genes to environmental
stress. Adv. Genet., 28: 1-41. Selote, D.S., Bharti, S., and Khanna-Chopra, R., 2004. Drought acclimation reduces O2-
accumulation and lipid peroxidation in wheat seedlings. Biochem. Biophys. Res. Comm., 314: 724-729.
Sinha, S. K., 1986. Drought resistance in crop plants: A physiological and biochemical
analysis. In: Chopra, V.L. and Paroda, R.S. (Eds.) Approaches for Incorporating Drought and Salinity Resistance in Crop Plants. Oxford, IBH, Delhi. pp. 56-86.
Sinha, S. K., Aggarwal., P.K,. Chaturvedi, G.S., Koundal, K.R., Khanna-Chopra, R.,
1981. A comparison of physiological and yield characteristics in old and new wheat varieties. J. Agric. Sci. (Camb.),. 97: 233-236.
Sinha, S. K., Aggarwal., P.K,. Chaturvedi, G.S., Singh, A.K., Kailasnathan, K., 1986.
Performance of wheat and Triticale cultivars in a variable soil-water environment. I. Grain yield stability. Field Crops Res., 13: 289-299.
Smirnoff, N., 1998. Plant resistance to environmental stress. Curr. Opin. Biotech., 9: 214-
219. Srivalli, B., Sharma, G., and Khanna-Chopra, R., 2003. Antioxidative defense system in
an upland rice cultivar subjected to increasing intensity of water stress followed by recovery. Physiol. Plant., 119: 503–512.
Tambussi, E.A., Bartoli, C.G., Beltrano, J., Guiamet, J.J., Araus, J.L., 2000. Oxidative
damage to thylakoid proteins in water-stressed leaves of wheat (Triticum aestivum). Physiol. Plant., 108: 398-404.
15

Turner, N.C., 1979. Drought resistance and adaptation to water deficits in crop plants. In:
Mussell, H. and Staples, R.C. (Eds.) Stress Physiology in Crop Plants. Wiley Interscience, NY. pp. 343-372.
Van Ginkel, M., Ortiz-Monasterio, I., Trethowan, R., and Hernandez, E., 2001.
Methodology for selecting segregating populations for improved N-use efficiency in bread wheat. Euphytica., 223-230.
Vranová, E., Atichartpongkul, S., Villaroel, R., Van Montagu, M., Inzé, D., Van Camp,
W., 2002. Comprehensive analysis of gene expression in Nicotiana tabacum leaves acclimated to oxidative stress. Proc. Natl. Acad. Sci. U S A, 99: 10870-10875.
Winter, S.R., Musick, J.T., and Porter, K.B., 1988. Evaluation of screening techniques for
breeding drought resistant wheat crop. Crop Sci., 28: 512-516.
16

Table 1. Solutes and K+ contributing to osmotic potential in cell sap of desi and kabuli chickpea leaves during mid pod development stage (Khanna-Chopra et al., 1994)
Water potential Osmotic potential (OP)
Sugars Amino acids
Proline K+ content
OP accounted for
(-MPa) PUSA 256 (Desi) 1.13 1.44 0.10 0.17 0.09 0.67 1.03 2.17 1.96 0.10 0.20 0.34 0.84 1.48 BG 1001 (Kabuli) 1.73 2.37 0.20 0.39 0.15 0.77 1.51 2.07 2.52 0.16 0.37 0.32 0.69 1.54
17

Table 2: Mean and % coefficient of variation (CV) for some Morpho-physiological traits in parents and F2 population obtained from wheat cross WL711 x C306
Leaf Area (cm2/plant
Flag Leaf Area (cm2)
Biomass (g/plant) Yield (g/plant) 1000 Seed
Weight (g) CMS (%) RWC (%) ELRWC (%)
Mean CV Mean CV Mean CV Mean CV Mean CV Mean CV Mean CV Mean CV
WL711 187.24 15.84
71.62 13.09 55.03 10.11 25.40 12.17 38.10 6.19 78.29 9.14 69.54 7.55 58.19 5.57
C306 240.07 7.05 58.29 14.16 66.19 8.37 22.54 13.10 40.42 4.91 60.27 7.91 80.44 2.40 77.56 9.10
F2 166.21 70.47 68.59 23.63 79.15 42.91 31.38 50.06 39.01 24.23 71.50 58.92 74.52 13.00 63.56 17.35
CMS: Cell membrane stability, RWC: Relative water content, ELRWC: Excised leaf relative water content
18
Dr. S.K. Sinha
able 1: Mean and % coefficient of variation (CV) for some morpho-physiological traits

Table 3: Yield stability and yield characteristics of F6 RILs of the wheat cross WL711 x C306 RIL
Yield gm-2
Biomass gm-2
1000 seed weight (g)
bi S Seed colour
WL711 598.4 1719.3 35.3 1.42 1.19 Brown
C306 460.4 1879.0 37.1 0.72 0.78 White
BL10 612.4 1895.0 36.0 1.04 0.82 White
W12 554.4 1786.3 39.1 0.89 0.83 White
HT9 574.1 1805.6 36.2 1.10 0.96 White
BR10 537.0 1719.9 36.2 0.98 0.95 White
CD at 0.05 P 40.9 102.6 bi: Grain Yield stability over water variable environments, S: Drought susceptibility index
19

Stability Index (Grain Yield)
Y=-1.9024x + 1.6066
2R2=0.454
2.5
2
1.5
1
0.5
0 0.8 0.60.40.20
Osmotic adjustment
Figure 1. Relationship between osmotic adjustment and stability index for grain yield for different water regimes in wheat genotypes and species (Khanna-Chopra, 1999).
20

0 10 20 30 40 50
a
SOD activity (Units mg-1protein)
R R R
50
40
30
20
10
0
Days after treatment
b
Figure 2. Drought acclimation effect on superoxide dismutase activity (a) and catalase isoforms (b) showed the increase in activity during stress and the presence of a catalase isoform which increased with the stress intensity (Srivalli et al., 2003).
21

y = -6.425x + 708.24R2 = 0.4118
0
100
200
300
400
500
600
25 35 45 55 65 75% Relative Injuty
Gra
in Y
ield
gm
-2a
y = 170.53x + 350.3R2 = 0.3235
200
450
700
950
1200
1450
1700
1950
4.0 5.0 6.0 7.0 8.0Canopy Temperature Depression (oC)
Bio
mas
s gm
-2
b
Fig 3: Cell membrane stability (a) and Canopy temperature depression (b) showed significant correlation with yield and biomass respectively under water stress in F6 RILs of the wheat cross WL711 x C306
22

Crop Management Strategies for Improved Maize Productivity Under Marginal Environment Raj K. Gupta1, R.P. Singh2, P.K. Rai2 and S. Singh2
1 International Maize and Wheat Improvement Center (CIMMYT), NASC Complex, Pusa Campus, New Delhi-12, India 2 Directorate of Maize Research, I.A.R.I. Campus, New Delhi-110 012, India
Introduction In tropics, climatic conditions are seldom “optimal” for healthy growth and higher productivity of crop community. Prevailing climatic conditions are either too wet or too dry for optimal corn growth and development. Abiotic stresses of varied nature and intensity often occur simultaneously. For example, drought and low soil fertility (low nitrogen) stresses often go hand in hand. Similarly, excessively sodic and acidic soils cause increase resistance to root penetration, cause toxicity/deficiency of specific ions, and waterlogging and/or drought like conditions due to low soil moisture contents, deep in soil profile. Also abiotic stresses may be visually obvious to be easily recognized, but when operative at lower levels may go unnoticed by the casual observers until the final harvest. Five broad levels of agricultural production can be distinguished (Penning de Vries and Laar 1982). At the potential production level, growth occurs under conditions of ample supply of water and nutrients, and is determined by weather conditions (radiation, temperatures) in interaction with the morpho-physiological and genetic make-up of the plant. This circumstance prevails on perhaps only 5.0% of the area planted to maize in the lowland tropics. Low or excess water, poor N-fertility and perhaps phosphorus and zinc availability limit growth for at least part of the growing season. Together, they define the attainable production level, found on around 95% of the tropical maize growing areas. Actual production level may be further reduced if growth is limited by the presence of weeds, pests, diseases or pollutants. It is generally agreed that the largest causes of maize yield loss in the tropics and subtropics are inadequate water and soil fertility. Losses to drought alone in the tropics may total 24 million tones per year, or around 17 percent of well-watered production, but localized losses may be much higher (Edmeades et al., 1992). Severe losses such as these can be expected to lead to close association between seasonal rainfall and national or regional average of maize yields. This suggests that drought is a pervasive cause of yield instability in maize-based cropping systems in most years and environments. Within a particular field, localized yield losses can reach 100 percent where rainfall falls below 350 to 500 millimeters (mm) in the crop season, or where there are patches of soil that are sandy or shallow, provided the period of severe water deficit coincides with flowering.
23

Potential Yield
Attainable Yield
Actual Yield
ProtectionMeasures
Yield increasingMeasures
Defining factors
Yield Limiting Factors
Yield Reducing Factors
Kharif Maize Rabi maize
• Radiation• Temperature• Genetic Potential
•Radiation•Temperature•Genetic Potential
•Imbalanced & inadequate Fertilizer use, late planting
•Less Conjunctive water use
• Weeds•Low crop stand, •Water logging• Week seedlings due to pests•Energy and labor shortages
•Nutrients•Water shortages• Crop estab. Tech.
•Delayed Irrig.•Plough pan•Weeds-disease•
Production due to various types and Level
Production Constraints: Sustainability Dimensions
In considering technological options for improving maize production under abiotic stresses, it is important not to lose sight of several key points. First, only genetic improvement for tolerance to drought, excessive moisture and low N cannot eliminate the gap between current and potential yields (as determined by radiation and temperature). Breeding is one strategy for attacking the problems through genetic improvement for improved tolerance to abiotic stresses. Agronomic practices such as timely sowing at the correct density and improved infiltration and reduced evaporation through weed control, mulch management, and tillage (Gischer, 1989; Eyherabide et al., 1997) also play an important part in alleviating effects of inadequate water or nutrient availability in maize. Conventional wisdom holds that genetic improvement could make up about 15-25% of the gap in yields between stressed and unstressed conditions, and use of efficient crop management practices could possibly close the gap by an additional 15-25%, although a full consideration of field spatial variability and its effects could further raise this figure. The remaining 50-70% can only be filled by adding fertilizer and water to the crop (Edmeades et al., 2000).
The Marginal Environment A general definition of a marginal environment proposed by CIMMYT is an area "in which irremediable climatic or soil conditions limit yields to less than 40% of potential yields as defined by temperature and available solar radiation" (Morris et al.,1991). "Irremediable conditions" are those that entail prohibitive costs for amelioration, except
24

over the very long term (Fischer, 1988). Applying this definition has proven difficult because of problems in quantifying the costs of providing irrigation. All the definitions of drought-stressed maize environments could, however, may vary with soil infiltration and water-holding capacity of a particular area. In the tropics, a marginal rainfed maize environment in the lowlands may be defined as having seasonal precipitation below 500 mm and in the highlands as having seasonal precipitation below 300-350 mm. Lower temperatures associated with higher elevations account for the reduction in water requirements. In view of the crucial nature of drought at flowering (Chapman and Baretto, 1996) suggested an alternative rainfall based definition on the amount of rain received during the four-week period around flowering, over the long term. Less than 100 mm during this period indicates the region is unsuitable for maize production; more than 200 mm suggests suitability for most maize cultivars. Rainfall between 100 and 200 mm around the flowering period could indicate that an area is marginal for maize production. Yet another drought measure based on rainfall is the ratio of precipitation (P) to potential evapotranspiration (PE). For example, favorable maize growing environments could be defined as those with growing seasons that include n or more consecutive months when P/PE> 0.5; marginal environments would be areas with n-l or fewer months when P/PE> 0.5. Identifying drought-stressed production zones and attendant yield losses implies analyzing differences in degree rather than in kind. Maize, which is produced primarily under rainfed conditions, may experience drought stress in diverse production environments, even those classified as "favorable." For example, in the world's largest maize producer, USA, one-fourth of the maize crop in the more favorable growing areas can be expected to experience at least moderate drought stress in any given season (Reeder 1997).
Agro-ecologies of Asian Region South Asia could be divided into six major agro-ecoregions (Mruthyunjaya and Pal, 2002), i.e.- Hot Arid, Semi-Arid, Irrigated Sub-Humid, High Rainfall Humid, Sub-Humid to Humid Coasts, and Sub-Humid to Cold Arid Mountains (Table-1). The Semi-Arid, High Rainfall Humid, and Irrigated Sub-Humid AERs are quite large, occupying 38.1%, 26.4% and 19%, respectively, of the total net-sown area in South Asia. They contribute about one-fourth each to the total value of agricultural output. The High Rainfall Humid agro-ecoregions (AER), largely practicing rice-based production system, is of greater significance as it has lot of growth potential, and a large proportion of poor people live in this region. However, these constraints cause significant production losses. For example, abiotic stresses like drought and excessive moisture (waterlogging) causes significant production losses in most the crops, including maize, grown in Northern and eastern India. A systematic strategy to address all these constraints successfully through harnessing scientific opportunities should guide further prioritization of research programs for various AERs in South & Southeast Asia.
In India, average monsoon rainfall is about 850 mm. Orissa, Chattishgarh, West Bengal states, North East India, west coast and ghat receive more than 1000 mm rain during this season. The sub mountain region intending north Bihar to Jammu region also receive more than 1000 mm rainfall during monsoon. The peninsular India gets less than 500 mm rain. 500 mm isoline of rainfall covers the region from Sourashtra and Kutch
25

(Gujarat) to Delhi and then to Punjab, Haryana and Himachal Pradesh. The rainfall decreases rapidly to less than 100 mm in western Rajasthan. Region above 500 mm rain in the season can be classified as wet and those below 500 mm as dry part of India. Though southwestern monsoon is a regular cyclic process over this part of subcontinents, its distribution is often erratic. This gives rise to variation in space and time results in flood in some area and drought in other. Recurring abnormalities brings serious shortfall in food production particularly in marginal regions. Nearly 16% of our geographical area is chronically drought affected. However, in drought year like 1987 three fourth area of the country was severely affected. The coefficient of variation in rainfall in different range is given below (Joshi et al., 1998). The high value of coefficient of variation associated with less amount of rainfall is the main problem associated with these areas.
Rain fall range C.V. % < 500 mm 50-55 500 – 700 mm 40-50 700 – 1100 mm 30-40 > 1100 mm 20-30
Rainfed Production System and Management Options Drought is a climatic anomaly, which is characterized by deficient supply of soil moisture resulting from sub-normal rainfall, erratic distribution, higher water need or combination of all above. This is a common feature in rainfall areas. Raising crop in this region as a major challenge to farming communities, agricultural scientists and administrators. However, success or raising crops and their choice depend on
• Nature of drought • Duration of drought • Periodicity of occurrence with in season
The quantum and distribution of rainfall allows the choice of crops and cropping pattern in any region is determined by length of growing region. Venkateswaralu (1986) estimated effective cropping season at different location in India (Table-2). Managing the Rainfed Crop Environment: Rainfed agriculture is a system of low inputs combined with soil and water conservation practices and risk reducing strategies. The system can be sustainable if practiced properly. Water shortage is the main limiting factor, but successful systems also maintain reasonable practices to eliminate other limiting factors (poor nutrient status, weeds, biotic stresses etc.). However, as moisture shortage dictates a limit on yield, all other inputs must be carefully adjusted accordingly to fit the expected low economic return. The most advanced systems have been developed in many part of world, even though traditional systems employed in Asia and the Middle East also offer important insights. The system involves a rotation between self-seeding legumes grown for several
26

years. The farmer grows wheat and raises sheep, while the legume serves to sustain soil fertility (mainly nitrogen). The lesson learned from the American and Australian experience is that the development of a sustainable farming system involves the following principles.
i) Improve soil and water conservation practices and associated tillage systems
ii) Weed control iii) Soil fertility management. iv) Optimized plant population density. v) Improved forage/livestock/grains integration and rotation. vi) Avoid mono cropping vii) Diversification of farming
i) Fallow and conservation tillage The fallow system is designed to conserve soil moisture from one season to another or from one year to the other, depending on climate and crop. Increasing storage of soil moisture by the fallow system with or without conservation tillage is standard agricultural practice in rainfed farming. The benefit of fallow and conservation tillage in terms of increasing available soil moisture to the crop depends on soil water-holding capacity, climate, topography and management practices. Fallow efficiency, in terms of percent increase in soil moisture availability to the crop measured at planting date normally ranges from about 5% to 30%. While these amounts are not impressive they can make a difference between crop failure and success. The fallow carries additional benefits such as improved soil nutrients availability and the eradication of certain soil-born pests, such as nematodes. Conservation agriculture involves the principles of no-till or minimum tillage to preserve soil structure, ground cover by mulch, and crop rotations. Conservation agriculture has become the cornerstone of irrigated intensely cultivated agroecosystems and also gaining ground in dryland systems in certain regions of the USA, Canada and other regions. It has been recently re-demonstrated very impressively in dryland wheat experiments carried out in Southern Israel. While the benefits of conservation agriculture are well documented it has also been noted that crop residues under this system may promote certain crop diseases. In certain soils, deep tillage was found very useful to improve soil moisture storage, especially when hard soils or hardpans are a problem. This is an expensive operation that cannot be deployed regularly in dryland farming. Tillage can improve the entry of water into the soil and facilitate the early growth of plant roots, enabling them to capture stored moisture. Tillage can also control weeds that compete with the crop for water. Tillage options vary by soil type. In southern Africa, sandy soils "have little or no crumb structure, are often compact when dry, and some are prone to crusting. Compaction of undisturbed subsoils tends to impede root penetration" (Waddington et al., 1995). On those soils, some form of tillage is necessary for crop production, so minimum tillage may be appropriate. However, in many semiarid areas of
27

the region where draft animals are used, the conventional oxdrawn moldboard plough reaches a depth of only 10-15 cm; deeper ploughing can improve maize yields up to 25% by permitting deeper rooting (Grant, et al.,. 1979; Willcocks 1981; Ivy 1987). Adjusting tillage practices can allow farmers to plant at more optimal dates. Reduced tillage options include chisel plough and shallow ripper tines. Most on-farm experimentation on reduced tillage in southern Africa demonstrates equal yields over one to three years when compared with traditional moldboard ploughing, but draft animal and time requirements were considerably lower (Waddington et al.,1995), which may permit earlier, more optimal planting (Shumba, 1989). Another tillage operation, post-harvest or winter plowing, may contribute to earlier planting by reducing the time and energy needed to prepare the land when the next rainy season begins (Waddington et al., 1995). ii) Furrow dikes and soil pitting These techniques constitute a field surface tillage manipulation to minimize runoff away from the field. Furrow dikes are furrows, which are divided into short basins by small dikes. This is achieved by special equipment. The system is very amenable to grow crops like maize and it can be integrated with or without furrow irrigation. It is generally considered effective for increasing rainfall capture and raising yield where annual rainfall ranges between 500 and 800 mm. Soil pitting involves the formation of small depressions at close proximity to reduce runoff from rainstorms. The crop is planted over this modified surface. Experiments performed with wheat in nine farmer demonstration plots in Southern Israel during 1988 showed that pitting increased yield by an average of 7.5% at a mean yield of 3.25 ton/ha. Unlike furrow dikes this system is not limited to row crops. iii) Water harvesting/spreading This is a broad term to describe various methods to collect runoff from large contributing areas and concentrate it for use in smaller crop area. This is an ancient practice already adopted by Nabtian desert settlements in the Middle East several centuries A.D. The basic water harvesting systems involve an external contributing area to induce runoff. This area is physically or chemically treated for maximizing runoff. The water is diverted into a receiving area comprising of cultivated plots, individual trees or small terraces. The contributing area may lie in the agricultural field (a system sometimes referred to as "conservation bench terrace") or outside the field in the natural watershed system. The size ratio between the contributing and the receiving areas is determined by the expected rainfall events, soil characteristics and topography. The resulting yield increase in the receiving (crop) area is proportional to the amount of water gained in that area. The major goal of crop management practices in semiarid areas is to maximize the amount of water passing through the crop as transpiration. This can be achieved by increasing the amount of water available to the crop, by decreasing water losses (from evaporation, runoff, or weeds), or both. At one extreme would be the development of irrigation systems or the expansion of maize area into already irrigated land. We conclude that this is not likely to be a major source of increased maize production or the primary contributor to the mitigation of drought stress in particularly vulnerable areas. Short of full-fledged irrigation, other management options have been explored for intercepting a
28

larger proportion of precipitation and directing it to the crop; these include tillage, water harvesting, and mulch. By reducing runoff or diverting runoff from other areas onto a plot, water harvesting can also contribute to increased crop yields in the semiarid tropics; however, water harvesting in maize, which is susceptible to waterlogging, can provide too much water to the crop in some seasons. Nonetheless, farmers in the semiarid Baringo District of Kenya use handmade tied contour ridges for both maize and sorghum (Critchley et al., 1992). Similar interventions also have demonstrated clear yield advantages in semiarid areas of West Africa (Rodriguez, 1987). In Machakos District, Kenya, excess runoff is diverted to tree crops or channeled to the top of terrace systems. The presently preferred bench terrace is formed by throwing soil uphill from a ditch laid out on the contour. The ability of bench terracing to produce higher maize yields in dry years and dry areas has provided strong incentives for farmer adoption (Tiffen, et al., 1994). In southern Africa, researchers have experimented with a variety of ridge- furrow systems, including tied ridges and potholes, to concentrate runoff and allow it to infiltrate slowly into the soil (Waddington et al., 1995). Ridging systems require draft power and human labor to construct ridges and ties. A small survey, conducted a few years after the initiation of the research, found that about 40% of the farmers near Chiredzi in the southeast region of Zimbabwe (an area where tractors are available for hire) had adopted a tied ridging system (Mazhangara 1993). iv) Diversification of farming Diversification of farming is an ancient but an effective approach to reduce the risk associated with farming in unpredictable environments. Reduced diversification to the extent of monocropping is possible only if a high level of control is possible over the crop environmental conditions. Such control method (irrigation, chemical pest control, etc) are among the main reasons for the more recent environmental quality problems found to be associated with mono-cropping. Diversification of cropping to reduce risk is especially important under dryland conditions. It is achieved on several levels, as described by Pandey et al. (2000) for the case of traditional rainfed rice in Eastern India.
1. Spatial diversification of fields: The farmer’s land is divided into several fields or plots which may differ in their topography, soil and hydraulic properties. Some fields may be prone to flooding while others do not hold water. The different field conditions allow to achieve a better fit between the crop and the environment and to reduce the general probability of stress affecting the farmer.
2. Crop diversification: It is an important feature of traditional farming. It takes an advantage of the generally low correlation between crops in performance when grown in a single stress environment. Crops differ in their response to a given environment and this difference is used to reduce the risk associated with growing one crop. “Mixed cropping” or “intercropping” is an example of a traditional and a successful approach to crop diversification on a single piece of land, where two or more crops are grown together in various possible configurations. If for some reason only one crop is grown, a certain (though lower) level of risk reduction can be achieved by varietal diversification. Planting of several crop varieties offer a
29

better probability for reducing loss due to environmental stress, as compared with growing one variety only. For environmental stress conditions varietal diversification is based mainly on differential phenology, primarily flowering date. A typical example is a transient frost or heat wave that is likely to occur around flowering time of the specific crop. Damage reduction can be achieved when the crop is sown to several varieties of different flowering dates.
3. Temporal diversification: This may achieve the same result as varietal
diversification, when phenology is concerned. The purpose of setting a distinct planting date is to optimize crop development with respect to seasonal climate, mainly rainfall in rain-fed agriculture. Ideally the crop is planted at the beginning of the rainy season, rainfall peaks when crop evapo-transpiration peaks and it terminates just before harvest time. When such conditions are reasonable predictable, planting date can be set to optimize production. Where the timing of rainfall is very unpredictable, adopting more than one planting date for the given crop can reduce the risk involved with untimely rainfall and a given planting date.
4. Planting Date, Density, Method, and Crop Establishment: Planting date is a
particularly important consideration for maize production in drier areas. When maize is planted under appropriate soil moisture and temperature conditions, the chances of complete germination and crop establishment increase greatly. Where the length of the growing season is limited by the duration of the rainy season, early planting reduces the probability of drought during the late grain-filling stage. Delayed planting (frequently caused by labor and land preparation constraints) exacerbates agronomic problems, often resulting in a crop that is tall, prone to lodging, and with relatively fewer kernels per plant. These effects, together with the increased possibility of terminal drought stress, can result in significant yield losses (Waddington et al.,1991). Considerable efforts have been made to develop methods that ensure that maize is planted at the best possible time. "Response farming" is based on an improved prediction of expected rainfall (including date of the onset of rains in the upcoming growing season) and establishing and managing the crop according to that prediction (Stewart 1991; Stewart and Kashasha 1984). In a dry area of Kenya, however, where many of the principles of response farming were developed, farmers had not adopted them by the early 1990s.
Another management strategy to ameliorate the effects of drought is to reduce maize plant populations in an attempt to maintain the amount of water available per plant above the minimum needed to form an ear. In South Africa, relatively late maturing maize grown under an annual rainfall of 500-600 mm is often sown at densities as low as 10,000 plants per hectare in rows up to 2 m apart. Cultivars are selected for prolificacy (and in some instances, tillering capacity) so they can more fully exploit a high rainfall year when it occurs (Magson 1997), but they are not necessarily extremely tolerant of drought. Similar principles can be applied to some problems associated with nutrient availability per plant; reduced plant densities also are appropriate when soil fertility is low (Waddington et al., 1995; Blackie 1995 and Carr 1989).
30

v) Mulch In semiarid areas, as much as 50% of total evapotranspiration from a crop can be lost through evaporation from the soil surface (Unger and Stewart 1983). Losses are highest during early crop growth. Mulch can play an important role in reducing soil evaporation and temperature. In tropical environments characterized by episodes of high intensity rainfall, however, its major role is to reduce runoff, increase infiltration, and minimize associated soil losses (Scopel et al., 1998). Crop residue mulches have been shown to increase maize yields significantly in semiarid western Mexico at application rates as low as 2 t/ha, and they have been closely associated with increased water capture compared with conventionally tilled plots. In a series of on-farm trials conducted in a semiarid area of Jalisco, Mexico, zero tillage, chemical weed control, and mulch applied at 2 t/ha increased water capture by 65% compared with a treatment that comprised two diskings and mechanical weed control. The result was an increase in grain yield of up to 100%. In those areas and in semiarid southern and eastern Africa, however, use of maize residues as livestock feed may reduce the available mulch below the threshold level. In Africa, termite activity and fire are also important factors in diminishing residues (Waddington et al., 1995).Increasing the rooting depth of crops generally increases water availability. Typically, maize extracts more than 90% of its water from the upper 70 cm of its rooting profile, but if rooting depth is restricted by compaction layers, or by rocky or acidic subsoils, drought symptoms will occur more rapidly and with greater intensity. Subsoiling and deep liming can be effective in delaying the development of drought stress, but at a cost. Crop Management Practices for Increasing Water Use Efficiency One important characteristic of drought stress is that it interacts with other types of stresses including disease, competition from weeds and intercrops, soil acidity, and low soil fertility. Generally, dry environments have a lower incidence of foliar and ear fungal diseases. Weeds, on the other hand, compete for water that could be used by the maize plant, so drought symptoms are often more severe and prolonged. In semiarid sandy areas with animal traction, relatively inexpensive weed control using a moldboard plough has also proven beneficial for water retention (Riches et al., 1997). And, though intercrops clearly compete with maize for available water and reduce maize yields, they serve to reduce the risk of crop failure if the maize is severely affected by drought at a particularly susceptible stage of growth. The most important management interaction in many drought-stressed maize environments is between soil fertility management and response to drought stress. It is widely accepted that low soil fertility and drought are the major constraints to maize production in non-temperate environments (Edmeades et al., 1997). Low soil fertility is considered to be a particularly important constraint in sub-Saharan Africa (Blackie, 1995). In areas subject to drought stress, many small-scale farmers are reluctant to risk economic losses by applying fertilizer, which strengthens the linkage between drought and low soil fertility. Again, this appears to be a particular problem in sub-Saharan Africa, where fertilizer nutrient-grain price ratios are usually considerably higher than
31

elsewhere (Heisey and Mwangi, 1997). Yield gains resulting from selection for drought tolerance, observed under N levels that reduce yields by about 50%, are remarkably similar to those observed when plants are drought-stressed at flowering (Banziger, et al., 1998). Recent unpublished data suggest, however, that when the yield reduction caused by N stress increases to around 70%, the benefits of improved drought tolerance that spill over into fertile environments decline. Management of N fertilizer based on rainfall events, using response farming, could lead to increases in fertilizer efficiency and allow farmers to take advantage of wetter years (Piha 1993). Other evidence suggests that the case for response farming may not be quite so compelling. Wafula, et al.,. (1992) summarized detailed economic analyses of alternative fertilization strategies in Machakos District, Kenya, and suggested that the most important first step was increased use of N, "irrespective of any formal system to forecast seasonal potential" Introducing The Improved Technologies Into Stressed Environments Even discounting attempts to reduce yield variability, increasing mean yields in drought-stressed maize production environments is difficult. In large part this is because "for many farmers, successful technology introduction requires the simultaneous adoption of up to four different technology components. Four simultaneous input changes are difficult for researchers to study, for extension agents to promote, and for farmers to undertake" (Sanders et al., 1996). Farmers tend to adopt new technologies in a stepwise fashion (Byerlee and Polanco, 1986), and gradually, in the case of divisible inputs. Many proposed changes involve management components, which are more difficult to promote than simple input adoption. This contrasts with the pattern of technological change in areas where the Green Revolution began, where relatively simple technological changes based on seed and fertilizer only later gave way to more complex management changes (Byerlee 1987, 1992; Pingali, et al., 1997). Despite the extreme difficulties in developing and promoting technological change in dry areas, such change is necessary in many cases simply to help support farm family incomes and to reduce, if only slightly, the pressure placed on more favorable land. In some instances, technological change may be necessary to preserve present yield levels or to prevent further resource degradation. Most farmers are interested in profitability and risk, and not yield per se. Field studies to determine the profitability of technologies under farmers' actual circumstances will have to be significantly more widespread than at present. Participatory research to elicit this information must concentrate on real activities in farmers' fields, in many cases employing cultivars that farmers already use in combination with newer, stress-tolerant alternatives under development. Better information sharing across different drought stressed environments can help. Carefully planned infrastructure development and greater integration of dry areas into larger markets can play important roles in technological change (Walker 1991; Smith et al.. 1994,1997; Fan and Hazell 1997). Finally, time horizons need to be lengthened considerably beyond the three to five year planning period of the typical donor-financed development project. A case in point is that genetic improvements in yield of around 50% under midseason drought stress were
32

achieved only after six to eight years of selection. The Machakos case in Kenya is also instructive. Soil and water conservation technologies in that district were often developed based on agricultural recommendations from the colonial past. They did not begin to make an impact until much later, after they had been modified by farmers, and after farmers' circumstances had changed to make them profitable (Tiffen, et al., 1994). The Way Forward In order to improve productivity of corn in South Asia, harness the genetic potential of corn and its ability to grow almost round the year, there are certain measures, which must be taken. In our experience these measure include:
• Timely planting of maize • Increase acreage of the corn grown in Rabi season. Grow maize as intercrop with
potato or other legumes. • Identify hybrids / OPVs that pollinate well in cold winter rabi season. • Promote maize planting on raised beds furrow irrigation system particularly in
kharif season to reduce waterlogging stress. • Identify cultivars/ hybrids suited to deeper planting in Kharif in raised bed system
and surface seeding in tal and chaur lands in the wet soil in winter season. • Develop weed management practices for maize based intercropping systems.
For flood prone areas, mixed cropping systems reduces the risk of the farmers. Maize cultivars tolerant to water stagnation and compatible with mixed cropping are needed. In agro-forestry systems, cultivars appropriate to partial shading conditions are required. Micro-environments change at short distances in the hills and according to the slope aspects. Cultivars appropriate to wide array of micro-environments may be the best bet. References Angus, J. I (1991). The evaluation of methods for quantifying risk in water limited
environments. In R. C. Muchow and J. A. Bellamy (eds.) Climate Risk in crop Production. Models and Management for the Semiarid Tropics and Subtropics. Wallingford, U. K.: CAB Inter national. Pp. 39-53.
Banziger, M., G.O. Edmeades, and H.R. Lafitte (1998). Selection for drought tolerance increases in maize yields-over a range of N levels. Crop Sciences, 38 (in press).
Blackie, M.J. (1995). Maize productivity for the 21st century: the African challenge. In D.C. Jewell, S.R. Waddington, J.K. Ranson, and K.V. Pixeley (eds.), Maize Research for Stress Environments. Proceedings of the Fourth Eastern and Southern Regional Maize Conference, Harare, Zimbabwe, March 28-April 1, 1994. Mexico, D.F.: CIMMYT. Pp. xi-xxiii.
33

Byerlee, D. (1987). Maintaining the momentum in Post-Green Revolution Agriculture: A Micro- Level Perspective from Asia. MSU International Paper No. 10.East Lansing, Michigan: Department of Agricultural Economics, Michigan State University.
Byerlee, D. (1992). Technical change, productivity, and sustainability in irrigated cropping system of South Asia: emerging issues in post -Green Revolution era. Journal of International Development. 4(5): 477-496.
Byerlee, D., and E. Hesse de Polanco (1986). Farmers’ stepwise adoption of technological packages: Evidence from the Mexican Altiplano. American journal of Agricultural Economics 68: 519-527.
Carr, S. (1989). Technology for small farmers in Sub-Saharan Africa. World Bank Technical Paper No 109, Washington, D.C. The World Bank.
Chapman, S.C., and H.J. Barreto (1996). Using simulations models and spatial data bases to improve the efficiency of plant breeding programme. In M. Chopra and G.L. Hammer (eds) Plant Adaptation and Crop Improvement Walling Production, U.K.: CABI, ICRISAT and IRRI. pp 563-590
CIMMYT (1989). Towards the 21st century: CIMMYT’s strategy, Mexico D.F., CIMMYT.
Clackie, M.J. (1995) Maize productivity for the 21st centaury. The African challenge in D.C. Jowell, S.R. Waddington, J.K. Ranson and K.V. Pixely (eds) Maize research for stress environment. Proc. Fourth Eastern and Southern Regional Maize Conference. Harrare, Zimbabwe, 28 March-1 April 1994. Mexico, D.F. CIMMYT pp 129-151
Crithley, W.C., C. Raij, and A. Seznec (1992). Water harvesting for plant production. Vol-II case studies and conclusion for sub-saharan Africa World bank Technical Paper No 157 Washington, D.C. The World Bank.
Edmeades, G.O., and M. Banziger (1997). Conclusions: Where do we go from here? In G.O. Edmeades, M. Banziger, H.R. Mickelson, and C.B. Pena-Valdivia (eds.), Developing Drought –and Low N-Tolerant Maize. Proceedings of a symposium, March 25-29, 1996, CIMMYT, EI Batan, Mexico. Mexico, D.F: CIMMYT.Pp.557-563.
Edmeades, G.O., J. Bolanos, and S.C. Chapman (1997). Value of secondary traits in seedling for drought tolerance in tropical maize. In G.O. Edmeades, M. Banziger, H.R. Mickeson, and C.B. Penn-Valdivia (eds.), Developing Drought and low N-tolerant maize. Proceedings of a symposium, March 25-29, 1996, CIMMYT, EI Baton, Mexico. Mexico, D.F.: CIMMYT. Pp. 222-234.
Edmendes, G.O., J. Balanos and H R Lalitte (1992). Progress in plant breeding for drought tolerance in maize. In D. Wilkinson (Ed) Proceedings the 47th Annual
34

Corn and Sorghum Research Conference. Washington, D.C. American Seed Trade Association (ASTA).
Fan, S., and P. Hazell (1997). Technologies, infrastructure, productivity growth and poverty alleviation in rural India: Policy implications for government investments in less-favored areas. Washington, D.C.: IFPRI. Mimeo.
Fischer, R.A. (1988). Plant breeding and some boarder issues in agriculture, paper prepared for 9th Australian Plant Breeding Conference 27-31, June 1988, Wagga, New Australia.
Grant, M.P., G.T. Meiiible and W.R., Mills (1979). A comparison of plough types and depth of annual ploughing for maize monoculture with varied manuring. Zimbabwe Journal of Agricultural research 17:99-123
Heisey, P.W. and W. Mwangi (1997). Fertilizer use and maize production. In D. Byerlee and C.K. Eicher (eds.), Africa’s Emerging Maize Revolution. Bolder, Colorado: Lynne Ricnner Publishers. Pp. 193-211.
Ivy, P (1987). Technical and Environmental limitation to increasing food crop production under sub humid and semiarid east and southern African environments and possible solutions. In improving food crop production.
Joshi, N.L., D.V.Singh, R.S. Singh and Anurag Saxena (1998) Climate and Crop Production. In R.L. Yadav, Punjjab Singh, Rajendra Prasad and IPS Ahlawat (eds) Fifty years of Agronomic Research in India, Indian Society of Agronomy. Ppi-32
Magson, J. (1997) Towards drought tolerant maize in South Africa. In G.O. Edmeades, M. Banzingr H.R. Mideelson and C.B. Pena Valdiva (eds) Developing Drought and low N tolerant Maize. Proc. of Symp. March 25-29, 1996, CIMMYT, L L Baton , Mexico D.F., pp 455-459
Mazhangara, E.P. (1993). Policy consideration to enhance tied furrow technique adoption in south eastern low yield vertisol area of Zimbabwe. In W. Mwangi, D.R. Rohrbach and P. Heisey (eds) Cereal Grain Policy Analysis in national Agricultural Research Systems of Easter and Southern Africa. Addis Abada, Ethiopia: CIMMYT and SADC (ICRISAT).
Moris, M.L. (1998). Maize Seed Industries in Developing Countries. Boulder, Colorado: Lynne Rienner Publishers and CIMMYT.
Morris, M.L., A. Belaid and D. Byerdee (1991) Wheat and Barley production in rainfed marginal environments of the developing world Part-I of 1990-91 CIMMYT World Wheat Facts and Trends: Wheat and Barley production in rainfed Marginal Environment of Developing World. Mexico, D.F., CIMMYT
Muhammad, L.W. and K.A. Parton (1992). Smallholder farming in semi-arid eastern Kenya- basic issues relating to the modelling of adoption. In M.E. Probert (ed.), A
35

search for strategies for sustainable Dryland Cropping in Semi-arid Eastern Kernya. ACIAR Proceeding No. 41. Canberra, Australia: ACIAR. Pp. 119-123.
Pandey, S. Behura, D.D., Villano and R. Naik D. (2000). Economic costs of drought and farmer’s coping mechanism: a study of rainfed rice system in Eastern India. IRRI Discussion paper Series 39, IRRI, p. 35.
Piha, M.I. (1993). Optimizing fertilizer use and practical rainfall capture in a semi-arid environment with variable rainfall. Experimental Agriculture 29: 405-415.
Pingali, P.L., M. Hossain, and R.V. Gerpacio (1997). Asian Rice Bowls: The Returning Crises? Wallingford, U.K.: CAB International in association with IRRI.
Reeder, L.R. (1997). Breeding for yield stability in commercial programme in the USA. In G.O. Edmeadas, M. Banzigaer, H.R. Mikelson and C.B. Pana Valdivia (eds) Developing Drought and Low-N tolerant Maize Proc. Symp. March 25-29, 1996 CIMMYT, EL Batan, Mexico, D.F. pp 387-391
Riches,C.R., S.J. Twomlow, and H. Dhaliwayo (1997). Low input weed management and conservation tillage in semi-arid Zimbabwe. Experimental Agriculture 33: 173-187.
Rodriguez, M.S. (1987). Agronomic practices for reducing drought stress and improving maize grain yield in semiarid tropics of West Africa. In J.M. Maryonga, T. Bezune tl and A. Youdeowei, A.(eds) Food grain Production in Semi-Arid Africa, Ougadougou Burkina faso. OAUISTRC-SAFDRAD. Pp. 493-509
Rohrbach, D.D. (1995). Improving farmer well-being in semi-arid areas: strategies, option and implications for maize research. In D.C. Jewell, S.R. Waddington, J.K. Ransom, and K.V.Pixley (eds.). Maize Research for Stress environments. Proceedings of the Fourth Eastern and southern Africa Regional Maize Conference, Harare, Zimbabwe, 28 March – April1, 1994. CIMMYT, Mexico. Pp. 296-303.
Sanders, J.H., B.I. Shaprio, and S. Ramasawamy (1996). The Economics of Agricultural Technology in semiarid Sub- Saharan Africa. Baltimore, Maryland. The Johns Hopkins University Press.
Scopel, E.; B. Muller, J. M. Arreole Tost ado, E. Chavez, Guerrand F. Marawe (1998 a). Quantifying and modeling the effect of a light crop application to rainfed maize in western Mexico. Mimeo.
Shumba, E.M. (1989). Maize Technology Research in Mangwende, a high potential commercial area environment in Zimbabwe part z: the on-farm experimental programme. Farming systems Bulletin Eastern and Southern Africa 1:1-13.
Smith, J., A.D. Barau, A. Goldman, and J.H. Mareck (1994). The role of technology in agricultural intensification: The evolution of maize production in the northern Guinea savanna of Nigeria. Economic Development and Cultural Change 42 (3) 537-554.
36

Smith, J.,G. Weber, M.V. Manyong, and M.A.B. Fakorede (1997). Fostering sustainable increases in maize productivity in Nigeria. In D. Byerlee and C.K. Eicher (eds.), Africa’s Emerging Maize Revolution. Boulder, Colorado: Lynne Rienner Publishers.
Stewart, J.I. (1991). Principle and performance of response farming. In R.C. Muchow and J.A. Ballery (eds) climatic risk in crop production : Models and management for the semiarid tropics and sub-tropics. Willinglord; U.K.: CAB International pp 361-382
Stewart, J.T. and D.A.R. Kashasha (1984) Rainfall criteria to enable response farming through crop based climate analysis. East African Agriculture and Forestry Journal Special Issue pp 58-79
Tiffen, M., M. Mortimore , and F. Gichuki (1994). More people, Less erosion: Environmental Recovery in Kenya. Chichester, U.K.: John Wiley and Sons.
Tiffen, M., M.Mortimore and F.Gickuki (1994). More people less erosion: environmental recovery in Kenya. Chichester, U.K., John Willey and Sons.
Unger , P.W. , and B.A. Stewart (1983). Soil management for efficient water use: an overview. In H.M. Taylor, W.R. Jordan, T.R. Sinclair (eds.), Limitations to Efficient Water Use in Crop Production. Madison, Wisconsin: ASA, CSSA and SSSA. Pp. 419-460.
Venkateswarlu, J. (1986). Efficient resource management for drylands. In 15 years of Dryland Agricultural Research. Sovenier CRIDA, Hyderabad pp. 42-58.
Waddington, S.R. and P.W. Heisey (1995). Meting the nitrogen requirement of maize grown by resource poor farmers in Southern Africa by Integrated varieties, fertilizers use, crop management and policies. In G. O. Edmeades , M. Banziger, H. R. Mickelson, and C.B. Pena-Valdibia (eds.), Developing drought and low N-tolerance maize , Proceedings of a Symposium, March 25-29, 1996, CIMMYT,EI-Batan Mexico. Mexico D.F.: CIMMYT.Pp.44-57.
Waddington, S.R., G.O. Edmeades , S.C. Chapman and H.J. Barreto (1995). Where to with agricultural research for drought prone maize environments. In D.C. Jowell, S.R. Waddington, J.K. Ranson and K.V. Pixely (eds) Maize research for stress environment. Proc. Fourth Eastern and Southern Regional Maize Conference. Harrare, Zimbabwe, 28 March-1 April 1994. Mexico, D.F. CIMMYT pp 129-151
Waddington, S.R., M. Mudhara, M. Hlasthwayo and P. Kunju (1991). Extent and causes of low yield in maize planted late by small holders farmers in for sub-humid areas of Zimbabwe. Farming systems Bulletin. Eastern and Southeren African 9:15-31.
Wafula, B.M., R.L. Mc Cown, and B.A. Keating (1992). Prospects for improving maize productivity through response farming. In M.E. Probert (ed.), A search for sustainable Dryland Cropping in Semi arid Eastern Kenya. ACIAR Proceedings No. 41. Canbera, Australia: ACIAR. Pp 101-107.
37

Walker, T.S. (1991). Improved technology in relation to other options for dealing with climatic risk to crop production in the semi-arid tropics. In R.C. Muchow and J.A. Bellamy (eds), Climatic Risk in Crop Production: Models and Management for the Semiarid Tropics and Subtropics. Wallingford, U.K. CAB International. Pp. 511-523.
Willcocks, T.J. (1981). Tillage of clod forming sandy loan soils in semiarid climate of Bostwana. Soil and Tillage Research 1:323-350
38

Table 1. Important Agro-ecoregions of South Asia. Particular Hor Arid Agro-
ecoregion Semi Arid Agro-ecoregion
Irrigated sub Humid Agro- ecoregion
High Rainfall Humid Agro-ecoregion
SubHumid to Humid Coastal Agro-ecoregion
Sub-Huid to Cold Arid Mountain Agro – ecoregion
Regional coverage Desert of Indian and Pakistan; arid and plateau region of Baluchistan in Pakistan
Rainfed peninsular and west India; rainfed region of Pakistan Punjab and Sindh; part of Sri Lanka
Irrigated region of north-west India (upper Indo-Gangetic Plains) and irrigated region of Pakista (Punjab and Sindh); part of tarai region of Nepal
Eastern India (irrigated or lower Indo-Gangetic region, and rainfed or eastern Plateau region); Bangladesh; part of tarai region of Nepal
Coastal regions of India and Bangladesh; part of Sri Lanka; Maldives
Hill and mountain region of India, Nepal and Pakistan; Bhutan.
Rainfall (mm) <300 500-1000 500-1200 1000-2000 900-3200 <150-400Dominant cropping systems
Millets, pulses and oilseed based
Coarse cerea-pulse-based; cotton-based oilseed-based; rice and sugarcane-based in irrigated areas
Rice-wheat; sugarcane-wheat cotton-wheat; cotton-wheat; maize-wheat
Rice-rice; rice-wheat; rainfed rice-based; rice vegetables; rice fish; fruits
Rice-coconut-based plantation crops; fruits; brackishwater shrimp and fish
Millets and wheat in cold arid; rice, coarse cereals and wheat-based
Share in the total net sown area (%)
7.3 38.1 19.0 26.4 5.8 3.4
Share in total net agriculture production (%)
2.91 25.40 28.59 26.63 10.36 6.11
39


Table 2: Effective cropping season at different research station
Research Station
Standard Weeks
No. of Weeks
Length of growing season (days)
Bellary 33-44 8 60-90
Anantpur 33-45 13 60-90
Hissar 27-39 13 60-90
Bijapur 29-45 17 60-90
Rajkot 26-42 17 60-90
Jhansi 26-46 21 120-150
Hyderabad 25-46 22 120-150
Udaipur 26-47 22 190-120
Agra 27-50 24 90-120
Anand 25-49 25 120-150
Bangalore 20-51 32 120-150
Varanasi 26-05 32 120-150
Hoshiarpur 26-08 35 120-150
Ranchi 22-14 45 150-180
41

42

Maize (Zea mays L.) Under Excessive Moisture (Waterlogging) Stress
Pervez H. Zaidi, P. Maniselvan, Poonam Yadav, R.P. Singh and N.N. Singh
Directorate of Maize Research, I.A.R.I. Campus, New Delhi-110 012, India
Introduction Plants are obligate aerobes and require well-drained soil for optimal growth and yield. Prolonged saturation has a significant impact on both biotic and abiotic attributes of the soils. Drastic reduction in oxygen partial pressure is the primary plant stress under excessive moisture condition. The inability of crops to withstand low oxygen conditions in rhizosphere results in substantial yield losses. Roots of most plants are highly susceptible to anaerobic conditions, which support a unique microbial community compared with aerobic conditions, and this severely affects the nutrient relation of the soil. Shortly after onset of excessive moisture condition (1-2 days) obligate aerobic bacteria become inactive, and facultative/obligate anaerobic bacteria become active and dominate the micro-flora of saturated/inundated soils. Over-time the activity of anaerobic bacteria causes sharp decline in redox potential, which causes severe nutrient imbalances. The another important secondary effect of excessive moisture is leaching of mineral nutrients and/or essential intermediate metabolites from the roots, due to the volume water of in which they are immersed. Excessive soil moisture causes major changes in physical and chemical properties in rhizosphere (Fig. 1.). Gaseous diffusion rates in flooded soil is about 100 times lower than air (Kennedy et al., 1992), and respiration of plant roots, soil micro-flora and fauna leads rapid exhaustion of soil oxygen, and thereby causes anaerobiosis. Oxygen deprivation, either completely (anoxia) or partially (hypoxia), is detrimental to most species of higher plants inevitably raises the question of whether there are any fundamental physiological differences between plants in their cellular responses to imposed anaerobiosis. It is often assumed that most cultivated plants avoid, rather than tolerate, oxygen shortages (Armstrong et al., 1994). However, proximate causes of plant injury can be oxygen deficit or mineral nutrient imbalances, a decrease in cytokinins or other hormones released from the roots, a decrease in available soil nitrogen and/or nitrogen uptake, an increase in toxic compounds in soil such as methane, ethylene, ferrous ions or manganese, an increase in toxic compounds in the plant such as ethanol or ethylene, and an increase in disease organisms.
Maize crop grown during the summer-rainy season in tropical/sub-tropical environments occasionally faces extreme climatic conditions. Excessive soil moisture caused by flooding, waterlogging, poorly drained soil or high water table is one of the most important constraints for maize production in South-Asia, and many other parts of the world. During 1993, approximately 20 million acres of corn and soybean were inundated in the mid-western United States leading to heavy economic losses, as estimated by the United States Department of Agriculture, National Agricultural Statistics Service (Suszkiw, 1994). The areas where rainfall is dependent on monsoon, covering Asia and part of Africa, are comparatively more prone to excess moisture stress. In South-East
43

Asia alone, about 15% of total maize growing areas are affected by floods and waterlogging problem (Table-1). In India, waterlogging is one of the most serious constraints for crop production and productivity, where about 8.5 million hectare of arable soil is prone to this problem (Fig. 2). Out of the total 6.55 million hectare area under maize, about 2.5 million hectare is affected by excess soil moisture, causing losses in maize production of 25-30% almost every year (DMR, 2001).
There is no any proper ventilation system in maize plants for gaseous exchange between aboveground plant parts and inundated roots. Therefore, plant roots suffer with extreme oxygen stress, hypoxia followed by anoxia, whenever it faces prolonged (>3 days) excess soil moisture situation (Zaidi and Singh, 2002). Prior to V6 growth stage (6th leaf collar visible) the growing of maize plant is near or below the soil surface. Since, the oxygen supply in the soil is depleted within 48 hours (Fausey et al., 1985) plants can not perform critical life sustaining functions, e.g.- nutrient and water uptake is impaired, root growth is inhibited etc. If temperature is warm during excessive moisture/waterlogging (> 770 F) plants may not survive even more than 24-hours. Cooler temperatures may prolong the survival. The extent of damage in maize due to excess moisture stress varies significantly with developmental stage, and past studies have shown that maize crop is comparatively more susceptible to excess moisture stress during early seedling to tasseling stage (Palvadi and Lal, 1976; Mukhtar et al., 1990; Evans et al., 1990; Rathore et al., 1998; Zaidi et al., 2002). At later growth stages (after knee-high stage), some genotypes, with inbuilt capacity of producing adventitious roots and morphological adaptation like air space (aerenchyma) formation in cortical region of adventitious roots, can tolerate excess water situation in rhizosphere up to some extent (Drew et al., 1979; Rathore et al., 1996; Zaidi et al., 2003). However, at an early growth stages (up to late vegetative stage), before proper adventitious root formation, excess moisture condition, caused by heavy and/or continuous rainfall or grown on poorly drained soils, found to be most detrimental for maize plant (Singh and Ghildyal, 1980; Rathore et al., 1998; Zaidi and Singh, 2002). However, considerable genetic variability has been observed in maize for tolerance to excess moisture (Torbert et al., 1993; Rathore et al., 1996, 98; Zaidi and Singh, 2001; Zaidi et al., 2002, 2003). Such responses inevitably raise the question whether there are any fundamental differences between plants in their responses to imposed anaerobiosis. Such differences may be exploited to develop maize varieties that can tolerate hypoxia/anoxia conditions. Excessive Soil Moisture and Stresses In any type of soil, plants can extract water over a range of soil moisture between field capacity (FC) and permanent wilting point (PWP). The field capacity is the upper limit and PWP is the lower limit of moisture availability to plants. Presence of water in soil (or other root medium) in excess of field capacity is called excessive soil moisture. In terms of soil water potential, the water bound with soil particles less than –0.033 MPa is excess water or free water, which occupies the air space of soil (Fig. 3). Field capacity, or field-carrying capacity, of a soil is usually described as the water content after downward drainage of gravitational water has become very slow and water content has become
44

relatively stable. The downward drainage may exist for several days after the soil has been thoroughly wetted by rain or irrigation. Levitt (1980) argued that as water deficit is defined as any water potential below zero bars, the excess water must be defined as any water potential above zero bars. This definition proves to be approximately correct, due to the existence of optimum water potential slightly below zero. However, excessive moisture cannot change the water potential as such, and therefore, cannot produce a water potential stress, since by definition, it does not occur until after field capacity, and therefore, maximum water potential of soil is attained. Thus, excessive moisture is the phenomenon of replacement of gas (air) phase of soil by liquid (water) phase and involves no change in free energy of the water. Therefore, excess moisture stress cannot produce a primary, water potential stress, and can affect plants only by way of secondary, excess moisture-induced stresses (Fig. 4).
i) Oxygen deficit stress First and immediate secondary effect of excessive moisture is on gaseous exchange in rhizosphere. Since excess water replaces gaseous air by liquid water, it causes O2 deficit and excess of CO2 and ethylene. In the situation of complete deprivation of oxygen in rhizosphere (anoxia) the root respiration switches from aerobic to anaerobic. Although, plants are capable of anaerobic respiration, it is well known that due low availability of ATP for plant functions, and accumulation toxic substances due to anaerobiosis most plant can not survive longer with anaerobic respiratory process. The direct strain produced in the plant cell by the O2 deficit is a decrease in the oxidation-reduction potential (O/R potential), which results in several adverse effects in soil, and eventually on plants.
ii) Nutrient stress Another important secondary effect of excess soil moisture is deficit of important mineral nutrient such as- nitrogen, phosphorous, potassium etc., toxicity of other nutrients such as- iron and manganese (Table-2). In general, excessive moisture stress causes nutrients imbalances by affecting nutrient ion homeostasis. According to Levitt (1980) two types of nutrient stress due to excessive moisture are conceivable: (i) O2 deficit of root environment may produce mineral nutrient deficiency due to
decreased uptake of ions, and (ii) Low redox potential due to low O2 partial pressure in submerged soil may reduce
some elements in more soluble and toxic form, e.g.- Fe3+ versus Fe2+. A third type of nutrient stress may be due to leaching of essential nutrients from rhizosphere and intermediate metabolites from roots, due to presence of free water in which root are immersed.
45

iii) Gas stresses Apart from O2 deficit the poor gaseous exchange under excessive soil moisture condition results in accumulation CO2 and ethylene, and other gases such as- hydrogen sulphide, ammonia and methane, and rhizosphere become fully anaerobic. Increased concentrations of these gases in rhizosphere causes various hazardous effects on plants, which results in various stress injuries. Being a growth inhibitor ethylene further complicate the effects of O2 deficit stress on plant growth and development. Similarly, excess CO2 concentration in rhizosphere may lead accumulation of toxic quantities of acetaldehyde and ethanol from pyruvate, probably due to strong controlling effects of CO2 on mitochondrial activity. High CO2 concentration also suppresses the activities of catalase, glycollate oxidase and nitrate reductase (Levitt, 1980).
iv) Water deficit Under excessive moisture stress plants face water scarcity in above ground plant parts, and the symptoms of drought stress such as leaf rolling/wilting appears very quickly. Excess moisture-induced injuries on cell membrane of root tissues affect the efficiency and effectiveness roots for water and nutrient uptake. The stress condition affects membrane integrity, and therefore, membrane become leaky. This disturbs the osmotic gradient in root cortex, and causes poor water uptake by roots. Therefore, root cannot keep pace with water demand of above ground plant parts, and in spite of the fact that plants are literally standing in water but suffer with water deficit stress.
v) Biotic stresses Morpho-physiological changes in host-plant due excessive moisture condition are in great part responsible for susceptibility disease-related excess moisture injuries. Soil saturation affects root tissues, which results zoospore attraction and infection, e.g.- Phytophthora root rot is closely associated with excessive rainfall and poorly drained or heavily irrigated soil. Maize plants become highly susceptible to Pythium and Erwinia species under excessive moisture conditions (Zaidi et al., unpublished data). Changes in Rhizosphere Under Excessive Moisture Imposition of excessive moisture condition sets in motion a series of physical, chemical and biological processes that profoundly affects the quality of soil as growth medium for plants. Extent of these changes depends upon the physical and chemical properties of soil and duration of excessive moisture condition. i) Reduced gaseous exchange and O2 deficit Under saturated soil conditions the capillary pores between the soil particles get filled with water and this displaces the air present in the pores. Thus, gaseous diffusion virtually ceases when the pore space drops to about 10%, and thereby limits gas exchange between rhizosphere and atmosphere. The available oxygen in pore spaces is soon exhausted through respiration of plant roots and soil microorganisms (Ponnamperuma, 1972). Since gaseous exchange in water medium is about 100 times slower than air, fresh supply of oxygen from the air cannot be sustained, which results in severe oxygen
46

deficiency in rhizosphere. Apart from depletion of in molecular oxygen, the restricted gaseous exchange results in accumulation of several gases such as- nitrogen, hydrogen, carbon dioxide, hydrogen sulphide, ammonia and methane (Table-3).
ii) Thermal effects Excess soil moisture affects net solar radiation absorbed by soil, heat fluxes in and out of rhizosphere, heat capacity of the soil and soil temperature. In waterlogged soil, the day temperature tends to be lower and the night temperature higher than in well-aerated soil. Mean temperature of the surface layer was found 60C lower for flooded soils than well-drained soils (Bonneau, 1982). During mid-day the temperature of stagnant water was found to be maximum followed by air and inundated soil (Zaidi et al., 2003).
iii) Chemical changes Main chemical changes brought about by excessive moisture or waterlogging are disappearance of O2, accumulation of CO2, anaerobic decomposition of organic matter, transformation of nitrogen, reduction of Fe3+, Mn4+ and SO4
2- (Ernest, 1990). Up to 3.0 tons CO2 per hectare may be accumulated in the plowed layer of a flooded field (Ponnamperuma, 1984). Being soluble in water and chemically reactive, the accumulated CO2 forms carbonic acids and bicarbonates, and reacts with divalent cations to form insoluble carbonates. Conversion of organic nitrogen into inorganic form stops at ammonium level due to lack of oxygen. In absence of oxygen, ferric and manganic forms are reduced to ferrous and manganous forms respectively, which results in sharp decline in soil redox potential (Zaidi et al., 2003). iv) Biotic changes Within few hours of exposure to excessive moisture aerobes are replaced by facultative anaerobes, which in turn are superseded by strict anaerobes (Yoshida, 1978). Fungi and actinomycetes are suppressed and anaerobic bacteria predominate. In absence of the anaerobic bacteria causes denitrification and reduction of manganese, iron and sulfate, and formation of methane (Yoshida, 1978; Watanabe, 1984). Effects of Excessive Moisture Stress on Maize Plant Maize (Zea mays L.), a non-wetland species, is highly susceptible to excessive moisture stress; however, the extent of damage due to excess moisture stress varies significantly with developmental stage. Our study showed that maize crop is comparatively more susceptible to excess moisture stress during the early seedling to tasseling stage (Fig. 5). At later growth stages some genotypes with inbuilt ability to produce adventitious roots and morphological adaptation like air space (aerenchyma) formation in cortical region of adventitious roots, can tolerate excess water situation up to some extent (Drew et al., 1979; Rathore et al., 1996; Zaidi and Singh, 2001). Research on plant responses to anoxia has indicated a wide spectrum of changes at molecular, biochemical, physiological, anatomical and morphological levels, and has been reviewed extensively (Kennedy et al., 1992; Perata and Alpi, 1993; Ricard et al., 1994; Drew, 1997). Excessive moisture
47

condition in rhizosphere profoundly affects various plant functions, and causes stress injury.
i) Water relations First symptom of excess moisture injury is wilting of leaves. Reduced stomatal conductance is among the earliest responses to excess moisture in maize, followed by leaf yellowing, inhibition of root growth, alteration in root and shoot morphology, leaf senescence and brace root development from above ground nodes (Rathore et al., 1997; Zaidi and Singh, 2001; Zaidi et al., 2002, 2003). Rapid wilting seems to be related to water deficit due to net loss of water from shoot, which is found to be related to increased resistance to water flow in roots (Levitt, 1980). In maize, decrease in water availability was found to be associated with root decay and wilting. Excess moisture induces stomatal closure and reduced rate of transpiration (Fig. 6) due to changes in growth regulator translocation in leaves. Reduced stomatal conductance and high humidity causes a reduced demand on the root system for water acquisition. Under inundated condition maize root respires anaerobically, therefore, very little energy is available (only 2 moles of ATP per mole of glucose against 38 moles ATP produced in aerobic respiration). Consequently, due to energy starvation the root cell membrane is unable to maintain structural integrity, and membrane becomes leaky, which results in leaching of mineral nutrients and organic substances from root tissues (Table-4). Leaching-induced disturbance in osmotic gradient in root cortex results in inhibition of radial movement of water from root hairs across the cortex into xylem. Consequently, the water supply to above ground plant parts is reduced and plant suffer with water deficit stress. ii) Nutrient relations Excessive moisture or waterlogging condition causes mineral nutrient deficiency as well as nutrient imbalances in maize plants. This is due to its effects on nutrient availability in soil, uptake and transport by roots, and distribution within plant. In fact, there are three main issues of plant nutrition that are affected due to excessive moisture condition: • Reduced transport of water reduces nutrient transport in leaves. • Anaerobiosis reduces the ATP availability and thereby rate of nutrient uptake. • Anaerobic condition affects the availability of important mineral nutrients in soil. Prolonged excess moisture condition causes deficiency of important macronutrients and toxicity of some micronutrients (Table-2). Under anoxia condition nitrate is reduced to ammonium and sulfate is converted to hydrogen sulphide, and both become unavailable to most of the plants, including maize. In addition, being a soluble form nitrate leached out with standing water. Availability of phosphorous may increase or decrease depending upon soil pH during waterlogging. Among the micronutrients, availability of iron and manganese increases as iron and manganese are reduced to highly soluble ferrous and manganic form (Ponnamperuma, 1972), which often lead to toxicity (Tanaka and Yoshida, 1970; Rathore et al., 1996).
48
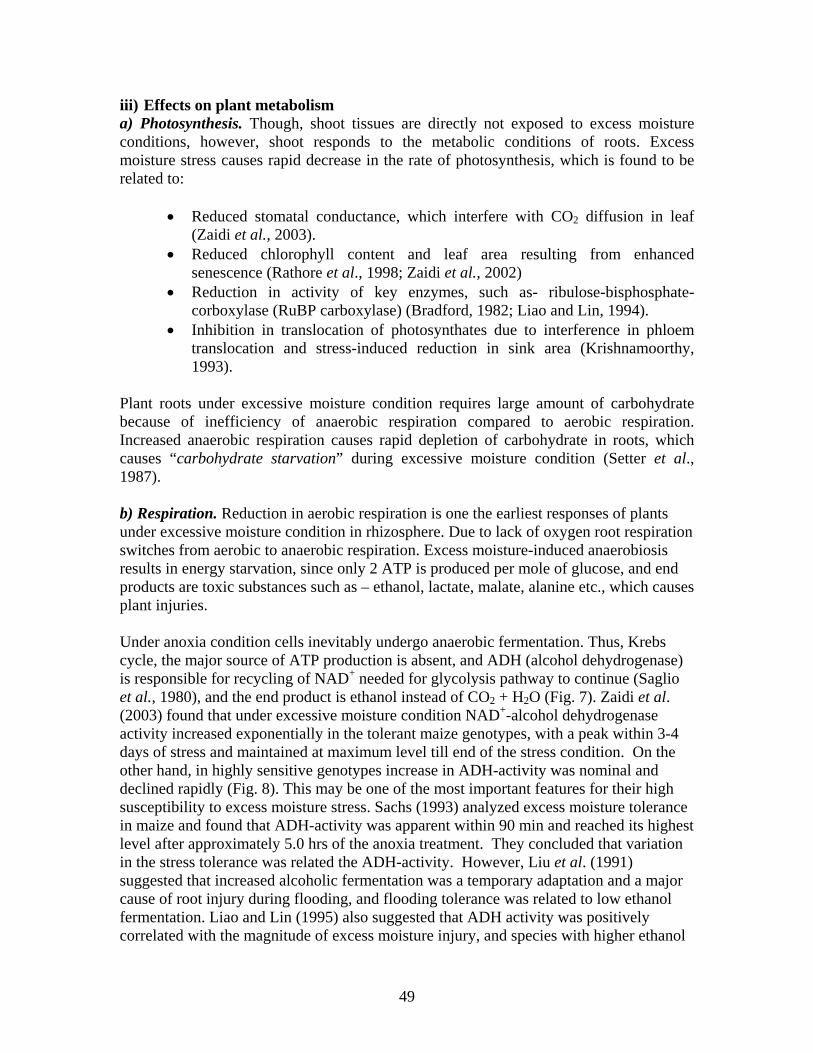
iii) Effects on plant metabolism a) Photosynthesis. Though, shoot tissues are directly not exposed to excess moisture conditions, however, shoot responds to the metabolic conditions of roots. Excess moisture stress causes rapid decrease in the rate of photosynthesis, which is found to be related to:
• Reduced stomatal conductance, which interfere with CO2 diffusion in leaf
(Zaidi et al., 2003). • Reduced chlorophyll content and leaf area resulting from enhanced
senescence (Rathore et al., 1998; Zaidi et al., 2002) • Reduction in activity of key enzymes, such as- ribulose-bisphosphate-
corboxylase (RuBP carboxylase) (Bradford, 1982; Liao and Lin, 1994). • Inhibition in translocation of photosynthates due to interference in phloem
translocation and stress-induced reduction in sink area (Krishnamoorthy, 1993).
Plant roots under excessive moisture condition requires large amount of carbohydrate because of inefficiency of anaerobic respiration compared to aerobic respiration. Increased anaerobic respiration causes rapid depletion of carbohydrate in roots, which causes “carbohydrate starvation” during excessive moisture condition (Setter et al., 1987).
b) Respiration. Reduction in aerobic respiration is one the earliest responses of plants under excessive moisture condition in rhizosphere. Due to lack of oxygen root respiration switches from aerobic to anaerobic respiration. Excess moisture-induced anaerobiosis results in energy starvation, since only 2 ATP is produced per mole of glucose, and end products are toxic substances such as – ethanol, lactate, malate, alanine etc., which causes plant injuries. Under anoxia condition cells inevitably undergo anaerobic fermentation. Thus, Krebs cycle, the major source of ATP production is absent, and ADH (alcohol dehydrogenase) is responsible for recycling of NAD+ needed for glycolysis pathway to continue (Saglio et al., 1980), and the end product is ethanol instead of CO2 + H2O (Fig. 7). Zaidi et al. (2003) found that under excessive moisture condition NAD+-alcohol dehydrogenase activity increased exponentially in the tolerant maize genotypes, with a peak within 3-4 days of stress and maintained at maximum level till end of the stress condition. On the other hand, in highly sensitive genotypes increase in ADH-activity was nominal and declined rapidly (Fig. 8). This may be one of the most important features for their high susceptibility to excess moisture stress. Sachs (1993) analyzed excess moisture tolerance in maize and found that ADH-activity was apparent within 90 min and reached its highest level after approximately 5.0 hrs of the anoxia treatment. They concluded that variation in the stress tolerance was related the ADH-activity. However, Liu et al. (1991) suggested that increased alcoholic fermentation was a temporary adaptation and a major cause of root injury during flooding, and flooding tolerance was related to low ethanol fermentation. Liao and Lin (1995) also suggested that ADH activity was positively correlated with the magnitude of excess moisture injury, and species with higher ethanol
49

production were less tolerant. It has been proposed that ethanol accumulation may have a “self poisoning” role in flood-intolerant plants. According to metabolic theory of R.M.M. Crawford (Crawford, 1967) flood tolerance was achieved by minimization of ethanol production, and was associated with re-routing from ethanol fermentation to malate production. Alternatively, Vanlerberghe et al. (1990) proposed succinate, rather than malate, as end product of fermentation. Lactate dehydrogenase activity increased by 20-fold during prolonged anoxia condition, which may be an important factor contributing to long-term adaptation to excessive moisture stress (Hoffman et al., 1986).
c) Phytohormones. Under excessive moisture or waterlogging situation maize plants exhibit several morphological and anatomical responses, particularly in inundated roots, and also on entire plant. Some of these have adaptive significance. Formation of lysigenous aerenchyma formation and accelerated brace root development on aboveground nodes are the most prominent responses to excessive moisture stress in maize (Rathore et al., 1998; Zaidi and Singh, 2001, 2002; Zaidi et al., 2003). Other morphological symptoms of excessive moisture stress in maize include rapid stomatal closure and epinastic bending. Each of these reactions is mediated by phytohormones, where ethylene and abscisic acid play prominent roles (Jackson et al., 1993). The extensive aerenchyma system in the root cortex greatly facilitates gas transport under excessive moisture condition, when normal gaseous exchange in blocked. Jackson (1989, 1990) suggested that ethylene is found to be the principal mediator of promoting the development of aerenchyma in maize roots, and also in other plants (Fig. 9). Auxin and gibberellins are prerequisites for ethylene action and triggering rather than regulatory functions. Gas diffusion into the plant is impeded, leading to low oxygen partial pressure. Low partial pressure stimulates biosynthesis of ethylene by increasing ACC (1-aminocyclopropane-1-carboxylic acid) synthase activity, thus further enriching the stem with ethylene (Pearce et al., 1992). However, the effects of excessive moisture are not confined to only inundated parts of the plant. Stomatal closure and epinastic curvature take place in root and shoots, which involve adjustment of the translocation of hormones or their precursors between the above and belowground parts (Jackson et al., 1993). ABA concentration were found to increase in roots of pea plants during 2nd, 3rd and 4th days of flooding, causing stomata to partially close and enriching the leaves with the hormone (Zhang and Davies, 1987). Epinastic curvature can be induced by small amounts of exogenous ethylene, and shoots of flooded plants contain increased amounts of endogenously produced gas (Jackson and Campbell, 1976).
d) Metabolic imbalance between shoots and roots. Among the biochemical changes observed in plants under flooding, a high level of fermentative metabolism in roots has been shown to be important for the plant survival because it supplies a high enough energy change that can sustain metabolism in roots (Mohanty et al., 1993). Starch reserves in roots are considered to be easily mobilized during flooding and can readily provide sugar for anaerobic metabolism in flooded roots (Perata et al., 1992), provided α-amylase activity is successfully induced for performing the starch breakdown.
50

Continuous supply of fermentable sugar to root tissues is critical for long-term survival of plants under excessive moisture condition (Jackson and Drew, 1984). In theory, if the translocation path is blocked, assimilate in leaves will not be able to reach the roots, thus resulting in a sugar deficiency in roots. Starch accumulation in leaves or stem tissues has been attributed to a reduced rate of translocation of carbohydrate to roots, which results lower level of root metabolism and retarded root growth.
Excessive soil moisture condition significantly affects the activity of to key enzymes of nitrogen metabolism, i.e.- nitrate reductase (NR) and glutamine synthetase (GS) (Reggiani et al., 1988). Synthesis of NR and GS proteins are substrate regulated, and in case of decline of substrate availability, e.g.- nitrate, the enzyme activity is inhibited. iv) Effects of plant growth and development Excess moisture stress severely affects plant growth and development. Maize seed can germinate under wet soil conditions in the presence of nominal amounts of oxygen (Van Toai et al., 1995), but further growth was highly susceptible to excess soil moisture stress (Zaidi et al., 2003). However, the extent of susceptibility varied remarkably at different growth stages (Fig. 5, Table-5). Mukhtar et al. (1990) also reported that corn was most susceptible to flooding at an early vegetative stage, followed by late vegetative stage; susceptibility declined with further developmental stages. Excess moisture stress significantly reduced plant height, leaf area and total dry weight plant-1 at V2 and V7 growth stages (Table-5). Lizaso and Ritchie (1997) also observed that senescence of green leaf area was increased by the soil saturation treatment and had major influence in total leaf area changes in maize genotypes that occurred after stress treatment. Genotypic variability for seed germination and early seedling growth under fully saturated soil conditions was observed (Porto, 1997, Zaidi et al., 2003). Such variability might be related to the ability of different maize genotypes to utilize the stored assimilate in the endosperm through anaerobic metabolism for germination and radicle/coleoptile development (Xia and Saglio, 1992). Poorly developed brace roots prior to tasseling may be one of the most important factors responsible for high susceptibility. The impact of the excessive moisture stress was apparent in reproductive behavior. Female flowering is comparatively more susceptible to the stress than male flowering (Zaidi and Singh, 2001). Delayed silking resulted in a long ASI and severe barrenness with exposure to the stress at V2 and V7 growth stages (Table-5). However, at later growth stages ASI was maintained less than 5 days. The process of female flowering reflected in silk emergence was found to be largely dependent on the availability of current photosynthates under drought (Bolanos and Edmeades, 1996). Reduced current photosynthesis in susceptible genotypes under excess moisture stress (Huang et al., 1994) apparently reduced assimilates for silk growth and cob development. Increase in ASI appears to be ubiquitous response of the maize plant to any stress that reduces photosynthesis per plant at flowering.
51

Adaptative Responses to Excessive Moisture Stress in Maize To cope up with the injuries/losses due to excessive moisture stress various stress-adaptive changes, including morphological, physiological/biochemical, cellular and molecular adaptations has been observed in different crop plants, including maize (Fig. 10). Considerable genotypic variability has been observed in maize for tolerances to excess moisture stress (Torbert et al., 1993; Rathore et al., 1996, 1998; Zaidi and Singh, 2001; Zaidi et al., 2003), which can be identified under carefully managed stress conditions and further improved. i) Morphological adaptation Maize plants have been found to rapidly respond any environmental changes, including excessive soil moisture caused by flooding, waterlogging, poor soil drainage or high water table. The most prominent morphological and anatomical changes widely observed in maize genotypes low oxygen partial pressure in rhizosphere are:
a) Nodal root development. Within 1-2 days of exposure to excessive moisture nodal roots were initiated from both below- and above-ground nodes (Rathore et al., 1996, Zaidi and Singh, 2001). The stress-induced brace root development was comparatively more in tolerant maize genotypes, when exposed to excessive moisture stress at knee-high (V7) stage (Fig. 11). Enhanced adventitious rooting was one of the most remarkable features in relatively tolerant genotypes and was found to be closely related to final grain yield under the stress condition (Fig.11). In tolerant genotypes primary root system was completely replaced by newly developed adventitious roots below ground surface (Zaidi et al., 2002). The brace roots originating from aboveground surface do not suffer complete oxygen deficit (anoxia) because i) they enter surface soil that is hypoxic, not anoxic, ii) they contain large air spaces containing reservoir of oxygen in their tissues, and iii) in general, partly they are exposed to open atmosphere. Newly emerged adventitious roots in maize genotypes under waterlogging conditions has been reported to have large air spaces in cortical region (Rathore et al., 1996), which would be helpful in increasing the supply of oxygen, nutrients and water, and improve anchorage where severe damage of primary roots under excess moisture has occurred.
b) Changes in root geotropism. Under excessive moisture situation a typical change in root geotropism, i.e.- root growth toward ground surface has been observed in maize genotypes (Zaidi et al., unpublished data). Within 2-3 days of waterlogging in field a large number of root tips (white tips) were visible around the maize plants. However, such change in root geotropism and visible white tips of roots was comparatively more around the plants, which belongs to relatively tolerant genotypes (data not published). Such changes in root geotropism may have adaptive role to excessive moisture (or waterlogging) conditions because the visible root tips and shallow–placed roots will be under hypoxic rather than complete anoxic state, and therefore can retain partial aerobic respiration. The advantage of surface rooting in excessive moisture stress conditions can be enhanced by having thin roots. Roots with fine diameter have less resistance to radial oxygen diffusion,
52

and thus do not develop an anaerobic core as would occur in thicker roots. Furthermore, a greater surface area of roots per root volume may enhance the exploitation of the limited rhizosphere volume. Surface root has been identified as an adaptive strategy for coping with flooding in a large number of wetland species (Justin and Armstrong, 1987).
ii) Anatomical adaptation Under excessive moisture stress the submerged maize roots, including newly developed adventitious roots during excessive moisture stress, develop large air spaces called aerenchyma. In maize, aerenchyma is not a constitutive trait; rather it is a stress-responsive trait develops with exposure to excessive moisture conditions. Ethylene-induced cell lysis leading to aerenchyma formation is a process of progressive cell deterioration or precocious senescence, beginning about 10mm behind the root tip in intact roots of maize, in cell initiated some 12-18 hrs earlier, and first detectable by the collapse of cells in the mid-cortex (Campbell and Drew, 1983). Dissolution of protoplasm and much of the cell wall is complete within next 12-24 hrs, leaving gas-filled spaces (lacunae) that interconnect to gas space system in the shoot. Aerenchyma provides a diffusion path of low resistance for the transport of O2 from aerial parts of the newly developed brace root to the roots present under severe anoxic conditions (Kawase and Whitmoyer, 1980; Laan et al., 1989). Aerenchyma also provides a path for diffusion of volatile compound such as ethylene, methane, CO2, ethanol, and acetaldehyde (Visser et al., 1997; Vartapetian and Jackson, 1997). The O2 supplied through aerenchyma for root respiration and oxygenation of rhizosphere facilitating detoxification of chemically reduced iron, manganese, and hydrogen sulphide (Gambrell et al., 1991) and may also support nitrifying bacteria in conversion of ammonia to nitrate (Blom et al., 1994). Aerenchyma tissues develop in the root cortex of maize either by lyses (lysigenous) of cortical cells (Kuo, 1993). Vartapetian and Jackson (1997) suggested that ethylene is found to be the principal mediator of promoting the development of aerenchyma in maize roots (Fig. 9). Our studies showed a many fold increase in root porosity was one of the unique characteristics of the excess moisture tolerant maize genotypes. Analogous to brace roots, expression this trait was nominal under normal moisture condition, which indicates that it is a stress-induced trait and adaptive strategy to excessive moisture stress. Root porosity was significantly and strongly related to final grain yield under excessive moisture stress condition (Fig. 11). iii) Metabolic adaptations In order to tolerate the excessive moisture situation and avoid or minimize the stress-induced injuries several metabolic adaptations have been observed in crop plants, including maize (Fig. 12). In hypoxia, rather than complete anoxia prevails, anaerobic strains with the tissues may sometime be avoided by simple decrease in rate of aerobic respiration, so that the limited O2 available would be sufficient to support the markedly decreased rate of aerobic respiration. In case of prolonged anoxia conditions the carbohydrate breakdown does not proceed beyond pyruvic acid, Krebs cycle is inhibited and the pyruvic acid is converted into ethyl alcohol and CO2. The switch from aerobic to anaerobic respiration severely curtails energy availability by 88% (only 2 ATP against 36
53

ATP with aerobic respiration), produce potentially detrimental products and causes cytoplasmic acidosis. However, through metabolic adaptation low energy and toxic end product like ethanol can be avoided (Crawford, 1967). In excessive moisture tolerant species/genotypes under anaerobic condition tri-carboxylic acid (TCA) cycle switched off leading to increased phophofructokinase (PFK) activity, which result in enhanced rate of glycolysis. The phenomenon is referred as Pasture effect. The high rate of pasture effect under anaerobiosis helps cells in maintaining high sufficient energy supply, provided carbohydrate supply is sustained in the tissues under anoxia. Another important metabolic adaptation of respiration is the regulatory induction of alcohol dehydrogenase (ADH) under anoxia. Alcoholic fermentation is the key catalytic pathway for recycling NAD to maintain glycolysis and substrate level phosphorylation in absence of oxygen (Ap Rees et al., 1987). Increased alcoholic fermentation is thus one way to alleviate the adverse effect of anoxia on energy production. However, the phytotoxic effects of end product of alcoholic fermentation (mainly ethanol) has been major concern and under debate. Studies indicated that a low level of ethanol accumulation might not be highly phytotoxic, since ethanol readily diffuses out in the surrounding water, leaving small fraction in the plant tissues (Liao and Lin, 2001). However, high level of ethanol accumulation definitely causes anoxic death of plant tissue. Thus, the level of ethanol tolerance and ability to excrete the ethanol produced by anaerobiosis may be important factors in discriminating the excessive moisture tolerant and intolerant species/genotypes. Metabolic theory of flooding tolerance (Crawford, 1967) suggest that excessive moisture tolerance is achieved by minimization of ethanol production and re-routing towards less toxic malate production (Fig. 12). According to this theory, in anoxia-tolerant species/genotypes PEP (phosphoenol pyruvic acid), instead of producing pyruvic acid, combine with CO2 and produce oxaloacetate. In the next step, with the activity of enzyme malate dehydrogenase oxaloacetate is converted to malate by the, which is less toxic to plants cells. However, this theory suffers some drawbacks and appears to be incompatible with Crawford’s theory (Su and Lin, 1996). Lactate dehydrogenase activity has been found to increase by 20 fold during prolonged hypoxia, which may be an important factor contributing to log-term adaptation to hypoxia (Hoffman et al., 1986). iv) Regulation of gene expression and anoxia-induced proteins (ANPs) Anaerobic treatment drastically alters the profile of total protein synthesis in maize (Zea mays L.) seedlings. During anaerobiosis there is an immediate repression of ongoing protein synthesis and 20 new proteins (ANPs), which account for >70% of the total translation, are selectively synthesized (Sachs, 1980; Sachs et al., 1996). Most of these ANPs are identified as enzymes of glycolysis or sugar-phosphate metabolism (Subbaiah and Sachs, 2003). Anaerobiosis results in alteration of gene expression in plants leading to the accumulation of ANPs. These alterations occur at transcriptional, translational and pos-translational levels (Sachs, 1980; Manjunath et al., 1999). At the level of translation, anaerobic treatment of maize seedlings disrupts polysomes and leads to a redirection of protein synthesis (Sachs, 1980; Russell and Sachs, 1992).
54

Advances have been made in molecular-level analysis of several cDNAs and genes involved in the anaerobic response (Sachs, 1994; Sachs et al., 1996). Genes involve in anaerobic responses in maize are distributed throughout the genome (Table-6). Genes coding ANPs (e.g.- adh1) are rapidly turned on even by mild hypoxia and also rapidly turned off upon reoxygenation (Chang et al., 2000), which indicates that a fast and precise oxygen sensing system operating in plant cells. However, until recently, the pathway leading to the perception and transduction of low O2 signals remained a ‘black box’. The transient changes in Ca2+ and H+ that follow cell stimulation are immediately recognize even at sub-micromolar levels, amplified and finally translated into long-lasting biochemical and physiological responses by plant cells (Knight et al., 1996; Sanders et al., 1999). Gene expression and physiological changes in response to O2 deprivation are preceded and signaled by and elevation of Ca2+ in maize seedlings and cultured cells (Subbaiah et al., 1994a, b).
References Ap Rees, T., Jenkin, L.E.T., Smith, A.M., Wilson, P.M., 1987. The metabolism of flood
tolerant plant. In. Plant life in aquatic and amphibious habitat, (Crawford, R.M.M., Ed.). Blackwell Scientific Publications, Oxford, pp. 227-238.
Armstrong, W., Brandle, R., Jackson, M.B., 1994. Mechanism of flood tolerance in
plants. Acta Bot. Neerlandica 43, 307-358. Blom, C.W.P.M., Voesenek, L.A.C.J., Banga, M., Engelaur, W.M.H.G., Rinjders,
J.H.G.M., Van, E.J.W., 1994. Physiological ecology of riverside species: adaptation responses of plants to submergence. Annals Bot.74, 253-263.
Bolaños, J., Edmeades, G.O., 1996. The importance of anthesis-silking interval in
breeding for drought tolerance in tropical maize. Field Crop Res. 48, 65-80. Bonneau, M., 1982. Soil temperature. In. Constituents and properties of soil. (M.
Bonneau and B. Souchier, eds.). pp. 366-371, Academic press, New York and London.
Bradford, K.J., 1982. Regulation of shoot response to root stress by ethylene, abscisic
acid and cytokinins. In. Plant growth substances 1982. (P.F. Wareing, ed.). pp. 599-608. Academic press, New York and London.
Campbell, R., Drew, M.C., 1983. Electron microscopy of gas space (aerenchyma)
formation in adventitious roots of Zea mays L. subjected to oxygen shortage. Planta 157, 350-357.
Chang, W.W.P., Huang, L., Shen, M., Webster, C., Burlingame, .L., Roberts, J.K.M.,
2000. Pattern of protein synthesis and tolerance of anoxia in root tips of maize seedlings acclimated to a low-oxygen environment, and identification of proteins by mass spectrophotometry. Plant Physiol. 122, 295-318.
55

Crawford, R.M.M., 1967. Alcohol dehydrogenase activity in relation to flooding of roots.
J. Exp. Bot. 18, 454-464. Crawford, R.M.M., Braendle, R., 1996. Oxygen deprivation stress in changing
environment. J. Exp. Bot. 47, 145-159. Devitt, A.C., Francis, C.M., 1972. The effect of waterlogging on the mineral nutrient
content in Trifolium subterraneum. Aus. J. Exp. Agric, Anim. Husb. 12, 614-617. DMR, 2001. Annual report, Directorate of Maize Research (DMR), 49th Annual Maize
Workshop, Directorate of Maize Research, held at C.S. Azad University of Agriculture & Technology, Kanpur (U.P.), India, 5-9 April 2001.
Drew, M.C., 1997. Oxygen deficiency and root metabolism: injury and acclimation under
hypoxia and anoxia. Annu. Rev. Plant. Physiol. Plant Mol. Biol. 48, 223-250. Drew, M.C., Jackson, M.B., Giffard, S., 1979. Ethylene-promoted adventitious rooting
and development of cortical air spaces (aerenchyma) in roots may be adaptive response to flooding in Zea mays L. Planta 147, 83-88.
Drew, M.C., Sisworo, E.J., 1979. The development of waterlogging damage in young
barley plants in relation to plant nutrient status and changes in soil properties. New Phytol. 82, 301-314.
Eur J. Agron. 19, 383-399. Evans, R.O., Skaggs, R.W., Sneed, R.E., 1990. Normalized crop susceptibility for corn
and soybean to excess water stress. Trans. of the ASAE 33, 1153-1161. Ernest, W.H.O., 1990. Ecophysiology of plants in waterlogged and flooded
environments. Aquatic Bot. 38, 73-90. Fausey, N.R., VanToai, T.T., McDonald, M.B., 1985. Response of ten corn cultivars to
flooding. Trans. ASAE 28, 1794-1797. Gambrell, R.P., Delaune, R.D., Patrick, W.H. Jr., 1991. Redox processes in soil following
oxygen depletion. In. Plant life under oxygen deprivation. M.D. Jackson, D.D. Davies and H. Lambers, pp. 101-117. SPB Acad. The Hague, The Netherlands.
Hoffman, N.E., Bent, A.F., Hanson, A.D., 1986. Induction of lactate dehydrogenase by
oxygen deficit in barley root tissue. Plant Physiol. 82, 658-663. Huang, B.R., Johnson, J.W., Bridges D.C., 1994. Growth, physiological and anatomical
response of two wheat genotypes to waterlogging and nutrient supply. J. Exp. Bot. 45, 193-202.
56

Jackson, M.B., 1989. Regulation of aerebchyma formation in roots and shoots by oxygen and ethylene. In. Separation of plants: physiology, biochemistry and molecular biology. pp. 262-274 (Osborne, D.J. and Jackson, M.B., Eds.). Springer-Verlag, Heidelberg, Germany.
Jackson, M.B., 1990. Hormones and developmental changes in plants subjected to
submergence and soil waterlogging. Aquatic Bot. 38, 49-72. Jackson, M.B., Brailsford, R.W., Else, M.A., 1993. Hormone and plant adaptation to poor
aeration. A review. In. Adaptation of food crops to temperature and water stress., pp. 231-243 (Kuo, C.G., ed.), Proceeding of an International symposium, AVRDC Pub., Taipei, Taiwan, R.O.C.
Jackson, M.B., Campbell, D.J., 1976. Waterlogging and petiole epinasty in tomato: the
role of ethylene and low oxygen. New Phytol. 76, 21-29. Jackson, M.B., Drew, M.C., 1984. Effect of flooding on growth and metabolism of
herbaceous plants. In. Flooding and plant growth. Pp. 47-128 (Kozlowski, T., Ed.), Academic press, New York.
Jackson, M.B., Kowalewska, A.K.B., 1983. Positive And Negative massages from root
induce foliar desiccation and stomatal closure in flooded pea plants. J. Exp. Bot. 34, 493-506.
Justin, S.H.F.W., Armstrong, W., 1987. The anatomical characterization of roots and
plant response to soil flooding. New Phytol. 106, 465-495. Kawase, M., Whitmoyer, R.E., 1980. Aerenchyma development in waterlogged plant.
Am. J. Bot. 67, 18-22. Kennedy, R.A., Rumpho, M.E., Fox, T. C., 1992. Anaerobic metabolism in plants. Plant
Physiol. 100, 1-6. Knight, H., Trewavas, A.J., Knight, M.R., 1996. Cold calcium signaling in Arabidopsis
involved two cellular pools and a change in calcium signature after acclimation. Plant Cell 8, 489-503.
Krishnamoorthy, H.N., 1993. Waterlogging. In. Physiology of plant growth and
development, pp. 467-488. Kue, J., 1993. Molecular and anatomical responses to waterlogging and submergence in
selected plants. In. Adaptation of food crops to temperature and water stress. (Kuo, C.G., ed.), pp. 205-219. Proceeding of International Symposium, AVRDC Publ., Taipei, Taiwan R.O.C.
57

Laan, P., Berrevoets, M.J., Lythe, S., Armstrong, W., Blom, C.W.P.M., 1989. Root morphology and aerenchyma formation as indicators of the flood-tolerant of Rumex species. J. Ecol. 77, 693-703.
Lal, R., Taylor, G.S., 1970. Drainage and nutrient effects in a field lysimeter study. II.
Mineral uptake in corn. Soil Sci. Soc. Am. Soc. 34, 245-248. Levitt, J., 1980. Excess water or flooding stress. In. Responses of plants to environmental
stress. Vol. II, pp. 213-228. Liao, C.T., Lin, C.H., 1994. Effect of flooding stress on photosynthetic activities of
Momordica charantia. Plant Physiol. Biochem. 32, 1-5. Liao, C.T., Lin, C.H., 1995. Effect of flood stress on morphology and and aerobic
metabolism of Momordica charantia. Environ. Exp. Bot. 35, 105-113. Liao, C.T., Lin, C.H., 2001. Physiological adaptation of crop plants to flooding stress.
Proc. Nat. Sci. Counc. ROC(B) 25, 148-157. Liu, X.Z., Wang, Z.L., Gao, Y.Z., 1991. The relationship between alcohol
dehydrogenase and flooding tolerance in maize roots under waterlogging stress. Jiangsu J. Agric. Sci. 7, 1-5.
Lizaso, J.I., Ritchie, J.T., 1997. Maize shoot and root response to root zone saturation
during vegetative growth. Agron. J. 89, 125-134. Manjunath, S., Williams, A.J., Bailey-Serres, J., 1999. Oxygen deprivation stimulates
Ca2+- mediate phophorylation of mRNA cap-binding protein eIF4E in maize roots. Plant J. 19, 21-30.
Mohanty, B., Wilson, P.M., ap Rees, T., 1993. Effect of anoxia on growth and
carbohydrate metabolism in suspension cultures of soybean and rice. Phytochem, 34, 75-82.
Mukhtar, S., Bakler, J.L., Kanwar, R.S., 1990. Corn growth as affected by excess soil
water. Trans. of the ASAE 33, 437-442. Palvadi, H.K., Lal, B., 1976. Note on susceptibility of maize to waterlogging at different
growth stages. Pantnagar J. Res. 1, 141-142. Pearce, D.M.E., Hall, K.C., Jackson, M.B., 1992. Effect of oxygen, carbon dioxide,
ethylene on ethylene biosynthesis in relation to shoot extension of rice (Oryza sativa L.) and barnyard grass (Echinochloa oryzoides). Ann. Bot. 69, 441-447.
Perata, P., Alpi, A., 1993. Plant responses to anaerobiosis. Plant Science 93, 1-17.
58

Perata, P., Pozueta-Romero, J., Akazawa, T., Yamaguchi, J., 1992. Effect of anoxia on starch breakdown in rice and wheat seeds. Planta 188, 611-618.
Ponnamperuma, F.N., 1972. Adv. Agron. 24, 29. Ponnamperuma, F.N.,1984. Effect of flooding on soils. In. Flooding and plant growth.
Kozlowsky T.T. ed., Orlando, Florida Acad. Press, 9-45. Porto, M.P., 1997. Method of selection for tolerance to soil waterlogging in maize plants.
Pesq. Agrop. Gaucha 3, 187-190. Rathore, T.R., Warsi., M.Z.K., Lothrop, J.E., Singh N.N., 1996. Production of maize
under excess soil moisture (waterlogging) conditions. 1st Asian Regional maize Workshop, 10-12 Feb 1996, P.A.U., Ludhiana, pp. 56-63.
Rathore, T.R., Warsi., M.Z.K., Singh N.N. and Vasal, S.K. 1998. Production of maize
under excess soil moisture (waterlogging) conditions. 2nd Asian Regional Maize Workshop PCCARD, Los Banos, Philippines, Feb 23-27, 1998.
Rathore, T.R., Warsi., M.Z.K., Zaidi, P.H., Singh N.N., 1997. Waterlogging problem for
maize production in Asian region. TAMNET News Letter, 4, 13-14. Reggiani, R., Cantu, C.A., Brambilla, I., Bertani, A., 1988. Accumulation and inter-
conversion of amino acids in rice roots under anoxia. Plant Cell Physiol. 29, 981-987.
Ricard, B., Couee, I., Raymond, P., Salgio, P. Saint-Ges V., Pradet, A., 1994. Plant
metabolism under hypoxia and anoxia. Plant Phyisol. Biochem. 32, 1-10. Russell, D.A., Sachs, M.M., 1992. Protein synthesis in maize during anaerobic and heat
stress. Plant Physiol. 99, 615-620. Sachs, M.M. 1993. Molecular genetic basis of metabolic adaptation to anoxia in maize
and its possible utility for improving tolerance of crops to soil waterlogging. In. Jackson M.B., Black C.R., Eds. Interacting stresses on plants in a changing environment, NATO ASI series, Vol-I 16, Berlin: Springer-Verlag, p. 375-393.
Sachs, M.M., 1994. Gene expression in maize during anoxia. In: Basra, A.S. ed. Stress
induced gene expression in plants. Switzerland: Harwood Academic Pulishers, 87-102.
Sachs, M.M., Freeling, M., Okimoto, R. 1980. The anaerobic proteins in maize. Cell 20,
761-767. Sachs, M.M., Subbaiah, C.C., Saab, I.N., 1996. Anaerobic gene expression and flooding
tolerance in maize. J. Exp. Bot. 47, 1-15.
59

Saglio, P.H., Raymond, P., Pradet, A., 1980. Metabolic activity and energy change of
excised maize root tips under anoxia. Plant Physiol. 66, 1053-1057. Sanders, D., Brownlee, C., Harper, J.F., 1999. Communicating with calcium. Plant Cell
11, 691-706. Setter, T.L., Kupkanchanakul, T., Kupkanchanakul, K., Bhekasut, P., Weingweera, A.,
Greenway, H., 1987. Concentrations of CO2 and O2 in floodwater and in internodal lacunae of floating rice growing at 1-2 meter water depths. Plant, Cell and Environ. 10, 767-776.
Sharpiro, R.E., Taylor, G.S., Volk, G.W., 1956. Soil oxygen content and oxygen uptake
by corn. Soil Sci. Soc. Am. Proc. 20, 193-197. Singh, R., Ghildyal, B.P., 1980. Soil submergence effects on nutrient uptake, growth,
and yield of five corn cultivars. Agron. J. 72, 737-741. Su, P.H., Lin, C.H., 1996. Metabolic response to luffa roots to log-term flooding. J. Plant
Physiol. 148, 735-740. Subbaiah, C., Sach, M.M., 2003. Molecular and cellular adaptations of maize to flooding
stress. Annals Bot. 90, 119-127. Subbaiah, C.C., Bush, D.S., Sachs, M.M., 1994a. Elevation of cytosolic calcium precedes
anoxic gene expression in maize suspension cultured cells. Plant Cell 6, 1747-1762.
Subbaiah, C.C., Zhang, J., Sachs, M.M., 1994b. Involvement of intracellular calcium
anaerobic gene expression and survival of maize seedlings. Plant Physiol. 105, 369-376.
Suszkiw, J., 1994. After the flood – satellites show damage in Midwest farmlands. Agril.
Res. 42, 20-21. Tanaka, A., Yoshida, S., 1970. IRRI Technical Bull. No. 10. Torbert, H.A., Hoeft, R.G., Vanden-Heuvel, R.M., Mulvaney, R.L., Hollinger, S.E.,
1993. Short-term excess water impact on corn yield and nitrogen recovery. J. Prod. Agric. 6, 337-344.
Van Toai, T.T., Saglio, P., Ricad, B., Pradit, A., 1995. Development regulation of anoxic
stress tolerance in maize. Plant Cell Environ. 18, 937-942.
60

Vanlerberghe, C.C., Feil, R., Turpin, D.H., 1990. Anaerobic metabolism in the N-limited green alga Selenastrum minutum. 1. Regulationof carbon metabolism in and succininate in as a fermentation product. Plant Physiol. 94, 1116-1123.
Vartapetian, B.B., Jackson, M.B., 1997. Plant adaptations to abiotic stress. Annals Bot.
79 (Suppl. A), 3-20. Visser, E.J.W., Nabben, R.H.M., Blom, C.W.P.M., Voesenek, L.A.C.J., 1997. Elongation
by primary lateral roots and adventitious roots during condition of hypoxia and high ethylene concentrations. Plant Cell Environ. 20, 647-653.
Watanabe, I., 1984. Anaerobic decomposition of organic matter in flooded rice soils. In.
Organic matter and rice. International Rice Research Institute, Los Banos, Philippines.
Xia, J.H., Saglio, P.H., 1992. Lactic acid efflux as a mechanism of hypoxic acclimation
of maize root tips to anoxia. Plant Physiol. 93, 453-459. Yoshida, T., 1978. Microbial metabolism in rice soils. In. Soil and Rice. pp. 445-463.
International Rice Research Institute, Los Banos, Philippines. Zaidi, P.H., Rafique, S., Singh, N.N., 2003. Response of maize (Zea mays L .) genotypes
to excess moisture stress : morpho – physiological effects and basis of tolerance Zaidi, P.H., Rafique, S., Singh, N.N., Srinivasan, G., 2002. Excess moisture tolerance in
maize – progress and challenges. Proceeding-8th Asian Regional Maize Workshop, 5-9 August 2002, Bangkok, Thailand (in press).
Zaidi, P.H., Singh N.N., 2001. Effect of waterlogging on growth, biochemical
compositions and reproduction in maize. J. Plant Biol. 28,61-69. Zaidi, P.H., Singh, N.N., 2002. Identification of morpho-physiological traits for excess
soil moisture tolerance in maize. In. Stress and Environmental Physiology. Eds. K.K. Bora, Karan Singh and Arvind Kumar, Scientific publishers, Jodhpur, India, pp. 172-183.
Zhang, J., Davies, W.J., 1987. ABA in roots and leaves of flooded pea plants. J. Exp. Bot.
38, 649-659.
61

20
25
30
35
40
1 2 3 4 5 6 7
Air Stagnent water Inundated soil
0
5
10
15
20
25
1 2 3 4 5 6 7
-400
-200
0
200
400
600
800
1 2 3 4 5 6 7
Tem
pera
ture
(0 C)
Days under waterlogging R
edox
pot
entia
l (m
v)
Days under waterlogging
Dis
solv
e O
xyge
n (p
pm)
(A) (C)
(B)
Days under waterlogging
Fig. 1: Changes in soil and water properties under excess soil moisture conditions in field. (A) Temperature, (B) Dissolved oxygen and (C) Redox potential.(cf. Zaidi et al., 2003)
63

Fig 2.Waterlogging prone areas in India during summer-rainy (monsoon) season
64

Fig. 3: Soil hydraulic conductivity as function of the water potential of the soil.
65

EXCESSIVE MOISTURE
Primary stress Secondary stresses(Excess water potential)
Gas stresses Ion stresses
O2 deficit CO2 excess Ethylene excess Leaching-inducedion deficit
Anaerobic decrease ofredox potential
Metabolic Reduced Nutrient iontoxins ion toxins deficit
Fig. 4: Different kinds of stresses under excess soil moisture condition. (cf. Levitt, 1980)
66

0.00
0.25
0.50
0.75
1.00
Total dry wt. Yield
V2 stage V7 stage VT stage R3 stage
Cro
p su
scep
tibili
ty in
dex
Fig. 5: Crop susceptibility index for maize under excess soil moisture conditions.
67

0
25
50
75
100
125
150
2 3 4 5 6 7
Tra
nspi
r ati o
n ( µ
g cm
-2s-1
)
2 3 4 5 6 7
CN W WW*
CM-118 CM-501
CML-752 3 4 5 6 7
CML-226
CML-80CML-311
Days under waterlogging
Fig. 6: Daily transpiration during excess soil moisture stress at knee-high stage in different maize genotypes.
CN=normal moisture, W= excess moisture stress only at knee-high stage, WW= excess moisture stress at early growth stage and knee-high stage
68

Carbohydrate
Gly
coly
sis
PyruvateFermentation(cytosol)
-O2 +O2
Anaerobic Aerobic
Mitochondria
Ethanol or lactate or malate or
alanine
CO2andH2O
2 ATP 2 ATP
34 ATP+
Fig. 7: Aerobic and anaerobic respiration in plants.
69

0
50
100
150
200
250
1 2 3 4 5 6 7
CM-188(W) CM-501(W)CML-226(W) CML-311(W)CML-75(W) CML-80(W)
Days under waterlogging stress
AD
H a
c ti v
i ty ( u
nits
mg- 1
p ro t
e in
min
- 1)
1 2 3 4 5 6 7
CM-118(WW) CM-501(WW)
CML-226(WW) CML-311(WW)
Fig.8: NAD+-alcohol dehydrogenase activity in new developed adventitious roots of different maize genotypes under excess soil moisture stress at knee-high stage.
70

Excessive soil moisture
Enhanced ethylene formation
Increased cellulase activity
Lyses of cortical cell wall
Aerenchyma development
Low O2 partial pressure
Increased ACC-synthase activity
Fig.9: Schematic representation of aerenchyma development in root cortex under excessive soil moisture stress
71

Adaptation to excessive soil moisture
Stress avoidance
Stress tolerance
Morphologicaladaptations
(aerenchyma)
Alternate source of O2
supply (brace roots)
Lowering metabolic
rate
Compensatory metabolic rate
changes
Removal of toxic
products
Changes inmetabolic pathways
Endogenous oxidation
Synthesis of adaptive enzymes
Preservation of membrane
integrity
Metabolic breakdown
of the products of anaerobiosis
Fig. 10: Diagrammatic representation of the various means of adaptation to oxygen deficit (excessive moisture) stress in maize. (modified from: Crawford and Braendle, 1996).
72

0
20
40
60
80
100
120
Control Waterlogging
HTL TL MTL SUS HSUS
Bra
ce ro
ot F
W (g
pl- 1
)
0
5
10
15
20
25
30
Control Watarlogging
Roo
t por
osit y
(%
)
y = 0.0008x2 + 0.0045x - 0.0183R2 = 0.9134**
0
0.25
0.5
0 5 10 15 20 25
y = 0.304Ln(x) - 0.8783R2 = 0.8509**
0
0.25
0.5
0 40 80 120
Brace root (FW g plant-1)
Gra
in y
ield
( kg
p lot
-1)
Root porosity (%)
Fig.11 : Means of root traits observed after exposure to excess moisture stress for 10 days at V7 growth stage at different group of maize genotypes (HTL = highly tolerant, TL = tolerant, MTL = moderately tolerant, SUS = susceptible and HSUS = highly susceptible), and their relationship with grain yield.
** indicate significant differences at P<0.01.
73

Phosphoenolpyruvate (PEP)
Pyruvate
Acetaldehyde
Ethanol
Glutamate
α-keto glutarate
Alanine
Oxaloacetate
Malate
Lactate
ADP
ATP(PK)
(PEPK)
(MD)NADH
NAD+
NADH
NAD+
NADH
NAD+
(AAT)
CO2
(PDC)
(LDH)
(ADH)
Fig. 12: Different anaerobic fermentation pathways in plant cells. PK = pyruvate kinase, PDC = pyruvate decorboxylase, ADH = alcohol dehydrogenase, LDH = lactate dehydrogenase, PEPC = phophoenolpyruvate decorboxylase, MD = malate dehydrogenase, AAT = alanine aminotransferase
74

Table 1: Total and water logging affected area (ha) of maize in South-East Asia*.
Country Total maize area Area affected by waterlogging
Bangladesh 3,000 1000
Cambodia 71,000 15,000
India 6.55m 2.62m
Indonesia 3.5m 5,00,000
Laos 32,000 5,000
Malaysia 21,000 -
Myanmar 2,49,000 -
Nepal 7,50,000 2,00,000
Pakistan 9,00,000 2,50,000
Philippines 3.40m 5,00,000
S. China 2.10m 1,00,000
Taiwan 50,000 20,000
Thailand 1.5m 3,00,000
Vietnam 5,00,000 2,00,000
* Updated from Rathore et al. (1998).
75

Table-2: Waterlogging-induced changes in tissues ion concentrations in maize (Zea mays L.).
Element Tissue N P K Ca Mg Fe Mn Cu Zn Mo B References
Ear leaf
Shoot
Roots
Leaves
Whole plant
↓ ↓ ↓ ↑ ↑ ↓ ↓ ↑ ↓
↓ ↓ ↓ ↓ ↓
↑ ↑ ↑ ↑
↓ ↑ ↓ ↓ ↑ ↑ ↓ ↓ ↓
↓ ↑ ↓ → →
Lal and Taylor (1970)
Sharpiro et al. (1956)
Singh and Ghildyal (1980)
Rathore et al. (1997)
Devitt and Francis (1972)
76

Table 3: Changes in soil properties after 15 days of flooding (cf. Drew and Sisworo, 1979).
Soil properties Control Waterlogging
Oxygen (%, v/v)
NO3 (mM)
NH4 (mM)
pH
Mn (mg l -1)
21.0
8.0
14.0
6.8
0.006
1.6
0.17
31.0
7.4
0.5
Table 4: Effect of 6 days waterlogging on the leakage of mineral ions from the detached leaves of pea. (cf. Jackson and Kowalewska, 1983).
Mineral ions (µg/ml/leaflet) Control Waterlogging
Potassium (K+)
Calcium (Ca 2+)
Phosphorous (PO3-/PO4
-)
Magnesium (Mg 2+
Ammonium (NH4+
Nitrate (NO3-)
0.18
0.73
0.0
0.0
0.0
0.0
41.63
9.28
8.38
6.70
0.39
0.08
77

Table-5: Means of the traits observed on maize genotypes under normal and excess moisture stress imposed for 10 days at different growth stages.
Excess moisture at different growth stages Traits
Normal moisture V2 Stage V7 Stage VT Stage R1 Stage
Plant mortality (%)
Plant height (cm)
Leaf area (dm2 pl.-1)
Dry wt. (g pl-1)
A.S.I. (d) #
Yield (t ha-1)
1.3
121.3
286.3
64.9
3.3
2.46
87.8**
45.8**
92.3**
14.2**
25.3**
0.49**
70.3**
79.6**
169.7**
33.6**
10.7**
1.01**
32.6**
116.6ns
269.2ns
53.7ns
3.7ns
2.03*
13.6*
122.3ns
279.5ns
61.5ns
3.2ns
2.27ns
*,** indicate significant differences in comparison to normal condition at P <0.05 and
0.01, respectively; ns indicates non-significant at P,0.05. # A.S.I. = anthesis-silking interval.
78

Table-6: Chromosomal locations of maize genes involved in the anaerobic responses. (cf. Sachs et al., 1996)
Gene name or clone number Symbol Location
Alcohol dehydrogenase 1
Alcohol dehydrogenase 2
Aldolase 1
Enolase 1
Enolase 2
Glyceraldehyde-3-phosphte dehydrogenase 1 (c)
Glyceraldehyde-3-phosphte dehydrogenase 2 (c)
Glyceraldehyde-3-phosphte dehydrogenase 3
Glyceraldehyde-3-phosphte dehydrogenase 4
Phosphohexose isomerase 1
Pyruvate decorboxylase 1
Pyruvate decorboxylase 2
Pyruvate decorboxylase 3
Shruken 1
Sucrose synthase 1
Xyloglucon endotranglycosylase 1
No. 1032
adh1
adh2
ald1
eno1
eno2
gpc1
gpc2
gpc3
gpc4
phi1
pdc1
pdc2
pdc3
sh1
sus1
xet1
wusl1032= umc217
1L
4S
8L
9S
1S
4S
6S
4S
5L
1L
8L
8
1S
9S
9L
5S
1S
(c) indicates constitutive member of a gene family; other members are anaerobically inducible
79

80

Screening Technique and Selection Criteria for Maize (Zea mays L.) Genotypes Tolerant to Excessive Moisture Stress Pervez H. Zaidi1, P. Maniselvan1, Poonam Yadav1, R.P. Singh1, N.N. Singh1 and G. Srinivasan2
1Directorate of Maize Research, I.A.R.I. Campus, New Delhi-110 012, India 2 International Maize and Wheat Improvement Center (CIMMYT), Apdo. Postal 6-641, Mexico D.F., Mexico Introduction Maize crop grown in tropics during summer-rainy season occasionally face extreme climatic conditions and various biotic/abiotic pressures that severely limits crop growth and development, and eventually yield potential. Among the abiotic stress, excessive soil moisture, caused by flooding, waterlogging or high water table, is one of the most important constraints for maize production and productivity in Asian region. In South-East Asia alone, more than 15% of total maize growing areas is affected by flooding and waterlogging problem (Rathore et al., 1998). In India, waterlogging is the second most serious constraints for crop production, after drought, where about 8.5 mha of arable soil is in grip of this problem. Out of the total 6.55mha area of maize, about 2.5mha is affected by excess soil moisture problem that causes on average 25-30% loss of national maize production almost every year (DMR, 2001). Excess soil moisture causes major changes in physical and chemical properties in rhizosphere (Zaidi et al., 2003). Gaseous diffusion rates in flooded soil is about 100 times lower than air (Kennedy et al. 1992), and respiration of plant roots, soil micro-flora and fauna leads rapid exhaustion of soil oxygen, and thereby causes hypoxia/anoxia condition. Since, there is no any proper ventilation system in maize plants for gaseous exchange between aboveground plant parts and inundated roots, plants roots suffer with extreme oxygen stress, hypoxia followed by anoxia, whenever it faces prolonged (>3-4 days) excess soil moisture situation (Zaidi et al., 2002). The extent of damage due to excess moisture stress varies significantly with developmental stage, and past studies have shown that maize crop is comparatively more susceptible to excess moisture stress during the early seedling to tasseling stage (Palvadi and Lal, 1976; Mukhtar et al., 1990; Evans et al., 1990; Rathore et al., 1998; Zaidi et al., 2002). At later growth stages some genotypes with inbuilt ability to produce adventitious roots and anatomical adaptation like air space (aerenchyma) formation in cortical region of adventitious roots, can tolerate excess water situation up to some extent (Drew et al., 1979; Rathore et al., 1996, Zaidi et al., 2003). At early growth stages excess moisture condition caused by either due to heavy and/or continuous rainfall or grown on poorly drained soils, found to be extremely detrimental for maize plants (Rathore et al., 1998; Singh and Ghildyal, 1980; Zaidi et al., 2002). However, remarkable genetic variability has been observed in maize with regards to excess moisture tolerance (Torbert et al., 1993; Rathore et al., 1996, 1998; Zaidi and Singh, 2001; Zaidi et al., 2002, 2003). Such responses inevitably raise questions, whether there are any fundamental physiological/biochemical/genetic differences between plants
81

in their responses to imposed anaerobiosis. Such genetic variability can be exploited in developing genotypes that can tolerate longer period of excessive moisture conditions. In this regard suitable screening techniques and selection criteria for identification of promising tolerant genotypes are the major bottlenecks. In this paper suitable screening technique, and selection criteria using suitable secondary traits along with grain yield to identify excessive moisture tolerant maize genotypes is discussed. Susceptible Growth Stage(s) of Maize to Excessive Moisture Stress In order to identify the most susceptible growth stage(s) experiments were conducted during the summer-rainy season at the Maize Research Farm, Indian Agricultural Research Institute, New Delhi, India. A total of 52 tropical/subtropical advance generation elite inbred lines were planted (4 rows each) in flat field conditions using recommended package of practices with row length of 2.5m, row-to-row distance 0.75m and plant-to-plant distance of 0.25m in three replicates. Genotypes were selected on the basis of their local adaptation, per se performance and wide genetic background, and on the basis of some preliminary information on the performance of those entries under excessive moisture conditions (Rathore et al., 1997; Zaidi and Singh, 2002). Waterlogging treatment was applied continuously for 10 days with a ponding depth of 10.0 ± 0.5 cm at different growth stages, i.e. V2, V7, VT and R1 stages (Table 1). Data on different morpho-physiological parameters were recorded at one week after completion of excess moisture treatments at the R1 growth stage, with the exception of plant mortality, which was recorded at one week after completion of each stress treatment. Selection and classification of genotypes into tolerant (T) and susceptible (S) categories was done on the basis of multi-trait selection index using ALPHA selection assistant (CIMMYT, 1999). Crop susceptibility index (CSI) was calculated using total dry matter production and grain yield as follows:
CSI = (C – W) / C
Where, C and W indicate the performance under normal and excess moisture conditions, respectively. Stage-sensitivity in Maize to Excessive Moisture Stress In general, the presence of excess water in the rhizosphere negatively affects maize at every growth stage. However, the extent of susceptibility varied remarkably at different growth stages as observed in the present study (Table 2 and Fig. 1), and reported in previous studies also (Evans et al., 1990; Mukhtar et al., 1990). The largest effect was observed at V2-stage followed by V7-stage, and was least at the R1-stage for all the parameters studied. Frequency distribution of susceptible germplasm showed that out total 52 genotypes evaluated, 4 were susceptible at all the growth stages, 8 were found susceptible at V2, V7 and VT stages, and most genotypes (36) were susceptible at V2 and V7 growth stages but not at other stages (Table 3). Only two genotypes were susceptible exclusively at the V2 stage, and two lines showed no susceptibility to either of these stages. Out of a total of 52 lines, most (50) were susceptible at V2-stage, followed by 48 at V7-stage, 12 at VT-stage, and only 4 at R1-stage. Crop susceptibility index (Fig. 1), calculated for total biomass and final grain yield confirmed that crop susceptibility was
82

highest at the V2-stage followed by the V7-stage. Susceptibility to the stress declined with progress of crop growth, and was least at the R1-stage. Studies suggest that maize is highly susceptible to excess moisture condition if it is exposed to before tasseling, and crop susceptibility decreases gradually at later growth stages, as observed in our study (Table 3, Fig. 1) and also reported by others (Palvadi and Lal, 1976; Mukhtar et al., 1990; Evans et al., 1990; Rathore et al., 1996, 1997). Poorly developed brace roots prior to tasseling may be one of the important reasons of high susceptibility. High brace root development has been found to related to better performance of maize germplasm under excess moisture conditions (Rathore et al., 1997; Zaidi et al., 2003) due to the role of brace root aerenchyma as an alternative source of oxygen supply under anoxic conditions (Rathore et al., 1998). Stress Management and Screening Methodology The key of maize improvement for abiotic stresses, including excessive moisture, is providing correct exposure to the stress condition in order to identify the available genetic variability. Timing, intensity and uniformity of the stress are the key components of stress management (Banziger et al., 2000). The stress treatment should be given in a way that the susceptible growth stages (Fig. 1) have been exposed and stress intensity is uniform with space and time (i.e. uniform stress treatment through out the field and the duration of treatment), and should be severe enough, so that important traits associated with stress tolerance are distinctly express, and can be measured. Our experience says that stress management in field condition, particularly stress intensity and uniformity, is quite difficult and cumbersome process. Maintaining the same level of standing water through out the plot and through out the duration of stress treatment is quite impractical. Field leveling through out the plot significantly affects the intensity and uniformity of the stress. To avoid such discrepancies and to achieve uniform stress treatment with desired stress intensity and timing we have used a new screening technique (Cup method) for initial screening of large number of germplasm, followed by field screening of selected tolerant genotypes identified from cup screening. Cup screening The cup screening experiment (Fig. 2) can be planted either during winter cycle or during May-June, i.e. well before the main summer-rainy season cycle, in order to identify the tolerant genotypes and later on to confirm of their performance during main crop season (summer-rainy or Kharif season). Screening was conducted using the 'Cup method' originally developed by Porto (1997) with certain modification to make it suitable and easy-to-use in our conditions. Disposable plastic cups (250 cm3) perforated at the base at four points with an orifice of 5.0 mm diameter were used to grow maize seedlings (Fig. 3). Cups were filled with 220 cm3 of its volume with a mixture of siphoned soil, farmyard manure (FYM) and chemical fertilizers (NPK), which were calculated on soil weight basis and thoroughly mixed in the soil as per need of the culture. Each cup was weighted after filling, so as to maintain same quantity of soil for maintaining a same moisture level in each cup. Filled cups were placed in plastic tray (50 x 30 x 10 cm) containing a thin
83

layer (5.0 cm) of water (Fig. 3). Water level in the trays was maintained continuously at same level through out the experimentation. Total soil in the cups got fully saturated with water entering from the wholes present at the base of the cups through capillary action. After 24-hrs, one seed per cup was sown, keeping embryo upside down, at a depth of approximately 2.0-cm in the fully saturated soil condition. Trays along with cups and the cups outside the trays were kept under controlled conditions until well seedling establishment (4-5 leaf stage). Thereafter, trays were shifted outside the glass-house for proper seedling growth and development. At 20 days after planting, following responses were observed:
a) Seed rotting and no seed germination.
b) Coleoptiles death immediately after germination.
c) Seedling death immediately after emergence.
d) Seedling death at 2-3 leaf stage.
e) Seedling death at later stages.
f) Stunted seedling growth and development, and severe shoot chlorosis/necrosis.
g) Normal seed germination, good seedling growth and development, proper root development floating in water, passing through perforation at the base of cups.
Plantlets showing the performance under the last category (g), i.e. successfully growing, in spite of saturated soil condition for 20 days, has been selected as tolerant plants (Fig. 2). The genotypes having maximum number of seedlings performing under this category have been identified as tolerant genotype. Crop response to early stage excessive moisture stress during cup screening. In the cup experiment saturated soil conditions severely affected seed germination and seedling growth (Table 4). Significant genotypic variation was observed for germination itself, ranging from 5.2% - 88.5%. Post-emergence survival was about 100% in relatively tolerant genotypes, while for susceptible lines, seedling mortality was severe after emergence. Excess moisture conditions severely affected shoot and root growth, which resulted in reduced dry matter. However, the effect was small on relatively tolerant genotypes. Most remarkable change was observed in number of newly developed adventitious roots under EM Stress. In general, excess moisture increased the number of adventitious roots in all the genotype categories. However, the increase was comparatively greater (2-3 times) in case of relatively tolerant genotypes. Shoot chlorosis in susceptible genotypes, right from seedling emergence, was a clearly visible stress symptom. Quantification of the response shows that the stress significantly reduced both chlorophyll ‘a’ and ‘b’ concentrations (Table 4); though the effect was slightly more severe on chlorophyll ‘b’. Tolerant genotypes showed nominal loss in both chlorophyll ‘a’ and ‘b’. Total carbohydrate (CHO) content was also significantly reduced in shoot tissues, particularly in susceptible genotypes (Table 4). Reduction in shoot CHO content was comparatively less in relatively tolerant genotypes (HTL and TL). In general, total CHO content in shoot tissues was higher in relatively tolerant lines even under normal moisture conditions.
84

Following statistical analysis using MSTATC (MSTATC, 1990) means were entered in a multi-traits selection index program (CIMMYT, 1999), and the genotypes were grouped into the following five categories (Table 5), i.e. – highly tolerant (HTL), tolerant (TL), moderately tolerant (MTL), susceptible (SUS), and highly susceptible (HSUS).
Field screening After 20 DAS (days after sowing), all the successfully growing genotypes from HTL, TL and MTL under excess moisture (EM) conditions, and ten representative genotypes from SUS were transplanted, two rows each, in the field (2*2.5mts length/1*25cm between hills/row-to-row spacing 75cm/replicates-3). The same set of materials was planted directly in the field to evaluate the performance of genotypes observed during the cup screening. At 14 DAT (days after transplanting), i.e. at V7 growth stage, waterlogging treatment was applied in the field continuously for 10 days with a ponding depth of approximately 10.0 ± 0.5 cm. Ponding depth was maintained at same level during the stress treatment by maintaining a continuous supply of water from one end of the plots and making arrangement of overflow of excess water (>10 cm depth) at another end. In this way all the genotypes selected during cup screening, except those grouped as HSUS, were exposed two times to an EM stress, i.e. (i) seedlings were raised under saturated soil conditions and were again exposed to waterlogging stress at V7 growth stage, and (ii) seedling raised under normal moisture conditions were exposed to waterlogging only at V7 growth stage. These are hereafter referred to the double EM treatment (WW) and the single EM treatment (W), respectively. The highly susceptible genotypes at germination and early growth stage were exposed to only the single EM treatment at V7 growth stage.
Crop response to excessive moisture stress at V7- stage. Excess moisture severely affected plant growth and development at V7 growth stage (Table 6). However, significant variation was observed due to both genotype and the EM pre-treatment at early growth stage. The plants exposed to EM stress during early growth stage (WW) showed slightly improved performance over plants exposed to waterlogging stress only at the V7 growth stage (W). Excess moisture stress significantly promoted adventitious root development in most of the genotypes (Fig. 4). Maximum brace root biomass was recorded in HTL, followed by TL and MTL genotypes under both single and double EM treatments. However, in case of SUS and HSUS genotypes, there was nominal nodal root development even under the stress condition. Leaf area development was also suppressed under EM stress, and the effect was more pronounced under a single EM treatment (W) with susceptible genotypes (Table 6). Total dry weight plant-1 was also reduced in almost all genotypes. Maximum dry matter inhibition was recorded with HSUS and SUS, followed by MTL genotypes. Irrespective of genotypes, dry matter inhibition was comparatively less in pre-anoxia treated plants (WW). Root porosity was nominal (3.1 + 0.3) in almost all the genotypes under normal moisture. Under stress conditions, however, there was remarkable increase in root porosity, particularly in case of HTL and TL genotypes (Fig. 3). EM stress significantly reduced total leaf chlorophyll (Table 6), though the reduction was comparatively less in HTL and TL genotypes, and with pre-anoxia treated materials. Total stem CHO concentration declined to about one fourth in HSUS and SUS, and about half in MTL genotypes under single EM stress as compared to
85

normally grown plants. However, irrespective of the genotype, pre-anoxia exposure improved total CHO concentration in the stem tissues. Under normal moisture conditions alcohol dehydrogenase activity (ADH) in adventitious roots was similar in almost all the genotypes. However, under excess moisture a multi-fold increases in the enzyme activity was recorded, especially in relatively susceptible genotypes. Increased ADH activity was also observed with tolerant materials, but it was relatively less in comparison to susceptible genotypes. Excess moisture stress significantly affected reproductive behavior of maize genotypes. Female flowering was comparatively more affected by EM stress than male flowering (data not shown), resulting in an extended ASI. A large proportion of HSUS and many SUS genotypes failed to reach 50% silking, which resulted in many barren plants, and a sharp reduction in grain yield. Most of the HSUS genotypes produced no ears. Grain yield decreased to less than half of the normally grown plants when ASI exceeded 5 days, and declined asymptotically to zero as ASI increased further. Re-grouping of the genotypes on the basis of the data obtained at V7 stage excess moisture stress showed that the reaction of genotypes was similar as observed at the early stage stress treatment during cup screening (Table 5). Selection Criteria for Excessive Moisture Tolerant Genotypes Grain yield, the primary trait of interest, is commonly used as selection criteria in breeding programs for crop improvement. However, selection on the basis of grain yield per se for improved performance under abiotic stresses has often been misleading and inefficient. Inheritance of yield is complex and its heritability often decline under stress conditions. Therefore, stress breeding programs commonly use secondary traits, where heritability of some of those traits remain relatively high, while the genetic correlations between grain yield and those traits increase sharply under abiotic stress conditions, such as drought and low nitrogen stress (Banziger and Lafitte, 1997). Several secondary traits have been proposed for excessive moisture tolerance in maize (Rathore et al., 1996, 98; Zaidi and Singh, 2001, 2002), all putatively related to improved survival or tolerance. Numerous recommendations on the use of secondary traits have been made based on phenotypic correlations between those traits and grain yield. However, most of the studies have included a limited number of genotypes and environments, where outlying values may greatly affect the sign and magnitude of these correlations. Moreover, breeding progress for excess moisture stress tolerance in maize using those traits has not been estimated. Thus, it is not sufficient to identify secondary traits; the value of such traits must be estimated for using as criteria of selection under excess moisture stress conditions.
Value of a secondary trait in selection. It is difficult to obtain unequivocal proof of the value of a trait, so that perceptions are often based on opinion rather than fact (Ludlow and Muchow, 1990). Blum (1983) argued that it is worth attempting to prove the values of a trait because of the difficulties involved, and that if a trait appears desirable even on theoretical ground alone, it should be introduced into a breeding program with
86

simultaneous selection for both the trait and high yield under non-stressed conditions. Edmeades et al. (1998) established that an ideal secondary trait should be:
• Genetically associated with grain yield • Highly heritable • Genetically variable • Cheap and fast to measure • Stable within the measurement period • Not associated with a yield penalty under unstressed conditions • Observed at or before flowering, so that undesirable parents are not crossed • A reliable estimator of yield potential before final harvest
Various approached has been suggested for establishing the value of a trait in selection and improvement of germplasm, which are as follows: i) A common approach for assessing the value of traits is the comparison of grain
yields of isogenic/near-isogenic genotypes that have a similar genetic background but contrast in expression of the particular trait (Richard, 1988). However, this approach is restricted to traits that are controlled by one or only few genes, since isogenic lines cannot be developed for quantitatively inherited traits.
ii) Use simulation modeling, in which simulations are performed with all other
factors being held constant, while the trait is absent or present to varying degrees (Muchow and Sinclair, 1986; Sinclair et al., 1987; O’Toole and Bland, 1988). Though, this approach is rigorous, unequivocal and intellectually appealing, however, its application depends upon having an adequate simulation model for the particular crop, and sufficient understanding of the trait and its mode of operation.
iii) Analyzing the morpho-physiological changes in genotypes that have been
consistently selected and improved for tolerance to excessive moisture conditions. iv) Another approach, which is most commonly used in case of abiotic stress, is
analyses of genetic and phenotypic correlation of the trait with grain yield, and heritability of the trait among progenies of a single population.
Relationship between secondary traits and yield under excessive moisture stress. It is found that excess moisture condition is more suitable and efficient for selection of germplasm for the stress tolerance, rather than selection under optimal moisture regime, mainly because few important traits (e.g. above-ground brace root development, root porosity etc.) are stress-induced and cannot be assessed under optimal moisture conditions (Rathore et al., 1996; Zaidi and Singh, 2001). Each water regime serves different purposes. Optimum moisture condition allows estimation of yield potential, maturity and morpho-physiological characteristics of germplasm, while excess moisture
87

environment allows manifestation of genetic variability for different secondary traits, particularly brace root development and root porosity. Under excess moisture stress, ears and kernels per plant were more important determinants of grain yield than test weight (Table 7). Test weight seems to have a comparatively more important role in determining grain yield under normal moisture conditions. Genetic correlations for ears per plant increased under excess moisture conditions. Among the other traits, brace root development at aboveground nodes (both number of nodes with brace root and brace root fresh weight) and root porosity have been found to be strongly correlated to per se performance and grain yield under excess moisture conditions. Under the normal moisture regime these traits were poorly expressed, however, under stress conditions, there was many-fold increase. Data suggest that these are excess moisture-induced traits have an important role in excess moisture tolerance. Similar observations have also been made by Rathore et al. (1998) in maize for waterlogging conditions. Inheritance studies conducted by Khera et al. (1990) showed that tolerance to excess water was genetically controlled, and concluded that both additive and non-additive gene actions are important. They also found good correlations between grain yield and adventitious root development under waterlogged conditions and suggested that the trait can be used in selection index to screen maize genotypes for waterlogging stress tolerance. Rathore et al. (1998) reported that adventitious rooting and increased root porosity provide waterlogging tolerance in number of maize genotypes. They suggested that these two traits could be used in selection index for screening and breeding maize for waterlogging tolerance. Leaf senescence has shown a negative and weak correlation with grain yield under normal moisture but comparatively strong in excess water conditions, suggesting that remobilization of nutrients and assimilates from older to younger leaves have important role in the stress tolerance. Grain yield was strongly and significantly related to root porosity (R2 = 0.91**) and brace root weight (R2 = 0.85**). The relationship between grain yield and ASI was also strong and significant (R2 = 0.87**). The relationship of grain yield with root porosity and ASI was polynomial, while it was logarithmic with brace root fresh weight (Fig. 5). Grain yield decreased to less than half of the normal grown plants when ASI exceeded 5 days, and declined asymptotically to zero as ASI increased further. However, regression analysis for grain yield and ADH activity showed that it was not related to any improvement in grain yield or stress tolerance. This appears to be one of the general responses to anoxia, but was not related to stress tolerance. Liu et al. (1991) suggested that increased alcohol fermentation was a temporary adaptation and a major cause of root injury during flooding, and that flooding tolerance was related to low ethanol fermentation. However, in contrast to our findings Sachs (1993) analyzed excess moisture tolerance in maize and found that increased ADH-activity was apparent within 90 min and reached its highest level after approximately 5 hrs of the anoxia treatment. Sachs concluded that variation in the stress tolerance was related to ADH-activity. Relationship between grain yield and ASI in the present study was in agreement with previous reports for maize under waterlogging conditions (Rathore et al., 1996), and drought (Du Plessis and Dijkhuis, 1967; Edmeades and Daynard, 1979). This relationship could be ubiquitous in maize under different abiotic stresses that affects current
88

photosynthesis. Poor availability of photo-assimilates is one of the key factors causing barrenness in maize under abiotic stresses (Westgate and Boyer, 1986). Availability of stem reserve at this critical stage and its remobilization towards cob formation might promote early silk emergence and ear development. On the other hand, since hypoxia/anoxia is the main constraint under excess moisture stress, increased brace root development might play a key role to overcome the plant from oxygen stress and in this way indirectly facilitate assimilate synthesis and remobilization towards reproductive development. For most traits studied, including grain yield, heritability was higher under normal moisture as compared to excess moisture conditions (Table 8), with exception of ears per plant, nodes bearing brace roots, brace root fresh weight and root porosity, where the trend was opposite. Broad-sense heritability for grain yield showed a general tendency to decrease under stress conditions. Heritability for kernels per plant and test weight also declined by 0.13 and 0.17 under excess moisture conditions. On the other hand, heritability for ears per plant increased under the stress. Heritability for flowering parameters also showed declining trends under the stress. There was significant increase in the heritability for number of nodes bearing brace roots, brace root fresh weight and root porosity under excess moisture. Heritability for leaf senescence, leaf area, total stem carbohydrate and rate of transpiration declined under excess moisture conditions. Maximum heritability under excess moisture regimes was found in nodes bearing brace roots, root porosity, and brace root fresh weight. Selection index for excessive moisture stress. A selection index summarizes the worth of genotype by making use of information from important secondary traits along with yield (Banziger et al., 2000). For excessive moisture stress we have used the software developed by CIMMYT that calculate such a selection index (ALPHA) using MSTAT data files (CIMMYT, 1999). AGROBASE® is another program that can also be used for this purpose. Higher weight is assigned to final grain yield. For other traits, weight is assigned on the basis of their relative importance in excessive moisture tolerance, genetic and phenotypic correlation with yield and broad sense heritability, as follows:
Traits Weight Sign Grain yield 5 +
Ears per plant 3 +
Root porosity 2 +
Brace root 2 +
Anthesis-silking interval 2 -
Senescence 1 -
As in case of drought and low-N tolerance (Banziger et al., 2000), plant height and days to 50% anthesis is used in selection index for selection of tolerant genotypes to excessive
89

moisture stress in order to avoid the taller plant height and early or delayed maturity, respectively in the selected fraction of entries. However, the final selection of entries is done on the basis of their performance across the regimes of moisture availability, in order to assure that the selected genotypes have good yield potential under optimal moisture conditions as well. This is done by comparing the ranks (index value) of genotypes in the two moisture regimes (normal and excessive moisture). The entries having relatively higher ranks in both the conditions is selected and used in excessive moisture stress breeding program.
90

References Banziger, M., Edmeades, G.O., Beck, D., Bellon, M., 2000. Breeding for drought and
nitrogen stress tolerance in maize: From theory to practice. CIMMYT, Mexico, D.F.
Banziger, M., Lafitte, H.R., 1997. Efficiency of secondary traits for improving maize for
low-nitrogen target environments. Crop Sci. 37, 482-485. Blum, A., 1983. In. Plant production and management under drought stress. J.F. Stone
and W.O. Willis (eds.). pp. 195-205, Elsevier, Amsterdam. CIMMYT Maize Program 1999. A user’s manual for field book 5.1/7.1 and ALPHA.
Mexico, D.F.: CIMMYT. DMR, 2001. 49th Annual Maize Workshop, Directorate of Maize Research (DMR), held
at C.S. Azad University of Agriculture & Technology, Kanpur (U.P.), India, 5-9 April 2001.
Drew, M.C., Jackson, M.B., Giffard, S., 1979. Ethylene-promoted adventitious rooting
and development of cortical air spaces (aerenchyma) in roots may be adaptive response to flooding in Zea mays L. Planta 147, 83-88.
DuPlessis, D.P., Dijkhuis, F.J.,1967. The influence of time lag between pollen shedding
and silking on the yield of maize. S. Africa J. Agric. Sci. 10, 667-674. Edmeades, G.O., Bolanos, J., Banziger, M., Ribut, J.-M., White, J.W., Raynolds, M.P.,
Lafitte, H.R., 1998. Improving crop yields in tropics. In. Crop productivity and sustainability – shaping the future. V.L. Chopra, R.B. Singh and A. Verma (eds.). Proceeding – 2nd ICSC, 437-451. New Delhi: Oxford & IBH.
Edmeades, G.O., Daynard, T.B., 1979. The development of plant-to-plant variability in
maize at different planting densities. Can. J. Plant Sci. 59, 561-576. Evans, R.O., Skaggs, R.W., Sneed, R.E., 1990. Normalized crop susceptibility for corn
and soybean to excess water stress. Trans. of the ASAE 33, 1153-1161. Kennedy, R.A., Rumpho, M.E., Fox, T. C., 1992. Anaerobic metabolism in plants. Plant
Physiol. 100, 1-6. Khera, A.S., Dhillon, B.S., Saxena, V.K., Barar, H.S., Malhi, N.S., 1990. Genetic and
physiological studies in maize on tolerance to stress caused by waterlogged conditions . Ad-hoc project, ICAR, New Delhi, India.
91

Liu, X.Z., Wang, Z.L., Gao, Y.Z., 1991. The relationship between alcohol dehydrogenase and flooding tolerance in maize roots under waterlogging stress. Jiangsu J. Agric. Sci. 7, 1-5.
Ludlow, M.M., Muchow, R.C., 1990. A critical evaluation of traits for improving cro
yields in water-limited environments. Adv. Agron. 43, 107-153. MSTAT-C, 1990. A microcomputer program for the design, management and analysis of
agronomic experiments. Crop and Soil Science Dept., Michigan State Univ., East Lansing, MI.
Muchow, R.C., Sinclair, T.R., 1986. Field Crop Res., 15, 143-156. Mukhtar, S., Bakler, J.L., Kanwar, R.S., 1990. Corn growth as affected by excess soil
water. Trans. of the ASAE 33, 437-442. O’Toole, J.C., Bland, W.L., 1988. Adv. Agron. 41, 91-145. Palvadi, H.K., Lal, B., 1976. Note on susceptibility of maize to waterlogging at different
growth stages. Pantnagar J. Res. 1, 141-142. Porto, M.P., 1997. Method of selection for tolerance to soil waterlogging in maize plants.
Pesq. Agrop. Gaucha 3, 187-190. Rathore, T.R., Warsi., M.Z.K., Lothrop, J.E., Singh N.N., 1996. Production of maize
under excess soil moisture (waterlogging) conditions. 1st Asian Regional maize Workshop, 10-12 Feb 1996, P.A.U., Ludhiana, pp. 56-63.
Rathore, T.R., Warsi., M.Z.K., Singh N.N. and Vasal, S.K. (1998). Production of maize
under excess soil moisture (waterlogging) conditions. 2nd Asian Regional Maize Workshop PCCARD, Los Banos, Philippines, Feb 23-27, 1998.
Rathore, T.R., Warsi., M.Z.K., Zaidi, P.H., Singh N.N., 1997. Waterlogging problem for
maize production in Asian region. TAMNET News Letter, 4, 13-14. Richards, R.A., 1988. In. Drought tolerance in winter cereals. J. Srivasatava, E.
Portceddu, E. Acevedo, S. Barma (eds.). pp. 133-149. Wiley, Chicester, England. Sachs, M.M. 1993. Molecular genetic basis of metabolic adaptation to anoxia in maize
and its possible utility for improving tolerance of crops to soil waterlogging. In. Jackson M.B., Black C.R., Eds. Interacting stresses on plants in a changing environment, NATO ASI series, Vol-I 16, Berlin: Springer-Verlag, p. 375-393.
Sinclair, T.R., Muchow, R.C., Ludlow, M.M., Leach, G.J., lawn, R.J., Foale, M.A., 1987.
Field Crop res. 17, 121-140.
92

Singh, R., Ghildyal, B.P., 1980. Soil submergence effects on nutrient uptake, growth, and yield of five corn cultivars. Agron. J. 72, 737-741.
Torbert, H.A., Hoeft, R.G., Vanden-Heuvel, R.M., Mulvaney, R.L., Hollinger, S.E.,
1993. Short-term excess water impact on corn yield and nitrogen recovery. J. Prod. Agric. 6, 337-344.
Westgate, J.W., Boyer, J.S., 1986. Reproduction at low silk and pollen water potential in
maize. Crop Sci. 26, 951-956. Zaidi, P.H., Rafique, S., Singh, N.N., 2003. Response of maize (Zea mays L .) genotypes
to excess moisture stress : morpho – physiological effects and basis of tolerance Eur J. Agron. 19, 383-399.
Zaidi, P.H., Rafique, S., Singh, N.N., Srinivasan, G., 2002. Excess moisture tolerance in
maize – progress and challenges. Proceeding- 8th Asian Regional Maize Workshop, 5-9 August 2002, Bangkok, Thailand. (in press).
Zaidi, P.H., Singh N.N., 2001. Effect of water logging on growth, biochemical
compositions and reproduction in maize. J. Plant Biol. 28,61-69. Zaidi, P.H., Singh, N.N., 2002. Identification of morpho-physiological traits for excess
soil moisture tolerance in maize. In. Stress and Environmental Physiology. Eds. K.K. Bora, Karan Singh and Arvind Kumar, Scientific publishers, Jodhpur, India, pp. 172-183.
93

0
0.25
0.5
0.75
1
Total dry wt. Yield
V2 stage V7 stage VT stage R3 stage
Cr o
p Su
s cep
t ibi
lity
I nde
x
Fig. 1 : Crop susceptibility index for maize under excess soil moisture conditions. Figures in parentheses are standard deviations (±).
(0.11)
(0.09)
(0.06)
(0.10)
(0.04)
(0.09)
(0.12)
(0.14)
94

Disposable cup (250 cm3) Plastic tray (50 x 30 x 10 cm)
Fig. 2: Accessories required in “cup method” of screening of maize germplasm for excessive moisture tolerance.
95

Selected tolerant plants
Fig. 3 : “Cup method” – a novel technique for preliminary screening maize germplasm tolerant to excessive moisture stress.
96

0
5
10
15
20
25
30
NM W WW
HTL TL MTL SUS HSUS
Roo
t por
osit y
(%
)
L.S.D. G =1.02*E = 2.32*G x E = ns
Moisture conditions
0
20
40
60
80
100
120
NM W WWMoisture conditions
Bra
ce ro
ot F
W (g
pl- 1
)
L.S.D. G =4.62*E = 7.26*G x E = 10.22**
Fig.4 : Means of root traits observed after excess moisture stress at V6-V7 stage for different categories of genotypes.
*, ** indicate significant differences at P<0.01 and <0.05, respectively; G= category of genotypes, E= growing conditions.
NM = normal moisture, W = direct planting, excess moisture at V6-V7 stage, WW = transplanting, excess moisture at germination and early growth stage and V6-V7 stage, HTL = highly tolerant, TL = tolerant, MTL = moderatelytolerant, SUS = susceptible and HSUS = highly susceptible
97

y = 0.304Ln(x) - 0.8783R2 = 0.8509**
0
0.25
0.5
0 40 80 120
Brace root (FW g plant-1)
0
0.25
0.5
0 100 200 300 400
NAD+- alcohol dehydrogenase activity
y = 0 .0 0 2 9x2 - 0 .10 65x + 0 .8 6R2 = 0 .8 711**
-0.20
0.05
0.30
0.55
0.80
0 10 20 30
Anthesis-silking interval (d)
Gra
in y
ield
(kg
plot
-1)
Gra
in y
ield
( kg
p lot
-1)
y = 0.0008x2 + 0.0045x - 0.0183R2 = 0.9134**
0
0.25
0.5
0 5 10 15 20 25Root porosity (%)
Non-significant
Fig. 5: Grain yield as a function of mean anthesis-silking interval, root porosity, fresh weight of brace roots plant-1 and NAD+-alcohol dehydrogenase activity in maize genotypes exposed to excess moisture (W) stress under field conditions at V6-V7 stage.
** indicates statistical significance at P<0.01.98

Table-1: Waterlogging treatments at different developmental stages and days after sowing (DAS) for a field trial of 52 tropical/sub-tropical genotypes at New Delhi, India.
Waterlogging duration (DAS) Physiological stages Crop stage Start Stop
1. V2 stage
2. V7 stage
3. VT stage
4. R1 stage
Early vegetative stage
Knee – high stage
Tasseling stage
Milk -stage
10
30
60
90
19
39
69
99
99
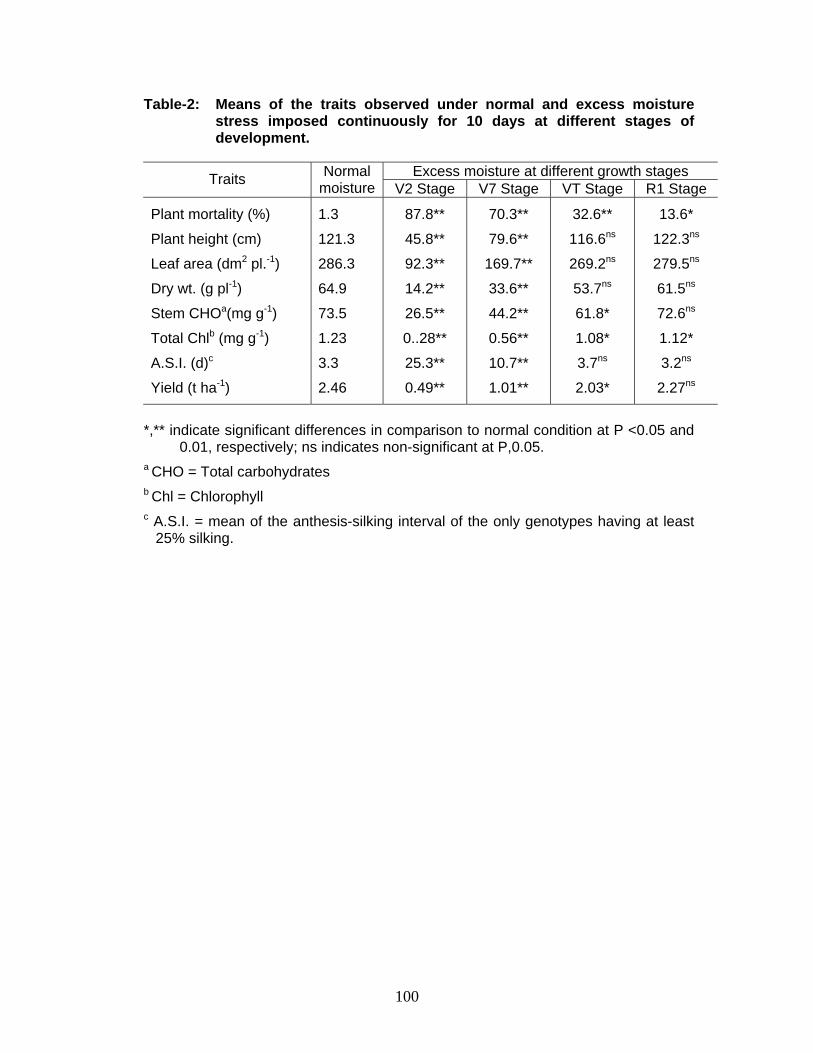
Table-2: Means of the traits observed under normal and excess moisture stress imposed continuously for 10 days at different stages of development.
Excess moisture at different growth stages Traits Normal moisture V2 Stage V7 Stage VT Stage R1 Stage
Plant mortality (%)
Plant height (cm)
Leaf area (dm2 pl.-1)
Dry wt. (g pl-1)
Stem CHOa(mg g-1)
Total Chlb (mg g-1)
A.S.I. (d)c
Yield (t ha-1)
1.3
121.3
286.3
64.9
73.5
1.23
3.3
2.46
87.8**
45.8**
92.3**
14.2**
26.5**
0..28**
25.3**
0.49**
70.3**
79.6**
169.7**
33.6**
44.2**
0.56**
10.7**
1.01**
32.6**
116.6ns
269.2ns
53.7ns
61.8*
1.08*
3.7ns
2.03*
13.6*
122.3ns
279.5ns
61.5ns
72.6ns
1.12*
3.2ns
2.27ns
*,** indicate significant differences in comparison to normal condition at P <0.05 and
0.01, respectively; ns indicates non-significant at P,0.05. a CHO = Total carbohydratesb Chl = Chlorophyll
c A.S.I. = mean of the anthesis-silking interval of the only genotypes having at least 25% silking.
100

Table-3: Frequency distribution of tolerant and susceptible genotypes identified under excess soil moisture treatments imposed on 52 tropical/sub-tropical genotypes at various developmental stages at New Delhi, India.
Developmental stages No. of genotypes V2 Stage V7 Stage VT Stage R1 Stage
4
8
36
2
2
S
S
S
S
T
S
S
S
T
T
S
S
T
T
T
S
T
T
T
T
Total susceptible genotypes 50 48 12 4
S=susceptible, T=tolerant
101

Table 4. Means and standard deviations (±) of various morpho-physiological traits for different categories of genotypes under normal and excess soil moisture conditions at germination and early growth stage during ‘cup screening’.
Categories HTL TL MTL SUS HSUS
L.S.D.
Environment a/ Parameters
NM EM NM EM NM EM NM EM NM EM
Germination (%) 100+0.0 88.5+9.3 100+0.0 64.3+9.2 100+0.0 39.6+8.7 100+0.0 18.4+6.2 100+0.0 5.2+3.3 7.84**
Survival (%) 100+0.0 100+0.0 100+0.0 100+0.0 100+0.0 96.2+3.3 100+0.0 28.3+11.2 100+0.0 10.2+9.6 5.62ns
Shoot DW (g pl.-1) 0.64+0.05 0.60+0.08 0.65+0.11 0.45+0.09 0.63+0.03 0.37+0.03 0.64+0.10 0.22+0.05 - - 0.049*
Root DW (g pl.-1) 0.30+0.03 0.36+0.04 0.31+0.04 0.34+0.03 0.28+0.02 0.14+0.07 0.29+0.03 0.10+0.02 - - 0.023**
No. of advt. roots 7.5+1.3 21.3+2.5 6.8+1.7 17.5+4.4 7.7+2.2 11.2+5.4 6.2+3.5 3.2+1.3 - - 1.32**
Chl. ‘a’ (mg g-1) 0.44+0.08 0.38+0.07 0.42+0.04 0.29+0.09 0.45+0.10 0.22+0.06 0.39+0.03 0.10+0.06 - - 0.044*
Chl. ‘b’ (mg g-1) 0.26+0.03 0.19+0.02 0.24+0.05 0.14+0.05 0.24+0.08 0.10+0.04 0.26+0.06 0.07+0.03 - - 0.021**
Total CHO(mg g-1 FW)
48.6+5.3 37.0+5.3 49.5+4.9 26.7+3.8 39.8+7.3 19.7+6.6 36.7+8.9 11.5+8.2 - - 2.83*
*,** indicate significant differences due to growing conditions at P<0.05 and <0.01, respectively; ns indicate non-significant at P<0.05. a NM = normal moisture, EM = excess moisture, HTL= Highly tolerant, TL = Tolerant, MTL = Moderately tolerant, SUS = susceptible and
HSUS = Highly susceptible, Chl = Chlorophyll ‘a’ and ‘b’ concentrations, CHO = total carbohydrate concentration
102

Table 5: Performance of maize inbred lines and local accessions under different regimes of excessive moisture stress during cup and field screening at New Delhi, India.
Categories
Cup screening
Field screening
(WW)*
Field screening
(W)*
Genotypes
Highly tolerant (HTL)
Tolerant (TL)
Moderately tolerant (MTL)
Susceptible (SUS)
Highly susceptible (HSUS)
5
9
14
139
58
5
10
15
8
-c
5
9
16
132
63
CML- 327, CML- 425, CA 00106, CM-118 & CM-500
CML-228, CML-338, CML-427, CML-429, CA14707, CM-133, WL-18-1-2-6, WL-28-3-2-7, Jaunpur local-5, CM-501a
-b
-
-
Total genotypes screened 225 38 225
* W = direct planting, excess moisture at V7 stage, WW = transplanting of the plantlets
survived during cup screening a The entry showed excess moisture stress tolerance (TL) only under WW treatment b Details of the entries under the MTL, SUS, and HSUS categories is not mentioned c No transplanting
103

Table 6: Means of the traits observed under different moisture regimes in different categories of genotypes under field conditions. The categories were established by ‘cup screening’ and plants were later transplanted to the field at New Delhi, India.
Category of genotypesa Traits Moisture
condition HTL TL MTL SUS HSUS
LSD
Plant Mortality (%)
Leaf area (dm2 plant-1)
Dry weight (g plant-1)
Total Chl.c(mg g-1)
Stem CHO d (mg g-1 DW)
ADH-activity (units mg-1 protein)
A.S.I (days)
Grain yield (t ha-1)
NM
W
WW
NM
W
WW
NM
W
WW
NM
W
WW
NM
W
WW
NM
W
WW
NM
W
WW
NM
W
WW
0.0
7.8
5.9
286.3
210.3
221.6
48.9
43.1
44.2
1.12
0.92
0.98
70.2
58.6
61.2
37.3
155.3
145.6
3.6
4.3
4.1
2.86
1.63
1.71
0.0
25.6
23.7
301.2
198.3
204.1
51.2
35.2
37.1
1.16
0.85
0.88
71.6
72.3
48.5
32.6
165.4
156.2
3.4
5.7
4.6
2.91
1.03
1.21
0.0
46.5
40.2
282.1
142.3
150.1
50.2
26.3
28.2
1.14
0.56
0.65
64.2
32.3
36.8
38.4
168.8
170.2
4.2
8.7
7.3
2.79
0.89
0.97
0.0
80.8
76.9
292.2
122.2
131.3
50.2
14.3
17.5
1.12
0.42
0.42
52.6
15.2
21.3
32.5
210.5
200.3
3.7
18.7
15.4
2.12
0.42
0.58
0.0
93.2
-b
287.2
80.2
-
51.4
9.5
-
1.15
2.22
-
48.2
10.7
-
34.6
208.1
-
3.5
25.3
-
2.39
0.16
-
6.82*
21.3*
8.27**
0.15*
3.52**
14.5**
1.23**
0.23**
a NM = normal moisture, W = direct planting, excess moisture at V7 stage, WW = transplanting, excess moisture at germination and early growth stage and V7 stage, HTL = highly tolerant, TL = tolerant, MTL = moderately tolerant, SUS = susceptible and HSUS = highly susceptible.
b No transplanting because of poor seedling survival at early stage screening c Chl = Chlorophyll d CHO = Total carbohydrates
*,** indicate significant differences due to growing conditions at P<0.05 and 0.01, respectively.
104

Table 7. Genetic and phenotypic correlations between different secondary traits and grain yield in tropical/subtropical inbred lines under normal (NM) and excessive moisture (EM) conditions.
Genetic correlation (rg) Phenotypic correlation (rp) Traits
NM EM NM EM Ears per plant Kernels per plant Test weight Days to 50% silking Anthesis-silking interval Brace root fresh wt. Leaf senescence Leaf area* Root porosity*
0.61
0.69
0.26
-0.49
-0.52
0.22
-0.16
0.35
0.18
0.76
0.64
0.18
-0.56
-0.64
0.71
-0.23
0.28
0.74
0.44
0.72
0.86
-0.28
-0.33
0.32
-0.18
0.38 -
0.68
0.53
0.88
-0.38
-0.49
0.79
-0.14
0.26 -
* Calculated on the basis of data obtained from selected fraction of genotypes.
105

Table-8: Broad-sense heritability for grain yield and various secondary traits in tropical/subtropical lines under normal and excess soil moisture stress.
Traits Normal moisture Excess moisture
Grain yield Ears per plant Kernels per plant Test weight Days to 50% silking Anthesis-silking interval Brace root FW Leaf senescence score Leaf area* Root porosity *
0.61 (0.04)
0.42 (0.10)
0.65 (0.04)
0.69 (0.06)
0.61 (0.08)
0.65 (0.09)
0.34 (0.08)
0.46 (0.10)
0.53 (0.08)
0.22 (0.10)
0.39 (0.12)
0.49 (0.08)
0.52 (0.07)
0.52 (0.06)
0.36 (0.12)
0.54 (0.10)
0.66 (0.07)
0.44 (0.09)
0.41 (0.08)
0.69 (0.09)
* Calculated on the basis of data obtained from selected genotypes.
106

Breeding Strategies for Excessive Moisture Tolerance in Maize (Zea may L.)
M.Z.K.Warsi Department of Genetics and Plant Breeding, College of Agriculture. G.B. Pant Univ. of Agriculture & Technology, Pantnagar-263145, Uttaranchal, India
Introduction Excessive soil moisture conditions caused by temporary flooding or waterlogging prevail in most of the Southeast Asian countries where maize is cultivated. This condition arises either from poor soil drainage following irrigation, heavy rains or from a raising water table from adjacent areas or from structural breakdown of soil due to excess field preparations. Another reason for excessive soil moisture could be related to planting of maize in poorly drained paddy fields after a rainy season rice crop, which is a very common practice in Southeast Asian countries notably, Thailand, Japan and East China. The stress is highly unpredictable and can occur at any stage of crop growth. Intensity and duration of the stress may also vary from year-to-year and from one location to another. The extent of damage from excess soil moisture, however, depends on a number of factors, including duration of waterlogging, soil type, crop growth stage, cloudiness and intensity of sunlight, and of course tolerance of different maize genotypes to this stress. It has been observed that the magnitude of losses is higher when maize plants are flooded at early growth stage (Mukhtar et al., 1990; Evan et al., 1990; Loaiza and Ramirez, 1993; Rathore et al., 1996). Although the stress at flowering may also restrict normal pollination behavior and seed setting, but reduction in root growth, nutrient absorption and net assimilation rate are most marked when flooding occurs in early growth stage. Hence early stage excess soil moisture stress has been found more injurious compared to later stages stress (Gupta et al., 1992; Wu- Biingchyl et al., 1994, Sharma, 1994; Sachs et al., 1996). Effects of Excessive Soil Moisture on Crop Environment A. On root growth Development of profuse adventitious root system from the base of the plant and formation of more gas spaces in the roots has been observed under excessive soil moisture conditions. In some cases adventitious roots developed even from several nodes of the stem, which provide mechanical support to the plant under wet and loose soil condition. The tips of these roots are normally white, flaccid and swollen, and found floating on water surface to supplement the oxygen demand of the roots. Waterlogging also increases root porosity. B. On plant growth Reduction in growth, yellowing of leaves (chlorosis), senescence, delayed silking and maturity is the common symptoms of excessive moisture stress. Reduction in plant height and grain yield, and sometimes eventual death of plants are of common occurrence under
107

excessive soil moisture conditions. Further flooding a maize plant in the early vegetative and reproductive stages was observed to be harmful to the growth and development than flooding at later stages.
Responses of Maize Cultivars to Excessive Soil Moisture Conditions Several methods have been employed to evaluate plant responses to excessive soil moisture. These methods range from measurement of the effect of excessive soil moisture on crop growth (Howell and Hier, 1974; Jackson et al., 1981) to more sophisticated measurement of oxygen diffusion rates (Chaudhury et al., 1975) or transpiration rates (Wenkert et al., 1981). In general crop yield is a useful measure of crop responses to waterlogging. Reductions of varying magnitudes have been reported on maize yields in various studies as a response to excessive soil moisture. Variable responses have also been observed of varying degrees at different crop growth stages. High temperatures reached on clear sunny days may influence yield reductions caused by excessive soil moisture. In clear sunny weather the rate of water absorptions by roots (partially influenced by hot water) lags behind the rate of transpiration by leaves. This results in midday closure of stomata and ultimately increases the heat load at the leaf surface and causes wilting of plants. Further, with a rise in inundated water temperature, solubility of oxygen in water also decreases. Thus, the lack of oxygen and consequently the reduced metabolic absorption of water cause rapid water deficit as well as a rise in leaf temperature, which may be responsible for rapid wilting of plants under excess soil moisture conditions. Breeding Strategies
The ultimate aim of breeding programme is to evolve superior genotypes and the measure of superiority is often taken in terms of yield. According to Whitehouse (1958) there may not be gene(s) for yield per se but for their components, the multiplicative interactions of which results in the ultimate yield. Breeding varieties or hybrids having tolerant to various stresses is bit different from normal breeding methods in the sense that additional characteristics other than yield are desirable in the tolerant varieties or hybrids. Breeders always try to accumulate genes conferring tolerance/resistance to a particular abiotic stress in the variety or hybrid. Choice of particular breeding method to be deployed depends upon various factors, including the nature of tolerance/resistance of the concerned stress, selection environment, stress levels and the type of product required, whether hybrid or variety. Alike other abiotic stresses, excess soil moisture tolerance in maize seems to be complex in nature. No systematic information is so far available regarding the inheritance pattern of excess soil moisture tolerance in maize. However, inheritance studies conducted by Khera et al. (1990) showed that tolerance to excess soil moisture was genetically controlled and both additive and non-additive gene actions were important. They observed good correlations between grain yield and number of green leaves, ear length and adventitious root development under stress conditions. They suggested that these characters could be used in a selection index to screen maize genotypes for excess soil moisture stress tolerance. Hossain (2001) worked out the general and specific combining ability effects for different yield components under normal and waterlogging conditions. It was observed that significant differences existed among the parents and crosses for all
108

characters. Variances due to GCA were found to be higher than SCA for all the characters, except days to 50% silking, under normal conditions, whereas under waterlogged conditions variances due to GCA were higher than SCA. Traits Identified for Excessive Soil Moisture Tolerance The most typical of the morphological traits for excessive soil moisture tolerance seems to be the development of adventitious roots. Maturity duration has also been observed as an important trait. From the experimental findings it could be established that early maturing germplasm by virtue of their fast root growth and plant establishment habit are by and large more tolerant to the excessive soil moisture stress, which is relatively more injurious to early growth stages. Anthesis–silking interval (ASI) may also be used as selection criterion. Most of the tolerant genotypes, in general, have been observed to have less than 5 days ASI. The length of the internodes could also be used while selecting for tolerance. An interesting observation was that tolerant inbred/hybrids possessed dark orange kernel color. It has yet to be established if this could be used as marker trait. Over and above the yield potential of a particular genotypes under normal and stress conditions with minimum reduction in yield in stress should be foremost priority in selecting for excess soil moisture tolerance. Breeding Approaches The choice of breeding approaches depends upon the mode of gene action conditioning tolerance/resistance and the sources of resistance available with regard to a particular abiotic stress. The choice of germplasm is extremely important. Generally high performing maize populations with sufficient genetic variation for the trait are selected. Germplasm having some level of tolerance/resistance for the stress trait should be preferred over others. Other aspects worth considering may be inbreeding effects, heterotic behavior in crosses with other populations especially if both OPV and hybrid goals are to be accomplished. New populations and synthetics can also be formed provided materials have been previously screened for tolerance to such traits. Vasal et al., (1998) categorized the breeding methodologies for the abiotic stress tolerance in the four broad groups namely: 1. Direct strategies 2. Indirect strategies 3. Alternate Strategies 4. Comprehensive integrated strategies Direct strategies: This methodology involves evaluation and selection under specific stress environment for the improvement of source population using recurrent selection procedure.
Indirect strategies: In this case, evaluation and identification of maize germplasm is done for the concerned stress for which these germplasm have not been previously selected. This involves evaluation of potentially useful germplasm, OPVs, hybrids and inbred lines
109

for excessive soil moisture tolerance. Alternate strategies: Tools like high plant density and inbreeding are used in building up tolerance to abiotic stresses. Inbreeding influences ASI. Also manifestation is increased with continued inbreeding. Selfed progenies have improved heritability. High plant densities also influence ASI. Comprehensive integrated strategies: The specific stress can be further augmented by imposing other stresses, such as high density. A combination of specific stress with other stress could turn out to be a useful strategy. There are various breeding alternatives. Within intra-population improvement schemes there are several options, which involve selection among individual plants or families, which could be non-inbred, or selfed progenies. The evaluation of families may be per se or in test-cross. Intra-population breeding alternatives are listed in Table 1. These include simple mass selection, stratified mass selection, half-sib family selection, full sib family selection, Sl selection, S2 selection, S3 selection etc. In Inter-population alternatives half-sib reciprocal recurrent selection, modified half-sib reciprocal recurrent selection and full-sib reciprocal recurrent selection are worth mentioning. Development of Excess Soil Moisture Tolerant Cultivars When breeding programme for excess soil moisture tolerance was initiated the immediate need was to have a source population, which could be used as the reservoir of genes for stress tolerance. With this objective, two waterlogging tolerant pools were synthesized, one each in yellow and white kernel color (Table 2). The tolerant germplasm were selfed and equal numbers of seeds from each tolerant germplasm were recombined. The genetic bases of these pools were narrow, that way, we always kept in mind that the pools by virtue of their nature are open ended. In order to broaden the base of these pools time-to-time tolerant germplasm have been identified through they have yet to be introgressed. The next step was the improvement of pools for their performance. Modified S1 - recurrent selection was used to improve these pools. The modified way of using S1- recurrent selection was to cross the S1s with two inbreds testers in each kernel color. Thus selfs developed in yellow pool were crossed with two inbred lines namely Tarun ⊗41-1-2-1⊗⊗⊗ and D831⊗39-2-1-1⊗⊗⊗ and selfs developed in white pool were crossed with CM 400 and CM 600. On the basis of test cross performance the selfs were selected and recombined. The elite selfs were also further selfed in order to develop the inbred lines. Later the breeding methodology was changed from S1- recurrent selection to S3- recurrent selection. The reason being that S3- recurrent selection has an edge over S1 recurrent selection in the way that elite selfs could be quickly used for the development of advanced generation inbred lines. Besides two excess soil moisture tolerant pools, two tolerant synthetics were also develop4d following chain crossing and bulking of seed from each cross. The components of these synthetics were supplied by CIMMYT-ARMP, Bangkok (Table3). Random mating of two cycles was allowed before putting these synthetics in use. In the year 1997 the breeding strategy was further reviewed. Accordingly a large number of inbred lines
110

collected from CIMMYT and Indian Maize programme were screened with the aim to identify the tolerant inbred lines to be used in future tolerant hybrid development programme. On the basis of continuous screening for three consecutive seasons, fourteen inbred lines and waterlogging tolerant synthetics were finally selected for screening (Tripathi, 2000). These genotypes were grown under normal and excess soil moisture conditions (Table 4 and 5). It was observed that intensity of stem pigmentation was more in case of tolerant genotypes but immediate response of maize to waterlogging was the development of extensive adventitious root system from several nodes of stem (4-5 nodes). Further, grain yield was also reduced by 38.9percent under stress condition. The reduction in yield was attributed by lower plant height, ear height, smaller cob length and diameter and low value of transpiration rate.
Development of Stress Tolerant Hybrids On the basis of results obtained from screening of inbred lines in the studies mentioned earlier. Eleven tolerant inbred lines (4 lines from early and 7 from medium maturity group) were finally selected for the development of tolerant hybrids. These include CM500, CML-32 rob 98 Tsr, CM-132, CML-3l, Pob27, CM 124, CML294, CompA6⊗ 1-90-31-1-1, CompA6 ⊗ 1-90-31-2-1-1, CM121 and CM125. A complete detail of all these lines was attempted and the resultant hybrids have been evaluated for yield and excess soil moisture tolerance (Table 6). The promising hybrids has been identified and marked in Table 6 (Hossain, 2001).
111

Table la: Choosing among intra-population alternatives. Individual plant selection
• Simple mass selection • Stratified mass selection
Important features • Simple • One or more cycles/year • Pre-flowering stress • Density • Field execution at flowering • other test sites not required
Family – based selection (per se)
• Half – sib (many variations) • Full – sib (2 seasons/cycle) • S1 ( 3 or 4 seasons/ cycle)
Availability of off seasons, test sites, seed storage facilities, emphasis on variety, hybrids or both, selection trait, heritability, seed quantities, parental control on both sexes.
Family based selection (test crosses) • S0 testcrosses (3 seasons/year) • S1 testcrosses (3 seasons/year) • S2 testcrosses (4 seasons/year)
Emphasis on combining ability, hybrid approach, hybrid oriented, integrating population improvement and hybrid research, identifying superior early generation lines
112

Table 1b: Inter-population alternatives.
• Reciprocal recurrent selection – Half – sib (RRS – HS)
• Modified RRS – HS
• Reciprocal recurrent selection – Full sib (RRS – FS)
• Modified RRS – FS
Dual purpose, emphasis on hybrid, hybrid oriented, integration population and hybrid, extraction of good GCA early generation lines, early generation lines, superior testers on continuous basis, future contemplated hybrids.
113

Table 2: Yield of white and yellow pool components under normal and waterlogged conditions at Pantnagar, India.
Grain Yield (kg/ha)
Pool
Components
Normal Waterlogging
Reduction in
grain yield (%) White Yellow
LW-DMR C6 EW-DMR C6 EW-DMR C7 EEW-DMR Cali White D 822 TEY Drought tol. Syn. POP 31 C5 EY-DMR C5 POP 28 C 17 Viemyt 49 (Y) EEY-DMR DY-DMR C6 La Posta Sequia “best all” Cali Yellow
5650 5120 4850 5130 5460 2700
2730 4639 4530 5092 2800 4000 4630 4070 3380
4520 3970 3630 3560 2380 1823
2160 3920 4560 4180 2500 1880 3590 2300 3040
20 23 27 36 50 32
21 15 21 18 34 53 23 43 8
114

Table 3: The germplasm involved in waterlogging tolerant yellow and white synthetics developed at Pantnagar.
A. Components of yellow synthetics, Syn. (Y)
1. Ki44/Yunnan H2O TOL6 [WD}//LWDMR
2. LYDMR2/Yunnan H2O Tol. 7 [WF]
3. LYDMR/Yunnan H2O Tol. 9[WF]
4. Ki442/Yunnan H2O Tol. 9 [WF]
5. Ki442/Yunnan H2O Tol. 11 [WF]
6. LYDMR/Yunnan H2O Tol. 13 [WF]//Ki44
7. LYDMR/Yunnan H2O Tol.
8. 13 [WF]/0 LWDMR
9. Ki442/Yunnan H2O Tol. 15 [WF]
10. LYDMR//Ki44/Yunnan H2O Tol. 5[WSD]
B. Components of white synthetics, Syn. (W).
1. Yunnan H2O Tol. 2 [WD]/LWDMR2
2. Yunnan H2O Tol. 3 [WD]/LWDMR2
3. LWDMR/Yunnan H2O Tol.4 [WSD]
4. Ki44/Yunnan H2O Tol. 5 [WSD]
5. LWDMR2/Yunnan H2O Tol.2 [WSD]
6. Yunnan H2O Tol. 10 [WF]/LWDMR2
7. Ki21/Yunnan H2O Tol. 6 [WD]//LWDMR
8. Yunnan H2O Tol.11 [WF]/LYDMR/LWDMR
9. LWDMR2/Yunnan H2O Tol. 13 [WF]
115

116

Table 4. Mean performance of maize inbred lines and synthetic populations under normal (N) and waterlogged (W) conditions.
Days to 50%
tasselling
Days to 50%
silking
Stem
pigmentation
Nodes bearing
adventitious roots
Plant height (cm)
S. No.
Pedigree
N W N W N W N W N W
Kernel colour
1
2
3
4
5
6
7
8
9
10
11
12
13
14
15
16
CM 500
CML 31 POB 27
CML 32 POB 28 TSR
CM 132
CM 111
CM 124
POP 31(21-1-2-4-1-1-3-1- to 11#
CML 294
CompA6( 1-90-31-1-1
CompA6( 1-90-31-2-1
CM 121
CM 125
Lineas Prometadorous Process ⊗ 6-2-1-2
Lineas Prometadorus Process ⊗ 6-3-1-3
Syn-1 (Y)
Syn – 2 (W)
46.3
47.6
47.6
45.0
46.3
44.3
45.0
45.3
44.3
47.0
45.6
47.0
43.3
44.0
49.6
48.3
51.0
54.0
54.0
51.3
51.3
50.6
51.3
54.3
51.3
54.3
51.3
52.3
51.0
48.6
54.3
54.3
52.3
54.3
54.0
53.3
54.3
51.6
50.3
54.3
53.0
53.0
53.0
53.6
48.3
49.6
53.6
55.6
56.3
58.0
58.3
58.0
58.3
55.0
56.6
59.0
55.0
56.0
57.0
56.0
55.3
56.0
58.3
58.0
1.0
1.0
2.6
3.3
1.3
1.0
1.0
1.6
1.0
1.3
1.3
1.3
1.0
2.0
2.0
2.3
3.3
2.6
3.6
3.6
3.3
3.0
2.0
4.0
4.3
4.3
3.3
3.3
3.0
4.0
4.0
5.0
1.6
2.3
2.0
2.3
1.6
1.6
1.0
2.6
2.6
3.0
2.0
2.0
2.3
2.6
2.0
3.3
2.0
3.0
2.3
3.0
2.6
2.3
2.0
2.0
4.0
3.3
2.6
2.3
2.6
3.0
2.6
3.0
236.60
260.40
230.83
255.33
258.93
232.80
175.80
253.10
263.80
250.70
218.26
227.76
218.83
223.60
238.00
272.00
169.40
173.54
158.87
179.73
180.20
183.13
105.40
186.13
190.60
191.53
188.33
187.73
172.40
182.26
208.27
197.93
Orange
-do-
-do-
-do-
-do-
-do-
-do-
-do-
-do-
-do-
-do-
-do-
-do-
-do-
Yellow
White
Grand Mean SEM CD at 1% CV %
46.06 0.874 3.398 3.285
52.25 0.972 3.780 3.222
52.79 0.572 2.225 1.877
59.96 2.225 2.158 1.687
1.58 0.350 1.362
38.316
3.56 0.335 1.304 16.31
2.21 0.300 1.169 23.57
2.69 0.243 0.947 15.69
238.92 5.443
21.168 3.946
178.47 7.399
28.777 7.181
117

Table 5. Performance of inbred lines under waterlogging conditions at Pantnagar, India. S. No.
Pedigree
Plant height
ASI (days)
Grain yield (kg/ha)
118

1 2 3 4 5 6 7 8 9 10 11 12 13 14 15 16 17 18 19 20 21 22 23 24 25 26 27 28 29
Tarun ( 36-1-1-1 Tarun ( 83-1-3-2 D741 ( 1-1-1-10-4-4 D 831 ( 41-1-2-1 Pop. 31 ( 18-2-1-1-4-2-3-1 to 19 Tarun ( 129-1-1-1-1-1-2 Pop. 31 ( 21-1-2-4-1-1-1-1/7 Pop.31 ( 21-1-2-4-1-1-5-1/3 Pop 31 ( 18-2-1-1-4-2-2-1/19 YHP Alm. ( 217-2-1-1-3-2-1 YHP Pant ( 45-1-2-3-1-6-2-4 YHP Alm. ( 85-4-3-2-3-3-7-1 YHP Pant ( 45-2-1-3-2-1-2-1 YHP Alm. ( 85-4-3-2-3-3-1-1-1 YHP Plant ( 45-2-1-3-2-2-5-3-2 YHP Plant ( 130-2-2-5-1-4-2-1 YHP Plant ( 135-1-2-2-1-3-4-1 YHP plant ( 161-1-4-1-2-1-2-1 YHP Alm. ( 85-4-3-2-3-3-7-1-2 YHP plant ( 134-2-3-2-5-5-4-1 YHP Alm. ( 217-2-1-1-3-2-1 Pop. 31 ( 23-1-1-1-1-1-2/3 # 4-2 to 5 # Pop. 31 ( 23 –1-1-1/2 # 2-2 to 6 # Pop. 31 ( 23-1-1-1-1-2-1/2 # 3-1 to 6 # Pop. 31 O 23-1-1-1-3-2-2 to 4 # 3-1 Pop. 31 ( 18-2-1-1-1-1-1-3-1 to 6 # 1-1 to 5 Pop. 31 ( 18-2-1-1-1-3-2-1 to 5 # 2-1 to 2 Pop. 31 ( 23-3-3-1-1-1-2-1/2 # 7-2 to 3 SARACURA
165 170 155 180 160 175 190 200 220 210 145 165 180 190 165 150 175 170 170 155 160 165 140 170 160 170 180 185 255
5 3 3 3 4 4 3 3 3 3 4 3 3 4 4 4 4 4 3 3 4 5 4 4 5 5 3 3 3
3687 1577 2109 3714 2120 1323 3183 3714 5280* 2646 526 1059 2373 3187 1331 1323 3191 528 1064 1056 800 266 799 1322 1591 799 3436 6875* 8154*
Continuous waterlogging for 6 days at knee-high stage.
119

Table 6. Relative performance of hybrids under normal (N) and waterlogging (W) conditions at Pantnagar, India.
Early Maturity Plant stand
(th./ha) Plant height
(cm) Ear height (cm)
Days to 50%
silking Grain Yield
(kg/ha) Plot No.
Pedigree
N W N W N W N W N W
Reduction in grain yield
(%)
1
2
3
4
5
6
CM 500 x CML 31 Pob 27
CM 500 x CML 32 Pob 28 TSR (S2)-11-2-4B-1ff-1
CM 500 x CM 132
CML 31 Pob 27 x CML 132 pob 28 TSR (S2)-1-11-2-4-B-1-ff-1
CML 31 Pob 27 x CM 132
CML 32 Pob 28 TSR (S2)-11-2-4-B-1-ff-1 x CM 132
62
60
61
66
61
65
57
59
59
61
56
61
207
224
221
201
217
228
193
210
208
195
205
213
91
97
105
81
100
106
90
95
102
80
93
100
57
57
55
57
56
56
58
58
58
58
58
58
3544
3370
3890
4490*
3596
4009*
2968
2734
3409
3460
2536
3456
16.2
18.8
12.3
22.9
29.4
13.7
Medium maturity
7
8
9
10
CM 111 x CM 124
CM 111 x Pop 31⊗ 21-1-2-4-1-1-3-1 to 11 #
CML 294 x CM 111 ⊗ 1-90-311-1
CML 111 x COMP. A6 ⊗ 1-90-31-1
64
66
66
64
60
59
52
61
210
215
206
224
209
205
200
211
96
97
93
104
95
89
88
100
59
56
57
58
60
57
59
59
4495*
4294*
3539
4376*
3341
3380
2887
3342
25.6
21.2
18.4
23.6
120

11
12
13
14
15
16
17
18
19
20
21
22
23
24
25
26
27
28
29
30
31
32
33
34
CML 111 x COMP. A6 ⊗ 1-90-31-2-1
CM 111 x CM 121
CM 111x CM 125
CM x Pop 31 ⊗ 21-1-2-4-1-1-3 to –11 #
CM 124 x CML 294
CM 124 x COMP. A6 ⊗ 1-90-31-1-1
CM 124 x COMP. A6 ⊗1-90-31-2-1
CM 124 x CM 121
CM 124 x CM 125
Pop 31 ⊗ 21-1-2-4-1-1-3-1- to 11 # x CML 294
Pop 31 ⊗ 21-1-2-4-1-1-3-1- to 11 # x COMP. A6 ⊗ 1-90-31-1-1
Pop 31 ⊗ 21-1-2-4-1-1-3-1- to 11 # x CML 294
Pop 31 ⊗ 21-1-2-4-1-1-3-1- to 11 # x CML 294
Pop 31 ⊗ 21-1-2-4-1-1-3-1- to 11 # x CML 294
CML-294 X COMP. A6 ⊗ 1-90-31-1-1
CML-294 X COMP. A6 ⊗ 1-90-31-2-1
CML-294 X CM 121
CML-294 X CM 125
COMP. A6 ⊗ 1-90-31-1-1 X COMP. A6 ⊗ 1-90-31-2-1
COMP. A6 ⊗ 1-90-31-1-1 X CM-121
COMP. A6 ⊗ 1-90-31-1-1 X CM-125
COMP. A6 ⊗ 1-90-31-2-1 X CM-121
COMP. A6 ⊗ 1-90-31-2-1 X CM-125
CM-121 X CM-125
56
59
64
66
55
64
63
64
66
59
62
66
65
66
59
66
66
66
66
66
66
58
62
66
55
63
60
61
55
62
56
58
54
57
61
62
57
55
51
54
59
60
62
56
58
56
55
59
232
197
229
203
209
231
198
193
200
225
217
219
203
221
230
230
209
233
234
227
219
238
237
224
230
188
222
195
207
222
182
188
198
215
210
215
203
208
222
215
196
218
228
218
215
227
233
210
100
85
102
83
97
103
95
86
89
99
94
99
88
93
108
92
101
110
115
96
93
114
147
99
99
83
96
82
93
95
95
82
83
95
93
97
88
88
107
88
90
105
112
97
87
103
110
93
56
58
56
56
57
57
56
57
59
55
56
57
58
55
57
56
58
56
57
58
58
56
55
57
58
58
57
58
58
57
57
59
59
56
58
57
58
58
58
58
59
58
58
59
59
57
58
57
3189
3086
4050
4570*
4347*
4822*
4285*
3844*
3070*
4355*
4285*
3670*
4113*
4718*
3776
3151
4164
4485*
3562
3092
3171
3637
4132
3799
2522
2303
3166
3550
3495
3605
3409
2973
2507
2970
3545
3434
2896
3603
2782
2235
3334
3265
2982
2096
2465
2770
3520
2951
20.9
25.3
21.8
22.3
19.5
29.3
20.4
22.6
18.3
31.8
19.1
6.4
29.5
23.6
26.3
29.0
19.9
27.2
16.2
32.2
22.2
23.8
14.8
22.3
121

122

Molecular Approaches for Improving Drought Tolerance in Tropical Maize B.M. Prasanna1 and J.–M. Ribaut2
1AMBIONET-India Lab, Division of Genetics, Indian Agricultural Research Institute, New Delhi, India; E-mail: [email protected]; 2Applied Biotechnology Center, CIMMYT, Mexico; E-mail: [email protected] Abstract Breeding for abiotic stress tolerance, particularly drought and nutrient availability, will play an increasingly important role for stabilizing and improving maize production and productivity. The complex genetic basis and the strong genotype x environment interactions are some of the major reasons for the slow progress in breeding for drought stress tolerance in tropical maize. Application of molecular technologies by researchers worldwide, particularly at CIMMYT, led to the first time localization and analyses of effects of loci affecting various morpho-physiological traits, root characteristics, and grain yield under drought stress conditions in tropical maize. AMBIONET (Asian Maize Biotechnology Network) provided the much-needed platform for researchers from China, India and Thailand to identify QTLs influencing drought stress tolerance under respective target environments. QTL information available for different crosses is being integrated by CIMMYT on the consensus map for drought stress toelrance, to identify genomic regions involved in the expression of the same trait or different target traits. The effort has already led to identification of some putative ‘universal drought QTLs’, for instance, one on chromosome 2, which could be valuable for marker-assisted selection (MAS) as well as for functional genomics. QTL information serves as a bridge between the data emerging from functional genomics and plant responses under drought stress, enabling identification and characterization of major pathways and candidate genes related to drought response and tolerance in tropical maize. A number of possible candidate genes mapping near the QTLs regulating important morpho-physiological traits and grain yield under drought stress in maize have already been identified. Changes in hormone, carbohydrate and water status are the current pathways being targeted to better understand the response of the maize plant under drought stress. Adopting a multidisciplinary approach combining breeding, physiology, and biotechnology is critical for a comprehensive understanding of how a plant responds to the drought stress. Effective screening techniques that focus on specific mechanisms of drought tolerance at sensitive stages of plant growth are essential for identifying useful tolerance mechanisms, and for mapping and isolating the underlying genes or major quantitative trait loci (QTLs). There is also a distinct need for identification, isolation and characterization of drought stress-related proteins and unraveling their functions. The lessons learnt in relation to breeding and biotechnology for drought stress tolerance, particularly in the last decade, clearly indicate that no single approach can be adequate or successful in tackling drought stress in crop plants. Judicious integration of various technological options in breeding for drought stress tolerance is the only viable option. The presentation shall provide a perspective of QTL mapping, MAS and functional genomics for drought stress tolerance in tropical maize.
123

Introduction Drought tolerance improvement is a major objective for the maize breeders in most of the developing countries. Under tropical conditions, drought together with the low fertility of soils represents the most important factor limiting maize production and productivity. The progress in developing maize cultivars with tolerance to drought stress has been largely constrained due to several factors, including poor understanding of the genetic machinery involved in tolerance, genotype x environment interactions and low heritability of the associated traits, besides the lack of efficient phenotypic assays for reliably screening and evaluating the potential of germplasm and breeding materials. Nevertheless, encouraging progress has been made in the recent decades with respect to genetic dissection of drought stress tolerance as well as development of maize germplasm and cultivars with varying levels of tolerance to water stress (Edmeades et al., 1998; Heisey and Edmeades, 1999). The potential for genetic enhancement with respect to drought stress tolerance, particularly in tropical maize growing countries in Asia and Africa, is still huge. Translation of this potential into a field reality warrants judicious utilization of all available options, including the modern molecular tools and the information generated through the genomic approaches. In maize, the period during pollination to early seed development is the most sensitive to water stress. Several studies have examined in detail components of stress response during the flowering stage of development. Anthesis-silking interval has emerged as one of the critical components influencing grain yield under water stress (Bolanos and Edmeades, 1996). The advent of DNA markers significantly expanded our understanding of the genetic circuitry underlying drought tolerance, particularly with respect to the quantitative trait loci (QTLs) controlling the key traits associated with drought tolerance and the interrelationships among these traits. Molecular Markers offer Powerful Tools for Genetic Dissection of Drought Tolerance A major limitation of the conventional quantitative genetic approach with respect to analysis of complex, quantitative traits, such as drought stress tolerance, is that it does not provide much information about the mechanisms and pathways involved in drought tolerance, nor does it identify and localize the multitude of genes involved in the control of the targeted trait. The discovery and utilization of an array of molecular markers in the last two decades has changed this scenario, by enabling researchers to identify, map, and transfer loci involved in the expression of the target trait(s) in a wide range of crop species. The first DNA markers, restriction fragment length polymorphisms (RFLPs), were widely used to construct linkage maps for several crop species, including maize, tomato and rice. During the 1990s, detection of an array of DNA markers based on the polymerase chain reaction (PCR) led to a new era in genetics. PCR-based DNA markers such as simple sequence repeats (SSRs), amplified fragment length polymorphisms (AFLPs), allele specific oligonucleotides, and single nucleotide polymorphism (SNPs), today offer a palette of powerful tools to analyze the plant genome (Liu, 2002). Maize has been at the forefront in the development and application of molecular markers in plant breeding. Despite the technological advances, genetic and molecular dissection of a complex trait like drought tolerance continues to a highly challenging endeavour, as it is not easily possible to define or measure drought tolerance with the same clarity or precision as in case of traits such as disease resistance, nor is it easy to manage experimental drought environments with a high level of control
124

and repeatability. Nevertheless, numerous studies on quantitative trait loci (QTL) mapping were carried out by different research groups for examining drought tolerance and related traits in maize. The first comprehensive analysis of quantitative trait loci (QTLs) determining the maize plant responses to drought stress was reported by Lebreton et al. (1995). This study led to mapping of QTLs for physiological traits associated with drought tolerance, namely stomatal conductance, ABA of different tissues, leaf water relations parameters, fluorescence, root pulling force, and nodal root number. Intensive research on drought tolerance in maize at CIMMYT led to the appreciation of the significance of reduced anthesis-silking interval (ASI) as one of the key traits associated with drought tolerance. This was further supported by QTL mapping experiments (Agrama and Moussa, 1996; Ribaut et al., 1996; Ribaut et al., 1997). These studies also provided for the first time an opportunity to analyze correspondence of QTL positions for ASI in different mapping populations. Four of the 5 QTLs for ASI detected by Agrama and Moussa (1996) appeared to map in the same chromosomal regions (chromosomes 1, 5, 6, 8) as those in Ribaut et al. (1996) who identified 6 QTL for this trait. In addition, Ribaut et al. (1997) identified two “stable” QTL for grain yield that coincided with QTL for kernel number per plot. Several mapping populations for analysis of drought tolerance were developed at CIMMYT, many being based on a drought tolerant line (Ac7643). To date, genetic dissection has been conducted in four different crosses, at different inbreeding levels (hybrids, F2:F3 families, and recombinant inbred lines (RILs), under different water regimes [well-watered (WW), intermediate stress (IS), and severe stress (SS) conditions) and in several different environments (Kenya, Mexico, and Zimbabwe) (Ribaut et al., 2002). Initial experiments focused on flowering parameters, plant and ear height, leaf size and number, and yield components (Ribaut et al., 1996; 1997a). Six QTLs were identified on chromosomes 1,2,5,6, 8 and 10 which together accounted for 47 per cent of the phenotypic variance (Ribaut et al., 1996). As all the morphological traits, including yield, are complex and regulated by several genes, no major QTL (explaining more than 25% of the phenotypic variance) has been identified. The majority of the QTLs expressed 3–10% of the phenotypic variance and the total phenotypic variance expressed by combining all of the significant QTLs was generally 30 to 40%, and never surpassed 60%. Besides the morphological traits, physiological parameters like relative water content, osmotic adjustment, root conductivity, chlorophyll content, ABA content in the ear at the flowering stage, have also been systematically analyzed by CIMMYT researchers through inter-institutional collaborations during 1996-1999, leading to identification and localization of several QTLs (Ribaut et al., 1997, 2002). QTLs for maize-leaf ABA content under drought stress were also mapped by Tuberosa et al. (2002) and Sanguineti et al. (1999). Sixteen QTL for ABA content corresponded with QTL for at least one of the following traits: stomatal conductance, drought sensitivity index, leaf temperature, leaf relative water content, ASI and grain yield. An increase in ABA content was generally associated with decreased stomatal conductance and grain yield but increased leaf temperature. However, the opposite effect was observed for a QTL on chromosome 7 that aligned with a QTL from a previous study for root pulling resistance suggesting that elevated ABA stimulated the development of a more extensive root system (Lebreton et al., 1995). An important outcome of the above studies was detection of correspondence of genomic locations of QTLs related to physiological and morphological traits in many cases. For example, a QTL for chlorophyll content was identified on chromosome 2 close to a QTL for ASI (under IS and SS)
125

and grain yield (under IS only). Similarly, a QTL for relative water content on chromosome 6 corresponds exactly to a QTL for ASI (under IS and SS) and grain yield (under IS and SS) (Ribaut et al., 2002). At the same chromosomal region, a dehydrin gene (dhn1) has also been located (Campbell and Close, 1997). The QTLs for physiological parameters were generally less significant compared to those obtained for morphological traits, and the total phenotypic variance was rarely greater than 25% for any given parameter. However, the QTL information generated for the physiological parameters is potentially valuable: (i) developing a ‘drought tolerance index’ for selection of genotypes in MAS experiments; and (ii) serving as link between the data generated from functional genomics and morphological responses of the genotypes in response to drought stress. While QTL analysis of segregating populations (with genotyping of each member of the mapping population) is the most precise method, Quarrie et al. (1999) explored the utility of bulk segregant analysis (BSA) to locate QTLs associated with grain yield under drought stress in two different genetic backgrounds (Tuxpeno Sequia and Drought Tolerant Population). A number of markers identified by this study corresponded with those detected in earlier studies employing conventional QTL analysis (Agrama and Moussa, 1996, Ribaut et al., 1997). BSA, coupled with physiological studies, could be a potentially useful approach for identification of important traits and molecular markers associated with drought tolerance. An interesting approach for studying drought tolerance was proposed by the INRA (France) researchers using proteomics (de Vienne et al., 1999; Prioul et al., 1999). Using large-scale two-dimensional gel electrophoresis, they quantified the protein spot intensities and mapped these as ‘protein quantity loci’ (PQL). This approach was used to evaluate a maize RIL population under mild drought stress. Differentially expressed proteins from the leaf tissue were sequenced for identification of putative candidate genes. One of the proteins was an ABA/water stress/ripening induced protein located on chromosome 10 that was previously found to be induced by water stress in other species (de Vienne et al., 1999). The location of this candidate gene corresponded with a QTL for xylem sap ABA content, leaf senescence, and ASI. Other PQL corresponding to the QTLs for drought responsive traits included those on chr.1 (Sh2–ADP-gulcose pyrophosphorylase), chr.2 (invertase), chr.5 (invertase), chromosomes 6, 8 (sucrose phospahte synthase), chromosomes 9 and 10 (Prioul et al., 1999). Similarly, QTLs for invertase activity were found close to carbohydrate QTLs, and some of them formed ‘stress clusters’ (Pelleschi et al., 1999). A few important conclusions from the various experiments outlined above in relation to mapping of QTLs associated with drought stress tolerance in tropical maize may be summarized as follows:
(i) A MAS experiment based only on the QTL involved in the expression of yield components
would not be the most efficient because only a few of the QTLs are stable across environments;
(ii) A MAS experiment should consider the QTLs involved in the expression of secondary
traits of interest correlated with yield under drought, such as ASI and plant height. (iii) The selected QTLs should be stable across environments and account for a large
percentage of the phenotypic variance. Therefore, an efficient MAS strategy should take into account the most suitable QTLs from different traits as an index (Ribaut et al., 1999,
126

2003). (iv) Although a number of chromosomal regions with concomitant effects on key traits
associated with drought tolerance in maize have been identified, many studies have clearly indicated the co-location of the QTLs influencing including key traits such as grain yield, ASI, root characters, ABA concentration, etc. across different genetic backgrounds (Tuberosa et al., 2002a,b). Such observations could be valuable in identification of ‘universal drought QTLs’ and putative candidate genes for further analyses and utilization.
Marker-assisted breeding for drought tolerance in maize Although the information generated with respect to QTL mapping for drought tolerance in maize has been highly impressive and encouraging, very few successful experiments on marker-assisted selection (MAS) for improvement of drought tolerance in tropical maize have been published. This may be attributed to the limited number of major QTLs identified per trait, the reduced amount of phenotypic variance that they generally express individually, their interaction with the environment, plus the difficulty of epistasis evaluation (Ribaut and Hoisington, 1998). Most notable among the MAS experiments in maize are those carried out by CIMMYT researchers for the improvement of both lines and populations for drought stress tolerance (Ribaut et al 1999). A drought-tolerant donor (Ac7643) was crossed to CML247 as a recurrent parent. After two backcrosses and two self-pollinations, the best genotype was fixed from the donor line for five target regions. The 70 best BC2F3 plants were crossed to two CIMMYT tester inbreds (CML254 and CML274). These hybrids, as well as the BC2F4 families derived from the selected BC2F3 plants were evaluated in 1997-1998 under several water regimes. Results showed that the mean of the 70 selected genotypes performed better than the control crossed with the testers, and the best genotype among the 70 selected genotypes performed much better than the control under drought conditions. No yield reduction was observed under well-watered conditions for the hybrids derived from the MAS genotypes (reviewed by Ribaut et al., 2002). Although some of the morpho-physiological traits associated with drought tolerance (such as ASI) can be effectively selected based on visual observations, molecular markers linked to QTLs for such key traits would undoubtedly aid in enhancing the efficiency of selection of drought tolerant genotypes as well as continuing a selection programme even in the absence of drought stress at flowering. Why are MAS experiments for improving drought tolerance so limited despite the wealth of information related to QTLs and molecular markers? Besides the important limitation of having to select for several QTLs with less than 10% contribution to phenotypic variance, the technical handicap of handling restricted population sizes had been a major factor, thereby limiting the flexibility and the power of selection. The latter constraint can be now overcome with the development of improved MAS protocols and availability of reliable PCR-based markers, which make screening of a substantial segregating population possible in a reasonable time period (Ribaut et al., 1997). With the availability in recent years of superior maize germplasm with drought tolerance (Banziger et al., 1999), it is also now possible to pyramid favorable alleles through MAS by crossing two elite lines that perform well under the target environment conditions. Novel strategies such as SLS-MAS (Ribaut and Betran, 1999) could be potentially exploited for this purpose. The recent focus of CIMMYT with respect to molecular breeding for drought stress tolerance in maize has been to initiate a MAS experiment based on “universal drought genomic regions” identified on a maize consensus map. Such a map is being based on: (1) QTL information for yield
127

components, morphological traits and physiological parameters; (2) positions of candidate genes; and (3) gene expression information. The success of this MAS experiment would depend heavily on (i) location of key genes involved in drought response at the same genomic positions, independent of the genetic background, and (ii) phenotypic differences across the germplasm attributable to the nature/quality of the alleles at those genes (Ribaut et al., 2002). The first important step towards this important goal is construction of a unique linkage map using a set of ‘anchor markers’ common to different segregating populations, different environments or different target traits (same cross and/or different crosses or environments). The strategy has already resulted in detection of some key regions for drought tolerance in maize. The Asian Maize Biotechnology Network (AMBIONET), facilitated by CIMMYT, in six Asian countries (China, India, Indonesia, Philippines, Thailand and Vietnam) provided significant impetus for extending the knowledge and germplasm accumulated over the last 15 years at CIMMYT with respect to drought tolerance in tropical maize, through focused reach activities in the region. AMBIONET teams in China, India and Thailand are making intensive efforts for identification of drought stress tolerant lines and mapping of QTLs conferring drought stress tolerance in the respective conditions (George et al., 2002; Prasanna and Hoisington, 2003; Prasanna et al., 2004). These efforts would further strengthen the development of a consensus map for drought stress tolerance and application of QTL information in functional genomics and MAS. Functional Genomics of Drought Tolerance The recent advances with respect to genomic technologies (both structural and functional) are now providing researchers with uncommon opportunities for detailed characterization of genes (including localization, sequence, and expression framework) influencing specific target traits. While the number of genes found to be associated with the response of plants to abiotic stresses such as drought is steadily increasing (Bohnert and Bressan, 2001; Bruce et al., 2002), the knowledge of the function, interaction, and more importantly, the operational time-frame of these genes, is at present highly inadequate. Studies have also clearly identified an array of molecules that are either produced or accumulated during water stress, suggesting a protective role for the plants. These include a variety of sugars, proline, glycine betaine, ABA, polyamines, etc (Bohnert and Bressan, 2001). A major challenge in the coming years is to understand the network of interactions among these important components and the key genes influencing these pathways. Functional genomics offers considerable hope to fill some of these critical gaps and to provide important information for evaluating the role of potential candidate genes and the pathways in which they are involved. Intensive studies have already led to the discovery of promoter regulatory elements, like DRE (dehydration-responsive element) or ABRE (ABA-responsive element) involved in both dehydration- and low-temperature-induced gene expression in Arabidopsis (Shinozaki and Yamaguchi-Shinozaki, 1997), as well as identification of several key transcriptional factors interacting with such promoters (Liu et al., 1998). Recently, scientists at Pioneer (USA) carried out expression profiling analysis of drought stress responses in maize, specifically to discover genes expressed in the ear that are changing due to water stress during flowering. The study suggested distinct functions for the members of the cell cycle regulation gene family during dehydration and recovery (Bruce et al., 2002). Another recent study using functional genomics tools led to the finding that soluble invertase expression is an early target of drought stress during the critical, abortion-sensitive phase of young ovary
128

development in maize (Andersen et al., 2002). Comparative transcriptional profiling of placenta and endosperm in developing maize kernels in response to water stress (Yu and Setter, 2003) has recently provided some interesting insights. In placenta, the genes encoding recognized stress tolerance proteins, including heat shock proteins, chaperonins, and major intrinsic proteins, were the largest class of genes regulated, all of which were up-regulated. In contrast, in endosperm, genes in the cell division and growth category represented a large class of down-regulated genes. Several cell wall-degrading enzymes were expressed at lower levels than in controls, suggesting that stress delayed normal advance to programmed cell death in the central endosperm. Based on this study, Yu and Setter (2003) suggested that the responsiveness of placenta to whole-plant stress factors (water potential, abscisic acid, and sugar flux) and of endosperm to indirect factors may play key roles in determining the threshold for kernel abortion. There are now exciting opportunities to combine information related to drought tolerance emerging at three different levels: phenotypic characterization of the plant, QTL data, and changes in expression of genes involved in specific physiological pathways (Ribaut et al., 2002, 2003). A collaborative programme on functional genomics for drought stress tolerance in maize has been initiated at CIMMYT to optimize the relevant parameters for identification of the most informative changes in gene expression, and to evaluate the associated phenotypes. Once the characterization of the key genes involved in drought responses is achieved, MAS could be effectively employed for screening of the elite germplasm and promising gene bank accessions to evaluate the allelic value at those genes based on field performance. Improving Drought Tolerance through Genetic Transformation There has been substantial progress in identifying genes for resistance to various abiotic stresses such as temperature, salinity, and drought. Some success has also been achieved in developing transgenic plants in model plant systems such as Arabidopsis, rice and tobacco (reviewed by Datta, 2001) through transfer of genes encoding LEA proteins, molecular chaperonins, enzymes invoved in synthesis of osmoprotectants, etc. However, most of these transgenic plants have been evaluated only at the laboratory level and there are no detailed reports available with respect to their field performance. Perhaps, it would take some more years for a possible breakthrough in developing transgenic lines with drought stress tolerance under field conditions. Concluding Remarks Molecular approaches can offer exciting ways of shortening the time for product development. However, deployment of an integrated strategy for drought selection that effectively combines knowledge from physiology, breeding and molecular genetics, would be as challenging as effectively undertaking a well-designed QTL mapping experiment for drought stress tolerance. Accurate field phenotyping of mapping populations, for traits as complex as drought tolerance, is currently the most important limiting factor in many developing countries. The creation and genotyping of mapping populations is often the more expensive part of the overall effort, but its ultimate success depends much more on proper selection of parental lines and the effectiveness of the phenotyping procedure in detecting repeatable, highly heritable differences in the mapping populations. Therefore, greater synergy among scientists from different disciplines and dedicated efforts are required in the conceptualization, design, and management of phenotyping assays for drought tolerance.
129

Synergistic partnerships between various institutions with respect to genome mapping, MAS, comparative and functional genomics would be critical for identification of key genes responsible for drought tolerance in different crop plants, including maize. This would aid not only in enhancing our understanding of the mechanisms and pathways involved in plant’s response to drought stress, but can also lead to development of superior germplasm and cultivars through marker-assisted breeding or genetic transformation.
130

References Cited Agrama, H.A.S. and Moussa, M.E. (1996). Mapping QTLs in breeding for drought tolerance in
maize (Zea mays L.). Euphytica 91: 89-97. Andersen, M.N. et al. (2002). Soluble invertase expression is an early target of drought stress
during the critical, abortion-sensitive phase of young ovary development in maize. Plant Physiol. 130: 591-604.
Banziger, M. et al. (1999). Breeding for drought tolerance in tropical maize - conventional
approaches and challenges to molecular approaches. In: J.M. Ribaut and D. Poland (eds). Molecular Approaches for the Genetic Improvement of Cereals for Stable Production in Water-limited Environments. CIMMYT, Mexico.
Banziger, M. et al. (2000). From theory to practice: Breeding for drought and low nitrogen stress
tolerance in maize. CIMMYT, Mexico. Bohnert, H.J. and Bressan, R.A. (2001). Abiotic stresses, plant reactions and new approaches
towards understanding stress tolerance. In: J. Nosberger et al. (eds.). Crop Science. CAB International, pp. 81-100.
Bolanos, J. and Edmeades, G.O. (1996). The importance of anthesis-silking interval in breeding for
drought tolerance in tropical maize. Field Crops Res. 31: 253-268. Bruce, W.S. et al. (2002). Molecular and physiological approaches to maize improvement for
drought tolerance. J. Exp. Bot. 53: 13-25. Campbell S.A., and Close, T.J. (1997). Dehydrins: genes, proteins, and associations with
phenotypic traits. New. Phytol. 137: 61-74. Datta, S.K. (2001). Recent developments in transgenics for abiotic stress tolerance in rice. In:
JIRCAS Working Report, pp. 43-53. de Vienne, D. et al. (1999). Genetics of proteome variation for QTL characterization: application
to drought stress responses in maize. J. Exp. Bot. 50: 303-309. Edmeades, G.O. et al. (1998). Improving crop yields under water deficits in the tropics. In: V.L.
Chopra et al. (ed.) Crop productivity and sustainability: shaping the future. Proc. 2nd International Crop Science Congress, New Delhi, 10-17 Nov. 1996. Oxford & IBH, New Delhi, pp. 437-451.
George, M.L. et al. (2002). Studies on drought stress tolerance in the Asian Maize Biotechnology
Network. In: Proc. IRRI Workshop on ‘Progress toward developing resilient crops for drought-prone areas’, May 26-30, 2002, IRRI, Los Banos, Philippines.
Heisey, P.W., and Edmeades, G.O. (1999). Maize production in drought-stressed environments:
technical. options and research resource allocation. Part 1 of CIMMYT 1997/98 world maize
131

facts and trends; maize production in drought-stressed environments: technical options and research resource allocation. CIMMYT, Mexico.
Lebreton, C. et al. (1995). Identification of QTL for drought responses in maize and their use in
testing causal relationships between traits. J. Exp. Bot. 46: 853-865. Liu, B.-H. (2002). Statistical Genomics: Linkage, Mapping and QTL Analysis. CRC Press, Boca
Raton, Florida. Liu, Q. et al. (1998). Two transcription factors, DREB1 and DREB2, with and EREBP/AP1 DNA
binding domain separate two cellular signal transduction pathways in drought- and low- temperature-responsive gene expression, respectively, in Arabidopsis. Plant Cell 10: 1391-1406.
Pelleschi, S. et al. 1999. Ivr2, a candidate gene for a QTL of vaculoar invertase activity n maize
leaves. Gene-specific expression under water stress. Plant Mol. Biol. 39: 373-380. Prasanna, B.M. and Hoisington, D. (2003). Molecular breeding for maize improvement: An
overview. Indian J. Biotech. 2: 85-98. Prasanna, B.M. et al. (2004). Application of molecular marker technologies for maize
improvement in India – present status and prospects. In: Proc. 8th Asian Regional Maize Workshop, Bangkok, Thailand (August 5-8, 2002) [In Press].
Quarrie, S.A. et al. 1999. Bulk segregant analysis with molecular markers and its use for
improving drought resistance in maize. J. Exp. Bot. 50: 1299-1306. Ribaut, J.-M. and Betrán, J. (1999). Single large-scale marker-assisted selection (SLS-MAS). Mol.
Breed. 5: 531-541. Ribaut, J.-M. and Hoisington, D. (1998). Marker-assisted selection: new tools and strategies.
Trends Plant Sci. 3: 236-239. Ribaut, J.-M. et al. (1996). Identification of quantitative trait loci under drought conditions in
tropical maize: 1. Flowering parameters and the anthesis-silking interval. Theor Appl Genet 92:905-914
Ribaut, J.-M. et al..(1997). Identification of quantitative trait loci under drought conditions in
tropical maize: 2. Yield components and marker-assisted selection strategies. Theor Appl Genet. 94: 887-896.
Ribaut J.-M. et al. (1999). QTL analysis, MAS results, and perspective for drought tolerance
improvement in tropical maize. In: J.M. Ribaut and D. Poland (eds). Molecular Approaches for the Genetic Improvement of Cereals for Stable Production in Water-limited Environments. CIMMYT, Mexico.
Ribaut, J.-M. et al. (2002). Genetic dissection and plant improvement under abiotic stress
conditions : drought tolerance in maize as an example. In: JIRCAS Working Report, pp. 85-
132

92. Ribaut, J.-M. et al. (2003). Genetic dissection of drought tolerance in maize: A case study. In: H.
Nguyen and A. Blum (eds.) Physiology and Biotechnology Integration for Plant Breeding. Marcel Dekker Inc., New York, USA.
Sanguineti, M.C. et al. (1999). QTL analysis of drought related traits and grain yield in relation to
genetic variation for leaf abscisic acid concentration in field-grown maize. J. Exp. Bot. 50: 1289-1297.
Shinozaki, K. and Shinozaki-Yamaguchi, K. (1997). Gene expression and signal transduction in
water-stress response. Plant Physiol. 115: 327-334. Tuberosa, R. et al. (2002a). Identification of QTLs for root characteristics in maize grown in
hydroponics and analysis of their overlap with QTLs for grain yield in the field at two water regimes. Plant Mol. Biol. 48: 697-712.
Tuberosa, R. et al. (2002b). Mapping QTLs regulating morpho-physiological traits and yield: case
studies, shortcomings and perspectives in drought-stressed maize. Ann. Bot. 89: 941-963. Yu, L.-X. and Setter, T.L. (2003). Comparative transcription profiling of placenta and endosperm
in developing maize kernels in response to water deficit. Plant Physiol. 131: 1-14.
133

134

Agronomic Options for Reducing Yield Losses Under Drought Stress
K.P.R. Vittal All India Co-ordinated Research project for Dryland Agriculture Central Research Institute for Dryland Agriculture Santoshnagar, Hyderabad 500 059, India
Maize is highly popular and preferred among the coarse cereals in rainfed agriculture for grain, cobs and fodder. It has also gained in roads as poultry feed due to better starch without moulds. The crop is grown rainfed from arid through semi-arid to sub-humid climatic regions. Some popular maize based production systems in various agro-eco regions are given in Table 1. Maize is also sown as a kharif crop in diara lands which are the result of floods and the meandering of the rivers. In this region, “satta” Maize (60 days) is popular. In Chotanagpur area it is grown in the catchments of Ahar as a kharif crop. In the humid region of orissa, Bihar and West Bengal, it is grown as upland crop. In all the cases, a short duration variety shall be helpful. The production can be augmented also by intercropping apart rabi crop. The agricultural statistics on the rainfed maize area are not readily available. Herein an attempt has been made to derive rainfed area as a difference between total cropped area and total irrigated area under crop. However, the average yield is based on total cropped area, which includes both rainfed and irrigated. Maize is grown in about 4.54 m.ha in 16 States, except 7 sister states in NE, Sikkim, Kerala and J&K. In 16 States, there are about 139 districts with more 5000 ha under rainfed maize for each district. Districts are based on 1995 statistics. The total rainfed area is about 3.7 m.ha. Thus, 84% of the area is rainfed in these 16 States. The grain yield (district average over 5 years) ranges from 0.4 – 3.8 tons/ha. The districts are divided by taking the maximum district average and dividing into three ranges of high (2.6to 3.8), medium ((1.3 to 2.6) and low (< 1.2). The low, medium and high ranges occupied 0.2 m.ha (10 Districts), 1.5m.ha (62 districts) and 2.1 m.ha (67) m.ha. The spatial distribution of range of yield and area are presented in Figure 1.
The high severity regions of water logging and water erosion are overlaid over the yields. It is seen that most of the rainfed maize area is having severe water erosion. Thus, leading to shallow, top soil depth. Minor area is also affected by water logging.The rainfall distribution for the high medium and lows yield zones is given in figure. It is seen that the rainfall distribution is more important for rainfed maize than the amount. In the high yield area the monsoon almost starts from April-May and ends by almost November. Thus probable season for the rainfed maize in the country is mid April to mid November. However, the rainfall distribution in the medium and low yield levels is almost similar. In the low potential area, the crop may need to be replaced with more agronomically efficient crop. However, due to the attachment of the farmers to this crop, that crop yield may need to be stabilized with supplemental irrigation from harvested water in ponds. A judicious application at critical time needs to be observed for supplemental irrigation. In the medium potential area there exists a possibility for utilization of available technology for bigger yield jumps. An integrated nutrient and pest management along with a promising variety can usher in the desired change. In the high potential zone, biotic stresses will be more. Plant protection needs to be taken care of for avoiding the losses. Weeds also are a severe menace. High
135

rainfall may lead to leaching losses of the nutrients especially that of nitrogen. Maize is basically a sensitive (indicator) crop for various nutrient deficiencies as well as moisture. In case of water logged areas, raised and sunken beds or broad bed and furrows will be needed. More so with higher rainfall. Graded cultivation also can answer. In the region with high topsoil loss, contour bunding is needed to avoid further degradation. Graded bunding may replace contour bunding to reduce the temporary water logging problem form high intensity rainfalls, especially in semi-arid tropics. In the other regions, without a severe problem of drainage or water logging, the soil and water conservation measures are important like in situ conservation. Ridges and furrows will help in this zone. In the medium range yield without severe problem of soil erosion or water logging lies a promising zone wherein the efforts for soil moisture conservation and fertility management are always rewarded. Simple non-monitoring techniques like timely sowing, blade harrowing between rows in weeding and soil mulch, in time fertilizer application always are rewarded as it helps in efficient water and nutrient utilization. Some suggestions for soil and moisture conservation based on runoff surplus index and yield gap (collected for each district separately and clustered) have been given in Table 2. Mulching is also helpful, but it is a costly affair and crop residue material may not be available.
However, in drylands, supplanting the non-water available period with water is not possible. Hence, the twin problems of land degradation and climate change need to be dealt with. Hence farming system model needs to be developed. An example is given for the Jhalawar district, which underwent from high, severe water erosion is extreme terrain deformation and moderate top soil loss (Table 3). This will transform the microclimate and soil resilience overtime with improved hydrological and nutrient cycles. The AICRPDA has worked out for similar models for several districts.
136

Table 1. Popular rainfed maize based production systems in various agro-eco regions
Agro-eco region Cropping System
Northern Plain (and Central Highlands) including Aravillis, Hot Semi-arid Eco-Region
Maize + Blackgram Maize – Chickpea
Central Highlands (Malwa), Gujarat Plain and Khathiawar Peninsula, Semi-arid Eco Region
Maize – Fallow/chickpea/Safflower Maize + Soybean/Groundnut – Safflower
Eastern Ghats and Tamil Nadu Uplands and Deccan (Karnataka) Plateau, hot semi-arid Eco Region
Pigeonpea + Maize
Northern Plain, Hot-sub-humid (dry) Eco Region Maize – Mustard/Chickpea/Wheat
Eastern Plateau (Chotanagpur) and Eastern Ghats, Hot sub-humid Eco Region
Maize/Cowpea – Sesamum Maize + Cowpea/Pigeonpea/Yarn
Eastern Plain, hot sub-humid (moist) Eco Region Maize/Pigeonpea – Fallow/Wheat Maize + Rajma
137

Table 2. Suggestions on soil and moisture conservation measures based on runoff surplus index and yield gap for some districts
Districts Avg.
triennial yield
(kg/ha)
Yield gap (%)
Surplus index (%)
Soil Conservation
Dharwad, Nizamabad Karimanagar
4188
29
2
Mysore, Shimoga 2996 23 10
In situ conservation Non-monetary inputs
Bastar, Bilaspur, Mandla, Gurdaspur, Koraput, Dumka
1095 66 41 In situ conservation, Water harvesting, Drainage Mulch/ Canopy cover Non-monetary inputs Fertilizer
Etah, Ambala, Kanpur, Farukkabad, Roopnagar, Mandsaur, Khargone, Shajapur, Adilabad, Sabarkanta, Chittorgarh
1569 61 15
Medak, Warangal, Hoshiarpur, Chhindwara
2995 50 18
In situ conservation, Water harvesting Non-monetary inputs Fertilizer
Hazaribagh, Sitapur, Kheri 867 81 30 Guna, Ganjam, Surguja Shahdol, Phulbani, Keonjhar, Kalahandi
988 74 53 In situ conservation, Water harvesting, Drainage Non-monetary inputs Fertilizer Mulch/ Canopy cover
Kota, Unnao, Banswara Lalithpur
646 78 18
Hardoi, Sidhi, Indore, Ratlam, Dwas, Jhalawar, Saharanpur, Buduan, Shivpurri, Jaunpur, Ballia, Kaira, P. Mahals, Bundi, Dhar, Jhabua, Betul
1099 70 25
In situ conservation, Water harvesting Non-monetary inputs Fertilizer
Dhule, Bhilwara, Udaipur 1086 78 3 Dunjarpur, Tonk 558 84 9
In situ conservation Non-monetary inputs Fertilizer
138

Table 3. A farming system model for Jhalawar, Rajasthan
Soil degradation status:
Water erosion, Very high severity with extreme terrain deformation and also moderate with loss of topsoil
State: Rajasthan District: Jhalawar Soils: Deep clayey black soils, shallow black soils
Rainfall: 1024 mm Length of growing period: 120 – 150 days
Suggested diversification Horizontal Diversification Maize- rapeseed mustard- on heavy soils
Maize + blackgram (2:2 row ratio in paired planting 37 cm.) Maize + pigeonpea (alternate rows at 30 cm.) Maize + castor (1: 1)
Vertical Fodder/ green biomass: Alianthus excelsa, Albizzia lebbeck, Dalbergia
sissoo, Azadiracta indica, Prosopis cineraria, Dichrostachys Fruit: Ber, date palm, jamun, fig, phalsa, karonda Medicinal/ Aromatic Plants: Plantago ovata, Cassia angustifolia, Safed musli, Papaver somniferum Vegetables: Clusterbean, cowpea, amaranthus, round melon, long melon Animal Component: Male cattle, female buffaloes/ cattle, sheep, goat
139

##
#
##
## ##
##
##
##
#
## #
#
#
##
###
##
#
##
# #
#
### #
##
#
##
#
#
#
##
#####
#
#
### #
##
# ##
#
##
# ####
##
#
## ###
#
# ##
##
##
# #
####
#
#
# #
##
## ## ##
##
##
#
#
###
###
#### ##
##
#####
##
######
## ## # #
#
##
#
###
#
#
#
#
#
#
##
#
#
###
##
###
##
#
##
#
#
#
#
###
##
# ##
#####
#
##
#
###
##
####
# #
#
#
#
###
##
##
#
##
##
##
###
#
#
## ##
# #
##
###
##
##
#
##
##
###
##
##
##
#
##
##
#
###
##
## #
##
#
##
##
#
###
#
# #
# #
#
##
#
#
#
#
#
# #
#
# ##
#
## #
#
## #
#
#
#
#
# #
####
##
###
##
## # #
#
##
#
#
##
###
## #
#
#
##
##
#
#
#
##
#
###
#
##
#
# #
##
#
##
#
#
#
#
###
#
#
#
#
##
#
##
###
#
####
#### ##
# ## #
#
##
##
##
###
#
###
##
##
#
#
##
#
##
##
#
#
#
#
###
#
##
###
##
#
###
#
#
#
##########
#
##
## #
###
#
#
## #
###
##
##
##
##
##
###
#
#
##
##
###
##
##
#### #
#
####
#
#
##
#
####
#
#
##
##
##
#
## #
# ###
###
# ##
#
#
#
#
###
##
#
#
###
##
#
###
#
#
###
#
#
##
### #
##
#
#
##
###
##
#
#
###
#
###
##
##
##
##
##### #
##
###
##
# ###
###
#
#
##
## #
##
###
#
#
##
##
##
#
#### #
#
## #
##
##
## #
###
##
##
#
#
##
##
##
###
# #
### #
#
#
# ##
##
##
#
##
## ###
#
###
##
### #
#
#
#
# # ## #
#
#
#
##
#
#
MaizeTotal Area (16 states) 4.54 mhaTotal Rainfed Area 3.79 mha 84%
Yield Range kg/ha Rainfed
Level Mean Max Min Area(mha)High 988 3851 2647 0.20Medium 1605 2646 1273 1.49Low 2992 1272 372 2.10
Water loggingWater erosion
High Severity0
50
100
150
200
250
300
JAN
FEBMARAPRMAYJU
NJU
LAUGSEPOCTNOVDEC
Nor
mal
Rai
nfal
l (m
m)
1. Panch Mahals
2. Udaipur
3. Bhilwara
4. Bahraich
5. Banswara
6. Jhabua
7. Gonda
8. Dhar
9. Jhalawar
10. Hardoi
11. Rajsamand
12. Dungarpur
13. Surguja
14. Ajmer
15. Rajgarh
16. Baroda
17. Sidhi
18. Shahdol
19. Unnao
20. Bundi
21. Shivpuri
22. Guna
23. Buduan
24. Palamu
25. Sirohi
26. Mungair
27. Sitapur
28. Pali
29. Lalitpur
30. Phulbani
31. Baran
32. Keonjhar
33. Betul
34. Kota
35. Tonk
36. Kheri
37. Kaira
38. Sonabhadra
39. Hazaribagh
40. Purulia
41. Nasik
42. Ganjam
43. Kalahandi
44. Indore
45. Dewas
46. Mayurbhanj
47. Alwar
48. Azamgarh
49. Seoni
50. Jabalpur
51. Gadva
52. Basti
53. Sahebganj
54. Jamui
55. Barabanki
56. Varanasi
57. Jaipur
58. Dhenkanal
59. Ujjain
60. Moradabad
61. Osmanabad
62. Malda
63. Chatra
64. Coimbatore
65. Nainital
66. Broach
67. Puri
12. Hoshiarpur13. Mandla 14. Bhagalpur 15. Shajapur 16. Bastar 17. Aurangabad18. Etah 19. Kanpur (Dehat) 20. Samastipur 21. Roopnagar 22. Saran 23. Warangal 24. Jalna 25. Dhule 26. Ambala 27. Adilabad 28. Sivan 29. Dumka 30. Vaisali 31. Khagaria 32. Ballia 33. Gurdaspur 34. Dehradun 35. Banaskantha 36. Bilaspur 37. Saharanpur 38. Banka 39. Mainpuri 40. Dindigul Anna 41. Buldhana 42. Gopalgunj 43. Katihar 44. Madhepura 45. Giridih 46. Raigarh 47. Visakhapatnam 48. Etawah 49. Sehore 50. Solapur 51. Purnea 52. Deoria 53. Muzaffarpur 54. Patna 55. Vidisha 56. Godda 57. Sangli 58. Gaya 59. Sundergarh 60. Aligarh 61. Yamunanagar 62. Ahmednagar
1. Mandsaur 2. Chittorgarh 3. Sabarkantha 4. Medak 5. Farukkabad 6. Begusarai 7. Ratlam 8. Koraput 9. Jaunpur
10. Chhindwara 11. Khargone
1. Karimnagar 2. Nizamabad 3. Chitradurga 4. Darjeeling 5. Mysore 6. Dharwad 7. Shimoga 8. Khammam 9. Prakasam
10. Bellary
= 5,000 ha
140

Field Demonstration and Evaluation of Germplasm Under Marginal Environment: A Practical Guide to Implementation J. de Meyer, M. Mwala, and M. Bänziger CIMMYT, Mexico Introduction – What is The Objective of Variety Testing? The objective of crop variety testing is to assess which variety (varieties) will be the best performing and the best accepted by farmers/consumers when deployed in the entire target environment1. If resources were unlimited, the best answer to this question would be obtained by growing the varieties in the entire target environment, getting performance data from all fields and requesting feed-back from all farmers/consumers. Since both practical reasons and resource constraints prohibit such an approach, researchers have to get the answer by growing variety trials at a few representative locations and by obtaining feed-back from a few representative farmers/consumers. Selection of representative locations for variety trials has to look for trial conditions that are representative for the target environment in terms of climate, soil type and farmers’ management practices. Different trials can represent different conditions as long as all variety trials together are a good sample for the type of conditions under which farmers will ultimately grow the crop. Because climatic variation at a certain site over several years is typically less than climatic variation across several sites in one year, variety trials grown at different locations can to some extent represent the type of conditions experienced across years. While researchers have been conscientious in placing variety trials in different agro-ecologies (as defined by climate and soil type), much less consideration has been given to also represent farmers’ management practices. Most variety trials have often simply been grown under recommended crop management practices, even though recommended crop management practices may deviate considerably from those used by the majority of farmers. Similar to rainfall, temperature and soil type, management factors such as fertilization, planting date, or plant density can differently affect the performance of varieties, i.e. they can result in genotype-by-environment interactions. Unless farmers’ real management practices are represented by variety trials, inappropriate information may be obtained about the most suitable variety (varieties). Apart from choosing appropriate testing environments, involving farmers in variety testing has been strongly advocated over the past decade. Recommended varieties need to conform to the demands of farmers, as the principal clients, and therefore it is important to seek and listen to farmers’ feed-back about new crop varieties. Like other traits, farmers’ feedback may vary when they assess varieties under recommended crop management practices versus their own management practices. It is therefore important to obtain farmers’ feed-back to varieties in an environment that is representative for the type of environments under which farmers grow their crop.
1 Target environment: environment where farmers will potentially be growing a certain variety.
141

Farmer-participatory variety evaluation, i.e. multi-location testing with farmers, has several advantages over multi-location testing at research stations. It samples not only climatic and edaphic differences but also farmers’ management practices as well as their preferences. When properly set up, it can provide information on the relative merit of different crop varieties as well as the target environment and farmers’ priorities. This information can be used to adjust breeding priorities, resulting in future varieties conforming increasingly better to the requirements of the target environment and the expectations of the principal users, the farmers. Thus, farmer-participatory variety evaluation is a more holistic approach to breeding that allows researchers to put their knowledge and expertise in improving a variety together with farmers that provide a sample of the target environment and report on their needs and preferences. Farmer-participatory variety evaluation, however, also raises several challenges, particularly when conducted in low-income countries. Multi-location trials require researchers to travel long distances which is made difficult when financial resources are limiting, the road infrastructure is poor and trial operations (planting, harvesting) require researchers to be at several places at the same time. Another challenge is to find an experimental design that addresses the wishes of the farmers without compromising scientific requirements. Researchers typically prefer replicated trials with a good statistical design. They want to evaluate a reasonable number of varieties and therefore use small plots. Farmers, on the other hand, prefer bigger plots with a simple design, a trial that is easy to implement and understand. The treatments (varieties) should be few, given that field sizes are often small and some farmers may be illiterate. Using the Mother-Baby Trial concept for farmer-participatory variety evaluation addresses several of these concerns, not the least to keep costs low. Mother-Baby Trials are sets of experiments grown with farming communities. They evaluate the performance and acceptance of new varieties under “real” farmer conditions, and create an understandable, cost-effective and simple flow of information between researchers, extension staff and farmers, thus integrating both technical and social aspects in the sense that the users/ultimate beneficiaries are part of the development and transfer of the technology. This provides for quick and high adoption of new varieties even in a resource-poor environment. The Mother-Baby Trial design for variety testing was first tried out for maize in Zimbabwe in 1999/2000 (Bänziger and de Meyer, 2002). Quickly, it was adopted by several countries in Africa, and many researchers asked for further information about the tool. This manual provides a practical guide to those researchers and partner organizations that want to set up or participate in a Mother-Baby Trial Scheme in their own country.
142

Literature Review Traditional approaches for variety testing The exploitation of breeding progress has often been connected to the use of fertilizers and other inputs, and breeders have focused their efforts on raising yield under favorable, high-input conditions as typically achieved on research stations or when recommended agronomic practices are implemented (Rosielle and Hamblin, 1981; Simmonds, 1991). Over the past forty years, most crop varieties have been selected in this manner, creating high expectation for productivity gains in farmers’ fields. The approach proved to be successful where farmers were able to implement agronomic practices similar to those of breeders on their research stations. In many low-income countries, however, farmers failed to adopt improved varieties and if they did, the improved varieties often failed to perform significantly better than local varieties when grown under farmers’ practices (e.g. Kamara et al., 1996). Few farmers in low-income countries can afford nor access the full range of resources needed to manage their crop optimally. Thus, their growing environments often differ considerably from those used by researchers during crop improvement. Researchers, on the other hand, have been hesitant to evaluate variety trials under farmers’ management practices. Experiments conducted under low-yielding conditions or farmers’ management have a high frequency of producing statistically non-significant differences and large coefficient of error variation. Thus, variety differences cannot be easily discriminated. As a result, there seems to have been a systematic bias towards evaluating crop varieties under optimal conditions and/or weighing the results of high-yielding experiments more heavily (Bänziger and Cooper, 1999). It has been shown for a number of crops that the ranking of varieties evaluated under optimal agronomic practices differs significantly from that of varieties grown under yield levels more similar to those of resource-poor farmers (Bänziger et al., 1997; Ceccarelli et al., 1992; Cooper et al., 1997; Fukai et al. 1999). Similar to rainfall, temperature and soil type, management factors such as fertilization, planting date, or plant density can differently affect the performance of varieties, i.e. they result in genotype-by-environment interactions. If farmers management practices deviate strongly from recommended practices, evaluation under recommended crop management practices has therefore very little relevance for deciding which variety is the best for farmers’ conditions. And in spite of lower precision, many studies have therefore found that variety evaluation under farmer-representative conditions is more effective for making breeding progress in farmers’ real growing environments. (Atlin and Frey, 1990; Bänziger et al., 1997; Ceccarelli et al., 1992; Pederson and Rathjen, 1981; Rosielle and Hamblin, 1981; Simmonds, 1991; Ud-Din et al., 1992). Generic benefits of variety evaluation in farmer’s fields Partly due to the lack of impact of traditional plant breeding approaches in low-income countries, there has been in recent years an increasing interest in involving farmers in variety selection. The multitude of benefits arising has been well documented. In many examples, farmers benefited from new varieties five to six years in advance of the conventional formal system and with less effort. Additional benefits comprised increased productivity gains, more rapid variety adoption, reduced research costs, and enhanced genetic diversity (Sperling et al., 1993, Witcombe et al, 1996, Ipinge et al., 1996, Kamara et al, 1996, Otim Nape et al, 1994).
143

A range of approaches has been used. They may be differentiated in farmer-led approaches that support farmers’ own systems of crop development and seed exchange, and approaches where farmers join in variety trials that have been initiated by researchers. Each of these approaches has its challenges and benefits, and different approaches have been used in different environments or for different goals and crops (for further information, see Smith and Weltzien et al., 2000). In most cases, farmers participated during the testing of varieties in the final stages of selection, or even in the evaluation of released varieties: groups of representative farmers select a limited numbers of varieties on-station for growing in their fields; or after involving farmers in priority setting and defining breeding targets, a group of farmers was given a number of varieties for testing in their own field. There is little doubt that farmers’ skills in selecting appropriate varieties can match those of breeders (Ceccarelli and Grando; 2000; Witcombe et al., 1996). The most intrinsic advantage for involving farmers in the breeding process is that they contribute a sample of the ‘real’ growing conditions, they express their preferences, and these preferences are based on the socio-economic constraints they encounter. Breeders’ intrinsic advantage is that they have the essential understanding of the underlying genetics of variety selection (Witcombe et al., 1996) and know, for example, to distinguish between factors that can be addressed through the breeding process (e.g. yield improvement, drought tolerance, disease resistance) and those not likely to be addressed through a traditional breeding process (e.g. termite resistance, animal damage etc). The main objective of farmer-participatory variety evaluation, like the one described in this manual, is therefore to expose representative farmers to relevant genetic variation and establish a sustainable collaboration that enables breeders, other stakeholders involved in the seed sector, and the wider population of farmers to make better decisions on what variety to promote or use. It is natural that different parties will make different selection decisions in this system. This fosters the use of genetically diverse germplasm and allows for exploitation of specific adaptation of varieties (Bänziger and de Meyer, 2002). Research constraints in low-income countries Given the financial, structural and personnel constraints intrinsic to low-income countries, attempts by individual researchers and even organizations to evaluate new crop varieties in a reasonable time period and in a manner that does justice to the highly variable growing conditions, diverse crop management practices and user preferences are prone to failure. Lack of access to communication and transport, poor road networks, and high cost of travel combined with financial and personnel constraints result in few trials being planted, delayed planting, poor supervision of trials and poor contact with farmers. Highly variable growing environments and diverse crop management practices and user preferences require a large number of trials being planted if the target environment and farmers preferences should be adequately represented. This is rarely possible due to lack of funds resulting in little confidence in the data collected. High turnover of personnel and low morale in government agencies only aggravate the situation. These constraints complicate the sustainability of participatory approaches, which could be potentially beneficial for smallholder farmers. Effective collaboration
144

between different actors, governmental and non-governmental, that are working towards alleviating poverty in the country is one, may be even the only way to face up to these challenges. Importance of partnership Collaboration between different actors – governmental and non-governmental, private and public - that are interested in variety testing and seed production systems is an effective way to achieve sustainability, cost effectiveness and to address the scaling out challenge of farmer-participatory variety trials. Some NGOs treat research as one of various means of seeking viable production alternatives for improving food and income security, others are more interested in the aspect of farmer empowerment, both of which are intrinsic components of farmer-participatory variety evaluation in low-income countries. As variety testing seems to fall in the domain of researchers, extension services have often been ignored even though extension staff are better positioned for frequent contacts with farmers and are often queried by farmers about varieties. Agriculture is taught at secondary schools and many agricultural teachers show a lively interest in research. The idea of evaluating a variety trial together with their students and the community is more appealing to them than simply growing a maize crop at the school plot. Farmer organizations typically show enthusiasm and keen interest in the information created through collaborative research, and the benefit to their community organization is apparent in the follow-up to the information created by the trials. Collaborative field trials quickly allow each partner to work out in what tasks they will be the most cost effective (Farrington and Bebbington, 1994) and in which area of expertise their collaboration is value-additive to the primary goal of variety testing. Where mobility and operational resources are needed, non-governmental organizations (NGOs) often have a comparative advantage. They are also often involved in community-based seed production, provision of inputs, and capacity building within the communities. Government agencies may be well staffed even though operation funds are limiting. They have access to seed of different varieties, data analysis capacities and can provide both institutional memory and links to policy makers. Involvement of research services, universities and extension services allows for a transparent flow and feedback of information within various government agencies and contributes to the institutionalization of a sustainable variety testing approach. As farmer-participatory research creates ownership with farmers and increases adoption, the same applies when involving partner organization in the execution of trials. Even though only a few individuals in each organization may be involved, lessons learnt get included in the natural information exchange within each organization, with impact on a wide extension of trial results. Another benefit of partnerships lays in that different partners may address different groups of farmers. Some partners are collaborating with wealthier and more influential farmers, others with the so-called poorest of the poor. Some partners may facilitate access to inputs while others are operating in remote areas with little or no access to inputs. Together these partners allow for a representative sample of the farming populations and the target environment which would not be possible, or far too expensive, if one organization attempted to do it alone (Bänziger and de Meyer, 2002).
145

The Mother-Baby Trial Scheme In 1999, a pilot project was initiated in Zimbabwe to develop a new variety testing system that evaluates the performance and acceptance of new maize varieties under farmers’ conditions, and creates a cost-effective and simple flow of information between breeders, extension staff and farmers. The resulting testing scheme was based on two concepts: (i) an innovative experimental design - the ‘Mother-Baby Trial Design’ (Snapp, 1999) – that was adapted for variety evaluation, and (ii) wide-ranging and organized partnerships with farmers and farmer organizations interested in variety testing. Snapp (1999) first used the Mother-Baby Trial Design2 to evaluate soil fertility management practices with farmers in Malawi: a replicated ‘conventional’ on-farm trial including a range of treatments was grown in the centre of a farming-community. Several farmers of that community evaluated the four most promising treatments in an unreplicated design on their own farm. The design proved useful for farmer-participatory research because the Mother Trial permits farmers to choose from a range of new technologies those that they wanted to evaluate in Baby Trials on their own farm during the following season (Snapp, 1999). We adapted the Mother-Baby Trial design for variety evaluation as described in this manual.
2 The Mother-Baby Trial Design was originally called the Satellite Plot Design. One of the Malawian farmers collaborating with Snapp made a comparison to a “mother with her babies” and thereby renamed the trial design.
146

Essential Elements of the Mother-Baby Scheme Purpose A Mother-Baby Trial scheme is as a cost-effective verification tool that is intrinsically linked to dissemination. Mother-Baby Trials are sets of experiments grown with farming communities. They evaluate the performance and acceptance of new crop varieties under “real” farmer conditions, and create an understandable, cost-effective and simple flow of information between researchers, partner organizations (extension, NGOs, schools) and farmers, thus integrating both technical and social aspects in the sense that the users/ultimate beneficiaries are part of the development and transfer of the technology. The approach has several benefits: (i) It generates an improved understanding of farmers’ needs and their
environment. (ii) It addresses those needs through the identification of appropriate crop
varieties. (iii) Through involvement of farmers and partner organizations, it obtains a higher
rate of adoption of selected varieties. The Mother-Baby Trial scheme has two essential elements: (i) A trial design that adequately samples the target environment and farmers’ preferences, and (ii) wide-ranging and organized partnerships with farmers and partner organizations interested in variety testing. Trial design Mother Trial The Mother Trial evaluates crop varieties under recommended agronomic practices and under farmer-representative conditions. The Mother Trial is researcher-managed and planted by partner organizations in the center of farming communities, with a school or a progressive farmer. It could also be situated at a research station provided it is close to a farming community. Important is that the Mother Trial is protected from natural hazards that usually contribute to the unreliability of results from on-farm trials (stray animals, theft etc.) and that it can easily be supervised by a competent local partner (extension or NGO staff, agricultural teacher). The Mother Trial evaluates varieties using small plots (in the case of maize, two 5-6 meter rows) and two different levels of inputs: 1. The recommended amount of inputs as advised by the extension services in the
area. This level of inputs is called the “Green Mother Trial” because it typically stays green for a longer time.
2. The amount of inputs representative for farmers’ practice in the area. This level of inputs is called the “Yellow Mother Trial” because it typically senesces earlier.
Farmers’ practice is established in discussion with the local partner organization and can be based either on a survey or, in the case of partners that have been working for several years in the area, on their expert opinion. The two input levels of one trial are planted side-by-side on the same date and, except for input application, are managed in the same manner. The number of varieties tested is typically between nine and twenty, and is limited by the number of Baby Trials that
147

can be handled by the testing program. Each experiment has a replicated incomplete block design (Patterson and Williams, 1976). Cob weight, shelling percentage and grain moisture are measured at harvest and data are analyzed using a spatial analysis program (Gilmour et al., 1998). The Mother Trial creates an ideal setting for the local partner to arrange field days with the community and discuss differences between varieties and input levels. From the breeding perspective, the two input levels created two environments per site, each representing relevant growing conditions. In many cases, fertilizer application may be the main difference between the two input levels. However, other factors such as land preparation, planting date or application of organic fertilizers could also be included in the two input levels, particularly if local partners are interested in demonstrating and promoting such practices to farmers. Important is that the input levels represent recommended management and farmer-representative management. The Baby Trial Subsets of the varieties in the Mother Trial are put into farmer-managed Baby Trials and planted with several farmers of that particular community under conditions chosen by the hosting farmer. Farmer perceptions are collected from these trials and the information used in conjunction with the Mother Trial results. A Baby Trial typically contains three or four varieties. The specific varieties are allocated to Baby Trials using an incomplete block design (Patterson and Williams, 1976) and all varieties in the Mother Trial are represented among the Baby Trials. Within each community, there are enough Baby Trials so that each variety is grown by at least two different farmers. All Baby Trials in one community thus form a replicated incomplete block design where each Baby Trial (or farm) is an incomplete block. This design takes into consideration that farmers prefer a trial that is easy to implement and understand. Plot size in the Baby Trial is determined by the amount of seed. In the case of maize, enough seed is provided to plant 100 m2 (equivalent to 400 seeds). Farmers are asked to plant the seed using a plot length of about 10 meters, but choosing their own planting distance between hills and rows. To avoid planting mistakes, the seed is packed in colored plastic bags with the name of the variety on it, and four stones painted with the same colors (blue, red, yellow, and green) are included as plot markers. This color-coding system is key to farmers being able to plant the Baby Trial themselves. Farmers might be unable to recall or read the name of the variety on the seed bag, but they are always aware of the color of a certain variety and its location in the field. The local partner organization decides how to choose farmers for hosting Baby Trials. Farmers are asked to grow the Baby Trial using their usual management practices, and they are requested to treat the four cultivars uniformly. Preferably the Baby Trial is grown next to the farmer’s own crop to allow for comparisons between the farmer’s choice of variety and trial entries. The partner takes the cob weight from a subplot at harvest, leaving some border rows for farmers to assess processing characteristics and taste. Using a simple questionnaire that is filled out together with the local partner, farmers provide information on their socio-economic circumstances, type of characteristics they value in crop varieties, and an assessment of the four varieties in the Baby Trial for a common set of criteria.
148

Replication of Mother-Baby Trial sets across the target environment (country) Different partner organizations plant Mother-Baby Trial sets in different communities across the target environment. A sufficient large number of Mother-Baby Trial sets must be planted so to adequately attain data that are representative for the target environment and farmers’ preferences. A good rule of thumb says that a variety needs to be characterized in at least 30 trials (and by at least 30 farmers) before a decision on its merit should be made. This would imply that data from a minimum of 15 Mother-Baby Trials should be obtained. Choice of trial entries Trial entries should be the same for all Mother-Baby Trial sets. The Mother-Baby Trial scheme exposes farmers to new crop varieties, so the majority of trial entries should be at the release or pre-release stage. As the system generates information on farmers’ preferences and environment, this information is expected to influence the choice of the varieties to be evaluated in future years. Check entries are included as one or two trial entries. These are varieties that are well known to farmers and that can be used as reference entries for release decisions. Farmers’ main interest for collaborating Mother-Baby Trials is because they want to learn about new varieties to be able to make a more informed decision about what variety to use in the following season. Farmers may therefore not be keen to evaluate varieties that may come available on the market only in two-to-three years and maybe even under a different name. It may therefore be necessary to make a compromise between newly released trial entries - that are not yet known by farmers but available on the market - and prerelease varieties. Farmers need to be informed that not all of the varieties are available on the market but that their feed-back will help to decide whether they will become available on the market. Partners The different stakeholders Three types of stakeholders collaborate in a Mother-Baby Trial Scheme: (i) Coordinating unit: The coordination unit coordinates all Mother-Baby Trials
in a country and back-stops partners for trial execution. The coordination unit consists of researchers and representatives of selected partner organizations.
(ii) Partner organizations: Mother-Baby Trial sets are grown in several parts of the country, each supervised by a local partner. Partner organizations include research stations, extension, NGOs, rural development projects, agricultural teachers of secondary schools, and other organizations with interest in variety testing. Based on its core agenda, the partner organization must already have active interactions with the community where the trial is grown.
(iii) Farming communities and host farmers: Farming communities are hosting the Mother-Baby Trials. Improved knowledge of crop varieties must be a priority topic for these communities and host farmers.
Prerequisites for collaboration The coordination unit must be conscientious that there must be an intrinsic benefit to each stakeholder to become involved in Mother-Baby Trials. Also, Mother-Baby Trials are conducted in partnership and transparency is a prerequisite for the process to work. Therefore clear roles, contributions and foreseen benefits have to be outlined to all stakeholders for the successful execution of the trials. Roles and responsibilities
149

must correspond to the comparative advantage of each stakeholder, and the contribution of each stakeholder must be proportional to the benefits each stakeholder obtains from participating in the scheme. Roles of different stakeholders Each partner should contribute to the Mother-Baby Trials Scheme using own resources. This may include land, labor, infrastructure (vehicle, computers), operational funds and know-how. External (project) funds can be used to top up the Scheme but they should not be the sole source of funds nor the reason for contributing to the Scheme. Role of the coordination unit (CU): The CU puts together the trials, acquires the inputs, provides on-site training to partner organizations and technical back-up through visits, records the exact position of the sites, analyses the results, writes the report, and organizes feed-back/planning workshops with all partner organizations. Role of the partner organization: Partner organizations are responsible for one (several) Mother-Baby Trial set(s) in their area of operation. They provide established links to the host community and intrinsic knowledge of the problems faced by farmers in the area. Because the trials are located nearby, it is easy and inexpensive for the partner organization to visit and monitor them and provide feedback to the coordinating unit. In detail, partner organizations identify interested host farmers, provide training to host farmers, select the sites where the trials are grown, distribute the inputs, plant, manage and harvest the Mother Trials, visit and backstop farmers, collect all information and send it to the CU when completed. After the feed-back workshop, partner organizations discuss the over-all results of the trials with the community. If necessary, partners will be provided with travel and subsistence allowances and contributions to field days in accordance with standards agreed with the CU. Depending on their core agenda, partner organizations may plan follow-up activities such as initiating community-based seed production schemes or bulk purchases of seed of successful varieties, or further promotion of farmer-selected varieties through demonstration plots. Role of the Farmer/Research Station/School: Mother trials are grown with research stations, secondary schools or experienced and interested master farmers. Baby trials are grown with interested farmers. The farmer/school treats the trial as his/her own maize. Management guidelines will be provided for the Mother Trial while the farmer chooses the management for the Baby Trial. The farmer/school informs the partner when harvest is due and makes sure that the partner will be able to measure yield. The farmer provides feedback about the varieties to the partner. Benefits to different stakeholders Benefit to farmers: Making informed choices about crop varieties and having access to seed of those varieties are priorities to farmers. Host farmers can assess every year new varieties under their own management practices, and compare their performance with other varieties in the nearby Mother Trial. Farmer will be able to make a more informed decision about varieties suited to their conditions and preferences. Benefit to partner organizations: Partner organizations receive packaged seed of new varieties. They can assess their merit for the area they are working for and will have
150

access to country-wide information about the performance of these varieties. Partner organizations can therefore make better variety recommendations to all farmers in their mandate area and design more appropriate follow-up strategies (such as community-based seed production schemes; bulk purchases of seed; further promotion of farmer-selected varieties through demonstration plots). Benefit to researchers: Researchers receive reliable feed-back on the performance and acceptance of their varieties under farmers’ conditions. This information can be used to revise breeding priorities and to direct dissemination of new varieties towards the area where these varieties performed well.
151

Planning and Implementing Planning a Mother-Baby Trial Scheme The planning of a Mother-Baby Trial Scheme is a consultative process. While the essential elements, as described in the last chapter, should generically be maintained, the Scheme is flexible enough to be adjusted in other aspects based on the demand of partners (see Box). Elements that should be maintained: • A design that evaluates new crop
varieties in the “real” target environment and assesses both variety performance and farmers’ acceptance of the varieties
• Adequate representation of the target environment and farmers preferences by growing replicated sets of the trials
• Involvement of partner organizations and farmers
• Clear contributions by each stakeholder
• Clear roles for each stakeholder • Clear benefits to each stakeholder • A coordination unit for the Scheme • Collaborative planning and
assessment of the Scheme
Elements that can vary: • Number of varieties evaluated • Type of varieties evaluated • Plot size • Exact location of each Mother-Baby
Trial set • Level of inputs in the Mother Trial • Type of partners • Allocation of responsibilities • Type of contributions by each partner
Organising a sensitisation/planning meeting Meeting objectives The first important step for implementing a Mother-Baby Trial Scheme is to expose potential partners to the concept and determine for whom variety evaluation is a priority on their agenda. The easiest way to do this is to organise a sensitisation/planning meeting with the following objectives: • Introduction of the Mother-Baby Trial concept • Explanation of the steps needed for implementing Mother-Baby Trials • Explanation of roles and benefits of/to the various stakeholders • Identification of partners • Identification of members of the coordination unit • With committed partners, development of workplans and timelines • With committed partners, training and discussion of trial management and
interaction with host farmers • Identification of follow-up activities needed for implementing workplans. In the following years, the sensitisation/planning meeting will be used as a feed-back/planning meeting. An appraisal of the past season’s implementation should be done to identify areas of improvement and therefore actions to be taken. Invitation letter Invitations to attend the sensitization/planning meeting should be sent to a wide range of stakeholders including NGOs working in rural areas or with interest in agriculture,
152

agricultural research and extension departments, seed services, agricultural universities and colleges, private seed companies (breeders and marketing personnel), and any other players that might be interested. The invitation letter should explain the purpose of the trials (see 3.1), outline the principal roles (see 3.3.3.) and benefits (see 3.3.4) of/to the different stakeholders, and describe meeting objectives. The meeting may take 1-1.5 days and may have an agenda as follows. Suggested meeting agenda 08:00 Welcome and introduction of meeting participants 08:30 Explaining the Mother-Baby Trial concept 10:00 Break 10:30 Identification of partners and development of workplans 12:30 Lunch 14:00 Training and discussion of trial management and partner-farmer interaction 15:30 Break 16:00 Membership of the coordination unit and identification of follow-up activities Information provided to meeting participants At the beginning of the meeting, the concept of the Mother-Baby Trials must be explained in detail so that stakeholders arrive at a shared understanding of the concept. This is critical. All steps in the implementation of the trials must be explained and accompanying documentation, such as an example for instructions passed on to the partners. A clear explanation is given of the roles of the partners in the implementation of the trials, along with the benefits that accrue to them. Partner selection Suitable partners should be identified during the meeting and clear commitments established. Suitable partners have the following characteristics: • They are interested in the evaluation of crop varieties. • They work with farming communities that have identified knowledge about new
crop varieties as a priority topic. • They are ready to commit some of their resources for implementing the trials. • They are located close to the communities where the trials are conducted so to
keep travel costs minimal. • They principally agree with their roles in the Scheme. As partners have been identified, it is important to immediately develop a list of the different locations where the trials will be grown. Development of workplans Together with committed partners, workplans (operational plans) are developed during this meeting and roles, contributions and timeliness agreed upon. This includes both a workplan for the overall Scheme as well as workplans for individual partners for conducting individual Mother-Baby Trial sets. These workplans describe exactly who will do what, when and where, and examples can be found in the annex. The requirements for execution of the trials should be ratified during the meeting, in the sense that it is clear what contributions are made by each the partner, the coordination unit and the farmers. This is important to ensure transparency in the acquisition and use of resources. Remember in dealing with partners that mutual trust is non-negotiable. Also once the planning is done, agreed workplans should be rigorously implemented.
153

Establishing the coordination unit Due to the number of partners likely to be involved and the different channels of communication a strong coordination unit has to be established. Apart from representing and safe-guarding the Schemes’ objectives and providing the institutional memory, the coordination unit is action-oriented. The coordination unit puts together the trials, acquires the inputs, provides on-site training to partner organizations and technical back-up through visits, records the exact position of the sites, analyses the results, writes the report, and organizes feed-back/planning workshops with all partners. The membership of the Coordinating Unit should be established in a democratic manner but with clear objective of making the Unit action-oriented. Training and discussion of trial implementation It is desirable to include a training session in this meeting where the following topics will be discussed with the partners: • Identifying suitable locations for the Mother Trials. • Identifying suitable host farmers for evaluating Baby Trials. • Managing the Mother Trials. • Interacting with farmers on the Baby Trials. • Demonstrating the planting of a Mother Trial and the planting of a Baby Trial.
This can be done by bringing along a trial set, as it will be prepared by the coordinating unit, and laying out the seed packages for that trial set as if it were to be planted.
An important point to underline is that Mother and Baby Trials of one set should be located within a short distance from each other. Somebody on foot should be able to visit them all in less than a day. This will ensure that the farmers hosting the Baby Trial can easily visit the Mother Trial site and also that it is easy and cost-effective for the partner to supervise the Baby Trials. Identifying follow-up activities Even though detailed workplans have been established, the immediate follow-up activities that are needed after the meeting should be summarized at the end of the meeting. This includes issues such as reminding partners to: • Immediately send the name of host farmers to the coordination unit so that
appropriately labelled trial sets can be sent. Developing instructions, fieldbooks and preparing the seed It is important to develop a comprehensive list of the different location where the trials will be grown as well as a list of the farmers that will participate in the trials. As each trial as a different randomization, these lists are important to keep track of the location of each trial. Randomization and field book are done with the help of FieldBook (see Chapter 6). Once the seed is packaged, it is labeled with the trial location and name of the partner (Mother Trial) or farmer (Baby Trial), respectively. This prevents errors, increases the partner’s and farmer’s ownership of the trials (“This is my trial!”), and increases the return of data. The instructions for implementing the trials and the questionnaire for collecting data should be written in vernacular language, so that they are well understood by all stakeholders involved, including farmers. If possible, the coordination unit translates
154

the instructions and questionnaires into local language. Where many different languages are spoken, partners may need to translate the instructions and questionnaires for their respective area.. Back-stop visits to Mother-Baby Trial sites Communication between the coordination unit and partners While partner organizations take care of the day-to-day management of Mother Trials and interaction with the farming community, members of the coordination unit visit Mother-Baby Trial sites to train and back-stop partners, check for progress, problems and concerns that may arise, discuss upcoming workplan components that need to be implemented, and keep touch with reality i.e. the concerns and observation of partners and the farming community. To keep the number of visits to the necessary minimum, the coordination unit should exploit other means to make sure that they keep up-to-date with the progress at each trial site. A good workplan, and phone, email, mail and radio communication are the most important communication tools with partners, and there should be a conscientious effort to use them effectively and keep them in good order. This may require some investment such as purchasing one or two cell phones for the coordination unit. Travel is expensive and time-consuming. A phone call to partners, to check about progress and discuss whether a visit may be necessary, is much cheaper than simply travelling to the site. Looking for effective ways to send the inputs to partners, such as by courier service or colleagues that have other business in that area, is more cost-effective than going to each site at planting time. Similarly, it is important that partners can reach the coordination unit by phone for most of the time. The number and timing of visits depends very much on the competence and needs of various partners. Some need almost no on-site back-stopping. New partners with no or little experience in trial management need more frequent visits. If partners are to be visited, there are three occasions when such a visit is particularly useful, at (pre-)planting, on occasion of field days during grain-filling stage and at harvest. Visit at (pre-) planting The visit should be conducted before planting or during planting for partners that are participating in the Scheme for the first time. It may not be needed for partners that are already familiar with the concept and have experience in planting and managing field trials. This is also an important time to make sure that the implementing partners and farmers are fully aware of the goal and purpose of Mother-Baby Trials. If results from previous years are available, they should be shown and explained to partners and farmers, and questions should be addressed. Mother Trial: It is necessary to explain to the partner in detail how to plant the Mother Trial, particularly if the planting is to be done by the partner alone. At the site of the Mother Trial, clearly explain the field lay-out, how to lay out and plant the seed in the seed packages, and the difference between the green and yellow experiments. If possible, the trial should be placed at a location with uniform soil, away from trees and protected from stray animals. If the field is not level, the yellow experiment should always be placed at the higher side of the field with the green one on the lower
155

side to avoid leaching of applied fertilizers from the green to the yellow experiment. The Mother Trial seed comes together with two strings, one with marks for the inter-row spacing and another with marks for inter-plant spacing. The use of these two strings for marking rows and plating stations should be explained to partners. Explain when and how thinning should be done, and how the partner should make sure that the correct amounts of inputs are applied for each of the two input levels (yellow and green experiment). Baby Trials: Ideally the host farmers for the Baby Trials come to one location to discuss the planting of the Baby Trials. For farmers participating for the first time, it is necessary to reinforce the understanding about the purpose of the Baby Trial and the set up of the trial while underlining the importance of their feed-back to the varieties. Farmers that already hosted Baby Trials in the past should be told that their trial will likely contain different varieties than in the previous year. Farmers should be shown how to plant a Baby Trial. It should be underlined that they should manage the trial similar to their own crop and that they should treat all varieties in the same manner. The Baby Trials can then be distributed during the visit. Field day visit during grain-filling After flowering, the members of the coordination unit should make sure that they visit each Mother-Baby Trial site, one member per site. Ideally this visit is combined with the partner organizing a field day at the Mother Trial site. This visit is also used to take the exact location of the Mother Trial site using a GPS unit, and to discuss trial management issues with the partner and farmers. Mother Trial: There may be the risk of animal damage, pest attacks (termites) or theft. Discuss with the partner how these issues will be addressed. At harvest time, the partner will need to have access to a scale and moisture meter. Discuss when and how these implements will reach the partner, unless you already have brought them along with you. Discuss the details of harvesting a Mother and Baby Trials and how the fieldbook and questionnaires should be filled in. Unless these explanations are done well, the partner or farmers may bulk the grain of the plots and all information is lost. Baby Trial: The partner should mark in each Baby Trial plot a uniform sub-plot that will be used to determine ear weight for each Baby Trial plot. Bring along strings for the partner to mark the sub-plot, explain how to determine the area of the sub-plot which needs to be noted in the fieldbook, and provide the farmer with one colored harvest bag for each Baby Trial plot. Explain to the farmers that host the Baby Trials the need to keep the harvest for the sub-plots separate so that the partner can take the weight. Reinforce the need to fill-in the questionnaires so that their feed-back to the varieties can be considered. Field day: The field day is organized by the partner. It is the perfect occasion for interaction with the community and for explaining who? what? how? and why? Mother-Baby trials are being conducted. The most important ‘allies’ are enthusiasm and short time benefit which have to be kept high and alive in partners and farmers high by explaining exactly what is going on and what benefits accrue to all involved. If people do not understand what is going on and why, they will loose interest and commitment.
156

Who is implementing the trials? The host farmers and farming community must take an ownership and pride in the trials. Explain that Mother-Baby Trial sets are being planted with selected farming communities and that these (and only these) communities have the possibility to evaluate and provide feed-back to new crop varieties. Their feed-back will be taken into consideration to decide which variety will be come available on the market. Farmers should get an understanding that their assessment and feed-back are an important input to the evaluations scheme and that the evaluation scheme is irrelevant without their participation. To emphasize this message, mention the number of farmers and farming communities participating in the scheme, their location and also the stakeholders involved. What is the purpose of the trials? Without understanding the purpose, farmers may develop erroneous expectations and also they are more likely to make mistakes in the execution of the trials. The message should include the following points: Farmers should have the possibility to influence what crop varieties become available on the market. It should be those varieties that are well liked and that perform better under their conditions than older varieties. Therefore, the Mother-Baby Trial scheme evaluates new crop varieties under conditions typical for farmers in this country and also assesses the preferences of farmers for particular varieties. The varieties have been developed by crop breeding programs and the breeders will listen to farmers’ feed-back. It will influence how future varieties are developed and what seed will be increased and becomes available on the market. In addition, there is a second benefit to the farmers. They learn the characteristics of new varieties under their own conditions, can compare them with their own varieties and make more informed decisions on what variety to grow. The two input levels of the Mother Trial let them compare recommended crop management practices with practices that are similar to their own. Farmers should be made aware that, through the partner and before next season, they will get access to the information from all the Mother-Baby Trial sets grown in the entire country. How are the trials conducted? Farmers should understand the design of both Mother and Baby Trials, and also the link between the two trials. If culturally acceptable, the farmers should be encouraged to visit all the trials in a community and compare the varieties. For the Mother Trial, it should be explained that the Green Experiment is grown under recommended agronomic practices and that the Yellow Experiment is grown under practices typical for the practices in that community. There may be varieties that do well in one experiment but not in the other. For the Baby Trials, it should be explained that they only contain a subset of the varieties in the Mother Trial. Farmers have the opportunity to observe the varieties in their own field and under their own management, so to better see advantages and disadvantages. They can record these impressions in the questionnaire. If a farmer likes a certain Baby Trial variety, the farmer can go and visit the Mother Trial to compare it with all the other varieties. What is the benefit to us? Farmers and partners are the most interested in those aspects of the trial that are of immediate benefit to their welfare. If there is an immediate benefit to them, they will collaborate and contribute willingly to the trials. Otherwise, the interest in the trials will be quickly lost. It is therefore important to discuss with partners and farmers how they want to use the results of these trials. If already available on the market, the communities could organize through the partner bulk
157

purchases of seed of selected varieties or request their local dealer to offer seed of those varieties. Otherwise, the coordination unit should provide the community with sufficient seed for community-based seed production and instruction on how to increase the seed. Visit at harvesting time The visit during harvest should ensure that data are properly recorded and questionnaires filled in, particularly in the case where the trials are being conducted for the first time. If not done before, harvest of the Mother Trial could also be used to organize a field day. Similar issues as the ones described above (4.3.3.) should be discussed, and farmers given the opportunity to comment on the different varieties and input levels. Mother Trial: In the case of maize, the number of plants at harvest, the number of ears harvested and the ear weight is taken for each plot. The representative ears are then weighed, shelled and the grain weighed again. Grain moisture is taken. There is a fieldbook for collecting the data for each the Yellow Experiment and the Green Experiment, and they must not be switched. Baby Trials: It is advisable that the partner is present at the harvest of the Baby Trial. If this is not the case, such as with experienced farmers, farmers should harvest the entire subplot as previously marked by the partner and gather the harvest in separate bags for each variety. The partner fills in the area of the subplot harvested, takes the weight for each variety and records the feedback of the farmer based on the questionnaire. The farmer may harvest the border rows (out side the subplot) to assess processing ability and taste. After weighing the subplots, the harvest belongs to the farmer. Frequently asked questions Partners and farmers typically have many questions and suggestions on how to modify the Scheme. Some suggestions can be incorporated into the execution of the Scheme in the following year, such as criteria that should be applied when selecting trial entries, or suggestions for using more appropriate input levels for the green and yellow Mother experiment. Other questions may contradict the purpose of the Scheme and may be answered as follows: Can we have fertilizer, chemicals or other inputs for the Baby Trials? Farmers are interested in short-term benefits, and in this case it is “Inputs for free”. Explain that if they are given all the inputs, the varieties will be evaluated in an artificial environment, the results obtained will not be relevant for their conditions, and they will not be able to make a better and more informed decision about the varieties that are the most appropriate under their REAL conditions. Can we have bigger seed packets? Producing the seed for Mother-Baby Trials carries a cost and the larger the plots, the more seed needs to be produced and shipped. The plot size should be a compromise between what is needed to assess a variety and cost-effectiveness. Also, since the performance of the varieties is not known before being tested, it is better to plant smaller plots. The bigger the plot, the bigger the loss in case of an unsuitable variety. Finally, small plots are easier to manage, plant and weed on the same day, thus support similar management of all four varieties.
158

Where can I find seed of these varieties? Recently released varieties are not yet widely found in all shops. Farmers and partners should be encouraged to arrange bulk purchases from companies that produce the variety, either directly or through the local dealer. This clearly indicates to the company that this variety is in demand and stimulates that the variety will become more widely available. In the case of pre-release varieties, the coordination unit may provide the community with sufficient seed and instruction so that they can produce their own seed until the variety becomes available on the market. For how many years does the entry list need to remain the same? The merit of a variety is judged by the difference between that particular variety and the check entry (entries) in the trial. This means that there is no need to keep the entry list exactly the same. The best entries should be reevaluated in the following year. Varieties that perform below average and/or are not liked by farmers should not be reevaluated but replaced with new varieties. Can we include more crop varieties in the Mother-Baby Trials? Researchers rather than farmers ask this question. It should be considered that the more varieties are included, the larger the Mother Trial and the more Baby Trials need to be planted. Thus, the number of varieties evaluated has a bearing on land area needed and costs. One compromise may be to evaluate more varieties in the Mother Trial than included in all the Baby Trials. Under this concept, only varieties that have been performing above-average in the Mother Trial, are included in Baby Trials in the following year. Can we evaluate crop management practices through Mother-Baby Trials? Evaluating varieties through Mother-Baby Trials is facilitated by that the seed is the technology to be transferred. It is relatively easy to show to partners and farmers how to plant, manage and harvest a variety trial on their own. In the case of crop management practices, knowledge is being transferred and it is much more difficult to delegate the implementation of crop management practices to a wide range of partners and farmers. The interest in crop management practices, however, was one reason for growing a yellow and a green Mother Trial. Partners can use this as a flexible option to show the difference between farmer-representative and recommended crop management. These input levels can differ at various sites and the same partner/farming communities can even choose to try different input levels in different years. What is important is that both input levels are relevant scenarios for that particular community, that one is representative for actual farmers’ practice and the other a “best-bet” option. Partners are encouraged to make an economic analysis of each input level and discuss it with the community. Preparing the report Stakeholder report After harvest, the coordination unit need to ensure quick data processing. Partners should mail the forms as soon as completed. Data analysis is done with EXCEL and FieldBook (see Chapter 6), but other software packages may also be suitable. The report needs to be ready by the next feed-back/planning workshop. The report should be kept simple. Be conscientious that it will be read by laypersons. For farmers and partners, it is important to see that their data and feed-back is reflected in the report. Therefore, the report should include, as a minimum, the following sections:
159

• Description of the purpose and design of the trials, including roles and
contributions by each stakeholder. • List participating partners and farmers with name, and partner organizations. • List locations where trials were conducted and by whom. • Provide a summary of trial results with a simple explanation on how to read the
results. This includes summary information for yield and farmers’ preferences. If socio-economic parameters such as wealth, gender or farm location influenced farmers’ preferences, this should be mentioned.
• Provide yield results for each Mother Trial and each Baby Trial. • For those varieties that have been evaluated for more than one year, provide
information on performance in previous years. • Provide an assessment on how partners and farmers can use the results, what
interpretations may be valid and what interpretations may be speculative. Make sure that a copy of the report is distributed to current and future collaborators (researchers, members of the coordinating unit, partners and farmers) and other interested stakeholders (seed companies, heads of research and extension, donors). Wider dissemination of results The coordination unit and partner organizations should be conscientious that the results of Mother-Baby Trials can help not only the participating farmers but also the wider farming community to make more informed choices about what variety to grow. Summary results for varieties that were evaluated for more than one year, should be made available to the wider farming community in a simple form. This can be done in form of leaflets and posters through partner organizations, extension, other NGOs, seed services, agro-dealers, and the press. Feed-back/planning workshop The feed-back and planning workshop should be done in good time before the start of the season. Depending on logistical reasons and particularly in large countries, this workshop may be held at three-to-four locations separately, so to minimize travel costs of participants. Partner organizations may have access to low-cost venues (guest-houses). All partners, selected farmers and other interested stakeholders (future collaborators, seed companies) should be invited. The invitation letter should explain the purpose of the workshop, include the agenda and logistical details such as arrangements for transport, accommodation and subsistence. It should also request partners to already bring along the names of the farmers that will be hosting the Baby Trials. The invitation letter should be sent well in advance so that participants will be available. The meeting may take 1-1.5 days and may have the following agenda: Suggested meeting agenda – Day 1 08:00 Welcome and introduction of meeting participants
Explaining of the workshop objectives: feedback and planning 08:30 Feed-back by farmers and partner organizations 10:00 Break 10:30 Coordination unit presents the results and distributes reports 11:30 Discussion of the results 12:30 Lunch
160

14:00 Identification of areas of improvement and discussion of actions to be taken 15:30 Break 16:00 Commitments by partners and development of workplans 17:30 Adjourn Suggested meeting agenda – Day 2 08:00 Training and discussion of trial management and partner-farmer interaction 10:00 Break 10:30 Discussion of the coordination unit, its membership and areas of improvement
Summary of follow-up activities 12:00 Adjourn Several of these agenda items have been described in chapter 4.2. It is important that the coordination unit goes with “open ears” to this meeting. Benefits to partners and farmers are carrying the Scheme, and also the perception that all stakeholders own and can influence the Scheme. This is one reason why in the suggested agenda the feed-back of farmers and partners is listened before the coordination unit presents the results. There should be adequate time for discussion and the training session adjusted to specific needs of workshop participants. Budgeting One intriguing benefit of Mother-Baby Trials is that they can be conducted with a very small budget provided several aspects are considered: • Mother-Baby Trials should not be an add-on activity but should replace less
appropriate variety evaluation schemes and those resources (human and financial) redirected.
The coordination unit must be conscientious that there must be an intrinsic benefit to each stakeholder to become involved in Mother-Baby Trials. Also, Mother-Baby Trials are conducted in partnership and transparency is a prerequisite for the process to work. Therefore clear roles, contributions and foreseen benefits have to be outlined to all stakeholders for the successful execution of the trials. Roles and responsibilities must correspond to the comparative advantage of each stakeholder, and the contribution of each stakeholder must be proportional to the benefits each stakeholder obtains from participating in the scheme.
161

References and additional readings: Aquino, P., Carrión, F., Calvo, R. and Flores, D. (2001) Selected maize statistics. In:
Pingali, P. (ed.) CIMMYT 1999-2000 World Maize Facts and Trends. Meeting World Maize Needs: Technological Opportunities and Priorities for the Public Sector. CIMMYT, Mexico D.F., Mexico. pp. 45-60.
Atlin, G.N. and Frey, K.J. (1990) Selecting oat lines for yield in low-productivity environments. Crop Science 30, 556-561.
Bänziger M., J. de Meyer, K. Pixley, B. Vivek, M. Mwala and P. Setimela (2003). Developing and disseminating stress-tolerant maize: Rationale and example for a practical breeding approach. CIMMYT 2003. Book of Abstracts: Arnel R. Hallauer International Symposium on Plant Breeding, 17-22 August 2003, Mexico City, Mexico. Mexico D.F.
Bänziger M., and J. de Meyer (2002). Collaborative maize variety development for stress-prone environments in southern Africa. In D. A. Cleveland and D. Soleri (eds) Farmers, Scientists and Plant Breeding: Integrating Knowledge and Practice. CABI Publishing. p. 269-296.
Bänziger, M, Edmeades, G.O. and Lafitte, H.R. (1999) Selection for drought tolerance increases maize yields over a range of N levels. Crop Science 39, 1035-1040.
Bänziger, M. and Cooper, M.E. (2001) Breeding for low-input conditions and consequences for participatory plant breeding - examples from tropical maize and wheat. Euphytica (in press).
Bänziger, M., Betrán, F.J. and Lafitte, H.R. (1997) Efficiency of high-nitrogen selection environments for improving maize for low-nitrogen target environments. Crop Science 37, 1103-1109.
Bänziger, M., Edmeades, G.O., Beck, D. and Bellon, M. (2000a) Breeding for Drought and Nitrogen Stress Tolerance in Maize. CIMMYT, Mexico D.F., Mexico. 68pp.
Bänziger, M., Pixley, K.V., Vivek, B. and Zambezi, B.T. (2000b) Characterization of Elite Maize Germplasm Grown in Eastern and Southern Africa: Results of the 1999 Regional Trials Conducted by CIMMYT and the Maize and Wheat Improvement Research Network for SADC (MWIRNET). CIMMYT, Harare, Zimbabwe. 44pp.
Bolaños, J. and Edmeades, G.O. (1993) Eight cycles of selection for drought tolerance in lowland tropical maize. I. Responses in grain yield, biomass and radiation utilization. Field Crops Research 31, 233-252.
Butler, L.M., Myers, J., Nchimbi-Msolla, S., Massangye, E., Mduruma, Z.O., Mollel, N. and Dimosa, P. (1995) Farmer evaluation of early generation bean lines in Tanzania: comparisons of farmers’ and scientists’ trait preferences. In: Southern Africa Development Community (SADC) Regional Bean Research Workshop, 2-
162

4 October 1995. Oil and Protein Seed Center, Potchefstroom, South Africa. pp. 20.
Byerlee, D. and Heisey, P.W. (1997) Evolution of the African maize economy. In: Byerlee, D. and Eicher, C.K. (ed.) Africa’s Emerging Maize Revolution. Lynne Rienner Publishers, Inc., Boulder CO, USA. pp. 9-22.
Byerlee, D. and Jewell, D.C. (1997) The technology foundation of the revolution. In: Byerlee, D. and Eicher, C.K. (ed.) Africa’s Emerging Maize Revolution. Lynne Rienner Publishers, Inc., Boulder CO, USA. pp. 127-143.
Byrne, P.F., Bolaños, J., Edmeades, G.O. and Eaton, D.L. (1995) Gains from selection under drought versus multilocation testing in related tropical maize populations. Crop Science 35, 63-69.
Castleberry, R.M., Crum, C.W., and Krull, C.F. (1984) Genetic yield improvement of U.S. maize cultivars under varying fertility and climatic environments. Crop Science 24, 33-36.
Ceccarelli, S. and Grando, S. (2000) Quality of science in participatory plant breeding. In: PRGA Program (ed.) Uniting Science and Participation in Research. Proceedings of the Third International Seminar of the CGIAR Program on Participatory Research and Gender Analysis for Technology Development and Institutional Innovation, 6-9 November 2000, Nairobi, Kenya. CIAT, Cali, Colombia. (in press).
Ceccarelli, S., Bailey, E., Grando, S. and Tutwiler, R.N. (1996) Decentralized participatory plant breeding: A link between formal plant breeding and small farmers. In: PRGA Program (ed.) New Frontiers in Participatory Research and Gender Analysis. Proceedings of the First International Seminar on Participatory Research and Gender Analysis for Technology Development, 9-14 September 1996. CIAT, Cali, Colombia. pp. 65-75.
Ceccarelli, S., Grando, S. and Hamblin, J. (1992) Relationship between barley grain yield measured in low- and high-yielding environments. Euphytica 64, 49-58.
Cooper, M., Brennan, P.S. and Sheppard, J.A. (1996) A strategy for yield improvement of wheat which accommodates large genotype by environment interactions. In: Cooper, M.E. and Hammer, G.L. (ed.) Plant Adaptation and Crop Improvement. CAB International, Wallingford, England. pp. 487-511.
De Meyer, J. and Bänziger, M. (2000) Evaluation of Maize Varieties in Farmers’ Fields in Zimbabwe Using the Mother-Baby Trial Scheme. Results of the 1999/2000 Season. CIMMYT, Harare, Zimbabwe. 37pp.
Duvick, D.N. (1984) Genetic contribution to yield gains of U.S. hybrid maize, 1930 to 1980. In: Fehr, W.R. (ed.) Genetic Contribution to Yield Gains of Five Major Crop Plants. CSSA Special Publication 7. CSSA and ASA, Madison WI, USA. pp. 15-47.
Edmeades, G.O., Bolaños, J., Chapman, S.C., Lafitte, H.R. and Bänziger, M. (1999) Selection improves tolerance to mid/late season drought in tropical maize
163

populations. I. Gains in biomass, grain yield and harvest index. Crop Science 39, 1306-1315.
Eicher, C.K. and Byerlee, D. (1997) Accelerating maize production: Synthesis. In: Byerlee, D. and Eicher, C.K. (ed.) Africa’s Emerging Maize Revolution. Lynne Rienner Publishers, Inc., Boulder CO, USA. pp. 247-262.
Eicher, C.K. and Kupfuma, B. (1997) Zimbabwe’s emerging maize revolution. In: Byerlee, D. and Eicher, C.K. (ed.) Africa’s Emerging Maize Revolution. Lynne Rienner Publishers, Inc., Boulder CO, USA. pp. 25-43.
Falconer, D.S. (1989) Introduction to Quantitative Genetics, 3rd edn. Longman Scientific and Technical, Burnt Mill, Harlow, England. 438pp.
Farrington, J., Bebbington, A.J. 1994. From research to innovation: Getting the most from interaction with NGOs in Beyond Farmer First eds Scoones, I., Thompson J. Intermediate Technology Publications
Fernandes, M.I., Prager,, M., Gamboa, C.I., 1996, NGO’s and the improvement of peasant agriculture: Methods and organizational aspects, in Joining farmers experiment, Intermediate technology publications.
Gebrekidan, B. and Gelaw, B. (1990) The maize mega-environments of eastern and southern Africa and germplasm development. In: Gebrekidan, B. (ed.) Maize Improvement, Production and Protection in Eastern and Southern Africa: Proceedings of the Third Eastern and Southern Africa Regional Maize Workshop. CIMMYT, Nairobi, Kenya, pp. 197-211.
Gilmour, A. R., Cullis, B.R., Welham, S.J. and Thompson, R. (1998) ASREML. NSW Agriculture, Orange NSW, Australia. 177pp.
Granados, G., Pandey, S. and Ceballos, H. (1993) Response to selection for tolerance to acid soils in a tropical maize population. Crop Science 33, 936-940.
Hartkamp, A.D., White, J.W., Rodriguez Aguilar, A., Bänziger, M., Srinivasan, G., Granados, G. and Crossa, J. (2000). Maize Production Environments Revisited: A GIS-based Approach. CIMMYT, Mexico D.F., Mexico. 33pp.
Heisey, P.W. and Edmeades, G.O. (1999) Maize production in drought-stressed environments: technical options and research resource allocation. Part 1 of: CIMMYT 1997/98 World Maize Facts and Trends. CIMMYT, Mexico D.F., Mexico. pp. 1-36.
Heisey, P.W. and Mwangi, W. (1997) Fertilizer use and maize production. In: Byerlee, D. and Eicher, C.K. (ed.) Africa’s Emerging Maize Revolution. Lynne Rienner Publishers, Inc., Boulder CO, USA. pp. 193-211.
Ipinge, S.A., Lechner, W.R., Monyo, E.S., 1996, Farmer participation in on-station evaluation of plant and grain traits: the case of pearl Millet in Namibia. Page 35-42 in Drought tolerant crops for southern Africa: Proceedings of the SADC/ICRISAT regional Sorghum and Pearl Millet Workshop, 25-29 Jul 1994, Gaborone, Botswana.
164

Ipinge, S.A.; Lechner, W.R. and Monyo, E.S. (1996)Farmer participation in on-station evaluation of plant and grain traits: The case of pearl millet in Namibia. In: Leuschner, K. and Manthe, C.S. (ed.) Drought-tolerant Crops for Southern Africa. Proceedings of the SADC/ICRISAT Regional Sorghum and Pearl Millet Workshop, 25--29 Jul 1994, Gaborone, Botswana. ICRISAT, Patancheru, Andhra Pradesh, India. pp. 35-42.
Jensen, S. (1995) Genetic improvement of maize for drought tolerance. In: Jewell, D.C., Waddington, S.R., Ransom, J.K. and Pixley, K.V. (ed.) Maize Research for Stress Environments. Proceedings of the Fourth Eastern and Southern Africa Regional Maize Conference, 28 March – 1 April 1994, Harare, Zimbabwe. CIMMYT, Mexico D.F., Mexico. pp. 67-75.
Jones, P.J., Wopereis, M.P., Erenstein, O. 2001. Uniting science and participation: Experiences in Participatory Rice varietal selection in Africa. Summary of Keynote Paper for “Uniting Science and Participation in Research” III International seminar of the CGIAR Program on participatory Research and Gender Analysis for technology development and Institutional innovation- PRGA Program, November 6-9, 2000 – Nairobi, Kenya.
Joshi, A. and Witcombe, J.R. (1996) Farmer participatory crop improvement. II. Participatory varietal selection, a case study in India. Experimental Agriculture 32, 461-477.
Kamara, A, Defoer, T, de Groote, H, 1996, Selection of new varieties through participatory research, the case of Corn in southern Mali. Tropicultura. 14,3, 100-105
Kumwenda, J.D.T., Waddington, S.R., Snapp, S.S., Jones, R.B. and Blackie, M.J. (1997) Soil fertility management in southern Africa. In: Byerlee, D. and Eicher, C.K. (ed.) Africa’s Emerging Maize Revolution. Lynne Rienner Publishers, Inc., Boulder CO, USA. pp. 157-172.
Lafitte, H.R. and Edmeades, G.O. (1994) Improvement for tolerance to low soil nitrogen in tropical maize. II. Grain yield, biomass production, and N accumulation. Field Crops Research 39, 15-25.
Maurya, D.M., Bottral, A., and Farrington, J., 1988 Improved Livelihood, Genetic diversity and Farmer participation. A strategy for breeding in Rainfed areas of India. Experimental Agriculture 24: 311-320
McCown, R.L., Keating, B.A., Probert, M.E. and Jones, R.K. (1992) Strategies for sustainable crop production in semi-arid Africa. Outlook on Agriculture 21, 21-31.
Morris, M.L. (2001) Assessing the benefits of international maize breeding research: An overview of the global maize impact study. In: Pingali, P. (ed.) CIMMYT 1999-2000 World Maize Facts and Trends. Meeting World Maize Needs: Technological Opportunities and Priorities for the Public Sector. CIMMYT, Mexico D.F., Mexico. pp. 25-34.
165

Mwala M., J. de Meyer, and M. Bänziger (2003). Participatory Varietal Selection of Maize Trial Using the Mother and Baby Scheme: Empowering Farmers Brings Rewards. CIMMYT 2003. Book of Abstracts: Arnel R. Hallauer International Symposium on Plant Breeding, 17-22 August 2003, Mexico City, Mexico. Mexico D.F.
Otim-Nape, G.W., Bua, A. and Baguma,Y. (1994) Accelerating the transfer of improved production technologies: Controlling African Cassava Mosaic Virus disease epidemics in Uganda. African Crop Science Journal 2, 479-495.
Pandey, S., Ceballos, H., Magnavaca, R., Bahia Filho, A.F.C., Duque-Vargas, J. and Vinasco, L.E. (1994) Genetics of tolerance to soil acidity in tropical maize. Crop Science 34, 1511-1514.
Patterson, H.D. and Williams, E.R. (1976) A new class of resolvable incomplete block designs. Biometrika 63, 83-89.
Pederson, D.G. and Rathjen, A.J. (1981) Choosing trial sites to maximize selection response for grain yield in spring wheat. Australian Journal of Agricultural Research 32, 411-424.
Pixley, K.V., Harrington, L. and Ransom, J.K. (1997) Regional priorities for maize research in eastern and southern Africa. In: Ransom, J.K., Palmer, A.F.E., Zambezi, B.T., Mduruma, Z.O., Waddington, S.R., Pixley, K.V. and Jewell, D.C. (ed.). Maize Productivity Gains through Research and Technology Dissemination. Proceedings of the Fifth Eastern and Southern African Regional Maize Conference, 3-7 June 1996, Arusha, Tanzania. CIMMYT, Addis-Ababa, Ethiopia. pp. 169-172.
Rhoades, R. and Booth, R. (1982) Farmer-back-to-farmer: a model for generating acceptable agricultural technology. Agricultural Administration 11, 127-137.
Rosielle, A.A. and Hamblin, J. (1981) Theoretical aspects of selection for yield in stress and non-stress environments. Crop Science 21, 943-946.
Rubey, L., Ward, R.W. and Tschirley, D. (1997) Maize research priorities: the role of consumer preferences. In: Byerlee, D. and Eicher, C.K. (ed.) Africa’s Emerging Maize Revolution. Lynne Rienner Publishers, Inc., Boulder CO, USA. pp. 145-155.
SADC (1993) Status of crop production, constraints and research/development priorities in SADC countries. Unpublished report. Southern Africa Development Community, Gaborone, Botswana.
Simmonds, N.W. (1991) Selection for local adaptation in a plant breeding programme. Theoretical and Applied Genetics 82, 363-367.
Smale, M., Heisey, P.W. and Leathers, H.D. (1995) Maize of the ancestors and modern varieties: The microeconomics of HYV adoption in Malawi. Economic Development and Cultural Change 43, 351-368.
166

Smaling, E.M.A. and Braun, A.R. (1997). Soil fertility research in sub-Saharan Africa: New dimensions, new challenges. In: Hood, T. M. and Benton Jones, J. Jr. (ed.) Soil and Plant Analysis in Sustainable Agriculture and Environment. Marcel Dekker Inc., New York, USA. pp. 89-110.
Smith, M.E., Weltzien, E., Meitzner, L.S. and Sperling, L. (2000) Technical and Institutional Issues in Participatory Plant Breeding from the Perspective of Formal Plant Breeding. A Global Analysis of Issues, Results and Current Experience. Working Document 3. PRGA Program. CIAT, Cali, Colombia.
Sperling, L., Loevinsohn, M.E. and Ntabomvura, B. (1993) Rethinking the farmer’s role in plant breeding : Local bean experts and on-station selection in Rwanda. Experimental Agriculture 29, 509-519.
Stahpit, B.R., Joshi, K.D. and Witcombe, J.R. (1996) Farmer participatory crop improvement. III Participatory plant breeding, a case study for rice in Nepal. Experimental Agriculture 32, 479-496.
Thiele, G., Gardner, G., Torrez, R. and Gabriel, J. (1997) Farmer involvement in selecting new varieties: potatoes in Bolivia. Experimental Agriculture 33, 275-290.
Ugen, M.A., Wortmann, C.S.; 1994, Farmer participation in cultivar evaluation: The case of beans. African Crop Science conference proceedings. Vol. 1, pp 413-417.
Vivek, B., Bänziger, M. and Pixley, K.V. (2001) Characterization of Maize Germplasm Grown in Eastern and Southern Africa: Results of the 2000 Regional Trials Coordinated by CIMMYT. CIMMYT, Harare, Zimbabwe. 56 pp.
Weltzien, E./Smith M. E., Meitzner L.S., and Sperling L. 2000. Technical and Institutional Issues in Participatory Plant Breeding – from the Perspective of Formal Plant Breeding. A Global Analysis of Issues, Results, and Current Experience. Working Document. CGIAR Systemwide Program on Participatory Research and Gender Analysis for Technology Development and Institutional Innovation.
Witcombe, J.R., Joshi, A., Joshi, K.D. and Sthapit, B.R. (1996) Farmer participatory crop improvement. I. Varietal selection and breeding methods and their impact on biodiversity. Experimental Agriculture 32, 445-460.
167

168

169
Breeding for Drought and Low Nitrogen Tolerance in Maize - Indian Experience
Sain Dass, Dharam Pal, Meena, P. Arora, S. Kukreja, G. Yadav, K.S. Dhanju and J.C. Mahla CCS, Haryana Agricultural University, Regional Research Station, Uchani, Karnal- 32001,India Abstract To reduce the cost of cultivation and cater the need of stress areas identification of low input efficient genotypes possessing drought enduring ability through effective screening techniques makes the breeder task easy. To screen drought tolerant genotypes, irrigation was limited at different crop growth stages. Flowering and grain filling were found to be the most critical stages reducing the yield drastically. Reduction of yield from 50-90% was observed under drought stress in different genotypes. Shorter anthesis-silking-interval (ASI), protogyny, early maturity, covered tassel and prolificacy were identified as some of the drought enduring traits. HKI-209, HKI-335, HKI-1332, HKI-1025, HKI-551 and HKI-3-4-D-2 were identified as drought tolerant genotypes. To screen nitrogen efficient use genotypes, evaluation was made at different levels of fertility. Nutrient stress resulted in weak plant, slow growth, chlorosis, patchy grain filling and in most of the cases cobs tip remained naked. On the basis of yield efficiency index HKI-323,HKI-193-1, HKI-193-2, HKI-1344, HKI-1354-2, HKI-1040-3, HKI-164, HKI-288D, HKI-1352-58-9 were identified as highly efficient inbreds. Among the hybrids 1105x488(HM-6), 193-1x163(HQPM-1), 194x163, HHM-1and HM-4 were the nitrogen efficient users. Stay green, strong plant, better root system and lodging resistance were some of the common traits enduring tolerance to both the stresses. Hybrids were found to be better under both stress conditions as compared to open pollinated varieties because of their strong genetically inbuilt mechanism. Therefore, development of single cross hybrids in these stress areas may be one of the possible solutions. Thus, screening and identification of genotypes under artificially created stress conditions is pre-requisite to achieve the goals of high yield and stress tolerance. Introduction Among the abiotic stresses drought and low soil nitrogen are the most important factors limiting the yield of maize. More than 80% of the maize area is rain fed and almost all the Indian soils where maize is grown are poor in indigenous N. Yield and production losses due to low N has been reported 50% and 4.5 million tones, respectively which is highest in Asia whereas, a reduction of more than 50% in yield has been observed if drought coincides with critical crop growth stages i.e., flowering and grain filling (Classen and Shaw,1970). The capacity of soil to supply N declines rapidly once agricultural activities commence, and the N derived from the breakdown of organic matter must therefore be supplemented. For productivity to be sustained at the current levels, N removed as agricultural produce or lost from the system must be replenished (Peoples et al., 1995). Drought and low N and continues to be a major constraint to maize production in light of continuous and intensive monocropping and unsustainable farming practices. In India, no systematic work has been initiated to identify/develop drought tolerant and nutrient/N efficient improved cultivars. Therefore, no hybrid or composite variety has been

170
developed in the country, which is specifically possessing genes for stress tolerance (Drought and Low N tolerance). To stabilize the production for year to year, emphasis should be given to the screening of genotypes under different stress conditions (Drought and low nitrogen) and their correlation with traits associated with drought and low N tolerance. So, stress tolerant hybrids may offer an suitable alternative for stabilizing the production and productivity. Drought and Maize Production Moisture stress/drought is the most limiting factor in reducing the maize production in India. Despite of its high yield potential the yield levels of maize are quite low (>2 ton/ ha) in India and most of the tropical countries except USA (> 7.5t/ha) and China (>5.0t/ha). Drought occurring around flowering has a major effect on grain yield. Deficit of water periods lasting one to two days during tasseling or pollination may cause as much as 22% reductions in yield (Robins and Domingo, 1953, Fischer et al, 1982). Water stress affects most of the plant traits including vegetative, phonological and productivity. Management of moisture stress through cultural practices and genetic manipulation is, therefore, imperative. Among the various drought tolerant technologies to be adopted, the screening of diverse germplasm under artificially created drought conditions is a pre-requisite for the identification of reliable morpho-physiological criteria related to drought tolerance.
Screening Techniques
To ensure the stability of drought tolerance among the genotypes, the effectiveness of screening technique is pre-requisite. The following screening techniques may be used to identify the source material for drought tolerance as per the details: a. Primary screening technique Initially, genetically diverse germplasm of different maturity groups collected from different sources should be evaluated under following different artificially created stress conditions (controlled water regimes). The advantage of this screening technique is that it can accommodate large number of genotypes. 1. All the irrigations required by the crop were given as per schedule (WW) 2. Irrigation was limited at flowering stage, further irrigation as per crop schedule (IR1) 3. Irrigation limited at grain filling stage. (IR2) 4. No irrigation after knee height stage. (SS)
b. Secondary screening technique Those lines which were found tolerant in the primary screening technique are evaluated in the secondary screening technique, where, the moisture is limited at all the crop growth stages. 1. All the irrigations required by the crop were given as per schedule (WW) 2. Irrigation was limited at knee height stage, further irrigations were given as per schedule (IR1) 3. Irrigation was limited at flowering stage, further irrigation as per crop schedule (IR2) 4. Irrigation limited at grain filling stage. (IR3)
5. Irrigation limited at both flowering and grain filling stage. (IR4) 6. No irrigation after knee height stage. (SS)

171
c. Rain shelter screening technique To confirm the tolerance level among the genotypes, the rain shelter screening technique is useful during the rainy season which is the main season of maize crop in India. This technique is implied for a set of selected number of genotypes due to limited space. The controlled water regimes are kept same as in secondary screening technique.
Breeding for Drought Tolerance The grain production is affected adversely under stress conditions if it occurs during the critical crop growth stages (flowering and grain filling). The most discouraging factor in the development of drought tolerant germplasm/lines is that it is a complex trait and many traits affect the outcome. Some known indicators of drought tolerance includes days to 50% silking, days to 50% pollen shedding, the interval between the two (Anthesis-Silking-Interval), plant height, ear length, ear girth, test weight. Tollenaar (1977) suggested that improved grain yield could be achieved by selecting for factors that influence photosynthate supply to the ear during the flowering period. Improvement in drought resistance is much more rapid when the selection procedures simultaneously using many characters than just based on grain yield per-se; because many factors are involved in conferring drought tolerance. The use of a selection index based on relative leaf elongation, the interval between pollen shed and silking (ASI), canopy temperature, leaf area loss and grain yield under stress and non stress resulted in maximum gain per cycle in grain yield under stress. Morphological trait selection such as reduced height, tassel size and leaf size, made under non stress conditions, also improved grain yield under stress. Bolanoes and Edmeades (1996) reported that selection for drought tolerance on grain yield and related traits (cob traits) may result in limited progress because of low genetic variation for that trait and could reduce yield potential. Use of secondary traits (leaf senescence, leaf rolling, ASI) are of adoptive values. Observed genetic variation is increased under drought may increase selection efficiency by their correlation with adoptive traits. These criteria are easily incorporated into a breeding program and can be used for individual plant selection. There are however, some report/indications that a combination of morphological, physiological and biochemical parameters i.e. Anthesis-Silking- Interval, plant height, cob traits, horizontal and vertical expansion of the roots, ears per plant, leaf senescence, leaf rolling and high grain yield under drought conditions with high drought index can be used as parameters of drought tolerance.
Characters Associated with Drought Tolerance
i) Grain yield Under different stress conditions all the genotypes showed reduction in yield. Reduction of more than 80% was reported in highly susceptible lines, while some of the lines showed relatively less reduction in yield over the stress environments. Further it was observed that hybrids were more tolerant to drought in comparison to inbreds, probably due to their strong and vigorous nature (Dass et al., 1999, 2001). Hybrids viz. 536x295, 1040x 645,1332 x 3-4D-

172
2,1025 x 3-4D-2, 335 x 1035-11,551 x 3-4D-2 and lines viz.HKI-1332, HKI-209, HKI-1025, HKI-335, HKI-551 were identified as some of the drought tolerant genotypes. It has been observed that grain yield is strongly associated with 50% silking, no. of ear per plant, ASI, leaf senescence, leaf rolling, chlorophyll stability, tassel blasting, cob length, test weight and horizontal and vertical expansion of the root across the stress environment. These traits have a direct effect on grain yield under stress conditions. A combination of these morpho-physiological traits with high yield under stress condition can serve the purpose of developing drought tolerant material. The differential behaviour of different genotypes w.r.t grain yield under different drought environment is given in Fig. 1. ii) Anthesis-silking-interval Anthesis-silking-interval (ASI) is commonly delayed under stress condition if it occur just before flowering. Delays from 6-16 days have been reported under Indian conditions (Dass et al., 2001 and Subramanyan, 1992). The timing of pollen shed appears to be less affected under stress conditions (although delays can occur under N stress) leading to an increase in the interval between pollen shedding and silking. There is a direct correlation between this interval (4-16d) and maize grain yield and genotypes with a longer ASI tend to suffer less yield reduction under drought. Lines i.e. HKI-209, HKI-335, HKI-551, HKI-1332, HKI-1025 and hybrid 1035-11536x295, 1332x3-4, 335x1035-11 and 209x3-4, were some of the genotypes identified with short ASI (3-6 Days under stress conditions).It has been found that anthesis-silking-interval is positively correlated with root traits i.e., root biomass and horizontal and vertical expansion of roots. The differential behaviour of different genotypes w.r.t ASI under different drought environment is given in Fig. 2. iii) Root characteristics There were differences with respect to root behaviour among different genotypes. Genotypes showing greater root length alongwith more horizontal spreading, showed better tolerance to drought. In rainfed areas where the less plant population is characteristics of the field in such case lines which were having better horizontal expansion can utilize the moisture available in the surrounding zone and resulting in less reduction in yield losses. Horizontal expansion under these situations can serve as useful parameter of drought tolerance. In areas where plant population is sufficient, there at particular crop growth stage, the genotypes have the ability to go as deep as they can, for their survival. Thus under such situations vertical expansion of roots play an important role in drought tolerance. Edmeades, (1985) and Dass et. al., (1999) reported the similar results with respect to root traits under drought conditions. Inbred HKI-645, HKI-877, HKI-1332, HKI-1025, HKI-335, HKI-1011, HKI-1040C2 and hybrid 536x295, 606-3x295,1332 x 3-4D-2, 1025 x3-4D-2 showed increase in root length & biomass under severe stress conditions. Differential behavior of different genotypes w.r.t root biomass is shown in Fig. 3.
iv) Ear length and girth These traits are often reduced under drought, but comparatively less reduction in these measurements was observed in the drought tolerant genotypes. Reduction was more in inbreds than the hybrids. Stress affected the cob length upto 60% in inbreds and 40% in hybrids (Dass et al. 2001). Miller et. al. (1995) also stated that yield losses are primarily due to decrease in ear size. However, a few genotypes showed less reduction in different cob traits viz. Line HKI-209, HKI- 295, HKI- 1332, HKI- 3-4D-2, HKI- 1027, HKI- 761 and hybrid 1015-3x645, 536x335,1332 x 3-4D-2, 335 x 1034-11, 551 x3-4D-2

173
v) Test weight and grain filling Test weight and grain filling were severely affected under different drought environments and were also directly related with yield reduction under stress (Frederick et. al., 1989). A reduction of 40-50% in test weight and 50-70% in grain filling has been observed in some of the susceptible genotypes (Dass et. al., 2001). Poor seed setting in drought susceptible lines may be due to a number of reasons: • Longer ASI due to delay in the silk development • Sensitivity of male flowers • Poor fertilization • Non-availability of functional pollens • Due to less moisture at grain filling shrunken type of grain may be formed that leads to less
test weight. vi) Leaf senescence and chlorophyll stability index A slow rate of leaf senescence and high degree of chlorophyll stability are criteria, which may also be used while selecting drought tolerant genotypes. The rate of leaf senescence is more in inbreds as compared to hybrids. Oostrom et al., (1996) reported that heterosis delays leaf death under drought. Thus, in most of the hybrids, leaf senescence rate was low as compared to inbreds. Due to slow rate of leaf senescence, tolerant lines either resist decreasing of chlorophyll content during stress conditions or showed very little reduction. Genotypes viz. line HKI-209, HKI- 335, HKI-1025, HKI-1332, and hybrid 1025 x 3-4D-2, 1332 x3-4D-2, 1332x877, 1035x645, 1094x1324, 1025x3-4D-2 ,335 x 1035-11 showed negligible reduction in Chl-a and Chl-b under stress environment as compared to normal. Differential behaviour of lines, testers, hybrids and checks w.r.t chlorophyll stability index ( Dass et al., 2001) is shown in Fig. 4. Ideal Plant Type for Drought Tolerance:
• Shorter Anthesis-Silking Interval/Protogyny • Prolific/ ears per plant/non barrenness • Covered tassel • Stay green • Better root system • Erect leaves
Nitrogen Status of Indian Soils Indian nitrogen map (Gosh and Hassan, 1980) shows that only 15 districts of north eastern hills and Himalayan regions covering about 5% of total cultivated areas soils are rich in N content. The remaining 95% soils are either low (62.5% of the area) or medium (32.5% of the area) in nitrogen. Furthermore, nitrogen level in semiarid region where maize is grown are typically low in organic matter, often containing less than 1.0 per cent organic matter with a total nitrogen generally not exceeding 0.1 per cent.

174
Role of Nitrogen in Maize Production Several morpho-physiological and biochemical processes are affected by the availability of nitrogen. Photosynthetic rate, chlorophyll content, leaf surface area, size of the sink, protein synthesis etc are some of the characters affected by nitrogen. All these collectively affect the grain yield of maize. Each ton of maize grain production requires about 16 kg N. Grain protein production in maize increased upon application of nitrogen during grain filling (Deckard et al., 1973). Maize yields in India have shown a linear response to increased N fertilizer use over the past several years. Nitrogen recommendations for maize in India are specific for location and crop rotation, and vary from 80-150 Kg/ Nha-1, depending upon plant spacing and moisture conditions of the area. In irrigated areas, N rates upto 150Kg/ ha have proved economical, whereas in rain fed areas economic rates of N application are around 80Kg/ha. In general, N is applied in three equal splits: planting, knee height and at silking stages. The use of both N and water would be more efficient if irrigation were synchronized with the rate and timing of N application (Dass et al., 1996).
Screening for Low Nitrogen Tolerance in Maize To make screening technique more effective with respect to identification of nutrient efficient genotypes, soil fertility status of the screening plot is pre-requisite. Therefore, soil from different parts of the field in which such kind of experiment is to be conducted, should be collected and analyzed. Based on the results of soil analysis, the experiment is to be planned on the field of lowest fertility status. The genotypes of different maturity groups should be evaluated at different levels of fertility. Keeping the above facts in view, the experiment was planned to evaluate the genotypes for their low nitrogen efficiency at four levels of fertility. The experimental field was low in available nitrogen (OC%=0.32%), medium in phosphorus (12 Kg/ha) and high in potash content (260 Kg/ha). Treatments consisted of four different levels of N-P2O5-K2O i.e., F0: 0-0-0, F1: 50-20-20, F2: 100-40-40 and F3: 150-60-60 Kg/ha. Yield data of different genotypes (70 inbreds/14 hybrids) was recorded and used as the main criteria for classifying genotypes for nitrogen efficiency.
Traits Affected by Low Nitrogen Based on the results of one-year field experiment, a significant reduction in all the traits viz. grain yield, plant height, cob length and test weight was observed at low levels of fertility. i) Grain yield Grain yield is one of the indicators which can be used for the selection of low nitrogen responsive genotypes. All the genotypes irrespective of inbreds and hybrids showed a reduction in grain yield at low levels of fertility. This was due to poor grain filling and kernel abortion in most of the genotypes. Present findings are similar to those of Below (1996), who also reported that N stress results in low yield in different genotypes of maize. Inbreds viz. HKI-323, HKI-193-1, HKI-193-2, HKI-1344, HKI-1354-2, HKI-1040-3, 288D, 1352-58-9 were identified as the highly N efficient whereas hybrids viz. HM-6, HQPM-1, HHM-1 and HM-4 were the N efficient hybrids. It was also observed that hybrids were having higher grain yield at all levels of fertility as compared to inbreds (Fig. 5). ii) Plant height A decrease in plant height of both inbreds and hybrids was observed at lower doses of nutrient. The decrease in plant height of genotypes at reduced levels of fertility may be due to the reduction in growth of

175
plants because of nutrient deficiency as plants require some minimum level of nutrients to show optimum growth. Below et al., also reported that nitrogen deficiency affects the plant growth and ear height probably to affect the source sink relationship. HKI-1040-9, HKI-536C, HKI-326, HKI-1035-10, HKI-285D, 1040C2x1011, HM-6, HQPM-1 and HHM-1 were some of the genotypes identified with desirable plant height. Similarly the reduction in hybrids was lesser as compared to inbreds at low levels of fertility (Fig. 6).
iii) Cob length Like other morphological characters, cob length of all the genotypes irrespective of inbred and hybrids was also affected by reducing the levels of fertility. With increase in the doses of nutrients a concomitant increase in the cob length was observed at all the levels of fertility. Hybrids were having comparatively lesser nutrient affect on cob length (Fig. 7). HKI-1350, HKI-1040-3, HKI-1332,HQPM-1, HM-6 and HM-5 were some of the genotypes identified with comparatively longer cob length.. iv) Test weight This trait also showed a reduction at lower levels of fertility. However, with increase of fertility levels a significant increase was observed in test weight irrespective of inbreds and hybrids. Genotypes viz. HKI-877, HKI-1011, HKI-3-4-8, HKI-551-1, HM-7, HM-6, HQPM-1, HM-4 and HM-5 showed less reduction in test weight at lower levels of fertility (Fig. 8). These findings are supported by Lantin and Octavio (1985), who reported that hybrids are efficient users of nitrogen as compared to open pollinated varieties (OPV) under both low and high nitrogen regimes. Similarly inbreds in comparison to hybrids are less efficient user of nitrogen may be due to their slow growing habit. Conclusion Most of the abiotic stresses including drought and low nitrogen are complex problems because they are governed by polygenes. Thus they are not dependent on one factor/one character. Therefore, to tackle such problems combination of lines possessing desirable characters for drought and low nitrogen tolerance is required to yield the desired results. Several morpho-physiological and biochemical traits are responsible for drought tolerance. Morpho-physiological traits like stay green, strong plant with better root system, prolificacy, short ASI, biochemical traits like proline content, sugar content and chlorophyll stability could be used to identify drought tolerant genotypes under laboratory and field conditions by using effective screening technique, but only if clear association between theses traits and yield under drought in the field can be demonstrated. Similarly parameters desirable for improving N use efficiency include: high rate of N uptake and assimilation during the grain filling period, high rate of translocation of N to developing grain and retention of green leaf area and efficient C assimilation during grain filling. For convenience while incorporating drought and low N tolerance traits, a hybrid breeding methodology will be the simplest approach, since heterosis favoured stress tolerance. Single cross hybrids having shorter ASI under drought, early maturity and high yield under stress and well-watered or high N conditions should be selected.

176
References
Below, F.E 1996 Growth and productivity of maize under N stress. Proc. Symp. Developing Drought and low N tolerant maize, CIMMYT, Mexico, March 25-29.pp 235-240.
Bolanos, J. and Edmeades, G.O. 1996. The importance of the anthesis- silking interval in breeding for drought tolerance in tropical maize. Field Crop Res. 48: 65-80.
Bolanos, J. and Edmeades, G.O. 1993b. Eight cycles of selection for drought tolerance in low land tropical maize. II. Responses in reproductive behaviour. Field Crops Res. 31 : 253-268.
Classen, M.M. and Shaw, R.H.1970. Water deficits effects on corn II. Grain Components. Agron. J. 621: 652-655.
Dass, Sain; Meena Kumari and Arora, P. 1999. Morphological Traits associated with drought tolerance in maize (Zea mays L.). Annals of Agri-Bio. Res. 4(2): 193-196.
Dass, Sain; Arora, P. ;Meena Kumari and Dharam Pal. 2001. Morphological Traits determing drought tolerance in maize (Zea mays L.). J. Agri. Res. 35 (3):90-93.
Dass, Sain; Meena Kumari and Arora, P. 2001. Physiological parameters governing drought tolerance in maize (Zea mays L.). I.J. Agricul. Sci. (submitted).
Dass, S., Singh, N.N., Dang, Y.P. and Dhawan, A.K. 1996. Morpho-physiological basis for breeding drought and low N tolerant maize genotypes in India.Paper presented in the symposium on developing drought and low nitrogen tolerant maize at CIMMYT, Mexico, March 24-29, 1996.
Deckard, E.J., R.J. Lambert, and R.H. Hageman. 1973. Nitrate reductase activity in corn leaves as related to yield of grain and grain protein. Crop Sci. 13: 343-350.
Edmeades, G.O.; Bolanoes, J; Hernandez,M. and Bello.S. 1989. Underlying causes of reduced anthesis-silking-interval Tuxpeno Sequia. Paper prepared for the ASA meetings, Lac Vegas, Nevada, USA, 15-21 October 1989.
Fisher, K.S., Johnson, E.C. and Edmeades, G.O.1982. Breeding and selection for drought resistance in tropical maize. In: Drought resistance in crops with emphasis on rice. IRRI, Los Banos, Phillippines, pp. 377-399.
Fisher, K.S; Johnson,E.C. and Edmeades, G.O.1985. Breeding and selection for drought resistance in tropical maize. In : International maize and wheat improvement center. Londres 40.
Ghosh, A.B and R.Hassan 1980. Nitrogen fertility status of Indian soils. Fert. News 25: 19-21.
Lantin, M.M. and G.Octavio.1985. Corn production in Philippines. Problems and Prospects. J. Agric. Econ. And Dev.1:32-54.

177
Miller, L.C. ; Vasilas,B.P. ; Taylor,R.W. ; Evans,T.A. and Gempesaw,C,M., 1995. Plant production and hybrid considerations for dryland corn production on drought susceptible soils. Can. J. P. Sci.. 15:1, 87-91.
Peoples, M.B., D.F. Herridge, and J.K.Ladha. 1995. Biological nitrogen fixation: An efficient source of nitrogen for sustainable agricultural production? Plant and Soil. 174:3-28.
Robins,J.S.,Domingo,L.E.1953. Some effects on severe moisture deficits at specific stages in corn. Agron. J. 45 : 618-621.
Subramanyam, M. 1992. Genetics of some physiological and morphological parameters of drought resistance in maize(Zea mays L.). Ph. D. thesis, Division of Genetics, IARI, New Delhi.
Tollenaar, M. 1977. Sink-source relationships between reproductive development in maize. A review. Maydica 22:49-75.
Turner, N.C., 1976. Adaptation to water deficits : a changing perspective. Aust.J.PlantPhysiol. 13: 175-190.
Van Oosterom, E.J.; Jayachandran, E.J.R. and Bidinger, F.R. 1996. Diallel analysis of the staygreen trait and its component in sorghum. Crop Sci. 36 : 549-555.

Differential behaviour of different genotypes w.r.t. Yield/plant in different drought environments
0.00
10.00
20.00
30.00
40.00
50.00
60.00
70.00
80.00
WW IR1 IR2 IR3 IR4 IR5
Different drought environments
yiel
d/pl
ant (
g)
LinesHybridsChecks
Figure 1:
178

Differential behaviour of different genotypes w.r.t. ASI in different drought environments
0.00
2.00
4.00
6.00
8.00
10.00
12.00
WW IR1 IR2 IR3 IR4 IR5Different drought environments
ASI (
d)
LinesHybridsChecks
Figure 2:
179

Differential behaviour of different genotypes w.r.t. root biomass
0.00
5.00
10.00
15.00
20.00
25.00
30.00
WW IR1 IR2 IR3 IR4 IR5
Different drought environments
Root
bio
mas
s (g
)
LinesHybridsComposites
Figure 3:
Differential behaviour of genotypes w.r.t. chlorophyll stability index
0.000.050.100.150.200.250.300.35
WW IR2 IR3Varied drought environments
Chl
orop
hyll
stab
ility
in
dex
Lines
Testers
Hybrids
Checks
Fig. 4:
180

0
30
60
90
120
150
F0 F1 F2 F3
Fertility levels
GR
AIN
YIE
LD(g
/pla
nt)
INBREDHYBRID
Figure 5. Comparative performance of inbreds and hybrids w.r.t grain yield
0
50
100
150
F0 F1 F2 F3
FERT IL IT Y L EV EL S
PLA
NT
HEI
GH
T (c
m) INBRED
HY BRID
Figure 6. Comparative performance of inbreds and hybrids w.r.t plant height
181

0369
121518
F0 F1 F2 F3
FERTILITY LEVELS
CO
B L
ENG
TH (c
m)
INBRED HYBRID
Figure 7. Comparative performance of inbreds and hybrids w.r.t cob length
182

0
5
10
15
20
25
30
35
1 2 3 4
FERTILITY LEVELS
TEST
WEI
GH
T (G
)
INBREDSHYBRIDS
Figure 8: Comparative performance of inbreds and hybrids w.r.t test weight
183

Picture 1.
Picture 2.
184

Annex 1 Hand Notes for Presentation by José Crossa
185

Basic Concepts in Experimental Design
One of the most persistent misconceptions about statistics in that it is merely a collection of calculating routines for analyzing data already collected. Many otherwise competent researchers fall into the following trap: they begin with a vague notion of the topic of their research and proceed to collect data, often very large amounts of data; only after these data are collected do they ask themselves exactly how the data are to be analyzed and specifically what can it show – or not show! They assume that their friendly neighborhood statistician can make sense out of their experiment. Occasionally this is true but more often it is not. Each statistical procedure is based on a particular set of assumptions. If the data have been collected with these assumptions in mind, the analysis is usually easy; if not, all too often the researcher finds that either the data do not address the objectives of the experiment or, worse yet, the data cannot be meaningfully analyzed at all. It is difficult, therefore, to overemphasize the fact that the most important contribution of statistics to the experimental process is in the planning of strategies for the collection of data so that the researcher can obtain clearcut answers to his or her questions. The study of strategies for efficient plans for the collection of data which lead to proper estimates of parameters relevant to the researcher’s objective is known as Experimental Design. A properly designed experiment for a particular research objective is the basis for a successful experiment. An experiment which is poorly or inadequately designed is likely to lead to a situation known aptly as “garbage in – garbage out”. The purpose of this handout is to acquaint you with some of the basic terminology and considerations in experimental design.
186

Terminology of Experimental Design
1. An experiment is a planned inquiry to obtain new knowledge or to confirm or deny previous results.
2. The population of inference is the set of all entities to which the researcher
intends to have the results of the experiment be applicable 3. The experimental unit is the smallest entity to which the treatment is applied and
which is capable of being assigned a different treatment independently of other experimental units if the randomization was repeated. (This is the most seriously misunderstood and incorrectly applied aspects of experimental design).
4. A factor is a procedure or condition whose effect is to be measured. 5. A level of a factor is a specific manifestation of the factor to be included in the
experiment. 6. Experimental error is measure of the variation which exists among experimental
units treated alike. 7. A factor level is said to be replicated if it occurs in more than one experimental
unit in the experiment. Functions of replication:
a) To provide evidence of the repeatability of the results of the experiment. b) To provide an estimate of experimental error c) To improve precision of the experiment by reducing the standard error of
estimates of parameters involved in the experiment d) To facilitate extension of the results to a wide range of conditions. e) To permit control error variance
8. Randomization in the application of factor levels to experimental units occurs only if each experimental unit has an equal and independent chance of receiving any factor level and if each experimental unit is subsequently handled independently.
Functions of randomization:
a) To insure applicability of results to the entire population of inference.
187

b) To reduce the chance of systematic (and often unconscious) bias affecting
the accuracy of the estimated of the parameters of interest. c) To validate the use of probability theory as a tool of inference based on
experiment (i.e. sample) data.
The Design Process The experimenter should go through a series of steps before the experiment is conducted. These steps are not meant as a “cookbook” but rather as a reminder that these aspects of the experiment should be accounted for before it is conducted.
1. The experimenter should clearly understand what facts of results he or she is attempting to establish. These objectives should be stated in terms of population parameters which can be estimated by response variables. Care should be taken to ensure that the response variable can be reliably measured.
2. The experimenter should clearly understand what treatment factors will be involved and what levels of these treatments will be used. The experimenter should also understand that there is a direct relationship between the quality of the experiment and the number of levels: the fewer the levels, the better the experiment.
3. The experimenter should clearly understand what experimental units will receive the various levels of the various treatment factors.
4. The experimenter should precisely define the intended population of inference. Care should be taken to see that the experimental units used are a representative cross-section of the population.
5. The experimenter should decide how many experimental units will be assigned to each factor level. Remember, to do this, one MUST know the following:
a. What is the magnitude of precision required? That is, how wide a confidence interval is permissible or how big a difference between levels is biologically meaningful?
b. What is the variance among experimental units? One must be familiar with existing literature in the area; good journals normally require publication of estimates o experimental error. If you are not so lucky, you will have to do a “pilot study” to estimate the variance.
c. What coefficient of confidence is considered tolerable? Journals tend to be arbitrary about this: it has not been a subject of a great deal of careful thought. You will find 90%, 95% and 99% to be standard figures,
188

depending on the perceived seriousness of failing to include the parameter of interest.
One of the more tenacious misconceptions about statisticians is that they can somehow decide how many experimental units the researcher needs without the above information. They cannot (and anyone who says they can is trading in snake oil!)
6. As scheme to randomly assign experimental units to the various factor levels should be devised. Otherwise, systematic biases in the observations may occur or observations may not be truly independent, in either case destroying the validity of inference based on the data collected.
7. The experimenter should examine the experimental situation for any sources of potential variation in his or her data other than those identified as treatment factors or experimental error. If such sources of variation do in fact exist, experimental units can be grouped together in blocks (or pairs if only two treatment levels are being considered) so that the source of variation occurs between blocks rather than among blocks. (i.e. blocking effects will not be confounded with treatment effects).
8. The experimenter should plan ahead insofar as having and understanding of how the data are to be analyzed once collected. What parameters are to be estimated? How will they be estimated? What hypotheses will be tested? What procedures will be utilized to the test these hypotheses? A useful practice here is to write out a “skeleton analysis”, that is, and outline of the calculations to be performed and how there are to be interpreted. The importance of this step cannot be overstated. One of the most common errors in research is to conduct an experiment which cannot be analyzed.
9. In planning the analysis, the experimenter must decide what action will be taken if things go wrong. Ho will the analysis be done then? Or can it be done? The experimenter must never assume immunity to “Murphy’s Law”, which states “anything which can go wrong will go wrong”. Notice there is no suffix “for the other guy” attached to “Murphy’s Law”. (In 8 years as a consultant, I have yet to work with a researcher for whom everything went as planned).
If the experiment is excessively sensitive to departure from “the plan”, it must be revised to make it more resistant.
10. If any ambiguities arise in steps 1-9, a statistician should be consulted. Remember it is a wise use of time to obtain assistance prior to collecting data; afterward, there is likely to be a lot of wasted motion and it may be too late.
189

INCOMPLETE BLOCKS DESIGNS
Introduced by Yates (1936) (1939) (1940)
For exp. in plant breeding
These designs are arranged in blocks or groups that are smaller than a complete replication, in order to eliminate heterogeneity to a greater extent than is possible with RCBD. Objectives Make all comparisons among pair of treatment with equal precision BALANCED or PARTIALLY BALANCED I II III IV 1 1 2 3 4 1 4 7 7 1 5 9 10 1 8 6 2 4 5 6 5 2 5 8 8 7 2 6 11 4 2 9 3 7 8 9 6 3 6 9 9 4 8 3 12 7 5 8
190

BALANCED LATTICES
All pair of treatments are compared with the approximately the same precision. Every pair of treatments occur once and only once in the same block. Balanced Lattices {# of treatments} must be an exact square {size of block} square root I II III IV
(1) (2) (3) (4) (5) (6) (7) (8) (9) (10) (11) (12)1 1 2 3 1 4 7 1 6 8 1 9 5 2 4 5 6 2 5 8 9 2 4 6 2 7 3 7 8 9 3 6 9 5 7 3 8 4 3
LATTICE SQUARE
Every pair of treatment occurs once in the same row and once in the same column. Disadvantage of balanced lattices. Large # of treatments determines a large # of replicates to achieve the complete symmetry of the balanced designs.
PARTIALLY BALANCED DESIGNS Constructed in the same way as balanced lattices except that there are fewer replicates From Simple lattice 2 Reps Previous Designs Triple lattice 3 Reps
191

• Analysis is more complicated • Several different SE • When variation among blocks (rows or columns) is large, some pair of
treatments are more precisely compared than others. The simplest of the partially balanced designs are those with two associate classes Some pairs of treatments occur in the same block λ1 times and Other pairs of treatments occur in the same block λ2 times λ1 + λ2 are whole numbers
In lattice designs λ1 = 0 λ2 = 1
192

STATISTICAL ANALYSIS
Yates developed 2 methods:
Intra-blocks analysis
ijkkijiijk Etbr Y ++++= µ mean rep incomplete treatment error block are fixed effects
Inter-block analysis
ijkkijiijk Etbr Y ++++= µ mean rep incomplete treatment error block are random effects
zero ofmean have b variancehaveb
ij
2 ij bσ
When variation among incomplete blocks is no greater than the variation within blocks the analysis reduces to the RCBD
193

COMPARING INCOMPLETE BLOCKS AND RCBD
100 x latticeerror MSRCBDerror MS E =
lattice use 20 to15 ERCBD use 15 to10 E
><
G. Efficiency No. of Reps in lattice No. of Reps in RCBD50% 2 3 25% 4 5
RECTANGULAR LATTICES
Less symmetrical than the square lattices in the sense that there is a greater variation in the precision by which two treatments means are compared.
I II III 1 2 3 1 8 11 1 5 7 4 5 6 2 5 12 2 9 10 7 8 9 3 6 9 3 4 11 10 11 12 4 7 10 6 8 12
No two treatments are in the same block more than once.
194

Experimental Designs and
the Analysis of
Multilocation Trials
197

EXPERIMENTAL DESIGNS AND THE ANALYSIS OF MULTILOCATION TRIALS Objectives Within site considerations Experimental Designs Complete randomized block Resolvable incomplete block Lattices Alpha-lattices Row-Column Latinized Alpha and Row-Column Example – A Drought Maize Multilocation Trial Unreplicated design Spatial variability Across site considerations – assessing GE Structures of two way-tables Row-linear structure Concurrent structure (condition) The Biplot of Gabriel The additive and multiplicative model of Mandel Multiplicative models for two-way tables Additive model Tukey’s test of nodadditivity Mandel’s bundle of straight lines Optimal fit (SVD) SHMM model AMMI model GREG model SREG model COMM model Least squares estimates Diagnostic for choice of model form Cross validation Methods of Mandel Biplots SHMM clustering of sites and genotypes Applications in maize and wheat trials Three-way cluster and principal component analyses Applications in genetic resources and drought maize trials
195

OBJECTIVES
• To estimate contrast between genotypes (minimum error variance)
• To predict genotypic performance in new sites and future years
• To study Genotype x Environment Interaction (GE) and to assess yield stability
• To select superior genotypes
• To maximize genetic gains
196

WITHIN SITE CONSIDERATIONS
Experimental Designs Batchelor and Reed (1918) noted that soil variation tend to make adjacent orange tree yields alike Fisher (1937) observed that after the experimental area is selected the researcher has not guidance on soil variability except the fact that patches of soil in close proximity are more alike than those which are further apart. Fischer, 1931 Replication
Randomization Control local variability
Sound experimental designs (“a priori” control of residual variance) is the cornerstone of field experimentation irrespective of the role of any “a posteriori” model based analysis such as spatial analysis.
---BASIC PRINCIPLE--- ---CONTROL LOCAL VARIATION---
Arrangement of experimental units (plots) into roughly homogeneous groups. This groups are referred to as BLOCKS. BLOCKING attempts to minimize the variation between plots in the same block and maximize the variation between plots in different blocks. In the field BLOCKS are usually contiguous and can be either rectangular arrays of plots or a single line of plots. In other context BLOCKS can be days, race or weight of group of animals. Choice of experimental design has three components:
Treatment design (structured or nonstructured treatments) Error-control design
(arrangement of the treatments among EU – Rule) ---- > “A priori” control of residual variance ---- > “A posteriori” control of residual variance
197

error) alexperiment 2ˆ ˆ
Precision σσn
In order to detect difference between genotypes
'../2ˆ iin Υ−Υ<<σ
Sampling and observation designs Assume one variety has been assigned to all plots and denote Y as the plot grain yield An hypothetical additive model for Y is Y = u + Zv + b + e u = grand mean Zv = Extraneous trend that arised from agronomic and cultural intervention
(formation of irrigation banks, etc.) (Z is a matrix; v is a vector of affects) b = natural trend such as local fertility e = error term
198

COMPLETE RANDOMIZED DESIGN (CRD) The CRD assumes plots are uniform, that is there is no trend across the experimental field (error is the sample variance of plots). CRD is inappropriate for variety trials
199

RANDOMIZED COMPLETE BLOCK DESIGN (RCBD) Block is a characteristic of the EU and not of the genotypes
For t genotypes a CB has t EU (2t or 3t EU?) CB homogeneous (the trend is assumed constant within CB) Blocks and genotypes are orthogonal Difference between the effect of two genotypes A, B
[ ] =−+− )()(2/1 211 2 AAB YYYY B
=+−+ 2/)(2/)( 2121 AABB YYYY (Average B) – (Average A) Free of block effect * Maximum homogeneity of EU within a CB Maximum heterogeneity of EU in different CB * Blocks can be square or rectangular; in many cases are just columns of the array.
200

PROBLEMS!! * Large number of genotypes require larger CB BUT large CB do not effectively
control soil variability in the field * Orientation of the blocks (replicates) ---- > genotypes can occur at one end of the trial ---- > genotypes can occur in the same row more than once
Column Block 1 Block 2 Row 1 2 3 4 5 6
1 5 26 19 47 25 34 2 15 9 50 2 58 43 3 1 58 45 35 14 7 4 13 41 55 6 51 19 5 54 43 14 55 36 40 6 31 34 4 30 44 20 7 52 40 24 37 54 11 8 2 10 42 33 41 31 9 56 6 2 56 13 39 10 8 48 20 2 4 17 11 30 23 28 1 12 10 12 25 37 57 1 23 32 13 22 38 1 45 50 24 14 7 16 49 28 53 5 15 44 39 53 29 8 16 16 51 18 27 9 42 3 17 47 3 12 49 18 26 18 35 21 11 38 48 22 19 29 46 33 57 21 46 20 36 32 17 52 27 15
58 barley genotypes RCBD 2 reps (Cullis et al., 1996) There is a chance of bias if the yield potential at the end of the trial is lower or higher than other parts Improvement Block 1 -- > row 1 – 10 Block 2 -- > row 11 - 20
201

RESOLVABLE INCOMPLETE BLOCK
* The trend is assumed constant within IB Intra block analysis * Comparison of genotypes within block
Inter block analysis * Comparison of genotypes between blocks
(Blocks are considered random effects) t1 t3 t4 t5 SUB-BLOCK 1 t2 t3 t4 t5 SUB-BLOCK 2 t1 vs t2 can be compared through t3, t4, t5 with some lost in precision
202

LATTICES * Simple, double, triple and rectangular lattices of Yates are effective when plots are
LONG and NARROW PROBLEM!! --- > Not available for certain number of treatments * Square Lattices are effective when plots are SQUARE (control variability in two
directions) PROBLEMS!! --- > Number of genotypes should be a perfect square --- > Large number of replicates are required
203

ALPHA LATTICES
• Generalization of the lattices of Yates • Flexibility; alpha-lattice exist for all combination of genotypes, replicates and
plots per block • IB of different size • Checks in different sub-blocks • Alpha (0,1) Alpha (0,1,2) • Analysis can be done using PROC MIXEC of SAS
PROC MIXED; CLASS REP BLOCK GENOTYPE; MODEL YLD = GENOTYPE RANDOM REP BLOCK (REP); LSMEANS GENOTYPE;
204

ALPHA LATTICES
Column
Block 1 Block 2 Row 1 2 3 4 5 6
1 2 55 54 52 16 12 2 45 6 60 24 22 41 3 28 5 30 27 34 11 4 46 47 25 29 32 15 5 8 36 51 14 23 49 6 56 20 21 58 9 39 7 33 7 19 53 18 37 8 1 40 17 57 3 48 9 26 10 13 43 42 59
10 31 38 35 4 44 50 11 24 11 1 33 17 47 12 6 10 7 55 26 5 13 41 14 35 44 57 29 14 28 2 39 54 52 13 15 8 43 23 12 40 60 16 32 51 18 4 22 42 17 21 48 36 50 38 16 18 15 56 30 53 19 45 19 3 25 58 31 37 45 20 27 9 59 20 34 46
205
58 barley genotypes RCBD 2 reps (Cullis et al., 1996) Block 1 = row 1–10 of Col 1 Block 2 = row 11-20 of Col 2 and so on; there are 12 IB Replicates are rearranged so rep 1 and 2 are below each other. This ensure that genotypes will not occur at the end of the trial and that genotypes will not occur in the same row more than once. PROBLEM!! EXTRANEOUS EFFECTS CAN BE CONFOUNDED WITH THE ROWS OF THE DESIGN (SERPENTINE HARVESTING, LODGING, SLOPE, WIND) AFFECTING THE RECOVERY OF THE YIELD

PROBLEM IN ALPHA LATTICE!! Extraneous effects can be confounded with the rows of the design (serpentine harvesting, lodging, slope, wind) affecting the recovery of the yield. This can be overcome by using a resolvable ROW-COLUMN DESIGN (control variability in two directions)
206

ROW-COLUMN DESIGN
• Generalization of the square lattices of Yates • More flexible (less restrictions) and more economical than SQUARE LATTICE • Treatments are arranged in rectangular form (rows and columns) • Analysis can be done using PROC MIXED of SAS
PROC MIXED; CLASS REP COL ROW GENOTYPE; MODEL YLD = GENOTYPE RANDOM REP COL (REP) ROW (REP); LSMEANS GENOTYPE
When analyzing ROW-COLUMN designs several things may happen
1. COL(REP) or ROW (REP) have variance component estimates of zero 2. Some spatial variability may exist 3. True gradient is at 45 degree angle to the ROW and COLUMN; this effectively
creates a ROW*COLUMN interaction. The symptoms are apparently negligible ROW and COLUMN effects along with an unexpectedly high error variance (or CV) and estimates of treatments means that don’t make sense
207

WHAT DO WE DO? ***Model 1*****; **row-col standard design**; PROC MIXED; CLASS REP COL ROW ENTRY; MODEL YLD=ENTRY; RANDOM REP COL(REP) ROW(REP); ***Model 2*****; ***spatial model**; PROC MIXED; CLASS REP ENTRY; MODEL YLD=REP ENTRY; REPEATED / SUBJECT=REP TYPE=SP(SHP) (ROW COL); PARMS (2) (1); ***Model 3*****; **rcbd rep=blk**; PROC MIXED; CLASS REP ENTRY; MODEL YLD=REP ENTRY; Compare the –2 REML Log Likelihood of these models
• Subtract (model 3) – (model 2) and compare with chi-square with 1 df for evidence of spatial variability
• Subtract (model 3) – (model 1) and compare with chi-square with 2 df [REP and one for COL(REP)]for evidence of ROW or COL effect.
208
LATINIZED ALPHA LATTICE AND ROW-COLUMN DESIGNS
If replicates are contagious then columns (blocks) of each replicate form long columns running across the field It is sensible to ensure that each genotype occurs only once in each long column; such designs are said to be latinized. Still, there is no account of spatial neighbors. Incomplete block designs, such as latinized row-column, model the trend as discrete or discontinuous and do not model the natural variation in the field as well as smooth variance models (spatial models).
209

SPATIAL CORRELATION MODELS (from Cullis, Gilmour and Frensham, 1996)
Yield of plots in close proximity in the field are more alike. If random trend component is zero, then the correlation between neighboring plots would be zero. Consider the following residuals: Range Plots within a range
1 e11 e12 e13
2 e21 e22 e23
3 e31 e32 e33
Define the lag 1 spatial correlation of error between plots in adjacent ranges r(1,0)=corr(eij, ei+1, j) (lag one spatial row correlation) trend between rows Define the lag 2 spatial correlation of error between plots in adjacent ranges r(2,0)=corr(eij, ei+2, j) (lag one spatial row correlation) trend between rows Define the lag 1 spatial correlation of error between adjacent plots in a range r(0,1)=corr(eij, ei, j+1) (lag one spatial column correlation) trend between columns Define the lag 1 spatial correlation of error between adjacent plots in a range r(0,2)=corr(eij, ei, j+2) (lag one spatial column correlation) trend between columns
210

The entire set of correlations can be presented in a matrix. If there is no trend all the spatial correlations of the residuals will be zero. Sample correlation r(1,0) Range Plots within a range
1 e11 e12 e13
2 e21 e22 e23
3 e31 e32 e33
Sample correlation r(2,0) Range Plots within a range
1 e11 e12 e13
2 e21 e22 e23
3 e31 e32 e33
As the lag increases, the number of pairs over which the correlation is calculated decreases, hence its accuracy.
211

Sample correlation r(0,1) Trend between columns Range Plots within a range
1 e11 e12 e13
2 e21 e22 e23
3 e31 e32 e33
Sample correlation r(0,2) Trend between columns Range Plots within a range
1 e11 e12 e13
2 e21 e22 e23
3 e31 e32 e33
212

Sample correlation r(1,1) between plots and their South-East neighbors Range Plots within a range
1 e11 e12 e13
2 e21 e22 e23
3 e31 e32 e33
Sample correlation r(1,-1) between plots and their North-East neighbors Range Plots within a range
1 e11 e12 e13
2 e21 e22 e23
3 e31 e32 e33
213

MATRIX OF SPATIAL CORRELATIONS
Distance apart (Ranges)
Distance apart (Plots within a range)
0 1 2 3 … 0 1 r(0,1) r(0,2) r(0,3) …
1 r(1,0) r(1,1) r(1,2) r(1,3) …
2
r(2,0) r(2,1) r(2,2) r(2,3) …
3
r(3,0) r(3,1) r(3,2) r(3,3) …
… … … … … … Heterogenity within a site can be quickly appreciated by looking at the matrix of spatial correlations
214

UNIFORMITY TRIAL
MATRIX OF SAMPLE SPATIAL CORRELATION
Distance apart (Ranges)
Distance apart (Plots within a range)
0 1 2 3
0 1 0.62 0.42 0.34
1 0.09 0.06 0.05 0.07
2
0.01 0.01 0.04 0.04
There are six ranges of 30 plots each Correlation is between plots within a range
215

FROM A GENERAL MODEL TO A TREND + ERROR MODEL
The most general model for the analysis of field trial data is: y = mean + rep + genotype + error
• For simplicity consider the uniformity trial (see above matrix of special correlations) where there is only one genotype and assume we impose a RCBD where the blocks are the six ranges of 30 plots each. The general model now has the following terms: y = mean + rep + error It is assumed that individual plot error (e) are independently and identically distributed normal deviates with mean zero and constant variance (i.i.d. N(0, σ2). Consider the results from the previous spatial correlation matrix where spatial correlation (trend) is evident between plots within a range (variability is in one direction). If the assumption that (i.i.d. N(0, σ2) is satisfied then the sample lag 1 autocorrelation (i.e., the correlation of errors from adjacent plots) should be approximately zero.
• Suppose that instead of imposing an RCBD on this trial we impose an incomplete block. Now the model is as follows: y = mean + rep + trend + error The vector of plot errors is partitioned into two components, TREND + ERROR For incomplete block designs trend = incomplete block.
216

Example multilocation trial of
Maize Grown Under Drought
Stress Alpha-Lattice vs RCBD
217

Table 1. Site, genotype and country names and site and genotype codes of 21 sites and 10 genotypes included in trial EDEVT.
Site name Country name Site code
Tlaltizapan (IS)* Mexico S1 Tlaltizapan (SS)+ Mexico S2 Tlaltizapan (WW)@ Mexico S3 Jipijapa Ecuador S4 Portoviejo Ecuador S5 Chiclayo Peru S6 St. Cruz Bolivia S7 Charagua Bolivia S8 Makaholi Station Zimbabwe S9 Chitala Malawi S10 Kutamani Kenya S11 Awassa Res. Station Ethiopia S12 Tak-Fa Thailand S13 Godhra India S14 Rampur Nepal S15 Bogor Indonesia S16 St. Cristobal Nicaragua S17 Jutiapa Guatemala S18 Llano de la Cruz Panama S19 Cd. Obrego Mexico S20 New Delhi India S21
Genotype name Genotype code1
Santa Rosa 8330 RE# G3 Across 8331 RE# G4 Pool 18 Sequía C3 F2 G5 Pool 18 Sequía C2 best ASI F2 G6 Pool 18 Sequía C3 smallest tassels F2 G7 TEWF Drought Tol. Syn.2 F2 G8 TEYF Drought Tol. Syn.2 F2 G9 Pool 16 C20 Syn. 1 F2 G10 TIWD Drought Tol. Population C0 G11 DTP1 C5 Early Selection F2 G12 * IS = Intermediate drought stress. + SS = Severe drought stress. @ ww = Well-watered 1 G1 and G2 are the local checks # RE = Reference checks
218

Table 3. Minimum (LMIN), maximum (LMAX), and average (LAVER) standard error of the difference between two adjusted genotypic means obtained from alpha lattice design, standard error of the difference between two unadjusted means obtained from RCBD (BAVER) and minimum (EMIN), maximum (EMAX) and average (EAVER) efficiencies for 21 sites included in trial EDEVT.
Alpha lattice RCBD Efficiency
Site LMIN LMAX LAVER BAVER EMIN EMAX EAVER S1 0.14 0.15 0.15 0.15 7.12 2.85 5.16 S2 0.21 0.22 0.22 0.24 13.76 7.89 11.05 S3 0.34 0.36 0.35 0.42 25.69 17.40 21.82 S4 0.19 0.21 0.21 0.25 30.35 18.43 23.13 S5 0.51 0.51 0.51 0.53 4.38 4.38 4.38 S6 0.30 0.31 0.31 0.31 4.67 0.69 2.20 S7 0.23 0.24 0.24 0.25 7.94 2.19 4.40 S8 0.76 0.76 0.76 0.76 0.30 0.30 0.30 S9 0.47 0.52 0.50 0.62 30.63 18.96 23.56 S10 0.43 0.46 0.45 0.45 5.46 0.02 1.56 S11 0.09 0.09 0.09 0.10 13.55 8.23 10.26 S12 0.46 0.48 0.47 0.55 20.61 14.00 17.55 S13 0.38 0.38 0.38 0.38 0.00 0.00 0.00 S14 0.10 0.10 0.10 0.11 12.33 5.14 7.93 S15 0.75 0.75 0.75 0.75 0.00 0.00 0.00 S16 0.37 0.39 0.38 0.41 10.08 3.47 6.02 S17 0.33 0.34 0.34 0.34 2.24 -0.12 0.76 S18 0.46 0.46 0.46 0.46 0.00 0.00 0.00 S19 0.27 0.27 0.27 0.27 0.00 0.00 0.00 S20 0.23 0.25 0.25 0.27 15.94 5.48 8.65 S21 0.49 0.51 0.50 0.51 3.48 0.19 1.43
Aver. 0.36 0.37 0.36 0.39 9.93 5.21 7.15
219

Table 4. Standard error (Std. Error) and probability (Prob.) of pairwise comparisons of genotypes included site S9 of EDEV that changed their significance when unadjusted means from RCBD where used instead of adjusted means from the alpha lattice.
RCBD Alpha lattice
Contrast Std. Error Prob. Std. Error Prob.
Local check 1-G9 0.61374 0.159 0.4914 0.050 Local check 1-G10 “ 0.110 0.4934 0.017 Local check 2-G7 “ 0.090 0.4914 0.017 Local check 2-G8 “ 0.068 0.4914 0.041 Local check 2-G9 “ 0.069 0.4914 0.013 Local check 2-G10 “ 0.046 0.4934 0.004 G4 - G11 “ 0.148 0.4914 0.050 G4 - G12 “ 0.204 0.4914 0.027 G5 - G12 “ 0.136 0.4914 0.035 G10 - G12 “ 0.551 0.4914 0.040
220