Reduction of cure-induced stresses in thermoset polymer ...
59
University of Tennessee, Knoxville University of Tennessee, Knoxville TRACE: Tennessee Research and Creative TRACE: Tennessee Research and Creative Exchange Exchange Masters Theses Graduate School 5-2003 Reduction of cure-induced stresses in thermoset polymer Reduction of cure-induced stresses in thermoset polymer composites via chemical and thermal methods composites via chemical and thermal methods Brett Hardin Franks Follow this and additional works at: https://trace.tennessee.edu/utk_gradthes Recommended Citation Recommended Citation Franks, Brett Hardin, "Reduction of cure-induced stresses in thermoset polymer composites via chemical and thermal methods. " Master's Thesis, University of Tennessee, 2003. https://trace.tennessee.edu/utk_gradthes/5224 This Thesis is brought to you for free and open access by the Graduate School at TRACE: Tennessee Research and Creative Exchange. It has been accepted for inclusion in Masters Theses by an authorized administrator of TRACE: Tennessee Research and Creative Exchange. For more information, please contact [email protected].
-
Upload
khangminh22 -
Category
Documents
-
view
0 -
download
0
Transcript of Reduction of cure-induced stresses in thermoset polymer ...
University of Tennessee, Knoxville University of Tennessee, Knoxville
TRACE: Tennessee Research and Creative TRACE: Tennessee Research and Creative
Exchange Exchange
Masters Theses Graduate School
5-2003
Reduction of cure-induced stresses in thermoset polymer Reduction of cure-induced stresses in thermoset polymer
composites via chemical and thermal methods composites via chemical and thermal methods
Brett Hardin Franks
Follow this and additional works at: https://trace.tennessee.edu/utk_gradthes
Recommended Citation Recommended Citation Franks, Brett Hardin, "Reduction of cure-induced stresses in thermoset polymer composites via chemical and thermal methods. " Master's Thesis, University of Tennessee, 2003. https://trace.tennessee.edu/utk_gradthes/5224
This Thesis is brought to you for free and open access by the Graduate School at TRACE: Tennessee Research and Creative Exchange. It has been accepted for inclusion in Masters Theses by an authorized administrator of TRACE: Tennessee Research and Creative Exchange. For more information, please contact [email protected].
To the Graduate Council:
I am submitting herewith a thesis written by Brett Hardin Franks entitled "Reduction of cure-
induced stresses in thermoset polymer composites via chemical and thermal methods." I have
examined the final electronic copy of this thesis for form and content and recommend that it be
accepted in partial fulfillment of the requirements for the degree of Master of Science, with a
major in Engineering Science.
Madhu Madhukar,, Major Professor
We have read this thesis and recommend its acceptance:
Accepted for the Council:
Carolyn R. Hodges
Vice Provost and Dean of the Graduate School
(Original signatures are on file with official student records.)
To the Graduate Council:
I am submitting herewith a thesis written by Brett Franks entitled "Reduction of CureInduced Stresses in Thermoset Polymer Composites via Chemical and Thermal Methods." I have examined the final paper copy of this thesis for form and content and recommend that it be accepted in partial fulfillment of the requirements for the degree of Master of Science, with a major in Engineering Science·.
We have read this thesis and Recommend its acceptance:
�2 !�-
Dr. Madhu Madhukar, Major Professor
Reduction of Cure-Induced Stresses in Thermoset-Polymer
Composites via Chemical and Thermal Methods ·
A Thesis
Presented for the
Master of Science
Degree
The University of Tennessee, Knox ville
Brett Franks
May 2003

Copyright © 2002 by Brett Franks.
All rights reserved.
ii
DEDICATION
This thesis is dedicated to my love Lisa and her family,
And to my parents Omby and Jessica,
And to my sister Lia
who have contributed so much to my growth, both
personally and professionally over the years. I cannot
begin to thank all of you enough for your support and for
the joy I have been so fortunate to experience with you, and
I eagerly await the blessed opportunity to treasure many
more moments together.
iii
ACKNOWLEDGEMENTS
So many people have been integral to the successful completion of this study.
First and foremost, I would like to thank Dr. Madhu Madhukar for his wisdom, guidance,
and patience. He has taken hours of his time to help this research progress correctly and
efficiently, yet has always found the time to care about the graduate student personally as
well. His contributions to my understanding of this research and its importance will be
something I will never forget. His professional knowledge and personal spirit have
encouraged me through even the most difficult of dilemmas. He has been an honor and a
pleasure with whom to work.
I would also like to thank those members of my graduate committee Dr. Y. Jack
Weitsman and Dr. Kevin Kit for appropriate suggestions that have led to a better
publication. Thank you to Dr. Sindee Simon at Texas Tech University for the
opportunity to develop a cutting-edge concept, for your patience, and for the time and
effort it takes to make a long-distance collaborative effort work. Thank you Doug
Logsdon for training me on the equipment. This research was supported in part by the
United States Air Force under contract number RO 1-1373-082. Their support is most
gratefully acknowledged.
Finally, I would like to thank Lisa for her ability to love and keep sanity (and
good humor) present at times when we needed it most. Thank you to my family who has
wholeheartedly supported and cheered with encouragement through a long educational
process. Thank you Brock, Lisa T., and the many friends who have also given words of
encouragement. I could not have done this without you.
iv
ABSTRACT
This thesis discusses three different experiments in which we examine in-cure
residual stresses in carbon/epoxy thermoset polymer composites. Throughout this
research the Cure Induced Stress Test (CIST), developed at UT, has been used. The
CIST is a unique experimental procedure in which the effect of polymer volume change
on fiber stress is determined by monitoring the change in fiber load. In the first part of
the research, we addressed the role of fiber-matrix interface on the fiber-load
measurement. For this purpose, the CIST experiments were conducted with as-received
and Teflon-coated fibers. The Teflon coating was intended to weaken the fiber-matrix
interface. The use of a Teflon coating was shown to have no effect on the fiber load
measurements during cure. Thus, it is concluded that the fiber-matrix interface does not
significantly influence the data obtained in the CIST experiments. Second, we use CIST
to verify a new methodology to reduce the internal stresses involving a chemically
engineered ring-opening reaction that is still under development. The purpose of the
ring-opening reaction is to offset the polymer shrinkage. Finally, we use CIST to expand
upon a previous study to determine the build-up of polymer stiffness during cure.
Comparison of stiffness curves obtained from CIST and measured stiffness values of
fully and partially cured polymer samples show a good agreement.
V
TABLE OF CONTENTS
Chapter 1 Literature Review and Introduction ...... ... ... ..... ........... ........ ......... 1
1.1 Literature Introduction ....... ........ ... .. . ... . ..... ... .......... ............ 1 1.2 CIST Experimental Introduction ......................... . ... ............... 5 1.3 Motivation for this Research . ......... ... .. ...... ........... .............. ... 6
Chapter 2 Effects of bonding at the fiber/matrix interface on CIST results ........... . 8
2.1 Introduction ............... ......... . . . ... .. . .... . ....... .. ............. ........ 8 2.2 Procedure ....... ....... ..... . . .... ...... .-. .. .... .. .. .......... .................. 8 2.3 Results ........ ..... ... ..... .. . .. . .... ................................... ........ 9 2.4 Conclusions .......... .......... . ....... . ... ... ...... ........ . .... ............. 10
Chapter 3 Effects of chemical ring-opening on stresses during cure in composites 11
3 .1 Introduction ............. ............ . ................................ ......... 11 3 .2 Procedure ....... ... ..... ... . .... ............. ............................... .. 11 3.3 Results ........................... .. ............................................ 12 3.4 Conclusions ... .............. ............................. .......... ........... 13
Chapter 4 Effects of cure temperature and cure length on Young's modulus ......... 14
4.1 Introduction ................................. .. ...... ...................... ... 14 4.2 Procedure ................ .. .. ................. ................................ 14 4.3 Results ............................ .. . ..... ... ......... ......... ........... .... 16' 4.4 Conclusions .......... .... ...... .. . ... ....... ....................... .......... 17
References .. ............. ...... ....................... . .... ..... ............................... ...... 18
Appendix ............ .......... ...... .............. .................. .. . . ............................. 22
Vita ........................................................................ -........................... 49
vi
LIST OF FIGURES
1. Schematic of CIST setup .................................................................. 26 2. Photo of CIST setup ........................................................................ 27 3. Fiber response to polymer tension and compression ................................... 28 4. Typical CIST results ........................................................................ 29 5. 3501-6 CIST results without Teflon .................................................... .30 6. 3501-6 CIST results with Teflon ......................................................... 31 7. Comparison of Teflon and non-Teflon results .......................................... 32 8. Matrimid A and SOC chemical structures .............................................. 33 9. Matrimid A and SOC structures after reacting (after ring opening) ......... � ........ 34 ., 10. Matrimid B chemical structure ........................................................... 35 11. CIST results for isothermal cure using combinations with and without SOC ..... .36 12. Trial 1 CIST results for A+B .............................................................. 37 13. Trial 2 CIST results for A+B ............................................................. 38 14. Trial 1 CIST results for A+B+SOC ................. · .................................... 39 15. Trial 2 CIST results for A+B+SOC .................................................... .40 16. Trial 1 CIST results for A+B+SOC+Catalyst ......................................... .41 17. Trial 2 CIST results for A+B+SOC+Catalyst ......................................... .42 18. Volumetric dilatometry setup ............................................................ .43 19. 136 C Partially Cured Stress Strain Curves ............................................ .44 20. 136 C Fully Cured Stress Strain Curve ................................................ .45 21. 169 C Partially Cured Stress Strain Curve ............................................. .46 22. 169 C Fully Cured Stress Strain Curve ................................................. .47 23. Scaled volumetric dilatometry results (compare with Table 2) ...................... .48
vii
Chapter 1
Literature Review and Introduction
1.1 Literature Review
Composites and polymers have been used in a variety of fields to devise
innovative products with enhanced properties versus other materials such as metals,
woods, and ceramics. For instance, new age applications of composites and polymers
include the production of lightweight sporting equipment, flame retardant cotton, stronger
and lighter bridges and airplanes, medical products with improved biocompatibilty, and.
conductive plastics. Additional applications include reduction of environmental waste in
the paper industry and more durable materials for high-speed civil transport [1-5].
The factors that influence a composite's properties are its constituents; i.e. fiber,
matrix, and fiber-matrix interface. In the case of thermoset polymer composites, the cure
cycle also influences composite properties. Recently, the study of how cure cycles affect
a composite's properties [6-15] and the study of cure-induced stresses have been of much
research [16-20]. Cure-induced stresses are the result of polymer volume change during
cure an� have been of interest due to problems with manufacturing large parts in
industry. For example, a plane wing must be constructed from many small parts due to
part warpage during the cure cycle. Understanding the cure cycle's effects on polymer
volume change will allow for better part fit-up and for considerable reductions in the cost
of manufacturing of larger parts by using fewer part molds.
Methods to modify and improve composite properties include modification of the
cure cycle and modification of the polymer chemistry. The thermal cure cycle has been
1
· modeled via finite element analysis to determine the optimal cure for resin flow in resin
transfer molding [6]. It has been found that the degree of cure has a strong influence on
the mechanical properties of phenolic resins based on varying the postcuring times [7].
Leterrier et al. have linked interfacial shear strength and interfacial internal stresses
resulting from cure to the long-term durability of a composite [8].
Michaud et al. [9] developed a process whereby robust cure cycle optimization is
· achieved. The optimization occurred by implementing a computerized algorithm with
various cure crossover and temperature constraint inputs to produce a cure cycle output.
Cure crossover occurs when, during cure, the temperature of the center of a composite
laminate rises to where it is higher than the temperature of the composite on the outside
of the laminate. The temperature constraints could be an initial range of starting
temperatures. For example, in a two-step cure cycle, their algorithm suggested that the
optimal cure cycle started at 53.625 °C and went to the user defined post-cure
temperature of 90 °C at the optimal time of 193 minutes. They found that the optimal
cure cycle always had at least one cooling stage before the final post-cure heating stage.
Their cure cycle optimization, which allowed for four changes in cure temperature
(heating and cooling), decreased the number of inferior parts produced in one cure cycle
by 80%. However, some edge effects in the heat transfer were not taken into account, so
experimental verification of the computer algorithm showed that a three-dimensional
algorithm was needed to achieve true optimization. Several other researchers have also
used computer algorithms to achieve cure cycle optimization [10-12).
Similar cure cycle findings are reported for the epoxy matrix polyphenylene ether
ketone [13). The optimal cure cycle was a stepwise cure cycle comprising two
2
isothermal processes at different temperatures. The cure cycle simulation developed in
this study also indicates that the first isothermal temperature determines resin fluidity
while the second isothermal temperature determines cure uniformity. Thermally treated
composites have also been shown to have a decrease of elongation at break and an
increase of the Young's modulus [14]. In another investigation, researchers examined
polymer compo'sites reinforced with short carbon fibers. After curing at optimal thermal
curing conditions, the composite showed excellent thermal stability, with initial
deco�position temperature as high as 540° C [15]. These studies highlight the
importance of examining changes in properties of composites due to thermal changes in
the cure cycle.
One of the main sources of part warpage during composite manufacture is the
build up of residual stresses. Residual stresses have been linked to part warpage in a
study by Tierney and his coworkers [ 16]. They were able to model the residual stresses
and showed that applying a specific external load to the first ply in the tow during an
automated tow placement process reduced the warpage. Madhukar and his associates
[ 17] have studied cure cycles to determine how to lower the residual stresses in a
carbon/epoxy matrix. Using a feedback control system that monitored the stresses during
cure for a lone carbon fiber in epoxy matrix, they developed cure cycles that reduced the
residual stresses over the same time period as a standard cure cycle. They have
completed an additional study, which monitors how the development of the modulus of
the epoxy has been linked to changes in polymer volume and changes in the cure cycle
[18]. Genidy [19] uses a single fiber cured in an epoxy matrix to measure residual
stresses. Via cure cycle optimization, he achieved a reduction in residual stresses without
3
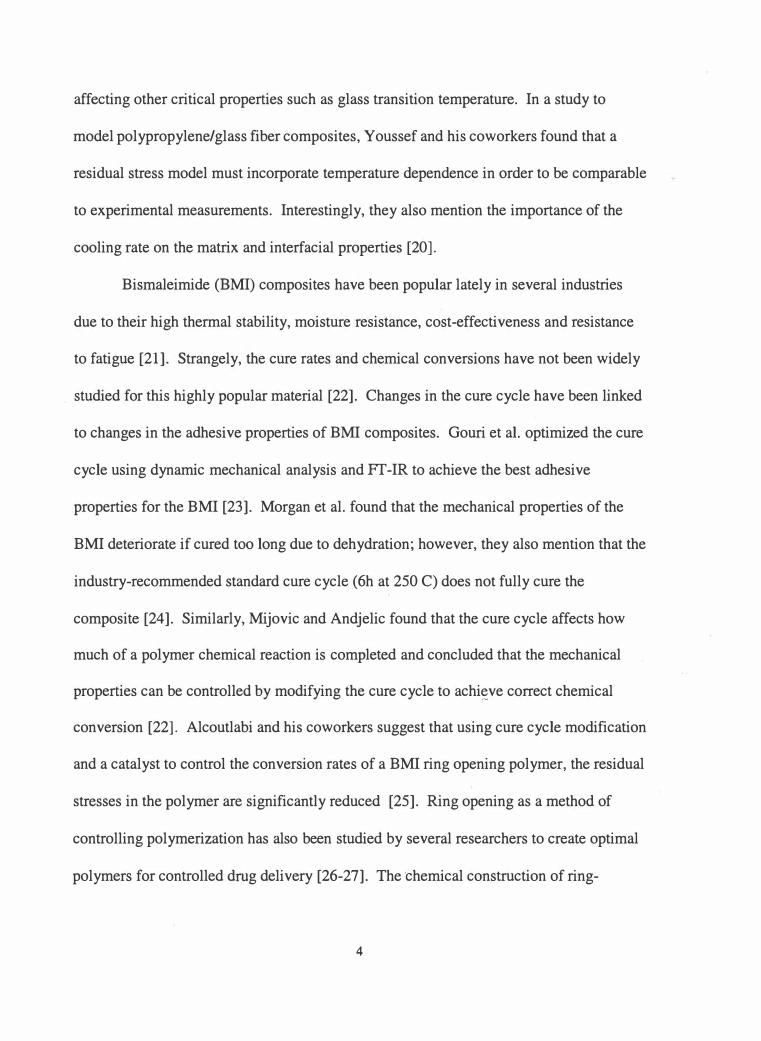
affecting other critical properties such as glass transition temperature. In a study to
model polypropylene/glass fiber composites, Youssef and his coworkers found that a
residual stress model must incorporate temperature dependence in order to be comparable
to experimental measurements. Interestingly, they also mention the importance of the
cooling rate on the matrix and interfacial properties [20].
Bismaleimide (BMI) composites have been popular lately in several industries
due to their high thermal stability, moisture resistance, cost-effectiveness and resistance
to fatigue [21]. Strangely, the cure rates and chemical conversions have not been widely
studied for this highly popular material [22]. Changes in the cure cycle have been linked
to changes in the adhesive properties of BMI composites. Gouri et al. optimized the cure
cycle using dynamic mechanical analysis and Ff-IR to achieve the best adhesive
properties for the BMI [23]. Morgan et al. found that the mechanical properties of the
BMI deteriorate if cured too long due to dehydration; however, they also mention that the
industry-recommended standard cure cycle (6h at 250 C) does not fully cure the
composite [24]. Similarly, Mijovic and Andjelic found that the cure cycle affects how
much of a polymer chemical reaction is completed and concluded that the mechanical
properties can be controlled by modifying the cure cycle to achi�ve correct chemical
conversion [22]. Alcoutlabi and his coworkers suggest that using cure cycle modification
and a catalyst to control the conversion rates of a BMI ring opening polymer, the residual
stresses in the polymer are significantly reduced [25]. Ring opening as a method of
controlling polymerization has also been studied by several researchers to create optimal
polymers for controlled drug delivery [26-27]. The 'Chemical construction of ring-
4
opening polymers with multifunctional initiators, cross linkers or termination agents has
been commonly studied [28].
As the above discussion has shown, there has been quite a bit of research
involving BMI composites, cure characterization, and mechanical properties including
residual stresses. Ring opening has also been investigated to control polymer properties
including residual stresses. The ties between chemical ring opening, mechanical property
tailoring, and cure cycle optimization are evident. This thesis examines these concepts
with three related experiments. First, the interfacial shear stress between a carbon fiber
and epoxy matrix is examined to determine the effect on the residual stresses experienced
by the fiber. Second, we examine the application of a nov�l ring opening reactfon to a
BMI composite to determine the effect on the residual stresses of the composite. Finally,
we show supporting evidence in favor of a previous study involving polymer volume.
change in which the cure temperature and cure length cause predictable changes in the
modulus of a composite during cure.
1.2 CIST Experimental Introduction
The cure-induced stress test (CIST) was developed to determine the residual
stresses that build up during the cure of a composite as the polymer volume changes.
Each experiment begins by degassing the polymer at a certain temperature (degassing
temperature) for a certain length of time (degas time). The CIST consists of a silicone
rubber mold of a particular geometry that is injected with a syringe filled with the
degassed polymer matrix, and a single carbon fiber that is inserted into the center of the
polymer matrix and runs through both sides of the mold. The ends of the fiber are
5
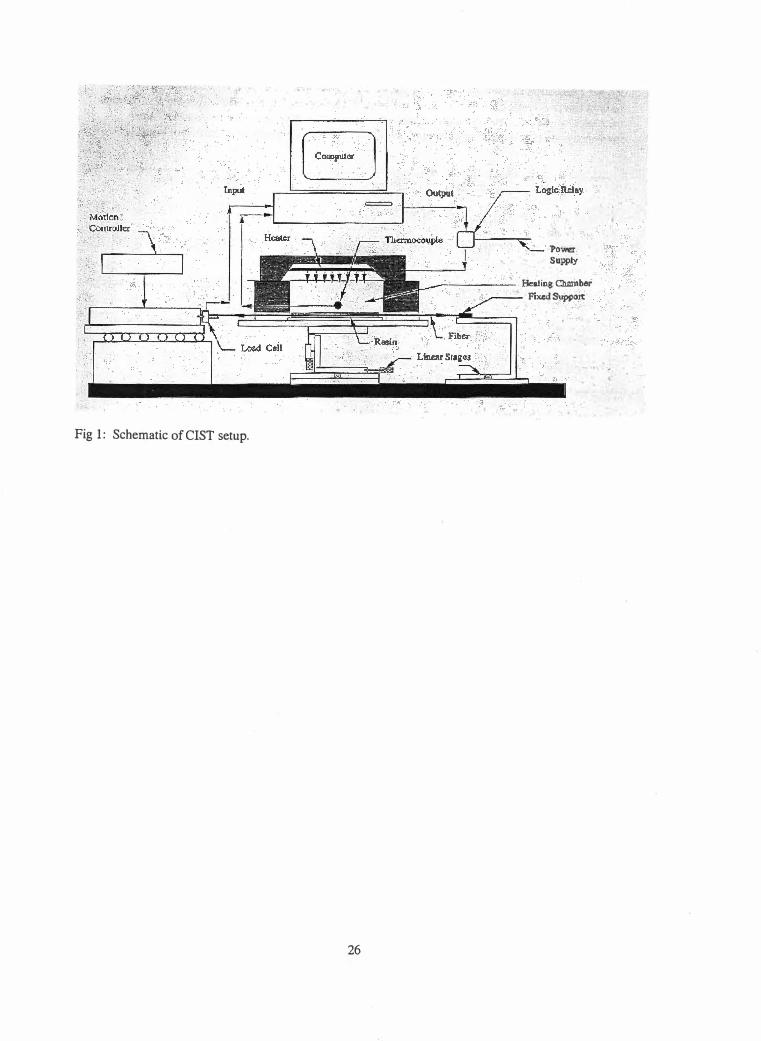
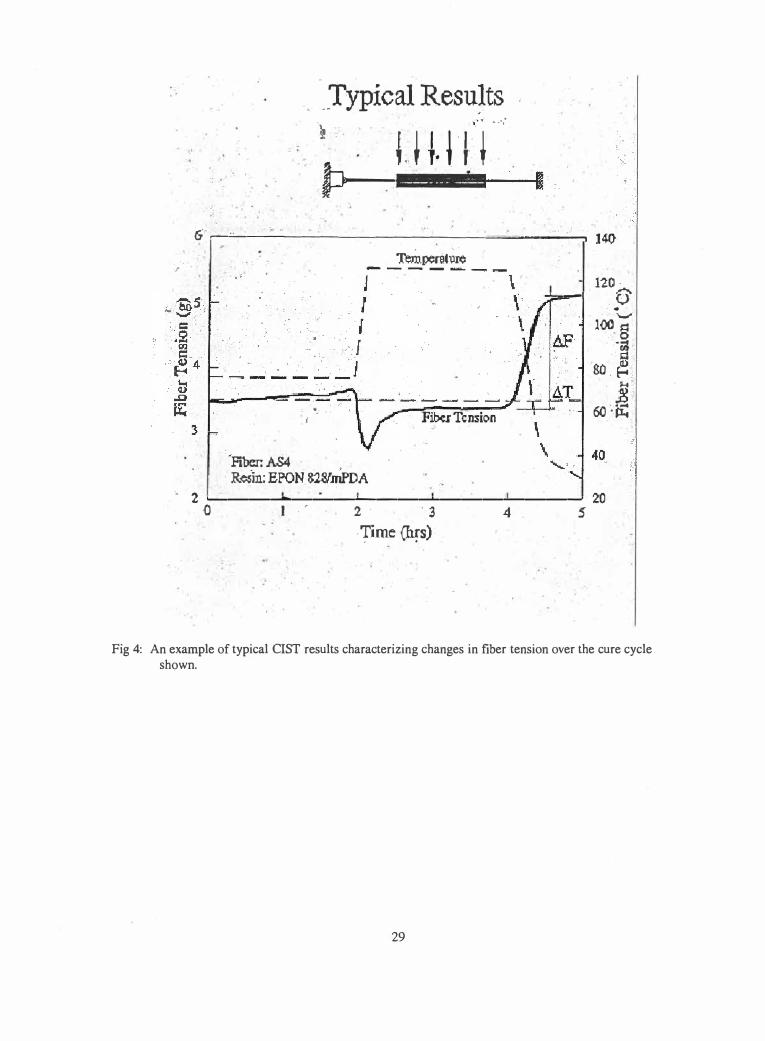
attached respectively to a fixed end and to a load cell [Fig. 1-2 1]. The polymer is then
cured via a specific cure cycle entered by the user into the computer system. As the
polymer is heated according to the user-specified heat cycle, the polymer volume changes
and the tension in the carbon fiber also changes [Fig. 3]. For example, if the polymer
expands during heating, the carbon fiber will experience a slack in tension. If the
polymer contracts during cooling, the carbon fiber will experience and increase in
tension. These changes in the tension of the carbon fiber cause a change in the reading of
the load cell, whi�h is attached to the fiber. Each fiber is preloaded to about 3.5 g (140
m V) of tension before the test begins. As the cure cycle is applied, the changes in the
load are entered into a computer during the cure process. From this change in the fiber
load, we are able to characterize the residual stresses that occur during the cure of the
polymer [Fig. 4]. More details on the validation and previous use of the CIST can be
found in the appendix [ 17-19].
1.3 Motivation for this Research
The CIST results needed to be checked to-determine ifthe interfacial stresses
between the polymer and the carbon fiber_were having an effect on the load reading at the
load cell. The concern was that perhaps the load cell was reading the combined total of
the load caused by polymer volume change plus the interfacial load between the fiber and
the matrix. Experiments were conducted to resolve this concern. In addition, a novel
theoretical model was developed to reduce internal residual stresses during cure for a
BMI composite with a chemical ring opening reaction. Because the model was only
1 All tables and figures are located in the appendix.
theoretical, CIST tests were run in order to validate the theoretical model. Finally, the
CIST was used to verify the results of a previous study in which volumetric dilatometry
was used to characterize changes in the progression of the elastic modulus during cure.
The CIST was used to cure the samples under the same cure conditions, and then a series
of three-point bend tests were conducted to determine the elastic modulus. The results
were compared to those of the independently conducted volumetric dilatometry analysis
as verification.
7
Chapter 2
Effects of bonding at the fiber/matrix interface on CIST results
2.1 Introduction
A concern had been raised with the CIST developed at UT because the role of
the fiber/matrix interface on the load cell readings had not been addressed. For
example, as the matrix changed in_ volume and pulled on the fiber, it was
uncertain whether the measured load response was due to the volume change of
the polymer, the fiber/matrix interface properties, or some combination of both.
To determine the effect of fiber-matrix interface on the.measured fiber-load
values, a series of experiments (described below) were conducted.
2.2 Procedure
Two batches of experiments were run to determine the effects of the
fiber/matrix interface on the CIST results. First, we ran multiple control tests.
The CIST control tests used a Ciba-Geigy AS4 carbon fiber and 3501-6 epoxy
matrix as is. Then, we ran a second series of CIST tests whereby we sprayed each
fiber with a Teflon coating before inserting the fiber into the matrix. The purpose
of the Teflon coating was to act as a lubricant between the fiber and matrix at the
interface, and thus prevent any chemical bonding between fiber and the matrix. If
the interface between the fiber and the matrix affects CIST measurements, there
would have been a difference between the results read by the load cell between
these two batches.
8
For all of these CIST tests epoxy 3501-6 and AS4 carbon fiber (as
received with optimum surface trea�ment) were used. The 3501-6 was heated to
about 80° C and degassed for about 15 minutes to remove bubbles. Then the
epoxy was injected into the silicone mold with a syringe. Finally, the carbon fiber
was inserted into the mold. Again, in some cases the fiber was pre-sprayed with a
Teflon coating (Camie AIO00) until it visibly turned a white color and was
allowed to air dry, and in other cases, the fiber was not sprayed with the Teflon
coating. One end of the carbon fiber was attached to a fixed end. The other end
of the fiber was attached to the load cell. The output of the load cell is in m V,
_ however, it has been previously determined that 40 mV is equal to 1 gram. Each
sample was heated to 169° C and fully cured. Fully cured Teflon samples showed
a white fiber running through the specimen after cure.
2.3 Results
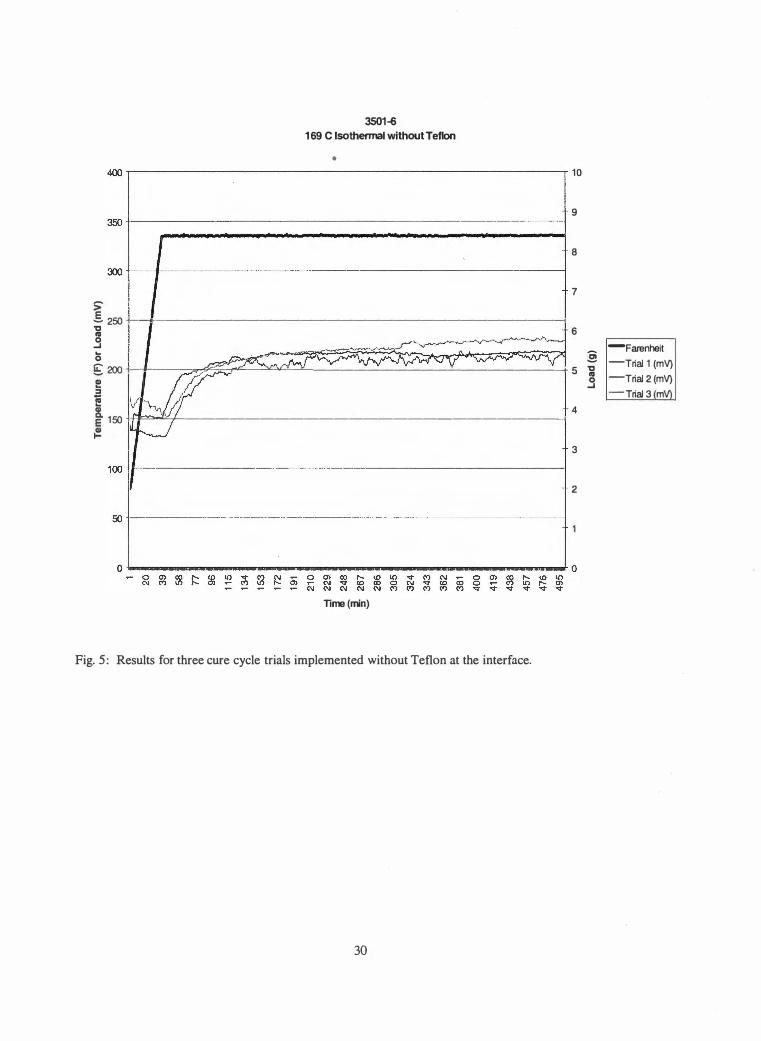
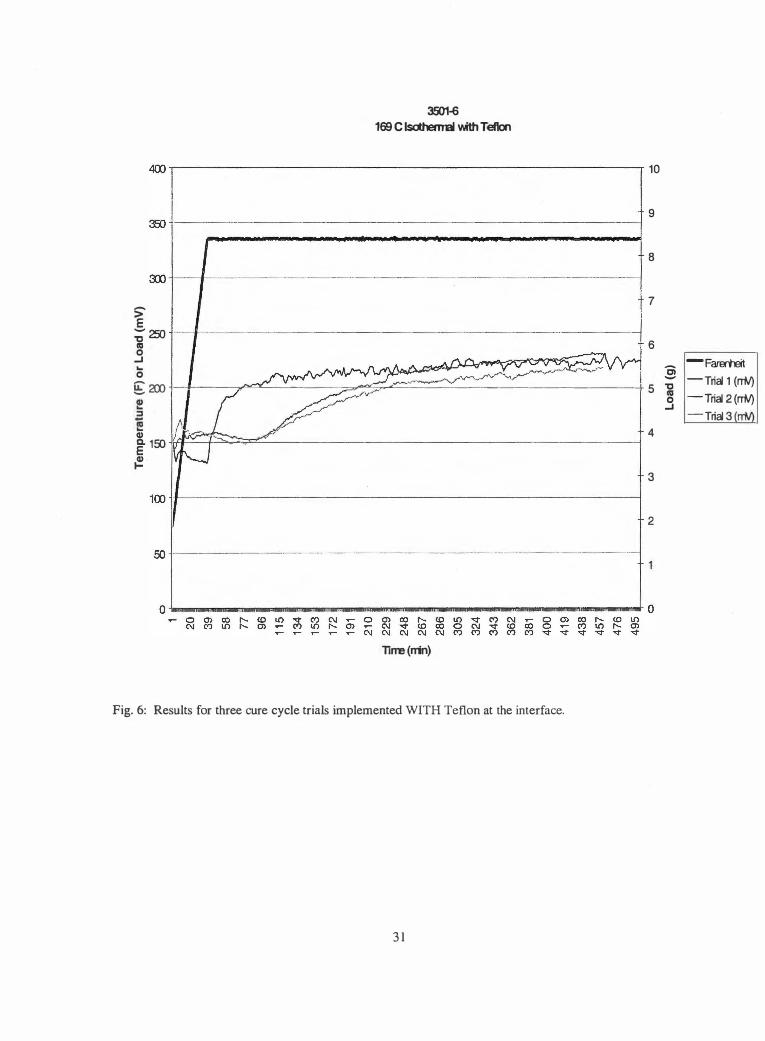
The results for the control set (unsprayed) and the Teflon coated set of
trials show only negligible differences (Fig. 5-6). The load response that was
measured was practically identical between both sets of tests. Because of the
digital sampling by the CIST, the results have small peaks and valleys. In one
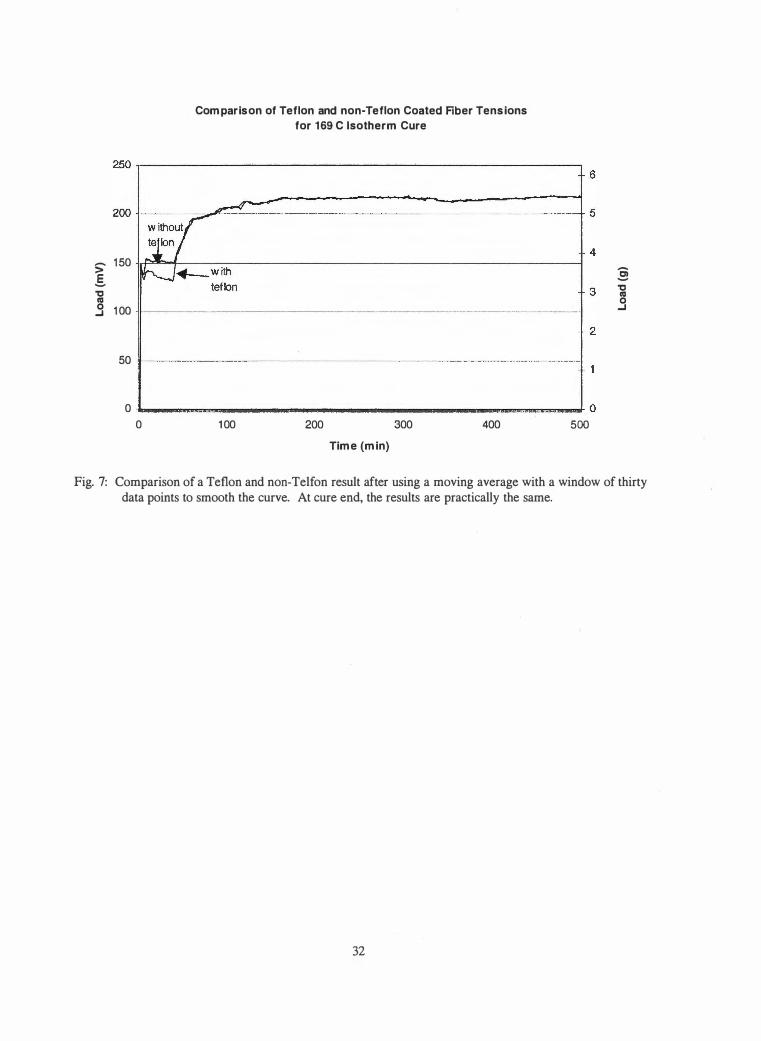
case, we compared the Teflon and non-Teflon results by smoothing the peaks and (,
valleys using a moving average technique in which the window size was 30 data
points. The figure containing smoothed data for a Teflon coated fiber and a non
Teflon coated fiber is shown in the appendix (Fig. 7).
9
2.4 Conclusions
In conclusion, there was no significant difference in our load response
regardless of whether or not a Teflon coating was used. In all cases, the fully
cured sample at 169° C gave a stable final load reading of about 225 m V. If the
fiber/matrix interface had played a large role in the load cell readings, a Teflon
spray would have affected it. The 3501-6 polymer would have had more
difficulty gripping the slippery Teflon coated fibers than it did with the fiber as-is.
However, this was not the case because both sets of tests produced similar results.
In other words, the role that the fiber/matrix interface had on our load response
was very small and certainly negligible. It is concluded that the lateral clamping
force (perpendicular to the fiber axis) exerted on the fiber when the surrounding
polymer shrinks is large enough to effectively transfer shear stresses from the
polymer to the fiber even when there is little chemical bonding between fiber and
matrix.
10
Chapter 3
Effects of chemical ring-opening on stresses during cure in composites
3.1 Introduction
A new chemistry has been developed at the Texas Tech University combining
bismaleimide (BMI) with a ring-opening polymer called spiro-orthocarbonate (SOC).
The chemical reaction is a two-part reaction; however, the two reactions are independent
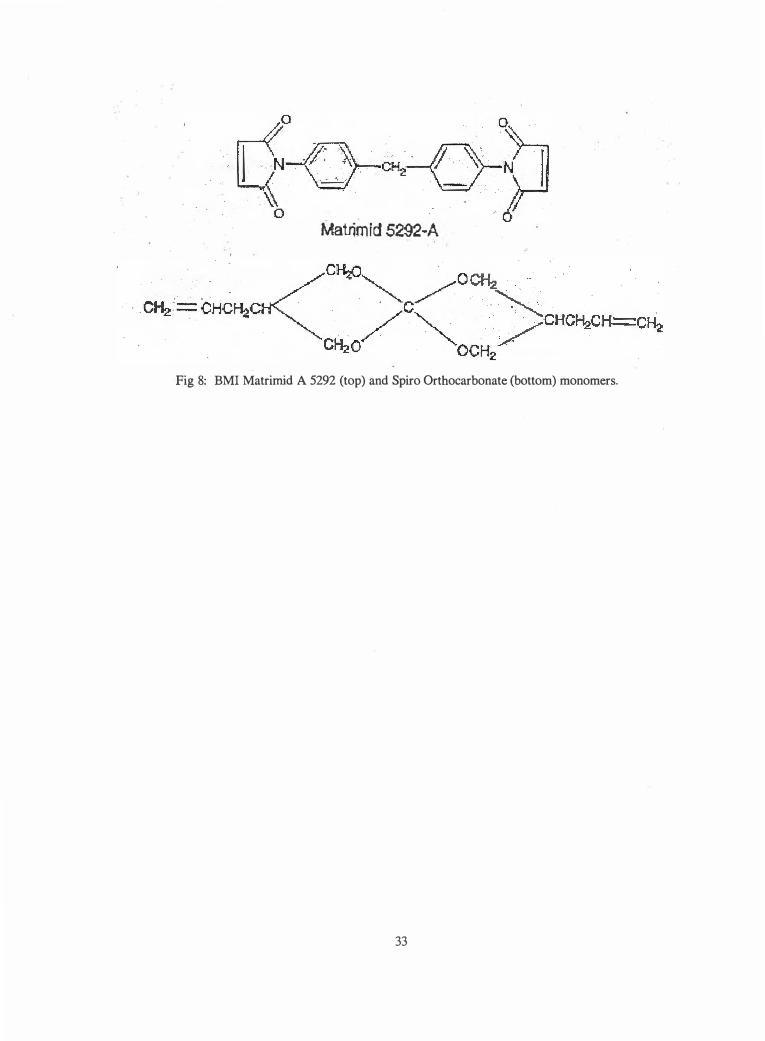
of each other. The structures of the BMI (Matrimid 5292) and SOC monomers are shown
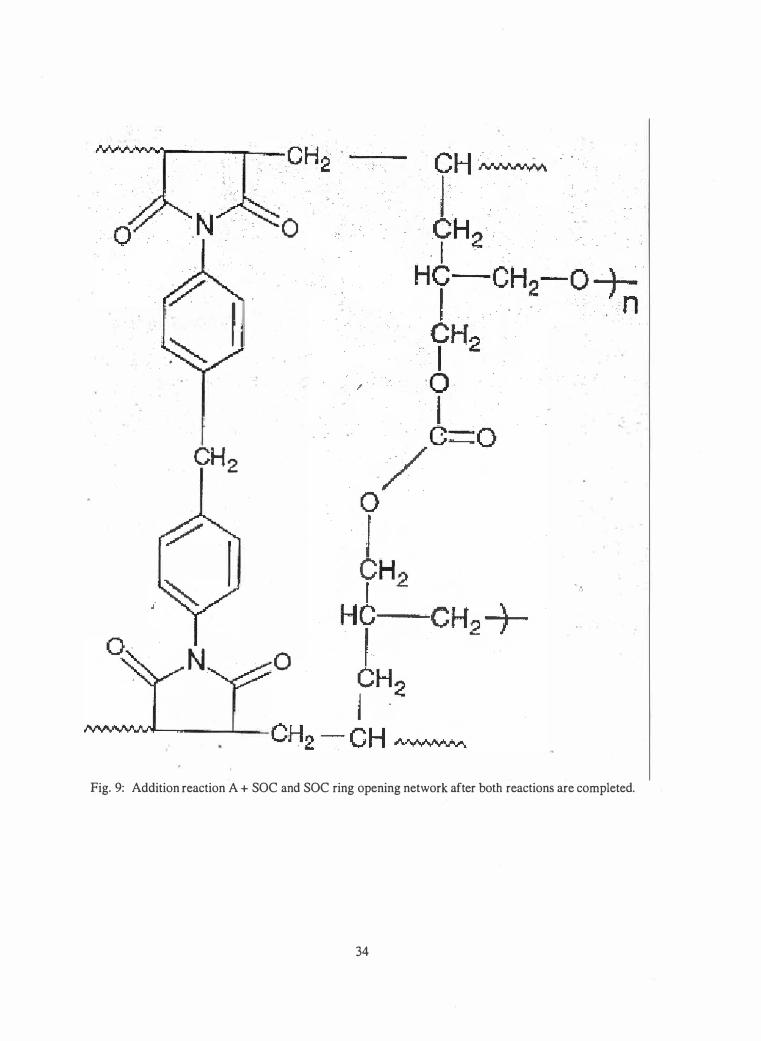
(Fig. 8). Two reactions- take place. First the BMI bonds with the SOC. This is the
addition reaction that occurs via free radical polymerization. Second, the SOC undergoes
a ring opening reaction via cationic polymerization. After both reactions are completed,
the resulting structure is shown in the appendix (Fig. 9). The rates of these two reactions
can differ because the initiators used to promote them can differ. Theoretical analysis has
shown that the lowest stresses occur when these two reactions occur at the same rates
[25]. Residual stresses are reduced by 17% at the completion of cure at the cure
temperature, but only 6% reduction is seen after dropping to room temperature due to
thermal shrinkage when the reaction rates are identical [25]. The CIST was used to
verify the theoretical finding that SOC did in fact reduce the residual stresses.
3.2 Procedure
Typically, these experiments involved a comparison between a standard
BMI mixture and a mixture involving SOC intended to lower the residual stresses.
Several different procedures were used throughout this study. The standard procedure for
11
BMI Matrimid 5292 A/B was to mix the A and B part of the BMI together. First the B
part is heated to about 130° C, and then the A part is stirred in. Then the entire mixture
was degassed for about 15 minutes at 130° C. Then the CIST was used with a fiber to
record the loads on the fiber during cure. These CIST results became the control for the
experimentation or the baseline that we were trying to improve on by using SOC.
Several additional combinations were used as a comparison. First attempts
involved mixing A and B together, then adding SOC, and then adding the catalyst. A
second procedure was to mix 1 mole A and .75 mole B together, then add .25 mole SOC,
and then the catalyst (5% of SOC weight). In a third procedure, A and Band SOC were
mixed, but the catalyst was dissolved in a different solvent (same ratios as above). In
some of the final trials, the sample solutions were mixed at Texas Tech and shipped in
dry ice. Their mixtures included those above, but a slightly different control group: part
A and Band the catalyst (with the assumption that the catalyst should not react because
no SOC was present). It is clear that a variety of mixing strategies were attempted. In all
cases, after mixing was completed the CIST was used with fiber, and the resulting loads
were recorded and compared. The chemical structures of various parts of the chemistry
are shown in the appendix (Fig. 8-10).
3.3 Results
In order to avoid a lot of confusion, the mixing strategy was not listed in for each
result. Each listed result is labeled by the ingredients used to produce that particular
result. For example, if only A and SOC were used, the graph of the CIST fiber loads is
labeled A+SOC. If only A and B are used, the graph of the CIST fiber loads is labeled A
12
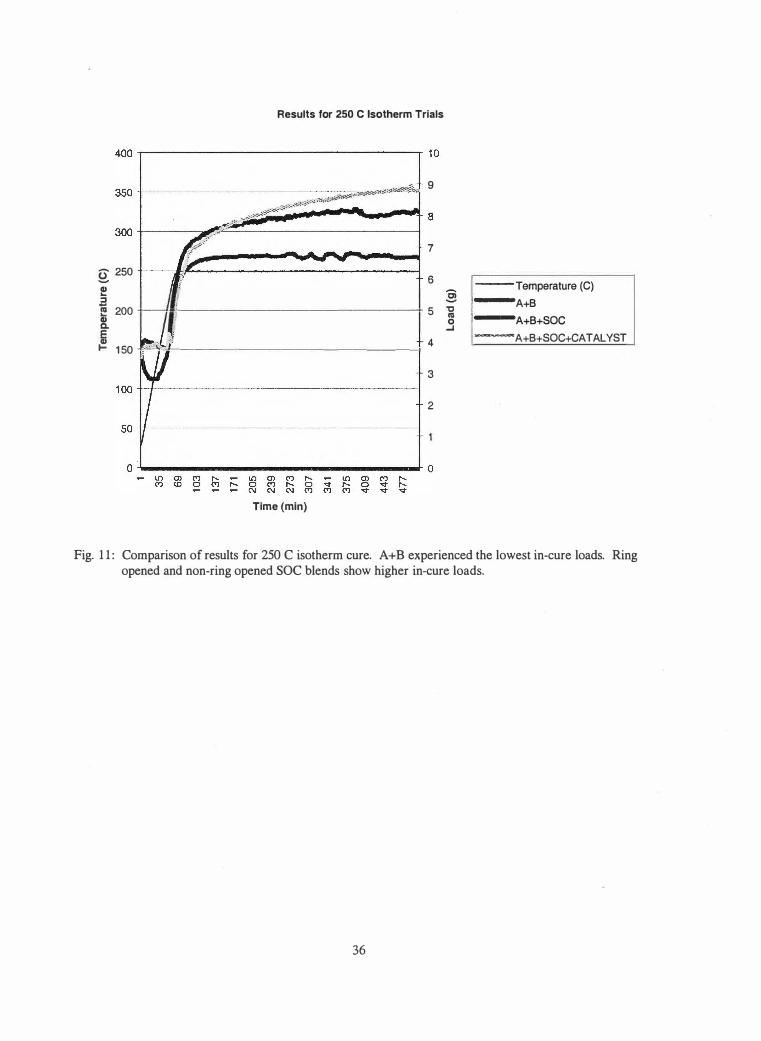
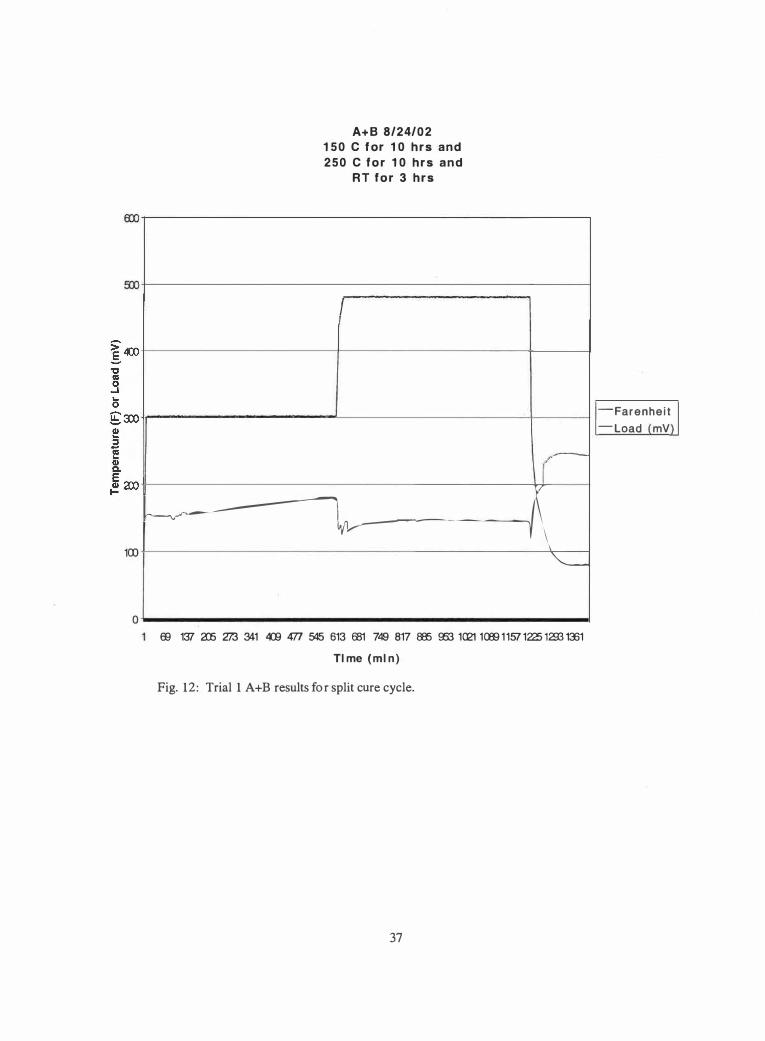
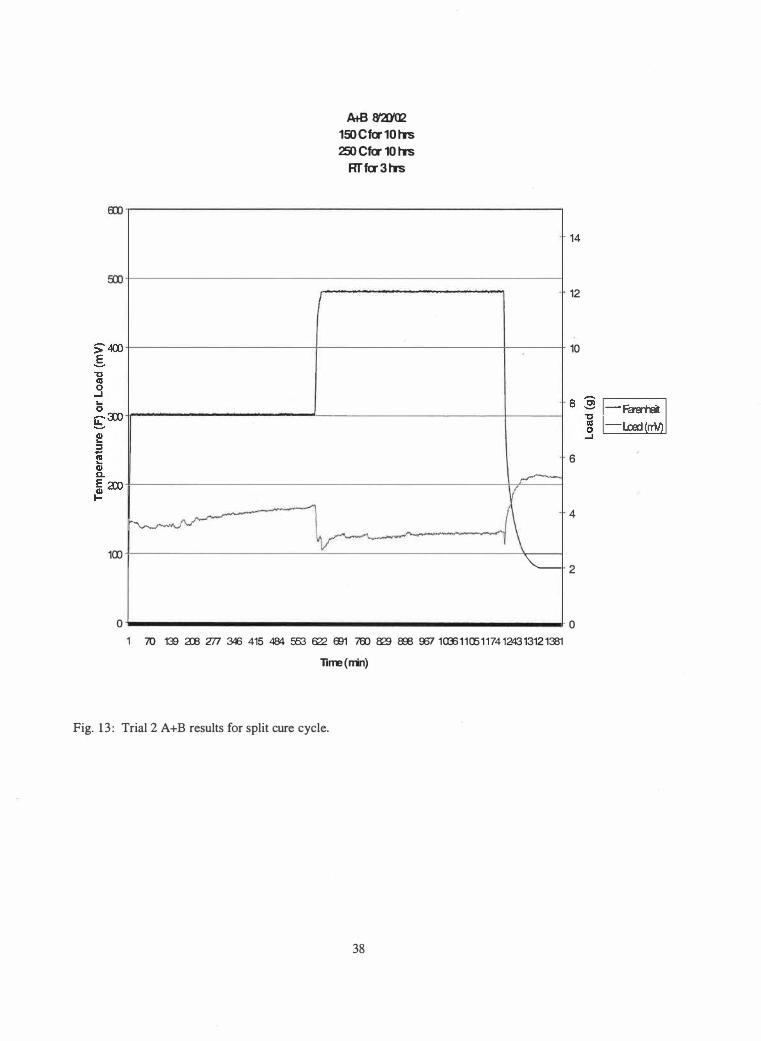
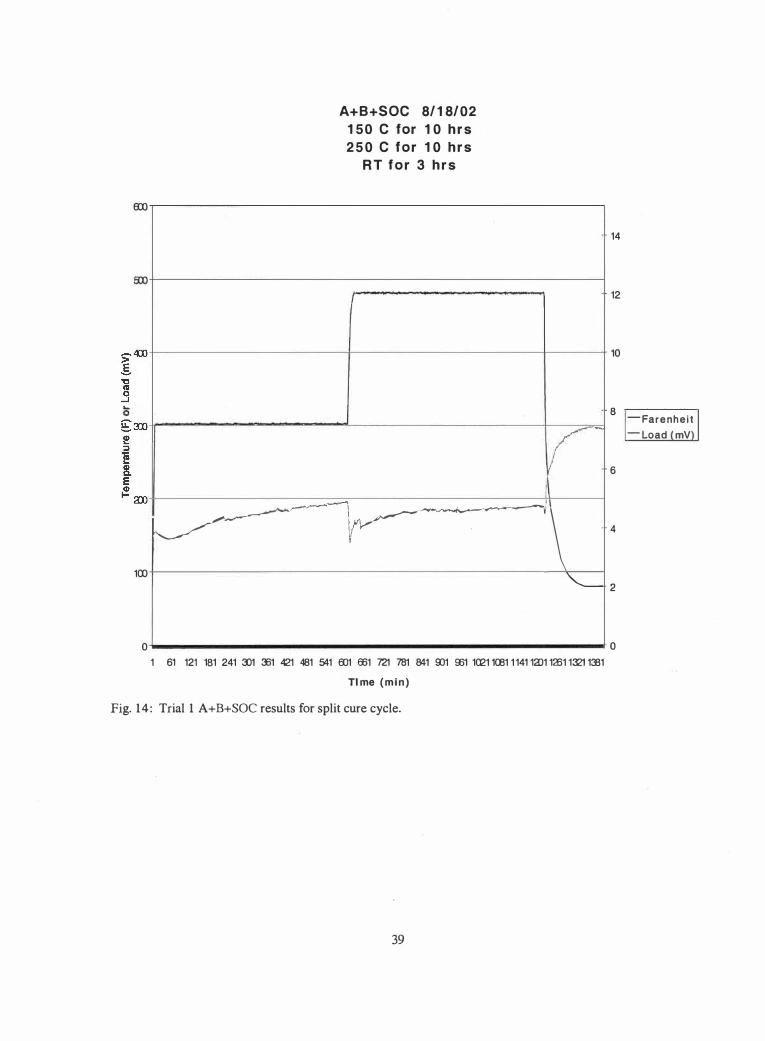
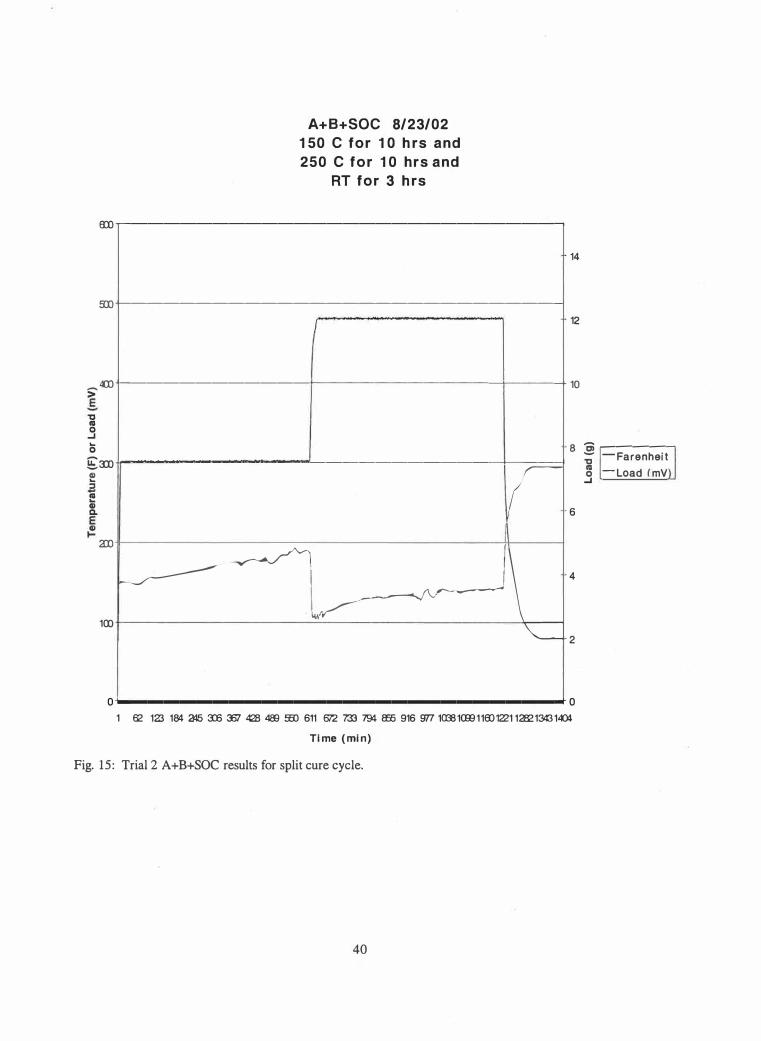
+ B. The results for all of the procedures are shown in the appendix (Fig. 11-17).
Consistently, it was shown that the lowest fiber loads from CIST were produced using
A+B alone, regardless of whether a split cure cycle or isothermal cure cycle was used.
The combinations we 'tried using the SOC increased the CIST fiber load values.
3.4 Conclusions
At the time of publication of this thesis, the chemistry was still being altered to
produce more favorable results. Current results do not indicate that the particular
chemistries and procedures used here were able to produce a lowered load response via
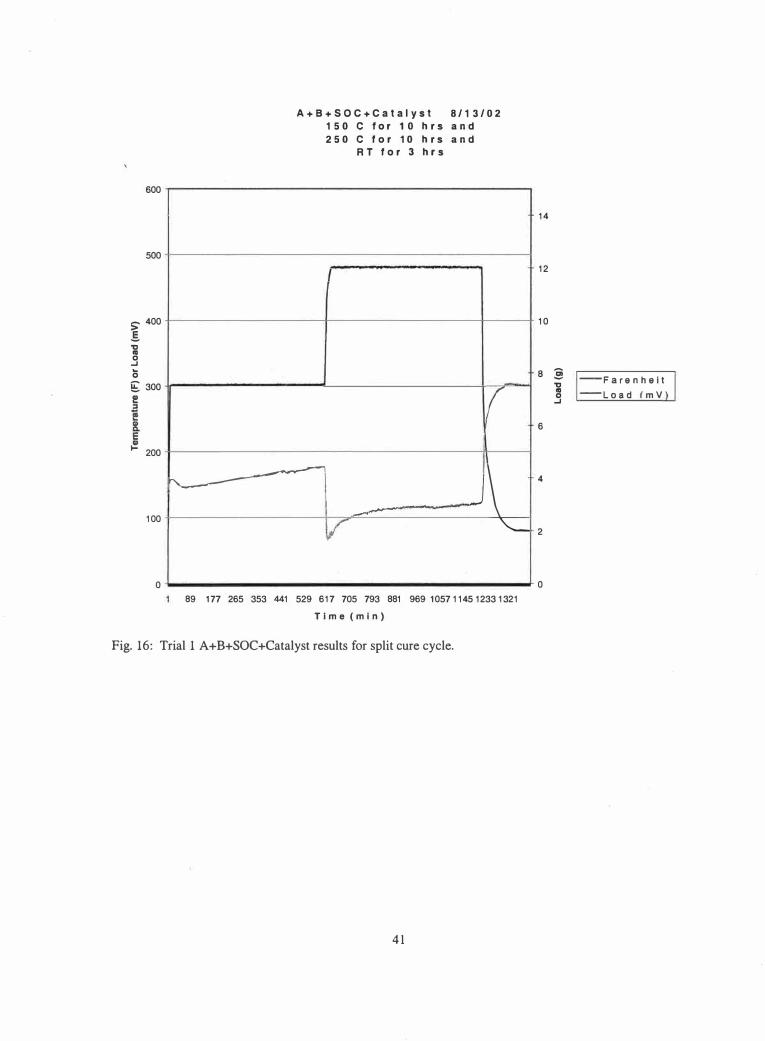
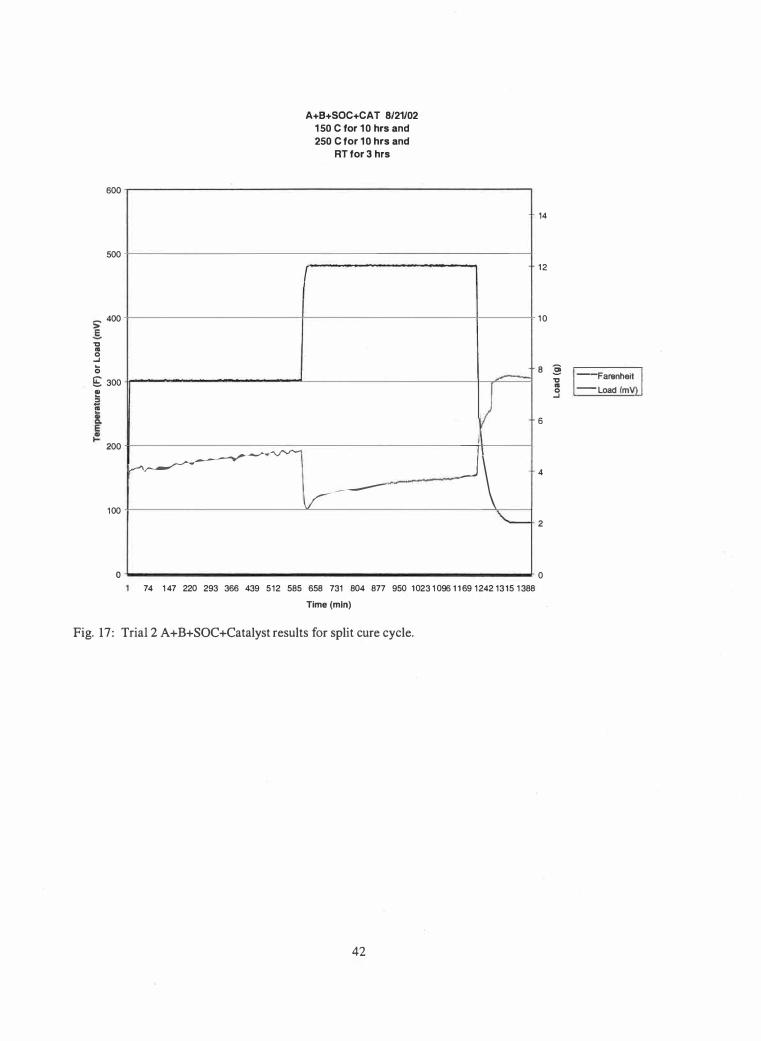
chemi�al ring opening. In Table 3, the changes in fiber tension are displayed. It can be
seen that A+B+SOC+catalyst shows higher final load values than A+B. It is also seen
that the changes in tension (8F) for A+B+SOC+catalyst compared to A+B during either
of the two changes in temperature is much more drastic, probably due to thermal
expansion and contraction. Regardless, it is evident based on the results after cure that
the final tension values in an SOC chemical reaction are actually higher than those
without SOC.
13
Chapter 4
Effects of cure temperature and cure length on composite properties
4.1 Introduction
As has been shown, the study of cure cycles and their effects on composites has
been of much research recently. The stiffness values of polymers as they cure are needed
as inputs in process models. The composite stresses developed at a given point during
their cure depend on the polymer stiffness at that point. In terms of this thesis, a previous
study was conducted to estimate the build-up of the elastic Young's modulus (E) of a
thermoset polymer during cure. This chapter verifies volumetric dilatometry results using
CIST to cure the samples and three-point bend tests to measure each modulus (E).
4.2 Procedure
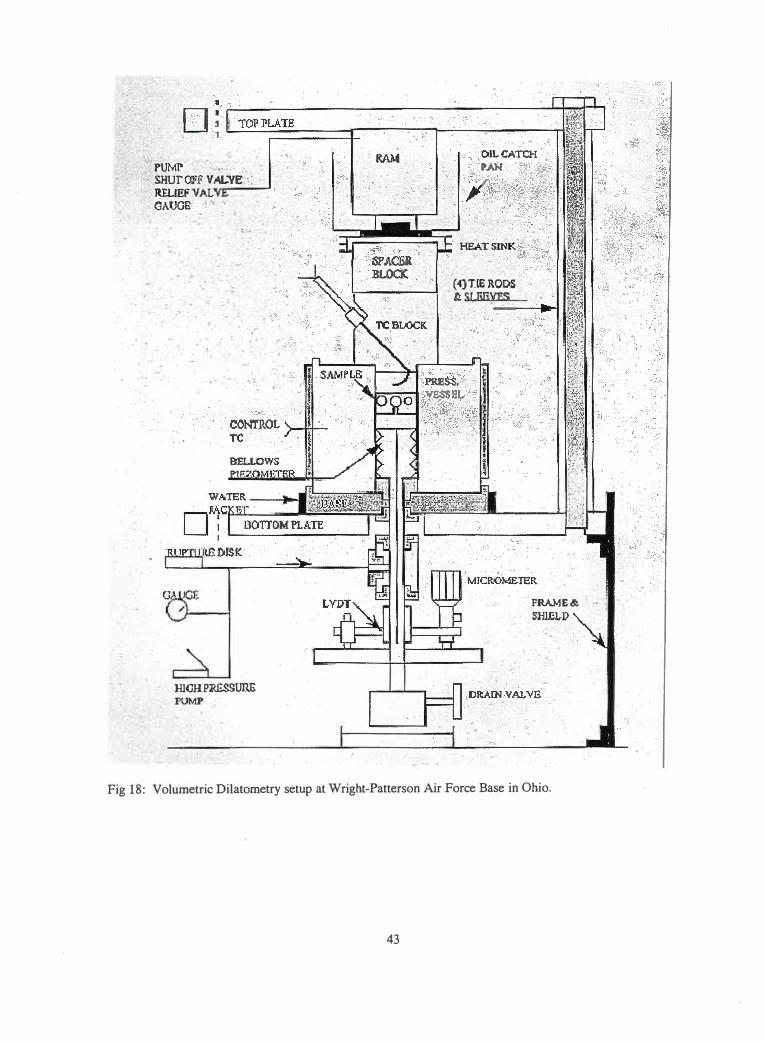
The changes in polymer volume were obtained via volumetric dilatometry for a
variety of cure cycles [17-18]. A diagram of the setup of the volumetric dilatometry
conducted at Wright Patterson Air Force Base in Ohio can be found in the appendix (Fig. ·
18). For each of the CIST cured samples, epoxy 3501-6 was used. The epoxy was
heated to a,bout 80 C and degassed for about 15 minutes to remove bubbles. Then, the
epoxy was injected into a silicone rubber mold to create a beam shape. No fiber was
placed in the mold.
Several samples were cured at varying temperatures and durations of cure using
the CIST without a fiber. After cure completion, the samples were sanded and polished
to minimize thickness variations along the specimen length. The specimens were then
14
measured for average thickness (t) and average width (w). A strain gauge was mounted
to the center of the underside of each sample and a three-point bend test was performed.
The length between supports for each sample during the three-point bend test was 50.38
mm. The dimensions for each of the specimens are located in the front of the appendix
(Table 1).
Four different types of specimens were created. One group was partially cured
for 210 minutes @ 136 C. A second group was fully cured for 480 minutes @ 136 C. A
third group was partially cured for 45 minutes @ 169 C. Finally, the fourth group was
fully cured fo� 180 minutes @ 169 C.
A hydraulic test machine could not be used to produce a dear result for the bend
test due to the hydraulic pressure changes interfering with the sensitive results of the
strain gauge. Instead, a strain gauge was mounted to the underside of each sample in the
center. Each sample was placed between two supports equidistant from the strain gauge
for the three-point bend test. At the center of the beam, a thin loop of string was hung.
At this time, an amplifier was used to balance the strain gauge at zero microstrains, with
1 volt = 1000 microstrains. First, a 1 Newton hook was placed on the string and hung . .
from the sample. Then, the reading from the strain gauge was recorded. The load on the
hook was increased in 1 Newton increments and strain readings w_ere obtained
·accordingly, until a sufficient number of load-strain data points were obtained.
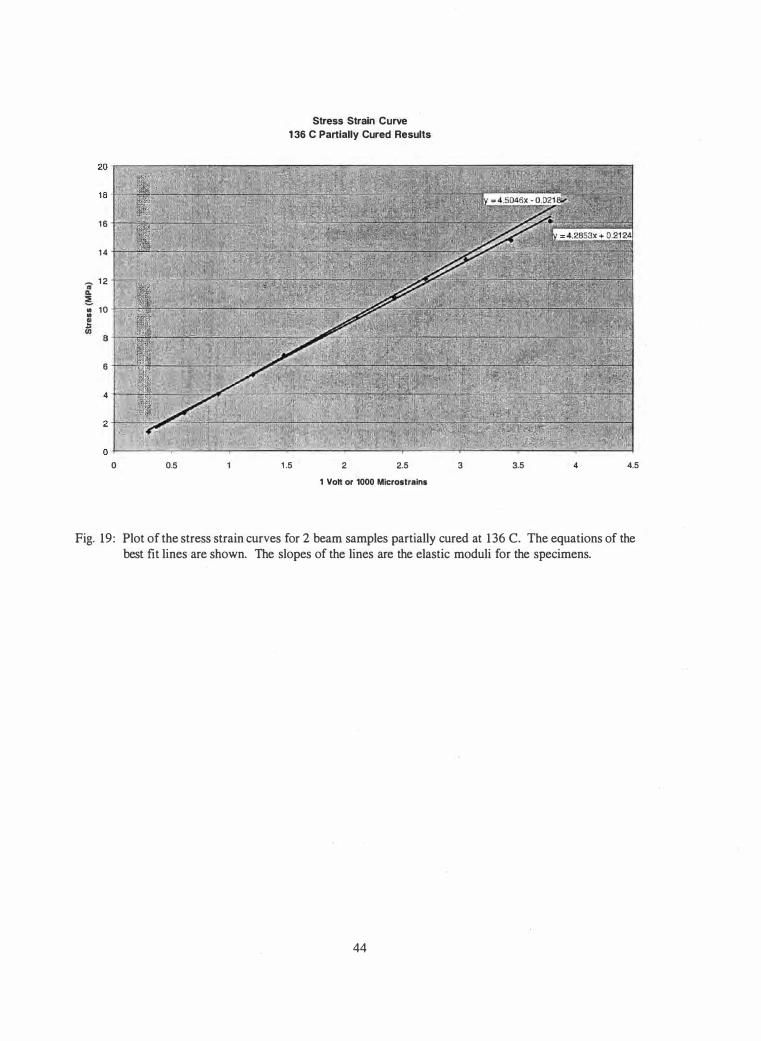
The strain was given by the strain gauge for each data point. The stress was ·
calculated for each load data point (P) from the beam bending equation: cr = My/I =
(3PL)/(2wt2) , with L, w, and t given from the pre-measured values in the appendix
(Table 1 ). This produced a series of stress-strain data points. Upon plotting the stress-
15
strain curve, the data was fitted using linear regression. The slope of the best-fit line was
the elastic modulus. The results from these tests were compared to previous results
developed from independently conducted volumetric dilatometry tests for 3501-6 epoxy
to determine the elastic modulus by linearly calibrating the y-axis of the volumetric
dilatometry results using only one data point. The other three data points were used to
check the calibration (Fig. 23).
4.3 Results
The results for the stress-strain data are shown in the appendix (Fig. 19-22). The
slope (E) of each curve is listed on each graph as well as in a chart in the front of the
appendix (Table 2). The average modulus values for each of the four cure cycles are also
shown in the chart.
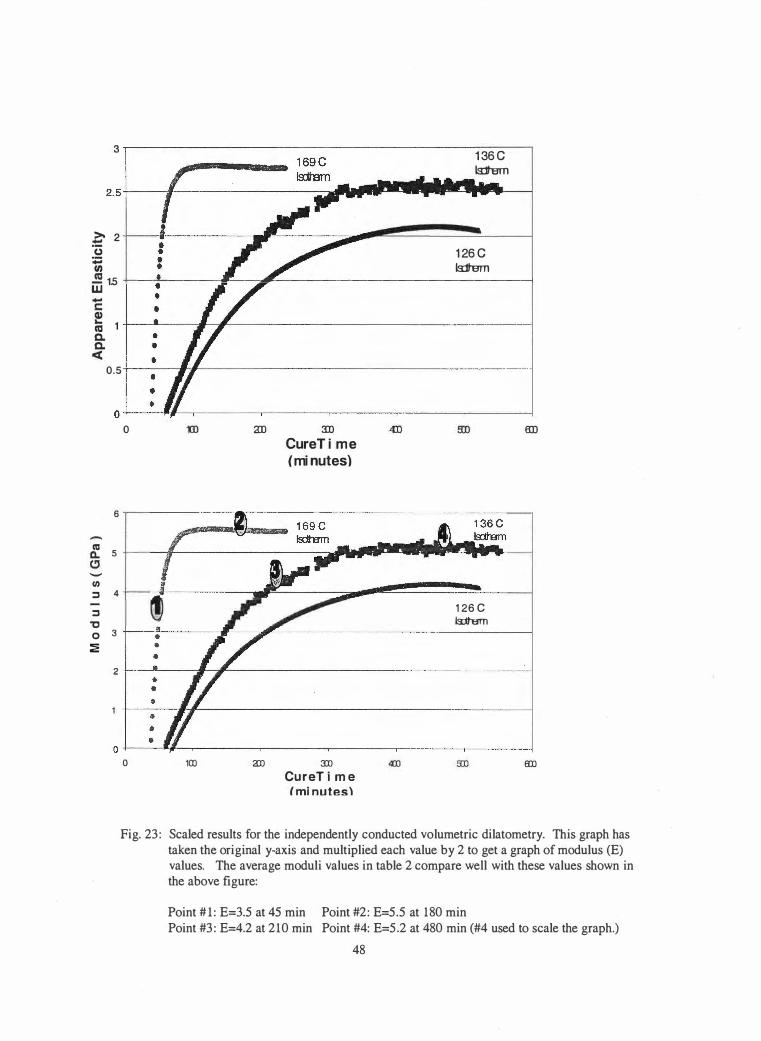
For comparison, the scaled results of the dilatometry are also shown (Fig. 23).
The original y axis, "apparent elasticity", was used to compare stiffness between cure
cycles and cure times, but needed to be scaled to determine specific modulus values. To
produce Figure 23 from the original results, the original axis was multiplied by a scaling
factor of 2. Figure 23 produces remarkable agreement with the modulus values from the
CIST cured bend test results (Table 2). For example, the old dilatometry figure showed
_an "apparent elasticity" for 480 minutes of cure at 136 C to be 2.6. We multiplied this
value by 2 to get a modulus (E) value of 5.2. Now compare this with the bend test
results. The average modulus value for the same degree of cure was also 5 .2 (Table 2).
Similarly, a good agreement is shown when comparing the other 3 cure cycle groups
16
using the scaled volumetric dilatometry results (Fig. 23) and the CIST cured bend test
results (Table 2).
4.4 Conclusions
The CIST method in conjunction with the volumetric dilatometry was used to
determine the stiffness curves during polymer cure. These curves were then calibrated
using independently measured s.tiffness values of fully and partially cured polymers.
The results show that the degree of cure and the temperature of cure affect the
value of the elastic modulus. In general, the higher the cure temperature, the higher the
modulus value. Also, the longer the cure cycle takes place, the higher the modulus value.
It appears that the volumetric dilatometry can be used to predict the modulus value during
cure given bend test verification of several data points. The apparent elasticity,
previously used only for comparing strengths and not assigning modulus values, simply
requires a scaling factor to help it transform to a graph of modulus values for 3501-6
epoxy.
· Future work for this thesis could include usage of a photo-initiator catalyst with e
beam to control the timing of the SOC ring opening reaction discussed in Chapter 3.
Also, characterizing and quantifying how much the interface was weakened by using
Teflon in Chapter 2 could be conducted. In Chapter 4, future work could focus on
verifying the volumetric dilatometry results for non-isothermal cure cycles. Finally; the
modulus curves developed in Chapter 4 could be verified using other technologies such
as dynamic mechanical analysis (DMA).
17

LIST OF REFERENCES
1 8
LIST OF REFERENCES
1. Hebeish, A. A. Waly, and A.M. Abou-Okeil. "Flame Retardant Cotton". Fire Materials. 23. (1999):117-123.
2. Keller, Thomas. "Recent All-Composite and Hybrid Fibre-Reinforced Polymer Bridges and Buildings." Progress in Structural Engineering and Materials. 3. (2001):132-140.
3. Balac, Igor et al. "Predictive Modeling of the Mechanical Properties of Particulate Hydroxyapatite Reinforced Polymer Composites." Journal of Biomedical Materials Research. 63. (2002):793-799.
4. Chodak, Ivan, Maria Omastova, and Jurgen Pionteck. "Relation Between Electrical and Mechanical Properties of Conducting Polymer Composites." Journal of Applied Polymer Science. 82. (2001) : 1903-1906.
5. Son, Jungil, Hyun-Joong Kim, and Phil-Woo Lee. "Role of Paper Sludge Particle . Size and Extrusion Temperature of Performance of Paper Sludge-Thermoplastic Polymer Composites." Journal of Applied Polymer Science. 82. (2001) :2709-2718.
6. Ngo, Nam and Kumar Tamma. "Non-isothermal '2-D flow/3-D Thermal' Developments Encompassing Process Modeling of Composites : Flow/Thermal/Cure Formulations and Validations." International Journal for Numerical Methods in Engineering. 50. (2001) :1559-1585.
7. Wolfrum, J. and G.W. Ehrenstein. "Interdependence Between the Curing, Structure, and the Mechanical Properties of Phenolic Resins." Journal of Applied Polymer Science. 74. (1999):3173-3185. ·
8. Leterrier, Y., Y. Wyser , and J.-A. E. Manson. "Durability in the Life cycle of Polymer Composites." Journal of Applied Polymer Science. 73. (1999): 1427-1434.
9. Michaud, D.J., A.N. Beris , and P.S. Dhurjati. ''Thick-Sectioned RTM Composite Manufacturing, Part II. Robust Cure Cycle Optimization and Control." Journal of Composite Materials. 36.10 (2002) :1201- 1231.
10. Bogetti, T.A. and Gillespie, J.W. Jr. ''Two-Dimensional Cure Simulation of Thick Thermosetting Composites." Journal of Composite Materials. 25.3 (1991):239-273.
11. Pillai , V.K. et al. "Intelligent Curing of Thick Composites Using a KnowledgeBased System." Journal of Composite Materials. 31.1 (1997):22-51.
19
12. Williams, R.J .J. et al. "Criteria for Selecting Cure Cycles in Autoclave Processing of Graphite/Epoxy Composites." Polymer Engineering and Science. 30. 18 ( 1990): 1 1 40- 1 1 45.
13. Wang, Qiang et al. "Cure Processing Modeling and Cure Cycle Simulation of Epoxy-Terminated Poly(phenylene ether ketone). IV. Cure Cycle Simulation." Journal of Applied Polymer Science. 66. ( 1997): 175 1-1757.
1 4. Omastova, Maria et al. "Stability of Electrical and Mechanical Properties of Polyethylene/Carbon Black Composites." Macromolecular Symposia. 170. (200 1):23 1-239.
15. Li, Y. et al. "Synthesis and Properties of PMR Type Poly(benimidazopyrroloneimide)s." Journal of Applied Polymer Science. 82. (200 1): 1600- 1608.
16. Tierney, John et al. "Control of Warpage and Residual Stresses During the Automated Tow Placement Process." 43rd International SAMPE Symposium. 43. 1 ( 1998): 652-664.
17. Madhukar, M. et al. "On Cure Induced Stresses in Low Cure Temperature Thermoset Polymer Composites." 43rd International SAMPE Symposium. 43. 1 ( 1998): 199-2l3.
18. Madhukar, M.S., Ryan L. Karkkainen, and John D. Russell. "A New Method to Characterize Stiffness Development and Stress Relaxation in Polymers." Journal of Reinforced Plastics and Composites. In print.
19. Genidy, Mohamed. "On the Reduction of Cure-Induced Stresses in Thermoset Polymer Composites." Ph.D. Dissertation. University of Tennessee, Knoxville. ( 1999).
20. Youssef, Y. and J. Denault . "Residual Stresses in Continuous Glass Fiber/Polypropylene Composite Thermoformed Parts." 43rd International SAMPE Symposium. 43. 1 ( 1_998): 64 1-651.
2 1. Stenzenberger H. D. Advances in Polymer Science. 1 17. ( 1994): 167-220.
22. Mijovic, Jovan and Sasa Andjelic. "Study of the Mechanism and Rate of Bismaleimide Cure by Remote in-Situ Real Time Fiber Optic Near-Infrared Spectroscopy." Macromolecules. 29. ( 1996):239-246.
23. Gouri, C., C. Nair and R. Ramaswamy. "Reactive Alder-ene Blend of Diallyl Bisphenol A Novolac and Bisphenol A Bismaleimide : Synthesis, Cure and Adhesion Studies". Polymer International. 50. (200 1): 403-413.
20
24. Morgan, Roger et al. "Characterization of the Cure Reaction of Bismaleimide Composite Matrices." Polymer. 38.3 ( 1997):639-646.
25. Alcoutlabi, M., G.B. McKenna, and S.L. Simon. "Analysis of the Development of Isotropic Residual Stresses in BMI/SOC Thermosetting Resin for Composite Materials." Journal of Applied Polymer Science. Submitted Dec. 200 1.
26. Albertsson, A.C. "Controlled Ring-Opening Polymerization of Lactones and Lactides." Macromolecular Symposia. 157. (2000):39-46.
27. Edlund, U. and Albertsson, A.C. "Novel Drug Delivery Microspheres from Poly( l ,5-dioxepan-2-one-co-L-lactide)." Journal of Polymer Science, Part A: Polymer Chemistry. 37. ( 1999): 1877- 1884.
28. Palmgren, R. et al. "Synthesis of degradable crosslinked polymers based on 1 ,5-dioxepan-2-one and crosslinker of bis--caprolactone type." Journal of Polymer Science, Part A: Polymer Chemistry. 35. ( 1997): 1635.
2 1
APPENDIX
22
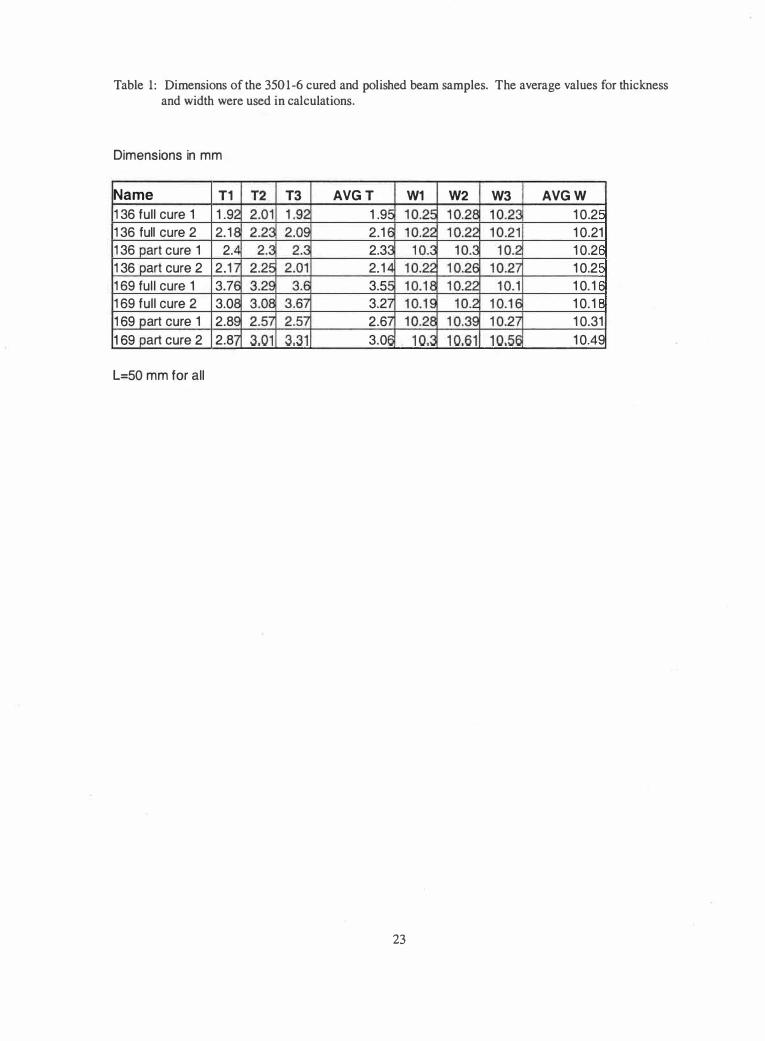
Table 1: Dimensions of the 3501-6 cured and polished beam samples. The average values for thickness and width were used in calculations.
Dimensions in mm
Name T1 T3 AVG T W1 W2 W3 AVG W
1 36 ful l cure 1 1 .9 1 .9 1 0.2
1 36 full cure 2 2. 1 2.1 1 0.21
1 36 art cure 1 2. 2.3 1 0.2
1 36 art cure 2 2 . 1 2. 1 1 0.2
1 69 ful l cure 1 3.7 3.5 1 0. 1
1 69 ful l cure 2 3.0 3.2 1 0. 1
1 69 art cure 1 2.8 2.6 1 0.31
1 69 art cure 2 2.8 3.0 1 0.49
L=50 mm for all
23
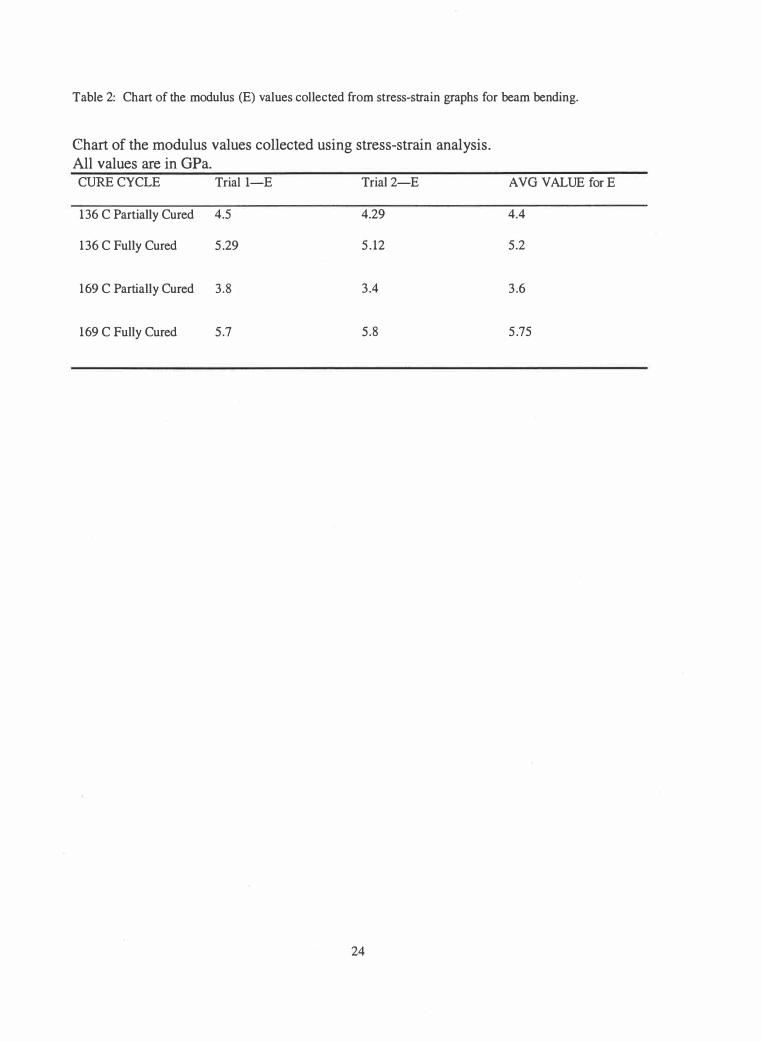
Table 2: Chart of the modulus (E) values collected from stress-strain graphs for beam bending.
Chart of the modulus values collected using stress-strain analysis. All values are in GPa. CURE CYCLE Trial 1-E Trial 2-E A VG VALUE for E
136 C Partially Cured 4.5
1 36 C Fully Cured 5 .29
169 C Partially Cured 3.8
169 C Fully Cured 5 .7
4.29
5 . 12
3 .4
5.8
24
4.4
5.2
3 .6
5 .75
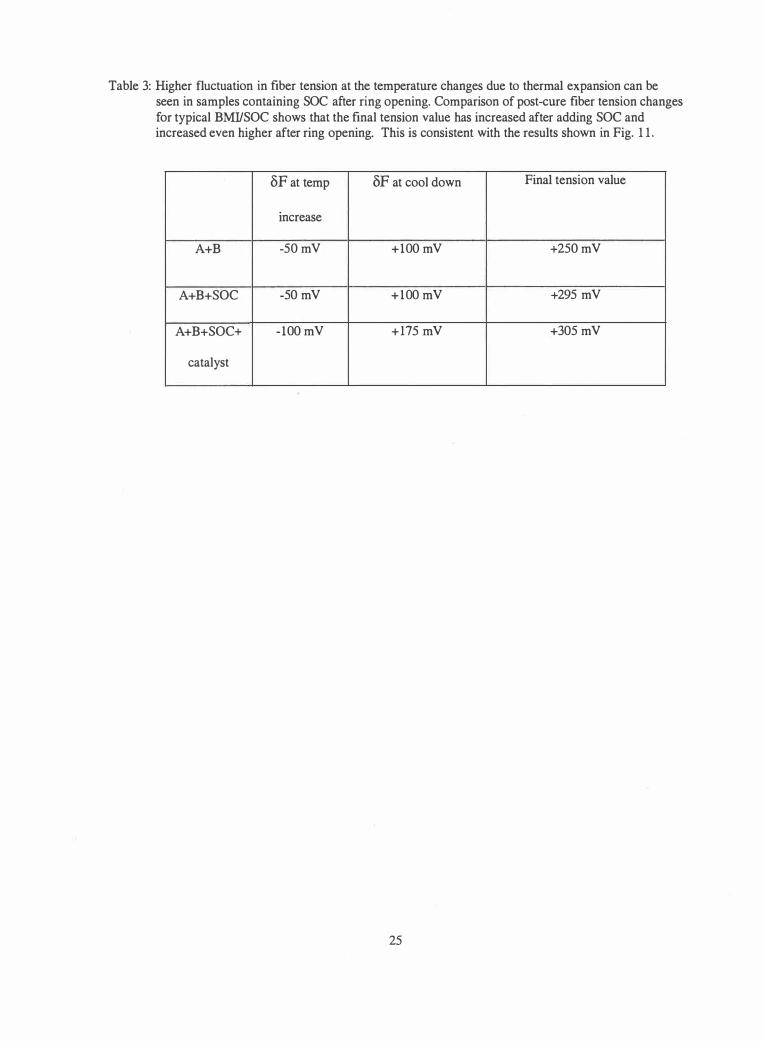
Table 3: Higher fluctuation in fiber tension at the temperature changes due to thermal expansion can be seen in samples containing SOC after ring opening. Comparison of post-cure fiber tension changes for typical BMI/SOC shows that the final tension value has increased after adding SOC and increased even higher after ring opening. This is consistent with the results shown in Fig. 1 1 .
8F at temp 8F at cool down Final tension value
increase
A+B -50 mV +lO0 mV +250 mV
A+B+SOC -50 mV +lO0 mV +295 mV
A+B+SOC+ -lO0 mV +175 mV +305 mV
catalyst
25
•: ·, >�,- .
. .::.:.
'PO'Wer: Supply ·
. ,; \J�:o:;;r . ; .. , �:t,,
:: .·,,:
Fig 1 : Schematic . of CIST setup.
26
Fig 2: Photo of CIST setup.
27
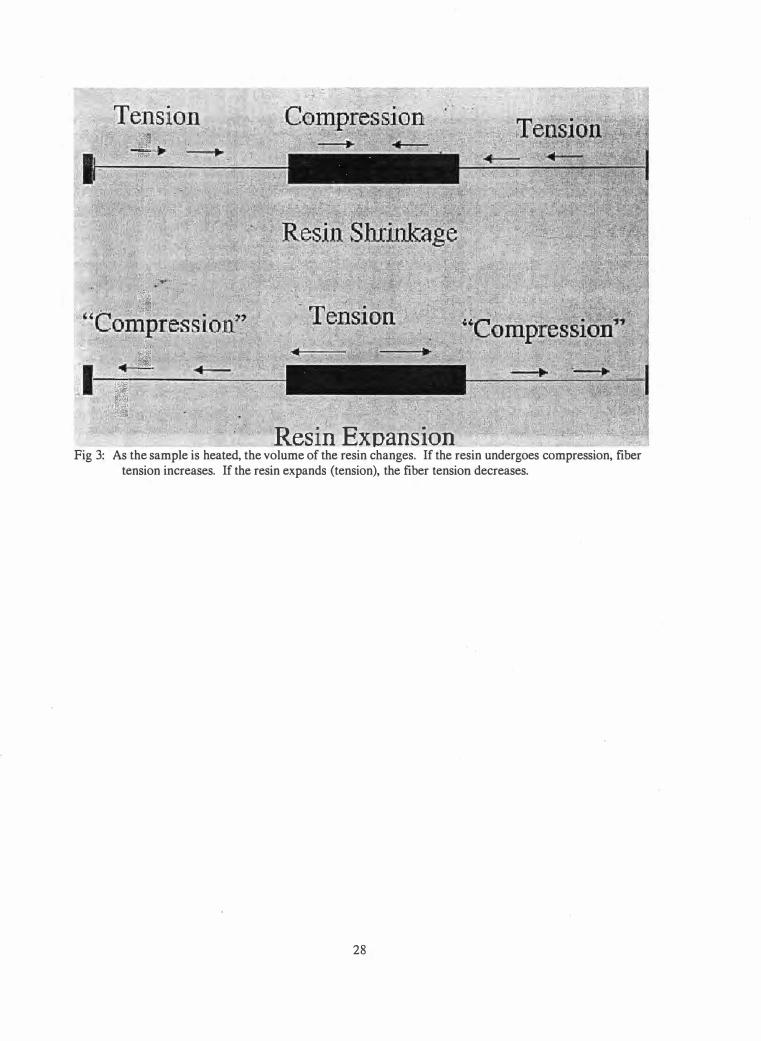
Resin Expansion Fig 3: As the sample is heated, the volume of the resin changes. If the resin undergoes compression, fiber
tension increases. If the resin expands (tension), the fiber tension decreases.
28
_ _ Typica� Results
· ! . . iJl { · 1/� . .... . P� ··---- --- ·
6 ' ,....,...._..:..:....__' _,.,_ .. ____________ ____.. __ ._, .... _. --· . . 140
:.,.: · . .
'\ .. '
Tem,perat'\lre � -- --- - � --- -
• .. ·· · '
- . '.'Fiber: .AS4 -· Res.in: EPON 828/niPDA
·-. �
· Fibies T-cnsion
_ l20 � .......__, ,. 0
., • < •
. . - -._-· 100 � ·
�- ':�-� /; - · d ·'80- d) ::
- - � ,'.
� P-1 �=:
.8i . 50 ·-� -
._ 2 '------'-----.:...-.-----'----�----J 20 - � . , · , ,. 2 · · · 3 4 5
•Time Chfs) -
Fig 4: An example of typical CIST results characterizing changes in fiber tension over the cure cycle shown.
29
3501-6
1 69 C Isothermal without Teflon
•
§. 250 -i------11----------------------------------t 'ti ca .9 0 £ 200 -i- ---1---------,�;,=...;=-1------"'--.Jv..--'----"---------------=------------+ I!! .a I? � 150 -i�=�+--------------------------�
Time (min)
Fig. 5 : Results for three cure cycle trials implemented without Teflon at the interface.
30
10
9
8
7
6
- -Farenheit s -Trial 1 (mV)
5 'ti ca -Trial 2 (mV) ..J
-Trial 3 m 4
3
2
> E
;- 250 LV 0 ..J
0
3501-6
169 C lsahemel with Tefloo
£ 200 �---¾----.,C,,,C:.:1[__ ____ ---==-'°,cL_.,,_,,,_ ________________ -1-
Q)
� 150 Q) . t-
lirre (rrin)
Fig. 6: Results for three cure cycle trials implemented WITH Teflon at the interface.
3 1
10
9
8
7
6
§ -Farerreit
5 "C -Trial 1 (rrW)
0 -Trial 2 (rrW) ..J
-Tnal 3
4
3
2
> 150
g "O ca 0
1 00 ...J
50
0
0
Com par ison of Teflon and non-Teflon Coated Fiber Tens ions for 1 69 C Isotherm Cure
1 00 200 300 400
Tim e (m in)
500
:§ "O ca 0
...J
Fig. 7: Comparison of a Teflon and non-Telfon result after using a moving average with a window of thirty data points to smooth the curve. At cure end, the results are practically the same.
32
Matrimrd 5292·A
Fig 8: BMI Matrirnid A 5292 (top) and Spiro Orthocarbonate (bottom) monomers.
33
J ..
CH . 2
N
. o-
o .
• • I' .._ � 'r
· , .
·- . ,,
Fig. 9: Addition reaction A + SOC and SOC ring opening network after both reactions are completed.
34
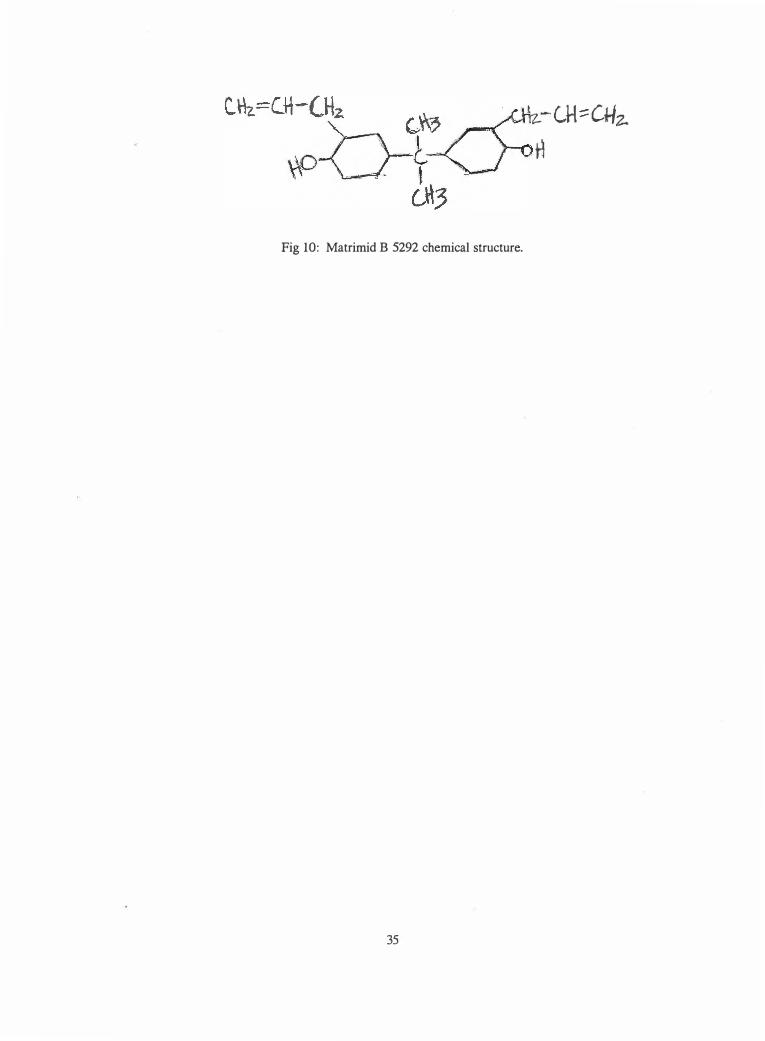
Fig 10 : Matrimid B 5292 chemical structure.
35
.. i--C.Jt::: CHi.
- H
Results for 250 C Isotherm Trials
9
7
� 250 6
� -� s � 200 ------------------------+- 5 'g � 0 � � �
1 50 1,-..=�; . .1------- -------------1 4
3
2
Time (min)
,�.---.-.-.Temperature (C) ,..
A+B
1---A+B+SOC
-A+B+SOC+CATALYST
Fig. 1 1 : Comparison of results for 250 C isotherm cure. A+ B experienced the lowest in-cure loads. Ring opened and non-ring opened SOC blends show higher in-cure loads.
36
100
0
A+ B 8/24/02
1 5 0 C f or 1 0 h r s and
2 5 0 C f o r 1 0 h r s a n d
R T f o r 3 h r s
I
,I".,.--..__
� --1\ ¥�
'---
EB 137 2E 273 341 49 477 54.5 613 631 749 817 005 ffi3 1C21 1cm 1 157 1225 12:B 1331
Ti me (m i n )
Fig. 12 : Trial 1 A+B results for split cure cycle.
37
- Far enhe i t
- Load mV
100
0
I
�
AtB &'a)'Q2
150 Cfa 10 trs
250 Cfa 10 trs
RTfa 3 trs
r.-........_
'---
70 1� ZS 'ZT7 346 415 484 553 fi?'2 001 700 � fB3 '£1 1Cll511Cl51 174 1243 1312 1381
lirre ( rrin)
Fig. 1 3 : Trial 2 A+ B results for split cure cycle.
38
14
12
10
6
4
2
0
EOO
100
0
A+B+SOC 8/ 1 8/02
1 50 C for 1 0 h r s
2 5 0 C for 1 0 h r s
R T f o r 3 h r s
I
�,,.,__..
--., �I � r� . \
.......
'-._
1 61 121 181 241 3)1 33'1 421 481 541 001 ffi1 721 781 841 001 00'1 1a21 1CB1 1 141 12J1 12:31 1321 1:E1
Ti me ( m i n )
Fig. 14 : Trial 1 A+B+SOC results for split cure cycle.
39
14
12
10
8 - Farenhe i t
- Load mV
6
4
2
0
A+ B+SOC 8/23/02
1 50 C for 1 0 h rs and
250 C for 1 0 hrs and
RT for 3 h rs
oco�----------------------------.
&X) -1-------------------------------1
I
14
12
_ .«n -1--------------1----------------t-----+ 10 >
"tJ ca 0 ..J ... 0
i£:m�------------!....__ __________ --je-------------l
8 'c, ----:; - Farenhei t
GI
(
... ca
l s
4
· 4<�
an�1 I\
100 � 2
0 ------------------------------ 0
1 � 123 184 24.5 3l5 'J5l 428 400 !:B:> 611 672 733 794 ffi5 916 rJT7 1CXl31CW110012Z1 1�13<:G14l4
Ti me ( mi n)
Fig. 15 : Trial 2 A+B+SOC results for split cure cycle.
40
! - Load mV ..J
600
500
> 400
.§. '0 ca 0
..J
� £ 300 !
t- 200
1 00
0
A + B + S O C + C a t a l y s t 8 / 1 3 / 0 2 1 5 0 C f o r 1 0 h r s a n d
2 5 0 C f o r 1 0 h r s a n d
R T f o r 3 h r s
I
(
'""---------�
J\ _....,,..,.,-'--
89 1 77 265 353 441 529 61 7 705 793 881 969 1 057 1 1 45 1 233 1 321
T i m e ( m i n )
Fig. 16: Trial 1 A+B+SOC+Catalyst results for split cure cycle.
4 1
1 4
1 2
1 0
8 §
6
4
2
0
'0 ca 0
..J
-- F a r e n h e i t
-- L o a d m V
600
500
...... 400 >
"C nl 0
...I
5
!£: 300 f
nl
200
100
0
.,;-'1,�
-.r,,,-
A+B+SOC+CAT 8/21/02
1 50 C for 1 0 hrs and
250 C for 1 0 hrs and
RT for 3 hrs
I
�-
I
J\
74 1 47 220 293 366 439 512 585 658 731 804 877 950 1023 1 096 1 1 69 1 242 1315 1 388
Time (mln)
Fig. 17 : Trial 2 A+B+SOC+Catalyst results for split cure cycle.
42
14
12
1 0
8 §
6
4
2
0
'C nl 0
...I
--Farenheit
- Load mV
..... _. _, ·'",-.-�
. .. �,. . ·:
rUMr . < , , . • SHU1" 0llif, VAL.VE':: <
. . · RELIEF VAL CJAUGB -1 s ""
.... :..:
,,,_, ... .. . . ;:-.. , , ---
GA JO£ ✓1----1
·' ...... � .. -..,,
IDCHP�SURE PUMP
. (4)1:tE ROOS . t! SLEEY,ES, �- ,:
?\ ��=====-------.... ;�· ,:)
'-· :;:-:• �:
: : ·F�E & SHI.BL-D
·, . ........ ,
Fig 1 8 : Volumetric Dilatometry setup at Wright-Patterson Air Force Base in Ohio.
43
Stress Strain Curve
1 36 C Partially Cured Results
1 6
1 4
,... 1 2
Ill 10 Ill
6
4
0 0.5 1 .5 2 2.5 3 3.5 4 4.5
1 Volt or 1000 Microstralns
Fig. 19 : Plot of the stress strain curves for 2 beam samples partially cured at 1 36 C. The equations of the best fit lines are shown. The slopes of the lines are the elastic moduli for the specimens.
44
0 0.5
Stress Strain Curve 136 C Fully Cured Results
1 .5
1 Volt or 1000 Microstralns
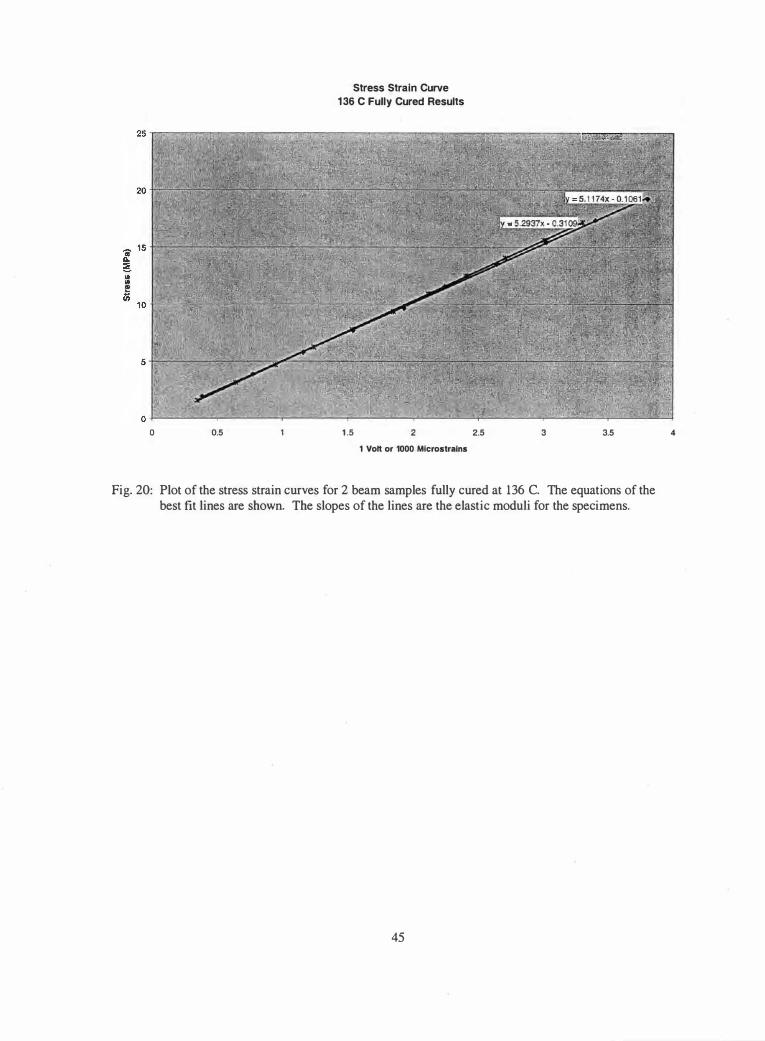
2.5 3 3.5
Fig. 20: Plot of the stress strain curves for 2 beam samples fully cured at 136 C. The equations of the best fit lines are shown. The slopes of the lines are the elastic moduli for the specimens.
45
4
Stress Strain Curve 1 69 C Partially Cured Results
12
� 1 0 • •
8 u;
6
4
2
0
0 0.5 1 .5 2 2.5 3 3.5 4 4.5 5
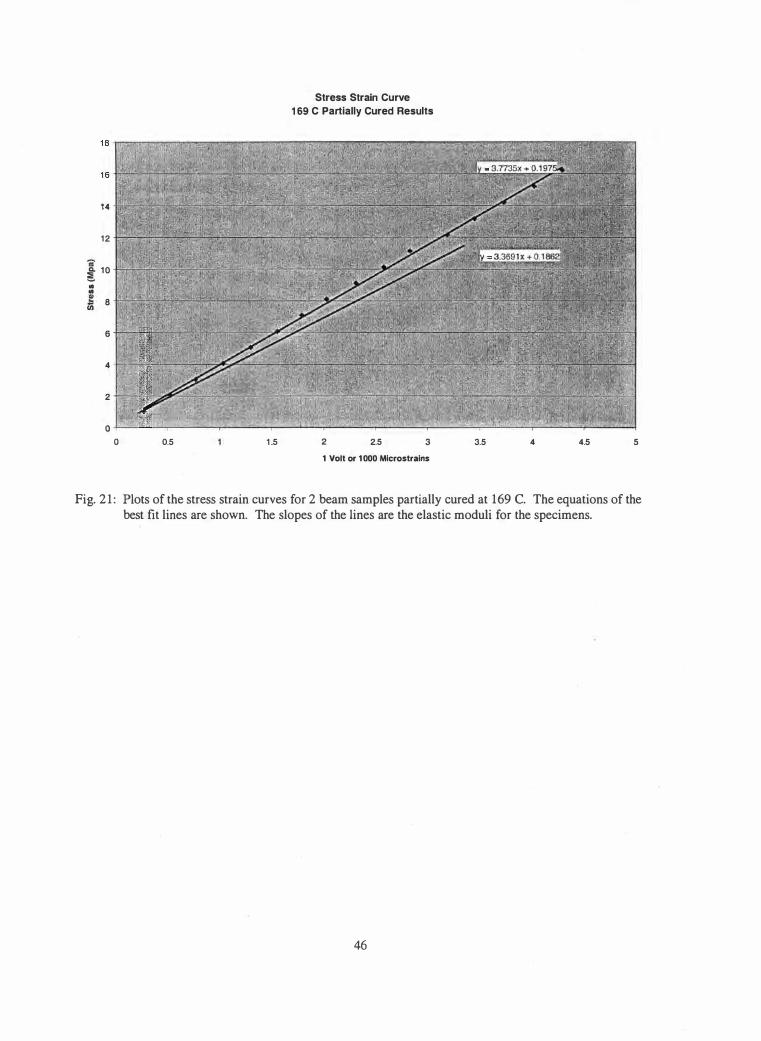
1 Volt or 1 000 Microstrains
Fig. 2 1 : Plots of the stress strain curves for 2 beam samples partially cured at 169 C. The equations of the best fit lines are shown. The slopes of the lines are the elastic moduli for the specimens.
46
Ill Ill
4
2
0
0 0.2 0.4 0.6
Stress Strain Curve
1 69 C Fully Cured Data
0.8 1 .2
1 Volt or 1000 Mlcrostrains
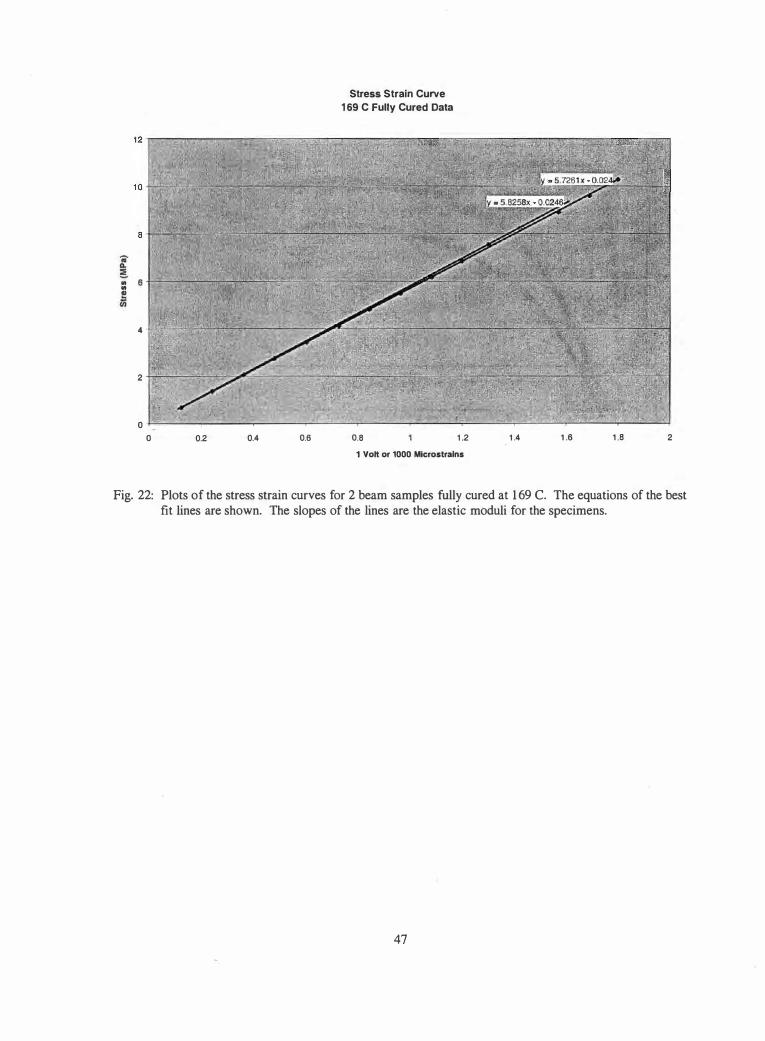
1 .4 1 .6 1 .8 2
Fig. 22: Plots of the stress strain curves for 2 beam samples fully cured at 1 69 C. The equations of the best fit lines are shown. The slopes of the lines are the elastic moduli for the specimens.
47
3
� 2 (,) :;::; en
1 36 C
ls:tam
1 26 C
ls:tem .! 1.5 +--�---_.=------,,6C----------------------j w
i 1 C. C.
0.5
6
ca 5
-
fl) :::, 4
:::, "C 0 3
:E
2
0
0 1CD
an :m CureT i me
(mi nutes)
a::o :m Cu r eT i m e
( mi nutes)
6D
1 26 G
ls:tem
81)
Fig. 23 : Scaled results for the independently conducted volumetric dilatometry. This graph has taken the original y-axis and multiplied each value by 2 to get a graph of modulus (E) values. The average moduli values in table 2 compare well with these values shown in the above figure:
Point #1: E=3.5 at 45 min Point #2: E=5.5 at 180 min Point #3 : E=4.2 at 210 min Point #4: E=5 .2 at 480 min (#4 used to scale the graph.)
48
VITA
Brett Hardin Franks was born in Worcester, MA on May 23, 1978. He obtained
his B.S. in Engineering Science with a concentration in biomedical engineering from the
University of Tennessee, Knoxville in 2001, where he fulfilled the requirements of the
University Honors Program and graduated cum laude. During his undergraduate
experience, he worked for one year at a biomedical device company as an engineer. In
August 2001, he began his graduate studies at the University of Tennessee, Knoxville.
Brett worked with Dr. Madhu Madhukar as his major professor during this time. The
M.S. degree in Engineering Science will be granted in December 2002 upon publication
of this study. Currently, Brett is seeking a professional position as an engineer.
49