FE Analysis of Weld Stresses in Composite Bridges
104
FE Analysis of Weld Stresses in Composite Bridges A case study of the influence of the cross bracings ANDREAS SJÖLANDER Degree project in Steel Structures Second cycle Stockholm, Sweden 2013
-
Upload
khangminh22 -
Category
Documents
-
view
3 -
download
0
Transcript of FE Analysis of Weld Stresses in Composite Bridges
FE Analysis of Weld Stresses in CompositeBridges
A case study of the influence of the cross bracings
ANDREAS SJÖLANDER
Degree project inSteel Structures
Second cycleStockholm, Sweden 2013


FE Analysis of Weld Stresses in
Composite Bridges
A case study of the influence of the cross bracings
Andreas Sjölander
January 2013
TRITA-BKN. Master Thesis 375, 2013
ISSN 1103-4297
ISRN KTH/BKN/EX-375-SE

©Andreas Sjölander, 2013
Royal Institute of Technology (KTH)
Department of Civil and Architectural Engineering
Division of Structural Engineering and Bridges
Stockholm, Sweden, 2013

i
Abstract
Composite bridges in Sweden are commonly designed as a twin I-girder section. To stabilize the bridge during launching and concreting horizontal cross bracings are used. These are normally connected to a transverse web stiffener that is welded to the main beams. These welds are in Sweden designed as fillet welds with a throat size of 5 mm regardless of the dimensions of the bridge. During an inspection of Vårby Bridge south of Stockholm in 2006 cracks were found in this weld between the transverse web stiffener and the top flange. After discovering of these problems the Swedish Transport Administration (Trafikverket) wants the designer to present calculations for this weld. The aim of this thesis was to investigate and compare the stresses in the weld between the top flange and the transverse stiffener for different cross bracings. A finite element model of a typical composite bridge, with five different types of cross bracings, was investigated using the FE program Brigade Plus. A selection of loads including temperature-, traffic- and fatigue loads were considered. In Table 1 is the normalized level of utilization for the considered load cases showed for the different cross bracing types. Table 1 clearly shows that the design of cross bracings will affect the stress levels in the weld.
Table 1 Normalized level of utilization for the selection of load cases with respect to different design of cross bracings
Load Case Normalized Level of Utilization [-] Type 1 Type 2 Type 3 Type 4 Type 5
Gravity 0.73 0.69 0.73 0.44 1
Wind 0.34 0.11 0.25 0.09 1
Flange 0.41 0.40 0.14 0.13 1
Temp High 0.63 0.75 0.41 0.15 1
Temp Low 0.63 0.75 0.41 0.15 1
Delta Temp High 0.75 0.54 0.76 0.40 1
Delta Temp Low 0.72 0.58 0.68 0.35 1
Traffic 1 0.74 0.64 0.72 0.40 1
Traffic 2 0.77 0.55 0.75 0.35 1
Traffic 3 0.72 0.77 0.70 0.5 1
Keywords: Weld Stresses, Composite Bridges, Cross Bracings, Web Stiffeners


iii
Acknowledgements
A warm thank you to my supervisors Hans-Göran Jansson and Andreas Fridholm at Vectura for the initiative to this thesis and also for all their support and advice during the process. Thanks also to Jörgen Andersson at Vectura for help and advice with FE modeling. Thanks to associate professor Bert Norlin at KTH for support and thoughtful advice. A big thank you to Johan Kölfors at Scanscot for the usage of Brigade Plus and thanks also to the support team at Scancot for guidance with modelling. Thanks to Lars Hamrebjörk, Mattias Nilsson and Runquist Arkitekter for contribution of pictures. Stockholm, June 2012 Andreas Sjölander


v
Contents
Abstract ...................................................................................................................................... i
Acknowledgements ............................................................................................................. iii
List of Notations .................................................................................................................... ix
Latin Letters .................................................................................................................... ix
Greek Letters ................................................................................................................... ix
Index ................................................................................................................................. x
Additional Notations ...................................................................................................... x
Contractions ..................................................................................................................... x
1 Introduction .................................................................................................................... 1
1.1 Background ........................................................................................................... 1
1.2 Aim and objective ................................................................................................. 2
1.3 Method ................................................................................................................... 2
1.4 Limitations ............................................................................................................. 3
1.5 Structure of report ................................................................................................ 3
2 Composite bridges ......................................................................................................... 5
2.1 History of composite bridges in Sweden .......................................................... 5
2.2 Concept of composite bridges ............................................................................ 8
2.2.1 Transferring of shear forces ................................................................... 8
2.2.2 Better usage of materials ...................................................................... 10
2.2.3 Requirement in codes ........................................................................... 10
2.3 Advantages with composite bridges ............................................................... 11
2.3.1 Erection methods ................................................................................... 11
3 Cross bracings in composite bridges ....................................................................... 13
3.1 Requirements in codes ....................................................................................... 13
3.1.1 Codes in Sweden ................................................................................... 13
3.1.2 Design of cross bracings ....................................................................... 14

vi
3.2 Functionality of cross bracings ......................................................................... 14
3.2.1 Lateral torsional buckling .................................................................... 15
3.2.2 Constrain forces ..................................................................................... 17
3.3 Usage of web stiffeners ...................................................................................... 17
3.3.1 Shear buckling according to classical theory ..................................... 18
3.3.2 Transverse web stiffeners ..................................................................... 20
3.3.3 Longitudinal web stiffeners ................................................................. 21
3.3.4 Gusset plates .......................................................................................... 21
3.3.5 Notches ................................................................................................... 22
3.4 Connections of cross bracings ........................................................................... 22
3.4.1 Welded connections .............................................................................. 22
3.4.2 Bolted connections ................................................................................ 23
3.5 Design of welded connections .......................................................................... 23
3.5.1 Residual stresses .................................................................................... 23
3.5.2 Design of fillet welds in the ULS: Directional Method .................... 24
3.5.3 Design of fillet welds in the ULS: Simplified Method ..................... 25
3.5.4 Design of fillet welds in the fatigue limit state ................................. 25
4 Studied bridge .............................................................................................................. 27
4.1 Studied bridge ..................................................................................................... 27
4.2 The bridge geometry .......................................................................................... 28
4.2.1 Deviations from the original bridge ................................................... 29
4.3 Geometry of the main beams ............................................................................ 29
4.4 Geometry of bridge deck ................................................................................... 30
4.5 Cross bracings ..................................................................................................... 31
4.5.1 Design of cross bracings along the spans........................................... 31
4.5.2 Cross bracings of type 1 and 2 ............................................................. 32
4.5.3 Cross bracings of type 3 and 4 ............................................................. 33
4.5.4 Cross bracing of type 5 ......................................................................... 34
4.5.5 Cross bracings over supports .............................................................. 34
4.6 Geometry of web stiffeners ............................................................................... 35
4.7 Mechanical properties ........................................................................................ 36
4.8 Loads .................................................................................................................... 36
4.8.1 Gravity load ............................................................................................ 36

vii
4.8.2 Wind load ............................................................................................... 36
4.8.3 Lateral force at bottom flange .............................................................. 37
4.8.4 Temperature loads ................................................................................ 38
4.8.5 Traffic load ............................................................................................. 39
4.8.6 Fatigue load ............................................................................................ 41
5 FE model ........................................................................................................................ 45
5.1 General theory ..................................................................................................... 45
5.1.1 Theory of FEM ....................................................................................... 45
5.1.2 Theory of convergence.......................................................................... 46
5.1.3 Integration technique ............................................................................ 46
5.2 FE model of the studied bridge ........................................................................ 47
5.2.1 Modelling of the bridge deck ............................................................... 47
5.2.2 Modelling of main beams ..................................................................... 49
5.2.3 Modelling of cross bracings ................................................................. 51
5.2.4 Modelling of web stiffeners and gusset plates .................................. 53
5.2.5 Modelling of connections ..................................................................... 53
5.2.6 Modelling of boundary conditions ..................................................... 54
5.3 Quality assurance ............................................................................................... 54
5.3.1 Control of mass of the model ............................................................... 54
5.3.2 Control of reaction forces ..................................................................... 55
5.3.3 Control of traffic load ............................................................................ 55
5.3.4 Convergence analysis for displacements ........................................... 56
5.3.5 Convergence analysis for stresses ....................................................... 58
5.3.6 Orthotropic behaviour of deck plate .................................................. 60
5.3.7 Displacement of main beams ............................................................... 61
5.3.8 Control of stresses in top flange .......................................................... 62
5.3.9 Control of section forces in web stiffener .......................................... 63
5.4 Conclusions of quality control .......................................................................... 65
6 Results ............................................................................................................................ 67
6.1 Extraction of results ............................................................................................ 67
6.2 Comparison of stresses ...................................................................................... 67
6.3 Comparison of Stresses Ranges ........................................................................ 76

viii
7 Analysis and discussion ............................................................................................. 79
7.1 Comments and possible errors in modelling ................................................. 79
7.2 Evaluation of studied load cases ...................................................................... 80
7.2.1 General evaluation ................................................................................ 80
7.2.2 Evaluation of web stiffeners and gusset plates ................................. 81
7.2.3 Comments regarding level of utilization ........................................... 82
7.3 Evaluation of fatigue life ................................................................................... 83
7.4 Conclusions ......................................................................................................... 84
7.5 Further research .................................................................................................. 85
Bibliography .......................................................................................................................... 87
Books ............................................................................................................................... 87
Design Standards .......................................................................................................... 88
Internet ........................................................................................................................... 88
Journals and Papers ...................................................................................................... 89

ix
List of Notations
Latin Letters
a Height of fillet weld d Height/Depth of a beam f Stress property of steel h Height t Thickness q Uniformly distributed load A Area E Young´s modulus of elasticity F Force I Moment of inertia K Element stiffness L Length N Axial force U Strain energy
Greek Letters
α Angle in degrees γ Partial coefficient regarding safety ε Strain ν Poisson’s ratio σ Normal stress τ Shear stress Σ Summation
x
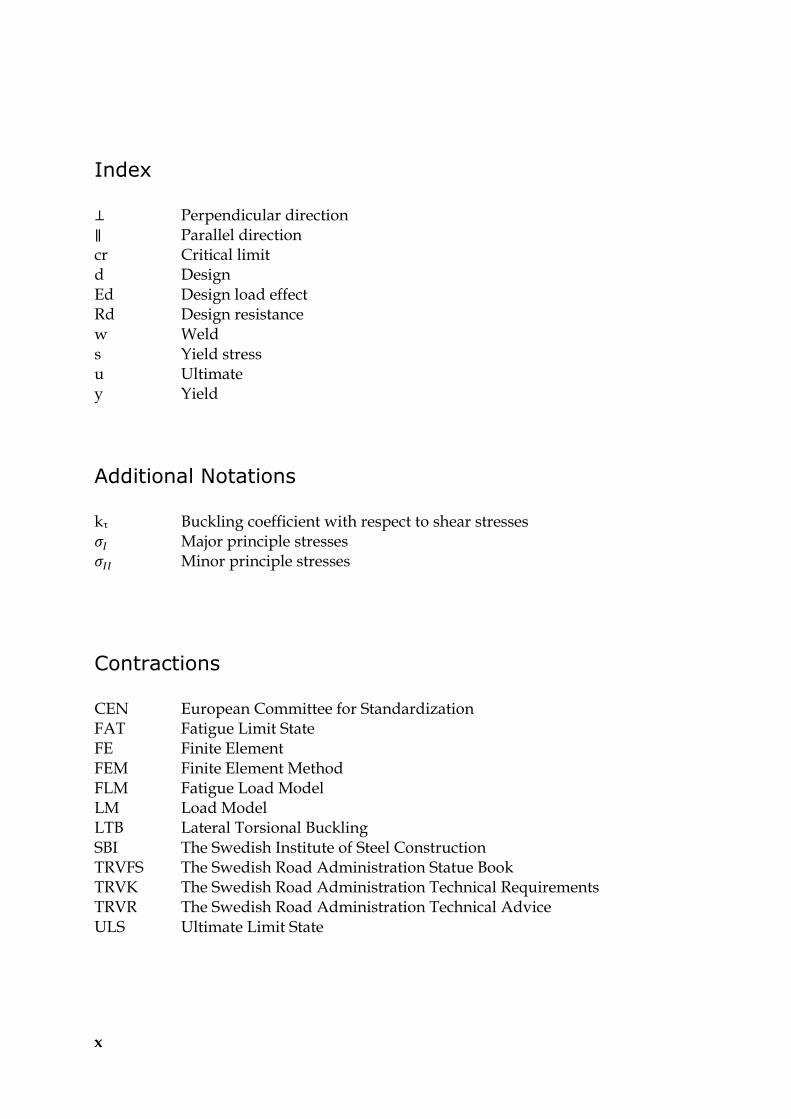
Index
⊥ Perpendicular direction ∥ Parallel direction cr Critical limit d Design Ed Design load effect Rd Design resistance w Weld s Yield stress u Ultimate y Yield
Additional Notations
kτ Buckling coefficient with respect to shear stresses Major principle stresses
Minor principle stresses
Contractions
CEN European Committee for Standardization FAT Fatigue Limit State FE Finite Element FEM Finite Element Method FLM Fatigue Load Model LM Load Model LTB Lateral Torsional Buckling SBI The Swedish Institute of Steel Construction TRVFS The Swedish Road Administration Statue Book TRVK The Swedish Road Administration Technical Requirements TRVR The Swedish Road Administration Technical Advice ULS Ultimate Limit State

1. INTRODUCTION
1
1 Introduction
In Sweden a common bridge type in span lengths from 30 to 60 meters is according to Collin et.al (2008) a composite bridge consisting of steel beams and a concrete slab. A common structural solution, in Sweden, to this bridge type is to use a twin I-girder1. Due to stability reasons during construction- and serviceability phases horizontal stiffening beams, cross bracings, are used. These beams are usually connected by bolts to a transverse/vertical web stiffener that are welded to the main beams. The cross bracings will locally stiffen the bridge in the transverse direction. The locally increased rotational stiffness will lead to stresses in the welds. The design of the welds will be based on the individual engineers’ judgement and the influence of different cross bracings can be hard to estimate. An example of a cross braced cross section for a twin I-girder bridge can be seen in Figure 1.1. The cross bracings can be designed in different ways.
Figure 1.1 Cross section of a twin I-girder composite bridge with cross bracings
1.1 Background
In Eurocode SS-EN 1994-2; 6.6.1.1(13) there is a notification saying that adjacent to the vertical web stiffeners the moment acting around the steel beams longitudinal direction should be considered. In the Designers’ Guide to EN 1994-2 by Hendy et.al (2006) the above section is commented that the design of these welds with respect to the moment often leads to throat sizes greater than a nominal of 6 mm. The common design approach among designers in Sweden is to use a nominal weld of 5 mm. This
1 Combri, 2008b

1. AIM AND OBJECTIVE
2
has been assumed to be a conservative and safe approach with small or no calculation effort. But during an inspection in 2006 of Vårby Bridge cracks in the weld between the stiffening plate and main beams where found, se Figure 1.2. Vårby Bridge is a highway composite bridge located south of Stockholm. These cracks where later determined to be caused by fatigue according to Bengtsson et.al (2010). After the mentioned problem with Vårby Bridge had been discovered the Swedish Transport Administration (Trafikverket) wants the designer to present the calculations for this specific weld when designing new bridges.
Figure 1.2 A fatigue crack in the fillet weld between a vertical stiffener and top flange. © Mattias Nilsson
1.2 Aim and objective
The aim with this master thesis was to study the influence of cross bracings and vertical web stiffeners with respect to stresses in the weld between the vertical stiffener and the top flange in a composite bridge. The design of the weld between the upper flange and stiffening plate will be studied in the Ultimate Limit State (ULS) and in the Fatigue Limit State (FAT).
1.3 Method
Initially a literature study about the structural behaviour of composite bridges and the design requirements according to Swedish codes was performed. Studies about welded connections and the design of these in ULS and with respect to fatigue were studied to increase the understanding of how they should be modelled and designed. To understand how forces are transferred and what influence the cross bracing and vertical stiffeners have a model of a bridge was created using the finite element program Brigade Plus 4.1-2. Three different types of cross bracings were studied for the same bridge type. Also, two different connections to the main girder were

1. INTRODUCTION
3
studied, i.e gusset plates or vertical web stiffeners. The studied bridge modelled is a commonly used solution in Sweden for composite bridges.
1.4 Limitations
Due to the limited time for working with the master thesis the following limitations had to be implemented. The impact of – and reason for the simplification is more precisely described in Chapter 4.
The geometry of the studied bridge was slightly simplified
The number of studied cross bracings was set to five
Forces and stresses were only studied at the location of the weld between the stiffening plate and top flange
Possible negative effects of different cross bracings considering other structural elements than the weld were mentioned but not studied
Only linear elastic material behaviour was considered
1.5 Structure of report
The structure of the report is according to the following:
Chapter 2: Brief history and concept of composite bridges
Chapter 3: Describes the requirements and design of cross bracings and web stiffeners according to the Eurocode. Some brief theory about the usage of web stiffeners and design of welds.
Chapter 4: Describes the studied bridge with the geometry of the structural parts and the loads considered to act on it.
Chapter 5: Brief presentation of FE theory along with a detailed presentation of the FE model of the bridge and the quality controls that were performed.
Chapter 6: Selection of results is presented.
Chapter 7: Conclusions and discussion about the obtained results.


2. COMPOSITE BRIDGES
5
2 Composite bridges
This chapter contains a brief history about composite bridges in Sweden together with the structural concept of composite bridges.
2.1 History of composite bridges in Sweden
Composite bridges with steel and concrete have been built in Sweden since the beginning of the 1970-ties2. With the publication of Bronorm 88 in 1988 by the Swedish Transport Administration steel beam bridges with concrete slabs had to be designed as composite bridges3. This together with the development of more effective shear studs and other advantages have made composite bridges an attractive solution for bridges for spans between 30 to 60 meters. Longer spans is also possible to construct, Foxen Bridge in Värmland, se Figure 2.1, is with its span of 125 m the longest composite bridge in Sweden today4. In Sundsvall the construction of the bridge over Sundsvallsfjärden is on-going. It’s a steel box girder composite bridge and will have a maximum span of 170 meters once it’s completed in late 20145. It will also be Sweden’s second largest road bridge with a total length of 2109 meters.
2 Collin et.al, 2008 3 Samhällsbyggaren, #3 2011 4 Swedish Steel Construction Institute, 2012 5 Trafikverket, 2012

2. HISTORY OF COMPOSITE BRIDGES IN SWEDEN
6
Figure 2.1 Foxen Bridge in Värmland with Sweden´s today longest span for composite bridges, 125 m. ©Trafikverket
The traffic situation in Sweden is such that most modern highway bridges needs to carry two lanes of traffic in each direction. In Figure 2.2 the Vårby Bridge is shown. This represents the typical concept for a highway composite road bridge in Sweden. The bridge is constructed as two identical twin I-girder bridges, each carrying two lanes of traffic6. The benefits with building two bridges is that you during maintenance can close one bridge and do the repair work whithout having the effect of traffic loads on the bridge. The investment cost for building two bridges will usually be higher. This will partly be due to more material usage and the need for more railings and edge beams. Another reason is that by building only one bridge it could be possible to optimize the usage of steel by using three main beams instead of four which could reduce the costs.
6 Combri, 2008b

2. COMPOSITE BRIDGES
7
Figure 2.2 The Vårby Bridge is constructed as a twin I-girder bridge, a common structural solution to composite highway road bridges in Sweden. ©Runquist Arkitekter
For a period of ten years, from 2001-2011 a total of 1805 road- and railway bridges have been built in Sweden. Of these bridges 99 (6%) are composite bridges. If only the beam type of bridges is considered, for which composite bridges is considered as a good alternative, 92 bridges out of 393 are composite bridges (23%). The market share for the different structural materials used for beam bridges is presented in Figure 2.3. This statistic is collected from BaTMan which is the Swedish bridge management system.
Figure 2.3 Diagram showing the choice of structural material for road- and railway beam bridges.
23%
1%
71%
5%
Structural material for road- and railway beam bridges
Composite
Timber
Concrete
Steel

2. CONCEPT OF COMPOSITE BRIDGES
8
2.2 Concept of composite bridges
The concept of composite bridges is that the bearing capacity of the bridge is achieved by two materials in structural cooperation. A good design leads to a better utilization of the materials and more slender cross sections compared to a concrete bridge. A common use of material for composite action in bridges is steel and concrete. In this case you utilize the ability of the concrete to carry compressive forces and the steels ability to carry tensile forces. Other combinations that are used are steel together with timber and steel-soil composite bridges. The definition of composite bridges in this report refers to the combination of steel and concrete.
2.2.1 Transferring of shear forces
To ensure full composite action no sliding or separation between the two materials is allowed. To satisfy this one structural element that can transfer shear forces and prevent vertical separation is required in the joint between the two materials. The most common solution today is to weld headed shear stud connectors to the top flange of the main beam. A typical arrangement of the studs can be seen in Figure 2.4. Theoretically no sliding or separation between the two materials will occur. In practise some small sliding or separation has to occur to enable the transfer of forces. By using a large number of shear studs the force and therefore the displacement on each stud is kept low and can therefore be neglected. This ensures that the two materials are in full structural cooperation, called full composite action. Composite action in this report refers to full composite action.
Figure 2.4 Assembling of a steel box before launching. On the top flange the arrangement of studs is visible. ©Lars Hamrebjörk

2. COMPOSITE BRIDGES
9
Figure 2.5 is illustrating the difference between composite action and no composite action for a simply supported beam under a uniformly distributed load. The beam is made up of two sections and the differences in the stress distribution over the section is showed considering in A) full composite action and in B) no composite action. As can be seen in Figure 2.5 the maximum normal stresses over the section is 50 % less when full composite action between the materials is achieved.
Figure 2.5 Distribution of stresses for a simply supported beam under a uniformly distributed load considering a section with in A) Full Composite Action and B) No Composite Action. Picture redrawn from Stålbyggnadsinstitutet (2008)

2. CONCEPT OF COMPOSITE BRIDGES
10
2.2.2 Better usage of materials
Figure 2.6 is showing the moment diagram for a continuous beam under a uniformly distributed load together with a cross section for a composite bridge.
Figure 2.6 Concept for good material use in a continuous composite bridge under a uniformly distributed load.
As can be seen in Figure 2.6 the concrete is mainly in compression and the steel is in tension. This is a beneficial usage of the two materials. Concrete is very strong in compression compared to in tension. Steel is equally strong in tension and compression but can suffer from instability problems such as buckling when loaded in compression.
2.2.3 Requirement in codes
The design codes in Sweden only distinguish between composite action and no composite action. It’s not possible, according to the codes, to consider partial composite action between two materials. Hence older bridges made of steel and concrete whiteout shear studs, or other shear force transferring mechanism, is consider as bridges with no composite action. Simply supported road bridges and pedestrian bridges are allowed to be designed whiteout composite action according to TRVK Bro 11; E.1.1.

2. COMPOSITE BRIDGES
11
2.3 Advantages with composite bridges
Two of the major advantages with composite bridges, compared to concrete bridges, are that the steel beams will be able to carry the formwork for the concrete slab. This reduces the need for temporary constructions for formwork during concreting7. This will shorten the construction time and can save money. The design in steel will also give more architectural freedom in terms of shape and colour of the bridge. The importance of aesthetics of bridges is something that the Swedish Institute of Steel Construction (SBI) wanted to point out with the publication of the book Steel Bridges (Stålbroar) by Anderson et.al in 1994. The purpose of the publishing was to present well planned steel bridges as alternatives to concrete bridges8.
2.3.1 Erection methods
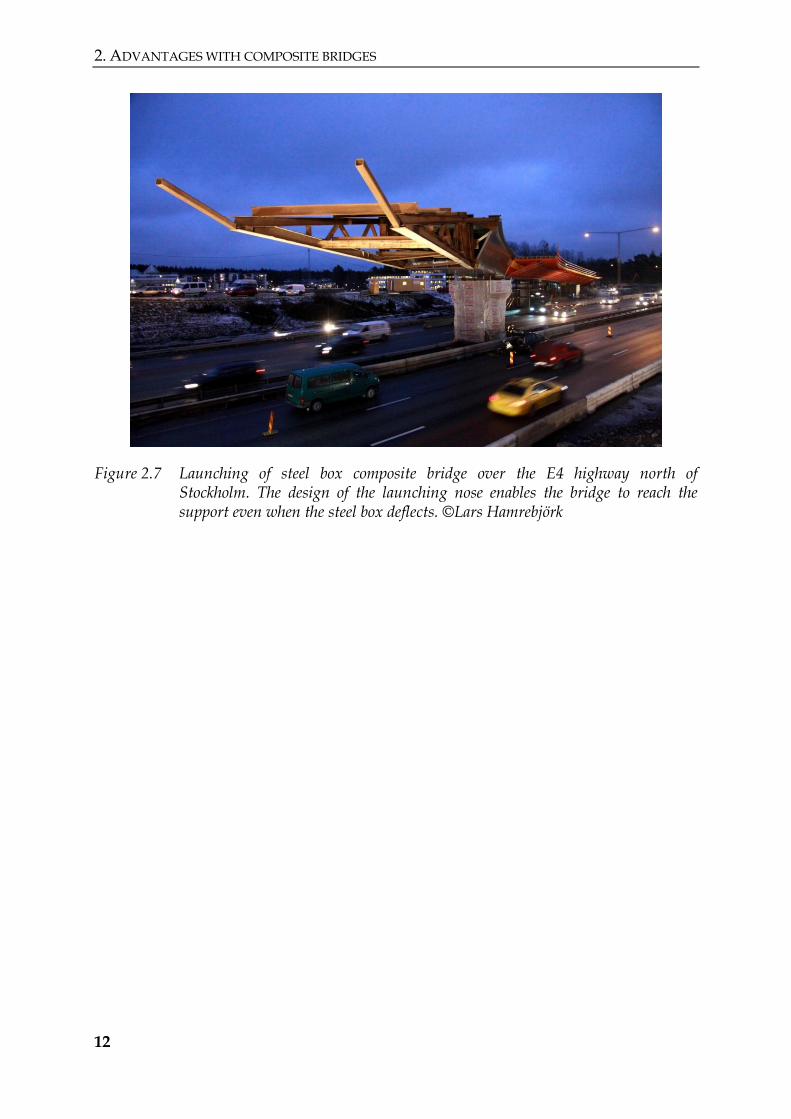
The two main erection methods are launching and lifting. The steel beams are prefabricated and delivered to the work site in pieces. The size of the pieces delivered to the work site depends on the erection method and the possibilities of transportation to the site. If the bridge is to be erected by launching the pieces are assembled and welded together at one side and then gradually launched in place. A launch nose is usually attached to the front of the bridge. This will compensate for the deflections due to deadweight during launching that otherwise will make the procedure impossible. In Figure 2.7 the launching of a composite bridge over the E4 highway north of Stockholm is showed. The usage of a composite bridge enabled the construction of the bridge with no traffic interruptions9. The other erection method is lifting. The pieces is then lifted into place from a boat or other transport and then welded together. This method is normally used together with launching. Alternatively the bridge is lifted into place in one piece.
7 Collin et.al, 2002 8 Collin et.al, 2008 9 Stålbyggnad #1 2012
2. ADVANTAGES WITH COMPOSITE BRIDGES
12
Figure 2.7 Launching of steel box composite bridge over the E4 highway north of Stockholm. The design of the launching nose enables the bridge to reach the support even when the steel box deflects. ©Lars Hamrebjörk

3. CROSS BRACINGS IN COMPOSITE BRIDGES
13
3 Cross bracings in composite bridges
This chapter gives a short introduction to the design codes for bridges in Sweden together with a description of the function of cross bracings in composite bridges and the design of welds.
3.1 Requirements in codes
3.1.1 Codes in Sweden
The design codes used today for bridges in Sweden are listed below in order of significance. These codes were introduced 1st of February 2012.
1. TRVFS 2011:12- This is the Swedish Road Administration Statue Book. This document includes among other things rules about the usage of Eurocodes and national selected parameters.
2. TRVK Bro 11- This is the Swedish Road Administrations Technical Requirements for Bridges. This document includes rules and loads for bridges in Sweden that are not covered by the Eurocode.
3. Eurocode- The European standards for design of structures and bridges. The codes published by the Swedish Road Administration are refereeing to the Eurocodes but when in contradiction the above order of significance is referred to.
4. TRVR Bro 11- This is the Swedish Road Administration Technical Advice for Bridges. This document includes advice regarding the design of bridges. Deviation from this document should be verified with good engineering practice.
In Figure 3.1 is a graphical overview of the system of Swedish codes is presented.

3. FUNCTIONALITY OF CROSS BRACINGS
14
Figure 3.1 Graphical representation of the order of significance for the Swedish design codes for bridges
3.1.2 Design of cross bracings
According to TRVK Bro 11; E.2.1.1.1 cross bracings should be used at supports, beam ends and beam splices with abrupt horizontal angular changes. The cross bracings should be connected to a vertical web stiffener or to plates attached to the upper- and lower flange. According to older standards in Sweden, Bro 2004, cross bracings should be arranged to a necessary extent along the spans. This requirement have been removed from TRVK Bro 11 and implemented in TRVR Bro 11; D.1.2.7.1. This means that it’s no longer a requirement to use cross bracings but an advice.
3.2 Functionality of cross bracings
The cross bracings have three major functions in a composite bridge:
Stabilize the bridge and prevent lateral torsional buckling during launching and concreting
Distribute horizontal loads from the steel girders to the concrete deck
Act as lifting points for exchange of bearings Some different types of cross bracings can be seen in Figure 3.2.
TRVFS 2011:12
TRVK Bro 11
-Requirements-
Eurocode
TRVR Bro 11
-Advice-

3. CROSS BRACINGS IN COMPOSITE BRIDGES
15
Figure 3.2 Some different types of cross bracings
3.2.1 Lateral torsional buckling
Lateral torsional buckling (LTB) is an instability problem that can occur when a beam is loaded in its strong direction. If a beam, free from any imperfections, is considered it will at lower load levels mostly bend in its strong direction, but as approaching the critical load the compressed flange will bend out in its weak direction and twist, se Figure 3.3. Due to LTB the capacity of the beam may be lower than its capacity of pure bending in the strong direction. For composite bridges LTB is mainly a problem during concreting and launching. Before the concrete has hardened there is no composite action between steel and concrete. The concrete is therefore acting as a load on the steel beam. This creates compressive forces acting in the upper flange along the spans and in the lower flange over the inner support due to the bending moment. To increase the lateral stability of the beams cross bracings are therefore used. This will decrease the lateral buckling length of the beams, se Figure 3.4. During service life composite action between the concrete deck and the main beams will fully stabilize the upper flange laterally. Hence LTB of the upper flange during service is not possible. For continuous bridges the lower flange will be subjected to compressive forces over- and close to the supports. The lateral stability must therefore be controlled in these areas. If the stability is insufficient the size of the flange can be increased or extra cross bracings can be added.

3. FUNCTIONALITY OF CROSS BRACINGS
16
Figure 3.3 A) Beam under loading by a point load, B) deflection mostly in strong direction, C) reaching the critical load the compressed part of the beam will bend out in its weak direction
Figure 3.4 In a) no cross bracings are used and the lateral buckling length is equal to the length of the beam. In b) cross bracings are used and the lateral buckling length is equal to the distance between the bracings

3. CROSS BRACINGS IN COMPOSITE BRIDGES
17
3.2.2 Constrain forces
When cross bracings are introduced in the bridge it will restrain its lateral deflections. When the deflections are restrained forces will develop in the structural parts. This is visualized in Figure 3.5. The figure shows a composite section loaded with a point load. If the beams are assumed to have no rotational stiffness, Figure 3.5 A), they will follow the deformation of the slab and no moment will be developed. If the beams are horizontally braced, Figure 3.5 B), the web will be partially restrained and moment will develop. These forces are in this report referred to as restraining forces.
Figure 3.5 Composite section subjected to a point load with in A) No rotational stiffness and in B) Horizontally braced
3.3 Usage of web stiffeners
Steel plates subjected to compressive forces can buckle. Buckling is an instability problem that makes the plate buckle out in its weak plane before the stresses reach the yield limit. For composite bridges the slenderness, the ratio between the height and thickness, of the web is usually very high. For slender sections subjected to large shear forces, e.g. over and close to supports for continuous beams, the bearing capacity is often governed by the shear buckling capacity of the web.

3. USAGE OF WEB STIFFENERS
18
3.3.1 Shear buckling according to classical theory
The critical shear buckling capacity, , of a plate according to the classical theory is derived from a section loaded in pure shear10. For a web with low slenderness the bearing capacity in shear is determined by the yield limit. The yield limit in shear is according to von Mises hypothesis:
√ (3.1)
If the slenderness of the web is high, the limits for the slenderness are given in SS-EN 1993-1-5; 5.3, the bearing capacity of the web will be governed by its shear buckling capacity. In Figure 3.6 a section of an I-beam under a uniformly distributed load is showed with the characteristic look of a shear buckle. The shape of the buckle can be explained by studying a section under pure shear loading as in Figure 3.6 B and the orientation of the principle stresses of such a section, as in Figure 3.6 C. The buckle will be initiated by the principle compressive stresses and counteracted and extended in the direction of the principle tensile stresses11.
Figure 3.6 A) Section of a I-beam under a uniformly distributed load with a shear buckle. B) Section under pure shear loading and in C) the principle stresses and principle stress orientations for a section under pure shear loading
10 Bradford et.al, 2008 11 Stålbyggnadsinstitutet, 2008
3. CROSS BRACINGS IN COMPOSITE BRIDGES
19
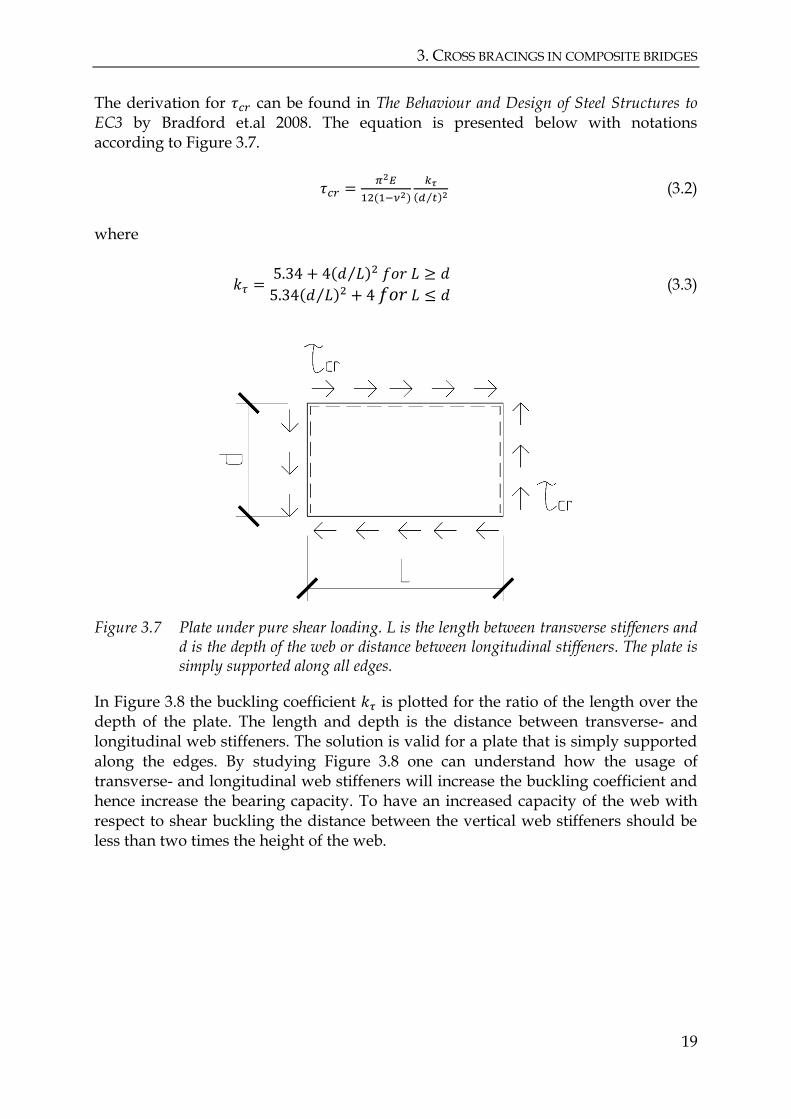
The derivation for can be found in The Behaviour and Design of Steel Structures to EC3 by Bradford et.al 2008. The equation is presented below with notations according to Figure 3.7.
⁄ (3.2)
where
⁄
⁄ (3.3)
Figure 3.7 Plate under pure shear loading. L is the length between transverse stiffeners and d is the depth of the web or distance between longitudinal stiffeners. The plate is simply supported along all edges.
In Figure 3.8 the buckling coefficient is plotted for the ratio of the length over the depth of the plate. The length and depth is the distance between transverse- and longitudinal web stiffeners. The solution is valid for a plate that is simply supported along the edges. By studying Figure 3.8 one can understand how the usage of transverse- and longitudinal web stiffeners will increase the buckling coefficient and hence increase the bearing capacity. To have an increased capacity of the web with respect to shear buckling the distance between the vertical web stiffeners should be less than two times the height of the web.

3. USAGE OF WEB STIFFENERS
20
Figure 3.8 Buckling coefficient, , plotted against the ratio between the lengths between the stiffeners over the depth of the web, L/d
3.3.2 Transverse web stiffeners
According to Swedish design codes cross bracings should be connected to stiffening plates or gusset plates. Stiffening plates are commonly used. Over- and sometimes close to the supports the extra capacity given by the stiffeners are used to maintain a smaller web thickness. However the extra costs for welding and maintenance must be considered for an economic design. In this report the word web stiffener are commonly used instead of stiffening plate.
Figure 3.9 Combined usage of transverse- and longitudinal web stiffeners
0
5
10
15
20
25
30
35
40
0 0,5 1 1,5 2 2,5 3 3,5 4 4,5 5
Kτ
L/d
Bucklingcoefficient for L/d
3. CROSS BRACINGS IN COMPOSITE BRIDGES
21
3.3.3 Longitudinal web stiffeners
A study of a composite bridge with unstiffened- and longitudinally stiffened webs where conducted by Combri in 2007. The study concluded that the usage of longitudinal stiffeners is not economical for webs with a depth of less than 4 m. The practise in Sweden is that longitudinal stiffeners are not used for girders with a web depth less than 3.2 m12 .
3.3.4 Gusset plates
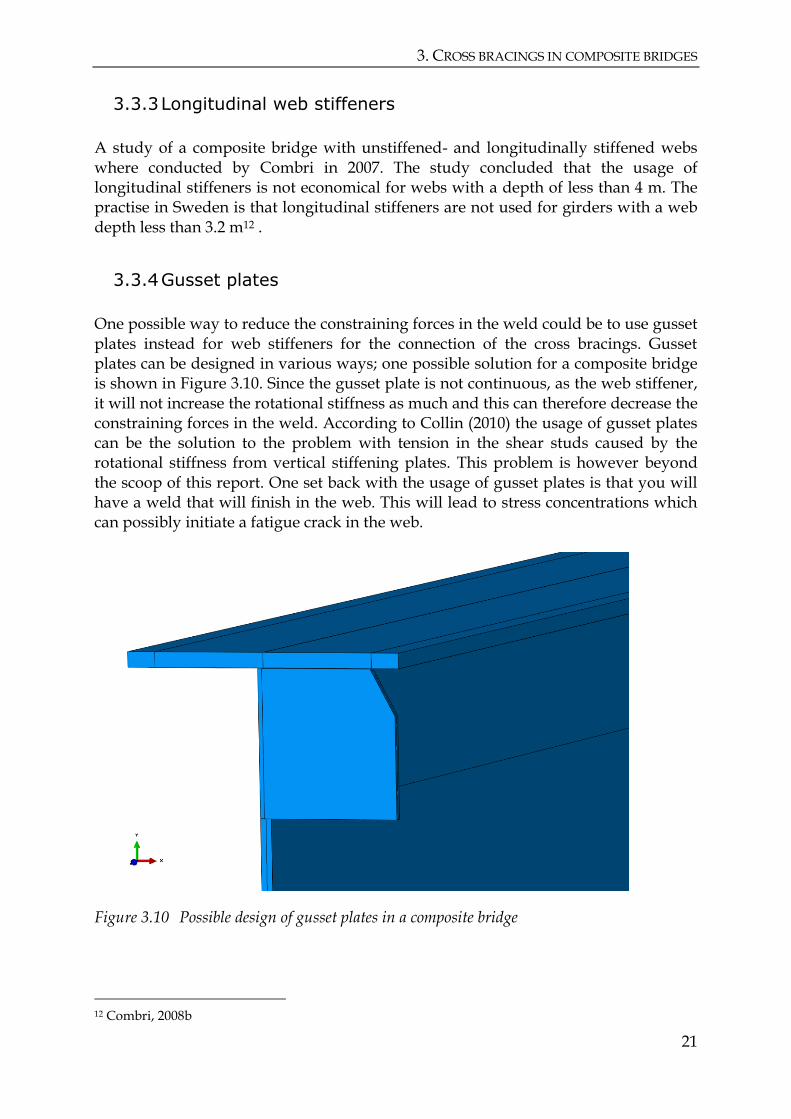
One possible way to reduce the constraining forces in the weld could be to use gusset plates instead for web stiffeners for the connection of the cross bracings. Gusset plates can be designed in various ways; one possible solution for a composite bridge is shown in Figure 3.10. Since the gusset plate is not continuous, as the web stiffener, it will not increase the rotational stiffness as much and this can therefore decrease the constraining forces in the weld. According to Collin (2010) the usage of gusset plates can be the solution to the problem with tension in the shear studs caused by the rotational stiffness from vertical stiffening plates. This problem is however beyond the scoop of this report. One set back with the usage of gusset plates is that you will have a weld that will finish in the web. This will lead to stress concentrations which can possibly initiate a fatigue crack in the web.
Figure 3.10 Possible design of gusset plates in a composite bridge
12 Combri, 2008b
3. CONNECTIONS OF CROSS BRACINGS
22
3.3.5 Notches
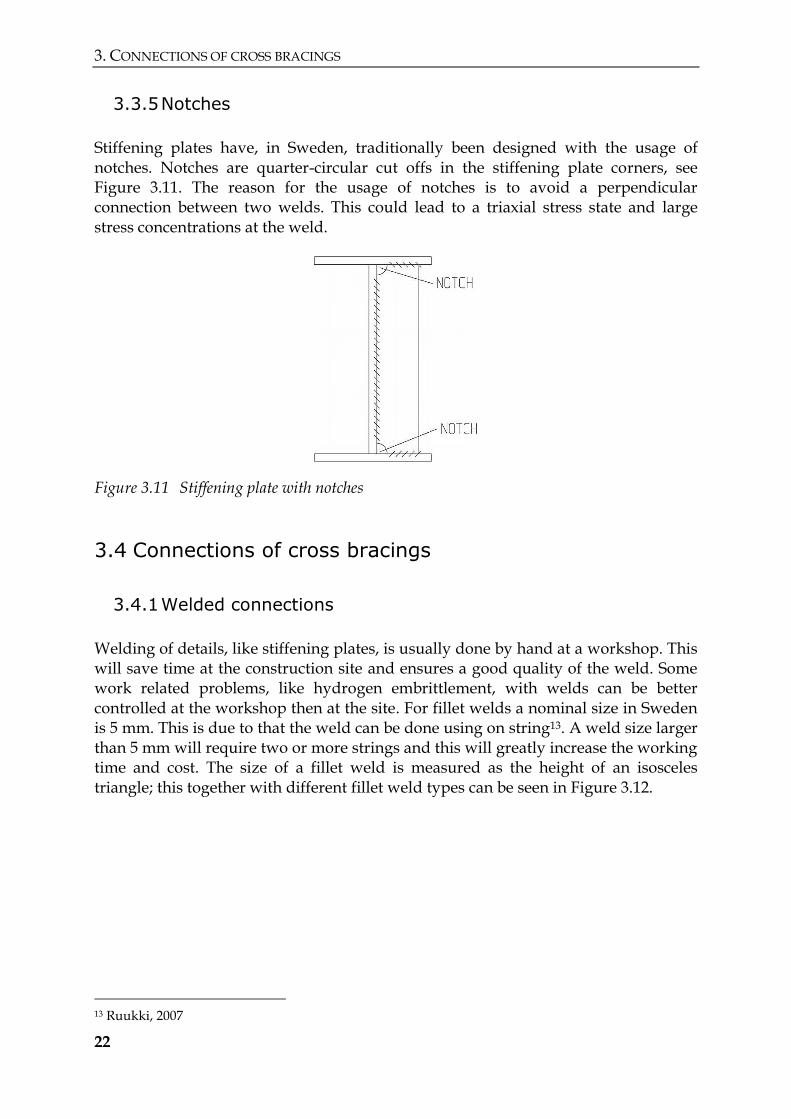
Stiffening plates have, in Sweden, traditionally been designed with the usage of notches. Notches are quarter-circular cut offs in the stiffening plate corners, see Figure 3.11. The reason for the usage of notches is to avoid a perpendicular connection between two welds. This could lead to a triaxial stress state and large stress concentrations at the weld.
Figure 3.11 Stiffening plate with notches
3.4 Connections of cross bracings
3.4.1 Welded connections
Welding of details, like stiffening plates, is usually done by hand at a workshop. This will save time at the construction site and ensures a good quality of the weld. Some work related problems, like hydrogen embrittlement, with welds can be better controlled at the workshop then at the site. For fillet welds a nominal size in Sweden is 5 mm. This is due to that the weld can be done using on string13. A weld size larger than 5 mm will require two or more strings and this will greatly increase the working time and cost. The size of a fillet weld is measured as the height of an isosceles triangle; this together with different fillet weld types can be seen in Figure 3.12.
13 Ruukki, 2007

3. CROSS BRACINGS IN COMPOSITE BRIDGES
23
Figure 3.12 Different fillet welds and the weld height; a-measure
3.4.2 Bolted connections
Due to that the cross bracings most commonly are attached at the construction site they are usually bolted. This will generally save time and money. A bolted connection should be designed according to TRVK Bro 11; E.2.1.4.2. The connection over a support and at beam splices with horizontal angular changes should be designed as a fit bolted connection. This implement that the diameter of the bolt holes should be equal to the shank diameter of the bolt. For bolted connections along the spans the bolt holes are allowed to be designed with certain clearance for the bolts.
3.5 Design of welded connections
The weld is designed with respect to the maximum stresses according to SS-EN 1993-1-8: Design of joints and to fatigue according to SS-EN 1993-1-9: Fatigue.
3.5.1 Residual stresses
Residual stresses are stresses in the steel caused during the cooling process after welding. According to SS-EN 1993-1-8; 4.9(3) the residual stresses does not need to be included when checking the resistance of the weld. When designing the weld according to fatigue the residual stresses are considered empirically.

3. DESIGN OF WELDED CONNECTIONS
24
3.5.2 Design of fillet welds in the ULS: Directional Method
The verification of fillet welds should according to SS-EN 1993-1-8; 4.5.3.1 be controlled by the Directional method or the Simplified method. When using the directional method one equivalent stress acting on the weld is calculated and compared to the design strength of the weakest part in the joint according to the following equation:
[ (
∥ )]
(3.4)
where is the nominal ultimate tensile strength of the weaker part joined is a correlation factor of fillet welds is a partial factor for safety regarding resistance for welds ∥ are uniformly distributed stresses acting on the throat section of the weld
according to Figure 3.13. The normal stress ∥ parallel to the axis of the weld is not considered when verifying the resistance of the weld.
Figure 3.13 Stresses acting on the throat section of the weld. The stresses are assumed to be distributed uniformly
3. CROSS BRACINGS IN COMPOSITE BRIDGES
25
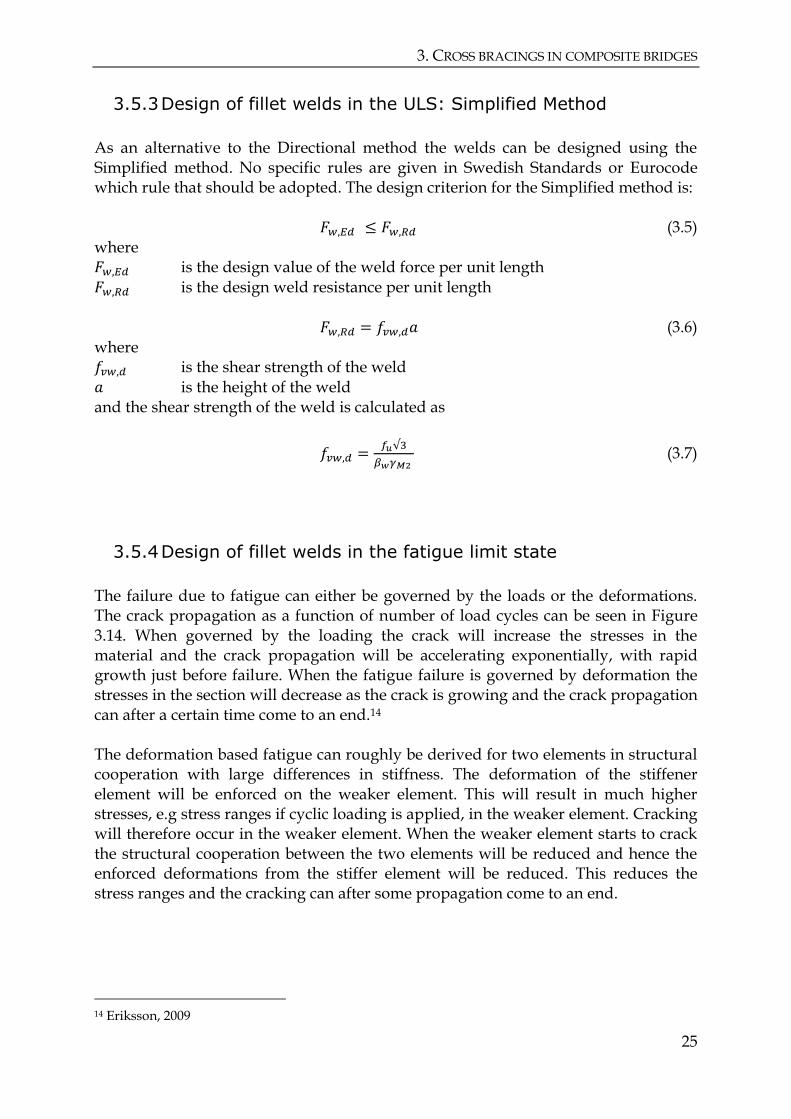
3.5.3 Design of fillet welds in the ULS: Simplified Method
As an alternative to the Directional method the welds can be designed using the Simplified method. No specific rules are given in Swedish Standards or Eurocode which rule that should be adopted. The design criterion for the Simplified method is:
(3.5) where is the design value of the weld force per unit length is the design weld resistance per unit length
(3.6) where is the shear strength of the weld is the height of the weld and the shear strength of the weld is calculated as
√
(3.7)
3.5.4 Design of fillet welds in the fatigue limit state
The failure due to fatigue can either be governed by the loads or the deformations. The crack propagation as a function of number of load cycles can be seen in Figure 3.14. When governed by the loading the crack will increase the stresses in the material and the crack propagation will be accelerating exponentially, with rapid growth just before failure. When the fatigue failure is governed by deformation the stresses in the section will decrease as the crack is growing and the crack propagation can after a certain time come to an end.14 The deformation based fatigue can roughly be derived for two elements in structural cooperation with large differences in stiffness. The deformation of the stiffener element will be enforced on the weaker element. This will result in much higher stresses, e.g stress ranges if cyclic loading is applied, in the weaker element. Cracking will therefore occur in the weaker element. When the weaker element starts to crack the structural cooperation between the two elements will be reduced and hence the enforced deformations from the stiffer element will be reduced. This reduces the stress ranges and the cracking can after some propagation come to an end.
14 Eriksson, 2009

3. DESIGN OF WELDED CONNECTIONS
26
Figure 3.14 Crack propagation for fatigue governed by loading and deformations. Figure redrawn from Eriksson (2009)
Special consideration is according to Eriksson (2009) required for welded connections since fatigue often is the decisive factor for the design. When designing against fatigue the most important aspect is the stress ranges. Two methods are available in Eurocode, the λ-method and the linear Miner-Palmgren damage rule. When using the λ-method the maximum- respective minimum stresses are obtained by selecting the most severe load positions that is possible for all the fatigue load cases considered. The other method is the linear Miner-Palmgren damage rule. In this method a stress spectrum is obtained at the position in the weld where crack initiation is suspected. The stress spectrum shows the variation of the stresses at that point due to one passage over the bridge for the fatigue load case considered. Every possible passage considered over the bridge will correspond to one stress spectrum. Based on the stress spectrums an accumulated damage for all the passages can be calculated and the total number of passages until failure can then be determined.
Cra
ck
pro
po
gati
on
Loadcycles
Crack propagation
Force Based Deformation Based

4. STUDIED BRIDGE
27
4 Studied bridge
In this chapter the geometry of the bridge and its structural elements are presented. The mechanical properties for the bridge together with the considered loads are also presented.
4.1 Studied bridge
The studied bridge was a continuous twin I-girder road bridge with two spans of 45 meters. The bridge is part of the E45 road between the cities of Göteborg and Trollhättan, located in the southwest of Sweden, see Figure 4.1. The bridge was built in 2007 and the drawings used for modelling the bridge is based on draft drawings produced for the procurement of the bridge. The reason for using this bridge as a studying object is due to its simple geometry and that the bridge type represents a common solution for composite bridges.
Figure 4.1 Location of the studied bridge
4. THE BRIDGE GEOMETRY
28
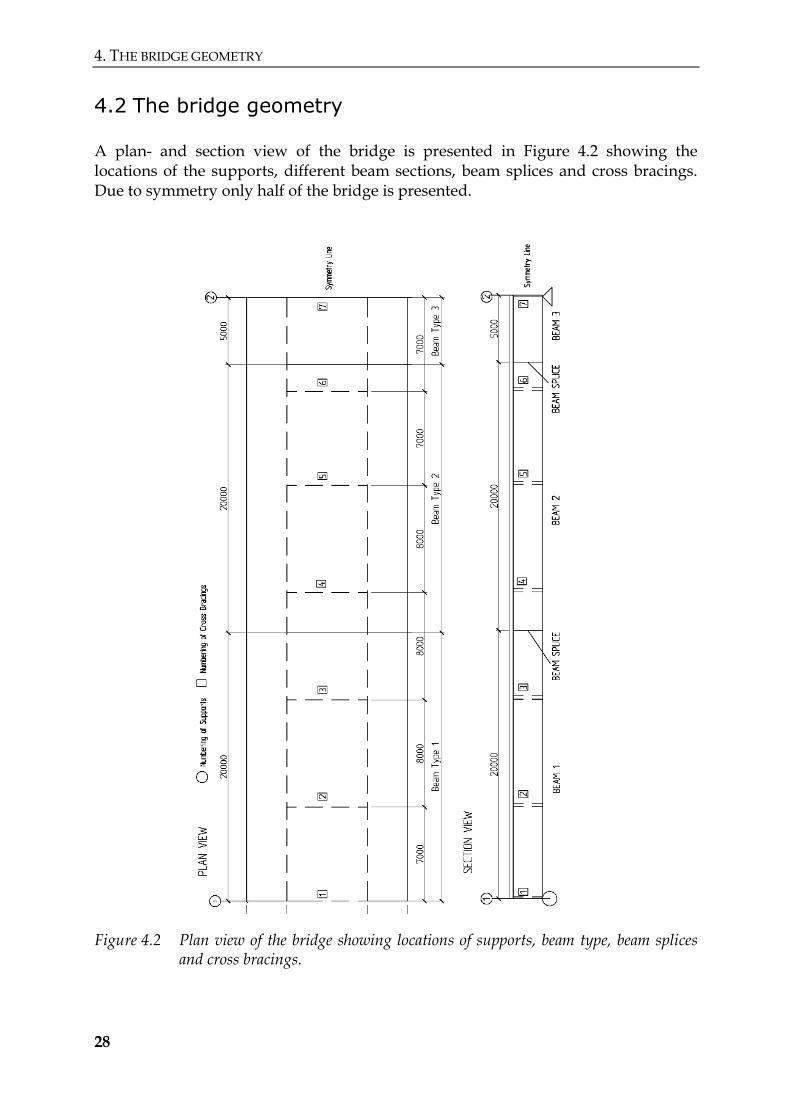
4.2 The bridge geometry
A plan- and section view of the bridge is presented in Figure 4.2 showing the locations of the supports, different beam sections, beam splices and cross bracings. Due to symmetry only half of the bridge is presented.
Figure 4.2 Plan view of the bridge showing locations of supports, beam type, beam splices and cross bracings.

4. STUDIED BRIDGE
29
4.2.1 Deviations from the original bridge
To simplify the modelling of the bridge in Brigade Plus some minor deviations from the original geometry and construction have been done. These are as follows:
The original bridge is slightly curved. The studied bridge was considered to be straight.
The original bridge is horizontally inclined 5 %. The studied bridge was considered without inclination.
The original bridge is constructed using wing walls. In the studied bridge the wing walls were not modelled. Boundary conditions were implemented to simulate the wing walls, allowing the bridge to move in the longitudinal direction and locking vertical- and transverse movement.
The middle supports were not modelled. Boundary conditions were implemented locking the bridges movement in all directions.
The bridge deck was considered to have a uniform thickness of 300 mm. The above modifications of the original geometry give a double symmetric cross section of the bridge. This simplified the modelling of the bridge and eliminated any geometric effects of the forces in the cross bracings.
4.3 Geometry of the main beams
The main beams are made up of three different steel sections as shown in Figure 4.3. The reason for this is to optimize the usage of steel. The beams are connected by butt welding.

4. GEOMETRY OF BRIDGE DECK
30
Figure 4.3 Different steel sections for the main beams
4.4 Geometry of bridge deck
The bridge deck consists of a reinforced concrete slab with edge beams as shown in Figure 4.4.
Figure 4.4 Geometry of the bridge deck and edge beams

4. STUDIED BRIDGE
31
4.5 Cross bracings
For the studying of the effect of cross bracings three different cross bracing types and two different connection plates were selected. The different cross bracings and the dimensions of the steel profiles are commonly used solutions and presented below in Figure 4.6-Figure 4.10.
4.5.1 Design of cross bracings along the spans
In Figure 4.5 is the geometry of the steel sections used as cross bracings presented and in a list of the different cross sections used for the different cross bracing types are listed in Table 4.1.
Figure 4.5 Geometry for the different steel sections used for cross bracings
Table 4.1 List of different cross sections used as cross bracings
Cross Bracing Type Horizontal Beams Inclined Beams Connection
Type 1 2 HEA 200 2 VKR 100 100 5 Stiffening Plates Type 2 2 HEA 200 2 VKR 100 100 5 Gusset Plates Type 3 1 HEA 240 2 HEA 200 Stiffening Plates Type 4 1 HEA 240 2 HEA 200 Gusset Plates Type 5 1 IPE 450 - Stiffening Plates

4. CROSS BRACINGS
32
4.5.2 Cross bracings of type 1 and 2
Cross bracings of type 1 and 2 were constructed as a frame section consisting of two horizontal HEA 200 beams connected by two inclined quadratic hollow sections with dimension 100 100 5 mm. Type 1, Figure 4.6, was connected to the main beams through a stiffening plate and type 2, Figure 4.7, was connected through gusset plates.
Figure 4.6 Cross bracing type 1, a frame section made up of four beams connected to the main beams through stiffening plates
Figure 4.7 Cross bracing type 2, a frame section made up of four beams connected to the main beams through gusset plates
4. STUDIED BRIDGE
33
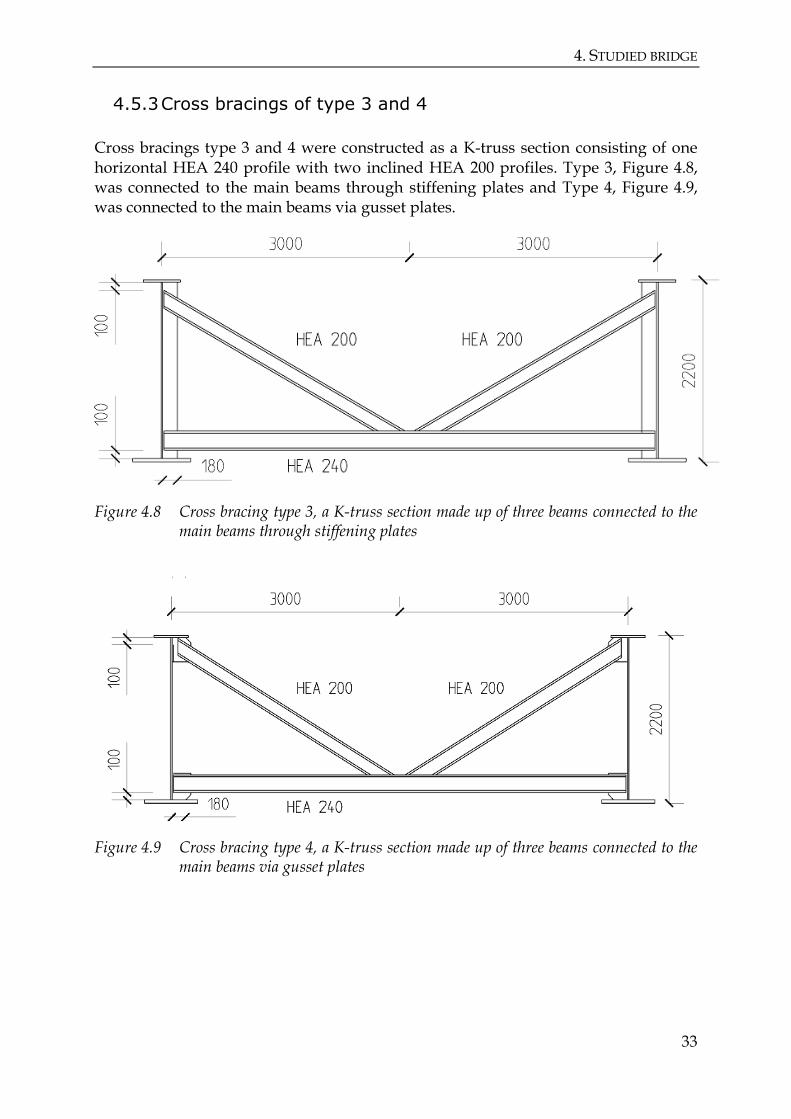
4.5.3 Cross bracings of type 3 and 4
Cross bracings type 3 and 4 were constructed as a K-truss section consisting of one horizontal HEA 240 profile with two inclined HEA 200 profiles. Type 3, Figure 4.8, was connected to the main beams through stiffening plates and Type 4, Figure 4.9, was connected to the main beams via gusset plates.
Figure 4.8 Cross bracing type 3, a K-truss section made up of three beams connected to the main beams through stiffening plates
Figure 4.9 Cross bracing type 4, a K-truss section made up of three beams connected to the main beams via gusset plates
4. CROSS BRACINGS
34
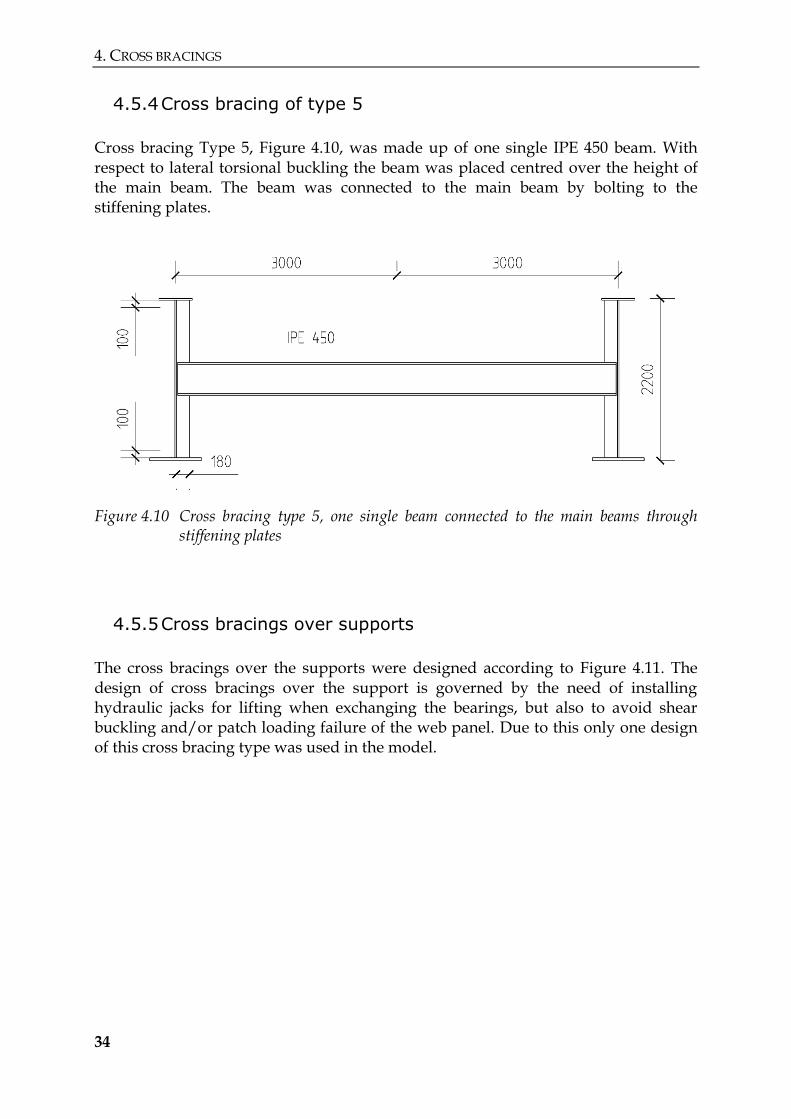
4.5.4 Cross bracing of type 5
Cross bracing Type 5, Figure 4.10, was made up of one single IPE 450 beam. With respect to lateral torsional buckling the beam was placed centred over the height of the main beam. The beam was connected to the main beam by bolting to the stiffening plates.
Figure 4.10 Cross bracing type 5, one single beam connected to the main beams through stiffening plates
4.5.5 Cross bracings over supports
The cross bracings over the supports were designed according to Figure 4.11. The design of cross bracings over the support is governed by the need of installing hydraulic jacks for lifting when exchanging the bearings, but also to avoid shear buckling and/or patch loading failure of the web panel. Due to this only one design of this cross bracing type was used in the model.

4. STUDIED BRIDGE
35
Figure 4.11 Cross bracings used over supports
4.6 Geometry of web stiffeners
The geometry for web stiffeners and gusset plates used is presented in Figure 4.12. The thickness of the plate used along the span was 15 mm and 20 mm over supports.
Figure 4.12 Geometry of web stiffeners and gusset plates

4. MECHANICAL PROPERTIES
36
4.7 Mechanical properties
The mechanical properties of the steel and concrete are presented in Table 4.2. The materials were considered to be linear elastic.
Table 4.2 Mechanical properties for structural steel and concrete
Material Young´s Modulus [GPa] Poission´s Ratio [-]
Steel 210 0.3 Concrete C35/45 34 0.2
4.8 Loads
Normally a large number of different load cases needs to be considered when designing bridges. For this study the numbers of load cases have been limited and only load cases considered to give significant effects on the weld were used. Relevant numerical values for the loads have been used based on experience and sometimes on older Swedish standards. The used load cases in the study are presented below.
4.8.1 Gravity load
The gravity load that was considered to act on the bridge is the deadweight of the steel and the concrete deck including the edge beam. The densities of the two materials according to SS-EN 1991-1-1; Table A.1 and A.4 are presented in Table 4.3.
Table 4.3 Density for steel and concrete according to SS-EN 1991-1-1
Material Density [kg/m³]
Steel 7850 Concrete 2500
4.8.2 Wind load
According to Bro 2004; 21.273 (Swedish Bridge Standard from 2004) the wind load acting on bridges with a maximum clearance of 10 m is equal to 1.8 kPa. The load was considered as static loading acting uniformly along one side of the bridge, see Figure 4.13.

4. STUDIED BRIDGE
37
Figure 4.13 Wind load acting on the bridge
4.8.3 Lateral force at bottom flange
The transverse web stiffeners are subjected to axial forces. In the connection between stiffener and flanges a lateral force will be developed in the flange due to stability. According to SS-EN 1993-2; 6.3.5.2(5) this force can, as a rough estimate, be set equal to:
(4.1) for simplicity the normal force were assumed to be equal to the area times the yield limit and hence
(4.2)
were assumed. This will give the highest possible forces in the flange. In Table 4.4 is the input for the bottom flange for beam type 2 and 4 together with the numerical value of the lateral force at the flange presented.

4. LOADS
38
Table 4.4 Input for calculation of lateral force at bottom flange
Structural Part Width [mm] Thickness [mm] Area [mm²] fyd [MPa] FEd [kN]
Bottom Flange 700 45 31 500 355 168
The lateral force will act were the lower flange will be subjected to compression, i.e close to the middle support. The location of the lateral force is shown in plane and section in Figure 4.14, cross bracing number seven is the location of the middle support.
Figure 4.14 A) Location for the flange load on the bridge and B) detail for the flange load
4.8.4 Temperature loads
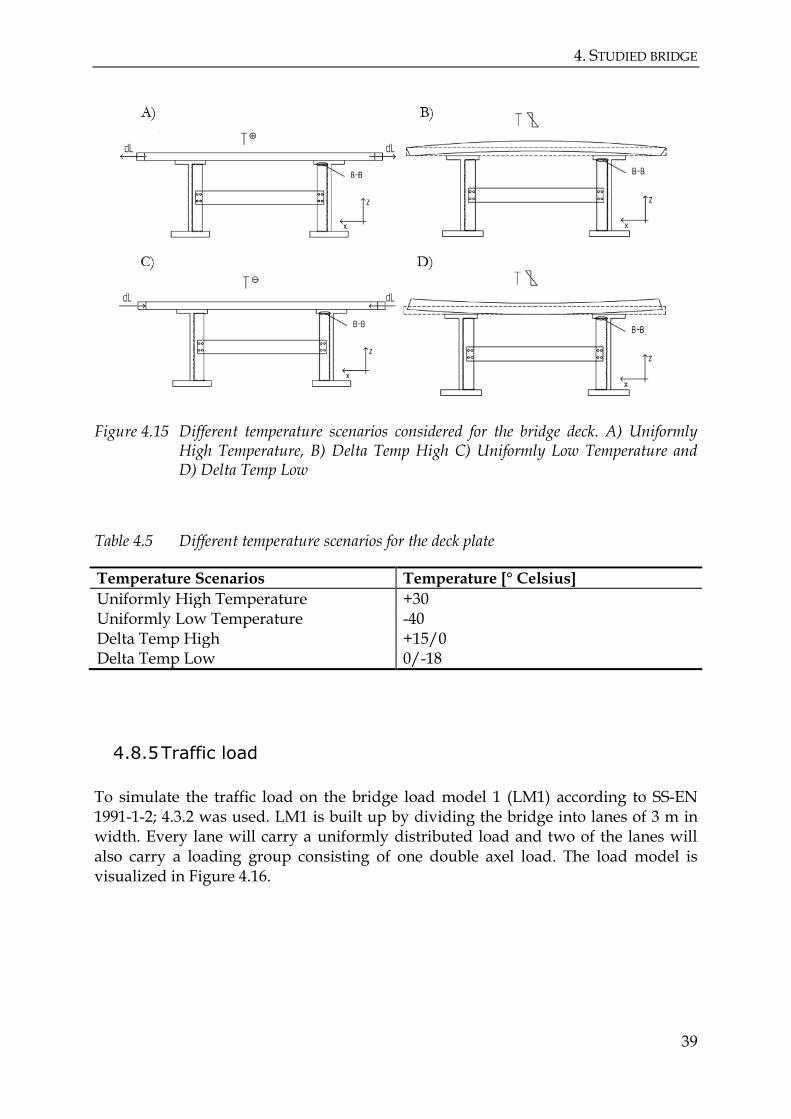
Four different temperature load scenarios were considered. Two scenarios where the temperature in the slab will change uniformly. The maximum change in temperature was calculated from a reference temperature during concreting. The other two scenarios were when an uneven temperature distribution in the plate, e.g. a linear temperature variation from the top- to the bottom of the slab was considered. These load cases were named delta temp high and low respectively. The different temperatures loads are visualized in Figure 4.15 and the temperatures used are presented in Table 4.5. The change in temperature was only considered in the deck plate.
4. STUDIED BRIDGE
39
Figure 4.15 Different temperature scenarios considered for the bridge deck. A) Uniformly High Temperature, B) Delta Temp High C) Uniformly Low Temperature and D) Delta Temp Low
Table 4.5 Different temperature scenarios for the deck plate
Temperature Scenarios Temperature [° Celsius]
Uniformly High Temperature +30 Uniformly Low Temperature -40 Delta Temp High +15/0 Delta Temp Low 0/-18
4.8.5 Traffic load
To simulate the traffic load on the bridge load model 1 (LM1) according to SS-EN 1991-1-2; 4.3.2 was used. LM1 is built up by dividing the bridge into lanes of 3 m in width. Every lane will carry a uniformly distributed load and two of the lanes will also carry a loading group consisting of one double axel load. The load model is visualized in Figure 4.16.

4. LOADS
40
Figure 4.16 Details for load model 1 according to SS-EN 1991-2; Figure 4.2a
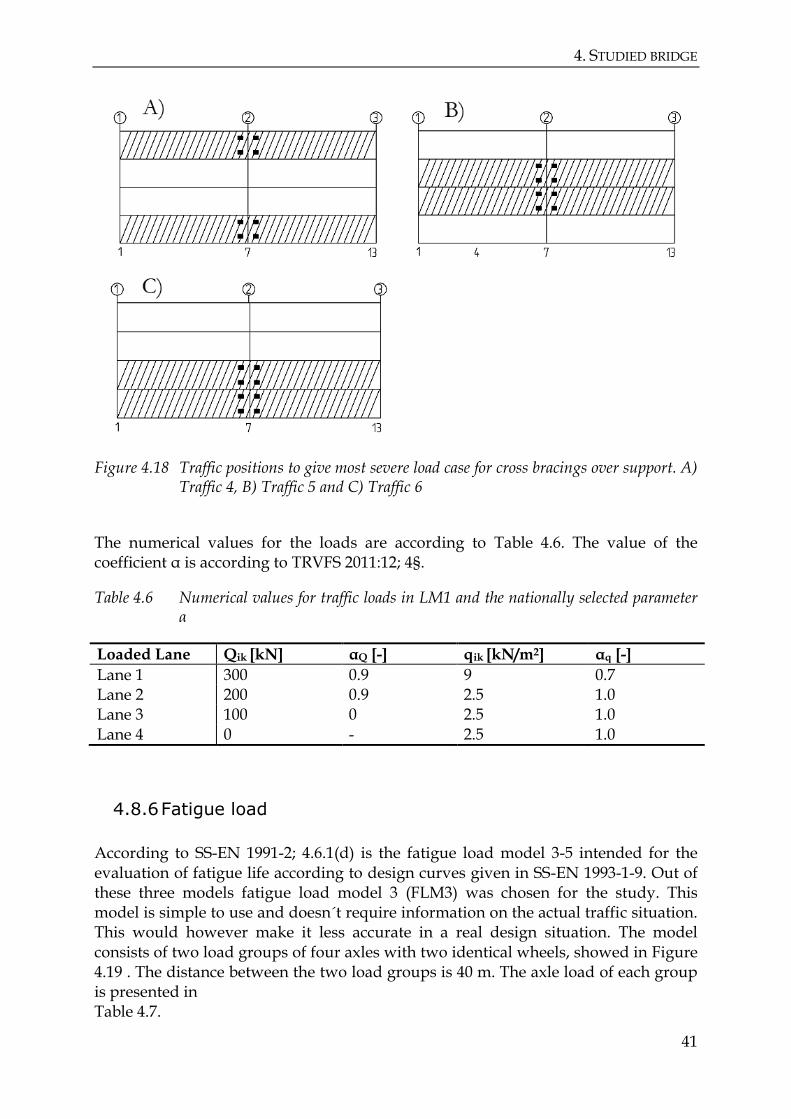
When designing the bridge using the LM1 combination only the traffic positions giving negative effects on the bridge will be considered. The traffic will therefore be placed on the bridge to give the largest possible transverse moment over the cross bracings in combination with the largest longitudinal bending moment. The traffic positions considered along the span and at support is presented in Figure 4.17 and in Figure 4.18.
Figure 4.17 Traffic positions considered to give most severe load case for cross bracings number 4 along the span. A) Traffic 1 ,B) Traffic 2 and C) Traffic 3
4. STUDIED BRIDGE
41
Figure 4.18 Traffic positions to give most severe load case for cross bracings over support. A) Traffic 4, B) Traffic 5 and C) Traffic 6
The numerical values for the loads are according to Table 4.6. The value of the coefficient α is according to TRVFS 2011:12; 4§.
Table 4.6 Numerical values for traffic loads in LM1 and the nationally selected parameter α
Loaded Lane Qik [kN] αQ [-] qik [kN/m2] αq [-]
Lane 1 300 0.9 9 0.7 Lane 2 200 0.9 2.5 1.0 Lane 3 100 0 2.5 1.0 Lane 4 0 - 2.5 1.0
4.8.6 Fatigue load
According to SS-EN 1991-2; 4.6.1(d) is the fatigue load model 3-5 intended for the evaluation of fatigue life according to design curves given in SS-EN 1993-1-9. Out of these three models fatigue load model 3 (FLM3) was chosen for the study. This model is simple to use and doesn´t require information on the actual traffic situation. This would however make it less accurate in a real design situation. The model consists of two load groups of four axles with two identical wheels, showed in Figure 4.19 . The distance between the two load groups is 40 m. The axle load of each group is presented in Table 4.7.

4. LOADS
42
Table 4.7 Axle load for different groups in Fatigue Load Model 3
Load Group Axle Load [kN]
Group 1 120 Group 2 36
Figure 4.19 Showing one axle load group according to fatigue load model 3, SS-EN 1991-2:Figure 4.8
For this study was a simplified evaluation considering fixed traffic positions performed. This will give a reasonable indication whether or not design of cross bracings will affect the fatigue life of the weld. Figure 4.20 shows a plan view of the traffic positions considered. The first will be when the vehicles are traveling along the console, se section view in Figure 4.21, and the second when the vehicle is passing with one wheel directly over the position of the web stiffener. These two cases will cause the greatest possible tensile- and compressive stresses.
Figure 4.20 Plan view of fixed load positions for evaluation of fatigue.

4. STUDIED BRIDGE
43
Figure 4.21 Section view of the fatigue load case with traffic along the console


5. FE MODEL
45
5 FE model
This chapter briefly describes the theory of FEM and explain how the FE model in Brigade Plus was built. It also contains the different quality controls that have been performed.
5.1 General theory
The general theory of the Finite Element Method is briefly described together with the convergence of the solution and different integration techniques. For a deeper understanding of the Finite Element Method the book Concepts and Applications of Finite Element Analysis by Cook et.al is recommended.
5.1.1 Theory of FEM
For simple structural problems such as a simply supported beam under a uniformly distributed load analytical solutions are available and easy to use. For more complicated problems analytical solutions will become complicated and sometimes impossible to derive. Simplifications of the structure, loading and boundary conditions are therefore imposed to be able to solve the problems analytically. This is one of the reasons for the development of the Finite Element Method (FEM). The FEM is based on that the structure is divided into small elements. For each element the relationship between the element stiffness (denoted K), the displacement (denoted d) and external force (denoted F) are set up according to:
(5.1) Different solution techniques can be used to solve equation 5.1. A common approach is to use the principle of stationary potential energy. The potential energy for a linear elastic material is expressed as the strain energy:
(5.2)
Expressing the potential strain energy for a small element and finding its minimum will satisfy equilibrium of the element in an average sense. Equilibrium is not satisfied in every single point of the element but is satisfied on an average over the whole element. This is the weak form of equilibrium. The strong form of equilibrium is when equilibrium in every single point over the whole element is satisfied. Solutions to the strong form of equilibrium are only possible to find for very simple structural problems.

5. GENERAL THEORY
46
5.1.2 Theory of convergence
When solving structural problems using the principle of stationary energy the displacements of the elements are approximated using simple polynomials. The approximation will overestimate the stiffness of the element resulting in smaller displacement and stresses. The solution is said to be overstiff. When the numbers of elements are increasing, e.g the size of the elements gets smaller, the solution will converge towards the exact solution. Therefore the FE solution is under conservative and the convergence study is of great importance.
5.1.3 Integration technique
For shell elements and 2D solid elements different integration techniques for calculation of stresses and displacements are available in Brigade and most other FE programs. The integration technique determines the number of nodes that are used in the element and decides in which shape the element can be displaced. For a quadratic element using a linear interpolation technique four nodes are used and the element can only displace linearly. If a quadratic interpolation technique is used the element will have eight nodes and the element can displace in a parabolic shape, se Figure 5.1. The stresses for each element are normally calculated at Gauss points using either a full integration or a reduced integration. A full integration requires the number of Gauss points along one element side to be equal to the grade of the polynomial plus one. The full integration will give an exact solution to the integral for an undistorted element. It should be remembered that this exact solution is based on an approximation of the displacements and sometimes this leads to that the full integration gives a to stiff solution. For a reduced integration the number of Gauss points along the sides will be equal to the grade of the polynomial. This integration technique decrease the computational time and is a possible solution to overcome the problem of to stiff solutions. In Figure 5.1 the differences between linear and quadratic interpolation are showed in terms of possible displacement and the number of Gauss points used for full integration. The choice of interpolation- and integration technique has to be considered from case to case and is determined by a convergence study.

5. FE MODEL
47
Figure 5.1 Showing a the number of nodes, the possible displacement and number of Gauss points using full integration for a quadratic element using A) linear interpolation and B) quadratic interpolation
5.2 FE model of the studied bridge
The FE model was created to simulate the global behaviour of the bridge and captures the differences between the five different cross bracings. Linear elastic material behaviour was considered. The fillet weld was not modelled so when referring to weld stresses in this report this refers to the stresses along the edge of the stiffener, e.g at the location of the fillet weld. For further clarification the term weld end is used in this report when referring to stresses in the fillet weld at this location.
5.2.1 Modelling of the bridge deck
The bridge deck consists of one slab and two edge beams. The deck was modelled using shell elements and the edge beams were modelled as beam elements. The connections for the edge beams to the slab and the slab to the main beams were modelled using tie constraints. No stress analysis was to be performed in the slab itself and the modelling of this part is therefore kept simple. The function of the slab in the model was to transfer forces from traffic load, dead weight and temperature load into the main beams. The plate was therefore considered to have a uniform thickness and the influence of the reinforcement with respect to the plate stiffness was neglected.

5. FE MODEL OF THE STUDIED BRIDGE
48
According to a simplified method in SS-EN 1994-2; 5.4.2.3(3) the concrete deck over and close to the support for a continuous bridge can be considered to be cracked. The cracked length corresponds to 15 % of the spans total length, in this case 6.75 m. The stiffness of the edge beam is not allowed to be used for the calculation of section forces according to TRVK Bro 11; D.2.2.1.2. In Figure 5.2 the cracked- and uncracked concrete sections in the slab are visualized.
Figure 5.2 Cracked- and uncracked concrete sections of the modelled slab
Setting the stiffness of the cracked concrete and the edge beam to zero might implement some problems since the displacement of the parts will tend to infinity. Therefore the parts were considered to be orthotropic and the stiffness in the longitudinal direction was set very low. This imply that the cracked section of the slab and the edge beams will not contribute to the longitudinal stiffness of the bridge. The stiffness of the plate is presented in Table 5.1.
Table 5.1 Material model for cracked concrete
Structural Part Young´s Modulus Longitudinal Direction
Young´s Modulus Transverse Direction
Cracked Concrete 1 MPa 34 GPa

5. FE MODEL
49
5.2.2 Modelling of main beams
The main beams are built up of three different cross sections and hence three different beams were modelled. The beams were modelled as shell extrudes where the beam section was drawn in 2D and then extruded along its length axis. The sketched position of the flanges will not correspond to the real center of gravity and the flanges will therefore be given an offset of half the flange thickness. This will place the center of gravity of the flanges correctly, see Figure 5.3. This modelling technique will give a correct physical representation of the beams’ geometry and increase the accuracy of corner stresses15.
Figure 5.3 A) Beam section to be modelled, B) sketched section for shell extrusion and C) dashed line shows the offset given to flanges for correct positioning
The different beam sections were then assembled to create the main beams, visualized in Figure 5.4. The beams were connected to each other using tie constraints. Abrupt geometric changes between the different sections will lead to stress concentrations. The geometric changes between beam section 1 and 2 are small and negligible. The geometric changes between beam section 2 and 3 are larger and therefore considered. The width of the flange changes at top from 450 mm to 600 mm and at bottom from 700 mm to 900 mm, see Figure 4.3. To reduce the stress concentrations a beam splice element of 1 m was modelled. This element changes the width of the flanges linearly over 1 meter to avoid abrupt changes in geometry, see Figure 5.5. The web- and flange thickness assigned to the beam splice element was the mean value of beam section 2 and 3.
15 Sunnersjö (1999)

5. FE MODEL OF THE STUDIED BRIDGE
50
Figure 5.4 Main beams made up of three different sections and one beam splice element.
Figure 5.5 Beam splice used to connect beam section 2 and 3 to decrease the stress concentrations due to abrupt geometric changes.

5. FE MODEL
51
5.2.3 Modelling of cross bracings
The cross bracings were modelled in two steps. First the individual structural elements in the cross bracings were modelled. The beams were modelled using the same technique as for the main beams. Each cross bracing were then assembled according to the geometry presented in Figure 4.6-Figure 4.10. The different elements were then merged into one element that represents the cross bracing. The merge function ensures full fixation between the merged elements, e.g works the same way as a tie connection but will decrease the computational time. The model for cross bracing used over support is visualized in Figure 5.6. The HEA- and IPE beam profiles were connected to the stiffening plate or gusset plates either by bolting or by welding. To enable this connection the flanges on one side has to be cut. This was considered and in Figure 5.7 the modelled connection is showed. The connections were modelled using a tie constraint, this enforces that the translations and rotations of the connected nodes must follow each other. For a fitted bolted connection or a welded connection this is a good approximation. In the spans where the bolt holes are allowed to have a certain clearance this will slightly overestimate the rotational stiffness of the connection. Some small movement of the bolt can theoretically take place before forces are transferred between the stiffening plate and the cross bracing. The connection could therefore be considered as a semi-rigid joint. Since this simplification was implemented for the connections of all cross bracings the overestimated stiffness will be the same for all cross bracings.

5. FE MODEL OF THE STUDIED BRIDGE
52
Figure 5.6 Modelling of a cross bracing over a support. The four separate structural elements are merged into one structural element.
Figure 5.7 Modelled connection between a cross bracing and web stiffener.
5. FE MODEL
53
5.2.4 Modelling of web stiffeners and gusset plates
The web stiffeners and the gusset plates were both modelled as shell elements. The notches were neglected in the model. The presence of notches will have a negligible effect on the global behaviour of the FE model and will make the meshing more difficult.
5.2.5 Modelling of connections
In the model two different types of connections were used, tie constraints and mechanical constraints. Tie constraint has been used to connect the following elements:
Edge beam to Slab
Slab to Main beam
Different sections of the main beams to each other
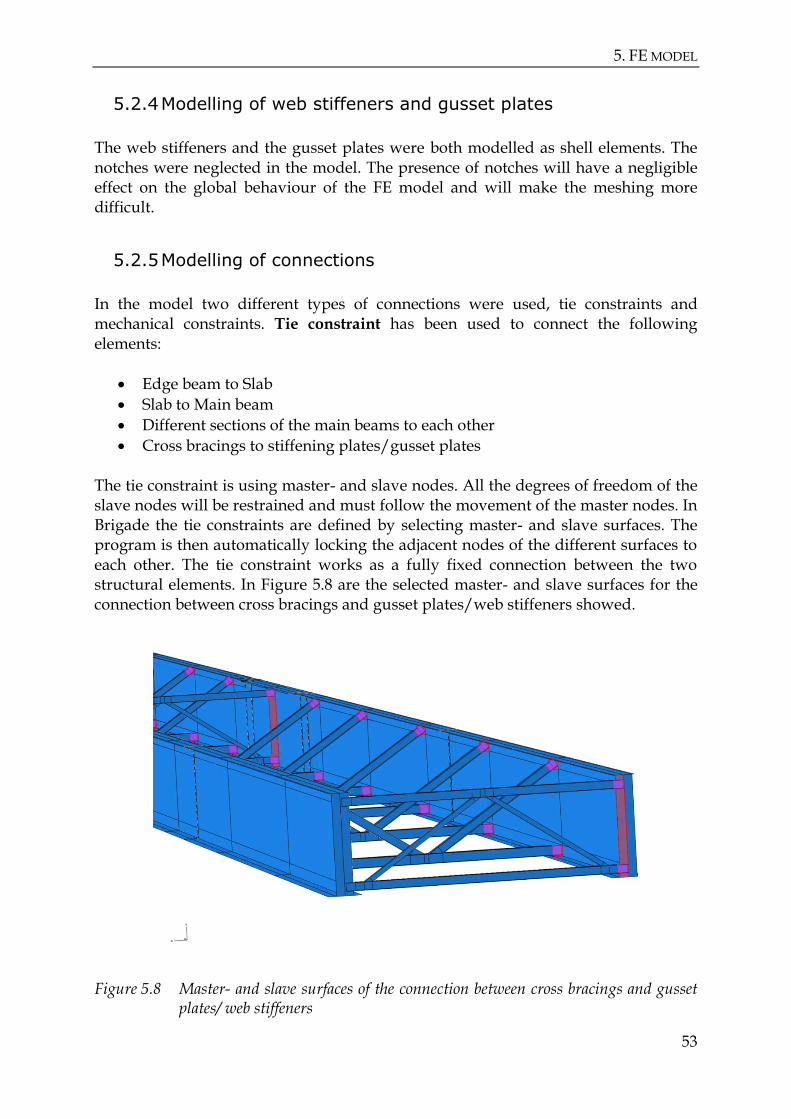
Cross bracings to stiffening plates/gusset plates The tie constraint is using master- and slave nodes. All the degrees of freedom of the slave nodes will be restrained and must follow the movement of the master nodes. In Brigade the tie constraints are defined by selecting master- and slave surfaces. The program is then automatically locking the adjacent nodes of the different surfaces to each other. The tie constraint works as a fully fixed connection between the two structural elements. In Figure 5.8 are the selected master- and slave surfaces for the connection between cross bracings and gusset plates/web stiffeners showed.
Figure 5.8 Master- and slave surfaces of the connection between cross bracings and gusset plates/ web stiffeners
5. QUALITY ASSURANCE
54
Mechanical constraints have been used to model the connection between the following elements:
Stiffening plates/gusset plates to main beams
Structural elements in cross bracings The mechanical constraints are in Brigade defined by merging the geometry of two different elements to each other. The elements will along the intersected lines share nodes and full structural cooperation between them is therefore assured. This is an efficient way to connect element in a computational time perspective but have some practical downsides regarding meshing and possibilities to change geometry of the merged elements.
5.2.6 Modelling of boundary conditions
Neither the end support nor the middle support of the bridge was modelled. Simple boundary conditions were therefore implemented. To simulate the wing walls the bridge was allowed to move horizontally but vertical and transverse movement were restricted. For the middle support the movement in all three directions are restricted and hence all the horizontal forces along the bridge like breaking etc. were taken by the middle support.
5.3 Quality assurance
To ensure good results from the model a quality assurance was performed in different steps.
5.3.1 Control of mass of the model
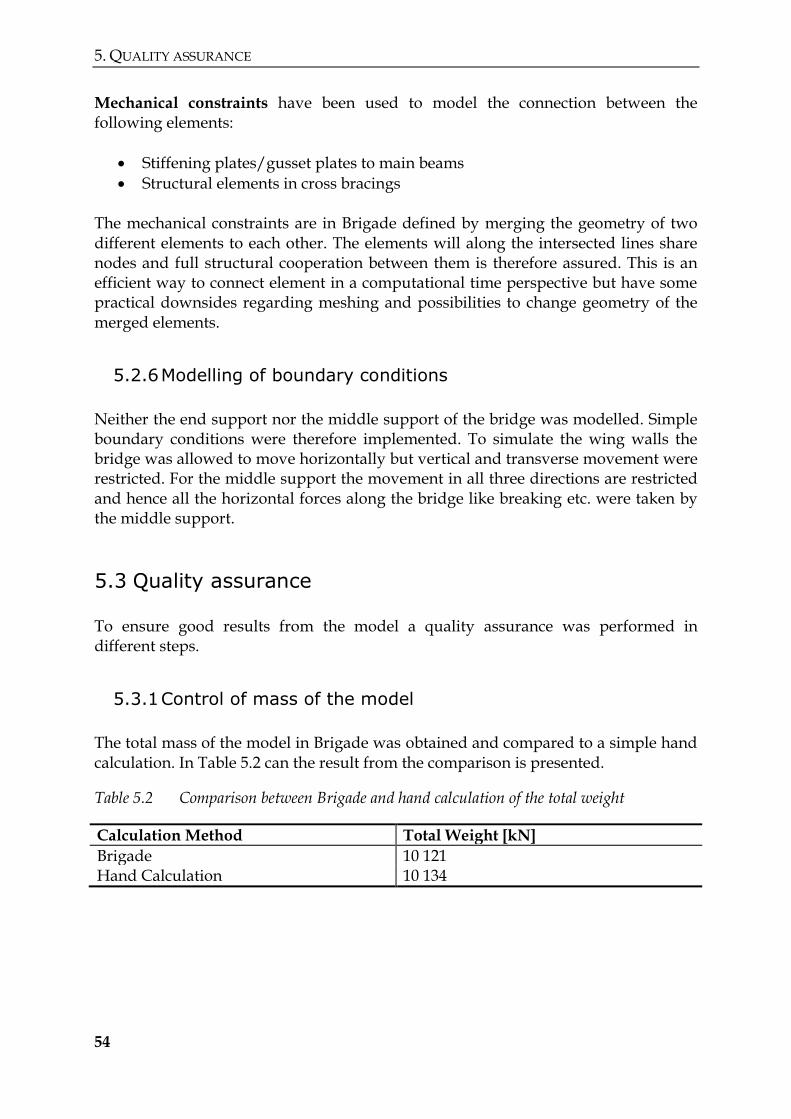
The total mass of the model in Brigade was obtained and compared to a simple hand calculation. In Table 5.2 can the result from the comparison is presented.
Table 5.2 Comparison between Brigade and hand calculation of the total weight
Calculation Method Total Weight [kN]
Brigade 10 121 Hand Calculation 10 134

5. FE MODEL
55
5.3.2 Control of reaction forces
The calculated reaction forces from Brigade was compared with a hand calculation and presented in Table 5.3. Notations for reaction forces and the calculated results by hand are according to Figure 5.9. The bending stiffness of the beam was assumed to be constant and the calculated reaction forces were the summation of both beams.
Figure 5.9 Calculations for reaction forces by hand
Table 5.3 Comparison between Brigade and hand calculation of reaction forces
Calculation Method RA [kN] RB [kN] RC [kN]
Brigade 1854 6413 1854 Hand Calculation 1900 6334 1900
5.3.3 Control of traffic load
To verify that the traffic load was correctly defined the summation of the loads were compared to the summation of reaction forces in Brigade. The traffic load according to Figure 4.18 and Figure 5.10 was used. The loads were summarized as:
The result of the comparison can be seen in Table 5.4.

5. QUALITY ASSURANCE
56
Figure 5.10 Traffic load used for verification of reaction forces
Table 5.4 Comparison between Brigade and hand calculation for summation of reaction forces due to traffic load
Calculation Method Summation Reaction Forces [kN]
Brigade 3268 Hand Calculation 3276
5.3.4 Convergence analysis for displacements
A convergence study was performed for the different structural elements. The convergence of the displacements was studied first. The first analysis was done with four noded linear shell elements (S4R) with a mesh size of 40 cm and then changed to 20 cm. The element was then changed to eight noded quadratic shell elements (S8R) with a mesh size of 40 cm. The influence of the boundary conditions was also tested by locking all rotations for the middle support with a mesh size of 20 cm. The result line from where the displacements were extracted is showed in Figure 5.11. The convergence study of the vertical displacements due to gravity loading is showed in Figure 5.12.
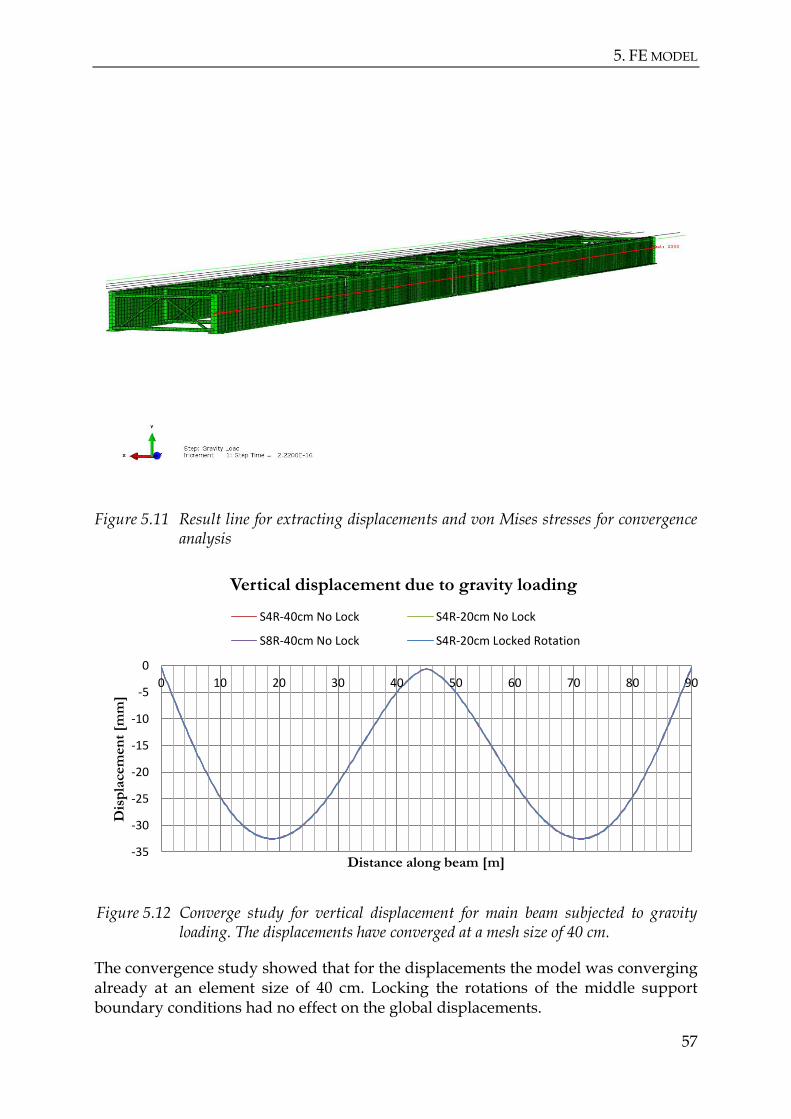
5. FE MODEL
57
Figure 5.11 Result line for extracting displacements and von Mises stresses for convergence analysis
Figure 5.12 Converge study for vertical displacement for main beam subjected to gravity loading. The displacements have converged at a mesh size of 40 cm.
The convergence study showed that for the displacements the model was converging already at an element size of 40 cm. Locking the rotations of the middle support boundary conditions had no effect on the global displacements.
-35
-30
-25
-20
-15
-10
-5
0
0 10 20 30 40 50 60 70 80 90
Dis
pla
cem
en
t [m
m]
Distance along beam [m]
Vertical displacement due to gravity loading
S4R-40cm No Lock S4R-20cm No Lock
S8R-40cm No Lock S4R-20cm Locked Rotation

5. QUALITY ASSURANCE
58
5.3.5 Convergence analysis for stresses
The convergence of the stresses was studied by extracting stresses from the result line showed in Figure 5.11. A S4R element with mesh sizes of 40 cm, 20 cm, 10 cm and 5 cm was studied. The extracted stresses for the different meshes are visualized in Figure 5.13. The figure shows that the stresses were converging at a mesh size of 10 cm. In this study the stresses along the edge of the web stiffener, the location of the fillet weld, was of interest. The width of the stiffener is 18 cm and with a mesh size of 10 cm only 2 elements will be created along the weld. A mesh size of 5 cm will generate 4 elements and will give a more detailed picture of the stress changes along the weld. A more detailed convergence study was performed considering convergence of the normal force perpendicular to the weld direction, e.g the normal force giving tension or compression perpendicular to the weld direction, along the edge of the web stiffener. The different element, interpolation, integration and mesh sizes that were used are presented in Table 5.5. The result from this convergence study is presented in Figure 5.14.
Figure 5.13 Convergence study of stresses due to horizontal pressure loading against the web. Only a small part of the main beam is showed
Table 5.5 Different element types and mesh sizes used for convergence analysis
Element Notation Interpolation Integration Mesh Sizes [cm]
S4R Linear Reduced 5.0; 2.5 S4 Linear Full 5.0
0
50
100
150
200
250
300
350
400
450
0 1 2 3 4 5 6 7
Str
ess
es
[MP
a]
Distance along beam [m]
Convergence study of stresses along beam
Mises 40cm Mises 20cm Mises 10cm Mises 5cm

5. FE MODEL
59
Figure 5.14 Convergence study of normal force perpendicular to weld direction.
What can be seen in Figure 5.14 is that the normal forces along a greater part of the stiffener have converged at a mesh size of 5 cm. At the end of the stiffener the normal forces will increase rapidly when a finer mesh size and integration type is used. This is a problem that can arise when a linear elastic analysis is performed. The stresses at corners can go towards infinity when the size of the mesh decreases. A linear variation of the force along the edge is expected. The behaviour of the 5 cm linear interpolated shell element with reduced integration was therefore determined to best describe the behaviour of the stiffener and was used in the analysis. Based on the performed convergence study Table 5.6 shows the elements that were used in the model.
Table 5.6 Selected elements and mesh size. S4R is a Shell Linear 4-noded element with reduced integration
Structural Element Element Type Mesh Size
Slab S4R 40 cm Main Beams S4R 5 cm Stiffening Beams S4R 5 cm
The location from where the stresses in the stiffener should be extracted was then investigated. Four different locations were considered, showed in Figure 5.15 together with a section view of the bridge. The extracted results are from gravity loading for the web stiffener at support. The deadweight of the console will make the bridge deck curve upwards and the forces acting on the stiffener should therefore go from tension at the left side to compression at the right side. The results are visualized in Figure 5.16.
-2 000
-1 500
-1 000
-500
0
500
1 000
1 500
2 000
00,040,080,120,160,20,240,280,320,36
Ax
ial
forc
e [
kN
/m
]
Lenght [m]
Normal force perpendicular to weld direction
5 CM 2,5 CM 5 CM FULL

5. QUALITY ASSURANCE
60
Figure 5.15 Locations at top of web stiffener from where the results have been extracted
Figure 5.16 Extracted results along different locations at the stiffener at support due to gravity loading
Based on these results line number two was selected as the line from where the results will be extracted. The result along that line was considered to be realistic.
5.3.6 Orthotropic behaviour of deck plate
The reason of modelling the deck plate as an orthotropic plate was that the concrete should be considered to be cracked over- and close to the support. This implies that the concrete will not contribute to the stiffness of the structure. The normal forces due to longitudinal bending should therefore be taken by the main beams. Figure
-3 000
-2 000
-1 000
0
1 000
2 000
3 000
4 000
5 000
00,040,080,120,160,20,240,280,320,36
No
rmal fo
rce [
kN
/m
]
Lenght [m]
Normal force at different levels
SF2-1 SF2-2 SF2-3 SF2-4

5. FE MODEL
61
5.17 shows that the normal forces in the deck plate due to longitudinal bending will be zero in the cracked zone for the orthotropic material model.
Figure 5.17 Normal forces in deck plate due to longitudinal bending for an isotropic- and orthotropic material model. Only half of the deck is plotted.
5.3.7 Displacement of main beams
The displacement of the main beams for the converged mesh was obtained from Brigade. A hand calculation of the displacement was performed for the same load case and the results were compared. The analytical solution was based on the conjugate beam method. In this method the moment along the beam divided by its bending stiffness is acting as a load. The displacement along the beam can then be solved by simple equilibrium equations. In Figure 5.18 is the analytical solution for the different beam stiffness plotted against the solution obtained in Brigade. In this comparison the deck plate was modelled as isotropic in Brigade to simplify the comparison. The figure shows the vertical displacement in the first span due to the deadweight. For the hand calculation the stiffness of the main beam has first been assumed to be uniform with the lowest stiffness of the beams, denoted Beam 1. The stiffness was secondly varied with the actual stiffness, denoted Different Stiffness. The moment distribution due to the variation of the stiffness was not considered.
-800
-600
-400
-200
0
200
400
600
800
1000
0 5 10 15 20 25 30 35 40 45
No
rmal fo
rce [
kN
/m
]
Distance along deck [m]
SF2 deck midline
ISOTROPIC ORTHOTROPIC

5. QUALITY ASSURANCE
62
Figure 5.18 Vertical displacement of main beam due to deadweight along the first span for calculations based on Brigade and an analytical solution.
5.3.8 Control of stresses in top flange
The stresses in the top flange of the main beam at the intermediate support due to deadweight was obtained from Brigade for the converged mesh size and with the deck plate modelled as isotropic. A simple hand calculation of the stresses in the top flange due to the longitudinal bending moment that arises was then performed. The moment of inertia for the composite section was calculated assuming full composite action and the concrete was considered to be uncracked. The comparison of stresses is presented in Table 5.7.
Table 5.7 Stresses in the top flange at support due to deadweight
Structural Part σhand [MPa] σFEM [MPa]
Top Flange 13 12
-0,035
-0,03
-0,025
-0,02
-0,015
-0,01
-0,005
0
0 5 10 15 20 25 30 35 40 45
Dis
pla
cem
en
t [m
]
Distance along span [m]
Vertical displacement due to gravity loading
Beam 1 FEM Different Stiffness
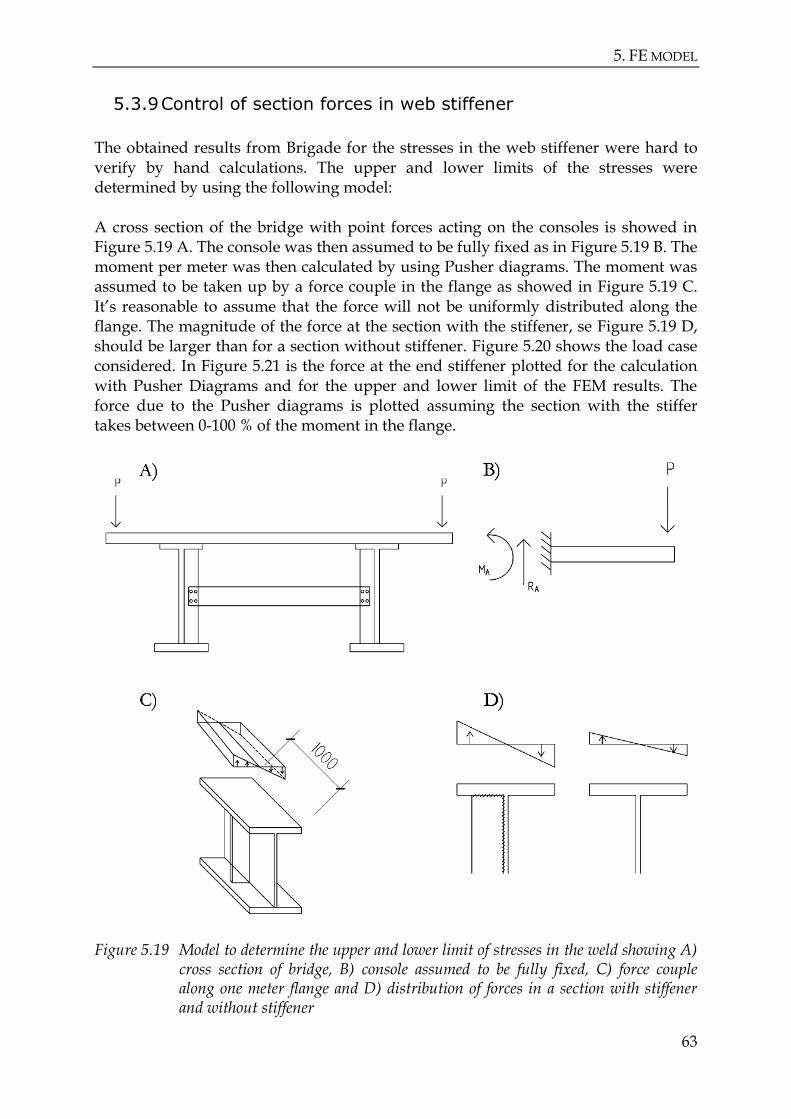
5. FE MODEL
63
5.3.9 Control of section forces in web stiffener
The obtained results from Brigade for the stresses in the web stiffener were hard to verify by hand calculations. The upper and lower limits of the stresses were determined by using the following model: A cross section of the bridge with point forces acting on the consoles is showed in Figure 5.19 A. The console was then assumed to be fully fixed as in Figure 5.19 B. The moment per meter was then calculated by using Pusher diagrams. The moment was assumed to be taken up by a force couple in the flange as showed in Figure 5.19 C. It’s reasonable to assume that the force will not be uniformly distributed along the flange. The magnitude of the force at the section with the stiffener, se Figure 5.19 D, should be larger than for a section without stiffener. Figure 5.20 shows the load case considered. In Figure 5.21 is the force at the end stiffener plotted for the calculation with Pusher Diagrams and for the upper and lower limit of the FEM results. The force due to the Pusher diagrams is plotted assuming the section with the stiffer takes between 0-100 % of the moment in the flange.
Figure 5.19 Model to determine the upper and lower limit of stresses in the weld showing A) cross section of bridge, B) console assumed to be fully fixed, C) force couple along one meter flange and D) distribution of forces in a section with stiffener and without stiffener
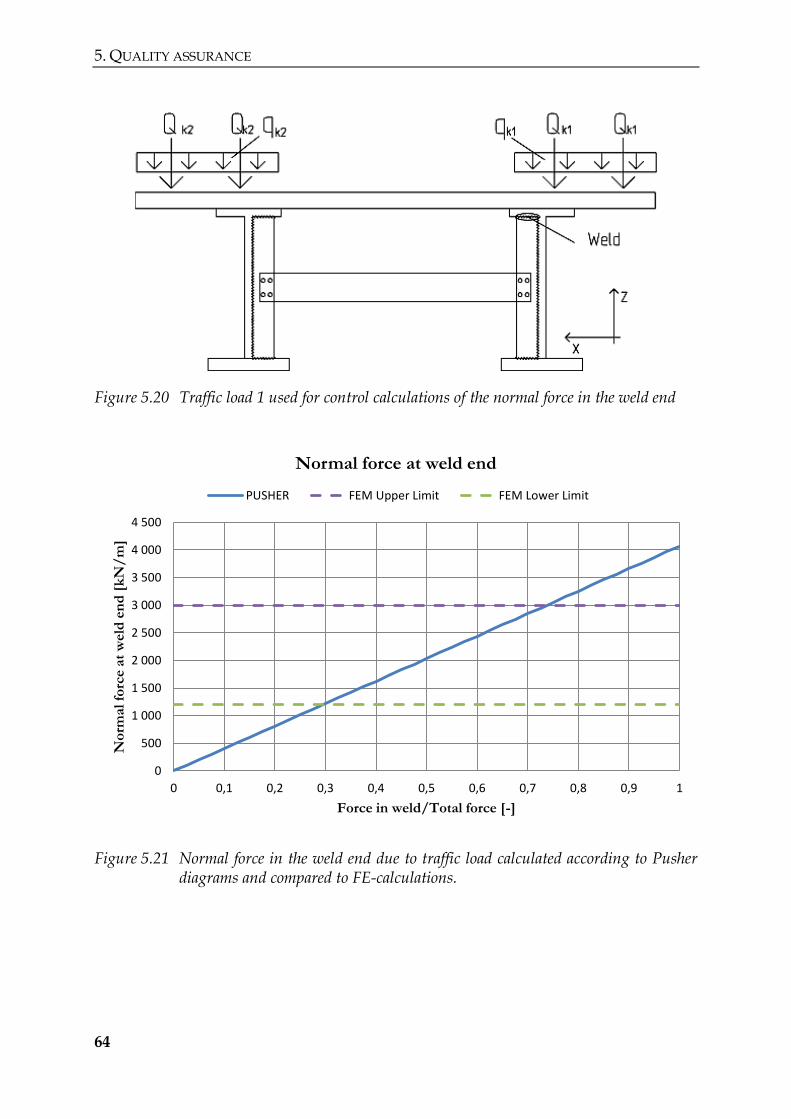
5. QUALITY ASSURANCE
64
Figure 5.20 Traffic load 1 used for control calculations of the normal force in the weld end
Figure 5.21 Normal force in the weld end due to traffic load calculated according to Pusher diagrams and compared to FE-calculations.
0
500
1 000
1 500
2 000
2 500
3 000
3 500
4 000
4 500
0 0,1 0,2 0,3 0,4 0,5 0,6 0,7 0,8 0,9 1
No
rmal fo
rce a
t w
eld
en
d [
kN
/m
]
Force in weld/Total force [-]
Normal force at weld end
PUSHER FEM Upper Limit FEM Lower Limit

5. FE MODEL
65
5.4 Conclusions of quality control
Based on the quality controls that have been performed the following conclusions could be drawn:
The differences in calculation of reaction forces and total weight of the model were less than 2.5 %.
The calculated displacements of the FE model were slightly over conservative. The maximum displacements were around 5 % larger in the FE model compared to the hand calculation.
The mesh size for the deck plate (40 cm) will be based on the convergence of the displacement since no stresses will be evaluated in the deck.
The mesh size for the main beams and cross bracings will be based on the convergence study of the stresses and selected as 5 cm.
The control calculation of stresses and section forces that determined the upper and lower limits for the results shows that the results from the FE calculation lies within these boundaries.

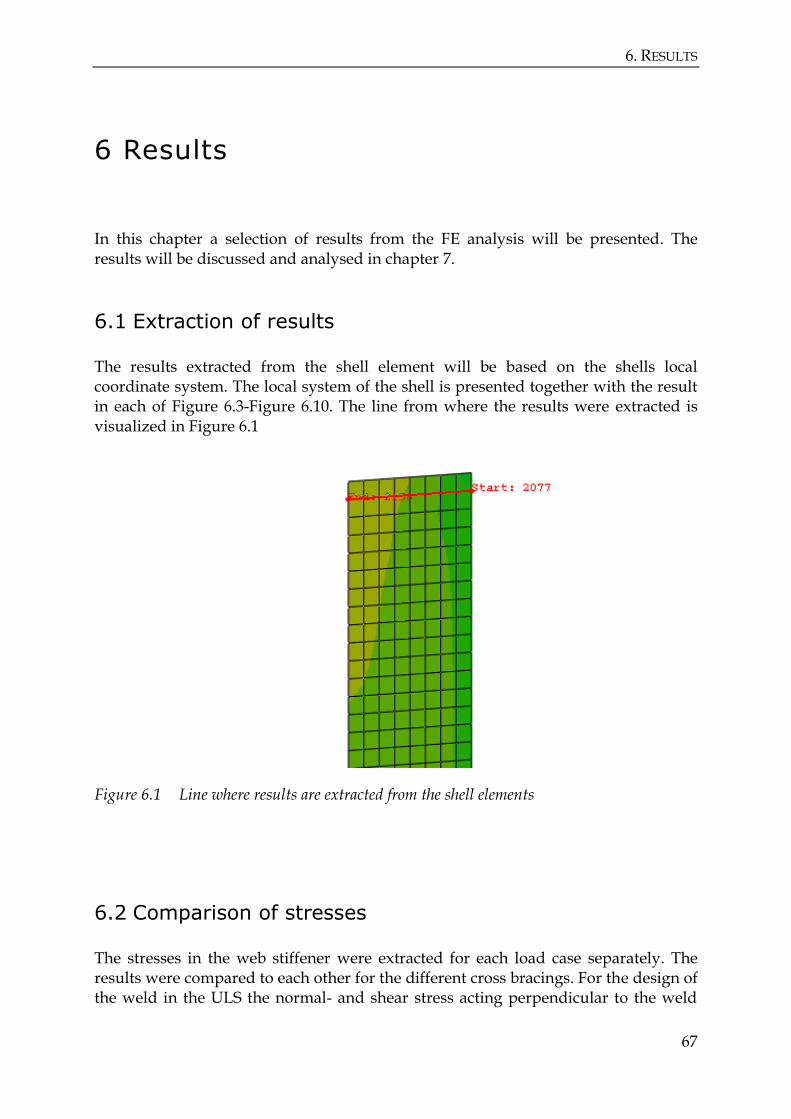
6. RESULTS
67
6 Results
In this chapter a selection of results from the FE analysis will be presented. The results will be discussed and analysed in chapter 7.
6.1 Extraction of results
The results extracted from the shell element will be based on the shells local coordinate system. The local system of the shell is presented together with the result in each of Figure 6.3-Figure 6.10. The line from where the results were extracted is visualized in Figure 6.1
Figure 6.1 Line where results are extracted from the shell elements
6.2 Comparison of stresses
The stresses in the web stiffener were extracted for each load case separately. The results were compared to each other for the different cross bracings. For the design of the weld in the ULS the normal- and shear stress acting perpendicular to the weld

6. COMPARISON OF STRESSES
68
plane together with the shear stress acting parallel to the weld is needed, as presented in Figure 3.13. The transformation from stresses in the stiffener to the weld is showed in Figure 6.2. Therefore the results presented in this report were focused on the three section forces giving the mentioned stresses. The Figures presenting the results will first show the bridge in plane marking the location of the studied section. A general cross section of the bridge is visualizing the load case that is considered. The location of the weld is marked and viewed in detail. In the detailed view of the weld are the stresses showed in the local coordinate system for the shell. The diagrams are showing the variation of stresses (MPa) in the weld along the stiffener. The diagrams are presented in a uniform scale. The x,y,z-cordinate system is referring to the systems Global Cordinate system. The 1,2-cordinate system is referring to the shells local coordinate system. For the comparison only the cross bracings in the spans were considered. The cross bracings at the support were designed in the same way and the only differences in the results at the support will be due to differences in the global behaviour of the bridge. The results from the analysis at the support showed very small or no differences at all and the results were therefore not presented.
Figure 6.2 Transformation of stresses in the stiffener to stresses in the weld showing in A) Stresses acting on the stiffener, B) Cut out section for study of equlibirum and C) Stresses acting on stiffener and weld

6. RESULTS
69
In Table 6.1 is a list of load cases that are presented in this chapter together with the location of the web stiffener and in which Figure the results are presented.
Table 6.1 List of extracted results from FE analysis
Load Case Location for Results Results Presented
Gravity Loading Cross Bracing 4 Figure 6.3 Wind Loading Cross Bracing 4 Figure 6.4 Flange Load Cross Bracing 6 Figure 6.5 Uniform Low Temp. Cross Bracing 4 Figure 6.6 Delta Temp Low Cross Bracing 4 Figure 6.7 Traffic 1 Cross Bracing 4 Figure 6.8

6. COMPARISON OF STRESSES
70
Figure 6.3 Stresses in the stiffener for gravity loading

6. RESULTS
71
Figure 6.4 Stresses in the stiffener for wind load

6. COMPARISON OF STRESSES
72
Figure 6.5 Stresses in the stiffener for flange load
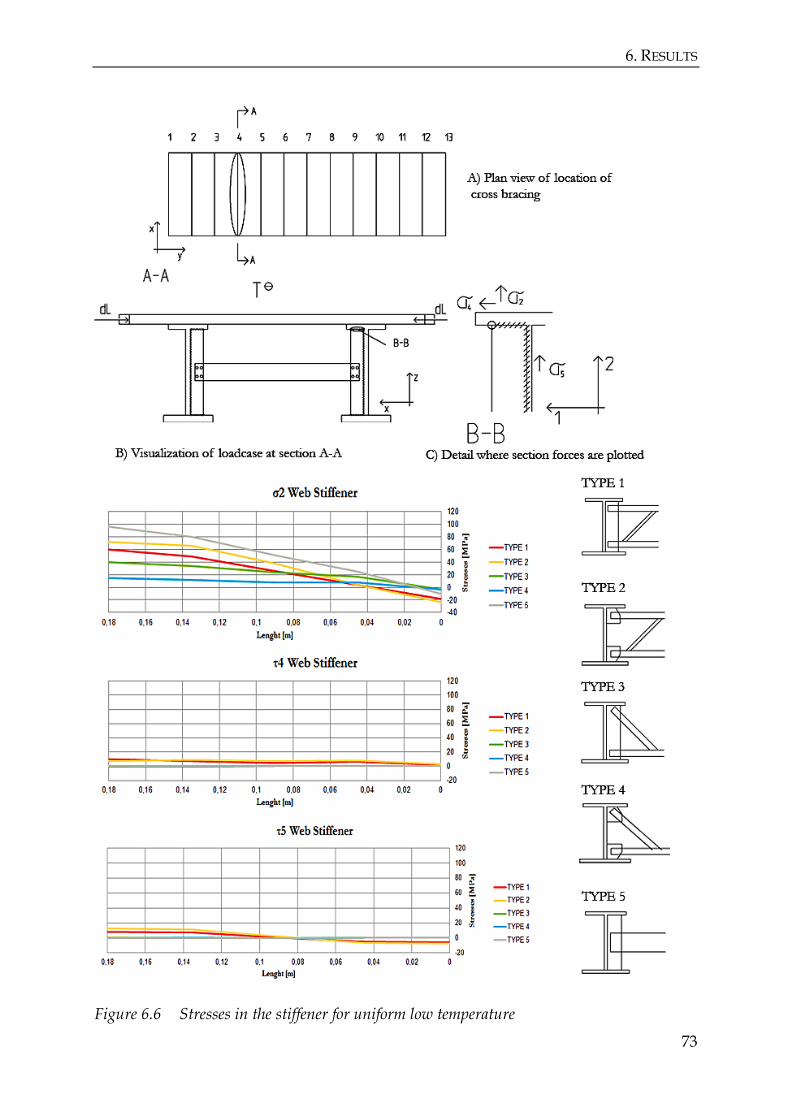
6. RESULTS
73
Figure 6.6 Stresses in the stiffener for uniform low temperature

6. COMPARISON OF STRESSES
74
Figure 6.7 Stresses in the stiffener for delta temp low

6. RESULTS
75
Figure 6.8 Stresses in the stiffener for traffic load 1

6. COMPARISON OF STRESSES RANGES
76
6.3 Comparison of Stresses Ranges
For the evaluation of the differences in the fatigue life for the different cross bracings the stress ranges is the most interesting thing to compare. For the evaluation of the fatigue life only the λ-method was considered and the maximum tensile and compressive stresses in the weld end were obtained for the traffic positions considered. The stress range was the calculated as:
(6.1)
where for simplicity was assumed to be zero and hence:
(6.2)
Figure 6.9-Figure 6.10 shows firstly the location in the plane of the bridge from where the weld stresses have been extracted. Secondly, a general cross section of the bridge is showed describing the load case that was considered and which detail that is studied. Lastly, a detail of the connection is showed and where the stresses were obtained.

6. RESULTS
77
Figure 6.9 Maximum stress range in weld due to fatigue vehicles passing along the console

6. COMPARISON OF STRESSES RANGES
78
Figure 6.10 Maximum stress range in weld due to one passage of fatigue vehicles in midspan

7. ANALYSIS AND DISCUSSION
79
7 Analysis and discussion
In this chapter the results presented above will be discussed and analysed. When axial forces are discussed this refers to axial forces in the plane of the cross bracings. Some interesting topics for further work and research are given.
7.1 Comments and possible errors in modelling
Early in the work of this master thesis it was decided that only static load cases would be considered. The model was therefore built up using shell elements exclusively. The reason for using only shell elements was to avoid possible error and difficulties when connecting dissimilar elements. At a later stage it turned out that it was not possible to obtain a stress spectrum unless a full dynamic evaluation of the bridge and the traffic load was performed. Due to the selected modelling technique and limitations in computer capacity it was not possible to run a full dynamic evaluation with a reasonable mesh size. Therefore a more simplified analysis with respect to fatigue was performed. The evaluation performed corresponds quite well to an approach using the λ-method but the minimum stresses were for simplicity assumed to be zero. The obtained results will however give a good indication whether or not the design of cross bracings will have an effect of the fatigue life of the weld. When the dynamic effects of the bridge is omitted this will generate a very smooth stress spectrum consisting of two stress cycles. In reality the dynamic effects from the loads will create oscillations that will generate more stress cycles. If the Miner-Palmgren approach of calculating the fatigue life is used this could generate a higher accumulated damage for one run. The connections between the web stiffener/gusset plates to the cross bracings were modelled using tie constraint. This will overestimate the stiffness of the connection and might result in higher stresses in the weld. Another option would have been to model the connections as a semi rigid joint. This implements that assumptions about the rotational rigidity of the joint would have been done. The results from such an analysis could have been more accurate but could also underestimate the stresses in the weld. The results that are obtained from this analysis will be on the safe side.

7. EVALUATION OF STUDIED LOAD CASES
80
7.2 Evaluation of studied load cases
In Table 7.1 is a list of the results for all load cases presented. In the tables the level of utilization of the weld was calculated for each load case. The stresses in the weld were calculated according to
[ (
∥ )]
(7.1)
the level of utilization was then calculated as
(7.2)
where is set equal to 355 MPa.
Table 7.1 Level of utilization, in percentage, of the weld for the different cross bracings types
Load Case Level of Utilization [%] Type 1 Type 2 Type 3 Type 4 Type 5
Gravity 30.6 29.2 30.8 18.6 42.2
Wind 4.5 1.5 3.3 1.2 13.2
Flange 16.5 16.1 5.7 5.1 40.6
Temp High 27.2 32.3 17.8 6.5 42.9
Temp Low 36.3 43.1 23.7 8.7 57.2
Delta Temp High 55.6 39.6 55.9 29.8 73.9
Delta Temp Low 82.8 66.8 77.7 39.7 114.5
Traffic 1 –Console- 90.7 79.1 88.5 49.4 123.2
Traffic 2 –Midspann- 80.0 56.9 77.5 36.0 103.8
Traffic 3 –Onesided- 32.0 34.0 31.2 22.2 44.4
7.2.1 General evaluation
Looking at Table 7.1 one can conclude that cross bracing Type 4 and Type 5 distinguish themselves by having the lowest- and highest level of utilization for every load case. The difference between them clearly shows the importance the design of the cross bracings will have with respect to the stresses that will develop in the weld. When the external loading mainly creates a bending moment in the deck plate some differences can be pointed out:
The stresses in the weld will be higher if web stiffeners are used, Type 1, 3 and 5 than if gusset plates are used, Type 2 and 4.
Cross bracing Type 5 that consists of a centred IPE profile will restrain the rotation and lateral deflection of the web along the middle of the web. This

7. ANALYSIS AND DISCUSSION
81
will restrain the lateral deflection of the web more than the other types and hence the stresses in this section will be larger.
The differences between a frame type of cross bracing, Type 1, and a K-truss section, Type 3 is rather small if vertical stiffeners are used.
When the external loading mainly creates an axial force in the deck the following difference can be pointed out:
A frame type of cross bracing as Type 1 and 2 will be much stiffer than a K-truss section type of cross bracing as type 3 and 4. This will generate higher stresses in the frame type.
In Table 7.2, the level of utilization for all cross bracing types is normalized against the usage of type 5. This table shows very clearly the significant differences between type 4 and 5 and that the stresses in the weld will depend highly on the stiffness of the cross braced section. The level of stresses in Type 4 compared to Type 5 is in the wind case 91 % smaller. It can also be seen that the differences between Type 1 and Type 3 is very small except for the load cases that will create large axial forces; Temp High- and Low and Flange Load.
Table 7.2 Normalized level of utilization of the weld against type 5
Load Case Normalized Level of Utilization [-] Type 1 Type 2 Type 3 Type 4 Type 5
Gravity 0.73 0.69 0.73 0.44 1
Wind 0.34 0.11 0.25 0.09 1
Flange 0.41 0.40 0.14 0.13 1
Temp High 0.63 0.75 0.41 0.15 1
Temp Low 0.63 0.75 0.41 0.15 1
Delta Temp High 0.75 0.54 0.76 0.40 1
Delta Temp Low 0.72 0.58 0.68 0.35 1
Traffic 1 –Console- 0.74 0.64 0.72 0.40 1
Traffic 2 –Midspan- 0.77 0.55 0.75 0.35 1
Traffic 3 –Onesided- 0.72 0.77 0.70 0.5 1
7.2.2 Evaluation of web stiffeners and gusset plates
One interesting aspect of this thesis was to investigate how the usage of gusset plates instead of transverse web stiffeners in the connection between the cross bracings and main beams would affect the stress levels. To evaluate this difference the results from Type 1 and 2 and Type 3 and 4 should be studied separately. Cross bracing Type 1 and 2 were constructed as a frame. When a bending moment is the dominating load, as for Wind, Delta Temp High- and Low and for Traffic 1- and

7. EVALUATION OF STUDIED LOAD CASES
82
2 the level of utilization will be notable smaller when gusset plates are used. For other load cases the differences between them are rather small and for Temp High and Low the level of utilization is higher when using gusset plates which is an unexpected result. Cross bracing Type 3 and 4 were constructed as a K-truss section. For all load cases, except Flange Load, the level of utilization is much smaller when gusset plates are used. The differences between stiffeners and gusset plates are greater for Type 3 and 4 than it is for Type 1 and 2. One possible explanation why the difference between stiffeners and gusset plates are greater for the K-truss section than for the frame section can be due to frame- and truss action. All the connections in the sections are done assuming the parts to be fully fixed. When stiffeners were used both the frame type of bracing and the K-truss bracing will work more like a frame. The connections between the bracings and stiffeners will transfer moment. When gusset plates are used the rigidity of the connection will be smaller and less moment can be transferred and the stresses will therefore be reduced. The section will now more work like a truss section. The frame type of bracing will still have one stiff truss section when the stiffener is removed. The K-truss section will no longer have any stiff truss section when the stiffener is removed. This will make the stiffness of the K-truss section smaller than for the frame section when gusset plates were used and explain why the difference in stresses between Type 2 and 4 exists.
7.2.3 Comments regarding level of utilization
Studying the level of utilization in Table 7.1 one can see that the temperature loads and traffic loads generally gives a very high level of utilization. If the loads should be combined and partial factors of safety added to the loads it will not be possible to show that the theoretical capacity of the weld, with a nominal throat size of 5 mm, would be sufficient with the given dimensions and steel grades. Up to this date only one composite road bridge, Vårby Bridge, have reported problems with cracking of the weld. The results in this thesis points in the direction that more bridges should have problems with cracking of the weld. Possible explanations to why this is not the case is listed below: 1) Possible error in modelling: The FE analysis is based on an approximation and even if a comprising quality control has been performed there is always a possibility of errors in the modelling. One source of error can be the overestimation, using of tie constraints, of the rotational stiffness in the connection between the cross bracing and the stiffener. 2) Linear elastic analysis: The analysis is run considering linear elastic material behaviour. The temperature loads applied on the bridge will give tensile stresses in the concrete deck of such magnitude that cracking will occur in parts of the plate.

7. ANALYSIS AND DISCUSSION
83
The cracking will reduce the restraining forces and hence the stresses in the weld would be smaller. The material in the welds were assumed to be linear elastic and the weld has not been considered to have any plastic behaviour. In reality it´s reasonable to assume that part of the weld can turn plastic allowing some redistribution of stresses and this would increase the theoretical capacity. SS-EN 1993-1-8;2.4(2) allows joints, with certain restrictions, to be designed assuming either elastic or elasto-plastic material behaviour. 3) Magnitude of traffic loads: The traffic loads applied when designing in the ULS have such magnitudes that they never should appear in reality. The differences between the considered theoretical load and the actual load can be one more explanation to why problems with cracking of the welds only have been reported in one case.
7.3 Evaluation of fatigue life
In Table 7.4 is the stress ranges for the fatigue evaluation presented. The results shows the same differences as discussed above where the stresses will be much higher in Type 5 compared to Type 4. The stress levels in Type 1 and Type 3 are rather close to each other. In Table 7.4 is the number of load cycles until failure calculated for the characteristic values of the stresses. This gives a good indication of how small differences in the stress range can result in quite large differences in number of load cycles until failure.
Table 7.3 Stress ranges for different cross bracing types for evaluation of fatigue life.
Traffic Position Stress Range [MPa] Type 1 Type 2 Type 3 Type 4 Type 5
Along Console 68 57 73 37 90
Between Main Beams 47 41 50 22 58
Table 7.4 Millions of load cycles until failure due to fatigue
Traffic Position Millions of Load Cycles to Failure [-] Type 1 Type 2 Type 3 Type 4 Type 5
Along Console 3.1 5.5 2.7 45 1.4
Between Main Beams 15.6 30.9 11.4 >100 5.4

7. CONCLUSIONS
84
7.4 Conclusions
This master thesis has showed that the design of cross bracings with respect to the stresses in the weld should be considered. The cross bracings should be carefully designed and the increased rotational stiffness to the main beam should be kept as low as possible. Increased rotational stiffness will lead to increased stresses in the weld. In most cases cracking of the weld are not severe for the structural capacity of the bridge unless the crack will propagate into the web or flange of the main beam. If the crack only propagates in the weld it will mainly cause a problem with maintenance of the corrosive protection. Although this thesis points in the direction that the theoretical capacity of the weld will not be sufficient in the ULS the results from the fatigue evaluation is still very interesting. The results shows that the design of the cross bracings can have a large impact on the fatigue life of the weld. The usage of gusset plates instead of transverse web stiffeners between the cross bracings and main beams can greatly reduce the stresses in the weld. It should be remembered that the usage of gusset plates will introduce a fillet weld that will end in the web of the main beam. This will introduce a stress concentration in the web and a possible initiation of a fatigue crack. A fatigue crack in the web of the main beam is very severe for the safety of the structure and this should therefore be further investigated. If the results from this analysis are accurate the question will arise how this weld should be designed. A range of solutions are possible; the a-measure of the fillet weld can be increased, the parts can be joined by butt welding or the steel grade of the parts included in the joint can be increased. Increasing the steel grade will however only affect the static capacity and not the fatigue life of the weld. It should however be remembered that up to this date only one composite road bridge, Vårby Bridge, have reported problems with cracking of the weld. All the solutions mentioned will increase the costs for the bridge and since history shows that a fillet weld of 5 mm will be sufficient one should be careful before proposing dramatic changes regarding the design of the weld.

7. ANALYSIS AND DISCUSSION
85
7.5 Further research
Investigate what influence semi rigid joints will have on the design of the welds. The connections, when using bolts, between the cross bracing and web stiffener are in the span designed allowing a certain clearance between the bolt and the hole. This enables some movement in the joint before stresses will develop and it should be interesting to investigate if this clearance has any effect on the design of the welds.
Simplified calculation models for design of welds. The calculation of load distribution in a cross section with transverse web stiffeners is hard to perform. FE models take time to build and the evaluation of the results takes even more time. Simple frame models tend to overestimate the amount of load that comes into the weld/stiffener. A simple method for the calculation of load distribution in a cross section with transverse web stiffeners would therefore be interesting to develop. An interesting model have been developed by Mattias Nilsson at Luleå University of Technology/Ramböll in his licentiate thesis; Secondary strain in web stiffeners in steel and composite bridges. This model could be used as basis for further research.
Evaluation of the weld stresses based on measurements The results in this report shows that the weld, according to theoretical calculations, will go to failure. The loads acting on a bridge during its service time will differ from the loads considered in the ULS. An evaluation of the real weld stresses according to measured stresses/strains in a real bridge would therefore be interesting to perform. This could be used to improve the accuracy of FE models and increase the understanding of how the connection between the stiffeners and cross bracings could be modelled.
Evaluation of fatigue cracking in the web when using gusset plates If gusset plates are used as the connection plate between the cross bracings and the main beams one have introduced a fillet weld that will end in the web of the main beam. This will introduce an area of stress concentrations and a possible starting point for a fatigue crack. If you consider the alternative of using gusset plates instead of transverse web stiffener the fatigue life of the web would be interesting to investigate.


BIBLIOGRAPHY
87
Bibliography
Books
1\ Bradford M.A, Gardner L, Nethercot D.A and Trahair N.S. 2008. The Behaviour and Design of Steel Structures to EC3. Taylor&Francis London and New York. ISBN 0-415-41865-8
2\ Combri. 2008a. Part I: Application of Eurocode rules. Luleå University of Techology, Division of Steel Structures.
3\ Combri. 2008b. Part II: State-of-the-Art and Conceptual Design of Steel and Composite Bridges. Luleå University of Techology, Division of Steel Structures.
4\ Collin P, Johansson B and Sundquist, H., 2008. Steel Concrete Composite Bridges. Royal Institute of Technology, division of Structural Design and Bridges together with Luleå University of Techology, Division of Structural Engineering. ISSN 1103-4289
5\ Cook R, Malkus D, Plesha M and Witt R. 2002?. Concepts and Applications of Finite Element Analysis- Fourth Edition. University of Wisconsin. ISBN 0-471-35605-0
6\ Eriksson K. 2009. Modul 8 Utmattning. Swedish Steel Construction Institute, Royal Institute of Technology and Luleå University of Techology. ISBN 91-7127-043-4
7\ Ruukki. 2007. Stålbrohandboken. Rautaruukki Abp.
8\ SCI Steel Knowledge. 2010. Composite Highway Bridge Design. The Steel Construction Institute of United Kingdom.
9\ Stålbyggnadsinstitutet. 2008. Stålbyggnad. The Swedish Institute of Steel Construction. ISBN 91 7127 042 6
10\ Sunnersjö, S. 1999. FEM I praktiken- En introduktion till finita elementmetodens praktiska tillämpning. Sveriges Verkstadsindustrier. ISBN 91-7548-541-9

BIBLIOGRAPHY
88
Design Standards
1\ CEN. 2008. SS-EN 1990-2:2008+A1 Execution of Steel Structures and Aluminium Structures- Part 2: Technical requirements for steel structures. European Committee for Standardization.
2\ CEN. 2003. SS-EN 1991-2 Actions on Structures- Part 2: Traffic loads on bridges. European Committee for Standardization.
3\ CEN. 2006. SS-EN 1993-2 Design of Steel Structures- Part 2: Steel Bridges. European Committee for Standardization.
4\ CEN. 2006. SS-EN 1993-1-5 Design of Steel Structures- Part 1-5: Plated structural elements. European Committee for Standardization.
5\ CEN. 2005. SS-EN 1993-1-8 Design of Steel Structures Part 1-8: Design of joints. European Committee for Standardization.
6\ CEN. 2004. SS-EN 1993-1-9 Design of Steel Structures Part 1-9: Fatigue. European Committee for Standardization.
7\ CEN. 2005. SS-EN 1994-2 Design of Composite Steel and Concrete Structures Part 2: General rules and rules for bridges. European Committee for Standardization.
8\ Trafikverket. 2011. TRVFS 2011:12 -Trafikverkets Författningssamling. Trafikverket Borlänge.
9\ Trafikverket. 2011. TRVK Bro 11- Trafikverkets Tekniska Krav Bro. Trafikverket Borlänge.
10\ Trafikverket. 2011. TRVR Bro 11 –Trafikverkets Tekniska Råd Bro. Trafikverket Borlänge.
11\ Vägverket. 2004. Bro 2004. Vägverket Borlänge.
Internet
1\ Trafikverket. Read: 25 January 2012. http://www.trafikverket.se/Privat/Vasternorrland/E4-Sundsvall/Dubbelkrum www.trafikverket.se; Keywords: Sundsvallsbron, Dubbelkrum
2\ Stålbyggnadsinstitutet. Read: 25 January 2012. http://sbi.se/upload/dokument/files/steel%20bridges%20in%20the%20World%20-%20October%202009.pdf www.sbi.se; Keywords: Stålbroar i världen, långa broar i Sverige

BIBLIOGRAPHY
89
Journals and Papers
1\ Bengtsson R, Widén M, 2010. FE-analysis of Vårby Bridge- Investigation of fatigue damage in a composite bridge. Master Thesis, Chalmers University of Technology, Division of Structural Engineering.
2\ Samhällsbyggaren #3 2011. Journal, Svenska Väg- och Vattenbyggarens Riksförbund.
3\ Collin P, Stoltz A, Möller M. 2002. Innovative Prefabricated Composite Bridges. Scientific paper
4\ Stålbyggnad #1 2012. Journal, Stålbyggnadsinstitutet

ISSN 1103-4297BKN.Master Thesis375
KTH/BKN/EX-375-SE
www.kth.se