Evaluation of Hydrogen Cracking in Weld Metal Deposited ...
66
June 16, 2009 PR-185-04508 Draft Final Report EWI Project Nos. 46354CAP/47964GTH Evaluation of Hydrogen Cracking in Weld Metal Deposited using Cellulosic- Coated Electrodes Submitted to: Pipeline Research Council International, Inc. Arlington, VA and U.S. Department of Transportation Washington, DC
-
Upload
khangminh22 -
Category
Documents
-
view
1 -
download
0
Transcript of Evaluation of Hydrogen Cracking in Weld Metal Deposited ...

June 16, 2009 PR-185-04508 Draft Final Report
EWI Project Nos. 46354CAP/47964GTH
Evaluation of Hydrogen Cracking in Weld Metal Deposited using Cellulosic-
Coated Electrodes
Submitted to:
Pipeline Research Council International, Inc. Arlington, VA
and
U.S. Department of Transportation
Washington, DC

Version Date of Last Revision Date of Uploading Comments
1 October 3, 2006 October 6, 2006 Draft Final Report 2 June 16, 2009 Final Report, Rev. 1

Revised Report
PR-185-04508 Draft Final Report Project Nos. 46354CAP/47964GTH
on
Evaluation of Hydrogen Cracking in Weld Metal Deposited using Cellulosic-Coated Electrodes
to
Pipeline Research Council International, Inc. Arlington, VA
and
U.S. Department of Transportation
Washington, DC
June 16, 2009
Susan Fiore and Matt Boring
EWI 1250 Arthur E. Adams Drive
Columbus, OH 43221

iv
Contents
Page
Executive Summary ....................................................................................................................viii
1.0 Introduction ............................................................................................................................ 1
2.0 Background............................................................................................................................ 2
3.0 Approach................................................................................................................................ 2 3.1 Phase 1 ............................................................................................................................... 3
3.1.1 Task 1 – Selection/Procurement of Welding Consumables.......................................... 3 3.1.2 Task 2 – Welding and Testing ...................................................................................... 3
3.2 Phase 2 ............................................................................................................................... 5 3.2.1 Selection of Welding Consumables .............................................................................. 5 3.2.2 Welding and Testing ..................................................................................................... 6 3.2.3 Storage Effects ............................................................................................................. 6
4.0 Results and Discussion.......................................................................................................... 6 4.1 Electrode Selection ............................................................................................................. 7
4.1.1 Effect of Electrode Drying on Coating Moisture............................................................ 7 4.1.2 Effect of Electrode Drying on Deposit Chemistry.......................................................... 7 4.1.3 Effect of Electrode Drying on Arc Characteristics......................................................... 8
4.2 Groove Weld Test Results .................................................................................................. 9 4.2.1 Mechanical Property Test Results .............................................................................. 10 4.2.2 Bend Test Results ...................................................................................................... 10 4.2.3 Chemical Analysis Test Results ................................................................................. 11 4.2.4 Effect of Arc Length .................................................................................................... 11
4.3 Review of Rehydration Conditions .................................................................................... 13 4.4 Environmental Exposure Testing ...................................................................................... 13 4.5 Power Source Effects........................................................................................................ 15
5.0 Safe Handling Guidelines .................................................................................................... 16
6.0 Summary and Conclusions .................................................................................................. 17
7.0 References........................................................................................................................... 19 Tables
Table 1. Cellulosic-Coated Electrodes Used During the Project .............................................. 20
Table 2. Coating Moisture, Carbon Content, Manganese Content, and Silicon Content of the As-Received versus Dried Electrodes ........................................................................ 21
Table 3. Complete Chemical Analysis Results for All Electrodes Tested................................. 22

v
Table 4. Chemistry and Mechanical Property Results for Seven Down-Selected Electrodes ..24
Table 5. Chemistry Results for Short and Long Arc Lengths for Electrodes in the As-Received and Dried Condition .................................................................................................... 26
Table 6. Results of Bend Testing for Restrained Welds Made Using Short Arc Lengths with Electrodes in the As-Received, Dried, and Rehydrated Conditions ........................... 27
Table 7. Results of Bend Testing for Restrained Welds Made Using Medium Arc Lengths with Electrodes in the As-Received, Dried, and Rehydrated Conditions ........................... 28
Table 8. Effect of Varying Times at 80°F/80% Relative Humidity............................................. 29
Table 9. DOE Test Conditions .................................................................................................. 29
Table 10. DOE Test Results ....................................................................................................... 30
Table 11. Actual DOE Test Conditions ....................................................................................... 30
Table 12. Additional Testing Done at Equal Grains of Moisture ................................................. 31
Table 13. Mechanical Property and Chemistry Results for Inverter/Motor-Generator Testing ... 32 Figures
Figure 1. Joint Configuration for the Groove Weld Testing..................................................... 33
Figure 2. Summary of Preheat Requirements for E8010-G, E9010-G Electrodes for Varying Pipe Thickness from the Results of PR-185-9909................................................... 33
Figure 3. The Application of Propane Flame Preheat ............................................................. 34
Figure 4. Approximate Location of Bend, Tensile, and Chemical Analysis Specimens .......... 34
Figure 5. Detail of Bend Test for Hydrogen Cracking Determination ...................................... 35
Figure 6. HS-DA and HSV Equipment .................................................................................... 35
Figure 7. Equipment Set-up with AVC Control and Moving Work Piece................................. 36
Figure 8. The Orientation of HSV Camera to the Travel Direction.......................................... 36
Figure 9. Coating Moisture Results for the As-Received and Dried Cellulosic Electrodes ..... 37
Figure 10. Effect of Electrode Drying on the Manganese Content of Deposited Chemical Analysis Pads .......................................................................................................... 37

vi
Figure 11. Effect of Electrode Drying on the Silicon Content of Deposited Chemical Analysis Pads......................................................................................................................... 38
Figure 12. Effect of Electrode Drying on the Carbon Content of Deposited Chemical Analysis Pads......................................................................................................................... 38
Figure 13. Coating Moisture Results for Eight Selected Electrodes in the As-Received, Dried and Rehydrated Condition ....................................................................................... 39
Figure 14. Lincoln Shield-Arc 70+............................................................................................. 39
Figure 15. Hobart Pipemaster 70.............................................................................................. 40
Figure 16. ESAB Sureweld 10P................................................................................................ 40
Figure 17. Voltage as a Function of Electrode Condition for Constant (Short) Arc Length....... 41
Figure 18. Voltage as a Function of Electrode Condition for Constant (Medium) Arc Length... 41
Figure 19. Ultimate Tensile Strength as a Function of Electrode Condition, Short Arc Length.42
Figure 20. Ultimate Tensile Strength as a Function of Electrode Condition, Medium Arc Length42
Figure 21. Yield Strength as a Function of Electrode Condition, Short Arc Length .................. 43
Figure 22. Yield Strength as a Function of Electrode Condition, Medium Arc Length .............. 43
Figure 23. Elongation as a Function of Electrode Condition, Short Arc Length........................ 44
Figure 24. Elongation as a Function of Electrode Condition, Medium Arc Length.................... 44
Figure 25. CEN as a Function of Electrode Condition, Short Arc Length ................................. 45
Figure 26. CEN as a Function of Electrode Condition, Medium Arc Length ............................. 45
Figure 27. Carbon Content as a Function of Electrode Condition, Short Arc Length................ 46
Figure 28. Carbon Content as a Function of Electrode Condition, Medium Arc Length ........... 46
Figure 29. Manganese Content as a Function of Electrode Condition, Short Arc Length......... 47
Figure 30. Manganese Content as a Function of Electrode Condition, Medium Arc Length .... 47
Figure 31. Silicon Content as a Function of Electrode Condition, Short Arc Length................. 48
Figure 32. Silicon Content as a Function of Electrode Condition, Medium Arc Length............. 48
Figure 33. Tensile Strength as a Function of Arc Length, As-Received Electrodes ................. 49

vii
Figure 34. Tensile Strength as a Function of Arc Length, Dried Electrodes ............................. 49
Figure 35. Yield Strength as a Function of Arc Length, As-Received Electrodes..................... 50
Figure 36. Yield Strength as a Function of Arc Length, Dried Electrodes................................. 50
Figure 37. Deposit Carbon Content as a Function of Arc Length, As-Received and Dried Electrodes................................................................................................................ 51
Figure 38. Deposit Manganese Content as a Function of Arc Length, As-Received and Dried Electrodes................................................................................................................ 51
Figure 39. Deposit Silicon Content as a Function of Arc Length, As-Received and Dried Electrodes................................................................................................................ 52
Figure 40. Deposit CEN as a Function of Arc Length, As-Received and Dried Electrodes ...... 52
Figure 41. Deposit Carbon as a Function of Arc Length, As-Received and Dried Electrodes..53
Figure 42. Deposit Manganese as a Function of Arc Length, As-Received and Dried Electrodes................................................................................................................ 53
Figure 43. Deposit Silicon as a Function of Arc Length, As-Received and Dried Electrodes ... 54
Figure 44. Deposit CEN as a Function of Arc Length, As-Received and Dried Electrodes ...... 54
Figure 45. Corrected Number of Defects in Bend Specimens for As-Received, Dried, and Rehydrated Electrodes, Short Arc Length ............................................................... 55
Figure 46. Corrected Number of Defects in Bend Specimens for As-Received, Dried, and Rehydrated Electrodes, Medium Arc Length ........................................................... 55
Figure 47. Corrected Bend Defect Lengths for As-Received, Dried, and Rehydrated Electrodes, Short Arc Length................................................................................... 56
Figure 48. Corrected Bend Defect Lengths for As-Received, Dried, and Rehydrated Electrodes, Medium Arc Length............................................................................... 56
Figure 49. Effect of Exposure Time at 80°F/80% Relative Humidity on Moisture Content ....... 57

viii
Evaluation of Hydrogen Cracking in Weld Metal Deposited using Cellulosic-Coated Electrodes
Executive Summary
Cellulosic-coated electrodes (primarily AWS EXX10-type) are traditionally used for “stovepipe” welding of pipelines because they are well suited for deposition of pipeline girth welds and are capable of high deposition rates when welding downhill. Despite advances in mechanized welding technology, development of low-hydrogen self-shielded flux-cored arc welding consumables, and substantial improvement of basic-coated low-hydrogen vertical-down shielded metal arc welding electrodes, manual pipeline welding using cellulosic-coated electrodes is still widely utilized throughout the world. Cellulosic-coated electrodes are also used for critical applications in offshore pipeline construction such as tie-in welds and repair welds. Several incidents involving significant hydrogen-assisted cracking in the weld metal of pipeline girth welds made using cellulosic-coated electrodes have occurred in recent years. Two of these cases required removal of many welds at an expense of over 4 million dollars, in spite of the fact that established welding procedures were used. In previous work at EWI for PRCI, PR-185-9909 – Limitations for Cellulosic Electrodes,(1) two cases of severe weld metal hydrogen cracking were investigated. In each case, the composition of the weld metal was substantially richer than would typically be expected for the type of electrode in question. Subsequent investigation into factors influencing the composition of weld metal from cellulosic-coated electrodes revealed that arc length has a pronounced effect on carbon, manganese, and silicon recovery. The increase in composition observed with variation in arc length could not explain the extremely rich compositions observed in the cracked girth welds, however. Subsequent investigation demonstrated that it was possible to effectively double the manganese concentration and triple the silicon concentration when using cellulosic-coated electrodes that have a low coating moisture content. Under the current program, an extensive study involving a variety of manufacturers’ cellulosic-coated electrodes in strength levels ranging from 60 to 90 ksi has allowed the conditions that can lead to hydrogen cracking in weld metal to be further defined. Specifically operator preference (arc length), electrode properties, power supply selection, and materials handling were examined. The effect of re-hydrating the electrodes was also studied. The results of the project have been used to develop safe handling guidelines.

ix
It was determined that while different manufacturers’ electrodes may respond somewhat differently to drying, they all exhibited some change in chemistry and strength level. Exposure to bright sunlight in warm, dry areas may be just as damaging as low-temperature baking, so it is best to keep cellulosic-coated electrodes in cool, shaded regions throughout the work day. Rehydrating the electrodes did not restore them to the as-received condition, so the best practice is to discard electrodes that have been exposed to particularly hot or dry conditions, and under no circumstances should cellulosic electrodes ever be placed in electrode drying ovens. While proper handling may help to reduce the risk of hydrogen cracking, past experience indicates that extreme caution should be exercised when applying cellulosic electrodes to low-alloy steels. Many manufacturers, including Lincoln, ESAB, and Hobart, produce cellulosic electrodes for welding steels of grade X70 and above, and improvements have been made in these products in recent years. However, the most conservative approach is to use low-hydrogen electrodes, gas metal arc welding or flux-cored arc welding when welding these higher-strength grades. If cellulosic electrodes must be used for these steels, the lowest grade which will produce adequate strength for the intended application should be chosen. Minimum preheat and interpass temperature recommendations should be strictly adhered to, and if possible, a post-weld hydrogen bake-out should be utilized. Electrodes should be stored in cool, dry locations and not exposed to direct sunlight. Any electrodes which have been exposed to hot, dry conditions, or very humid conditions should be discarded.
1
1.0 Introduction Cellulosic-coated electrodes (primarily AWS EXX10-type) are traditionally used for “stovepipe” welding of pipelines because they are well suited for deposition of pipeline girth welds and are capable of high deposition rates when welding downhill. Despite advances in mechanized welding technology, development of low-hydrogen self-shielded flux-cored arc welding (FCAW) consumables, and substantial improvement of basic-coated low-hydrogen vertical-down shielded metal arc welding (SMAW) electrodes, manual pipeline welding using cellulosic-coated electrodes is still widely utilized throughout the world. Cellulosic-coated electrodes are also used for critical applications in offshore pipeline construction such as tie-in welds and repair welds. Hydrogen-assisted cracking can occur in both the weld metal and heat-affected zone (HAZ) regions of a welded joint, although HAZ hydrogen cracking is more common. Extensive work was undertaken in the 1970s and 1980s to study HAZ hydrogen cracking, and guidelines were developed to avoid HAZ hydrogen cracking by controlling heat input and preheat. Improvements in steelmaking practice and the trend toward leaner chemistries have also helped to alleviate HAZ hydrogen cracking. In recent years, weld metal hydrogen cracking has become more of an issue with the trend toward higher-strength steels and welding with minimal or no preheat. Unlike HAZ hydrogen cracking, weld metal hydrogen cracking is much less understood, and reliable, consistent test methods have not been developed. Over the last few years, EWI has been involved in several pipeline projects where weld metal hydrogen cracking has been observed in girth welds deposited using cellulosic-coated SMAW electrodes (AWS EXX10-type). These have included girth welds and pipe to fitting welds in cross-country pipelines and repair welds on an offshore lay barge. The repair costs for the offshore lay barge project alone exceeded $10M. In all cases, the weld metal chemistry was much richer than expected and contributed to weld metal cracking. High carbon concentration (>0.20 wt%) and exceptionally high carbon equivalents (up to CE = 0.66 wt%) were measured in the cracked welds. It was found that weld metal chemistry was influenced by the welding parameters and electrode moisture content. The primary objectives of this project are to further define the conditions that can lead to hydrogen cracking in weld metal deposited using cellulosic-coated electrodes, in terms of operator preference (arc length), electrode properties, power supply selection, and materials handling. The results of the project are being used to develop welding guidelines, and if applicable, re-hydration guidelines to prevent weld metal hydrogen cracking.

2
2.0 Background In previous work at EWI for PRCI, PR-185-9909 – Limitations for Cellulosic Electrodes,(1) a variety of multipass weld metal cracking tests were reviewed. A test method that can be performed as part of a procedure qualification/material qualification test to determine appropriate preheat/interpass temperatures was developed. The preheat levels determined in this study agree well with data previously published by others for E8010-G and E9010-G electrodes.(2,3) This testing also demonstrated that, even when using “safe” welding procedures(4-7) with dried electrodes, it was possible to induce extensive weld metal cracking due primarily to the enriched weld metal composition. Subsequent investigation into factors influencing the composition of weld metal from cellulosic electrodes revealed that arc length has a pronounced effect on carbon, manganese, and silicon recovery. The increase in composition observed with variation in arc length could not explain the extremely rich compositions observed in the cracked girth welds, however. Subsequent investigation demonstrated that it was possible to effectively double the manganese concentration and triple the silicon concentration when using cellulosic electrodes that have low coating moisture contents. In the past the consensus has always been that cellulosic electrodes which have been over-dried will produce porosity well before weld metal cracking becomes a problem. However, some of the newly developed cellulosic welding electrodes are more resistant to porosity, even when the coating moisture is very low. Consequently, the welder may have no indication that there is a potential problem with the consumables that is being using until an actual failure has occurred.
3.0 Approach The work on this project was carried out in two phases. Phase 1 focused primarily on consumable selection and initial evaluation. Phase 2 focused primarily on evaluation of procedure variables and the development of safe-handling guidelines. Details of each phase are provided below. A second project, which was funded by the U.S. Department of Transportation (DoT) has been going on simultaneously. The main emphasis of that project has been to determine the effects of re-hydrating the electrodes. Because the two projects are closely linked, the results of the DoT project will also be discussed here.

3
3.1 Phase 1 In Phase 1, cellulosic-coated electrodes from a variety of manufacturers were selected with a range of strength levels, from 60- to 90-ksi tensile strength (i.e., from E6010 to E9010). EWI evaluated the electrodes by depositing chemical analysis pads and by depositing groove welds under the following conditions:
• As-received, short arc length • As-received, medium arc length • Oven-dried, short arc length • Oven-dried, medium arc length • Rehydrated, short arc length • Rehydrated, medium arc length.
The conditions for electrode drying were the same as those used under PR-185-9909: the electrodes were dried in an oven for a period of 7 days at 86°C (187°F). The re-hydration process consisted of placing the oven-dried electrodes into a humidity cabinet set at 27°C (80°F) and 80% humidity for a period of 7 days. High-speed data acquisition (HS-DA) was used to characterize droplet transfer mode welding characteristics for each electrode. 3.1.1 Task 1 – Selection/Procurement of Welding Consumables Cellulosic-type SMAW electrodes (EXX10-type) were selected from the top U.S. manufacturers, including Lincoln Electric, ESAB Welding & Cutting Products, and ITW Hobart Brothers. The types of electrodes included AWS A5.1 E6010, AWS A5.5 E7010-P1 and/or E7010-G, E8010-P1 and/or E8010-G, and E9010-G. Because most manufacturers now produce both traditional and soft-arc cellulosic electrodes (which are often referred to as “plus-type”), samples of each type were included in the analysis. The electrodes selected are listed in Table 1. The electrodes selected were all 3.2-mm (⅛-in.) diameter. 3.1.2 Task 2 – Welding and Testing Chemical analysis pads were welded with each of the electrodes to determine the weld metal chemical analysis. The chemical analysis pads were welded in accordance with AWS A5.5-96. The chemical analysis pads were fabricated using 12.7 mm (0.5 in.) A36 as the base material and a medium arc length (3-4 mm). The electrodes were initially tested in the as-received condition and the dried condition resulting in a total of 34 chemical analysis pads. As stated previously, the drying process was carried out by placing the electrodes in an electrode oven for a period of 7 days at 86°C (187°F). Samples of the coating from each of the electrodes in each

4
condition were removed and submitted for moisture analysis. The moisture analysis was done on a weight-loss basis: a sample of the coating was precisely weighed, dried for a minimum of 2 hours at 110°C (230°F) and then reweighed. In one case, the Hobart Pipemaster Pro-80, the electrode was not usable after being dried due to a lack of adhesion of the coating consequently no chemical analysis was performed for this condition. Based on the results of the weld metal chemical analysis for the electrodes in the as-received and dried conditions, two electrodes of each type were selected for additional testing. Because only one E9010-type electrode was available, there was only one electrode tested at that strength level. Consequently, a total of seven electrodes were selected for the additional testing. The electrodes were chosen based on which consumables displayed the widest range of variation in chemistry, in particular, the variation of manganese and silicon content in the deposited chemical analysis pads. The additional testing of the seven electrodes selected included further chemical analysis pads and complete groove welds. The additional chemical analysis pads were fabricated using rehydrated electrodes. As stated previously, the re-hydration process consisted of placing the oven-dried electrodes into a humidity cabinet for a period of 7 days at 27°C (80°F) and 80% humidity. The moisture of the coatings of the rehydrated electrodes was measured in the same manner as the as-received and dried electrodes. The second test called for depositing groove welds in 19-mm (0.75-in.) X-70 pipe. The pipe was sectioned into several 250- × 250-mm (10- × 10-in.) sections. The pipe sections were rigidly restrained using strong-backs. The joint configuration is shown in Figure 1. Two grooves for each electrode and electrode condition were welded, one with a short arc length (approximately 1-2 mm) and one with a medium arc length (approximately 3-4 mm). This resulted in a total of 42 groove welds. The welds were made using an inverter-type power supply in the 1G position. Preheat and interpass temperatures were selected based on the results of PR-185-9909. Specifically, the preheat/interpass temperature chosen was the temperature at which cracking was no longer observed for the as-received electrode condition using a medium arc length (Figure 2). From Figure 2, a value of 121°C (250°F) was selected as the preheat/interpass temperature. The preheat was achieved by using a propane torch on the backside of the weld joint (Figure 3). The preheat/interpass temperatures were monitored by a thermocouple attached to the face of the weld joint. Following welding the grooves remained restrained for a minimum of 72 hours prior to inspection. After the 72-hour delay, the completed welds were examined visually for the presence of porosity and/or cracks, radiographically inspected, and sectioned to remove longitudinal bend

5
specimens, all-weld-metal tensile specimens and chemical analysis specimens from each weld. The bend specimens were taken such that the fusion line would run diagonally through the sample so that it would contain approximately 50% weld metal and 50% base metal. Figure 4 shows the approximate location and orientation of the bend specimen, the all-weld-metal tensile specimen, and the chemical analysis specimen in each weld. The bend specimens and the tensile specimens were aged for 48 hours at 104°C (220°F) prior to testing. Details of the bend test configuration are shown in Figure 5. The bend testing was such that the weld metal side of the sample was put in tension. Following testing, the bend specimens were visually examined and an assessment was made as to how extensively the weld metal cracked. The tensile specimens were also examined for evidence of hydrogen damage. In addition to the weld composition characterization and groove weld testing, HS-DA and high-speed video (HSV) were used to characterize the droplet transfer mode and welding characteristics for each electrode/condition. The HS-DA and HSV equipment are shown in Figure 6. An automatic voltage control (AVC) was used to maintain constant voltage as the work-piece was moved underneath the arc (Figure 7). The electrode remained stationary as the work-piece traveled beneath the welding arc, thereby maintaining a constant distance between the welding arc and the HSV camera. The HSV camera was parallel to the travel direction aimed at the leading edge of the weld pool, as can be seen in Figure 8. 3.2 Phase 2 Two consumables from Phase 1 were selected for additional testing. The testing included fabricating several groove welds to determine relationships between coating moistures and procedure variables. The objectives of Phase 2 are listed below:
• Determine the relationship between coating moisture, operating characteristics, and weld metal composition
• Determine the effect of power supply (inverter vs. rectifier) • Recommend storage/handling procedures.
The results from Phase 2 are being used to develop guidelines to prevent hydrogen cracking in weld metal deposited using cellulosic-coated electrodes. 3.2.1 Selection of Welding Consumables Because a higher strength level is a greater concern for hydrogen cracking, and because the majority of cracking problems which had been encountered previously had been with electrodes of the E8010-X classification, it was decided that electrodes of this classification would be used

6
for the Phase 2 testing. The two electrodes selected were the Lincoln Shield Arc 70+ and the Hobart Pipemaster 80. 3.2.2 Welding and Testing In order to determine the effect of power supply type, welds were produced using the Lincoln Shield Arc 70+ and the Hobart Pipemaster 80 with two different power supplies, an inverter and a motor-generator type power supply. The welds were produced with electrodes in the as-received and the dried condition. After a minimum of 72 hours following welding, the grooves were examined visually, radiographed and sectioned for the removal of tensile and bend specimens. The specimens were aged for 48 hours at 104°C (220°F) prior to testing. Following testing, the bend specimens were examined and an assessment was made as to how extensively the weld metal cracked. 3.2.3 Storage Effects The results of Phase 1 indicated that rehydrating electrodes was difficult to control, and may be impractical in the field, it was decided that a better approach would be to determine maximum exposure times for a variety of environmental conditions under which coating degradation (either excessive drying or excessive moisture pick-up) would not occur. To accomplish this, a design-of-experiments (DOE) approach was utilized. Climatology reports from around the world were reviewed and a variety of conditions, ranging from about 40 to 90% relative humidity, were selected. The amount of moisture in the air from the climatology reports ranged from 30 to 170 grains per pound of dry air. The range of moisture conditions were simulated in the lab using a humidity cabinet. In order to determine whether different manufacturers’ products responded differently, to the different environmental conditions, the ESAB Sureweld 810P was included in this portion of the study, in addition to the Lincoln Shield Arc 70+ and the Hobart Pipemaster 80.
4.0 Results and Discussion The results of the project are grouped into electrode selection results and groove weld test results. The electrode selection results include the chemical analysis pad, coating moisture, and the HSV droplet transfer data. The groove weld results include the weld metal chemistries, all-weld-metal tensile results, bend test results, and the procedure variable weld data.

7
4.1 Electrode Selection As was indicated previously, the electrodes were tested in the as-received condition and then dried in an electrode oven for one week at 86°C (187°F). The electrodes which were tested are listed in Table 1. All of the products tested initially were “off-the-shelf,” i.e., no effort was made to obtain products that were produced to the manufacturers’ optimal chemistry or moisture content. This was done in an effort to prevent biasing the results in any way. However, as a result, some of the products may not have been representative of typical product chemistries and/or moisture contents, and in some cases, the products may not have been within the manufacturers’ specifications. 4.1.1 Effect of Electrode Drying on Coating Moisture The first portion of the electrode selection process was to determine the coating moisture content of the as-received and dried electrodes and the change in chemical composition of the electrodes as a result of drying. Table 2 lists the measured coating moistures along with the percent change between the as-received electrodes and the dried electrodes. Coating moisture testing was done by precisely weighing a sample of coating, drying it for a minimum of 2 hours at 110°C (230°F) and reweighing it. Figure 9 shows a graphical representation of the moisture results for all the electrodes tested. The drying of the electrodes dramatically reduced the coating moisture content for all the electrodes except for Hobart Pipemaster Pro-70. The coating moisture of Pipemaster Pro-70 was reduced by 19%, as compared with typical decreases of about 50-80% for the other electrodes. The small reduction was attributed to the low as-received coating moisture result, less than 1 wt% moisture, which is uncommon for cellulosic-coated electrodes. It is likely that this product was not within the manufacturer’s specification when it was received. 4.1.2 Effect of Electrode Drying on Deposit Chemistry The effect of electrode drying on the chemical composition of chemical analysis pads is shown graphically in Figure 10 through Figure 12. The figures show the effects on manganese, silicon, and carbon content, respectively. Table 2 lists the percent change of each element from the as-received electrodes and the dried electrodes. One electrode, Hobart Pipemaster Pro-80, would not produce a stable arc after the drying cycle. For this reason, the Pipemaster Pro-80 was discarded as a viable option for further testing. Figure 10 shows that all but one electrode produced weld pads with an increase in manganese content and Figure 11 shows that all but one electrode produced weld pads with an increase in silicon content as a result of electrode drying. Hobart Pipemaster Pro-70 was the source of both deviations. Again, this is likely due to the very low initial moisture content for this product. Figure 12 shows the results for the carbon

8
analysis of the weld pads. The carbon content results show no clear trends as a result of electrode drying. Five electrodes increased in carbon content, nine electrodes decreased in carbon content, and one electrode exhibited no change in carbon content. A comparison of the percent change of the manganese and silicon contents listed in Table 2 led to the decision as to which electrodes would be used for additional testing. The electrodes selected for additional testing are highlighted in Table 2. The seven electrodes selected were once again dried and then rehydrated in a humidity cabinet for a period of 7 days. After the rehydration period, the coating moisture samples were analyzed and chemical analysis pads were fabricated using the rehydrated electrodes. Table 3 shows complete chemistry results for all of the electrodes, including the seven tested in the rehydrated condition. Figure 13 shows graphically the effect of re-hydration on the coating moisture of the seven electrodes. Clearly the rehydrating conditions selected resulted in a substantial increase in coating moisture, well above that of the as-received condition. Table 3 includes two different calculations of carbon equivalent (CE): the IIW carbon equivalent (CEIIW) and the carbon equivalent number (CEN). The calculations are shown below as Equation 1 and Equation 2, respectively.
1556
)( CuNiVMoCrMnCIIWCeq+
+++
++= Equation 1
( )[ ]12.020tanh25.075.0)(
552015624
)(
−+=
⎟⎠⎞
⎜⎝⎛ +
++++++++=
CCAwhere
BVNbMoCrNiCuMnSiCACCEN Equation 2
4.1.3 Effect of Electrode Drying on Arc Characteristics Bead-on-plate welds were made with each of the seven second-round electrodes. The arc was monitored using HS-DA and filmed using HSV. The data was matched with the video so that details of metal transfer could be matched with changes in current. The voltage was held constant for the bead-on-plate welds; as a result the arc length was automatically adjusted to maintain the set voltage. It was noted that in all cases, the arc length was notably longer when the electrodes were in the dried condition. Snapshots taken from several of the HSVs are shown in Figure 14 through Figure 16. As can be seen, the increase in arc-length with electrode drying holds true for all three manufacturers’ products. It was also noted that in general, when the electrodes were dried, the transfer tended to become more globular in nature.

9
When the groove welds were made, the welder was told what arc length to use and was asked to maintain that arc length as closely as possible. As a result, the voltage tended to vary as that arc length was maintained. Based on the fact that the arc length tended to increase at constant voltage when the electrodes were dried, it was expected that for equivalent arc lengths voltage would drop when the electrodes were dried. An examination of the data for the groove welds indicated that this was generally the case. The data are shown graphically in Figure 17 and Figure 18. While the trend generally held true for the short arc length welds, it was true in all cases for the medium arc length welds. This may be because a medium arc length may be easier to control and hold consistently. The significance of this variation in voltage with drying is that when the welder holds a constant arc length, the voltage goes down for the dried electrodes, which means that more alloy will transfer across the arc, resulting in a richer chemistry in the deposit. For the rehydrated electrodes, the variation in voltage with electrode condition was not consistent. While in many cases, the voltage dropped further when the electrodes were rehydrated, in some cases it remained essentially unchanged, and in a few cases it increased. Again, there was more consistency for the welds made with a medium arc-length, which in five out of the seven cases exhibited a drop in voltage when the electrodes were rehydrated. Electrodes of the EX010 classification are often referred to as cellulosic because one of the primary ingredients in the coating is cellulose. Cellulose is a long-chain organic material comprised of carbon, hydrogen, and oxygen. When cellulose breaks down in the arc, it forms carbon monoxide, carbon dioxide, and water vapor. The carbon dioxide acts to shield the arc, and the water vapor may act to give the cellulosic electrode its characteristic driving arc. When the electrode coating is exposed to very dry conditions or low temperature baking, the cellulose will begin to break down. When this happens, there is less water available to provide the arc its drive. The result is either a longer arc length when voltage is held constant, or a lower voltage when arc-length is held constant, which is perceived as a “softer” arc by most welders. 4.2 Groove Weld Test Results Table 4 shows the results of the groove weld testing. The test welds were produced with the seven electrodes which were down-selected from the previous round of testing. The electrodes were tested in the as-received, dried, and rehydrated conditions using both a short and a medium arc length. Following nondestructive evaluation (NDE), the welds were tested for tensile properties, bend properties, and chemistry. In one case (Hobart Pipemaster 80, dried, medium arc length), the weld showed indications of extensive hydrogen damage. As a result, the weld was repeated. Both results are included in Table 4.

10
4.2.1 Mechanical Property Test Results In all but one case (ESAB Sureweld 10P, short arc length), the tensile strength increased as a result of electrode drying. The yield strength increased following drying in all cases. On the average, the yield and tensile strength increased 9 and 8.4%, respectively, after drying, with increases as great as 20 to 25% noted. The mechanical test results are shown graphically in Figure 19 through Figure 24. In most cases, the tensile strength dropped following re-hydration of the electrodes. The Hobart Pipemaster 70 showed a definite increase in tensile strength from the dried to the rehydrated condition, especially when welding was done using a medium arc length. The ESAB Sureweld 10P also exhibited a very slight increase in tensile strength (<0.5%) as a result of re-hydration. About half of the products showed either an increase in yield strength or a very minor drop in yield strength associated with re-hydration. The increases in yield and tensile strength which were associated with rehydration did not exhibit a corresponding increase in alloy recovery. All of the products showed a drop in CE from the dried to the rehydrated condition. The fact that rehydrating the electrodes did not lead to reduced strength levels would seem to indicate that there may be a second strengthening mechanism at work in this case. The changes in percentage elongation were not consistent with electrode condition. It was expected that the dried electrodes would have lower elongation than those used in the as-received condition. In fact, five of the fourteen electrode/arc length combinations had better elongation when the electrodes were dried than when they were in the as-received condition. Similarly, rehydrating the electrodes only led to an improvement in elongation in five of the fourteen cases. The latter is probably due, in part, to the fact that in some cases, rehydrating the electrodes caused excessive moisture pick-up, porosity and/or hydrogen damage. 4.2.2 Bend Test Results The bend test results are summarized in Table 6 and Table 7. Table 6 shows the results for the short arc length and Table 7 shows the results for the medium arc length. The samples were analyzed both for the total number of defects and the total defect length. Because some defects such as root tears and lack-of-fusion defects were clearly not related to hydrogen damage, they are not included in the “corrected” numbers listed in Table 6 and Table 7. The results are also shown graphically in Figure 45 through Figure 48. In general, drying the electrodes resulted in a deterioration of the bend properties. In many cases, the change was

11
relatively minor. Rehydrating led to an improvement in bend properties in many cases. However in a significant number of cases, the bend properties were considerably worse for those welds produced with rehydrated electrodes. 4.2.3 Chemical Analysis Test Results The chemical analysis results for all of the groove welds are provided in Table 4. The chemical analysis results are shown graphically in Figure 25 through Figure 32. In all cases, drying the electrodes resulted in an increase in CEN. The increases in CEN ranged from around 1% up to around 33%, with an average increase of 16.5%. The individual elements, specifically manganese and silicon showed even larger increases. The average percentage increase in manganese was 26.1% and for silicon it was 67.7%. Individual increases as high as 63 and 196%, respectively, were observed. In most cases, the carbon increased when the electrodes were dried. In a few cases, there were either very small increases in carbon, or actual drops in carbon as a consequence of drying. This may be due to differences in what form the carbon is in when it is incorporated into the coating. Rehydrating the electrodes resulted in a drop in CEN in all cases. The drop in CE was generally related to the drop in carbon content. In some cases, the manganese and/or silicon actually increased after rehydration. Again, this tends to indicate that re-hydration is not an effective means of controlling electrode chemistry and properties. 4.2.4 Effect of Arc Length There was not a great deal of variation in strength as a result of changes in arc length. Figure 33 through Figure 36 show the yield and tensile strengths for the as-received and the dried conditions as a function of arc length. It was expected that the strength level would be higher for welds produced using a short arc length versus a medium arc length. As can be seen in Figure 33, there is effectively no change in tensile strength with arc length for electrodes in the as-received condition. Those that did show a change typically showed a slight increase in strength as the arc length increased. The trend was more as expected for the dried electrodes, as can be seen in Figure 34 and Figure 36, which show tensile and yield strength, respectively. In all but one case, the strength was higher when the weld was produced using a short arc length. The only product which deviated from the trend was of the ESAB Sureweld 10P which showed an increase in yield and tensile strength with increasing arc length for the dried electrode condition. The reason for this deviation is unclear. Again, it may be related to the way the product is formulated or the way the elements are incorporated into the coating.

12
The changes in deposit carbon and CEN with arc length followed the expected trend, although the manganese and silicon levels did not, in many cases. The chemical analysis data is shown graphically in Figure 37 through Figure 40. As can be seen in Figure 37, the carbon recovery was always higher for the short arc length welds, regardless of whether the electrodes were in the as-received or the dried condition. The same holds true for the CEN, which is shown in Figure 40. Manganese and silicon, which are shown in Figure 38 and Figure 39, respectively, did not show a consistent variation with arc length. In roughly half the cases either the manganese, the silicon, or both increased when the arc length increased. The expectation was that as the arc length decreased, the alloy recovery would increase because there would be less opportunity for atmospheric exposure and the corresponding oxidation, which would result in less alloy lost across the arc. While this held true for carbon, it did not hold true for manganese and silicon in many cases. This may be related to the way the various products are formulated. The manganese which is present in a SMAW electrode typically takes several forms. First, there is a certain level of manganese which is present in the core wire. Because it is part of the steel alloy, its recovery rate is relatively high. Manganese is also present in the coating. In the coating it may be in the form of ferro-alloy powder or as complex mineral oxides. Manganese in the coating would not be expected to transfer as efficiently as that in the core wire, and different alloy and mineral forms may be affected in different ways by the arc. Similarly, silicon is also found in different forms in a SMAW electrode. Ferro-silicon is not typically added to cellulosic electrode coatings, so most of the silicon in the coating comes from mineral silicates and the binder. One of the primary sources of carbon in a cellulosic electrode weld deposit is the cellulose itself. When cellulose is exposed to the heat of the arc, it breaks down into carbon, carbon dioxide and carbon monoxide, water and elemental hydrogen. While the majority of the cellulose will form the shielding around the arc, a small amount of carbon and hydrogen will end up in the deposit. The core wire typically contains less than about 0.06 wt% carbon. One concern with regard to the inconsistent variation in chemistry with respect to arc length was that the difference between the “short” and the “medium” arc lengths was not significant enough to show true differences. Also, because SMAW is a manual process, it is more difficult for the welder to maintain a 1-2 mm difference in arc length. As a consequence, it was decided that tests should be done using a “short” (1-2 mm) arc length and a “long” (4-5 mm) arc length so that the differences could be determined more precisely. Results for the short and long arc-length tests are summarized in Table 5 and are shown graphically in Figure 41 through Figure 44.
13
The changes in deposit carbon content were much more dramatic when a short versus long arc length was used as opposed to a short versus medium arc length. One exception was the ESAB Sureweld 10P in the as-received condition, which showed no change with changes in arc length. The results for the dried sample of the same material were comparable to the other electrodes tested in that there was a large variation in carbon content with arc length. Typically, the carbon content in welds produced using a short arc length was 0.06 to 0.08% higher than for those produced using a long arc length. Again, the variations in manganese and silicon with arc length were not as consistent or as dramatic as those in the carbon content. Although there were a few exceptions, the changes in manganese and silicon were generally small, and in some cases one or both actually increased with increasing arc length. Again, this is probably related to how the material is added to the electrode. 4.3 Review of Rehydration Conditions The conditions which were chosen for rehydrating the electrodes, in retrospect, appeared to be overly aggressive. The choice of conditions was based on standard electrode exposure conditions [27°C (80°F) and 80% relative humidity] which are used to test low hydrogen electrodes. The time chosen was based on the fact that the electrodes had been dried for a period of one week, so it seemed logical to rehydrate them for a period of one week. In order to determine how quickly the electrodes actually picked up moisture, a second study was performed using two of the second-round electrodes with exposure times ranging from 4 to 24 hours. The results are presented in Table 8 and shown graphically in Figure 49. It is clear from both the data and the graph that the time it takes for the moisture to get back to the as-received level is quite short, less than 4 hours. In fact, extrapolation would tend to indicate that the as-received moisture level is probably reached within about an hour. 4.4 Environmental Exposure Testing Environmental conditions from a variety of locations around the world were simulated based on the grains of moisture per pound of dry air for each temperature and humidity level. A humidity cabinet was used to duplicate those conditions for times ranging from 2 to 10 hours. Products from each of the manufacturers were tested, all of which were of the E8010-type. In each case, the product was procured directly from the manufacturer in order to ensure that it was all within specification limits. The details of the times and conditions selected are shown in Table 9. The results are shown in Table 10.
14
Because the range of settings available in the humidity cabinet which was used for the simulations is limited, some of the extreme conditions of temperature and humidity could not be easily duplicated. For this reason, the simulations were based on grains of moisture per pound of dry air rather than actual temperature and relative humidity. However, it appears that the temperature at which a given relative humidity is measured may be more important than the actual number of grains of moisture in the air. For this reason, additional testing was performed. Three additional combinations of temperature and relative humidity were selected, all of which resulted in a moisture level of 65 grains per pound of dry air. The temperatures ranged from 16 to 43°C (60 to 110°F). The original run at 65 grains of moisture was done at 24°C (75°F). All of the 65 grains of moisture tests were done for a period of 8 hours. Additionally, two tests were done to simulate the extremes of exposure conditions: in one case, the open cans of electrodes were placed in a freezer overnight; in the other case, the open cans of electrodes were placed under a heat lamp to simulate intense sunlight. In both of these cases, the exposure time was 24 hours. It was noted that the temperature inside the opened can for the sun exposure experiment reached over 49°C (120°F). Results of all the testing are provided in Table 10 and Table 12. The details of the DOE test conditions are shown in Table 11. As expected, high temperatures and low relative humidities had the most dramatic effect on the moisture content of the electrodes. However, even at 43°C (110°F) and 16% relative humidity, the change in coating moisture was relatively minor as compared with the as-received moisture. For equivalent grains of moisture in the air at lower temperatures and higher relative humidity levels the coating moisture generally increased. The sun exposure testing showed the largest drop in coating moisture content. The results indicate that care should be taken to store electrodes in a shaded area when welding is being done throughout the day, especially in warmer climates. Also, unused electrodes which have experienced prolonged exposure to heat or sun should be discarded. It is clear from the initial testing in which electrodes were exposed to different environmental conditions that the likelihood of the electrodes picking up moisture is at least as high as the likelihood of the electrodes drying out. Although the ramifications of welding with a cellulosic electrode which is above the recommended moisture content may not be as serious as welding with cellulosic electrodes that are overly dry, there may still be cause for concern. As was seen in the rehydration study, in some cases, electrodes which were high in moisture had poor elongation and greater cracking tendencies. In order to ensure that electrodes are within the manufacturers’ specification limits, it is recommended that they be kept in sealed containers

15
until they are ready for use, and that electrodes that have been exposed for more than 8 hours to either very dry or very humid conditions be discarded. 4.5 Power Source Effects Groove welds were made with both an inverter power supply and a motor generator power supply using electrodes in the as-received and dried conditions in order to determine what effect the type of power source might have on the weld properties and cracking susceptibility. The Lincoln ShieldArc 70+ and Hobart Pipemaster 80 (both E8010 types) were chosen for this study. Electrodes were procured directly from the manufacturers to ensure that they were within specification limits in the as-received condition. All welds were made using a medium arc length. Again, the restrained welds were tested in a manner similar to the earlier welds. The mechanical test and chemistry results are summarized in Table 13. On initial testing, the welds made using dried electrodes with the inverter exhibited low strength and evidence of hydrogen damage. It was unclear if this was a result of differences between the power sources, or if it was simply because of the high hydrogen content of the welds. A second set of test welds was ordered in an effort to determine whether the differences were real. The results of the retests are also listed in Table 13. The retest of the Hobart electrode again exhibited low strength and hydrogen damage. The strength level for the re-weld made using the Lincoln electrode was comparable to that of the weld made using the motor generator. A third set of retests were ordered for the Hobart product, again using the dried electrodes and the inverter power source. While the strength was somewhat higher than on previous testing, the elongation was again low and there were indications of hydrogen damage. It appears that the welds made using the inverter and certain manufacturer’s electrodes may be somewhat more sensitive to hydrogen damage than those made using the motor-generator, additional testing would be required to say this conclusively. Additional testing is also necessary to determine exactly which cellulosic electrodes are most susceptible to the differences in the power sources. Differences in chemistry and strength level (for non-hydrogen-damaged weld metal) for the two types of power sources were insignificant and within experimental error. It was noted that the chemical analyses for the Lincoln ShieldArc 70+ electrodes which were procured for the power source study indicated much higher levels of carbon and manganese for the product in both the as-received and dried conditions than had been noted for the original lot

16
that was tested. It is unlikely that this is a power source effect, since the same inverter was used to make the original welds. It appears that this is simply lot-to-lot variation. It was also notable that the change in chemistry which occurred as a result of drying this lot of ShieldArc 70+ was much more dramatic than for the previous lot. An increase of about 25% in the IIW CE was noted for the dried electrodes using both the inverter and the motor generator, as compared to a change of about 17% for the medium arc length in the previous testing. This would tend to explain why the strength levels measured for the dried electrodes in the power-source study were significantly higher than for the initial evaluation, and why there was a greater tendency for hydrogen damage.
5.0 Safe Handling Guidelines In the arc, cellulose breaks down to form CO, CO2 and water vapor, which is thought to provide the characteristic driving arc. Very dry conditions and/or low temperature baking will cause the cellulose to begin to break down. The result is that there is less oxygen available to react with the manganese and silicon in the electrode. The loss of water vapor results in a less driving arc and the transfer tends to become more globular in nature. Drying the electrodes results in a lower voltage for a given arc length. All of these factors contribute to higher alloy recovery when dried electrodes are used. The higher alloy recovery can lead to increased weld-metal strength and increased cracking tendencies. Rehydrating electrodes by placing them in a humidity cabinet or dipping them in water does not reconstitute the cellulose. The moisture adsorbed during rehydrating does not necessarily result in reduced alloy recovery and may result in increased cracking tendencies. Rehydration is difficult to control and is not a viable option for restoring as-received chemistry or mechanical properties. In order to reduce the likelihood of cracking and other problems associated with improper electrode storage, the following guidelines should be observed.
• If possible, cellulosic electrodes should be purchased in small, hermetically-sealed packages.
• Electrodes should be stored in cool, dry locations, and should not be exposed to direct sunlight.
• Preheat and interpass temperature recommendations should be strictly adhered to, and if possible, a post-weld hydrogen bake-out should be utilized.
• For steels of grade X70 and above, the conservative approach is to use low-hydrogen electrodes, GMAW, or FCAW.

17
• If cellulosic electrodes must be used for these higher-strength steels, the lowest grade which will produce adequate strength for the intended application should be chosen.
• Placing dried electrodes in humidity cabinets or dipping them in water is not recommended.
• Electrodes which have been exposed to overly dry or overly humid conditions should be discarded.
6.0 Summary and Conclusions Electrodes of the EX010 classification are often referred to as cellulosic because one of the primary ingredients in the coating is cellulose. Cellulose is a long-chain organic material comprised of carbon, hydrogen, and oxygen. When cellulose breaks down in the arc, it forms carbon monoxide, carbon dioxide, and water vapor. The carbon dioxide acts to shield the arc, and the water vapor may act to give the cellulosic electrode its characteristic driving arc. In addition to cellulose, the coating may also contain clays and other sources of high temperature water. When the electrode coating is exposed to very dry conditions or low temperature baking, the cellulose will begin to break down. The result is that there is less oxygen present in the coating, which means there is less oxygen available to react with the carbon and the deoxidizing agents which are present in the electrode. As a result, the deposit carbon, manganese, and silicon typically increase when the electrode coating has been dried out. Having less moisture in the coating also causes the transfer to become more globular in nature. This, and the drop in voltage which was also noted when the electrodes are dry, also contribute to an increase in alloy recovery. While drying the electrodes results in degradation of the cellulose and a decrease in low temperature water, it would generally not affect any high-temperature water present in the electrodes. For this reason, drying affects different electrode formulations differently. Rehydrating the electrodes may increase the surface moisture, but it will not recompose the cellulose. The surface moisture will evaporate more readily and will not necessarily interact with the arc in the same manner as moisture that is tied up in the cellulose. For this reason, manufacturers do not recommend attempting to rehydrate their electrodes. Furthermore, as was seen in the time study for rehydration, moisture pick-up occurs very quickly, and it may be difficult to control it precisely. In general, a better option than rehydrating is to purchase electrodes in small containers and to discard electrodes that may have been exposed to adverse environmental conditions. Often when a cellulosic electrode has been exposed to very dry conditions, the welder will notice differences in operation, primarily in the amount of drive in the arc. It is not unusual to

18
hear of welders wrapping cellulosic electrodes in wet rags or even dipping them in water in an effort to restore the as-manufactured operating characteristics. In fact, the change in arc characteristics should serve as a warning, indicating that the electrodes should be discarded. While adding surface moisture to the electrode may improve the operation somewhat, it will not restore the deposit chemistry or properties to those for the as-manufactured condition, and will likely increase the likelihood of hydrogen damage or cracking. The best practice is to purchase electrodes in small, preferably hermetically sealed containers, and discard any unused product at the end of the workday or shift, especially if the worksite is in a dry or sunny, hot location. If possible, opened containers should be kept in cool, shaded locations. It was also found that excessive moisture in cellulosic electrodes can be a potential problem. Of particular concern is the fact that cellulosic electrodes pick up moisture quickly, and may be well above the as-manufactured moisture content in less than 4 hours. For this reason, cellulosic electrodes should also be protected from exposure to humid conditions. Electrodes which have been exposed to high humidity should be discarded. Again, purchasing electrodes in small containers will help reduce the likelihood of overexposure to environmental conditions. And finally, under no circumstances, should cellulosic electrodes ever be dried or stored in an electrode drying oven. While proper handling may help to reduce the risk of hydrogen cracking in welds made using cellulosic electrodes, past experience indicates that extreme caution should be exercised when applying these electrodes to low-alloy steels. For steels of grade X70 and above, the conservative approach is to use low-hydrogen electrodes, GMAW, or FCAW. If cellulosic electrodes must be used for these higher-strength steels, the lowest grade which will produce adequate strength for the intended application should be chosen. Preheat and interpass temperature recommendations should be strictly adhered to, and if possible, a post-weld hydrogen bake-out should be utilized. Electrodes should be stored in cool, dry locations, and should not be exposed to direct sunlight. Any electrodes which have been exposed to hot, dry conditions, or very humid conditions should be discarded.

19
7.0 References 1. Johnson, M. Q., Reynolds, J., Ramirez, J., and Bruce, W. A., “Limitations of Cellulosic-
Coated Electrodes,” PRCI Contract No. PR-185-9909. 2. Harasawa, H., Ikoma, T., and Namioka, T., ”Prevention of Cold Cracking in Pipeline Girth
Welding by the Use of High-Cellulose Electrodes,” Welding and Performance of Pipelines, Proceedings: 3rd International Conference, London, Ed: P. H. M. Hart, Abington Publishing, TWI, Paper 58, Nov. 18-21, 1986.
3. Perteneder, E. and Konigshofer, H., “Capabilities and Limitations of Cellulosic Electrodes: A
Producer’s Perspective,” Proceedings: 1st International Conference, Wollongong, Ed: L. Fletcher, Publ: Silverwater, NSW 2128, Australia, Welding Technology Institute of Australia (WTIA), March 1-2, 1999.
4. Bailey, N., Coe, F. R., Gooch, T. G., Hart, P. H. M., Jenkins, N., and Pargeter, R. J.,
“Welding Steel without Hydrogen Cracking”, 2nd Edition, Abington Publishing, TWI, 1993. 5. Graville, B. A., “The Principles of Cold Cracking Control in Welds”, published by Dominion
Bridge, April 1975. 6. Yurioka, N., Kasuya, T., and Okumura, M., “Methods for Predicting Maximum Hardness of
Heat-Affected Zone and Selecting Necessary Preheat Temperature for Steel Welding,” Nippon Steel Technical Report No. 65, pp 7-14, April 1995.
7. Yurioka, N. and Kasuya, T., “A Chart Method to Determine the Necessary Preheat in Steel
Welding,” Welding in the World/Soudage dans le Monde, 35(5)m pp. 327-334, Sept./Oct. 1995.

20
Table 1. Cellulosic-Coated Electrodes Used During the Project
Manufacture Trade Name AWS Classification Sureweld 10P E6010
Sureweld 10P+ E6010 Sureweld 710P E7010 P1 ESAB
Sureweld 810P E8010 P1 Fleetweld 5P E6010
Fleetweld 5P+ E6010 Shield Arc HYP+ E7010 P1
Shield Arc 80 E8010 P1 Shield Arc 70+ E8010 G
Lincoln Electric
Shield Arc 90 E9010 G Pipemaster 60 E6010
Pipemaster Pro-60 E6010 Pipemaster 70 E7010 P1
Pipemaster Pro-70 E7010 P1 Pipemaster 80 E8010 P1
Pipemaster Pro-80 E8010 P1
Hobart
Pipemaster 90(a) E9010 G (a) The Hobart Pipemaster 90 was never received.

21
Table 2. Coating Moisture, Carbon Content, Manganese Content, and Silicon Content of the As-Received versus Dried Electrodes
Coating Moisture,
wt% Carbon, wt% Manganese, wt% Silicon, wt% Electrodes*
AR Dry % Change AR Dry %
Change AR Dry % Change AR Dry %
Change ESAB Sureweld 10P 6.67 1.10 -83.5% 0.13 0.14 7.7% 0.43 0.72 67.4% 0.20 0.45 125.0% Lincoln Fleetweld 5P 2.13 0.73 -65.7% 0.12 0.10 -16.7% 0.51 0.57 11.8% 0.28 0.33 17.9% Hobart Pipemaster 60 5.06 0.84 -83.4% 0.11 0.12 9.1% 0.26 0.33 26.9% 0.12 0.18 50.0% ESAB Sureweld 10P+ 4.41 0.94 -78.7% 0.19 0.17 -10.5% 0.78 0.90 15.4% 0.24 0.32 33.3% Lincoln Fleetweld 5P+ 1.72 0.71 -58.7% 0.17 0.15 -11.8% 0.60 0.68 13.3% 0.20 0.27 35.0%
Hobart Pipemaster Pro-60 4.43 1.30 -70.7% 0.12 0.13 8.3% 0.38 0.5 31.6% 0.19 0.29 52.6%
6010
ESAB Sureweld 710P 1.81 1.02 -43.6% 0.13 0.09 -30.8% 0.53 0.57 7.5% 0.28 0.35 25.0%
Lincoln Shield Arc HYP+ 4.04 0.49 -87.9% 0.15 0.13 -13.3% 0.58 0.87 50.0% 0.18 0.37 105.6% Hobart Pipemaster 70 3.98 1.08 -72.9% 0.13 0.14 7.7% 0.68 0.79 16.2% 0.19 0.26 36.8%
Hobart Pipemaster Pro-70 0.58 0.47 -19.0% 0.11 0.10 -9.1% 0.75 0.67 -10.7% 0.27 0.22 -18.5% 7010
ESAB Sureweld 810P 2.69 1.26 -53.2% 0.12 0.10 -16.7% 0.83 0.86 3.6% 0.43 0.45 4.7% Lincoln Shield Arc 80 1.64 0.53 -67.7% 0.12 0.12 0.0% 0.78 0.95 21.8% 0.27 0.36 33.3% Hobart Pipemaster 80 3.31 0.57 -82.8% 0.14 0.15 7.1% 0.75 1.11 48.0% 0.18 0.33 83.3%
Hobart Pipemaster Pro-80 3.52 0.93 -73.6% 0.11 n/a n/a 0.51 n/a n/a 0.14 n/a n/a Lincoln Shield Arc 70+ 4.09 0.49 -88.0% 0.13 0.10 -23.1% 0.70 1.10 57.1% 0.16 0.36 125.0%
8010
Lincoln Shield Arc 90 3.24 0.53 -83.6% 0.11 0.09 -18.2% 0.53 0.85 60.4% 0.13 0.33 153.8%
9010
*Electrodes highlighted in yellow are those selected for additional testing.

22
Table 3. Complete Chemical Analysis Results for All Electrodes Tested Product Class. Cond
. Moist. (wt%) C Mn Si P S Cr Ni Mo Cu V Ti
CE (IIW) CEN
AR 6.67 0.13 0.43 0.20 0.006 0.010 0.05 0.07 <0.01 0.04 0.007 0.013 0.220 0.208 Dried 1.10 0.14 0.72 0.45 0.007 0.009 0.05 0.07 <0.01 0.04 0.010 0.021 0.279 0.273 ESAB SW 10P E6010
RH 13.13 0.14 0.69 0.47 0.006 0.006 0.06 0.07 <0.01 0.06 0.010 0.021 0.278 0.272 AR 2.13 0.12 0.51 0.28 0.009 0.005 0.04 0.03 <0.01 0.01 0.004 0.016 0.216 0.201 Lincoln FW 5P E6010 Dried 0.73 0.10 0.57 0.33 0.010 0.005 0.04 0.03 <0.01 0.02 0.005 0.019 0.207 0.180 AR 5.06 0.11 0.26 0.12 0.007 0.009 0.03 0.02 <0.01 0.06 0.005 0.010 0.166 0.152 Hobart PM 60 E6010 Dried 0.84 0.12 0.33 0.18 0.007 0.009 0.03 0.02 <0.01 0.06 0.006 0.015 0.188 0.176 AR 4.41 0.19 0.78 0.24 0.012 0.008 0.04 0.04 <0.01 0.02 0.012 0.020 0.334 0.340 ESAB SW 10P+ E6010 Dried 0.94 0.17 0.90 0.32 0.013 0.008 0.04 0.04 <0.01 0.02 0.013 0.023 0.335 0.337 AR 1.72 0.17 0.60 0.20 0.010 0.011 0.03 0.01 <0.01 0.01 0.004 0.020 0.278 0.280 Lincoln FW 5P+ E6010 Dried 0.71 0.15 0.68 0.27 0.011 0.010 0.03 0.01 <0.01 <0.01 0.004 0.022 0.271 0.267 AR 4.43 0.12 0.38 0.19 0.010 0.014 0.04 0.04 <0.01 0.04 0.012 0.016 0.199 0.185 Dried 1.30 0.13 0.50 0.29 0.009 0.014 0.04 0.04 <0.01 0.04 0.013 0.021 0.229 0.218 Hobart PM Pro-60 E6010
RH 11.35 0.11 0.43 0.22 0.009 0.007 0.04 0.05 <0.01 0.04 0.011 0.012 0.198 0.177 AR 1.81 0.13 0.53 0.28 0.011 0.008 0.04 0.50 0.27 0.02 0.010 0.017 0.317 0.282 ESAB SW 710P E7010 P1 Dried 1.02 0.09 0.57 0.35 0.010 0.008 0.04 0.52 0.29 0.03 0.009 0.017 0.289 0.216 AR 4.04 0.15 0.58 0.18 0.009 0.006 0.02 0.02 0.29 0.04 0.002 0.015 0.313 0.301 Dried 0.49 0.13 0.87 0.37 0.009 0.006 0.02 0.02 0.28 0.05 0.002 0.025 0.340 0.310 Lincoln SA HYP+ E7010 P1
RH 11.21 0.14 0.48 0.15 0.009 0.007 0.03 0.04 0.23 0.10 0.002 0.013 0.282 0.264 AR 3.98 0.13 0.68 0.19 0.008 0.009 0.06 0.80 <0.01 0.05 0.010 0.018 0.314 0.273 Dried 1.08 0.14 0.79 0.26 0.008 0.009 0.06 0.79 <0.01 0.05 0.010 0.023 0.342 0.309 Hobart PM 70 E7010 P1
RH 9.91 0.16 0.97 0.35 0.008 0.004 0.06 0.78 <0.01 0.04 0.010 0.028 0.385 0.364 AR 0.58 0.11 0.75 0.27 0.008 0.010 0.06 0.07 0.30 0.03 0.007 0.018 0.315 0.261 Hobart PM Pro-70 E7010 P1 Dried 0.47 0.10 0.67 0.22 0.008 0.011 0.06 0.08 0.32 0.03 0.007 0.014 0.296 0.234

23
Table 3. (Continued) Product Class. Cond
. Moist. (wt%) C Mn Si P S Cr Ni Mo Cu V Ti
CE (IIW) CEN
AR 2.69 0.12 0.83 0.43 0.009 0.006 0.08 0.84 0.08 <0.01 0.003 0.019 0.347 0.293 ESAB SW 810P E8010-P1 Dried 1.26 0.10 0.86 0.45 0.009 0.005 0.08 0.82 0.08 <0.01 0.004 0.018 0.331 0.255 AR 1.64 0.12 0.78 0.27 0.006 0.007 0.03 0.76 0.22 0.01 0.002 0.019 0.352 0.293 Lincoln SA 80 E8010-P1 Dried 0.53 0.12 0.95 0.36 0.005 0.006 0.03 0.77 0.22 0.02 0.003 0.019 0.382 0.318 AR 3.31 0.14 0.75 0.18 0.008 0.008 0.06 0.84 0.16 0.04 0.009 0.014 0.369 0.328 Dried 0.57 0.15 1.11 0.33 0.008 0.007 0.06 0.82 0.15 0.04 0.010 0.028 0.436 0.403 Hobart PM 80 E8010-P1
RH 9.06 0.16 0.96 0.31 0.008 0.005 0.06 0.77 0.14 0.06 0.010 0.027 0.417 0.396 AR 3.52 0.11 0.51 0.14 0.008 0.007 0.03 0.03 0.25 0.07 0.004 0.012 0.258 0.218 Hobart PM Pro-80* E8010-P1 Dried 0.93 AR 4.09 0.13 0.70 0.16 0.009 0.007 0.03 0.89 0.06 0.02 <0.001 0.013 0.325 0.280 Dried 0.49 0.10 1.10 0.36 0.010 0.006 0.03 0.88 0.06 0.02 <0.001 0.020 0.361 0.271 Lincoln SA 70+ E8010-G
RH 11.43 0.14 0.70 0.16 0.010 0.005 0.04 0.83 0.06 0.03 0.001 0.013 0.334 0.298 AR 3.24 0.11 0.53 0.13 0.007 0.008 0.03 0.76 0.52 <0.01 0.002 0.011 0.359 0.280 Dried 0.53 0.09 0.85 0.33 0.007 0.007 0.04 0.79 0.52 <0.01 0.002 0.023 0.397 0.279 Lincoln SA 90 E9010-G
RH 13.12 0.13 0.71 0.24 0.007 0.005 0.04 0.79 0.53 0.01 0.003 0.021 0.416 0.356 *Unusable as dried

24
Table 4. Chemistry and Mechanical Property Results for Seven Down-Selected Electrodes
Des. Class. Cond. Arc Length
UTS (ksi)
YS (ksi)
% El.
% RA C Mn Si P S Cr Ni Mo Nb Cu V Ti CE
(IIW) CEN
AR Short 88.9 70.4 20.7 45.4 0.15 0.64 0.44 0.005 0.010 0.055 0.071 0.002 0.004 0.042 0.009 0.020 0.277 0.277 Dried Short 87.2 72.2 30 66.3 0.16 0.73 0.67 0.006 0.010 0.053 0.069 0.002 0.006 0.041 0.011 0.021 0.302 0.314 RH Short 87.6 72.1 32.1 66.6 0.14 0.78 0.57 0.013 0.011 0.065 0.075 <0.01 <0.01 0.051 0.014 0.018 0.294 0.289 AR Medium 92.9 76.8 33.3 63.7 0.13 0.78 0.54 0.013 0.010 0.062 0.074 <0.01 <0.01 0.050 0.018 0.001 0.284 0.270 Dried Medium 94.9 79.2 27 59.1 0.14 0.85 0.66 0.011 0.010 0.064 0.073 <0.01 <0.01 0.050 0.015 0.024 0.306 0.302
ES
AB
SW
10P
E601
0
RH Medium 91.2 77.0 30.4 63.2 0.10 0.90 0.73 0.011 0.010 0.069 0.072 <0.01 <0.01 0.050 0.015 0.018 0.275 0.234 AR Short 80.7 65.4 28.6 62.4 0.17 0.50 0.26 0.009 0.012 0.037 0.040 0.007 0.004 0.023 0.012 0.013 0.267 0.271 Dried Short 95.1 77.8 22.1 36.0 0.19 0.78 0.69 0.007 0.010 0.038 0.041 0.006 0.008 0.025 0.015 0.032 0.335 0.358 RH Short 87.5 71.5 20.8 58.3 0.18 0.71 0.45 0.014 0.012 0.044 0.044 <0.01 <0.01 0.030 0.018 0.025 0.316 0.327 AR Medium 85.9 70.6 31.3 68.8 0.14 0.61 0.26 0.016 0.010 0.039 0.040 <0.01 <0.01 0.028 0.022 <0.01 0.258 0.249 Dried Medium 93.6 77.0 32.6 65.9 0.15 0.74 0.77 0.008 0.010 0.030 0.036 0.004 0.007 0.025 0.015 0.027 0.286 0.298
Hob
art P
M P
ro-6
0
E601
0
RH Medium 87.0 72.0 23.7 67.3 0.15 0.68 0.69 0.008 0.011 0.035 0.038 0.004 0.007 0.025 0.015 0.031 0.278 0.288 AR Short 89.7 72.8 23.2 57.8 0.16 0.69 0.33 0.012 0.006 0.015 0.020 0.26 <0.01 0.040 <0.01 0.057 0.282 0.284 Dried Short 98.3 83.1 18.2 31.8 0.17 0.83 0.46 0.011 0.005 0.017 0.019 0.33 0.004 0.042 0.008 0.032 0.317 0.326 RH Short 92.2 75.1 32.5 59.1 0.15 0.70 0.35 0.009 0.004 0.020 0.018 0.34 0.004 0.036 0.007 0.014 0.276 0.274 AR Medium 92.7 72.5 24.4 50.1 0.12 0.67 0.22 0.018 0.006 0.016 0.021 0.25 <0.01 0.045 0.011 <0.01 0.241 0.218 Dried Medium 96.1 77.1 27.9 62.9 0.13 0.95 0.46 0.017 0.006 0.018 0.020 0.25 <0.01 0.044 <0.01 0.016 0.296 0.278
Linc
oln
SA H
YP+
E701
0 P1
RH Medium 89.2 68.0 30.4 43.6 0.11 0.86 0.51 0.010 0.006 0.014 0.015 0.37 0.002 0.039 0.004 0.015 0.261 0.230 AR Short 95.6 78.7 23.9 63.4 0.19 0.93 0.28 0.013 0.009 0.064 0.66 <0.01 <0.01 0.036 0.015 0.015 0.407 0.402 Dried Short 102.4 83.3 28.9 63.7 0.18 1.11 0.47 0.015 0.008 0.068 0.74 <0.01 <0.01 0.042 0.015 0.018 0.434 0.430 RH Short 104.7 88.0 24 37.2 0.17 0.96 0.35 0.013 0.009 0.067 0.70 <0.01 <0.01 0.038 0.013 0.016 0.395 0.385 AR Medium 95.3 75.6 40.3 68.1 0.14 0.82 0.55 0.001 0.008 0.093 0.45 <0.01 <0.01 0.021 0.033 0.039 0.333 0.316 Dried Medium 97.3 78.6 30.5 62.2 0.16 1.21 0.52 0.016 0.008 0.067 0.68 <0.01 <0.01 0.038 0.020 0.021 0.427 0.414 H
obar
t PM
70
E701
0 P1
RH Medium 103.1 84.0 29 66.6 0.15 1.16 0.50 0.007 0.008 0.075 0.68 0.002 0.006 0.038 0.016 0.038 0.409 0.388

25
Table 4. (Continued)
AR Short 102.2 84.0 22 58.8 0.20 1.03 0.30 0.014 0.009 0.079 0.69 0.16 <0.01 0.047 0.015 0.019 0.440 0.436 Dried Short 108.7 88.6 26.1 65.2 0.21 1.06 0.30 0.006 0.010 0.072 0.62 0.20 0.007 0.033 0.012 0.021 0.447 0.446 RH Short 104.4 89.4 12.7 34.2 0.18 1.17 0.43 0.013 0.009 0.079 0.73 0.14 <0.01 0.048 0.016 0.022 0.446 0.440 AR Medium 102.7 83.8 26.4 64.4 0.16 0.82 0.19 0.017 0.010 0.083 0.75 0.14 <0.01 0.051 0.014 <0.01 0.369 0.348 Dried Medium 68 61.8 5 12.3 0.17 1.33 0.55 0.015 0.009 0.083 0.77 0.15 <0.01 0.052 0.016 0.028 0.466 0.458 Dried-retest Medium 108.4 86.1 23.9 60.6 0.18 0.97 0.34 0.006 0.010 0.068 0.60 0.19 0.006 0.034 0.012 0.017 0.400 0.395 H
obar
t PM
80
E801
0-P1
RH Medium 107.8 89.5 10.7 25.5 0.14 1.14 0.40 0.015 0.009 0.079 0.73 0.14 <0.01 0.049 0.017 0.020 0.401 0.364 AR Short 86.2 69.6 27.3 64.4 0.17 1.03 0.29 0.016 0.007 0.034 0.75 0.044 <0.01 0.026 <0.01 0.011 0.400 0.386 Dried Short 103.6 86.6 26 63.4 0.15 1.23 0.46 0.016 0.007 0.033 0.76 0.056 <0.01 0.027 <0.01 0.017 0.414 0.389 RH Short 83.4 69.4 27.7 65.9 0.14 0.96 0.27 0.019 0.008 0.039 0.82 0.05 <0.01 0.029 <0.01 0.011 0.364 0.328 AR Medium 86.1 68.7 34.1 72.1 0.12 0.76 0.29 0.010 0.007 0.027 0.85 0.074 0.001 0.023 0.004 0.009 0.311 0.262 Dried Medium 94.4 76.1 31.7 52.2 0.098 1.24 0.45 0.016 0.007 0.035 0.77 0.052 <0.01 0.028 <0.01 0.012 0.365 0.274
Linc
oln
SA 7
0+
E80
10-G
RH Medium 86.9 69.9 27.8 52.5 0.10 0.91 0.40 0.011 0.007 0.033 0.66 0.075 0.002 0.027 0.005 0.018 0.305 0.238 AR Short 96.3 81.3 31.2 66.6 0.12 0.82 0.25 0.014 0.008 0.032 0.66 0.48 <0.01 0.011 0.011 <0.01 0.310 0.262 Dried Short 109.9 90.0 30.2 63.4 0.15 0.96 0.50 0.008 0.009 0.034 0.72 0.69 0.002 0.011 0.004 0.028 0.366 0.349 RH Short 106.3 89.1 25.8 59.4 0.13 0.98 0.40 0.013 0.008 0.034 0.69 0.49 <0.01 0.034 <0.01 0.019 0.348 0.309 AR Medium 96.9 79.0 35.1 64.4 0.099 0.95 0.46 0.008 0.008 0.028 0.61 0.62 0.004 0.010 0.007 0.019 0.306 0.239 Dried Medium 108.8 87.0 32.9 61.2 0.11 1.10 0.50 0.017 0.009 0.035 0.70 0.49 <0.01 0.012 0.012 0.020 0.350 0.285 Li
ncol
n SA
90
E90
10-G
RH Medium 103.2 90.2 31.9 55.6 0.099 0.83 0.55 0.009 0.008 0.029 0.68 0.65 0.002 0.009 0.005 0.020 0.290 0.231
Des. Class. Cond. Arc Length
UTS (ksi)
YS (ksi)
% El.
% RA C Mn Si P S Cr Ni Mo Nb Cu V Ti CE
(IIW) CEN

26
Table 5. Chemistry Results for Short and Long Arc Lengths for Electrodes in the As-Received and Dried Condition
Product Class. Cond.
Arc Length C Mn Si P S Cr Ni Mo Nb Cu V Ti CE
(IIW) CEN
AR Short 0.13 0.51 0.28 0.012 0.009 0.020 0.020 <0.010 0.005 0.070 0.005 0.012 0.226 0.216 Dried Short 0.18 0.62 0.34 0.011 0.009 0.020 0.020 <0.010 0.006 0.070 0.005 0.017 0.294 0.303 AR Long 0.13 0.49 0.27 0.012 0.009 0.020 0.020 <0.010 0.005 0.070 0.005 0.009 0.223 0.213
ES
AB
SW
10
P
E601
0
Dried Long 0.12 0.67 0.47 0.012 0.009 0.020 0.020 <0.010 0.006 0.070 0.006 0.016 0.243 0.227 AR Short 0.17 0.58 0.40 0.011 0.007 0.060 0.080 <0.010 0.007 0.050 0.013 0.022 0.290 0.297 Dried Short 0.16 0.55 0.38 0.011 0.006 0.060 0.070 <0.010 0.007 0.050 0.012 0.024 0.274 0.278 AR Long 0.10 0.50 0.35 0.011 0.007 0.060 0.070 <0.010 0.006 0.050 0.012 0.016 0.206 0.178
Hob
art P
M
Pro-
60
E601
0
Dried Long 0.09 0.49 0.33 0.011 0.007 0.060 0.080 <0.010 0.006 0.070 0.012 0.018 0.196 0.163 AR Short 0.18 0.59 0.23 0.012 0.010 0.020 0.020 0.291 0.003 0.040 0.001 0.015 0.287 0.291 Dried Short 0.16 0.78 0.37 0.012 0.010 0.020 0.020 0.299 0.004 0.050 0.001 0.025 0.299 0.301 AR Long 0.10 0.60 0.22 0.012 0.010 0.020 0.020 0.286 0.003 0.050 0.001 0.011 0.209 0.177
Linc
oln
SA
HY
P+
E701
0 P1
Dried Long 0.10 0.76 0.33 0.011 0.009 0.020 0.020 0.298 0.004 0.050 0.001 0.014 0.236 0.198 AR Short 0.16 0.60 0.18 0.008 0.012 0.040 0.75 <0.010 0.005 0.060 0.007 0.016 0.323 0.305 Dried Short 0.16 0.80 0.32 0.009 0.012 0.050 0.75 <0.010 0.006 0.060 0.009 0.025 0.359 0.343 AR Long 0.05 0.52 0.14 0.009 0.013 0.040 0.74 <0.010 0.004 0.060 0.007 0.007 0.199 0.126
Hob
art P
M
70
E701
0 P1
Dried Long 0.08 0.66 0.23 0.009 0.012 0.050 0.74 <0.010 0.005 0.060 0.008 0.018 0.255 0.181 AR Short 0.17 0.75 0.20 0.012 0.011 0.040 0.86 0.143 0.005 0.060 0.008 0.016 0.366 0.349 Dried Short 0.18 0.98 0.34 0.012 0.008 0.030 0.81 0.131 0.007 0.050 0.008 0.034 0.408 0.399 AR Long 0.10 0.78 0.20 0.011 0.009 0.040 0.85 0.134 0.005 0.060 0.008 0.014 0.300 0.227
Hob
art P
M
80
E801
0-P1
Dried Long 0.11 1.02 0.33 0.012 0.008 0.040 0.85 0.134 0.006 0.050 0.009 0.017 0.350 0.278 AR Short 0.15 0.81 0.22 0.010 0.004 0.020 0.85 0.062 0.003 0.030 0.001 0.016 0.348 0.321 Dried Short 0.14 1.00 0.33 0.010 0.004 0.020 0.87 0.063 0.003 0.030 0.001 0.021 0.371 0.334 AR Long 0.09 0.59 0.14 0.010 0.005 0.020 0.87 0.062 0.003 0.030 0.001 0.011 0.253 0.185
Linc
oln
SA
70+
E80
10-G
Dried Long 0.06 0.99 0.31 0.010 0.004 0.020 0.85 0.057 0.003 0.030 0.001 0.018 0.288 0.183 AR Short 0.12 0.58 0.15 0.010 0.007 0.030 0.73 0.475 0.003 0.020 0.001 0.012 0.273 0.230 Dried Short 0.14 0.77 0.29 0.010 0.007 0.030 0.73 0.478 0.003 0.020 0.001 0.024 0.325 0.296 AR Long 0.08 0.58 0.17 0.011 0.007 0.030 0.77 0.486 0.003 0.010 0.001 0.010 0.235 0.167
Linc
oln
SA
90
E90
10-G
Dried Long 0.08 0.84 0.31 0.010 0.007 0.030 0.78 0.494 0.004 0.020 0.001 0.016 0.280 0.196
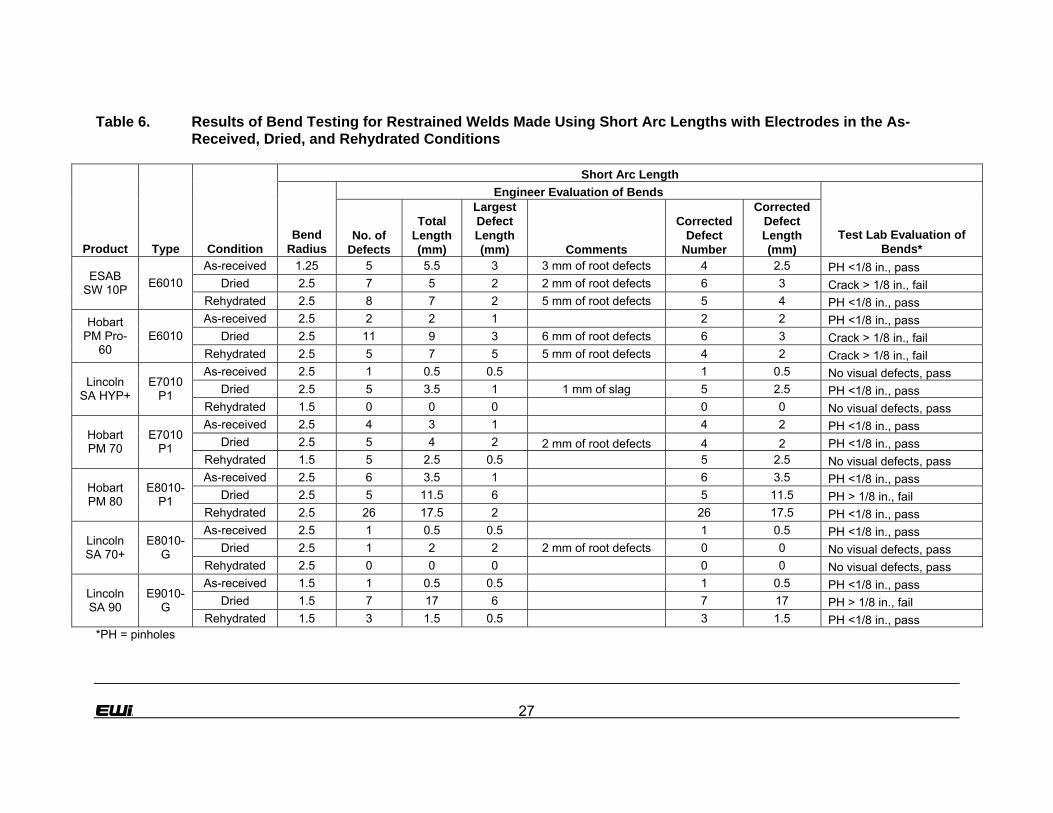
27
Table 6. Results of Bend Testing for Restrained Welds Made Using Short Arc Lengths with Electrodes in the As-Received, Dried, and Rehydrated Conditions
Short Arc Length
Engineer Evaluation of Bends
Product Type Condition Bend
Radius No. of
Defects
Total Length (mm)
Largest Defect Length (mm) Comments
Corrected Defect
Number
Corrected Defect Length (mm)
Test Lab Evaluation of Bends*
As-received 1.25 5 5.5 3 3 mm of root defects 4 2.5 PH <1/8 in., pass Dried 2.5 7 5 2 2 mm of root defects 6 3 Crack > 1/8 in., fail
ESAB SW 10P E6010
Rehydrated 2.5 8 7 2 5 mm of root defects 5 4 PH <1/8 in., pass As-received 2.5 2 2 1 2 2 PH <1/8 in., pass
Dried 2.5 11 9 3 6 mm of root defects 6 3 Crack > 1/8 in., fail Hobart
PM Pro-60
E6010 Rehydrated 2.5 5 7 5 5 mm of root defects 4 2 Crack > 1/8 in., fail As-received 2.5 1 0.5 0.5 1 0.5 No visual defects, pass
Dried 2.5 5 3.5 1 1 mm of slag 5 2.5 PH <1/8 in., pass Lincoln
SA HYP+ E7010
P1 Rehydrated 1.5 0 0 0 0 0 No visual defects, pass As-received 2.5 4 3 1 4 2 PH <1/8 in., pass
Dried 2.5 5 4 2 2 mm of root defects 4 2 PH <1/8 in., pass Hobart PM 70
E7010 P1
Rehydrated 1.5 5 2.5 0.5 5 2.5 No visual defects, pass As-received 2.5 6 3.5 1 6 3.5 PH <1/8 in., pass
Dried 2.5 5 11.5 6 5 11.5 PH > 1/8 in., fail Hobart PM 80
E8010-P1
Rehydrated 2.5 26 17.5 2 26 17.5 PH <1/8 in., pass As-received 2.5 1 0.5 0.5 1 0.5 PH <1/8 in., pass
Dried 2.5 1 2 2 2 mm of root defects 0 0 No visual defects, pass Lincoln SA 70+
E8010-G
Rehydrated 2.5 0 0 0 0 0 No visual defects, pass As-received 1.5 1 0.5 0.5 1 0.5 PH <1/8 in., pass
Dried 1.5 7 17 6 7 17 PH > 1/8 in., fail Lincoln SA 90
E9010-G
Rehydrated 1.5 3 1.5 0.5 3 1.5 PH <1/8 in., pass *PH = pinholes
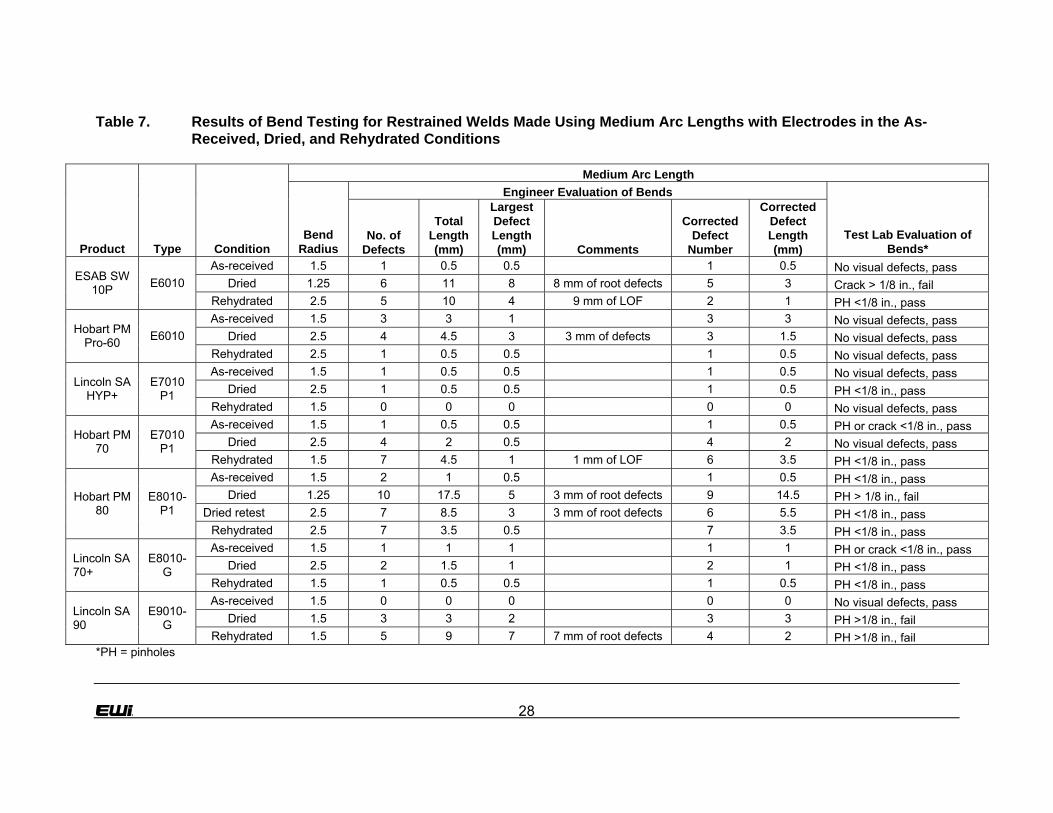
28
Table 7. Results of Bend Testing for Restrained Welds Made Using Medium Arc Lengths with Electrodes in the As-Received, Dried, and Rehydrated Conditions
Medium Arc Length
Engineer Evaluation of Bends
Product Type Condition Bend
Radius No. of
Defects
Total Length (mm)
Largest Defect Length (mm) Comments
Corrected Defect
Number
Corrected Defect Length (mm)
Test Lab Evaluation of Bends*
As-received 1.5 1 0.5 0.5 1 0.5 No visual defects, pass Dried 1.25 6 11 8 8 mm of root defects 5 3 Crack > 1/8 in., fail
ESAB SW 10P E6010
Rehydrated 2.5 5 10 4 9 mm of LOF 2 1 PH <1/8 in., pass As-received 1.5 3 3 1 3 3 No visual defects, pass
Dried 2.5 4 4.5 3 3 mm of defects 3 1.5 No visual defects, pass Hobart PM
Pro-60 E6010 Rehydrated 2.5 1 0.5 0.5 1 0.5 No visual defects, pass As-received 1.5 1 0.5 0.5 1 0.5 No visual defects, pass
Dried 2.5 1 0.5 0.5 1 0.5 PH <1/8 in., pass Lincoln SA
HYP+ E7010
P1 Rehydrated 1.5 0 0 0 0 0 No visual defects, pass As-received 1.5 1 0.5 0.5 1 0.5 PH or crack <1/8 in., pass
Dried 2.5 4 2 0.5 4 2 No visual defects, pass Hobart PM
70 E7010
P1 Rehydrated 1.5 7 4.5 1 1 mm of LOF 6 3.5 PH <1/8 in., pass As-received 1.5 2 1 0.5 1 0.5 PH <1/8 in., pass
Dried 1.25 10 17.5 5 3 mm of root defects 9 14.5 PH > 1/8 in., fail Dried retest 2.5 7 8.5 3 3 mm of root defects 6 5.5 PH <1/8 in., pass
Hobart PM 80
E8010-P1
Rehydrated 2.5 7 3.5 0.5 7 3.5 PH <1/8 in., pass As-received 1.5 1 1 1 1 1 PH or crack <1/8 in., pass
Dried 2.5 2 1.5 1 2 1 PH <1/8 in., pass Lincoln SA 70+
E8010-G
Rehydrated 1.5 1 0.5 0.5 1 0.5 PH <1/8 in., pass As-received 1.5 0 0 0 0 0 No visual defects, pass
Dried 1.5 3 3 2 3 3 PH >1/8 in., fail Lincoln SA 90
E9010-G
Rehydrated 1.5 5 9 7 7 mm of root defects 4 2 PH >1/8 in., fail *PH = pinholes

29
Table 8. Effect of Varying Times at 80°F/80% Relative Humidity
Electrode Conditioning Moisture
(%) ESAB SW 10P As-Received 2.84 Dried 1.15 Rehydrated, 4 hr 8.82 Rehydrated, 8 hr 11.39 Rehydrated, 24 hr 12.94 Lincoln SA 90 As-Received 2.86 Dried 1.24 Rehydrated, 4 hr 9.19 Rehydrated, 8 hr 12.32 Rehydrated, 24 hr 13.2
Table 9. DOE Test Conditions
DOE Parameters Time Grains of Moisture
Run 1 6 170 Run 2 2 100 Run 3 10 100 Run 4 6 100 Run 5 6 30 Run 6 4 135 Run 7 4 65 Run 8 6 100 Run 9 8 135
Run 10 8 65 Run 11 6 100

30
Table 10. DOE Test Results
Moisture Content (wt%) DOE Parameters
ESAB Lincoln Hobart Time (hr) Grains of Moisture
As-Received 4.82 3.56 3.46 Run 1 13.12 14.91 10.84 6 170 Run 2 5.41 3.69 3.59 2 100 Run 3 3.75 3.57 3.76 10 100 Run 4 5.21 3.63 3.73 6 100 Run 5 5.18 3.56 3.42 6 30 Run 6 9.93 9.22 9.02 4 135 Run 7 5.35 3.62 3.65 4 65 Run 8 5.00 3.24 3.26 6 100 Run 9 13.82 13.15 10.79 8 135
Run 10 3.29 4.60 3.38 8 65 Run 11 6.84 5.21 4.81 6 100
Table 11. Actual DOE Test Conditions
Grains of Moisture Temp (°F) RH (%) 30 53 50 65 75 50
100 95 40 135 79 90 170 85 91

31
Table 12. Additional Testing Done at Equal Grains of Moisture
Additional Testing Moisture Content (wt%)
ID Grains Temp (°F)
RH (%)
Time (hr) ESAB Lincoln Hobart
60-1 65 95 27 8 5.37 4.21 3.81 60-2 65 110 16 8 4.35 3.68 3.72 60-3 65 60 85 8 6.30 5.04 5.33
Frozen 24 5.49 3.97 3.59 Sun 24 2.80 3.58 3.18

32
Table 13. Mechanical Property and Chemistry Results for Inverter/Motor-Generator Testing
Prod. Cond. Pwr.
Source UTS (ksi)
YS (ksi)
% El.
% RA
Bend Defects C Mn Si P S Cr Ni Mo Nb Cu V Ti CE(iiw) CEN
AR Inv 88.8 67.0 44.7 59.1 0 0.14 1.15 0.09 0.010 0.006 0.13 0.71 0.09 0.003 0.031 0.008 0.006 0.427 0.376
AR Gen 88.2 70.9 36.3 64.4 3 0.14 1.21 0.09 0.010 0.007 0.13 0.70 0.09 0.003 0.032 0.010 0.007 0.437 0.384
Dried Inv 45.1 35.5 28.2 41.9 14 0.15 1.74 0.33 0.009 0.006 0.14 0.73 0.10 0.003 0.031 0.006 0.024 0.540 0.496
Dried Inv Retest 109.7 92.1 24.9 60.6 1 0.16 1.66 0.32 0.011 0.008 0.17 0.77 0.10 0.006 0.040 0.010 0.015 0.547 0.515
Dried Gen 106.6 81.6 26.2 52.1 19 0.15 1.87 0.35 0.009 0.007 0.15 0.77 0.10 0.003 0.031 0.007 0.022 0.566 0.519 Linc
oln
SA 7
0+
Dried Gen Retest 108.8 92.2 25.3 57.7 5 0.14 1.70 0.36 0.011 0.009 0.17 0.75 0.10 0.006 0.040 0.010 0.015 0.531 0.473
AR Inv 97.3 80.4 28.6 56.1 0 0.17 1.01 0.21 0.009 0.008 0.06 0.77 0.12 0.008 0.038 0.020 0.013 0.432 0.412
AR Gen 92.6 74.6 27.9 49.4 1 0.17 0.92 0.10 0.009 0.007 0.06 0.76 0.12 0.006 0.034 0.017 0.012 0.393 0.372
Dried Inv 67.7 63.4 1.4 12.0 15 0.19 1.13 0.39 0.008 0.009 0.06 0.85 0.12 0.007 0.036 0.015 0.029 0.477 0.471
Dried Inv Retest 82.7 78.7 0.8 13.0 22 0.20 1.11 0.40 0.010 0.010 0.08 0.83 0.13 0.010 0.040 0.018 0.021 0.488 0.485
Dried Inv Retest 98.9 87.5 10.3 31.9
Dried Inv Retest 87.8 85.1 3.3 25.6
Dried Gen 109.1 85.1 32.0 64.4 12 0.19 1.20 0.16 0.009 0.009 0.07 0.85 0.13 0.007 0.038 0.014 0.034 0.491 0.475
Hob
art P
M 8
0
Dried Gen Retest 109.4 85.1 23.1 56.1 16 0.20 1.12 0.42 0.011 0.010 0.08 0.84 0.13 0.009 0.040 0.018 0.022 0.491 0.489

33
Figure 1. Joint Configuration for the Groove Weld Testing
Thyssen E-8010
Wall Thickness (mm)5 10 15 20 25
Pre
heat
and
Inte
rpas
s Te
mpe
ratu
re (°
C)
0
20
40
60
80
100
120
140
160
180
Wall Thickness (inches)
0.25 0.50 0.75 1.00P
rehe
at a
nd In
terp
ass
Tem
pera
ture
(°F)
50
100
150
200
250
300
350CrackingIntermittant CrackingNo Cracking
E7010
E8010
E9010
Figure 2. Summary of Preheat Requirements for E8010-G, E9010-G Electrodes for Varying Pipe Thickness from the Results of PR-185-9909

34
Figure 3. The Application of Propane Flame Preheat
Figure 4. Approximate Location of Bend, Tensile, and Chemical Analysis Specimens

35
Figure 5. Detail of Bend Test for Hydrogen Cracking Determination
Figure 6. HS-DA and HSV Equipment

36
Figure 7. Equipment Set-up with AVC Control and Moving Work Piece
Figure 8. The Orientation of HSV Camera to the Travel Direction

37
Coating Moisture (wt%)
0.0
1.0
2.0
3.0
4.0
5.0
6.0
7.0
8.0
ESAB
SW
10P
Linc
oln
FW 5
P
Hob
art P
M 6
0
ESAB
SW
10P
+
Linc
oln
FW 5
P+
Hob
art P
M P
ro-6
0
ESAB
SW
710
P
Linc
oln
SA H
YP+
Hob
art P
M 7
0
Hob
art P
M P
ro-7
0
ESAB
SW
810
P
Linc
oln
SA 8
0
Hob
art P
M 8
0
Hob
art P
M P
ro-8
0
Linc
oln
SA 7
0+
Linc
oln
SA 9
0
ARDried
Figure 9. Coating Moisture Results for the As-Received and Dried Cellulosic
Electrodes
Manganese (wt%)
0
0.2
0.4
0.6
0.8
1
1.2
ESA
B S
W 1
0P
Linc
oln
FW 5
P
Hob
art P
M 6
0
ESA
B S
W 1
0P+
Linc
oln
FW 5
P+
Hob
art P
M P
ro-6
0
ES
AB
SW
710
P
Linc
oln
SA
HYP
+
Hob
art P
M 7
0
Hob
art P
M P
ro-7
0
ES
AB
SW
810
P
Linc
oln
SA
80
Hob
art P
M 8
0
Hob
art P
M P
ro-8
0
Linc
oln
SA
70+
Linc
oln
SA
90
ARDried
Figure 10. Effect of Electrode Drying on the Manganese Content of Deposited
Chemical Analysis Pads

38
Silicon (wt%)
0
0.05
0.1
0.15
0.2
0.25
0.3
0.35
0.4
0.45
0.5
ESA
B SW
10P
Linc
oln
FW 5
P
Hob
art P
M 6
0
ESA
B SW
10P
+
Linc
oln
FW 5
P+
Hob
art P
M P
ro-6
0
ES
AB
SW
710
P
Linc
oln
SA
HY
P+
Hob
art P
M 7
0
Hob
art P
M P
ro-7
0
ES
AB
SW
810
P
Linc
oln
SA
80
Hob
art P
M 8
0
Hob
art P
M P
ro-8
0
Linc
oln
SA 7
0+
Linc
oln
SA
90
ARDried
Figure 11. Effect of Electrode Drying on the Silicon Content of Deposited Chemical
Analysis Pads
Carbon (wt%)
0
0.02
0.04
0.06
0.08
0.1
0.12
0.14
0.16
0.18
0.2
ESA
B SW
10P
Linc
oln
FW 5
P
Hob
art P
M 6
0
ESA
B SW
10P
+
Linc
oln
FW 5
P+
Hob
art P
M P
ro-6
0
ES
AB
SW
710
P
Linc
oln
SA
HY
P+
Hob
art P
M 7
0
Hob
art P
M P
ro-7
0
ES
AB
SW
810
P
Linc
oln
SA
80
Hob
art P
M 8
0
Hob
art P
M P
ro-8
0
Linc
oln
SA 7
0+
Linc
oln
SA
90
ARDried
Figure 12. Effect of Electrode Drying on the Carbon Content of Deposited Chemical
Analysis Pads

39
Coating Moisture (wt%)
0.0
2.0
4.0
6.0
8.0
10.0
12.0
14.0
ESAB
SW
10P
Hob
art P
M P
ro-
60
Linc
oln
SAH
YP+
Hob
art P
M 7
0
Hob
art P
M 8
0
Linc
oln
SA
70+
Linc
oln
SA
90
ARDriedRe-Hydrated
Figure 13. Coating Moisture Results for Eight Selected Electrodes in the As-Received,
Dried and Rehydrated Condition
(a) As-received (b) Dried Figure 14. Lincoln Shield-Arc 70+

40
(a) As-received (b) Dried Figure 15. Hobart Pipemaster 70
(a) As-received (b) Dried Figure 16. ESAB Sureweld 10P

41
Short Arc Length
10
12
14
16
18
20
22
24
26
28
30
ESABSW 10P
HobartPM Pro-
60
LincolnSA
HYP+
HobartPM 70
HobartPM 80
LincolnSA 70+
LincolnSA 90
Volta
ge As-ReceivedDriedRehydrated
No
Dat
a
Figure 17. Voltage as a Function of Electrode Condition for Constant (Short) Arc
Length
Medium Arc Length
10
12
14
16
18
20
22
24
26
28
30
ESABSW 10P
HobartPM Pro-
60
LincolnSA
HYP+
HobartPM 70
HobartPM 80
LincolnSA 70+
LincolnSA 90
Volta
ge As-ReceivedDriedRehydrated
Figure 18. Voltage as a Function of Electrode Condition for Constant (Medium) Arc
Length

42
Short Arc Length
0
20
40
60
80
100
120
ESABSW 10P
HobartPM Pro-
60
LincolnSA
HYP+
HobartPM 70
HobartPM 80
LincolnSA 70+
LincolnSA 90
UTS
(ksi
)
As-ReceivedDriedRehydrated
Figure 19. Ultimate Tensile Strength as a Function of Electrode Condition, Short Arc
Length
Medium Arc Length
0
20
40
60
80
100
120
ESABSW 10P
HobartPM Pro-
60
LincolnSA
HYP+
HobartPM 70
HobartPM 80
LincolnSA 70+
LincolnSA 90
UTS
(ksi
)
As-ReceivedDriedRehydrated
Figure 20. Ultimate Tensile Strength as a Function of Electrode Condition, Medium
Arc Length

43
Short Arc Length
0
10
20
30
40
50
60
70
80
90
100
ESABSW 10P
HobartPM Pro-
60
LincolnSA
HYP+
HobartPM 70
HobartPM 80
LincolnSA 70+
LincolnSA 90
YS (k
si) As-Received
DriedRehydrated
Figure 21. Yield Strength as a Function of Electrode Condition, Short Arc Length
Medium Arc Length
0
10
20
30
40
50
60
70
80
90
100
ESABSW 10P
HobartPM Pro-
60
LincolnSA
HYP+
HobartPM 70
HobartPM 80
LincolnSA 70+
LincolnSA 90
YS (k
si) As-Received
DriedRehydrated
Figure 22. Yield Strength as a Function of Electrode Condition, Medium Arc Length

44
Short Arc Length
0
5
10
15
20
25
30
35
ESABSW 10P
HobartPM Pro-
60
LincolnSA
HYP+
HobartPM 70
HobartPM 80
LincolnSA 70+
LincolnSA 90
% E
long
atio
n
As-ReceivedDriedRehydrated
Figure 23. Elongation as a Function of Electrode Condition, Short Arc Length
Medium Arc Length
0
5
10
15
20
25
30
35
40
45
ESABSW 10P
HobartPM Pro-
60
LincolnSA
HYP+
HobartPM 70
HobartPM 80
LincolnSA 70+
LincolnSA 90
% E
long
atio
n
As-ReceivedDriedRehydrated
Figure 24. Elongation as a Function of Electrode Condition, Medium Arc Length

45
Short Arc Length
0.00
0.05
0.10
0.15
0.20
0.25
0.30
0.35
0.40
0.45
0.50
ESABSW 10P
HobartPM Pro-
60
LincolnSA
HYP+
HobartPM 70
HobartPM 80
LincolnSA 70+
LincolnSA 90
CEN
As-ReceivedDriedRehydrated
Figure 25. CEN as a Function of Electrode Condition, Short Arc Length
Medium Arc Length
0.00
0.05
0.10
0.15
0.20
0.25
0.30
0.35
0.40
0.45
ESABSW 10P
HobartPM Pro-
60
LincolnSA
HYP+
HobartPM 70
HobartPM 80
LincolnSA 70+
LincolnSA 90
CEN
As-ReceivedDriedRehydrated
Figure 26. CEN as a Function of Electrode Condition, Medium Arc Length

46
Short Arc Length
0.00
0.05
0.10
0.15
0.20
0.25
ESABSW 10P
HobartPM Pro-
60
LincolnSA
HYP+
HobartPM 70
HobartPM 80
LincolnSA 70+
LincolnSA 90
Car
bon
(wt%
) As-ReceivedDriedRehydrated
Figure 27. Carbon Content as a Function of Electrode Condition, Short Arc Length
Medium Arc Length
0.00
0.02
0.04
0.06
0.08
0.10
0.12
0.14
0.16
0.18
0.20
ESABSW 10P
HobartPM Pro-
60
LincolnSA
HYP+
HobartPM 70
HobartPM 80
LincolnSA 70+
LincolnSA 90
Car
bon
(wt%
) As-ReceivedDriedRehydrated
Figure 28. Carbon Content as a Function of Electrode Condition, Medium Arc Length

47
Short Arc Length
0.00
0.20
0.40
0.60
0.80
1.00
1.20
1.40
ESABSW 10P
HobartPM Pro-
60
LincolnSA
HYP+
HobartPM 70
HobartPM 80
LincolnSA 70+
LincolnSA 90
Man
gane
se (w
t%)
As-ReceivedDriedRehydrated
Figure 29. Manganese Content as a Function of Electrode Condition, Short Arc Length
Medium Arc Length
0.00
0.20
0.40
0.60
0.80
1.00
1.20
1.40
ESABSW 10P
HobartPM Pro-
60
LincolnSA
HYP+
HobartPM 70
HobartPM 80
LincolnSA 70+
LincolnSA 90
Man
gane
se (w
t%)
As-ReceivedDriedRehydrated
Figure 30. Manganese Content as a Function of Electrode Condition, Medium Arc
Length

48
Short Arc Length
0.00
0.10
0.20
0.30
0.40
0.50
0.60
0.70
0.80
ESABSW 10P
HobartPM Pro-
60
LincolnSA
HYP+
HobartPM 70
HobartPM 80
LincolnSA 70+
LincolnSA 90
Silic
on (w
t%) As-Received
DriedRehydrated
Figure 31. Silicon Content as a Function of Electrode Condition, Short Arc Length
Medium Arc Length
0.00
0.10
0.20
0.30
0.40
0.50
0.60
0.70
0.80
0.90
ESABSW 10P
HobartPM Pro-
60
LincolnSA
HYP+
HobartPM 70
HobartPM 80
LincolnSA 70+
LincolnSA 90
Silic
on (w
t%) As-Received
DriedRehydrated
Figure 32. Silicon Content as a Function of Electrode Condition, Medium Arc Length

49
0
20
40
60
80
100
120
ESABSW 10P
HobartPM Pro-
60
LincolnSA HYP+
HobartPM 70
HobartPM 80
LincolnSA 70+
LincolnSA 90
UTS
(ksi
)
AR - SAAR - MA
Figure 33. Tensile Strength as a Function of Arc Length, As-Received Electrodes
0
20
40
60
80
100
120
ESABSW 10P
HobartPM Pro-
60
LincolnSA
HYP+
HobartPM 70
HobartPM 80
LincolnSA 70+
LincolnSA 90
UTS
(ksi
)
Dried - SADried - MA
Figure 34. Tensile Strength as a Function of Arc Length, Dried Electrodes

50
0
10
20
30
40
50
60
70
80
90
ESABSW 10P
HobartPM Pro-
60
LincolnSA
HYP+
HobartPM 70
HobartPM 80
LincolnSA 70+
LincolnSA 90
YS (k
si)
AR - SAAR - MA
Figure 35. Yield Strength as a Function of Arc Length, As-Received Electrodes
0
10
20
30
40
50
60
70
80
90
100
ESABSW 10P
HobartPM Pro-
60
LincolnSA
HYP+
HobartPM 70
HobartPM 80
LincolnSA 70+
LincolnSA 90
YS (k
si)
Dried - SADried - MA
Figure 36. Yield Strength as a Function of Arc Length, Dried Electrodes

51
0.00
0.05
0.10
0.15
0.20
0.25
ESABSW 10P
HobartPM Pro-
60
LincolnSA
HYP+
HobartPM 70
HobartPM 80
LincolnSA 70+
LincolnSA 90
Car
bon
(wt %
) AR - SAAR - MADried - SADried - MA
Figure 37. Deposit Carbon Content as a Function of Arc Length, As-Received and
Dried Electrodes
0.00
0.20
0.40
0.60
0.80
1.00
1.20
1.40
ESABSW 10P
HobartPM Pro-
60
LincolnSA
HYP+
HobartPM 70
HobartPM 80
LincolnSA 70+
LincolnSA 90
Man
gane
se (w
t %)
AR - SAAR - MADried - SADried - MA
Figure 38. Deposit Manganese Content as a Function of Arc Length, As-Received and
Dried Electrodes

52
0.00
0.10
0.20
0.30
0.40
0.50
0.60
0.70
0.80
0.90
ESABSW 10P
HobartPM Pro-
60
LincolnSA
HYP+
HobartPM 70
HobartPM 80
LincolnSA 70+
LincolnSA 90
Silic
on (w
t %) AR - SA
AR - MADried - SADried - MA
Figure 39. Deposit Silicon Content as a Function of Arc Length, As-Received and
Dried Electrodes
0.00
0.05
0.10
0.15
0.20
0.25
0.30
0.35
0.40
0.45
0.50
ESABSW 10P
HobartPM Pro-
60
LincolnSA
HYP+
HobartPM 70
HobartPM 80
LincolnSA 70+
LincolnSA 90
CEN
AR - SAAR - MADried - SADried - MA
Figure 40. Deposit CEN as a Function of Arc Length, As-Received and Dried
Electrodes

53
Carbon (wt%)
0.00
0.02
0.04
0.06
0.08
0.10
0.12
0.14
0.16
0.18
0.20
ESABSW 10P
HobartPM Pro-
60
LincolnSA HYP+
HobartPM 70
HobartPM 80
LincolnSA 70+
LincolnSA 90
AR - SAAR - LADried - SADried - LA
Figure 41. Deposit Carbon as a Function of Arc Length, As-Received and Dried
Electrodes
Manganese (wt%)
0.00
0.20
0.40
0.60
0.80
1.00
1.20
ESABSW 10P
HobartPM Pro-
60
LincolnSA HYP+
HobartPM 70
HobartPM 80
LincolnSA 70+
LincolnSA 90
AR - SAAR - LADried - SADried - LA
Figure 42. Deposit Manganese as a Function of Arc Length, As-Received and Dried
Electrodes

54
Silicon (wt%)
0.00
0.05
0.10
0.15
0.20
0.25
0.30
0.35
0.40
0.45
0.50
ESABSW 10P
HobartPM Pro-
60
LincolnSA HYP+
HobartPM 70
HobartPM 80
LincolnSA 70+
LincolnSA 90
AR - SAAR - LADried - SADried - LA
Figure 43. Deposit Silicon as a Function of Arc Length, As-Received and Dried
Electrodes
Carbon Equivalent (CEN)
0.000
0.050
0.100
0.150
0.200
0.250
0.300
0.350
0.400
0.450
ESABSW 10P
HobartPM Pro-
60
LincolnSA
HYP+
HobartPM 70
HobartPM 80
LincolnSA 70+
LincolnSA 90
CEN
AR - SAAR - LADried - SADried - LA
Figure 44. Deposit CEN as a Function of Arc Length, As-Received and Dried
Electrodes

55
Short Arc Length
0
5
10
15
20
25
30
ESABSW 10P
HobartPM Pro-
60
LincolnSA
HYP+
HobartPM 70
HobartPM 80
LincolnSA 70+
LincolnSA 90
Cor
rect
ed N
umbe
r of D
efec
ts
As-ReceivedDriedRehydrated
Figure 45. Corrected Number of Defects in Bend Specimens for As-Received, Dried,
and Rehydrated Electrodes, Short Arc Length
Medium Arc Length
0
1
2
3
4
5
6
7
8
ESABSW 10P
HobartPM Pro-
60
LincolnSA
HYP+
HobartPM 70
HobartPM 80
LincolnSA 70+
LincolnSA 90
Cor
rect
ed N
umbe
r of D
efec
ts
As-ReceivedDriedRehydrated
Figure 46. Corrected Number of Defects in Bend Specimens for As-Received, Dried,
and Rehydrated Electrodes, Medium Arc Length

56
Short Arc Length
0
2
4
6
8
10
12
14
16
18
20
ESABSW 10P
HobartPM Pro-
60
LincolnSA
HYP+
HobartPM 70
HobartPM 80
LincolnSA 70+
LincolnSA 90
Cor
rect
ed D
efec
t Len
gth
(mm
)
As-ReceivedDriedRehydrated
Figure 47. Corrected Bend Defect Lengths for As-Received, Dried, and Rehydrated
Electrodes, Short Arc Length
Medium Arc Length
0
1
2
3
4
5
6
7
8
ESABSW 10P
HobartPM Pro-
60
LincolnSA
HYP+
HobartPM 70
HobartPM 80
LincolnSA 70+
LincolnSA 90
Cor
rect
ed N
umbe
r of D
efec
ts
As-ReceivedDriedRehydrated
Figure 48. Corrected Bend Defect Lengths for As-Received, Dried, and Rehydrated
Electrodes, Medium Arc Length

57
Rehydration Effects
0
2
4
6
8
10
12
14
ESAB SW 10P Lincoln SA 90
Electrode
Moi
stur
e C
onte
nt (w
t%)
As-ReceivedDried4 hrs 80/808 hrs 80/8024 hrs 80/80
Figure 49. Effect of Exposure Time at 80°F/80% Relative Humidity on Moisture Content