
Redox Potentials as Reactivity Descriptors in Electrochemistry
24
Chapter Redox Potentials as Reactivity Descriptors in Electrochemistry José H. Zagal, Ingrid Ponce and Ruben Oñate Abstract A redox catalyst can be present in the solution phase or immobilized on the electrode surface. When the catalyst is present in the solution phase the process can proceed via inner- (with bond formation, chemical catalysis) or outer-sphere mechanisms (without bond formation, redox catalysis). For the latter, log k is linearly proportional to the redox potential of the catalysts, E°. In contrast, for inner-sphere catalyst, the values of k are much higher than those predicted by the redox potential of the catalyst. The behaviour of these catalysts when they are confined on the electrode surface is completely different. They all seem to work as inner-sphere catalysts where a crucial step is the formation of a bond between the active site and the target molecule. Plots of (log i) E versus E° give linear or volcano correlations. What is interesting in these volcano correlations is that the falling region corresponding to strong adsorption of intermediates to the active sites is not necessarily attributed to a gradual surface occupation of active sites by intermedi- ates (Langmuir isotherm) but rather to a gradual decrease in the amount of M(II) active sites which are transformed into M(III)OH inactive sites due to the applied potential. Keywords: redox potential, reactivity descriptors, redox catalysis, chemical catalysis, linear free-energy correlations, volcano correlations 1. Introduction Predicting the rate of chemical processes on the basis of thermodynamic infor- mation is of fundamental importance in all areas of chemistry including biochemis- try, coordination chemistry and especially electrochemistry [1]. Correlations do exist between the Gibbs free-energy for one series of reactions and logarithm of the reaction rate constant for a related series of reactions. These relations are known as linear free-energy relationships (LFER) [1]. For example, the Brønsted catalysis equation describes the relationship between the ionization constant of a series of catalysts and the reaction rate constant for a reaction on which the catalyst operates. The Hammett equation predicts the equilibrium constant or reaction rate constant of a reaction from a substituent constant and a reaction type constant. The Edwards equation relates the nucleophilic power to polarizability and basicity. The Marcus equation is an example of a quadratic free-energy relationship (QFER) that applies to electron transfer (ET) reactions where the activation energy is given by the inner and outer reorganizational energies. In the case of electrochemical reactions, the 1
-
Upload
khangminh22 -
Category
Documents
-
view
0 -
download
0
Transcript of Redox Potentials as Reactivity Descriptors in Electrochemistry

Chapter
Redox Potentials as ReactivityDescriptors in ElectrochemistryJosé H. Zagal, Ingrid Ponce and Ruben Oñate
Abstract
A redox catalyst can be present in the solution phase or immobilized on theelectrode surface. When the catalyst is present in the solution phase the process canproceed via inner- (with bond formation, chemical catalysis) or outer-spheremechanisms (without bond formation, redox catalysis). For the latter, log k islinearly proportional to the redox potential of the catalysts, E°. In contrast, forinner-sphere catalyst, the values of k are much higher than those predicted by theredox potential of the catalyst. The behaviour of these catalysts when they areconfined on the electrode surface is completely different. They all seem to work asinner-sphere catalysts where a crucial step is the formation of a bond between theactive site and the target molecule. Plots of (log i)E versus E° give linear or volcanocorrelations. What is interesting in these volcano correlations is that the fallingregion corresponding to strong adsorption of intermediates to the active sites is notnecessarily attributed to a gradual surface occupation of active sites by intermedi-ates (Langmuir isotherm) but rather to a gradual decrease in the amount of M(II)active sites which are transformed into M(III)OH inactive sites due to the appliedpotential.
Keywords: redox potential, reactivity descriptors, redox catalysis,chemical catalysis, linear free-energy correlations, volcano correlations
1. Introduction
Predicting the rate of chemical processes on the basis of thermodynamic infor-mation is of fundamental importance in all areas of chemistry including biochemis-try, coordination chemistry and especially electrochemistry [1]. Correlations doexist between the Gibbs free-energy for one series of reactions and logarithm of thereaction rate constant for a related series of reactions. These relations are known aslinear free-energy relationships (LFER) [1]. For example, the Brønsted catalysisequation describes the relationship between the ionization constant of a series ofcatalysts and the reaction rate constant for a reaction on which the catalyst operates.The Hammett equation predicts the equilibrium constant or reaction rate constantof a reaction from a substituent constant and a reaction type constant. The Edwardsequation relates the nucleophilic power to polarizability and basicity. The Marcusequation is an example of a quadratic free-energy relationship (QFER) that appliesto electron transfer (ET) reactions where the activation energy is given by the innerand outer reorganizational energies. In the case of electrochemical reactions, the
1
thermodynamics can be provided by the electrode potential or by the redoxpotential of a mediator or both [1].
The slope of the linear free-energy correlations reflects the sensitivity of rateconstant to structural changes in a family of similar reactions. For organic reactionsthis slope resembles the definition of the parameter σ in Hammett correlations. Itis interesting to mention that already in 1932 Frumkin stated [2] that at differentelectrode potentials, an electrochemical reaction is equivalent to a series of similarreactions differing only by the magnitude of ΔG°, where ΔG° is equal to –nFΔE°[3], n is the number of electrons exchanged in the complete reaction and F is theFaraday constant. In this case the role of substituents for changing the driving forceis played by the potential of the electrode applied by an external source. The mostcommon linear free-energy relationship in electrochemistry is the Tafel plot [4, 5],where (log i) is plotted versus the potential of the electrode. This linear correlationis observed in the absence of mass transport limitations. If i is a kinetic currentdensity, log i is proportional to log k (k is the rate constant), and the potential of theelectrode is proportional to ΔG°. As discussed further down, these correlations arenot always linear in electron transfer processes in the homogenous phase or atelectrode interfaces. In this chapter we will focus our attention of the correlationsbetween the redox potential, a thermodynamic parameter of the catalyst and itscatalytic activity. As we will discuss, these correlations are sometimes linear, and onother occasions they can have the shape of a volcano.
2. Catalytic effects in electrochemistry
A redox catalyst is a molecule that has an atom with two oxidation states that arekinetically more favorable than the oxidation states of the reactants and productsupon which the catalyst is operating. In general, the most common active site is ametal that can be an atom that is coordinative unsaturated and is active for bindingextraplanar ligands such as the reacting molecules [1]. The catalyst can be present inthe solution phase or immobilized on the electrode surface. When the catalysts arepresent in the solution phase, the process can proceed via inner- or outer-spheremechanisms [1]. For the latter, log k is linearly proportional to E°, whereas forinner-sphere catalyst, the values of k are much higher than those predicted by theformal potential of the catalyst. The behaviour of these catalysts when they areconfined on the electrode surface is completely different. They all work as inner-sphere catalysts where a crucial step is the formation of a bond between the activesite and the target molecule. Plots of (log i)E versus E° give volcano plots.
2.1 Redox catalysis and chemical catalysis
Metal, metal alloys and metal oxides have been studied extensively in the liter-ature as catalysts for many reactions since the beginnings of electrochemistry. Forexample, the hydrogen evolution reaction (HER) was studied by Tafel [4], and hederived from his studies his well-known equation. In contrast, molecular catalystshave only been studied more intensively rather recently than the long history offundamental and applied work using metals and alloys. It is important to point outthat the electronic structure of metal electrodes is described using d-band theorieswhere electronic levels form a continuum in the valence band. In contrast, molecu-lar catalysts have discrete energy levels like any isolated chemical molecule orisolated atom. It is interesting then to correlate the electronic properties and energylevels of molecular catalysts with their catalytic activity for any reaction [6].
2
Redox

As mentioned above, a redox molecular catalyst is a species that can present atleast two oxidation states that are kinetically much more favorable than the oxida-tion states of the reactants and products that the catalyst is promoting. Someelectrochemical reactions involving reactants in the solution phase proceed at rea-sonable rates at potentials that are close to the equilibrium potential of the reaction,i.e. they require a rather low overpotential for the process to proceed at measurablerates. The kinetics of these reactions are then rather fast. A typical example is HERoccurring on a Pt electrode [1]. However, many electrochemical reactions of inter-est usually require the transfer of more than one electron, each electron transferstep representing an energy barrier. The slow step, which is the rate-determiningstep, can be accelerated by the action of electrocatalysts mainly in two ways (someof them are illustrated in Figure 1):
i. The catalyst is in the solution phase, and the electrode serves only as a sink orsource of electrons. The electrode regenerates the active form of the catalystcontinuously which interacts with the target molecule in the homogeneousphase.
ii. The process is heterogeneous, and the catalyst can be the electrode surfaceitself (e.g. d-type noble metals like Pt, Pd, etc.) or a molecular catalystconfined on a rather inert electrode surface (i.e. for so-called modifiedelectrodes). In the case of a molecular catalyst attached to the electrodesurface, the electrode also regenerates the active form of the catalystcontinuously.
2.1.1 Case (i): the catalyst is present in the solution phase
In case (i), the homogeneous catalytic process can proceed via two differentpathways: via outer-sphere and inner-sphere processes [7].
Figure 1.Different reactions schemes for catalytic processes in electrochemistry as described by Savéant [7] (reproduced bypermission John Wiley & son).
3
Redox Potentials as Reactivity Descriptors in ElectrochemistryDOI: http://dx.doi.org/10.5772/intechopen.89883
(ia) For the case of an outer-sphere reaction, the process has been termed “redoxcatalysis”, and the active form of the catalysts is present in a given oxidation state.The catalyst oxidation state changes upon interacting with the target molecule, andthe active state is continuously regenerated at the electrode surface. The catalystand the reactant only collide in the homogeneous phase without forming a bond.The catalyst recuperates its initial oxidation state at the electrode surface as illus-trated in Figure 1. The catalysis in this case lowers the overpotential of the overallreaction by acting in a three-dimensional dispersion. The redox potential of thecatalyst contributes to the driving force of the reaction, not the potential of theelectrode, which only serves to regenerate the active form of the catalyst at theinterface (no reaction takes place directly between the electrode and thereactants [7]).
(ib) For the case of an “inner sphere” process, the process has been termed“chemical catalysis” and involves the temporary formation of an adduct betweenthe mediator and the reactant. The bond formed between the reactant and thecatalyst is broken after the exchange of electrons to form intermediates and prod-ucts. This regenerates the catalysts that recuperate its initial oxidation state at theelectrode [7].
If we take as an example a reduction reaction mediated by catalysts dissolved inthe solution phase, on thermodynamic grounds one would expect that the morenegative the formal potential of the mediator (more powerful reductant), thehigher its reactivity for the oxidation of the target, according to the reaction schemebelow, where step in Eq. (3) is rate-determining and the first step, Eq. (1), is theelectrogeneration of the catalyst in its active form:
non� active OX½ � þ e� ! active RED½ �� (1)
active RED½ �� þ target ! non� active OX½ � þ target� (2)
target� !k products (3)
According to this reaction scheme and assuming that step 3, Eq. (3), is ratecontrolling, the rate of the reaction is:
�d target½ �dt
¼ kK target½ � non� activeOX½ �activeRED½ �� ¼ k target½ � ∗ 10 E�E°ð Þ=0:059 (4)
Savéant et al. [7–11] carried out a series of studies using different redox catalystsfor the homogeneous reduction of alkyl halides and vicinal halides to alkenes. Theyidentified two types of catalytic systems: outer-sphere and inner-sphere redoxcatalysts. Figures 2 and 3 show a linear correlation between the E° formal potentialof the catalysts and log k for outer-sphere catalysts. Inner-sphere catalysts fall outfor the linear correlation. In the latter, the catalytic effect originates from theformation of an adduct between the reacting molecule and the catalyst, whichlowers the activation energy of the process. The reaction studied involved therupture of a bond so Marcus theory cannot be applied but rather a modified versionproposed by Savéant that describes a Morse curve rather that a parabola for thereaction products [11]. In the latter, the catalytic effect rises from the formation ofan adduct between the reacting molecule and the catalyst, which lowers the activa-tion energy of the process. For inner-sphere processes where the redox catalystsare in the homogeneous phase, there is no clear dependence of the rate of theprocess of the redox potential of the catalyst. The inner-sphere process has loweractivation energy than the outer-sphere pathway. If both pathways are available,the inner-sphere process is preferred.
4
Redox

2.1.2 Electrocatalysis by redox mediators, chemical catalysis and oxygen reduction
Electrodes modified with macrocyclic metal complexes that exhibit fast revers-ible redox processes centred on the metal have received considerable attention in
Figure 3.Homogeneous redox and chemical catalysis of trans-1,2 dibromocyclohexane. (a1) Cyclic voltammogram inDMF of direct electrochemical reduction on glassy carbon, (a2) redox catalysis of fluorenone and (a3) chemicalcatalysis promoted by iron(I) porphyrin. (b) Rate constant versus the standard redox potential of the catalyst(taken from Savéant [7]. Reproduced by permission John Wiley & son).
Figure 2.Dependence of log k versus the redox potential of the catalyst for the reduction of trans-1,2 dibromocyclohexaneby aromatic radicals and by reduced metalloporphyrins from Lexa et al. [11] (reproduced by permission of theAmerican Chemical Society).
5
Redox Potentials as Reactivity Descriptors in ElectrochemistryDOI: http://dx.doi.org/10.5772/intechopen.89883
the literature because of the applications in electrocatalysts and also as electro-chemical sensors [12–14]. A very important area that has been investigated by manyauthors for decades is the oxygen reduction reaction (ORR). The ORR is a veryimportant reaction indeed as it is involved in energy conversion processes (fuelcells, air batteries) in metallic corrosion etc., without considering important biolog-ical processes as the respiration chain [15]. The complete reduction of O2 in aqueousmedia requires the presence of catalysts and involves the transfer of four electronsand the splitting of the O–O bond. This reaction delivers the most energy in a fuelcell and in living systems. However, in electrochemistry rather few electrodematerials promote the four-electron reduction of O2.
The ORR process is a multielectron reaction in aqueous media that occurs viatwo main pathways: one involving two electrons to give peroxide and the directfour-electron pathway to give water. The four-electron process involves the ruptureof the O–O bond [16]. The nature of the electrode surface strongly influences thepreferred pathway. Most electrode materials catalyse the reaction only via twoelectrons to form peroxide:
Pathways for ORR.In acid media:
O2 þ 2Hþ þ 2e� ! H2O2 E° ¼ þ0:67 V vs NHE (5)
In alkaline media:
O2 þH2Oþ 2e� ! HO�2 þ OH� E° ¼ �0:65 V vs NHE (6)
Peroxide formation during O2 reduction can be followed by its reduction:
H2O2 þ 2Hþ þ 2e� ! 2H2O E° ¼ þ1:77 V vs NHE (7)
HO�2 þH2Oþ 2e� ! 3OH� E° ¼ þ0:867 V vs NHE (8)
or by its chemical decomposition:
2H2O2 ! 2H2Oþ O2 (9)
Direct four-electron reduction pathway.In acid:
O2 þ 4Hþ þ 4e� ! 2H2O2 E° ¼ þ1:229 V vs NHE (10)
In alkaline:
O2 þ 2H2Oþ 4e� ! 4OH� E° ¼ þ0:401 V vs NHE (11)
In strongly alkaline solutions or in organic solvents, O2 is reduced via the trans-fer of a single electron to give superoxide ion. This process is outer-sphere:
O2 þ e� ! O�2 E° ¼ �0:33 V vs NHE (12)
The O2 four-electron reduction reaction is thermodynamically spontaneous inO2/H2 fuel cells, but its kinetics are slow on most electrode materials. The sluggish-ness of the reaction kinetics can be attributed to the transfer of four electronsinvolving the formation of bonds between intermediates and the active sites. Thebest catalytic materials for the four-electron ORR contain Platinum. The high costof this metal is one of the limitations for the widespread use of fuel cells. Several
6
Redox

authors have faced the challenge of preparing catalytic materials for oxygen reduc-tion that do not involve precious metals like Platinum and its alloys. This probablystarted with the seminal work of Jasinski [17] that reported that cobalt phthalocya-nine (CoPc) exhibited catalytic activity for the ORR. This discovery triggered theresearch on metal macrocyclic MN4 complexes as potential catalysts for ORR.Figure 4 shows the molecular structures of the most common macrocyclic com-plexes investigated as catalysts for ORR. However, some MN4 electrodes containingthese complexes are not stable in the corrosive environment of a fuel cell after longoperating conditions. For this reason, a new research started, on pyrolysed MN4complexes [18]. Heat treatment at different temperatures increases both activityand stability, and this has been demonstrated by several authors. It was also foundthat MN4 or MNx pyrolysed catalytic materials can be obtained without using MN4complexes as a starting ingredient, but rather using metal salts and N-containingorganic compounds.
In this chapter, we will discuss the different reactivity predictors that serve asguidelines for the synthesis of more active catalysts [6, 12, 14, 16, 19–22] but withemphasis on the redox potential of the catalyst. There are several reactivity pre-dictors for MN4 macrocyclic complexes that have been described in the literature:(i) the d-level populations in the central metal, (ii) the donor-acceptorintermolecular hardness, (iii) the M-O2 binding energy and (iv) the M+n/M+(n�1)
redox potential. We will discuss predictors (i) and (iii)–(iv), especially the last two,the M-O2 binding energy and the redox potential of the catalysts, as they seem to berelated to each other. One rather simple reactivity predictor is the number of d-electrons when comparing the activities of a family of similar macrocyclic metalcomplexes. For example, when comparing the activities of metal phthalocyanines(MPcs), a plot of E at constant current versus the number of d-electrons gives a
Figure 4.Structure of several unsubstituted and substituted metal phthalocyanines, metal porphyrins and a metal corrole.
7
Redox Potentials as Reactivity Descriptors in ElectrochemistryDOI: http://dx.doi.org/10.5772/intechopen.89883

parabolic correlation with FePc showing the highest activity with 6 d-electrons.When metal porphyrins (MPs) are compared, the highest activity is exhibited byCoPs with 7 d-electrons. These results are illustrated in Figure 5. These resultsindicate that highest activity is achieved by complexes with nearly half-filledd-orbitals. However, it is important to point out that those metals with low and orpartially filled d-orbitals exhibit reversible redox processes located on the metalcentre. This is true for Cr, Mn, Fe and Co macrocyclic complexes. The frontierorbitals of these complexes have d-character and have the proper symmetry to bindan extraplanar ligand like O2. On the other hand, Ni, Cu and Zn complexes exhibitno redox process centred on the metal and redox processes involve the ligand. Thesecomplexes show less catalytic activity for ORR and other reactions. We will discussfurther down the important role that the redox potential plays in dictating thecatalytic activity. As a graphical example, Figure 6 illustrates electron tunnelingmicroscopy images obtained with CoPc and CuPc by two different authors [12, 19].It is clear that CoPc shows an electron-rich zone on the central metal in contrast toCuPc. This is corroborated in the same Figure 6C by frontier orbital profiles
Figure 5.Correlation between electrocatalytic activity (as potential at constant current) versus the number of d-electronsfor ORR in alkaline media on metallo-phthalocyanines (A) and metal porphyrins (B) (data on MPcs from[12] and MPs from [19]).
Figure 6.(A and B) tunnel microscopy images of CuPc (inactive) and CoPc (active) adsorbed on Au (adapted from[20, 21]). (C) theoretical profiles of frontier orbitals of CoPc and CuPc (taken from [22] with permissionfrom Elsevier).
8
Redox

obtained theoretically that show that CoPc exhibits a prominent d-orbital that canbind O2 in contrast again to CuPc. These images are in agreement with the reactivitytrends shown in Figure 5A.
Figure 7 illustrates a correlation of catalytic activity as (log i)E for ORR atconstant potential versus the M(III)/(II) redox potential of the catalyst; the datawas obtained in acid solution (8 M H2SO4) [23]. It is clear from this figure that theactivity increases almost linearly with the redox potential of the catalyst up to apoint and then decreases. A maximum activity is observed for octaethyl CoPs (seeCoOEP in Figure 7). It is interesting that Fe complexes appear on one side of thevolcano and Co complexes on the other side. These volcano-shaped correlations arevery common in electrocatalysis and heterogeneous catalysis, but instead of theredox potential a parameter is used that describes the degree of interaction of O2
with the active site. In recent work the M-O2 binding energy is used [6], and thisparameter is the most common reactivity descriptor. The data in Figure 7 stronglysuggests that the redox potential of the catalyst is a reactivity descriptor and thenshould be related to the M-O2 energy.
Figure 8 clearly shows that there is a direct correlation between the M(III)/(II)redox potential of the catalyst and the M-O2 binding energy, for redox dataobtained in alkaline media [6]. The data in Figure 8 indicates that the M-O2 bindingis a reactivity descriptor for ORR catalysed by MN4 macrocyclic complexes as iswell established for metal electrodes [24]. Strong binding catalysts appear on theleft side of the volcano, and weak binding catalysts appear on the right-hand side ofthe correlation, illustrating that these catalysts follow the Sabatier principle that forachieving the highest catalytic activity, the binding needs to be not too strong andnot too weak. The volcano correlation illustrated in Figure 8 bears a strong resem-blance with similar volcano correlations obtained for ORR catalysed by pure metals[24]. For both MN4 complexes and pure metals, strong binding catalysts promotethe four-electron reduction of O2 to water or OH�, whereas weak binding catalystsonly promote the two-electron reduction to hydrogen peroxide.
Figure 9 illustrates the potentiodynamic response of CoPc/OPG and FePc/OPG,where OPG is ordinary pyrolytic graphite electrode, and also the reduction wave for
Figure 7.Illustration of volcano correlations of catalytic activity as (log i)E for ORR at constant potential versus the M(III)/(II) redox potential of the catalyst. The data was obtained in acid solution (8 M H2S4) [23].
9
Redox Potentials as Reactivity Descriptors in ElectrochemistryDOI: http://dx.doi.org/10.5772/intechopen.89883

ORR obtained on rotating OPG disk modified with monolayers of CoPc or FePc.Both complexes exhibit M(II)/(I) and M(III)/(II) reversible redox couples in thepotential range examined. However, there are some striking differences in theresponse of these two complexes: first, the Co(II)/(I) and Co(III)/(II) redox couplesappear much more separated for CoPc than similar processes occurring on FePc. ForCoPc the onset for ORR appears at potentials between the Co(II)/(I) and Co(III)/(II) transitions, and the onset is well removed in the positive direction from the Co(III)/(II) redox potential, whereas for FePc, the onset for ORR appears at a potentialclose and more positive than the Fe(III)/(II). In this case ORR starts at potentialswhere the surface coverage by Fe(II) active sites is potential-dependent, and thiscoverage gradually increases as the potential is scanned to more negative potentials[25]. Figure 10 illustrates the potential dependence of the coverage of the surface by
Figure 8.(A) Correlation of electrocatalytic versus M(III)/(II) redox potential of the MN4 complexes and (B) versus theM-O2 binding energy to the metal center in the MN4 complex (ref.[6] and references there in).
Figure 9.(A) Cyclic voltammogram obtained in 0.1 M NaOH with an ordinary pyrolytic graphite (OPG) disk electrodemodified with a monolayer of CoPc in the absence of O2. The bottom of that figure shows a polarization curveobtained with the same electrode, in the presence of O2 (saturated) and with rotation of 1000 rpm. (B)Analogous to (A) but with the OPG electrode modified with FePc [25].
10
Redox
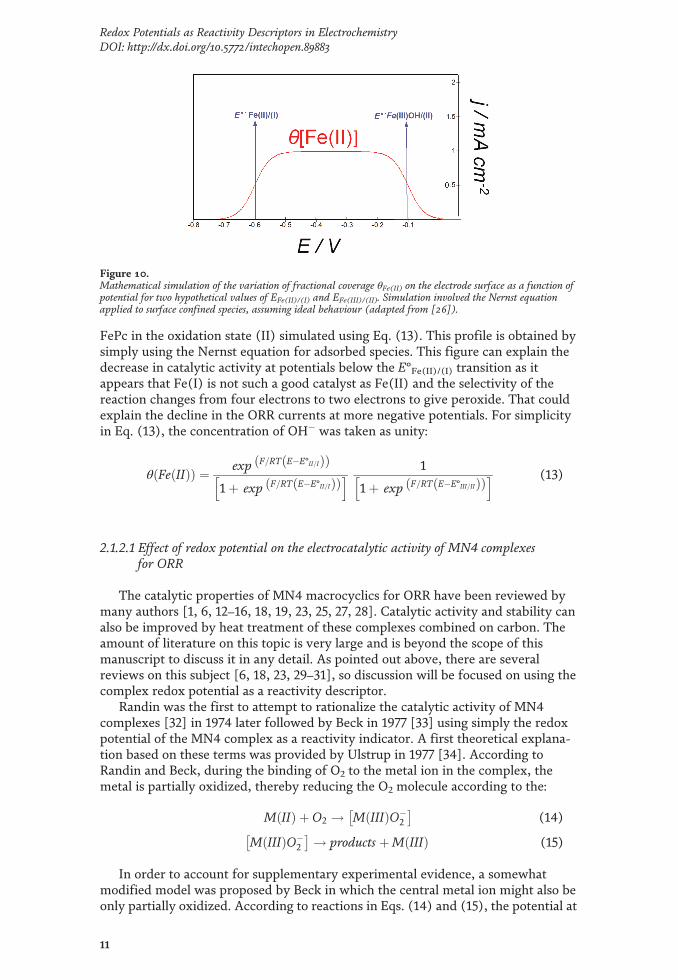
FePc in the oxidation state (II) simulated using Eq. (13). This profile is obtained bysimply using the Nernst equation for adsorbed species. This figure can explain thedecrease in catalytic activity at potentials below the E°Fe(II)/(I) transition as itappears that Fe(I) is not such a good catalyst as Fe(II) and the selectivity of thereaction changes from four electrons to two electrons to give peroxide. That couldexplain the decline in the ORR currents at more negative potentials. For simplicityin Eq. (13), the concentration of OH� was taken as unity:
θ Fe IIð Þð Þ ¼ exp F=RT E�E°II=Ið Þð Þ1þ exp F=RT E�E°II=Ið Þð Þh i 1
1þ exp F=RT E�E°III=IIð Þð Þh i (13)
2.1.2.1 Effect of redox potential on the electrocatalytic activity of MN4 complexesfor ORR
The catalytic properties of MN4 macrocyclics for ORR have been reviewed bymany authors [1, 6, 12–16, 18, 19, 23, 25, 27, 28]. Catalytic activity and stability canalso be improved by heat treatment of these complexes combined on carbon. Theamount of literature on this topic is very large and is beyond the scope of thismanuscript to discuss it in any detail. As pointed out above, there are severalreviews on this subject [6, 18, 23, 29–31], so discussion will be focused on using thecomplex redox potential as a reactivity descriptor.
Randin was the first to attempt to rationalize the catalytic activity of MN4complexes [32] in 1974 later followed by Beck in 1977 [33] using simply the redoxpotential of the MN4 complex as a reactivity indicator. A first theoretical explana-tion based on these terms was provided by Ulstrup in 1977 [34]. According toRandin and Beck, during the binding of O2 to the metal ion in the complex, themetal is partially oxidized, thereby reducing the O2 molecule according to the:
M IIð Þ þO2 ! M IIIð ÞO�2
� �(14)
M IIIð ÞO�2
� � ! productsþM IIIð Þ (15)
In order to account for supplementary experimental evidence, a somewhatmodified model was proposed by Beck in which the central metal ion might also beonly partially oxidized. According to reactions in Eqs. (14) and (15), the potential at
Figure 10.Mathematical simulation of the variation of fractional coverage θFe(II) on the electrode surface as a function ofpotential for two hypothetical values of EFe(II)/(I) and EFe(III)/(II). Simulation involved the Nernst equationapplied to surface confined species, assuming ideal behaviour (adapted from [26]).
11
Redox Potentials as Reactivity Descriptors in ElectrochemistryDOI: http://dx.doi.org/10.5772/intechopen.89883

which O2 is reduced should be closely related to the M(III)/M(II) redox potential ofthe central metal ion. Later studies published by van Veen et al. [23] using mea-surements of the redox potential of the complex under the same conditions as thoseunder which the ORR kinetic data were obtained showed for the first time thatthe activity of several metal complexes, plotted as log i at constant potentialversus the M(III)/(II) redox potential of the catalyst, gave a volcano-shapedcurve (Figure 7).
More recent results comparing the activity of a large collection of MN4 catalystsfor ORR in alkaline media is shown in Figure 8. The data was reported by Zagal andKoper [6]. The volcano correlation illustrated in Figure 8 shows two features. Onthe weak binding side, the two-electron reduction catalysts appear. According tothe Sabatier principle for maximum catalytic activity, the binding of the reactingmolecule needs to be not too strong and not too weak and to essentially explain theshape of the correlation where low activity is observed for low M-O2 binding andfor high M-O2 binding energies. The highest activity is achieved for intermediateM-O2 binding energies. The shape of the volcano correlation can also be explainedusing a Langmuir isotherm that essentially defines the coverage (θ) of M-O2 specieson the catalytic surface. Catalysts binding O2 very weakly give very low values of θand low activities, and the opposite is true for catalysts binding O2 very stronglywhich give values of θ approaching unity, and in that case practically all the surfaceis occupied with adsorbed intermediates, blocking the active sites and again givingvery low activities. These two extreme cases represent the foothills of both sides ofthe volcano correlation. It can be demonstrated that under standard conditions, theapex of the volcano corresponds to a situation where θ = 0.5 and ΔG°O2 = 0. Forsimplicity we consider the binding of O2 to the active sites occurring with thetransfer of a first electron, Eq. (17). This is generally the bottleneck of the wholereduction process leading to peroxide (two-electron transfers) or to water (four-electron transfer):
M IIIð ÞOHN4½ �ad þ e� ! M IIð ÞN4½ �ad þOH� (16)
M IIð ÞN4½ �ad þ O2 þ e� ! O2 �MN�4
� �ad (17)
Depending on the catalyst, this equation will be shifted to the product (strongadsorption) or to the reactants (weak adsorption). Other adsorption steps canoccur, involving other intermediates. The kinetic current density for a given poten-tial consistent with the Butler-Volmer equation is given by the following equationneglecting the back reaction:
i ¼ nFk θM IIð Þ pO2 1� θð Þ exp �βFE=RT exp �β´ΔG°ad=RT (18)
where β is the symmetry factor of the energy barrier and β’ the is the Brönsted-Polanyi coefficient. β and β’ can be assumed to be 0.5.
From the data in Figure 8 we can assume that ΔG°ad = nFE° + C, where E° = isthe M(III)/(II) formal potential of each complex. The surface coverage of activesites varies as 0 < θM(II) < 1 depending on the electrode potential. Figure 10 showsa simulation of the variation of θM(II) with potential using the Nernst equation foradsorbed species [26].
However, in the case of metal complexes with very negative redox potentials,the Fe(III)/Fe(II) redox transition also comes into play, lowering the fraction ofcatalytically active sites θ[M(II)] as illustrated in Figure 10. The M(II) active siteswill predominate in the potential range, E°’(II/I) ≤ E ≤ E°’(III/II), as illustrated inFigure 10.
12
Redox

Since the Fe(III) binds OH� [35], these sites will be inactive for the reduction ofO2; the coverage of adsorbed O2 can be assumed to follow a Langmuir isotherm:
θ ¼ pO2 exp �ΔG°O2=RTð Þ
1þ pO2 exp �ΔG°O2=RTð Þ� � (19)
In volcano plots, the data for different catalysts is compared at constant E, so theButler-Volmer exponential term for simplicity can be absorbed into the constant k’.For small coverages, ΔG°O2 is positive so Eq. (19) can be written as:
k0 ¼ k exp �βFE=RTð Þ (20)
i ¼ nFk0θM IIð Þ pO2 1� θadð Þ exp �β0ΔG°ad=RTð Þ (21)
1� θð Þ ¼ 1þ pO2 exp �ΔG°O2=RTð Þ
1þ pO2 exp �ΔG°O2=RTð Þ� �� pO2 exp�ΔG°O2=RTð Þ
1þ pO2 exp �ΔG°O2=RTð Þ (22)
1� θð Þ ¼ 11þ pO2 exp �ΔG°O2=RTð Þ� � (23)
i ¼ θFe IIð ÞnFk0pO2 exp �β0ΔG°O2=RTð Þ
1þ pO2 exp �ΔG°O2=RTð Þ� � (24)
Equation (24) essentially describes the shape of the volcano plot of log i vs.ΔG°O2 and that the maximum current density will be observed for ΔG°O2 = 0, andthe maximum current at the apex of the volcano is:
i ¼ nFk0θFe IIð Þ pO21þ pO2� � (25)
For strong adsorption, ΔG°O2 is large with a negative sign so 1 << pO2exp(�ΔGO2/RT), so the general Eq. (25) becomes:
Strong adsorption:
i ¼ nFk0 ΓθFe IIð Þ exp þβ0ΔG°O2=RTð Þ (26)
Equation (26) explains the linear correlation in the region of strong adsorption(ΔG°O2 is negative) and is essentially independent of the concentration of thereactant, in this case, O2.
For weak adsorption, ΔG°O2 is very positive, the term pO2exp(�ΔG°O2/RT) << 1in Eq. (24) vanishes, and the general Eq. (24) becomes simply:
Weak adsorption:
i ¼ nFk0 θFe IIð Þ pO2 exp �β0ΔG°ad=RTð Þ (27)
So, Eqs. (26) and (27) describe both linear correlations in the volcano plots withslopes of different signs, i.e. +β’/RT for the strong adsorption region and�β’ΔG°O2/RTfor the weak adsorption region. According to this, the volcano plot should be sym-metrical since both legs of the volcano have the same absolute value of the slope. It isnecessary to clarify that in theoretical calculations, the binding energy ΔEbO2 is usedbecause it does not contain entropy terms as ΔG°O2 and the entropic terms aredifficult to estimate. The binding energy is essentially the energy to break the M-O2
bond. If we use ΔG°ad = nFE° + C and replacing the formula described above, theconstant “C” can be adsorbed in a new constant k”:
13
Redox Potentials as Reactivity Descriptors in ElectrochemistryDOI: http://dx.doi.org/10.5772/intechopen.89883
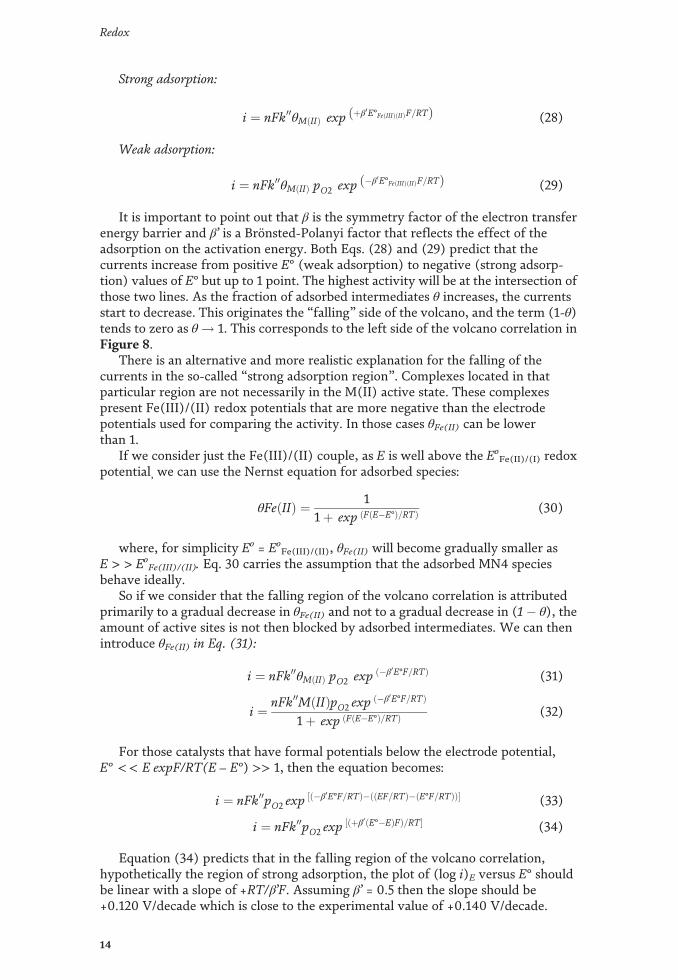
Strong adsorption:
i ¼ nFk00θM IIð Þ exp þβ0E°Fe IIIð Þ IIð ÞF=RTð Þ (28)
Weak adsorption:
i ¼ nFk00θM IIð Þ pO2 exp �β0E°Fe IIIð Þ IIð ÞF=RTð Þ (29)
It is important to point out that β is the symmetry factor of the electron transferenergy barrier and β’ is a Brönsted-Polanyi factor that reflects the effect of theadsorption on the activation energy. Both Eqs. (28) and (29) predict that thecurrents increase from positive E° (weak adsorption) to negative (strong adsorp-tion) values of E° but up to 1 point. The highest activity will be at the intersection ofthose two lines. As the fraction of adsorbed intermediates θ increases, the currentsstart to decrease. This originates the “falling” side of the volcano, and the term (1-θ)tends to zero as θ! 1. This corresponds to the left side of the volcano correlation inFigure 8.
There is an alternative and more realistic explanation for the falling of thecurrents in the so-called “strong adsorption region”. Complexes located in thatparticular region are not necessarily in the M(II) active state. These complexespresent Fe(III)/(II) redox potentials that are more negative than the electrodepotentials used for comparing the activity. In those cases θFe(II) can be lowerthan 1.
If we consider just the Fe(III)/(II) couple, as E is well above the EoFe(II)/(I) redox
potential, we can use the Nernst equation for adsorbed species:
θFe IIð Þ ¼ 11þ exp F E�E°ð Þ=RTð Þ (30)
where, for simplicity Eo = EoFe(III)/(II), θFe(II) will become gradually smaller as
E > > EoFe(III)/(II). Eq. 30 carries the assumption that the adsorbed MN4 species
behave ideally.So if we consider that the falling region of the volcano correlation is attributed
primarily to a gradual decrease in θFe(II) and not to a gradual decrease in (1 � θ), theamount of active sites is not then blocked by adsorbed intermediates. We can thenintroduce θFe(II) in Eq. (31):
i ¼ nFk00θM IIð Þ pO2 exp �β0E°F=RTð Þ (31)
i ¼ nFk00M IIð ÞpO2 exp �β0E°F=RTð Þ
1þ exp F E�E°ð Þ=RTð Þ (32)
For those catalysts that have formal potentials below the electrode potential,E° << E expF/RT(E – E°) >> 1, then the equation becomes:
i ¼ nFk00pO2 exp�β0E°F=RTð Þ� EF=RTð Þ� E°F=RTð Þð Þ½ � (33)
i ¼ nFk00pO2 expþβ0 E°�Eð ÞFð Þ=RT½ � (34)
Equation (34) predicts that in the falling region of the volcano correlation,hypothetically the region of strong adsorption, the plot of (log i)E versus E° shouldbe linear with a slope of +RT/β’F. Assuming β’ = 0.5 then the slope should be+0.120 V/decade which is close to the experimental value of +0.140 V/decade.
14
Redox
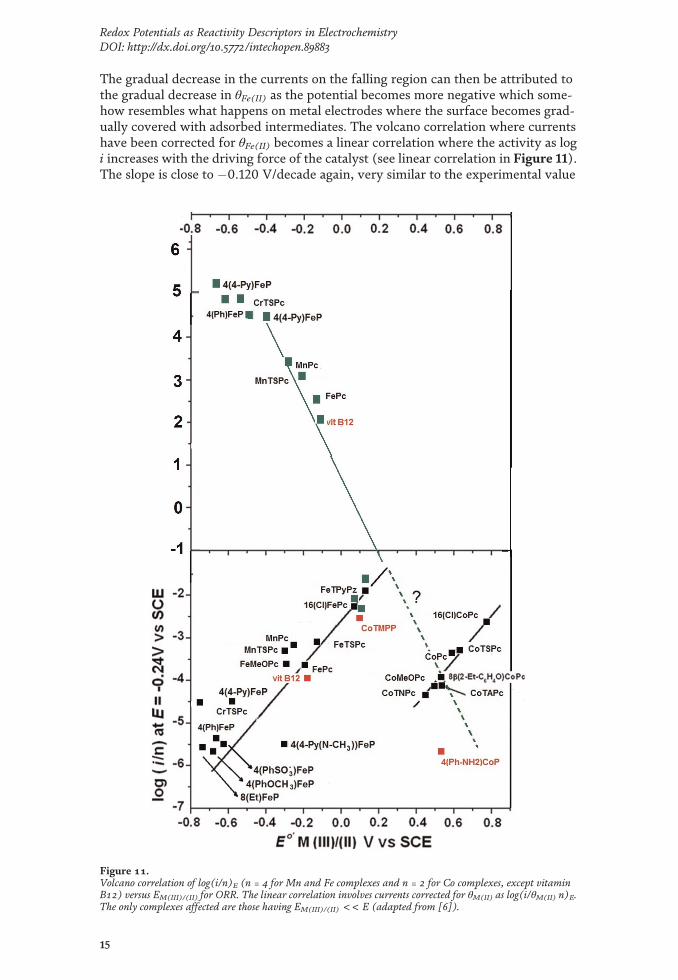
The gradual decrease in the currents on the falling region can then be attributed tothe gradual decrease in θFe(II) as the potential becomes more negative which some-how resembles what happens on metal electrodes where the surface becomes grad-ually covered with adsorbed intermediates. The volcano correlation where currentshave been corrected for θFe(II) becomes a linear correlation where the activity as logi increases with the driving force of the catalyst (see linear correlation in Figure 11).The slope is close to �0.120 V/decade again, very similar to the experimental value
Figure 11.Volcano correlation of log(i/n)E (n = 4 for Mn and Fe complexes and n = 2 for Co complexes, except vitaminB12) versus EM(III)/(II) for ORR. The linear correlation involves currents corrected for θM(II) as log(i/θM(II) n)E.The only complexes affected are those having EM(III)/(II) << E (adapted from [6]).
15
Redox Potentials as Reactivity Descriptors in ElectrochemistryDOI: http://dx.doi.org/10.5772/intechopen.89883

of �0.130 V/decade. This also suggests that the redox potential of the catalysts actsas the driving force of the reaction, in a similar way of the electrode potential. Theslope of this correlation is a linear free-energy correlation similar to a Tafel linewhere the driving force is provided by the overpotential. In inner-sphere chemicalcatalysis or electrocatalysis, the reacting molecule, in this case O2, does react pro-moted by two independent parameters: the electrode potential and the redoxpotential of the catalyst. The redox potential of the catalyst represents an excellentreactivity descriptor as it can be measured under the same conditions of the kineticexperiments. It is important to point out that the reactivity guidelines provided byMN4 macrocyclic complexes are also valid for smaller complexes like Cuphenanthrolines where the activity also depends in this case on the Cu(II)/(I) redoxpotential where the active state is Cu(I). For these complexes the activity of (log i)Eincreases with the Cu(II)/(I) redox potential according to a linear correlation with aslope close to +0.120 V/decade. No volcano correlation is observed in this case.Since the slope has a positive sign, the correlation might correspond to the strongadsorption region, but this is not the case since calculated Cu-O2 binding energiesincrease with the redox potential. In contrast to metal phthalocyanines and metalporphyrins, θCu(I) is practically constant and equal to 1 since kinetic measurementswere conducted at potentials well below the Cu(II)/(I) formal potentials of thecatalysts examined. This will be discussed in detail in section 2.1.2.3.
Figure 12 shows a correlation for a series of Mn porphyrins for ORR versus theMn(III)/(II) redox potential of the complexes. Again, the correlation has the shapeof a volcano. Since as a parameter of activity the half-wave potential was used, it isdifficult to estimate if the falling region is attributed to a damping effect of θMn(II).However, the values of E1/2 are well above the redox potential of the complexes.
2.1.2.2 Pyrolysed catalysts for ORR
As pointed out above, intact molecular catalysts like the metal complexesdescribed above are not stable in fuel cell electrolytes so a whole new area ofresearch started in the 1970s. The aim was to obtain pyrolytic materials from heat-treated MN4 complexes or other ingredients involving metal salts and carbon- andnitrogen-containing compounds [18, 29–31, 36–38]. Heat treatments of up to 1000°C have been used, and the structure of the obtained catalysts is still a matter of
Figure 12.Volcano correlation of half-wave potential E1/2 ORR versus the EMn(III)/(II) [19] (reproduced by permission ofWiley).
16
Redox
debate. These materials are not only more stable but importantly also more active.The effects of the heat treatment on the activity were interpreted by van Veen et al.in terms of the M(III)/(MII) redox potential [29, 30]. For example, when Fe por-phyrins are pyrolysed, the ligand is destroyed by the pyrolysis, and the resultingsurrounding ligand is much more electron-withdrawing in character. This results ina dramatic shift in the Fe(III)/(II) redox potential to more positive values. Literally,with heat treatment, the catalyst climbs the volcano correlation towards the top.Catalysts prepared without using a MN4 complex but other ingredients also exhibitmore positive redox potentials than intact metal complexes. Many very highlyactive pyrolysed MNx catalysts do not exhibit visible redox signals in cyclicvoltammograms, especially those prepared at higher temperatures, so the redoxpotential as predictor is lost. This could be attributed to the heterogeneity of activesites that can be formed at higher temperatures. Many authors have studied thechanges occurring in carbon-supported metalloporphyrins and metallo-phthalocyanines. A variety of physical techniques have been used including X-rayphotoelectron spectroscopy (XPS), Fourier-transform infrared spectroscopy,electron spin resonance and Mössbauer spectrometry and EXAFS [30].
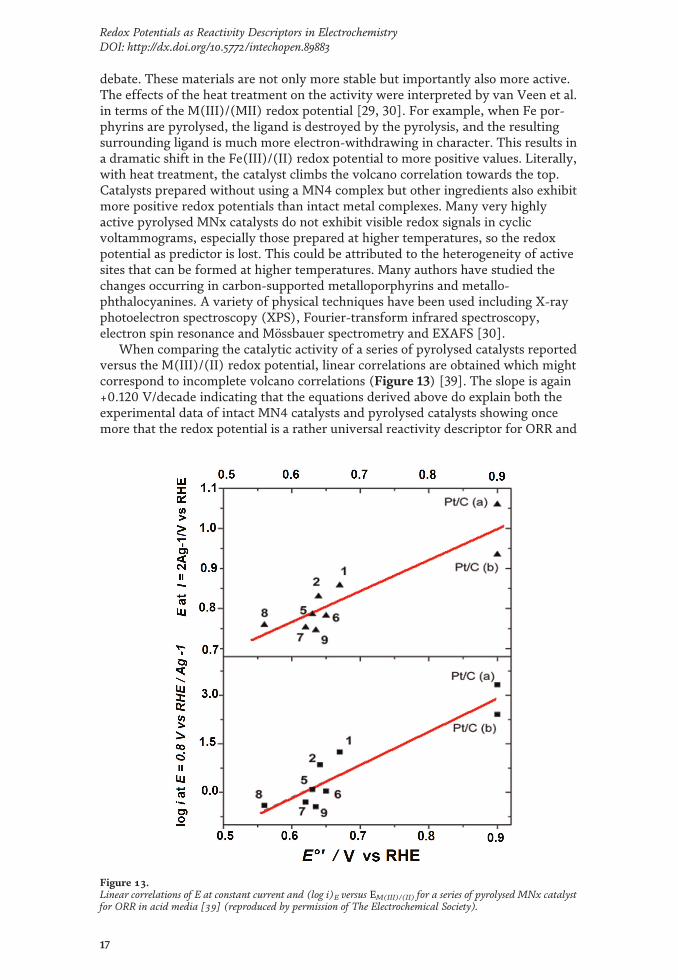
When comparing the catalytic activity of a series of pyrolysed catalysts reportedversus the M(III)/(II) redox potential, linear correlations are obtained which mightcorrespond to incomplete volcano correlations (Figure 13) [39]. The slope is again+0.120 V/decade indicating that the equations derived above do explain both theexperimental data of intact MN4 catalysts and pyrolysed catalysts showing oncemore that the redox potential is a rather universal reactivity descriptor for ORR and
Figure 13.Linear correlations of E at constant current and (log i)E versus EM(III)/(II) for a series of pyrolysed MNx catalystfor ORR in acid media [39] (reproduced by permission of The Electrochemical Society).
17
Redox Potentials as Reactivity Descriptors in ElectrochemistryDOI: http://dx.doi.org/10.5772/intechopen.89883

possibly for other reactions [12, 13, 26]. The literature in this subject is very abun-dant, and more details and discussion about this pyrolysed MNx catalysts arebeyond the scope of this chapter. However, it is important to remark that the redoxpotential is a reactivity predictor for this very important family of catalysts.
2.1.2.3 Cu non-macrocyclic complexes
In nature copper-containing laccase is an enzyme that under certain conditionscan promote the four-electron reduction of O2 to water without the formation ofany peroxide. Laccase only works at a very narrow pH range, and its large molecularsize prevents high current densities. The reaction can occur at very lowoverpotentials, and this is indeed very unusual in ORR catalysts. For this reason,some authors [40–43] have explored the catalytic activity for ORR of simpler Cucomplexes. For copper complexes, the active state is Cu(I). We will focus ourdiscussion on the effect of the redox potential. The reactivity trends of metalphthalocyanines and metal porphyrins illustrated in Figures 5 and 6 show thatCuN4 complexes exhibit very low activity for ORR. One of the reason for the lowactivity is that these Cu complexes are in the oxidation state Cu(II) and cannot bereduced to Cu(I) due to the rigidity of the planar phthalocyanine ligand since thereduction process involves a change in geometry around the Cu centre from planarCu(II) to tetrahedral (Cu(I) (see Figure 14). The other reason is that CuPc has nofrontier orbital with d-metal character that can bind O2. This was illustrated in
Figure 14.Illustration of changes in geometry when Cu(I) is oxidized to Cu(II) in a Cu(phen)2 complex.
18
Redox
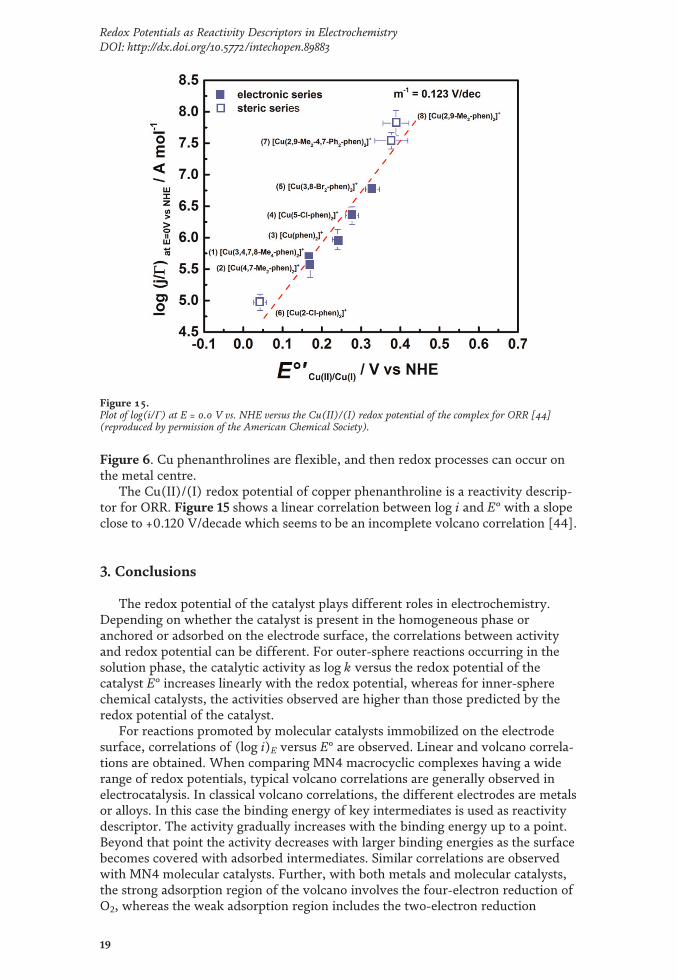
Figure 6. Cu phenanthrolines are flexible, and then redox processes can occur onthe metal centre.
The Cu(II)/(I) redox potential of copper phenanthroline is a reactivity descrip-tor for ORR. Figure 15 shows a linear correlation between log i and E° with a slopeclose to +0.120 V/decade which seems to be an incomplete volcano correlation [44].
3. Conclusions
The redox potential of the catalyst plays different roles in electrochemistry.Depending on whether the catalyst is present in the homogeneous phase oranchored or adsorbed on the electrode surface, the correlations between activityand redox potential can be different. For outer-sphere reactions occurring in thesolution phase, the catalytic activity as log k versus the redox potential of thecatalyst E° increases linearly with the redox potential, whereas for inner-spherechemical catalysts, the activities observed are higher than those predicted by theredox potential of the catalyst.
For reactions promoted by molecular catalysts immobilized on the electrodesurface, correlations of (log i)E versus E° are observed. Linear and volcano correla-tions are obtained. When comparing MN4 macrocyclic complexes having a widerange of redox potentials, typical volcano correlations are generally observed inelectrocatalysis. In classical volcano correlations, the different electrodes are metalsor alloys. In this case the binding energy of key intermediates is used as reactivitydescriptor. The activity gradually increases with the binding energy up to a point.Beyond that point the activity decreases with larger binding energies as the surfacebecomes covered with adsorbed intermediates. Similar correlations are observedwith MN4 molecular catalysts. Further, with both metals and molecular catalysts,the strong adsorption region of the volcano involves the four-electron reduction ofO2, whereas the weak adsorption region includes the two-electron reduction
Figure 15.Plot of log(i/Γ) at E = 0.0 V vs. NHE versus the Cu(II)/(I) redox potential of the complex for ORR [44](reproduced by permission of the American Chemical Society).
19
Redox Potentials as Reactivity Descriptors in ElectrochemistryDOI: http://dx.doi.org/10.5772/intechopen.89883
catalysts. The decrease in activity for ORR using MN4 metal complexes does notseem to be related to a gradual occupation of the active site but rather to a gradualdecrease in the amount of M(II) active sites. This is observed for those catalysts thathave M(III)/(II) redox potentials more negative than the electrode potential chosenfor comparing the activities. Cu phenanthroline complexes follow similar correla-tions. It is observed that the activity increases as the Cu(II)/(I) redox potentialincreases, showing only a linear correlation.
A general conclusion from electrocatalytic phenomena is that if volcano correla-tions are well established, then for a particular reaction the properties of the catalystcan be “tuned” so to improve their activity. The optimal properties can involvemany other parameters such as metal-to-metal separation, crystal orientation, sta-bility, alloying, nanostructure and redox potential of catalyst, so this is an open fieldfor both experimentalists and theoreticians to find the ways of improving thecatalytic activity of electrode surfaces.
The implications of future development in this area will have a tremendousimpact in energy conversion devices, electrosynthesis and electrochemical sensors,just to mention a few.
Acknowledgements
This work has been financed by the Fondecyt Project 1181037, Fondecyt Project1171408 and 1140199 and Núcleo Milenio de Ingeniería Molecular P07-006.
Author details
José H. Zagal*, Ingrid Ponce and Ruben OñateDepartment de Chemistry of Materials, Department of Chemistry of theEnvironment, Faculty of Chemistry and Biology, Laboratory of Electrocatalysis,University of Santiago de Chile, Santiago, Chile
*Address all correspondence to: [email protected]
© 2019 TheAuthor(s). Licensee IntechOpen. This chapter is distributed under the termsof theCreativeCommonsAttribution License (http://creativecommons.org/licenses/by/3.0),which permits unrestricted use, distribution, and reproduction in anymedium,provided the original work is properly cited.
20
Redox

References
[1] Appleby AJ, Zagal JH. Free energyrelationships in electrochemistry: Ahistory that started in 1935. Journal ofSolid State Electrochemistry. 2011;15:1811-1832. DOI: 10.1007/s10008-011-1394-8
[2] Frumkin A. Bemerkung zur Theorieder Wasserstoffüberspannung.Zeitschrift für Physikalische Chemie.1932;160A:116-118. DOI: 10.1515/zpch-1932-16011
[3] Bockris JO, Khan SUM. Someexperimental techniques. In: SurfaceElectrochemistry. Boston, MA:Springer US; 1993. pp. 1-58. DOI:10.1007/978-1-4615-3040-4_1
[4] Tafel J. Über die Polarisation beikathodischer Wasserstoffentwicklung.Zeitschrift für Physikalische Chemie.1905;50:641-712. DOI: 10.1515/zpch-1905-5043
[5] Petrii OA, Nazmutdinov RR,Bronshtein MD, Tsirlina GA. Life of theTafel equation: Current understandingand prospects for the second century.Electrochimica Acta. 2007;52:3493-3504. DOI: 10.1016/j.electacta.2006.10.014
[6] Zagal JH, Koper MTM. Reactivitydescriptors for the activity of molecularMN4 catalysts for the oxygen reductionreaction. Angew Chemie. 2016;55:14510-14521. DOI: 10.1002/anie.201604311
[7] Savéant J-M. Elements ofMolecular and BiomolecularElectrochemistry. Hoboken, NJ, USA:John Wiley & Sons, Inc.; 2006. DOI:10.1002/0471758078
[8] Lexa D, Mispelter J, Savéant JM.Electroreductive alkylation of iron inporphyrin complexes. Electrochemicaland spectral characteristics of Sigma.-alkylironporphyrins. Journal of the
American Chemical Society. 1981;103:6806-6812. DOI: 10.1021/ja00413a004
[9] Lexa D, Savéant JM, Wang DL.Electroreductive alkylation of ironporphyrins. Iron(III), iron(II) and iron(I) alkyl complexes from the reaction ofdoubly reduced iron(II) porphyrinswith alkyl halides. Organometallics.1986;5:1428-1434. DOI: 10.1021/om00138a022
[10] Lexa D, Savéant JM, Su KB,Wang DL. Chemical vs. redox catalysisof electrochemical reactions. Reductionof trans-1,2-dibromocyclohexane byelectrogenerated aromatic anion radicalsand low oxidation statemetalloporphyrins. Journal of theAmerican Chemical Society. 1987;109:6464-6470. DOI: 10.1021/ja00255a036
[11] Lexa D, Savéant JM, Schaefer HJ,Khac Binh S, Vering B, Wang DL.Outer-sphere and inner-sphereprocesses in reductive elimination.Direct and indirect electrochemicalreduction of vicinal dibromoalkanes.Journal of the American ChemicalSociety. 1990;112:6162-6177. DOI:10.1021/ja00173a002
[12] Zagal JH. Metallophthalocyanines ascatalysts in electrochemical reactions.Coordination Chemistry Reviews. 1992;119:89-136. DOI: 10.1016/0010-8545(92)80031-L
[13] Zagal JH, Griveau S, Silva JF,Nyokong T, Bedioui F.Metallophthalocyanine-based molecularmaterials as catalysts forelectrochemical reactions. CoordinationChemistry Reviews. 2010;254:2755-2791. DOI: 10.1016/j.ccr.2010.05.001
[14] Masa J, Ozoemena K,Schuhmann W, Zagal JH. Oxygenreduction reaction using N4 -metallomacrocyclic catalysts:
21
Redox Potentials as Reactivity Descriptors in ElectrochemistryDOI: http://dx.doi.org/10.5772/intechopen.89883
Fundamentals on rational catalystdesign. Journal of Porphyrins andPhthalocyanines. 2012;16:761-784. DOI:10.1142/S1088424612300091
[15] Boulatov R. Billion-year-old oxygencathode that actually works: Respiratoryoxygen reduction and its biomimeticanalogs. In: Zagal JH, Bedioui F, DodeletJ-P, editors. N4-Macrocyclic MetalComplexes. New York, NY: SpringerNew York; 2006. pp. 1-40. DOI:10.1007/978-0-387-28430-9_1
[16] Zagal JH, Páez MA, Silva JF.Fundamental aspects on the catalyticactivity of metallomacrocyclics for theelectrochemical reduction of O2. In:Zagal JH, Bedioui F, Dodelet J-P,editors. N4-Macrocyclic MetalComplexes. New York, NY: SpringerNew York; 2006. pp. 41-82. DOI:10.1007/978-0-387-28430-9_2
[17] Jasinski R. A new fuel cell cathodecatalyst. Nature. 1964;201:1212-1213.DOI: 10.1038/2011212a0
[18] Dodelet J-P. Oxygen reduction inPEM fuel cell conditions: Heat-treatednon-precious metal-N4 macrocycles andbeyond. In: Zagal JH, Bedioui F, DodeletJ-P, editors. N4-Macrocyclic MetalComplexes. New York, NY: SpringerNew York; 2006. pp. 83-147. DOI:10.1007/978-0-387-28430-9_3
[19] Masa J, Schuhmann W. Systematicselection of metalloporphyrin-basedcatalysts for oxygen reduction bymodulation of the donor-acceptorintermolecular hardness. Chemistry:A European Journal. 2013;19:9644-9654. DOI: 10.1002/chem.201203846
[20] Hipps KW, Lu X, Wang XD,Mazur U. Metal d-orbital occupation-dependent images in the scanningtunneling microscopy of metalphthalocyanines. The Journal ofPhysical Chemistry. 1996;100:11207-11210. DOI: 10.1021/jp960422o
[21] Wang Y, Wu K, Kröger J, Berndt R.Review article: Structures ofphthalocyanine molecules on surfacesstudied by STM. AIP Advances. 2012;2:041402. DOI: 10.1063/1.4773458
[22] Cárdenas-Jirón GI, Gulppi MA,Caro CA, del Río R, Páez M, Zagal JH.Reactivity of electrodes modified withsubstituted metallophthalocyanines.Correlations with redox potentials,Hammett parameters and donor-acceptor intermolecular hardness.Electrochimica Acta. 2001;46:3227-3235.DOI: 10.1016/S0013-4686(01)00614-4
[23] van Veen JAR, van Baar JF,Kroese KJ. Effect of heat treatment onthe performance of carbon-supportedtransition-metal chelates in theelectrochemical reduction of oxygen.Journal of the Chemical Society,Faraday Transactions. 1981;77:2827-2843. DOI: 10.1039/f19817702827
[24] Nørskov JK, Rossmeisl J,Logadottir A, Lindqvist L, Kitchin JR,Bligaard T, et al. Origin of theoverpotential for oxygen reduction at afuel-cell cathode. The Journal ofPhysical Chemistry. B. 2004;108:17886-17892. DOI: 10.1021/jp047349j
[25] Zagal JH, Javier Recio F,Gutierrez CA, Zuñiga C, Páez MA,Caro CA. Towards a unified way ofcomparing the electrocatalytic activityMN4 macrocyclic metal catalysts for O2reduction on the basis of the reversiblepotential of the reaction.Electrochemistry Communications.2014;41:24-26. DOI: 10.1016/j.elecom.2014.01.009
[26] Silva N, Calderón S, Páez MA,Oyarzún MP, Koper MTM, Zagal JH.Probing the Fen+/Fe(n � 1)+ redoxpotential of Fe phthalocyanines and Feporphyrins as a reactivity descriptor inthe electrochemical oxidation ofcysteamine. Journal of ElectroanalyticalChemistry. 2018;819:502-510. DOI:10.1016/J.JELECHEM.2017.12.068
22
Redox

[27] Zagal JH, Aguirre MJ, Páez MA.O2 reduction kinetics on a graphiteelectrode modified with adsorbedvitamin B12. Journal of ElectroanalyticalChemistry. 1997;437:45-52. DOI:10.1016/S0022-0728(97)00253-2
[28] Cárdenas-Jirón GI, Zagal JH.Donor–acceptor intermolecularhardness on charge transfer reactions ofsubstituted cobalt phthalocyanines.Journal of Electroanalytical Chemistry.2001;497:55-60. DOI: 10.1016/S0022-0728(00)00434-4
[29] van Veen JAR, Colijn HA, vanBaar JF. On the effect of a heattreatment on the structure of carbon-supported metalloporphyrins andphthalocyanines. Electrochimica Acta.1988;33:801-804. DOI: 10.1016/S0013-4686(98)80010-8
[30] Bouwkamp-Wijnoltz AL,Visscher W, van Veen JAR, Boellaard E,van der Kraan AM, Tang SC. On active-site heterogeneity in pyrolyzed carbon-supported iron porphyrin catalysts forthe electrochemical reduction ofoxygen: An in situ Mössbauer study. TheJournal of Physical Chemistry. B. 2002;106:12993-13001. DOI: 10.1021/jp0266087
[31] Chen Z, Higgins D, Yu A, Zhang L,Zhang J. A review on non-preciousmetal electrocatalysts for PEM fuelcells. Energy & EnvironmentalScience. 2011;4:3167. DOI: 10.1039/c0ee00558d
[32] Randin J-P. Interpretation of therelative electrochemical activity ofvarious metal phthalocyanines for theoxygen reduction reaction.Electrochimica Acta. 1974;19:83-85.DOI: 10.1016/0013-4686(74)85060-7
[33] Beck F. The redox mechanism of thechelate-catalyzed oxygen cathode.Journal of Applied Electrochemistry.1977;7:239-245. DOI: 10.1007/BF00618991
[34] Ulstrup J. Catalysis of theelectrochemical reduction of molecularoxygen by metal phthalocyanines.Journal of Electroanalytical Chemistry.1977;79:191-197. DOI: 10.1016/S0022-0728(77)80411-7
[35] Zagal JH, Gulppi M, Isaacs M,Cárdenas-Jirón G, Aguirre MJ. Linearversus volcano correlations betweenelectrocatalytic activity and redox andelectronic properties ofmetallophthalocyanines. ElectrochimicaActa. 1998;44:1349-1357. DOI: 10.1016/S0013-4686(98)00257-6
[36] Zhang L, Zhang J, Wilkinson DP,Wang H. Progress in preparation ofnon-noble electrocatalysts for PEM fuelcell reactions. Journal of Power Sources.2006;156:171-182. DOI: 10.1016/J.JPOWSOUR.2005.05.069
[37] Bezerra CWB, Zhang L, Liu H,Lee K, Marques ALB, Marques EP, et al.A review of heat-treatment effects onactivity and stability of PEM fuel cellcatalysts for oxygen reduction reaction.Journal of Power Sources. 2007;173:891-908. DOI: 10.1016/J.JPOWSOUR.2007.08.028
[38] Song C, Zhang J. Electrocatalyticoxygen reduction reaction. In: Zhang J,editor. PEM Fuel Cell Electrocatalystsand Catalyst Layers. London: SpringerLondon; 2008. pp. 89-134. DOI:10.1007/978-1-84800-936-3_2
[39] Zagal JH, Ponce I, Baez D,Venegas R, Pavez J, Paez M, et al. Apossible interpretation for the highcatalytic activity of heat-treated non-precious metal Nx/C catalysts for O2reduction in terms of their formalpotentials. Electrochemical and Solid-State Letters. 2012;15:B90. DOI:10.1149/2.032206esl
[40] Thorseth MA, Tornow CE,Tse ECM, Gewirth AA. Cu complexesthat catalyze the oxygen reductionreaction. Coordination Chemistry
23
Redox Potentials as Reactivity Descriptors in ElectrochemistryDOI: http://dx.doi.org/10.5772/intechopen.89883

Reviews. 2013;257:130-139. DOI:10.1016/j.ccr.2012.03.033
[41] McCrory CCL, Ottenwaelder X,Stack TDP, Chidsey CED. Kineticand mechanistic studies of theelectrocatalytic reduction of O2 to H2Owith mononuclear Cu complexes ofsubstituted 1,10-phenanthrolines. TheJournal of Physical Chemistry. A. 2007;111:12641-12650. DOI: 10.1021/jp076106z
[42] Solomon EI, Augustine AJ, Yoon J.O2 reduction to H2O by the multicopperoxidases. Dalton Transactions. 2008;30:3921. DOI: 10.1039/b800799c
[43] Lei Y, Anson FC. Dynamics of thecoordination equilibria in solutionscontaining copper(II), copper(I), and2,9-dimethyl-1,10-phenanthroline andtheir effect on the reduction of O2 by Cu(I). Inorganic Chemistry. 1995;34:1083-1089. DOI: 10.1021/ic00109a014
[44] Venegas R, Muñoz-Becerra K,Lemus LA, Toro-Labbé A, Zagal JH,Recio FJ. Theoretical and experimentalreactivity predictors for theelectrocatalytic activity of copperphenanthroline derivatives for thereduction of dioxygen. Journal ofPhysical Chemistry C. 2019;332:19468-19478. DOI: 10.1021/acs.jpcc.9b03200
24
Redox


![Descriptors for Sponge Gourd [Luffa cylindrica (L.) Roem.]](https://static.fdokumen.com/doc/165x107/63187e763394f2252e02b92e/descriptors-for-sponge-gourd-luffa-cylindrica-l-roem.jpg)