Synthesis, characterization and LPG response of Pd loaded Fe doped tin oxide thick films
8
Synthesis, characterization and LPG response of Pd loaded Fe doped tin oxide thick films L.P. Chikhale a , J.Y. Patil a , A.V. Rajgure a , R.C. Pawar b , I.S. Mulla c , S.S. Suryavanshi a,⇑ a School of Physical Sciences, Solapur University, Solapur 413255, India b Department of Materials Engineering, Hanyang University, ERICA Campus, Ansan 426-791, South Korea c Centre for Materials for Electronic Technology(C-MET), Pune 411008, India article info Article history: Received 21 September 2013 Received in revised form 6 April 2014 Accepted 7 April 2014 Available online 18 April 2014 Keywords: SnO 2 Palladium Fe doping Screen printing Thick film LPG sensor abstract The nanocrystalline powders of undoped, Fe doped tin oxide and Pd (1, 2 and 3 mol%) loaded Fe: SnO 2 were synthesized by co-precipitation method and characterized by using TGA–DTA, XRD, FE-SEM, EDAX, TEM, SAED, FTIR and Raman spectroscopy techniques. Gas sensing properties were investigated towards various reducing gases viz. liquid petroleum gas (LPG), ethanol, ammonia and acetone vapor. All the SnO 2 compositions revealed single phase solid solution formation. The TEM and SAED results of samples sintered at 650 °C for 2 h show particle size of 19 nm for undoped SnO 2 which was reduced to 5 nm on loading of Pd in Fe: SnO 2 . It is found that loading of Pd in Fe doped SnO 2 reduces the particle size and improves the gas response. The gas sensing measurements showed that the 3 mol% Pd loaded Fe: SnO 2 thick film sensor exhibited high response and good selectivity towards LPG at moderate operating temperature of 225 °C. Ó 2014 Elsevier B.V. All rights reserved. 1. Introduction Gas sensor play a key role in various industries such as chemical and petrochemical industries, food and drinks processing, semi- conductor manufacturing, agriculture, fabrication industries and many more. Amongst the devoted and applied family of gas sensors, semiconducting metal oxide (SMO) based gas sensors are of particular interest due to enhanced chemical interactions, high catalytic activity, and hence the sensing response. These gas sensors have been found to be extremely useful in detecting harmful and explosive pollutants present in the atmo- sphere. The response of SMO to a particular gas depends on the interaction between gas molecules and adsorbed oxygen species on the sensor surface, microstructure of sensor, temperature of operation, gas being analyzed and sensor packaging [1,2]. It has been reported by many researchers that the sensing properties of SMO can be improved by addition of small amounts of noble metals [3]. The presence of noble metal catalysts (Pt, Pd, etc.) on the surface of sensor enhances the sensitivity of sensor [4]. The catalysts create enhanced sites for gas molecular adsorption and lowers the activation energy required for the sensing reaction. Tin oxide is a well-known n-type semiconductor with a wide direct band gap (E g = 3.6 eV at 300 K). Commercially available SnO 2 based sensors normally contain a small quantity of noble metals or catalysts such as Ag, Fe, Pd, and Pt . They act as activators or sensitizers to improve the gas selectivity and to lower the operating temperature [5]. These sensors are sensitive to various toxic and explosive gases [6]. Furthermore, the use of Pd as a catalyst in tin oxide resulted in a dramatic increase in the sensitivity to LPG [7]. In the present state of art, Wang et al. [8] have reported the excellent CO response properties of nanocomposites of Gold and tin oxide at low temperature, synthesized using co-precipitation method. Xiong et al. [9] have reported the use of thick films of rare earth doped SnO 2 for the detection of traces of CO 2 . The influence of addition of Al, Pd and Pt on the surface properties of SnO 2 based thick films have been reported by Hubner et al. In this the sensor materials was synthesized using the co-precipitation method. [10] Shen et al. [11] have reported the thermally evaporated SnO 2 nanorods for H 2 sensing at low operating temperature of 200 °C. Liquefied petroleum gas (LPG) is a combustible gas used widely for many domestic and industrial applications. Since it is poten- tially explosive, the detection of gas leaks is very essential for pre- venting the occurrence of accidents [12]. In this paper, we report the influence of Pd loading on LPG response properties of Fe doped SnO 2 thick film sensors. http://dx.doi.org/10.1016/j.jallcom.2014.04.046 0925-8388/Ó 2014 Elsevier B.V. All rights reserved. ⇑ Corresponding author. Tel.: +91 0217 2744771; fax: +91 0217 2744770. E-mail address: [email protected] (S.S. Suryavanshi). Journal of Alloys and Compounds 608 (2014) 133–140 Contents lists available at ScienceDirect Journal of Alloys and Compounds journal homepage: www.elsevier.com/locate/jalcom
-
Upload
independent -
Category
Documents
-
view
3 -
download
0
Transcript of Synthesis, characterization and LPG response of Pd loaded Fe doped tin oxide thick films
Journal of Alloys and Compounds 608 (2014) 133–140
Contents lists available at ScienceDirect
Journal of Alloys and Compounds
journal homepage: www.elsevier .com/locate / ja lcom
Synthesis, characterization and LPG response of Pd loaded Fe dopedtin oxide thick films
http://dx.doi.org/10.1016/j.jallcom.2014.04.0460925-8388/� 2014 Elsevier B.V. All rights reserved.
⇑ Corresponding author. Tel.: +91 0217 2744771; fax: +91 0217 2744770.E-mail address: [email protected] (S.S. Suryavanshi).
L.P. Chikhale a, J.Y. Patil a, A.V. Rajgure a, R.C. Pawar b, I.S. Mulla c, S.S. Suryavanshi a,⇑a School of Physical Sciences, Solapur University, Solapur 413255, Indiab Department of Materials Engineering, Hanyang University, ERICA Campus, Ansan 426-791, South Koreac Centre for Materials for Electronic Technology(C-MET), Pune 411008, India
a r t i c l e i n f o
Article history:Received 21 September 2013Received in revised form 6 April 2014Accepted 7 April 2014Available online 18 April 2014
Keywords:SnO2
PalladiumFe dopingScreen printingThick filmLPG sensor
a b s t r a c t
The nanocrystalline powders of undoped, Fe doped tin oxide and Pd (1, 2 and 3 mol%) loaded Fe: SnO2
were synthesized by co-precipitation method and characterized by using TGA–DTA, XRD, FE-SEM, EDAX,TEM, SAED, FTIR and Raman spectroscopy techniques. Gas sensing properties were investigated towardsvarious reducing gases viz. liquid petroleum gas (LPG), ethanol, ammonia and acetone vapor. All the SnO2
compositions revealed single phase solid solution formation. The TEM and SAED results of samplessintered at 650 �C for 2 h show particle size of 19 nm for undoped SnO2 which was reduced to 5 nmon loading of Pd in Fe: SnO2. It is found that loading of Pd in Fe doped SnO2 reduces the particle sizeand improves the gas response. The gas sensing measurements showed that the 3 mol% Pd loaded Fe:SnO2 thick film sensor exhibited high response and good selectivity towards LPG at moderate operatingtemperature of 225 �C.
� 2014 Elsevier B.V. All rights reserved.
1. Introduction
Gas sensor play a key role in various industries such as chemicaland petrochemical industries, food and drinks processing, semi-conductor manufacturing, agriculture, fabrication industries andmany more. Amongst the devoted and applied family of gassensors, semiconducting metal oxide (SMO) based gas sensorsare of particular interest due to enhanced chemical interactions,high catalytic activity, and hence the sensing response.
These gas sensors have been found to be extremely useful indetecting harmful and explosive pollutants present in the atmo-sphere. The response of SMO to a particular gas depends on theinteraction between gas molecules and adsorbed oxygen specieson the sensor surface, microstructure of sensor, temperature ofoperation, gas being analyzed and sensor packaging [1,2]. It hasbeen reported by many researchers that the sensing properties ofSMO can be improved by addition of small amounts of noblemetals [3]. The presence of noble metal catalysts (Pt, Pd, etc.) onthe surface of sensor enhances the sensitivity of sensor [4]. Thecatalysts create enhanced sites for gas molecular adsorption andlowers the activation energy required for the sensing reaction.
Tin oxide is a well-known n-type semiconductor with a widedirect band gap (Eg = 3.6 eV at 300 K). Commercially availableSnO2 based sensors normally contain a small quantity ofnoble metals or catalysts such as Ag, Fe, Pd, and Pt . They act asactivators or sensitizers to improve the gas selectivity and to lowerthe operating temperature [5]. These sensors are sensitive tovarious toxic and explosive gases [6]. Furthermore, the use of Pdas a catalyst in tin oxide resulted in a dramatic increase in thesensitivity to LPG [7].
In the present state of art, Wang et al. [8] have reported theexcellent CO response properties of nanocomposites of Gold andtin oxide at low temperature, synthesized using co-precipitationmethod. Xiong et al. [9] have reported the use of thick films of rareearth doped SnO2 for the detection of traces of CO2. The influenceof addition of Al, Pd and Pt on the surface properties of SnO2 basedthick films have been reported by Hubner et al. In this the sensormaterials was synthesized using the co-precipitation method.[10] Shen et al. [11] have reported the thermally evaporatedSnO2 nanorods for H2 sensing at low operating temperature of200 �C.
Liquefied petroleum gas (LPG) is a combustible gas used widelyfor many domestic and industrial applications. Since it is poten-tially explosive, the detection of gas leaks is very essential for pre-venting the occurrence of accidents [12]. In this paper, we reportthe influence of Pd loading on LPG response properties of Fe dopedSnO2 thick film sensors.
134 L.P. Chikhale et al. / Journal of Alloys and Compounds 608 (2014) 133–140
2. Experimental
2.1. Preparation of undoped and Pd loaded Fe doped SnO2 nanopowder
The undoped and Pd loaded Fe doped SnO2 powders were prepared by a simpleco-precipitation route. All the chemical reagents used were Aldrich make withanalytical reagent grade and were used without further purification. In a typicalexperiment, an appropriate quantity of stannic chloride (SnCl4�5H2O) and ammo-nium hydroxide solution (NH4OH) were taken. The stannic chloride was dissolvedin distilled water to form transparent solution. Dilute ammonia was added dropwise in the above prepared solution under magnetic stirring until pH was reachesaround 9–10 where the precipitation of metal cations was occurred. The obtainedprecipitate was filtered, washed several times with distilled water to remove chlo-ride ions [13]. The resulting product was kept for drying under an IR lamp for about8 h, which was followed by calcinations in air at 450 �C for 2 h. This sample waslabeled as P1. The detailed process of powder preparation by chemical route is illus-trated in Fig. 1. The Fe:SnO2 (2 mol%) powder was prepared by using similar way asthat of P1 and the sample was labeled as P2. The Pd loaded Fe: SnO2 with variousmol% Pd were prepared by adding 1.0, 2.0 and 3.0 mol% Pd into 2 mol% Fe dopedSnO2. The calcinated P2 sample was mixed with 1.0 mol% of the palladium andwas labeled as P3, while 2.0 mol% and 3.0 mol% Pd were labeled as P4 and P5,respectively. The Table 1 shows the sample identification for different compositionsof the base material.
2.2. Preparation of thick films
The thixotropic paste of the sensor material was formulated by mixing finepowder of SnO2 with a mixture of organic solvents (a temporary binder) namelyethyl cellulose, butyl carbitol acetate and terpineol. In formulating the paste, ratioof inorganic to organic part was kept at 75:25 [14]. This paste was used to depositthick films on ultrasonically cleaned alumina substrate (10 mm � 20 mm) usingscreen printing technique with nylon cloth of 140 mesh counts. The details of thetechnique are described elsewhere [15]. The thick films were sintered at 650 �Cfor 2 h in air. The film thickness was measured using a fully computerized AMBIOSMake XP-1 surface profiler with 1 Å vertical resolution. The average film thicknessfor all the sensors was around �10–11 lm.
Table 1Sample identification for Pd loaded Fe doped SnO2.
Sample Code Composition
P1 Undoped SnO2
P2 98 mol% SnCl4 + 2 mol% Fe (NO3)3
P3 P2 + 1 mol% PdCl2
P4 P2 + 2 mol% PdCl2
P5 P2 + 3 mol% PdCl2
Fig. 1. Flow chart of sample preparation.
2.3. Experimental techniques
The X-ray diffraction (XRD) patterns were obtained by using BRUKER AXSD8-Advanced X-ray diffractometer using Cu Ka (l = 1.5418 Å) radiation. The surfacemorphology of the film were observed by field-emission scanning electron micros-copy (FESEM) on a JEOL JEM-6700F microscope operating at 5 kV. The elementalcomposition was obtained by the energy dispersive X-ray spectroscopy (EDS)technique. The transmission electron microscopic (TEM) analysis and selected areaelectron diffraction (SAED) were performed on the Philips CM 200 FEG microscopeequipped with a field emission gun at an accelerating voltage of 200 kV, with aresolution of 0.24 nm.
FTIR analysis was carried out using a JASCO Model FTIR 6100 type-Aspectrometer in the wave number range of 400–4000 cm�1 for studying thechemical groups on the surface of samples. The Raman spectra of SnO2 thick filmsamples of undoped and Pd loaded Fe doped SnO2 were taken at room temperaturein backscattering geometry. Thermo Fisher DXR Raman spectrometer with semi-conductor laser beam was carried out at the excitation wavelength of 532 nm.
2.4. Gas response studies
The sintered thick film sensors were tested for gas sensing properties. DigitalNanometer Model DNM-121 and Scien Tech (India) variable power supplyST4074 were used to measure the change in resistance of the sample. Conductingsilver paste was used to make ohmic contacts on both ends of thick film andmeasurements were performed using the gas sensing set-up described earlier[16]. The film was mounted on two probe ceramic sample holder placed in an insu-lated glass chamber which was inserted coaxially inside the tubular furnace. Thearea of thick films for all the samples was kept identical and measurements werecarried out in air as carrier gas. The resistance of the thick film in air and in presenceof test gas was measured as a function of time at different operating temperaturesand concentrations of test gas. The responses of all the samples were investigatedtowards LPG at various operating temperatures. The high performance of the sensorwas confirmed through testing the gas response for 3–5 cycles. The sensor response(S%) to a reducing test gas is defined as:
Sð%Þ ¼ ðRa � RgÞRa
� 100 ð1Þ
where Ra = resistance of sensor in air and Rg = resistance in presences of test gas.
3. Results and discussion
3.1. Thermo gravimetric differential temperature studies
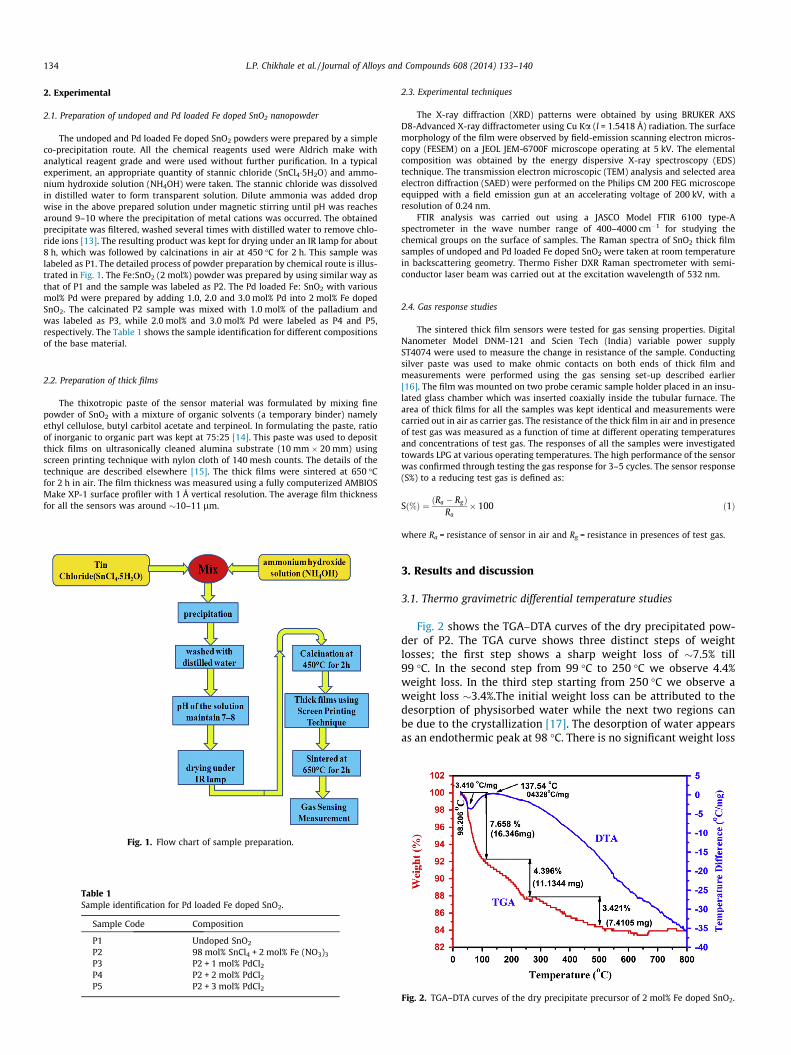
Fig. 2 shows the TGA–DTA curves of the dry precipitated pow-der of P2. The TGA curve shows three distinct steps of weightlosses; the first step shows a sharp weight loss of �7.5% till99 �C. In the second step from 99 �C to 250 �C we observe 4.4%weight loss. In the third step starting from 250 �C we observe aweight loss �3.4%.The initial weight loss can be attributed to thedesorption of physisorbed water while the next two regions canbe due to the crystallization [17]. The desorption of water appearsas an endothermic peak at 98 �C. There is no significant weight loss
Fig. 2. TGA–DTA curves of the dry precipitate precursor of 2 mol% Fe doped SnO2.
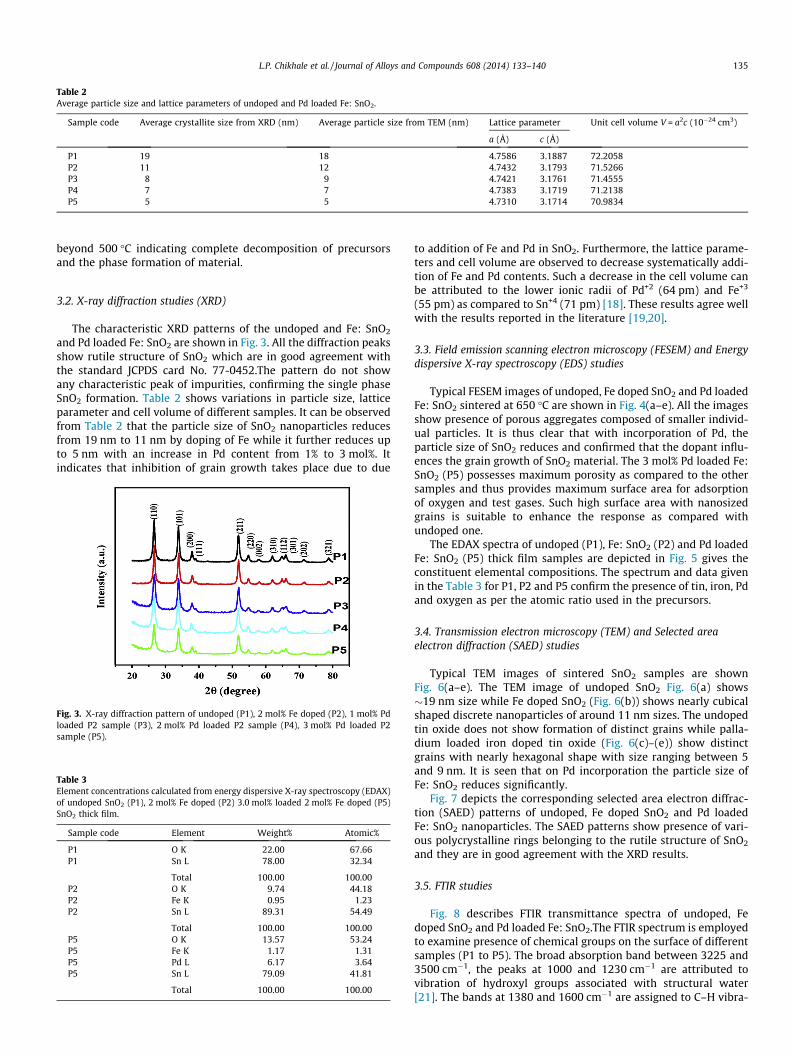
Table 2Average particle size and lattice parameters of undoped and Pd loaded Fe: SnO2.
Sample code Average crystallite size from XRD (nm) Average particle size from TEM (nm) Lattice parameter Unit cell volume V = a2c (10�24 cm3)
a (Å) c (Å)
P1 19 18 4.7586 3.1887 72.2058P2 11 12 4.7432 3.1793 71.5266P3 8 9 4.7421 3.1761 71.4555P4 7 7 4.7383 3.1719 71.2138P5 5 5 4.7310 3.1714 70.9834
L.P. Chikhale et al. / Journal of Alloys and Compounds 608 (2014) 133–140 135
beyond 500 �C indicating complete decomposition of precursorsand the phase formation of material.
3.2. X-ray diffraction studies (XRD)
The characteristic XRD patterns of the undoped and Fe: SnO2
and Pd loaded Fe: SnO2 are shown in Fig. 3. All the diffraction peaksshow rutile structure of SnO2 which are in good agreement withthe standard JCPDS card No. 77-0452.The pattern do not showany characteristic peak of impurities, confirming the single phaseSnO2 formation. Table 2 shows variations in particle size, latticeparameter and cell volume of different samples. It can be observedfrom Table 2 that the particle size of SnO2 nanoparticles reducesfrom 19 nm to 11 nm by doping of Fe while it further reduces upto 5 nm with an increase in Pd content from 1% to 3 mol%. Itindicates that inhibition of grain growth takes place due to due
Table 3Element concentrations calculated from energy dispersive X-ray spectroscopy (EDAX)of undoped SnO2 (P1), 2 mol% Fe doped (P2) 3.0 mol% loaded 2 mol% Fe doped (P5)SnO2 thick film.
Sample code Element Weight% Atomic%
P1 O K 22.00 67.66P1 Sn L 78.00 32.34
Total 100.00 100.00P2 O K 9.74 44.18P2 Fe K 0.95 1.23P2 Sn L 89.31 54.49
Total 100.00 100.00P5 O K 13.57 53.24P5 Fe K 1.17 1.31P5 Pd L 6.17 3.64P5 Sn L 79.09 41.81
Total 100.00 100.00
Fig. 3. X-ray diffraction pattern of undoped (P1), 2 mol% Fe doped (P2), 1 mol% Pdloaded P2 sample (P3), 2 mol% Pd loaded P2 sample (P4), 3 mol% Pd loaded P2sample (P5).
to addition of Fe and Pd in SnO2. Furthermore, the lattice parame-ters and cell volume are observed to decrease systematically addi-tion of Fe and Pd contents. Such a decrease in the cell volume canbe attributed to the lower ionic radii of Pd+2 (64 pm) and Fe+3
(55 pm) as compared to Sn+4 (71 pm) [18]. These results agree wellwith the results reported in the literature [19,20].
3.3. Field emission scanning electron microscopy (FESEM) and Energydispersive X-ray spectroscopy (EDS) studies
Typical FESEM images of undoped, Fe doped SnO2 and Pd loadedFe: SnO2 sintered at 650 �C are shown in Fig. 4(a–e). All the imagesshow presence of porous aggregates composed of smaller individ-ual particles. It is thus clear that with incorporation of Pd, theparticle size of SnO2 reduces and confirmed that the dopant influ-ences the grain growth of SnO2 material. The 3 mol% Pd loaded Fe:SnO2 (P5) possesses maximum porosity as compared to the othersamples and thus provides maximum surface area for adsorptionof oxygen and test gases. Such high surface area with nanosizedgrains is suitable to enhance the response as compared withundoped one.
The EDAX spectra of undoped (P1), Fe: SnO2 (P2) and Pd loadedFe: SnO2 (P5) thick film samples are depicted in Fig. 5 gives theconstituent elemental compositions. The spectrum and data givenin the Table 3 for P1, P2 and P5 confirm the presence of tin, iron, Pdand oxygen as per the atomic ratio used in the precursors.
3.4. Transmission electron microscopy (TEM) and Selected areaelectron diffraction (SAED) studies
Typical TEM images of sintered SnO2 samples are shownFig. 6(a–e). The TEM image of undoped SnO2 Fig. 6(a) shows�19 nm size while Fe doped SnO2 (Fig. 6(b)) shows nearly cubicalshaped discrete nanoparticles of around 11 nm sizes. The undopedtin oxide does not show formation of distinct grains while palla-dium loaded iron doped tin oxide (Fig. 6(c)–(e)) show distinctgrains with nearly hexagonal shape with size ranging between 5and 9 nm. It is seen that on Pd incorporation the particle size ofFe: SnO2 reduces significantly.
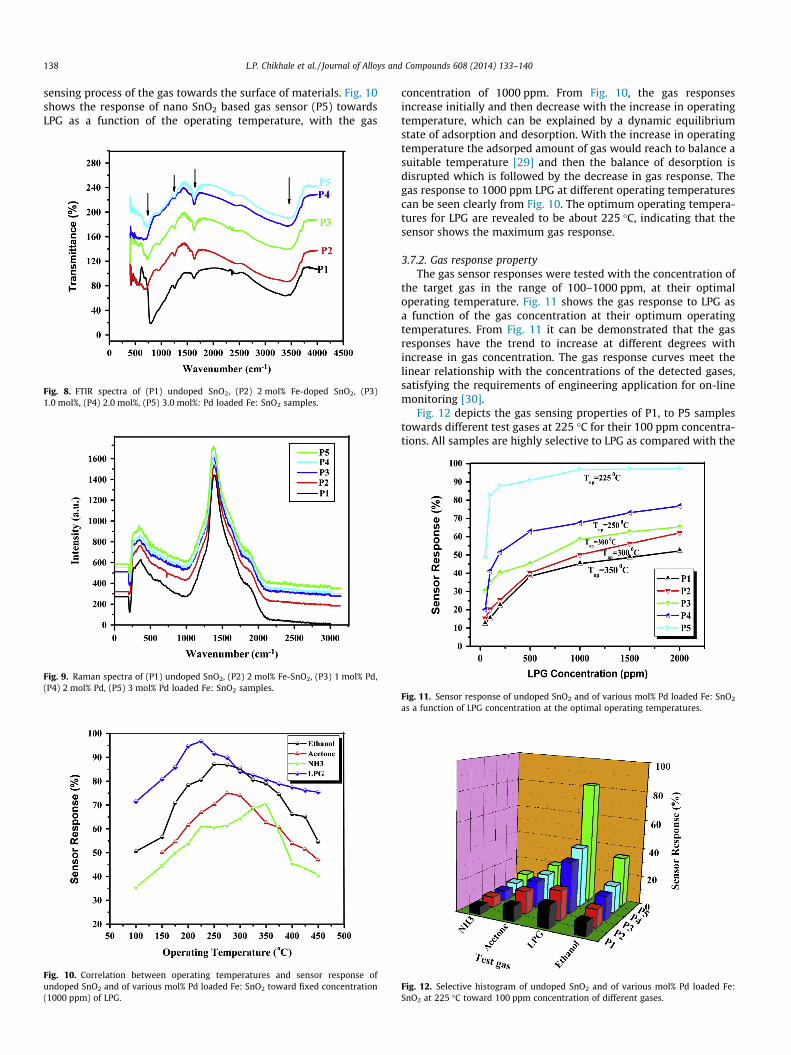
Fig. 7 depicts the corresponding selected area electron diffrac-tion (SAED) patterns of undoped, Fe doped SnO2 and Pd loadedFe: SnO2 nanoparticles. The SAED patterns show presence of vari-ous polycrystalline rings belonging to the rutile structure of SnO2
and they are in good agreement with the XRD results.
3.5. FTIR studies
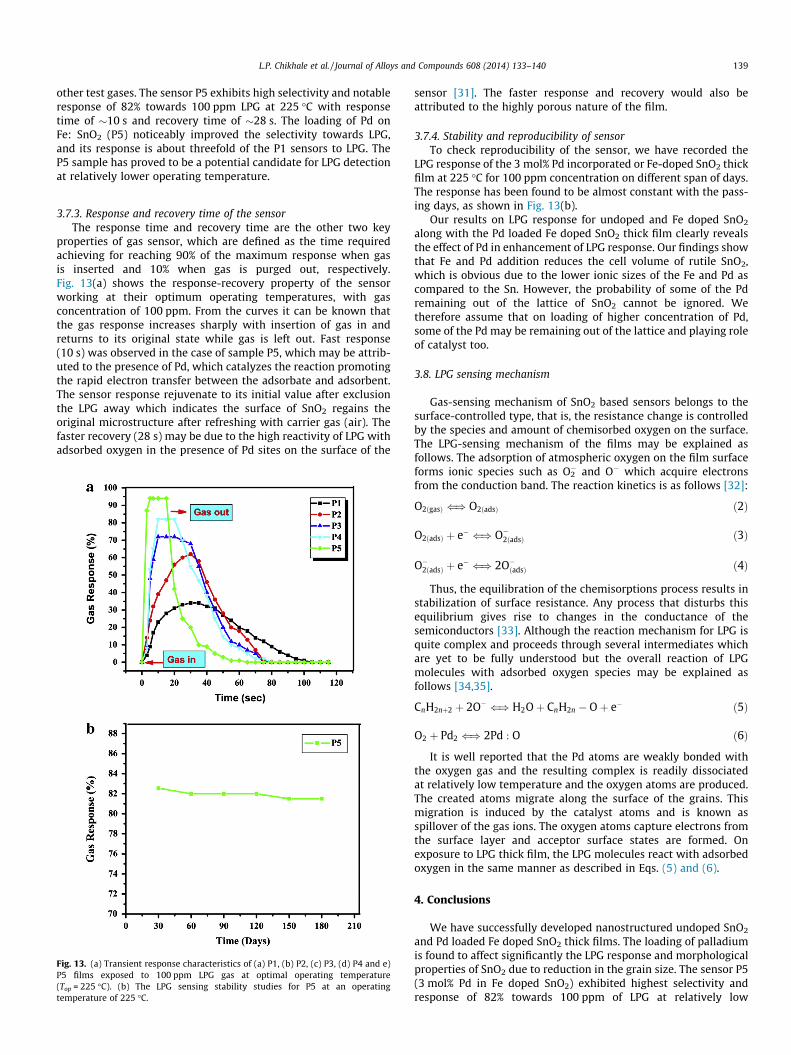
Fig. 8 describes FTIR transmittance spectra of undoped, Fedoped SnO2 and Pd loaded Fe: SnO2.The FTIR spectrum is employedto examine presence of chemical groups on the surface of differentsamples (P1 to P5). The broad absorption band between 3225 and3500 cm�1, the peaks at 1000 and 1230 cm�1 are attributed tovibration of hydroxyl groups associated with structural water[21]. The bands at 1380 and 1600 cm�1 are assigned to C–H vibra-
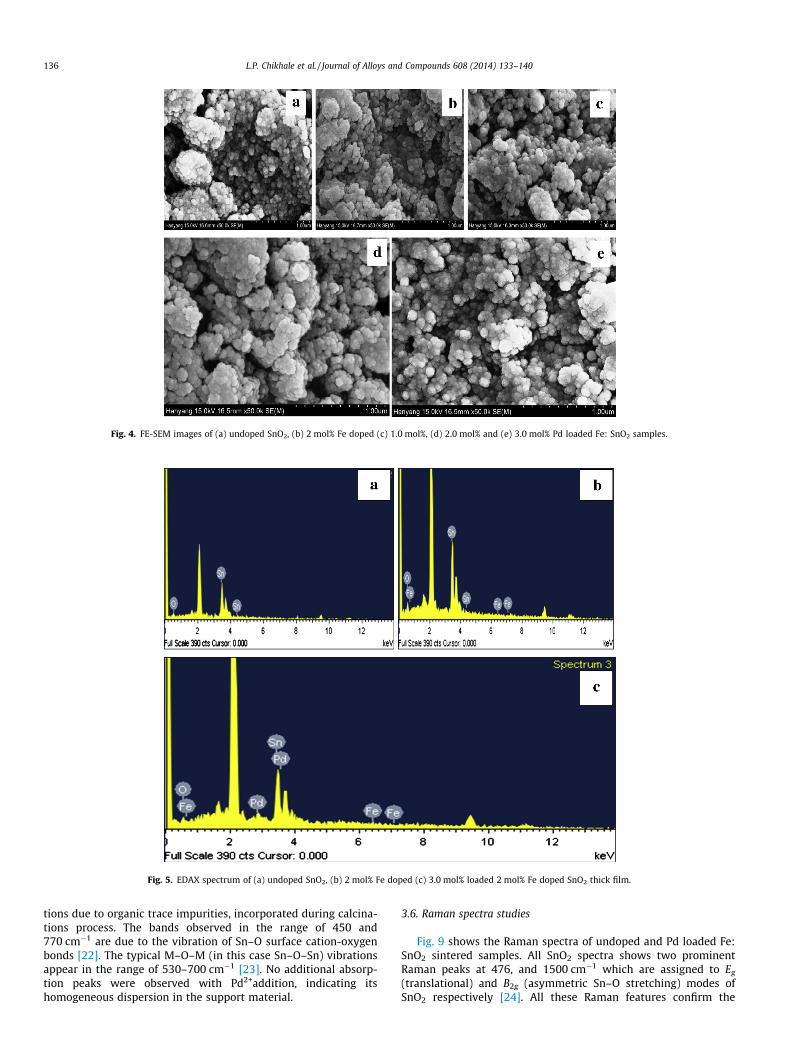
Fig. 4. FE-SEM images of (a) undoped SnO2, (b) 2 mol% Fe doped (c) 1.0 mol%, (d) 2.0 mol% and (e) 3.0 mol% Pd loaded Fe: SnO2 samples.
Fig. 5. EDAX spectrum of (a) undoped SnO2, (b) 2 mol% Fe doped (c) 3.0 mol% loaded 2 mol% Fe doped SnO2 thick film.
136 L.P. Chikhale et al. / Journal of Alloys and Compounds 608 (2014) 133–140
tions due to organic trace impurities, incorporated during calcina-tions process. The bands observed in the range of 450 and770 cm�1 are due to the vibration of Sn–O surface cation-oxygenbonds [22]. The typical M–O–M (in this case Sn–O–Sn) vibrationsappear in the range of 530–700 cm�1 [23]. No additional absorp-tion peaks were observed with Pd2+addition, indicating itshomogeneous dispersion in the support material.
3.6. Raman spectra studies
Fig. 9 shows the Raman spectra of undoped and Pd loaded Fe:SnO2 sintered samples. All SnO2 spectra shows two prominentRaman peaks at 476, and 1500 cm�1 which are assigned to Eg
(translational) and B2g (asymmetric Sn–O stretching) modes ofSnO2 respectively [24]. All these Raman features confirm the
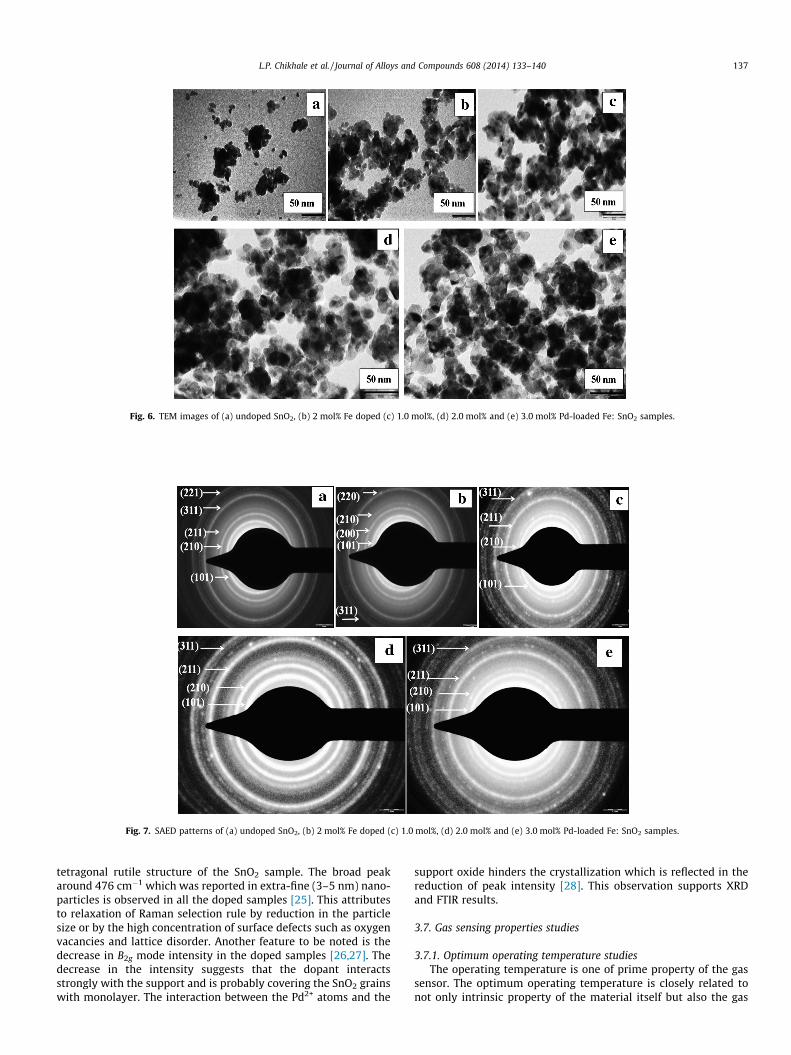
Fig. 6. TEM images of (a) undoped SnO2, (b) 2 mol% Fe doped (c) 1.0 mol%, (d) 2.0 mol% and (e) 3.0 mol% Pd-loaded Fe: SnO2 samples.
Fig. 7. SAED patterns of (a) undoped SnO2, (b) 2 mol% Fe doped (c) 1.0 mol%, (d) 2.0 mol% and (e) 3.0 mol% Pd-loaded Fe: SnO2 samples.
L.P. Chikhale et al. / Journal of Alloys and Compounds 608 (2014) 133–140 137
tetragonal rutile structure of the SnO2 sample. The broad peakaround 476 cm�1 which was reported in extra-fine (3–5 nm) nano-particles is observed in all the doped samples [25]. This attributesto relaxation of Raman selection rule by reduction in the particlesize or by the high concentration of surface defects such as oxygenvacancies and lattice disorder. Another feature to be noted is thedecrease in B2g mode intensity in the doped samples [26,27]. Thedecrease in the intensity suggests that the dopant interactsstrongly with the support and is probably covering the SnO2 grainswith monolayer. The interaction between the Pd2+ atoms and the
support oxide hinders the crystallization which is reflected in thereduction of peak intensity [28]. This observation supports XRDand FTIR results.
3.7. Gas sensing properties studies
3.7.1. Optimum operating temperature studiesThe operating temperature is one of prime property of the gas
sensor. The optimum operating temperature is closely related tonot only intrinsic property of the material itself but also the gas
138 L.P. Chikhale et al. / Journal of Alloys and Compounds 608 (2014) 133–140
sensing process of the gas towards the surface of materials. Fig. 10shows the response of nano SnO2 based gas sensor (P5) towardsLPG as a function of the operating temperature, with the gas
Fig. 8. FTIR spectra of (P1) undoped SnO2, (P2) 2 mol% Fe-doped SnO2, (P3)1.0 mol%, (P4) 2.0 mol%, (P5) 3.0 mol%: Pd loaded Fe: SnO2 samples.
Fig. 10. Correlation between operating temperatures and sensor response ofundoped SnO2 and of various mol% Pd loaded Fe: SnO2 toward fixed concentration(1000 ppm) of LPG.
Fig. 9. Raman spectra of (P1) undoped SnO2, (P2) 2 mol% Fe-SnO2, (P3) 1 mol% Pd,(P4) 2 mol% Pd, (P5) 3 mol% Pd loaded Fe: SnO2 samples.
concentration of 1000 ppm. From Fig. 10, the gas responsesincrease initially and then decrease with the increase in operatingtemperature, which can be explained by a dynamic equilibriumstate of adsorption and desorption. With the increase in operatingtemperature the adsorped amount of gas would reach to balance asuitable temperature [29] and then the balance of desorption isdisrupted which is followed by the decrease in gas response. Thegas response to 1000 ppm LPG at different operating temperaturescan be seen clearly from Fig. 10. The optimum operating tempera-tures for LPG are revealed to be about 225 �C, indicating that thesensor shows the maximum gas response.
3.7.2. Gas response propertyThe gas sensor responses were tested with the concentration of
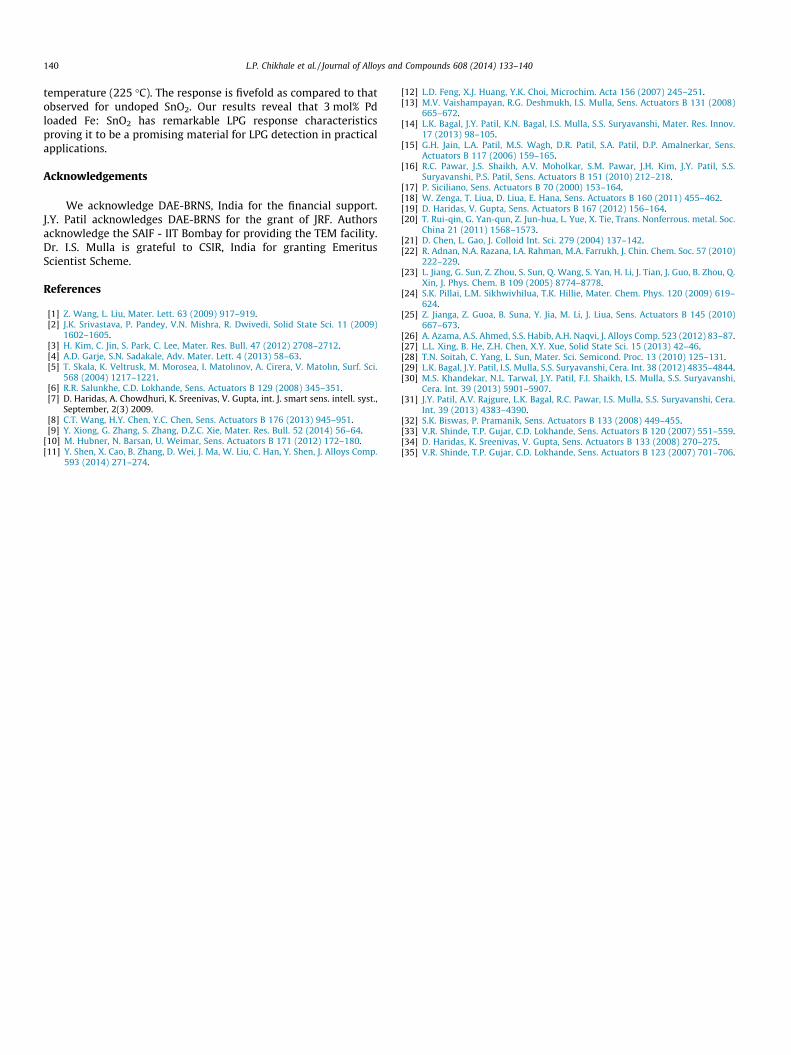
the target gas in the range of 100–1000 ppm, at their optimaloperating temperature. Fig. 11 shows the gas response to LPG asa function of the gas concentration at their optimum operatingtemperatures. From Fig. 11 it can be demonstrated that the gasresponses have the trend to increase at different degrees withincrease in gas concentration. The gas response curves meet thelinear relationship with the concentrations of the detected gases,satisfying the requirements of engineering application for on-linemonitoring [30].
Fig. 12 depicts the gas sensing properties of P1, to P5 samplestowards different test gases at 225 �C for their 100 ppm concentra-tions. All samples are highly selective to LPG as compared with the
Fig. 12. Selective histogram of undoped SnO2 and of various mol% Pd loaded Fe:SnO2 at 225 �C toward 100 ppm concentration of different gases.
Fig. 11. Sensor response of undoped SnO2 and of various mol% Pd loaded Fe: SnO2
as a function of LPG concentration at the optimal operating temperatures.
L.P. Chikhale et al. / Journal of Alloys and Compounds 608 (2014) 133–140 139
other test gases. The sensor P5 exhibits high selectivity and notableresponse of 82% towards 100 ppm LPG at 225 �C with responsetime of �10 s and recovery time of �28 s. The loading of Pd onFe: SnO2 (P5) noticeably improved the selectivity towards LPG,and its response is about threefold of the P1 sensors to LPG. TheP5 sample has proved to be a potential candidate for LPG detectionat relatively lower operating temperature.
3.7.3. Response and recovery time of the sensorThe response time and recovery time are the other two key
properties of gas sensor, which are defined as the time requiredachieving for reaching 90% of the maximum response when gasis inserted and 10% when gas is purged out, respectively.Fig. 13(a) shows the response-recovery property of the sensorworking at their optimum operating temperatures, with gasconcentration of 100 ppm. From the curves it can be known thatthe gas response increases sharply with insertion of gas in andreturns to its original state while gas is left out. Fast response(10 s) was observed in the case of sample P5, which may be attrib-uted to the presence of Pd, which catalyzes the reaction promotingthe rapid electron transfer between the adsorbate and adsorbent.The sensor response rejuvenate to its initial value after exclusionthe LPG away which indicates the surface of SnO2 regains theoriginal microstructure after refreshing with carrier gas (air). Thefaster recovery (28 s) may be due to the high reactivity of LPG withadsorbed oxygen in the presence of Pd sites on the surface of the
Fig. 13. (a) Transient response characteristics of (a) P1, (b) P2, (c) P3, (d) P4 and e)P5 films exposed to 100 ppm LPG gas at optimal operating temperature(Top = 225 �C). (b) The LPG sensing stability studies for P5 at an operatingtemperature of 225 �C.
sensor [31]. The faster response and recovery would also beattributed to the highly porous nature of the film.
3.7.4. Stability and reproducibility of sensorTo check reproducibility of the sensor, we have recorded the
LPG response of the 3 mol% Pd incorporated or Fe-doped SnO2 thickfilm at 225 �C for 100 ppm concentration on different span of days.The response has been found to be almost constant with the pass-ing days, as shown in Fig. 13(b).
Our results on LPG response for undoped and Fe doped SnO2
along with the Pd loaded Fe doped SnO2 thick film clearly revealsthe effect of Pd in enhancement of LPG response. Our findings showthat Fe and Pd addition reduces the cell volume of rutile SnO2,which is obvious due to the lower ionic sizes of the Fe and Pd ascompared to the Sn. However, the probability of some of the Pdremaining out of the lattice of SnO2 cannot be ignored. Wetherefore assume that on loading of higher concentration of Pd,some of the Pd may be remaining out of the lattice and playing roleof catalyst too.
3.8. LPG sensing mechanism
Gas-sensing mechanism of SnO2 based sensors belongs to thesurface-controlled type, that is, the resistance change is controlledby the species and amount of chemisorbed oxygen on the surface.The LPG-sensing mechanism of the films may be explained asfollows. The adsorption of atmospheric oxygen on the film surfaceforms ionic species such as O2
� and O� which acquire electronsfrom the conduction band. The reaction kinetics is as follows [32]:
O2ðgasÞ () O2ðadsÞ ð2Þ
O2ðadsÞ þ e� () O�2ðadsÞ ð3Þ
O�2ðadsÞ þ e� () 2O�ðadsÞ ð4Þ
Thus, the equilibration of the chemisorptions process results instabilization of surface resistance. Any process that disturbs thisequilibrium gives rise to changes in the conductance of thesemiconductors [33]. Although the reaction mechanism for LPG isquite complex and proceeds through several intermediates whichare yet to be fully understood but the overall reaction of LPGmolecules with adsorbed oxygen species may be explained asfollows [34,35].
CnH2nþ2 þ 2O� () H2Oþ CnH2n � Oþ e� ð5Þ
O2 þ Pd2 () 2Pd : O ð6Þ
It is well reported that the Pd atoms are weakly bonded withthe oxygen gas and the resulting complex is readily dissociatedat relatively low temperature and the oxygen atoms are produced.The created atoms migrate along the surface of the grains. Thismigration is induced by the catalyst atoms and is known asspillover of the gas ions. The oxygen atoms capture electrons fromthe surface layer and acceptor surface states are formed. Onexposure to LPG thick film, the LPG molecules react with adsorbedoxygen in the same manner as described in Eqs. (5) and (6).
4. Conclusions
We have successfully developed nanostructured undoped SnO2
and Pd loaded Fe doped SnO2 thick films. The loading of palladiumis found to affect significantly the LPG response and morphologicalproperties of SnO2 due to reduction in the grain size. The sensor P5(3 mol% Pd in Fe doped SnO2) exhibited highest selectivity andresponse of 82% towards 100 ppm of LPG at relatively low
140 L.P. Chikhale et al. / Journal of Alloys and Compounds 608 (2014) 133–140
temperature (225 �C). The response is fivefold as compared to thatobserved for undoped SnO2. Our results reveal that 3 mol% Pdloaded Fe: SnO2 has remarkable LPG response characteristicsproving it to be a promising material for LPG detection in practicalapplications.
Acknowledgements
We acknowledge DAE-BRNS, India for the financial support.J.Y. Patil acknowledges DAE-BRNS for the grant of JRF. Authorsacknowledge the SAIF - IIT Bombay for providing the TEM facility.Dr. I.S. Mulla is grateful to CSIR, India for granting EmeritusScientist Scheme.
References
[1] Z. Wang, L. Liu, Mater. Lett. 63 (2009) 917–919.[2] J.K. Srivastava, P. Pandey, V.N. Mishra, R. Dwivedi, Solid State Sci. 11 (2009)
1602–1605.[3] H. Kim, C. Jin, S. Park, C. Lee, Mater. Res. Bull. 47 (2012) 2708–2712.[4] A.D. Garje, S.N. Sadakale, Adv. Mater. Lett. 4 (2013) 58–63.[5] T. Skala, K. Veltrusk, M. Morosea, I. Matolınov, A. Cirera, V. Matolın, Surf. Sci.
568 (2004) 1217–1221.[6] R.R. Salunkhe, C.D. Lokhande, Sens. Actuators B 129 (2008) 345–351.[7] D. Haridas, A. Chowdhuri, K. Sreenivas, V. Gupta, int. J. smart sens. intell. syst.,
September, 2(3) 2009.[8] C.T. Wang, H.Y. Chen, Y.C. Chen, Sens. Actuators B 176 (2013) 945–951.[9] Y. Xiong, G. Zhang, S. Zhang, D.Z.C. Xie, Mater. Res. Bull. 52 (2014) 56–64.
[10] M. Hubner, N. Barsan, U. Weimar, Sens. Actuators B 171 (2012) 172–180.[11] Y. Shen, X. Cao, B. Zhang, D. Wei, J. Ma, W. Liu, C. Han, Y. Shen, J. Alloys Comp.
593 (2014) 271–274.
[12] L.D. Feng, X.J. Huang, Y.K. Choi, Microchim. Acta 156 (2007) 245–251.[13] M.V. Vaishampayan, R.G. Deshmukh, I.S. Mulla, Sens. Actuators B 131 (2008)
665–672.[14] L.K. Bagal, J.Y. Patil, K.N. Bagal, I.S. Mulla, S.S. Suryavanshi, Mater. Res. Innov.
17 (2013) 98–105.[15] G.H. Jain, L.A. Patil, M.S. Wagh, D.R. Patil, S.A. Patil, D.P. Amalnerkar, Sens.
Actuators B 117 (2006) 159–165.[16] R.C. Pawar, J.S. Shaikh, A.V. Moholkar, S.M. Pawar, J.H. Kim, J.Y. Patil, S.S.
Suryavanshi, P.S. Patil, Sens. Actuators B 151 (2010) 212–218.[17] P. Siciliano, Sens. Actuators B 70 (2000) 153–164.[18] W. Zenga, T. Liua, D. Liua, E. Hana, Sens. Actuators B 160 (2011) 455–462.[19] D. Haridas, V. Gupta, Sens. Actuators B 167 (2012) 156–164.[20] T. Rui-qin, G. Yan-qun, Z. Jun-hua, L. Yue, X. Tie, Trans. Nonferrous. metal. Soc.
China 21 (2011) 1568–1573.[21] D. Chen, L. Gao, J. Colloid Int. Sci. 279 (2004) 137–142.[22] R. Adnan, N.A. Razana, I.A. Rahman, M.A. Farrukh, J. Chin. Chem. Soc. 57 (2010)
222–229.[23] L. Jiang, G. Sun, Z. Zhou, S. Sun, Q. Wang, S. Yan, H. Li, J. Tian, J. Guo, B. Zhou, Q.
Xin, J. Phys. Chem. B 109 (2005) 8774–8778.[24] S.K. Pillai, L.M. Sikhwivhilua, T.K. Hillie, Mater. Chem. Phys. 120 (2009) 619–
624.[25] Z. Jianga, Z. Guoa, B. Suna, Y. Jia, M. Li, J. Liua, Sens. Actuators B 145 (2010)
667–673.[26] A. Azama, A.S. Ahmed, S.S. Habib, A.H. Naqvi, J. Alloys Comp. 523 (2012) 83–87.[27] L.L. Xing, B. He, Z.H. Chen, X.Y. Xue, Solid State Sci. 15 (2013) 42–46.[28] T.N. Soitah, C. Yang, L. Sun, Mater. Sci. Semicond. Proc. 13 (2010) 125–131.[29] L.K. Bagal, J.Y. Patil, I.S. Mulla, S.S. Suryavanshi, Cera. Int. 38 (2012) 4835–4844.[30] M.S. Khandekar, N.L. Tarwal, J.Y. Patil, F.I. Shaikh, I.S. Mulla, S.S. Suryavanshi,
Cera. Int. 39 (2013) 5901–5907.[31] J.Y. Patil, A.V. Rajgure, L.K. Bagal, R.C. Pawar, I.S. Mulla, S.S. Suryavanshi, Cera.
Int. 39 (2013) 4383–4390.[32] S.K. Biswas, P. Pramanik, Sens. Actuators B 133 (2008) 449–455.[33] V.R. Shinde, T.P. Gujar, C.D. Lokhande, Sens. Actuators B 120 (2007) 551–559.[34] D. Haridas, K. Sreenivas, V. Gupta, Sens. Actuators B 133 (2008) 270–275.[35] V.R. Shinde, T.P. Gujar, C.D. Lokhande, Sens. Actuators B 123 (2007) 701–706.