Facile synthesis of Co doped ZnO nanodisks for highly efficient photocatalytic degradation of methyl...
7
Research Article Adv. Mater. Lett. 2015, 6(3), 217-223 ADVANCED MATERIALS Letters Adv. Mater. Lett. 2015, 6(3), 217-223 Copyright © 2015 VBRI Press www.amlett.com, www.vbripress.com/aml, DOI: 10.5185/amlett.2015.5693 Published online by the VBRI press in 2015 Facile synthesis of Co doped ZnO nanodisks for highly efficient photocatalytic degradation of methyl orange Sini Kuriakose 1 , Biswarup Satpati 2 , Satyabrata Mohapatra 1* 1 School of Basic and Applied Sciences, Guru Gobind Singh Indraprastha University, Dwarka, New Delhi 110078, India 2 Saha Institute of Nuclear Physics, 1/AF Bidhannagar, Kolkata 700064, India * Corresponding author. Tel: (+91) 11 25302414; E-mail: [email protected] Received: 22 August 2014, Revised: 28 November 2014 and Accepted: 25 December 2014 ABSTRACT Highly photocatalytically active nanodisks of ZnO and Co doped ZnO were synthesized by a facile wet chemical method. The structural, optical and photocatalytic properties of ZnO and Co doped ZnO nanodisks were studied by X-ray diffraction (XRD), field emission scanning electron microscopy (FESEM), atomic force microscopy (AFM), transmission electron microscopy (TEM), Raman spectroscopy and UV-visible absorption spectroscopy. FESEM, AFM and TEM studies revealed the presence of ZnO nanodisks. Sun light driven degradation of aqueous methyl orange (MO) dye was used for evaluating the photocatalytic activity of as-synthesized ZnO and Co doped ZnO nanodisks. Co doped ZnO nanodisks showed very high photocatalytic efficiency and lead to almost complete degradation of MO dye in just 8 minutes. A tentative mechanism of the photocatalytic degradation of MO by Co doped ZnO nanodisks is proposed. We attribute the enhanced photocatalytic activity of Co doped ZnO nanodisks to their high specific surface area and efficient charge carrier separation due Co doping, which improves suppression of recombination of photogenerated electrons and holes. Development of sun light active highly efficient and stable photocatalysts is very promising for environmental remediation leading to safe and clean water. Copyright © 2015 VBRI press. Keywords: Co doped ZnO; nanodisks; photocatalysis; methyl orange. Sini Kuriakose is working as a research scholar at School of Basic and Applied Sciences, Guru Gobind Singh Indraprastha University, New Delhi, India. She completed M.Sc. from Mahatma Gandhi University, Kerala, India in 2005. Her main area of research is synthesis of multifunctional metal- semiconductor hybrid plasmonic nanostructures. Biswarup Satpati is working as a Scientist at Saha Institute of Nuclear Physics, Kolkata, India since September, 2010. He completed his Ph.D. degree in the year 2005 from Institute of Physics, Bhubaneswar, India, in the area of synthesis, modification, and characterization of nanostructured materials by energetic ion irradiation. He has worked as a Post Doctoral Researcher at Paul-Drude Institute for Solid State Electronics, Berlin, Germany. His main research interest is growth of wide class of low-dimensional metal and semiconductor heterostructures and study their interfaces (structure, chemistry and strain) using transmission electron microscopy and associated techniques. Satyabrata Mohapatra is working as an Assistant Professor of Nanoscience and Technology at School of Basic and Applied Sciences, Guru Gobind Singh Indraprastha University, New Delhi, India. He obtained Ph.D. degree from Institute of Physics (IOP), Bhubaneswar, India. He has worked as Postdoctoral Research Associate at Inter University Accelerator Centre (IUAC), New Delhi, India. His current research interests include synthesis and ion beam engineering of multifunctional hybrid nanostructures and plasmonic nanocomposites for the development of ultra-sensitive chemical and biosensors, gas sensors and highly efficient photocatalysts. Introduction Water contamination due to toxic chemicals and hazardous water soluble organic dyes in industrial effluents pose a severe threat to the environment. Purification and detoxification of industrial waste water is of immense importance for environmental remediation. Development of highly efficient and sun light active photocatalysts for elimination of toxic pollutants from water has driven significant research interests over the last few decades [1-
Transcript of Facile synthesis of Co doped ZnO nanodisks for highly efficient photocatalytic degradation of methyl...

Research Article Adv. Mater. Lett. 2015, 6(3), 217-223 ADVANCED MATERIALS Letters
Adv. Mater. Lett. 2015, 6(3), 217-223 Copyright © 2015 VBRI Press
www.amlett.com, www.vbripress.com/aml, DOI: 10.5185/amlett.2015.5693 Published online by the VBRI press in 2015
Facile synthesis of Co doped ZnO nanodisks for highly efficient photocatalytic degradation of methyl orange
Sini Kuriakose1, Biswarup Satpati
2, Satyabrata Mohapatra
1*
1School of Basic and Applied Sciences, Guru Gobind Singh Indraprastha University, Dwarka, New Delhi 110078, India
2Saha Institute of Nuclear Physics, 1/AF Bidhannagar, Kolkata 700064, India
*Corresponding author. Tel: (+91) 11 25302414; E-mail: [email protected]
Received: 22 August 2014, Revised: 28 November 2014 and Accepted: 25 December 2014
ABSTRACT
Highly photocatalytically active nanodisks of ZnO and Co doped ZnO were synthesized by a facile wet chemical method. The structural, optical and photocatalytic properties of ZnO and Co doped ZnO nanodisks were studied by X-ray diffraction (XRD), field emission scanning electron microscopy (FESEM), atomic force microscopy (AFM), transmission electron microscopy (TEM), Raman spectroscopy and UV-visible absorption spectroscopy. FESEM, AFM and TEM studies revealed the presence of ZnO nanodisks. Sun light driven degradation of aqueous methyl orange (MO) dye was used for evaluating the photocatalytic activity of as-synthesized ZnO and Co doped ZnO nanodisks. Co doped ZnO nanodisks showed very high photocatalytic efficiency and lead to almost complete degradation of MO dye in just 8 minutes. A tentative mechanism of the photocatalytic degradation of MO by Co doped ZnO nanodisks is proposed. We attribute the enhanced photocatalytic activity of Co doped ZnO nanodisks to their high specific surface area and efficient charge carrier separation due Co doping, which improves suppression of recombination of photogenerated electrons and holes. Development of sun light active highly efficient and stable photocatalysts is very promising for environmental remediation leading to safe and clean water. Copyright © 2015 VBRI press.
Keywords: Co doped ZnO; nanodisks; photocatalysis; methyl orange.
Sini Kuriakose is working as a research scholar at School of Basic and Applied Sciences, Guru Gobind Singh Indraprastha University, New Delhi, India. She completed M.Sc. from Mahatma Gandhi University, Kerala, India in 2005. Her main area of research is synthesis of multifunctional metal-semiconductor hybrid plasmonic nanostructures.
Biswarup Satpati is working as a Scientist at Saha Institute of Nuclear Physics, Kolkata,
India since September, 2010. He completed his Ph.D. degree in the year 2005 from Institute of Physics, Bhubaneswar, India, in the area of synthesis, modification, and characterization of nanostructured materials by energetic ion irradiation. He has worked as a Post Doctoral Researcher at Paul-Drude Institute for Solid State Electronics, Berlin, Germany. His main research interest is growth
of wide class of low-dimensional metal and semiconductor heterostructures and study their interfaces (structure, chemistry and strain) using transmission electron microscopy and associated techniques.
Satyabrata Mohapatra is working as an Assistant Professor of Nanoscience and Technology at School of Basic and Applied Sciences, Guru Gobind Singh Indraprastha University, New Delhi, India. He obtained Ph.D. degree from Institute of Physics (IOP), Bhubaneswar, India. He has worked as Postdoctoral Research Associate at Inter University Accelerator Centre (IUAC), New Delhi, India. His current research interests include synthesis and ion beam engineering of
multifunctional hybrid nanostructures and plasmonic nanocomposites for the development of ultra-sensitive chemical and biosensors, gas sensors and highly efficient photocatalysts.
Introduction
Water contamination due to toxic chemicals and hazardous water soluble organic dyes in industrial effluents pose a severe threat to the environment. Purification and detoxification of industrial waste water is of immense importance for environmental remediation. Development of highly efficient and sun light active photocatalysts for elimination of toxic pollutants from water has driven
significant research interests over the last few decades [1-

Kuriakose, Satpati and Mohapatra
Adv. Mater. Lett. 2015, 6(3), 217-223 Copyright © 2015 VBRI Press 218
5]. Semiconductors such as ZnO and TiO2 have attracted
significant attention as efficient photocatalysts for degradation of organic dyes and toxic chemicals in waste
water [6-9]. ZnO with wide band gap (3.37 eV) and large
excitonic binding energy is one of the most widely used photocatalyst due to its non-toxicity, lower cost and ease of
large scale synthesis [10-12].
ZnO nanostructures with different morphology such as nanoparticles, micro/ nanorods, nanoballs and nanoflowers
have received
increasing attention for diverse applications including
photocatalytic degradation of organic dyes [13-17], dye
sensitized solar cells [18-21], and gas sensors [22, 23].
However, ZnO nanostructures suffer from low photocatalytic efficiency due to rapid recombination of
photoexcited electrons and holes [24, 25]. This limitation
can be overcome by suppressing the recombination of photogenerated charge carriers in ZnO. Doping ZnO nanostructures with transition metals has been used to inhibit the recombination, since doping introduces a change in the band structure of ZnO and creates traps to capture
photogenerated charge carriers [26]. Various transition metals such as Co, Cu, Ni, Fe and Mn have been used as dopants for tuning the optical and electrical properties of
semiconductors [27-30]. Doping with Co is considered to
be very effective for tuning the optical properties of ZnO
[31]. Lu et al. [25]
synthesized Co doped ZnO nanorods, by
a facile hydrothermal process, which led to photocatalytic degradation of 93% of 58 μM alizarin red dye in 60 minutes. Doping ZnO with Co enhanced the charge separation and charge transfer ability which in turn inhibited the recombination of photogenerated charge carriers in ZnO, resulting in high visible light photocatalytic
activity. Xiao et al. [32] synthesized Co doped ZnO, by
hydrothermal method, which led to the complete degradation of 31 μM methylene blue dye in 300 minutes. The high photocatalytic activity in these samples was attributed to the higher concentration of oxygen vacancies
and defects in ZnO. Xu et al. [33] studied the photocatalytic activity of Co doped ZnO towards degradation of MO dye and showed that Co doped ZnO nanostructures led to degradation of 78% of 30 μM MO dye in 240 minutes. Though there are few earlier reported works on the photocatalytic degradation of organic dyes by Co doped ZnO nanostructures, the photocatalytic efficiency achieved was not very high.
In this paper, we report highly enhanced photocatalytic activity of Co doped ZnO nanodisks, prepared by a facile wet chemical method, for sun light driven degradation of aqueous MO dye. Co doped ZnO nanodisks degraded 91% of 10 μM MO dye in just 8 minutes. The high photocatalytic efficiency achieved in our study for sun light driven photocatalytic degradation of MO dye by Co doped ZnO nanodisks have not been reported till date. We have shown that the photocatalytic efficiency is dependent on the level of Co doping in ZnO nanodisks.
Experimental
Materials
Zinc chloride (ZnCl2) and hexamethylenetetramine (HMTA) were used as the precursors for synthesis of ZnO nanodisks. Cobalt chloride hexahydrate (CoCl2. 6H2O) was
used for doping Co into ZnO nanodisks. Methyl orange (MO) was used for studying the photocatalytic activity of ZnO and Co doped ZnO nanodisks and was purchased from SRL, India. Zinc chloride, cobalt chloride and HMTA were purchased from Merck, India. All the chemicals used were of analytical grade and were used as received without any further purification.
Synthesis of ZnO and Co doped ZnO nanodisks
In a typical synthesis of ZnO nanodisks, ZnCl2 was dissolved in 50 mL double distilled water under stirring. A calculated amount of HMTA was dissolved in 50 mL of double distilled water in another beaker for reaching 1:1 ratio with Zn
2+ ions. Both these solutions were then mixed
together, continuously stirred and heated at 950C for 3 h. It
was then allowed to cool down and left undisturbed overnight. The white precipitates formed were thoroughly washed with double distilled water by repeated centrifugation-redispersion and dried at 80
oC for 20 h. The
solid white powder thus obtained was used for characterization and photocatalytic studies. Co-doped ZnO nanodisks were synthesized by adding CoCl2.6H2O to the 50 mL aqueous ZnCl2 solution, followed by addition of HMTA in 1:1 ratio and repeating the procedure for the synthesis of ZnO nanodisks. For different levels of Co doping in ZnO nanodisks the relative concentration of CoCl2.6H2O in the mixture was varied. Two different batches (A and B) of samples were prepared with different Zn
2+ concentrations of 0.01 M and 0.02 M.
The batch A consists of undoped ZnO sample (0.02 M) and doped samples prepared with 2.5%, 5% and 10% Co in ZnO and are hereafter referred to as PZA, CZA1, CZA2 and CZA3, respectively. The batch B consist of undoped ZnO sample (0.01 M) and doped samples with 5% and 10% Co in ZnO and are hereafter referred to as PZB, CZB1 and CZB2, respectively. Characterization of photocatalysts
The structural properties of as-synthesized samples were investigated using powder X-ray diffraction (XRD) studies, carried out using Panalytical X’pert Pro diffractometer with
Cu K radiation ( = 0.1542 nm) and transmission electron microscopy (TEM) using FEI, Tecnai G
2 F30 microscope
operating at 300 kV. The surface morphology of the samples was studied by atomic force microscopy (using Park systems XE-70) and field emission scanning electron microscopy (FESEM) (using MIRA, TESCAN). The optical properties of as-synthesized ZnO and Co doped ZnO samples were studied by UV-visible absorption spectroscopy. The powder samples were dispersed in double distilled water by sonication. UV-visible absorption spectra of the samples were recorded in the wavelength range of 200 - 800 nm using HITACHI U-3300 spectrophotometer, with double distilled water as the reference medium. Raman spectra on Co doped ZnO nanodisks were obtained using Horiba Jobin Yvon LabRAM using Ar laser (488 nm) with 1 µm spot size.
Photocatalytic measurements
Methyl orange (MO) is a widely used and stable organic dye. In this study, MO was used as a model dye to study the

Research Article Adv. Mater. Lett. 2015, 6(3), 217-223 ADVANCED MATERIALS Letters
Adv. Mater. Lett. 2015, 6(3), 217-223 Copyright © 2015 VBRI Press
photocatalytic activity of ZnO and Co doped ZnO nanodisks under sun light irradiation. For the photocatalytic studies, 5 mg of as-synthesized ZnO and Co doped ZnO photocatalysts were dispersed in 5 mL double distilled water in glass vials under sonication. 10 μM MO dye solutions were added to the vials with the photocatalysts and thoroughly mixed and kept in the dark for 30 minutes to reach the adsorption−desorption equilibrium, after which it was irradiated with sun light for different durations (2, 4, and 8 minutes). These experiments were carried out during mid day in April ensuring irradiations with sun light of maximum luminosity. After the exposure with sun light, the photocatalysts were removed from the dispersions by centrifugation and the final concentration of MO dye in the solution was monitored by UV-visible absorption spectroscopy with double distilled water as reference medium. The following formula was used to calculate the photocatalytic efficiency of the photocatalysts for the degradation of MO dye;
where C0 is the absorbance of 10 μM MO dye solution
before addition of any photocatalyst and sun light exposure and C is the absorbance of MO in reaction suspensions with photocatalyst following exposure with sun light for time t.
Results and discussion
Structure and morphology
The surface morphology of undoped ZnO and Co doped
ZnO samples were studied using FESEM. Fig. 1(a and c) show the FESEM images of undoped ZnO samples PZA
and PZB and Fig. 1 (b and d) show the FESEM images of Co doped ZnO samples CZA2 and CZB1. It can be seen that all the samples consist of a large concentration of nanodisks in addition to few nanorods.
Fig. 1. FESEM images of samples (a) PZA, (b) CZA2, (c) PZB and (d) CZB1.
Fig. 2 shows the AFM image of Co doped ZnO sample CZA2. AFM results clearly show the presence of nanodisk like structures along with few nanorods. The line profiles
for two nanodisks are also shown in Fig. 2. The thickness of the two marked nanodisks, as seen from the line profiles, are 127 nm and 86 nm, while the widths are found to be 263 nm and 133 nm, respectively.
Fig. 2. AFM image of Co doped ZnO sample CZA2.
TEM images of Co doped ZnO sample (CZA2) are
shown in Fig. 3 (a-b). From these TEM images one can see clearly that the sample contains nanodisks of varying size. The selected area electron diffraction (SAED) patterns (data not shown) from the nanodisks confirmed the single crystal nature of ZnO nanodisks having hexagonal close packed (hcp) structure with lattice parameters a = 3.253 Å
and c = 5.213 Å. Fig. 3 (c) shows the HRTEM image from a region of ZnO nanodisk. The HRTEM image clearly shows the single crystal nature of the nanodisk. The observed lattice spacing of 2.47 Å indicates the (011) inter-planar spacing (d-spacing) of hexagonal ZnO.
Fig. 3. (a, b) TEM images of CZA2 showing ZnO nanodisks, (c) HRTEM image from a region of nanodisk showing lattice fringes.
XRD patterns of as-synthesized undoped ZnO and Co doped ZnO samples PZA, CZA1, CZA2, CZA3, PZB,
CZB1 and CZB2 are shown in Fig. 4. The peaks observed in the XRD spectra are indexed to the hexagonal wurtzite structure of crystalline ZnO [JCPDS no. 36-1451]. No extra peaks due to any impurity could be observed. No

Kuriakose, Satpati and Mohapatra
Adv. Mater. Lett. 2015, 6(3), 217-223 Copyright © 2015 VBRI Press 220
significant shift in the (101) peak was observed due to the addition of Co dopant, since the ionic radii of Co and Zn are very close to each other (Zn
2+ ≈ 0.60Å, Co
2+ ≈ 0.56Å).
Any expected shift in the peak is beyond the resolution of
our diffractometer [34].
Fig. 4. XRD patterns of undoped ZnO and Co doped ZnO samples.
Optical properties
Fig. 5 (a) shows the optical absorption spectra for as prepared samples, which reveal a small peak in the UV region for undoped and doped samples. In addition to this UV peak, a broad absorption band in the visible region (between 400 nm to 520 nm) was observed in case of Co doped ZnO samples, which is assigned to the Co incorporated into the ZnO lattice. The band gap of Co doped ZnO samples are estimated to be higher as compared to undoped ZnO for both sets of samples. Typical Raman spectra of ZnO nanostructures in the range of 250 to 800
cm-1
are shown in Fig. 5 (b). Optical phonon of ZnO zone centre belongs to C6v space group and has the irreducible
representation A1+2B1+E1+2E2 [35]. The strongest peak E2
(high) at 437 cm
-1 is associated with motion of the oxygen
atoms. A second order mode caused by multi-phonon processes results in a peak at 330 cm
-1 and is assigned to the
E2(high)
– E2(low)
mode [36]. The peak at 384 cm-1
is assigned to A1(TO) mode. The A1(LO) /E1(LO) peak at 574 cm
-1 is
related to oxygen vacancies and Zn interstitials. The band
at 660 cm−1
is assigned to A1 (LO) + E2(low)
mode [35].
Fig. 5. (a) UV-visible absorption spectra of undoped ZnO and Co doped ZnO samples and (b) Typical Raman spectra of undoped ZnO nanodisks.
The formation of ZnO nanodisks can be understood as follows. The growth of any nanostructure occurs along the direction in which it has the lowest surface energy. In the case of ZnO nanostructure, growth occurs along the [0001] direction (c axis terminated by Zn), since (0001) facet has
the lowest surface energy. This results in formation of nanorods as the growth velocity along <1010> is slower than along [0001] direction. By suppressing the growth
along c-axis, nanodisk structures can be formed [37-39].
Normally, the formation of nanorods takes place when OH-
ions adsorbed on the (0001) surface attaches more of Zn+
ions to the end. But if an electronegative ion such as (as
in our case) is adsorbed on (0001) surface, it hinders the further attachment of growth units along this
direction. This suppresses the growth along (0001) direction and hence growth proceeds along sideways
directions leading to the formation of ZnO nanodisks [37-
39].
Photocatalytic studies
Photocatalytic studies have been carried out by sun light
irradiation of aqueous solutions of 10 M MO dye with different undoped ZnO and Co doped ZnO samples as photocatalysts for varying durations. The results of photocatalytic studies using samples PZA, CZA1, CZA2,
CZA3 as photocatalysts are shown in Fig. 6, while the results using samples PZB, CZB1 and CZB2 as
photocatalysts are shown in Fig. 7. The characteristic absorption peak of MO at 464 nm is monitored as a function of sun light exposure time. From the UV-visible
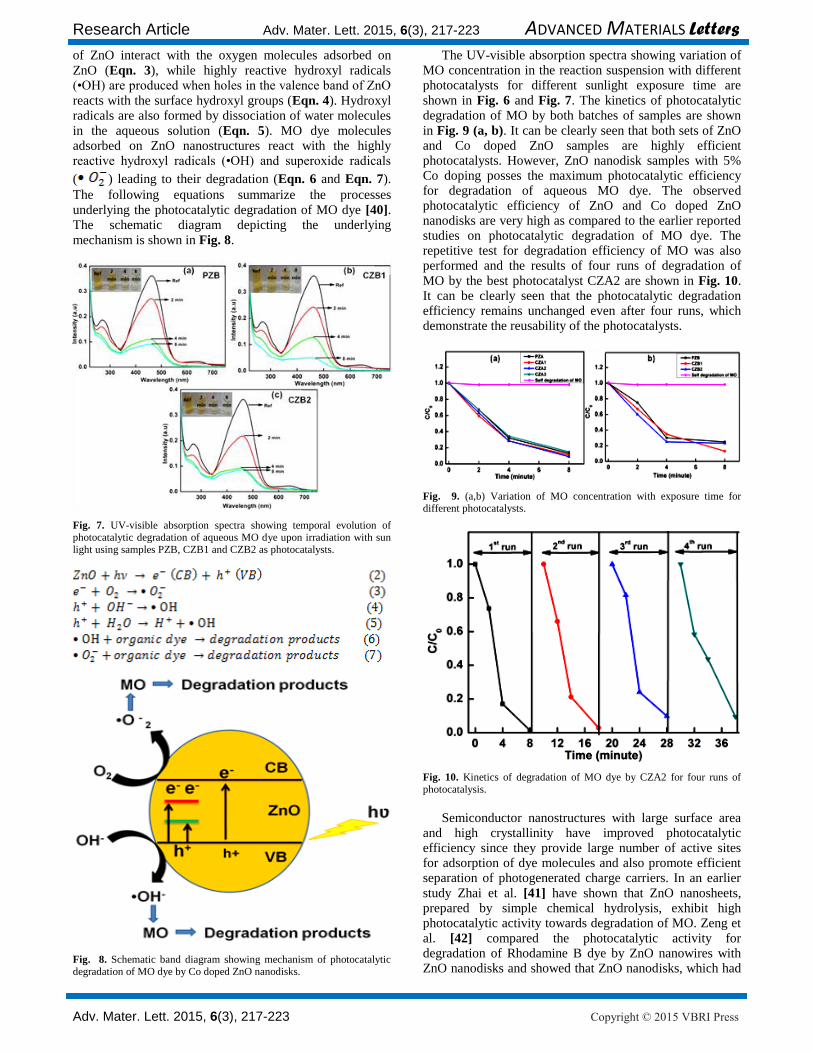
absorption spectra (Fig. 6 and 7), it can be clearly seen that for Co doped ZnO nanodisks the characteristic absorption peak of MO diminishes drastically following sun light exposure. Among both the batches of undoped ZnO and Co doped ZnO samples, 5% Co doped ZnO samples are found to the most efficient photocatalysts leading to almost complete degradation of MO dye in just 8 minutes.
Fig. 6. UV-visible absorption spectra showing temporal evolution of photocatalytic degradation of aqueous MO dye upon irradiation with sun light using samples PZA, CZA1, CZA2 and CZA3 as photocatalysts.
The mechanism underlying photocatalytic degradation of MO dye by ZnO and Co doped ZnO nanodisks can be understood as follows. Firstly, MO dye adsorbs onto the surface of ZnO and Co doped ZnO nanodisks. When the dye adsorbed photocatalyst is irradiated with sun light, it leads to the generation of electron-hole (e
- - h
+) pairs in
ZnO (Eqn. 2). Superoxide anion radicals ( ) are formed
when the photogenerated electrons in the conduction band
Research Article Adv. Mater. Lett. 2015, 6(3), 217-223 ADVANCED MATERIALS Letters
Adv. Mater. Lett. 2015, 6(3), 217-223 Copyright © 2015 VBRI Press
of ZnO interact with the oxygen molecules adsorbed on
ZnO (Eqn. 3), while highly reactive hydroxyl radicals (•OH) are produced when holes in the valence band of ZnO
reacts with the surface hydroxyl groups (Eqn. 4). Hydroxyl radicals are also formed by dissociation of water molecules
in the aqueous solution (Eqn. 5). MO dye molecules adsorbed on ZnO nanostructures react with the highly reactive hydroxyl radicals (•OH) and superoxide radicals
( ) leading to their degradation (Eqn. 6 and Eqn. 7).
The following equations
summarize the processes
underlying the photocatalytic degradation of MO dye [40]. The schematic diagram depicting the underlying
mechanism is shown in Fig. 8.
Fig. 7. UV-visible absorption spectra showing temporal evolution of photocatalytic degradation of aqueous MO dye upon irradiation with sun light using samples PZB, CZB1 and CZB2 as photocatalysts.
Fig. 8. Schematic band diagram showing mechanism of photocatalytic degradation of MO dye by Co doped ZnO nanodisks.
The UV-visible absorption spectra showing variation of MO concentration in the reaction suspension with different photocatalysts for different sunlight exposure time are
shown in Fig. 6 and Fig. 7. The kinetics of photocatalytic degradation of MO by both batches of samples are shown
in Fig. 9 (a, b). It can be clearly seen that both sets of ZnO and Co doped ZnO samples are highly efficient photocatalysts. However, ZnO nanodisk samples with 5% Co doping posses the maximum photocatalytic efficiency for degradation of aqueous MO dye. The observed photocatalytic efficiency of ZnO and Co doped ZnO nanodisks are very high as compared to the earlier reported studies on photocatalytic degradation of MO dye. The repetitive test for degradation efficiency of MO was also performed and the results of four runs of degradation of
MO by the best photocatalyst CZA2 are shown in Fig. 10. It can be clearly seen that the photocatalytic degradation efficiency remains unchanged even after four runs, which demonstrate the reusability of the photocatalysts.
Fig. 9. (a,b) Variation of MO concentration with exposure time for different photocatalysts.
Fig. 10. Kinetics of degradation of MO dye by CZA2 for four runs of
photocatalysis.
Semiconductor nanostructures with large surface area and high crystallinity have improved photocatalytic efficiency since they provide large number of active sites for adsorption of dye molecules and also promote efficient separation of photogenerated charge carriers. In an earlier
study Zhai et al. [41] have shown that ZnO nanosheets, prepared by simple chemical hydrolysis, exhibit high photocatalytic activity towards degradation of MO. Zeng et
al. [42] compared the photocatalytic activity for degradation of Rhodamine B dye by ZnO nanowires with ZnO nanodisks and showed that ZnO nanodisks, which had

Kuriakose, Satpati and Mohapatra
Adv. Mater. Lett. 2015, 6(3), 217-223 Copyright © 2015 VBRI Press 222
a higher population of (0001) facets, have better
photocatalytic activity. Roy et al. [43] showed that the exposed facets play a crucial role in the photocatalytic activity due to the preferential flow of photogenerated electrons and holes to particular facets. In our case the samples consist of ZnO nanodisks along with few nanorods. ZnO nanodisks with higher surface area provide increased number of active sites for enhanced adsorption of MO dye molecules and promote efficient separation of
photogenerated charge carriers. Xiao et al. [32] showed that for an optimum Co doping, high photocatalytic activity could be achieved because the recombination of photogenerated electrons and holes could be efficiently
inhibited. Lu et al. [25] reported that beyond an optimum doping level there could be a decrease in the photocatalytic efficiency. This is due to the decrease in the effective active sites because of accumulation of Co and formation of a new phase on the surface of ZnO resulting in decreased separation and transportation of photoexcited electrons and holes. Our results also suggest that an optimum Co doping of 5% extends the photoresponse to visible region and facilitates increased charge separation and transport in ZnO, which decreases the recombination rate of the photogenerated charge carriers. In our case, the ZnO nanodisk samples prepared with 5% Co doping (CZA2 and CZB1) showed the highest photocatalytic efficiency for degradation of MO dye as compared all the other synthesized samples.
Conclusion
In summary, nanodisks of ZnO and Co doped ZnO were synthesized by a facile wet chemical method and their structural, optical and photocatalytic properties were studied. We have demonstrated that ZnO nanodisks and Co doped ZnO nanodisks exhibit very high photocatalytic efficiency for sun light driven degradation of methyl orange dye. The enhanced photocatalytic activity of Co doped ZnO nanodisks is attributed to their high surface area leading to enhanced dye adsorption and the optimal Co doping, which leads to improved separation of photoexcited electrons and holes, inhibiting their recombination. By using facile synthetic routes we can develop highly efficient and stable photocatalysts much needed for safe and clean water.
Acknowledgements The authors are thankful to Hemant, Sunil and Srikanth for helping in the sample preparation, FESEM and XRD measurements, respectively. SM is thankful to Department of Science and Technology (DST), New Delhi for providing AFM and XRD facilities at Guru Gobing Singh Indraprastha
University and FESEM facility at IUAC, New Delhi under Nano Mission program. SM is thankful to University Grants Commission (UGC), New Delhi for funding under Major Research Project (F.No: 41-865/2012(SR)). SK is thankful to Guru Gobind Singh Indraprastha University, New Delhi for providing financial assistance through IPR Fellowship.
Reference
1. Baruah, S.; Sinha, S. S.; Ghosh, B.; Pal, S. K.; Raychaudhuri, A. K.;
Dutta, J. J. Appl. Phys. 2009, 105, 074308.
DOI: 10.1063/1.3100221
2. Khan, S. B.; Faisal, M.; Rahman, M. M.; Jamal, A. Talanta 2011, 85, 943– 949.
DOI: 10.1016/j.talanta.2011.05.003
3. Lv, Y.; Pan, C.; Ma, X.; Zong, R.; Bai, X.; Zhu, Y. Appl. Catal. B
2013, 138–139, 26.
DOI: 10.1016/j.apcatb.2013.02.011
4. Kuriakose, S; Choudhary, V; Satpati, B; Mohapatra, S. Beilstein J.
Nanotechnol. 2014, 5, 639.
DOI: 10.3762/bjnano.5.75 5. Jasso-Salcedo, A. B.; Palestino, G; Escobar-Barrios , V. A. J.Cataly
2014, 318, 170.
DOI: 10.1016/j.jcat.2014.06.008 6. Joo, J. B.; Lee, I.; Dahl, M.; Moon, G. D.; Zaera, F.; Yin, Y. Adv.
Funct. Mater. 2013, 23, 4246.
DOI: 10.1002/adfm.201300255 7. Nakata, K.; Fujishima, A. J. Photochem. Photobio. C: Photochem.
Rev. 2012, 13, 169.
DOI: 10.1016/j.jphotochemrev.2012.06.001 8. Kaneva, N.; Stambolova, I.; Blaskov, V.; Dimitriev, Y.; Bojinova, A.;
Dushkin, C. Surf. Coat. Technol. 2012, 207, 5.
DOI: 10.1016/j.surfcoat.2011.10.020 9. Sun, L.; Shao, R.; Chen, Z.; Tang, L.; Dai, Y.; Ding, J. Appl. Surf.
Sci. 2012, 258, 5455.
DOI: 10.1016/j.apsusc.2012.02.034 10. Mclaren, A.; Valdes-Solis, T.; Li, G.; Tsang, S. C. J. Am. Chem. Soc.
2009, 131, 12540.
DOI: 10.1021/ja9052703 11. Bai, X.; Wang, L.; Zong, R.; Lv, Y.; Sun, Y.; Zhu, Y. Langmuir
2013, 29, 3097.
DOI: 10.1021/la4001768
12. Liu, Z.; Zhang, Q.; Li, Y.; Wang, H. J. Phys. Chem. Solids 2012, 73, 651.
DOI: 10.1016/j.jpcs.2012.01.003 13. Kuriakose, S.; Bhardwaj, N.; Singh, J.; Satpati, B.; and Mohapatra,
S. Beilstein J. Nanotechno. 2013, 4, 763.
DOI: 10.3762/bjnano.4.87
14. Xia, C.; Wang, N.; Wang, L.; Guo, L. Sensors Actuat. B 2010, 147, 629.
DOI: 10.1016/j.snb.2010.04.005 15. Zhou, Y.; Li, D.; Zhang, X.; Chen, J.; Zhang, S. Appl. Surf. Sci.
2012, 261, 759.
DOI: 10.1016/j.apsusc.2012.07.160 16. Xing, Z.; Geng, B.; Li, X.; Jiang, H.; Feng, C.; Ge, T.
CrystEngComm 2011, 13, 2137.
DOI: 10.1039/C0CE00741B 17. Kuriakose, S; Choudhary, V; Satpati, B; Mohapatra, S.
Phys.Chem.Chem.Phys., 2014, 16, 17560.
DOI: 10.1039/c4cp02228a
18. Sakai, N.; Miyasaka, T.; Murakami, T. N. J. Phys. Chem. C 2013, 117, 10949.
DOI: 10.1021/jp401106u 19. Karst, N.; Rey, G.; Doisneau, B.; Roussel, H.; Deshayes, R.;
Consonni, V.; Ternon, C.; Bellet, D. Mater. Sci. Eng. B 2011, 176, 653.
DOI: 10.1016/j.mseb.2011.02.009 20. Shao, S.; Zheng, K.; Zidek, K.; Chabera, P.; Pullerits, T. ; Zhang, F.
Solar Energy Mater. Solar Cells 2013, 118, 43.
DOI: 10.1016/j.solmat.2013.07.046
21. Lin, Y.; Yang, J.; Meng, Y. Ceram. Inter. 2013, 39, 5049.
DOI: 10.1016/j.ceramint.2012.11.103 22. Shi, L.; Naik, A. J. T.; Goodall, J. B. M.; Tighe, C.; Gruar, R.;
Binions, R.; Parkin, I.; Darr, J. Langmuir 2013, 29, 10603.
DOI: 10.1021/la402339m 23. Huang, J.; Wu, Y.; Gu, C.; Zhai, M.; Yu, K.; Yang, M.; Liu, J.
Sensors Actuat. B 2010, 146, 206.
DOI: 10.1016/j.snb.2010.02.052 24. Liu, H. R.; Shao, G. X.; Zhao, J. F.; Zhang, Z. X.; Zhang, Y.; Liang,
J.; Liu, X. G.; Jia, H.S.; Xu, B. S. J. Phys. Chem. C 2012, 116, 16182.
DOI: 10.1021/jp2115143 25. Lu, Y.; Lin, Y.; Wang, D.; Wang, L.; Xie, T.; Jiang, T. Nano Res.
2011, 4, 1144.
DOI: 10.1007/s12274-011-0163-4 26. Barakat, M. A.; Schaeffer, H.; Hayes, G.; Ismat-Shah, S. Appl. Catal.
B: Environ. 2004, 57, 23.
DOI: 10.1016/j.apcatb.2004.10.001 27. Zhang, Y.; Ram, M. K.; Stefanakos, E. K.; Goswami, D. Y. Surf.
Coat. Techno. 2013, 217, 119.
DOI: 10.1016/j.surfcoat.2012.12.001
28. Ullah, R.; Dutta, J. J. Hazard. Mater. 2008, 156, 194.
DOI: 10.1016/j.jhazmat.2007.12.033
29. Kant, S.; Kumar, A. Adv. Mat. Lett. 2012, 3, 350.

Research Article Adv. Mater. Lett. 2015, 6(3), 217-223 ADVANCED MATERIALS Letters
Adv. Mater. Lett. 2015, 6(3), 217-223 Copyright © 2015 VBRI Press
DOI: 10.5185/amlett.2012.5344
30. Mohan, R.; Krishnamoorthy, K.; Kim, S. J. Solid State Comm. 2012, 152, 375.
DOI: 10.1016/j.ssc.2011.12.008
31. Hammad, T. M.; Salem, J. K.; Harrison, R. G. Appl. Nanosci. 2013,
3, 133.
DOI: 10.1007/s13204-012-0077-9
32. Xiao, Q.; Zhang, J.; Xiao, C.; Tan, X. Mater. Sci. Eng. B 2007, 142, 121.
DOI: 10.1016/j.mseb.2007.06.021 33. Xu, C.; Cao, L.; Su, G.; Liu, W.; Qu, X.; Yu, Y. J. Alloys Comp.
2010, 497, 373.
DOI: 10.1016/j.jallcom.2010.03.076 34. Yuhas, B. D.; Zitoun, D. O.; Pauzauskie, P. J.; He, R.; Yang, P.
Angew. Chem. Int. Ed. 2006, 45, 420.
DOI: 10.1002/anie.200503172 35. Šćepanović, M.; Grujić-Brojčin, M.; Vojisavljević, K.; Bernik, S.;
Srećković, T. J. Raman Spectrosc. 2010, 41, 914.
DOI: 10.1002/jrs.2546
36. Pal, B. and Giri, P. K. J. Nanosci. Nanotechno. 2011, 11, 1.
DOI: 10.1166/jnn.2011.4293 37. Xu, C. X.; Sun, X. W.; Dong, Z. L.; Yu, M. B. Appl. Phys. Lett.
2004, 85, 3878.
DOI: 10.1063/1.1811380
38. Pradhan, D.; Leung, K. T. Langmuir 2008, 24, 9707.
DOI: 10.1021/la8008943 39. Kuriakose, S.; Satpati, B.; and Mohapatra, S. Phys. Chem. Chem.
Phys. 2014, 16, 12741.
DOI: 10.1039/c4cp01315h
40. Legrini, O.; Oliveros, E.; Braun, A. M. Chem. Rev. 1993, 93, 671.
DOI: 10.1021/cr00018a003 41. Zhai, T.; Xie, S.; Zhao, Y.; Sun, X.; Lu, X.; Yu, M.; Xu, M.; Xiao,
F.; Tong, Y. CrystEngComm 2012, 14. 1850.
DOI: 10.1039/C1CE06013A
42. Zeng, J. H.; Jin, B. B.; Wang, Y. F. Chem. Phys. Lett. 2009, 472, 90.
DOI: 10.1016/j.cplett.2009.02.082
43. Roy, N.; Sohn, Y.; Pradhan, D. ACS Nano 2013, 7, 2532.
DOI: 10.1021/nn305877v