On the mechanical properties of nanoporous anodized alumina by nanoindentation and sliding tests
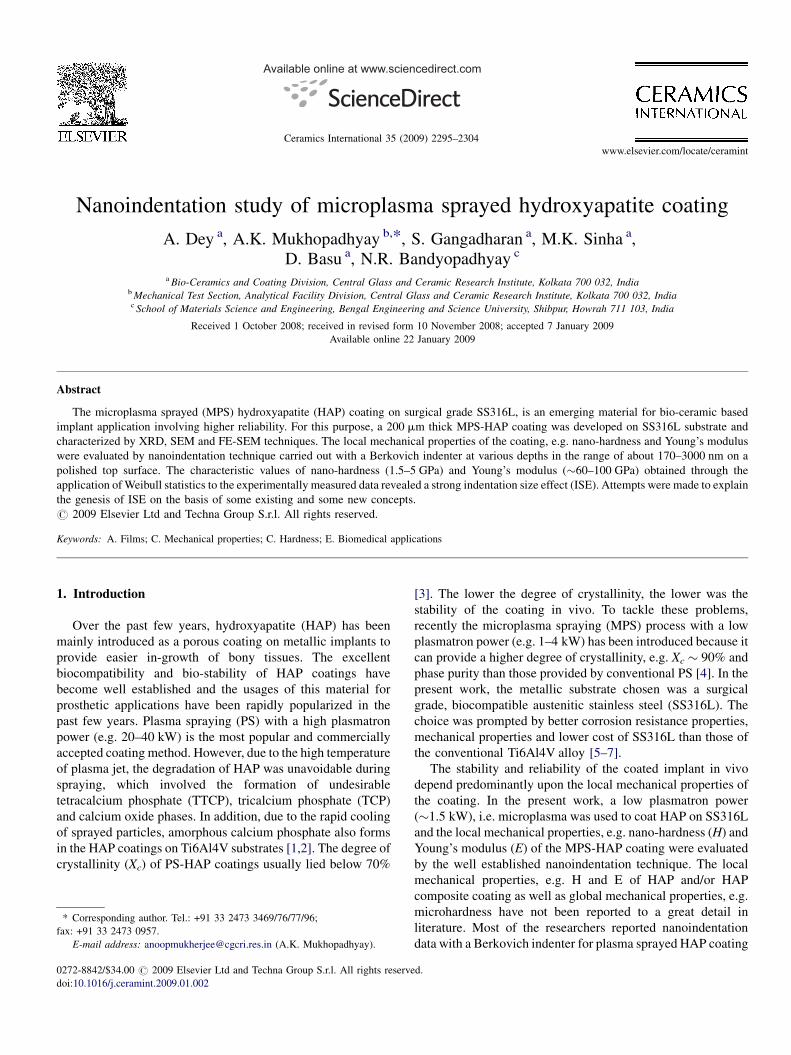
Nanoindentation study of microplasma sprayed hydroxyapatite coating
A. Dey a, A.K. Mukhopadhyay b,*, S. Gangadharan a, M.K. Sinha a,D. Basu a, N.R. Bandyopadhyay c
a Bio-Ceramics and Coating Division, Central Glass and Ceramic Research Institute, Kolkata 700 032, Indiab Mechanical Test Section, Analytical Facility Division, Central Glass and Ceramic Research Institute, Kolkata 700 032, Indiac School of Materials Science and Engineering, Bengal Engineering and Science University, Shibpur, Howrah 711 103, India
Received 1 October 2008; received in revised form 10 November 2008; accepted 7 January 2009
Available online 22 January 2009
Abstract
The microplasma sprayed (MPS) hydroxyapatite (HAP) coating on surgical grade SS316L, is an emerging material for bio-ceramic based
implant application involving higher reliability. For this purpose, a 200 mm thick MPS-HAP coating was developed on SS316L substrate and
characterized by XRD, SEM and FE-SEM techniques. The local mechanical properties of the coating, e.g. nano-hardness and Young’s modulus
were evaluated by nanoindentation technique carried out with a Berkovich indenter at various depths in the range of about 170–3000 nm on a
polished top surface. The characteristic values of nano-hardness (1.5–5 GPa) and Young’s modulus (�60–100 GPa) obtained through the
application of Weibull statistics to the experimentally measured data revealed a strong indentation size effect (ISE). Attempts were made to explain
the genesis of ISE on the basis of some existing and some new concepts.
# 2009 Elsevier Ltd and Techna Group S.r.l. All rights reserved.
Keywords: A. Films; C. Mechanical properties; C. Hardness; E. Biomedical applications
www.elsevier.com/locate/ceramint
Available online at www.sciencedirect.com
Ceramics International 35 (2009) 2295–2304
1. Introduction
Over the past few years, hydroxyapatite (HAP) has been
mainly introduced as a porous coating on metallic implants to
provide easier in-growth of bony tissues. The excellent
biocompatibility and bio-stability of HAP coatings have
become well established and the usages of this material for
prosthetic applications have been rapidly popularized in the
past few years. Plasma spraying (PS) with a high plasmatron
power (e.g. 20–40 kW) is the most popular and commercially
accepted coating method. However, due to the high temperature
of plasma jet, the degradation of HAP was unavoidable during
spraying, which involved the formation of undesirable
tetracalcium phosphate (TTCP), tricalcium phosphate (TCP)
and calcium oxide phases. In addition, due to the rapid cooling
of sprayed particles, amorphous calcium phosphate also forms
in the HAP coatings on Ti6Al4V substrates [1,2]. The degree of
crystallinity (Xc) of PS-HAP coatings usually lied below 70%
* Corresponding author. Tel.: +91 33 2473 3469/76/77/96;
fax: +91 33 2473 0957.
E-mail address: [email protected] (A.K. Mukhopadhyay).
0272-8842/$34.00 # 2009 Elsevier Ltd and Techna Group S.r.l. All rights reserve
doi:10.1016/j.ceramint.2009.01.002
[3]. The lower the degree of crystallinity, the lower was the
stability of the coating in vivo. To tackle these problems,
recently the microplasma spraying (MPS) process with a low
plasmatron power (e.g. 1–4 kW) has been introduced because it
can provide a higher degree of crystallinity, e.g. Xc � 90% and
phase purity than those provided by conventional PS [4]. In the
present work, the metallic substrate chosen was a surgical
grade, biocompatible austenitic stainless steel (SS316L). The
choice was prompted by better corrosion resistance properties,
mechanical properties and lower cost of SS316L than those of
the conventional Ti6Al4V alloy [5–7].
The stability and reliability of the coated implant in vivo
depend predominantly upon the local mechanical properties of
the coating. In the present work, a low plasmatron power
(�1.5 kW), i.e. microplasma was used to coat HAP on SS316L
and the local mechanical properties, e.g. nano-hardness (H) and
Young’s modulus (E) of the MPS-HAP coating were evaluated
by the well established nanoindentation technique. The local
mechanical properties, e.g. H and E of HAP and/or HAP
composite coating as well as global mechanical properties, e.g.
microhardness have not been reported to a great detail in
literature. Most of the researchers reported nanoindentation
data with a Berkovich indenter for plasma sprayed HAP coating
d.

A. Dey et al. / Ceramics International 35 (2009) 2295–23042296
on Ti6Al4V substrate [8–10]. The reported values on H and E
spanned a range of �4–5 and 83–123 GPa, respectively as
one moved from the coating-substrate interface to the free
coating side across the coating cross-section [8]. The
nanoindentation data showed further, that Young’s modulus
value of amorphous zone was much lower than that of the
crystalline zone of HAP coating [9,10]. On the other hand, for
HAP coating prepared by using an Nd-YAG laser on Ti, the
nanoindentation measurements with a Vicker’s diamond
pyramidal indenter along the coating cross-section showed
that both H and E values were lower at the coating side than at
the coating-substrate interface [11]. However, depending on
processing condition and type of substrates, the magnetron
sputtered thin HAP films (350–650 nm) displayed a much
higher range of nano-hardness (�4–9 GPa) and Young’s
moduli (�70–150 GPa) when measured with a Berkovich
indenter [12,13]. Nano-hardness and Young’s moduli data
have also been reported for functionally graded coating of
HAP/glass composite and HAP/a-TCP composite [14].
Others have evaluated Vicker’s microhardness and nano-
hardness of various composite coating systems, e.g. (a)
plasma sprayed 50 vol.% HAP/50 vol.% Ti6Al4V composite
coating on Ti6Al4V substrate [15], (b) plasma sprayed HAP/
YSZ/Ti6Al4V composite coating [16], (c) HAP/carbon
nanotube (CNT) composite coating [17] and (d) biomimetic
HAP coating deposited on Ti6Al4V and Ti13Nb11Zr alloy
substrates [18]. Most of these reports involve a Ti6Al4V or Ti
or Ti alloy substrate and thus the amount of information on
micro- or nano-mechanical properties of microplasma
sprayed HAP coating on SS316L substrate is almost
insignificantly small. This particular need provided the
genesis of the present work.
In general the scatter in data was very high for the plasma
sprayed coatings, presumably due to the highly heterogeneous
and porous structure of the coatings. To treat this scatter,
Weibull statistical analysis has been utilized and the
corresponding characteristic values in each case were
evaluated to obtain suitable results for structural designing.
As a matter of fact, this particular statistical method has been
widely utilized to calculate the characteristics values for
various mechanical properties of heterogeneous materials; for
example to calculate the Young’s modulus of the SiC/SiC
ceramic matrix composite for turbine vanes [19], the
microhardness and Young’s modulus of thermal barrier
coatings on Ti-alloys [20–22], etc. Thus, the Weibull statistical
analysis is a well established, simple and widely used
technique to calculate the characteristic properties of such
brittle materials with various phases, flaws or defects that
results in wide variations in the mechanical properties like
hardness and Young’s modulus.
From the survey of literature it appears that the local
mechanical properties of HAP coating are function of
method of preparation of the coating, substrate type,
condition of the substrate, coating thickness, test load,
loading rate, etc. However, as pointed out above, there has
not been any systematic study of local mechanical properties
for microplasma sprayed HAP coating on SS316L substrates.
Therefore, the objective of the present study was to prepare
the HAP coatings on SS316L substrates by microplasma
spraying (MPS) technique using a very low plasmatron
power (e.g. �1.5 kW) and characterize the local mechanical
properties, e.g. nano-hardness (H) and Young’s modulus (E)
of the coatings by the well established nanoindentation
technique.
2. Materials and methods
The HAP powder was conventionally synthesized by the
usual wet precipitation route. The detail preparation of HAP
powder has been described elsewhere [23,24]. The resulting
whitish precipitate was subsequently aged, dried, sintered at
1250 8C and sieved to produce sinter-granulated HAP to be
used as the starting powder for the microplasma spraying
process. Chemical analysis of the powder was performed by
inductively coupled plasma–atomic emission spectroscopy
(Spectro Flame Modula, Spectro-Analytical Instruments,
Model: STM 08, Germany). The size distribution of HAP
was measured by a particle size analyzer (Malvern Mastersizer
X, Malvern Instruments, Malvern, UK). Flowability of HAP
granule was measured as per ASTM B 212-99 standard by a
Hall Flowmeter (Lloyds, India).
The substrate used for coating was commercially available
surgical grade 316L stainless steel. The substrate was shaped
into strips and cylinder of sizes (155 mm � 20 mm � 2 mm)
and (w = 25 mm, L = 25.4 mm), respectively. Flat parallel
ground substrate strips were blasted with 200–250 mm alumina
grits to roughen the surface to an average roughness (Ra) value
of �2.5 mm, followed by ultrasonic cleaning (Microclean-109,
Oscar Ultrasonics, Mumbai, India) using sequentially AR-
grade acetone, ethanol and deionized water.
Thereafter, HAP coatings on SS316L substrates were
prepared by the microplasma spraying (MPS) technique at a
low plasmatron power of 1.5 kW using a commercial machine
(Miller Maxstar 200 SD 2.5 kW). Argon was used as the
primary and secondary gases. The MPS-HAP coated SS316L
samples were post-heat-treated at 600 8C in air to increase the
degree of crystallinity of the coating and the bonding strength.
The phase purity and crystallinity of the MPS-HAP coating
on the SS316L were analyzed by X-ray diffraction (Philips
PW1710, The Netherlands) using monochromatic Cu Ka1
radiation at 55 mA and 40 kV. The bonding strength of coating
was evaluated according to ASTM-C633. The microstructural
characterizations and film thickness measurements were
carried out by both SEM (scanning electron microscopy,
s430i, Leo, UK) and FE-SEM (field emission-scanning electron
microscopy, Supra VP35 Carl Zeiss, Germany) and subse-
quently by an image analyzer (Leica Q500MC, UK). Prior to
insertion in the sample chamber for electron microscopy, a 50–
70 nm carbon coating was deposited on the HAP coating by the
arc deposition technique to avoid charging.
Local mechanical properties, e.g. nano-hardness (H) and
Young’s modulus (E) were measured on the polished plan
section of the HAP coating, i.e. in a direction perpendicular to
the splat orientation by the nanoindentation technique using a
A. Dey et al. / Ceramics International 35 (2009) 2295–2304 2297
commercial machine (Fischerscope H100-XYp; Fischer,
Switzerland). The depth sensing resolution and force sensing
resolution were 1 nm and 0.2 mN, respectively. The machine
was calibrated with nanoindentation based independent
evaluation of H � 4.14 GPa and E � 84.6 GPa of a Schott
BK7 Glass. The experiments were conducted at nine different
loads in the range of 10–1000 mN with a Berkovich indenter on
the top surface (i.e. plan section) of polished, bonded, 200 mm
thick HAP coatings on SS316L substrates. The surface
roughness (Ra) of the bonded coating was �0.5 mm. The
maximum depth of penetration was kept within �5 mm, which
is well below 20 mm. The depth of 20 mm was about 10% of the
coating thickness. Thus, the measurements were taken from a
depth that would avoid the influence of the substrate’s
mechanical properties on the measured data. The Berkovich
indenter had a tip radius of about 150 nm and a semi-apex angle
of 65.038. Both the loading and unloading time were kept at
30 s. At least fifteen indents were made at each load at five
different locations of the sample as the nature of the coating was
porous and heterogeneous. The nano-hardness (H) and Young’s
modulus (E) were evaluated according to DIN 50359-1
standard from the load versus depth of penetration plots using
the well-established Oliver and Pharr (O–P) model [25].
The scatter in the data was treated in terms of the Weibull
statistics analysis. For this purpose, the two-parameter Weibull
distribution function was utilized. The function provides the
probability, p, for a given parameter, x, as [19,20,22]
p ¼ 1� exp � x
xo
� �m� �(1)
where xo is known as the scale parameter where the probability
of occurrence is 63.2% and ‘‘m’’ is the Weibull modulus. The
value of the Weibull modulus is a dimensionless quantity and
indicates the degree of scatter in the data. The magnitude of
‘‘m’’ increases with decreasing scatter. The survival probability
of the ith observation in the data arranged in ascending order
can be expressed as [19,20,22]
p ¼ i� 0:5
N(2)
where N is the total number of observations. Although, in some
literature, the formula for the probability estimator ‘‘p’’ was
found to be different, here we have employed the most exten-
sively used expression.
Taking ln for two times of both the sides and simplifying,
Eq. (1) can be expressed as
ln ln1
1� p
� �� �¼ m½lnðxÞ � lnðxoÞ� (3)
The values of m and xo are obtained by fitting the
experimental data to Eq. (3), by least square regression. The
slope of the straight line will give the value of Weibull modulus
(m) and the intercept on the ‘‘Y’’ axis will give the value of scale
parameter (xo). Finally, by setting the value of ln[ln {1/
(1 � p)}] equal to zero and placing the values of m and scale-
parameter in Eq. (3), one can easily calculate the characteristic
value (xo) of the related parameter, x. The characteristic values
(x) are of great engineering importance as it provides the
designer with a unique and dependable value of the required
parameter. In the present study, x was hardness and Young’s
modulus. The corresponding characteristic values were termed
as Hchar and Echar.
2.1. Basic theory of nanoindentation
During the nanoindentation, the high resolution instrument
continuously monitors the load, P and depth of penetration, h of
an indenter which in the present investigation was a Berkovich
tip. These data are utilized to get the load versus depth of
penetration (P � h) data plot. The important physical quantities
obtained from the load versus depth of penetration plot are: the
peak load, Pmax, maximum penetration depth, hmax, final
penetration depth, hf, and the contact stiffness, S.
According to the O–P model [25] which is the most
commonly used method to obtain the hardness and Young’s
modulus of a material by instrumented nanoindentation, the
nano-hardness (H) is expressed as
H ¼ Pmax
Acr
(4)
where Pmax is the maximum applied load and Acr is the real
contact area between the indenter and the material. According
to Oliver and Pharr, the polynomial form of Acr can be
expressed as [26]
Acr ¼ 24:56h2c þ C1hc þ C2h1=2
c þ C3h1=4c þ � � � þ C8h1=128
c
(5)
where C1–C8 are constants to be determined by standard
calibration method and hc is the penetration depth determined
from the following expression [26]:
hc ¼ hmax � kPmax
S
� �(6)
where k � 0.75 for a Berkovich indenter [27].
Again, the contact stiffness (S) which is the slope of the first
�1/3rd linear part recorded during the unloading cycle of the
load versus depth of penetration plot can be expressed as [28]
S ¼ dP
dh
� �h¼hmax
¼ aCAE�ffiffiffiffiffiffiAcr
p(7)
where a = 1.034 and CA ¼ 2=ffiffiffipp
for a Berkovich indenter [28]
and E* is the effective Young’s modulus. Following the O–P
model, E* can be expressed as [25]
1
E� ¼ð1� n2
i ÞEi
þ ð1� n2s Þ
Es(8)
where E and n are the Young’s modulus and Poisson’s ratio,
respectively and subscripts i and s, denotes the indenter and the
sample, respectively. For the Berkovich diamond indenter used
in the present work, the values of Ei and ni were taken as
1140 GPa and 0.07 respectively, following [28].
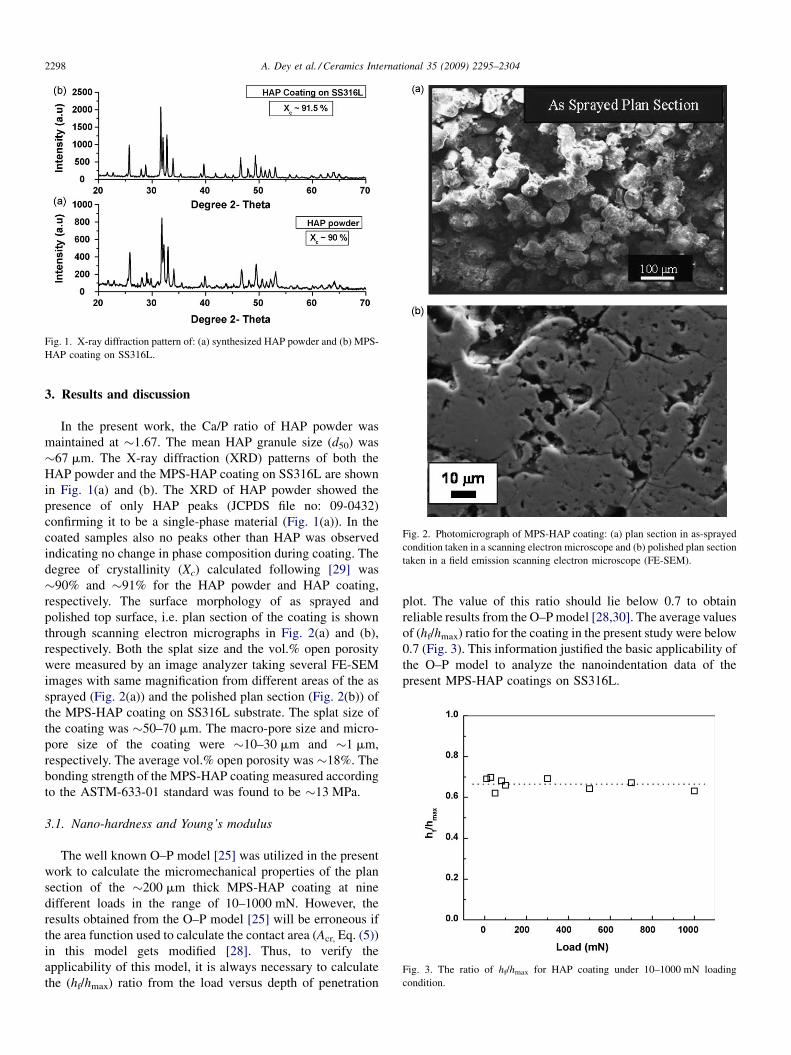
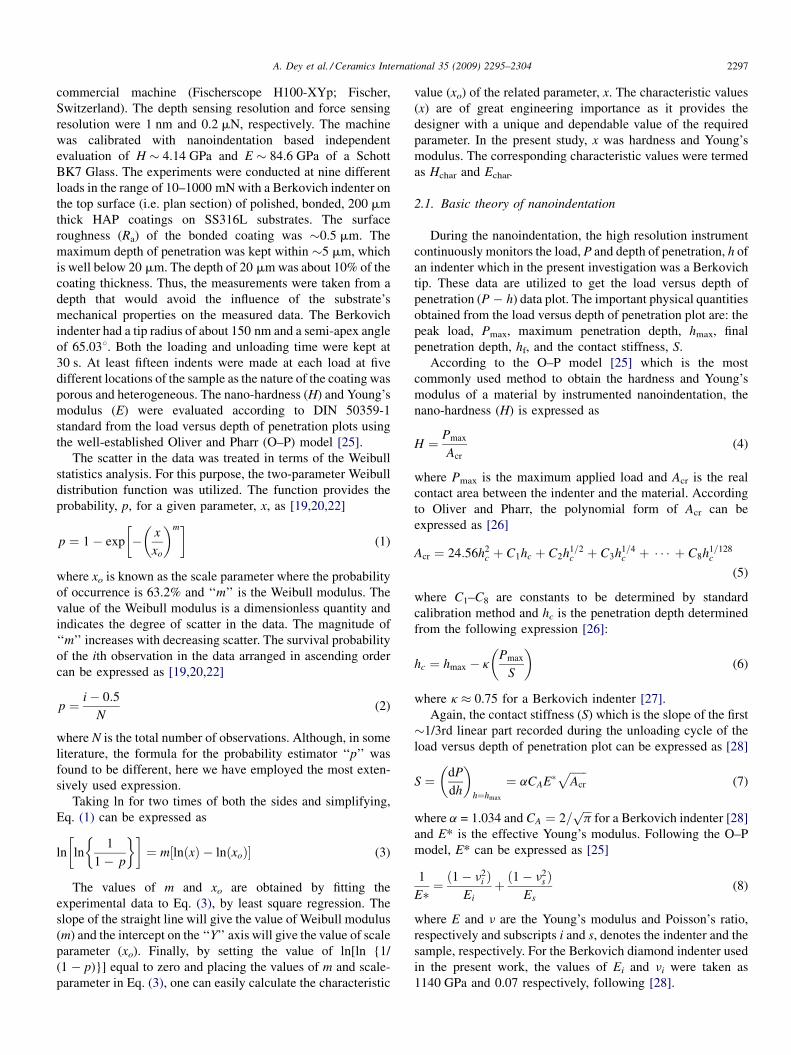
Fig. 1. X-ray diffraction pattern of: (a) synthesized HAP powder and (b) MPS-
HAP coating on SS316L.
Fig. 2. Photomicrograph of MPS-HAP coating: (a) plan section in as-sprayed
condition taken in a scanning electron microscope and (b) polished plan section
taken in a field emission scanning electron microscope (FE-SEM).
Fig. 3. The ratio of hf/hmax for HAP coating under 10–1000 mN loading
condition.
A. Dey et al. / Ceramics International 35 (2009) 2295–23042298
3. Results and discussion
In the present work, the Ca/P ratio of HAP powder was
maintained at �1.67. The mean HAP granule size (d50) was
�67 mm. The X-ray diffraction (XRD) patterns of both the
HAP powder and the MPS-HAP coating on SS316L are shown
in Fig. 1(a) and (b). The XRD of HAP powder showed the
presence of only HAP peaks (JCPDS file no: 09-0432)
confirming it to be a single-phase material (Fig. 1(a)). In the
coated samples also no peaks other than HAP was observed
indicating no change in phase composition during coating. The
degree of crystallinity (Xc) calculated following [29] was
�90% and �91% for the HAP powder and HAP coating,
respectively. The surface morphology of as sprayed and
polished top surface, i.e. plan section of the coating is shown
through scanning electron micrographs in Fig. 2(a) and (b),
respectively. Both the splat size and the vol.% open porosity
were measured by an image analyzer taking several FE-SEM
images with same magnification from different areas of the as
sprayed (Fig. 2(a)) and the polished plan section (Fig. 2(b)) of
the MPS-HAP coating on SS316L substrate. The splat size of
the coating was �50–70 mm. The macro-pore size and micro-
pore size of the coating were �10–30 mm and �1 mm,
respectively. The average vol.% open porosity was �18%. The
bonding strength of the MPS-HAP coating measured according
to the ASTM-633-01 standard was found to be �13 MPa.
3.1. Nano-hardness and Young’s modulus
The well known O–P model [25] was utilized in the present
work to calculate the micromechanical properties of the plan
section of the �200 mm thick MPS-HAP coating at nine
different loads in the range of 10–1000 mN. However, the
results obtained from the O–P model [25] will be erroneous if
the area function used to calculate the contact area (Acr, Eq. (5))
in this model gets modified [28]. Thus, to verify the
applicability of this model, it is always necessary to calculate
the (hf/hmax) ratio from the load versus depth of penetration
plot. The value of this ratio should lie below 0.7 to obtain
reliable results from the O–P model [28,30]. The average values
of (hf/hmax) ratio for the coating in the present study were below
0.7 (Fig. 3). This information justified the basic applicability of
the O–P model to analyze the nanoindentation data of the
present MPS-HAP coatings on SS316L.
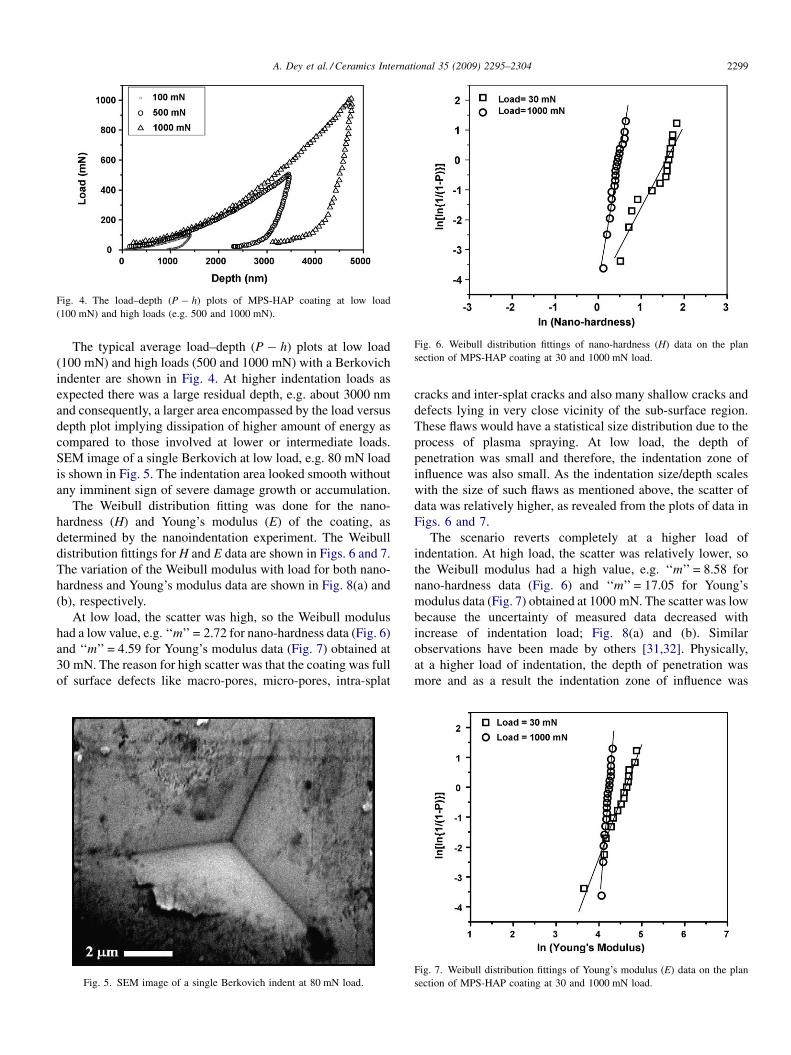
Fig. 4. The load–depth (P � h) plots of MPS-HAP coating at low load
(100 mN) and high loads (e.g. 500 and 1000 mN).
Fig. 6. Weibull distribution fittings of nano-hardness (H) data on the plan
section of MPS-HAP coating at 30 and 1000 mN load.
A. Dey et al. / Ceramics International 35 (2009) 2295–2304 2299
The typical average load–depth (P � h) plots at low load
(100 mN) and high loads (500 and 1000 mN) with a Berkovich
indenter are shown in Fig. 4. At higher indentation loads as
expected there was a large residual depth, e.g. about 3000 nm
and consequently, a larger area encompassed by the load versus
depth plot implying dissipation of higher amount of energy as
compared to those involved at lower or intermediate loads.
SEM image of a single Berkovich at low load, e.g. 80 mN load
is shown in Fig. 5. The indentation area looked smooth without
any imminent sign of severe damage growth or accumulation.
The Weibull distribution fitting was done for the nano-
hardness (H) and Young’s modulus (E) of the coating, as
determined by the nanoindentation experiment. The Weibull
distribution fittings for H and E data are shown in Figs. 6 and 7.
The variation of the Weibull modulus with load for both nano-
hardness and Young’s modulus data are shown in Fig. 8(a) and
(b), respectively.
At low load, the scatter was high, so the Weibull modulus
had a low value, e.g. ‘‘m’’ = 2.72 for nano-hardness data (Fig. 6)
and ‘‘m’’ = 4.59 for Young’s modulus data (Fig. 7) obtained at
30 mN. The reason for high scatter was that the coating was full
of surface defects like macro-pores, micro-pores, intra-splat
Fig. 5. SEM image of a single Berkovich indent at 80 mN load.
cracks and inter-splat cracks and also many shallow cracks and
defects lying in very close vicinity of the sub-surface region.
These flaws would have a statistical size distribution due to the
process of plasma spraying. At low load, the depth of
penetration was small and therefore, the indentation zone of
influence was also small. As the indentation size/depth scales
with the size of such flaws as mentioned above, the scatter of
data was relatively higher, as revealed from the plots of data in
Figs. 6 and 7.
The scenario reverts completely at a higher load of
indentation. At high load, the scatter was relatively lower, so
the Weibull modulus had a high value, e.g. ‘‘m’’ = 8.58 for
nano-hardness data (Fig. 6) and ‘‘m’’ = 17.05 for Young’s
modulus data (Fig. 7) obtained at 1000 mN. The scatter was low
because the uncertainty of measured data decreased with
increase of indentation load; Fig. 8(a) and (b). Similar
observations have been made by others [31,32]. Physically,
at a higher load of indentation, the depth of penetration was
more and as a result the indentation zone of influence was
Fig. 7. Weibull distribution fittings of Young’s modulus (E) data on the plan
section of MPS-HAP coating at 30 and 1000 mN load.
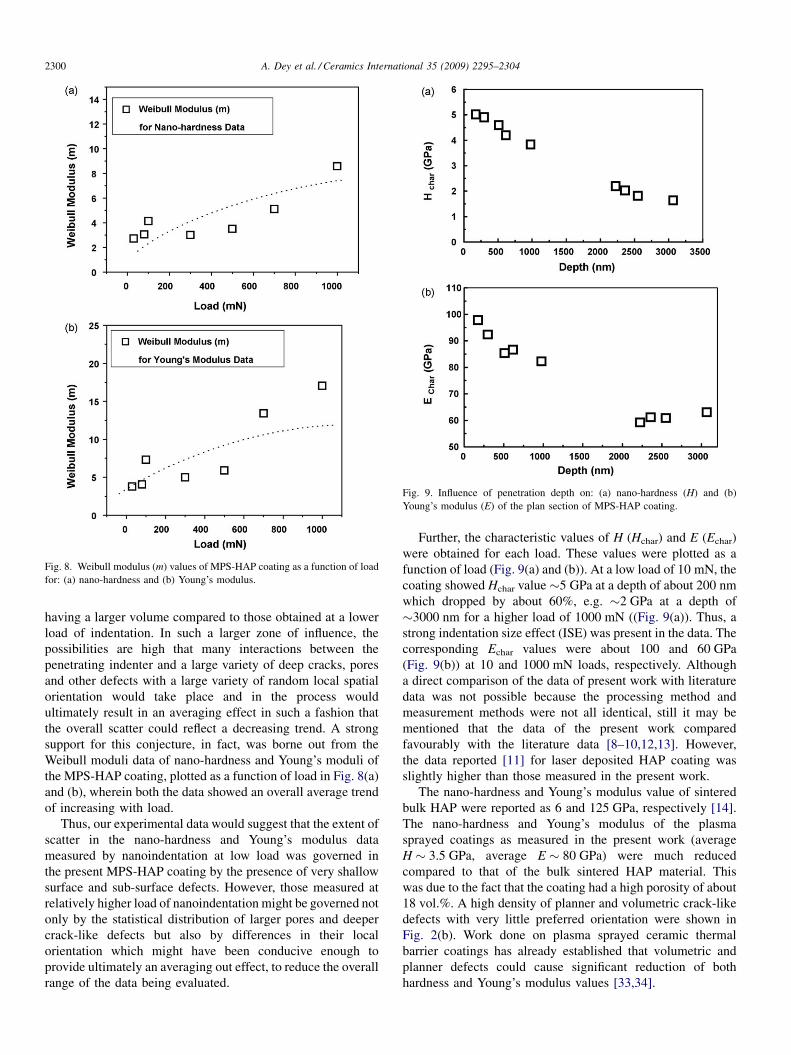
Fig. 8. Weibull modulus (m) values of MPS-HAP coating as a function of load
for: (a) nano-hardness and (b) Young’s modulus.
Fig. 9. Influence of penetration depth on: (a) nano-hardness (H) and (b)
Young’s modulus (E) of the plan section of MPS-HAP coating.
A. Dey et al. / Ceramics International 35 (2009) 2295–23042300
having a larger volume compared to those obtained at a lower
load of indentation. In such a larger zone of influence, the
possibilities are high that many interactions between the
penetrating indenter and a large variety of deep cracks, pores
and other defects with a large variety of random local spatial
orientation would take place and in the process would
ultimately result in an averaging effect in such a fashion that
the overall scatter could reflect a decreasing trend. A strong
support for this conjecture, in fact, was borne out from the
Weibull moduli data of nano-hardness and Young’s moduli of
the MPS-HAP coating, plotted as a function of load in Fig. 8(a)
and (b), wherein both the data showed an overall average trend
of increasing with load.
Thus, our experimental data would suggest that the extent of
scatter in the nano-hardness and Young’s modulus data
measured by nanoindentation at low load was governed in
the present MPS-HAP coating by the presence of very shallow
surface and sub-surface defects. However, those measured at
relatively higher load of nanoindentation might be governed not
only by the statistical distribution of larger pores and deeper
crack-like defects but also by differences in their local
orientation which might have been conducive enough to
provide ultimately an averaging out effect, to reduce the overall
range of the data being evaluated.
Further, the characteristic values of H (Hchar) and E (Echar)
were obtained for each load. These values were plotted as a
function of load (Fig. 9(a) and (b)). At a low load of 10 mN, the
coating showed Hchar value �5 GPa at a depth of about 200 nm
which dropped by about 60%, e.g. �2 GPa at a depth of
�3000 nm for a higher load of 1000 mN ((Fig. 9(a)). Thus, a
strong indentation size effect (ISE) was present in the data. The
corresponding Echar values were about 100 and 60 GPa
(Fig. 9(b)) at 10 and 1000 mN loads, respectively. Although
a direct comparison of the data of present work with literature
data was not possible because the processing method and
measurement methods were not all identical, still it may be
mentioned that the data of the present work compared
favourably with the literature data [8–10,12,13]. However,
the data reported [11] for laser deposited HAP coating was
slightly higher than those measured in the present work.
The nano-hardness and Young’s modulus value of sintered
bulk HAP were reported as 6 and 125 GPa, respectively [14].
The nano-hardness and Young’s modulus of the plasma
sprayed coatings as measured in the present work (average
H � 3.5 GPa, average E � 80 GPa) were much reduced
compared to that of the bulk sintered HAP material. This
was due to the fact that the coating had a high porosity of about
18 vol.%. A high density of planner and volumetric crack-like
defects with very little preferred orientation were shown in
Fig. 2(b). Work done on plasma sprayed ceramic thermal
barrier coatings has already established that volumetric and
planner defects could cause significant reduction of both
hardness and Young’s modulus values [33,34].

Fig. 10. Dependency of ln(Pmax) on ln(hc) according to the Meyer’s law.
Fig. 11. Dependency of Pmax on h2c according to the Hays–Kendall approach.
A. Dey et al. / Ceramics International 35 (2009) 2295–2304 2301
The dependence of Young’s modulus (E) on vol.% porosity
( p) is expressed as [35]
E ¼ E0expð�b pÞ (9)
where b is a constant (�2.5), E0 is the Young’s modulus for a
material with zero porosity, i.e. of theoretical density. Assum-
ing E0 = 125 GPa [14], for a HAP coating with 18 vol.%
porosity, the predicted Young’s modulus value was
�79 GPa, which matched quite well with the load averaged
Young’s modulus data of 80 GPa as mentioned above. The
reduced hardness value was calculated as �3.8 GPa by the
similar relation adapted for the hardness vs. porosity, assuming
H0 as 6 GPa [14]. This also matched well with the load
averaged hardness data of 3.5 GPa. Further, it may be noted
also that the load averaged values of characteristic Young’s
modulus (Echar) and hardness (Hchar) were calculated as 76.53
and 3.34 GPa, respectively. These values were also well
matched with the predicted value of hardness and Young’s
modulus.
The nano-hardness obtained from the geometrically similar
indenters, i.e. conical or pyramidal (e.g. Knoop, Vickers,
Berkovich, etc.) at various loads is in principle expected to
remain unchanged as the strain during the indentation is
constant unlike the spherical indenter. However, in a practical
situation, the hardness using similar indentations is found to
vary with the load. The increase in hardness with decreasing
load, which is known as indentation size effect, is often
observed in bulk ceramics [36–39], physically and chemically
vapour deposited ceramic coatings [40,41] as well as in plasma
sprayed ceramic coatings [21,31,42,43]. In the present work,
ISE also was observed (Fig. 9(a)).
The most widely used empirical equation for describing
the ISE is the Meyer’s law. This law correlates the test load
and the resultant indentation size using a simple power law
[37,44–47]
Pmax ¼ A1hnc (10)
where A1 and n are constants that can be derived directly from
the experimental data by any suitable regression technique.
When the value of ‘‘n’’ lies between 1 and 2; it can be attributed
to the definite presence of an ISE.
Through linear regression analysis, the best-fit values of the
parameters A1 and n were obtained as 5.3 � 10�4 mN/nmn and
1.48, respectively (Fig. 10). The high value of the correlation
coefficient, r (e.g. r = 0.99) implied that Eq. (10) could provide
a satisfactory description of the nanoindentation data of present
work. Since the value of ‘‘n’’ lies between 1 and 2, it can be
attributed to the definite presence of an ISE in the data.
An alternative approach to the explanation of the ISE
phenomenon has been put forward by Hays and Kendall [48]. It
has been proposed that the basis of the ISE is the existence of a
minimum level of the indentation test load, Wi, below which
permanent deformation or flow does not initiate, but only
elastic deformation occurs. So, philosophically one can
associate Wi with a basic, minimum intrinsic force that exist
at the specimen surface. We prefer to call this term as sample
resistance (Wi = R).
To explain ISE in the case of nanoindentation data taken
with a Berkovich indenter for glass as well as bulk TZP and
silicon nitride ceramics, the following equation has been
proposed [49]
Peff ¼ Pmax � R ¼ A2h2c (11)
where Peff represents the effective load that is available for
doing the actual work of indentation after passing over the
specimen’s intrinsic resistance (R), Pmax is the applied max-
imum load and A2 is a constant. At lower applied loads the
effective load is quite low, and the corresponding indentation
depth is very small. This in turn results in a higher hardness
value. This effect gradually diminishes with the increase in
load, thus producing the indentation size effect as observed in
the present work. A linear regression analysis of Pmax vs. h2c has
been carried out and from the intercepts of the best fitted line
(Fig. 11), the value of R = 2.38 mN was evaluated for the
present MPS HAP samples. Similarly the value of A2 was
estimated as 0.98 � 10�4 mN/nm2. Thus, for an applied load of
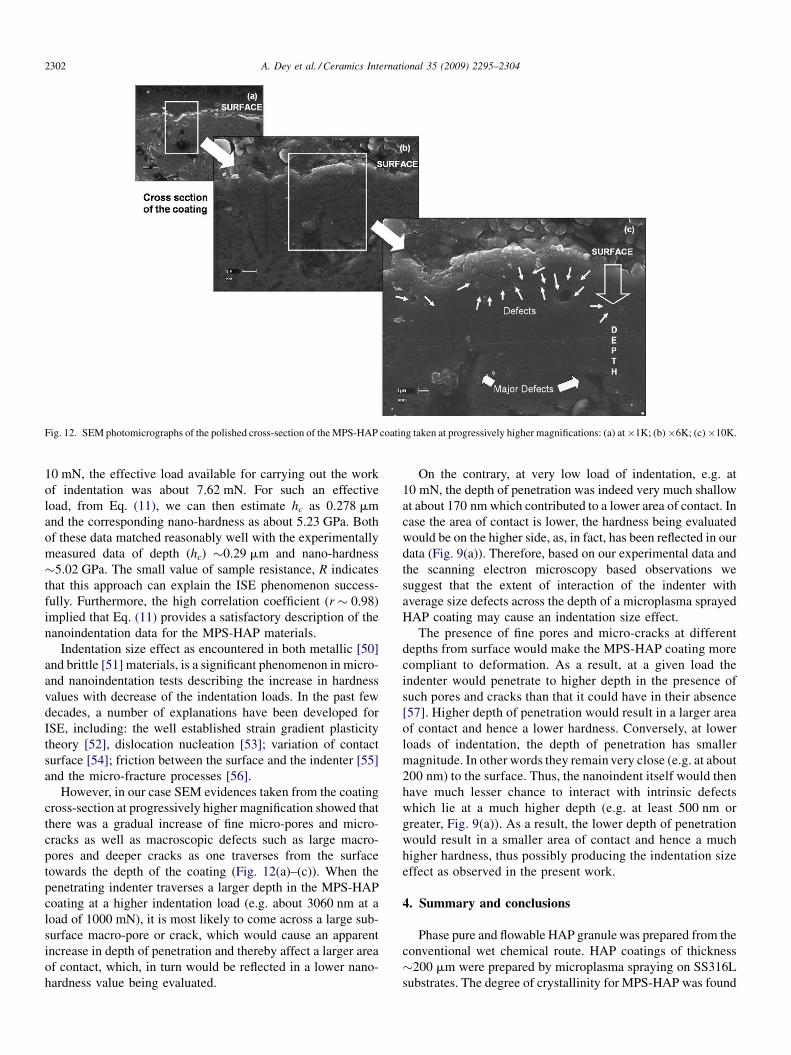
Fig. 12. SEM photomicrographs of the polished cross-section of the MPS-HAP coating taken at progressively higher magnifications: (a) at�1K; (b)�6K; (c)�10K.
A. Dey et al. / Ceramics International 35 (2009) 2295–23042302
10 mN, the effective load available for carrying out the work
of indentation was about 7.62 mN. For such an effective
load, from Eq. (11), we can then estimate hc as 0.278 mm
and the corresponding nano-hardness as about 5.23 GPa. Both
of these data matched reasonably well with the experimentally
measured data of depth (hc) �0.29 mm and nano-hardness
�5.02 GPa. The small value of sample resistance, R indicates
that this approach can explain the ISE phenomenon success-
fully. Furthermore, the high correlation coefficient (r � 0.98)
implied that Eq. (11) provides a satisfactory description of the
nanoindentation data for the MPS-HAP materials.
Indentation size effect as encountered in both metallic [50]
and brittle [51] materials, is a significant phenomenon in micro-
and nanoindentation tests describing the increase in hardness
values with decrease of the indentation loads. In the past few
decades, a number of explanations have been developed for
ISE, including: the well established strain gradient plasticity
theory [52], dislocation nucleation [53]; variation of contact
surface [54]; friction between the surface and the indenter [55]
and the micro-fracture processes [56].
However, in our case SEM evidences taken from the coating
cross-section at progressively higher magnification showed that
there was a gradual increase of fine micro-pores and micro-
cracks as well as macroscopic defects such as large macro-
pores and deeper cracks as one traverses from the surface
towards the depth of the coating (Fig. 12(a)–(c)). When the
penetrating indenter traverses a larger depth in the MPS-HAP
coating at a higher indentation load (e.g. about 3060 nm at a
load of 1000 mN), it is most likely to come across a large sub-
surface macro-pore or crack, which would cause an apparent
increase in depth of penetration and thereby affect a larger area
of contact, which, in turn would be reflected in a lower nano-
hardness value being evaluated.
On the contrary, at very low load of indentation, e.g. at
10 mN, the depth of penetration was indeed very much shallow
at about 170 nm which contributed to a lower area of contact. In
case the area of contact is lower, the hardness being evaluated
would be on the higher side, as, in fact, has been reflected in our
data (Fig. 9(a)). Therefore, based on our experimental data and
the scanning electron microscopy based observations we
suggest that the extent of interaction of the indenter with
average size defects across the depth of a microplasma sprayed
HAP coating may cause an indentation size effect.
The presence of fine pores and micro-cracks at different
depths from surface would make the MPS-HAP coating more
compliant to deformation. As a result, at a given load the
indenter would penetrate to higher depth in the presence of
such pores and cracks than that it could have in their absence
[57]. Higher depth of penetration would result in a larger area
of contact and hence a lower hardness. Conversely, at lower
loads of indentation, the depth of penetration has smaller
magnitude. In other words they remain very close (e.g. at about
200 nm) to the surface. Thus, the nanoindent itself would then
have much lesser chance to interact with intrinsic defects
which lie at a much higher depth (e.g. at least 500 nm or
greater, Fig. 9(a)). As a result, the lower depth of penetration
would result in a smaller area of contact and hence a much
higher hardness, thus possibly producing the indentation size
effect as observed in the present work.
4. Summary and conclusions
Phase pure and flowable HAP granule was prepared from the
conventional wet chemical route. HAP coatings of thickness
�200 mm were prepared by microplasma spraying on SS316L
substrates. The degree of crystallinity for MPS-HAP was found

A. Dey et al. / Ceramics International 35 (2009) 2295–2304 2303
to be high (�91%). Nanoindentation study was conducted to
evaluate local mechanical properties. The statistical validity of
the data was established through the application of Weibull
statistics, because of the porous and heterogeneous nature of the
coating. The ‘‘m’’ value for the nano-hardness (H) varied in the
range 2–9. For the Young’s modulus (E), the ‘‘m’’ value varied in
the range of 3–18. For both H and E values of the coating, the
values of the Weibull modulus (‘‘m’’) showed an overall
increasing trend with respect to load although there were some
occasional deviations. Such deviations might have occurred due
to the presence of pores and cracks in different layers of the
coating. It was postulated that higher scatter of data at lower load
could be linked to stochastic nature of interaction between the
indenter that penetrated a very shallow depth and the flaws that
scale with the size/depth of the indentation and which possessed a
highly statistical size distribution in the surface and in the close
vicinity of sub-surface region. At higher load, it was suggested
that due to a larger indentation zone of influence, an averaging
out effect of indenter-flaw interaction predominated to affect a
reduction in data scatter. At a low load of 10 mN, the coating
showed a hardness value of about 5 GPa at a depth of about
170 nm which dropped by 60%, e.g.�2 GPa at a depth of about
3000 nm for a higher load of 1000 mN. These data suggested the
presence of a strong indentation size effect in the nano-hardness
behaviour of the coatings. The corresponding Young’s moduli
data were about 100 and 60 GPa at 10 and 1000 mN loads,
respectively. Based on our experimental data and the scanning
electron microscopy based observations it has been suggested
that the extent of interaction of the indenter with average size
defects across the depth of a microplasma sprayed HAP coating
could be responsible for the observed indentation size effect.
Acknowledgements
The authors are grateful to Director, Central Glass and
Ceramic Research Institute (CGCRI), Kolkata for his kind
permission to publish this paper and to Dr. D.K. Bhattacharya,
Head, Analytical Facility Division of CGCRI for his kind
encouragements during the course of this work. Finally, the
authors appreciate the infrastructural support received from all
colleagues and particularly that received from the colleagues of
the Mechanical Test Section and Bio-Ceramics and Coating
Division at CGCRI. Finally, the authors gratefully acknowledge
financial support received from DST-SERC (Project No: GAP
0216) and CSIR (Network Project TAREMAC No: NWP 0027).
References
[1] L.L. Hench, Bioceramics, J. Am. Ceram. Soc. 81 (1998) 1705–1728.
[2] R.S. Lima, K.A. Khor, H. Li, P. Cheang, B.R. Marple, HVOF spraying of
nanostructured hydroxyapatite for biomedical applications, Mater. Sci.
Eng. A 396 (2005) 181–187.
[3] W. Tong, J. Chen, X. Li, Y. Cao, Z. Yang, J. Feng, X. Zhang, Effect of
particle size on molten states of starting powder and degradation of the
relevant plasma-sprayed hydroxyapatite coatings, Biomaterials 17 (1996)
1507–1513.
[4] L. Zhao, K. Bobzin, F. Ernst, J. Zwick, E. Lugscheider, Study on the
influence of plasma spray processes and spray parameters on the structure
and crystallinity of hydroxylapatite coatings, Mat. Wiss. u. Werkstofftech.
37 (2006) 516–520.
[5] G. Rondelli, B. Vicentini, A. Cigada, Localized corrosion tests on
austenitic stainless steels for biomedical applications, Br. Corr. J. 32
(1997) 193–196.
[6] T.M. Sridhar, U.K. Mudali, M. Subbaiyan, Sintering atmosphere and
temperature effects on hydroxyapatite coated type 316L stainless steel,
Corr. Sci. 45 (2003) 2337–2359.
[7] T.M. Sridhar, U.K. Mudali, M. Subbaiyan, Preparation and characterisa-
tion of electrophoretically deposited hydroxyapatite coatings on type
316L stainless steel, Corr. Sci. 45 (2003) 237–252.
[8] K.A. Khor, H. Li, P. Cheang, Characterization of the bone-like apatite
precipitated on high velocity oxy-fuel (HVOF) sprayed calcium phosphate
deposits, Biomaterials 24 (2003) 769–775.
[9] C. Zhang, Y. Leng, J. Chen, Elastic and plastic behavior of plasma-sprayed
hydroxyapatite coatings on a Ti–6Al–4V substrate, Biomaterials 22
(2001) 1357–1363.
[10] J. Wen, Y. Leng, J. Chen, C. Zhang, Chemical gradient in plasma-sprayed
HA coatings, Biomaterials 21 (2000) 1339–1343.
[11] G.J. Cheng, D. Pirzada, M. Cai, P. Mohanty, A. Bandyopadhyay, Bio-
ceramic coating of hydroxyapatite on titanium substrate with Nd-YAG
laser, Mater. Sci. Eng. C 25 (2005) 541–547.
[12] T.G. Nieh, A.F. Jankowski, J. Koike, Processing and characterization of
hydroxyapatite coatings on titanium produced by magnetron sputtering, J.
Mater. Res. 16 (2001) 3238–3245.
[13] T.G. Nieh, B.W. Choi, A.F. Jankowski, Synthesis and characterization of
porous hydroxyapatite and hydroxyapatite coatings, in: Proceedings of the
Minerals, Metals, and Materials Society Annual Meeting & Exhibition,
New Orleans, LA, February 11–15., 2001.
[14] R.R. Kumar, M. Wang, Modulus and hardness evaluations of sintered
bioceramic powders and functionally graded bioactive composites by
nano-indentation technique, Mater. Sci. Eng. A 338 (2002) 230–236.
[15] Y.W. Gu, K.A. Khor, P. Cheang, In vitro studies of plasma-sprayed
hydroxyapatite/Ti-6Al-4V composite coatings in simulated body fluid
(SBF), Biomaterials 24 (2003) 1603–1611.
[16] K.A. Khor, Y.W. Gu, D. Pan, P. Cheang, Microstructure and mechanical
properties of plasma sprayed HA/YSZ/Ti–6Al–4V composite coatings,
Biomaterials 25 (2004) 4009–4017.
[17] Y. Chen, Y.Q. Zhang, T.H. Zhang, C.H. Gan, C.Y. Zheng, G. Yu, Carbon
nanotube reinforced hydroxyapatite composite coatings produced through
laser surface alloying, Carbon 44 (2006) 37–45.
[18] A. Bigi, M. Fini, B. Bracci, E. Boanini, P. Torricelli, G. Giavaresi, N.N.
Aldini, A. Facchini, F. Sbaiz, R. Giardino, The response of bone to
nanocrystalline hydroxyapatite-coated Ti13Nb11Zr alloy in an animal
model, Biomaterials 29 (2008) 1730–1736.
[19] P.L.N. Murthy, N.N. Nemeth, D.N. Brewer, S. Mital, Probabilistic analysis
of a SiC/SiC ceramic matrix composite turbine vane, Comp. Part B: Eng.
39 (2008) 694–703.
[20] H. Zhou, F. Li, B. He, J. Wang, B. Sun, Air plasma sprayed thermal barrier
coatings on titanium alloy substrates, Surf. Coat. Technol. 201 (2007)
7360–7367.
[21] D. Basu, C. Funke, R.W. Steinbrech, Effect of heat treatment on elastic
properties of separated thermal barrier coatings, J. Mater. Res. 14 (1999)
4643–4650.
[22] S. Guo, Y. Kagawa, Effect of thermal exposure on hardness and Young’s
modulus of EB-PVD yttria-partially-stabilized zirconia thermal barrier
coatings, Ceram. Int. 32 (2006) 263–270.
[23] M.K. Sinha, D. Basu, P.S. Sen, Porous hydroxyapatite ceramics and its
clinical applications, Interceramics 2 (2000) 102–105.
[24] B. Kundu, M.K. Sinha, M.K. Mitra, D. Basu, Fabrication and character-
ization of porous hydroxyapatite ocular implant followed by an in vivo
study in dogs, Bull. Mater. Sci. 27 (2004) 133–140.
[25] W.C. Oliver, G.M. Pharr, An improved technique for determining hardness
and elastic modulus using load and displacement sensing indentation
experiments, J. Mater. Res. 7 (1992) 1564–1583.
[26] Z. Ling, J. Hou, A nanoindentation analysis of the effects of microstruc-
ture on elastic properties of Al2O3/SiC composites, Comput. Sci. Techol.
67 (2007) 3121–3129.

A. Dey et al. / Ceramics International 35 (2009) 2295–23042304
[27] D. Zhu, D. Hongna, F. Luo, W. Zhou, Preparation and mechanical
properties of C/C–SiC composites, Mater. Sci. Forum 546–549 (2007)
1501–1504.
[28] S. Guicciardi, A. Balbo, D. Sciti, C. Melandri, G. Pezzotti, Nanoindenta-
tion characterization of SiC-based ceramics, J. Eur. Ceram. Soc. 27 (2007)
1399–1404.
[29] M.B. Conz, J.M. Granjeiro, G.A. Soares, Physicochemical characteriza-
tion of six commercial hydroxyapatites for medical-dental applications as
bone graft, J. Appl. Oral Sci. 13 (2005) 136–140.
[30] A. Bolshakov, G.M. Pharr, Influences of pile-up on the measurement of
mechanical properties by load and depth sensing indentation techniques, J.
Mater. Res. 13 (1998) 1049–1058.
[31] J. Malzbender, R.W. Steinbrech, Determination of the stress-dependent
stiffness of plasma-sprayed thermal barrier coatings using depth-sensitive
indentation, J. Mater. Res. 18 (2003) 1975–1984.
[32] H. Meinhard, P. Grau, Hardness measurement on rough surfaces, Harterei-
Technische Mitteilungen 56 (2001) 287–293.
[33] J.S. Wallace, J. Llavsky, Elastic modulus measurements in plasma sprayed
deposits, J. Therm. Spray Technol. 7 (1998) 521–526.
[34] S. Guo, Y. Kagawa, Young’s moduli of zirconia top-coat and thermally
grown oxide in a plasma-sprayed thermal barrier coating system, Scr.
Mater. 50 (2004) 1401–1406.
[35] R.W. Rice, Microstructure dependence of mechanical behaviour of cera-
mics, in: R.C. MaCrone (Ed.), Treatise on Materials Science and Tech-
nology II, Academic Press, New York, 1977, p. 200.
[36] J. Gong, Z. Guan, Effect of microcracking on the energy–balance relation-
ship for hardness testing of ceramics, Mater. Lett. 49 (2001) 180–184.
[37] J. Gong, J. Wu, Z. Guan, Examination of the indentation size effect in low-
load Vickers hardness testing of ceramics, J. Eur. Ceram. Soc. 19 (1999)
2625–2631.
[38] S. Guicciardi, D. Sciti, M. Cesare, A. Bellosi, Nanoindentation character-
ization of submicro and nano sized liquid phase sintered SiC ceramics, J.
Am. Ceram. Soc. 87 (2004) 2101–2107.
[39] G. Feng, W.D. Nix, Indentation size effect in MgO, Scr. Mater. 51 (2004)
599–603.
[40] F. Attar, Hardness evaluation of thin ceramic coatings on tool steel, Surf.
Coat. Technol. 78 (1996) 78–86.
[41] R.G. Wellman, A. Dyer, J.R. Nicholls, Nano and micro indentation
studies of bulk zirconia and EB PVD TBCs, Surf. Coat. Technol. 176
(2004) 253–260.
[42] W. Feng, D. Yan, J. He, G. Zhang, G. Chen, W. Gu, S. Yang, Micro-
hardness and toughness of the TiN coating prepared by reactive plasma
spraying, Appl. Surf. Sci. 243 (2005) 204–213.
[43] S. Ghosh, S. Das, T.K. Bandyopadhyay, P.P. Bandyopadhyay, A.B.
Chattopadhyay, Indentation responses of plasma sprayed ceramic coat-
ings, J. Mater. Sci. 38 (2003) 1565–1572.
[44] G.N. Babini, A. Bellosi, C. Galassi, Characterization of hot-pressed
silicon nitride-based materials by microhardness measurements, J. Mater.
Sci. 22 (1987) 1687–1693.
[45] A.K. Mukhopadhyay, S.K. Datta, D. Chakraborty, On the microhard-
ness of silicon nitride and sialon ceramics, J. Eur. Ceram. Soc. 6 (1990)
303–311.
[46] H. Li, R.C. Bradt, The microhardness indentation load/size effect in rutile
and cassiterite single crystals, J. Mater. Sci. 28 (1993) 917–926.
[47] K.l. Sangwal, B. Surowska, P. Blaziak, Analysis of the indentation size
effect in the microhardness measurement of some cobalt-based alloys,
Mater. Chem. Phys. 77 (2003) 511–520.
[48] C. Hays, E.G. Kendall, An analysis of Knoop microhardness, Metallics 6
(1973) 275–282.
[49] Z. Peng, J. Gong, H. Miao, On the description of indentation size effect in
hardness testing for ceramics: analysis of the nanoindentation data, J. Eur.
Ceram. Soc. 24 (2004) 2193–2201.
[50] Q. Ma, D.R. Clarke, Size dependence of the hardness of silver single
crystals, J. Mater. Res. 10 (1995) 853–863.
[51] S.J. Bull, T.F. Page, E.H. Yoffe, An explanation for the indentation size
effect in ceramics, Phil. Mag. Lett. 59 (1989) 281–288.
[52] W.D. Nix, H. Gao, Indentation size effects in crystalline materials: a law
for strain gradient plasticity, J. Mech. Phys. Solid 46 (1998) 411–425.
[53] M.F. Horstemeyer, M.I. Baskes, S.J. Plimpton, Length scale and time scale
effects on the plastic flow of fcc metals, Acta Mater. 49 (2001) 4363–4374.
[54] A. Iost, R. Bigot, Indentation size effect: reality or artifact? J. Mater. Sci.
31 (1996) 3573–3577.
[55] H. Li, A. Gosh, Y.H. Han, R.C. Bradt, The frictional component of the
indentation size effect in low load microhardness testing, J. Mater. Res. 8
(1993) 1028–1032.
[56] M.V. Swain, M. Wittling, Fracture Mechanics of Ceramics, Plenum Press,
New York, 1996.
[57] K. Duan, R.W. Steinbrech, Influence of sample deformation and porosity
on mechanical properties by instrumented microindentation technique, J.
Eur. Ceram. Soc. 18 (1998) 87–93.
Copyright © 2022 FDOKUMEN