Material behavior of the hexagonal alpha phase of a titanium alloy identified from nanoindentation...
8
Material behavior of the hexagonal alpha phase of a titanium alloy identified from nanoindentation tests A.F. Gerday a , M. Ben Bettaieb a , L. Duchêne a , N. Clement b , H. Diarra a , A.M. Habraken a, * a Department of Architecture, Geology, Environment, and Constructions, MS2F Division, University of Liège, Chemin des Chevreuils 1, 4000 Liège, Belgium b Département des Sciences des Matériaux et des Procédés (IMAP Department), Université Catholique de Louvain-la-Neuve, Place Sainte Barbe 2, 1348 Louvain-la-Neuve, Belgium article info Article history: Received 20 January 2010 Accepted 19 November 2010 Available online 13 December 2010 Keywords: Finite element modeling (FEM) Nanoindentation Titanium alloy Slip system activation Hexagonal alpha phase abstract This article focuses on the numerical modeling of nanoindentation tests performed on the hexagonal a phase of Ti-5553 alloy in order to identify its mechanical behavior. The main goal consists in deter- mining the relative strength of the slip modes in the a phase of Ti-5553. This work was performed using an elastoviscoplastic crystal plasticity-based constitutive law. The difficulties in determining the slip systems that can be activated and their corresponding critical resolved shear stresses (CRSS) are dis- cussed. Numerical predictions are compared to experimental nanoindentation curves. Ó 2010 Elsevier Masson SAS. All rights reserved. 1. Introduction The Tie5Ale5Moe5Ve3Cre0.5Fe alloy (all elemental concen- trations in wt.%), called Ti-5553, is a new generation of titanium alloy suitable for aeronautical applications (Nag et al., 2009). It is composed of a body-centered cubic (BCC) b-phase and a hexagonal close packed (HCP) a-phase. The mechanical behavior of the b phase being previously studied (Gerday et al., 2009), this paper focuses on the a phase. Due to the difficulty to model the mechanical behavior of the a phase from macroscopic (tensile, shear) tests on (a þ b) material, another technique had to be used. Neutron diffraction’s technique can be used in order to identify the slip systems activated for each phase. However, this technique is not easily available (Grandjean, 2006) and it is not always possible to obtain the desire results (plastic domain too short, low hardening, .). Micropillar compression tests could advantageously be used due to their ability to directly identify active slip systems visually with a scanning electron microscope. They also provide a simple stress state. Yet, they have a few shortcomings. They require a specific set of equipments (focused ion beam, coating facilities, particular indenter tip, .) and it is absolutely not straightforward that they will represent the behavior of the genuine material without any surface effect or arti- fact due to irradiation. Consequently, it was decided to use other experimental results, readily available: nanoindentation tests per- formed on a grains having different orientations. Nanoindentation is a usual method for mechanical character- ization of materials at the micro/nano scale (Ahn et al., 2002; Xu and Li, 2008), as it was presented in a previous work (Gerday et al., 2009). This technique is used to measure, on thin films or small volumes of materials, mechanical parameters such as Young’s modulus or hardness. During nanoindentation, the diamond indenter fixed to a support that can move vertically pushes into the material and then, the tip is withdrawn. During the test, the indentation load and the penetration depth of the indenter into the material are simultaneously recorded and a load versus depth curve can be plotted. This experimental curve can be used to determine the mechanical properties of the indented material (Sasaki et al., 2004; Yan et al., 2007). One advantage of such tests is their locali- zation. Indeed, they can be performed on only one grain and the test can be repeated several times in the same grain. The orientation of the indented grain is measured using an electron backscattered diffraction (EBSD) technique. This information is necessary because the material response is strongly anisotropic at this scale and it depends on the lattice orientation. This information is then used in finite element (FE) simulations using a microscopic crystal plasticity constitutive law. Moreover, due to the complicated mechanical behavior, FE simulation of nanoindentation is much more chal- lenging than FE simulation of conventional indentation tests. The main motivation for the present study is the identification of the active slip systems and associated critical resolved shear stress by * Corresponding author. Tel.: þ32 43669430; fax: þ32 43669192. E-mail address: [email protected] (A.M. Habraken). Contents lists available at ScienceDirect European Journal of Mechanics A/Solids journal homepage: www.elsevier.com/locate/ejmsol 0997-7538/$ e see front matter Ó 2010 Elsevier Masson SAS. All rights reserved. doi:10.1016/j.euromechsol.2010.11.001 European Journal of Mechanics A/Solids 30 (2011) 248e255
-
Upload
independent -
Category
Documents
-
view
1 -
download
0
Transcript of Material behavior of the hexagonal alpha phase of a titanium alloy identified from nanoindentation...

lable at ScienceDirect
European Journal of Mechanics A/Solids 30 (2011) 248e255
Contents lists avai
European Journal of Mechanics A/Solids
journal homepage: www.elsevier .com/locate/ejmsol
Material behavior of the hexagonal alpha phase of a titanium alloy identifiedfrom nanoindentation tests
A.F. Gerday a, M. Ben Bettaieb a, L. Duchêne a, N. Clement b, H. Diarra a, A.M. Habraken a,*
aDepartment of Architecture, Geology, Environment, and Constructions, MS2F Division, University of Liège, Chemin des Chevreuils 1, 4000 Liège, BelgiumbDépartement des Sciences des Matériaux et des Procédés (IMAP Department), Université Catholique de Louvain-la-Neuve, Place Sainte Barbe 2, 1348 Louvain-la-Neuve, Belgium
a r t i c l e i n f o
Article history:Received 20 January 2010Accepted 19 November 2010Available online 13 December 2010
Keywords:Finite element modeling (FEM)NanoindentationTitanium alloySlip system activationHexagonal alpha phase
* Corresponding author. Tel.: þ32 43669430; fax: þE-mail address: [email protected] (A.M. Ha
0997-7538/$ e see front matter � 2010 Elsevier Masdoi:10.1016/j.euromechsol.2010.11.001
a b s t r a c t
This article focuses on the numerical modeling of nanoindentation tests performed on the hexagonala phase of Ti-5553 alloy in order to identify its mechanical behavior. The main goal consists in deter-mining the relative strength of the slip modes in the a phase of Ti-5553. This work was performed usingan elastoviscoplastic crystal plasticity-based constitutive law. The difficulties in determining the slipsystems that can be activated and their corresponding critical resolved shear stresses (CRSS) are dis-cussed. Numerical predictions are compared to experimental nanoindentation curves.
� 2010 Elsevier Masson SAS. All rights reserved.
1. Introduction
The Tie5Ale5Moe5Ve3Cre0.5Fe alloy (all elemental concen-trations inwt.%), called Ti-5553, is a newgeneration of titaniumalloysuitable for aeronautical applications (Nag et al., 2009). It iscomposed of a body-centered cubic (BCC) b-phase and a hexagonalclose packed (HCP) a-phase. Themechanical behavior of the b phasebeing previously studied (Gerday et al., 2009), this paper focuses ontheaphase.Due to thedifficulty tomodel themechanical behavior ofthe a phase from macroscopic (tensile, shear) tests on (a þ b)material, another technique had to be used. Neutron diffraction’stechnique can be used in order to identify the slip systems activatedfor each phase. However, this technique is not easily available(Grandjean, 2006) and it is not always possible to obtain the desireresults (plastic domain too short, low hardening, .). Micropillarcompression tests could advantageously be used due to their abilityto directly identify active slip systems visually with a scanningelectronmicroscope. Theyalso provide a simple stress state. Yet, theyhave a few shortcomings. They require a specific set of equipments(focused ionbeam, coating facilities, particular indenter tip,.) and itis absolutely not straightforward that they will represent thebehavior of the genuine material without any surface effect or arti-fact due to irradiation. Consequently, it was decided to use other
32 43669192.braken).
son SAS. All rights reserved.
experimental results, readily available: nanoindentation tests per-formed on a grains having different orientations.
Nanoindentation is a usual method for mechanical character-ization ofmaterials at themicro/nano scale (Ahn et al., 2002; Xu andLi, 2008), as it was presented in a previous work (Gerday et al.,2009). This technique is used to measure, on thin films or smallvolumes of materials, mechanical parameters such as Young’smodulus or hardness. During nanoindentation, the diamondindenter fixed to a support that can move vertically pushes intothe material and then, the tip is withdrawn. During the test, theindentation load and the penetration depth of the indenter into thematerial are simultaneously recorded and a load versus depth curvecan be plotted. This experimental curve can be used to determinethe mechanical properties of the indented material (Sasaki et al.,2004; Yan et al., 2007). One advantage of such tests is their locali-zation. Indeed, they can be performed on only one grain and the testcan be repeated several times in the same grain. The orientation ofthe indented grain is measured using an electron backscattereddiffraction (EBSD) technique. This information is necessary becausethe material response is strongly anisotropic at this scale and itdepends on the lattice orientation. This information is then used infinite element (FE) simulations using amicroscopic crystal plasticityconstitutive law. Moreover, due to the complicated mechanicalbehavior, FE simulation of nanoindentation is much more chal-lenging than FE simulation of conventional indentation tests. Themain motivation for the present study is the identification of theactive slip systems and associated critical resolved shear stress by
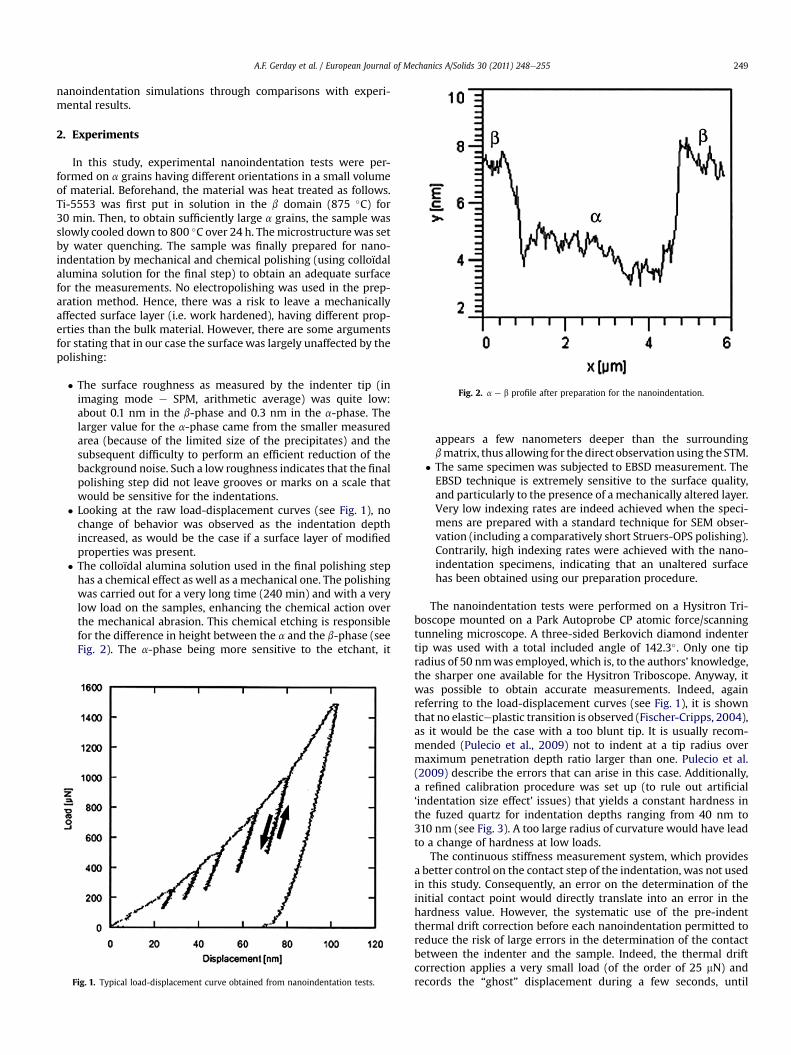
Fig. 2. a e b profile after preparation for the nanoindentation.
A.F. Gerday et al. / European Journal of Mechanics A/Solids 30 (2011) 248e255 249
nanoindentation simulations through comparisons with experi-mental results.
2. Experiments
In this study, experimental nanoindentation tests were per-formed on a grains having different orientations in a small volumeof material. Beforehand, the material was heat treated as follows.Ti-5553 was first put in solution in the b domain (875 �C) for30 min. Then, to obtain sufficiently large a grains, the sample wasslowly cooled down to 800 �C over 24 h. Themicrostructure was setby water quenching. The sample was finally prepared for nano-indentation by mechanical and chemical polishing (using colloïdalalumina solution for the final step) to obtain an adequate surfacefor the measurements. No electropolishing was used in the prep-aration method. Hence, there was a risk to leave a mechanicallyaffected surface layer (i.e. work hardened), having different prop-erties than the bulk material. However, there are some argumentsfor stating that in our case the surface was largely unaffected by thepolishing:
� The surface roughness as measured by the indenter tip (inimaging mode e SPM, arithmetic average) was quite low:about 0.1 nm in the b-phase and 0.3 nm in the a-phase. Thelarger value for the a-phase came from the smaller measuredarea (because of the limited size of the precipitates) and thesubsequent difficulty to perform an efficient reduction of thebackground noise. Such a low roughness indicates that the finalpolishing step did not leave grooves or marks on a scale thatwould be sensitive for the indentations.
� Looking at the raw load-displacement curves (see Fig. 1), nochange of behavior was observed as the indentation depthincreased, as would be the case if a surface layer of modifiedproperties was present.
� The colloïdal alumina solution used in the final polishing stephas a chemical effect as well as a mechanical one. The polishingwas carried out for a very long time (240 min) and with a verylow load on the samples, enhancing the chemical action overthe mechanical abrasion. This chemical etching is responsiblefor the difference in height between the a and the b-phase (seeFig. 2). The a-phase being more sensitive to the etchant, it
Fig. 1. Typical load-displacement curve obtained from nanoindentation tests.
appears a few nanometers deeper than the surroundingbmatrix, thus allowing for the direct observation using the STM.
� The same specimen was subjected to EBSD measurement. TheEBSD technique is extremely sensitive to the surface quality,and particularly to the presence of a mechanically altered layer.Very low indexing rates are indeed achieved when the speci-mens are prepared with a standard technique for SEM obser-vation (including a comparatively short Struers-OPS polishing).Contrarily, high indexing rates were achieved with the nano-indentation specimens, indicating that an unaltered surfacehas been obtained using our preparation procedure.
The nanoindentation tests were performed on a Hysitron Tri-boscope mounted on a Park Autoprobe CP atomic force/scanningtunneling microscope. A three-sided Berkovich diamond indentertip was used with a total included angle of 142.3�. Only one tipradius of 50 nmwas employed, which is, to the authors’ knowledge,the sharper one available for the Hysitron Triboscope. Anyway, itwas possible to obtain accurate measurements. Indeed, againreferring to the load-displacement curves (see Fig. 1), it is shownthat no elasticeplastic transition is observed (Fischer-Cripps, 2004),as it would be the case with a too blunt tip. It is usually recom-mended (Pulecio et al., 2009) not to indent at a tip radius overmaximum penetration depth ratio larger than one. Pulecio et al.(2009) describe the errors that can arise in this case. Additionally,a refined calibration procedure was set up (to rule out artificial‘indentation size effect’ issues) that yields a constant hardness inthe fuzed quartz for indentation depths ranging from 40 nm to310 nm (see Fig. 3). A too large radius of curvature would have leadto a change of hardness at low loads.
The continuous stiffness measurement system, which providesa better control on the contact step of the indentation, was not usedin this study. Consequently, an error on the determination of theinitial contact point would directly translate into an error in thehardness value. However, the systematic use of the pre-indentthermal drift correction before each nanoindentation permitted toreduce the risk of large errors in the determination of the contactbetween the indenter and the sample. Indeed, the thermal driftcorrection applies a very small load (of the order of 25 mN) andrecords the “ghost” displacement during a few seconds, until

Fig. 3. Modulus and hardness of the refined calibration.Fig. 5. Comparison of experimental nanoindentation results obtained in one grain.Non reproducible curves.
A.F. Gerday et al. / European Journal of Mechanics A/Solids 30 (2011) 248e255250
a chosen displacement rate is met. Then the indentation proceedsimmediately. The point is that true contact is already ensured atthis step. The whole contact determination problem is also of muchless concern if we are directly studying the load-displacementcurves, as in this paper. In this case, any bad contact would bedirectly detected by an anomalous load-displacement behavior inthe low-load part of the curve.
The first step in identifying the a phase consisted in selectingthe experimental curves to reproduce numerically from a set of 100experiments performed on one piece ofmaterial, as shown in Fig. 4.When it was possible, several indentations were performed ina same grain (for example: indentations 57, 58, 59 and 60 of Fig. 4
Fig. 4. EBSD image of the indented material. Indentations were perfo
performed in one grain). To limit grain boundary effects that canappear for some indentations or inhomogeneous grains, the loadversus depth nanoindentation curves obtained in a same grainwere compared. Only results corresponding to reproducible resultsin a same grain were chosen. This is illustrated in Figs. 5 and 6. InFig. 5, the curves corresponding to nanoindentation tests per-formed in one grain are not close to each other. However, in Fig. 6,the three curves of another grain are very similar and then, arechosen. Finally, four grains with reproducible results and differentgrain orientations were selected. These indentation numbersshown in Fig. 4 and the corresponding grain orientations are givenin Table 1.
rmed in a grains. Each number corresponds to one indentation.
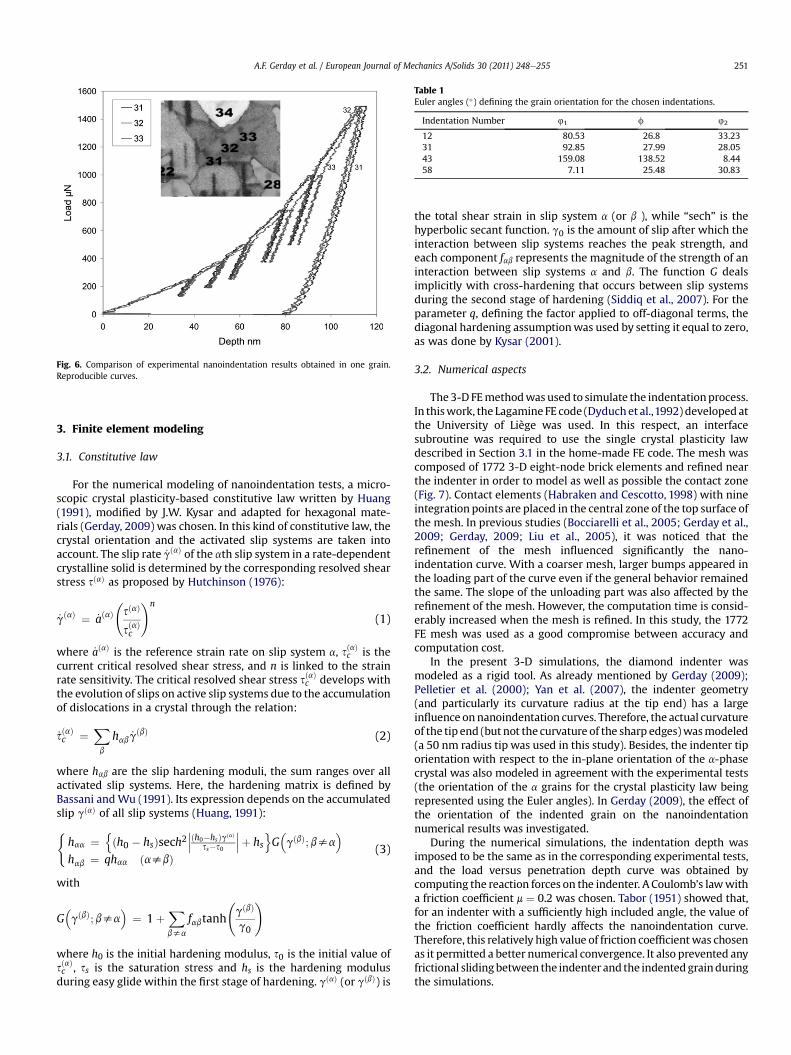
Fig. 6. Comparison of experimental nanoindentation results obtained in one grain.Reproducible curves.
Table 1Euler angles (�) defining the grain orientation for the chosen indentations.
Indentation Number 41 f 42
12 80.53 26.8 33.2331 92.85 27.99 28.0543 159.08 138.52 8.4458 7.11 25.48 30.83
A.F. Gerday et al. / European Journal of Mechanics A/Solids 30 (2011) 248e255 251
3. Finite element modeling
3.1. Constitutive law
For the numerical modeling of nanoindentation tests, a micro-scopic crystal plasticity-based constitutive law written by Huang(1991), modified by J.W. Kysar and adapted for hexagonal mate-rials (Gerday, 2009) was chosen. In this kind of constitutive law, thecrystal orientation and the activated slip systems are taken intoaccount. The slip rate _gðaÞ of the ath slip system in a rate-dependentcrystalline solid is determined by the corresponding resolved shearstress sðaÞ as proposed by Hutchinson (1976):
_gðaÞ ¼ _aðaÞ sðaÞ
sðaÞc
!n
(1)
where _aðaÞ is the reference strain rate on slip system a, sðaÞc is thecurrent critical resolved shear stress, and n is linked to the strainrate sensitivity. The critical resolved shear stress sðaÞc develops withthe evolution of slips on active slip systems due to the accumulationof dislocations in a crystal through the relation:
_sðaÞc ¼Xb
hab _gðbÞ (2)
where hab are the slip hardening moduli, the sum ranges over allactivated slip systems. Here, the hardening matrix is defined byBassani andWu (1991). Its expression depends on the accumulatedslip gðaÞ of all slip systems (Huang, 1991):
(haa ¼
nðh0 � hsÞsech2
���ðh0�hsÞgðaÞ
ss�s0
���þ hsoG�gðbÞ; bsa
�hab ¼ qhaa ðasbÞ
(3)
with
G�gðbÞ;bsa
�¼ 1þ
Xbsa
fabtanh
gðbÞ
g0
!
where h0 is the initial hardening modulus, s0 is the initial value ofsðaÞc , ss is the saturation stress and hs is the hardening modulusduring easy glide within the first stage of hardening. gðaÞ (or gðbÞ) is
the total shear strain in slip system a (or b ), while “sech” is thehyperbolic secant function. g0 is the amount of slip after which theinteraction between slip systems reaches the peak strength, andeach component fab represents the magnitude of the strength of aninteraction between slip systems a and b. The function G dealsimplicitly with cross-hardening that occurs between slip systemsduring the second stage of hardening (Siddiq et al., 2007). For theparameter q, defining the factor applied to off-diagonal terms, thediagonal hardening assumptionwas used by setting it equal to zero,as was done by Kysar (2001).
3.2. Numerical aspects
The3-D FEmethodwas used to simulate the indentationprocess.In thiswork, the LagamineFE code (Dyduchet al.,1992) developedatthe University of Liège was used. In this respect, an interfacesubroutine was required to use the single crystal plasticity lawdescribed in Section 3.1 in the home-made FE code. The mesh wascomposed of 1772 3-D eight-node brick elements and refined nearthe indenter in order to model as well as possible the contact zone(Fig. 7). Contact elements (Habraken and Cescotto, 1998) with nineintegration points are placed in the central zone of the top surface ofthe mesh. In previous studies (Bocciarelli et al., 2005; Gerday et al.,2009; Gerday, 2009; Liu et al., 2005), it was noticed that therefinement of the mesh influenced significantly the nano-indentation curve. With a coarser mesh, larger bumps appeared inthe loading part of the curve even if the general behavior remainedthe same. The slope of the unloading part was also affected by therefinement of the mesh. However, the computation time is consid-erably increased when the mesh is refined. In this study, the 1772FE mesh was used as a good compromise between accuracy andcomputation cost.
In the present 3-D simulations, the diamond indenter wasmodeled as a rigid tool. As already mentioned by Gerday (2009);Pelletier et al. (2000); Yan et al. (2007), the indenter geometry(and particularly its curvature radius at the tip end) has a largeinfluence onnanoindentation curves. Therefore, the actual curvatureof the tip end (but not the curvature of the sharp edges)wasmodeled(a 50 nm radius tip was used in this study). Besides, the indenter tiporientation with respect to the in-plane orientation of the a-phasecrystal was also modeled in agreement with the experimental tests(the orientation of the a grains for the crystal plasticity law beingrepresented using the Euler angles). In Gerday (2009), the effect ofthe orientation of the indented grain on the nanoindentationnumerical results was investigated.
During the numerical simulations, the indentation depth wasimposed to be the same as in the corresponding experimental tests,and the load versus penetration depth curve was obtained bycomputing the reaction forces on the indenter. A Coulomb’s lawwitha friction coefficient m ¼ 0.2 was chosen. Tabor (1951) showed that,for an indenter with a sufficiently high included angle, the value ofthe friction coefficient hardly affects the nanoindentation curve.Therefore, this relatively high value of friction coefficientwas chosenas it permitted a better numerical convergence. It also prevented anyfrictional slidingbetween the indenter and the indentedgrainduringthe simulations.

Fig. 7. 1772 element mesh used for nanoindentation.
Fig. 8. Unloading part of experimental nanoindentation curves obtained for the fourdifferent grain orientations of Table 1.
A.F. Gerday et al. / European Journal of Mechanics A/Solids 30 (2011) 248e255252
4. Elastic parameters
The elastic parameters of the a phase of Ti-5553 are unknownand the real elastic response is expected to be anisotropic. To studythe elastic parameters of the a phase of titanium or titanium alloys,some authors (Baranov and Dubov, 2005; Trinité, 2006) use theanisotropic parameters of the elastic matrix (parameters C11, C12,C13, C33 and C44 for a crystal with hexagonal symmetry (Nye,1961)).Other scientists (Chan, 2004; Delfosse, 2005; Feaugas et al., 1997)just use isotropic elastic parameters: Young’s modulus E and Pois-son’s ratio n. To help choosing isotropic or anisotropic elasticparameters, the unloading part of the nanoindentation curvesobtained with the same indenter tip were compared in Fig. 8 for thegrain orientations of Table 1. In fact, it is well-known that theunloading part of the curve is highly sensitive to elastic parameters(Gerday et al., 2009; Oliver and Pharr, 1992). Looking at the slopesof these curves, it seems to be adequate to use isotropic elasticparameters as indentations performed on different grain orienta-tions do not yield different experimental results.
However, to identify these isotropic parameters from theunloading curves, it is necessary to keep in mind that otherparameters also affect this part of the curve. Indeed, in a previousstudy (Gerday, 2009; Gerday et al., 2009), it was demonstrated thatthe unloading part of the curve is sensitive to Young’s modulus butalso to the mesh refinement and the tip geometry. It was alsoshown that the Poisson’s ratio hardly affects nanoindentationcurves. Consequently, for a chosen mesh and an appropriate esti-mation of the tip geometry, it appeared that a Young’s modulus E
equals to 125 GPa and a Poisson’s ratio n of 0.33 made an accuratemodeling of the unloading part of the curves possible. This choice isin agreement with general elastic parameters found in the litera-ture for the a phase of titanium (Chan, 2004; Delfosse, 2005;Feaugas et al., 1997).

Table 2Hardening parameters for the slip systems that can be activated. g*0 and f *
abare
linked to interaction between two slip systems from two different families while g0and fab are linked to interaction between two slip systems from the same family.
n _aðaÞ h0 (MPa) hs (MPa) g0 g*0 fab f *ab
50 0.001 7482 3 0.00091 0.000314 14.6 15
A.F. Gerday et al. / European Journal of Mechanics A/Solids 30 (2011) 248e255 253
5. Plastic parameters
The different slip planes (shaded planes) and slip directions(arrows) commonly activated in HCP materials are illustrated inFig. 9. The number of corresponding equivalent slip systems foreach family is also indicated.
Plastic parameters were identified using nanoindentationcurves obtained for different grain orientations. The hardeningparameters (n, _aðaÞ, h0, hs, g0 and fab) were assumed to be identicalfor each family of slip systems that can be activated. Due to thedifficulty to obtain better values, they were chosen to be equal tothose optimized for the b-phase (Gerday et al., 2009) and arementioned in Table 2. Indeed, the nanoindentation experimentspermitted to fit the elastic parameters (see Section 4), the initialcritical resolved shear stress (CRSS) s0 and the saturation value ssfor each slip system family of the a-phase (which is the focus of thissection). However, it was not possible to fit the hardening param-eters from the nanoindentation tests. Besides, the technique usedin Gerday (2009) to determine the hardening parameters of theb-phase was to produce a 100% b material with an adequatethermal treatment. Then classical mechanical tests were performedto fit the hardening parameters. However, this technique is notapplicable to the a-phase because it is not possible to producea 100% amaterial at room temperature. The fitting of the hardeningparameters of the a-phase from classical mechanical tests per-formed on the (a þ b) material (knowing the parameters for theb-phase) was also investigated. But, again, this technique did notyield to satisfactory results, the main reason being the too lowvolume fraction of the a-phase in our material (10e20%). Finally,hardening parameters found in the literature for the a-phase weretested. But the results were not satisfactory. Furthermore, it shouldbe noted that the parameters for the a-phase provided in this paper(hardening parameters from the b-phase, elastic parameters andcritical resolved shear stresses fitted from the nanoindentationtests) were satisfactorily used for the modeling of the Ti 5553material (a and b phases) using representative cells of one a grainembedded in the b matrix (Gerday, 2009).
The first step in identifying the plastic parameters of the a phaseis to determine the activated slip systems and their relativestrength, which is characterized by one initial critical resolvedshear stress s0 and one saturation value ss for each slip systemfamily. As mentioned previously, different families of slip systemscan be activated in HCP materials but their identification is notobvious. Indeed, different potential slip systems have been reportedby authors studying the same alloy (Dick, 2006; Fundenbergeret al., 1997; Medina Perilla and Gil Sevillano, 1995). An analysis ofthe slip line traces on the indented surface could help in identifyingactivated slip systems. However the slip lines associated with theindents were so small that they were not visible on our EBSDorientation maps. It would be necessary to either push the SEM to
Fig. 9. Usual slip system
higher resolutions or to study larger indents, which would only bereally feasible in the b-phase. Such an analysis would bemore likelyfeasible on a globally deformed specimen (e.g. shear testspecimens).
By testing several sets of parameters, it appeared that it wasgenerally relatively easy to reproduce one nanoindentation curve.However, difficulties occurred when the same set of parametershad to be chosen tomodel several nanoindentation curves obtainedin different grain orientations. To identify the potential slip systemsand the values of the corresponding CRSS, a first procedure usingthe parameters of titanium alloys collected in the literature(Delfosse, 2005; Dick, 2006; Feaugas et al., 1997) was tested.However, due to the inefficiency of this method, another procedurewas conducted following the steps described hereafter. Firstly, thesimulations were performed on three grain orientations (corre-sponding to the indentation numbers 12, 43 and 58 in Table 1).Three families of slip systems out of the five of Fig. 9 were arbi-trarily chosen to be potentially activated. The limitation tomaximum three families of slip systems is due to the crystal plas-ticity constitutive law used in this study (see Section 3.1). In orderto overcome this issue, different sets of (three) potential slip systemfamilies were analyzed in such a way that all the five slip systemfamilies shown in Fig. 9 were tested (successively instead ofsimultaneously). This optimization procedure is described below. Inaddition, according to the literature review of Table 3, severalauthors used a limited number of slip system families for differentHCP materials. In this table, only (Balasubramanian and Anand,2002) used the five slip system families (together with simplifiedCRSS ratios).
At this stage, it was assumed that all families had the sameinitial CRSS and saturation values. This procedurewas applied threetimes. The first time, the basal, prismatic and pyramidal<a> families of slip systems (set 1) could be activated. This choiceof slip system families was also performed by Chan (2004) forTi8Al1Mo1V. The second time, they were the basal, prismatic andfirst order pyramidal <c þ a> families of slip systems (set 2), as itwas the case, for example, for Dick (2006) that worked on Ti6Al4V.Finally, the third time, the prismatic, the pyramidal <a> and thefirst order pyramidal <c þ a> families of slip systems (set 3) werechosen. The choice of the prismatic and pyramidal <c þ a> slipsystem families is chosen by several authors working on titanium,
s in HCP materials.

Table 3Initial CRSS (in MPa or relative values) of HCP materials collected in the literature. In the last column, values labeled ‘1� ’ correspond to initial CRSS of 1st order pyramidal<c þ a> slip systems and values labeled ‘2� ’ correspond to initial CRSS of 2nd order pyramidal <c þ a> slip systems.
Reference Material s0, prism.<a>(MPa/rel.)
s0, basal<a> (MPa/rel.) s0, pyram.<a>(MPa/rel.)
s0, pyram.<cþa>(MPa/rel.)
Chan, 2004 Ti8Al1Mo1V 206.9 275.8 248.2Delfosse, 2005 Ti10.2.3 200 1�: 350Feaugas et al., 1997 Ti6246 380 1�: 615Dick, 2006 Ti6Al4V 380 400 1�: 640Fundenberger et al., 1997 Ti6Al4V 1 3e6 3e6 1�: 4e10Medina Perilla and Gil Sevillano, 1995 Ti6Al4V 1 w1 w1 1�: w1.4Balasubramanian and Anand, 2002 Titanium (750 �C) 1 1 1 1�: 10
2�: 10Sanchez et al., 2001 Zirconium 1.0 4.0 2.0 1�: 8.0
A.F. Gerday et al. / European Journal of Mechanics A/Solids 30 (2011) 248e255254
such as Feaugas et al. (1997) for Ti6246 or Luquiau (Delfosse, 2005)for Ti10.2.3. Here, the pyramidal <a> slip system family is addeddue to bad results using only the two previous families. Experi-mental loading curves for the three chosen orientations and thecorresponding numerical ones obtained using the three sets of slipsystem families are given in Fig. 10.
From this figure, one can deduce that, contrarily to experimentalresults, when the second or the third set of slip system familieswere
Fig. 10. Load versus displacement nanoindentation curves (loading part only) for threedifferent grain orientations (Table 1) and with different slip systems that could beactivated (all with the same initial CRSS and saturation shear stress).
Fig. 11. Experimental and numerical nanoindentation curves in four grains (see Table1) with optimized s0 and ss .
chosen, there was hardly any effect of the grain orientation onnanoindentation curves. To ensure that this phenomenon is not dueto the choice of the CRSS, other numerical simulations were per-formed using the third set of slip system families. For these simu-lations, several values of the CRSS, different for each family of slipsystems, were tested. However, the conclusion was the same: nosignificant influence of the grain orientation and CRSS values on thenanoindentation curves. Nevertheless, contrarily to the second andthird sets, the first set of slip system families (basal, prismatic andpyramidal <a>) made the distinction between nanoindentationcurves modeled in different grain orientations possible. For thisreason, thefirst set of slip system familieswas chosen and the valuesof the CRSS for the basal, prismatic and pyramidal <a> familieswere then optimized to improve the modeling of the three experi-mental results.
Many sets of parameters were tested but none of themwas ableto reproduce all the experimental nanoindentation curves obtainedfor several grain orientations in a fully accurate way. However,despite this observation, it was possible to optimize a set ofparameters making the modeling of some nanoindentation curvespossible. The corresponding values of s0 and ss are given hereafter:
s0;basal ¼ 4s0;prismatic ¼ 2s0;pyramidal<a> (4)
with s0;basal ¼ 200 MPa and (s0 � ss)/s0 ¼ 1%.Fig. 11 shows the comparison between the experimental and the
numerical curves obtained with these values of parameters s0 andss. They were also tested on a fourth grain (indent 31) and exper-imental and numerical results are also shown in this figure.
6. Conclusions
This article presents the procedure followed to identify thehexagonal a phase of Ti-5553 from nanoindentation experimentaltests performed on several a grains of different orientations. Thereproduction of nanoindentation tests with a crystal plasticity-based FE model has already been done previously (Wang et al.,2004) but it was never applied to the a phase of Ti-5553.
The elastic parameters were first identified using the unloadingpart of the nanoindentation curves. The identification of theisotropic elastic parameters (E and n) was demonstrated to besufficient. Moreover, the chosen values (E ¼ 125 GPa, n ¼ 0.33)correspond to those usually found in the literature for the a phaseof titanium alloys.
Finally, the characterization of the plastic parameters was con-ducted. The basal, prismatic and pyramidal <a> families of slipsystems were selected because they permitted the prediction ofdifferent nanoindentation behaviors for different grain orientations.The optimized set of parameters able to predict nanoindentationexperimental results in four grains with different orientations wasdetermined. The values of the initial CRSS and saturated stresses

A.F. Gerday et al. / European Journal of Mechanics A/Solids 30 (2011) 248e255 255
were not able to characterize perfectly all the experimental nano-indentation curves obtained for all grain orientations but theymadethe representation of the four selected grains in a relatively satis-factory way possible. Even if the agreement between the experi-mental nanoindentation results and the numerical predictions isnot perfect, it must bementioned that our resultswere not obtainedwith a phenomenological law containing numerous fitting param-eters permitting to tune the numerical results to the desired accu-racy. Instead, we used a crystal plasticity law and the optimizationwas performed only on the CRSS values. Therefore, the CRSS valuesobtained from our fitting are much more valuable (from a physicalpoint of view) that the fitting of a phenomenological law. Forinstance, the predictive capabilities of our model, together with theidentified CRSS values were checked in the paper. Indeed, the fittingwas performed on the grains number 12, 43 and 58 (see Table 1 fortheir orientation), while Fig. 11 additionally shows the resultsobtained for grain number 31 (which was not used for the fitting).And it is observed that the prediction for this grain 31 is as accurateas the prediction for the other grains.
During our study, we noticed that there is not a lot of infor-mation on the CRSS values for HCP materials in the literature (andparticularly for the a-phase of Ti-5553). This paper proposes somevalues obtained from the fitting of a crystal plasticity model onnanoindentation results. Even if a more complex optimization ofthe parameters would be required to increase the accuracy of ourresults (using for instance different hardening parameters for thethree slip system families, using more than three slip systemfamilies.), this paper provides valuable scientific advancement inthe modeling of the a-phase of titanium alloys.
Acknowledgments
The authors thank the Wallonia Region (Winnomat Titaeroproject), the Belgian Scientific Research Fund FNRS which financesA.M. Habraken and L. Duchêne and the Interuniversity AttractionPoles Program, Belgian Science Policy P6/24 for financial support.
References
Ahn, J.H., Jeon, E.C., Choi, Y., Lee, Y.H., Kwon, D., 2002. Derivation of tensile flowproperties of thin films using nanoindentation technique. Curr. Appl. Phys. 2,525e531.
Balasubramanian, S., Anand, L., 2002. Plasticity of initially textured hexagonalpolycrystals at high homologous temperatures: application to titanium. ActaMater. 50, 133e148.
Baranov, M.A., Dubov, E.A., 2005. Definition of elastic modules of ordered hexagonalcrystals. EPhTJ 1, 28e33.
Bassani, J.L., Wu, T., 1991. Latent hardening in single crystals 2, analytical charac-terization and predictions. Proc. Roy. Soc. Lond. A Math. Phys. Sci. 435, 21e41.
Bocciarelli, M., Bolzon, G., Maier, G., 2005. Parameter identification in anisotropicelastoplasticity by indentation and imprint mapping. Mech. Mater. 37,855e868.
Chan, K.S., 2004. A micromechanical analysis of the yielding behavior of individualwidmanstätten colonies of an a þ b titanium alloy. Metall. Mater. Trans. A 35,3409e3422.
Delfosse, J., 2005. Forgeage b du Ti17. Propriétés en fatigue, Paris, Ph.D. thesis.Dick, T., 2006. Modélisation multiéchelle du phénomène de fretting dans le contact
aube-disque, Paris, Ph.D. thesis.Dyduch, M., Habraken, A.M., Cescotto, S., 1992. Automatic adaptive remeshing for
numerical simulations of metal forming. Comput. Method. Appl. M. 101,283e298.
Feaugas, X., Pilvin, P., Clavel, M., 1997. Cyclic deformation behaviour of an a/b tita-nium alloy e II. Internal stresses and micromechanic modeling. Acta Mater. 45,2703e2714.
Fischer-Cripps, A.C., 2004. Nanoindentation. Springer, New York.Fundenberger, J.J., Philippe, M.J., Wagner, F., Esling, C., 1997. Acta Mater. 45,
4041e4055.Gerday, A.F., 2009. Mechanical behavior of Ti-5553 alloy. Modeling of representative
cells, University of Liège, Belgium. Ph.D. thesis. Available from: http://bictel.ulg.ac.be/ETD-db/collection/available/ULgetd-07142009-142010/.
Gerday, A.F., Ben Bettaieb, M., Duchêne, L., Clement, N., Diarra, H., Habraken, A.M.,2009. Interests and limitations of nanoindentation for bulk multiphase materialidentification. Application on b phase of Ti-5553. Acta Mater. 57, 5186e5195.
Grandjean, H., 2006. Graduation work, Université catholique de Louvain-la-Neuve,Belgium.
Habraken, A.M., Cescotto, S., 1998. Contact between deformable solids, the fullycoupled approach. Math. Comput. Model. 28, 153e169.
Huang, Y., 1991. A User-material Subroutine Incorporating Single Crystal Plasticity inthe Abaqus Finite Element Program, Internal Report. Harvard University.
Hutchinson, J.W., 1976. Bounds and self-consistent estimates for creep of poly-crystalline materials. P. Roy. Soc. Lond. A Mat 348, 101e127.
Kysar, J.W., 2001. Continuum simulations of directional dependence of crack growthalong copper/sapphire bicrystal interface. Part I: experiments and crystalplasticity background. J. Mech. Phys. Solids 49, 1099e1128.
Liu, Y., Wang, B., Yoshino, M., Roy, S., Lu, H., Komanduri, R., 2005. Combinednumerical simulation and nanoindentation for determining mechanical prop-erties of single crystal copper at mesoscale. J. Mech. Phys. Solids 53, 2718e2741.
Medina Perilla, J.A., Gil Sevillano, J., 1995. Two-dimensional sections of the yieldlocus of a Ti-6Al-4V alloy with a strong transverse-type crystallographic alpha-texture. Mat. Sci. Eng. A 201, 103e110.
Nag, S., Banerjee, R., Srinivasan, R., Hwang, J.Y., Harper, M., Fraser, H.L., 2009. u-Assisted nucleation and growth of a precipitates in the Tie5Ale5Moe5Ve3Cre0.5Fe b titanium alloy. Acta Mater. 57, 2136e2147.
Nye, J., 1961. Propriétés Physiques des Cristaux. Dunod editions, Paris.Oliver, W.C., Pharr, G.M., 1992. An improved technique for determining hardness
and elastic modulus using load and displacement sensing indentation experi-ments. J. Mater. Res. 7, 1564e1583.
Pelletier, H., Krier, J., Cornet, A., Mille, P., 2000. Limits of using bilinear stress-straincurve for finite element modeling of nanoindentation response on bulk mate-rials. Thin Solid Films 379, 147e155.
Pulecio, S.A.R., Farias, M.C.M., Souza, R.M., 2009. Analysis of the tip roundnesseffects on the micro- and macroindentation response of elastic-plastic mate-rials. J. Mater. Res. 24, 1037e1044.
Sanchez, P., Pochettino, A., Chauveau, T., Bacroix, B., 2001. Torsion texture devel-opment of zirconium alloys. J. Nucl. Mater. 298, 329e339.
Sasaki, T., Yang, M., Fukushima, S., Tsukano, R., 2004. Development of the CAE-assisted nano-indentation method for the evaluation of the anisotropicmechanical-properties of thin films. J. Mater. Process. Tech. 151, 263e267.
Siddiq, A., Schmauder, S., Huang, Y., 2007. Fracture of bicrystal metal/ceramicinterfaces: a study via the mechanism-based strain gradient crystal plasticitytheory. Int. J. Plasticity 23, 665e689.
Tabor, D., 1951. The Hardness of Metals. Clarendon press, Oxford.Trinité, V., 2006. Etude théorique des phases du titane, France, Ph.D. thesis.Wang, Y., Raabe, D., Klüber, C., Roters, F., 2004. Orientation dependence of nano-
indentation pile-up patterns and of nanoindentation microtextures in coppersingle crystals. Acta Mater. 52, 2229e2238.
Xu, Z.-H., Li, X., 2008. Effects of indenter geometry and material properties on thecorrection factor of Sneddon’s relationship for nanoindentation of elastic andelastic-plastic materials. Acta Mater. 56, 1399e1405.
Yan, J., Karlsson, A.M., Chen, X., 2007. Determining plastic properties of a materialwith residual stress by using conical indentation. Int. J. Solids Struct. 44,3720e3737.