A histogram-based segmentation method for characterization of self-assembled hexagonal lattices
8
Applied Surface Science 257 (2011) 10443–10450 Contents lists available at ScienceDirect Applied Surface Science j our nal ho me p age: www.elsevier.com/loc ate/apsusc A histogram-based segmentation method for characterization of self-assembled hexagonal lattices Mohammad J. Abdollahifard a , Karim Faez a,b,∗ , Mohammadreza Pourfard a , Mojtaba Abdollahi c a Electrical Engineering Department, Amirkabir University of Technology, Tehran 15914, Iran b Institute for Studies in Theoretical Physics and Mathematics (IPM), School of Computer Science, Tehran, Iran c Department of Chemical Engineering, University of Kashan, Kashan 8731751167, Iran a r t i c l e i n f o Article history: Received 26 December 2010 Received in revised form 29 June 2011 Accepted 29 June 2011 Available online 6 July 2011 Keywords: Nanostructures Quantitative grain analysis Anodic alumina oxide characterization Image processing a b s t r a c t Lattice characterization techniques are often used to quantify the effects of different anodization condi- tions on nano-porous anodized aluminum oxides. In this work, we develop a comprehensive hexagonal lattice characterization method to evaluate the amount of ordering of the lattice and localize the domains of the image and report their characteristics. A robust preprocessing is proposed to find pores’ centroids. Different domains of SEM images usually have different orientations. Pores orientation distribution is analyzed using angle-histogram. The valleys of angle-histogram are employed as thresholds to separate different dominant orientations. We show that using orientation as a distinguishing feature of different domains, significantly improves the robustness of the algorithm against tolerance parameters. Some new parameters are introduced to exactly characterize each of the domains and the whole lattice. © 2011 Elsevier B.V. All rights reserved. 1. Introduction Anodic aluminum oxide (AAO), produced by electrochemical anodization, has recently attracted significant attention [1,2]. Long range stability, controllability of pore dimensions and accessibil- ity of high aspect ratio pores makes porous alumina a suitable template for fabrication of nanowires [3–5], ordered carbon nan- otube arrays [6], magnetic storage devices [7], and many others. The ordering of the pore configuration of the aluminum oxide and the related grain structure is essential for optimizing the perfor- mance of the obtained devices [8]. The degree of ordering depends on preparation conditions including anodization time, electrolyte type, and applied voltage and temperature. At the beginning of the anodization process, pores are scattered randomly on the alu- minum surface. The degree of ordering increases with anodization time and the pore configuration gradually tends to an ordered hexagonal lattice [9,10] and ordered areas (domains) with differ- ent orientations are formed. Li et al. [11] claimed that the average domain size is a linear function of anodization time, but Nielsch et al. [12] showed that this is not the case and there is an optimum anodization time to obtain the largest domain size. Going beyond ∗ Corresponding author at: Electrical Engineering Department, Amirkabir Univer- sity of Technology, Hafez Avenue, Tehran 15914, Iran. E-mail addresses: mj [email protected] (M.J. Abdollahifard), [email protected] (K. Faez), [email protected] (M. Pourfard), [email protected] (M. Abdollahi). this optimum time reduces the ordering degree and maximum domain size. To find the domains’ borders, visual inspection is normally used by the researcher but there is an essential need to make this process automatic. Therefore, some image processing techniques have been proposed for this goal [2,13–15]. Order determination for 2D arrays with the development of the KTHNY theory of 2D melting has been introduced in the late ‘70 s [16]. To test the performance of the KTHNY theory, some simu- lations and experiments have been performed but sometimes the results are contradictory [17,18]. Randon et al. [19] calculate a surface coverage ratio of poly- crystallites with hexagonal symmetry and Lim et al. [20] show a model of pore growth. Radial distribution functions to define order- ing have been also used by [12,21,22] and based on these ideas, Behnke and Sand [23] have proposed order parameters for 1D and 2D ordering. 2D Fourier analysis-based methods were also employed for qualitative identification of lattice type and orientation distribu- tion [1,2]. These methods use a histogram on the basis of the Fast Fourier Transform (FFT) of the image and determine more ordered images based on histogram behavior. Mátéfi-Tempfli et al. [15] have proposed a simple triangle-based technique which determines the ordered and disordered areas of the AAO images. They have used the proportion of the ordered areas to the whole image surface as their proposed ordering criterion. But Hillebrand et al. [14] have introduced another ordering criterion based on domain size. In fact, the proportion of the largest domain 0169-4332/$ – see front matter © 2011 Elsevier B.V. All rights reserved. doi:10.1016/j.apsusc.2011.06.139
Transcript of A histogram-based segmentation method for characterization of self-assembled hexagonal lattices

Ah
Ma
b
c
a
ARRAA
KNQAI
1
aritoTtmottmthedea
s
((
0d
Applied Surface Science 257 (2011) 10443– 10450
Contents lists available at ScienceDirect
Applied Surface Science
j our nal ho me p age: www.elsev ier .com/ loc ate /apsusc
histogram-based segmentation method for characterization of self-assembledexagonal lattices
ohammad J. Abdollahifarda, Karim Faeza,b,∗, Mohammadreza Pourfarda, Mojtaba Abdollahi c
Electrical Engineering Department, Amirkabir University of Technology, Tehran 15914, IranInstitute for Studies in Theoretical Physics and Mathematics (IPM), School of Computer Science, Tehran, IranDepartment of Chemical Engineering, University of Kashan, Kashan 8731751167, Iran
r t i c l e i n f o
rticle history:eceived 26 December 2010eceived in revised form 29 June 2011ccepted 29 June 2011
a b s t r a c t
Lattice characterization techniques are often used to quantify the effects of different anodization condi-tions on nano-porous anodized aluminum oxides. In this work, we develop a comprehensive hexagonallattice characterization method to evaluate the amount of ordering of the lattice and localize the domainsof the image and report their characteristics. A robust preprocessing is proposed to find pores’ centroids.
vailable online 6 July 2011
eywords:anostructuresuantitative grain analysisnodic alumina oxide characterization
Different domains of SEM images usually have different orientations. Pores orientation distribution isanalyzed using angle-histogram. The valleys of angle-histogram are employed as thresholds to separatedifferent dominant orientations. We show that using orientation as a distinguishing feature of differentdomains, significantly improves the robustness of the algorithm against tolerance parameters. Some newparameters are introduced to exactly characterize each of the domains and the whole lattice.
mage processing
. Introduction
Anodic aluminum oxide (AAO), produced by electrochemicalnodization, has recently attracted significant attention [1,2]. Longange stability, controllability of pore dimensions and accessibil-ty of high aspect ratio pores makes porous alumina a suitableemplate for fabrication of nanowires [3–5], ordered carbon nan-tube arrays [6], magnetic storage devices [7], and many others.he ordering of the pore configuration of the aluminum oxide andhe related grain structure is essential for optimizing the perfor-
ance of the obtained devices [8]. The degree of ordering dependsn preparation conditions including anodization time, electrolyteype, and applied voltage and temperature. At the beginning ofhe anodization process, pores are scattered randomly on the alu-
inum surface. The degree of ordering increases with anodizationime and the pore configuration gradually tends to an orderedexagonal lattice [9,10] and ordered areas (domains) with differ-nt orientations are formed. Li et al. [11] claimed that the average
omain size is a linear function of anodization time, but Nielscht al. [12] showed that this is not the case and there is an optimumnodization time to obtain the largest domain size. Going beyond∗ Corresponding author at: Electrical Engineering Department, Amirkabir Univer-ity of Technology, Hafez Avenue, Tehran 15914, Iran.
E-mail addresses: mj [email protected] (M.J. Abdollahifard), [email protected]. Faez), [email protected] (M. Pourfard), [email protected]. Abdollahi).
169-4332/$ – see front matter © 2011 Elsevier B.V. All rights reserved.oi:10.1016/j.apsusc.2011.06.139
© 2011 Elsevier B.V. All rights reserved.
this optimum time reduces the ordering degree and maximumdomain size.
To find the domains’ borders, visual inspection is normally usedby the researcher but there is an essential need to make this processautomatic. Therefore, some image processing techniques have beenproposed for this goal [2,13–15].
Order determination for 2D arrays with the development of theKTHNY theory of 2D melting has been introduced in the late ‘70 s[16]. To test the performance of the KTHNY theory, some simu-lations and experiments have been performed but sometimes theresults are contradictory [17,18].
Randon et al. [19] calculate a surface coverage ratio of poly-crystallites with hexagonal symmetry and Lim et al. [20] show amodel of pore growth. Radial distribution functions to define order-ing have been also used by [12,21,22] and based on these ideas,Behnke and Sand [23] have proposed order parameters for 1D and2D ordering.
2D Fourier analysis-based methods were also employed forqualitative identification of lattice type and orientation distribu-tion [1,2]. These methods use a histogram on the basis of the FastFourier Transform (FFT) of the image and determine more orderedimages based on histogram behavior.
Mátéfi-Tempfli et al. [15] have proposed a simple triangle-basedtechnique which determines the ordered and disordered areas of
the AAO images. They have used the proportion of the ordered areasto the whole image surface as their proposed ordering criterion. ButHillebrand et al. [14] have introduced another ordering criterionbased on domain size. In fact, the proportion of the largest domain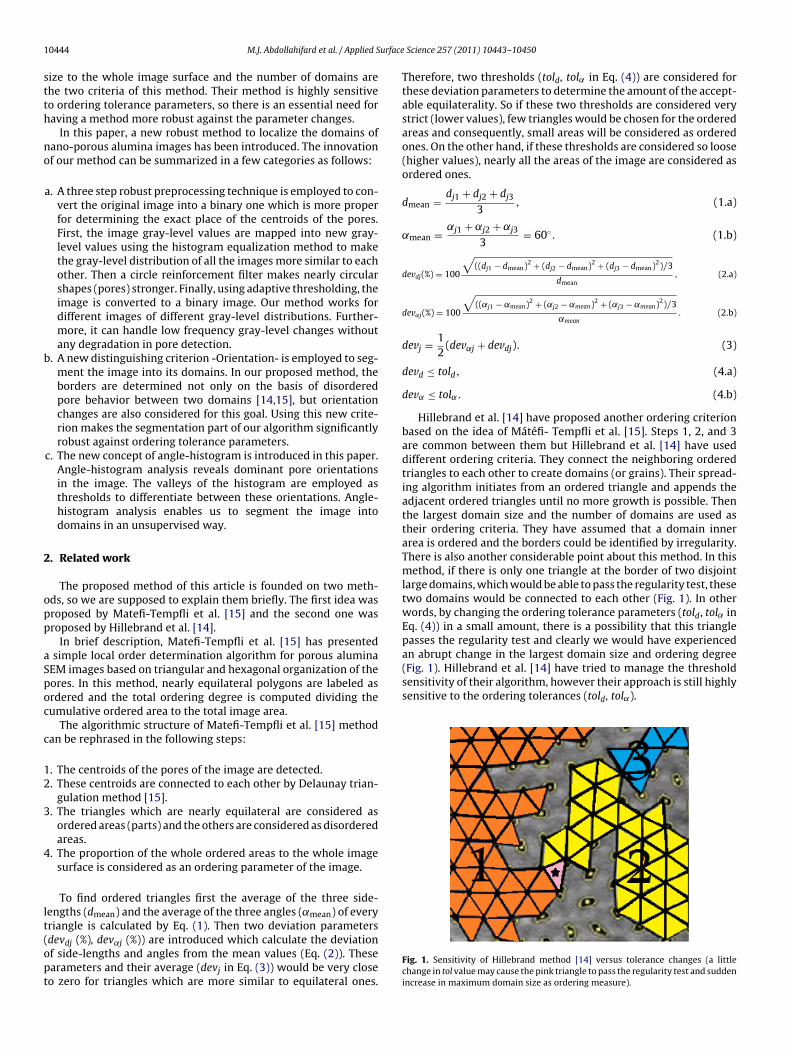
1 urface
stth
no
b
2
opp
aSpoc
c
12
3
4
lt(opt
an abrupt change in the largest domain size and ordering degree(Fig. 1). Hillebrand et al. [14] have tried to manage the thresholdsensitivity of their algorithm, however their approach is still highlysensitive to the ordering tolerances (told, tol˛).
0444 M.J. Abdollahifard et al. / Applied S
ize to the whole image surface and the number of domains arehe two criteria of this method. Their method is highly sensitiveo ordering tolerance parameters, so there is an essential need foraving a method more robust against the parameter changes.
In this paper, a new robust method to localize the domains ofano-porous alumina images has been introduced. The innovationf our method can be summarized in a few categories as follows:
a. A three step robust preprocessing technique is employed to con-vert the original image into a binary one which is more properfor determining the exact place of the centroids of the pores.First, the image gray-level values are mapped into new gray-level values using the histogram equalization method to makethe gray-level distribution of all the images more similar to eachother. Then a circle reinforcement filter makes nearly circularshapes (pores) stronger. Finally, using adaptive thresholding, theimage is converted to a binary image. Our method works fordifferent images of different gray-level distributions. Further-more, it can handle low frequency gray-level changes withoutany degradation in pore detection.
. A new distinguishing criterion -Orientation- is employed to seg-ment the image into its domains. In our proposed method, theborders are determined not only on the basis of disorderedpore behavior between two domains [14,15], but orientationchanges are also considered for this goal. Using this new crite-rion makes the segmentation part of our algorithm significantlyrobust against ordering tolerance parameters.
c. The new concept of angle-histogram is introduced in this paper.Angle-histogram analysis reveals dominant pore orientationsin the image. The valleys of the histogram are employed asthresholds to differentiate between these orientations. Angle-histogram analysis enables us to segment the image intodomains in an unsupervised way.
. Related work
The proposed method of this article is founded on two meth-ds, so we are supposed to explain them briefly. The first idea wasroposed by Matefi-Tempfli et al. [15] and the second one wasroposed by Hillebrand et al. [14].
In brief description, Matefi-Tempfli et al. [15] has presented simple local order determination algorithm for porous aluminaEM images based on triangular and hexagonal organization of theores. In this method, nearly equilateral polygons are labeled asrdered and the total ordering degree is computed dividing theumulative ordered area to the total image area.
The algorithmic structure of Matefi-Tempfli et al. [15] methodan be rephrased in the following steps:
. The centroids of the pores of the image are detected.
. These centroids are connected to each other by Delaunay trian-gulation method [15].
. The triangles which are nearly equilateral are considered asordered areas (parts) and the others are considered as disorderedareas.
. The proportion of the whole ordered areas to the whole imagesurface is considered as an ordering parameter of the image.
To find ordered triangles first the average of the three side-engths (dmean) and the average of the three angles (˛mean) of everyriangle is calculated by Eq. (1). Then two deviation parameters
devdj (%), dev˛j (%)) are introduced which calculate the deviationf side-lengths and angles from the mean values (Eq. (2)). Thesearameters and their average (devj in Eq. (3)) would be very closeo zero for triangles which are more similar to equilateral ones.Science 257 (2011) 10443– 10450
Therefore, two thresholds (told, tol˛ in Eq. (4)) are considered forthese deviation parameters to determine the amount of the accept-able equilaterality. So if these two thresholds are considered verystrict (lower values), few triangles would be chosen for the orderedareas and consequently, small areas will be considered as orderedones. On the other hand, if these thresholds are considered so loose(higher values), nearly all the areas of the image are considered asordered ones.
dmean = dj1 + dj2 + dj3
3, (1.a)
˛mean = ˛j1 + ˛j2 + ˛j3
3= 60◦. (1.b)
devdj(%) = 100
√((dj1 − dmean)2 + (dj2 − dmean)2 + (dj3 − dmean)2)/3
dmean, (2.a)
dev˛j(%) = 100
√((˛j1 − ˛mean)2 + (˛j2 − ˛mean)2 + (˛j3 − ˛mean)2)/3
˛mean. (2.b)
devj = 12
(dev˛j + devdj). (3)
devd ≤ told, (4.a)
dev˛ ≤ tol˛. (4.b)
Hillebrand et al. [14] have proposed another ordering criterionbased on the idea of Mátéfi- Tempfli et al. [15]. Steps 1, 2, and 3are common between them but Hillebrand et al. [14] have useddifferent ordering criteria. They connect the neighboring orderedtriangles to each other to create domains (or grains). Their spread-ing algorithm initiates from an ordered triangle and appends theadjacent ordered triangles until no more growth is possible. Thenthe largest domain size and the number of domains are used astheir ordering criteria. They have assumed that a domain innerarea is ordered and the borders could be identified by irregularity.There is also another considerable point about this method. In thismethod, if there is only one triangle at the border of two disjointlarge domains, which would be able to pass the regularity test, thesetwo domains would be connected to each other (Fig. 1). In otherwords, by changing the ordering tolerance parameters (told, tol˛ inEq. (4)) in a small amount, there is a possibility that this trianglepasses the regularity test and clearly we would have experienced
Fig. 1. Sensitivity of Hillebrand method [14] versus tolerance changes (a littlechange in tol value may cause the pink triangle to pass the regularity test and suddenincrease in maximum domain size as ordering measure).
urface
sb
3
pcSabtt
3
s
b
d
h
M.J. Abdollahifard et al. / Applied S
In this paper, a new method which significantly reduces the sen-itivity of the algorithm to the ordering tolerances (told, tol˛) haseen proposed.
. The proposed method
In this part of the paper, first the algorithmic structure of ourroposed method is expressed in Section 3.1. Then the prepro-essing stage will be described in more detail in Section 3.2. Inection 3.3 the orientation parameter will be defined. Then thengle-histogram and the unsupervised segmentation method wille explained in Section 3.4. Finally, in Section 3.5, some quantita-ive parameters are introduced to characterize each domain andhe whole lattice.
.1. Algorithmic structure of our method
In this section, the whole process of our method is briefly pre-ented in the algorithmic structure as follows:
a. Preprocessing including histogram-equalization, circle rein-forcement filter and adaptive thresholding to convert theoriginal image into a binary one.
. Computing the centroids of each pore and using Delaunay trian-gulation to partition the image into a large number of triangles.
c. Using the same method as Mátéfi-Tempfli et al. [15] to determineordered triangles.
. Determining ordered pores: If a pore is a common vertex ofexactly six triangles and all of the triangles are ordered the poreis considered as ordered.
e. Assigning an angle, between 0◦ and 60◦, to each ordered pore toquantify its orientation (Eq. (7)).
f. Computing the angle histogram (orientation distribution ofordered pores), and then finding its valleys (Eq. (8)).
g. Using the histogram valleys as thresholds to cluster the imageinto different orientated classes (Cm (m = 1, 2, . . ., M)).
. Finding domains (Dk (k = 1, 2, . . ., K)): a domain is a set of contin-uous ordered pores with the same class label (Note that a domain
is continuous but a class is not necessarily continuous so K ≥ M).i. Calculating characterization parameters (�k, �k, �) to quantify thecharacteristics of each domain and the whole image (Eq. (9), (10),(12)).
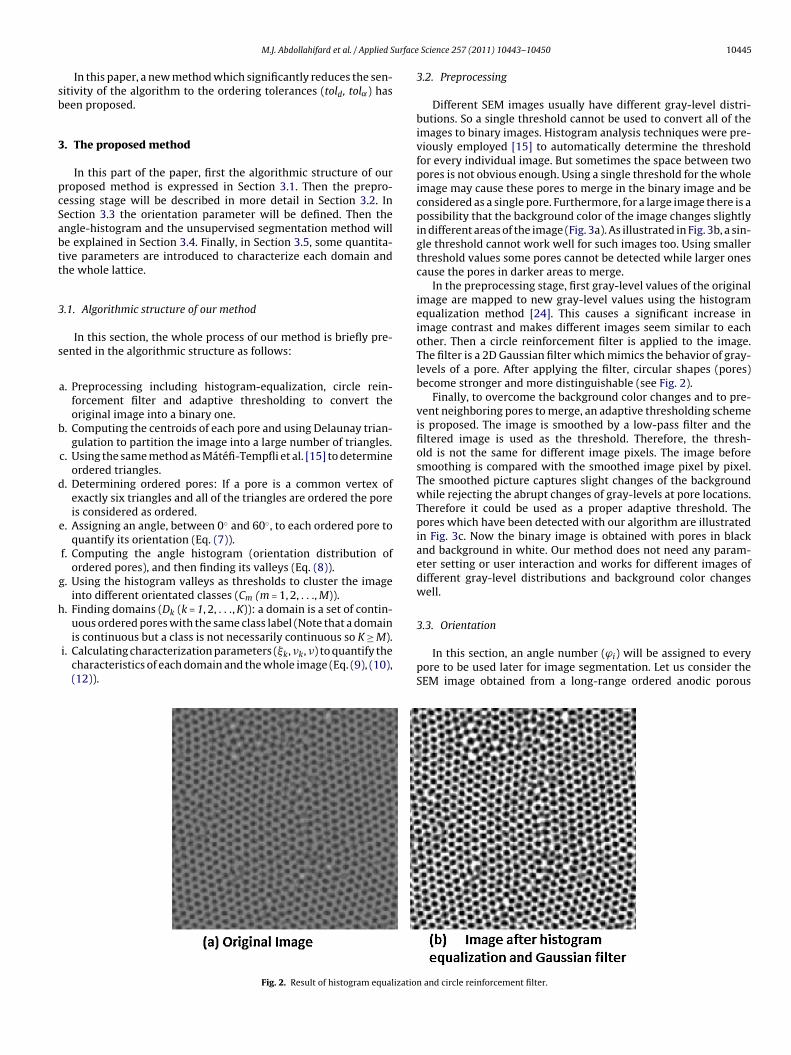
Fig. 2. Result of histogram equalizatio
Science 257 (2011) 10443– 10450 10445
3.2. Preprocessing
Different SEM images usually have different gray-level distri-butions. So a single threshold cannot be used to convert all of theimages to binary images. Histogram analysis techniques were pre-viously employed [15] to automatically determine the thresholdfor every individual image. But sometimes the space between twopores is not obvious enough. Using a single threshold for the wholeimage may cause these pores to merge in the binary image and beconsidered as a single pore. Furthermore, for a large image there is apossibility that the background color of the image changes slightlyin different areas of the image (Fig. 3a). As illustrated in Fig. 3b, a sin-gle threshold cannot work well for such images too. Using smallerthreshold values some pores cannot be detected while larger onescause the pores in darker areas to merge.
In the preprocessing stage, first gray-level values of the originalimage are mapped to new gray-level values using the histogramequalization method [24]. This causes a significant increase inimage contrast and makes different images seem similar to eachother. Then a circle reinforcement filter is applied to the image.The filter is a 2D Gaussian filter which mimics the behavior of gray-levels of a pore. After applying the filter, circular shapes (pores)become stronger and more distinguishable (see Fig. 2).
Finally, to overcome the background color changes and to pre-vent neighboring pores to merge, an adaptive thresholding schemeis proposed. The image is smoothed by a low-pass filter and thefiltered image is used as the threshold. Therefore, the thresh-old is not the same for different image pixels. The image beforesmoothing is compared with the smoothed image pixel by pixel.The smoothed picture captures slight changes of the backgroundwhile rejecting the abrupt changes of gray-levels at pore locations.Therefore it could be used as a proper adaptive threshold. Thepores which have been detected with our algorithm are illustratedin Fig. 3c. Now the binary image is obtained with pores in blackand background in white. Our method does not need any param-eter setting or user interaction and works for different images ofdifferent gray-level distributions and background color changeswell.
3.3. Orientation
In this section, an angle number (ϕi) will be assigned to everypore to be used later for image segmentation. Let us consider theSEM image obtained from a long-range ordered anodic porous
n and circle reinforcement filter.
10446 M.J. Abdollahifard et al. / Applied Surface Science 257 (2011) 10443– 10450
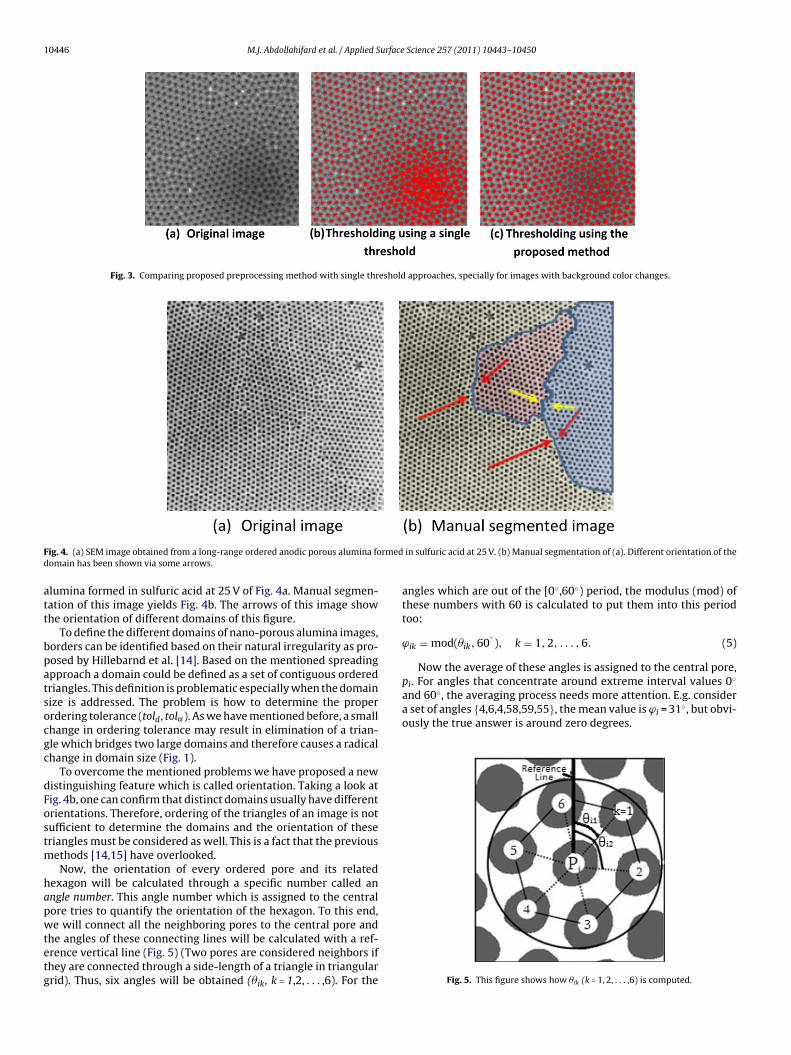
Fig. 3. Comparing proposed preprocessing method with single threshold approaches, specially for images with background color changes.
F rmedd
att
bpatsocgc
dFostm
hapwtetg
pi. For angles that concentrate around extreme interval values 0and 60◦, the averaging process needs more attention. E.g. considera set of angles {4,6,4,58,59,55}, the mean value is ϕi = 31◦, but obvi-ously the true answer is around zero degrees.
ig. 4. (a) SEM image obtained from a long-range ordered anodic porous alumina foomain has been shown via some arrows.
lumina formed in sulfuric acid at 25 V of Fig. 4a. Manual segmen-ation of this image yields Fig. 4b. The arrows of this image showhe orientation of different domains of this figure.
To define the different domains of nano-porous alumina images,orders can be identified based on their natural irregularity as pro-osed by Hillebarnd et al. [14]. Based on the mentioned spreadingpproach a domain could be defined as a set of contiguous orderedriangles. This definition is problematic especially when the domainize is addressed. The problem is how to determine the properrdering tolerance (told, tol˛). As we have mentioned before, a smallhange in ordering tolerance may result in elimination of a trian-le which bridges two large domains and therefore causes a radicalhange in domain size (Fig. 1).
To overcome the mentioned problems we have proposed a newistinguishing feature which is called orientation. Taking a look atig. 4b, one can confirm that distinct domains usually have differentrientations. Therefore, ordering of the triangles of an image is notufficient to determine the domains and the orientation of theseriangles must be considered as well. This is a fact that the previous
ethods [14,15] have overlooked.Now, the orientation of every ordered pore and its related
exagon will be calculated through a specific number called anngle number. This angle number which is assigned to the centralore tries to quantify the orientation of the hexagon. To this end,e will connect all the neighboring pores to the central pore and
he angles of these connecting lines will be calculated with a ref-rence vertical line (Fig. 5) (Two pores are considered neighbors ifhey are connected through a side-length of a triangle in triangularrid). Thus, six angles will be obtained (�ik, k = 1,2, . . . ,6). For the
in sulfuric acid at 25 V. (b) Manual segmentation of (a). Different orientation of the
angles which are out of the [0◦,60◦) period, the modulus (mod) ofthese numbers with 60 is calculated to put them into this periodtoo:
ϕik = mod(�ik, 60◦), k = 1, 2, . . . , 6. (5)
Now the average of these angles is assigned to the central pore,◦
Fig. 5. This figure shows how �ik (k = 1, 2, . . . ,6) is computed.
urface
i3
˚
˚
ecb
ϕ non-
prob
{
m
ddb
3
atsbBdp
ath
Fo
M.J. Abdollahifard et al. / Applied S
To detect these special cases, the initial angles are partitionednto two classes, the angles below 30◦ (˚i
L) and the angles above0◦ (˚i
U):
Li = {ϕik, ϕik < 30
◦ }, (6.a)
Ui = {ϕik, ϕik ≥ 30
◦ }. (6.b)
If the averages of these two classes differ more than 30◦ withach other (mean(˚i
U) − mean(˚iL) > 30◦) then obviously a spe-
ial case has occurred. Therefore, a 60◦ shift in one of these classesefore computing the average value is necessary:
i =
⎧⎪⎪⎨⎪⎪⎩
16
6∑K=1
ϕik for
mean({˚Li, ˚U
i− 60}) if 0 ≤ mean({˚L
i, ˚U
i− 60}) < 60 for
mean({˚Li
+ 60, ˚Ui}) if 0 ≤ mean({˚L
i+ 60, ˚U
i}) < 60
The result of the algorithm to the above sequence4,5,4,58,59,55} would be as follows:
ean({˚Li , ˚U
i − 60}) = mean({4, 6, 4, −2, −1, −5}) = 1.
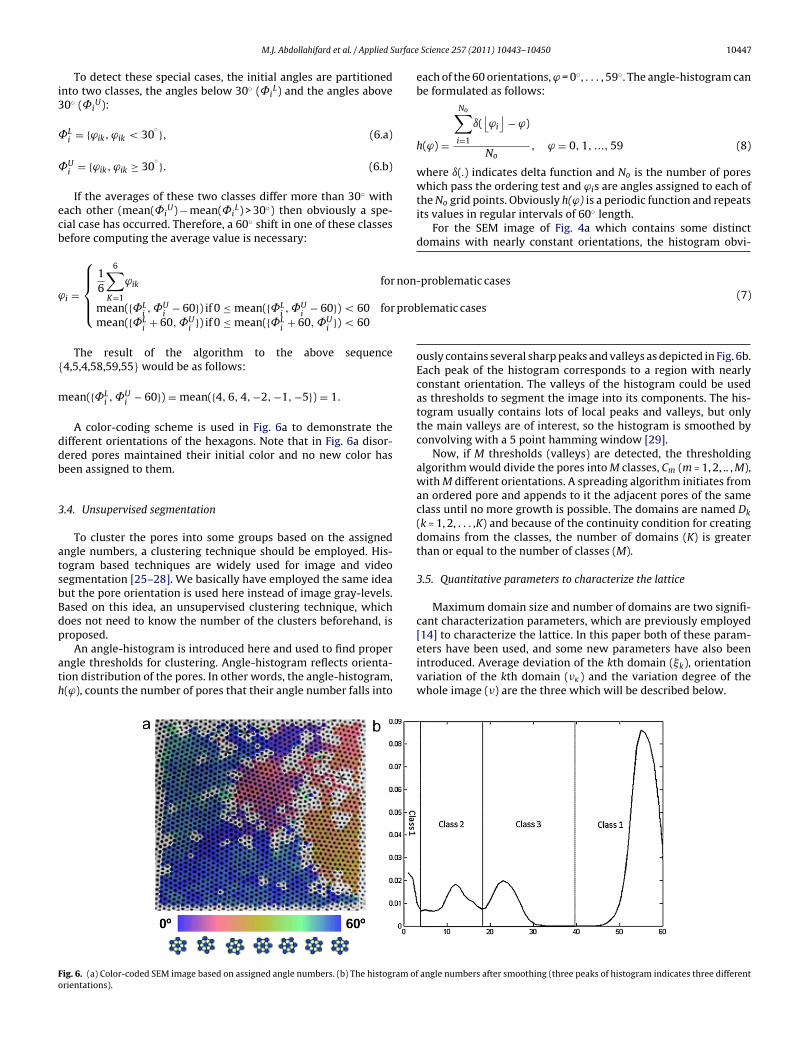
A color-coding scheme is used in Fig. 6a to demonstrate theifferent orientations of the hexagons. Note that in Fig. 6a disor-ered pores maintained their initial color and no new color haseen assigned to them.
.4. Unsupervised segmentation
To cluster the pores into some groups based on the assignedngle numbers, a clustering technique should be employed. His-ogram based techniques are widely used for image and videoegmentation [25–28]. We basically have employed the same ideaut the pore orientation is used here instead of image gray-levels.ased on this idea, an unsupervised clustering technique, whichoes not need to know the number of the clusters beforehand, isroposed.
An angle-histogram is introduced here and used to find properngle thresholds for clustering. Angle-histogram reflects orienta-ion distribution of the pores. In other words, the angle-histogram,(ϕ), counts the number of pores that their angle number falls into
ig. 6. (a) Color-coded SEM image based on assigned angle numbers. (b) The histogram ofrientations).
Science 257 (2011) 10443– 10450 10447
problematic cases
lematic cases(7)
each of the 60 orientations, ϕ = 0◦, . . . , 59◦. The angle-histogram canbe formulated as follows:
h(ϕ) =
No∑i=1
ı(⌊
ϕi
⌋− ϕ)
No, ϕ = 0, 1, ..., 59 (8)
where ı(.) indicates delta function and No is the number of poreswhich pass the ordering test and ϕis are angles assigned to each ofthe No grid points. Obviously h(ϕ) is a periodic function and repeatsits values in regular intervals of 60◦ length.
For the SEM image of Fig. 4a which contains some distinctdomains with nearly constant orientations, the histogram obvi-
ously contains several sharp peaks and valleys as depicted in Fig. 6b.Each peak of the histogram corresponds to a region with nearlyconstant orientation. The valleys of the histogram could be usedas thresholds to segment the image into its components. The his-togram usually contains lots of local peaks and valleys, but onlythe main valleys are of interest, so the histogram is smoothed byconvolving with a 5 point hamming window [29].
Now, if M thresholds (valleys) are detected, the thresholdingalgorithm would divide the pores into M classes, Cm (m = 1, 2, .. , M),with M different orientations. A spreading algorithm initiates froman ordered pore and appends to it the adjacent pores of the sameclass until no more growth is possible. The domains are named Dk(k = 1, 2, . . . ,K) and because of the continuity condition for creatingdomains from the classes, the number of domains (K) is greaterthan or equal to the number of classes (M).
3.5. Quantitative parameters to characterize the lattice
Maximum domain size and number of domains are two signifi-cant characterization parameters, which are previously employed[14] to characterize the lattice. In this paper both of these param-
eters have been used, and some new parameters have also beenintroduced. Average deviation of the kth domain (�k), orientationvariation of the kth domain (��) and the variation degree of thewhole image (�) are the three which will be described below.angle numbers after smoothing (three peaks of histogram indicates three different

10448 M.J. Abdollahifard et al. / Applied Surface Science 257 (2011) 10443– 10450
Fig. 7. In the first row of this figure the results of the Hillebrand et al. [14] algorithm with three different ordering thresholds (7%, 12%, and 15%) are shown. The best result oft thres( sult am n.
pto
dc
�
eb
his algorithm which is much closer to manual segmentation was obtained by a 13%15%, 20%, and 100%) are shown. After 20% our algorithm has an acceptable stable re
anual segmented image and result of the 40% threshold of our algorithm are show
Let us assume that the SEM image contains N pores, No orderedores and Mo ordered triangles. Furthermore let us assume thathe image is partitioned into K domains, each of which contains Nkrdered pores and Mk ordered triangles (k = 1, . . . , K).
The average deviation parameter (�k) of each domain is intro-uced for precise quantifying of its ordering on the basis of itsonstituting triangles:
k = 1Mk
Mk∑devj. (9)
j=1
On the other hand, within a single domain all pores do notxactly have the same angle but the angles lie in an intervaletween two thresholds (histogram’s valleys). Concentration of all
hold. In the second row the results of our algorithm with three different thresholdsnd is able to detect the three main domains. At the third row the original image, its
angles of a domain pores around the average angle results in a sharppeak which is more distinguishable from other peaks and indi-cates very little orientation variation within the domain. Averageorientation variation parameter �k is defined as follows:
�k =
√√√√√√√1
Nk
Nk∑
i = 1pi ∈ Dk
(�i − �k)2, (10)
where �k is the average orientation of the kth domain:
�k = mean{�i|pi ∈ Dk}, k = 1, ..., K. (11)
M.J. Abdollahifard et al. / Applied Surface Science 257 (2011) 10443– 10450 10449
F 4] (bi e we
d
�
4
fftp
Ftsvtol
ivs
3i1a
lo1tartd
rftA[
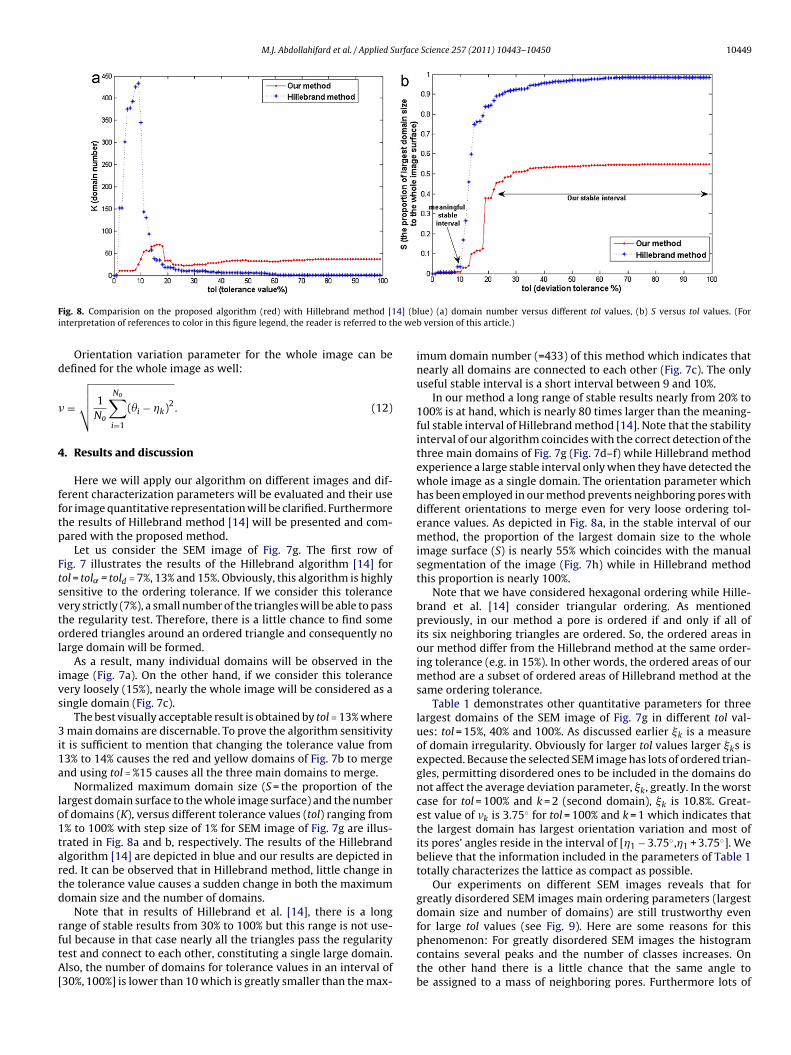
ig. 8. Comparision on the proposed algorithm (red) with Hillebrand method [1nterpretation of references to color in this figure legend, the reader is referred to th
Orientation variation parameter for the whole image can beefined for the whole image as well:
=
√√√√ 1No
No∑i=1
(�i − �k)2. (12)
. Results and discussion
Here we will apply our algorithm on different images and dif-erent characterization parameters will be evaluated and their useor image quantitative representation will be clarified. Furthermorehe results of Hillebrand method [14] will be presented and com-ared with the proposed method.
Let us consider the SEM image of Fig. 7g. The first row ofig. 7 illustrates the results of the Hillebrand algorithm [14] forol = tol˛ = told = 7%, 13% and 15%. Obviously, this algorithm is highlyensitive to the ordering tolerance. If we consider this toleranceery strictly (7%), a small number of the triangles will be able to passhe regularity test. Therefore, there is a little chance to find somerdered triangles around an ordered triangle and consequently noarge domain will be formed.
As a result, many individual domains will be observed in themage (Fig. 7a). On the other hand, if we consider this toleranceery loosely (15%), nearly the whole image will be considered as aingle domain (Fig. 7c).
The best visually acceptable result is obtained by tol = 13% where main domains are discernable. To prove the algorithm sensitivity
t is sufficient to mention that changing the tolerance value from3% to 14% causes the red and yellow domains of Fig. 7b to mergend using tol = %15 causes all the three main domains to merge.
Normalized maximum domain size (S = the proportion of theargest domain surface to the whole image surface) and the numberf domains (K), versus different tolerance values (tol) ranging from% to 100% with step size of 1% for SEM image of Fig. 7g are illus-rated in Fig. 8a and b, respectively. The results of the Hillebrandlgorithm [14] are depicted in blue and our results are depicted ined. It can be observed that in Hillebrand method, little change inhe tolerance value causes a sudden change in both the maximumomain size and the number of domains.
Note that in results of Hillebrand et al. [14], there is a longange of stable results from 30% to 100% but this range is not use-
ul because in that case nearly all the triangles pass the regularityest and connect to each other, constituting a single large domain.lso, the number of domains for tolerance values in an interval of30%, 100%] is lower than 10 which is greatly smaller than the max-
lue) (a) domain number versus different tol values, (b) S versus tol values. (Forb version of this article.)
imum domain number (=433) of this method which indicates thatnearly all domains are connected to each other (Fig. 7c). The onlyuseful stable interval is a short interval between 9 and 10%.
In our method a long range of stable results nearly from 20% to100% is at hand, which is nearly 80 times larger than the meaning-ful stable interval of Hillebrand method [14]. Note that the stabilityinterval of our algorithm coincides with the correct detection of thethree main domains of Fig. 7g (Fig. 7d–f) while Hillebrand methodexperience a large stable interval only when they have detected thewhole image as a single domain. The orientation parameter whichhas been employed in our method prevents neighboring pores withdifferent orientations to merge even for very loose ordering tol-erance values. As depicted in Fig. 8a, in the stable interval of ourmethod, the proportion of the largest domain size to the wholeimage surface (S) is nearly 55% which coincides with the manualsegmentation of the image (Fig. 7h) while in Hillebrand methodthis proportion is nearly 100%.
Note that we have considered hexagonal ordering while Hille-brand et al. [14] consider triangular ordering. As mentionedpreviously, in our method a pore is ordered if and only if all ofits six neighboring triangles are ordered. So, the ordered areas inour method differ from the Hillebrand method at the same order-ing tolerance (e.g. in 15%). In other words, the ordered areas of ourmethod are a subset of ordered areas of Hillebrand method at thesame ordering tolerance.
Table 1 demonstrates other quantitative parameters for threelargest domains of the SEM image of Fig. 7g in different tol val-ues: tol = 15%, 40% and 100%. As discussed earlier �k is a measureof domain irregularity. Obviously for larger tol values larger �ks isexpected. Because the selected SEM image has lots of ordered trian-gles, permitting disordered ones to be included in the domains donot affect the average deviation parameter, �k, greatly. In the worstcase for tol = 100% and k = 2 (second domain), �k is 10.8%. Great-est value of �k is 3.75◦ for tol = 100% and k = 1 which indicates thatthe largest domain has largest orientation variation and most ofits pores’ angles reside in the interval of [�1 − 3.75◦,�1 + 3.75◦]. Webelieve that the information included in the parameters of Table 1totally characterizes the lattice as compact as possible.
Our experiments on different SEM images reveals that forgreatly disordered SEM images main ordering parameters (largestdomain size and number of domains) are still trustworthy evenfor large tol values (see Fig. 9). Here are some reasons for thisphenomenon: For greatly disordered SEM images the histogram
contains several peaks and the number of classes increases. Onthe other hand there is a little chance that the same angle tobe assigned to a mass of neighboring pores. Furthermore lots of
10450 M.J. Abdollahifard et al. / Applied Surface Science 257 (2011) 10443– 10450
Table 1Sk (each domain area in percent), �k (orientation variation), �k (average deviation) for k = 1,2,3 (the three largest domains) of SEM image of Fig. 7g.
Domain (k) Tolerance = 15% Tolerance = 40% Tolerance = 100%
1 2 3 1 2 3 1 2 3
Sk (%) 12 11 6 61 16 13 63 17 13�k (%) 7.2 8.0 7.6 9.2 9.6 10.1 9.8 10.8 10.5�k (◦) 1.96 2.99 2.09 3.65
Fa
pttt
sd2ui
5
aWoltithasefimwia
R
[
[
[
[
[
[
[
[
[
[
[
[
[
[
[
[
[
[
ig. 9. Result of our algorithm on a greatly disordered SEM image. Large domainsre unlikely to form.
olygons contain not exactly 6 vertices and so they have no chanceo be identified as ordered even for tol = 100%. As depicted in Fig. 9he largest domain size is 3.41% for tol = 40% which indicates thathe SEM image is highly disordered.
However if the exact location of domains are of some interestelecting tol more than 30% seems to be unwise because very disor-ered triangles will be included in the domains. tol values between0% and 30% seems to fulfill our requirements for loose tol val-es and at the same time prevent very disordered triangles to be
ncluded in the domains.
. Conclusion
In this paper, we have proposed an unsupervised segmentationlgorithm to find domains in nano-porous alumina SEM images.e have also introduced some ordering parameters based on
ur segmentation algorithms to give the researchers a commonanguage to report their experiments. A new parameter orienta-ion, based on human interpretation of segmenting these types ofmages, is employed in our method. Using this new feature, a his-ogram based segmentation method is proposed which is capable ofandling ordering tolerance changes without any meaningful vari-tion in ordering criteria. We have also used some preprocessingtages on the basis of image processing techniques like histogram-qualization, adaptive thresholding, and circular-reinforcementlter techniques which make the nano-porous alumina imagesore appropriate for the later stages. Comparison of our methodith the previous ones reveals a significant improvement in stabil-
ty of the algorithm while the detected domains are visually morecceptable.
eferences
[1] M.H. Rahimi, S. Saramad, S.H. Tabaian, S.P. Marashi, A. Zolfaghari, M. Moham-madalinezhad, Study the effect of striping in two-step anodizing process
[
[
3.08 2.39 3.75 3.14 2.39
on pore arrangement of nano-porous alumina, Appl. Surf. Sci. 256 (2009)12–16.
[2] M.H. Rahimi, S.H. Tabaian, S.P. Marashi, M. Amiri, M.M. Dalaly, S. Saramad,A. Ramazani, A. Zolfaghari, The effect of aluminum electropolishing on nano-pores arrangement in anodic alumina membrains, Int. J. Mod. Phys. B 22 (2008)3267–3277.
[3] J. Mallet, K. Yu-Zhang, S. Matefi-Tempfli, M. Matefi-Tempfli, L. Piraux, Elec-trodeposited L10 CoxPt1−x nanowires, J. Phys. D: Appl. Phys. 38 (2005) 909.
[4] K. Nielsch, R.B. Wehrspohn, J. Barthel, J. Kirschner, U. Gösele, S.F. Fischer, H.Kronmüller, Hexagonally ordered 100 nm period nickel nanowire arrays, Appl.Phys. Lett. 79 (2001) 1360–1362.
[5] L. Piraux, A. Encinas, L. Vila, S. Matefi-Tempfli, M. Matefi-Tempfli, M. Darques, F.Elhoussine, S. Michotte, Magnetic and superconducting nanowires, J. Nanosci.Nanotechnol. 5 (2005) 372–389.
[6] J. Li, C. Papadopoulos, M.J. Xu, M. Moskovits, Highly-ordered carbon nanotubearrays for electronics applications, Appl. Phys. Lett. 75 (1999) 367–369.
[7] R. Karmhag, T. Tesfamichael, E. Wäckelgård, G.A. Niklasson, M. Nygren, Oxi-dation kinetics of nickel particles: comparison between free particles andparticles in an oxide matrix, Solid Energy 68 (2000) 329–333.
[8] S. Massou, L. Masson, I. Ozerov, E. Moyen, K. Sengupta, M. Hanbucken, Largescale ordered topographical and chemical nano-features from anodic aluminatemplates, Appl. Surf. Sci. 256 (2009) 395–398.
[9] J. Choi, K. Nielsch, M. Reiche, R.B. Wehrspohn, U. Gösele, Fabrication ofmonodomain alumina pore arrays with an interpore distance smaller thanthe lattice constant of the imprint stamp, J. Vac. Sci. Technol. B 21 (2003)763–766.
10] H. Masuda, K. Fukuda, Fabrication of highly ordered structures using anodicporous alumina, Science 268 (1995) 1466.
11] F. Li, L. Zhang, R.M. Metzger, On the growth of highly ordered pores in anodizedaluminum oxide, Chem. Mater. 10 (1998) 2470–2480.
12] K. Nielsch, J. Choi, K. Schwirn, R.B. Wehrspohn, U. Gösele, Self-ordering regimesof porous alumina: the 10 porosity rule, Nano. Lett. 2 (2002) 677–680.
13] Y. Lansac, M.A. Glaser, N.A. Clark, Discrete elastic model for two-dimensionalmelting, Phys. Rev. E 73 (2006) 041501.
14] R. Hillebrand, F. Muller, K. Schwirn, W. Lee, M. Steinhart, Quantitative analy-sis of the grain morphology in self-assembled hexagonal lattices, ACS Nano 2(2008) 913–920.
15] S. Mátéfi-Tempfli, M. Mátéfi-Tempfli, L. Piraux, Characterization of nanoporesordering in anodic alumina, J. Thin Solid Films 516 (2008) 3735–3740.
16] D.R. Nelson, B.I. Halperin, Dislocation-mediated melting in two dimensions,Phys. Rev. B 19 (1979) 2457–2484.
17] K.J. Strandburg, Two-dimensional melting, Rev. Mod. Phys. 60 (1988)161–207.
18] T. Weider, M.A. Glaser, H.J.M. Hanley, N.A. Clark, Shear-induced melting of two-dimensional solids, Phys. Rev. B 47 (1993) 5622–5628.
19] J. Randon, P.P. Mardilovich, A.N. Govyadinov, R. Paterson, Modelling the porestructure of anodic alumina membranes, in: 3rd International Conference onInorganic Membranes, Worchester, MA, USA, 1994, p. 613.
20] J.H.F. Lim, X. Jia, R. Jafferali, G.A. Davies, Statistical models to describe the struc-ture of porous ceramic membranes, Sep. Sci. Technol. 28 (1993) 821–854.
21] R.B. Wehrspohn, A.P. Li, K. Nielsch, F. Müller, W. Erfurth, U. Gösele:, Highly-ordered alumina films: pore growth and applications, Electrochem. Soc. Proc.(2000) 271–282.
22] A.C. Gâlca, E.S. Kooij, H. Wormeester, C. Salm, V. Leca, J.H. Rector, B.Poelsema, Optical anisotropy, porosity of anodic aluminum oxide character-ized by spectroscopic ellipsometry, Electrochem. Solid-State Lett. 6 (2003)B52–B54.
23] J.F. Behnke, T. Sands, Bimodal spatial distribution of pores in anodically oxidizedaluminum thin films, J. Appl. Phys. 88 (2000) 6875.
24] R.C. Gonzalez, R.E. Woods, S. Eddins, Digital Image Processing, 3rd ed., PrenticeHall, 2008.
25] H.R. Tizhoosh, Image thresholding using type II fuzzy sets, Pattern Recogn. 38(2005) 2363–2372.
26] A. Bigand, O. Colot, Fuzzy filter based on interval-valued fuzzy sets for imagefiltering, Fuzzy Set. Syst. 161 (2010) 96–117.
27] K.S. Tan, N.A.M. Isa, Color image segmentation using histogram thresholding –
Fuzzy C-means hybrid approach, Pattern Recogn. 44 (2011) 1–15.28] O. Küc üktunc , U. Güdükbay, Ö. Ulusoy, Fuzzy color histogram-based video seg-mentation, Comput. Vis. Image Under. 114 (2010) 125–134.
29] Oppenheim A.V., Schafer R.W., Buck J.R., Discrete-Time Signal Processing, Pren-tice Hall, 1999.