A Statistical Approach for the Characterization of Self-assembled Hexagonal Lattices
11
Applied Surface Science 259 (2012) 124–134 Contents lists available at SciVerse ScienceDirect Applied Surface Science jou rn al h om epa g e: www.elsevier.com/locate/apsusc A statistical approach for the characterization of self-assembled hexagonal lattices Mohammadreza Pourfard, Karim Faez ∗ Amirkabir University of Technology, 424 Hafez Ave, Tehran, Iran a r t i c l e i n f o Article history: Received 14 December 2011 Received in revised form 30 June 2012 Accepted 1 July 2012 Available online 21 July 2012 Keywords: Nanostructures Quantitative grain analysis Anodic alumina oxide characterization Image processing Signal processing a b s t r a c t Different anodization conditions create different lattices of aluminum oxides. Some lattice characteriza- tion techniques have been proposed in the literature to quantify the effects of these conditions. In this paper, a statistical method for evaluating the degree of ordering in the hexagonal nano-porous anodized aluminum oxide (AAO) lattices has been proposed. A robust preprocessing technique is used to eliminate the irregularity of the background of the SEM image of these structures. Then the maximum variance of the summation of the intensity value of two directions of the image in different orientations is used to determine the degree of ordering. The mentioned variance signal also shows the dominant and other orientations of the nano pores in an AAO image. One new criterion is also introduced which could exactly characterize the whole lattice. © 2012 Elsevier B.V. All rights reserved. 1. Introduction Anodic aluminum oxide (AAO) has recently attracted signifi- cant attention among researchers [1–3,18]. Some specific features of anodic aluminum oxide are their accessibility of high aspect ratio pores, controllability of pore dimensions, and long range stability, and so this structure can be used as a suitable template for fabrica- tion of magnetic storage devices [5], nanowires [4–5,12], ordered carbon nanotube arrays [6], and many other useful devices. An important issue for optimizing the performance of the obtained devices is the ordering of this structure. Preparation con- ditions of the anodic aluminum oxide (AAO) including temperature, anodization time, electrolyte type, and applied voltage determine the ordering degree of this structure. In fact, at the beginning of the anodization process, the sur- face of the aluminum seems like randomly scattered pores. But as the anodization time goes on, the degree of the ordering gradually increases and an ordered hexagonal lattice forms [7,13,16–18]. In this structure, there are also different ordered areas with different orientations which are called domains. At first, researchers like Li et al. [8] thought that the average domain size is a linear function of anodization time but Nielsch et al. [9] have shown that this is not the case and there is an optimum ∗ Corresponding author at: Electrical Engineering Department, Amirkabir Univer- sity of Technology, Tehran 15914, Iran. E-mail addresses: [email protected] (M. Pourfard), [email protected] (K. Faez). anodization time to obtain the highest ordering and largest domain size. Any deviation from this optimum time will reduce the ordering degree and maximum domain size. To determine the domains’ borders, normally subjective judg- ment (e.g. visual inspection) is used by the researchers but there is an essential need to make this process objective and automatic. To solve this problem, some image processing techniques have been proposed recently [1–3,10–11]. These techniques can be catego- rized into two major types: transformation-domain methods and spatial-domain methods. As an example of the first type, Rahimi et al. [1–2,19] have used a 2D Fourier analysis-based method for qualitative identification of the lattice type. Their methods construct a histogram on the basis of the fast Fourier transform of the image and extract the amount of ordering on the basis of the histogram behavior. On the other hand, as an example of the second type, Mátéfi- Tempfli et al. [11] have proposed a simple triangle-based technique which determines the ordered and disordered areas of these images. They have introduced a criterion for the degree of ordering which is the proportion of the ordered areas to the whole image area. Hillebrand et al. [10] have improved the idea and introduced another two ordering criteria. Their criteria are the proportion of the largest domain size to the whole image surface and the number of domains. However, Hillebrand et al.’s [10] are still highly sensitive to ordering tolerance parameters. Furthermore, they use a nearly complex technique for defining the ordering of the AAO images. Another shortcoming of this method is that it is not capable of using orientation information of the pores 0169-4332/$ – see front matter © 2012 Elsevier B.V. All rights reserved. http://dx.doi.org/10.1016/j.apsusc.2012.07.004
Transcript of A Statistical Approach for the Characterization of Self-assembled Hexagonal Lattices
Ah
MA
a
ARRAA
KNQAIS
1
copatc
odat
ftito
d[
s
0h
Applied Surface Science 259 (2012) 124– 134
Contents lists available at SciVerse ScienceDirect
Applied Surface Science
jou rn al h om epa g e: www.elsev ier .com/ locate /apsusc
statistical approach for the characterization of self-assembledexagonal lattices
ohammadreza Pourfard, Karim Faez ∗
mirkabir University of Technology, 424 Hafez Ave, Tehran, Iran
r t i c l e i n f o
rticle history:eceived 14 December 2011eceived in revised form 30 June 2012ccepted 1 July 2012vailable online 21 July 2012
a b s t r a c t
Different anodization conditions create different lattices of aluminum oxides. Some lattice characteriza-tion techniques have been proposed in the literature to quantify the effects of these conditions. In thispaper, a statistical method for evaluating the degree of ordering in the hexagonal nano-porous anodizedaluminum oxide (AAO) lattices has been proposed. A robust preprocessing technique is used to eliminatethe irregularity of the background of the SEM image of these structures. Then the maximum variance
eywords:anostructuresuantitative grain analysisnodic alumina oxide characterization
mage processing
of the summation of the intensity value of two directions of the image in different orientations is usedto determine the degree of ordering. The mentioned variance signal also shows the dominant and otherorientations of the nano pores in an AAO image. One new criterion is also introduced which could exactlycharacterize the whole lattice.
© 2012 Elsevier B.V. All rights reserved.
ignal processing. Introduction
Anodic aluminum oxide (AAO) has recently attracted signifi-ant attention among researchers [1–3,18]. Some specific featuresf anodic aluminum oxide are their accessibility of high aspect ratioores, controllability of pore dimensions, and long range stability,nd so this structure can be used as a suitable template for fabrica-ion of magnetic storage devices [5], nanowires [4–5,12], orderedarbon nanotube arrays [6], and many other useful devices.
An important issue for optimizing the performance of thebtained devices is the ordering of this structure. Preparation con-itions of the anodic aluminum oxide (AAO) including temperature,nodization time, electrolyte type, and applied voltage determinehe ordering degree of this structure.
In fact, at the beginning of the anodization process, the sur-ace of the aluminum seems like randomly scattered pores. But ashe anodization time goes on, the degree of the ordering graduallyncreases and an ordered hexagonal lattice forms [7,13,16–18]. Inhis structure, there are also different ordered areas with differentrientations which are called domains.
At first, researchers like Li et al. [8] thought that the average
omain size is a linear function of anodization time but Nielsch et al.9] have shown that this is not the case and there is an optimum∗ Corresponding author at: Electrical Engineering Department, Amirkabir Univer-ity of Technology, Tehran 15914, Iran.
E-mail addresses: [email protected] (M. Pourfard), [email protected] (K. Faez).
169-4332/$ – see front matter © 2012 Elsevier B.V. All rights reserved.ttp://dx.doi.org/10.1016/j.apsusc.2012.07.004
anodization time to obtain the highest ordering and largest domainsize.
Any deviation from this optimum time will reduce the orderingdegree and maximum domain size.
To determine the domains’ borders, normally subjective judg-ment (e.g. visual inspection) is used by the researchers but there isan essential need to make this process objective and automatic. Tosolve this problem, some image processing techniques have beenproposed recently [1–3,10–11]. These techniques can be catego-rized into two major types: transformation-domain methods andspatial-domain methods.
As an example of the first type, Rahimi et al. [1–2,19] have useda 2D Fourier analysis-based method for qualitative identification ofthe lattice type. Their methods construct a histogram on the basisof the fast Fourier transform of the image and extract the amountof ordering on the basis of the histogram behavior.
On the other hand, as an example of the second type, Mátéfi-Tempfli et al. [11] have proposed a simple triangle-based techniquewhich determines the ordered and disordered areas of theseimages. They have introduced a criterion for the degree of orderingwhich is the proportion of the ordered areas to the whole imagearea. Hillebrand et al. [10] have improved the idea and introducedanother two ordering criteria. Their criteria are the proportionof the largest domain size to the whole image surface and thenumber of domains. However, Hillebrand et al.’s [10] are still
highly sensitive to ordering tolerance parameters. Furthermore,they use a nearly complex technique for defining the orderingof the AAO images. Another shortcoming of this method is thatit is not capable of using orientation information of the pores
urface
fosrha
cosi
eov
m
-
-
-
-
-
mmpi
spoateteTao
2
pb
(
(
M. Pourfard, K. Faez / Applied S
or determination of the domains place in an AAO image. Therientation problem has been solved in our previous work [3] byome modification on the Hillebrand et al. [10] method and theobustness of the method to the ordering tolerance parametersas increased significantly. But this method is still a complex onend depends on an ordering tolerance parameter.
In this paper, a simple method is proposed based on statisticalharacteristics of nano porous alumina for defining the degree ofrdering in these structures. This method relies on some image andignal processing techniques to obtain the ordering criterion in AAOmages.
In brief, this method uses the summation of the intensity of pix-ls in AAO images in both x and y axes and evaluates the degreef ordering in an AAO image through calculation of the averageariance in the x axis and shifted y axis.
The innovations of this method can be categorized into fiveajor parts as follows:
This method has introduced a new robust criterion for determin-ing the degree of ordering of an AAO image. The ordering criterionis the normalized maximum average variance of the summationof the intensity signals.
This method would be able to determine the dominant orienta-tion of the nano pores in the AAO images. It is also capable ofdetermining the other dominant orientations of the nano pores.
This method alleviates the noise effect by a combination of thedata of two perpendicular orientations (x and y axes).
By using adaptive thresholding technique, this method eliminatesthe irregularity of image background intensity.
By using low-pass filtering, this method smoothes the variancesignal so the dominant domains are defined more precisely.
It is worth emphasizing two distinguishing features of ourethod: on one hand, it is a simple and fast method for deter-ining the ordering of SEM images. On the other hand, it has no
redetermined parameters and so its results are not dependent onnitial parameter settings.
This paper is organized as follows: In Section 2 the algorithmictructure of our method has been described. Then in Section 3 thereprocessing steps which will be used to increase the accuracyf the algorithm has been clarified. Section 4 describes the rownd column intensity signals and variance criteria of our methodhrough a well-structured image for more simplicity. Section 5xtends the idea and tackles the rotation problem of the image. Inhis section our algorithm will be able to define the dominant ori-ntation of the nano porous alumina oxide and reduce the noise.he concept of the high-pass filtering for smoothing the signal islso discussed in that section. This section also covers the result ofur algorithm on a real SEM image.
. Algorithmic structure of this work
In this section an algorithmic structure of this method will beresented briefly and then in the following sections each part wille explained in more details.
The steps of the proposed algorithm are as follows:
1) Histogram equalization is applied to the image to smooth thedistribution of gray-levels of the image.
2) Adaptive thresholding is applied to the image to eliminate the
irregularity of the image background yielding in a binary imagewhich shows the pores in black color.For every rotation angle � = 0–59 the following steps are carriedout
Science 259 (2012) 124– 134 125
(3) Every row of the image’s intensity is summed up and con-stitutes a row intensity signal (I�
y ) and also every columnof the image is also summed up and constitutes a columnintensity signal (I�
x ).(4) These two signals are normalized dividing to the length of
the row (or column).(5) The variance of (I�
x ), (I�y ) are calculated: var(I�
x ) and var(I�y ).
(6) For reduction of the noise, the average variance of both xaxis and shifted y axis is calculated by proper (30◦) orienta-tion shift
var(I�ave) = var(I�
y ) + var(I(�−30◦)x )
2(7) This average variance is smoothed by a low-pass filter to
show the peaks and the valleys of the signals (dominantorientation) more distinctively.
End(8) The maximum of the var(I�
ave) is calculated among these differ-ent values of the angles varmax(I�max
ave ).
Now, this criterion var(I�ave) will show the degree of the ordering
in the AAO image.
3. Preprocessing
For applying our algorithm in an AAO image some preprocessingsteps are needed. The capturing conditions of the AAO images arenot always the same. This fact causes dissimilarity among the gray-level distribution of a sequence of different AAO images. Histogramequalization, as a famous image processing technique [14], can beused to solve this problem to some extent. Histogram equalizationmaps the initial gray-level set to a new gray-level set (Fig. 1b) so thatthe new image has an equalized (uniformly distributed) histogram.As a result, all histogram equalized SEM images have nearly thesame histogram (gray-level distribution) and visually look alike.
Now in the histogram-equalized image the pores are more vis-ible than the original image but they have different gray-levels inthe [0 255] interval because there are still some background dis-similarities in the image.
Adaptive thresholding [14] is a useful method which has beenused here to eliminate the background dissimilarity.
In fact, in this method the image is smoothed by a low-pass fil-ter and the filtered image is used as the threshold. Therefore, thethreshold is not the same for different image pixels. Then the imagebefore smoothing is compared with the smoothed image pixel bypixel. The smoothed picture captures slight changes of the back-ground while rejecting the abrupt changes of gray-levels at porelocations. Therefore it could be used as a proper adaptive threshold.
Consequently, after applying this method a binary image whichshows the pores with black color more distinctively will remain(Fig. 1c).
4. Ordering criterion of a well-structured image
After the preprocessing step, the pore intensities in the AAOimages are nearly in the same scales and they are ready for latersteps.
Now it is worth to mention to idea of the paper briefly to havea general view of the following steps. Here we make use of somesynthetic images to better explain our strategy. After the clarifica-tion of some concepts of our algorithm, in the following sessions,the algorithm will be generalized and the subsequent problemsof these generalizations like rotation problem will be tackled. The
result of our algorithm on real SEM images will be shown there.Consider the image depicted in Fig. 3b. If the intensity values ofthe image are summed up on a family of straight parallel lines theresulting signal will explain the image structure to some extent
126 M. Pourfard, K. Faez / Applied Surface Science 259 (2012) 124– 134
Fig. 1. (a) An original image is an SEM image obtained from a long-range ordered anodic porous alumina formed in sulfuric acid at 25 V. (b) The result of the histogramequalization method on the original image. (c) A binary image which is the result of the adaptive thresholding method on (b).
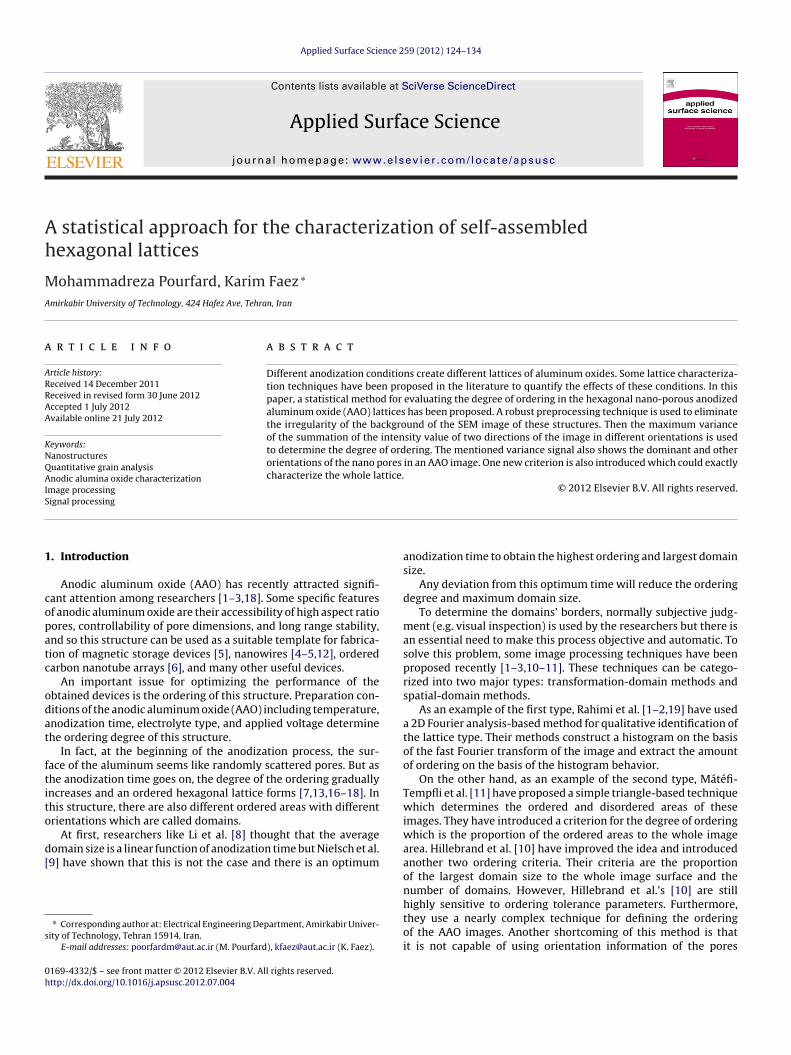
Fig. 2. The synthesis picture is constructed based on a hexagonal structure of the nano porous alumina structure. The direction of hexagons is in the x-direction because theangle of the rotation of these hexagons to the horizontal line is zero. In part (a), it is also clear that there are more pores in every row (6.5) than every column (4) becauseof the direction of the hexagons. Therefore, the row intensity signals will have higher peaks in rows than the columns. It is also observable that only for a few angles thedepicted straight line does not intersect with the pores � = (0◦ or 30◦). (b) It is shown that every hexagon is constructed from six equilateral triangles. It is also seen that bya 60◦/2 = 30◦ rotation of the figure, the pores are placed vertically and the y direction will intersect with more pores than any other direction (including x-direction). (c) Acompletely ordered AAO image is rotated on � angle. Therefore, none of the x and y intensity signals are placed on the direction on which most of the pores are placed. Theonly direction that experiences most of the pores is the � angle direction from the horizontal line.
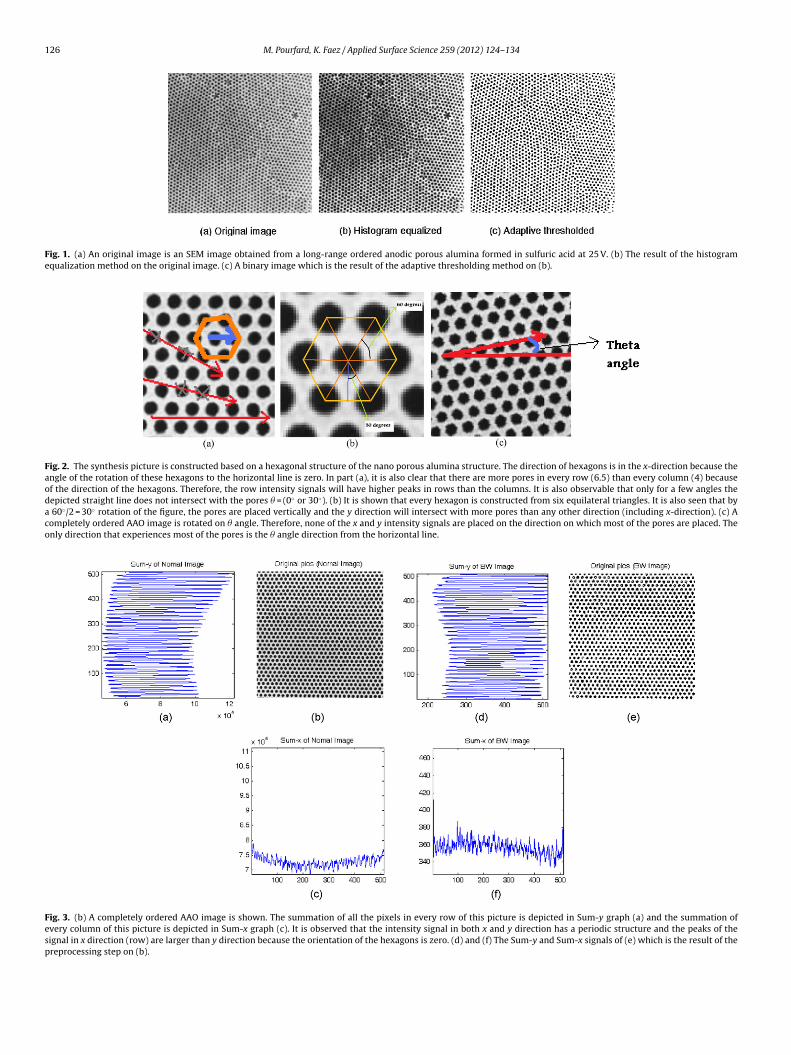
Fig. 3. (b) A completely ordered AAO image is shown. The summation of all the pixels in every row of this picture is depicted in Sum-y graph (a) and the summation ofevery column of this picture is depicted in Sum-x graph (c). It is observed that the intensity signal in both x and y direction has a periodic structure and the peaks of thesp
ignal in x direction (row) are larger than y direction because the orientation of the hexagreprocessing step on (b).ons is zero. (d) and (f) The Sum-y and Sum-x signals of (e) which is the result of the
urface
(sfltrsppc
atvt
e
s
4
ptotspt(
tasmtan1
ioo
icsFft
soontwc(
dtLoi
M. Pourfard, K. Faez / Applied S
Fig. 3a and d). In a special case if these lines are horizontal theummation intensity signal, I�=0◦
x experiences the most possibleuctuations (the x index indicates that the column summation ofhe image intensity is considered on x-direction and � shows theotation of the image versus a horizontal reference line). In thisignal the deepest valleys take place where the line crosses all theores in a straight horizontal line and most significant peaks takelace where the line crosses no pore at all. Clearly, this signal in aompletely ordered structure has a periodic pattern (Fig. 3a and c).
It is interesting to note that this special case takes place for � = 0◦
nd � = 60◦ where some lines cross zero pores and some other crosshe most possible pores (Fig. 2a). For every other values of � thealleys are of less depth and the peaks are of less height and hencehe signal experiences less fluctuations.
To measure the fluctuations we make use of a statistical param-ter which is the variance of the summation of the intensity signals.
In the next part the concept of the row and column intensityignals will be described.
.1. Row and column intensity signals
In a completely ordered AAO image, the centroids of everyore are in a straight line (Fig. 2). Therefore, if the summation ofhe intensity of pixels in every row is considered with a widthf one pixel, the resulting signal will experience some valleys inhe rows for which the centroids of the pores are placed in atraight line and it experiences some peaks in the row which islaced between the centroids of the two adjacent pores. Clearly,his signal has a periodic pattern in a completely ordered structureFig. 3a and c).
It is also observed that this periodic signal has a small bias andhe average of signal shifted up and down in column signal (or rightnd left in row signal). This fact is due to intentionally applied dis-imilarity in different parts of the synthetic AAO images to make itore similar to real SEM AAO images. It is also worthy to mention
hat one of the reasons that the preprocessing steps are used is tolleviate this problem, however it is observed that this problem isot completely solved (the signal has 150 bias in x direction and50 in y direction).
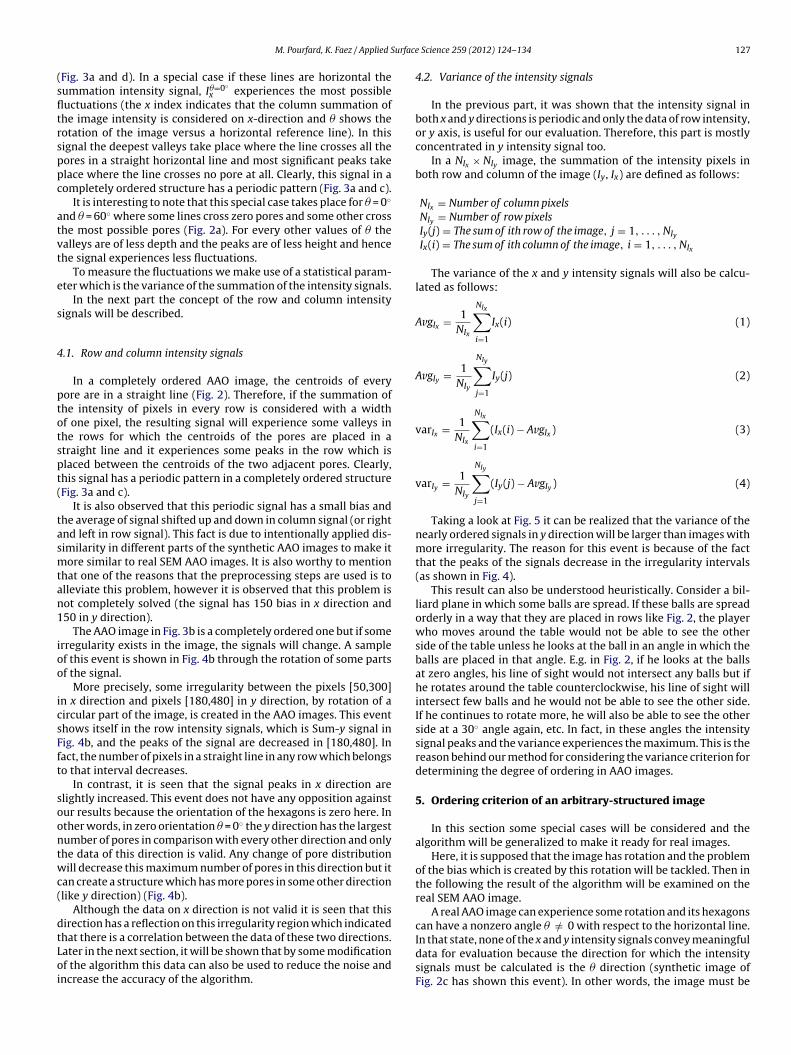
The AAO image in Fig. 3b is a completely ordered one but if somerregularity exists in the image, the signals will change. A samplef this event is shown in Fig. 4b through the rotation of some partsf the signal.
More precisely, some irregularity between the pixels [50,300]n x direction and pixels [180,480] in y direction, by rotation of aircular part of the image, is created in the AAO images. This eventhows itself in the row intensity signals, which is Sum-y signal inig. 4b, and the peaks of the signal are decreased in [180,480]. Inact, the number of pixels in a straight line in any row which belongso that interval decreases.
In contrast, it is seen that the signal peaks in x direction arelightly increased. This event does not have any opposition againstur results because the orientation of the hexagons is zero here. Inther words, in zero orientation � = 0◦ the y direction has the largestumber of pores in comparison with every other direction and onlyhe data of this direction is valid. Any change of pore distributionill decrease this maximum number of pores in this direction but it
an create a structure which has more pores in some other directionlike y direction) (Fig. 4b).
Although the data on x direction is not valid it is seen that thisirection has a reflection on this irregularity region which indicated
hat there is a correlation between the data of these two directions.ater in the next section, it will be shown that by some modificationf the algorithm this data can also be used to reduce the noise andncrease the accuracy of the algorithm.Science 259 (2012) 124– 134 127
4.2. Variance of the intensity signals
In the previous part, it was shown that the intensity signal inboth x and y directions is periodic and only the data of row intensity,or y axis, is useful for our evaluation. Therefore, this part is mostlyconcentrated in y intensity signal too.
In a NIx × NIy image, the summation of the intensity pixels inboth row and column of the image (Iy, Ix) are defined as follows:
NIx = Number of column pixelsNIy = Number of row pixelsIy(j) = The sum of ith row of the image, j = 1, . . . , NIyIx(i) = The sum of ith column of the image, i = 1, . . . , NIx
The variance of the x and y intensity signals will also be calcu-lated as follows:
AvgIx = 1NIx
NIx∑i=1
Ix(i) (1)
AvgIy = 1NIy
NIy∑j=1
Iy(j) (2)
varIx = 1NIx
NIx∑i=1
(Ix(i) − AvgIx ) (3)
varIy = 1NIy
NIy∑j=1
(Iy(j) − AvgIy ) (4)
Taking a look at Fig. 5 it can be realized that the variance of thenearly ordered signals in y direction will be larger than images withmore irregularity. The reason for this event is because of the factthat the peaks of the signals decrease in the irregularity intervals(as shown in Fig. 4).
This result can also be understood heuristically. Consider a bil-liard plane in which some balls are spread. If these balls are spreadorderly in a way that they are placed in rows like Fig. 2, the playerwho moves around the table would not be able to see the otherside of the table unless he looks at the ball in an angle in which theballs are placed in that angle. E.g. in Fig. 2, if he looks at the ballsat zero angles, his line of sight would not intersect any balls but ifhe rotates around the table counterclockwise, his line of sight willintersect few balls and he would not be able to see the other side.If he continues to rotate more, he will also be able to see the otherside at a 30◦ angle again, etc. In fact, in these angles the intensitysignal peaks and the variance experiences the maximum. This is thereason behind our method for considering the variance criterion fordetermining the degree of ordering in AAO images.
5. Ordering criterion of an arbitrary-structured image
In this section some special cases will be considered and thealgorithm will be generalized to make it ready for real images.
Here, it is supposed that the image has rotation and the problemof the bias which is created by this rotation will be tackled. Then inthe following the result of the algorithm will be examined on thereal SEM AAO image.
A real AAO image can experience some rotation and its hexagonscan have a nonzero angle � /= 0 with respect to the horizontal line.
In that state, none of the x and y intensity signals convey meaningfuldata for evaluation because the direction for which the intensitysignals must be calculated is the � direction (synthetic image ofFig. 2c has shown this event). In other words, the image must be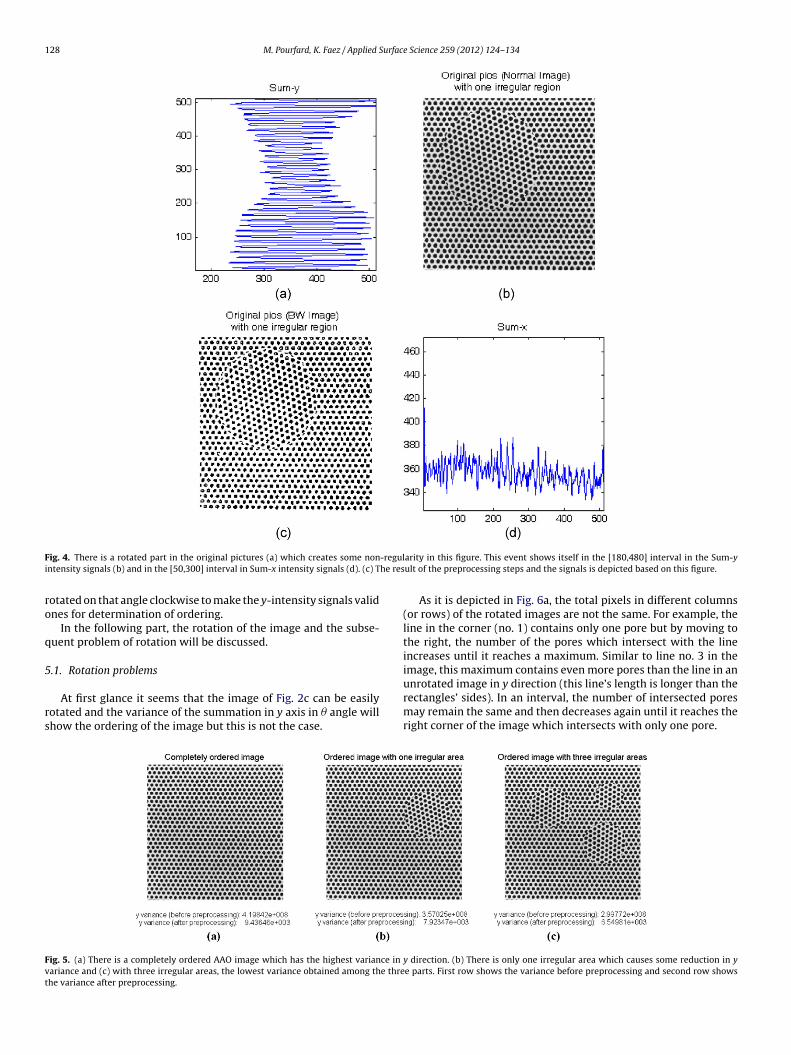
128 M. Pourfard, K. Faez / Applied Surface Science 259 (2012) 124– 134
F -reguli he res
ro
q
5
rs
Fvt
ig. 4. There is a rotated part in the original pictures (a) which creates some nonntensity signals (b) and in the [50,300] interval in Sum-x intensity signals (d). (c) T
otated on that angle clockwise to make the y-intensity signals validnes for determination of ordering.
In the following part, the rotation of the image and the subse-uent problem of rotation will be discussed.
.1. Rotation problems
At first glance it seems that the image of Fig. 2c can be easilyotated and the variance of the summation in y axis in � angle willhow the ordering of the image but this is not the case.
ig. 5. (a) There is a completely ordered AAO image which has the highest variance in
ariance and (c) with three irregular areas, the lowest variance obtained among the threhe variance after preprocessing.
arity in this figure. This event shows itself in the [180,480] interval in the Sum-yult of the preprocessing steps and the signals is depicted based on this figure.
As it is depicted in Fig. 6a, the total pixels in different columns(or rows) of the rotated images are not the same. For example, theline in the corner (no. 1) contains only one pore but by moving tothe right, the number of the pores which intersect with the lineincreases until it reaches a maximum. Similar to line no. 3 in theimage, this maximum contains even more pores than the line in an
unrotated image in y direction (this line’s length is longer than therectangles’ sides). In an interval, the number of intersected poresmay remain the same and then decreases again until it reaches theright corner of the image which intersects with only one pore.y direction. (b) There is only one irregular area which causes some reduction in ye parts. First row shows the variance before preprocessing and second row shows

M. Pourfard, K. Faez / Applied Surface Science 259 (2012) 124– 134 129
Fig. 6. There is a rotated image in (a). This image has only one pixel in the corners and as we move to the center, the number of pixels of the AAO image in the vertical lineincreases. In the middle we have the largest number of pixels (the length of this line is even longer than the square’s side). In this figure, line no. 2 is intersected with 14pores while line no. 3 is intersected with 32 pores so the intensity signals have different peaks in these different x coordinates. (b) There is a � angle rotated image. As wemove from the left of the image to the right the number of pixels on the line that is perpendicular to the movement of the direction varies. An attempt is made to formulizet
sfte
i
Ftvii
he number of pixels in y direction based on the pixel’s number in x direction.
This event causes the signal to have a bias and the skeleton of theignals comes up at the intermediate pixels of the image (Fig. 7b and). This bias wrongly increases the variance of the signal and makeshe variance criterion nearly invalid. Therefore it is necessary to
liminate this bias to have a proper valid signal.In the following a solution on the basis of the geometry of themage is proposed to solve this problem.
ig. 7. (c) A completely ordered image is rotated 30◦ . (b) and (f) The row and column’s ihe number of pores in every column and row are not constant. By normalization methoariance criterion can be applied on them. (d) The result of preprocessing on (c) and thentensity x (b) and y signals (f) are considered, it is clear that the Sum-x signal has a large pmage in that rotation are placed vertically and the y direction intersects with the largest
5.2. Geometric solution algorithm for the rotation problem
Here it is necessary to carry out some tasks on the intensitysignals of the rotated image to make it comparable to the intensity
signals of the unrotated image. If the number of pores in every row(or column) is normalized dividing to the total number of pixelsin that row, then the bias will be eliminated. The reason for thisntensity signals of the image, respectively. These two signals have biases becauseds, these biases are nearly eliminated and (a) and (e) have a very low bias and the
above mentioned signals are constructed based on this image. If the normalizedeak and reacts similar to the Sum-y signal of Fig. 3. This is because the pores of this
possible number of pores.

1 urfac
fe(cl
y
n
d
irTd
neat
toe
A
A
v
v
rFr
5
cwofi
Fgso
30 M. Pourfard, K. Faez / Applied S
act is that in a completely ordered image, the number of pores invery specific length of the image’s line in the direction of the porese.g. vertical or horizontal) is the same. In other words, there are aonstant number of pores in every unit of the row’s (or column’s)ength.
1 = min{d2 sin(�), d1 cos(�)} (5)
1 = d2
cos(�)(6)
= d2 sin(�) + d1 cos(�) (7)
if y ≤ y1 ⇒ n = n1
y1× y
if y1 ≤ y ≤ d − y1 ⇒ n = n1
if y ≥ d − y1 ⇒ n = n1
y1× (d − y1)
(8)
It is observable from Eq. (8) that the normalization factor will bencreased by the movement from the left (y = 0) of the image to theight (or from the bottom to the top) until it reaches a maximum.hen it remains constant in an interval (y1 ≤ y ≤ d). Afterwards, itecreases again until it reaches the right corner of the image (y = d).
y1 and n1 are known constants so it is necessary to calculate theumber of the vertical line’s pixels n (i.e. normalization factor) invery x coordinate (y1). It is also clear that the amount of increasingnd decreasing will not be the same for both x and y directions andhese biases will also be different in different orientation angles.
Now, if the intensity value of every row (or column) is divided byhe normalization factor of that row (or column), then the biasesf the signals will be eliminated. Therefore, Eqs. (1)–(4) must bedited based on this algorithm as shown below:
vgIy = 1NIx
NIy∑j=1
Iy(i)ny(i)
(9)
vgIy = 1NIx
NIy∑j=1
Iy(i)ny(i)
(10)
arIx = 1NIx
NIx∑i=1
(Ix(i)nx(i)
− AvgIx
)(11)
arIy = 1NIy
NIx∑j=1
(Iy(j)ny(j)
− AvgIy
)(12)
The result of applying this algorithm in an image with � = 30◦
otation is shown in Fig. 7a and e. It is observable that the bias ofig. 7b and f is nearly eliminated in these two figures so they areeady for calculation of the variance.
.3. Determination of the dominant orientation
In Fig. 8 two synthetic AAO images after applying the prepro-essing steps are considered. Fig. 8a is a completely ordered onehile Fig. 8b has one irregular region which is created by a rotation
f a circular region in the completely ordered ones with � = 20◦ (inact this irregular region is itself a regular region but it is irregularn comparison with the whole image).
The variance of the normalized y intensity signal is depicted in
ig. 8c and d for different rotations of the image. In both figures, thereatest peak belongs to � = 3◦ but in Fig. 8d, there is also anothermall peak in � = 23◦. These two peaks coincide with two dominantrientations of the pores of the AAO image of Fig. 8b. These resultse Science 259 (2012) 124– 134
prove that our method is capable of determining the different ori-entations of the AAO images through a normalized variance signal.In other words, by rotating the image in different angles, the nor-malized variance signal reacts to the different orientations of thepores and has a peak on dominant orientations.
5.4. Reduction of the noise by using two directions’ data
Another appealing result that is also observable in this figure isthat it seems that the normalized variance x intensity signal alsopursues the changes of the normalized variance y intensity signalwith some delays. These two signals have a 30◦ phase difference.
This event can also be proven by meticulous attention to thestructure of the completely ordered AAO image. In fact, in a com-pletely ordered AAO image, the pores have a hexagonal structure(Fig. 1b). Every hexagon is constituted from six equilateral trian-gles. Therefore, if the image is rotated 60◦/2 = 30◦, the resultingimage will be exactly the same as the unrotated ones because thehexagons will be placed in the same direction as before.
This event is shown in Fig. 7. In that figure which is the 30◦
rotated image of Fig. 3, the normalized x intensity signal has thesame peaks as the normalized y intensity signal of Fig. 3 becausein that rotation, the pores number in a unit interval of the verticaldirection is larger than other directions. Fig. 7e and f also confirmsthis result in another view. In this figure, it is observed that thenormalized variance x intensity signal is a 30◦ shifted version of thenormalized variance x intensity signal. In other words, variations ofthese signals coincide with each other only with some delay and ifone signal shifted 30◦, they would have the same peaks in the sameangles.
Therefore, it is appropriate to use the data of both x and y sig-nals simultaneously and use their average instead of a single oneto decrease the noise and to increase the accuracy of the variancesignal.
In mathematical sense, this fact can be rephrased as below.If normalized y intensity variance is shown by var(I�
y ), then thefollowing proportion stands:For every angle �:
var(I�y ) ∝ var(I(�−30◦)
x ) ∝ var(I�ave) = var(I�
y ) + var(I(�−30◦)x )
2(13)
It is also clear that the proportion symbol (∝) of Eq. (13) can bechanged to the equal symbol (=) if the AAO image is a completelyordered one with a quadratic structure. But it does not have anyinfluence on our final conclusion because it does not change thetwo important outputs of the image which are the value of theangles of the dominant orientation of the image and the relativemagnitude of the peak’s value.
5.5. Peaks value versus dominant orientation numbers
It is also clear that in a totally ordered AAO image like Fig. 8a,the peaks of the average normalized variance will be larger thanthe non-ordered ones (Fig. 8b) because there is only one dominantorientation. In Fig. 8g which is the variance of a completely orderedimage, the largest peak has a magnitude of 0.04487 while the peakin Fig. 8h which is the variance of a semi-ordered image has a mag-nitude of 0.03049. Therefore, this fact can be used to model thedegree of ordering of an AAO image.
Consequently, the degree of ordering of an AAO image can bemodeled in mathematical form as below:
�max = {arg max�(varave(I�)) for � = 0–59} (14)
varave(I�) ∝ Degree of ordering of an AAO image (15)
Eqs. (14) and (15) indicate that for determining the degree ofordering of an AAO image, they must be rotated from � = 0–59 and in

M. Pourfard, K. Faez / Applied Surface Science 259 (2012) 124– 134 131
F of thiy le. Vaa e ave
esaotoha
5
a
ig. 8. (a) There is a completely ordered synthesis image and (b) one circular region signals (c and d) react to the orientation angle of this region and peak in that angverage of both normalized x and y variance signals is also depicted in (g) and (h). Th
very angle the average variance of both the x direction and the 30◦
hifted y direction is calculated. The maximum of this average vari-nce is the degree of ordering and the angle in which this varianceccurs is the dominant orientation of the pores. It is also obvioushat the other dominant pore orientations of the AAO image are thether largest peaks of the variance graph and therefore our methodas been able to determine the dominant domains orientations inddition to the degree of ordering.
.6. Smoothing the variance signal with high-pass filter
Now it is also possible to make the output of our method moreccurate. The variance signal has some small oscillations (Fig. 8g
s image is rotated and has created an image with one irregular region. The varianceriance x signals also pursue these changes by a 30◦ phase difference (e and f). Therage the normalized variance of the normalized x and y is also depicted in (i) and (j).
and h) which are created because of the remaining dissimilarityof the background. If this signal is filtered with a high-pass filterwith a hamming window of n = 6 [15] then the smoothed versionof the signal (Fig. 8i and j) will remain which shows the dominantorientation of the signals more precisely.
6. Experimental results on a real AAO image
Up to now, our algorithm was applied to some synthetic
images which mimic the behavior of real AAO images (disorder-ing, background dissimilarity, and orientation variation). Now inFigs. 9 and 10a the results of our algorithm on some real SEM AAOimages are demonstrated.
132 M. Pourfard, K. Faez / Applied Surface Science 259 (2012) 124– 134
F fferenT iance
tdt(aa
ig. 9. The result of applying our algorithm on three different AAO images with dihe dominant orientation of this figure is also observable from the peaks of the var
Fig. 9 shows a real complicated image which is more difficulto evaluate its ordering visually. In parts (a) and (b) of Fig. 9, twoifferent AAO images are considered in which (a) is more ordered
han the other. In (a) lots of domains are detectable visually but inb) much more domains are detectable which none of them are nots large as (a). Our results also coincide to these visual judgmentsnd Fig. 9c has lager maximum value of variance than Fig. 9d.t irregularities before and after preprocessing with or without high-pass filtering.signal.
It is also seen that the result of our method on an original imagebefore preprocessing (Fig. 9g and h) has lots of oscillation and it isso hard to determine the orientations of the images. Application of
the high-pass filtering lowers these oscillations but they are stilllots of oscillation remained (Fig. 9i and j). But if the preprocessingstep is done on the original image then the BW image has loweroscillation than before (Fig 9c and d). Application of the high-pass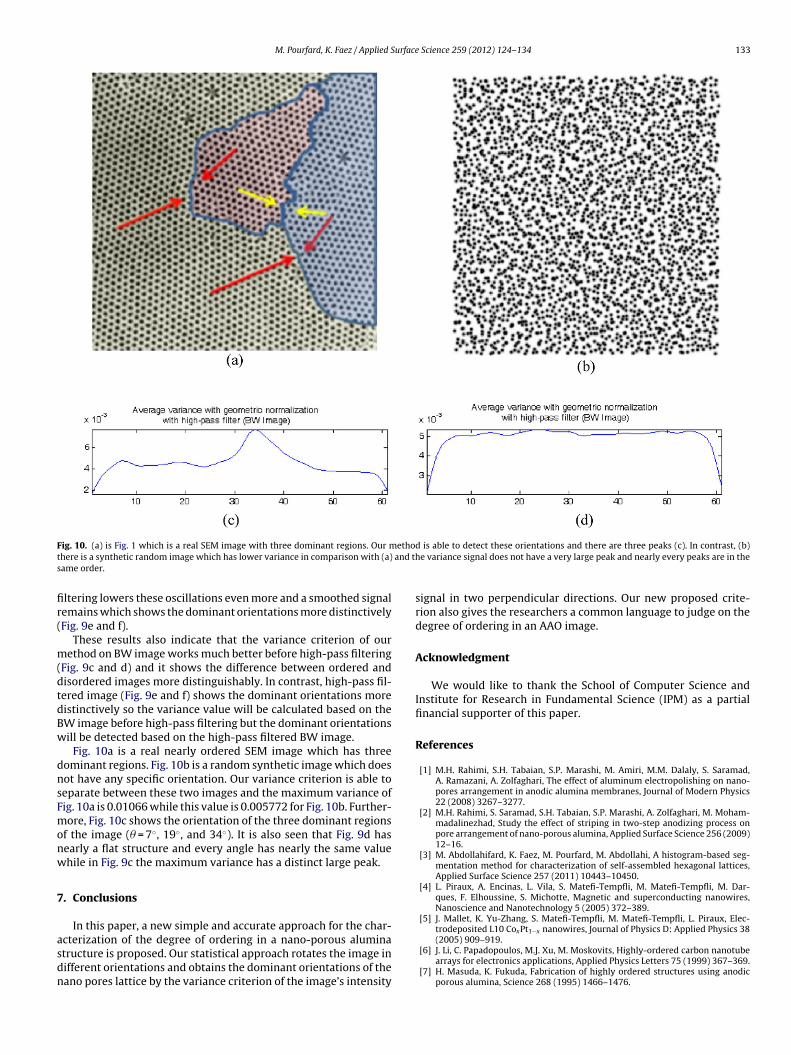
M. Pourfard, K. Faez / Applied Surface Science 259 (2012) 124– 134 133
F ethot and ts
fir(
m(dtdBw
dnsFmonw
7
asdn
ig. 10. (a) is Fig. 1 which is a real SEM image with three dominant regions. Our mhere is a synthetic random image which has lower variance in comparison with (a)ame order.
ltering lowers these oscillations even more and a smoothed signalemains which shows the dominant orientations more distinctivelyFig. 9e and f).
These results also indicate that the variance criterion of ourethod on BW image works much better before high-pass filtering
Fig. 9c and d) and it shows the difference between ordered andisordered images more distinguishably. In contrast, high-pass fil-ered image (Fig. 9e and f) shows the dominant orientations moreistinctively so the variance value will be calculated based on theW image before high-pass filtering but the dominant orientationsill be detected based on the high-pass filtered BW image.
Fig. 10a is a real nearly ordered SEM image which has threeominant regions. Fig. 10b is a random synthetic image which doesot have any specific orientation. Our variance criterion is able toeparate between these two images and the maximum variance ofig. 10a is 0.01066 while this value is 0.005772 for Fig. 10b. Further-ore, Fig. 10c shows the orientation of the three dominant regions
f the image (� = 7◦, 19◦, and 34◦). It is also seen that Fig. 9d hasearly a flat structure and every angle has nearly the same valuehile in Fig. 9c the maximum variance has a distinct large peak.
. Conclusions
In this paper, a new simple and accurate approach for the char-
cterization of the degree of ordering in a nano-porous aluminatructure is proposed. Our statistical approach rotates the image inifferent orientations and obtains the dominant orientations of theano pores lattice by the variance criterion of the image’s intensityd is able to detect these orientations and there are three peaks (c). In contrast, (b)he variance signal does not have a very large peak and nearly every peaks are in the
signal in two perpendicular directions. Our new proposed crite-rion also gives the researchers a common language to judge on thedegree of ordering in an AAO image.
Acknowledgment
We would like to thank the School of Computer Science andInstitute for Research in Fundamental Science (IPM) as a partialfinancial supporter of this paper.
References
[1] M.H. Rahimi, S.H. Tabaian, S.P. Marashi, M. Amiri, M.M. Dalaly, S. Saramad,A. Ramazani, A. Zolfaghari, The effect of aluminum electropolishing on nano-pores arrangement in anodic alumina membranes, Journal of Modern Physics22 (2008) 3267–3277.
[2] M.H. Rahimi, S. Saramad, S.H. Tabaian, S.P. Marashi, A. Zolfaghari, M. Moham-madalinezhad, Study the effect of striping in two-step anodizing process onpore arrangement of nano-porous alumina, Applied Surface Science 256 (2009)12–16.
[3] M. Abdollahifard, K. Faez, M. Pourfard, M. Abdollahi, A histogram-based seg-mentation method for characterization of self-assembled hexagonal lattices,Applied Surface Science 257 (2011) 10443–10450.
[4] L. Piraux, A. Encinas, L. Vila, S. Matefi-Tempfli, M. Matefi-Tempfli, M. Dar-ques, F. Elhoussine, S. Michotte, Magnetic and superconducting nanowires,Nanoscience and Nanotechnology 5 (2005) 372–389.
[5] J. Mallet, K. Yu-Zhang, S. Matefi-Tempfli, M. Matefi-Tempfli, L. Piraux, Elec-trodeposited L10 CoxPt1−x nanowires, Journal of Physics D: Applied Physics 38
(2005) 909–919.[6] J. Li, C. Papadopoulos, M.J. Xu, M. Moskovits, Highly-ordered carbon nanotubearrays for electronics applications, Applied Physics Letters 75 (1999) 367–369.
[7] H. Masuda, K. Fukuda, Fabrication of highly ordered structures using anodicporous alumina, Science 268 (1995) 1466–1476.
1 urfac
[
[
[
[
[
[
[
[
[
34 M. Pourfard, K. Faez / Applied S
[8] F. Li, L. Zhang, R.M. Metzger, On the growth of highly ordered pores in anodizedaluminum oxide, Chemistry of Materials 10 (1998) 2470–2480.
[9] K. Nielsch, J. Choi, K. Schwirn, R.B. Wehrspohn, U. Gösele, Self-ordering regimesof porous alumina: the 10 porosity rule, Nano Letters 2 (2002) 677–680.
10] R. Hillebrand, F. Mller, K. Schwirn, W. Lee, M. Steinhart, Quantitative analysis ofthe grain morphology in self-assembled hexagonal lattices, ACS Nano 2 (2008)913–920.
11] S. Mátéfi-Tempfli, M. Mátéfi-Tempfli, L. Piraux, Characterization of nanoporesordering in anodic alumina, Thin Solid Films 516 (2008) 3735–3740.
12] K. Nielsch, R.B. Wehrspohn, J. Barthel, J. Kirschner, U. Gösele, S.F. Fischer, H. Kro-nmüller, Hexagonally ordered 100 nm period nickel nanowire arrays, Applied
Physics Letters 79 (2001) 1360–1362.13] J. Choi, K. Nielsch, M. Reiche, R.B. Wehrspohn, U. Gosele, Fabrication of mon-odomain alumina pore arrays with an interpore distance smaller than thelattice constant of the imprint stamp, Vacuum Science and Technology 21(2003) 763–766.
[
e Science 259 (2012) 124– 134
14] R.C. Gonzalez, R.E. Woods, S. Eddins, Digital Image Processing, 3rd ed., PrenticeHall, 2008.
15] A.V. Oppenheim, R.W. Schafer, J.R. Buck, Discrete-Time Signal Processing, Pren-tice Hall, 1999.
16] J.F. Behnke, T. Sands, Bimodal spatial distribution of pores in anodically oxidizedaluminum thin films, Applies Physics (2000) 6875.
17] A.C. Gâlca, E.S. Kooij, H. Wormeester, C. Salm, V. Leca, J.H. Rector, B. Poelsema,Optical anisotropy, porosity of anodic aluminum oxide characterized byspectroscopic ellipsometry, Electrochemical and Solid-State Letters 6 (2003)B52–B54.
18] S. Massou, L. Masson, I. Ozerov, E. Moyen, K. Sengupta, M. Hanbucken, Large
scale ordered topographical and chemical nano-features from anodic aluminatemplates, Applied Surface Science 256 (2009) 395–398.19] M.H. Rahimi, S.H. Tabaian, S.P.H. Marashi, S. Saramad, M. Arab, A. Hemasian,Heat treatment of aluminum in preparing porous anodic alumina templates,Micro & Nano Letters 7 (2011) 125–129.