Lattice spacing trends in close-packed hexagonal phases ...
9
HAL Id: jpa-00236655 https://hal.archives-ouvertes.fr/jpa-00236655 Submitted on 1 Jan 1962 HAL is a multi-disciplinary open access archive for the deposit and dissemination of sci- entific research documents, whether they are pub- lished or not. The documents may come from teaching and research institutions in France or abroad, or from public or private research centers. L’archive ouverte pluridisciplinaire HAL, est destinée au dépôt et à la diffusion de documents scientifiques de niveau recherche, publiés ou non, émanant des établissements d’enseignement et de recherche français ou étrangers, des laboratoires publics ou privés. Lattice spacing trends in close-packed hexagonal phases based on the noble metals T.B. Massalski To cite this version: T.B. Massalski. Lattice spacing trends in close-packed hexagonal phases based on the noble metals. J. Phys. Radium, 1962, 23 (10), pp.647-654. 10.1051/jphysrad:019620023010064701. jpa-00236655
-
Upload
khangminh22 -
Category
Documents
-
view
4 -
download
0
Transcript of Lattice spacing trends in close-packed hexagonal phases ...

HAL Id: jpa-00236655https://hal.archives-ouvertes.fr/jpa-00236655
Submitted on 1 Jan 1962
HAL is a multi-disciplinary open accessarchive for the deposit and dissemination of sci-entific research documents, whether they are pub-lished or not. The documents may come fromteaching and research institutions in France orabroad, or from public or private research centers.
L’archive ouverte pluridisciplinaire HAL, estdestinée au dépôt et à la diffusion de documentsscientifiques de niveau recherche, publiés ou non,émanant des établissements d’enseignement et derecherche français ou étrangers, des laboratoirespublics ou privés.
Lattice spacing trends in close-packed hexagonal phasesbased on the noble metals
T.B. Massalski
To cite this version:T.B. Massalski. Lattice spacing trends in close-packed hexagonal phases based on the noble metals.J. Phys. Radium, 1962, 23 (10), pp.647-654. �10.1051/jphysrad:019620023010064701�. �jpa-00236655�

647
and ionic and covalent character become possible.What happens as the area of the Fermi surfacedecreases is that the range of distance over which
. metallic screening occurs increases. Thus in asemimetal with a very small Fermi surface, onemight have a net charge, in a covalent bond loca-lized on anatomic scale which is surrounded by aneutraliziny.cloud with a radius of order a hundredatomic separations. Thus in principle, the theorem
holds for se’1limetals, but becàuse of the longscreening radius there is a greater re3e nblance toan insulator than to a metal as regards ionic or covalent character.
Aeknowledgement. -- I am very grateful toDr. Walter A. Harrison for searching criticism of ,
the Hartree calculations and to Prof. J. C, Phillips for general discussions. n
REFERENCES AND FOOTNOTES -
[1] GELL-MANN (M.) and BRUECKNER (K. A.), Phys. Rev.,1957, 106, 364.
[2] HUBBARD (J.), Proc. Roy. Soc., London, 1957, A 240,539; 1958, A 243, 336 ; 1958, A 244,199.
[3] PHILLIPS (J. C.) and KLEINMAN (L.), Phys. Rev., 1959,116, 287. KLEINMAN (L.) and PHILLIPS (J. C.), Phys.Rev., 1959, 116, 880; 1960, 117, 460 ; 1960, 118,1153. PHILLIPS (J. C.), J. Phys. Chem. Solids, 1959,11, 226.
[4] COHEN (M. H.) and HEINE (V.), Phys. Rev., 1961,122,1821.
[5] NOZIÈRES (P.) and PINES (D.), Nuovo Cimento [X],1958, 9, 470,
[6] EHRENREICH (H.) and COHEN (M. H.), Phys. Rev.1959,115, 786.
[7] Such a separation is not possible for the transitionmetals, the rare earth metals, and the actinides, andis marginal for the noble metals.
[8] Their work (ref. 3) has been generalized to includemany-body effects by BASSANI, GOODMAN, ROBIN-SON and SCHRIEFFER, Phys. Rev. (in press).
[9] COHEN (M. H.) and PHILLIPS (J. C.), Phys. Rev., 1961,124,1818.
[10] PHILLIPS (J. C.), Phys. Rev., 1961, 123, 420. [11] PHILLIPS (J. C.) and KLEINMAN (L.), Phys. Rev.
(in press).
LATTICE SPACING TRENDS IN CLOSE-PACKED HEXAGONAL PHASES BASED ON THE NOBLE METALS
By T. B. MASSALSKI.Mellon Intitute, Pittsburgh 13, Pennsylvania, U. S. A.
Résumé. - La variation des paramètres cristallins et du rapport e/a dans les alliages hexa-gonaux compacts de métaux nobles a été étudiée en détail, avec des méthodes de haute precision, sur tous les exemples connus. On trouve une corrélation remarquable entre les résultats experi-mentaux d’une part, la concentration en électrons et la zone de Brillouin d’autre part. Les phaseshexagonales examinées forment trois groupes, chacun ayant un comportement caractéristique ence qui concerne le rapport e/a, le volume atomique et les écarts par rapport à la linéarité. L’appa-rition d’un contact entre la surface de Fermi et les faces {10.0} et {00.2} de la zone de Brillouinpeut être détectée avec précision, et un modèle simple permet d’estimer les intervalles entre bandesdans la zone. Les valeurs obtenues sont comprises entre 0,5 et 1 eV, selon le rapport e/a, la concen-tration en électrons et la nature du solute.
Abstract. 2014 The changes of lattice spacings and of the axial ratio in h. c. p. intermediate phases based on the noble metals constitute an interesting chapter in the theory of alloys. We have recen-tly completed the survey of the lattice spacings of all known h.c.p. phases which belong to thisgroup using high precision methods and the results show a very remarkable correlation with theelectron concentration and the Brillouin zone. The investigated h.c.p. phases fall naturallyinto three distinct groups each showing a characteristic behaviour in terms of axial ratio, volumeper atom, and systematic deviations from linearity. Onset of overlap of electrons across the
{10.0} and {00.2} sets of Brillouin zone faces can be detected with high accuracy in terms ofelectron concentration and the use of a simple electron theory permits one to evaluate approximatevalues of the band gaps in the zone. The obtained values range between 0.5-1.0 eV dependingon the axial ratio, the electron concentration and the nature of the alloying elements. Theseand other details will be discussed.
LE JOURNAL DE PHYSIQUE ET LE RADIUM , TOME 23, OCTOBRE 1962,
Some thirty years ago Jones [1] interpreted thechanges with composition of lattice spacings ofthe E and n phases in the Cu-Zn system in terms ofoverlaps of electrons across the Brillouin zone. At
that time the available data consisted of only afew points in the Cu-Zn system and was non-
existent for other similar syste ns. By now thélattice spacings of all phases which possess the close-
Article published online by EDP Sciences and available at http://dx.doi.org/10.1051/jphysrad:019620023010064701

648
packed hexagonal structure in binary systemsbased on the noble metals (Cu, Ag, Au) have beenmeasured with a high degree of accuracy and theyreveal a very striking and interesting picture. The
purpose of this paper is to summarize the availabledata and to discuss the possible interpretations.The typical phases with thé close-packed hexa-
gonal (h,c.p.) structure may be conveniently divi-ded into three natural groups which are denoted bythe Greek symbols 03B6, E and ~ according to theiraxial ratio (c/a), lattice spacing trends, electronconcentration (e/a) and solute content. The rangeof stability in terms of e/a of all known 03B6, é and -1phases are shown in figure 1. In this figure are
FiG. 1. - Ranges of maximum stability of the oc, 03B6, e and -1 phases in termsof electron concentration (after Massalski and King [2]).
also included the ranges of stability of the corres-ponding a phases which are terminal solid solutionswith the face-centred cubic (f.c.c.) structure andwhich are of interest in connection with the trendsin the lattice spacings of the h.c.p. phases. Thechanges of the axial ratio with e ja in the h.c.p.phases listed in figure 1 are shown in figure 2.
The 03B6 phases follow the oc terminal solutions andoccur within the e la range between 1.22 and 1.83.Their axial ratios lie relatively close to the idealvalue for the close-packing of spheres
and they decrease with increases of e/a. The e and1) phases always contain zinc or cadmium as themajor constituent. The axial ratios of the 03B6 phasesfall below the ideal value, in the region of
decreasing initially with e/a and showing an
increase near zinc-, or cadmium-rich boundaries.The q phases are terminal solid solutions based onzinc or cadmium. Their initial axial ratios lieconsiderably above the ideal value of 1.633 andthey increase with increasing e ja towards thevalues of pure zinc (cla = 1.8563) or pure cad-mium (cla = 1.8859).
In order to emphasize certain characteristictrends in the lattice spacings in each group ofh.c.p. phases it is convenient to compare the03B6 phases with the oc terminal solid solutions whichprecede them in the respective phase diagramsand to compare the e phases with the q terminalsolid solutions which follow them in the respectivephase diagrammes. This is illustrated diagrama-tically in figure 3 in which the phase fields aredrawn with the characteristic shapes usuallyobserved.To a first approximation the structure of the a
and 03B6 phases are very similar, differing only in thestacking of the elosest-packed planes. Therefore,it can be assumed that the contributions to thechanges of lattice spacings from such factors as thedifférence in atomic sizes, electrochemical inter-actions, etc., should vary in a smooth and conti-nuous manner across through a and 03B6 phases.Any specific deviation may be attributed to thechange of structure between the two phases andhence to the change in the Brillouin zone and, rela-ted to it, a change in the possible interactionsbetween the Fermi surface and the Brillouin zone.The characteristic features in the general trends
with composition in the a spacings of the 03B6 phases

649
FIG. 2. - Changes of axial ratio (c/a) with electron concentration (e/a) in the 03B6, E and 7] phases(after Massalski and King [7]).
FIG. 3. - Characteristic positions of the phase diagrammea) in the oc - 03B6 region of systems based on the noblemetals and b) in the e - ui region of systems based onzinc or cadmium.
FIG. 4. - The Da’ and Aa deviations in the ( phasesbased on the noble metals (after Massalski and King [9]).

650
are illustrated in figure 4. These trends are parti-cularly clear if the lattice spacings within the ter-minal solid solutions (1) are plotted together(marked a’) with the corresponding a spacings inthe 03B6 phases. Ag-based systems are represented ,by the Ag-Sn system, Cu-based systems by the Cu-Ge system and Au-based systems by the Au-Snsystem. An initial contraction, 1Ya’ may be obser-ved in the closest packed spacings on passingfrom f.c.c. to the h.c.p. structure. This contrac-tion increases depending on the solvent in theorder Ag Cu Au. For each group ôf systemsbased on one solvent the 0394a’ contraction is foundto be nearly the same. -
By contrast the values of mean volume peratom change smoothly from the oc to the 03B6phases, the values in the 03B6 phases falling almostexactly on the values extrapolated from the corres-ponding a terminal solid solutions. A typicaltrend may be illustrated by the data for the Au-Snsystem as shown in figure 5. It may be seen that
FIG. 5. - Lattice spacing trands in a and 03B6 phases in thesystem Au-Sn (after Massalski and King [5]).
the 1Ya’ contraction occurs at nearly constantvolume per atom ; and hence a complementaryexpansion, Ac’, may be expected to exist in thec spacings. This is revealed (see fig. 5) by com-paring the c spacings in the 03B6 phases with hypo-thetical c’ spacings ïn a alloys derived by multi-
(1) For this purpose the cubic a spacings are dividedby B/2B so that a direct comparison can be made betweenthe closest distance of approach of atoms in the {111}planes of the f.c.c. structure - and the equivalent closestdistance of approach of atoms in the {oo. 2 } planes ofthe h.c.p. structure, a’ = 1 IV2- - ai. 0,. c. c" = 2/V3 .af:c.c..
plying the. a’ spacings by the ideal axial ratio.Accompanying the 1Yc’ increase and the 1Ya’ de-crease in the 03B6 phases’are the initial higher-than-ideal values of the axial ratio. The detailed trendsin the axial ratio in all phases are shown in figure 6.Corresponding to the 1Yc’ and 1Ya’ deviations the
FIG. 6. - Changes of axial ratio with electron concen-tration in 03B6 phases based on the noble metals (afterKing and Massalski [6]).
initial c ja is highest in Au-based systems anddecreases in the order Au > Cu > Ag.
In addition to the a’ decrease and the c’ increasedescribed above an accelerated increase (marked 0394ain figures 2 and 5) occurs in the a spacings in eachgroup of03B6 phases based on a common solvent at asurprizingly narrow range of ela. The actualvalues of ela appear to be characteristic of eachnoble métal falling in the range e/a =: 1. 415-1.43 ;1.39-1.40 and 1.35-1.36 for alloys based on Cu,Ag and Au respectively [2]. In the range of the Aadeviation the volume per atom trends indicate aslight departure towards higher values from thesmooth curves extrapolated from the terminal solidsolutions. This may be seen in figure 7 in whichthe lattice spacings in all ot and t phases based onsilver are plotted together arranged to follow theplan of the periodic table for the B-subgroup cle-ments which follow silver. The inclusion of both aand t lattice spacings trends in figure 7 clearlyshows that the Aa deviation occurs in all 03B6 phasesirrespective of whether the genera.l trend of thelattice spacings is to decrease with e/a or to increasewith e ja.The slight increase of the volume per atom in the
region of the da déviation is insufficient to compen-sate the total change in the a spacings and hencea compensating decrease in the c spacing may beobserved... The characteristic trend in the behavior of the
, .lattice spacings in the e and -1 phases may be illus- .

651
FIG. 7. - Lattice spacing trands in oc and y phases based on silver (after King and Massalski [6]).
trated with reference to the système Ag-Zn andAu-Zn as shown in figure 8. Thé data for the oc
phases is again included for comparison. The exis-tence of the Aa deviation, similar to the Aa devia-tion observed in the 03B6 phases, is clearly evidentwithin the entire range of thé e phases when com-parison is made between the lattice spacings of aand 03B6 phases. The volume per atom deviation,from a line extrapolated from the a phases, ishowever now quite pronounced. Another strikingfeature of the s phases is an accelerated increase inthe c spacings (marked Aci in figure 8) observednear the Zn-rich boundaries of. thé s phases.These increases in the c spacings cause a reversalin the trend of the axial ratio in thé s phases from adecrease to an increase. This is illustrated in fi-
gure 9 for the four known s phases. Judging by thedata in figure 9 the initial values of e/a at which adeviation of the axial ratio (resulting from the Aceexpansion) becomes noticeable occurs slightlyabove e/a ~ 1.8 and increases in the order
It is of interest to note that within the r phases thevolume trends indicate a further positive déviationfrom the original line extrapolated from the ce
phases. At the same time the increase in thé c spa-cings in thé 7) phases, and the decrease in the aspacings, occur at higher rateû than those indicatedby similar trends near the Zn-rich boundaries ofthe c phases (see fig. 8). The interpretation of some of the above data
supplelnents and extends the original suggestion’byJones [1] that overlaps of électrons across theBrillouin zone discontinuities exist in the e and1) phases and that they are responsible for thebehavior of the lattice spacings. The presentlysummarized data permits one to locate the onset ofthe overlaps in terms o.f e/a and it throws addi-tional light upon the relationship between the lat-tice spacings and the band structure..A vertical and horizontal section through the
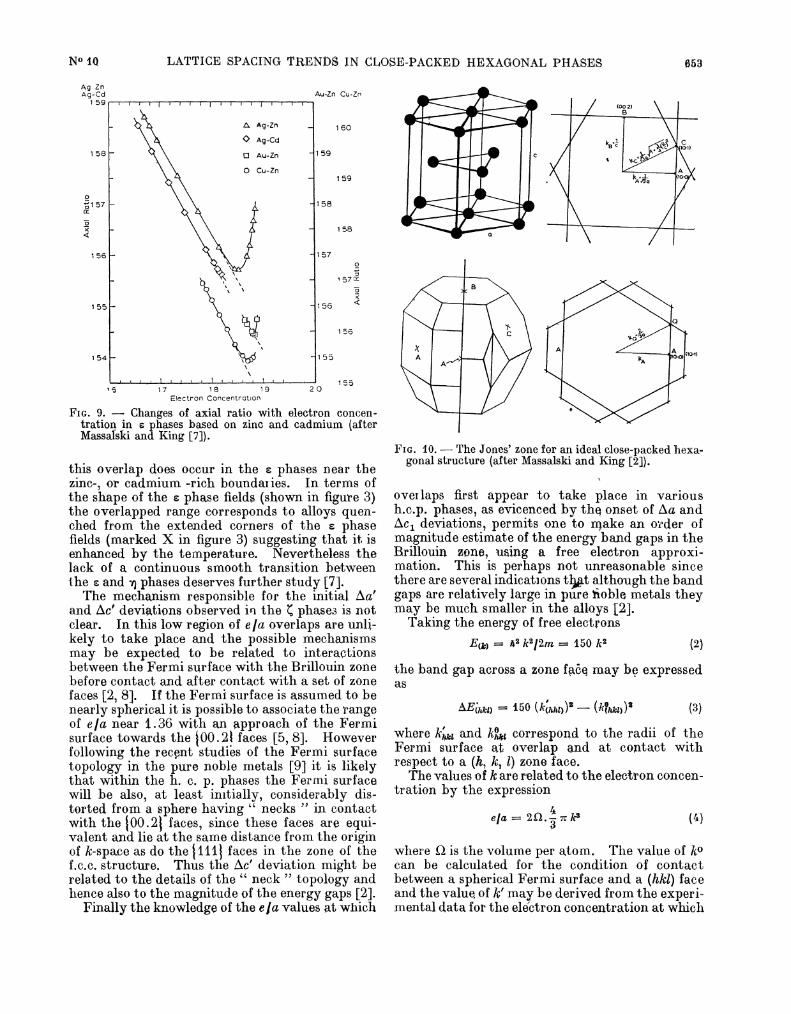
energy zone suggested by Jones [1] is. shown infigure 10. This zone is bounded by 20 faces : 6 ofthe 110.61 type (the A faces), 2 of the JOO.21

652
FIG. 8. - Lattice spacing trends in oc, e and 7) phases (after Massalski and King [7]).
type (the B faces) and 12 of the f 10.1 } type(the C faces). The number of states per atom, n,enclosed within the inner zone (without the domesproduced by the intersection of the C fa,ces) is givenby
The values of n for 03B6 phases with ideal axial ratioand for thé e phasmes with cla = 1.55 are 1.745and 1.721 respectively, [2] but since the zone isincomplete [3] overlaps may occur at much lowervalues of ela. Following Jones it may be assumedthat overlaps produce a net electron stress tendingto distort the Brillouin zone and that any changein the zone shape should be reflected by a corres-ponding change in the lattice spacings in real spacein directions opposite to the displacement of thezone faces. If the volume remains constant, a
positive deviation say in the a direction [11.0]must be compensated by a negative deviation inthe c direction [Ô0.2].The Da deviation in both the t and s phases may
be taken as evidence of the f 10. O} (across theA faces) overlap [4-6]. The available data suggeststhat this overlap first occurs in the region of the tphases at relatively low values of e/a between 1. 36and 1.4 [2]. This is not suprizing since the con-tact between a spherical Fermi surface and the
10 . 0 } f aces of the zone would occur at e Ja ~ 1.14.The trends in the lattice spacings in the Ag-Cd
system, where both the 03B6 and s phases are stable,suggests that, once started, the influence of the( 10 .0 ) } overlap is about the same in both ( ande phases. However the rate at which the a spa-cings expand in différent systems (as measured byAal(a -Lla) [2}) changes from one system to ano-ther and appears to be dependent on additionalfactors such as the magnitude of band gaps in theBrillouin zone, elastic constants, etc. [2].The reason for the existence of a two-phase
region between the e and -1 phases in the Cu-Znsystem, both of which posses the h.c.p. structure,has been attributed by Jones [1] to the lack oftao.21 overlap in tbe E phases. The interpreta-tion of the Ac, deviation suggests however that
653
FIG. 9. - Changes of axial ratio with electron concen-tration in e phases based on zinc and cadmium (afterMassafski and King [7]).
this overlap does occur in the s phases near thezinc-, or cadmium -rich boundar ies. In terms ofthe shape of the e phase fields (shown in figure 3)the overlapped range corresponds to alloys quen-ched from the extended corners of the e phasefields (marked X in figure 3) suggesting that it isenhanced by the température. Nevertheless thelack of a continuous smooth transition betweenthe s and -n phases deserves further study [7].The mechanism responsible for the initial Aa’
and Ac’ deviations observed ia the ( phases is notclear. In this low region of ela overlaps are unli-kely to take place and the possible mechanismsmay be expected to be related to interactionsbetween the Fermi surface with thé Brillouin zonebefore contact and after contact with a set of zonefaces [2, 8]. If the Fermi surface is assumed to benearly spherical it is possible to associate thé rangeof e ja near 1.36 with an approach of the Fermisurface towards the {OO. 2B faces [5, 8]. Howeverfollowing the récent studies of the Fermi surfacetopology in the pure noble metals [9] it is likelythat within the h. c. p. phases the Fermi surfacewill be also, at least initially, considerably dis-torted from a sphère having " necks " in contactwith the 100.2 faces, since these faces are equi-valent and lie at the same distance from the orjginof k-space as do the 11111 faces in the zone of thef.c.c. structure. Thus the Ac’ deviation might berelated to the details of the " neck " topology andhence also to the magnitude of the energy gaps [2].
Finally the knowledge of the e ja values at which
FIG. 10. - The Jones’ zone for an idéal close-packed hexa-gonal structure (after Massalski and King [2]).
overlaps first appear to take place in varioush.c.p. phases, as evicenced by thé onset of Aa andAci deviations, permits one to Make an ocder ofmagnitude estimate of the energy _baud gaps in theBrillouin. zone, uxing a free électron approxi-mation. This is perhaps not unreasonable sincethere are several indications that although the ban’dgaps are relatively large in pure Soble metals theymay be much smaller in thé alloys [2].Taking the energy of free électrons
thé band gap across a zone face may be expressedas
where khkl and Àjly, correspond to thé radii of theFermi surface at overlap and at contact withrespect to a (h, k, l) zone face.Thé values of k are related to the électron concen-
tration by the expression
where Q is the volume per atom. The value of kocan be calculated for the condition of contactbetween a spherical Fermi surface and a (hkl) faceand the value. of k’ may be derived from the expéri-mental data for the électron concentration at which

654
initial overlap appears to take place across theRame face. Such calculations yield several inte-resting points. The band gaps across the ’( 10 . 0 )faces in the 03B6 phases in the region of the ( 10. 0) }overlap appear to be less than 1 eV (AE(10.c) - 0.73eV for the Ag-Sn system [6]) and the band gapsacross the 100. 21 faces in the e phases in’the régionof 100*.21 overlapappear to be about 1 eV
eV for the Ag-Zn system [7]). If a slight changein the slope of the c spacings in the Ag-Sn systemis interpreted to be a result of the {OO. 2} overlap
in that system (for details see ref. [7]). The cor-
responding band gap is, equal to. 0. 41 eV at ela == 1. 51.
The same band gap at the electron concentrationvalue in the region of the (10.0) overlap has beenestimated to be AE(oo.2) =1.32 eV at e ja = 2 .4[6]. Therefore the lattice spacings data indicatethat the band gaps in the Brillouin zone of thehexagonal phases decrease with the increase ofthe solute content.
This work has been supported in part by theUnited States Atomic Energy Commission,Washington 25, D. C.
REFERENCES
[1] JONES (H.), Proc. Roy. Soc.,1934, A 147, 396.[2] MASSALSKI (T. B.) and KING (H. W.), Prog. Mat. Sci.,
1961, 10, 1. [3] JONES (H.), The Theory of Brillouin Zones and Elec-
tronic States in Crystals, North Holland PublishingCo., Amsterdam, 1960.
[4] MASSALSKI (T. B.) and COCKAYNE (B.), Acta Met., 1959,7, 762.
[5] MASSALSKI (T. B.) and KING (H. W.), Acta Met., 1960,8, 677 and 684.
[6] KING (H. W.) and MASSALSKI (T. B.), Phil. Mag., 1961,6, 669.
[7] MASSALSKI (T. B.) and KING (H. W.), Acta Met., 1962,10, in press.
[8] GOODENOUGH (J. B.), Phys. Rev., 1953, 89, 282.[9] HARRISON (W. A.) and WEBB (M. B.), The Fermi Sur-
face, John Wiley and Sons, Inc.
THE RESIDUAL RESISTIVITY DUE TO DEFECT PAIRS (1)
By C. P. FLYNN,Department of Physics, University of Illinois, Urbana, Illinois.
Résumé. 2014 Des calculs ont été effectués dans le but de déterminer les contributions des phéno-mènes de diffusions multiples cohérentes à la résistivité résiduelle des paires de défauts dans unréseau métallique. La théorie a été appliquée aux paires de lacunes et d’impuretés d’étain dansl’or où l’on trouve que les échanges isotropes sont petits, de l’ordre de 5 % de la résistivité totaledue aux défauts isolés. On trouve une énorme anisotropie dans le cas des paires de lacunes en position de premiers et seconds voisins, en accord avec les résultats trouvés par Bross et Seegeravec un modèle différent. Les variations de résistivité isotrope et anisotrope oscillent avec lapériode kF 03B1/03C0 avec une décroissance en 03B120142, lorsque la distance a entre les défauts augmente.
Abstract. 2014 Calculations have been performed to determine the contributions of coherent andmultiple scattering phenomena to the residual resistivity of defect pairs in a metal lattice. The
theory has been applied to vacancy and tin impurity pairs in gold where it is found that the iso-tropic changes are small, being of the order of five percent of the total resistivity due to the isolateddefects. The anisotropy in the case of vacancy pairs at first and second neighbouring sites is foundto be considerable, in agreement with the results of calculations by Bross and Seeger using a diffe-rent model. Both isotropic and anisotropic resistivity increments oscillate with period kF 03B1/03C0and decays as 03B120142, with increasing separation a of the defects.
LE JOURNAL DE PHYSIQUE ET LE RADIUM TOME 23, OCTOBRE 1962,
Introduction. - In the theory of resistivity dueto point defects in a metal lattice, it is commonlyassumed that the various .deviations of the latticefrom petfect periodicity scatter electrons inde-
pendently. This being the case, the observedlinear dependence of residual resistance on defect
(1) This work has been supported in part by the U. S.Atomic Energy Commission.
concentration is automatically built into the theo-retical description of the expriments. Conversely,the linearity of the resistivity-concentration rela-tionship up to concentrations of many atomic peur-cent of defects, ànd the reasonable agreementbetween the rate of change of resistivity with con-centration observed and that predicted on theore-tical grounds, may be taken to imply that point