On the mechanical properties of nanoporous anodized alumina by nanoindentation and sliding tests
10
On the mechanical properties of nanoporous anodized alumina by nanoindentation and sliding tests L. Vojkuvka a , A. Santos a , J. Pallarès a , J. Ferré-Borrull a , L.F. Marsal a, ⁎, J.P. Celis b, ⁎ a Departament d'Enginyeria Electrònica, Elèctrica i Automàtica, Universitat Rovira i Virgili, Avda. Països Catalans 26, 43007 Tarragona, Spain b Department MTM, Katholieke Universiteit Leuven, Kasteelpark Arenberg 44, Heverlee B3110, Belgium abstract article info Article history: Received 21 February 2011 Accepted in revised form 18 September 2011 Available online xxxx Keywords: Anodized aluminum Nanoindentation Scratch test Image analysis Plastic deformation Elastic behavior Mechanical properties like hardness, Young's modulus, and plastic deformation of nanoporous anodized alu- mina fabricated in the most used acid electrolytes (i.e. sulphuric, oxalic and phosphoric) were extracted from nanoindentation and sliding tests. The dependence of the mechanical properties on the porosity level was an- alyzed for each type of samples. Nanohardness, Young's modulus and the coefficient of friction were related to the sample type and its porosity. Indents and scratches were inspected by FEG-SEM, which revealed that nanoporous anodized alumina undergo an elastoplastic behavior under the applied loads. The ductility is found to be higher for samples prepared in the phosphoric solution than for the ones obtained from oxalic and sulphuric solutions. This is associated with the high water content, the phosphate anions incorporated into the alumina structure during the anodization process and the aluminum nanopillar structure between those pores with irregular junctions located at the alumina–aluminum interface. © 2011 Elsevier B.V. All rights reserved. 1. Introduction Since the development of the two-step anodization process to achieve self-ordered nanoporous anodized alumina (NAA) [1], the material sci- ence community has focused its interest on this material due to its poten- tial applications as magnetic storage [2], photovoltaic solar cells [3], filters [4], chemical sensors [5], photonics [6], and metallic nanowires [7,8]. In addition, this synthesis process is relatively easy and cost-effective since no expensive laboratory equipment is required. Nanoporous anodized alumina obtained by a two-step anodization process consists of hexago- nal and periodic pore arrangement caused by the self-ordering effect forming polydomains of 15 μm 2 , approximately. In applications where the mechanical interaction with other parts is expected, the mechanical properties of nanoporous anodized alumina must be known (e.g. micro/ nanoelectromechanical systems (M/NEMS), integrated biosensing/ analyzing nanodevices) [9]. In that respect, nanoindentation test is a commonly used technique to determine the mechanical prop- erties of NAA [10]. In nanoindentation tests the investigated vol- umes of material are in the nanometer range. Usually, the indenter used for nanoindentation testing is a diamond having a Berkovich tip that has three-sided pyramid geometry. The tip pen- etration vs. the applied load is recorded. So, knowing the exact indenter dimensions, some mechanical properties of the tested ma- terial as nanoindentation hardness (H) and Young's modulus (E) can be obtained [11]. The scratch test is another well-established technique used to characterize the superficial mechanical proper- ties of thin films and coatings. In the scratch test, the applied nor- mal force (F n ) and the tangential force (F t ) are measured and the friction coefficient (c f ) of the tested material is calculated as c f = F t / F n . So far, only a few works report on the mechanical properties of nanoporous anodized alumina [12–20]. In this paper, we present an exhaustive and systematic study on the mechanical properties of nanoporous anodized alumina. To this end, multiple nanoindentation and scratch tests are performed. The indents and scratches on the NAA samples are inspected by field emission gun scanning electron microscopy (FEG-SEM). This makes it possible to relate the resulting morphology of the indents and scratches to the mechanical proper- ties of each type of NAA. From this analysis, we have found out that the mechanical properties of nanoporous anodic alumina not only de- pend on the porosity level but also in the acid electrolyte used during the anodization process. To the best of our knowledge, this feature has not been reported previously and it could be very interesting for some applications such as electromechanical or biological nanode- vices, in which special mechanical, physical and chemical characteris- tics (e.g. elasticity, flexibility, thermal stability, chemical inertness, electrical isolation, etc.) are required [9]. This paper is structured as follows: first, the experimental proce- dure to fabricate the NAA samples is described, second, the results extracted from characterization tests are presented, and finally, we discuss about these results and argument our conclusions. Surface & Coatings Technology xxx (2011) xxx–xxx ⁎ Corresponding authors. E-mail addresses: [email protected] (L.F. Marsal), [email protected] (J.P. Celis). SCT-17065; No of Pages 10 0257-8972/$ – see front matter © 2011 Elsevier B.V. All rights reserved. doi:10.1016/j.surfcoat.2011.09.040 Contents lists available at SciVerse ScienceDirect Surface & Coatings Technology journal homepage: www.elsevier.com/locate/surfcoat Please cite this article as: L. Vojkuvka, et al., Surf. Coat. Technol. (2011), doi:10.1016/j.surfcoat.2011.09.040
-
Upload
independent -
Category
Documents
-
view
1 -
download
0
Transcript of On the mechanical properties of nanoporous anodized alumina by nanoindentation and sliding tests

Surface & Coatings Technology xxx (2011) xxx–xxx
SCT-17065; No of Pages 10
Contents lists available at SciVerse ScienceDirect
Surface & Coatings Technology
j ourna l homepage: www.e lsev ie r .com/ locate /sur fcoat
On the mechanical properties of nanoporous anodized alumina by nanoindentationand sliding tests
L. Vojkuvka a, A. Santos a, J. Pallarès a, J. Ferré-Borrull a, L.F. Marsal a,⁎, J.P. Celis b,⁎a Departament d'Enginyeria Electrònica, Elèctrica i Automàtica, Universitat Rovira i Virgili, Avda. Països Catalans 26, 43007 Tarragona, Spainb Department MTM, Katholieke Universiteit Leuven, Kasteelpark Arenberg 44, Heverlee B3110, Belgium
⁎ Corresponding authors.E-mail addresses: [email protected] (L.F. Marsal),
[email protected] (J.P. Celis).
0257-8972/$ – see front matter © 2011 Elsevier B.V. Alldoi:10.1016/j.surfcoat.2011.09.040
Please cite this article as: L. Vojkuvka, et al
a b s t r a c t
a r t i c l e i n f oArticle history:Received 21 February 2011Accepted in revised form 18 September 2011Available online xxxx
Keywords:Anodized aluminumNanoindentationScratch testImage analysisPlastic deformationElastic behavior
Mechanical properties like hardness, Young's modulus, and plastic deformation of nanoporous anodized alu-mina fabricated in the most used acid electrolytes (i.e. sulphuric, oxalic and phosphoric) were extracted fromnanoindentation and sliding tests. The dependence of the mechanical properties on the porosity level was an-alyzed for each type of samples. Nanohardness, Young's modulus and the coefficient of friction were relatedto the sample type and its porosity. Indents and scratches were inspected by FEG-SEM, which revealed thatnanoporous anodized alumina undergo an elastoplastic behavior under the applied loads. The ductility isfound to be higher for samples prepared in the phosphoric solution than for the ones obtained from oxalicand sulphuric solutions. This is associated with the high water content, the phosphate anions incorporatedinto the alumina structure during the anodization process and the aluminum nanopillar structure betweenthose pores with irregular junctions located at the alumina–aluminum interface.
rights reserved.
., Surf. Coat. Technol. (2011), doi:10.1016/j.su
© 2011 Elsevier B.V. All rights reserved.
1. Introduction
Since the development of the two-step anodization process to achieveself-ordered nanoporous anodized alumina (NAA) [1], the material sci-ence community has focused its interest on thismaterial due to its poten-tial applications asmagnetic storage [2], photovoltaic solar cells [3], filters[4], chemical sensors [5], photonics [6], and metallic nanowires [7,8]. Inaddition, this synthesis process is relatively easy and cost-effective sinceno expensive laboratory equipment is required. Nanoporous anodizedalumina obtained by a two-step anodization process consists of hexago-nal and periodic pore arrangement caused by the self-ordering effectforming polydomains of 15 μm2, approximately. In applications wherethe mechanical interaction with other parts is expected, the mechanicalproperties of nanoporous anodized alumina must be known (e.g. micro/nanoelectromechanical systems (M/NEMS), integrated biosensing/analyzing nanodevices) [9]. In that respect, nanoindentation testis a commonly used technique to determine the mechanical prop-erties of NAA [10]. In nanoindentation tests the investigated vol-umes of material are in the nanometer range. Usually, theindenter used for nanoindentation testing is a diamond having aBerkovich tip that has three-sided pyramid geometry. The tip pen-etration vs. the applied load is recorded. So, knowing the exact
indenter dimensions, some mechanical properties of the tested ma-terial as nanoindentation hardness (H) and Young's modulus (E)can be obtained [11]. The scratch test is another well-establishedtechnique used to characterize the superficial mechanical proper-ties of thin films and coatings. In the scratch test, the applied nor-mal force (Fn) and the tangential force (Ft) are measured and thefriction coefficient (cf) of the tested material is calculated ascf=Ft /Fn.
So far, only a few works report on the mechanical properties ofnanoporous anodized alumina [12–20]. In this paper, we present anexhaustive and systematic study on the mechanical properties ofnanoporous anodized alumina. To this end, multiple nanoindentationand scratch tests are performed. The indents and scratches on theNAA samples are inspected by field emission gun scanning electronmicroscopy (FEG-SEM). This makes it possible to relate the resultingmorphology of the indents and scratches to the mechanical proper-ties of each type of NAA. From this analysis, we have found out thatthe mechanical properties of nanoporous anodic alumina not only de-pend on the porosity level but also in the acid electrolyte used duringthe anodization process. To the best of our knowledge, this featurehas not been reported previously and it could be very interesting forsome applications such as electromechanical or biological nanode-vices, in which special mechanical, physical and chemical characteris-tics (e.g. elasticity, flexibility, thermal stability, chemical inertness,electrical isolation, etc.) are required [9].
This paper is structured as follows: first, the experimental proce-dure to fabricate the NAA samples is described, second, the resultsextracted from characterization tests are presented, and finally, wediscuss about these results and argument our conclusions.
rfcoat.2011.09.040

Table 1Anodization conditions of the NAA samples studied (anodization voltage (V), type andconcentration (C) of the acid electrolyte, temperature (T) and anodization time (tan)).
Sample First step Second step
Acid V(V)
C(M)
T(°C)
tan(h)
Acid V(V)
C(M)
T(°C)
tan(h)
I H2SO4 20 1.0 1 1 H2SO4 20 1.0 1 4II H2C2O4 40 0.3 17 1 H2C2O4 40 0.3 17 4III H3PO4 170 0.2 1 1 H3PO4 170 0.2 1 4
2 L. Vojkuvka et al. / Surface & Coatings Technology xxx (2011) xxx–xxx
2. Materials and method
2.1. Anodization conditions
Nanoporous anodized alumina samples were prepared by thetwo-step anodization process [1]. Three types of acid solutions wereused: namely, 1.0 M sulphuric (H2SO4), 0.3 M oxalic (H2C2O4), and0.2 M phosphoric (H3PO4) at applied voltages of 20, 40, and 170 V,respectively.
The length of the second anodization step was selected to obtain afilm thickness of about 25 μm on all samples. Then, the NAA sampleswere etched in an aqueous solution of 0.4 M H3PO4 at 35 °C to in-crease the sample porosity. Table 1 summarizes the anodization pa-rameters used for the first and the second step. Both the porewidening time (tpw) after the second anodizing step and the calculat-ed porosity (P) after etching, are shown in Table 2. Three differentpore widening times were applied depending on the sample type:namely, i) tpw=0, 5 and 10 min for samples prepared in the H2SO4
solution, ii) tpw=0, 10, and 20 min for samples prepared in theH2C2O4 solution, and iii) tpw=0, 20 and 40 min for samples preparedin the H3PO4 solution. NAA sample produced in sulphuric, oxalic orphosphoric acid was labeled as type I, type II, and type III, respective-ly. In addition, for each type of sample, three different degrees of po-rosity (i.e. pore diameters) were obtained by varying the length ofpore widening time. In order to indicate the porosity level (i.e. porediameter) of each type of sample, a subscript was included in their la-bels (i.e. low = small pore, medium = medium pore and high =large pore).
2.2. Preparation of nanoporous anodized alumina samples
Before the two-step anodization process, commercial high purityaluminum (Al) foils (99.999%, Goodfellow Cambridge Ltd) were pre-treated. The aluminum foils were degreased in acetone and cleanedin double-distilled water. Subsequently, they were annealed in nitro-gen (N2) environment at 400 °C for 3 h to homogenize their crystal-line phase and grain size. Then, the Al foils were electropolished ina 4:1 volume mixture of ethanol (EtOH) and perchloric acid (HClO4)at 20 V for 2 min at 6 °C under constant stirring. Finally, the Al foilswere rinsed in double-distilled water, air dried, and stored in dryenvironment.
Table 2Geometric characteristics of the NAA samples after FEG-SEM image analysis (dinterpore,dpore and P).
Sample type dinterpore (nm) tpw (min) dpore (nm) P (%) Label
I 60 0 18 8 Ilow5 24 15 Imedium
10 31 25 IhighII 105 0 35 12 IIlow
10 49 22 IImedium
20 58 31 IIhighIII 455 0 124 11 IIIlow
20 191 20 IIImedium
40 242 32 IIIhigh
Please cite this article as: L. Vojkuvka, et al., Surf. Coat. Technol. (2011)
The pre-treated Al substrates were anodized in a thermally isolat-ed home-made electrochemical cell with a platinum wire as cathodeand a copper plate as anode. The Al substrates were exposed to theacid electrolytes under stirring. The anodizing temperature was ad-justed by a temperature controller from Polyscience (model 9106)during the whole process. The anodization voltage was controlledby a power supply from Delta Elecktronika (model SM 1500). Thefirst anodization step consisted of applying directly the correspond-ing anodization voltage for 1 h. When the first anodization step wasfinished, the aluminum oxide (Al2O3) film was dissolved by wetchemical etching in a mixture of phosphoric acid (H3PO4) 0.4 M andchromic acid (H2Cr2O4) 0.2 M at 70 °C during 1 h. So, a pre-patternwas produced on the aluminum surface. Afterward, the second anod-ization step was carried out at the same anodization voltage main-tained until the anodized layer reached a thickness of about 25 μm.In order to increase the porosity of the anodized samples, a pore wid-ening was carried out by wet chemical etching in 0.4 M aqueousphosphoric acid at 35 °C.
2.3. Nanoindentation tests
NAA samples of types I, II, and III were tested by nanoindentationtester (CSM-instruments equipped with a Berkovich tip). Two modesof measurement were applied: namely, a single indentation mode(SI) and a multicycled indentation mode (MI). In the SI mode, the ap-plied loading force was varied from 1 to 250 mN, starting atF0=1 mN. At each indentation step, the force was increased accord-ingly to Fn=F(n−1)+n (mN), where n=1 to 24. Each indentationwith its corresponding loading force (Fn) was repeated 5 times in arow, and each complete SI measurement matrix had 5 rows (i.e. 25indentations).
The MI mode was based on applying the maximum loading forceof 250 mN in 10 separated load–unloading cycles. In each cycle, theloading force was gradually increased with steps of 25 mN, startingat F1=25 mN and finishing at F10=250 mN. In this way, each com-plete MI measurement consisted finally of 10 loading–unloading cy-cles repeated 5 times in a row.
2.4. Scratch tests
Scratch tests on NAA samples with different porosities were per-formed using a multi specimen test machine (MUST tester fromFalex Tribology, N.V. Belgium).
The characteristics of the used scratching device (i.e. cantileversand tips) are given in Table 3. A glass cantilever labeled G1 with amounted Berkovich tip was used for applying forces (Fn) up to10 mN. Steel cantilevers labeled S1 and S2 were employed to test atapplied forces (Fn) from 20 up to 450 mN, since they are much stifferthan the glass cantilever. A cone tip on a steel cantilever labeled S3was used for scratch tests at high loads.
2.5. Characterization
Before nanoindentation and scratch tests, the geometric char-acteristics of the NAA samples consisting of the interpore distance(dinterpore) (i.e. center-to-center pore distance), the pore diameter(dpore), and the porosity (P) were estimated from images obtained
Table 3Characteristics of the cantilevers used for the scratch tests.
Label Cantilever Tip
G1 Glass BerkovichS1 Steel BerkovichS2 Steel BerkovichS3 Steel Cone
, doi:10.1016/j.surfcoat.2011.09.040
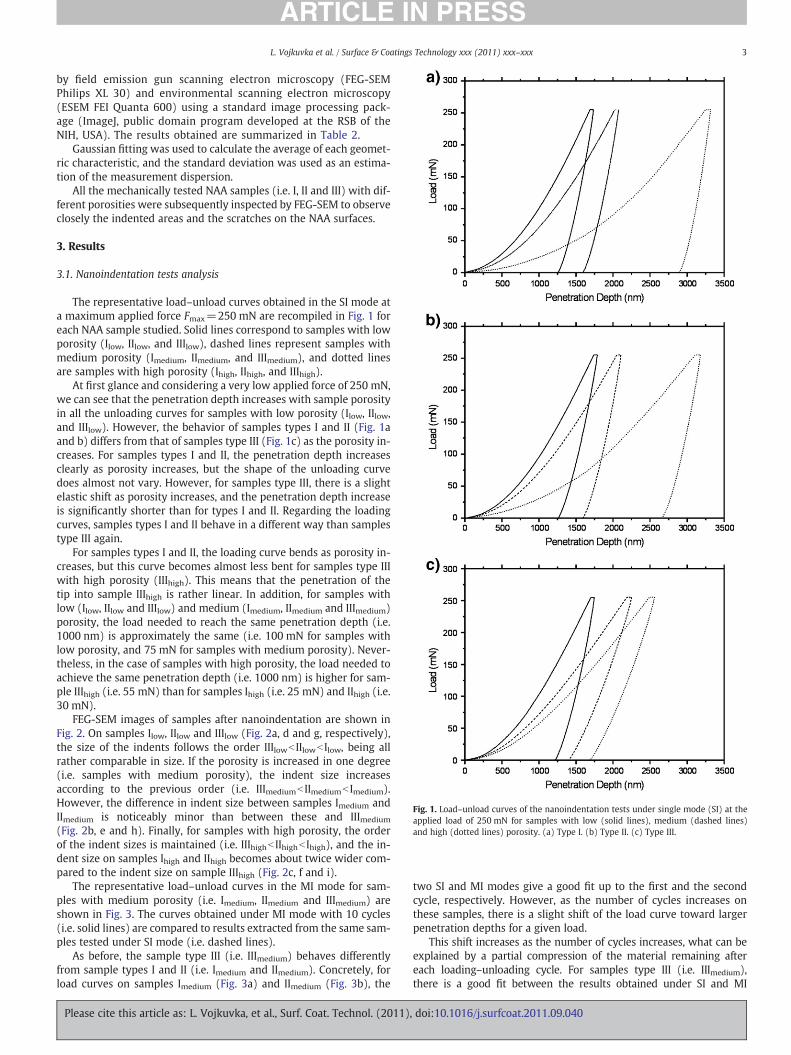
Fig. 1. Load–unload curves of the nanoindentation tests under single mode (SI) at theapplied load of 250 mN for samples with low (solid lines), medium (dashed lines)and high (dotted lines) porosity. (a) Type I. (b) Type II. (c) Type III.
3L. Vojkuvka et al. / Surface & Coatings Technology xxx (2011) xxx–xxx
by field emission gun scanning electron microscopy (FEG-SEMPhilips XL 30) and environmental scanning electron microscopy(ESEM FEI Quanta 600) using a standard image processing pack-age (ImageJ, public domain program developed at the RSB of theNIH, USA). The results obtained are summarized in Table 2.
Gaussian fitting was used to calculate the average of each geomet-ric characteristic, and the standard deviation was used as an estima-tion of the measurement dispersion.
All the mechanically tested NAA samples (i.e. I, II and III) with dif-ferent porosities were subsequently inspected by FEG-SEM to observeclosely the indented areas and the scratches on the NAA surfaces.
3. Results
3.1. Nanoindentation tests analysis
The representative load–unload curves obtained in the SI mode ata maximum applied force Fmax=250 mN are recompiled in Fig. 1 foreach NAA sample studied. Solid lines correspond to samples with lowporosity (Ilow, IIlow, and IIIlow), dashed lines represent samples withmedium porosity (Imedium, IImedium, and IIImedium), and dotted linesare samples with high porosity (Ihigh, IIhigh, and IIIhigh).
At first glance and considering a very low applied force of 250 mN,we can see that the penetration depth increases with sample porosityin all the unloading curves for samples with low porosity (Ilow, IIlow,and IIIlow). However, the behavior of samples types I and II (Fig. 1aand b) differs from that of samples type III (Fig. 1c) as the porosity in-creases. For samples types I and II, the penetration depth increasesclearly as porosity increases, but the shape of the unloading curvedoes almost not vary. However, for samples type III, there is a slightelastic shift as porosity increases, and the penetration depth increaseis significantly shorter than for types I and II. Regarding the loadingcurves, samples types I and II behave in a different way than samplestype III again.
For samples types I and II, the loading curve bends as porosity in-creases, but this curve becomes almost less bent for samples type IIIwith high porosity (IIIhigh). This means that the penetration of thetip into sample IIIhigh is rather linear. In addition, for samples withlow (Ilow, IIlow and IIIlow) and medium (Imedium, IImedium and IIImedium)porosity, the load needed to reach the same penetration depth (i.e.1000 nm) is approximately the same (i.e. 100 mN for samples withlow porosity, and 75 mN for samples with medium porosity). Never-theless, in the case of samples with high porosity, the load needed toachieve the same penetration depth (i.e. 1000 nm) is higher for sam-ple IIIhigh (i.e. 55 mN) than for samples Ihigh (i.e. 25 mN) and IIhigh (i.e.30 mN).
FEG-SEM images of samples after nanoindentation are shown inFig. 2. On samples Ilow, IIlow and IIIlow (Fig. 2a, d and g, respectively),the size of the indents follows the order IIIlowb IIlowb Ilow, being allrather comparable in size. If the porosity is increased in one degree(i.e. samples with medium porosity), the indent size increasesaccording to the previous order (i.e. IIImediumb IImediumb Imedium).However, the difference in indent size between samples Imedium andIImedium is noticeably minor than between these and IIImedium
(Fig. 2b, e and h). Finally, for samples with high porosity, the orderof the indent sizes is maintained (i.e. IIIhighb IIhighb Ihigh), and the in-dent size on samples Ihigh and IIhigh becomes about twice wider com-pared to the indent size on sample IIIhigh (Fig. 2c, f and i).
The representative load–unload curves in the MI mode for sam-ples with medium porosity (i.e. Imedium, IImedium and IIImedium) areshown in Fig. 3. The curves obtained under MI mode with 10 cycles(i.e. solid lines) are compared to results extracted from the same sam-ples tested under SI mode (i.e. dashed lines).
As before, the sample type III (i.e. IIImedium) behaves differentlyfrom sample types I and II (i.e. Imedium and IImedium). Concretely, forload curves on samples Imedium (Fig. 3a) and IImedium (Fig. 3b), the
Please cite this article as: L. Vojkuvka, et al., Surf. Coat. Technol. (2011)
two SI and MI modes give a good fit up to the first and the secondcycle, respectively. However, as the number of cycles increases onthese samples, there is a slight shift of the load curve toward largerpenetration depths for a given load.
This shift increases as the number of cycles increases, what can beexplained by a partial compression of the material remaining aftereach loading–unloading cycle. For samples type III (i.e. IIImedium),there is a good fit between the results obtained under SI and MI
, doi:10.1016/j.surfcoat.2011.09.040

Fig. 2. Set of FEG-SEM images of the indents after nanoindentation tests for all samples and porosities. (a) Sample Ilow. (b) Sample Imedium. (c) Sample Ihigh. (d) Sample IIlow.(e) Sample IImedium. (f) Sample IIhigh. (g) Sample IIIlow. (h) Sample IIImedium. (i) Sample IIIhigh.
4 L. Vojkuvka et al. / Surface & Coatings Technology xxx (2011) xxx–xxx
modes for all cycles, and the shift is practically unnoticeable along theentire load curve in contrast to Imedium and IImedium (Fig. 3c). Neverthe-less, the unload curve of the last indentation cycle under MI mode onsample IIImedium slightly shifts toward shorter penetration depths.This differs from what is noticed on the unloading curves on Imedium
and IImedium, which fit practically the results obtained under SI mode.This implies that IIImedium is less compressible than Imedium and IImedium.
Hardness (H) and Young's modulus (E) of NAA samples wereextracted from the nanoindentation tests using the software devel-oped by the nanoindenter provider (i.e. CSM-instruments). This soft-ware uses the Oliver–Pharr method described in literature [10].However, in line with previous studies [21], such a method was con-ceived for continuous solids and not for porous solids as NAA, sinceH is calculated by dividing the load by the real contact area of the in-dent. For this reason, actually, the hardness obtained from thenanoindentation software is the apparent hardness (Happ).
In order to calculate the real hardness (Hreal) of NAA samples, it isnecessary to find their real solid area (Areal). To this avail, FEG-SEMimages were analyzed, and the real solid area was estimated (pleasesee Appendix A). The average Areal, Happ, Hreal (calculated as100·Happ·Areal
−1(%)) and E for each sample and for both SI mode (per-formed indentations 5×25=125) and MI mode (performed indenta-tions 10×5=50) were calculated.
Please cite this article as: L. Vojkuvka, et al., Surf. Coat. Technol. (2011)
For samples type I (i.e. Ilow, Imedium and Ihigh) the average Happ,Hreal, and E for SI mode and MI mode, are rather comparable. The dif-ference between the average Happ, Hreal and E for SI mode andMI mode increases slightly for samples type II (i.e. IIlow, IImedium andIIhigh,) and that effect is more noticeable on samples type III (IIIlow,IIImedium and IIIhigh).
In addition, the values of Happ, Hreal and E for all samples are equalor slightly higher for the SI mode than for the MI mode, what can beattributed to the compression of the porous material remaining aftereach load–unload cycle in MI mode.
In order to study the influence of the porosity on the real hardnessand Young's modulus, the average values of Hreal, and E were plottedversus the porosity values obtained previously (Table 2) in Fig. 4. TheSI mode values are represented by solid lines while theMI mode valuescorrespond to dotted lines. As a first result, it is observed that the realhardness (Hreal) decreases linearly as the porosity increases for samplesI and II (Fig. 4a), and the trend of Hreal is practically the same under SIand MI modes. Nevertheless, for samples of type III, the dependenceof Hreal on P is less linear under SI mode than under MI mode, and thevalues ofHreal under SI mode are fairly superior to for the ones recordedunder MI mode when the porosity degree is low and medium.
Concerning to the Young's modulus (E), it decreases linearly as po-rosity increases for samples types I and II for both SI and MI modes, as
, doi:10.1016/j.surfcoat.2011.09.040

Fig. 3. Load–unload curves of the nanoindentation tests under single mode (SI-dashedlines) and multi-cycled mode (MI-solid lines) at the applied load of 250 mN for sam-ples with medium porosity. (a) Imedium. (b) IImedium. (c) IIImedium.
Fig. 4. Real hardness (Hreal) and Young's modulus (E) dependence on the porosity(P) for NAA samples types I, II and III. (a) Real hardness. (b) Young's modulus.
5L. Vojkuvka et al. / Surface & Coatings Technology xxx (2011) xxx–xxx
shown in Fig. 4b. However, the behavior of samples type III differsfrom I and II. The evolution of E is clearly not linear under both SIand MI modes and the values of E (SI) for low and medium porositiesare noticeably higher than the ones of E (MI). Another result that isworth noting is that, the Young's modulus of all the samples is rathercomparable at any porosity level. Nonetheless, the values of Hreal forsamples type III are generally higher than that for samples types Iand II.
Please cite this article as: L. Vojkuvka, et al., Surf. Coat. Technol. (2011)
3.2. Scratch tests analysis
Scratch tests were performed on each type of sample (i.e. I, II andIII) with different degrees of porosity (i.e. low, medium and high)using different cantilevers (Table 3). The scratch test results areshown in Fig. 5. The coefficient of friction recorded on NAA samples(cf) sliding against was calculated by dividing the tangential force(Ft) by the applied force (Fn).
The soft glass cantilever (G1) was used to measure the coefficientof friction at applied forces (Fn) ranging from 1 to 10 mN. As Fig. 5a, b,and c shows (label G1), the cf varies abruptly between 0.07 and 0.20on all types of samples and porosities. It is very difficult to establishdifferences between samples since they are very close and practicallyoverlapped.
The results obtained with the steel cantilever (S2) at Fn rangingfrom 20 to 100 mN, vary depending on the porosity degree, but thecf curve shape is similar on all samples. At low porosity (Fig. 5alabel S2), the difference in cf is almost unnoticeable between all sam-ples, and cf varies from 0.06 to 0.19. As porosity increases, the differ-ence in cf is more noticeable, but the general shape of the curves ismaintained (Fig. 5b label S2). Finally, at high porosity (Fig. 5c labelS2), the coefficient of friction is higher on samples Ihigh (from 0.24to 0.25) and IIhigh (from 0.21 to 0.24) than on sample IIIhigh (from0.13 to 0.17).
Finally, the results from scratch tests done with a cone tipmounted on a steel cantilever (S3) are shown in Fig. 5a, b, and c(label S3). Owing to the shape, dimensions and material propertiesof the cone tip (i.e. radius around 200 μm), the penetration depth ofthe cone tip (S3) into the NAA sample is much shorter than the pen-etration depth of the Berkovich tip (S1 and S2) at Fn ranging from 50to 400 mN.
The values of cf are rather lower than those obtained with theBerkovich tip (S1 and S2) on samples with medium and high porosity,but not on samples with low porosity (Fig. 5a label S3). In that last
, doi:10.1016/j.surfcoat.2011.09.040

Fig. 5. Friction coefficient (cf) dependence on the applied load (Fn) obtained after thescratch tests using different cantilevers and tips (G1, S1, S2 and S3). (a) Samples withlow porosity. (b) Samples with medium porosity. (c) Samples with high porosity.
Fig. 6. Scratch width (Ws) dependence on the applied load (Fn) measured after thescratch tests using different steel cantilevers. (a) Results with the steel cantilever S1.(b) Results with the steel cantilever S2 (for low porosity samples only to 250 mN).
6 L. Vojkuvka et al. / Surface & Coatings Technology xxx (2011) xxx–xxx
case, the curves overlapped to those corresponding to S1. In spite ofthis, the shape of the curves for S1 and S3 is practically the same asfor Fn ranging from 50 to 400 mN. The trends on all these samplesare practically the same, this is cf increases constantly between 50and 300 mN, and remains almost constant between 300 and 400 mN.
The scratch width (Ws) was measured after the friction tests withthe steel cantilevers S1 (Fig. 6a) and S2 (Fig. 6b) at applied forcesranging from 50 to 400 mN, and from 20 to 100 mN (for low porosity
Please cite this article as: L. Vojkuvka, et al., Surf. Coat. Technol. (2011)
samples only to 250 mN), respectively. The measured width of thescratches increases linearly at increasing applied force on all the sam-ples and all porosities. As the sample porosity increases, the scratchwidth increases with both steel cantilevers (S1 and S2). Nevertheless,this increase inWs is more pronounced for samples types I and II thanfor samples type III.
3.3. Examination of nanoindents
All the mechanically tested NAA samples (i.e. I, II and III) with low,medium, and high porosity, were inspected by FEG-SEM to derive theindent area. Fig. 7 shows a set of FEG-SEM images of indents made onthe top side of samples IIlow, IImedium and IIhigh at an applied force of250 mN. A cleavage is observed that increases in width as the sampleporosity increases (i.e. 0.1 μm for IIlow, 1.0 μm for IImedium, and 4.5 μmfor IIhigh).
Similar results are obtained on samples types I and III. In all cases,no superficial cracks were observed at the indent edges or indentsides. The same cleavage appears inside the indents of samples typeIII with low porosity under an applied force of 250 mN (Fig. 8). Thecleavage width increases as porosity increases, so that it is reasonableto assume that cleavage most probably occurs during the loadingcycle of the nanoindentation test when the indenter tip penetratesinto the samples. The shear forces between indenter tip and NAAare concentrated rather at the tip edges than at the tip sides. There-fore, the cleavages are also very uniformmatching well the pyramidal
, doi:10.1016/j.surfcoat.2011.09.040

Fig. 7. Set of top view FEG-SEM images of the indents on samples type II with differentporosities under applied load of 250 mN. (a) IIlow. (b) IImedium. (c) IIhigh.
Fig. 8. Set of top view FEG-SEM images of the indent under applied load of 250 mN on asample type III with low porosity. (a) Before wet chemical etching. (b) After wet chem-ical etching.
7L. Vojkuvka et al. / Surface & Coatings Technology xxx (2011) xxx–xxx
geometry of the tip. Fig. 8a shows an enlarged view of the indent onsample IIIlow.
Compressed and deformed pores with irregular shapes (comparedto the pores on the top surface of this sample) appear at the indentsides. A slight chemical etching in phosphoric acid solution of thesame sample was carried out to analyze in detail the pore shapes atthe indent sides (Fig. 8b). The deformed pore cells at the indentsides are distinguished by white borders, which are generated bystress accumulated between adjacent compressed pore cells afterthe nanoindentation process. During wet chemical etching, these bor-ders of the compressed pore cells dissolve in a different way than thecell walls. In addition, it is observed that the cell deformation is muchhigher at indent cleavages than at indent sides. This also supports theprevious assumption that shear forces are concentrated at the tipedges during the loading cycle.
Please cite this article as: L. Vojkuvka, et al., Surf. Coat. Technol. (2011)
3.4. Examination of scratches
A FEG-SEM image analysis was performed on scratches.Cracks were not observed in the scratched area on samples Ilow, IIlowand IIIlow. On the contrary, linear cracks are formed along the scratchside following the forward movement of the indenter tip throughoutthe surface of sample IImedium. The tip position and its movement di-rection are indicated in Fig. 9a. All cracks have the same angle withrespect to the scratch bottom, which corresponds to the geometryof the pyramidal tip (i.e. half angle of the tip edges=65°). It meansthat, during scratching, the cracks are simultaneously formed onboth scratch sides along the scratch path. A magnified view of thecrack area (see inset in Fig. 9a) reveals that the pore cells are de-formed, and collapse following a direction parallel to the crack. Thiscollapsing mode and the shape of the deformed pore cells are similarto the shear band formation observed in the stress simulations oflarge-scale porous metals and polymers with comparable hexagonalgeometry [22,23].
FEG-SEM images of scratch area of sample IIhigh are shown inFig. 9b. Besides the linear cracks present at the scratch sides, large cir-cular cracks are generated at the scratch bottom. Those circular crackscan be produced by the excessive high load used during the scratchtest (i.e. 400 mN). It is possible that the depth limitation wasexceeded during the scratch test. For that reason, the compressed ma-terial is released behind the indenter tip forming circular cracks as theindenter tip is moved forward. A closer inspection of the scratch bot-tom revealed that the original porous structure is still preserved be-neath the compressed material (see inset in Fig. 9b).
Cracks were not observed after scratch tests on samples type III(i.e. IIIlow and IIImedium) at an applied force of 400 mN. FEG-SEM
, doi:10.1016/j.surfcoat.2011.09.040

Fig. 9. Set of top view FEG-SEM images of the scratches performed under load of400 mN for samples type II. (a) IImedium. (b) IIhigh. The insets are magnified views ofthe red squares on (a) and (b). (For interpretation of the references to color in this fig-ure legend, the reader is referred to the web version of this article.)
Fig. 10. Set of FEG-SEM images of the scratches performed under load of 400 mN forsamples type III. (a) Top view of the scratched area of sample IIImedium before wetchemical etching. (b) Top view of the scratched area of sample IIImedium after wetchemical etching. (c) Lateral view of the scratched area of sample IIImedium.
8 L. Vojkuvka et al. / Surface & Coatings Technology xxx (2011) xxx–xxx
images of the scratch area on sample IIImedium are shown in Fig. 10a. Aslight chemical wet etching on that sample was carried out in H3PO4
solution to observe the pore morphology after the scratch test(Fig. 10b). The scratch side structure before chemical etching appearsto be almost completely non-porous.
However, when the thin layer of non-porous Al2O3 which covers thetops of the pores is dissolved by chemical etching, the actual materialstructure emerges (Fig. 10b). The pore cells are collapsed and com-pacted all together in rows following the deformation direction of theindenter tip movement. The pore cell borders are clearly highlightedsince, as was commented previously, the sites with accumulated stresspresent a different etching behavior. The formation of a thin layer ofcrushed Al2O3, which is spread over the sample surface during thescratch process, reveals that sample IIImedium is rather pliable.
On analyzing the lateral view of the scratch (Fig. 10c), some linearcracks were identified on the scratch side, but these are less percepti-ble than on samples types I and II. The cracks present the same anglewith respect to the scratch bottom (i.e. 65°).
In addition, the penetration depth of the indenter tip is muchshorter than on samples types I and II. No radial cracks at the scratchbottom were observed, and the cleavage on the scratch bottom waslarger than on samples types I and II.
4. Discussion
As we have shown throughout the Results section, generally, themechanical behavior of samples anodized in phosphoric acid (typeIII) differs from those fabricated in sulphuric acid (type I) and oxalicacid (type II).
Please cite this article as: L. Vojkuvka, et al., Surf. Coat. Technol. (2011)
From the nanoindentation tests, it is deduced that samples type IIIare more elastic than samples types I and II. This is reflected in both SIand MI nanoindentation modes. Samples type III recover relativelytheir shape after each load–unloading cycle. This behavior is morepronounced for tests in MI mode, because the loading force is not ap-plied continuously and the material can relax between successive
, doi:10.1016/j.surfcoat.2011.09.040

9L. Vojkuvka et al. / Surface & Coatings Technology xxx (2011) xxx–xxx
indentation cycles, allowing the accumulated stress to release be-tween successive cycles.
After nanoindentation and scratch tests, the FEG-SEM image anal-ysis confirms that the samples types I and II are rather brittle and stiffmaterials, but samples type III are more able to deform under nanoin-dentation and scratching without breaking up. This behavior can bedue to several reasons detailed hereafter:
i) Previous studies have verified that the walls between adjacentpores can be divided on two main regions [24,25]. The first oneis a dark inner layer (pure alumina) and the other one is abright outer layer (anion-contaminated alumina). The ratio ofthe inner to outer layer in disordered NAA depends on theacid electrolyte used for anodization and follows the orderH2SO4 (0.05)bH2C2O4 (0.1)bH3PO4 (0.5). However, as Nielschet al. reported [26], in ordered NAA the ratio of the inner to
Fig. 11. Set of bottom view ESEM images of samples types I, II and III, (a) type I (H2SO4 — 2regular junctions. (d) Type III (H3PO4 — 170 V) Al nanopillars on the Al pattern when the Alscribing the possible effect of the Al nanopillar arrays on the mechanical properties dinterpretation of the references to color in this figure legend, the reader is referred to the w
Please cite this article as: L. Vojkuvka, et al., Surf. Coat. Technol. (2011)
outer layer is the same for all acid electrolytes (i.e. 0.2). Forthat reason, owing to all samples have been fabricated underself-ordered regimens, it is not possible to relate the differentmechanical behaviors of samples types I, II and III to the thick-ness of the anion-contaminated oxide layer. However, it is pos-sible that the phosphate anions incorporated into the Al2O3
structure in the course of the anodization process confersmore elasticity to the NAA fabricated in phosphoric than thatproduced in oxalic and sulphuric acids.
ii) Thewater content in the NAA structure depends on the anodiza-tion conditions [24]. It is known that, during the anodization pro-cess, some voids are generated on the apexes of aluminumprotrusions at Al2O3/Al interface [27,28]. This generation ofvoids takes place due to oxygen evolution and their size in-creases with increasing the anodization voltage. Those voidsare preferential places for chemisorption of OH groups and
0 V). (b) Type II (H2C2O4 — 40 V). (c) Type III (H3PO4 — 170 V) red circles indicate ir-2O3 film is removed after the first anodization step. (e) Cross-section view diagram de-uring the nanoindentation tests (red arrows indicate the direction of forces). (Foreb version of this article.)
, doi:10.1016/j.surfcoat.2011.09.040

Table A.1Calculation of the number of pores (Np), the average area per pore (average Ap), thetotal porous area (Ap), the total area (At) and the real solid area (Areal) for all the sam-ples and porosities (Ilow, Imedium, Ihigh, IIlow, IImedium, IIhigh, IIIlow, IIImedium and IIIhigh).(Both the number of pores and the average area per pore were estimated from FEGSEMimage analysis).
Sample Np AverageAp(nm2)
Ap
(nm2)Ap
(%)At
(nm2)Areal
(nm2)Areal
(%)
Ilow 222 478±258 106,121 10.61 1,000,000 893,879 89.39IIlow 442 976±168 431,449 9.33 4,625,000 4,193,551 90.67IIIlow 105 12,548±4572 1,317,562 7.34 17,946,818 16,629,256 92.66Imedium 281 675±265 189,661 18.97 1,000,000 810,339 81.03IImedium 437 1881±330 822,229 17.78 4,625,000 3,802,771 82.22IIImedium 158 29,319±8321 4,632,544 16.25 28,509,955 23,877,411 83.75Ihigh 253 946±273 239,500 23.95 1,000,000 760,500 76.05IIhigh 444 2630±304 1,167,831 25.25 4,625,000 3,457,169 74.75IIIhigh 97 46,419±9214 4,502,628 24.34 18,500,000 13,997,372 75.66
10 L. Vojkuvka et al. / Surface & Coatings Technology xxx (2011) xxx–xxx
adsorption of water molecules from the acid electrolyte [29]. Forthis reason, the water content and OH groups in the NAA struc-ture of those samples fabricated in phosphoric acid at 170 V ismuch higher than that of those produced in oxalic and sulphuricacids. All this would explain the behavior of samples III duringthe sliding tests. From the geometry point of view, taking into ac-count that samples type III have the largest pore diameters, themovement of the indentation tip on these samples should bemore rugged than for those samples types I and II. Nevertheless,the friction coefficients of samples type III are the lowest becausethemovement of the indentation tip is somehow cushioned dur-ing the sliding tests. This could be a result of the higher ductilityof samples III conferred by the higher water and OH group con-tent into their structure.
iii) Finally, the presence of aluminum nanopillars between thepore cell walls at the bottom side of NAA samples could modifythe mechanical properties of NAA [30]. As we can see in Fig. 11,for samples types I (Fig. 11a) and II (Fig. 11b) obtained at lowanodization voltages of 20 and 40 V respectively, no irregularjunctions between adjacent pore cells are observed. Neverthe-less, for samples type III obtained at a high anodization voltageof 170 V, some irregular junctions connecting non-hexagonalpore cells are identified along the bottom side. These irregularjunctions are generated by the high electric field concentratedat the pore bottoms, and give rise to holes. These holes arefilled with Al during the anodization process (Fig. 11c and d).As a result, arrays of Al nanopillars grow throughout the NAAstructure (i.e. between adjacent pores). This could modify themechanical hardness of NAA at microscopic scale during thenanoindentation tests (Fig. 11e). For this reason, in spite ofthe Young's modulus of all the samples is rather comparableat any porosity level, the values of Hreal for samples type IIIare higher than that for samples types I and II. Another factorthat could explain this higher hardness is that the pore size(i.e. pore diameter) of those samples fabricated in phosphoricis much larger than that of those samples produced in oxalicand sulphuric, which are rather comparable (Table 2).
5. Conclusions
In summary, an extensive and systematic study on hardness,Young's modulus and friction coefficient of nanoporous anodic alumi-na has been discussed. The most commonly used types of NAAobtained from three different acid electrolytes (i.e. sulphuric (typeI), oxalic (type II) and phosphoric (type III)) have been tested bynanoindentation and scratch testing. The effect of porosity has beenanalyzed by modifying this characteristic at three levels: namely,low, medium and high, for all types of samples. It has been demon-strated that the mechanical properties of NAA samples not only de-pend on the porosity level but also on the acid electrolyte used inthe fabrication process. The mechanical behavior of samples types Iand II are rather comparable and can be considered as elastic-perfect plastic materials. However, samples type III show a more elas-tic behavior than those of types I and II which are rather brittle andstiff materials. The pore cells of samples type III deform under nanoin-dentation and scratch testing. This has been confirmed by FEG-SEMimage analysis of indents and scratches. The origin of such a divergentmechanical behavior has been ascribed to the higher water content,the phosphate anions incorporated in the NAA structure and the in-trusion of Al nanopillars between those adjacent pores with irregularjunctions. This special behavior makes NAA fabricated in phosphoricacid a material with a unique characteristic suitable for some poten-tial applications in nanotechnology (e.g. sensors, electromechanicaland biological systems and so forth).
Please cite this article as: L. Vojkuvka, et al., Surf. Coat. Technol. (2011)
Acknowledgments
This work was supported by the SpanishMinistry of Education andScience (MEC) under grant number TEC2009-09551, CONSOLIDERHOPE project CSD2007-00007, AECID project A/024560/09 andScientific Research Network on Surface Modification of Materialsfunded by the Flemish Science Foundation (FWO). Nanoindentationand scratch testing were performed at Dept. MTM-KULeuven withthe help of Marc Peeters. Anodization was done at Universitat Rovirai Virgili.
Appendix A. Real area calculations from FEG-SEM image analysisof samples types I, II and III
References
[1] H. Masuda, K. Fukuda, Science 268 (1995) 1466.[2] D. Al Mawlawi, N. Coombs, M. Moskovits, J. Appl. Phys. 70 (1991) 4421.[3] N. Haberkorn, J.S. Gutmann, P. Theato, ACS Nano 3 (2009) 1415.[4] G. Gorokh, A. Mozalev, D. Solovei, V. Khatko, E. Llobet, X. Correig, Electrochim.
Acta 52 (2006) 1771.[5] J.H. Holtz, S.A. Asher, Nature 389 (1997) 829.[6] M. Deubel, G. von Freymann, M. Wegener, S. Pereira, K. Busch, C.M. Soukoulis,
Nat. Mater. 3 (2004) 444.[7] G. Sauer, G. Brehm, S. Schneider, K. Nielsch, R.B. Wehrspohn, J. Choi, H. Hofmeis-
ter, U. Gösele, J. Appl. Phys. 91 (2002) 3243.[8] A. Santos, L. Vojkuvka, J. Pallarés, J. Ferré-Borrull, L.F. Marsal, Nanoscale Research
Letters 4 (2009) 1021.[9] F. Matsumoto, M. Harada, K. Nishio, H. Masuda, Adv. Mater. 17 (2005) 1609.
[10] S. Bueno, C. Baudin, J. Mater. Res. 21 (2006) 161.[11] W.C. Oliver, G.M. Pharr, J. Mater. Res. 7 (1992) 1564.[12] D. Choi, S. Kim, S. Lee, D. Kim, K. Lee, H. Park, W. Hwang, Nanotechnology 19
(2008) 145708.[13] D. Choi, S. Lee, S. Kim, P. Lee, K. Lee, H. Park, W. Hwang, Scr. Mater. 58 (2008) 870.[14] B.A. Latella, J. Mater. Sci. Lett. 19 (2000) 1127.[15] B. Bhushan, S. Sundararajan, Acta Mater. 46 (1998) 3793.[16] Z. Xia, L. Riester, B.W. Sheldon, W.A. Curtin, J. Liang, A. Yin, J.M. Xu, Rev. Adv.
Mater. Sci. 6 (2004) 131.[17] S. Ko, D. Lee, S. Jee, H. Park, K. Lee, W. Hwang, Thin Solid Films 515 (2006) 1932.[18] T.H. Fang, T.H. Wang, C.H. Liu, L.W. Ji, S.H. Kang, Nanoscale Res. Lett. 2 (2007) 410.[19] J.H. Jeon, W. Hwang, K.H. Lee, J. Compos. Mater. 43 (2009) 1155.[20] K.Y. Ng, Y. Lin, A.H.W. Ngan, Acta Mater. 57 (2009) 2710.[21] K. Zeng, C.-H. Chiu, Acta Mater. 49 (2001) 3539.[22] S.D. Papka, S. Kyriakides, Int. J. Solids Struct. 35 (1998) 239.[23] S.D. Papka, S. Kyriakides, Acta Mater. 46 (1998) 2765.[24] A. Eftekhari (Ed.), Nanostructured Materials in Electrochemistry, WILEY-VCH
Verlag GmbH & Co. KGaA, Weinheim, 2008, p. 1.[25] G.E. Thompson, G.C. Wood, Nature 290 (1981) 230.[26] K. Nielsch, J. Choi, K. Schwirn, R.B. Wehrspohn, U. Gösele, Nano Lett. 2 (2002) 677.[27] S. Ono, H. Ichinose, N. Masuko, J. Electrochem. Soc. 138 (1991) 3705.[28] S. Ono, H. Ichinose, N. Masuko, J. Electrochem. Soc. 139 (1992) L80.[29] E. Palibroda, P. Marginean, Thin Solid Films 240 (1994) 73.[30] W. Lee, K. Nielsch, U. Gösele, Nanotechnology 18 (2007) 475713.
, doi:10.1016/j.surfcoat.2011.09.040