High Surface Area Nanoporous Activated Carbons Materials ...
17
Citation: Joshi, S.; Shrestha, R.G.; Pradhananga, R.R.; Ariga, K.; Shrestha, L.K. High Surface Area Nanoporous Activated Carbons Materials from Areca catechu Nut with Excellent Iodine and Methylene Blue Adsorption. C 2022, 8, 2. https:// doi.org/10.3390/c8010002 Academic Editors: Craig E. Banks and Jandro L. Abot Received: 7 December 2021 Accepted: 19 December 2021 Published: 27 December 2021 Publisher’s Note: MDPI stays neutral with regard to jurisdictional claims in published maps and institutional affil- iations. Copyright: © 2021 by the authors. Licensee MDPI, Basel, Switzerland. This article is an open access article distributed under the terms and conditions of the Creative Commons Attribution (CC BY) license (https:// creativecommons.org/licenses/by/ 4.0/). Journal of Carbon Research C Article High Surface Area Nanoporous Activated Carbons Materials from Areca catechu Nut with Excellent Iodine and Methylene Blue Adsorption Sahira Joshi 1,2 , Rekha Goswami Shrestha 2 , Raja Ram Pradhananga 3 , Katsuhiko Ariga 2,4 and Lok Kumar Shrestha 2, * 1 Materials Science and Engineering Program, Pulchowk Campus, Institute of Engineering (IOE), Tribhuvan University (TU), Lalitpur 44700, Nepal; [email protected] 2 International Center for Materials Nanoarchitectonics (WPI-MANA), National Institute for Materials Science (NIMS), 1-1 Namiki, Ibaraki, Tsukuba 305-0044, Japan; [email protected] (R.G.S.); [email protected] (K.A.) 3 Amrit Campus, Tribhuvan University (TU), Kathmandu 44613, Nepal; [email protected] 4 Department of Advanced Materials Science, Graduate School of Frontier Sciences, The University of Tokyo, 5-1-5 Kashiwanoha, Chiba 277-8561, Japan * Correspondence: [email protected]; Tel.: +81-29-860-4809 Abstract: Nanoporous carbon materials from biomass exhibit a high surface area due to well-defined pore structures. Therefore, they have been extensively used in separation and purification technolo- gies as efficient adsorbents. Here, we report the iodine and methylene blue adsorption properties of the hierarchically porous carbon materials prepared from Areca catechu nut. The preparation method involves the phosphoric acid (H 3 PO 4 ) activation of the Areca catechu nut powder. The ef- fects of carbonization conditions (mixing ratio with H 3 PO 4 , carbonization time, and carbonization temperature) on the textural properties and surface functional groups were studied. The optimum textural properties were obtained at a mixing ratio of 1:1, carbonized for 3 h at 400 ◦ C, and the sample achieved a high specific surface area of 2132.1 m 2 g -1 and a large pore volume of 3.426 cm 3 g -1 , respectively. The prepared materials have amorphous carbon structures and contain oxygenated surface functional groups. Due to the well-defined micro-and mesopore structures with the high surface area and large pore volume, the optimal sample showed excellent iodine and methylene blue adsorption. The iodine number and methylene blue values were ca. 888 mg g -1 and 369 mg g -1 , respectively. The batch adsorption studies of methylene dye were affected by pH, adsorbent dose, contact time, and initial concentration. The optimum parameters for the methylene blue adsorption were in alkaline pH, adsorbent dose of 2.8 g L -1 , and contact time of 180 min. Equilibrium data could be best represented by the Langmuir isotherm model with a monolayer adsorption capacity of 333.3 mg g -1 . Thus, our results demonstrate that the Areca catechu nut has considerable potential as the novel precursor material for the scalable production of high surface area hierarchically porous carbon materials that are essential in removing organic dyes from water. Keywords: Areca catechu nut; chemical activation; nanoporous activated carbon; methylene blue adsorption; iodine adsorption 1. Introduction Synthetic dyes represent complex aromatic compounds and are extensively used in textile, leather, cosmetics, paper, printing, plastic, rubber, and pharmaceutical industries to color their products [1]. However, a massive discharge of dye effluents generated from these industries into the water sources or the ecosystem adversely affects aquatic life and human beings. The persistence of dyes even in small concentrations (<1 mg L -1 ) in water reduces light penetration, thus affecting the photosynthetic activities and plant growth and thus destroying marine ecosystems [2] and making the water unfit for human consumption. C 2022, 8, 2. https://doi.org/10.3390/c8010002 https://www.mdpi.com/journal/carbon
-
Upload
khangminh22 -
Category
Documents
-
view
1 -
download
0
Transcript of High Surface Area Nanoporous Activated Carbons Materials ...
�����������������
Citation: Joshi, S.; Shrestha, R.G.;
Pradhananga, R.R.; Ariga, K.;
Shrestha, L.K. High Surface Area
Nanoporous Activated Carbons
Materials from Areca catechu Nut with
Excellent Iodine and Methylene Blue
Adsorption. C 2022, 8, 2. https://
doi.org/10.3390/c8010002
Academic Editors: Craig E. Banks
and Jandro L. Abot
Received: 7 December 2021
Accepted: 19 December 2021
Published: 27 December 2021
Publisher’s Note: MDPI stays neutral
with regard to jurisdictional claims in
published maps and institutional affil-
iations.
Copyright: © 2021 by the authors.
Licensee MDPI, Basel, Switzerland.
This article is an open access article
distributed under the terms and
conditions of the Creative Commons
Attribution (CC BY) license (https://
creativecommons.org/licenses/by/
4.0/).
Journal of
Carbon Research C
Article
High Surface Area Nanoporous Activated Carbons Materialsfrom Areca catechu Nut with Excellent Iodine and MethyleneBlue Adsorption
Sahira Joshi 1,2, Rekha Goswami Shrestha 2, Raja Ram Pradhananga 3, Katsuhiko Ariga 2,4
and Lok Kumar Shrestha 2,*
1 Materials Science and Engineering Program, Pulchowk Campus, Institute of Engineering (IOE),Tribhuvan University (TU), Lalitpur 44700, Nepal; [email protected]
2 International Center for Materials Nanoarchitectonics (WPI-MANA), National Institute for MaterialsScience (NIMS), 1-1 Namiki, Ibaraki, Tsukuba 305-0044, Japan; [email protected] (R.G.S.);[email protected] (K.A.)
3 Amrit Campus, Tribhuvan University (TU), Kathmandu 44613, Nepal; [email protected] Department of Advanced Materials Science, Graduate School of Frontier Sciences, The University of Tokyo,
5-1-5 Kashiwanoha, Chiba 277-8561, Japan* Correspondence: [email protected]; Tel.: +81-29-860-4809
Abstract: Nanoporous carbon materials from biomass exhibit a high surface area due to well-definedpore structures. Therefore, they have been extensively used in separation and purification technolo-gies as efficient adsorbents. Here, we report the iodine and methylene blue adsorption propertiesof the hierarchically porous carbon materials prepared from Areca catechu nut. The preparationmethod involves the phosphoric acid (H3PO4) activation of the Areca catechu nut powder. The ef-fects of carbonization conditions (mixing ratio with H3PO4, carbonization time, and carbonizationtemperature) on the textural properties and surface functional groups were studied. The optimumtextural properties were obtained at a mixing ratio of 1:1, carbonized for 3 h at 400 ◦C, and the sampleachieved a high specific surface area of 2132.1 m2 g−1 and a large pore volume of 3.426 cm3 g−1,respectively. The prepared materials have amorphous carbon structures and contain oxygenatedsurface functional groups. Due to the well-defined micro-and mesopore structures with the highsurface area and large pore volume, the optimal sample showed excellent iodine and methylene blueadsorption. The iodine number and methylene blue values were ca. 888 mg g−1 and 369 mg g−1,respectively. The batch adsorption studies of methylene dye were affected by pH, adsorbent dose,contact time, and initial concentration. The optimum parameters for the methylene blue adsorptionwere in alkaline pH, adsorbent dose of 2.8 g L−1, and contact time of 180 min. Equilibrium datacould be best represented by the Langmuir isotherm model with a monolayer adsorption capacity of333.3 mg g−1. Thus, our results demonstrate that the Areca catechu nut has considerable potential asthe novel precursor material for the scalable production of high surface area hierarchically porouscarbon materials that are essential in removing organic dyes from water.
Keywords: Areca catechu nut; chemical activation; nanoporous activated carbon; methylene blueadsorption; iodine adsorption
1. Introduction
Synthetic dyes represent complex aromatic compounds and are extensively used intextile, leather, cosmetics, paper, printing, plastic, rubber, and pharmaceutical industriesto color their products [1]. However, a massive discharge of dye effluents generated fromthese industries into the water sources or the ecosystem adversely affects aquatic life andhuman beings. The persistence of dyes even in small concentrations (<1 mg L−1) in waterreduces light penetration, thus affecting the photosynthetic activities and plant growth andthus destroying marine ecosystems [2] and making the water unfit for human consumption.
C 2022, 8, 2. https://doi.org/10.3390/c8010002 https://www.mdpi.com/journal/carbon
C 2022, 8, 2 2 of 17
The data show that approximately 100 tons/year of dyes are discharged directly into waterstreams by the fabric industry [3].
Methylene blue (MB), a thiazine cationic dye with a complex molecular structure,is highly demanded in textile industries. It is extensively used for biological stainingand coloring paper, hair, cotton, wool, and silk [4,5]. Long-term exposure to MB dye cancause difficulties in breathing, vomiting, eye burns, diarrhea, nausea, anemia, and hyper-tension [5,6]. Its degradation products such as toluidine, benzidine, and other aromaticcomponents are potentially carcinogenic and mutagenic. Furthermore, plant growth canalso be interrupted when MB dye combines with phosphate and lipid molecules in cellmembranes [7]. Hence, the treatment of water and wastewater containing MB dye isnecessary. Different separation methods are applied to reduce MB dye from water andwastewater, such as membrane filtration [8], coagulation–flocculation [9], advanced ox-idation [10], adsorption [11], and electrochemical methods [12]. Among these methods,adsorption has offered the most efficient, facile, and economical alternative for removingMB dye from aqueous solutions [13]. Some of the common adsorbents used for MB dyeremoval include carbon-based materials (e.g., activated carbon), polymeric materials (e.g.,polystyrene), minerals (e.g., zeolite), and metal-organic framework (MOF), etc. [10,14–16].Carbon materials have attracted increasing research attention in recent years because oftheir unique internal structures, excellent performance, and extensive application prospects.Carbon materials with different structural characteristics such as activated carbon [10,11],mesoporous carbon [17], and carbon nanotubes (CNTs) [18] have been used as efficientadsorbents to remove MB dyes from water.
Among carbon materials, nanoporous activated carbons (ACs) are considered as themost concerning adsorbents for dye removal due to their higher specific surface area, hier-archal porous texture composed of ultrafine micropores (0.5–1 nm), micropores (1–2 nm),mesopores (2–50 nm) and macropores (50–100 nm), and extended functionalities on theoutward. The micropore and mesopores volume is the critical index of any AC for theadsorption process of molecular species. Activated carbons with abundant microporesare relevant to gas-phase adsorption systems [19]. Conversely, the ACs with abundantmesopores are relevant to liquid-phase adsorption processes because of the larger size ofliquid molecules [20]. In the past few years, nanoporous carbon materials have become apromising adsorbent for dye removal [21–23]. ACs can be prepared from the carbonaceousmaterials by the chemical activation method, a single-step method in which the precursorsare carbonized in the presence of chemical activating agents at relatively lower tempera-tures 400–600 ◦C [24]. The activating agent helps develop porosity in the AC by pyrolyticdecomposition of the carbonaceous materials through dehydration and degradation re-actions. This more flexible method requires lower activation temperatures and shorteractivation times. In addition, it helps in producing AC with a large surface area and tunableporosity [25]. The commonly used activating agents are H3PO4, zinc chloride (ZnCl2), andpotassium hydroxide (KOH). Among these, H3PO4 and ZnCl2 are used for the activationof lignocellulosic materials that have not been pre-carbonized previously [26]. The use ofH3PO4 as activating agent is preferable to ZnCl2 because of its non-polluting characterthan ZnCl2, its ease of elimination by leaching with water, and the recovered phosphoricacid being recycled for further use. Moreover, H3PO allows developing micropores andmesopores in resulting AC, which enhances mass transfer rates of pollutants [27].
The adsorption capacity of AC depends on the accessibility of the adsorbate moleculesto its micro and mesopores; thus, it becomes necessary for the AC to present a well-structured network of interconnected micro, meso, and macropores. Furthermore, thesurface chemistry of the carbon or carbon hybrid materials plays an essential role in thedye adsorption process [28]. The AC with properly balanced micro/mesoporosity canbe achieved by a well-controlled chemical activation procedure established by specify-ing the preparation condition such as activating reagent/precursor ratio, carbonizationtemperature, and carbonization time for a specific precursor [29].
C 2022, 8, 2 3 of 17
Commercial ACs are more often synthesized from fuel-based precursors such as coal,petroleum coke, peat, and lignite. However, the utilization of coal-based precursors raisedits cost, which limits its widespread applications. The high cost of coal-based AC hasattracted remarkable attention to the production of AC from low-cost, renewable, andeco-friendly raw materials. Recently, extensive efforts have been given to agriculturalwaste or biomass to prepare AC due to their abundant availability at no or little cost [30].For example, activated carbons prepared from Teak Sawdust hydrochars [31] and spentcoffee [32] have shown excellent MB adsorption properties. Accordingly, various agricul-tural waste such as almond shell, walnut shell, apricot kernel shell [33], coconut shell [34],apricot stone [35], cashew nutshell [36], soapnut shell, pineapple waste [37] was used aspotential precursors of ACs for MB dye removal. Among various agricultural bio-resources,Areca catechu represents the potential to be a precursor for carbon production due to itspeculiar structure, composition (67% of carbon from cellulose, amino acids, tannins, andlignin), and easy availability [38]. It is the edible fruit of the Areca palm tree and is native toSouth-East Asia and the Pacific islands. Investigations have shown that fragments of theAreca fruit such as betel nut husk [39,40], Areca nutshell [41], and Areca nut pod [42] hadbeen used for the preparation of AC for dye removal.
In this contribution, we report the iodine and MB adsorption properties of the ACprepared from Areca catechu nut by the H3PO4 activation method. The effects of prepara-tion conditions on the textural properties and iodine and MB adsorption characteristicswere systematically studied. We have found that, under the optimized condition, theAreca catechu Nut-derived AC has an amorphous structure containing oxygen functionalityand exhibits a high specific surface area of ca. 2132.1 m2 g−1 and a large pore volume ofca. 3.426 cm3 g−1, respectively. Furthermore, due to well-defined micro-and mesoporestructures, the optimal sample displayed excellent iodine and methylene blue adsorptionproperties achieving a high iodine number of 888 mg g−1 and methylene blue value of ca.369 mg g−1, respectively. Furthermore, the Langmuir isotherm model could describe MBadsorption with a monolayer adsorption capacity of 333.3 mg g−1. These results revealthat the porous carbon materials prepared from the novel Areca catechu Nut precursor haveconsiderable potential as the adsorbents for water purification, removing organic dyesfrom water.
2. Materials and Methods2.1. Materials
Areca catechu Nut (ACN) was purchased from the local market. Orthophosphoric acid(H3PO4: 88% w/w) and hydrochloric acid (HCl) solution (2M) were purchased from NacalaiTesque Inc. Kyoto, Japan. Methylene blue (MB) and iodine were the products of TokyoChemical Industry, Tokyo, Japan. Millipore filter water was used to prepare solutions.
2.2. Preparation of Nanoporous Activated Carbon Materials
ACs were prepared via the chemical activation method using H3PO4 as the activatingagent. First, ACN was washed with Millipore water to remove the impurities, and it wasdried at 100 ◦C for 12 h. Then, the dried ACN was crushed to powder in a mechanicalcrusher and sieved through a mesh size of <250 µm. Next, ACN powder was chemicallyactivated with H3PO4 and the effects of impregnation ratio (H3PO4: ACN powder = 0.25:1,0.5:1, 1:1, and 1.5:1), carbonization time (2, 3, and 4 h) and carbonization temperature (300,400, and 500 ◦C) on the structure and properties were studied. Next, carbonization wascarried out in a tube furnace (KOYO, Tokyo, Japan) under nitrogen gas flow (120 cc min−1),and the temperature ramp was 5 ◦C min−1. After cooling, the carbonized products werewashed with Millipore filter water several times until the supernatant liquid attained pH 7and dried at 120 ◦C in a vacuum oven. The obtained products are designated as ANCx_y_z,where x, y, and z, respectively, represent the ratio of H3PO4, carbonization temperature,and carbonization time.
C 2022, 8, 2 4 of 17
2.3. Yield of the Prepared Carbon
The yield of prepared ANC was calculated on a chemical-free basis. The yield isregarded as an indicator of the process efficiency for the chemical activation process. Theyield of ANC was calculated by using the following equation.
Yield (%) =Weight o f activated carbon
Weight o f Areca Catechu Nut powder× 100 (1)
2.4. Characterizations
The surface and textural properties of the raw precursor and the ANCs were in-vestigated. Thermogravimetric analysis (TGA) of ANP powder was performed on anSII Instrument (Model Exstar 600) from 25 to 1000 ◦C at a temperature ramp of 10 ◦Cmin–1 under nitrogen gas atmosphere. The ANCs were characterized by powder X-raydiffraction (XRD: Rigaku X-ray diffractometer RINT, Japan, Cu-Kα radiation, ran at 40 kVand 40 mA at 25 ◦C in the diffraction angles range from 10 to 50◦), Raman spectroscopy(NRS-3100, JASCO, Tokyo, Japan), Fourier-transform infrared (FTIR) spectroscopy (Nicolet4700, Thermo Electron Corporation, Waltham, MA, USA), scanning electron microscopy(SEM: S-4800, Hitachi Co., Ltd. Tokyo, Japan operated at 10 kV), transmission electronmicroscopy (TEM: JEOL Model JEM2100F, Tokyo, Japan operated at 200 kV), and ni-trogen adsorption/desorption isotherms (Quantachrome Autosorb-iQ2, Boynton Beach,FL, USA). Nitrogen adsorption/desorption isotherm analysis estimated specific surfacearea, total pore volume, and pore size distribution were estimated from nitrogen adsorp-tion/desorption isotherm analysis. Pore dimensions and pore volumes were calculatedby using the density functional theory (DFT) and Barrett–Joyner–Halenda (BJH) methods.About 35 mg of sample was placed in a glass cell and degassed at 120 ◦C for 24 h beforerecording the nitrogen adsorption isotherm.
2.5. Iodine and Methylene Blue Number
Iodine number (IN) indicates the micro-porosity of ACs. It is defined as the milligramof iodine adsorbed per g of carbon [43]. Following the standard method [44] iodine numberwas. In determining the iodine number, HCl solution (5 wt%: 5 mL) was added to ANC(1 g) and was allowed to boil. After cooling the solution, iodine solution (10 mL: 0.1N)was added and shaken vigorously for 1 min, filtered, and washed with distilled water.The whole of the filtrate was titrated against 0.1 N sodium thiosulphate using starch as anindicator. The iodine number was calculated as:
IN =Weight o f iodine adsorbed on carbon (mg)
Weight o f carbon (g)(2)
Methylene blue number (MBN) indicates the mesoporosity of ACs. It is defined asthe maximum amount of dye in mg adsorbed per g of adsorbent. MBN of the ANs wasdetermined by single point adsorption isotherm studies [45]. In this single-point adsorp-tion isotherm method, 0.1 g of AC was mixed with 75 mL MB solution of concentrations1000 mg L−1 each separately. The suspension was stirred intermittently in an electricshaker at 200 rpm for 3 h at room temperature (25 ◦C). After that, the solution was fil-tered, and the remaining concentration of methylene blue was analyzed using a UV/Visspectrophotometer (CECIL-CE-100) at absorbance 664 nm. The MBN was calculated as:
MBN =Co − Ce × V
M(3)
where Co = concentration of the MB solution (mg L−1), Ce = concentration of the MBsolution at equilibrium time (mg L−1), V = volume of solution (L), and M = mass ofactivated carbon added (g).

C 2022, 8, 2 5 of 17
2.6. Adsorption of MB Dye
MB dye adsorption on the prepared ANC was performed by batch experiments at25 ◦C. The effects of adsorption parameters such as contact time, adsorbent dose, pH,and initial dye concentration have been studied. The experiments were carried out in100 mL stoppered conical flasks by mixing a definite ANC with 25 mL of dye solution.The suspensions were agitated on an electric shaker (Digital VDRL Rotator) at a rotationspeed of 160 rpm. After equilibrium, the suspensions were filtered, and the residual dyeconcentration of the filtrates was analyzed by a UV-visible. The absorbance was measuredat the maximum absorption wavelength of 664 nm.
2.6.1. Effect of Contact Time
The effect of contact time on the percentage of MB dye adsorption by the ANC wasinvestigated at different time intervals in the range of 15 to 280 min. Other parameters werekept constant (adsorbent dose 1 g L−1, initial MB concentration 350 mg L−1, and pH 6.5).
Percentage adsorption of MB dye adsorbed was calculated by using the followingequation.
Removal (%) =(Co − Ce)× 100
Co(4)
where Co = initial concentration of MB dye (mg L−1); Ce = equilibrium concentration ofMB dye solution (mg L−1).
2.6.2. Effect of Dose
Effect of adsorbent dose on the percentage of MB dye adsorption by the ANC was stud-ied by varying the adsorbent dose from 0.04 g L−1 to 4.8 g L−1, keeping other parametersconstant (initial MB concentration 850 mg L−1, contact time 180 min and pH 6.5).
2.6.3. Effect of pH
Effect of pH on the percentage of MB dye adsorption by the ANC was studied in thepH range of 2 to 12 while maintaining all other variables constant (adsorbent dose 1 g L−1,initial MB concentration 450 mg L−1 and contact time 180 min). The pH of solutions wasmaintained using either 0.1 M HCl or 0.1 M NaOH.
2.6.4. Effect of Initial Concentration of MB
The effect of initial MB concentration on the adsorption phenomenon was studied bychanging the initial concentration from 300 to 650 mg mL−1 dye concentration at 25 ◦C. Theadsorbent dose, pH, and contact time were set to 1 g L−1, 6.5, and 180 min, respectively.
2.6.5. Adsorption Isotherms
The adsorption isotherm experiments were carried out by agitating 25 mL of dyesolutions of various initial dye concentrations varying from 350 to 650 mg L−1. Otherparameters were kept constant, such as adsorbent dose 1 g L−1, contact time 180 min, andpH 6.5. The amount of dye adsorbed in milligram per gram (qe) was determined by:
qe =(Co − Ce)× V
M(5)
where V = volume of MB dye solution (L); M = mass of the ANC (g). Thus, obtainedexperimental data were analyzed using Langmuir and Freundlich models. The linearizedform of Langmuir adsorption isotherm can be described as
Ce
qe=
1qmKL
+
(1
qm
)Ce (6)
C 2022, 8, 2 6 of 17
where Ce, qe, qm, and KL represents equilibrium concentration of solution (mg L–1), amountof adsorbate adsorbed (by 1 g of adsorbent) maximum amount of adsorbate (mg g−1), andthe Langmuir adsorption constant (L mg–1), respectively.
Freundlich isotherm assumes the non-ideal systems, including multi-molecular ad-sorption on a heterogeneous surface. The linearized form of Freundlich adsorption isothermcan be expressed as:
log qe = log KF +
(1n
)log Ce (7)
where KF represents the Freundlich constant and n indicates the adsorption intensity.
3. Results and Discussion3.1. TGA and FTIR Analysis of Areca catechu Nut Powder
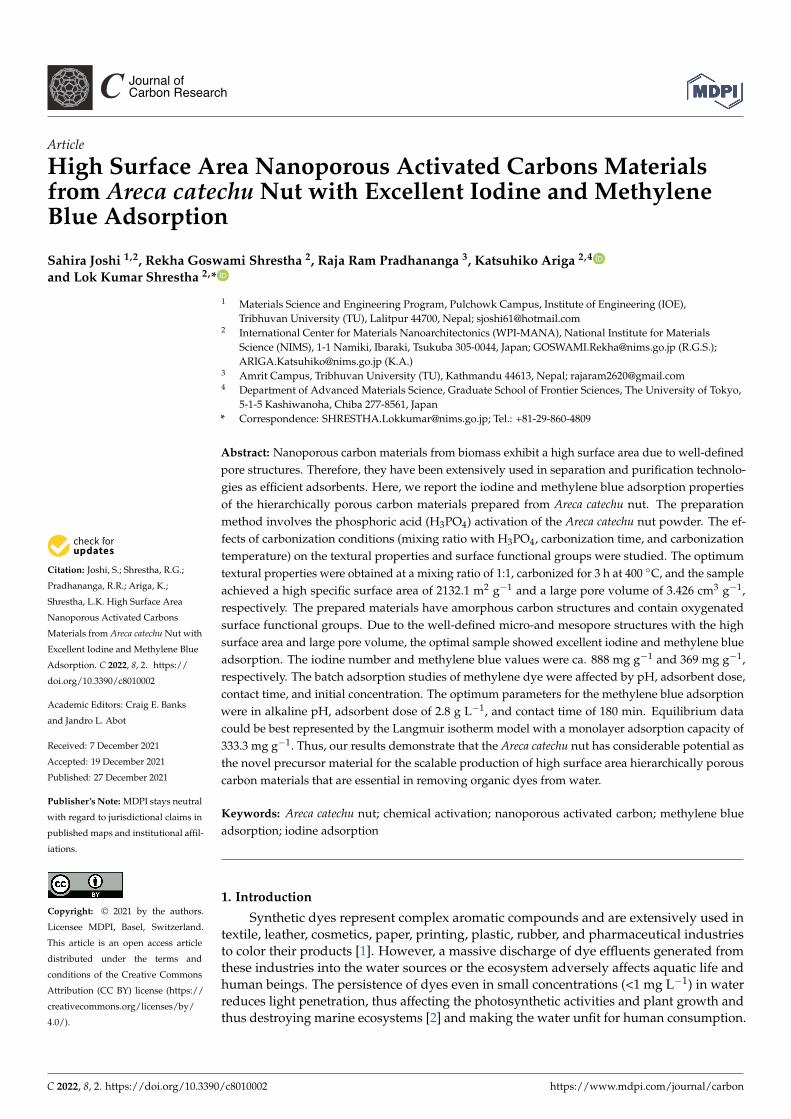
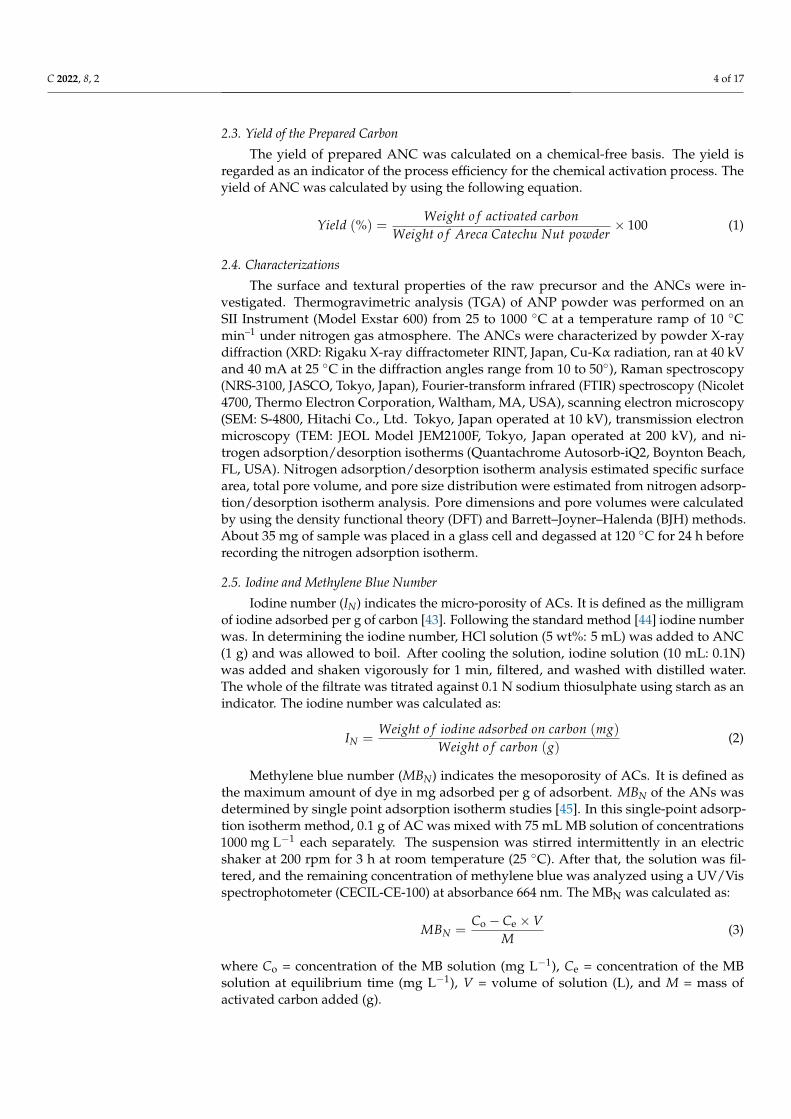
TGA analysis was performed to analyze the pyrolysis properties, and ANP precursormaterial’s mass-temperature relationship. Figure 1a shows the TGA curve recorded from 25to 1000 ◦C under the nitrogen gas atmosphere. The curve shows that the pyrolysis processof the ANP follows in three stages: evaporation of crystal water or moisture (around at100 ◦C), polymerization of cellulosic materials and degradation of carbohydrates or lipids(in the range of 200 to 400 ◦C), and release of volatile gaseous or tar formed during thepyrolysis (above 400 ◦C). Above 600 ◦C, there is no noticeable mass loss, suggesting thesuccessful transformation of ANP into carbon materials. Therefore, we performed thecarbonization in a low-temperature region (300 to 500 ◦C) in the present study.
C 2022, 8, x FOR PEER REVIEW 6 of 17
where V = volume of MB dye solution (L); M = mass of the ANC (g). Thus, obtained ex-perimental data were analyzed using Langmuir and Freundlich models. The linearized form of Langmuir adsorption isotherm can be described as 𝐶𝑞 = 1𝑞 𝐾 + 1𝑞 𝐶 (6)
where Ce, qe, qm, and KL represents equilibrium concentration of solution (mg L–1), amount of adsorbate adsorbed (by 1 g of adsorbent) maximum amount of adsorbate (mg g−1), and the Langmuir adsorption constant (L mg–1), respectively.
Freundlich isotherm assumes the non-ideal systems, including multi-molecular ad-sorption on a heterogeneous surface. The linearized form of Freundlich adsorption iso-therm can be expressed as: log 𝑞 = log𝐾 + 1𝑛 log𝐶 (7)
where KF represents the Freundlich constant and n indicates the adsorption intensity.
3. Results and Discussion 3.1. TGA and FTIR Analysis of Areca catechu Nut Powder
TGA analysis was performed to analyze the pyrolysis properties, and ANP precursor material’s mass-temperature relationship. Figure 1a shows the TGA curve recorded from 25 to 1000 °C under the nitrogen gas atmosphere. The curve shows that the pyrolysis pro-cess of the ANP follows in three stages: evaporation of crystal water or moisture (around at 100 °C), polymerization of cellulosic materials and degradation of carbohydrates or li-pids (in the range of 200 to 400 °C), and release of volatile gaseous or tar formed during the pyrolysis (above 400 °C). Above 600 °C, there is no noticeable mass loss, suggesting the successful transformation of ANP into carbon materials. Therefore, we performed the carbonization in a low-temperature region (300 to 500 °C) in the present study.
Figure 1. (a) TGA curve of ANP. (b) Corresponding FTIR spectrum.
As seen in Figure 1b, ANP precursor materials contain several oxygenated surface functional groups. The broad peak located at 3421 cm−1 reflects the O–H stretching vibra-tion of hydroxyl groups, while the bands at 2917 and 2849 cm−1 correspond to the C–H stretching vibration of CH3 and CH2 groups of cellulose. The band at 1737 cm−1 can be assigned to the C=O stretching vibration of acetyl groups in lignin and ester groups in hemicelluloses. The band around 1617 cm−1 may be assigned to the bending vibration of O–H groups bound to the cellulose structure [42]. In addition, the absorption band at 1550 and 1250 cm−1 arise from the aromatic C=C stretching and the C–O stretching of guaiacyl unit in lignin, respectively. The band around 1441 cm−1 can be assigned to the C-H defor-mation in methoxyl, and aromatic skeletal vibrations in lignin and the band at 1370 cm−1 can be associated with the C-H symmetric deformation that is typical in cellulose and hemicelluloses [46,47]. The bands in the regions 1000–1180 and 900–650 cm−1 represent the stretching and asymmetric vibrations of C-O, C-C, and C-O-C and C-H bending vibration
Figure 1. (a) TGA curve of ANP. (b) Corresponding FTIR spectrum.
As seen in Figure 1b, ANP precursor materials contain several oxygenated surfacefunctional groups. The broad peak located at 3421 cm−1 reflects the O–H stretching vibra-tion of hydroxyl groups, while the bands at 2917 and 2849 cm−1 correspond to the C–Hstretching vibration of CH3 and CH2 groups of cellulose. The band at 1737 cm−1 can beassigned to the C=O stretching vibration of acetyl groups in lignin and ester groups inhemicelluloses. The band around 1617 cm−1 may be assigned to the bending vibrationof O–H groups bound to the cellulose structure [42]. In addition, the absorption band at1550 and 1250 cm−1 arise from the aromatic C=C stretching and the C–O stretching ofguaiacyl unit in lignin, respectively. The band around 1441 cm−1 can be assigned to theC-H deformation in methoxyl, and aromatic skeletal vibrations in lignin and the band at1370 cm−1 can be associated with the C-H symmetric deformation that is typical in celluloseand hemicelluloses [46,47]. The bands in the regions 1000–1180 and 900–650 cm−1 repre-sent the stretching and asymmetric vibrations of C-O, C-C, and C-O-C and C-H bendingvibration related to cellulose hemicellulose the aromatic ring. Thus, the FTIR spectrum ofthe biomass-based ANP precursor confirms the presence of cellulose, hemicelluloses, asexpected for lignocellulosic materials [48].
C 2022, 8, 2 7 of 17
3.2. Yield
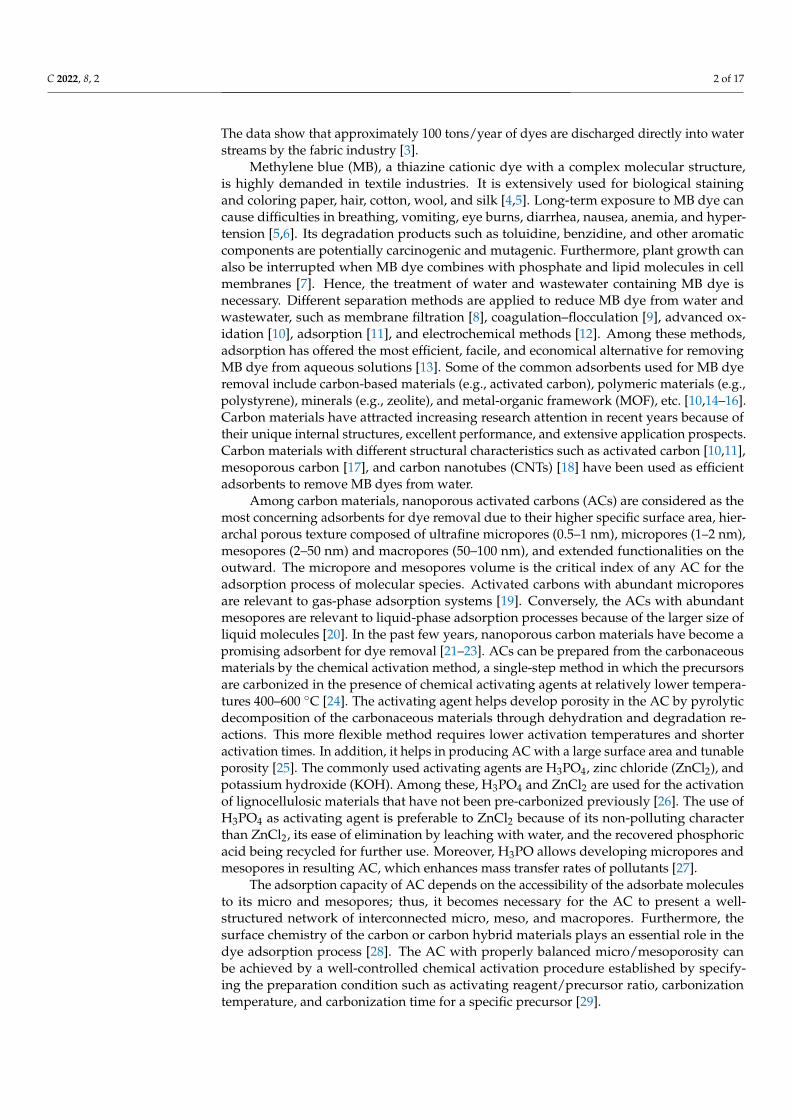
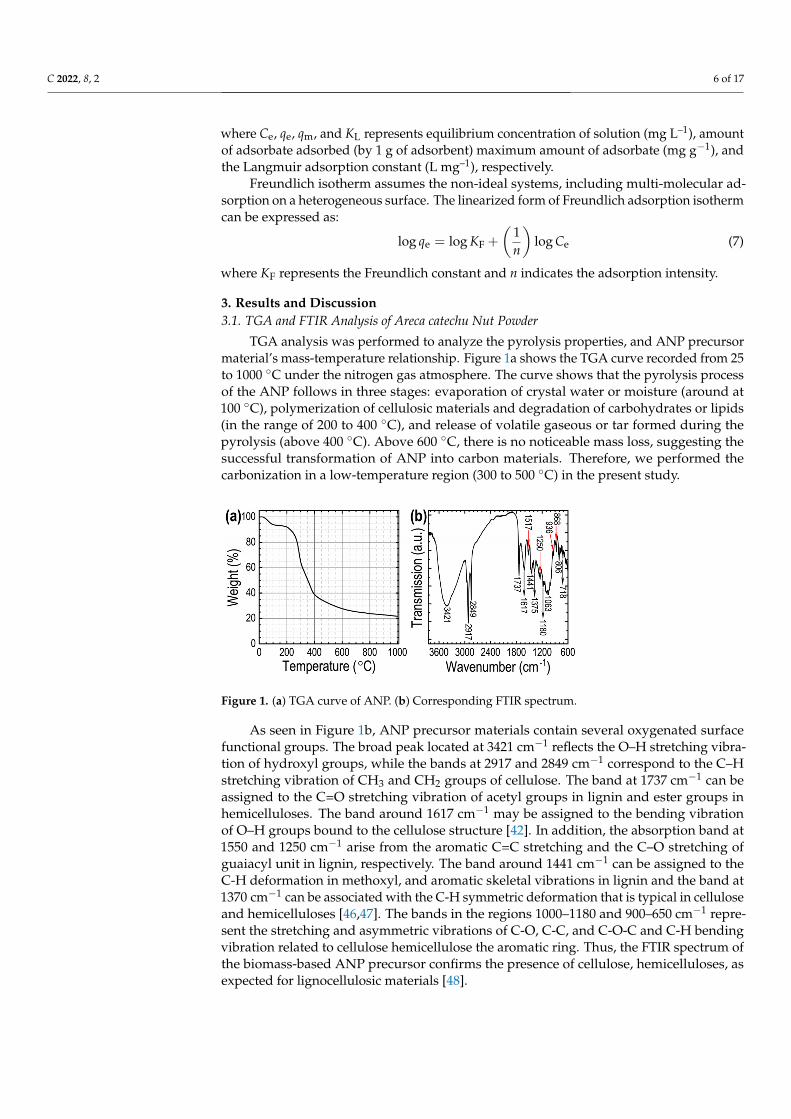
Yield is an essential parameter in the preparation of nanoporous activated carbonmaterials related to the industrial production cost. Therefore, we have studied the yield (%)of the ANC by altering the carbonization conditions of impregnation ratio, carbonizationtime, and carbonization temperature. Figure 2 shows the yield vs. carbonization conditions.
C 2022, 8, x FOR PEER REVIEW 7 of 17
related to cellulose hemicellulose the aromatic ring. Thus, the FTIR spectrum of the bio-mass-based ANP precursor confirms the presence of cellulose, hemicelluloses, as expected for lignocellulosic materials [48].
3.2. Yield Yield is an essential parameter in the preparation of nanoporous activated carbon
materials related to the industrial production cost. Therefore, we have studied the yield (%) of the ANC by altering the carbonization conditions of impregnation ratio, carboniza-tion time, and carbonization temperature. Figure 2 shows the yield vs. carbonization con-ditions.
Figure 2. The effects of carbonization conditions on the yield (%) of ANC: (a) yield vs. H3PO4 im-pregnation ratio; (b) yield vs. carbonization time; (c) yield vs. carbonization temperature.
As shown in Figure 2a, the yield decreases gradually with the impregnation ratio of activating agent (H3PO4). Note that in H3PO4 activation of lignocellulosic materials, the acid first attacks hemicellulose and lignin because the cellulose is more resistant to acid hydrolysis. The acid hydrolyzes glycosidic linkages in the lignocellulose, promotes the rupture of aryl ether bond in lignin, and forms crosslinks via cyclization, dehydration, degradation, and condensation processes. Furthermore, it combines with organic polymer to form phosphate and polyphosphate bridges that connect and crosslink polymer frag-ments. The process is followed by the evolution of volatile matter such as CO2, CO, and CH4, increasing aromaticity. The high acid concentration could react with the carbon and volatile matter and diffuse out of the surface of the particles faster during the activation process. It increases the gasification of surface carbon atoms, thus leading to an increase in weight loss and a decrease in carbon yield. The mangrove-based AC showed a similar trend [49].
In Figure 2b,c, the yield of ANC follows the decreasing trend with an increase in the carbonization time and carbonization temperature. Increasing carbonization time en-hances the burn-off and tar volatilization by losing phosphate compounds from the car-bonized product, leading to decreased carbon yield. Similarly, the decreases in the carbon yield with increasing carbonization temperature could be due to aromatic condensation reactions among the small polyaromatic units, increasing the evolution of gaseous prod-ucts and loss of phosphate compounds from the hydroaromatic structure of carbonized char. It resulted in an increased release of volatile matters to further decrease the yield [50]. Similar trends in the yields with carbonizing temperature and carbonization time have been reported for the AC from pre-leached cassava peels [51] and sugarcane bagasse [47], respectively.
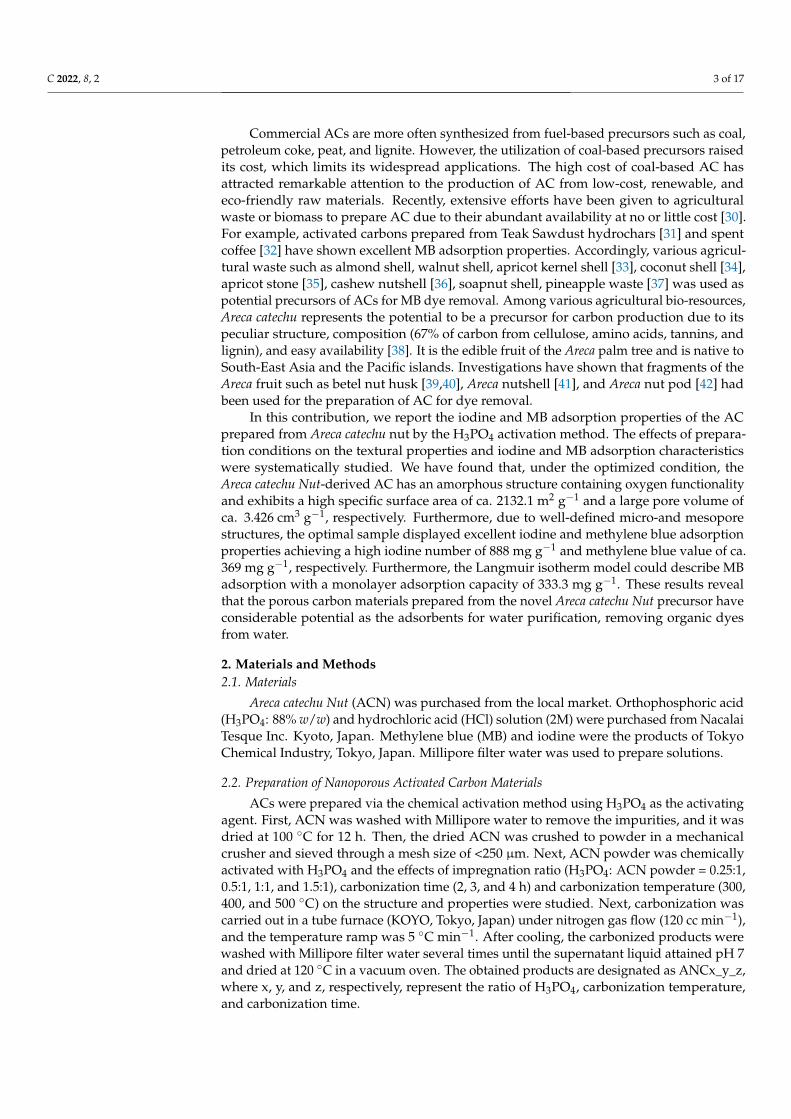
3.3. Characterizations: XRD, Raman Scattering and FTIR Figure 3 shows the XRD patterns, Raman scattering spectra, and FTIR spectra of the
prepared carbon samples. All the carbon samples exhibit two broad X-ray diffraction peaks: a distinct peak at 24° and a less intense peak at 43.5° in the XRD patterns (Figure 3a). These diffraction peaks correspond to the (002) and (100) lattice planes of graphitic
Figure 2. The effects of carbonization conditions on the yield (%) of ANC: (a) yield vs. H3PO4
impregnation ratio; (b) yield vs. carbonization time; (c) yield vs. carbonization temperature.
As shown in Figure 2a, the yield decreases gradually with the impregnation ratio ofactivating agent (H3PO4). Note that in H3PO4 activation of lignocellulosic materials, theacid first attacks hemicellulose and lignin because the cellulose is more resistant to acidhydrolysis. The acid hydrolyzes glycosidic linkages in the lignocellulose, promotes therupture of aryl ether bond in lignin, and forms crosslinks via cyclization, dehydration,degradation, and condensation processes. Furthermore, it combines with organic polymerto form phosphate and polyphosphate bridges that connect and crosslink polymer frag-ments. The process is followed by the evolution of volatile matter such as CO2, CO, andCH4, increasing aromaticity. The high acid concentration could react with the carbon andvolatile matter and diffuse out of the surface of the particles faster during the activationprocess. It increases the gasification of surface carbon atoms, thus leading to an increasein weight loss and a decrease in carbon yield. The mangrove-based AC showed a similartrend [49].
In Figure 2b,c, the yield of ANC follows the decreasing trend with an increase in thecarbonization time and carbonization temperature. Increasing carbonization time enhancesthe burn-off and tar volatilization by losing phosphate compounds from the carbonizedproduct, leading to decreased carbon yield. Similarly, the decreases in the carbon yieldwith increasing carbonization temperature could be due to aromatic condensation reactionsamong the small polyaromatic units, increasing the evolution of gaseous products and lossof phosphate compounds from the hydroaromatic structure of carbonized char. It resultedin an increased release of volatile matters to further decrease the yield [50]. Similar trendsin the yields with carbonizing temperature and carbonization time have been reported forthe AC from pre-leached cassava peels [51] and sugarcane bagasse [47], respectively.
3.3. Characterizations: XRD, Raman Scattering and FTIR
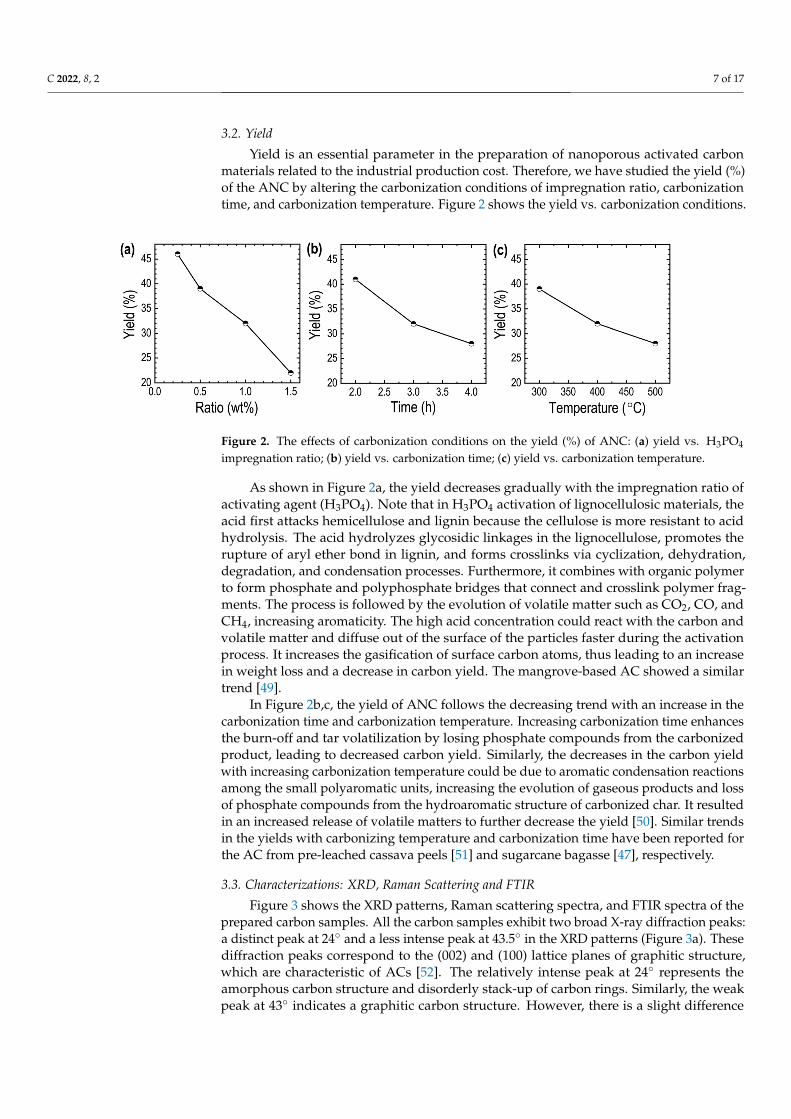
Figure 3 shows the XRD patterns, Raman scattering spectra, and FTIR spectra of theprepared carbon samples. All the carbon samples exhibit two broad X-ray diffraction peaks:a distinct peak at 24◦ and a less intense peak at 43.5◦ in the XRD patterns (Figure 3a). Thesediffraction peaks correspond to the (002) and (100) lattice planes of graphitic structure,which are characteristic of ACs [52]. The relatively intense peak at 24◦ represents theamorphous carbon structure and disorderly stack-up of carbon rings. Similarly, the weakpeak at 43◦ indicates a graphitic carbon structure. However, there is a slight difference
C 2022, 8, 2 8 of 17
in the graphite crystallinity and intensity of the (002) and (100) peaks in which differentpreparation conditions may cause.
C 2022, 8, x FOR PEER REVIEW 8 of 17
structure, which are characteristic of ACs [52]. The relatively intense peak at 24° repre-sents the amorphous carbon structure and disorderly stack-up of carbon rings. Similarly, the weak peak at 43° indicates a graphitic carbon structure. However, there is a slight difference in the graphite crystallinity and intensity of the (002) and (100) peaks in which different preparation conditions may cause.
Figure 3. (a) XRD patterns; (b) Raman scattering; (c) FTIR spectra of ANP derived nanoporous car-bon materials.
Raman scattering spectra exhibit two broad Raman bands: the first peak detected in the range of 1339 and 1348 cm−1 can be assigned to the defect or disordered phase (D-band), and the second peak at 1593 cm−1 can be attributed to the graphitic phase (G-band) of carbon (Figure 3b). The D-band represents the vibrations of carbon atoms having a dan-gling bond in the terminations of the disordered graphite structure, whereas the G-band represents the stretching vibration mode of the sp2 hybridized carbon atoms in the graph-ite layer [53]. Furthermore, the ratio of the intensities of D-band and G-band (IG/ID) measures disorder in carbon materials with the graphitic structure. The IG/ID increases with the decrease in crystallinity. The carbon samples exhibited IG/ID ratios in the range of 1.10 to 1.42, indicating the formation of amorphous graphitic carbon with a minimal de-gree of defects. Careful observations reveal that the IG/ID ratio decreases from 1.42 to 1.27 upon the increase in the H3PO4 impregnation ratio from 0.25 to 1.5, indicating more and more defects in the carbon framework. An increase in carbonization temperature from 300 to 500 °C decreases the IG/ID ratio from 1.10 to 1.41, demonstrating an increase in the gra-phitic carbon. An increase in the hold time during carbonization at a fixed temperature of 400 °C does not cause any significant effect on carbon microstructure. The IG/ID ratio re-mains apparently unchanged. Note that the Areca catechu nut-derived amorphous carbon materials with a partial graphitic structure are similar to bimetallic ZIF carbon [54,55]. The degree of graphitic structure strongly affects electrical conductivity, specific area, pore size, and wettability and thus influences the carbon materials’ performance in sensing, separation, and energy storage.
Notably, FTIR spectra of all the ANC samples possess almost similar vibrational bands (Figure 3c) with slight differences in their intensities. The weak broad peak at 3410 cm−1 corresponds to the O–H symmetric stretching vibration of the H2O molecules. How-
Figure 3. (a) XRD patterns; (b) Raman scattering; (c) FTIR spectra of ANP derived nanoporouscarbon materials.
Raman scattering spectra exhibit two broad Raman bands: the first peak detectedin the range of 1339 and 1348 cm−1 can be assigned to the defect or disordered phase(D-band), and the second peak at 1593 cm−1 can be attributed to the graphitic phase (G-band) of carbon (Figure 3b). The D-band represents the vibrations of carbon atoms havinga dangling bond in the terminations of the disordered graphite structure, whereas theG-band represents the stretching vibration mode of the sp2 hybridized carbon atoms in thegraphite layer [53]. Furthermore, the ratio of the intensities of D-band and G-band (IG/ID)measures disorder in carbon materials with the graphitic structure. The IG/ID increaseswith the decrease in crystallinity. The carbon samples exhibited IG/ID ratios in the rangeof 1.10 to 1.42, indicating the formation of amorphous graphitic carbon with a minimaldegree of defects. Careful observations reveal that the IG/ID ratio decreases from 1.42 to1.27 upon the increase in the H3PO4 impregnation ratio from 0.25 to 1.5, indicating moreand more defects in the carbon framework. An increase in carbonization temperature from300 to 500 ◦C decreases the IG/ID ratio from 1.10 to 1.41, demonstrating an increase in thegraphitic carbon. An increase in the hold time during carbonization at a fixed temperatureof 400 ◦C does not cause any significant effect on carbon microstructure. The IG/ID ratioremains apparently unchanged. Note that the Areca catechu nut-derived amorphous carbonmaterials with a partial graphitic structure are similar to bimetallic ZIF carbon [54,55]. Thedegree of graphitic structure strongly affects electrical conductivity, specific area, poresize, and wettability and thus influences the carbon materials’ performance in sensing,separation, and energy storage.
Notably, FTIR spectra of all the ANC samples possess almost similar vibrational bands(Figure 3c) with slight differences in their intensities. The weak broad peak at 3410 cm−1
corresponds to the O–H symmetric stretching vibration of the H2O molecules. However,in some cases, -OH functional groups almost disappeared during the high-temperaturecarbonization/activation process. The small peak at 1710 cm−1 can be assigned to the
C 2022, 8, 2 9 of 17
C=O stretching vibrations of carboxylic acids. The strong peak centered at 1580 cm−1 maybe assigned to the stretched vibrations of the aromatic C=C bond, a typical characteristicof carbonaceous materials. It could form by decomposition of C–H bonds to form morestable aromatic C=C bonds at the higher carbonization/activation temperatures. The smallpeaks at 1430 and 1270 cm−1 can be ascribed to the C-C stretching vibration of CH2 or CH3groups and the C–O stretching in carboxylic groups or the C–O–C stretching vibration.Furthermore, a weak peak at 890 cm−1 can be assigned to the C-H bending vibrations ofaromatic rings. The result agrees with the surface chemistry of the nano-porous preparedfrom Lapsi seed stone [52]. Thus, FT-IR analysis results of ANCs confirm the existence ofoxygenated surface functional groups such as –OH, –CO, COOH, and lactones that couldbe potential adsorption sites for interaction with the cationic MB dye.
3.4. Electron Microscopy: SEM and TEM Observations
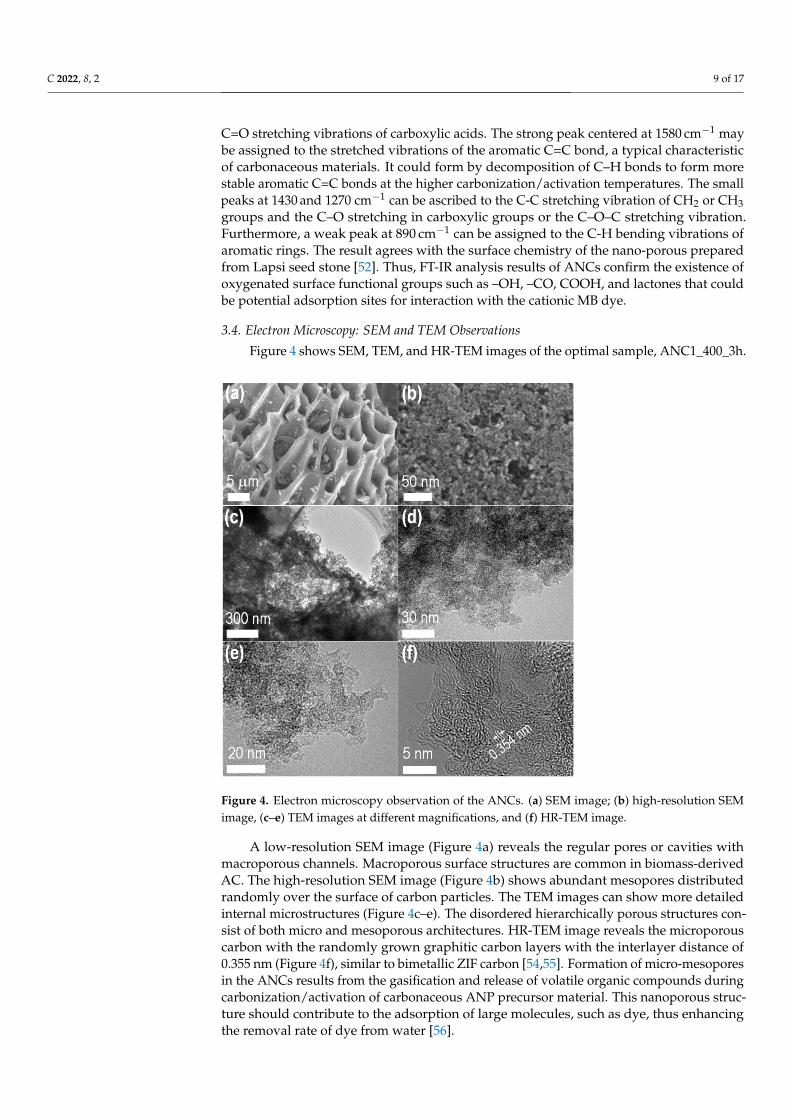
Figure 4 shows SEM, TEM, and HR-TEM images of the optimal sample, ANC1_400_3h.
C 2022, 8, x FOR PEER REVIEW 9 of 17
ever, in some cases, -OH functional groups almost disappeared during the high-tempera-ture carbonization/activation process. The small peak at 1710 cm−1 can be assigned to the C=O stretching vibrations of carboxylic acids. The strong peak centered at 1580 cm−1 may be assigned to the stretched vibrations of the aromatic C=C bond, a typical characteristic of carbonaceous materials. It could form by decomposition of C–H bonds to form more stable aromatic C=C bonds at the higher carbonization/activation temperatures. The small peaks at 1430 and 1270 cm−1 can be ascribed to the C-C stretching vibration of CH2 or CH3 groups and the C–O stretching in carboxylic groups or the C–O–C stretching vibration. Furthermore, a weak peak at 890 cm−1 can be assigned to the C-H bending vibrations of aromatic rings. The result agrees with the surface chemistry of the nano-porous prepared from Lapsi seed stone [52]. Thus, FT-IR analysis results of ANCs confirm the existence of oxygenated surface functional groups such as –OH, –CO, COOH, and lactones that could be potential adsorption sites for interaction with the cationic MB dye.
3.4. Electron Microscopy: SEM and TEM Observations Figure 4 shows SEM, TEM, and HR-TEM images of the optimal sample, ANC1_400_3h.
Figure 4. Electron microscopy observation of the ANCs. (a) SEM image; (b) high-resolution SEM image, (c–e) TEM images at different magnifications, and (f) HR-TEM image.
A low-resolution SEM image (Figure 4a) reveals the regular pores or cavities with macroporous channels. Macroporous surface structures are common in biomass-derived AC. The high-resolution SEM image (Figure 4b) shows abundant mesopores distributed randomly over the surface of carbon particles. The TEM images can show more detailed internal microstructures (Figure 4c–e). The disordered hierarchically porous structures consist of both micro and mesoporous architectures. HR-TEM image reveals the mi-croporous carbon with the randomly grown graphitic carbon layers with the interlayer distance of 0.355 nm (Figure 4f), similar to bimetallic ZIF carbon [54,55]. Formation of mi-cro-mesopores in the ANCs results from the gasification and release of volatile organic compounds during carbonization/activation of carbonaceous ANP precursor material. This nanoporous structure should contribute to the adsorption of large molecules, such as dye, thus enhancing the removal rate of dye from water [56].
Figure 4. Electron microscopy observation of the ANCs. (a) SEM image; (b) high-resolution SEMimage, (c–e) TEM images at different magnifications, and (f) HR-TEM image.
A low-resolution SEM image (Figure 4a) reveals the regular pores or cavities withmacroporous channels. Macroporous surface structures are common in biomass-derivedAC. The high-resolution SEM image (Figure 4b) shows abundant mesopores distributedrandomly over the surface of carbon particles. The TEM images can show more detailedinternal microstructures (Figure 4c–e). The disordered hierarchically porous structures con-sist of both micro and mesoporous architectures. HR-TEM image reveals the microporouscarbon with the randomly grown graphitic carbon layers with the interlayer distance of0.355 nm (Figure 4f), similar to bimetallic ZIF carbon [54,55]. Formation of micro-mesoporesin the ANCs results from the gasification and release of volatile organic compounds duringcarbonization/activation of carbonaceous ANP precursor material. This nanoporous struc-ture should contribute to the adsorption of large molecules, such as dye, thus enhancingthe removal rate of dye from water [56].
C 2022, 8, 2 10 of 17
3.5. Surface Textural Properties: Nitrogen Adsorption/Desorption
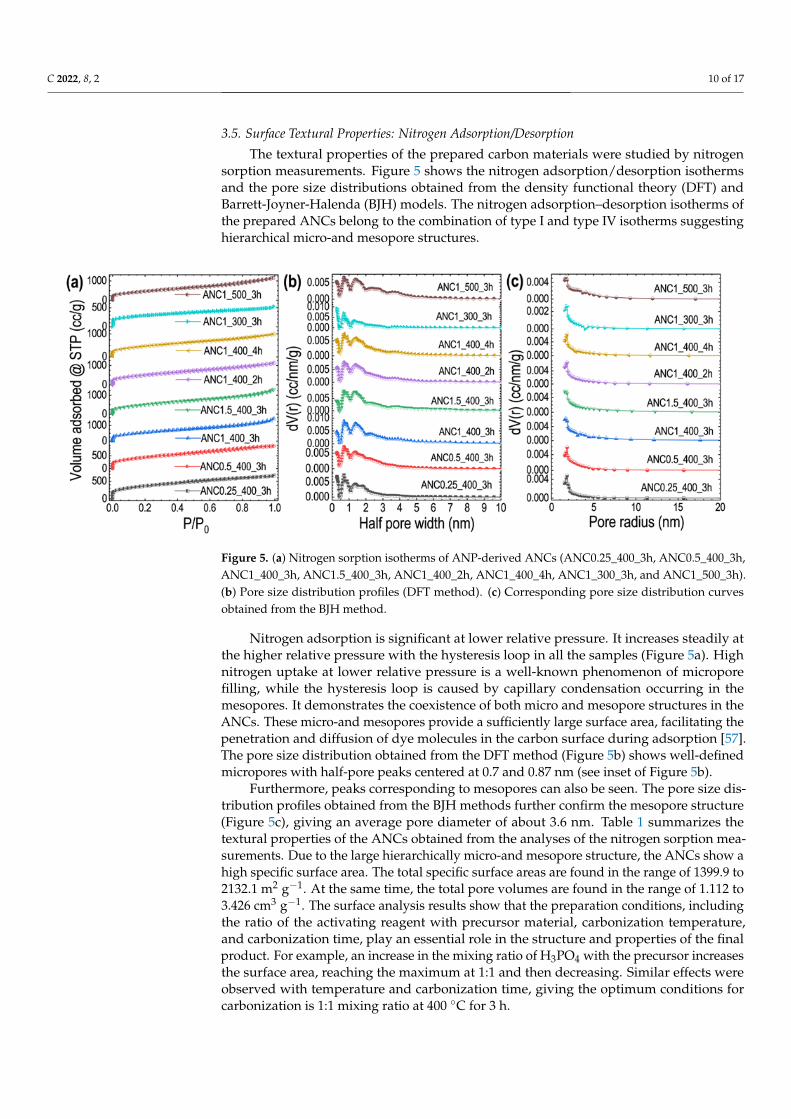
The textural properties of the prepared carbon materials were studied by nitrogensorption measurements. Figure 5 shows the nitrogen adsorption/desorption isothermsand the pore size distributions obtained from the density functional theory (DFT) andBarrett-Joyner-Halenda (BJH) models. The nitrogen adsorption–desorption isotherms ofthe prepared ANCs belong to the combination of type I and type IV isotherms suggestinghierarchical micro-and mesopore structures.
C 2022, 8, x FOR PEER REVIEW 10 of 17
3.5. Surface Textural Properties: Nitrogen Adsorption/Desorption The textural properties of the prepared carbon materials were studied by nitrogen
sorption measurements. Figure 5 shows the nitrogen adsorption/desorption isotherms and the pore size distributions obtained from the density functional theory (DFT) and Barrett-Joyner-Halenda (BJH) models. The nitrogen adsorption–desorption isotherms of the prepared ANCs belong to the combination of type I and type IV isotherms suggesting hierarchical micro-and mesopore structures.
Figure 5. (a) Nitrogen sorption isotherms of ANP-derived ANCs (ANC0.25_400_3h, ANC0.5_400_3h, ANC1_400_3h, ANC1.5_400_3h, ANC1_400_2h, ANC1_400_4h, ANC1_300_3h, and ANC1_500_3h). (b) Pore size distribution profiles (DFT method). (c) Corresponding pore size distribution curves obtained from the BJH method.
Nitrogen adsorption is significant at lower relative pressure. It increases steadily at the higher relative pressure with the hysteresis loop in all the samples (Figure 5a). High nitrogen uptake at lower relative pressure is a well-known phenomenon of micropore filling, while the hysteresis loop is caused by capillary condensation occurring in the mesopores. It demonstrates the coexistence of both micro and mesopore structures in the ANCs. These micro-and mesopores provide a sufficiently large surface area, facilitating the penetration and diffusion of dye molecules in the carbon surface during adsorption [57]. The pore size distribution obtained from the DFT method (Figure 5b) shows well-defined micropores with half-pore peaks centered at 0.7 and 0.87 nm (see inset of Figure 5b).
Furthermore, peaks corresponding to mesopores can also be seen. The pore size distribution profiles obtained from the BJH methods further confirm the mesopore structure (Figure 5c), giving an average pore diameter of about 3.6 nm. Table 1 summarizes the textural properties of the ANCs obtained from the analyses of the nitrogen sorption measurements. Due to the large hierarchically micro-and mesopore structure, the ANCs show a high specific surface area. The total specific surface areas are found in the range of 1399.9 to 2132.1 m2 g−1. At the same time, the total pore volumes are found in the range of 1.112 to 3.426 cm3 g−1. The surface analysis results show that the preparation conditions, including the ratio of the activating reagent with precursor material, carbonization temperature, and carbonization time, play an essential role in the structure and properties of the final product. For example, an increase in the mixing ratio of H3PO4 with the precursor increases the surface area, reaching the maximum at 1:1 and then decreasing. Similar effects were observed with temperature and carbonization time, giving the optimum conditions for carbonization is 1:1 mixing ratio at 400 °C for 3 h.
Figure 5. (a) Nitrogen sorption isotherms of ANP-derived ANCs (ANC0.25_400_3h, ANC0.5_400_3h,ANC1_400_3h, ANC1.5_400_3h, ANC1_400_2h, ANC1_400_4h, ANC1_300_3h, and ANC1_500_3h).(b) Pore size distribution profiles (DFT method). (c) Corresponding pore size distribution curvesobtained from the BJH method.
Nitrogen adsorption is significant at lower relative pressure. It increases steadily atthe higher relative pressure with the hysteresis loop in all the samples (Figure 5a). Highnitrogen uptake at lower relative pressure is a well-known phenomenon of microporefilling, while the hysteresis loop is caused by capillary condensation occurring in themesopores. It demonstrates the coexistence of both micro and mesopore structures in theANCs. These micro-and mesopores provide a sufficiently large surface area, facilitating thepenetration and diffusion of dye molecules in the carbon surface during adsorption [57].The pore size distribution obtained from the DFT method (Figure 5b) shows well-definedmicropores with half-pore peaks centered at 0.7 and 0.87 nm (see inset of Figure 5b).
Furthermore, peaks corresponding to mesopores can also be seen. The pore size dis-tribution profiles obtained from the BJH methods further confirm the mesopore structure(Figure 5c), giving an average pore diameter of about 3.6 nm. Table 1 summarizes thetextural properties of the ANCs obtained from the analyses of the nitrogen sorption mea-surements. Due to the large hierarchically micro-and mesopore structure, the ANCs show ahigh specific surface area. The total specific surface areas are found in the range of 1399.9 to2132.1 m2 g−1. At the same time, the total pore volumes are found in the range of 1.112 to3.426 cm3 g−1. The surface analysis results show that the preparation conditions, includingthe ratio of the activating reagent with precursor material, carbonization temperature,and carbonization time, play an essential role in the structure and properties of the finalproduct. For example, an increase in the mixing ratio of H3PO4 with the precursor increasesthe surface area, reaching the maximum at 1:1 and then decreasing. Similar effects wereobserved with temperature and carbonization time, giving the optimum conditions forcarbonization is 1:1 mixing ratio at 400 ◦C for 3 h.

C 2022, 8, 2 11 of 17
Table 1. Surface textural properties of ANCs obtained from nitrogen sorption analysis.
Sample SSA (m2 g−1) Smic (m2 g−1) Vp (cm3 g−1) Vmic (cm3 g−1) Vmeso/Vp × 100 (%) Wp (nm) Dp (nm)
ANC0.25_400_3h 1399.9 1008.8 1.464 0.925 36.81 0.704 3.67
ANC0.5_400_3h 1705.0 1124.7 2.088 1.257 39.79 0.705 3.68
ANC1_400_3h 2132.1 1320.8 3.426 1.920 43.95 0.705 3.29
ANC1.5_400_3h 1945.2 1219.3 3.152 1.791 43.17 0.705 3.30
ANC1_400_2h 1970.4 1278.1 2.643 1.563 40.86 0.704 3.67
ANC1_400_4h 1781.3 1187.5 2.333 1.393 40.29 0.705 3.68
ANC1_300_3h 1156.1 903.4 1.112 0.709 36.24 0.286 3.66
ANC1_500_3h 1934.8 1217.4 2.878 1.635 43.18 0.705 3.49
SSA, specific surface area; Smic, micropore surface area; Vp, total pore volume; Vmic, micropore volume; Vmeso,mesopore volume; Wp, average half pore width; and Dp, average mesopore diameter.
3.6. Iodine and Methylene Blue Numbers
Figure 6 shows the results of iodine and methylene blue adsorption at differentcarbonization conditions vs. specific surface areas of the carbon materials. IN increasessignificantly with an increase in the mixing ratio of H3PO4 from 0.25 to 1 and then decreases(Figure 6a), which agrees with the micropore surface area (Table 1). The highest IN ca.888 mg g−1 is observed for the optimal sample. Conversely, MBN increases with the ratioof H3PO4 and remains unchanged above the mixing ratio of 1. The decrease in IN at a highmixing ratio indicates micropore coalescence leading to the formation of mesopores; as aresult, the MBN remains unchanged or minor increase. This result agrees with the previousfindings [58]. Similarly, IN and MBN increase with the carbonization time up to 3 h and thendecrease (Figure 6b). It suggests that carbonizing for a prolonged period probably destroysthe micropores and mesopores forming macropores. It may be due to the contraction in thematerial to some extent and breaking polyphosphate linkage. Increasing the carbonizationtemperature from 300 to 400 ◦C increases both IN and MBN, at which point it decreases(Figure 6c). As carbonization temperature increases, the porosity also increases due to therelease of tars from the cross-linked framework generated by phosphoric acid treatment.Above 400 ◦C, the phosphate and polyphosphate bridges become thermally unstable andbreak up. It results in the contraction in the carbon structure that destructs micropores andmesopores hence decreasing IN, MBN, and surface area.
C 2022, 8, x FOR PEER REVIEW 11 of 17
Table 1. Surface textural properties of ANCs obtained from nitrogen sorption analysis.
Sample SSA (m2 g−1) Smic (m2 g−1) Vp (cm3 g−1) Vmic (cm3 g−1) Vmeso/Vp × 100 (%) Wp (nm) Dp (nm) ANC0.25_400_3h 1399.9 1008.8 1.464 0.925 36.81 0.704 3.67 ANC0.5_400_3h 1705.0 1124.7 2.088 1.257 39.79 0.705 3.68 ANC1_400_3h 2132.1 1320.8 3.426 1.920 43.95 0.705 3.29
ANC1.5_400_3h 1945.2 1219.3 3.152 1.791 43.17 0.705 3.30 ANC1_400_2h 1970.4 1278.1 2.643 1.563 40.86 0.704 3.67 ANC1_400_4h 1781.3 1187.5 2.333 1.393 40.29 0.705 3.68 ANC1_300_3h 1156.1 903.4 1.112 0.709 36.24 0.286 3.66 ANC1_500_3h 1934.8 1217.4 2.878 1.635 43.18 0.705 3.49
SSA, specific surface area; Smic, micropore surface area; Vp, total pore volume; Vmic, micropore vol-ume; Vmeso, mesopore volume; Wp, average half pore width; and Dp, average mesopore diameter.
3.6. Iodine and Methylene Blue Numbers Figure 6 shows the results of iodine and methylene blue adsorption at different car-
bonization conditions vs. specific surface areas of the carbon materials. IN increases signif-icantly with an increase in the mixing ratio of H3PO4 from 0.25 to 1 and then decreases (Figure 6a), which agrees with the micropore surface area (Table 1). The highest IN ca. 888 mg g−1 is observed for the optimal sample. Conversely, MBN increases with the ratio of H3PO4 and remains unchanged above the mixing ratio of 1. The decrease in IN at a high mixing ratio indicates micropore coalescence leading to the formation of mesopores; as a result, the MBN remains unchanged or minor increase. This result agrees with the previous findings [58]. Similarly, IN and MBN increase with the carbonization time up to 3 h and then decrease (Figure 6b). It suggests that carbonizing for a prolonged period probably destroys the micropores and mesopores forming macropores. It may be due to the con-traction in the material to some extent and breaking polyphosphate linkage. Increasing the carbonization temperature from 300 to 400 °C increases both IN and MBN, at which point it decreases (Figure 6c). As carbonization temperature increases, the porosity also increases due to the release of tars from the cross-linked framework generated by phos-phoric acid treatment. Above 400 °C, the phosphate and polyphosphate bridges become thermally unstable and break up. It results in the contraction in the carbon structure that destructs micropores and mesopores hence decreasing IN, MBN, and surface area.
Figure 6. The effect of carbonization conditions on the specific surface area, iodine, and methylene blue adsorptions. (a) Results of mixing ratio of H3PO4; (b) carbonization time; (c) carbonization tem-perature.
3.7. Adsorption Studies The batch adsorption experiments were carried out to optimize the physical param-
eters on the MB dye adsorption efficiency using the optimal sample, ANC1_400_3h. Fig-ure 7 shows the effect of different parameters (contact time, adsorbent dose, pH, and ini-tial concentration of dye) on the adsorption properties of MB. Contact time can influence the economic efficiency of the process and the adsorption kinetics. As shown in Figure 7a, the adsorption (%) increases rapidly with the contact time and attains equilibrium within
Figure 6. The effect of carbonization conditions on the specific surface area, iodine, and methylene blueadsorptions. (a) Results of mixing ratio of H3PO4; (b) carbonization time; (c) carbonization temperature.
3.7. Adsorption Studies
The batch adsorption experiments were carried out to optimize the physical parame-ters on the MB dye adsorption efficiency using the optimal sample, ANC1_400_3h. Figure 7shows the effect of different parameters (contact time, adsorbent dose, pH, and initialconcentration of dye) on the adsorption properties of MB. Contact time can influence theeconomic efficiency of the process and the adsorption kinetics. As shown in Figure 7a,the adsorption (%) increases rapidly with the contact time and attains equilibrium within

C 2022, 8, 2 12 of 17
180 min. The initial rapid uptake of the dye is due to the availability of many adsorptionsites on the ANC surface. As a result, the mass transfer of the adsorbate from the bulk phasetowards the adsorbent surface is rapid. With time, available active sites on the adsorbentdecrease. Thus, the adsorption rate decreases, eventually reaching an equilibrium stateof MB concentration on the adsorbent and the solution [59]. Figure 7b shows the effect ofadsorbent dose on MB adsorption. An increase in adsorbent dose from 0.04 to 2.8 g L−1
increases the MB adsorption, and an equilibrium is reached. A further increase in adsorbentdosage (>2.8 g L−1) does not cause any significant change in dye adsorption.
C 2022, 8, x FOR PEER REVIEW 12 of 17
180 min. The initial rapid uptake of the dye is due to the availability of many adsorption sites on the ANC surface. As a result, the mass transfer of the adsorbate from the bulk phase towards the adsorbent surface is rapid. With time, available active sites on the ad-sorbent decrease. Thus, the adsorption rate decreases, eventually reaching an equilibrium state of MB concentration on the adsorbent and the solution [59]. Figure 7b shows the effect of adsorbent dose on MB adsorption. An increase in adsorbent dose from 0.04 to 2.8 g L−1 increases the MB adsorption, and an equilibrium is reached. A further increase in adsorbent dosage (>2.8 g L−1) does not cause any significant change in dye adsorption.
Figure 7. Effects of adsorption parameters on the MB adsorption on ANC1_400-3h: (a) contact time; (b) adsorbent dose; (c) pH; and (d) initial concentration.
The pH of the solution is one of the critical parameters in the adsorption process, which affects surface charge by causing the adsorbent to ionize [60]. Figure 7c shows the effect of pH on the adsorption of MB dye. Increasing pH monotonously increases the ad-sorption of MB dye with maximum adsorption of ~99% at pH 12. MB is a cationic dye; therefore, when the dye solution is at pH 2 (acidic medium), the surface of the ANC ad-sorbent is positively charged. Therefore, it does not favor the adsorption of cationic MB dye. Conversely, when the pH of the dye solution increases (alkaline medium), the ANC surface becomes negatively charged. As a result, the adsorption of MB dye increases due to increasing electrostatic attraction [61,62].
The initial dye concentration also affects adsorption phenomena, either increasing or decreasing the availability of binding sites on the adsorbent. Figure 7d shows the adsorp-tion of MB vs. initial dye concentration. The adsorption decreases with the initial dye con-centration and eventually reaches equilibrium. The higher adsorption of dye at lower con-centrations may be caused due to the availability of abundant active sites on the carbon surface. However, at higher concentrations, dye adsorption decreases due to the satura-tion of the binding sites [63]. In addition, the electrostatic repulsion between negative charges of adsorbate ions results in the decrease of the adsorption percentage. Therefore, it results in a decrease in the efficiency of the adsorption of dye [37]. Thus, the adsorption results show that the optimum conditions for adsorption of MB dye on the Areca catechu nut-derived nanoporous activated carbon are: contact time of 180 min, alkaline pH, and adsorbent dose of 2.8 g L−1 with an initial dye concentration of 300 mg mL−1.
The adsorption isotherm describes the distribution of MB dye between the solid and the liquid phase in equilibrium and reflects the relationship between MB dye adsorbed and its concentration at a constant temperature. Langmuir and Freundlich isotherms are
Figure 7. Effects of adsorption parameters on the MB adsorption on ANC1_400-3h: (a) contact time;(b) adsorbent dose; (c) pH; and (d) initial concentration.
The pH of the solution is one of the critical parameters in the adsorption process,which affects surface charge by causing the adsorbent to ionize [60]. Figure 7c showsthe effect of pH on the adsorption of MB dye. Increasing pH monotonously increasesthe adsorption of MB dye with maximum adsorption of ~99% at pH 12. MB is a cationicdye; therefore, when the dye solution is at pH 2 (acidic medium), the surface of the ANCadsorbent is positively charged. Therefore, it does not favor the adsorption of cationic MBdye. Conversely, when the pH of the dye solution increases (alkaline medium), the ANCsurface becomes negatively charged. As a result, the adsorption of MB dye increases due toincreasing electrostatic attraction [61,62].
The initial dye concentration also affects adsorption phenomena, either increasingor decreasing the availability of binding sites on the adsorbent. Figure 7d shows theadsorption of MB vs. initial dye concentration. The adsorption decreases with the initialdye concentration and eventually reaches equilibrium. The higher adsorption of dye atlower concentrations may be caused due to the availability of abundant active sites on thecarbon surface. However, at higher concentrations, dye adsorption decreases due to thesaturation of the binding sites [63]. In addition, the electrostatic repulsion between negativecharges of adsorbate ions results in the decrease of the adsorption percentage. Therefore, itresults in a decrease in the efficiency of the adsorption of dye [37]. Thus, the adsorptionresults show that the optimum conditions for adsorption of MB dye on the Areca catechunut-derived nanoporous activated carbon are: contact time of 180 min, alkaline pH, andadsorbent dose of 2.8 g L−1 with an initial dye concentration of 300 mg mL−1.
The adsorption isotherm describes the distribution of MB dye between the solid andthe liquid phase in equilibrium and reflects the relationship between MB dye adsorbed

C 2022, 8, 2 13 of 17
and its concentration at a constant temperature. Langmuir and Freundlich isothermsare widely used models in water and wastewater treatment [64]. Figure 8a shows thelinearized Langmuir isotherm model: plot of Ce/qe vs. Ce for the adsorption MB on theoptimal sample (ANC1_400_3h). A good correlation coefficient suggests a homogeneousmonolayer exposure of the MB dye on the surface of the adsorbent without interactionbetween adsorbed species. From the slope, the maximum amount of MB adsorbed on thecarbon materials is ca. 333.3 mg g−1, and from the intercept, the Langmuir constant is ca.0.833 L mg−1. The high MB adsorption capacity can be attributed to the high surface areaof the Areca catechu nut carbon.
C 2022, 8, x FOR PEER REVIEW 13 of 17
widely used models in water and wastewater treatment [64]. Figure 8a shows the linear-ized Langmuir isotherm model: plot of Ce/qe vs. Ce for the adsorption MB on the optimal sample (ANC1_400_3h). A good correlation coefficient suggests a homogeneous mono-layer exposure of the MB dye on the surface of the adsorbent without interaction between adsorbed species. From the slope, the maximum amount of MB adsorbed on the carbon materials is ca. 333.3 mg g−1, and from the intercept, the Langmuir constant is ca. 0.833 L mg−1. The high MB adsorption capacity can be attributed to the high surface area of the Areca catechu nut carbon.
Figure 8. The adsorption isotherms. (a) Langmuir adsorption and (b) Freundlich adsorption model for the MB adsorption on the ANC1_400-3h at 25 °C.
Figure 8b shows the Freundlich isotherm model. The correlation coefficient of the Freundlich isotherm model is ca. 0.611, which is poorer than the Langmuir model, sug-gesting that the Langmuir model better explains the MB adsorption. Table 2 compares the maximum MB adsorption capacity of similar adsorbents described by the Langmuir model.
Table 2. Comparison of maximum adsorption capacity of Areca catechu Nut carbon with activated carbon materials prepared from other carbon sources.
Carbon Source qm (mg g−1) Ref. Delonix regia Pod 175.4 [65]
Coconut shell 320.5 [34] Tea seed shells 324.7 [66]
Dipterocarpus alatus fruit 269.3 [67] Bamboo 305.3 [68]
Almond shell/Zr3O Composites 208.3 [69] Areca catechu Nut 333.3 This work
4. Conclusions In conclusion, we successfully synthesized nanoporous activated carbon materials
from a novel carbon source, Areca catechu nut powder, by the phosphoric acid activation method and studied their adsorption performance for the iodine and methylene blue ad-sorption from aqueous solution. In addition, the effects of carbonization conditions on the surface textural properties were systematically studied. Depending on the carbonization condition, the Areca catechu nut-derived amorphous carbon materials with partial gra-phitic carbon structure display high surface areas and large pore volumes from 1156.1 to 2132.1 m2 g−1 and from 1.112 to 3.426 cm3 g−1, respectively. Due to the excellent textural properties (surface area and pore volume) and hierarchically porous structures consisting of micro-and mesopores, the optimal sample displays the outstanding iodine and meth-ylene blue adsorption properties. The material achieved a high iodine number and meth-ylene blue values of ca. 888 and 369 mg g−1, respectively.
Figure 8. The adsorption isotherms. (a) Langmuir adsorption and (b) Freundlich adsorption modelfor the MB adsorption on the ANC1_400-3h at 25 ◦C.
Figure 8b shows the Freundlich isotherm model. The correlation coefficient of theFreundlich isotherm model is ca. 0.611, which is poorer than the Langmuir model, sug-gesting that the Langmuir model better explains the MB adsorption. Table 2 compares themaximum MB adsorption capacity of similar adsorbents described by the Langmuir model.
Table 2. Comparison of maximum adsorption capacity of Areca catechu Nut carbon with activatedcarbon materials prepared from other carbon sources.
Carbon Source qm (mg g−1) Ref.
Delonix regia Pod 175.4 [65]Coconut shell 320.5 [34]Tea seed shells 324.7 [66]
Dipterocarpus alatus fruit 269.3 [67]Bamboo 305.3 [68]
Almond shell/Zr3O Composites 208.3 [69]Areca catechu Nut 333.3 This work
4. Conclusions
In conclusion, we successfully synthesized nanoporous activated carbon materialsfrom a novel carbon source, Areca catechu nut powder, by the phosphoric acid activationmethod and studied their adsorption performance for the iodine and methylene blueadsorption from aqueous solution. In addition, the effects of carbonization conditions onthe surface textural properties were systematically studied. Depending on the carbonizationcondition, the Areca catechu nut-derived amorphous carbon materials with partial graphiticcarbon structure display high surface areas and large pore volumes from 1156.1 to 2132.1 m2
g−1 and from 1.112 to 3.426 cm3 g−1, respectively. Due to the excellent textural properties(surface area and pore volume) and hierarchically porous structures consisting of micro-and mesopores, the optimal sample displays the outstanding iodine and methylene blueadsorption properties. The material achieved a high iodine number and methylene bluevalues of ca. 888 and 369 mg g−1, respectively.
The batch adsorption of MB dye from the water was found to be affected by pH,adsorbent dose, contact time, and initial concentration. The optimum parameters for
C 2022, 8, 2 14 of 17
adsorption of MB dye were found to be the contact time of 180 min, alkaline pH (~12),and adsorbent dose of 2.8 g L−1, with an initial dye concentration of 300 mg mL−1. Theadsorption equilibrium data follow the Langmuir isotherm model with a maximum valueof monolayer adsorption capacity of 333.3 mg g−1. Our results demonstrate that Arecacatechu nut would be a suitable carbon source for synthesizing activated carbon materialswith a high surface area desired in the high-performance adsorbent for water purification,especially for removing organic dyes. Therefore, we will explore the energy-related applica-tions of the materials such as supercapacitors in the future. Furthermore, we will producenovel carbon materials using Areca catechu nut powder by activating with ZnCl2 and KOHat different temperatures. Since the pore architectures and surface chemistry depend onthe activating agents, it is worth having a complete phase diagram of the surface texturalproperties and functions of the Areca catechu nut-derived nanoporous carbon materials,particularly in water purification and energy storage applications.
Author Contributions: Conceptualization, S.J. and L.K.S.; methodology, R.G.S., R.R.P., and S.J.;validation, L.K.S., K.A., S.J., and R.G.S.; formal analysis, S.J., R.R.P., and L.K.S.; investigation, S.J.and R.G.S.; data curation, S.J., R.G.S., and L.K.S.; writing—original draft preparation, S.J. and R.G.S.;writing—review and editing, L.K.S. and K.A.; supervision, L.K.S.; project administration, L.K.S.;funding acquisition, L.K.S. and K.A. All authors have read and agreed to the published version ofthe manuscript.
Funding: This work was partially supported by JSPS KAKENHI Grant Number JP20H00392,JP20H00316, JP20K05590, and JP21H04685.
Data Availability Statement: The data presented in this study are available on request from thecorresponding author.
Acknowledgments: S.J. acknowledges the Materials Science and Engineering Program, PulchowkCampus, Institute of Engineering, Tribhuvan University, Nepal for the technical support.
Conflicts of Interest: The authors declare no conflict of interest.
References1. Vital, R.K.; Saibaba, K.V.N.; Shaik, K.B. Dye Removal by Adsorption: A Review. J. Bioremediat. Biodegrad. 2016, 7, 371.2. El-Naggar, N.E.; Rabei, N.H.; El-Malkey, S.E. Eco-Friendly Approach for Biosorption of Pb2+ and Carcinogenic Congo Red Dye
from Binary Solution onto Sustainable Ulva Lactuca Biomass. Sci. Rep. 2020, 10, 16021. [CrossRef] [PubMed]3. Verma, R.K.; Singh, M.; Singh, S.M.; Rathod, S.N.; Rathod, N.; Singh, G.S. Eradication of Fatal Textile Industrial Dyes by
Wastewater Treatment. Biointerface Res. Appl. Chem. 2020, 12, 567–587.4. Sintakindi, A.; Ankamwar, B. Uptake of Methylene Blue from Aqueous Solution by Naturally Grown Daedalea Africana and
Phellinus Adamantinus Fungi. ACS Omega 2020, 5, 12905–12914. [CrossRef]5. Bayomie, O.S.; Kandeel, H.; Shoeib, T.; Yang, H.; Youssef, N.; El-Sayed, M.M.H. Novel Approach for Effective removal of
methylene blue dye from water using fava bean peel waste. Sci. Rep. 2020, 10, 7824. [CrossRef]6. Vutskits, L.; Briner, A.; Klauser, P.; Gascon, E.; Dayer, A.G.; Kiss, J.Z.; Muller, D.; Licker, M.J.; Morel, D.R. Adverse Effects of
Methylene Blue on the Central Nervous System. Anesthesiology 2008, 108, 684–692. [CrossRef]7. Chen, L.F.; Wang, H.H.; Lin, K.Y.; Kuo, J.Y.; Wang, M.K.; Liu, C.C. Removal of Methylene Blue from Aqueous Solution using
Sediment Obtained from a Canal in an Industrial Park. Water Sci. Technol. 2018, 78, 556–570. [CrossRef]8. Cheng, J.; Zhan, C.; Wu, J.; Cui, Z.; Si, J.; Wang, Q.; Peng, X.; Turng, L.T. Highly Efficient Removal of Methylene Blue Dye from an
Aqueous Solution using Cellulose Acetate Nanofibrous Membranes Modified by Polydopamine. ACS Omega 2020, 5, 5389–5400.[CrossRef]
9. Noor, N.H.M.N.; Zaini, M.A.A.; Yunus, M.A.C. Isotherm and Kinetics of Methylene Blue Removal by Musa acuminata PeelAdsorbents. Acta Chemica Malaysia 2021, 5, 63–88. [CrossRef]
10. Shrestha, P.; Jha, M.K.; Ghimire, J.; Koirala, A.R.; Shrestha, R.M.; Sharma, R.K.; Pant, B.; Park, M.; Pant, H.R. Decoration of ZincOxide Nanorods into the Surface of Activated Carbon Obtained from Agricultural Waste for Effective Removal of MethyleneBlue Dye. Materials 2020, 13, 5667. [CrossRef]
11. Avom, J.; Mbadcam, J.K.; Noubactep, C.; Germain, P. Adsorption of Methylene Blue from an Aqueous Solution on to ActivatedCarbons from Palm-Tree Cobs. Carbon 1997, 35, 365–369. [CrossRef]
12. Nwanebu, E.O.; Liu, X.; Pajootan, E.; Yargeau, V.; Omanovic, S. Electrochemical Degradation of Methylene Blue using aNi-Co-Oxide Anode. Catalysts 2021, 11, 793. [CrossRef]
13. Kuang, Y.; Zhang, X.; Zhou, S. Adsorption of Methylene Blue in Water onto Activated Carbon by Surfactant Modification. Water2020, 12, 587. [CrossRef]

C 2022, 8, 2 15 of 17
14. Cervantes, M.A.Y.; Aguilar-Vega, M.; Santiago-Garcia, J.L.; Pizarro, G.C.; Godoy, M.; Sánchez, J. Methylene Blue Removal fromAqueous Solutions by Sulfonated Polymeric Porous Sorbents. Desalin. Water Treat. 2020, 184, 367–374. [CrossRef]
15. Mulushewa, Z.; Dinbore, W.T.; Yihunie Ayele, Y. Removal of methylene blue from textile waste water using kaolin and zeolite-xsynthesized from Ethiopian kaolin. Environ. Anal. Health Toxicol. 2021, 36, e2021007. [CrossRef] [PubMed]
16. Zhang, G.; Wo, R.; Sun, Z.; Hao, G.; Liu, G.; Zhang, Y.; Guo, H.; Jiang, W. Effective Magnetic MOFs Adsorbent for the Removal ofBisphenol A, Tetracycline, Congo Red and Methylene Blue Pollutions. Nanomaterials 2021, 11, 1917. [CrossRef]
17. Shrestha, R.G.; Shrestha, L.K.; Ariga, K. Carbon Nanoarchitectonics for Energy and Related Applications. C J. Carbon Res. 2021,7, 73. [CrossRef]
18. Abualnaja, K.M.; Alprol, A.E.; Ashour, M.; Mansour, A.T. Influencing Multi-Walled Carbon Nanotubes for the Removal of IsmateViolet 2R Dye from Wastewater: Isotherm, Kinetics, and Thermodynamic Studies. Appl. Sci. 2021, 11, 4786. [CrossRef]
19. Soumi Dutta, S.; Gupta, B.; Srivastava, S.K.; Gupta, A.K. Recent Advances on the Removal of Dyes from Wastewater usingVarious Adsorbents: A Critical Review. Mater. Adv. 2021, 2, 4497–4531. [CrossRef]
20. Trukawka, M.; Cendrowski, K.; Peruzynska, M.; Augustyniak, A.; Nawrotek, D.M.; Mijowska, E. Carbonized Metal–OrganicFrameworks with Trapped Cobalt Nanoparticles as Biocompatible and Efficient Azo-Dye Adsorbent. Environ. Sci. Eur. 2019,31, 56. [CrossRef]
21. Han, X.; Wang, H.; Zhang, L. Efficient Removal of Methyl Blue using Nanoporous Carbon from the Waste Biomass. Water Air SoilPollut. 2018, 229, 26. [CrossRef]
22. Koyuncu, F.; Güzel, F. Use of New Nanoporous Carbon Produced from Mandarin (Citrus reticulata) Industrial Processing Waste toRemove Anionic and Cationic Dyes. Sep. Sci. Technol. 2020, 56, 1–13. [CrossRef]
23. Shi, X.; Zhang, S.; Chen, X.; Mijowska, E. Evaluation of Nanoporous Carbon Synthesized from Direct Carbonization of aMetal–Organic Complex as a Highly Effective Dye Adsorbent and Supercapacitor. Nanomaterials 2019, 9, 601. [CrossRef]
24. Adhikari, M.P.; Adhikari, R.; Goswami, R.G.; Rajendran, R.; Adhikari, L.; Bairi, P.; Pradhananga, R.R.; Shrestha, L.K.; Ariga, K.Nanoporous Activated Carbons Derived from Agro-Waste Corncob for Enhanced Electrochemical and Sensing Performance. Bull.Chem. Soc. Jpn. 2015, 88, 1108–1115. [CrossRef]
25. Singh, J.; Mishra, V. Synthesis and Characterization of Activated Carbon derived from Tectona grandis Sawdust via Green Route.Environ. Prog. Sustain. Energy 2020, 40, 13525. [CrossRef]
26. Yakout, S.M.; Sharaf El-Deen, G. Characterization of Activated Carbon Prepared by Phosphoric Acid Activation of Olive Stones.Arab. J. Chem. 2016, 9, S1155–S1162. [CrossRef]
27. Shrestha, L.K.; Shrestha, R.G.; Joshi, S.; Rajbhandari, R.; Shrestha, N.; Adhikari, M.P.; Pradhananga, R.R.; Ariga, K. Nanoarchitec-tonics of Nanoporous Carbon Materials from Natural Resource for Supercapacitor Applications. J. Inorg. Organomet. Polym. 2017,27, S48–S56. [CrossRef]
28. Kamedulski, P.; Gauden, P.A.; Lukaszewicz, J.P. Effective Synthesis of Carbon Hybrid Materials Containing Oligothiophene Dyes.Materials 2019, 12, 3354. [CrossRef] [PubMed]
29. Oliveira, L.S.; Franca, A.S. Conventional and Non-Conventional Thermal of Activated Carbons from Agro-Industrial Wastes. InActivated Carbon: Classifications, Properties and Applications Processing for the Production; Kwiatkowski, J.F., Ed.; Nova Publishers:New York, NY, USA, 2011; pp. 205–238.
30. Ahmad, A.A.; Al-Raggad, M.; Shareef, N. Production of Activated Carbon Derived from Agricultural By-Products via Microwave-Induced Chemical Activation: A Review. Carbon Lett. 2021, 31, 957–971. [CrossRef]
31. Nguyen, H.D.; Tran, H.N.; Chao, H.-P.; Lin, C.-C. Activated Carbons Derived from teak Sawdust-Hydrochars for EfficientRemoval of Methylene Blue, Copper, and Cadmium from Aqueous Solution. Water 2019, 11, 2581. [CrossRef]
32. Block, I.; Günter, C.; Rodrigues, A.D.; Paasch, S.; Hesemann, P.; Taubert, A. Carbon Adsorbents from Spent Coffee for Removal ofMethylene Blue and Methyl Orange from Water. Materials 2021, 14, 3996. [CrossRef]
33. Kocaman, S. Removal of Methylene Blue Dye from Aqueous Solutions by Adsorption on Levulinic Acid-Modified Natural Shells.Int. J. Phytoremediat. 2020, 22, 885–895. [CrossRef] [PubMed]
34. Oribayo, O.; Olaleye, O.O.; Akinyanju, A.S.; Omoloja, K.O.; Williams, S.O. Coconut Shell-Based Activated Carbon as Adsorbentfor the Removal of Dye from Aqueous Solution: Equilibrium, Kinetics, and Thermodynamic Studies. Niger. J. Technol. 2020,39, 1076–1084. [CrossRef]
35. Abbas, M.; Trari, M. Removal of Methylene Blue in Aqueous Solution by Economic Adsorbent Derived from Apricot StoneActivated Carbon. Fibers Polym. 2020, 21, 810–820. [CrossRef]
36. Thang, N.H.; Khang, D.K.; Hai, T.D.; Nga, D.T.; Tuan, P.D. Methylene blue adsorption mechanism of activated carbon synthesisedfrom cashew nut shells. RSC Adv. 2021, 11, 26563–26570. [CrossRef]
37. Patel, R.K.; Prasad, R.; Shankar, R.; Khare, P.; Yadav, M. Adsorptive Removal of Methylene Blue Dye from Soapnut Shell &Pineapple Waste Derived Activated Carbon. Int. J. Eng. Sci. Technol. 2021, 13, 81–87.
38. Yallappa, S.; Shivakumar, M.; Nagashree, K.L.; Dharmaprakash, M.S.; Vinu, A.; Hegde, G. Electrochemical Determination ofNitrite Using Catalyst Free Mesoporous Carbon Nanoparticles from Bio Renewable Areca nut seeds. J. Electrochem. Soc. 2018,165, 614–619. [CrossRef]
39. Tabassum, M.; Bardhan, M.; Novera, T.M.; Islam, M.A.; Jawad, A.H.; Islam, M.A. NaOH-Activated Betel Nut Husk Hydrochar forEfficient Adsorption of Methylene Blue Dye. Water Air Soil Pollut. 2020, 231, 398. [CrossRef]

C 2022, 8, 2 16 of 17
40. Bardhan, M.; Novera, T.M.; Tabassum, M.; Islam, M.A.; Jawad, A.H.; Islam, M.A. Adsorption of Methylene Blue onto BetelNut Husk-Based Activated Carbon Prepared by Sodium Hydroxide Activation Process. Water Sci. Technol. 2020, 82, 1932–1949.[CrossRef] [PubMed]
41. Sundaram, M.M.; Sivakumar, S. Effective Role of Areca Nut Shell Carbon and Cashew Nut Shell Carbon in the Removal of CongoRed Dye for The Application Towards Effluent Treatment. Indian J. Environ. Prot. 2013, 33, 546–553.
42. Gopalswami, P.; Sivakumar, N.; Ponnuswamy, S.; Venkateswaren, V.; Kavitha, G. Adsorption of Direct Dye Onto ActivatedCarbon Prepared From Areca Nut Pod-An Agricultural Waste. J. Environ. Sci. Eng. 2010, 52, 367–372. [PubMed]
43. Cleiton, N.A.; Guerreiro, M.C. Estimation of Surface Area and Pore Volume of Activated Carbons by Methylene Blue and IodineNumbers. Quim. Nova 2011, 34, 472–476.
44. ASTM International. Annual Book of ASTM Standards, Standard Test Method for Determination of Iodine Number of Activated Carbon,ASTM D4607-94; ASTM International: Philadelphia, PA, USA, 2006.
45. Raposo, F.; Rubia, M.A.D.L.; Borja, R. Methylene Blue Number as Useful Indicator to Evaluate the Adsorptive Capacity ofGranular Activated Carbon in Batch Mode: Influence of Adsorbate/Adsorbent Mass Ratio and Particle Size. J. Hazard. Mater.2009, 165, 291–299. [CrossRef] [PubMed]
46. Bamgbola, A.A.; Adeyemi, O.O.; Olubomehin, O.O.; Akinlabi, A.K.; Sojinu, O.S.; Iwuchukwu, P.O. Isolation and Characterizationof Cellulose From Cashew (Anacardium occidentale L.) Nut Shells. Curr. Res. Green Sustain. Chem. 2020, 3, 100032. [CrossRef]
47. Maji, S.; Chaudhary, R.; Shrestha, R.G.; Shrestha, R.L.; Demir, B.; Searles, D.J.; Hill, J.P.; Yamauchi, Y.; Ariga, K.; Shrestha, L.K.High-Performance Supercapacitor Materials based on Hierarchically Porous Carbons derived from Artocarpus Heterophyllus Seed.ACS Appl. Energy Mater. 2021, 4, 12257–12266. [CrossRef]
48. Salim, R.M.; Asik, J.; Sarjadi, M.S. Chemical Functional Groups of Extractives, Cellulose and Lignin Extracted from NativeLeucaena leucocephala Bark. Wood Sci. Technol. 2021, 55, 295–313. [CrossRef]
49. Zakaria, R.; Jamalluddin, N.A.; Bakar, M.Z.A. Effect of Impregnation Ratio and Activation Temperature on the Yield andAdsorption Performance of Mangrove Based Activated Carbon for Methylene Blue Removal. Results Mater. 2021, 10, 100183.[CrossRef]
50. Zhou, J.; Luo, A.; Zhao, Y. Preparation and Characterization of Activated Carbon from Waste Tea by Physical Activation UsingSteam. J. Air Waste Manag. Assoc. 2018, 68, 12. [CrossRef]
51. Kayiwa, R.; Kasedde, H.; Lubwama, M.; Kirabira, J.B. Mesoporous Activated Carbon Yielded from Pre-Leached Cassava Peels.Bioresour. Bioprocess. 2021, 8, 53. [CrossRef]
52. Joshi, S.; Shrestha, L.K.; Kamachi, Y.; Yamauchi, Y.; Pradhananga, M.A.; Pokharel, B.P.; Ariga, K.; Pradhananga, R.R. SodiumHydroxide Activated Nanoporous Carbon Based on Lapsi Seed Stone. J. Nanosci. Nanotechnol. 2015, 15, 1465–1472. [CrossRef]
53. Ma, X.; Li, S.; Hessel, V.; Lin, L.; Meskers, S.; Fausto Gallucci, F. Synthesis of Luminescent Carbon Quantum Dots by MicroplasmaProcess. Chem. Eng. Process. Process Intensif. 2019, 140, 29–35. [CrossRef]
54. Han, S.A.; Lee, J.; Shim, K.; Lin, J.; Shahabuddin, M.; Lee, J.-W.; Kim, S.-W.; Park, M.-S.; Kim, J.H. Strategically Designed ZeoliticImidazolate Frameworks for Controlling the Degree of Graphitization. Bull. Chem. Soc. Jpn. 2018, 91, 1474–1480. [CrossRef]
55. Qutaish, H.; Lee, J.; Hyeon, Y.; Han, S.A.; Lee, I.-H.; Heo, Y.-U.; Whang, D.; Moon, J.; Park, M.-S.; Kim, J.H. Design of CobaltCatalysed Carbon Nanotubes in Bimetallic Zeolitic Imidazolate Frameworks. Appl. Surface Sci. 2021, 547, 149134. [CrossRef]
56. Shrestha, L.K.; Adhikari, L.; Shrestha, R.G.; Adhikari, M.P.; Ahikari, R.; Hill, J.P.; Pradhananga, R.R.; Ariga, K. NanoporousCarbon Materials with Enhanced Supercapacitance Performance and Non-Aromatic Chemical Sensing With C1/C2 AlcoholDiscrimination. Sci. Technol. Adv. Mater. 2016, 17, 483–492. [CrossRef] [PubMed]
57. Shrestha, L.K.; Thapa, M.; Shrestha, R.G.; Maji, S.; Pradhananga, R.R.; Ariga, K. Rice-Husk-Derived High Surface Area NanoporousCarbon Materials with Excellent Iodine and Methylene Blue Adsorption. C J. Carbon Res. 2019, 5, 10. [CrossRef]
58. Joshi, S.; Bishnu, K.C. Synthesis and Characterization of Sugarcane Bagasse Based Activated Carbon: Effect of ImpregnationRatio of ZnCl2. J. Nepal Chem. Soc. 2020, 41, 74–79. [CrossRef]
59. Mashkoor, F.; Khan, M.A.; Nasar, A. Fast and Effective Confiscation of Methylene Blue Dye from Aqueous Medium by LuffaAegyptiaca Peel. Curr. Anal. Chem. 2021, 17, 947–956. [CrossRef]
60. Wong, S.; Ghafar, N.A.; Ngadi, N.; Razmi, F.A.; Inuwa, I.M.; Mat, R.; Amin, N.A.S. Effective Removal of Anionic Textile DyesUsing Adsorbent Synthesized from Coffee Waste. Sci. Rep. 2020, 10, 2928. [CrossRef] [PubMed]
61. Yusop, M.F.M.; Ahmad, M.A.; Rosli, N.A.; Manaf, M.E.A. Adsorption of Cationic Methylene Blue Dye Using Microwave-AssistedActivated Carbon Derived from Acacia Wood: Optimization and Batch Studies. Arab. J. Chem. 2021, 14, 1878–5352. [CrossRef]
62. Wang, Y.; Pan, J.; Lia, Y.; Zhang, P.; Li, M.; Zheng, H.; Zhang, X.; Li, H.; Du, Q. Methylene Blue Adsorption by Activated Carbon,Nickel Alginate/Activated Carbon Aerogel, and Nickel Alginate/Graphene Oxide Aerogel: A Comparison Study. J. Mater. Res.Technol. 2020, 9, 12443–12460. [CrossRef]
63. Baloo, L.; Isa, M.H.; Sapari, N.B.; Jagaba, A.H.; Wei, L.J.; Yavari, S.; Razali, R.; Vasu, R.; Vasu; R. Adsorptive Removal of MethyleneBlue and Acid Orange 10 Dyes from Aqueous Solutions Using Oil Palm Wastes-Derived Activated Carbons. Alex. Eng. J. 2021,60, 5611–5629. [CrossRef]
64. Abdel-Gawad, S.A.; Abd El-Aziz, H.M. Removal of Pharmaceuticals from Aqueous Medium Using Entrapped Activated Carbonin Alginate. Air Soil Water Res. 2020, 12, 1–7. [CrossRef]
65. Utsev, J.T.; Iwar, R.T.; Ifyalem, K.J. Adsorption of Methylene Blue from Aqueous Solution Onto Delonix Regia Pod ActivatedCarbon: Batch Equilibrium Isotherm, Kinetic and Thermodynamic Studies. J. Mater. Environ. Sci. 2020, 11, 1058–1078.

C 2022, 8, 2 17 of 17
66. Gao, J.-J.; Qin, Y.-B.; Zhou, T.; Cao, D.-D.; Xu, P.; Hochstetter, D.; Wang, Y.-F. Adsorption of Methylene Blue onto Activated CarbonProduced from Tea (Camellia Sinensis L.) Seed Shells: Kinetics, Equilibrium, and Thermodynamics Studies. J. Zhejiang Univ. Sci. B2013, 14, 650–658. [CrossRef] [PubMed]
67. Patawat, C.; Silakate, K.; Chuan-Udom, S.; Supanchaiyamat, N.; Hunt, A.J.; Yuvarat Ngernyene, Y. Preparation of ActivatedCarbon from Dipterocarpus Alatus Fruit And its Application for Methylene Blue Adsorption. RSC Adv. 2020, 10, 21082–22109.[CrossRef]
68. Jawad, A.H.; Abdulhameed, A.S. Statistical Modeling of Methylene Blue Dye Adsorption by High Surface Area MesoporousActivated Carbon from Bamboo Chip Using KOH-Assisted Thermal Activation. Energy Ecol. Environ. 2020, 5, 456–469. [CrossRef]
69. Ahsaine, H.A.; Anfar, Z.; Zbair, M.; Ezahri, M.; Alem, N.E. Adsorptive Removal of Methylene Blue and Crystal Violet ontoMicro-Mesoporous Zr3O/Activated Carbon Composite: A Joint Experimental and Statistical Modeling Considerations. J. Chem.2018, 2018, 6982014. [CrossRef]