Electrolytic Etching Copper and Silver Using Copper Nitrate, a ...
Upload
independentCategory
view
0download
0
ARTICLE IN PRESS
Superlattices and Microstructures( ) –
www.elsevier.com/locate/jnlabr/yspmi
Energy transport in plasma etching of nanoporousdielectric materials
Joel Plawskya,∗, Shom Ponotha, George Dalakosa,Kourosh Malekb, Marc-Olivier Coppensb
aRensselaer Polytechnic Institute, Troy, NY, USAbDelftChemTech, Faculty of Applied Sciences, Delft University of Technology, Julianalaan 136, 2628BL Delft,
The Netherlands
Received 18 May 2003; accepted 30 October 2003
Abstract
A Monte Carlo routine was developed to simulate the motion and energetics of ions in the poresof a xerogel material under plasma etching conditions. The simulation included the effects of anapplied electric field and input conditions for the pore as a function of pressure and applied voltagein the plasma reactor. We were interested in the ion energy in a pore, the ion penetration depth andthe effect of ion energy on etching.
At low pressures the nanoporous material etches faster than dense silicon dioxide. This is to beexpected given the decrease in density and increase in surface area that arises due to the porosity.However, as the pressure is increased, the etch rate decreases dramatically and, eventually, the denseoxide may etch faster than the porous material. CHF3 was used as the etchant gas and, for this gas,we believe this behavior to be controlled by the ion energy and energy transport in the pores of thexerogel material. As the pressure in the plasma reactor is increased, the incoming ions switch overfrom etching activation to polymerisation activation. This agrees with the observed crossover in etchrate seen experimentally and with the cessation in etching as pressure is increased. The switch isaffected by pore roughness and correlates with the average ion energy in the pore.© 2004 Elsevier Ltd. All rights reserved.
Keywords: Plasma etching; Nanoporous solids; Diffusion and reaction
∗ Corresponding author. Tel.: +1-518-276-6049; fax: +1-518-276-4030.E-mail address: [email protected] (J. Plawsky).
0749-6036/$ - see front matter © 2004 Elsevier Ltd. All rights reserved.doi:10.1016/j.spmi.2003.10.001

ARTICLE IN PRESS2 J. Plawsky et al. / Superlattices and Microstructures ( ) –
Xerogel 38% porousXerogel 43% porousSolid SiO2
1000
800
600
400
200
00.04 0.06 0.08 0.10 0.12 0.14
Pressure (torr)
Etc
h ra
te (
Å/m
in)
Fig. 1. Rate of etching of xerogel as a function of porosity and pressure.
1. Introduction
Traditionally, nanoporous materials have been used in heterogeneous catalysis, fuelcells, membranes, and insulation, but, increasingly, nanoporous materials are beinginvestigated for use as interlayer dielectrics in integrated circuits [1–5]. An understandingof diffusion and reaction in these materials under microelectronics processing conditionsis fundamentally important if these materials are to be qualified for IC fabrication.
In plasma processing, pressures are generally low,<1 Torr, and so Knudsendiffusion [6] is the dominant mechanism for movement of species inside xerogel pores.Malek and Coppens [7, 8] used Monte Carlo methods to investigate the effect of poreroughness on Knudsen self-diffusion, transport diffusion, and chemical reaction in roughnanopores.
There is an extremely limited amount of experimental data on the reactive ion etchingof nanoporous materials [9, 10]. Fig. 1shows the results of some work we have performedusing nanoporous silica xerogels. There are two significant features. At low pressures theporous material etches faster than dense silicon dioxide. This is to be expected given thedecrease in density and increase in surface area that arises due to the porosity. However,as the pressure is increased, the etch rate decreases dramatically and, eventually, the denseoxide may etch faster than the porous material. The etch system in this work was CHF3diluted in N2. CHF3 is an etching gas normally used for controlled etching of oxidematerials. This gas produces ions that undergo two different types of chemical reaction. Inthe first reaction, the fluoride containing ions etch the silicon dioxide [11]. In the second,
ARTICLE IN PRESSJ. Plawsky et al. / Superlattices and Microstructures ( ) – 3
Initial (0.12 torr)
Initial (0.15 torr)
Etched in O2 for 45 s
Si PECVD Xerogel
2500
3000
2000
1500
1000
500
0
Thi
ckne
ss (
Å)
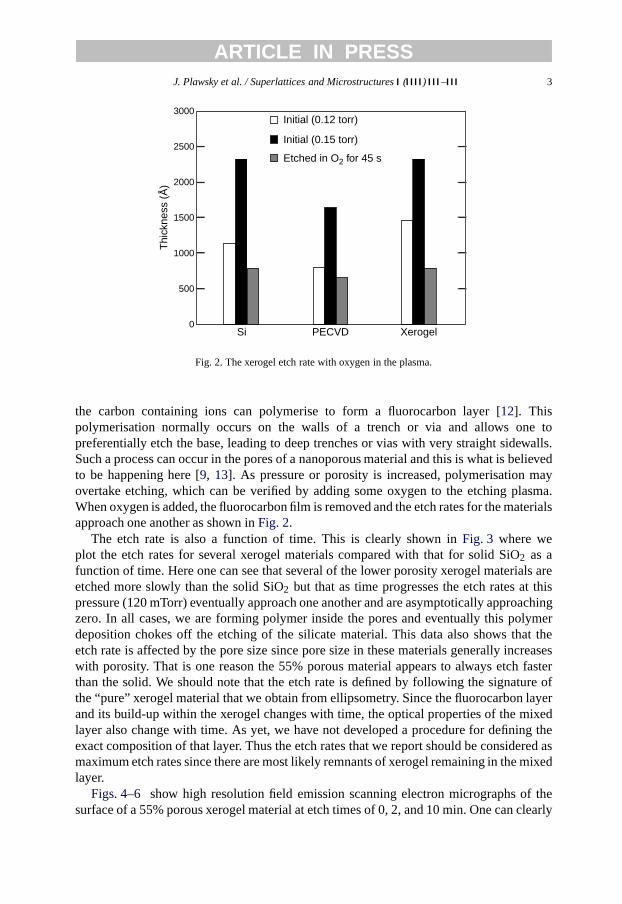
Fig. 2. The xerogel etch rate with oxygen in the plasma.
the carbon containing ions can polymerise to form a fluorocarbon layer [12]. Thispolymerisation normally occurs on the walls of a trench or via and allows one topreferentially etch the base, leading to deep trenches or vias with very straight sidewalls.Such a process can occur in the pores of a nanoporous material and this is what is believedto be happening here [9, 13]. As pressure or porosity is increased, polymerisation mayovertake etching, which can be verified by adding some oxygen to the etching plasma.When oxygen is added, the fluorocarbon film is removed and the etch rates for the materialsapproach one another as shown inFig. 2.
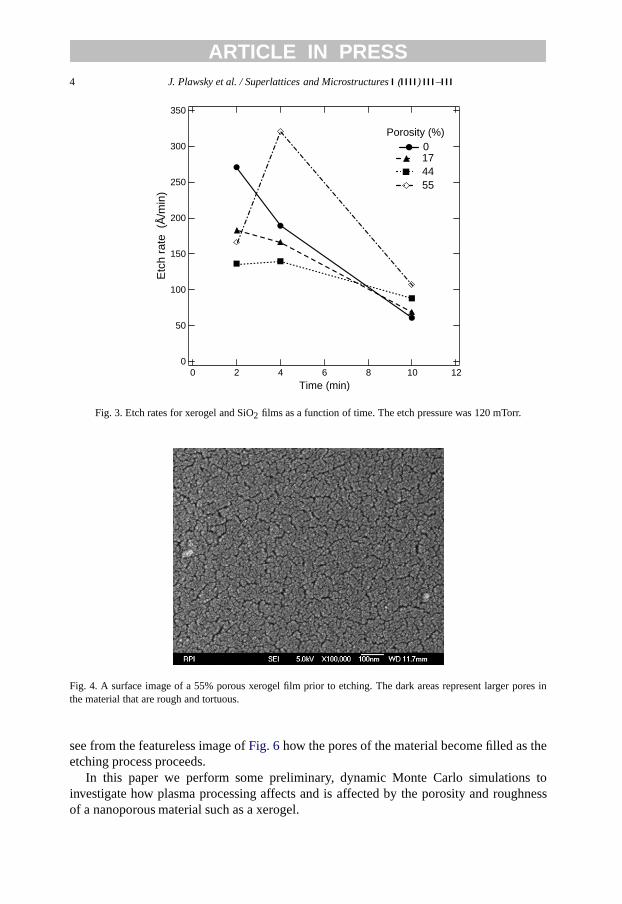
The etch rate is also a function of time. This is clearly shown inFig. 3 where weplot the etch rates for several xerogel materials compared with that for solid SiO2 as afunction of time. Here one can see that several of the lower porosity xerogel materials areetched more slowly than the solid SiO2 but that as time progresses the etch rates at thispressure (120 mTorr) eventually approach one another and are asymptotically approachingzero. In all cases, we are forming polymer inside the pores and eventually this polymerdeposition chokes off the etching of the silicate material. This data also shows that theetch rate is affected by the pore size since pore size in these materials generally increaseswith porosity. That is one reason the 55% porous material appears to always etch fasterthan the solid. We should note that the etch rate is defined by following the signature ofthe “pure” xerogel material that we obtain from ellipsometry. Since the fluorocarbon layerand its build-up within the xerogel changes with time, the optical properties of the mixedlayer also change with time. As yet, we have not developed a procedure for defining theexact composition of that layer. Thus the etch rates that we report should be considered asmaximum etch rates since there are most likely remnants of xerogel remaining in the mixedlayer.
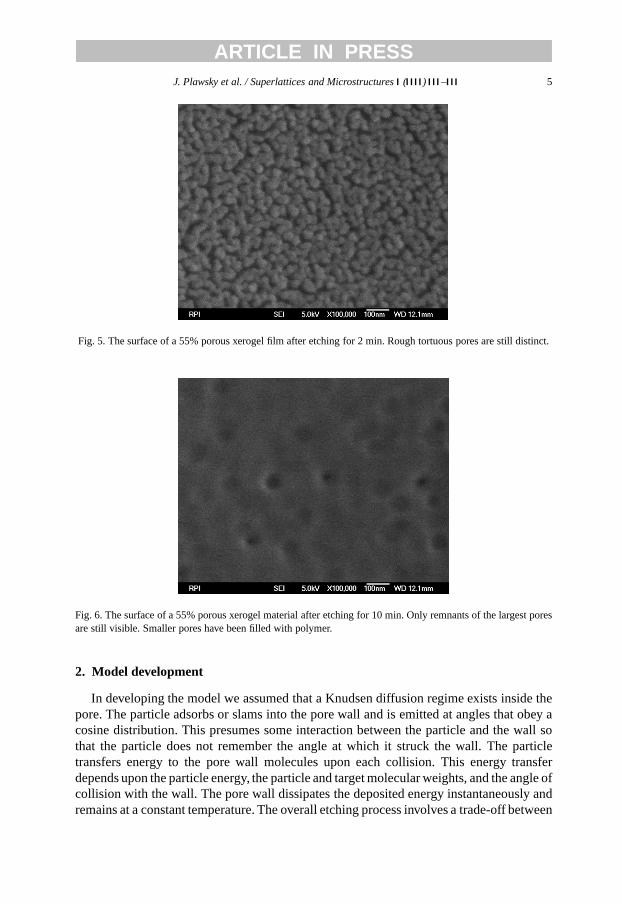
Figs. 4–6 show high resolution field emission scanning electron micrographs of thesurface of a 55% porous xerogel material at etch times of 0, 2, and 10 min. One can clearly
ARTICLE IN PRESS4 J. Plawsky et al. / Superlattices and Microstructures ( ) –
Etc
h ra
te (
Å/m
in)
Time (min)
Porosity (%)0174455
350
300
250
200
150
100
50
0121086420
Fig. 3. Etch rates for xerogel and SiO2 films as a function of time. The etch pressure was 120 mTorr.
Fig. 4. A surface image of a 55% porous xerogel film prior to etching. The dark areas represent larger pores inthe material that are rough and tortuous.
see from the featureless image ofFig. 6how the pores of the material become filled as theetching process proceeds.
In this paper we perform some preliminary, dynamic Monte Carlo simulations toinvestigate how plasma processing affects and is affected by the porosity and roughnessof a nanoporous material such as a xerogel.
ARTICLE IN PRESSJ. Plawsky et al. / Superlattices and Microstructures ( ) – 5
Fig. 5. The surface of a 55% porous xerogel film after etching for 2 min. Rough tortuous pores are still distinct.
Fig. 6. The surface of a 55% porous xerogel material after etching for 10 min. Only remnants of the largest poresare still visible. Smaller pores have been filled with polymer.
2. Model development
In developing the model we assumed that a Knudsen diffusion regime exists inside thepore. The particle adsorbs or slams into the pore wall and is emitted at angles that obey acosine distribution. This presumes some interaction between the particle and the wall sothat the particle does not remember the angle at which it struck the wall. The particletransfers energy to the pore wall molecules upon each collision. This energy transferdepends upon the particle energy, the particle and target molecular weights, and the angle ofcollision with the wall. The pore wall dissipates the deposited energy instantaneously andremains at a constant temperature. The overall etching process involves a trade-off between
ARTICLE IN PRESS6 J. Plawsky et al. / Superlattices and Microstructures ( ) –
0th Generation 1st Generation 2nd Generation
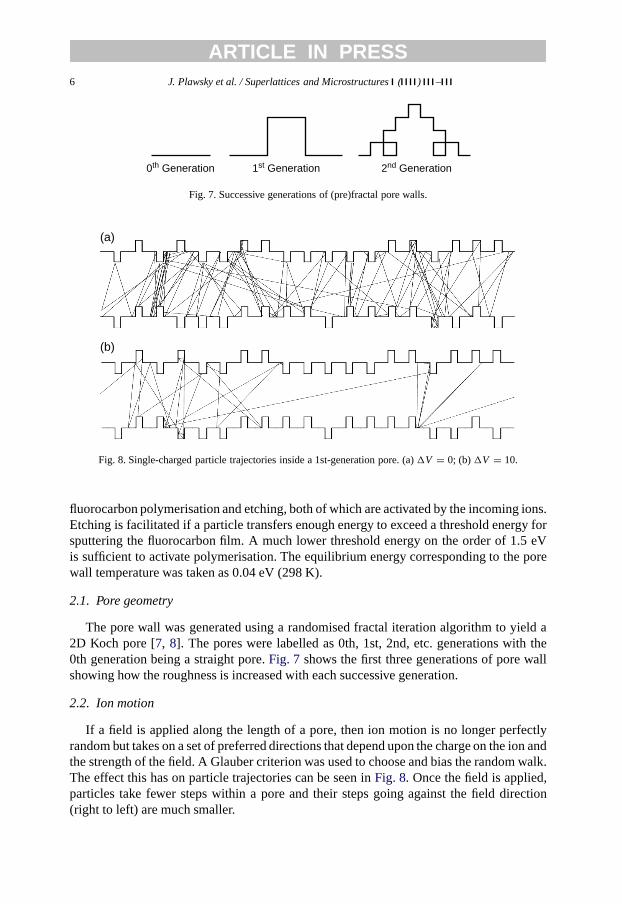
Fig. 7. Successive generations of (pre)fractal pore walls.
(a)
(b)
Fig. 8. Single-charged particle trajectories inside a 1st-generation pore. (a)�V = 0; (b)�V = 10.
fluorocarbon polymerisation and etching, both of which are activated by the incoming ions.Etching is facilitated if a particle transfers enough energy to exceed a threshold energy forsputtering the fluorocarbon film. A much lower threshold energy on the order of 1.5 eVis sufficient to activate polymerisation. The equilibrium energy corresponding to the porewall temperature was taken as 0.04 eV (298 K).
2.1. Pore geometry
The pore wall was generated using a randomised fractal iteration algorithm to yield a2D Koch pore [7, 8]. The pores were labelled as 0th, 1st, 2nd, etc. generations with the0th generation being a straight pore.Fig. 7 shows the first three generations of pore wallshowing how the roughness is increased with each successive generation.
2.2. Ion motion
If a field is applied along the length of a pore, then ion motion is no longer perfectlyrandom but takes on a set of preferred directions that depend upon the charge on the ion andthe strength of the field. A Glauber criterion was used to choose and bias the random walk.The effect this has on particle trajectories can be seen inFig. 8. Once the field is applied,particles take fewer steps within a pore and their steps going against the field direction(right to left) are much smaller.
ARTICLE IN PRESSJ. Plawsky et al. / Superlattices and Microstructures ( ) – 7
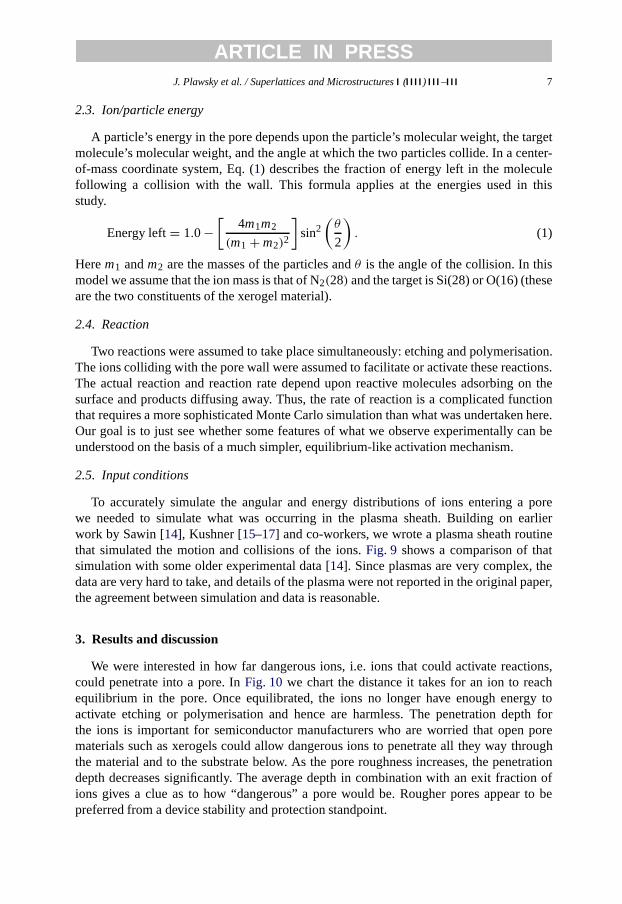
2.3. Ion/particle energy
A particle’s energy in the pore depends upon the particle’s molecular weight, the targetmolecule’s molecular weight, and the angle at which the two particles collide. In a center-of-mass coordinate system, Eq. (1) describes the fraction of energy left in the moleculefollowing a collision with the wall. This formula applies at the energies used in thisstudy.
Energy left= 1.0 −[
4m1m2
(m1 + m2)2
]sin2
(θ
2
). (1)
Herem1 andm2 are the masses of the particles andθ is the angle of the collision. In thismodel we assume that the ion mass is that of N2(28) and the target is Si(28) or O(16) (theseare the two constituents of the xerogel material).
2.4. Reaction
Two reactions were assumed to take place simultaneously: etching and polymerisation.The ions colliding with the pore wall were assumed to facilitate or activate these reactions.The actual reaction and reaction rate depend upon reactive molecules adsorbing on thesurface and products diffusing away. Thus, the rate of reaction is a complicated functionthat requires a more sophisticated Monte Carlo simulation than what was undertaken here.Our goal is to just see whether some features of what we observe experimentally can beunderstood on the basis of a much simpler, equilibrium-like activation mechanism.
2.5. Input conditions
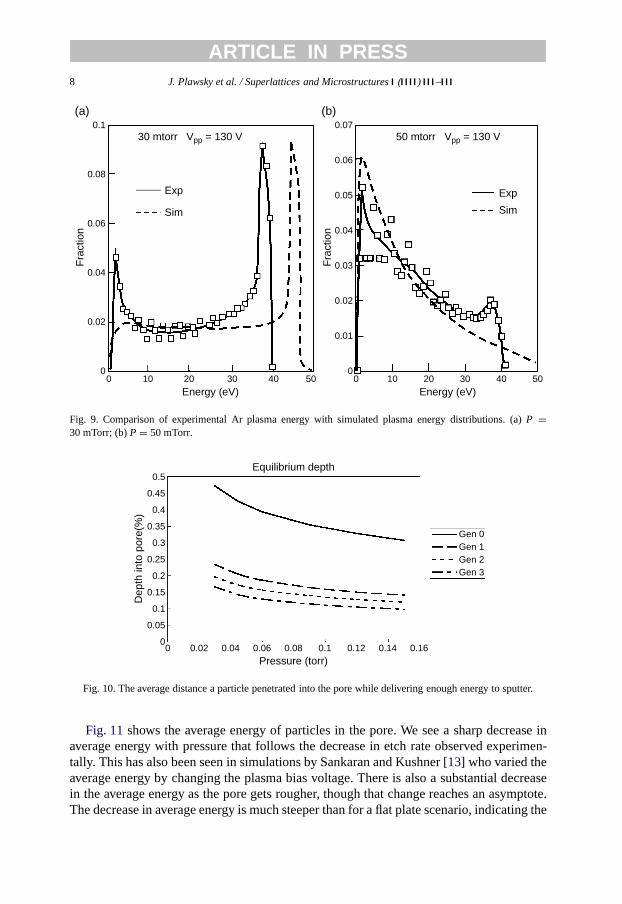
To accurately simulate the angular and energy distributions of ions entering a porewe needed to simulate what was occurring in the plasma sheath. Building on earlierwork by Sawin [14], Kushner [15–17] and co-workers, we wrote a plasma sheath routinethat simulated the motion and collisions of the ions.Fig. 9 shows a comparison of thatsimulation with some older experimental data [14]. Since plasmas are very complex, thedata are very hard to take, and details of the plasma were not reported in the original paper,the agreement between simulation and data is reasonable.
3. Results and discussion
We were interested in how far dangerous ions, i.e. ions that could activate reactions,could penetrate into a pore. InFig. 10 we chart the distance it takes for an ion to reachequilibrium in the pore. Once equilibrated, the ions no longer have enough energy toactivate etching or polymerisation and hence are harmless. The penetration depth forthe ions is important for semiconductor manufacturers who are worried that open porematerials such as xerogels could allow dangerous ions to penetrate all they way throughthe material and to the substrate below. As the pore roughness increases, the penetrationdepth decreases significantly. The average depth in combination with an exit fraction ofions gives a clue as to how “dangerous” a pore would be. Rougher pores appear to bepreferred from a device stability and protection standpoint.
ARTICLE IN PRESS8 J. Plawsky et al. / Superlattices and Microstructures ( ) –
0.1
0.08
0.06
Fra
ctio
n
0.04
0.02
00 10 20 30
Energy (eV)40 50
0.07
0.04
0.05
0.06
0.03Fra
ctio
n
0.02
0.01
00 10 20 30
Energy (eV)40 50
Exp
Sim
Exp
Sim
30 mtorr Vpp = 130 V 50 mtorr Vpp = 130 V
(a) (b)
Fig. 9. Comparison of experimental Ar plasma energy with simulated plasma energy distributions. (a)P =30 mTorr; (b)P = 50 mTorr.
0.5
0.45
0.4
0.35
0.3
0.25
0.2
0.15
0.1
0.05
00 0.02 0.04 0.06 0.08
Pressure (torr)
Equilibrium depth
Dep
th in
to p
ore(
%)
0.1 0.12 0.14 0.16
Gen 0Gen 1Gen 2Gen 3
Fig. 10. The average distance a particle penetrated into the pore while delivering enough energy to sputter.
Fig. 11shows the average energy of particles in the pore. We see a sharp decrease inaverage energy with pressure that follows the decrease in etch rate observed experimen-tally. This has also been seen in simulations by Sankaran and Kushner [13] who varied theaverage energy by changing the plasma bias voltage. There is also a substantial decreasein the average energy as the pore gets rougher, though that change reaches an asymptote.The decrease in average energy is much steeper than for a flat plate scenario, indicating the

ARTICLE IN PRESSJ. Plawsky et al. / Superlattices and Microstructures ( ) – 9
18
16
14
12
10
8
6
4
2
00 0.03 0.06 0.09 0.12
Flat
Gen 3Gen 2Gen 1Gen 0
Energy in pore
Ene
rgy
(eV
)
Fig. 11. The average energy of particles inside the pore.
effect of roughness. Energies all seem to converge at high pressure, which also follows theetch rate data. The results seem to indicate that facilitation of etching versus polymerisationmay depend upon a threshold average energy inside the pore itself, rather than a specificthreshold that we set for each individual process. For example, if we use a 5 eV averageion energy in the pore as the threshold for determining when etching will dominate overpolymerisation, we can see from the horizontal dashed line that there is a clear pressureat which the various generations of pores switch over from mostly etching to polymeri-sation. As the pores get rougher, the pressure at which the switch takes place becomesless. This also agrees qualitatively with the data inFig. 1where we correlate an increase inporosity of the open pore material with the roughness increase in the simulation. Since oursurface area and tortuosity increase with porosity, this is not necessarily a bad approxima-tion. Much more experimental data is needed to confirm that the simulation is representingreality and that the threshold pressures do indeed change in a systematic manner.
4. Conclusions
A Monte Carlo simulation program was developed to show how ions would diffuse andbehave inside the rough pores of a xerogel material. The energy transfer from a particleto the pore wall was calculated and depends on the molecular weights of the collidingspecies, the incoming energy statistics, and the angle of collision. By accurately simulatingthe incoming energetic conditions, we were able to simulate how the ions behave inside arough pore as a function of pressure and how they would activate etching or polymerisationreactions in the pore. As pressure is increased, the activation switches over from mostlyetching activation to mostly polymerisation activation. This agrees well with what isobserved experimentally where a crossover is seen and as pressure is increased, etchingstops. The switch seems to correlate with an average threshold ion energy in the poreindicating that as the pores get rougher or the porosity increases the switch occurs at lowerand lower pressures. Activation of either polymerisation or etching becomes more effectiveas the pore roughness increases.
ARTICLE IN PRESS10 J. Plawsky et al. / Superlattices and Microstructures ( ) –
Acknowledgements
This material is based on work that was supported by Delft University of Technologywho graciously supported the first author’s sabbatical leave. Any opinions, findings, andconclusions or recommendations expressed in this publication are those of the authors anddo not necessarily reflect the view of Delft University of Technology.
References
[1] J.-K. Hong, H.-S. Yang, M.-H. Jo, H.-H. Park, S.-Y. Choi, Thin Solid Films 308–309 (1997) 495.[2] S.V. Nitta, V. Pisupatti, A. Jain, P.C. Wayner Jr., W.N. Gill, J.L. Plawsky, J. Vac. Sci. Tech. B 17 (1999) 205.[3] A. Jain, S. Rogojevic, S. Ponoth, J.L. Plawsky, W.N. Gill, E. Simonyi, S.-T. Chen, J. Appl. Phys. 91 (2002)
3275.[4] A. Jain, S. Rogojevic, W.N. Gill, J.L. Plawsky, J. Appl. Phys. 90 (2001) 5832–5834.[5] A. Jain, S. Rogojevic, S. Ponoth, N. Agarwal, I. Matthew, W.N. Gill, P. Persans, M. Tomozawa, J.L. Plawsky,
E. Simonyi, Thin Solid Films 389–399 (2001) 513.[6] M.A. Lieberman, A.J. Lichtenberg, Principles of Plasma Discharges and Materials Processing, John Wiley
& Sons, New York, 1994.[7] K. Malek, M.-O. Coppens, Phys. Rev. Lett. 87 (2001) 125505.[8] K. Malek, M.-O. Coppens, Coll. Surf. A 206 (2002) 335.[9] T.E.F.M. Standaert, E.A. Joseph, G.S. Oehrlein, A. Jain, W.N. Gill, P.C. Wayner Jr., J.L. Plawsky, J. Vac.
Sci. Tech. A 18 (2000) 2742.[10] A.J. Bariya, C.W. Frank, J.P. McVittie, J. Electrochem. Soc. 137 (1990) 2575.[11] T.E.F.M. Standaert, M. Schaepkens, N.R. Rueger, P.G.M. Sebel, G.S. Oehrlein, J.M. Cook, J. Vac. Sci. Tech.
A 15 (1997) 1881.[12] K. Miyata, M. Hori, T. Goto, J. Vac. Sci. Tech. A 14 (1996) 2083.[13] A. Sankaran, M.J. Kushner, Appl. Phys. Lett. 82 (2003) 1824.[14] B.E. Thompson, H.H. Sawin, D.A. Fisher, J. Appl. Phys. 63 (1988) 2241.[15] M.J. Grapperhaus, M.J. Kushner, J. Appl. Phys. 81 (1997) 569.[16] D. Zhang, M.J. Kushner, J. Appl. Phys. 87 (2000) 1060.[17] D. Zhang, M.J. Kushner, J. Vac. Sci. Tech. A 19 (2001) 524.
Copyright © 2022 FDOKUMEN