Computer simulations of the structure of nanoporous carbons ...

Ultrasonic attenuation by nanoporous particles
Part II: Experimentalw
William N. Rowlands,aJames K. Beattie,*
aAlex M. Djerdjev
aand
Richard W. O’Brienb
Received 19th April 2006, Accepted 17th August 2006
First published as an Advance Article on the web 5th September 2006
DOI: 10.1039/b605617m
In Part I of this paper O’Brien presented a new theory that describes the dissipation of ultrasonic
energy by porous colloidal particles in suspension. In this paper we present experimental
measurements on several such suspensions and compare the resulting ultrasonic attenuation
spectra with O’Brien’s theory. We find that microporous colloids (e.g. zeolites) and mesoporous
colloids (e.g. porous silicas) both show greater attenuation of ultrasound than would solid
particles of the same size and effective density, as predicted by O’Brien. Fitting theoretical spectra
to the experimental data provides information about the porosity and pore diameters in the
particles. This makes the technique potentially suitable as a convenient method of characterizing
nanoporous materials, especially those already in suspension.
1. Introduction
The use of ultrasound to characterize colloidal suspensions of
particles has recently been reviewed.2 The formulae developed
by Allegra and Hawley3 to describe the attenuation of ultra-
sound by solid particles in suspension have been extensively
experimentally tested. The phenomena are sufficiently under-
stood to provide the basis for a number of commercial instru-
ments that use ultrasonic attenuation to measure particle size in
concentrated colloidal suspensions. In Part I of this paper1
O’Brien presented a new theory for the additional attenuation
expected for porous particles due to the flow of the fluid in and
out of open connected pores. In the present paper we present
experimental data that are compared with O’Brien’s theory,
with the aim of obtaining quantitative information about the
pore structure inside the colloidal particles.
While some investigators have reported ultrasonic attenuation
spectra for flocculated emulsions,2 there appear to be no reports
of the attenuation spectra of micro- or mesoporous colloidal
particles with rigid lattice structures. Some earlier experimental
results on a poorly defined commercial porous colloid measured
in this laboratory have been presented by O’Brien.4
Colloidal materials suitable for testing the theory should
ideally have the following characteristics:
(i) They should exhibit significant porous attenuation in the
frequency range that can be measured experimentally, i.e. 1 to
18 MHz in this case.
(ii) The particles should be (preferably) monodisperse
spheres with the particle diameter much less than the sound
wavelength in the above frequency range.
(iii) Suspensions of the particles in water should be stable
and not flocculated, so that the measurement is characteristic
of the primary particles.
(iv) The particles should have well-defined connected (open)
pore structures, with the pore diameter much less than the
particle diameter.
(v) The lattice material should be rigid.
(vi) The pores should be readily wetted when the particles
are exposed to saturated water vapour or are suspended in
water, and the closed porosity should be small.
Particles satisfying most or all of these criteria include
zeolites, especially those with larger pore sizes, and mesopor-
ous particles of silica and other materials. Criterion (ii) is
particularly difficult to satisfy since many colloidal materials
are appreciably polydisperse. Therefore when calculating the
theoretical viscous and porous components of the total at-
tenuation we have assumed a log-normal volume-based dis-
tribution of particle sizes characterized by a median diameter
d50 and an 85th percentile diameter d85.
2. Materials and methods
Materials studied are: a faujasite-type zeolite Linde type Y;
two commercial silica chromatography supports, Platinumt
Silica (Alltech) and LiChrosphers Si 100 (5 mm) (Merck); and
TUD-1, a synthetic mesoporous silica. Important properties of
the particles and suspensions determined or inferred by meth-
ods other than our ultrasonic attenuation analysis are given
in Table 1. Throughout our analysis we have assumed that the
particles consist of a solid lattice containing connected pores
that are fully hydrated before measurement. The samples are
all hydrophilic in nature and previous observations of sedi-
mentation velocities and suspension densities for the mesopor-
ous silica-based samples lead us to believe that all samples
are fully saturated (hydrated) under the conditions used.5
The materials were suspended at least three days before
a School of Chemistry, University of Sydney, NSW 2006, Australia.E-mail: [email protected]
bColloidal Dynamics Inc., 11 Knight Street, Building E18, Warwick,RI 02886, USA.
w For Part I, see ref. 1.
5124 | Phys. Chem. Chem. Phys., 2006, 8, 5124–5130 This journal is �c the Owner Societies 2006
PAPER www.rsc.org/pccp | Physical Chemistry Chemical Physics
measurement, and repeated ultrasonic attenuation measure-
ments at later times were reproducible. We did not observe any
changes due to increasing hydration of the samples with time.
A mesoporous silica known as Platinumt Silica was ob-
tained from Alltech Associates Inc., IL USA. Information
from the manufacturer suggested that the material had a high
porosity, of around 52%. Nitrogen adsorption measurements
on the sample in our laboratory indicated a much lower
porosity of 29%. The sample was originally obtained a decade
ago, and had been suspended in distilled water for a prolonged
period during that time, prior to being dried and recovered.
The internal surface area of the particles may have been
reduced during that period due to dissolution and re-precipi-
tation of silica. A sample was suspended in 5 mM sodium
chloride solution at pH 9, at a hydrated particle weight
fraction of 0.2117. For ultrasonic attenuation and electroa-
coustic measurements this suspension was further diluted with
water to a hydrated particle weight fraction of 0.103. The
suspension was sonicated in an ultrasonic cleaning bath for
5 min prior to measurement. The hydrated weight fraction was
determined from the more concentrated suspension by mea-
suring the weight loss of the sample when heated overnight to
350 1C in vacuum, after first allowing the free water to
evaporate from the sample at room temperature in air. The
effective hydrated particle density calculated from using the
effective weight fraction and pyknometer measurements of the
density of the aqueous suspension was consistent with that
calculated assuming the framework density to be the same as
that of amorphous silica, 2.2 g cm�3, and a porosity of 29%, at
1.85 g cm�3. SEM and TEM investigations in our laboratory5
have shown the Platinumt silica particles to be approximately
spherical with a narrow size distribution. The porosity is not
well defined but is apparently three-dimensional (3-D) in
nature and the surface layer of the particles appears to be
porous, without any significant areas of impermeable shell.
TUD-1 is the name given to a mesoporous silica family with
3-D pore structures, the pore sizes being determined by the
template molecules used in their synthesis.6 A sample of
TUD-1 with an average pore diameter of 11.7 nm and a
porosity of 69% based on nitrogen adsorption/desorption
measurements was prepared by Dr L. van de Water of the
University of Sydney. The sample was very polydisperse, with
only a small proportion of the material in the colloidal size
range. The sample was suspended in water adjusted to pH 9
with NaOH and sonicated with an ultrasonic horn (dr.hiesch-
ler GmbH UP 200S) for 4 min at 50% output, 50% duty cycle
while being cooled with ice water. The suspension was then
fractionated by sedimentation in order to obtain the material
with diameters in the range 2–5 mm. Because of the limited
amount of colloidal material available, the resulting suspen-
sion was very dilute, around the lower limit of particle con-
centration suitable for measurement on the AcoustoSizer II
instrument. The hydrated weight fraction was determined by
evaporating the free water from the sample at room tempera-
ture in an oven at 40 1C, and this value was found to be in
good agreement to the value inferred from heating the sample
to constant weight at 210 1C (cooling in a desiccator) and then
calculating the effective weight fraction from the weight frac-
tion of solid lattice material, assumed to be amorphous silica
with a density of 2.2 g cm�3, and a porosity of 69%.
A sample of Zeolite Y was provided by Dr S. Carr. For
ultrasonic attenuation and electroacoustic measurements the
sample was suspended in 15 mMNaCl solution adjusted to pH
9 with NaOH at a hydrated particle weight fraction of 0.050.
Before measurement the suspension was sonicated with the
ultrasonic horn for 4 min at 50% output, 50% duty cycle. The
Table 1 Properties of microporous and mesoporous colloidal particles
MaterialPlatinumt Silica TUD-1 Silica Zeolite Y LiChrospher s Si 100 5 mm Silica
PropertyThisstudy
Previousstudies
Thisstudy
Previousstudies
Thisstudy
Previousstudies
Thisstudy
Previousstudies
Porosity data(N2 adsorption)Total pore volume/cm3 g�1 0.19 0.5b 1.03 — — — 1.29 1.25b
Pore volume fraction 0.29a 0.52a 0.69a — — 0.34–0.48c 0.74a 0.73a
BET surface area/m2 g�1 57.8 210b 335 — — — 277 400b
Pore diameter/nm 10.5 10b 11.7 — — 0.74c 16 10b
Suspension dataHydrated particledensity/g cm�3
1.85ad 1.6a 1.37ad — 1.86d 1.92 1.31ad 1.32a
Hydrated particleweight fraction
0.103d — 0.0041d — 0.050d — 0.10d —
SuspensionDensity/g cm�3 — — — — 1.020 — 1.020 —Particle size dataTEM d50/mm 2.0 — — — — — 5.0b
TEM, d85/mm 2.4 1.5b — — — — —DLS Zave/mm 1.86 — — 0.72e — —DLS PDI 0.054 — — 0.203e — —Sedimentation d50/mm — 2.02 — 0.85 — 5.28Sedimentation d85/mm — 3.20 — 1.40 — 6.5
a Calculated from total pore volume assuming solid lattice density of 2.2 g cm�3. b Manufacturers’ data, methodology unknown. c See main body
of text for details and references. d These data are used in calculation of experimental attenuation spectra. See Experimental section for
details. e Conversion to volume distribution gives d50 = 1.03 mm, d85 = 1.45 mm.
This journal is �c the Owner Societies 2006 Phys. Chem. Chem. Phys., 2006, 8, 5124–5130 | 5125

powder sample was assumed to be fully saturated with atmo-
spheric water vapour at the time it was suspended, and this
was later confirmed by evaporating the free water from the
sample at room temperature in air. The density of the hy-
drated particles was calculated as 1.86 g cm�3 based on the
measured suspension density and the hydrated particle weight
fraction. This is close to the hydrated density of 1.92 g cm�3
given by Breck for zeolite Y.7
LiChrosphers Si 100 (5 mm) was obtained from Merck. For
ultrasonic attenuation and electroacoustic measurements the
sample was suspended in 1 mM NaCl solution at pH 7.5, at a
hydrated particle weight fraction of 0.10. The suspension was
sonicated in an ultrasonic cleaning bath for 5 min prior to
measurement. The hydrated weight fraction was determined by
evaporating the free water from the sample in an oven at 40 1C
until the sample was apparently dry. This procedure was
repeated several times by adding back just sufficient water to
form a gel of the sample and then re-drying. This method was
deemed to be sufficiently accurate for the purposes of the present
study, given the low relative external surface area of the particles
and the high porosity. The value obtained was found to be
consistent with pyknometer measurements of the density of the
aqueous suspension assuming a framework density the same as
that of amorphous silica, 2.2 g cm�3, and a porosity of 74%.
Ultrasonic attenuation and electroacoustic measurements
were made using a Colloidal Dynamics AcoustoSizer II in-
strument. All measurements were carried out at 25 � 1 1C.
Approximately 40 mL of each suspension is required as a
minimum measurement volume in the present configuration of
the instrument. The instrument was calibrated prior to mea-
surement with a dilute potassium tungstosilicate solution as
recommended by the manufacturer. The solution is dilute and
is taken to have the same attenuation characteristics as water.
Electroacoustic measurements were made automatically at the
same time as ultrasonic attenuation measurements. Electro-
acoustics is a complementary technique to ultrasonic attenua-
tion, and the dynamic mobility frequency spectrum derived
from electroacoustic measurements provides information
about the electrostatic charge, particle size distribution, and
the nature of micropores and mesopores in colloidal materials.
The electroacoustic properties of suspensions of some of the
microporous and mesoporous materials measured here have
been reported previously.5,8
Particle size distribution measurements by TEM were made by
measuring diameters of approximately 150 particles and convert-
ing these observations to a log-normal volume based distribution.5
Particle size measurements by dynamic light scattering
(DLS) were made using a Malvern HPPS 3.3 instrument.
The results are expressed as the mean (Zave) and polydispersity
index (PDI) of the intensity distribution. To convert this to a
volume-based distribution, using the Rayleigh–Debye equa-
tion incorporated in the instrument software, requires the
refractive index and absorption coefficient of the particles.
For Zeolite Y the refractive index of faujasite (n = 1.48) and
an adsorption coefficient of 0.01 were used. Data for the
Platinumt silica was not converted in this way because the
refractive index for this material is unknown and the distribu-
tion is narrow anyway, so that the intensity mean diameter
should be similar to the volume median diameter.
Particle size measurements by sedimentation were made using
a Horiba Capa 700 disk photocentrifuge in gravitational and/or
centrifugal sedimentation modes. The same value for the effec-
tive hydrated density was used for the sedimentation analysis as
for the ultrasonic attenuation analysis. The instrument firmware
allows an optional correction for the absorption coefficient of
the particles as a function of particle diameter. Following the
recommendation of Allen and Davies9 the correction parameters
were entered as numerically equivalent to the particle radius in
microns. The correction is significant for polydisperse samples
such as Zeolite Y and TUD-1.
Nitrogen adsorption and desorption isotherms were mea-
sured using a Micromeritics ASAP 2020 Surface Area and
Porosity Analyser. Average pore sizes and total pore volumes
were obtained from desorption isotherms by the BJH method
and from adsorption isotherms using the single point method,
respectively, using the instrument software.
Suspension densities were measured with a Parr DMA 35N
density meter.
Treatment of results
In Part I of this paper1 it is shown (eqn (23)) that the pressure
amplitude of a plane wave in a suspension is given by
P ¼ P0 expðkIxÞ
where x is the distance travelled by the wave into the suspen-
sion. The quantity kI is always negative, so the wave decays
exponentially with distance.
The AcoustoSizer II attenuation measurements are reported
in terms of a non-dimensional attenuation coefficient Catt
Catt ¼ �lfkI
Here, l is the sound wavelength and f is the particle volume
fraction. For a solid particle f is the volume fraction of
particles in suspension. In the porous case f is replaced by
feff, the effective volume fraction. This is the volume fraction
of the solid particles plus the pore liquid. In practice, the
software requires the weight fraction, w, as an input para-
meter, and f is then calculated from w and the particle density.
Therefore, the required parameters are weff and reff, the
effective weight fraction and density of the hydrated particles,
as recorded in Table 1.
In order to compare the theory presented in Part I1 with the
experimental data a computer program was used to calculate the
theoretical non-dimensional attenuation coefficient given by eqn
(51) of Part I as a function of frequency. To calculate the viscous
attenuation component F(Y) given by eqn (53) of Part I, reff is
used for rp. To calculate the porous attenuation component
H(g) given by equation (52) of Part I, two adjustable parameters
were entered, the pressure diffusivity Dp and the porosity, given
by (1 � fp), where fp is the volume fraction of solid material in
the suspension, i.e. excluding the volume of the pores.
3. Experimental results and comparisons with theory
Platinumt silica
Fig. 1 shows the experimental attenuation spectrum for this
sample together with the theoretical viscous, porous, and total
5126 | Phys. Chem. Chem. Phys., 2006, 8, 5124–5130 This journal is �c the Owner Societies 2006
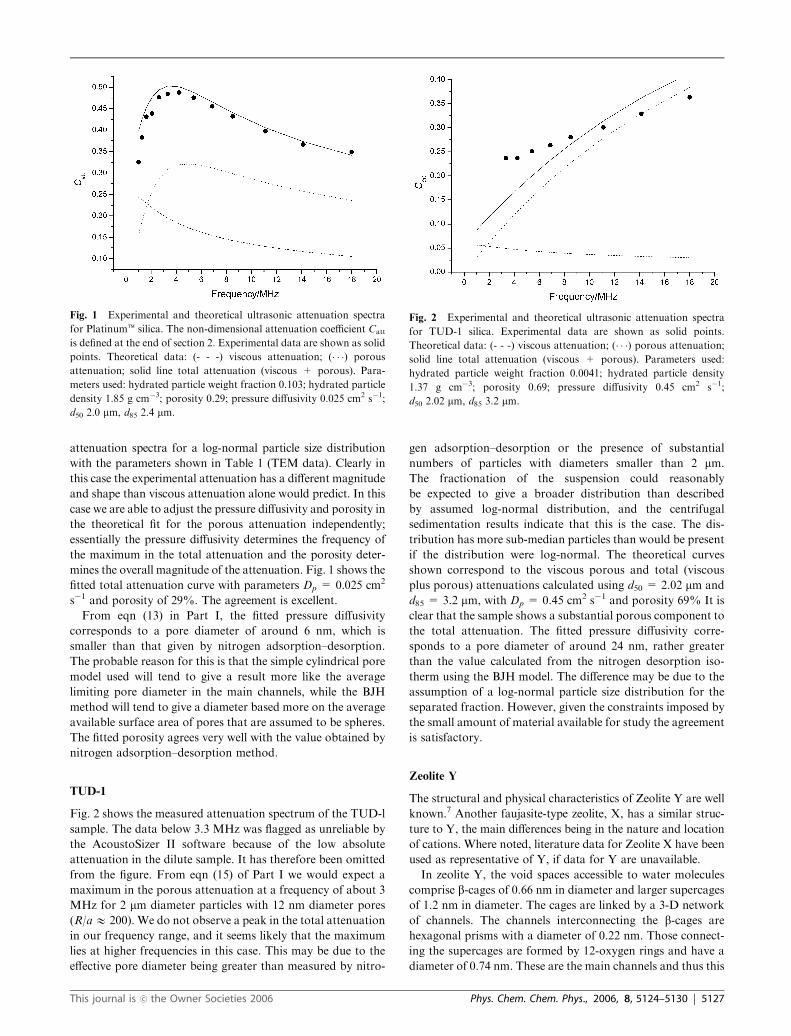
attenuation spectra for a log-normal particle size distribution
with the parameters shown in Table 1 (TEM data). Clearly in
this case the experimental attenuation has a different magnitude
and shape than viscous attenuation alone would predict. In this
case we are able to adjust the pressure diffusivity and porosity in
the theoretical fit for the porous attenuation independently;
essentially the pressure diffusivity determines the frequency of
the maximum in the total attenuation and the porosity deter-
mines the overall magnitude of the attenuation. Fig. 1 shows the
fitted total attenuation curve with parameters Dp = 0.025 cm2
s�1 and porosity of 29%. The agreement is excellent.
From eqn (13) in Part I, the fitted pressure diffusivity
corresponds to a pore diameter of around 6 nm, which is
smaller than that given by nitrogen adsorption–desorption.
The probable reason for this is that the simple cylindrical pore
model used will tend to give a result more like the average
limiting pore diameter in the main channels, while the BJH
method will tend to give a diameter based more on the average
available surface area of pores that are assumed to be spheres.
The fitted porosity agrees very well with the value obtained by
nitrogen adsorption–desorption method.
TUD-1
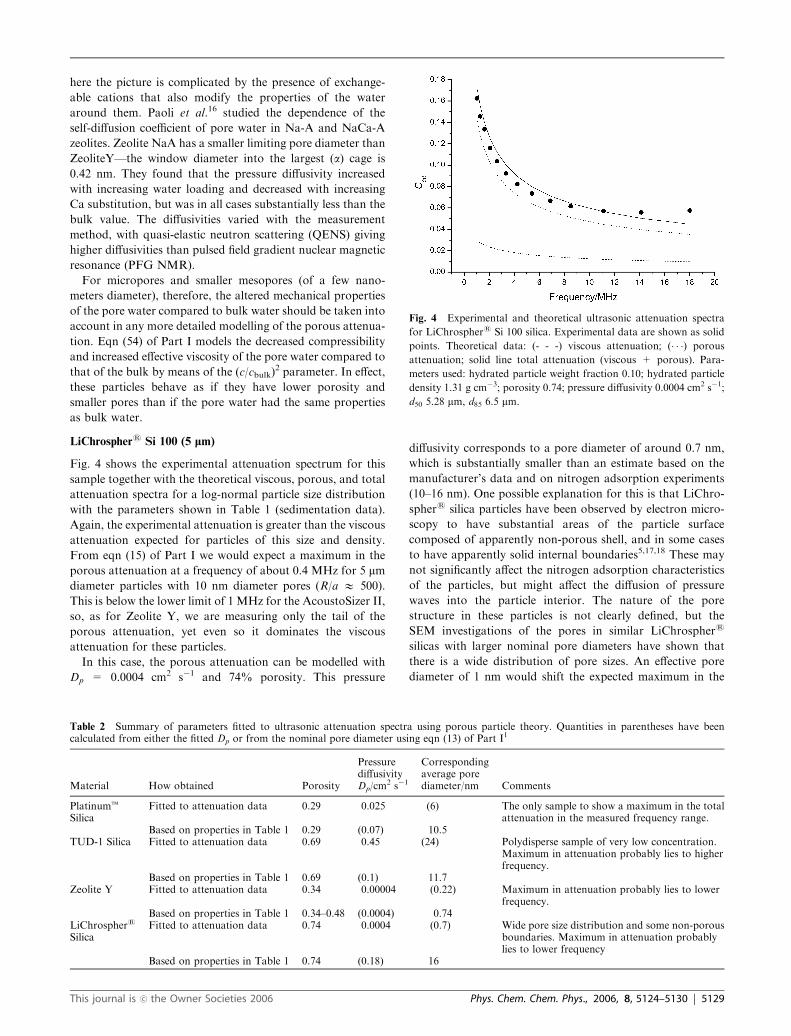
Fig. 2 shows the measured attenuation spectrum of the TUD-l
sample. The data below 3.3 MHz was flagged as unreliable by
the AcoustoSizer II software because of the low absolute
attenuation in the dilute sample. It has therefore been omitted
from the figure. From eqn (15) of Part I we would expect a
maximum in the porous attenuation at a frequency of about 3
MHz for 2 mm diameter particles with 12 nm diameter pores
(R/aE 200). We do not observe a peak in the total attenuation
in our frequency range, and it seems likely that the maximum
lies at higher frequencies in this case. This may be due to the
effective pore diameter being greater than measured by nitro-
gen adsorption–desorption or the presence of substantial
numbers of particles with diameters smaller than 2 mm.
The fractionation of the suspension could reasonably
be expected to give a broader distribution than described
by assumed log-normal distribution, and the centrifugal
sedimentation results indicate that this is the case. The dis-
tribution has more sub-median particles than would be present
if the distribution were log-normal. The theoretical curves
shown correspond to the viscous porous and total (viscous
plus porous) attenuations calculated using d50 = 2.02 mm and
d85 = 3.2 mm, with Dp = 0.45 cm2 s�1 and porosity 69% It is
clear that the sample shows a substantial porous component to
the total attenuation. The fitted pressure diffusivity corre-
sponds to a pore diameter of around 24 nm, rather greater
than the value calculated from the nitrogen desorption iso-
therm using the BJH model. The difference may be due to the
assumption of a log-normal particle size distribution for the
separated fraction. However, given the constraints imposed by
the small amount of material available for study the agreement
is satisfactory.
Zeolite Y
The structural and physical characteristics of Zeolite Y are well
known.7 Another faujasite-type zeolite, X, has a similar struc-
ture to Y, the main differences being in the nature and location
of cations. Where noted, literature data for Zeolite X have been
used as representative of Y, if data for Y are unavailable.
In zeolite Y, the void spaces accessible to water molecules
comprise b-cages of 0.66 nm in diameter and larger supercages
of 1.2 nm in diameter. The cages are linked by a 3-D network
of channels. The channels interconnecting the b-cages are
hexagonal prisms with a diameter of 0.22 nm. Those connect-
ing the supercages are formed by 12-oxygen rings and have a
diameter of 0.74 nm. These are the main channels and thus this
Fig. 1 Experimental and theoretical ultrasonic attenuation spectra
for Platinumt silica. The non-dimensional attenuation coefficient Catt
is defined at the end of section 2. Experimental data are shown as solid
points. Theoretical data: (- - -) viscous attenuation; (� � �) porous
attenuation; solid line total attenuation (viscous + porous). Para-
meters used: hydrated particle weight fraction 0.103; hydrated particle
density 1.85 g cm�3; porosity 0.29; pressure diffusivity 0.025 cm2 s�1;
d50 2.0 mm, d85 2.4 mm.
Fig. 2 Experimental and theoretical ultrasonic attenuation spectra
for TUD-1 silica. Experimental data are shown as solid points.
Theoretical data: (- - -) viscous attenuation; (� � �) porous attenuation;solid line total attenuation (viscous + porous). Parameters used:
hydrated particle weight fraction 0.0041; hydrated particle density
1.37 g cm�3; porosity 0.69; pressure diffusivity 0.45 cm2 s�1;
d50 2.02 mm, d85 3.2 mm.
This journal is �c the Owner Societies 2006 Phys. Chem. Chem. Phys., 2006, 8, 5124–5130 | 5127

pore diameter is the effective diameter most likely to be
suitable for comparison with our model.
When fully hydrated, Zeolite X is understood to contain
about 265 water molecules per unit cell in both the b-cages andthe supercages.7,10 The total volume available to water mole-
cules is theoretically around 7.332 nm3 of a total unit cell
volume of 14.428 nm3, or 54%. This is close to the experi-
mentally measured value of 50–51%. The equivalent value for
Zeolite Y is around 48%.7 It is doubtful that the water
molecules in the b-cages can be regarded as accessible pore
water from the point of view of our ultrasonic measurements.
Dielectric measurements on Zeolite A, which has similar-sized
b-cage windows and cavities as Y, suggest that at low water
loadings it may take of the order of tens of days for water
molecules to penetrate into the b-cages.11 Exclusion of the b-cage volume would reduce the ‘available’ pore volume to
around 46%. This is in line with experimental adsorbed
amounts of gases other than water or nitrogen, but still larger
than the ‘‘accessible volume’’ of 34%, calculated from a hard-
sphere geometric model for the volume accessible in faujasite
to the centre of a water molecule.12 We might then expect the
available porosity into which the ultrasonic pressure waves can
diffuse to lie between 34 and 46%.
Fig. 3 shows the experimental attenuation spectrum for this
sample together with the theoretical viscous, porous, and total
attenuation spectra for a log-normal particle size distribution
with the parameters shown in Table 1 (sedimentation data). In
this sample the extra attenuation due to the porosity of the
particles does not dominate the viscous attenuation, however the
additional attenuation due to the porosity of the zeolite is still
evident, particularly at the lower measurement frequencies.
It is possible to obtain reasonable and virtually identical fits
to the experimental data by assuming either a porosity of 34%
and a pressure diffusivity of 4 � 10�5 cm2 s�1 or with a
porosity of 48% and a pressure diffusivity of 2 � 10�5 cm2 s�1.
Thus, the porosity and Dp cannot be determined uniquely in
this case. The curves are so nearly identical that only the 34%
porosity data is shown in Fig. 3 for clarity. The porosities
fitted represent approximately the lower and upper limits of
the values found from geometric considerations and from
experiment by other investigators, as discussed previously.
However, in either case the pressure diffusivity is very small.
From eqn (13) of Part I, pressure diffusivities of 4 � 10�5 cm2
s�1 and 2 � 10�5 cm2 s�1 correspond to pore diameters of 0.22
and 0.16 nm, respectively. These are much smaller than the
window diameters between the supercages in Zeolite Y (0.74
nm) and this indicates that the physical properties of the pore
water are different from those of the bulk solvent. This is
discussed further later in this section.
The small apparent pressure diffusivity explains why the
porous component of the attenuation is relatively small in this
case and occurs mainly at the lower frequencies in the mea-
surement range. For a particle with radius R = 0.4 mm at
1 MHz (corresponding to an angular frequency o of 2p �106 Hz) the quantity (eqn (9) of Part I)
oR2
Dp¼ 2p� 106 � ð4� 10�7Þ2
4� 10�9¼ 240
The maximum in the porous attenuation occurs when this
quantity is O(1). So the porous attenuation in this micropor-
ous material occurs mainly at lower frequencies than measur-
able with the AcoustoSizer II (i.e. o1 MHz), and the part that
can be measured is in the high frequency tail of the effect. The
pressure variations diffuse into the particle to a depth of order
ffiffiffiffiffiffiDp
o
r
which at 1 MHz is only 25 nm. The pressure diffusivity factor
is so small for these particles that the pressure variations are
confined to a thin layer on the outer surface of the particle.
The maximum porous attenuation occurs when the penetra-
tion depth is of the order of the particle radius. Therefore we
can obtain more information for mesoporous particles in our
current frequency range, and lower frequency measurements
will be required to obtain more information about micropores.
Physical properties of confined water in nanopores
In a recent review Bellissent-Funel13 concluded that water in
the vicinity of a hydrophilic surface may be regarded as being
in a state equivalent to bulk water at a lower temperature. The
degree of the effect may depend on the proximity of the water
molecules to the pore walls. For example Takahara et al.14,15
modelled the pore water of MCM-41 materials with pore
diameters of 2.14 and 2.84 nm as comprising monolayer water
and capillary-condensed water. MCM-41, like TUD-1, is a
mesoporous silica with narrow pore size distributions con-
trolled by template molecules during synthesis. The pores in
MCM-41 are largely 1-D straight through channels with
limited interconnection, unlike the 3-D networks in TUD-1.
In the MCM-41 samples, the more mobile ‘capillary-con-
densed’ water molecules had translational diffusion coeffi-
cients approximately half those of bulk water, and the
mobility decreased with decreasing pore size. The effect is
even more pronounced in the narrower pores of zeolites, and
Fig. 3 Experimental and theoretical ultrasonic attenuation spectra for
Zeolite Y. Experimental data are shown as solid points. Theoretical
data: (- - -) viscous attenuation; (� � �) porous attenuation; solid line total
attenuation (viscous + porous). Parameters used: hydrated particle
weight fraction 0.05; hydrated particle density 1.86 g cm�3; porosity
0.34; pressure diffusivity 0.000 04 cm2 s�1; d50 0.85 mm, d85 1.4 mm.
5128 | Phys. Chem. Chem. Phys., 2006, 8, 5124–5130 This journal is �c the Owner Societies 2006
here the picture is complicated by the presence of exchange-
able cations that also modify the properties of the water
around them. Paoli et al.16 studied the dependence of the
self-diffusion coefficient of pore water in Na-A and NaCa-A
zeolites. Zeolite NaA has a smaller limiting pore diameter than
ZeoliteY—the window diameter into the largest (a) cage is
0.42 nm. They found that the pressure diffusivity increased
with increasing water loading and decreased with increasing
Ca substitution, but was in all cases substantially less than the
bulk value. The diffusivities varied with the measurement
method, with quasi-elastic neutron scattering (QENS) giving
higher diffusivities than pulsed field gradient nuclear magnetic
resonance (PFG NMR).
For micropores and smaller mesopores (of a few nano-
meters diameter), therefore, the altered mechanical properties
of the pore water compared to bulk water should be taken into
account in any more detailed modelling of the porous attenua-
tion. Eqn (54) of Part I models the decreased compressibility
and increased effective viscosity of the pore water compared to
that of the bulk by means of the (c/cbulk)2 parameter. In effect,
these particles behave as if they have lower porosity and
smaller pores than if the pore water had the same properties
as bulk water.
LiChrosphers Si 100 (5 lm)
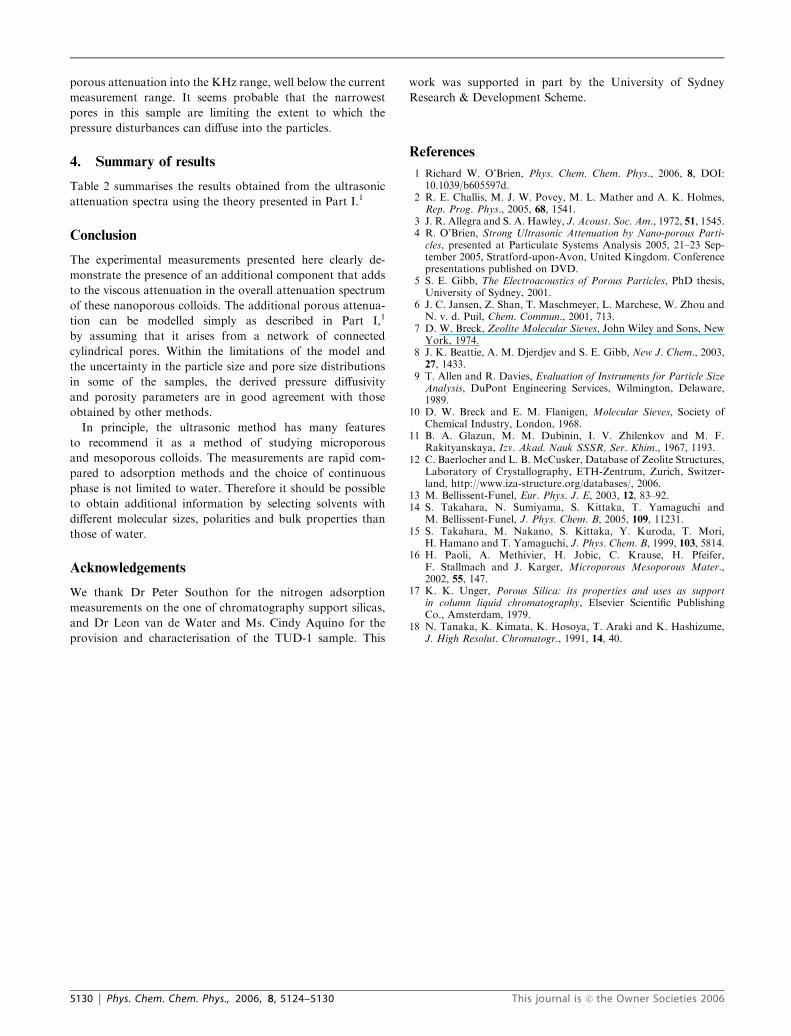
Fig. 4 shows the experimental attenuation spectrum for this
sample together with the theoretical viscous, porous, and total
attenuation spectra for a log-normal particle size distribution
with the parameters shown in Table 1 (sedimentation data).
Again, the experimental attenuation is greater than the viscous
attenuation expected for particles of this size and density.
From eqn (15) of Part I we would expect a maximum in the
porous attenuation at a frequency of about 0.4 MHz for 5 mmdiameter particles with 10 nm diameter pores (R/a E 500).
This is below the lower limit of 1 MHz for the AcoustoSizer II,
so, as for Zeolite Y, we are measuring only the tail of the
porous attenuation, yet even so it dominates the viscous
attenuation for these particles.
In this case, the porous attenuation can be modelled with
Dp = 0.0004 cm2 s�1 and 74% porosity. This pressure
diffusivity corresponds to a pore diameter of around 0.7 nm,
which is substantially smaller than an estimate based on the
manufacturer’s data and on nitrogen adsorption experiments
(10–16 nm). One possible explanation for this is that LiChro-
sphers silica particles have been observed by electron micro-
scopy to have substantial areas of the particle surface
composed of apparently non-porous shell, and in some cases
to have apparently solid internal boundaries5,17,18 These may
not significantly affect the nitrogen adsorption characteristics
of the particles, but might affect the diffusion of pressure
waves into the particle interior. The nature of the pore
structure in these particles is not clearly defined, but the
SEM investigations of the pores in similar LiChrosphers
silicas with larger nominal pore diameters have shown that
there is a wide distribution of pore sizes. An effective pore
diameter of 1 nm would shift the expected maximum in the
Fig. 4 Experimental and theoretical ultrasonic attenuation spectra
for LiChrosphers Si 100 silica. Experimental data are shown as solid
points. Theoretical data: (- - -) viscous attenuation; (� � �) porous
attenuation; solid line total attenuation (viscous + porous). Para-
meters used: hydrated particle weight fraction 0.10; hydrated particle
density 1.31 g cm�3; porosity 0.74; pressure diffusivity 0.0004 cm2 s�1;
d50 5.28 mm, d85 6.5 mm.
Table 2 Summary of parameters fitted to ultrasonic attenuation spectra using porous particle theory. Quantities in parentheses have beencalculated from either the fitted Dp or from the nominal pore diameter using eqn (13) of Part I1
Material How obtained Porosity
PressurediffusivityDp/cm
2 s�1
Correspondingaverage porediameter/nm Comments
PlatinumtSilica
Fitted to attenuation data 0.29 0.025 (6) The only sample to show a maximum in the totalattenuation in the measured frequency range.
Based on properties in Table 1 0.29 (0.07) 10.5TUD-1 Silica Fitted to attenuation data 0.69 0.45 (24) Polydisperse sample of very low concentration.
Maximum in attenuation probably lies to higherfrequency.
Based on properties in Table 1 0.69 (0.1) 11.7Zeolite Y Fitted to attenuation data 0.34 0.00004 (0.22) Maximum in attenuation probably lies to lower
frequency.Based on properties in Table 1 0.34–0.48 (0.0004) 0.74
LiChrosphers
SilicaFitted to attenuation data 0.74 0.0004 (0.7) Wide pore size distribution and some non-porous
boundaries. Maximum in attenuation probablylies to lower frequency
Based on properties in Table 1 0.74 (0.18) 16
This journal is �c the Owner Societies 2006 Phys. Chem. Chem. Phys., 2006, 8, 5124–5130 | 5129
porous attenuation into the KHz range, well below the current
measurement range. It seems probable that the narrowest
pores in this sample are limiting the extent to which the
pressure disturbances can diffuse into the particles.
4. Summary of results
Table 2 summarises the results obtained from the ultrasonic
attenuation spectra using the theory presented in Part I.1
Conclusion
The experimental measurements presented here clearly de-
monstrate the presence of an additional component that adds
to the viscous attenuation in the overall attenuation spectrum
of these nanoporous colloids. The additional porous attenua-
tion can be modelled simply as described in Part I,1
by assuming that it arises from a network of connected
cylindrical pores. Within the limitations of the model and
the uncertainty in the particle size and pore size distributions
in some of the samples, the derived pressure diffusivity
and porosity parameters are in good agreement with those
obtained by other methods.
In principle, the ultrasonic method has many features
to recommend it as a method of studying microporous
and mesoporous colloids. The measurements are rapid com-
pared to adsorption methods and the choice of continuous
phase is not limited to water. Therefore it should be possible
to obtain additional information by selecting solvents with
different molecular sizes, polarities and bulk properties than
those of water.
Acknowledgements
We thank Dr Peter Southon for the nitrogen adsorption
measurements on the one of chromatography support silicas,
and Dr Leon van de Water and Ms. Cindy Aquino for the
provision and characterisation of the TUD-1 sample. This
work was supported in part by the University of Sydney
Research & Development Scheme.
References
1 Richard W. O’Brien, Phys. Chem. Chem. Phys., 2006, 8, DOI:10.1039/b605597d.
2 R. E. Challis, M. J. W. Povey, M. L. Mather and A. K. Holmes,Rep. Prog. Phys., 2005, 68, 1541.
3 J. R. Allegra and S. A. Hawley, J. Acoust. Soc. Am., 1972, 51, 1545.4 R. O’Brien, Strong Ultrasonic Attenuation by Nano-porous Parti-cles, presented at Particulate Systems Analysis 2005, 21–23 Sep-tember 2005, Stratford-upon-Avon, United Kingdom. Conferencepresentations published on DVD.
5 S. E. Gibb, The Electroacoustics of Porous Particles, PhD thesis,University of Sydney, 2001.
6 J. C. Jansen, Z. Shan, T. Maschmeyer, L. Marchese, W. Zhou andN. v. d. Puil, Chem. Commun., 2001, 713.
7 D. W. Breck, Zeolite Molecular Sieves, John Wiley and Sons, NewYork, 1974.
8 J. K. Beattie, A. M. Djerdjev and S. E. Gibb, New J. Chem., 2003,27, 1433.
9 T. Allen and R. Davies, Evaluation of Instruments for Particle SizeAnalysis, DuPont Engineering Services, Wilmington, Delaware,1989.
10 D. W. Breck and E. M. Flanigen, Molecular Sieves, Society ofChemical Industry, London, 1968.
11 B. A. Glazun, M. M. Dubinin, I. V. Zhilenkov and M. F.Rakityanskaya, Izv. Akad. Nauk SSSR, Ser. Khim., 1967, 1193.
12 C. Baerlocher and L. B. McCusker, Database of Zeolite Structures,Laboratory of Crystallography, ETH-Zentrum, Zurich, Switzer-land, http://www.iza-structure.org/databases/, 2006.
13 M. Bellissent-Funel, Eur. Phys. J. E, 2003, 12, 83–92.14 S. Takahara, N. Sumiyama, S. Kittaka, T. Yamaguchi and
M. Bellissent-Funel, J. Phys. Chem. B, 2005, 109, 11231.15 S. Takahara, M. Nakano, S. Kittaka, Y. Kuroda, T. Mori,
H. Hamano and T. Yamaguchi, J. Phys. Chem. B, 1999, 103, 5814.16 H. Paoli, A. Methivier, H. Jobic, C. Krause, H. Pfeifer,
F. Stallmach and J. Karger, Microporous Mesoporous Mater.,2002, 55, 147.
17 K. K. Unger, Porous Silica: its properties and uses as supportin column liquid chromatography, Elsevier Scientific PublishingCo., Amsterdam, 1979.
18 N. Tanaka, K. Kimata, K. Hosoya, T. Araki and K. Hashizume,J. High Resolut. Chromatogr., 1991, 14, 40.
5130 | Phys. Chem. Chem. Phys., 2006, 8, 5124–5130 This journal is �c the Owner Societies 2006
Copyright © 2022 FDOKUMEN