
Adsorption of Lead (II) Ions by Organosilicate Nanoporous ...
220
Old Dominion University Old Dominion University ODU Digital Commons ODU Digital Commons Civil & Environmental Engineering Theses & Dissertations Civil & Environmental Engineering Spring 2007 Adsorption of Lead (II) Ions by Organosilicate Nanoporous Adsorption of Lead (II) Ions by Organosilicate Nanoporous Materials Materials Larry Keith Isaacs Old Dominion University Follow this and additional works at: https://digitalcommons.odu.edu/cee_etds Part of the Environmental Engineering Commons Recommended Citation Recommended Citation Isaacs, Larry K.. "Adsorption of Lead (II) Ions by Organosilicate Nanoporous Materials" (2007). Doctor of Philosophy (PhD), Dissertation, Civil & Environmental Engineering, Old Dominion University, DOI: 10.25777/fphy-gm74 https://digitalcommons.odu.edu/cee_etds/66 This Dissertation is brought to you for free and open access by the Civil & Environmental Engineering at ODU Digital Commons. It has been accepted for inclusion in Civil & Environmental Engineering Theses & Dissertations by an authorized administrator of ODU Digital Commons. For more information, please contact [email protected].
-
Upload
khangminh22 -
Category
Documents
-
view
3 -
download
0
Transcript of Adsorption of Lead (II) Ions by Organosilicate Nanoporous ...

Old Dominion University Old Dominion University
ODU Digital Commons ODU Digital Commons
Civil & Environmental Engineering Theses & Dissertations Civil & Environmental Engineering
Spring 2007
Adsorption of Lead (II) Ions by Organosilicate Nanoporous Adsorption of Lead (II) Ions by Organosilicate Nanoporous
Materials Materials
Larry Keith Isaacs Old Dominion University
Follow this and additional works at: https://digitalcommons.odu.edu/cee_etds
Part of the Environmental Engineering Commons
Recommended Citation Recommended Citation Isaacs, Larry K.. "Adsorption of Lead (II) Ions by Organosilicate Nanoporous Materials" (2007). Doctor of Philosophy (PhD), Dissertation, Civil & Environmental Engineering, Old Dominion University, DOI: 10.25777/fphy-gm74 https://digitalcommons.odu.edu/cee_etds/66
This Dissertation is brought to you for free and open access by the Civil & Environmental Engineering at ODU Digital Commons. It has been accepted for inclusion in Civil & Environmental Engineering Theses & Dissertations by an authorized administrator of ODU Digital Commons. For more information, please contact [email protected].

ADSORPTION OF LEAD (II) IONS BY
ORGANOSILICATE NANOPOROUS MATERIALS
B.S. May 1972, University of New Mexico M.S. May 2003, Christopher Newport University
A Dissertation Submitted to the Faculty of Old Dominion University in Partial Fulfillment of the
Requirement for the Degree of
by
Larry Keith Isaacs
DOCTOR OF PHILOSOPHY
ENVIRONMENTAL ENGINEERING
OLD DOMINION UNIVERSITY May 2007
Approved by:
Gary C. Schafranf (Member)
j de Erte n-Unal (Director)
Resit Unal (Member)
Tarek M. Abdel-Fattah (Member)
Reproduced with permission of the copyright owner. Further reproduction prohibited without permission.

ABSTRACT
ADSORPTION OF LEAD (II) IONS BY ORGANOSILICATE NANOPOROUS MATERIALS
Larry Keith Isaacs Old Dominion University, 2007 Director: Dr. Mujde Erten-Unal
As-synthesized organosilicate nanoporous (OSNP) materials HMS (hexagonal
mesoporous structure) and MCM-41 were used as adsorbents for removal of lead (II) ions
in laboratory batch and column studies. Mesoporous organosilicates were prepared from
tetraethylorthosilicate (TEOS) and either an ionic (cetyltrimethyl-ammonium) or neutral
(dodecylamine) surfactant. Batch reaction distribution coefficients for MCM-41 were Kd
= 51.5 L/g (SD - 26.3) at 24 h and KD = 73.7 L/g (SD = 40.5) at 7 d. OSNP lead (II) ion
adsorption increased from pH = 3 until pH ca. 7.5 after which a sharp decrease in
adsorption was noted. OSNP materials reflected a dependence on ionic strength
consistent with an outer-sphere complexation and electrostatic bonding mechanism.
Lead (II) ion adsorption behavior in seven matrix batch solutions was not effective
possibly due to soluble complexes that were formed that prevented adsorption and
precipitation. There was no difference in the batch adsorption performance of MCM-41
and HMS. Column designs were optimized by response surface methods. OSNP
material/sand media head loss at a superficial velocity = 0.49 m/h increased 28.1%
compared with sand only media. At column break through, defined as Ce/Co = 0.5,
MCM-41/sand media Kd = 46.2 L/g and sand only Kd = 0.04 L/g. There was significant
evidence to warrant rejection of the claim that the variances in Kd were equal (P < 0.001,
n = 12). Adsorption capacity in columns with synthetic adsorbates at Ce/Co = 0.50 were
HMS = 0.013 mmol/g (2.74 mg/g) at 0.6 m3/m2 h and MCM-41 = 0.071 mmol/g (14.63
Reproduced with permission of the copyright owner. Further reproduction prohibited without permission.

mg/g) at 2.1 m3/m2 h. For a stormwater treated by single pass column filtration, MCM-
41 lead (II) ion adsorption at Ce/Co = 0.50 was 0.028 mmol/g (5.88 mg/g) and sand only
= 2.83E-05 mmol/g (0.01 mg/g). Water molecule ionization by metal cations decreased
influent pH, combined with deprotonation of MCM-41 during adsorption of lead (II)
ions, caused a decrease in pH sufficient to change column adsorption performance. The
declining rate sand filtration cost for a 100 m2 unit in 2007 dollars was estimated at
$31,600, however this did not include the cost for MCM-41 adsorbent materials, which
are not available commercially. Adsorbent life cycle was calculated at 2.6 years.
Reproduced with permission of the copyright owner. Further reproduction prohibited without permission.

Copyright, 2007, by Larry Keith Isaacs, All Rights Reserved.
Reproduced with permission of the copyright owner. Further reproduction prohibited without permission.

This dissertation is dedicated to my wife Marsha who has been forever patient
and to our children for their constant encouragement.
Reproduced with permission of the copyright owner. Further reproduction prohibited without permission.

ACKNOWLEDGMENTS
There are many people who have contributed to the successful completion of this
dissertation. I wish to extend sincere thanks to all my professors and teachers who have
encouraged me throughout the conduct of this research. To the dissertation committee
Drs. Mujde Erten-Unal, Gary C. Schafran, Resit Unal, and Tarek M. Abdel-Fattah for
their collective and individual inquiry that significantly improved my research.
Drs. Schafran, Yoon and Erten-Unal all conducted rigorous graduate course work
in wastewater treatment, water treatment, aquatic chemistry, water modeling, and water
quality management. Their thought provoking lectures and exams challenged me to study
hard and really understand the material.
A very special thanks is extended to Dr. Tarek M. Abdel-Fattah who provided the
synthesis method for the nanoporous materials, access to the CNU laboratory, and for the
time he spent discussing options, ideas, and concepts of nanotechnology. His extensive
knowledge of physical chemistry and his constant mentoring helped me extensively.
Gratefully I thank my graduate advisor, Dr. Mujde Erten-Unal, who from the first
day we met in class provided clear timely guidance. Her constant encouragement and
suggestions to help me circumnavigate the doctoral process kept me on track and
successful. Her cheerful countenance made the process manageable and possible.
Special thanks to my supervisors Ms. Patricia M. Ogorzaly and Mr. Robert C.
Barrett who generously allowed me to take leave whenever I needed time to meet school
tasks. With their steady and generous support I was able to complete my studies while
working full time.
Reproduced with permission of the copyright owner. Further reproduction prohibited without permission.

TABLE OF CONTENTSPage
LIST OF TABLES...............................................................................................................x
LIST OF FIGURES..................... .......................................................................................... .xii
LIST OF EQUATIONS.....................................................................................................xv
Section
1. INTRODUCTION................................................................................................ 11.1 ORGANOSILICATE NANOPOROUS MATERIALS......................11.2 BACKGROUND OF THE PROBLEM..............................................31.3 RESEARCH OBJECTIVE............................................. 101.4 RESEARCH APPROACH................................................................10
2. LITERATURE REVIEW...................................................................................122.1 ORGANOSILICATE NANOPOROUS MATERIALS....................122.2 SYNTHESIS AND MATERIAL PREPARATIONS.......................142.3 CHARACTERIZATION OF MESOPOROUS MATERIALS........ 192.4 NANOPOROUS MATERIAL APPLICATIONS.............................192.5 LEAD IN SOILS AT OUTDOOR SHOOTING RANGES............. 262.6 COMPLEXES OF LEAD IN SOILS............................................... 282.7 HEAVY METAL REMOVAL TECHNOLOGIES OVERVIEW... 312.8 MASS TRANSFER ADSORPTION THEORY.............................. 382.9 AQUATIC CHEMISTRY OF LEAD (II) IONS............................. 442.10 OPTIMIZATION USING RESPONSE SURFACE
METHODOLOGY...........................................................................48
3. METHODS AND MATERIALS.......................................................................533.1 SYNTHESIS AND CHARACTERIZATION OF OSNP
MATERIALS....................... -............................................................533.1.1. HMS SYNTHESIS ................................................................533.1.2. MCM-41 SYNTHESIS ...................................................... 543.1.3. CHARACTERIZATION OF OSNP MATERIALS............. 54
3.2 SCREENING OSNP MATERIALS BY BATCH AND STRAW COLUMNS.......................................................................................57
3.3 SCREENING OSNP MATERIALS IN COLUMN STUDIES....... 583.4 HYDRAULIC EVALUATION........................................................603.5 LEACHABILITY OF OSNP MATERIALS FROM
SAND FILTER.................................................................................623.6 SYNTHETIC STORMWATER CHARACTERISTICS................. 633.7 RSM OPTIMIZATION EXPERIMENTAL SET-UP...................... 683.8 ADSORPTION ISOTHERM OF LEAD (II) IONS BY MCM-41
AND HMS ..................................................................................70
Reproduced with permission of the copyright owner. Further reproduction prohibited without permission.

3.9 INFLUENCE OF PH ON BATCH REACTION ADSORPTION... 713.10 ADSORPTION INTERFERENCE BY COMPETITIVE IONS.... 713.11 COLUMN STUDY........................................................................ 723.12 SAND FILTRATION CONCEPT DESIGN.................................. 74
4. RESULTS AND DISCUSSION.................. 764.1 OSNP MATERIAL CHARACTERIZATION................................. 764.2 OSNP MATERIAL SELECTION....................................................814.3 SCREENING BREAKTHROUGH AND LOADING
CAPACITY.......................................................................................834.4 HEADLOSS......................................................................................844.5 LEACHABILITY OF OSNP MATERIALS IN SAND
FILTRATION...................................................................................844.6 COLUMN OPTIMIZATION BY RESPONSE SURFACE
METHODS.................................................. 864.7 ISOTHERMS, INFLUENCE OF PH AND COMPETITIVE
IONS.................................................................................................984.7.1 ADSORPTION ISOTHERM................................................. 984.7.2 INFLUENCE OF P H ............................................................1024.7.3 INFLUENCE OF COMPETITIVE IONS............................1044.7.4 QUALITATIVE DISCUSSION ON OSNP
ADSORPTION IN BATCH REACTIONS.........................1094.8 LEAD (II) ION ADSORPTION PERFORMANCE
IN COLUMNS................................................................................1144.8.1 COLUMN BREAK THROUGH CURVES..........................1144.8.2 DISCUSSION OF ATYPICAL ADSORPTION
ISOTHERM FOR MCM-41 .................................................1174.8.3 COLUMN BREAK THROUGH USING RECYCLED
ADSORBATE.....................................................................1224.8.4 COLUMN BREAK THROUGH; AN ABBREVIATED
VALIDATION CHECK..................................................... 1234.8.5 OSNP MATERIAL PERFORMANCE USING
STORMWATER .........................................................1244.9 SAND FILTRATION CONCEPTUAL DESIGN..........................128
4.9.1 CONCEPTUAL DESIGN PROCEDURE............................1294.9.2 DESIGN PARAMETER CALCULATIONS.......................1304.9.3 FILTRATION UNIT CONCEPT DESIGN..........................132
5. SUMMARY AND CONCLUSION .......................................................1355.1 PERSPECTIVES ON FUTURE WORK................ 1385.2 CONCLUSION............................................. 140
REFERENCES.................................... 142
APPENDICES................................................................................................................. 152
A. ACRONYMS AND DEFINITIONS..............................................................153
Reproduced with permission of the copyright owner. Further reproduction prohibited without permission.

B. JOURNAL PAPER: LEAD LEACHING FROM SOILS AND IN STORM WATERS AT TWELVE MILITARY SHOOTING RANGES...................... 155
C. FORMATION CONSTANTS.........................................................................194
VITA............................................................................................................................... 203
Reproduced with permission of the copyright owner. Further reproduction prohibited without permission.

LIST OF TABLES
Table Page
1. NAD and Anthropogenic Trace Metals in Pedons Across the U.S. .............................. 4
2. Average Wastewater Influent Total Metal Concentrations............................................ 6
3. MCM-41 Synthesis Pathways........................................................................................15
4. Representative Functionalized Mesoporous Sieves...................................................... 20
5. MCM-41 Adsorption of Various Adsorbates in Batch Reactions................................ 22
6. Heavy Metals in Outdoor Shooting Range Soils.......................................................... 27
7. Shooting Range Soil and SPLP Lead and Copper Characteristics............................... 31
8. Solubility Products for Selected Lead Minerals and Compounds................................ 31
9. Traditional Heavy Metal Removal Technologies......................................................... 37
10. Hydrolysis Equilibria Lead (II) Speciation in Natural Waters................................... 45
11. OSNP Batch Reaction Materials..................................................................................55
12. Cation Analysis of Stormwater and Synthetic Solutions............................................ 66
13. Stormwater Characteristics..........................................................................................68
14. RSM Coded Factor Levels..........................................................................................69
15. Matrix Solution Constituents.......................................................................................71
16. FTIR Frequency of HMS and MCM-41 OSNP Materials.......................................... 80
17. Distribution Coefficients for Amine Functionalized Materials.................................. 82
18. Design Matrix in Geometric Notation.........................................................................87
19. Adsorption Treatment..................................................................................................88
20. Factor Effect Summary................................................................................................89
21. Analysis of Variance Summary for Dual-Media Filter............................................... 90
Reproduced with permission of the copyright owner. Further reproduction prohibited without permission.

22. Optimized Operating Column Parameters................................ 92
23. Log Normal Transformed ANOVA.............................................................................93
24. Mid-Point RMS Model Linearity Validation.............................................................. 95
25. Freundlich and Langmuir Parameters..........................................................................98
26. Adsorption Capacity at Specific p H ..........................................................................103
27. Batch Matrix Solution Characteristics.......................................................................105
28. Lead (II) Ion Adsorption Capacity for MCM-41, HMS and Sand Columns 115
29. Effect of Recycling on Adsorption Performance.......................................................122
30. Total Cations in Shooting Range Stormwater...........................................................125
31. Stormwater Charge Balance...................................................................................... 126
32. Small Arms Range Filter Sizing Parameters.............................................................129
33. Geotechnical Characteristics of Shooting Range Berm Soils.................................... 179
34. Percent Soil Crystalline Phases as Determined by XRD...........................................181
35. Bulk Soil Sequential Extraction Pb Associations in mg/kg.......................................184
36. Lead Fractional and Soil Leaching Associations.......................................................185
37. Measured Stormwater Lead Concentrations..............................................................187
38. Batch Study Results................................................................................................... 188
Reproduced with permission of the copyright owner. Further reproduction prohibited without permission.

LIST OF FIGURES
Figure Page
1. Average Soil Lead Concentrations Outside Shooting Range Boundaries.......................8
2. Dissolved Lead in Stormwaters...................................................................................... 9
3. Chemical Structure of HMS...................................................................... ....................16
4. Chemical Structure of MCM-41....................................................................................17
5. Surface Functionalization of Mesoporous Materials.....................................................18
6. Eh - pH Stability Diagram for Pb Compounds............................................................. 30
7. Speciation of Pb Hydroxide and Carbonate Species..................................................... 46
8. Speciation of Pb Hydroxide and Chloride Species....................................................... 48
9. 22 Factorial RSM Pb2+ Adsorption by Granular Filtration........................................... 50
10. Bragg's Law Diffraction Nomenclature...................................................................... 56
11. Metals in Stormwaters Collected from Small Arms Firing Ranges........................... 64
12. Column Study Experimental Set-up........................................................................... 73
13. XRD Diffraction Patterns............................................................................................76
14. Schematic Representation of OSNP Material Structure............................................. 77
15. Transmission Electron Micrographs........................................................................... 78
16. SEM Micrographs MCM-41...................................................................................... 79
17. OSNP Adsorption by Functionalization......................................................................81
18. Effluent Conductivity Values Versus Influent Tap Water.......................................... 86
19. 23 Factorial Design Labels...........................................................................................88
20. Model Normal Percent Probability Plot................... 93
21. Model Predicted Versus Actual Plot........................................................................... 94
Reproduced with permission of the copyright owner. Further reproduction prohibited without permission.

22. Response Surface Model..............................................................................................96
23. RSM Model Predictions at Constant OSNP Material Amendment............................ 97
24. Adsorption Isotherm Lead (II) Ions on OSNP Materials............................................ 99
25. Langmuir Adsorption Isotherm Coefficients Plots....................................................100
26. Freundlich Adsorption Isotherm Coefficient Plots....................................................101
27. Effect of pH on Lead (II) Ions Removed in Matrix Solution....................................103
28. Lead (II) Distribution Coefficients in Batch Reactions.............................................107
29. Silicate Surfactant Mesostructure..............................................................................108
30. Fraction of Lead (II) Ions in Matrix 1........................................................................110
31. Fraction of Lead (II) Ions in Matrix 2........................................................................I l l
32. Fraction of Lead (II) Ions in Matrix 3........................................................................112
33. Column Breakthrough Curves for Lead (II) Ions......................................................116
34. MCM-41 Adsorption Isotherm by Reference Zones.................................................117
35. MCM-41 Adsorption and Flow Rate.........................................................................119
36. MCM-41 Bed Volume vs Effluent pH.......................................................................120
37. MCM-41 Turbidity vs Bed Volume and Elapsed Time.............................................120
38. Column Adsorption of Matrix Solute.......................................................................124
39. Column Lead (II) Ion Adsorption of Stormwater......................................................127
40. Austin Sand Filter Design Concept............................................................................128
41. In-SitU Sand Bed Filtration Design Concept.............................................................133
42. Locations of Military Small Arms Firing Ranges in Nine States..............................178
43. Particle Size Distribution...........................................................................................182
44. Particle Size Distribution..........................................................................................184
Reproduced with permission of the copyright owner. Further reproduction prohibited without permission.

x iv
45. Lead Leaching Behavior in Soils From Column Studies...........................................190
46. Column Study Leachate pH.......................................................................................192
Reproduced with permission of the copyright owner. Further reproduction prohibited without permission.

XV
LIST OF EQUATIONS
Equation Page
1. Weathering and Oxidation of Lead in Soils.................................................................. 28
2. Chemical Precipitation of Lead.................................................................................... 32
3. Site Binding Surface Complexation Equilibrium......................................................... 39
4. Phase Transfer Surface Model...................................................... 40
5. Langmuir Isotherm.........................................................................................................41
6. Linear Form of the Langmujir Isotherm....................................................................... 41
7. Metal Ion Adsorption Capacity..................................................................................... 41
8. Distribution Coefficient at Solid/Water Interace.......................................................... 41
9. Freundlich Isotherm.......................................................................................................42
10. Linear Form of the Freundlich Isotherm..................................................................... 42
11. Equilibrium Equations for Lead Hydrolysis Complexes............................................ 47
12. RMS First Order Multiple Linear Regression Model................................................. 51
13. RMS Second Order ModelRMS Second Order Model............................................... 51
14. Bragg Equation............................................................................................................55
15. Carmen, Kozeny Headloss Formula........................................................................... 61
16. Adsorption of Lead (II) Ions........................................................................................73
17. Percent Removed of Lead (II) Ions..............................................................................74
18. Regression Model for RSM.........................................................................................88
19. First Order Regression Model for RSM...................................................................... 91
20. RSM Proportionality Partial Differential Equations................................................... 91
21. Column Adsorption Capacity at Breakthrough..........................................................114
Reproduced with permission of the copyright owner. Further reproduction prohibited without permission.

1
1. INTRODUCTION
Soil and water become contaminated with elevated metal concentrations from
various anthropogenic processes. Nationwide superfund sites have been documented
with elevated concentrations levels of metals (U.S. EPA 1997). Since metals do not
readily degrade naturally, immobilization, stabilization and removal techniques have
been continually explored for improved remediation solutions (Babel and Kumiawan
2003; Kostal et al. 2005; Lanouette 1977). Recent development of nanotechnologies has
offered novel adsorption possibilities for metals in aqueous conditions (Dionysiou and
Wiesner 2007; Savage and Diallo 2005). This research focuses on the application of one
type of nanoporous materials, with at least one dimension in the nanometer size; explores
its ability to remove lead (II) cations discharged from shooting ranges in stormwaters,
and considers an application method in a dual-media declining rate sand filtration system.
1.1 Organosilicate Nanoporous MaterialsDiscovery in 1992 of the family of mesoporous molecular sieve MCM-41 by
scientist at Mobil Research and Development Corporation, Paulsboro, NJ (Kresge et al.
1992) and similar breakthroughs by Inagaki et al. (1993), inaugurated a new technology
that has generated significant scientific interest and study of synthesized meso-structures
(Amato 1993; Feng et al. 1997). These molecular sieves are characterized by an ordered
uniformed cylindrical mesoporous structure with at least one dimension in the nanometer
range. Physically they fit between ordinary crystalline and amorphous solids (Rao and
Cheetham 2001). They are uniquely different from zeolites, with a purely tetrahedral
The model for this dissertation is the Journal o f Environmental Engineering
Reproduced with permission of the copyright owner. Further reproduction prohibited without permission.

2
structure that display a uniform honeycomb-like non-intersecting tubular channel
framework (Schumacher et al. 2000).
Like zeolite synthesis, MCM-41 materials are prepared using a surfactant (organic
molecule) and silica or silica-alumina (silicate) at sufficient concentrations to self-
assemble into the organosilicate nanoporous (OSNP) structures used in this research
(Zhao et al. 1996). Others have demonstrated the MCM-41 family may be synthesized
from a variety of temperatures, pH, reaction time and from at least four different gel
reaction synthesis routes (Huo et al. 1994, Tanev et al 1995). The large surface area (>
1100 m2/g) and ordered pore diameters 15 and 100 A (Beck et al. 1992) make the
material uniquely qualified as a special class of meso structures. Per IUPAC, materials
with pore diameters of 20 to 500 A are called mesoporous. The mesostructure can be
controlled by a choice of template surfactants, by adding organic moieties, and by
changing reaction parameters (temperature, pH, reaction time, and concentrations). The
materials also have large metal ion/aqueous distribution coefficients, KD = 340,000
(Yoshitake et al. 2003, Sayari et al. 2005). This adsorption behavior suggests there may
be many industrial, environmental, and medical application possibilities (Feng et al.
1997).
This research focuses on the application of the M41S family of silicate
mesoporous molecular sieves with 5 - 50 A uniform pore structures (Kresge et al. 1992;
Vartuli et al. 2001) as lead (II) ion adsorbents in a field condition competitive ion
aqueous environment. The setting of this research has basis in two areas. The first is the
recurring predominance of particulate-associated and dissolved lead (II) ions in
wastewaters and stormwaters in an urban and industrial, namely shoot range context.
Reproduced with permission of the copyright owner. Further reproduction prohibited without permission.

The second area is the synthesis of the silicate porous materials, which show promise as
an adsorbent with tunable porosities and behavior that may have unique application for
the removal of metal ions in solution. Both areas of interest are addressed. The goal of
this research was to develop an approach to lead (II) ion adsorption using OSNP material
in a low-maintenance passive field application.
1.2 Background of the ProblemLead is a toxic heavy metal that is nonfunctional biologically, that is, it is not a
required macro or micronutrient for flora and fauna. Lead has four valence states. A
valence of zero in the elemental form, monovalent, divalent and tetravalent. In the
environment lead exist in the divalent form and oxidizes to the tetravalent form only in
the presence of very strong oxidizing agents and then is not stable. In aqueous forms it
can be found dissolved as a free ion, hydroxide and carbonate forms. It may also exist as
particulate bound. The most common dissolved compounds include lead sulfate, lead
chloride, lead hydroxide, and lead carbonate (Eisler, 1988). It can be easily adsorbed in
plant roots and transported by the xylem throughout the plant interfering with
photosynthesis, germination, mitosis and cell division (Baghour et al. 2001).
Lead is a noted source of lead exposure to children through ingestion, respiratory,
and dermal uptake. It is also an accumulative biotoxin that is not metabolized and
excreted by mammalians. Similarly, fauna are detrimentally affected by exposure to lead
(Hettiarachchi et al. 2000). Mitigating transport, accumulation and migration of lead in
the environment is desired. Trace to moderate levels of heavy metals naturally occur in
soils. A survey of surface horizons pedons of NAD (no known anthropogenic addition)
soils across the United States by Burt (2003) found trace amounts of toxic and
Reproduced with permission of the copyright owner. Further reproduction prohibited without permission.

4
micronutrient heavy metals (Table 1). The research reported the physical and chemical
properties of soil highly variable. The most important soil factors that determined the
amount and distribution of trace metals were parent material, pedogenesis, and
anthropogenic contributions. From this study the concentration of metals in NAD soils
sources are approximated and provide a basis for initial estimates of background
conditions.
The results in Table l depict generally higher values in the NAD soils than
anthropogenic pedons. Burt et al. (2003) do not offer any detailed explanation for the
higher NAD pedon metal concentrations for Cr and Co, but did contend the elevated
Table 1. NAD and Anthropogenic Trace Metals in Pedons Across the U.S.Soil samples were taken from benchmark soils or soils considered extensive, important, and unique in the soil classification system. As such these soils are more important than other soil types. The studied pedons had a pH range from 2.1 to 9.9. All values are in mg/kg and show the arithmetic mean ± standard deviation. NAD = no known anthropogenic addition.
Metal NAD Pedons (n = 312) Anthropogenic Pedons (n = 392) Percentdifference
Pb 12.2 ± 14.1 102.9 ± 156.2 + 743.4Cd 0.20 ±0.18 0.80 ±3.3 ±300.0Cu 24.7 ± 27.7 74.8 ± 189.3 ± 202.8Mn 588.9 ±507.3 589.0 ± 629.8 -0.02Zn 162.6 ±27.2 148.6 ±491.6 -8.6Ni 59.5 ± 279.2 41.3 ±95.3 -30.6Co 13.4 ±30.4 7.9 ±7.1 -41.0Cr 88.7 ±360.4 29.3 ±33.5 -67.0
anthropogenic Pb is most likely from leaded gasoline and lead-based paints. For the
purposes of this research the Burt et al. (2003) study provides a point of demarcation for
lead and copper in soils. Significant departures from these averages can provide a basis
for evaluating the impact of an activity or process on the environment. The next section
Reproduced with permission of the copyright owner. Further reproduction prohibited without permission.

discusses how these impacts manifest themselves in waste and stormwaters, which have
originated from NAD and anthropogenic soil sources.
Heavy metal ions in urban wastewaters are generated from various industrial and
domestic sources. Industrial processes like metal plating, tanneries, mining operations,
and car washes discharge metal constituents into the wastewater collection system (Bulut
and Baysal 2006). Metals found frequently in domestic wastewaters include cadmium
(Cd), chromium (Cr), copper (Cu), iron (Fe), lead (Pb), manganese (Mn), mercury (Hg),
nickel (Ni), and zinc (Zn) (Cajuste et al. 1991; Chipasa 2003; Moriyama et al. 1989; Rule
et al. 2006; Sorme and Lagerkvist 2002; Tchobanoglous et al. 2003; Wang et al. 2006).
Most particulate bound metals are removed in the wastewater treatment processes (Ekster
and Jenkins 1996), however dissolved metals (metal in solution after passing through a <
0.45 pm filter) may be discharged in treated wastewaters (Buzier et al. 2006; Gagnon and
Saulnier 2003).
Oxidation, complexation, precipitation, and dissolution of metals from natural and
anthropogenic sources result in trace metal concentrations in urban wastewaters.
Wastewater treatment plant influent metal concentrations from four countries have been
reported (Table 2). Feces account for 60-70% of the Cd, Cu, Ni and Zn in domestic
wastewater and more than 20% of the mixed wastewater from domestic and industrial
processes. Other sources of metals in domestic wastewater are from body care products,
pharmaceuticals, cleaning materials and liquid waste. Copper and lead originate from
piping depending on the aggressive nature of water (Thornton et al. 2001).
The concentration of lead in urban stormwater has also been the interest of many
researchers. The elevated amounts found are concerning, but not surprising considering
Reproduced with permission of the copyright owner. Further reproduction prohibited without permission.

6
Table 2. Average Wastewater Influent Total Metal Concentrations
Metal_____________________ Average Daily (pg/L)As NA NA NA NA 2.6Cd 20 40 30 0.38 <1Cr 2 20 18 2.8 31Cu 62 30 75 189 77Pb 26 80 43 7.4 68Hg 4 NA NA 0.57 NANi 17 10 50 6.7 14.3Zn 28 50 49 160 346
Location France Norway UnitedKingdom
UnitedKingdom
Melbourne,Australia
Reference (Thornton (Thornton (Thornton (Rule et (Wilkie etet al. 2001) et al. 2001) et al. 2001) al. 2006) al. 1996)
NA = Not Analyzed
the many anthropogenic uses and applications of lead. Lead in urban stormwaters within
the continental United States have been reported at 15.5 times background (Murray et al.
2004). One investigator studied the sources of lead in the urban environment and found
the highest concentrations in synthetic rain waters leached from painted wood building
siding, and found other contributions to the lead urban deposition from roofs, brake dust,
automobile tires, automobile oil and concrete. The investigators total annual urban
loading estimate for all lead sources was 0.069 kg Pb/ha-yr (Davis et al. 2001). Boiler
(1997) estimated 50 - 80% of metals in stormwater run-off come from roofs and streets.
While these wet weather contributions are significant, a six-year study in California
found 33% of lead in surface run-off waters came from dry weather flows, indicating a
pervasive and constant anthropogenic urban source (McPherson et al. 2005). Other
elevated urban sources include Sweden street sediments (Viklander 1998), and roadsides
(Backstrom et al., 2004) which contained elevated lead, and Washington D.C. with trace
Reproduced with permission of the copyright owner. Further reproduction prohibited without permission.

7
elements of lead along roadways (Wigington et al., 1986). A nationwide urban study by
the U.S. EPA (1983) reported average stormwater total lead concentrations at 140 pg/L.
The distribution of lead manufactured in the United States includes 72% for
storage batteries, 13% in gasoline additives and other chemicals, 2% in solder and 9% for
other uses (Yu et al. 2001). The remaining 4% is used as ammunition (shot and bullets).
The U.S. Environmental Protection Agency (EPA) estimates the 4% translates into
72,575 metric tons, which is used as ammunition at military and private shooting ranges.
This translates into about 7.26 x 10⁷ kg of lead introduced into the environment by this
process (U.S.EPA 2001). Lead is heavily accumulated in soils within shooting range
boundaries (Astrup et al. 1999; Basunia and Landsberger 2001; Bruell et al. 1999; Cao et
al. 2003; Dermatas et al. 2003; Hardison et al. 2004; Vantelon et al. 2005). Lead
contamination within shooting ranges have been documented at concentrations to
400,000 mg/kg (Astrup et al. 1999). Shotgun pellets and expended bullets in soils have
also been found to transform into lead complexes through weathering in the soil
environment (Cao et al. 2003; Jorgensen and Willems 1987). Lead complexes formed
by weathering may be more mobile in the environment than thought to occur.
In a 2004 study of 12 Air Force installations by the U. S. Air Force, Headquarters
Air Combat Command, Langley Air Force Base (AFB), Virginia, and directed by this
researcher, lead in soils outside, but less than 10 m from shooting range boundaries, had
dissolved lead concentrations of 194 pg/L suggesting some lead may be migrating off
range (Isaacs 2003; Isaacs et al. 2005) (Figure 1).
Stormwater run-off samples were also collected and analyzed for total and
dissolved lead. Dissolved lead results are depicted in Figure 2. In other studies, Ma et
Reproduced with permission of the copyright owner. Further reproduction prohibited without permission.

al., (2002) found dissolved lead in surface waters near outdoor shooting ranges in Florida
from non-detect to 234 pg/L and total lead from non-detect to 694 pg/L. The elevated
lead in stormwaters and the proximity of a small river to the shooting ranges, motivated
700 -r
600
500 ■■
400 ••
300 ••
200 ■ ■
100
WHI(10) BAR (6) LAN(7) SHW(7) HOL(3) ELS(5) CAN(3) BEA(4)
U.S. Air Force Base (number of samples)
i i < 10 m Outside Range —♦—Background
Fig. 1. Average Soil Lead Concentrations Outside Shooting Range Boundaries Total lead in soils collected in top 10 cm and located outside, but less than 10 m of the defined boundary of the shooting range. Background levels are the 95% upper confidence limit. Error bars depict standard error of averages. U.S. Air Force Base (AFB) abbreviations are WHI - Whiteman AFB, MO; BAR - Barksdale AFB, LA; LAN - Langley AFB, VA; SHW - Shaw AFB, SC; HOL - Holloman AFB, NM; ELS - Ellsworth AFB, SD; CAN - Cannon AFB, NM; and BEA - Beale AFB, CA. Compare also with nationwide Pb in NAD and anthropogenic pedons.
the Louisiana state environmental regulatory department to amend the Barksdale AFB
multi-sector stormwater discharge permit limit to 150 pg/L total lead at the outfall nearest
the shooting range. Other permit limits have reported total lead for shipyard stormwater
outfalls in California, Hawaii, and Virginia, at 335,140, and 100 pg/L, respectively
Reproduced with permission of the copyright owner. Further reproduction prohibited without permission.

9
(Burgos 1997). All of these amounts are elevated contrasted with stormwater lead (II)
concentrations reported by Barrett (2003) who used an EMC for dissolved lead (II) ions
in stormwater = 2.1 pg/L and Sansalone (1999) 21.7 pg/L for a Cincinnati, Ohio urban
site. The presence of elevated concentrations of lead (II) ions in stormwaters is evident
and requires remediation management.
iL3P h
oOnto
500
450
400 --
350 --
300 --
250 --
200 + ~
150
100
50
0
Mean =194 (SD = 185.1, n = 32)
+ + HIVA1 SD NJ LA MO VA2 CA
Shooting Range Location (State)
NM
Fig. 2. Dissolved Lead in StormwatersDissolved lead analyzed after filtration through Whatman 0.45 pm filter paper. Samples were analyzed following EPA Method SW-846. Average National Urban survey =55 pg/L and municipal solid waste = 433 pg/L. U.S. EPA Criteria Continuous Concentration (CCC) for protection of aquatic life and human health in surface water is1.3 to 7.7 pg/L, and the Criteria Maximum Concentration (CMC) is 34 to 200 pg/L.
Reproduced with permission of the copyright owner. Further reproduction prohibited without permission.

10
1.3 Research ObjectiveThe purpose of this study is to evaluate the adsorption behavior of as-synthesized
organosilicate nanoporous material MCM-41 and HMS in batch and column lead (II) ion
spiked synthetic solutions. Additionally, the study investigates the adsorption
performance of MCM-41 in a 13 cation synthetic and natural stormwater solution via
batch and column adsorption studies. The study also considers the implications of
headloss, optimization, and concept of operations, to evaluate the practical applications of
this evolving technology.
1.4 Research ApproachThe specific approach to this research was to evaluate how an in-situ dual media
declining rate gravity sand filtration system could be optimized using OSNP materials as
media adsorbents to remove dissolved lead (II) ions from a selected ion competitive
aqueous solution. The technical approach used OSNP materials in conjunction with sand
as a combined media, and sand also acting as a pre-filtration mechanism to remove large
particulates. The sequence of accomplishment as executed was as follows:
1. As synthesized OSNP materials were evaluated in screening batch reactions in a
single lead (II) ion contaminant environment to determine the best adsorbent.
2. Using the best three performing OSNP materials from the batch reaction, a
column study was completed to evaluate breakthrough curves and nominal
adsorption capacities
3. Hydraulic studies were completed to evaluate applicability and headloss
4. Stormwaters were collected from a small arms firing range and analyzed for Ca2+,
Cr2+, Cu2+, Fe2+, Mg2+, Mn2+, Mo2+, Na+, Ni2+, Sb3+, Sn2+ and Zn2+ ions using
Reproduced with permission of the copyright owner. Further reproduction prohibited without permission.

11
ICP-MS. The results of collected stormwater data were used to prepare a
synthetic stormwater matrix for the column study.
5. Synthesized OSNP materials MCM-41 and HMS were prepared and.
characterized by X-ray diffraction, transmission electron microscopy (TEM),
scanning electron microscopy (SEM), and Fourier transform infrared
spectroscopy (FTIR).
6. Response Surface Methods were applied to select the optimum operating
parameters (filtration rate, percent OSNP material, and bed depth) and conducted
the experiments using these conditions.
7. Introduced competing ions Ca2+, Cr2+, Cu2+, Fe2+, Mg2+, Mn2+, Mo2+, Na+, Ni2+,
Sb3+, Sn2+ and Zn2+ ions in groups for batch reactions. Evaluated specific ion
competition implications for lead (II) ion adsorption.
8. Developed a concept of design for application of the results. Estimated the
amount of OSNP materials required and life cycle for the declining rate dual
media filtration system.
9. Opportunities and challenges were noted. Areas for further research were
identified.
Reproduced with permission of the copyright owner. Further reproduction prohibited without permission.

12
2. LITERATURE REVIEW
This research requires the review of literature in three areas: 1) the synthesis,
preparation, characterization and application of OSNP materials, with a specific focus on
their use as heavy metal adsorbents, 2) the character of Pb2+ ions in the soil and
stormwater, along with the current knowledge of the function of filtration and adsorption
technologies for control of heavy metals in stormwaters, with a special focus on literature
of shooting range applications, and 3) the theoretical considerations applicable to
adsorption by powders and porous solids. An examination of each of these areas should
identify the literature applicable to the proposed area of study.
2.1 Organosilicate Nanoporous MaterialsSince the discovery in 1992 of the synthesis mechanism for ordered mesoporous
materials researches have systematically studied and engineered nanoporous materials
with a variety of fimctionalizations, patterned nanostructures, and pore diameters (Rao
and Cheetham 2001; Yang and Chao 2002; Zhao et al. 1996). Mixing organic surfactants
and a silica or silica alumina source creates the self-assembled nanoporous MCM-41
material. The surfactant molecules possess the typical hydrophobic hydrocarbon tail with
polar heads, which self-align to form hexagonal honeycombs. This honeycomb structure
then serves as the template upon which an inorganic molecule can bond electrostatically,
covalently, or ionically to form the desired molecular sieve. If desired, the surfactant can
be removed by calcination or by solvents to reveal large open pore structures. The length
of the hydrocarbon chain controls the pore diameter.
Reproduced with permission of the copyright owner. Further reproduction prohibited without permission.

Researchers have also prepared other than honeycomb structures like cubic and
lamellar or stacked sheet forms (Amato 1993). The mixture molar ratios are adjusted to
prepare a supersaturated solution usually in a temperature range of 70 to 150 °C and
reacted for varying reaction times. There are at least five routes to achieve the desired
self-assembly mesostructure as summarized in Table 3. The synthesis research has
generally been motivated to create larger pore diameters, increased wall thickness, easier
assembly pathways, more hydrothermally stable, reactive moieties, ionic charge or to
generate acidity in polymers.
To date, nanoporous materials have been used in sporting goods, tires, strain-
resistant clothing, optics, material strengthening, catalysis, sunscreens, solar cells,
cosmetics, and electronics (Rao and Cheetham 2001). Prospects continue to explode as
researchers explore potential drug delivery mechanisms, diagnostic tools for medicinal
purposes, environmental remediation, toxic metal sensors and aerospace uses (Tao 2003).
It is anticipated nanotechnology will generate $1 trillion per year in services and new
technologies business by 2015 (Roco 2003).
However, the fate and transport of nanosized particles in the environment is
currently not well understood. Many of the nanomaterials developed consist of
nonbiodegradable inorganic chemicals and there is little data to enable meaningful
conclusions on the biodegradation (U.S. EPA 2007). There are studies in progress to
evaluate the processes that control transport and removal of nanoparticles in water and
wastewater (Moore 2006, Wiesner et al. 2006) along with the recently published white
paper by the U.S. EPA (2007). The complexation of nanoporous materials and metals
may have unintended long term consequences which must carefully studied and
Reproduced with permission of the copyright owner. Further reproduction prohibited without permission.

14
understood before they are universally applied. This investigation proposes a field
application of nanoporous materials, which the author suggests has potential for
environmental remediation after appropriate fate and transport answers are developed.
2.2 Synthesis and Material PreparationsA variety of procedures and methods have been developed to prepare mesoporous
structures, where surfactants function as templates for the formation of organic-inorganic
OSNP materials (Yang and Chao 2002). As the surfactant/silica molar ratio (SSMR)
increases, the silica products self-assemble into one of three phases: Phase 1) SSMR <
1.0: hexagonal phase designated HMS (Figure 3) and MCM-41 (Figure 4), Phase 2),
SSMR = 1.0 to 1.5: cubic phase or MCM-48, and Phase 3) SSMR = 1.2 - 2.0: thermally
unstable materials. The pore diameter (2 to 10 nm) of OSNP materials is controlled by
varying the chain length of the alkyl groups from 8 to 22 carbon atoms of surfactants, by
adding solvents to dissolve the hydrophobic chain lengths, or by varying the aging
conditions like time or temperature (Zhao et al. 1996). Figures 3 and 4 demonstrate the
HMS and MCM-41 chemical structure used in this study. The attractive forces between
the surfactant and inorganic molecules are illustrated in the figures.
Thicker material walls have been realized after long crystallization times and the
addition of silicate and surfactant materials from “seed” crystalline materials (Mokaya
1999). The thicker walls theoretically could impart more hydrothermally stable
materials. Pore diameter, wall thickness, and morphological symmetry is controlled by
the choice of surfactant (Berggren et al. 2005). The pore diameter may also be
influenced for MCM-41 by temperature, pH, alkalinity and crystallization time
Reproduced with permission of the copyright owner. Further reproduction prohibited without permission.

Table 3. MCM-41 Synthesis Pathways
Pathwayf Self-Assembly Mechanism Unique Characteristic MorphologicPhase
Reference
i ( s +r) Self-assembled cationic template directs self-assembly o f anionic inorganic molecule
Regular arrays o f uniform channels with controllable pore diameters from 16 to 100 A or more. 40% by wt. o f original surfactant retained after calcination
Hexagonal (Becketal. 1992; Kresge et al. 1992)
I l(S 'f) Anionic template directs self-assembly o f cationic inorganic species
Electrostatic attractive forces interact with solutes
Hexagonal (Huo et al. 1994)
III (S+X 'f) Counterion Cf or Br controls self- assembly o f organic and inorganic species of similar charge
Positively charged molecule Hexagonal and Lamellar
(Huo et al. 1994)
i v (SM +r) Counterion Na+ or K+ controls self- assembly o f organic and inorganic species o f similar charge
Negative charged molecule Hexagonal and Lamellar
No reference found, but mechanism is referred to by Tanev and Pinnavaia (1995)
V (S°I°) Hydrogen bonding and self-assembly of organic and inorganic species
Neutral molecule with larger wall thickness, small scattering domain size, and complementary meso-porosities to pathways I and ID.
Hexagonal (Tanev and Pinnavaia 1995)
f S+ = surfactant organic ions; T = anionic inorganic ions (Note: silica is not an anionic molecule, but acquires a negative charge in the synthesis process); X' = anionic halides; M+ = cationic alkaline ions

16
(Zhao et al. 1996).
The original MCM-41 mesoporous molecular sieve, for example, was synthesized
in an alkaline condition (Kresge et al. 1992). OSNP materials in this study were
synthesized through self-assembly of an inorganic silica precursor (tetraethyl-
orthosilicate) and an organic template of either an ionic (cetyltrimethylammonium) or
neutral (dodecylamine) surfactant, and used as synthesized.
Fig. 3. Chemical Structure of HMSHMS synthesis is a neutral (S°I°) template route that yields a hexagonal mesoporous molecular sieve with physical and catalytic properties substantially different from MCM- 41. Hydrogen bonding is the attractive force as depicted by dotted lines.
Reproduced with permission of the copyright owner. Further reproduction prohibited without permission.

Fig. 4. Chemical Structure of MCM-41MCM-41 is prepared by an electrostatic assembly pathway. The direct S+I' charge matching between cationic quaternary ammonium ion surfactants (S+) and the anionic silicate precursors (T) causes a self-assemblage of long-range hexagonal structures under hydrothermal synthesis conditions at 100 °C. The long range order is greatly reduced when the synthesis is conducted at ambient temperature. Bonding is an electrostatically attractive force between electronegative oxygen and electropositive nitrogen alkyl head group as shown. The electrostatic negative charge may also be the primary attractive force for Pb2+ cations in solution.
There are three recognized methods for functionalization of the mesophase
structure (Figure 5). The first is by grafting and attaching functional molecules to the
surface of the mesoporous silica. For example, grafting to the mesoporous silica internal
channels with alkylamines, alkylthiols, alkenes, alkyl halides and epoxides create reactive
permission of the copyright owner. Further reproduction prohibited without permission.

18
moieties within the structure. The second method for surface functionalization
Si(OCH3>4
HydrolysisCondensation
Calcination
or
Si-OH I
St - OH
Si:o
s KSi - OH
ISi- OH
I
Si-R I
Si(OCH3>4 Co-coadcnsation Si-OH + 1
R-S^OCH3}3surfactantextraction I
Si-R
Si-OH
GraftingR-SKOCH3>4
-> Si
Coatinghydration
l-S i(O C H 3>4
-S i-O -S i-R
y oS i ^
ISi—O—Si—R
SS-o5 L-RI -&
S i - o i i - R . i -or-
S_0-Si-R I -OC
St—O—Si—R
Si—G—Si—Ri .-or
lypfeaiRnidbifes:( C H ^ aCfiPs<CH2)3N %CCH2):3SH
Fig. 5. Surface Functionalization of Mesoporous MaterialsIllustration of three functionalization methods: grafting, coating and co-condensation, (modified after Yang and Chao, 2002)
of mesoporous materials is by coating reactions. A “coating” of ligand complexes is
achieved by employing enough water to form a monolayer on the pore surface (Zhao et
al. 2003). The third functionalization method is co-condensation. Co-condensation of
tetraalkoxysilane and organoalkoxysilanes with Si-C bonds has been used to produce
inorganic-organic hybrid moieties.
Reproduced with permission of the copyright owner. Further reproduction prohibited without permission.

19
The surfactant-template synthesis yields van der Waals bonded structures that
may leach surfactants in flow-through adsorption designs (Pinnavaia 2006). Whereas
creation of covalently bonded mesoporous materials inorganic-organic networks in the
pore walls should yield more stability because of stronger bonds. For this study, the
latter synthesis method, if achievable, may be more desirable.
2.3 Characterization of Mesoporous MaterialsResearchers have characterized mesoporous materials by X-ray powder
diffraction (XRD), transmission electron microscopy (TEM), scanning electron
microscopy (SEM), nitrogen adsorption-desorption usually following the Brunauer-
Emmett-Teller (BET) characterization, Fourier Transform Infrared Spectroscopy (FTIR)
reflectance spectra and others. The relationship between the surfactant hydrocarbon
chain length the pore diameter has been developed. Pore volumes and the surface area
have also been found to increase with the surfactant template concentration. Typical
BET surface areas, pore volumes and pore diameters for selected surfactants and
functionalization are provided in Table 4.
2.4 Nanoporous Material ApplicationsThe explosive growth of the new technology may best be illustrated by the
published literature on OSNP materials. By observing the publications in Science Direct,
a respected scientific database operated by the Elsevier Limited Publishing Company,
one can find in 1993, one year after the publication of the MCM-41 synthesis in Science,
three articles published on synthesis and applications of MCM-41. Five years later in
1999 there were 78, and in 2005, 243 articles, and in 2006, 271 articles were published
Reproduced with permission of the copyright owner. Further reproduction prohibited without permission.

20
Table 4. Representative Functionalized Mesoporous Sieves
Functionalization SurfactantTemplate
BETSurface
Area(m2/g)
PoreVolume(cm3/g)
PoreDiameter
(nm)Reference
Organosilicate Nanocomposite: HMS3-aminopropyl—, 2-cyanoethyl—
3 -chloroprophyl—
3 -mercaptopropyl—
3 -mercaptopropyl"
vinyl—
n-dodecyl- 1358 2.9ammen-dodecyl- 597 3.9ammen-dodecyl- 858 - 0.27- 2.2-4.1amine 1225 0.47n-dodecyl- 640- 0.27- 1.5-2.7amine 722 0.55n-dodecyl- 1520 30amine
(Macquarrie 1996)
(Macquarrie 1996)
(Richer 1998)
(Mercier and Pinnavaia 1998)
(Burkett et al. 1996)
Organosilicate Nanocomposite: MCM-413-aminopropyl— CTABr
in1oTt- (Fowler et al. 1997)
3-aminopropyl— CTABr 87-428
0.16-0.76 3.4-7.3 (Walcarius et al.
2003)
phenyl- CTABr 1060-1386 18-24 (Burkett et al.
1996)CH3HN(CH2)3..,(CH3)2N(CH2)3„,
H2N(CH2)2NH(CH2)3„CTABr 1110-
11900.96-1.06 4 .3 -4 .6 (VanDerVoort et al.
1998)
tetramethyl— CTABr 880 0.87 3 .3-3 .9 (Mokaya 1999)3 -mercaptopropyl— CTABr 792 0.47 1.4 (Lim et al. 1998)
3 -mecaptopropyl— CTABr 1061 0.44 2.0 (Mercier and Pinnavaia 1998)
3 -mercaptopropyl-- CTABr 162 - 818
0.19-1.24 3.4-7.3 (Walcarius et al.
2003)
Activated Carbon Comparison
FeO NotApplicable 625 1.04 5.8 (Reed et al. 2000)
CTABr = CH3(CH2 )i5N(CH3)3Br
Reproduced with permission of the copyright owner. Further reproduction prohibited without permission.

21
with MCM-41 in the keywords, abstract or title of peered reviewed journals. The process
of discovery continues and has led to the concept of self-assembled microstructure, which
can serve as structure-directing agents with controllable pore sizes with many
applications in a variety of disciplines (Zhao et al. 1996). The remarkable nature of the
MCM-41 structure is the construction of surface areas in excess of 1100 m /g with, in
some cases, pore walls no more than two oxygen atoms thick (Rouquerol et al. 1999).
Hence, there are potentially significant opportunities for the chemical modification of
OSNP materials with organic and organometallic ligands that are selective to specific
metal ions (Olkhovyk et al. 2005). For example, mercury selectivity over copper,
cadmium, lead and zinc for thioether functionalized MCM-41 has been demonstrated. In
2d"fact, Hg adsorption capacities increased directly in proportion to the concentration of
the thioether content in the MCM-41 material (Zhang et al. 2003). Similarly, selective
adsorption of gold over copper and nickel has been observed using organic amine grafted
groups to MCM-41 (Lam et al. 2006). This phenomenon may be the result of the stereo-
coordination chemistry between MCM-41 with Hg2+, N and Au2+, and the larger effective
charge of Cu and Ni (Zhang et al. 2003).
Table 5 presents a synopsis of adsorption performance for MCM-41 mesoporous
silica for various adsorbates. Adsorption capacities of OSNP materials show great
promise, particularly for lead (II) ion adsorption to be evaluated in this study. As a
general comparison, Swiatkowski et al. (2004) has reported the activated carbon
adsorption capacity of lead (II) ions at 0.53 mmol/g from an equilibrium pH = 5.54, 8290
mg/L lead nitrate solution, and Khraisheh et al. (2004) reported a 0.05 mmol/g lead (II)
adsorption by diatomite at an equilibrium pH = 4.0, and 1 mg/L lead nitrate solution.
Reproduced with permission of the copyright owner. Further reproduction prohibited without permission.

Reproduced with
permission
of the copyright owner.
Further reproduction prohibited
without permission.
Table 5. MCM-41 Adsorption of Various Adsorbates in Batch Reactions
Adsorbate
MaximnmAdsorption
Capacity(mmol/g)
BETSurface
Area(m2/g)
PoreDiameter
(nm)MCM-41 synthesis molar ratios Reference
Au3+ 1.4 772-1070
2.79-3.09
0.00658 TEOS:l CTAB:0.292 NH4- OH: 2.773 H20 (Lam et al. 2006)
Benzene 0.18 1160 NA 1 SiO2:0.64 Na20: 0.49 C l2H25(CH3)3NBr: 52 H20
(Choudhary and Mantri 2000)
Benzene 4.8 1060 3.2 NA (Zhao et al. 1998)
Ca2+
Cd2+
Co2+
0.007
0.03
0.16-0.94
1325
1325
89-1025
3.6
3.6
3.5-11.0
1 TEOS: 0.020 Ti(OC4H9)4: 0.36 TMAOH: 110 H20: 0.24 (CTMA)Br 1 TEOS: 0.020Ti(OC4H9)4: 0.36 TMAOH: 110 H20: 0.24 (CTMA)Br
1 Si02: 0.28 TMAOH: 0.17 CTAB: 0.17 NH3: 16.7 H20
(Xu et al. 1999)
(Xu et al. 1999)
(Sayari et al. 2005)
Co2+ 0.69 580 2.29 1 Si02: 6.0 CTMAC1: 3 TMAOH: 60 HzO(Yoshitake et al.
2003)
Cu2+ 0.06-1.67 89-1025 3.5-11.0 1 Si02: 0.28 TMAOH: 0.17 CTAB: 0.17 NH3: 16.7 H20
(Sayari et al. 2005)
Cu2+
Cu2+
0.04
0.36
1325
588
3.6
2.32
1 TEOS: 0.020 Ti(OC4H9)4: 0.36 TMAOH: 110 H20: 0.24 (CTMA)Br
1 Si02: 6.0 CTMAC1: 3 TMAOH: 60 H20
(Xu et al. 1999)
(Yoshitake et al. 2003)
Fe3+ 1.6 310 2.24 1 Si02: 6.0 CTMAC1: 3 TMAOH: 60 H20(Yoshitake et al.
2003)

Reproduced with
permission
of the copyright owner.
Further reproduction prohibited
without permission.
Table 5 continued
Adsorbate
MaximumAdsorptionCapacity(mmol/g)
BETSurfaceArea
(m2/g)
PoreDiameter
(ran)
Hg2+ 1.4 854-1264 2.7
Hg2+ 5.0 380-1040 3.0-4.8
Hg2+ 3.13-13.5 242-654 3.13-5.02
Hg2+ 0.02 1325 3.6
Hg2+ 0.07 56 2.9
Mg2+ 0.02 1325 3.6
Na+ 0.05 1325 3.6
Ni2+ 0.05 - 0.93 89-1025 3.5-11.0
Ni2+ 0.52 284 2.20
Pb2+ 0.02 1325 3.6
Pb2+ 0.05 NA 3.5Pb2+ 0.19 NA 3.5
MCM-41 synthesis molar ratios Reference
1 TEOS: 1 HC1: 0.2 octylamine: 1 TMB: 150 H20
1 Si02: 0.28 TMAOH: 0.17 CTAB:0.17 NH3: 16.7 H20
x TEOS: (0.041 - x)BTESPTS: 0.24 HC1: 8.33 H20 , where x = 0.041, 0.0402, 0.0385, 0.0376, 0.0368, 0.0354, and 0.0347 1 TEOS: 0.020 Ti(OC4H9)4: 0.36 TMAOH: 110 H20 : 0.24 (CTMA)Br
2.8 S i02: 1.0 C12TMABrf
1 TEOS: 0.020 Ti(OC4H9)4: 0.36 TMAOH: 110 H20 : 0.24 (CTMA)Br 1 TEOS: 0.020 Ti(OC4H9)4: 0.36 TMAOH: 110 H20: 0.24 (CTMA)Br1 Si02: 0.28 TMAOH: 0.17 CTAB: 0.17 NH3: 16.7 H20
1 S i02: 6.0 CTMAC1: 3 TMAOH: 60 HzO
1 TEOS: 0.020 Ti(OC4H9)4: 0.36 TMAOH: 110 H20: 0.24 (CTMA)Br 0.0303 TEOS: 0.0036 CTABr: 0.0152 NaOH: 3.939 H200.0303 TEOS: 0.0036 CTABr: 0.0152
(Mercier and Pinnavaia 1998)(Antochshuk et
al. 2003)
(Zhang et al. 2003
(Xu et al. 1999)
(Olkhovyk and Jaroniec 2005)(Xu et al. 1999)
(Xu et al. 1999)
(Sayari et al. 2005)
(Yoshitake et al. 2003)
(Xu et al. 1999)
(Wright, 2006)
(Wright, 2006)

Reproduced with
permission
of the copyright owner.
Further reproduction prohibited
without permission.
Table 5 continued
Adsorbate
MaximumAdsorptionCapacity(mmol/g)
BETSurfaceArea
(m2/g)
PoreDiameter
(nm)MCM-41 synthesis molar ratios Reference
NaOH: 3.939 H20
Zn2+
Cd2+, Cu2+, Pb2+ and
Zn2+
0.03
Not adsorbed in presence of
Hg
1325
242-654
3.6
3.13-5.02
1 TEOS: 0.020 Ti(OC4H9)4: 0.36 TMAOH: 110 H20: 0.24 (CTMA)Br
x TEOS: (0.041 - x)BTESPTS: 0.24 HC1: 8.33 H20, where x = 0.041, 0.0402, 0.0385, 0.0376, 0.0368, 0.0354, and 0.0347
(Xu et al. 1999)
(Zhang et al. 2003)
Cu2+ and Ni2+
Not adsorbed in presence of
Au772-1070 2.79-3.09 0.00658 TEOS:0.001 CTAB:0.292 NH4-
OH: 2.773 H20(Lam et al. 2006)
TEOS = tetraethylorthosilicate; TMB = 1,3,5 trimethylbenzene; TMAOH = tetramethylammonium hydroxide; CTAB = cetyltrimethylammonium bromide; (CTMA)Br = alkyltrimethylammonium bromide = CnH2n+iN-(CH3 )3Br = CnTMABr; where n = # carbon atoms
BTESPTS = (1,4)-bis(triethoxysilyl)propane tetrasulfide or (CH2CH20)3Si(CH2)3-S-S-S-S(CH2)3Si(OCH2CH3)3
CTMAC1 = cetyltrimethylammonium chloride; NA = Not Available
to

25
As shown, the hydrophobic and hydrophilic character uniquely functionalized
MCM-41, presents a tantalizing possibility of options to include the removal of organics,
and metals, replacement of hazardous catalysts and potentially separation of gases
(Raimondo et al. 1997). Other applications for these OSNP materials include the use as
optics (for example, laser-dye doped meso-materials can generate increased emissions or
operate as optical wave guides), low dielectric insulators, micro-electronic applications,
and other emerging technological applications. The possibility of heavy metal adsorbents
is certainly demonstrated and needs further illumination to understand application
parameters, controls, and conditions to optimize the performance of these novel
materials.
The beneficial properties and application of OSNP materials are dependent upon
their structural and chemical composition. The complexion of both of these also affects
the thermodynamic properties and with careful selection can "tune" the reactivity of the
molecule. Accessibility to the organic groups forms the underlying key to successful
complexion of the molecule and which steric formulation can contribute to successful
adsorption and kinetics. Although kinetic benefits are important most researchers would
consider the overall speed of OSNP adsorption reactions to be fast. There have been
some reported improvements to reaction rates when the co-condensation pathway was
used (Bibby and Mercier, 2002). As reviewed above, applications of interest include
high catalytic activity and selectivity, adsorption of heavy metals, removal of organic
compounds, and enhanced activity of sensors (Walcarius et al., 2003).
Reproduced with permission of the copyright owner. Further reproduction prohibited without permission.

26
2.5 Lead in Soils at Outdoor Shooting RangesThe presence of lead in soils at outdoor shooting ranges is well established in the
literature (Astrup et al. 1999; Basunia and Landsberger 2001; Bruell et al. 1999; Chen et
al. 2002; Darling and Thomas 2003; Dermatas et al. 2003; Isaacs 2006; John 2002; Lin et
al. 1995; Stansley et al. 1992; U.S.EPA 2001). Shooting range soils have elevated
concentrations of lead as high as 10 to 100 times background levels (Murray et al. 1997).
Lead in the soils of twelve military shooting range soils in the United States were found
in concentrations from 10 to 30,610 mg/kg (Isaacs, 2005; Isaacs, 2007). See Appendix B
for Isaacs (2007) paper.
Lead was selected as the metal of interest for this study because of the prevalence
of lead (II) ions in all shooting range stormwaters evaluated, the addition of total lead to
the stormwater permit at one shooting range, and because of its toxicity to aquatic
organisms. The presence of lead in these soils is obvious, but there are also elevated
particulate and dissolved lead(II) ions in stormwaters from shooting ranges (Bruell et al.
1999; Craig et al. 1999; Isaacs 2006). The quantification of lead in soils from a variety of
studies is summarized in Table 6, which highlights the variable nature and range of metal
types and concentrations that can be found in shooting range soils. The concentration
series (high to low) for selected heavy metals is Pb > Cu > Zn > Sb.
Reproduced with permission of the copyright owner. Further reproduction prohibited without permission.

Reproduced with
permission
of the copyright owner.
Further reproduction prohibited
without permission.
Table 6. Heavy Metals in Outdoor Shooting Range SoilsValues shown are the minimum and maximum values reported in mg/kg Sample locations varied by researcher, however all took samples of impact berms, and many included samples from various locations within the range infield and outfield. Note: AFB = Air Force Base; ND = Non-detect at detection limit = 0.05 mg/kg; blank = data not available.
Location Cu Pb Sb Zn ReferenceAmarillo, TX 13-359 11 -4675 1-517 9-136 (Basunia and Landsberger, 2001)Various, FL 7.3 - 48400 (Cao et al., 2003)Various, FL 50-1142 (Hardison et al., 2004)South Korea 117-192 71-184 164 -347 (Lee et al., 2002)Switzerland, multiple 100-4450 1900-515800 35 - 17500 (Johnson et al., 2005)Oberuzwil, Switzerland 20 -2250 110-67860 5 - 3020 55 -1025 (Vantelon et al., 2005)Barksdale AFB, LA 37 - 369 436 - 4433 <0.05-3.27 6.8 - 79 (Isaacs, 2007), see Appendix BBeale AFB, CA 15.9-954 10-30610 <0.05 - 5.3 53 -273 44
Cannon AFB, NM 7.1-9.3 37-102 ND 2.9-20.3 44
Ellsworth AFB, SD 56.5-148.1 1637-7621 ND 3.2-93.0 44
Holloman AFB, NM 1.8-68.8 10.1 -2984 <0.05-0.20 6.6-17.4 u
Langley AFB, VA 13.9-40.8 545 - 6320 <0.05 - 7.1 4.0-137.3 c«
Nellis AFB, NV 32.8 - 48 1137-9682 ND 51.8-57.5 44
Offutt AFB, NE 27.9 -106.7 1246 - 2134 <0.05 -10.08 9.1-18.7 44
Shaw AFB, SC 24.0 - 87.6 70.6 - 4355 6.03-54.1 44
Whiteman AFB, MO 5.03-38.5 384.5 - 764.7 ND 37.7-30.7
to~o

28
2.6 Complexes o f Lead in SoilsLead in the environment is mostly complexed with organic ligands in natural soils
as PbOH+ and PbHC0 3 + (Sposito, 1989). Weathering of elemental lead forms from
shooting ranges have also been documented as visible corrosion on lead fragments as
crusts of white, gray or brown material, and as hydrocerussite (Pb(C0 3 )2 (0 H)2), cerussite
(PbCC>3)and some amounts of anglesite (PbS0 4 ) (Cao et al. 2003; Lin et al. 1995). The
bullet abraded residue transforms into hydrocerussite and to a lesser degree cerussite, and
massicot (PbO) in as little as one week to 300 years (Cao et al. 2003; Chen et al. 2002;
Hardison et al. 2004; Jorgensen and Willems 1987; Vantelon et al. 2005). The lead of
weathered bullets exists as particulate or ionic forms and may provide a steady source of
potentially labile constituents, which can appear in various soil fractions and in
stormwaters. A suggested weathering process was formulated by Ma et al., (2002) and is
depicted in Eq. (la - Id).
2 Pb(s) + O2o 2 PbO(s) (la)
C02 + H20 o H+ + HC03' (lb)
PbO(s) + HC03' PbC03(s) + OH' (1 c)
3 PbO(s) + 2 HC03' + H20 O Pb3(C03)2(0H)2 (s) + 2 OH' (Id)
The oxidized lead apparently forms readily when exposed to air and then with carbon
dioxide and water exposure forms lead carbonate. The rate of elemental lead dissolution
is regulated by both physical and chemical factors. Ma et al., (2002) found for each
standard pH reduction, the concentration of lead (II) ions increased about two orders of
Reproduced with permission of the copyright owner. Further reproduction prohibited without permission.

29
magnitude. This is consistent with Eqs. lc and Id, which suggest as weathering
progresses hydroxyl groups, are formed naturally, raising the soil pH.
Lead is generally non-labile in soil (deMatos et al. 2001). Both aerobic and
acidic conditions in soils increase elemental lead dissolution, whereas anaerobic and
alkaline conditions decrease it (Scheuhammer and Norris 1995). Lead mobility in soil is
driven by redox potential, available anions (e.g. carbonates, phosphates, and sulfates),
pH, soil organic matter, and cation exchange capacity (McLean and Bledsoe 1992). Soil
organic carbon content has been found to enhance lead adsorption, but dissolved organic
carbon improves lead dissolution with decreased soil pH (Sauve et al. 1998; Strawn and
Sparks 2000). Soil colloids have been found to be active participants in transporting lead
to groundwater and limiting lead interaction with reactive soil constituents (Citeau et al.
2003). Surface (Abdel-Fattah et al. 2003; Craig et al. 1999) and sub-surface soils
(Murray et al. 1997) lead migration has been reported.
For the pH and Eh range of soils found at outdoor ranges lead complexes in the
soil and aqueous solutions would be typically found as carbonates and sulfates (Figure 6).
Figure 6 depicts the stability of various lead species by Eh-pH relationships for a lead,
water and soil system. Metallic lead (Pb°) is only stable in a very low redox potential
environment. Redox potentials for soil water conditions are typically at high levels
(McBride et al. 1997). Therefore, it is likely lead will weather (i.e. oxidize) as previously
outlined in Equation 1. Lead carbonate would be the expected stable compound between
about pH 6 and 8.
Reproduced with permission of the copyright owner. Further reproduction prohibited without permission.

30
1.2Pb‘
0.8
0.4Eh (v)
P b f i
PbS PbO1 bar
Pb- 0.8
12 140 2 4 6 8 10pH
Fig. 6. Eh - pH Stability Diagram for Pb CompoundsEh-pH stability diagram for activities of dissolved Pb = 10' 6 M, S = 10"3 M and CO32' = 10' 3 M. Shaded area added to illustrate shooting range Eh and pH intersection area. PbCC>3 would be the dominant precipitate in the expected pH and Eh range for shooting range stormwaters. Lead(II) ions of interest in this study will be associated as dissolved and particulate attached species. Redrawn after Bradl (2004).
The leachability of metals from soils has been associated with the natural organic
matter content. In Table 7 lead leachability was observed in soils from eastern and
western location outdoor shooting ranges following a synthetic precipitation leaching
procedure protocol. Soils with high pH, and high clay or organic matter content tended
to not leach lead cations. However, when lead did leach from soils it was predominantly
in particulate form bound to suspended colloids (Isaacs, 2007).
Relevant solubility products for lead minerals and complexes are shown in Table
8 . These solubility constants substantiate the general observation that lead compounds in
soils are non-labile and transport primarily with soil particulates.
Reproduced with permission of the copyright owner. Further reproduction prohibited without permission.

31
Table 7. Shooting Range Soil and SPLP Lead and Copper Characteristics Shooting range soil lead and copper concentrations and associated Pb leachate from the synthetic precipitation leaching procedure (SPLP). A more complete review of leaching behavior of lead and copper in soils from outdoor shooting ranges is provided in Appendix B.
Shooting Range Soil
LOCATION1" CEC(cmoVkg) pH
Total Pb (mg/kg)
SPLP Pb (gg/L)
Total Cu (mg/kg) Ref
East 8 .5 -4 3 .2 5 .5 - 6 .7 7 3 6 -2 7 2 0 NA NA AEast 4 .4 -1 7 .7 7.7 - 8.1 26 - 3400 837 7 - 0500 BEast 4 .8 2 -4 0 .6 5 .1 - 7 .5 7 - 4 8 4 0 0 NA NA CWest NA NA 1 1 -4 6 7 5 NA 1 3 -0 3 5 9 DWest 5 .6 -3 1 .5 6 .8 - 8 .7 10 -130000 2 - 2233 3 - 52000 B
t East and West division was arbitrarily set at the Mississippi River NA = Not Available; SPLP = Synthetic Precipitation Leaching Procedure. Ref - Reference key:A - (Cao et al. 2003)B - (Isaacs, 2007)C - (Ma et al. 2002)D - (Basunia and Landsberger 2001)
Table 8. Solubility Products for Selected Lead Minerals and Compounds
Mineral or Compound Equilibrium Reaction at 25 °C Log KsotHydroxypryromorphite Pb5(P 04)3(0H)(s) + 7H+ 5Pb2+ + 3H2P 0 4' + H20 -4.14Lead hydroxide Pb(OH)2(s) <-> Pb2+ + 2 OH' -7.71Anglesite PbS04(s) o Pb2+ + S 0 42' -7.79Cerrusite PbC03(s) + 2H+o Pb2++ C 0 2(g) + H20 -13.13Massicot PbO(s) + 2H+ Pb2+ + H20 -15.09Chloropyromorphite Pb5(P 04)3Cl(s) + 6H+ o 5Pb2+ + 3H2P 0 4‘ + Cl' - 25.05Galena PbS(s) Pb2+ + 2S' -28.05Lead phosphate Pb3(P 04)2(s) 3Pb2+ + 2 P 0 43' -44.50Hydrocerussite Pb3(C 03)2(0H )2(s) + 6H+ ■<-> 3Pb2+ + 2C 02(g) + 4H20 -45.46Solubility constants are from Benjamin (2002).
2.7 Heavy Metal Removal Technologies OverviewTechnologies traditionally employed to remove heavy metals from aqueous
solutions include chemical precipitation, adsorption (usually carbon adsorption), ion
Reproduced with permission of the copyright owner. Further reproduction prohibited without permission.

32
exchange, and filtration (depth, surface and membrane) processes (Tchobanoglous et al.
2003). The following briefly summarize each of these processes and concludes with a
comparative analysis of lead removal performance for each from the literature. Table 9
summarizes the performance characteristics of the traditional removal techniques and
highlights their advantages and disadvantages.
Chemical precipitation to form metal hydroxides or sulfides is the most common
metals removal method from wastewaters (Tchobanoglous et al. 2003). An example of
the stoichiometry for the removal of lead is typical of the chemistry for this process.
Pb(OH)2 Pb2+ + 2 OH' (2a)
PbS Pb2+ + S2' (2b)
Chemical precipitation is frequently used with or as part of other water treatment
processes. For example, chemical coagulation enables the removal of suspended
materials from water via precipitation. Softening of water is also a precipitation process
when lime or caustic soda is added to precipitate calcium and magnesium.
Adsorption is a physical and chemical process where an adsorbate accumulates at
the interphase of a surface or interface. The physical process mechanism is
predominantly van der Waals’ forces and is a reversible phenomenon. Chemical
adsorption is the result of a chemical reaction between the solid and the adsorbate and it
is typically not reversible. Adsorption is a proven process for the removal of organics
and metals to include water color, odors, taste and residual chlorine. Activated carbon is
the most commonly used adsorbent in wastewater treatment technologies. Also, sand has
Reproduced with permission of the copyright owner. Further reproduction prohibited without permission.

33
been used effectively as a metal adsorbents (Muhammad et al. 1998) and its metal
adsorption behavior enhanced when sand was coated with an iron oxide (Muhammad et
al. 1998; Sansalone 1999). Other adsorbents have been developed using zeolites, clays,
organic matter, and certain inorganic media. The difficulty with all these is the low
loading capacities and binding energies (Mercier and Pinnavaia 1998).
Ion exchange is a reversible process where ions of a solid and a liquid are
exchanged. Ion exchange may be defined as an adsorption process as the exchange of
ions occurs at the surface of the solid and ions are being transferred through an interphase
from the liquid to the surface of the solid. Exchange materials can be comprised of
resins, membranes, zeolites, and clays. Ion exchange effectiveness can be influenced by
presence of more selective anions inhibiting the removal of certain ions. Zeolites have
been used to remove >91% heavy metals in wastewater where the ordered preference
was Pb > Cu > Zn ~ Cd (Pitcher et al. 2004).
Filtration is a process of removing particulate matter from water (Droste 1997).
Various forms of filtration have been employed for many years using filter medias that
have consisted of cloths, sand, charcoal, gravel and others, The basic purpose of these
filtering methods have been to remove waterborne particulates, particularly in water
treatment processes (Crittenden et al. 2005). Nine principal mechanisms have been
identified for removing material within a granular filter. They include: 1) straining, 2)
sedimentation, 3) impaction, 4) interception, 5) adhesion, 6) flocculation, 7) chemical
adsorption, 8) physical adsorption, and 9) biological growth (Tchobanoglous et al. 2003).
Filtration, especially the mechanisms of chemical and physical adsorption, is of particular
interest in this study to remove inorganics (i.e. particulate bound heavy metals like lead
(II) ions).
Reproduced with permission of the copyright owner. Further reproduction prohibited without permission.

34
Filtration of wastewaters may be classified as depth, surface or membrane Depth
filtration pertains to the removal of suspended matter at the surface or within the filter
medium. Surface filtration is a mechanism where waterborne particulates are removed
by straining through a surface media (e.g., a filter cloth) (Tchobanoglous et al. 2003).
Membrane technology, basically a surface filtration process, extends beyond basic
surface treatment to separate dissolved solids and colloids from solution. A brief
summary of depth, surface and membrane application is presented in the following
paragraphs.
Depth filtration may be further sub-divided into slow and rapid media systems.
Typically the media of choice is sand because of is ready availability and low cost. The
grain size of the media is carefully selected for each application as grain size directly
impacts headloss and particulate removal efficiency. Researchers have sought methods
to enhance or augment the sorption behavior of sand for inorganics (i.e. relative to this
study, lead (II) ions) in sand filtration.
Sand has long been used as an effective media to remove particulate-bound
contaminants (Yao et al. 1971). While particulate-bound inorganics maybe effectively
removed, dissolved species may readily pass through a sand-only filter. To enhance the
sorption capability Sansalone (1999) coated sand with an iron oxide to increase its
surface area and amphoteric surface charge. In column studies Sansalone (1999) reported
lead (II) ion removal at Ce/Co = 0.9 for iron oxide coated sand (OCS) = 506 pore
volumes (PV) compared to un-coated sand = 20 PV (PV = 2.79 L; influent lead
concentration = 5 mg/L; pH = 6.5). Important to note for the OCS, 340 PVs were
dissolved lead (II) ions versus 166 PVs particulate bound. Although not mentioned, it
was assumed the 20 PV removed by sand was predominantly particulate-bound.
Reproduced with permission of the copyright owner. Further reproduction prohibited without permission.

35
Other media have also been used with sand filtration to enhance particulate and
sorption performance. Some of these media include anthracite, garnet, ilmenite (FeTi0 3 ,
typically found in beach sand), activated carbon and others (Tchobanoglous et al. 2003).
The selection of the appropriate media is site specific and most often determined by the
specific objectives of each application. The flow rate of water through the filter is also a
critical factor in media selection. Slow sand filters typically operate at 1 to 8 m /m d
versus rapid sand filters that may operate 100 to 475 m3/m2 d (Droste, 1997). Therefore,
slow sand filtration would most likely be the preferred filtration strategy to meet the
requirements for a stormwater filter system at a shooting range (i.e. contact time,
operation by gravity flow, and semi-continuous to intermittent operations).
Surface filtration includes those sorption processes that use diatomaceous earth
and cloth/screen filtration. Surface filtration is the method most often encountered for
removal of suspended particles used in swimming pools. Surface filters may consist of a
matrix of constructed glass or polymeric microfibers, or may use diatomaceous earth (a
porous medium) to trap particulates. Surface filtration can have sorption properties
similar to depth and membrane filtration. They have been used to remove suspended
materials from secondary effluents and from ponds used to receive waters for
sedimentary control. Surface filters can remove contaminants that are predominantly
particulate bound and be used to enhance or augment other sorption methods.
For membrane technology, water is forced through a membrane, usually by an
external force, where particulates larger than the membrane pore openings are trapped.
The membrane technologies are characterized by pore sizes and includes microfiltration
(> 50 nm), ultrafiltration (2-50 nm), nanofiltration (< 2nm), reverse osmosis (< 2 nm),
dialysis (2-50 nm), and electrodialysis (< 2 nm) (Tchobanoglous et al. 2003).
Reproduced with permission of the copyright owner. Further reproduction prohibited without permission.

Membranes are used for desalination and have been used for filtration, the removal of
microorganisms, and nanofiltration for the recovery of precious metals. Electrodialysis is
a specialized membrane process where an electric current is passed through a solution
causing the migrations of cations to the cathode and anions to the anode. Alternate
spacing of cation and anion permeable membranes causes concentration of dilute salts to
form between membrane layers, effectively demineralizing the wastewater.
The selection of a heavy metal removal technology depends on many factors,
which collective and simultaneously must be satisfied for each unique situation. For this
study, a treatment technology was needed where the dominant factors were contact time,
particulate and dissolved lead (II) ion removal effectiveness, low maintenance, low
capital cost, and minimal operator skills. A gravity declining rate depth slow sand
filtration system was selected based on these criteria and because OSNP materials could
be easily added as co-adsorbent media. Other technologies failed in one or more of the
selection criteria factors.
Reproduced with permission of the copyright owner. Further reproduction prohibited without permission.

Reproduced with
permission
of the copyright owner.
Further reproduction prohibited
without permission.
Table 9. Traditional Heavy Metal Removal TechnologiesWastewater technologies applicable to heavy metal removal (Crittenden et al. 2005; Tchobanoglous et al. 2003).Technology Mechanism Application Principles Advantages DisadvantagesChemicalPrecipitation
Chemical reaction of soluble metal compound with precipitating reagent
Alum; Aluminum chloride; Calcium hydroxide; Ferric chloride; Ferric sulfate
Fast reacting; strong chemical bonds; Creates precipitates which enhances sedimentation
Precipitation chemicals dependent on influent quality; sludge disposal; not reversible
Adsorption Mass transfer; diffusion; physical and chemical adsorption; Electrostatic
Zeolites; synthetic polymers; activated carbon, granular and powdered; Surface area and pore size important factors
Physical adsorption reversible Chemical adsorption typically not reversible; OSNP materials not been used in wastewater application; pH and ionic strength dependent
Ion Exchange Ionic bonding Zeolites; anion resins; cation resins; chelating resins, microbes; plant biomass
High selectivity for the target metal; Efficiency is high
Fluctuating metal conc. hard to design for; pH dependent; Particulates/solvents affect performance; regen. costs
Depth Filtration (slow sand and rapid)
Straining; interception; diffusion; inertial forces; gravitational forces; attachment
Typically sand or anthracite is used; Can be single, dual or multi-media;
Naturally occurring granular minerals effective adsorbent media; microbial development remove organics and minimize head loss build up; Effective TSS removal; Particle removal independent o f filtration rate
Efficiency highly dependent upon media effective size, density, shape, hardness, bed porosity, and bed specific surface area; Head loss increases with use; Dissolved species may pass through filter
Surface Mechanical sieving Woven metal fabrics; cloth Ease of use/backwash; Disposal o f residual solids;Filtration and synthetic materials Effective TSS removal; Can
operate intermittentlyNot effective for dissolved constituents
MembraneFiltration
Sieving; Diffusion Nanofiltration and Reverse Osmosis
Applicable to high dissolved solid constituents and saltwater; No chemicals required
Expensive; Energy Demand; Scale formation; Declining flux rate with use; Difficult to monitor; Filter membrane must be replaced; Brine disposal; propensity to foul
38
2.8 Mass Transfer Adsorption Theory
Adsorption is the process where a solute is accumulated at the surface liquid
interface. Specifically as related to this work, it is the free or dissolved metal ion,
adsorbate, in the liquid phase that is adsorbed to the solid phase, adsorbent. The transfer
of adsorbate mass to the adsorbent surface constitutes the principle known as adsorption.
It could be described in three phases: macrotransport (mass transport by advection and
diffusion), microtransport (mass transport by diffusion), and sorption (attachment to the
adsorbent). The adsorption mechanism represents an equilibrium relationship between
dissolved and adsorbed solutes. The solid-water surface chemistry is important to the
application of adsorption processes in natural waters.
Stumm (1992) explains solids can be generalized as inorganic or organic
polymers with surfaces bearing functional moieties such as solute ligands -OH, -SH, -SS,
and -COOH. These functional moieties may form coordination bonds in one of three
possible mechanisms, 1) outer-sphere complex, 2) inner-sphere complexes, and 3)
surface precipitates. It is assumed these same coordination bonds can represent the
adsorption mechanism on OSNP materials. Several models of this complexation have
been developed to represent the metal and ligand adsorption reaction. Two models
presented are the site-binding and phase transfer models (Benjamin 2002). The site-
binding model assumes surface ligands are attached to specific sites on the adsorbent
surface. The second model, the phase transfer model, treats the interfacial region as a
phase separate from the solution considering adsorption as a phase transfer reaction.
Both adsorption models are reviewed in the following paragraphs.
Reproduced with permission of the copyright owner. Further reproduction prohibited without permission.

39
number of surface sites is quantified by expressing the number of sites per unit mass of
solid times the concentration of solid in the system. This provides a representation of the
adsorption similar to moles/liter. A surface complexation of a soluble adsorbate can be
represented grammatically as simply: the soluble adsorbate A(aq) plus hydrated surface
site equals adsorbed A plus H2 O. The stoichiometric relationship is shown in Equation 3,
where the formation of a complex between a metal ion Mn+ and a ligand L results in a
coordination compound MLn. The model depicted assumes a coordination sphere of six
water molecules surrounding the metal.
M(H20)62+ + L <r-> M(H20 )5L2+ + H20 (3a)
Therefore, the equilibrium or first formation constant for adsorption is:
K i= [ ML2+ ] / [ M2+] [L] (3b)
The second formation constant would then be:
K2 = [ ML22+ ] / [ ML2+] [L] (3 c)
The size of the formation constant explains how much of metal will be coordinated with
the ligand and how much will be present as a hydrated M2+ complex. Assuming the
solution is infinitely diluted the activities can be assumed to be the molar concentration of
each species. As this model tends to represent the adsorption of hydrophilic species to
the adsorbent, and would seem to logically extend to ionic and electrostatic attraction
representations.
The Phase Transfer Model. In this model the adsorbed species are not considered
Reproduced with permission of the copyright owner. Further reproduction prohibited without permission.

40
bound to a specific site on the adsorbent, but is thought to move around the surface in
response to chemical or electrical forces. Theoretically, there is no limit on the amount
of adsorbate that can be bound to the surface of the adsorbent. This interphase
representation then can be modeled thus:
A{aq) <—> =A(interphase) (4a)
Kd= =A(interphase) / A (aq) (4b)
where Kd is called the distribution or partition coefficient. The distribution coefficient
represents the equilibrium condition for the surface adsorption complexation reaction and
has units L/kg. The distribution coefficient is very valuable to examine sorption behavior
of lead (II) ions on OSNP materials because it responds independent of the concentration
of suspended solids in water (Stumm 1992). Therefore, using Kq and the phase transfer
model to evaluate the complex competitive reactions of ions in stormwater may prove
useful to understand the fraction of metal ions in solution.
Adsorption isotherms relate the quantity of adsorbate adsorbed to the quantity of
adsorbent in solution at equilibrium. When the isotherm is expressed in mg per gram
ratio it provides a relative comparison mechanism to judge performance between various
materials. The isotherm models assume various phases or methods of the adsorption
reaction. For example, the Langmuir isotherm follows the site-binding model theory
where the adsorbate attaches to sites on the surface of the solid adsorbent. It is generally
expressed as (Equation 5):
Reproduced with permission of the copyright owner. Further reproduction prohibited without permission.

41
qe = Xm .K L-Ce/ ( 1 + K L-Ce) (5a)
qe= [(C0 - C e) * V ] / M (5b)
where:qe = mg of adsorbate per g of adsorbent at equilibrium Xm = mg of solute adsorbed per g of adsorbentKl = the Langmuir constant equal to liter of adsorbent per mg of adsorbate Ce = equilibrium concentration of adsorbate in solution (mg L'1)C0 = adsorbate initial or original concentration (mg L'1)V = volume of solution (L)M = Amount of adsorbent used (mg)
The linear form (Equation 6 ) is expressed by rearranging Equation 5 to the following:
Ce/ q e= 1 / (Xltl • Kl) + (1 / Xm) • Ce (6 )
The adsorption capacities of various adsorbents are typically calculated using the
Langmuir isotherm. Then the amount of metal retained mg/g can be estimated as:
qe = (Co - Ce) * V / M (7)
The solid water interface distribution ratios of metals can also be estimated as:
Kd = [(Co - Ce) / Ce ] x [V/M] (Stumm, 1992) (8 )
The Langmuir isotherm is frequently used, but assumes monolayer adsorption, surface
homogeneity, no lateral interaction between adsorbate molecules, and adsorbate
molecules are localized, that is they do not diffuse to other binding sites after first
attachment.
Reproduced with permission of the copyright owner. Further reproduction prohibited without permission.

42
The Freundlich model assumes no association or dissociation of the molecules
after they are adsorbed and there is no chemisorption, and the surface is heterogeneous.
At low concentrations the Freundlich equation tends to not reduce to the linear isotherm,
but has been shown by experiments of others the van der Waals’ adsorption is adequately
represented in the mid-concentration ranges (Noll et al. 1992). The Freundlich equation
takes the form:
where x/m = mass of adsorbate adsorbed per unit mass of adsorbent (mg/g)K f = Freundlich capacity factor (mg adsorbate/g adsorbent)(L HbO/mg adsorbate)I/n Ce= equilibrium concentration of adsorbate (mg/L)1/n = Freundlich intensity parameter
The linear form of the equation (Equation 10) can be obtained by taking the log of both
sides of the equation.
Isotherms have been reported for MCM-41 of the general Type IV, which exhibits
a hysteresis, but has been shown to be eliminated by increasing the operating
temperatures (Branton et al. 1995). The absence of hysteresis has been confirmed by
some for certain grades of MCM-41 (Rouquerol et al. 1999). The dependence of the
isotherm shape relative to pore size of MCM-41 has been investigated. Pore sizes 2.5 to
4 nm displayed very steep and reversible pore filling isotherm risers, but at 4.5 nm the
Type IV with hysteresis loop occurred. MCM-41 pore diameters used in this study are
3.5 nm and may not encounter the hysteresis loop mentioned.
x /m = K f Ce 1/n (9)
log (x/m) = log K f + (1 /n) log Ce (10)
Reproduced with permission of the copyright owner. Further reproduction prohibited without permission.

43
Adsorption on OSNP materials occurs as either outer-sphere, inner-sphere and in
rare instances as surface precipitates. The intermolecular interactions between solute and
any solid phase would include surface complexation reactions, electrostatic interactions,
hydrophobic, adsorption of surfactants and adsorption of polymers (Stumm, 1992).
All inorganic particles have a charge in aqueous environments and for silica, this
occurs because Si-OH loses a proton resulting in the attraction of counter-ions. Therefore
for silica, positive ions will collect at the solid - solute interface. Due to the radius of
influence of the ions, the adsorbed counter ions will not completely neutralize the charge,
causing another layer of counter ions to adsorb to the solid. This process continues until
at some distance from the solid surface a charge balance will be reached. It is at this
point and beyond there will be a balance of positive and negative ions in the bulk
solution. This is the double layer. The boundary of the double layer depends on the
initial charge of the solid phase and its potential is difficult to measure directly. The zeta
potential is not the surface charge potential, but is used as a representative potential
proportional to the surface charge. It represents the potential difference between the
adsorbate bulk phase and the plane of shear (Stumm, 1992). The magnitude of the zeta
potential helps explain the OSNP material stability. This potential or surface charge can
be altered by the addition of surfactants to the adsorbent or solid phase material.
Surfactants operate in three forms: as steric hindrance occupying the adsorption sites on
the surface of the particle, by electrostatic surface charge changes, and by a combination
of both of these processes. OSNP materials attractive forces have been described
predominantly as electrostatic, and specifically van der Waals forces (Pinnavaia 2006).
Electrostatic attraction or covalent bonds with functional groups is determined by ionic
Reproduced with permission of the copyright owner. Further reproduction prohibited without permission.

44
strength, pH and the type o f cation (Strawn and Sparks, 1999). The surface charge is not
directly measurable, but can be represented by the zeta potential.
An important factor effecting zeta potential in aqueous systems is pH. The
isoelectric point for OSNP materials is pH 2, which reflects the dominant structural
moiety of silica (Iler 1979; Kisler et al. 2001). Hence, virgin OSNP materials will be
negatively charged under typical solution conditions and exhibit attractive electrostatic
forces to cations in the bulk solution. However, zeta potential will also be affected by
changing the concentration of cations and the type (valence) of cations in solution. For
example Mg2+ ion will cancel out more surface charge on OSNP materials than Na+
(Vralstad 2005). The implications of multivalent cations are they will have quicker and
larger impact to surface charge and subsequent OSNP material adsorption performance.
In this study, multivalent cations Ca2+, Cr2+, Cu2+, Fe2+, Mg24-, Mn2+, Mo2+, Ni2+, Pb2+,
Sb3+, Sn2+ and Zn2+ ions were found in shooting range stormwaters. Theoretically then,
adsorption performance of OSNP materials may drop significantly in increasing ionic
strength conditions.
2.9 Aquatic Chemistry o f Lead (II) Ions
The speciation of lead (II) in solution is of interest because some forms, viz,
species which have lost one organic group form the neutral, fully saturated organo-
metallic, are more toxic to aquatic organisms than others (Mester et al. 2000). Further,
some species that are soluble (e.g. Pb(NOs)2) or insoluble (e.g. PbCl2 and Pb(OH)2),
which condition is of importance to identify appropriate complexion, precipitation, or
ionic exchange treatment processes. An element’s speciation is regulated by many
factors including other species in solution (i.e. ionic strength), pH and redox conditions.
Reproduced with permission of the copyright owner. Further reproduction prohibited without permission.

45
The need for better speciation o f metal complexes is desired to understand the
biologically available forms that may be harmful to the environment and anthropogenic
interactions (Sanz-Medel 1998). The charge on species can also display different
attractive properties to negatively charged colloids in stormwaters. These various
charges can regulate how species will react in the aqueous environment. It could be
overwhelming to tackle all potential speciation of lead (II) that might be encountered
within the current endeavor, it would be prudent to at least examine the expected
Table 10. Hydrolysis Equilibria Lead (II) Speciation in Natural Waters K = Equilibrium constant at 25 °C______________________________
Equilibrium Equation K pK ReferencePb2+ + H20 O PbOH+ + H+ ki 7.9 (Xu et al. 1999)Pb(OH)+ + H20 O Pb(OH) 2 + H+ k2 8.3 (Xu et al. 1999)Pb(OH) 2 + H20 O Pb(OH)3" + H+ k3 11.5 (Xu et al. 1999)Pb(OH)3- + H20 O Pb(OH)42' + H+ k4 13.1 (Xu et al. 1999)Pb(OH)2 (s) O Pb2+ + 20H' Ksp,OH 16.1 (Xu et al. 1999)Pb2+ + CO32' O PbC03 k5 7.24 (Benjamin 2002)Pb2+ + 2C032" O Pb(C03)22' k6 10.64 (Benjamin 2002)Pb2+ + CO32' + H+ O PbHC03+ k7 13.2 (Benjamin 2002)PbC03(s) O Pb2+ + C 032' Ksp,C03 13.13 (Benjamin 2002)Pb2+ + Cl' O PbCl+ k8 1 . 6 (Stumm and Morgan 1996)Pb2+ + 2C1' o PbCl2 k9 1 . 8 (Stumm and Morgan 1996)Pb2+ + 3C1' O PbCl3' kio 1.7 (Stumm and Morgan 1996)PbCl2(s) O Pb2+ + 2C1' Kspci 4.77 (Stumm and Morgan 1996)SOHx + «Pb2+ O SOPb„(2"';)+ + x H+ (Stumm and Morgan 1996)Note: The formation of lead nitrate and sulfate were not included as these species should be much less than the hydroxide and carbonate species at the redox potential, ligand concentration and pH of stormwaters from small arms shooting ranges (See Figure 6 ). SOPb represents the sorption of lead ions to a surface edge SO and is an illustration for OSNP material adsorption.
speciation. The expected hydrated forms of lead (II) in water are Pb2+, Pb(OH)+,
Pb(OH)2 , Pb(OH)3 ', and Pb(OH)42\ The carbonate species would include Pb(CC>3) or
cerussite or the hydrated form Pb(0 H)2 (C0 3 )2 , hydrocerrusite. Hydrocerrusite is the
usually found to be the most stable solid form in natural waters (Bilinski and Schindler
Reproduced with permission of the copyright owner. Further reproduction prohibited without permission.

46
1982). In an estuary environment or otherwise high chloride water, PbCl+ or PbCb could
be observed. The lead (II) equilibrium relationships are depicted in Table 10. With these
equilibrium relationships a distribution of species of lead (II) as a function of pH may be
estimated. From the relationship the solid phase that controls solubility may be
determined and the species expected for the specific stormwater conditions of interest
[P b2+]TOT = 1 0 .0 0 pM. [ C 0 32-]x o t = 1 0 .0 0 m M
1.0
0.8
0.6
0.4
0.2
0.0
2 4 6 B 1 0 12pH
Fig. 7. Speciation of Pb Hydroxide and Carbonate SpeciesConcentrations approximate anticipated stormwater run-off from small arms shooting ranges. For shooting range stormwater pH range = 5.2 to 7.8 (see Table 14). PbCC>3(c) will likely be the solid phase that controls solubility. Chart was drawn using software developed by the Royal Institute of Technology (Puigdomenech 2004). (c) = crystalline or solid species
may be speculated. For this study of [Pb2+] » 10 pmol, [CO32'] « 10 mmol and utilizing
the equilibrium relationships of Table 10, Figure 7 can be developed. The carbonate was
intentionally set high to represent calcareous soil run-off conditions.
Reproduced with permission of the copyright owner. Further reproduction prohibited without permission.

47
The following provides a review of how Figure 7 was constructed. The principal
hydrolysis forms of lead (II) ions in water solution are shown in Table 10. Their molar
fractions ao, a i, a 2, 0 C3 , and 0 . 4 may be estimated in terms of pH and their respective
equilibrium constants. With the following equations the distribution of each hydrolysis
species and carbonate complexes can be calculated, and represented on a fraction plot as
shown in Figure 7.
ao = [1 +k]/(H+) + k 1k2 /(H+ ) 2 + kik2k3 / (H+ ) 3 + kik2k3k4 /(H+ ) 4 ] 4 (1 la)
ai = a 0 *ki/(H+) (lib)
a 2 = ao * kik2 /(H+ ) 2 (11c)
a 3 = a 0 *kik2k3/(H+ ) 3 (lid)
014 = ao * kik2k3k4 /(H+ ) 4 (He)
The interpretation of the figure is based on the total Pb2+ and C 032' that specifies the
resultant graphs as shown in Figure 7. For the chosen concentrations some dissolved
Pb species would be expected for pH < 6 , and for 6 < pH <9, PbC03 would be the
expected dominate solid controlling lead (II) ion solubility.
Similarly, for conditions of this study at [Pb2+] = 10 pmol and [Cl'] = 1.0 mmol
then Figure 8 can be developed to evaluate the contribution of chloride may have on the
speciation of lead (II) hydroxide complexes. Figure 8 is constructed using the molar
fractional amounts Equations 11a through 11c, along with the same hydrolysis complexes
for lead (II) ions. In this controlled analysis free lead (II) ions would exist in large
fractions and PbCl+ = 0.3 molar fraction until ca. pH = 7, at which point the hydroxide
precipitate would dominant the aqueous environment.
Reproduced with permission of the copyright owner. Further reproduction prohibited without permission.

48
[ P b 2 ~ ] T O T = 1 0 GO A t
1.0 r P b
0.8
I j 6
0.4
u 2
ad.P b C l"
4
| C 1 ] T O T = 1 oG m \ l
■Pb(OHMc)
r
iT A X ,
p H8
_1_____L____ I_____I10 1 2
Fig. 8 . Speciation of Pb Hydroxide and Chloride SpeciesFractions of lead and chloride ions anticipated in stormwater run-off from small arms shooting ranges. For shooting range stormwater pH range = 5.2 to 7.8 (see Table 14). Free lead (II) ions and Pb(OH)2 (c) will dominate this pH range, (c) = crystalline or solid species
2.10 Optimization Using Response Surface Methodology
RSM is an experimental design process of mathematical and statistical methods
applicable with broad application to many disciplines. The response is typically
measured on a continuous scale and is the chosen variable that most likely influences the
response curve. The purpose of use is to enable exploration of the response surface with
equal precision, in any direction. It is fundamentally about analyzing the results of
experiments to ensure valid and objective conclusions are obtained (Montgomery 2005).
Reproduced with permission of the copyright owner. Further reproduction prohibited without permission.

49
Optimization of any experiment has at least one objective - alter controlled variables to
maximize or minimize the output of a process. In relation to this research it is possible to
vary parameters (media depth, filtration rate, percent OSNP material used, and possibly
others) to maximum the adsorption efficiency. In theory a starting point is selected,
typically an educated guess, and the media depth, for example, is varied to the most
optimum benefit. Then at this optimum media depth the filtration rate is varied until
again the optimum performance is realized. Other parameters may also be adjusted
similarly. This type of approach is called a one-factor-at-a-time strategy, however it
misses one critical part of the analysis; the interaction between the factors. The
correction to this is to conduct a factorial experiment and vary the controlling variables or
parameters of interest together.
RSM has been used to optimize processes in manufacturing, engineering
structural optimizations, campaign and voting results, Department of Defense budgets
and many others (Montgomery 2005). In one study RSM was used to analyze clinical
enzyme assays varying three parameters simultaneously (London et al. 1982). The
method is well established and has become a basis for design and analysis of
experiments.
The fundamental concept is, by educated selection, dependent and independent
factors are chosen that are theorized to have the dominant influence on the outcome of
the process. A simple two-factor analysis is illustrative of the RSM concept. For a sand
filtration system, two factors might be filtration rate and media depth. If these two
parameters were set at a range of values that represent the reasonable expectation of the
process, then the interaction of these two full ranges would represent all the combination
of the two factors at two levels, high and low (Fig. 9).
Reproduced with permission of the copyright owner. Further reproduction prohibited without permission.

50
350 Percent removal o f m etal ion
2 5 -
400Filter Depth (mm)
Fiter Depth ESeet = (97+98+98+99V4 - (9?+96+9g+98y4 = 0.75
Filtration Rate Effect = (97+9frl-97+98)/4 - (98+9g+98+98y4 = - 1.25
Interaction Effect = C97+98+98+98y4 - (98+99+97+96y4 = 0.25
Fig. 9 .22 Factorial RSM Pb2+ Adsorption by Granular Filtration Adapted from Montgomery (2005)
The results of this illustration in Fig. 9 demonstrates the filtration rate has larger effect on
the adsorption of lead (II) ions and the negative sign would suggest an inverse
relationship exists, that is a slower filtration rate would enhance metal adsorption. The
combination of each factor, that is, the 2 3 and 2 4 factorial designs, will create 8 and 16
runs, respectively. If there were n factors each at two levels there would be 2” runs
necessary. To keep the optimization process simple, with reduced run times, and lower
costs, fewer levels and factors are selected.
One way to address this numerical problem is to do what is called a fractional
factorial experiment. A subset of the runs are used, but selected to represent the major
Reproduced with permission of the copyright owner. Further reproduction prohibited without permission.

51
points of maximum, minimum and interaction. This process can be as informative about
the effects of the factors considered. The objective is always the same, determine which
process variable affects the response the most. A logical follow-on to this analysis then is
to evaluate variations to optimize the response. Iterative runs of this process will create
responses that will plot as contours on traditional charts, and in the previous example
contours of percent metal removal efficiencies. The resultant is a surface or to use the
terminology of this process, a response surface. To locate the optimum it will be
necessary to continue the 2 2 factorial experiment varying filtration rate and filter depth
together. Once a region of optimum performance is found a new round of experiments
are formulated to attempt to improve the previous operational set points. The end result
should enable the development of an empirical model of the process. This process is
known as response surface methodology. Response surface methodology (RSM) is then
a mathematical representation of the problem and allows statistical analysis of the
problem from which an optimum operating location can be determined. If the response
can be represented by a linear function of the independent variables then the approximate
function can be represented as shown.
y = Po + P1X1 + p2x2 + - + pkXk + s (1 2 )
If there is non-linearity in the process then a polynomial of higher degree must be used.
The second order function would be of the following form (Equation 13):
k ky = po + Z piXi + Z PiiXi2 + Z Z pijXiXj + a (13)
i=l i=i i<j
Reproduced with permission of the copyright owner. Further reproduction prohibited without permission.

52
It is assumed the response in this research will be linear in nature. Linearity was
validated by setting the operational column at mid-points of the model and comparing
results with predicted values. This method of least squares evaluation estimates the
precision of the model. Since the model proved linearity at a 90% confidence level the
second order model at Equation 13 was not used.
Reproduced with permission of the copyright owner. Further reproduction prohibited without permission.

3. METHODS AND MATERIALS
53
Screening batch and column experiments using various functionalizations (i.e.
thiol, ether, hydroxyl, amine, phosphate) of OSNP materials (Table 11) were conducted,
followed by the selection of the OSNP material from this group that most effectively
removed lead (II) ions. Using the selected OSNP material, batch reaction experiments
with lead (II) ions in DI water were completed, followed by batch reactions with a matrix
solution of 13 cations. Column experiments were optimized for media depth, filtration
rate and percent mass of OSNP (w/w) material following procedures for Response
Surface Methods. Column studies were completed using a 13-cation matrix solution in
tap water and with stormwater collected from a Virginia shooting range.
3.1 Synthesis and Characterization of OSNP Materials
Two formulations were used for the OSNP materials. Their specific formulations
are described in the following paragraphs after which descriptions of the analytical
methods for qualitative characterization are discussed.
3.1.1. HMS Synthesis.
The surfactant template was prepared by first adding 10 mL EtOH, then 87 mL DI
H2 O to 1.2424g n-dodecylamine (C 12H 2 7N , MW 185.36) and stirred. The silicate was
prepared by adding 12 ml EtOH to 6.8280 g tetraethylorthosilicate (TEOS, Si(OC2Hs)4 ,
MW 208.33). Both solutions were stirred to homogeneity and then the silicate added to
the surfactant template solution. Molar ratios of the final mixture were 217 mmol C12
amine: 6.74 mmol TEOS: 217 mmol EtOH: 4833 mmol H2O. The solution was stirred
overnight at ambient temperature. Afterwards, the material was dried for 4 d then rinsed
Reproduced with permission of the copyright owner. Further reproduction prohibited without permission.

54
with DI H2O and EtOH through Whatman No. 3 filter paper. Collected materials were air
dried for 3 d and bottled.
3.1.2. MCM-41 Synthesis
The surfactant template was prepared by first adding 71 mL DI H2 O to 1.3286 g
n-hexa-decyltrimethylammonium bromide (CTABr, CH3 (CH2)isN(CH3)3Br, MW
364.46), and then stirred. To this mixture 6.3228 g TEOS was added, stirred into the
mixture, and NaOH added drop wise until pH 12. Final mixture molar ratios were 3.636
mmol CTABr: 30.3 mmol TEOS: 15.15 mmol NaOH: 3939 mmol H2 O. After
approximately 30 min of stirring the solution was added to Parr Instrument Company,
Moline, IL stainless steel reactors and set in a pre-heated 110 °C oven for 3 d. After
cooling the resultant mixture was filtered through Whatman No. 3 filter paper using DI
H2O and EtOH. Collected materials were then air dried for 3 d and bottled.
3.1.3. Characterization of OSNP Materials
Qualitative analysis for the meso-structural order was determined by X-ray
powder diffraction (XRD) patterns on a Rigaku Corporation diffractometer Miniflex,
number 2005. The diffractometer was equipped with a rotating anode and Cu-Ka X-
radiation source (wavelength X.-0.15418 nm). Scanning speed was one-half degree per
minute and 1,000 cps with a goniometer radius =150 mm. Slit opening angle was 2.5°,
divergence slit 1°, scatter slit 1° and receiving slit 0.3 mm. All measurements were
started ca. 10 degrees and peaks identified to 0 degrees. Results were compared to
nanoporous material species spectra as published in the literature. Identification was
based on position of the lines in diffraction pattern and their relative intensities
Reproduced with permission of the copyright owner. Further reproduction prohibited without permission.

55
Table 11. OSNP Batch Reaction MaterialsThe first 6 OSNP materials were of the general formula [SiQ2 ]i.x [SiOi.5((CH2 ) 3 SH)]XReference OSNP Material Structure Description
1 Thiol functionalized, wormhole structure, powdered, x = 0.152 Thiol functionalized, wormhole structure, powdered, x = 0.303 Thiol functionalized, wormhole structure, powdered, x = 0.504 Thiol functionalized, foam framework, powdered, x = 0.155 Thiol functionalized, foam framework, powdered, x - 0.306 Thiol functionalized, wormhole structure, 1-10 pm, x = -0.507 Phosphate functionalized8 40% ether functionalized9 15% thiol functionalized
1 0 16% thiol functionalized1 1 1 0 % amine functionalized1 2 40% amine functionalized13 17% amine functionalized14 Hydroxide functionalized15 Hydroxide functionalized16 Hydroxide functionalized17 Amine functionalized18 Amine functionalized19 Amine functionalized2 0 Amine functionalized2 1 Hydroxide functionalized
Control 1000 mg/L Pb(N03 ) 2 in DI H20
The diffraction angle 20 generated by the diffractometer was used to determine the
spacing between the planes of the molecular structure. Then applying the Bragg equation
(Eq.14), the distance between the planes was calculated from the known
n X, = 2 d sin 0 (14)
where n = is an integer; X = wavelength (A); d = inter-planar distance (A); 0 = angle of incidence and constructive interference. See Figure 10.
wavelength of the source and the measured angle. The line intensities reflect the number
and kind of atomic reflection centers in each set of planes resulting from scattering that
Reproduced with permission of the copyright owner. Further reproduction prohibited without permission.

56
occurs as a consequence o f interaction o f the radiation with atoms in the molecule. It was
expected from the literature MCM-41 would have a very strong peak at the dlOO
reflection line and three weaker peaks at dl 10, d200 and d210 (Kresge et al. 1992;
Vartuli et al. 2001; Zhou et al. 2001).
Infrared absorption spectrometry reflectance (FTIR - Fourier Transform Infrared)
was obtained to evaluate molecular vibrations, either stretching or bending. Typically
heavier atoms will vibrate slower than lighter ones, and stronger bonds will vibrate faster
than weaker bonds. The character of the metal adsorption bond and other molecular
bonds to and within the OSNP materials may be elucidated this way (Skoog et al. 1998).
Transmission Electron microscopy (TEM) was used to identify and to elucidate
the morphology of the material. Pore diameters were qualitatively determined by TEM.
Quantitative metal concentrations were obtained using a Spectra AA 220 Graphite
Furnace Atomic Adsorption (GFAA) spectrometer with a Varian Graphite Tube Analyzer
(GTA) 110 located at the Applied Research Center (ARC), Christopher Newport
University Laboratory, and the Isotope and Trace Element Research (LITER) inductively
Distance A 8 + Distance 0 € = tiTs
4 = Atom
Fig. 10. Bragg’s Law Diffraction Nomenclature
Reproduced with permission of the copyright owner. Further reproduction prohibited without permission.

57
coupled plasma mass spectroscopy (ICP-MS) located at Old Dominion University. The
ICP-MS used in this study was a Finnigan ELEMENT 2 double focusing sector field
(SF)-ICP-MS (Bremen, Germany). The magnetic and electric sector mass analyzers were
in reversed Nier-Johnson geometry. Sample introduction was achieved using a self
aspirated Perfluoroalkyoxy (PFA) microflow nebulizer (50 pL/min). Scanning electron
microscopy (SEM) explored morphology and formula weights using a Jeol JSM-820
scanning electron microscope with an accelerating voltage of 4.5 kV to 15.0 kV and
magnification from x500 to x3300. Samples were mounted using a doubled sided
conductive carbon double-sided sticky tape.
3.2 Screening OSNP Materials by Batch and Straw Columns
The objective of the screening experimentation was to identify best performing
candidates adsorbent materials to be used in column and competitive ion studies. Batch
reactions were prepared of 21 OSNP materials of various silica-based templates. The
first group of silica OSNP materials had wormhole and foam framework structures with
the formula [Si0 2 ]i-X [SiOi.s((CH2 ) 3 SH)]X with x between 0.05 and 0.50. These were all
thiol-functionalized OSNP materials; reference materials 1 - 6 in Table 11. Additional
OSNP materials with various functional groups, phosphate, ether, thiol, amine and
hydroxide, were also prepared; reference material numbers 7 - 21 in Table 11. Control
for the experiment was 1000 mg/L lead (II) standard as Pb(N03 ) 2 in DI H2 O.
A flatbed shaker was used to suspend materials throughout the batch mixing
phase. All materials were run in triplicate with 5 mg OSNP material in 100 mL of DI
H2 O in polypropylene wide-mouth bottles at 23 ± 1 °C. Lead standard was lead nitrate
and measured at 1913 ±37 mg/L. Fifty mL of DI H20 was used to pre-wet each sample
Reproduced with permission of the copyright owner. Further reproduction prohibited without permission.

58
for preservative prior to analysis. Equilibrium was verified by allowing samples 7
through 21 to react an additional 6 d. All samples were centrifuged and a second aliquot
filtered through a 0.45 micron syringe filter for dissolved analysis. Each sample was
preserved with nitric acid and analyzed by ICP-MS. Sources of error include pipettes
used in multiple dilutions of the samples, balances, and standard concentrations. The
error associated with the dilutions was anticipated to be approximately 2-3% due to the
large dilutions (1 0 0 0 -fold dilution or more) needed to bring the sample concentrations
within the instrument calibrated linear range. Quality control measurements were
completed to include measurements of standards, blanks, and three laboratory controls
prepared by adding 50 mL of DI H2 O and 40 mL of the Pb(NOs) 2 solution. The resulting
relative percent deviation for the control samples averaged 6.9%. Distribution
coefficients (K d) were computed for each material.
Straw column studies were completed of three OSNP materials to evaluate
approximate loading capacities. A standard solution of 5 mg/mL Pb2+ as Pb(N0 3 ) 2 from
Environmental Express, NC was passed through a EiChrom 2.54 cm diameter column
containing 0.100 g of OSNP material. The effluent for each aliquot was collected
separately and tested for Pb by means of Plumbtesmo® test paper. The test paper is
sensitive to 0.05 pg/L Pb2+ and was used to detect column break through as a qualitative
determination. Loading capacities were calculated as number of aliquots x 0.200
mL/aliquot x metal concentration (mg/mL) divided by mass (g) of OSNP material used.
Results were tabulated as mg adsorbate / g adsorbent. Equivalent molar quantities
adsorbed in mmoles/g were also computed.
Reproduced with permission of the copyright owner. Further reproduction prohibited without permission.

59
3.3 Screening OSNP Materials in Column Studies
In this portion of the study a qualitative screen in small diameter straw columns
was completed to evaluate approximate break-through, and to estimate loading capacity.
The primary objective was to validate the type of OSNP material to use in the full column
and sand filtration development.
The first column study used 7 mm inside diameter by 60 mm borosilicate columns
with a polyethylene frit in the bottom to support the adsorbent materials. Approximately
0.1 g of OSNP material was placed into the column and 10 drops of isopropyl alcohol
and 2 mL of DI H20 added for wetting. A polyethylene frit was added to the top of the
media to disperse the liquid and create plug flow. Contaminant solution was 5,000 mg/L
as Pb(N0 3 ) 2 and added in 200 pL portions. Qualitative breakthrough was determined
using Plumbotesmo® test paper sensitive to 5 pg/L total Pb. Breakthrough fraction was
computed as the number of 200 pL aliquots that produced a positive test paper results.
The loading capacity column study were completed of the OSNP materials using
2.54 cm x 150 cm EiChrom borosilicate columns fritted at bottom of adsorbent as
support. To each of three columns 5.0 g of OSNP material was added with only light
hand tamping. The volume was measured and the pore volume of the material assumed to
be ca. 45%. This assumed porosity is what can be expected from non-compacted fine
grained aggregate (Freeze and Cherry, 1979). Influent water was as-provided tap water
spiked with 500 mg/L of Pb2+ as Pb(N0 3 )2 . Contaminated water was added in either 50
mL or 100 mL aliquots and allowed to filter by gravity through the OSNP adsorbent
media.
Effluent was collected in 160 mL nalgene beakers and tested each morning using
semi-quantitative indicator test papers for total Pb. These papers were calibrated on the
Reproduced with permission of the copyright owner. Further reproduction prohibited without permission.

60
standard solutions so that a positive test indicated > 5 pg/L for total Pb. These results
provided indications of break-through after which the solutions were decanted into
centrifuge tubes and analyzed by ICP-MS. Loading capacity was then estimated by
multiplying the number of aliquots x aliquot liter x metal concentration / mass of test
material x 100. Result provided the mg/g loading capacity. The equivalent molar
capacity in mmol/g was also computed by dividing the mg/g metal loading capacity by
the atomic weight of the metal of interest.
3.4 Hydraulic Evaluation
Water headloss through a filter bed was modeled considering particle shape (cj> =
particle shape factor, typically set as 1.0 for spheres, 0.82 for rounded sand, 0.75 for
average sand, and 0.73 for crushed coal and angular sand), depth of the filter bed,
superficial filtration velocity (m/s), porosity (the ratio of the particles voids to total
volume), acceleration due to gravity (9.81 m/s2), coefficient of drag, and geometric mean
diameter between sieve sizes. There have been a number of models developed by
Kozeny, Carman, Hazen, Rose, and others. For the initial screening processes the
headloss formula developed by Carmen (1937) and Kozeny (1927) was used as shown in
Equation 15. The computation for this study was based on the superficial velocity
measured in the laboratory for similar 600 mm media depth columns to maintain a
constant head.
To evaluate headloss due to the addition of OSNP materials to a sand filter, a
simple experimental design consisting of a 5.08 cm diameter polyvinylchloride schedule
40 pipe capped with a Whatman No. 3 paper filter (particle retention 6 pm) and plastic
end cap with 14-4.8 mm holes was prepared. The drilled holes provided about 50%
Reproduced with permission of the copyright owner. Further reproduction prohibited without permission.

porosity in the end cap to minimize headloss and support the paper filter. In the first
column commercial sand with dio = 0.21 mm and UC = 2.55 sieve was filled to the 600
mm depth. To this column tap water was added via a Control Company model 3386
mini-variable speed peristaltic pump to maintain a specific head in the column. To a
second column of the same size as the first, 7.9 cm of 5% by volume amine
functionalized powdered OSNP material and sand were added to the bottom 100 mm. To
the remainder of the column sand was added to the 600 mm depth. To this second
column tap water was added via Control Company model 3386 peristaltic pump to
maintain the same head as in the first column. The implications to hydraulics of the
filtration system were evaluated due to the addition of powdered OSNP materials and
headloss estimated.
h = fc* fl * (1 - £jf“ * A *U *L (15)
O* * V
Reproduced with permission of the copyright owner. Further reproduction prohibited without permission.

62
Where: Input Values:h = head loss in filter depth L (m) k = 5k = dimensionless Kozeny constant, 5 or 6 g = 9.81 m/s2
g = acceleration of gravity, 9.81 m/s2 p /p = 1.13E-06 m2/sp = absolute viscosity of water, N s/nf E — 0.40p = density of water, kg/m3 d = 0 . 0 0 0 2 1 mp / p = kinematic viscosity of water; at 15 C ip = 0.85e = porosity, dimensionless u = 1.67E-04 m/s =A / V = grain surface area per unit volume of grain L = 0 . 6 m
= specific surface S (or shape factor = 6.0 - 7.7) h = 0.3664 m == 6 /d for spheres; d = mean size of media = 6 / (Y * deq) for irregular grains
Y = grain sphericity or shape factor deq = grain diameter of spheres of equal volume
o = filtration (superficial) velocity (m/s)L = depth of filter, m
0.60 m/h
36.6 cm
0.5 m Sand only 0.1 m Sand and 5% OSNPInput Values: Input Values:k = 5 k = 5
g “ 9.81 m/s2 g = 9.81 m/s2p /p 1.13E-06 m2/s p / p ; 1.13E-06 m2/ss = 0.40 s = 0.40d = 0.00021 m d = 0.00010 mY = 0.85 x g = 0.85o = 1.36E-04 m/s = 0.49 m/h u = 1.36E-04 m/s =L = 0.5 m L = 0.1 mh = 0.2491 m = 24.9 cm h = 0.2197 m =
0.49 m/h
22.0 cm
Estimated dual media headloss = 46.9 cm
3.5 Leachability of OSNP Materials from Sand Filter
Leaching characteristics of OSNP and sand media were evaluated in 9.525 mm ID
vinyl tubing 230 mm long with Whatman No. 3 paper filter end caps. The Whatman filter
has a porous membrane with an average particle retention size of 6 pm. To one column
Reproduced with permission of the copyright owner. Further reproduction prohibited without permission.

63
14.07 g of sand and 0.45 g of HMS material were thoroughly mixed and added, and 14.05
g sand and 0.50 g of MCM-41 material were thoroughly mixed and added to a second
column. Mass OSNP material to sand ratios were 3.1% and 3.4% for HMS and MCM-
41, respectively. Tap water was added at an average of 12 mL/min (SD = 5.6, n = 45)
from 9 Dec 06 to 26 Jan 07. Influent and effluent turbidity, pH, temperature and
conductivity were measured at irregular intervals throughout the period. Flow rates were
measured at each sample collection time. Control samples were prepared using 0.0 to
0.0210 g MCM-41, and 0.0 to 0.0293g HMS in tap water. Control turbidity, pH, and
conductivity were measured at various times throughout the 48 d. Analytical equipment
included Mettler Toledo Model PR5002, balance d = 0.01 g (Switzerland) and Labpro
Data Logger using a TI- 8 6 interface and Vernier software (Beaverton, OR). Turbidity
calibration was completed prior to all measurements using 890 nm LED with 0.25 NTU
resolution and ± 5% accuracy for readings above 25 NTU. Conductivity and pH were
calibrated as needed. Turbidity and conductivity of effluent were compared to influent
by single factor analysis of variance.
3.6 Synthetic Stormwater Characteristics
Stormwaters were collected 6 Oct 06 from the Langley AFB small arms firing
range and analyzed by ICP-MS following methods explained in section 3.1.3,
Characterization of OSNP Materials. The results are summarized in Figure 11. Based on
the concentration of elements from this analysis and from metal leachate studies
conducted (see Appendix B) a synthetic formulation was devised as presented in Table
12. A more complete description of the source of the soils, the edaphic characteristics,
and mineral content of the shooting range soils is provided in a paper by this author
Reproduced with permission of the copyright owner. Further reproduction prohibited without permission.

64
published in the Journal o f Hazardous Substance Research. A copy of the article as
published is at Appendix B. While each of these metals could be selected as metals of
interest for this adsorption study, lead (II) ions were the preferred metal ion because of
the elevated dominance in the studies, its known toxicity and for the following additional
reasons:
Lig'L
Ca Na, Mg Fe Za Pb Cm Sb Ma £c M Mo Sa
Fig. 11. Metals in Stormwaters Collected from Small Arms Firing Ranges Time collected: 12:15 pm in light to heavy rain. Ambient T = 17.2 C; Dewpoint - 16.1 C; barometric pressure = 30.06 in (1018.0 mb); wind NE23G33 (mph), visibility 1.63 mi, clouds FEW005, BKN018, OVC039, Collected ca. 19L from Outfall. pH = 7.43. Samples were analyzed in triplicate by ICP-MS with RSD <10%.
o The amine OSNP materials have been shown to be effective adsorbents of the
divalent lead ion (Xu et al., 1999). Lead in shooting range stormwaters have been
found in waters with pH range of 5.5 to 8.5, and therefore will most likely be in a
2+ oxidation state in carbonate or sulfate form as shown in 6 (Bradl 2004; Weng
2004) or as free ions or attached to suspended particulates.
Reproduced with permission of the copyright owner. Further reproduction prohibited without permission.

65
o One shooting range in the twelve range study had a National Pollution Discharge
Elimination System (NPDES) permit limit = 0.15 mg/L total lead. The point of
compliance is at the shooting range stormwater outfall.
o Manganese (Mn) and iron (Fe) are secondary Safe Drinking Water Act (SDWA)
constituents of concern for color, taste, and odor purposes. They are not typically
regulated in stormwater discharge permits and as such do not pose a regulatory
concern. They have toxicity at elevated levels, but are essential nutrients for
biological organisms, and are abundant in soils and ground water. Manganese
exists naturally in both divalent and quadravalent forms typically as oxides,
carbonates, and hydroxides that are only slightly soluble. Iron exists also in two
forms, as divalent and trivalent, ferrous and ferric, respectively. It is not
uncommon for surface waters to contain iron constituents. Since neither ionic
form poses a regulatory or health related concern they are not isolated for this
study. However, their ionic lead (II) adsorption interference within the synthetic
water matrix will be considered as lead sorbs readily to manganese hydroxides
over iron oxides by a factor of 40, potentially restricting the mobilization of lead
(Hettiarachchi et al. 2000).
o The inorganics Cu and Zn will be used as competing ions in the synthetic
stormwaters prepared. MCM-41 has been shown to be an effective adsorbent of
Cu (Algarra et al., 2005). Sb has been found by others in shooting range soils
(Johnson et al. 2005) and may also be of interest as a competitive ion.
o Improving the quality of urban stormwaters prior to discharge to receiving waters
is desired. The pathway for lead exposure to the general population, to include
Reproduced with permission of the copyright owner. Further reproduction prohibited without permission.

66
children, is by ingestion in drinking waters (Royce et al. 2000). Further,
depending on the hardness of water the toxicity of lead in stormwaters can exceed
acute aquatic life criteria (Burton and Pitt 2001; Engstrom 2004; Paulson and
Amy 1993).
Based on these results and the leachate analysis described previously, 13 cations,
namely Ca2+, Cr2+, Cu2+, Fe2+, Mg2+, Mn2+, Mo2+, Na+, Ni2+, Pb2+, Sb3+, Sn2+ and Zn2+
Table 12. Cation Analysis of Stormwater and Synthetic Solutions Stormwater was collected 6 Oct 2006 approximately 6 h after the onset of heavy rain fall at Langley AFB, VA small arms range. 24 h rainfall = 2.03 in. The stormwater concentration data is the tabulated data of Figure 11. Tungsten and Arsenic have been reported at some ranges, but were not present in stormwaters collected at the Langley AFB small arms firing range. Batch solutions were prepared using deionized water. The column adsorbate concentrations are for laboratory tap water, except for the additional spiking of lead (II) ions as Pb(NC>3)2 . Batch and column solution were analyzed by ICP- MS with instrument detection limits from 0.1 to 3.6 pg/L.
Element Stormwater Batch Adsorbate Column Adsorbate(ftg/L) (ftg/L) (ftg/L)
Ca 16,401 65,002 31,063Na 6,685 3,439 23,973Mg 2,180 576 1,680Fe 580.9 674 46Cu 219.6 113 467Pb 236.7 1,017 1,060tZn 241 5,342 2,127Sb 27.2 152 0.7Mn 19.8 319 9.4Cr 8 . 2 72 4.5Mo 0.5 26 0 . 2
Ni 1 . 1 28 4.7Sn 0.3 479 0 . 1
Lead (II) ion concentration was spiked to this concentration
Reproduced with permission of the copyright owner. Further reproduction prohibited without permission.

67
ions were selected to constitute the synthetic solutions as shown in Table 12. This phase
of this research was to evaluate performance of OSNP material as adsorbents in a
controlled matrix high ionic strength solution and with natural stormwaters.
OSNP materials have had limited field application (Algarra et al. 2005) and most
synthesized mesoporous sieve research has been used for applications in controlled
environments and with limited to no ionic competition (Abdel-Fattah and Bishop 2004;
Antochshuk et al. 2003; Huo et al. 1995; Juang et al. 2006; Mercier and Pinnavaia 1998;
Xu et al. 1999; Yokoi et al. 2004; Yoshitake et al. 2003). This study proposed to improve
the understanding of OSNP materials application in selected constituent synthetic
stormwaters. Actual stormwater from a small arms firing range in Virginia were also
used.
Urban stormwaters are highly variable and often contain a large range (1 pm to
10,000 pm) of particulates (Sansalone et al. 1998), elevated concentrations of dissolved
solids (e.g. ~120 mg/L CaCh), metals (Cu & Pb ~ 0.08 mg/L, Zn ~ 0.6 mg/L), and
nutrients (NO3 ' ~ 2 mg N/L and P ~ 0.6 mg/L) (Davis et al. 2001; Wigington et al. 1986).
These amounts are typically uniquely characteristic of each urban environment
(Engstrom 2004; Vaze and Chiew 2004).
A summary of pH, TSS and lead (II) and copper (II) in shooting range and urban
stormwater conditions are provided in Table 13. The average dissolved lead
concentration in eight shooting range stormwaters was 91.5 pg/L (SD=22.3, n=34),
which was significantly higher than urban stormwater at 1.2 pg/L (SDK).4, n=34) (F =
16.35, Font = 3.99, P = 0.0001, n = 6 8 ). Also, total and dissolved stormwater lead
concentrations at shooting ranges had a larger range and greater maximums than urban
stormwaters. These differences in concentrations and conditions would suggest shooting
Reproduced with permission of the copyright owner. Further reproduction prohibited without permission.

68
range stormwaters provide a rich “target” for remediation, immobilization and removal
research. Developing control methods will be increasingly important to range managers
as lead migration in stormwaters persist effecting receiving streams.
3.7 RSM Optimization Experimental Set-up
Prior to conducting the column studies with matrix solutions a response surface
was developed to optimize column performance. A 23 factorial experimental design was
selected for ease of execution (only 8 runs were required). A fractional experiment of 2
requires two levels be established for three parameters. The objective of RSM is to fit a
model to the data to create a response surface from which optimum performance can be
Table 13. Stormwater CharacteristicsShooting Range Stormwater
LOCATION1 pH TSS(mg/L)
Total Pb (gg/L)
Dissolved Pb (pg/L)
Dissolved Cu (pg/L) Reference
East
East
East
West
NA
6 .4-6 .6
5 .2-6 .5
NA
NA
NA
NA
NA
600 - 1600
840 - 5655
NA
5.2-26000
22-160
42 - 283
11.7-473
4.2 - 450
17-29
NA
NA
1.7-160
(Isaacs, 2007) (Stansley et al. 1997)(Craig et al., 1999)(Isaacs, 2007)
Urban Stormwater
NURP
West
West
NA
NA
6 .3-7 .8
101
62-192
4-236
144
< 100
1.8-59
NA
< 100
0.28-14.2
NA
< 100
1.8-28.1
(U.S.EPA1983)(Characklis and Wiesner 1997) (Engstrom 2004)
Langley AFB SAFR Water Quality Parameters
LOCATION1 pHTSS(SD)
(mg/L)
Total Pb (Pg/L)
TDS (SD) (mg/L)
Turbidity(NTU) Date Collected
Outfall 7.16 61 (ft) 594 151.5(26.3) 34 17 Apr 06Outfall 7.19 43(3.2) 1442 66.6 (11.6) 24 22 Apr 06
Impact Berm 7.22 1204(tf) NM 36.0 (6.2) 670 3 Jun 06Outfall 7.42 52.2(tf) 237 114.3(ft) 33 6 Oct 06
T East and West division was arbitrarily set at the Mississippi River; NURP = National Urban Runoff Program; AFB = Air Force Base; SAFR = Small Anns Firing Range; SD = standard deviation; NM = not measured
tt Only one measurement taken
Reproduced with permission of the copyright owner. Further reproduction prohibited without permission.

69
selected. Experiments typically vary a factor over its range with other factors held
constant. With RSM all variables are varied simultaneously show interaction effects are
observed and documented (Montgomery 2005). For a filtration system, effluent quality is
an important response variable and was selected as the key response variable for this
study. The fractional design of experiment for the study selected the amount of OSNP
material used, bed depth and filtration rate as key parameters (Crittenden et al. 2005).
These parameters were selected based on their obvious interest (e.g. OSNP material) and
impact to effluent quality. Influent quality, TSS, particle size and distribution were all
controlled, while porosity, density, type and shape media were held constant. Selected
RSM coded factor levels were selected to encompass the expected range of operations of
the in-situ filtration system.
Table 14. RSM Coded Factor Levels
Coded Factor Low (-1) High (+1)
A. OSNP Material w/w (%) 2 . 0 1 0 . 0
B. Filter Depth (mm) 2 0 0 400
C. Filtration Rate (mL/min) 2 2 0
Eight columns 12.7 mm in diameter were prepared and configured for each
possible combination of levels. That is, one column setting was prepared for all
parameters set at the low level, a second for all high levels, and so forth. Influent was
lead (II) spiked tap water using diluted 1,000 ± 3 pg/mL lead nitrate manufactured by
Environmental Express, catalogue number 100028-1 (Mt. Pleasant, SC). Flow rate was
Reproduced with permission of the copyright owner. Further reproduction prohibited without permission.

70
regulated by a Control Company model 3386 variable flow peristaltic mini-pump
(Friendswood, TX). Effluents were collected at various intervals from 5 to 3300 min or 2
to 379 bed volumes (BV). Samples were analyzed by graphite furnace atomic absorption
(GFAA) spectroscopy, Varian Spectra AA model 220FS (Mulgrave, Australia) with ultra
hollow cathode lamps 5-point smoothing, with 3 to 4 replicates in a 9-step ramp process
culminating in measurements with ionized sample at 2100 C. Chemical modifier 800
mg/L palladium was used as recommended by the manufacturer. Instrument detection
limit was calculated following Kaiser (1970) and Long and Winefordner (1983) as 3
standard deviations from eight background measurements of blank samples. For these
and all other experiments in this study the calculated detection limit of total lead by
GFAA was ±1 pg/L. Samples were acidified with one to two drops of 70% analytical
grade HNO3 prior to analysis.
3.8 Adsorption Isotherm of Lead (II) Ions by MCM-41 and HMS
Batch reactions were conducted to evaluate isotherms with 22.5 to 27.1 mg OSNP
materials in 5 to 80 mL adsorbate (Table 12) with 1,017 pg/L lead (II) ion as Pb(N0 3 )2 .
Bottles were vigorously shaken for 30 s and equilibrated at 48 h at 20 ± 3 °C. Samples
were allowed to equilibrate for 24 h, supernatant withdrawn, acidified, filtered through
spun glass and analyzed by GFAA as previously described in Section 3.7. Only the top 5
mm of supernatant was withdrawn by pipette for analysis. Langmuir and Freundlich
isotherm coefficients and adsorption capacities were determined. Comparisons were
made to literature values.
Reproduced with permission of the copyright owner. Further reproduction prohibited without permission.

71
3.9 Influence o f pH on Batch Reaction Adsorption
The effects of pH were examined using 25 mg of OSNP material added to 25 mL
of adsorbate (Table 12) with 1,017 pg/L lead (II) ion as Pb(N0 3 )2 . Hydrogen ion
concentrations were prepared by adding analytical grade NaOH and HNO3 drop wise to
DI water to prepare solutions at pH of 2,4, 5, 8 ,10 and 12. Once OSNP materials were
added they were vigorously shaken for 30 s and equilibrated for 48 h at 20 ± 3 °C. The
supernatant was collected, acidified with nitric acid, then filtered through spun glass and
analyzed by GFAA as previously described in Section 3.7. Similar procedures were
followed for batch matrix solutions (See Table 15 in the next section) using 25 mg OSNP
material in 25 mL of adsorbate solution. Solution pH varied from 2 to 11.
3.10 Adsorption Interference by Competitive Ions
The effects of competitive ions were examined in step-wise fashion grouped as
shown in Table 15. The concentration of each cation was as described previously in
Table 12. All metals were from nitrate salts by Environmental Express (Mt Pleasant, SC)
at 1,000 ± 3 pg/mL in 1 to 5% HNO3 . Antimony solution also contained 0.1% HF.
Serial dilutions were prepared at target solution concentrations and analyzed
Table 15. Matrix Solution ConstituentsConcentration of each metal is shown as batch synthetic values in Table 12.
Matrix Elements1 Pb, Mo, Ni, and Sn2 Matrix 1 plus Sb, Mn, Cr3 Matrix 2 plus Cu, Zn4 Matrix 3 plus Fe5 Matrix 4 plus Mg6 Matrix 5 plus Na7 Matrix 6 plus Ca
Reproduced with permission of the copyright owner. Further reproduction prohibited without permission.

72
by GFAA as described in Section 3.7. Approximately 25 mg of MCM-41 and HMS were
added to 25 mL of each matrix solution and vigorously shaken for 30 s. Samples were
equilibrated for 48 h at 20 ± 3 °C. The supernatant was collected, acidified with nitric
acid, then filtered through spun glass and analyzed by GFAA as previously described in
Section 3.7. Distribution coefficients were calculated for comparative purposes.
3.11 Column Study
Column experimental set-up was as prescribed by the response surface
optimization which was 216 mm media depth, 11 mL/min flow rate and OSNP 3 percent
w/w sand mixture. Flow was adjusted initially to the RSM optimized rate and with time
(ca. 20 hours) reduced to gravity flow rate. Gravity flow operations were conducted to
simulate actual operating conditions that were expected for the field filtration unit.
Influent lead (II) ion concentrations varied from 500 to 1,000 pg/L. Matrix solutions
contained nitrate salts of 13 cations as described in Table 12. Bed volume (BV) was 27.4
mL for all columns evaluated. The column operated in a down-flow mode. Flow rate
was monitored throughout the sample period and adjusted periodically as needed, except
for gravity flow processes. Flow rate was not continuous and stopped for 7 d to simulate
anticipated start - stop field conditions for an in-situ sand filtration system. All sorption
experiments were carried out at a room temperature of 20 ± 3 C with an influent pH =
6.87 (n = 18, SD = 0.36). Influent and effluent samples were collected at irregular
intervals from initial to ca. 1,400 BVs, then analyzed for pH, turbidity, conductivity,
temperature and lead (II) ion concentration using methods previously described. The
amount of lead (II) ion adsorption was calculated using Equation 15.
Reproduced with permission of the copyright owner. Further reproduction prohibited without permission.

73
MatrixoJution
PeristalticPimp
162 mm
54 warn
.216 mm
PVC coupling and fittings
12.7 mm diameter clear PVC column
Sand df 0 = 0.20 torn dgQ= 0.51 mm UC = 2.55
OSNP and sand at 1/4 total media depth
PVC coupling and fittings
Effluent and sample collection
Fig. 12. Column Study Experimental Set-upOptimized column configuration was based on Response Surface Method media depth, filtration rate and percent w/w OSNP and sand. UC = uniformity coefficient.
qe(mg/g) = ( C o - C e ) * V / W (16)
where:qe = Amount of equilibrium adsorption of metal Co = Influent concentration Ce = Effluent concentration W = Dry mass of adsorbent
Reproduced with permission of the copyright owner. Further reproduction prohibited without permission.

The percent of metal removed is calculated by the ratio of the difference in metal
concentration before and after adsorption (Co - Ce) and the initial concentration of lead
(II) ions in the aqueous solution (Co).
Percent Removed = (Co - Ce) * 100 / Co (17)
Specific break-through concentrations were identified for each column. Break-through
BVs were determined when the effluent reached 50% of the feed concentration.
Breakthrough curves were plotted and break through capacities estimated following the
method developed by Treybal (1980).
To evaluate recycle efficiency an optimized column of 0.38 g of MCM-41 mixed
with 15.02 g sand (same sand used through-out this study) was placed in a 12.7 mm ID
PVC column from 0 to 54 mm, and then from 54 to 216 mm 44.10 g of sand was placed.
Feed stock was the discharge from a previous column of the same design parameters.
Columns were operated only to 50 bed volumes to expedite the evaluation.
3.12 Sand Filtration Concept Design
Stormwater declining rate sand filtration sizing and design followed procedures
developed by Urbonas (2002) in policy guidance developed for the urban drainage and
flood control district of Denver, Colorado. The design procedure began by determining
the average event mean concentration of TSS using published USGS datasets, followed
by calculating the average annual TSS load in stormwater runoff, and next determining
the required drain time to determine filter size. The estimates for the reduction in TSS
were from literature and removal filtration rates were based on results of data in this
Reproduced with permission of the copyright owner. Further reproduction prohibited without permission.

75
study. The design concepts were developed based on work published by Logsdon et al.
(2002), Urbonas (2003), El-Taweel and Ali (2000), and Sansalone (1999).
Biological action is important in the proper function of the design of slow sand
filtration (Logsdon et al. 2002). Therefore, no chemical pretreatment was suggested in
the concept design. Sand effective size (dio) for this experiment was 0.20 mm and
uniformity coefficient 2.55, which met accepted design practices for sand filtration
(Visscher 1990). Filtration rate was determined at a minimum necessary to evacuate a
25-year storm within 12 hr.
Reproduced with permission of the copyright owner. Further reproduction prohibited without permission.

76
4. RESULTS AND DISCUSSION
4.1 OSNP Material Characterization
X-ray diffraction patterns for MCM-41 had one strong well resolved peak at
approximately 2 degree 20, two moderate peaks at 4.5 and 5.3 degrees 2 0, and two very
shallow resolved reflections between 6 and 8 degrees 20 (Figure 13). Typically only the
.&
Q: 1 2 3 4 5 6 7 8
o f 7 82 3 4 5. 620
Fig. 13. XRD Diffraction PatternsAs-synthesized (a) MCM-41 and (b) HMS diffraction patterns were similar to literature values, with a sharp dioo reflection at ca. 2 °.
Reproduced with permission of the copyright owner. Further reproduction prohibited without permission.

77
ca. 2° 20 can be observed in most cases and the others are virtually absent (Zhao et al.
1996). XRD patterns of all as synthesized forms of mesoporous molecular sieves show
five reflections at very low angles and as expected, slightly shifted left of calcined
materials (Fenelonov et al. 1999).
The HMS molecular form has one intensive reflection at 2° 20 that closely
resembled literature XRD patterns (Zhang et al. 1997). Both OSNP material diffraction
patterns showed lower ordered reflections and agreed with as synthesized reports by Zhao
et al. (1998), Jaroniec et al. (2001), and Yokoi et al. (2004). Using Bragge (Equation 14)
for the sharp dioo reflection for both OSNP materials a pore spacing of ca. 43 A can be
calculated (Figure 14). This is typical spacing compared to literature values.
%
% J€ ;
Fig. 14. Schematic Representation of OSNP Material StructureInternal structure of OSNP materials consist of ordered arrays of cylindrical mesopores.
o o
The dioo pore spacing ca. 38 A and ao hexagonal unit cell spacing ca. 43 A for a reflection at 2° 20. Cartoon from Fenelonov et al. (1999).
As synthesized materials retain the surfactant organic chain, which have been shown to
be strong micelle expanders (Sayari and Yang 1999). Fenelonov et al. (1999) estimated
Reproduced with permission of the copyright owner. Further reproduction prohibited without permission.

78
Si OSNP materials prepared by methods published by Beck et al. (1992) and, Feuston
and Higgins (1994) had a pore wall thickness (PWT) from 5.5 to 8.4 A. Using a nominal
value for PWT = 7.0 A, the pore size (PS) for the OSNP materials of this study may be
estimated by PS = ao - PWT = 43 - 7.0 = 36 A. The XRD patterns for MCM-41 dioo
reflection, with additional 1 1 0 , 2 0 0 and 2 1 0 reflections, indicate a long-range ordered
hexagonal framework.
Transmission electron microscopy (TEM) of both materials are depicted in Figure
15. HMS structure is hexagonal with “worm” irregular pore openings and MCM-41
shows hexagonal arrays of uniform honeycomb openings. The micrographs
Fig. 15. Transmission Electron Micrographs(a) HMS and (b) MCM-41 with estimated pore openings of 39 A and 36 A, respectively. MCM-41 TEM was similar to Jaroniec et al. (2001).
o
clearly show a 35 to 39 A pore opening. The morphology of HMS depicts a repeating
worm hole and MCM-41 a honeycomb hexagonal porous structure as reported in the
Reproduced with permission of the copyright owner. Further reproduction prohibited without permission.

79
literature (Mokaya et al. 2000; Muroyama et al. 2006; Pauwels et al. 2001; Yokoi et al.
2004).
SEM morphology reflected a crystalline structure with expected formula weights.
For example, MCM-41 was for C - 23%, O - 15%, N - 19% and Si - 43%.
Magnification at x2700 provided some observable morphological characteristics although
the focus could not be optimized (Figure 16). These morphological characteristics were
similar to SEM results reported by Huang (2000) and Mokaya et al. (2000), who reported
sub-micrometer sized free standing agglomerates of curved hexagonal rods with
dimensions 5 to 15 pm.
Fig. 16. SEM Micrographs MCM-41The arrow points to a curved hexagonal rod approximately 7 pm in length.
Fourier transform infrared spectroscopy (FTIR) was used to evaluate vibration
frequency shifts in the functional moieties. Fundamental frequency peaks for OSNP
materials before and after exposure to lead (II) ions are illustrated in Table 16. Peaks had
Reproduced with permission of the copyright owner. Further reproduction prohibited without permission.

minor shifts in wave numbers after lead sorption. Most likely this phenomenon was due
to the interaction between lead ions and other functional groups. However, these band
shifts may reflect the effect of the heavier lead ions on vibration frequencies, and the fact
stronger bonds usually vibrate faster than weaker bonds (Skoog et al, 1998). The
adsorbed lead ions interacted more strongly within HMS than MCM-41. This could
imply lead ions in HMS are more closely associated with the external OSNP material
structure than MCM-41, and may explain a reduced performance at high ionic strength.
Table 16. FTIR Frequency of HMS and MCM-41 OSNP Materials Frequency units - cm'1; s = strong peak, m = moderate peak, and w - weak peak.
FunctionalMoiety
VibrationCharacteristic HMS HMS
w/ Pb2+ MCM-41 MCM-41w/Pb2+
c h 2Asymmetric
stretch 2912 s 2897 s 2911 s 2906 s
c h 2Symmetric
stretch 2843 m 2833 m 2840 m 2838 m
C—Nc —c h 2
Scissor bending 1457 m 1441 m 1458 m 1468 m
C—N Stretch 1 2 2 1 s 1206 s 1194 s 1199 s
Si-O—Si Asymmetricstretch 1049 s 1048 s 1025 s 1023 s
c h 2 Rocking 773 w 766 w 764 w 758 w
Reproduced with permission of the copyright owner. Further reproduction prohibited without permission.

81
4.2 OSNP Material Selection
Batch reactions of 21 OSNP materials of various silica-based templates were
screened to select the most effective lead (II) ion adsorbent to use in the column studies.
The phosphorus and amine functionalized OSNP materials were the best adsorbents in
batch reactions (Figure 17). Thiol functionalization has been found effective mercury (II)
ion selective adsorbents, but not for lead (II) ions (Brown et al. 1999). Mercier and
Pb2+(mg/L)
1200
1000
800
600
400 -
200 -
1054 1038
1015983
841836
>671 637
583
845
0.4 0.3 0.10.3 0.1 0.02
t 1 r 1 r
T T T T T H T H E T H T H A A A A A A A P C
Functionalization
Fig. 17. OSNP Adsorption by FunctionalizationFunctionalization is T = thiol; H - R-OH; E = R-O-R; A = R-NH2 and P = phosphorus. C was control using Pb(N0 3 )2 .as lead (II) ion adsorbate.
Reproduced with permission of the copyright owner. Further reproduction prohibited without permission.
4

82
Pinnavaia (1998) found hydroxyl sites could be congested increasing steric hindrance,
and reducing pore diameter and volumes that resulted in poor heavy metal sorbance. The
ether functionalization has also been reported as not effective for lead (II) adsorption
(Zhang et al. 2003). Phosphorus functionalized OSNP lead (II) adsorption was excellent,
however because of potential release of this nutrient to discharge streams adverse impacts
to water quality could develop. Therefore, phosphorus functionalization was not selected
for further study. Additionally, the 40% amine functionalization performed nearly as
well as the phosphorus moiety. The amine functionalized material removed above 90%
of lead (II) ion and in 5 of 7 amine formulations > 99% lead (II) ion was removed.
The distribution coefficient (K d) was used as a comparative tool to evaluate
sorption of materials following the method by Stumm (1992). Table 17 depicts the 24 h
and 7 d Kd of the five amine-functionalized materials. The distribution coefficient ratio
Kq = Cs / Cw (L/g); where Cs = concentration of the adsorbate adsorbed per unit mass of
solid (mg/g) and Cw is the concentration of the adsorbate remaining in solution at
equilibrium (mg/mL). The distribution coefficient is only valid for the particular
Table 17. Distribution Coefficients for Amine Functionalized Materials Reference number is same as Table 11. 5 g OSNP materials were added to 50 mL of adsorbate at [Pb2+] = 1,000 mg/L resulting in concentrations shown at 24 h and 7 d. 24 h average Kd = 51.5 L/g (SD = 26.3) and 7 d average Kd = 73.7 L/g (SD = 40.5)
Sample ID (Reference no.)
[Pb1+] [Pb2+] Kd (L/g) Kd (L/g)(Pg/L) (24 h)
(Pg/L) (7 d)
(24 h) (7 d)
A (19) 255 79 39.2 126.6B (20) 125 109 80.0 91.7C (17) 126 119 79.4 84.0D ( 1 2 ) 284 260 35.2 38.4E (18) 417 358 24.0 28.0
Reproduced with permission of the copyright owner. Further reproduction prohibited without permission.

83
reaction computed and only for that temperature and conditions. In simple terms the
distribution coefficient calculated herein is the ratio of the sorbed species to the dissolved
species and is most valuable for comparison within this study, but these results may not
be of value to compare with other studies with different parameters. While this
computation does not respond directly to variations in pH, ionic strength or temperature,
it does provide an indirect qualitative measurement of the effects of these parameters.
The distribution coefficient calculation for the material reference item 20 at 24 h
was as follows:
Cs = { [ (1,000 - 0.125) mg / L] }*0 .05L /5g = lOmg/g
Cw = 0.125 mg/L * L / 1000 mL - 0.000125 mg/mL
Kd - Cs / Cw = 10 mg/g / 0.000125 mg/mL = 79,990 mL / g = 80.0 L/g
Table 17 values appear typical and similar to values reported by Toshiyuki et al.
(2003) who computed Kd valued for amine functionalized MCM-41 adsorption of iron
and copper. Based on these data, amine functionalized material 19 was selected to use in
the column loading capacity study and to evaluate for application in the proposed in-situ
sand filtration unit.
4.3 Screening Breakthrough and Loading Capacity
Only the amine functionalized materials (reference material 19 and 20, (Table 17)
were used for the column break-through and loading capacity evaluations. For this study
break-through was defined as Ce / Co = 0.5, where Co is the influent concentration and
Ce is the effluent or equilibrium concentration. Once break-through occurred then the
adsorption or loading capacity of the material was estimated at that bed volume.
Reproduced with permission of the copyright owner. Further reproduction prohibited without permission.

84
The process used a standard solution of 5 mg Pb/mL in 0.200 mL aliquots with
0.100 g adsorbent. Plumbtesmo® test paper was used to ascertain breakthrough at 50 mg
Pb/L. Material reference number 19 lead (II) ion capacity = 39 mg/g (0.19 mmol Pb /g)
and material number 20 = 10 mg/g (0.05 mmol Pb/g). These adsorption amounts are
comparable to values reported by Xu et al. (1999) and Wright (2006) (See Table 5). The
screening procedure adequately justified the use of as synthesized amine-functionalized
material for study in the column applications.
4.4 Headloss
The headloss in the 216 mm media depth column, at a superficial velocity = 0.49
m/h, using sand only, was 36.6 cm, but with sand and OSNP material in the bottom third
of the column, headloss was 46.9 cm. This 28.1% increase, while significant, occurred at
superficial velocity that is greater than the shooting range application 0 . 2 1 m/h minimum
needed to evacuate a 25-year stormwater volume within 12 h.
Decreasing flow rate occurred over time for all columns as a result of increased
silica packing and reduced particle pore space. Gravity flow rate for the MCM-41 and
sand column changed from an initial 31.0 mL/min to 1.75 mL/min in 22.1 h. The dio =
0.20, dso = 0.46, d6o - 0.51 mm and UC = 2.55 sand used in this experiment was within
recommended slow sand filtration size (Crittenden et al. 2005). Pelletizing the OSNP
materials would improve hydraulics, however the OSNP in this experiment represented
less than 3% of media adsorbent by mass.
4.5 Leachability of OSNP Materials in Sand Filtration
There was no difference in the tap water influent and effluent turbidity of HMS (F
= 0.07, P = 0.79, n = 24) and MCM-41 (F = 0.14, P = 0.71, n = 24) materials during a 48
Reproduced with permission of the copyright owner. Further reproduction prohibited without permission.

85
d leachate evaluation period. The turbidity results were not statistically significant for
either material because of excessive variation within groups. This may have occurred
from fluctuations due to measurements at instrument detection limit.
There was a statistically significant difference in the conductivity of tap water
influent compared with HMS effluent (F = 9.85, P = 0.005, n = 24). There was no
difference in the MCM-41 effluent conductivity compared with the influent tap water
used, but this result was not statistically significant indicating the result may have simply
occurred by chance (F = 1.84, P = 0.19, n = 24). Figure 18 demonstrates graphically the
difference and similarity of conductivity results for HMS and MCM-41, respectively.
Pinnavaia (2006) reported to this author the amine moiety leached in controlled
experiments when operated at ca. 45 psi. Although a very low pressure (< 5 psi) was
applied in this study, much less than 45 psi (flow rates were from 1 to 29 mL/min),
additional research is needed to validate the leaching characteristics. Since HMS did
demonstrate some leaching characteristics, development of a polymeric binder may be
appropriate to agglomerate the materials into porous particles that would have less
leaching tendencies. Pelletization by Hartmann and Bischof (1999) was accomplished by
pressing OSNP materials in a steel die of 40 mm diameter, using a hand operated press
for 30 min. Pressures from 20 to 600 N/mm were applied to create disk that were
crushed and sieved to pellets of 0.2 to 0.3 mm.
Reproduced with permission of the copyright owner. Further reproduction prohibited without permission.

86
—*— Tap Water —o— HMS
360.0
350.0
~ 340.0
■|_ 330.0
« 320.0 a6 310.0
300.0
290.0
0 10 20 30 40 50
Time (d)
Tap Water - o - MCM-41
360.0
350.0
g* 340.0
330.0
320.0
300.0
290.0
0 10 5020 30 40
Time (d)
Fig. 18. Effluent Conductivity Values Versus Influent Tap Water
4.6 Column Optimization By Response Surface Methods
Before column studies were conducted operating conditions were optimized. This
approach ensures enhanced sorption performance while conducting the experiment.
Results of RSM analysis 23 fractional factorial runs are depicted in Table 18. The coded
Reproduced with permission of the copyright owner. Further reproduction prohibited without permission.

87
factors are the minimum and maximum range operating conditions of the experiments
and quantities explained in the Methods section (Table 14). The method published by
Montgomery (2005) was used to calculate the main and interaction effects. Computation
details follow with an explanation of the development of the optimization column
parameters.
Table 18. Design Matrix in Geometric Notation
Sixteen columns were prepared to provide a replicate for each run. Factor A = OSNP Material Amount; 2 - 10 % (w/w); Factor B = Media Bed Depth : 200 - 400 mm, and Factor C = Filtration Rate: 2 -20 mL/min. Replicate 1 sample was collected at BV = 2 to 24 and replicate 2 was collected at BV = 8 to 61.
Run Code Factor A
Code Factor B
Code Factor C
Replicate 1 ([Pb2+]
....JUg/L)
Replicate([Pb2+](Pg/L)
1 - 1 - 1 - 1 26.08 51.802 + 1 - 1 - 1 22.06 28.983 - 1 + 1 - 1 84.91 65.014 + 1 + 1 - 1 24.66 33.605 - 1 - 1 + 1 82.38 43.946 + 1 - 1 + 1 70.31 163.957 - 1 + 1 + 1 77.92 88.448 + 1 + 1 + 1 88.15 83.44
By convention the labels, main effects, two-factor and three-factor interactions are
evaluated to ascertain the parameter that has the most influence on performance. From
Table 18, replicate 1 and 2 are summed to provide totals to examine the treatment
combinations. For model run 1 the replicate total = 26.08 + 51.80 = 77.88 pg/'L. Table
19 reflects the results with labels and Figure 19 the labeling convention in 3-dimensional
geometric cube format. Totals were computed for each condition, a sum of the averages
or grand average calculated, and reference numbers assigned using common terminology
Reproduced with permission of the copyright owner. Further reproduction prohibited without permission.

88
Table 19. Adsorption Treatment Combinations and RSM Labels
Run Replicate Total (fig/L)
Labels
1 77.88 (1 )2 51.04 a3 149.92 b4 58.26 ab5 126.32 c6 234.26 ac7 166.36 be8 171.59 abc
Cl)
ac
ajbc1
Ffationtate
Media Bed-Deptha , /
-% OSXP-*
Fig. 19. 2 Factorial Design Labels
and assignment conventions for design of experiment RSM. Next, the factor affects were
estimated, the sum of the squares computed, total sum of the squares, and the percentage
contribution of each model term to the total sum of the squares. Finally the regression
model was estimated following the generalized formula:
y = Po + Pi Xi + Pj Xj +P ij X; Xj ( 18)
Where po = Regression coefficient for grand average / number of replicatespi = Regression coefficient for parameter causing maximum factor affect / 2 (2 is
for 2 levels)Pj = Regression coefficient for parameter causing second largest factor affect / 2 Pij = Regression coefficient for interaction parameter causing the largest factor
affect / 2
x; = Coded variable for parameter with maximum affectXj = Coded variable for parameter with second largest maximum affecty = Model output; for this study; concentration of total lead (II) ions
This model includes only the first three factors causing the maximum affect and assumes
the first two are primary factors and the third is an interaction parameter. The model was
Reproduced with permission of the copyright owner. Further reproduction prohibited without permission.

89
expanded to other factor interactions to represent the significant contributions of all main
and interaction effects as necessary.
The sum of the squares is computed for each parameter and parameter interaction
to enable evaluation of the deterministic variables. This was done by taking the square of
the contrast between the high and low levels divided by four times the number of
replicates. The contrast is computed for each parameter and each parameters interaction
with each other parameter. For example, to compute the factor effects and influence of
parameter A the high and low values are contrasted and divided by 8 (4 items x 2
replicates) as follows: A = (1 / 4*n )* [(a + ac + abc + ab) - (c + be + ( 1 ) + b)] = (1 / 8 )*
[(a + ac + abc + ab) - (c + be + (1 ) + b)]. The effects of other parameters were estimated
similarly followed by computation of the sums of squares. The results are shown below.
Table 20. Factor Effect SummarySummary of the effects of A - Percent OSNP, B - media depth, and C - filtration rate on lead (II) ion adsorption performance.
Factor EffectEstimate
Sum of Squares
PercentContribution
A 39.14 3678.60 7.78B -26.79 1722.43 3.64C 68.06 11120.43 23.52
AB -57.70 7992.44 16.91AC 58.26 8150.05 17.24BC -44.94 4848.19 10.26
ABC -40.72 3981.02 8.42Error 5782.14 12.23
The total sum of the squares is: S S t= X Yij2 - [(X yy)2 / 8n]; i = 1 — 8; j — 1 — 2
resulting in S S t= 47275.30; and the error sum is computed as: SSe = SST- SSa -SSb -
SSC - SSab - SSAC - SSBC - SSabc- Substituting values: SSE = 47275.30 -3678.60 -
Reproduced with permission of the copyright owner. Further reproduction prohibited without permission.

90
1722.43-11120.43-7992.44-8150.05-4848.19-3981.02 =5782.14. The
summarized results are provided in the following table with estimated P-values.
Table 21. Analysis of Variance Summary for Dual-Media Filter The model explained 87.8% of the variation in the results with a 91% confidence this result did not occur by chance. The filter bed depth was not statistically significant, however this parameter had the least affect on the model.________________ ____
Item Sum of Squares DF Mean Fo upSquare value
Model 14213.85 7 2030.55 2.81 0.0856A Percent OSNP 3678.60 1 ~ 3678.60 5.09 0.0541B Filter Bed Depth 1722.43 1 1722.43 2.38 0.1612C Filtration Rate 11120.43 1 11120.43 15.39 0.0044AB interaction 7992.44 1 7992.44 11.06 0.0105AC interaction 8150.05 1 8150.05 11.28 0 . 0 1 0 0
BC interaction 4848.19 1 4848.19 6.71 0.0321ABC interaction 3981.02 1 3981.02 5.51 0.0469Error 5782.14 8 722.77Total 47275.30 15
The ANOVA suggests C - filtration rate, was the dominant process explaining
23.52% (100* 11120.43 / 47275.30) of the variation, followed by the interaction between
AC (percent OSNP and filtration rate) and then the interaction between AB - percent
OSNP and filter depth. Therefore, using the factor effect values from Table 20 the
regression model and response surface can be represented by Equation 18.
The regression coefficients were adjusted by one-half since the regression
coefficient measures the effect of a unit change in x on the mean of y and the effect
estimate is based on a two-unit change (from - 1 to +1). In the equation, xi represents the
variable for parameter A or percent OSNP, xj represents the parameter B or media depth,
X3 represents the variable for parameter C or filtration rate, and variable X1X3 represents
the parameter interaction AC or percent OSNP and filtration rate. Taking into
Reproduced with permission of the copyright owner. Further reproduction prohibited without permission.

91
consideration filtration rate (C), and the interaction between AC, AB, and BC from 20,
the regression model (Equation 18) takes the following form.
y = Grand Average + (A/2)*xi + (A*C/2)*xi X3 + (A*B/2)*xiX2 + (B*C/2 )*X2X3 (19)
The ANOVA yielded coefficients for coded variables for A = -0.3325, B = 3.5393
and C = 22.5894. These values represent the direction of steepest descent in terms of
coded variables or more precisely the direction of the vector:
8 Y / 3 A , d Y / S B , d Y / dC
The increment for each coded variable was then calculated by the proportional partial
differentials:
AA = AC * (dY / 0A) / (dY / dC) AB = AC * (dY / 8B) / (dY / 0C) (20)
The increment for each coded variable was calculated as: AA = +1 * -0.333 /
22.589 = -0.0147 and AB = +1 * 3.539 / 22.589 = 0.1568. The coded variables were then
translated into actual values for each parameter as follows:
Percent OSNP = [(max - min) / 2 ] * AA = [(10 - 3)/2]*-0.01472 = -0.05 %;
Media Bed Depth = [(max - min) / 2 ] * AB = [(400-200)/2]*0.024 = +15.7 mm; and
Filtration Rate - [(max - min) / 2 ] * AC = [(20 - 2)/2]* 1.0 = 9.0 mL/min.
These new operating conditions were established as the incremental adjustments
necessary, and the experiment was run again. The revised parameter conditions provided
a new set of results. Using the next increment, a new column was built at the new
Reproduced with permission of the copyright owner. Further reproduction prohibited without permission.

92
parameters and the experiment run again. This process continued until there was no
further improvement (decrease) in removal of lead (II) ion. The next to last experiment
represents when the theoretical optimization has been achieved.
Following the above described procedure the experiment was conducted to
optimize the model. This was accomplished and the results are in Table 22. Run #2
represented the optimum reduction for lead (II) ion in the effluent, therefore these
parameters became the optimized column design parameters. The experiment was
conducted at the optimized parameters for 2.95% w/w OSNP material, 216 mm media
bed depth and 11.0 mL/min filtration rate.
Table 22. Optimized Operating Column ParametersThe first run was selected on the response surface to begin the process. The second run was the incremental adjustment as calculated to optimize the parameters. The third run was the second increment of adjustments and found an increase in output. Run number 2 best represented the optimized operating parameters.
Run# Percent OSNP (w/w)
Filter Depth (mm)
Filtration Rate (mL/min)
[Pb2+] W L )
1 3 2 0 0 . 0 2 . 0 37.92 2.95 215.7 1 1 . 0 20.43 2.90 231.4 2 0 . 0 37.0
To improve the statistical significance of the model a natural log transformation was
completed. The transformed sum of the squares values are depicted in Table 23 and
normal probability and residual plots at Figures 20 and 21.
Reproduced with permission of the copyright owner. Further reproduction prohibited without permission.

93
Table 23. Log Normal Transformed ANOVAThe Model F-value of 5.21 implies the model is significant. There is only a 1.67% chance that a "Model F-Value" this large could occur due to noise. P values < 0.0500 indicate model terms are significant. In this case C, AB, AC, BC, ABC are significant model terms. P values > 0.1000 indicate the model terms are not significant.
Factors Sum of Squares
df MeanSquare
F value p-value
Model 4.23 7 0.60 5.21 0.0167A-OSNP Material 0.52 1 0.52 4.46 0.0678B-Bed Depth 0 . 2 0 1 0 . 2 0 1.75 0 . 2 2 2 0
C-Filtration Rate 3.05 3.05 26.28 0.0009AB 1.79 1 1.79 15.44 0.0044AC 2.15 2.15 18.52 0.0026BC 1.16 1 1.16 1 0 . 0 2 0.0133ABC 0.84 1 0.84 7.21 0.0277
Pure Error 0.93 8 0 . 1 2
Cor Total 5.16 15
'A
Ln([Pfa'- j - 0.21)
SB —
£3,
W'*r=
Fig. 20. Model Normal Percent Probability Plot
Reproduced with permission of the copyright owner. Further reproduction prohibited without permission.

Pred
icte
d
94
5.10 -
3.53
3.08 3.59 5.104.59
Actaa!
Fig. 21. Model Predicted Versus Actual Plot
The final transformed equation in terms of coded factors became:
Ln([Pb2+]-0.21 = 4.3088442 + 0.232131 * A -0.145615 * B + 0.6960257 * C - 0.432103
* A * B + 0.582931 * A * C - 0.429786 * B * C - 0.364659 * A* B * C
The final transformed equation in terms of actual factors was:
Ln([Pb2+]-0.21 = 3.3618175 -0.17981 * OSNP Material + 0.0033873 * Bed Depth -
0.1611629 * Filtration Rate + 0.000105 * OSNP Material * Bed Depth + 0.0685008 *
OSNP Material * Filtration Rate + 0.0003535 * Bed Depth * Filtration Rate - 0.000149 *
OSNP Material * Bed Depth * Filtration Rate. With the regression model developed the
Reproduced with permission of the copyright owner. Further reproduction prohibited without permission.

95
performance of the proposed filtration was used to develop a 3-dimensional
representation of the response surface (Figure 22).
To evaluate the linearity of the model various points of the three factors were
selected and compared to model predicted values from the response surface. An OSNP
percent w/w of 13.5%, a filtration rate of 11.0 mL/min and media depth of 300 mm were
selected to validate the linearity of the response surface. A 13.5% OSNP material
percentage was intentionally selected to evaluate whether the model prediction would be
correct considering the apparent outlier at 10% OSNP material and 200 mm media depth.
The column was operated until approximately 100 BV and predicted versus measured
values compared. The 5-sample points average was within 0.6 relative percent difference
to the predicted value indicating a linear model could apply to the surface (Table 24).
Table 24. Mid-Point RMS Model Linearity ValidationLinearity check set percent OSNP material = 13.5%, filtration rate =11.0 mL/min and media depth = 300 mm. Metal analysis was by GFAA with RSD < 2.4 for all samples.
Bed Volume Predicted tPb2*] (W5/L)
Measured [Pb2+] (Hg/L)
ResidualRelativePercent
Difference27 309 127 -182 83.243 309 405 96 26.945 309 355 46 13.869 309 243 - 6 6 24.174 309 407 98 27.2
Average 309 307 - 2 0 . 6
Reproduced with permission of the copyright owner. Further reproduction prohibited without permission.

Reproduced with
permission
of the copyright owner.
Further reproduction prohibited
without permission.
310.0
242.5
175.0
40.
10.00
8.25
4-75 A: OSNP Material (° o w/w)
400350
300210
Fig. 22. Response Surface ModelTransformed RSM representing 3 parameter variables: filtration rate, bed depth and percent OSNP material (w/w). Filtration rate setat 11.0 mL/min for this model surface. Apparent outlier result at 10 % OSNP Material and 200 mm was included in the model. e*

97
With the model developed various operating condition scenarios to evaluate
operational effects were performed. With a constant percent mass OSNP material
amendment and by varying the filtration rate and media depth a series of points were
predicted for the sand filtration system (Figure 23).
60 -
+Media depth:
—•— 300 mm
—□— 2 0 0 mm
A - 100 mm
■A'2 0 -
0 5 10 15 20 25
Filtration Rate (mL/min)
Fig. 23. RSM Model Predictions at Constant OSNP Material AmendmentOSNP material set at 3.0 % w/w amendment to filter. All computed values are withinmodel linear range.
From Figure 23 with a maximum operational filtration rate of 10 mL/min or 4.74
m3/m2 h loading rate for the test column, and at 300 mm, the predicted total lead (II) ion
concentration at discharge would be ca. 65 pg/L. This provides a 57% safety factor for
the shooting range that has a storm water permit limit of 150 pg/L total lead (II). The
model predicts the intuitive conclusion that operation at a lower filtration rate, i.e.
Reproduced with permission of the copyright owner. Further reproduction prohibited without permission.

98
increased adsorbent and adsorbate contact time, should yield better results. Hence,
operation of the system by gravity flow would be appropriate. Further experiments were
conducted at optimized flow rates (11.0 mL/min) and at gravity flow rates. Section 4.8
below discusses the scale up plan for the full size filtration unit.
4.7 Isotherms, Influence of pH and Competitive Ions
4.7.1. Adsorption Isotherm
Freundlich and Langmuir coefficients for batch reactions for HMS and MCM-41
materials are shown in Table 25. The Freundlich coefficient Kf and Langmuir coefficient
Xm expresses the adsorption capacity of the adsorbent. Xu et al. (1999) has reported 3.18
mg (0.02 mmol/g) lead (II)/g maximum adsorption of Ti-MCM-41 with lead (II) removal
efficiencies of 63.6% for 1:500 g/mL ratio of Ti-MCM-41 to adsorbate. By comparison
Reed et al. (2000) has reported Xm = 3.06 mg/g (0.015 mmol/g) for virgin GAC and 4.35
mg/g (0.021 mmol/g) Fe-GAC in batch reactions with 1 mg/L Pb(N0 3 ) 2 adsorbate.
Table 25. Freundlich and Langmuir ParametersEquations for batch reaction isotherms were presented in Section 2.8, Mass Transfer Adsorption Theory. All reactions were conducted at pH range of 5.8 to 7.1 and T = 20 ± 3C. Adsorbate solution = 1017 pg Pb2+/L (RSD = 3.1, n=6 ).
OSNPMaterial
Langmuir (Fig. 24 and Fig. 25)
Freundlich (Fig. 26)
(mg/g)k l
(L/mg) r2Kf
(mg/g) 1 /n r2
HMS 1.28 1.56 0.94 0.94 0.17 0.99
MCM-41 1.29 0.29 0.98 1.14 0.14 0.99
Reproduced with permission of the copyright owner. Further reproduction prohibited without permission.

99
2.0
HMS
i i
5? 1.2bp
& 0.8
0.4
0.00.4 0.5 0.60.0 0.1 0.2 0.3
Ce (mg/L)
MCM-412.0
1.6
1.2
0.8
0.4
0.00.60 0.1 0.2 0.3 0.4 0.5
Ce (mg/L)
Fig. 24. Adsorption Isotherm Lead (II) Ions on OSNP Materials Lines were hand drawn to represent Langmuir isotherms.
There was moderate agreement between the Freundlich and Langmuir models for
MCM-41 (RPD = 12.3 %), but not for HMS (RPD = 30.6%). There are differences
between the two models as discussed earlier. The Langmuir isotherm assumes
Reproduced with permission of the copyright owner. Further reproduction prohibited without permission.

100
0.6
HMS Langmuir0.5
y= 0.7783x+ 0.0005 R2 = 0.9408
0.4
© 0.3<D° 0.2
0 0.6 0.70.1 0.2 0.3 0.4 0.5
Ce (mg/L)
0.6MCM-41 Langmuir
0.5y=0.7749x + 0.0027
R2 = 0.9844~ 0.4
Non-zero data point
0.1
0.70.60 0.1 0.2 0.3 0.4 0.5
Ce (mg/L)
Fig. 25. Langmuir Adsorption Isotherm Coefficients Plots
Reproduced with permission of the copyright owner. Further reproduction prohibited without permission.

101
qe Log(qe) y = 0.1692x - 0.0262
(mg-'g) R., = 0.9982HMS Freutidich.4.0 0.6 -I
3.2 0.5
2.S
2 . 0
6
13 0 .1 -
0.0 0-023 3.02 . 0
158 251 V8 o i l 1000
qe LovCq »
(“ S-g)
5.0 0.7 -| MCM-41 FreimdKch.
4.0 0.6. = 0.I392X + 0,0571
3.2 0.5
2.5 0.4
6 0.2
1.3 0.1
0 . 0
3,62 . t 4.0
100 251 631 15s5 39ft 10000
Fig. 26. Freundlich Adsorption Isotherm Coefficient Plots
Log Ce
Ce ( \ i LJ
Log (Ce)
CtKjxgs)
Reproduced with permission of the copyright owner. Further reproduction prohibited without permission.

102
monolayer adsorption, surface homogeneity, no lateral interaction between adsorbate
molecules, and adsorbate molecules do not diffuse to other binding sites after first
attachment. The Freundlich equation is an empirical model designed to represent a
heterogeneous system.
The Langmuir constant KL relates the affinity or strength of attraction between the
adsorbate and adsorbent. The Freundlich coefficients also relate to capacity and
adsorption intensity. A Freundlich value 1/n < 1 indicates a favorable adsorption and
increasing capacity (Juang et al. 2006). MCM-41 adsorption maximum had favorable
adsorption and comparable Freundlich 1/n values to Wright (2006), Xu et al. (1999) and
Zhang (2003). HMS had more favorable strength of attraction to lead (II) ions in the
competing ion environment. A qualitative discussion of this response behavior follows in
section 4.7.3.
4.7.2. Influence of pH
The effects of pH are depicted in Figure 27. Lead (II) ion removal increased to
ca. pH = 6 , after which a sharp drop in adsorption began at ca. pH > 7.5. An explanation
for the decreased adsorption at higher pH ca. 6 may simply be the availability of
hydrolysis products. Hydrolysis products, such as Pb(OH)+, Pb(OH)2 , Pb(OH)3_, and
Pb(OH)4 2' would have increased at higher pH, but these complexes with negative charges
are difficult to adsorb by negatively charged OSNP material edges. Further, as illustrated
at Fig. 7 and Fig 8 , as the pH increases above ca 6.5 the concentration of free lead (II)
ions available to adsorb is decreased, and the amount of lead (II) ions that could be
precipitated would be more. This same phenomenon was reported by Xu et al. (1999)
who experienced a similar pH response curve to lead (II) ion adsorption on Ti-MCM-41.
Reproduced with permission of the copyright owner. Further reproduction prohibited without permission.

103
80
70 -
60 -
| 50-
I 40 -
20 - + MCM-41
1 0 - ■e- HMS0
0 2 4 6 8 1 0 1 2
pH
Fig. 27. Effect of pH on Lead (II) Ions Removed in Matrix Solution Matrix solution 7 with cations used for batch reactions. Initial [Pb2+] = 1017.3 pg/L (RSD = 3.1, n = 4). Average mass of MCM-41 = 26.8 mg (SD = 1.65, n = 7) and HMS = 26.3 mg (SD = 1.05, n = 5). Conductivity of adsorbate solutions was 2721.6 to 905.1 ps/cm at pH 2.36 to 7.43, respectively. Results are average of triplicate analysis by GFAA with RSD < 5.0.
Lead (II) adsorption capacity at each pH value is summarized in Table 26. HMS
seemed to be less impacted by competing ions than MCM-41, and adsorbed more lead
(II) ions at all, but pH = 11.03, but this was not statistically significant (P = 0.22, n = 15).
MCM-41 with the tri-methyl amine moiety would have 3 times the proton exchange sites
than HMS, assuming equal alkyl chain lengths. Therefore, MCM-41 would be more
susceptible to the presence of competing ions or increased solution ionic strength. The
maximum adsorption capacity occurs at a pH range of ca. 7, which is within shooting
range storm waters pH of 5.1 to 8.7 (See Table 7).
Reproduced with permission of the copyright owner. Further reproduction prohibited without permission.

104
Table 26. Adsorption Capacity at Specific pHMCM-41 adsorbent = 0.025 mg (SD = 123, n = 5) and HMS = 0.025 mg (SD = 123, n = 5) in 25 mL of [Pb2+] = 1017.3 pg/L (RSD = 3.1, n = 4) with concentrations of twelve other cations in solution as in Table 12, see the column labeled, “Batch Adsorbate.” Optimum adsorption was at pH - 5.7 to 7.4.
MCM-41 HMSpH Adsorption (mg/g) pH Adsorption (mg/g)3.03 0.43 3.18 0.515.67 0.56 4.02 0.607.08 0.27 7.08 0.697.43 0.60 7.43 0.8311.03 0.50 11.08 0.40
4.7.3. Influence of Competitive Ions
To evaluate the effect of competitive ions, 7 matrix solutions were prepared with
increasing numbers of cations added at concentrations anticipated in shooting range
outfall stormwaters (Table 15). The cation concentrations were added to reflect the
expected field concentrations. This approach, while realistic, made the evaluation of
specific cation interference less obvious because cation concentrations were not equal.
Characteristics of matrix adsorbate solutions are found in Table 27. The following two
paragraphs provide a summary of the results, followed by a more thorough qualitative
discussion of results observed using hard soft acid base principles.
Distribution coefficients (K d) for each matrix solution were calculated by
Equation 8 . Figure 28 shows MCM-41 was not an effective adsorbent of lead (II) ion in
adsorbate solution until matrix 6 . Matrix 1 through 4 cations Mo, Ni, Sn, Sb, Mn, Cr, Cu,
Zn, and Fe, may complex with solution species preferentially excluding lead (II) ion
adsorption on MCM-41 surfaces. However, with the addition of Na at Matrix 6 , sodium
hydroxyl and other complexions were more likely formed at MCM-41 surface sites,
Reproduced with permission of the copyright owner. Further reproduction prohibited without permission.

105
et al. (2005) who reported Na cations did not interfere with Ni adsorption on amino-
functionalized MCM-41, unless Cu or Co were present at which
Table 27. Batch Matrix Solution CharacteristicsAll solutions were prepared using DIH 2 O and Environmental Express 1,000 ± 3 pg/mL in 2% HNO3 standard solutions (Mt Pleasant, SC). Metal analysis was by GFAA. pH adjustments were made with 0.2M NaOH. All values are averages of triplicates with RSD <10%. Batch reactions were completed using solutions with final pH as shown.
Matrix InitialpH
Cond. at initial
pH (ps/cm)
ReactionpH
Cond. at Final
pH(ps/cm)
[Pb2+](figL)
1 5.53 10.3 7.54 33.1 5902 5.18 11.4 7.30 32.1 6963 5.08 15.5 7.67 30.0 6594 3.81 48.6 7.43 69.3 7365 3.19 277.2 7.44 144.8 7786 2.82 792.4 7.03 337.2 7807 2.36 2721.6 7.43 905.1 911
Cond. = Conductivity
MCM-41 adsorption efficiency was decreased. Any analyte in the matrix with a higher
formation constant would be retained preferentially.
When a significant concentration of Ca2+ ions were added at matrix 7, the MCM-
41 lead (II) adsorption decreased. Calcium may have preferentially formed covalent
bonds with hydroxyl ions and would tend to increase solution pH. Fewer surface sites
were available for lead (II) ion adsorption. Lead precipitate complexes likely formed
(e.g. Pb(OH)2 ) further reducing available lead (II) ion adsorption by OSNP materials A
strong dependence on competing ions would suggest an outer-sphere complexation and
electrostatic bonding (Stumm, 1992).
HMS performed better in the competing ion condition than MCM-41, but also
experienced a similar adsorption decline when the Ca cation was added. This difference
in performance may be understood by noting the 1:3 ratio of HMS protons to MCM-41
Reproduced with permission of the copyright owner. Further reproduction prohibited without permission.

106
protons in the OSNP material amine head group (Figure 3 and Figure 4). Fewer available
protons would mean HMS is less influenced by competing ion hydrolysis and cation
complexations. The Ca cation is more electropositive and may have preferential protone
exchange reaction than other cations, contributing to the decrease in adsorption
performance by OSNP materials. This preference for protons and hydroxyl formations
simply out compete the metal cations in solution for OSNP material adsorbent surface
sites.
Hohl and Stumm (1976), Davis and Leckie. (1978) and Xu et al. (1999) measured
the number of protons released when lead (II) ions bind to heavy metals. Xu et al. (1999)
reported when Ti-MCM-41 adsorbed lead (II) ions, 1.5 to 1.7 protons were released, on
average.
From Figure 28 HMS materials were less impacted by competing ions than
MCM-41. In addition to the argument presented above, this may be rationalized by
observing the structure of aminopropyl ftmctionalized HMS material (Figure 29). HMS
is significantly different structurally to MCM-41. Zhang et al. (1997) has shown that the
textural mesoporosity of HMS, which can be controlled by the choice of synthesis
solvent, greatly facilitates access to the framework mesopores. Steric hindrance and
Reproduced with permission of the copyright owner. Further reproduction prohibited without permission.

107
(a)
6000
5000
-5?h-la
2000
■ HMS o MCM-41
-■
l■
■1 1
5 o O O (o-
2 3 4 5
Matrix
o
o
(b)60
6000 5000 -
4000 3000 H 2000
1000
0
-1000
HMS O MCM-41
- 6 200 400 600
Conductivity (ps/cm)
800 1000
Fig. 28. Lead (II) Distribution Coefficients in Batch ReactionsAverage pH for all matrix batch solutions = 7.32 (SD = 0.24, n = 7) in 25 mL of 748.2 pg Pb2+/L (SD = 125.7, n = 7) using an average 0.0257 g MCM-41 (SD = 0.0031, n = 7) and 0.0251 g HMS (SD = 0.0007, n = 7) of OSNP adsorbate. Matrix constituents and concentrations are in Table 12 and Table 15. Chart (a) is by matrix category and chart (b) by conductivity. All samples were analyzed in triplicate by GFAA with RSD < 5.0.
Reproduced with permission of the copyright owner. Further reproduction prohibited without permission.

108
electrostatic interference is avoided through a decreased head group size that leads to an
increase radius of curvature and to larger micelle size. In contrast MCM-41 with the
trimethyl-head-group or increased head-group size, leads to a decrease in the radius of
curvature and to a reduction in micelle size, and less electrostatic access (Figure 29).
•Nw/vww*
S' * i NH HJN I L h »
H h^ hhV
teSi O Oo H
H ^O e" 5
H»Nm.* '
H aOH^
° xs r t \ .v\'Si-
O
m E °CHS 'KaaaN *CHj O
«» HCH,CS, H
,C S .
M\\
OM - „-vHO1 t%H
(a) (b)
Fig. 29. Silicate Surfactant MesostructureNanoporous hexagonal mesoporous structure Lewis structure after Zhang et al. (1997) and Tanev and Pinnavaia (1996). (a) HMS. (b) MCM-41; Not all methyl groups are shown. The darkened tear drops are surfactant amine head group unpaired lone electrons that participate in hydrogen bonding with the silicate moiety.
MCM-41 possesses both hydrophobic and hydrophilic properties, but a greater
tendency to hydrophobic characteristics. This allows hydrolysis to be the primary
sorption phase in its meso-pores in competitive ionic solutions. This reaction
phenomenon suggests the adsorption of lead (II) ions includes bidentate surface
complexing and surface hydrolysis with hydroxyl moieties. Isomorphous substitution by
other metals (e.g. Al) MCM-41 can improve the hydrophilic characteristic (Zhao et al.
1996).
Reproduced with permission of the copyright owner. Further reproduction prohibited without permission.

109
4.7.4. Qualitative Discussion On OSNP Adsorption in Batch Reactions
The following provides a qualitative argument, in addition to the previous
discussion, for the response pattern observed in Figure 28. Hard soft acid base (HSAB)
principles would suggest there is a preference or order that an individual cation bonds
with a particular ligand before another. This order of stability is determined primarily by
electrostatic forces and offers some interpretation of the adsorption behavior of OSNP
materials in batch reactions.
HSAB would predict the formation constant for a metal M3+ to be greater than a
M2+ due its larger charge density. Said a different way, the formation constant is
basically determined by the charge of the metal ion. In a generalization of the HSAB
chemistry, cations have a preferred bonding order between ligands. The stability or
formation constant, as presented in Equation 3, then hints at the stability of the complex.
Pearson (1963) organized Lewis acids and bases into hard, borderline or soft
following the premise that hard Lewis acids prefer to bind to hard Lewis bases and soft
Lewis acids prefer to bind to soft Lewis bases. For the 13 cations of this study, Pb2+,^ i ' i t 0 4 - 0 -4 - 0 4 - *> i
Fe , Ni , Cu , Zn . Sn and Sb cations are considered borerline Lewis acids,
whereas Na+, Mg2+, Ca2+, Mo3+, Mn2+, and Cr3+ are considered hard Lewis acids.
Although not previously listed Fe3+ and Sn4+ are hard Lewis acids and could exist in the
batch solutions as follows. Ferric iron would be generated in the presence of oxygen
according to the reaction 4 Fe2+ + O2 + 4 H+ 4 Fe3+ + 2 H2 O, which would react with•3Q
hydroxyl anions to produce the very insoluble Fe(0 H) 3 (Ksp= 2.6 x 10' ). Similarly, tin
could likely exist as SnCU or Sn(OH)62'. Typically the +4 oxidation state complexes are
covalent and the + 2 mostly ionic.
Reproduced with permission of the copyright owner. Further reproduction prohibited without permission.

110
Consider matrix 1 response (Figure 28). Neither HMS or MCM-41 adsorbed lead
(II) ions. Matrix 1 cations included the nitrate salts of Pb2+, Mo2+, Ni2+ and Sn2+ at
concentrations of 4.9,27,47, and 4 pM, respectively (Table 12). Using the formation
constants from Appendix C the fraction diagram at Figure 30 can be drawn. At the
[ M ° o 4j ‘ 3t o t
t o t 3 It OT
- 2 7 .0 0 iiM 4 .9 0 iiM
[ N O , ' ] _ , - 1 0 .0 0 mM
1 . 0
PttNOi'
0 .4
0 . 2 -
0 . 0
't-V cO ' t i
[S n 2~ ]TOT = 4 .0 0 >iM[ N i2^ ]TOT - 4 7 .0 0 uM
P b (O H )-,fc )
I
pH r.54.1 0 1 2
Fig. 30. Fraction of Lead (II) Ions in Matrix 1Matrix 1 solution reaction pH = 7.54 is shown by vertical bar. Chart was made using the software application MEDUSA.
matrix reaction pH lead (II) ions would exist predominantly as the PbMo04 precipitate.
If there were any free lead (II) ions they would have been preferentially bound to CO 3 2',
and Mo per HSAB (See equilibrium equations with formation constants = 17.46,13.229,
and 15.62 for example). Therefore, the poor performance at matrix 1 may have been due
to precipitation. For analysis, although only supernatant was withdrawn from the top 5-
Reproduced with permission of the copyright owner. Further reproduction prohibited without permission.

I l l
10 mm of an equilibrated and settle 48 h solution, suspended precipitate was undoubtedly
collected. The analytical result of no lead (II) ion removal was possibly due to soluble
complexes that were formed that prevented adsorption and precipitation.
For matrix 2 a similar analysis was completed. The following figure reflects the
addition of Sb2+, Mn2+ and Cr2+ ions to the adsorbate. The same result occurred, again
due to precipitation of PbMo0 4 (See Appendix C formation constant = 15.62).
[N i2 ~]TOT = 4 7 .0 0 uM [ M o O r ' ] TOT - 2 7 .0 0 uM [Pb2'']TOT- 4 .9 0 uM[ N 0 31 to t = 1 0 .0 0 m \I
[ C r 2* ]TOT = 1 -4 0 |iM '[ M r 1 IO I = 5 .8 0 pM[SbCOH)3] TOT = 1 .20 |iM[ S n ^ ] TOT - 4 00 pM
-Pb-
0 . 2iN'O
0.0 I8
7.304 1 0 1 2
Fig. 31. Fraction of Lead (II) Ions in Matrix 2Matrix 2 solution reaction pH = 7.30 is shown by vertical bar. Chart was made using the software application MEDUSA.
Matrix 3 lead (II) ion fractions were similar to Matrix 2 with PbMo04 controlling
lead solubility for much of the pH range of interest (Figure 32). Figure 28 did show
Reproduced with permission of the copyright owner. Further reproduction prohibited without permission.

112
significant removal for HMS, but remained ineffective for MCM-41. With a primary
amine surfactant, HMS has less steric hindrance than MCM-41 (See Figure 29), and may
[Sb(OH)3]TOT “ 1.20 uM[Sii-~lTOT — 4.00 uM
T O T— 47.00 uM
[Mo04- ] TOT - 27.00 uM[Pb“-]TO ~ 4.90 iM
1.0 r
O.S -
0 . 6
0.4
0 . 2
0 . 0
[NO, 3 1 t o t “ [Zti- - ]TOT - [C^--]TOT = [C^”]TOT - [ M n - * ] T O T -
10.00 mM S2.70 |iM1.50 |iM 1.405.50 jjM
P b ( O H ) - ; ( c
u , , 0
pH 7,61
Fig. 32. Fraction of Lead (II) Ions in Matrix 3Matrix 3 solution reaction pH = 7.67 is shown by vertical bar. Chart was made using the software application MEDUSA.
have allowed easier access to the lone pair electrons on the surfactant N. This would
allow some lead (II) complexations represented in Appendix C equilibrium constants,
such as Log Knh3 = 1.5 and Log Kno3 = 1 -4. Matrix 4, 5, 6 and 7 looked very similar to
94 - 9 4 -Matrix 3. The addition of Fe (Matrix 4) and Mg (Matrix 5) had no apparent effect to
MCM-41 adsorption, and HMS lead (II) ion adsorption was only slightly less effective
than matrix 3. The species controlling lead solubility was consistently PbMoQ4.
Reproduced with permission of the copyright owner. Further reproduction prohibited without permission.

113
Lead molybdate is a poisonous white powder. During the experiment a residue of
white powder was observed at the bottom of all batch reactions. Since the OSNP
materials are also a white powder it was not apparent that this precipitate was interfering
with the experiment. The precipitation of PbMo04 likely clogged the pores of MCM-41,
which are closely packed with surfactant (Figure 29). HMS was less susceptible to this
blocking interference with only a primary aminated surfactant, and therefore able to
remove some lead(II) ions that found their way into the more open pores of HMS.
For Matrix 7 the adsorption performance of HMS and MCM-41 drastically
declined. This phenomenon may be explained by noting that Ca2+ and C032' complexes
with Mg2+ (Log K = 29.968,17.09, -19.894, -30.272, - 68.543) and Mo2+ (Log K = 7.95).
All of these complexes are precipitates and would interfere by coating the OSNP
materials to prohibit access by lead (II) ions. Calcium was added at 64 times the lead (II)
ion concentration to simulate calcareous soil stormwater runoff. In this instance
however, at pH 7.43, the Ca2+, Mg2+, and Mo2+ complexes coated the nanoporous
materials and rendered them ineffective.
The batch isotherm and pH reactions did not suffer from the PbMo04
precipitation problem as they were prepared with at an earlier time and used a different
matrix 7 batch. The initial batch reaction [Mo] = 0.1 pg/L = 0.001 pM versus the
subsequent matrix 7 batch, which had [Mo] = 26 pg/L = 27 pM. The quantity of Mo in
the lower amount was 4-orders less than the competitive ion batches and was low enough
to not influence lead (II) ion solubility.
Reproduced with permission of the copyright owner. Further reproduction prohibited without permission.

114
4.8 Lead (II) Ion Adsorption Performance in Columns
Column studies were conducted to resemble the proposed application of OSNP
materials in stormwater treatment to include start and stop flow regimes. Unlike batch
reactions where adsorbents stay in contact with the adsorbate until equilibrium is
achieved, in a dynamic column, the adsorbate is constantly flowing such that absolute
equilibrium is never achieved. However, the dynamic equilibrium at certain milestones
on the isotherm curve can provide quantifiable positions for comparison between
adsorbents or other design parameters. The sorption of metals capacity (mg/g) was
calculated using Equation 7 and column breakthrough capacities following Treybal
(1980). The distribution coefficient (L/g) was computed using Equation 8 . The column
break-through point Ce/Co = 0.5 was used for comparative purposes for breakthrough
maximum adsorption capacity and Kd.
4.8.1. Column Break Through Curves
MCM-41 break through occurred at 250 BV (13.5 h, influent pH = 6 .8 6 , flow rate
2.1 m3/m2 h). The HMS and columns were at flow rates of 0.6 m3/m2 h (reduced flow to
simulate gravity flow), and broke through with Ce/Co = 0.5 ca. at 30 BVs (83.6 h,
influent pH = 6 .8 6 ), and 15 BV (0.5 h, influent pH = 7.19) (Fig. 33). The Treybal (1980)
method was used to determine column capacities at breakthrough, but modified to use
break through bed volumes in lieu of break-through time. Equation 21, BTc =
Breakthrough capacity, is the modified form to estimate adsorption capacity and the
results are provided in Table 28.
BTc = break through BV x feed concentration / mass of adsorbent in bed (21)
Reproduced with permission of the copyright owner. Further reproduction prohibited without permission.

115
MCM-41 break-through was much later than the HMS and sand column (Figure
33). While the sand column results showed a traditional break-through curve, the MCM-
41 and HMS responses were unique and nonlinear. For MCM-41 at ca. 24 BVs, Ce/Co =
0.49 and 0.68, and for HMS at from 4 - 4 0 BV, Ce/Co ranged from 0.43 to 0.71. For
HMS this appeared to be a break-through point and the Ce/Co = 0.5 value was used to
compute the adsorption capacity. MCM-41 had good sorption to ca. BV = 250 BVs
where Ce/Co = 0.5. The two earlier values for MCM-41 at 0.49 and 0.68 may have
resulted from channeling and by-pass. They are otherwise not explainable.
Breakthrough capacities were computed for each adsorbent and are listed in Table
28. Comparison to studies by Goel et al. (2005) and Sansalone (1999) suggest the OSNP
materials are of comparable adsorption capacity accepting the fact that both studies used
had lead influent concentrations at 5 and 6 times the influent concentration of this study.
Table 28. Lead (II) Ion Adsorption Capacity for MCM-41, HMS and Sand Columns Cation concentrations are listed in Table 12 as column adsorbate. The bottom of columns to 54 mm bed height was sand (dio = 0.20 mm) and OSNP material. Sand was placed from 54 mm to 216 mm bed height for each column. All columns were 12.7 mm inside diameter clear polyvinyl chloride pipe (See Fig 12). BV = 27.4 mL. Btc = Breakthrough capacity______________________ __________________________________________
Adsorbent Influent lead (II) (Pg/L)
Break through Ce/Co = 0.5
HydraulicLoadingRate(m3/m2 h)
BedHeight(mm)
BTc(mg/g)
Reference
MCM-41HMSSand
106010601060
2503015
2 . 1
0 . 6
0 . 6
216216216
14.6272.7350.003
This study This study This study
Act. Carbon 6000 1 9 7.5 400 2.89 (Goel et al. 2005)
Sand w/ iron coated oxide 5000 2 .6 f 612 0.004* (Sansalone
1999)+ Calculated from data in referenced literaturefor comparative purposes.
Reproduced with permission of the copyright owner. Further reproduction prohibited without permission.

1161.2
MCM-410 . 8
o^ 0 . 6 O
0.4
0 . 2
0 . 0
200 400 600 800 1000 1200 1400
Bed Volume
1.2
1.0 HMS0.8o 0.6
V0.4
0.2
0.00 200 400 600 800
Bed Volume
1.2
§ 0.6u
0.4
Sand
0 . 2
0 . 0
8000 2 0 0 400 600Bed Volume
Fig. 33. Column Breakthrough Curves for Lead (II) IonsBreak through curves for (a) MCM-41 and (b) HMS and (c) sand only media at constant bed height = 216 mm. Hydraulic loading rate = 2.1 m3 /m2 h for MCM-41 and for HMS and sand = 0.6 m3/m2 h for sand. Influent [Pb2+] = 1060 pg/L (SD = 505.2, n = 11). 4.8.2. Discussion of Atypical Adsorption Isotherm for MCM-41
Reproduced with permission of the copyright owner. Further reproduction prohibited without permission.

117
The nonlinear response isotherm for MCM-41 material requires further
explanation. There are three distinct areas of response and they are shown in Figure 34.
These specialized areas of response were referred to as zone 1,2 and 3. A qualitative
discussion by response zones follows.
Zone i1..2
MCM-411.0
Q'a 0 . 6
U0.4
i-
0 2
■0,00 . 2Gu 400 600 800 1000 1200 1400
B ed Volum e
Fig. 34. MCM-41 Adsorption Isotherm by Reference Zones
Zone 1. In this zone the response adsorption is typical for MCM-41 sorption of
heavy metals and has been reported by others. Yoshitake et al. (2002) has reported
adsorption isotherms of arsenate and chromate on functionalized MCM-41. A very steep
slope characterizes the initial curve until saturation where saturation was found to not be
significantly dependent on the silanol functional groups. In fact, Yoshitake et al. (2002)
suggest the different frameworks (i.e. silicate amino group ratio) may influence the
Reproduced with permission of the copyright owner. Further reproduction prohibited without permission.

118
accessibility or utility of the amino groups causing adsorption sites to congregate on parts
of the MCM-41 surface while other parts remain unused. Walcarius et al. (2003) found a
similar relationships between mesoporous solids with pore sizes -35A (i.e. similar to
pore size of MCM-41 materials in this study) that were crowded with aminopropyl
groups. This directly affected both accessibility to the active sites and diffusion rates.
Walcarius et al. (2003), but also reported very fast reaction rates sorbing Cu and Hg, with
significant reduction the rate of adsorption once about 40% of the total capacity of the
material had been reached. Both researchers hypothesized the metal cations are unable to
reach deep into the material once the pore entrance sites had been populated.
From this review the response curve in zone 1 (Figure 34) represents fast
adsorption because of the large, uniform, and easily accessible pore channels. According
to HSAB (Hard Soft Acid Base) principles, the aminopropyl groups on MCM-41 are hard
bases. The cationic adsorption mechanism of MCM-41 for heavy metals ions such as,
lead (II) ions and cadmium (II) ions would interact according to HSAB chemistry (Perez-
Quintanilla et al. 2006). By frontier molecular orbital theory a hard Lewis acid and a
hard Lewis base would yield an ionic bound complex. Similarly, a soft Lewis acid and a
soft Lewis base would yield a covalently bound complex. Specifically in this study, lead
(II) ions are considered a borderline Lewis acid and the surfactant head group moiety
RNH2 , a hard Lewis base, and therefore, their interaction characteristics are intermediary
between a covalent and ionic bonding. Therefore, the lead (II) ion adsorption on OSNP
material would generally be less stable then a hard-hard and soft-soft complex.
As a hard Lewis base (RNH2), OSNP material adsorptive properties would prefer
hard Lewis acids, like H+, Na+, K+, Mg2+, Ca2+, Mn2+, Al3+, and Fe3+. The Irving-
Williams stability series (Irving and Williams 1953) contains 7 of the cations included in
Reproduced with permission of the copyright owner. Further reproduction prohibited without permission.

119
this study and provides the expected stability o f metal ion complexes for this study as
follows: Ca2+ < Mg2+ < Mn2+ < Fe2+ < Ni2+ < Cu2+ < Zn2+. Presumably, the electrostatic
nature of complexation would also predict the stability constants for metals with 3+
charge to be greater than those for metals with a 2 + charge.
Zone 2. To examine more closely the behavior that drives the change in zone 2 a
plot of the pH, flow, and turbidity are provided in Figures 35, 36 and 37.
♦ Ce Co Average
J 10.0■ ►
6.0
0
Aj 0 . 0
0 300 60) 900
Bed Vofaae
Fig. 35. MCM-41 Adsorption and Flow Rate
Reproduced with permission of the copyright owner. Further reproduction prohibited without permission.

7.6
7.4 -
I7.2 -
7.0 -( 10—
i . «-«
6.6 ■
6.4 -
6.2 -
6.0
□ m
* jp*
* INF pH ■ EFFpH o AVG INF □ AVG IFF
I " U -B&*<$©
**
**4>
I I600 900
Bed Volsue
Fig. 36. MCM-41 Bed Volume vs Effluent pH
1200
4.5
4.0
3.5O-jg 3.0 -pS-I? 2.5 -%2% 2.0 Hf-*
1.5
L0 t»
0.5 -
o.o 4o-0
□ ♦
-♦HUT300
15
kSty □ EFF TurbidityAverage
4*****************¥*********#**++4**
600 900Bed Vokme
-□--- 1—1200
30Time (h.)
60
□
■40^1500
120
Fig. 37. MCM-41 Turbidity vs Bed Volume and Elapsed Time
Reproduced with permission of the copyright owner. Further reproduction prohibited without permission.

121
From Figures 35 to 37 for zone 2, there is a noteworthy decrease in adsorbate
influent flow (-9.3%), a decrease in influent pH (-4.4%) and an increase in influent
turbidity (+13%). Noting in Figure 8 the fractional species of lead (II) ions versus pH, it
is obvious the initial average pH = 6 . 8 6 the Pb(OH) 2 is controlling solubility, but as soon
as the average pH dropped to 6.56 much of the precipitate would have been available as
free lead (II) ions. The influent pH decreased by hydrolysis by the various cations
according to the general relationship of a metal cation coordination with water:
[M(H2 0)n)z+ + H20 <==> [M(H2 0)n.i(0H)](z'1)+ + H30 +. This reaction decreased the pH
with increased contact time in the adsorbate supply tank. The hydronium ion production
was described by Rutgers and Hendrikx (1962) who developed a relationship that pKa is
proportional to the charge squared divided by the atom bonding radius.
MCM-41 also contributed to effluent pH decrease. Researchers have documented
the release of hydrogen ions during the adsorption of metal cations by MCM-41
materials. Xu et al. (1999) measured the release of protons during adsorption of lead (II)
ion in 0.20 L solution of 0.40 g Ti-MCM-41 at pH 7.0. They noted protons were released
during the adsorption reaction. They titrated with 0.1469 M carbonate-free NaOH to
maintain pH (±0.10 unit) for 2 h, after which the pH remained stable. The quantity of
base added was used as a direct measure of proton release. They suggest this
phenomenon is explained by the formation of surface complexes with two deprotonated
sites or simultaneous adsorption and hydrolysis. There were 1.5 - 1.7 protons released
on average per lead (II) ion adsorbed suggesting a bidentate surface complexing and
surface hydrolysis with surface hydroxyl groups.
For this experiment, zone 2 lead (II) ions availability increased as the pH
decreased, which then, in turn, were adsorbed by the MCM-41 material. Interestingly, as
Reproduced with permission of the copyright owner. Further reproduction prohibited without permission.

122
the lead (II) ions were adsorbed, protons were again released lowering the pH, which at
zone 3, Pb(OH) 2 precipitated, starting the cycle over. The dissolved portions of
precipitates easily passed through the column, which caused the overall lead (II) ion
adsorption to decrease. Presumably, if the column experiment had continued the cycle of
deprotonation of the silanol, i.e. drop in pH, adsorption by MCM-41, and then
precipitation would have continued indefinitely.
4.8.3. Column Break-Through Using Recycled Adsorbate
Since both OSNP materials had removal of ca. 30% to 50%, for HMS and MCM-
41, respectively, the effluent of one column was collected and used as feed for a new
“recycled” column. The objective of this portion of the experiment was to validate
whether a tandem or series filtration system would significantly reduce discharge lead (II)
ions. An optimized column of 0.38 g of MCM-41 mixed with 15.02 g sand (same sand
used through-out this study) was placed in a 12.7 mm ID PVC column from 0 to 54 mm,
and then from 54 to 216 mm 44.10 g of sand was placed. Feed stock was the discharge
from a previous column. Columns were operated only to 50 bed volumes to expedite the
evaluation. Column effluent concentrations due to recycling are depicted in Table 29.
Table 29. Effect of Recycling on Adsorption PerformanceAll lead (II) concentrations were measured within first 50 BVs of each column. Solute average flow rate = 2.1 m3/m2 h = 4.5 mL/min; influent pH = 6.74. Both columns were configured with the identical media amounts.________________________________
Column Description .+
W' *—
1 Std Dev n
Column 1 Influent 2811 2416 3Column 1 Effluent and Column 2 Influent 472 58 2
Column 2 Effluent 260 169 1 0
Reproduced with permission of the copyright owner. Further reproduction prohibited without permission.

123
An additional 44.7% reduction in effluent lead (II) concentration was achieved with a
total removal of ca 93% in the tandem filtration test. The use of filtration in series is not
a new practice and stormwater systems often use roughing filters, which contain coarse
media followed by another filter unit with finer media. In some instances an additional
filter bed with even finer media is appropriate (Logsdon et al. 2002).
4.8.4. Column Break Through; An Abbreviated Validation Check
A column was prepared simply to attempt to duplicate the response previously
observed with MCM-41 materials. The results were again similar to those previously
reported above, showing an immediate break through, followed by a restored adsorption
behavior when free lead (II) ions were available (Figure 34). After initial start up break
through with Ce/Co computed for < 0.2 to 130 BVs, the high initial adsorption slope was
observed at about 10 BVs. The adsorption isotherm appeared to duplicate what had
already been seen in Figure 33 for MCM-41. This phenomenon replicated the same
pattern as observed in the initial adsorption column study and suggest initial adsorption is
good until protons begin to be released by OSNP materials adsorbing cations. As shown
in Figure 34, after initial breakthrough, the column filter began the cycle of precipitation,
adsorption, and precipitation previously observed.
Reproduced with permission of the copyright owner. Further reproduction prohibited without permission.

124
1.0
I 0.6O
0.4
0.2
0.00 20 40 60 80 100 120 140
Bed Volume
Fig. 38. Column Adsorption of Matrix SoluteAdsorption behavior mirrored that seen in Fig. 33. Average flow = 4.5 mL/min. Influent pH for BV 0 to 25 = 7.35 and pH for BV 25 - 123 = 6.48. Effluent pH for BV 0 to 25 = 6.64 and pH for BV 25-123 = 6.55. The Ce/Co response at 10 and 40 BVs are similar to MCM-41 response in Figure 33. The dotted plot represents expected response for the area without data points from ca. 15 to 35 BVs based on previous MCM-41 response. Total elapsed time was 20 BV = 1.5 h.
4.8.5. OSNP Material Performance Using Stormwater
Approximately 19 L (ca. 694 BV for columns used in this study) of stormwater
was collected from a military shooting range in Virginia on 6 Oct 2006. Twenty-four
hour precipitation on the day of collection was 2.03 in (51.56 mm). Collection was made
at 12:15 pm and 0.58 in (14.73 mm) precipitation had fallen in the previous 12 hr. The
sample was collected from a well-established outfall during moderate rainfall with wind
NE 23 G 33. The outfall collects drainage from ca. 1.8 acres (0.73 ha) consisting of a
Reproduced with permission of the copyright owner. Further reproduction prohibited without permission.

125
single rifle and handgun firing range with 5 yr and 40 yr aged impact berms. The 5 yr
berm had been constructed in front of the older 40 yr aged impact berm.
Both berms had significant accumulations of lead fragments in the soils (See
Appendix B for a more complete description; reference range VA1 and VA2). Lead (II)
concentrations at this outfall from February 1998 to October 2006 were: dissolved =
192.7 pg/L (SD = 239.6, n - 22) and total = 601.0 pg/L (SD - 536, n - 14). Key
parameters of stormwater when used in columns for this study, not when collected, were
pH = 6.06, turbidity =14 NTU, conductivity =171.2 ps/cm and temperature 20 ± 3° C.
Cations measured by ICP-MS for this stormwater are shown in Table 30 (Same as shown
in Table 12, but repeated here to add RSD and instrument detection limit for each
element). Cation and anion charge balance are shown in Table 31.
Table 30. Total Cations in Shooting Range StormwaterRSD is relative standard deviation and DL is instrument detection limit. Allmeasurements were by ICP-MS.___________________________________
Element pg/L RSD IDL Element pg/L RSD IDLCa 16401 4.2 1 . 1 Sb 27 0.3 0 . 0
Na 6685 14.3 1 . 1 Mn 2 0 0.3 0 . 0
Mg 2180 4.8 0 . 2 Cr 8 4.7 0 . 0
Fe 581 0.5 0.3 Ni 1 1 . 0 0 . 0
Cu 2 2 0 0.3 8.4 Mo 0.5 4.3 0 . 0
Pb 237 1 . 0 0 . 0 Sn 0.3 5.1 0 . 0
Zn 241 0 . 6 3.6
Because of the limited stormwater supply the solution was split between three
columns. The first and second column was configured with the optimized 216 mm media
depth with the bottom 54 mm containing MCM-41 and sand (dio = 0.20 mm). In the
third column 216 mm of sand only was placed. The first 50 BVs for the MCM-41
Reproduced with permission of the copyright owner. Further reproduction prohibited without permission.

126
amended and the sand only media columns found there was significant evidence to
warrant rejection of the claim that the Kd variances are equal (F = 20,965, P « 0.001, n
= 12). Average Kd values for MCM-41/sand and sand only media columns were 2.1 L/g
(SD = 2.6, n = 6 ) and 0.02 L/g (SD = 1.9, n = 11), respectively.
Table 31. Stormwater Charge BalanceStormwater collected 6 Oct 06 from Langley AFB VA small arms range outfall. DOC (Dissolved Organic Carbon) was estimated at 0.5 x TDS. Bromide and Fluoride were not analyzed. Sulfate was assumed < 5 mg/L. Bicarbonate data is an estimate. Typically bicarbonate in rainwater <10 mg/L and < 200 mg/L in surface streams (Crittenden et al. 2005). The bicarbonate value used here is within this range and would be expected to be very low for this shooting range as measured soil carbonates averaged 43 mg/kg and were < 0.05 mg/kg in one berm (See VA1 and VA2 in Table 35).
Eq/LParameter mg/L Cations AnionsAmmonia-N 0.059 4.21E-06 -
Antimony 0.0272 6.70E-07Bromide 0 - 0.00E+00Bicarbonate 31.5 - 6.30E-04Calcium 16.401 8.18E-04 -
Chlorides 0 . 0 0 1 - 2.82E-08Copper 0.2196 6.91E-06Chrome 0.0082 3.15E-07DOC 85.6 - 8.56E-04Fluoride 0 . 0 - 0.00E+00Iron 0.5809 2.08E-05 -
Lead 0.5157 4.98E-06Magnesium 2.180 1.79E-04 -Manganese 0.0198 7.21E-07 -Molybdenum 0.0005 1.04E-08Nickel 0 . 0 0 1 1 3.75E-08pH 7.43 3.72E-08 -Potassium <5 6.39E-05 -Sodium 6.685 2.91E-04 -
Strontium 0 . 0 0.00E+00 -
Sulfate <5 - 5.21E-05Sulfide nd - -
Tin 0.0003 5.05E-09Zinc 0.241 7.37E-06 -
Totals = 0.00140 0.00154 RPD = 9.4%
Reproduced with permission of the copyright owner. Further reproduction prohibited without permission.

127
The adsorbent media response to stormwater is shown in Figure 39. Distribution
coefficient for MCM-41/sand and sand only columns at Ce/Co = 0.5 were 1.1 L/g and
0.038 L/g, respectively. All three columns responded similar to previous adsorption
profiles including a 0.55 pH drop at ca. BV = 75. MCM-41 began to improve after ca.
60 BV and continued to show decreasing lead (II) ion concentrations until a second
Ce/Co = 0.5 was reached at ca. 200 BV and Kd = 46.2 L/g. Adsorption capacity at break
through = 5.88 mg/g (0.028 mmol/g).
MCM-41 a MCM-41b
- a - Sand0.8
0.6 O Ce/Co = 0.5
0.4
0.2
0.0300 350 4000 50 100 150 200 250
Bed Volume
Fig. 39. Column Lead (II) Ion Adsorption of StormwaterInitial breakthrough for MCM-41/sand (point 1) = 20.0 BV and sand (point 2) = 17.2 BV. MCM-41 breakthrough (point 3) = 200 BV. Average influent pH for BV 0 to 75 = 6.70 and average pH for BV 75 to 200 = 6.55. Average effluent pH for BV 0 to 75 = 6.57 and BV = 75 to 200 = 6.33. Stormwater influent lead (II) concentration = 515.7 pg/L (SD = 214.1, n = 7). Flow rate was by gravity that began at 8.5 mL/min and declined after 24 h to ca. 1. 8 mL/min, and then after another 24 h to 0.98 mL/min. Average elapsed time was BV = 3.27 h. Concentrations of other cations and anions in solution are as shown in Table 30. MCM-41 column had 0.39 g OSNP and 15.03 g sand from the bottom of the column to 54 mm, and from 54 mm to 216 mm sand only.
Reproduced with permission of the copyright owner. Further reproduction prohibited without permission.

128
4.9 Sand Filtration Conceptual Design
Sand filtration design may be based on one of three concepts: the Austin, the
Washington, D.C. and the Delaware sand filter (U.S. EPA 1999). The main differences
between these are: above or below ground, drainage area served, filter surface area, and
runoff quantities. The Austin sand filtration system is applicable to large drainage areas
and is suited for pervious / impervious surfaces, located at grade, and can be easily
adapted to a 0.4-1.2 hectare shooting range (Figure 40). The Austin filter concept
To Stormwater Detention Basin Energy
, Dissipates FltrafeaBssm
■
£-*} cmA
Stormwater Channel Drop Met
j L
F ilte red Outflow
Sedimentation Basra Fitratioa Basin
c m
Filtered OutflowChannel Sloped toFacilitate Sediment Transport into
Perforated Eiser with Trash Rack
Elevation A — A
Fig. 40. Austin Sand Filter Design ConceptModified from combination of designs by Barrett (2003) and Schueler (1992).
Reproduced with permission of the copyright owner. Further reproduction prohibited without permission.

129
was selected and the design parameters developed following the Urban Drainage and
Flood Control District, Denver, Colorado guidelines for sizing and operating sand
filtration (Urbonas, 2002). Application research by Barrett (2003) University of Texas
was also considered in the preparation of the concept design. The filter media was
modified from a single media concept to include dual media, sand and OSNP material in
accordance with the optimized column test completed in this study.
4.9.1 Conceptual Design Procedure
The selected area for the design was a small arms firing range located at
Barksdale Air Force Base, Louisiana where outfall stormwater total lead (II)
concentrations were from 5.2 - 490 pg Pb2+/L. Range sizing parameters were as
follows.
Table 32. Small Arms Range Filter Sizing ParametersConcept of operation includes rain striking impact berm and sidewall, then runoff draining by gravity to detention volume catch basin, where large debris is removed as it flows to dual media filtration and then to discharge. SCS = Soil Conservation Service.
Range Parameter Quantity (English - Metric)Drainage Area 1.5 acres = 0.607 hectaresTSS Event Mean Concentration, EMCjss 120 mg/LAverage precipitation storm depth, Psd 1.22 in = 28.19 mmRange imperviousness, Ia 0.42 for Bermuda grass
(Cynodon dactylon)Runoff coefficient, C 0.29Avg. annual run-off, Pa - n * Psd * C 17.4 in = 442 mmAvg. annual TSS load, L tss 161.2 lbs = 73.1 kg/yRainfall intensity for SCS Type 3 storm 8 in = 203.2 mmFlow, Q = C*0.9*I*A/16 0.197 cfs = 482 m3/dDesign Safety Factor 1.5Detention Capture Volume, V 7,416 ft3 = 210 m3
Minimum Filtration Rate for 12 h cycle 0 . 2 1 m3/m2 h
Reproduced with permission of the copyright owner. Further reproduction prohibited without permission.

130
4.9.2 Design Parameters Calculations
The average event mean concentration (EMC) of TSS for the small arms range
catchment area was determined. The U.S. EPA (1983) EMC of TSS for Louisiana was
120 mg/L. From Table 13 this value falls within literature values for Western urban
stormwater, and is slightly higher than the shooting range TSS collected for this study
(avg = 52.2 mg/L, SD = 9.0, n = 3).
The average annual TSS was estimated using the runoff coefficient, which was
calculated as C = 0.858*Ia3 - 0.788 * Ia2 + 0.774 * Ia - 0.04. A Soil Conservation
Service range imperviousness factor for Bermuda grass (Cynodon dactylon), Ia = 0.42
was used yielding C = 0.29. The average storm precipitation was P sd = 1.11 in for the
area that occurs in 54 annual storm events. Annual average run-off from the range was
therefore: Pa = n * Psd * C = 54*1.11*0.29 = 17.4 in. The TSS load for the range
catchment was estimated as L tss = ac * 43,560.17 * (P a /1 2 ) * (EMC * 10' 6 * 62.4).
Then for this design TSS load was Ltss = 73.1 kg/y. Barrett (2003) has reported clogging
of the filtration system when loads were between 5 and 7.5 kg/m2 of the filter area. For
« • 0this concept design a 100 m filter would suggest a filter life = 7.0 y.
The time to fully discharge the captured volume was estimated based on historical
storm event periodicities for Louisiana. Based on the concept design and proposed
detention volume a conservative 12 h capture and discharge cycle would satisfy the 25-
year storm event cycle. Barrett (2003) used a 24 h discharge cycle and Urbonas (2002)
has recommended a preferred drainage time of 12 to 24 hours.
The proposed construction includes a detention filtration basin directly upstream
and structurally connected to the filtration area. The total TSS in the basin would
theoretically be captured by the filter, excluding any by-pass. The TSS concentration
Reproduced with permission of the copyright owner. Further reproduction prohibited without permission.

131
leaving the filter may be expressed as TSS (Leaving) = EMC * Rt, where Rp = total
system's average removal rate of TSS. Urbonas (2002) suggested removal rate for a 12 h
drain time = 0.50. Therefore the TSS (Leaving) = 120*0.50 = 60 mg/L. The estimate
for the average annual TSS load removed by the filter is then: Total average removed
TSS = (60 mg/L /120 mg/L) * 73.1 kg = 36.6 kg. The filter's maintenance frequency
was assumed to be twice per year. Barrett (2003) has reported ca. 49 h/y maintenance
was required to inspect, dewater, and structurally repair 5 Austin filters constructed in
California.
The water capture volume for the range area was estimated as: Vwc = Volume
max mean runoff * runoff coefficient (C) * mean storm depth in inches =1.12* 0.29 *
2.79 = 0.91 watershed inches. The value = 1.12 is from Urbona's (2002) graph of
maximized coefficient versus drain time of captured volume in hours. Gravity drain time
was assumed to be 2 in / hr (50.8 mm / hr). The 2.79 in was published by Driscoll et al.
(1989) as mean storm depths of precipitation in the United States. This incorporates an
additional safety factor since the Barksdale AFB area average precipitation is 1.22 in
(28.19 mm). The calculation is then Vwc = (0.91 in * ft / 1 2 in) * 1.5 ac * 43,560 ft2 / ac
= 4,955 ft3 = 140 m3.
The sand filter area was estimated as total removed TSS / (TSS average/area *
number of times filter is cleaned per year) = 36.6 kg / (0.18 kg/m2 * 2) = 102 m2. A
second method uses the flow-through rate of the filter to estimate the sand filter area and
was computed as: Area filter = (Capture volume) / (flow * time for capture volume to
drain through filter in hours) = (140 m3) / (0.115 m/h * 12 h) = 2,152 ft2 = 101 m2. The
results obtained by the two methods are compared ( 1 0 2 m vs. 1 0 1 m ), and the flow rate
Reproduced with permission of the copyright owner. Further reproduction prohibited without permission.

132
through the filter is adjusted until both results agreed. The filtration design area needed
for this sand filtration unit = 100 m (Figure 41).
From the above an in-situ sand filtration unit of 100 m2 surface area was required
based on a superficial flow rate of 0.11 m/h. Laboratory gravity stormwater flow rate
through 216 mm of MCM-41/sand column after 24 h was 1.75 mL/min or 0.71 m/h. The
lead (II) ion removal rates were ca. 60 to 80 %, hence a tandem or second filtration
system may be required to further reduce effluent concentrations. The first filtration unit
would be located inside the range berms and discharge via piping to a second filtration
unit located outside the berm area, but prior to discharge to the permitted outfall
4.9.3 Filtration Unit Concept Design
The filtration unit could be constructed as shown in Figure 41 as an open-air filter
with a separate sedimentation basin. Since the shooting range complex does not typically
have trees within the range complex liter accumulation should be minimal and allow the
construction of an open-air filtration unit. This will facilitate maintenance access, which
has been identified as a critical issue for Austin filters.
The in-ground filtration unit must have a minimum of 1 m inlet to outlet vertical
height to operate hydraulically (Barrett 2003). This study used dso = 0.46 mm sand, but it
may be appropriate to consider a greater dso sand along with pelletization of the
nanoporous materials, which as synthesized have powder fractions. To facilitate
maintenance monitoring, automatic samplers similar to Sigma 900 Max series and flow
meters similar to Sigma 950 series should be part of the construction.
Barrett (2003) reported 1999 costs for 5 Austin concrete cast-in place filters
constructed in Los Angeles (3 ea) and San Diego (2 ea) at an average cost per unit =
$257,375 or $2,009 / m3 of water quality volume. These costs included recycle pumps
Reproduced with permission of the copyright owner. Further reproduction prohibited without permission.

133
for some units because there was inadequate elevation for the required hydraulic head to
operate the systems by gravity flow. Further, some of the filter units were part of larger
California highway projects. Assuming these factors and adjusting for an annual
inflation of 2% per year, 2007 construction cost would be approximately $225,000 to
10 m
________________________
100 mm
165 mm
SECTION A-A SECTION B-B
Fig. 41. In-Situ Sand Bed Filtration Design ConceptUnder drain consist of PVC pipe 10 - 15 cm in diameter with 1 cm perforations. Filter fabric is wrapped around each under drain pipe to prevent sand and particulates from discharging. The system is designed to collect and treat the first 1.3 cm (0.5 in) of runoff.
$250,000 range. This may be considered the “high end” design due to type of
construction (in conjunction with state highway projects) and the location (Los Angeles
and San Diego, California). In separate studies by the U.S. EPA (1999) the estimate for
Reproduced with permission of the copyright owner. Further reproduction prohibited without permission.

134
an Austin sand filter to support a 0.4 ha (1 ac) drainage area was estimated at $18,500 in
1997. For 0.61 ha (1.5 ac) initial costs would increase by 40% to ca. $25,900. Inflating
to 2007 dollars at inflation, i = 2% for n = 10 y, the estimated Austin filter costs = P (1 +
i)n = 25900 * (1 + .02) 10 = $31,572.
The costs for nanoporous materials were not estimated, as they are not
commercially available for wholesale purpose for this intended purpose. However, the
life cycle of the filter media can be estimated as follows. The design concept from this
study would require 2.95% or say 3.00% w/w, nanoporous material in the first 54 mm of
the 100 m2 sand filtration unit. The required filtration unit volume for the OSNP
material & sand mixture = 10 m x 10 m x 0.054 m = 5.4 m3. OSNP materials optimized
in this study requires 3.0% w/w, therefore assuming 1,602 kg dry sand/m x 5.4 m x 0.03
= 259.52 kg MCM-41 needed. Based on this column study adsorption capacity = 14.627
mg/g. Then the total lead (II) ion capacity of the filtration unit would be = 259.52 kg x
14.627 mg/g = 3,796 g lead (II) ion. Assuming average lead (II) ion concentration in
stormwater =194 pg/L and the capture volume per storm event =140 m , for 54 storm
events per year for Barksdale AFB, the total life cycle for the MCM-41 adsorbent would
be 2.58 y. This is a conservative estimate, as it assumes no removal by the sand above
the OSNP material and sand mixture.
Reproduced with permission of the copyright owner. Further reproduction prohibited without permission.

135
5. SUMMARY AND CONCLUSION
Field analysis and laboratory experiments were conducted to evaluate the lead (II)
ion adsorptive properties by organosilicate nanoporous materials. OSNP materials were
used as amendments to sand filtration for lead (II) ion removal from synthetic and
shooting range stormwaters. Series order by functionalization of silica-based
mesostructure templates for removal of lead (II) ions in batch reactions was phosphorus >
amine > hydroxyl > ether > thiol. Amine functionalization was selected for further batch
and column studies; the phosphate functionalization was not used because of the potential
contribution to eutrophication in receiving streams. The HMS and MCM-41 materials
were characterized by a variety of techniques, which reflected literature mesoporous
structure and pore size.
Batch competitive ion adsorption studies found a strong dependence on ionic
strength that implies an outer-sphere complexation and electrostatic bonding metal
attraction. Outer-sphere complexation indicates a bonding mechanism that is less stable
and highly susceptible to pH variations. Stumm (1992) found there is a 1 to 2 pH unit
range where sorption will rise from near zero to almost 100%. The affect of pH on
OSNP material adsorption showed maximum adsorptive properties in the 5.5 to 6.5 pH
range.
Column designs were optimized using a 23 factorial design response surface. The
three factors used were percent by w/w of OSNP materials, media depth and filtration
rate. A linear response surface was developed with optimized column parameters of ca.
2.95 % OSNP material (w/w), 216 mm media depth and 11.0 mL/min filtration rate,
which were then used for subsequent column studies. Some experiments were operated
by gravity flow and were stopped for extended periods to simulate operational conditions
Reproduced with permission of the copyright owner. Further reproduction prohibited without permission.

136
expected in the field application. OSNP materials had 28.1 % increase in headloss
compared to sand only columns. HMS showed leaching characteristics in a 48 d study (P
= 0.005), but the MCM-41 material did not show a similar response (P = 0.19).
The fraction of metal species in solution was directly influenced by pH, and
competing ions (i.e. ionic strength). The unique characteristic of OSNP materials to
release protons while adsorbing metal cations (i.e. basically an ionic exchange process)
would predict a need to explore carefully the application of this material before a field
application could be considered. For the pH range < 6.7 free lead (II) ions are available
for adsorption. pH > 6.7 Pb(OH) 2 precipitate is the dominant controlling species. In the
presence of other cations like Mo, PbMo04(s) controlled solubility and this would be an
important consideration for the application of this material.
The objective of the current work was to examine the adsorptive properties of the
amine-containing mesoporous silica HMS and MCM-41 toward lead (II) ions in non
competing and competing ion aqueous solution. MCM-41 media and sand columns were
also operated using stormwater collected from a shooting range. OSNP materials fit both
Langmuir and Freundlich isotherm models in batch reactions and the Freundlich model
most closely represented the adsorption performance of both materials (r = 0.99). HMS
had a lead (II) ion adsorption capacity of 1.28 mg/g in batch reactions and MCM-41 had
10.75 mg/g (0.052 mmol/g). In column studies, lead (II) ion adsorption for spiked tap
water in single pass filtration at break through (Ce/Co = 0.5) was for HMS = 2.74 mg/g
(0.013 mmol/g) and MCM-41 = 14.627 mg/g (0.071 mmol/g). Stormwater lead (II) ion
adsorption in single pass filtration for MCM-41 = 5.84 mg/g (0.028 mmol/g).
An Austin single pass sand filtration unit was proposed with estimated costs
starting ca. $31,572 to a high-end cost of ca. $250,000 was presented. Adsorbent life
Reproduced with permission of the copyright owner. Further reproduction prohibited without permission.

137
cycle based on 140 m3 capture volume per storm event at 194 jig/L total lead would take
2.6 y before the MCM-41 adsorbent material would reach capacity. Discharge to a
second filtration unit did reduce lead (II) ion concentrations by 44.7% and may be
necessary to achieve desired end concentrations. Recycling of wastewater may be yet
another consideration. Adjustment to media size used in this study (dso - 0.51 mm) could
also be considered to improve hydraulics, although the sand used was well within typical
values used by others, namely Barrett (2003) and Sansalone (1999) who used 0.6 mm and
0.5 mm sand, respectively in single pass through sand filtration units.
In the current work OSNP materials in combination with sand media did improve
lead (II) ion adsorption performance and capacity. The hydrophilic channels in OSNP
materials allow the transport of water-soluble species such as metallic cations into the
meso pores. This further allows increased opportunities for contact with amino-
surfactants. Hence, further improvements to the OSNP materials performance may be
obtained by increasing the surface area and pore volume during synthesis as proposed by
Xu et al. (1999), Walcarius et al. (2003), Sayari et al. (2005) and others.
The MCM-41 mesoporous structures have well defined hexagonal ordered pore
structure that can be controlled by the choice of surfactants and reaction parameters. In
this study it was shown OSNP materials might be used in conjunction with traditional
sand media be used to enhance lead (II) ion adsorption, however high ionic strength
solution of primary metal cations, plus the deprotonation behavior of OSNP materials
adsorbing cations lowers pH and influence OSNP adsorption effectiveness. The OSNP
material has a large BET surface area (typically > 1,000 m2/g) with hydrophobic and
hydrophilic properties that can also be modified. The OSNP material showed promise as
Reproduced with permission of the copyright owner. Further reproduction prohibited without permission.

138
an innovative molecular sieve for lead (II) ion adsorption for in-situ sand filtration
applications.
5.1 Perspectives on Future WorkThere were many questions and additional areas of study identified during the
course of this study. If time and money had allowed, each should have been pursued to
more fully elucidate the potential and condition of application of OSNP materials. The
following provides a summary of perspectives on future work that is needed.
The OSNP materials have at least one dimension in the nanometer size and as
such may reduce media porosity. While the straining is typically the primary mechanism
for particulate removal in filtration, the increase in head loss in field applications with
OSNP materials could limit their applications. Pelletization of OSNP materials would
agglomerate the materials into larger media diameters and allow the less hindered flow of
solutions through the porous medium. Pelletization by Hartmann and Bischof (1999)
have demonstrated the possibility as previously discussed.
The batch reactions in the current study were hampered by lack of access to ICP-
MS analysis such that the implications and preference of cations by OSNP materials were
not completely explored. Additional work is needed to better understand the selective
surface chemistry of organosilicate materials and how they can be “tuned” to specific
cations. Sayari et al. (2005) has reported MCM-41 amine functionalized materials
sorption affinity for three cations as Cu > Co > Ni. The structure, porosity, density of
organic groups, reaction type, and analyte size all affect the adsorption characteristics.
For example, Walcarius et al. (2003) reported that increasing the amount of grafted
moieties in the mesopores caused reduced mass-transfer rates because of greater steric
Reproduced with permission of the copyright owner. Further reproduction prohibited without permission.

139
hindrance. The subtleties in design of these mesoporous materials are sensitive and
require further research and development.
The current work chose a starting range of amendment amounts, which were
optimized within the chosen range. Additional work for amendment amounts in a
different range should be completed. The performance in conjunction with other proven
medias like zeolites, activated carbon, anthracite, etc. is needed to optimize the results.
In theory this optimization could design target analytes for removal while excluding
others. In the earlier part of this study HMS had a very selective adsorption response in
batch reactions to a solute with various nitrate salts of metals. Lam et al. (2006) showed
that SH-MCM-41 had selective adsorption of silver (I) over copper (II) ions, and the
behavior was not influenced by metal concentration, anion, or pH. They proposed the
HSAB principle could be a useful guide in the development of selective adsorbents.
Brown et al. (1999) reported thiol functionalized silicas were selective for mercury (II)
ions over cadmium (II), lead (II), zinc (II), cobalt (II) iron (II) copper (II) and nickel (II).
The selective and enhanced performance of the OSNP material may be exploited in
conjunction with other adsorptive media.
Desorption of the media needs further study. Procedures to remove the analyte
while retaining the mesoporous structure must be developed. Most researchers have used
acids to desorb and regenerate adsorbents. Wright (2006) used vinegar as a desorbent
with some success, while Ganjali et al. (2004) used 3 M HOAc, 3 M HNO3 , 3 M HBr and
3M HC1. The use of mild acids is desired to avoid creating a hazardous waste stream as
defined by the Resource Conservation and Recovery Act regulations for corrosiveness.
In some batch and column reactions effluent amounts exceeded available influent
lead (II) ion concentrations. This phenomenon may be understood when MCM-41 is
Reproduced with permission of the copyright owner. Further reproduction prohibited without permission.

140
mixed in aqueous solutions the polar water molecules fills the entire length of the pores
without voids or hollow spaces (Tun and Mason 2002). Initially this may concentrate
metal ions in the equilibria or column effluents. In surface complexation these surface
hydroxyl groups exchange with other ligands and is in fact the main mechanism of ligand
adsorption (Stumm, 1992). While initial effluent lead (II) ion concentrations were high
ligand exchanges with the adsorbate dropped these amounts. Additional work to more
fully characterize this attribute should be undertaken to accommodate this in the design
of OSNP material applications.
5.2 ConclusionThis study used OSNP materials MCM-41 and HMS as novel adsorbents for the
removal of lead (II) ions from aqueous and natural stormwaters. The empirical data and
analysis completed suggests the following conclusions may be proposed.
1. Amine functionalized MCM-41 and HMS mesoporous materials were more
effective as lead (II) ion adsorbents than thiol, hydroxyl or ether functionalizations.
2. OSNP materials and sand media in a declining rate single pass filtration
increase headloss, which must be appropriately considered in application designs.
3. Batch and column reactions of OSNP materials can be effectively modeled
with Langmuir and Freundlich isotherms. The OSNP materials adsorption behavior was
characteristic of outer-sphere complexation and electrostatic attractive forces (i.e. van der
Waals).
4. As for most adsorption process pH is the "master variable." The application of
OSNP materials has a specific pH range (5.0 - 6.5) where lead (II) ion adsorption is
optimized. This pH range is typical of shooting range stormwater run-off. Above pH =
6.7 lead precipitates will control solubility. If Mo is in solution with Pb, PbMo04 can
Reproduced with permission of the copyright owner. Further reproduction prohibited without permission.

precipitate at ca. pH - 2.5 to 9.6 controlling solubility. Lead molybdate can interfere
with OSNP material adsorption.
5. MCM-41 was more susceptible to the presence of competing ions than HMS.
6 . For the shooting range conditions of this study, like rainfall, and lead (II) ion
concentration in stormwater run-off, the MCM-41 / sand media could operate 2.6 y
before Ce/Co = 0.5 breakthrough.
Reproduced with permission of the copyright owner. Further reproduction prohibited without permission.

142
REFERENCES
Abdel-Fattah, T. M., and Bishop, B. (2004). "Organo-silicate nanocompostes for theremoval of chlorinated phenols from aqueous media: Kinetics and environmental stability." Journal o f Environmental Science and Health, Part A, A39(l 1-12), 2855-2866.
Abdel-Fattah, T. M., Isaacs, L. K., and Payne, K. B. (2003). "Small Arms Range Lead Management Issues: Activated Carbon Molecular Sieves (5 A and 13X), and Naturally Occurring Zeolites as Lead Adsorbents." Federal Facilities Environmental Journal, 14(2), 113 -126.
Algarra, M., Jimenez, M. V., Rodriguez-Castellon, E., Jimenez-Lopez, A., and Jimenes- Jimenez, J. (2005). "Heavy metals removal from electroplating wastewater aminopropyl-Si MCM-41." Chemosphere, 59, 779-786.
Amato, I. (1993). "Chemists work their way from pores to riches." Science, 259(5097), 891.
Antochshuk, V., Olkhovyk, O., Jaroniec, M., Park, I.-S., and Ryoo, R. (2003). "Benzoylthiourea-modified mesoporous silica for mercury(II) removal." Langmuir, 19, 3031-3034.
Astmp, T., Boddum, J. K., and Christensen, T. H. (1999). "Lead Distribution and Mobility in a Soil Embankment Used as a Bullet Stop at a Shooting Range." Journal o f Soil Contamination, 8 (6 ), 653-665.
Babel, S., and Kumiawan, T. A. (2003). "Low-cost Adsorbents for Heavy Metals Uptake from Contaminated Water: A Review." B97, 219-243.
Barrett, M. E. (2003). "Performance, cost, and maintenance requirements of Austin sand filters." Journal Water Resource Planning and Management, 129(3), 243-242.
Basunia, S., and Landsberger, S. (2001). "Contents and leachability of heavy metals (Pb, Cu, Sb, Zn, As) in soil at the Pantex firing range, Amarillo, Texas." Journal o f the Air & Waste Management Association, 51(10), 1428-1435.
Beck, J. S., Vartuli, C., Roth, W. J., Leonowicz, M. E., Kresge, C. T., Schmitt, K. D., Chu, C. T.-W., Olson, D. H., Sheppard, E. W., McCullen, S. B., Higgins, J. B., and Schlenker, J. L. (1992). "A new family of mesoporous molecular sieves prepared with liquid crystal templates." J. Am. Chem. Soc., 114,10834-10843.
Benjamin, M. M. (2002). Water Chemistry, McGraw-Hill Companies, New York, NY.Berggren, A., Palmqvist, A. E. C., and Holmberg, K. (2005). "Surfactant-templated
mesostructured materials from inorganic silica." Soft Matter, 1, 219-226.Bilinski, H., and Schindler, P. (1982). "Solubility and equilibrium constants of lead in
carbonate solutions (25oC, I = 0.3 mol dm-3)." Geochimica et Cosmochimica Acta, 46(6), 921-928.
Boiler, M. (1997). "Tracking heavy metals reveals sustainability deficits of urban drainage systems." Water Science and Technology, 35(9), 77-87.
Bradl, H. B. (2004). "Adsorption of heavy metal ions on soils and soils constituents." Journal o f Colloid and Interface Science, 277, 1-18.
Branton, P. J., Hall, P. G., and Sing, K. S. W. (1995). "Physisorption of alcohols andwater vapour by MCM-41, a model mesoporous adsorbent." Adsorption, 1(1), 77- 82.
Brown, J., Mercier, L., and Pinnavaia, T. J. (1999). "Selective adsorption of Hg2+ bythiol-functionalized nanoporous silica." Chemical Communications, 1999, 69-70.
Reproduced with permission of the copyright owner. Further reproduction prohibited without permission.

143
Braell, R„ Nikolaidis, N. P., and Long, R. P. (1999). "Evaluation of remedial alternatives of lead from shooting range soil." Environmental Engineering Science, 16(5), 403-414.
Bulut, Y., and Baysal, Z. (2006). "Removal of Pb(II) from wastewater using wheat bran." Journal o f Environmental Management, 78, 107-113.
Burgos, W. D. (1997). "Heavy Metal Adsorbents for Stormwater Pollution Prevention." U.S. Navy Report NSRP 0514, San Diego, CA.
Burkett, S. L., Sims, S. D., and Mann, S. (1996). "Synthesis of hybrid inorganic-organic mesoporous silica by co-condensation of siloxane and organosiloxane precursors." Chemical Communications, 11, 1367-1368.
Burton, G. A., and Pitt, R. (2001). Stormwater effects handbook: A toolbox forwatershed managers, scientists, and engineers, Lewis Publishers, Boca Raton,FL.
Buzier, R., Tusseau-Vuillemin, M.-H., and Mouchel, J.-M. (2006). "Evaluation of DGT as a metal speciation tool in wastewater." Science o f the Total Environment, 358(1-3), 277-285.
Cajuste, L. J., Carrillo, R. G., Cota, E. G., and Laird, R. J. (1991). "The distribution of metals from wastewater in the Mexican valley of Mezquital." Water, Air, & Soil Pollution, 57-58(1), 763-771.
Cao, X., Ma, L. Q., Chen, M., Hardison, D. W., and Harris, W. G. (2003). "Leadtransformation and distribution in the soils of shooting ranges in Florida, USA." Science o f the Total Environment, 307, 179-189.
Cao, X., Ma, L. Q., Chen, M., Hardison, D. W., and Harrisa, W. G. (2003). "Weathering of Lead Bullets and Their Environmental Effects at Outdoor Shooting Ranges." Journal o f Environmental Quality, 32, 526-534.
Characklis, G. W., and Wiesner, M. R. (1997). "Particles, metals, and water quality in runoff from large urban watershed." Journal o f Environmental Engineering,123(8), 753-759.
Chen, M., Daroub, H., Ma, L. Q., Harris, G., and Cao, X. (2002). "Characterization of Lead in Soils of a Rifle/Pistol Shooting Range in Central Florida, USA." Soil & Sediment Contamination, 11(1), 1-17.
Chipasa, K. B. (2003). "Accumulation and fate of selected heavy metals in a biological wastewater treatment system." Waste Management, 23(2), 135-143.
Choudhary, V. R., and Mantri, K. (2000). "Adsorption of aromatic hydrocarbons on highly siliceous MCM-41." Langmuir, 16, 7031-7037.
Citeau, L., Lamy, I., vanOort, F., and Elsass, F. (2003). "Colloidal facilitated transfer of metals in soils under different land use." Colloids and Surfaces A: Physicochem. Eng. Aspects, 217, 11-19.
Craig, J. R., Rimstidt, J. D., Bonnaffon, C. A., Collins, T. K., and Scanlon, P. F. (1999). "Surface Water Transport of Lead at a Shooting Range." Bulletin o f Environmental Contamination and Toxicology, 63(3), 312-319.
Crittenden, J. C., Trussell, R. R., Hand, D. W., Howe, K. J., and Tchobanoglous, G.(2005). Water treatment: Principles and Design, 2nd, John Wiley & Sons, Inc., Hoboken, NJ.
Darling, C. T. R., and Thomas, V. G. (2003). "The distribution of outdoor shootingranges in Ontario and the potential for lead pollution of soil and water." Science o f the Total Environment, 313, 235-243.
Reproduced with permission of the copyright owner. Further reproduction prohibited without permission.

144
Davis, A. P., Shokouhian, M., and Ni, S. (2001). "Loading estimates o f lead, copper,cadmium, and zinc in urban runoff from specific sources." Chemosphere, 44(5), 997-1009.
Davis, A. P., Shokouhian, M., Sharma, H., and Minami, C. (2001). "Laboratory study of biological retention for urban stormwater management." Water Environ.Research, 73(1), 5-14.
Davis, J. A., and Leckie, J. O. (1978). "Surface ionization and complexation at theoxide/water interface II. Surface properties of amorphous iron oxyhydroxide and adsorption of metal ions." Journal o f Colloid and Interface Science, 67(1), 90- 107.
deMatos, A. D., Fontes, M. P. F., Costa, L. M. D., and Martinez, M. A. (2001). "Mobility of heavy metals as related to soil chemical and mineralogical characteristics of Brazilian soils." Environmental Pollution, 111(3), 429-435.
Dermatas, D., Menounou, N., Dutko, P., Dadachov, M., Arienti, P., and Tsaneva, V. (2003). "Lead and Copper Contamination in Small Arms Firing Ranges." Proceedings o f the 8th International Conference on Environmental Science and Technology, Lemnos Island, Greece, 134-141.
Dionysiou, D. D. D., and Wiesner, M. (2007). "Environmental Nanotechnology." Environmental Engineering Science, 24(1), 1.
Droste, R. L. (1997). Theory and practice o f water and wastewater treatment, John Wiley & Sons, Inc., New York, NY.
Ekster, A., and Jenkins, D. (1996). "Nickel and copper removal at the San Jose/Santa Clara water pollution control plant." Waster Environment Research, 6 8 , 1172- 1178.
El-Taweel, G. E., and Ali, G. H. (2000). "Evaluation of roughing and slow sand filters for water treatment." Water, Air, & Soil Pollution, 120, 21-28.
Engstrom, A. (2004). "Characterizing water quality of urban runoff: Interactions of heavy metals and solids in Seattle residential catchments," University of Washington, Seattle.
Fenelonov, V. B., Romannikov, V. N., and Derevyankin, A. Y. (1999). "Mesopore Size and Surface Area Calculations for Hexagonal Mesophases (types MCM-41, FSM- 16, etc.) Using Low-angle XRD and Adsorption Data." Microporous and Mesoporous Materials, 28, 57-72.
Feuston, B. P., and Higgins, J. B. (1994). "Physical sorption of argon, nitrogen and oxygen by MCM-41, a model mesoporous adsorbent." Journal o f Physical Chemistry, 98(16), 4459-4462.
Fowler, C. E., Burkett, S. L., and Mann, S. (1997). "Synthesis and characterization of ordered organo-silica-surfactant mesophases with functionalized MCM-41-type architecture." Chemical Communications, 18,1769-1770.
Gagnon, C., and Saulnier, I. (2003). "Distribution and fate of metals in the dispersion plume of a major municipal effluent." Environmental Pollution, 124, 47-55.
Ganjali, M. R., Babaei, L. H., Badiei, A., Ziarani, G. M., and tarlani, A. (2004). "Novel method for the fast preconcentration and monitoring of a ppt level of lead and copper with a modified hexagonal mesoporous silica compound and inductively coupled plasma atomic emission spectrometry." Analytical Sciences, 20, 725-729.
Goel, J., Kadirvelu, K., Rajagopal, C., and Garg, V. K. (2005). "Removal of lead(II) by adsorption using treated granular activated carbon: Batch and column studies." Journal o f Hazardous Materials, 125(1-3), 211-220.
Reproduced with permission of the copyright owner. Further reproduction prohibited without permission.

145
Hardison, D. W., Ma, L. Q., Luongo, T., and Harris, W. G. (2004). "Lead contamination in shooting range soils from abrasion o f lead bullets and subsequent weathering." Science o f the Total Environment, 328, 175-183.
Hartmann, M., and Bischof, C. (1999). "Mechanical stability of mesoporous molecular sieve MCM-48 studied by adsorption of benzene, n-heptane, and cyclohexane." Journal o f Physical Chemistry, 103(30), 6230-6235.
Hettiarachchi, G. M., Pierzynski, G. M., and Ransom, M. D. (2000). "In situ stabilization of soil lead using phosphorus and manganese oxide." Environmental Science & Technology, 34(21), 4614-4619.
Hohl, H., and Stumm, W. (1976). "Interaction of Pb2+ with hydrous a-ALOs." Journal o f Colloid and Interface Science, 55(2), 281-288.
Huang, L., Guo, W., Deng, P., Xue, Z., and Li, Q. (2000). "Investigation of synthesizing MCM-41/ZSM-5 com positesJournal Physical Chemistry, 104, 2817-2823.
Huo, Q., Leon, R., Petroff, P. M., and D.Stucky, G. (1995). "Mesostructure design with gemini surfactants: Supercage formation in a three-dimensional hexagonal array." Science, 268(5215), 1324-1327.
Huo, Q., Margolese, D. L., Ciesla, U., Feng, P., Gier, T. E., Sieger, P., Leon, R., Retroff, P. M., Schuth, F., and Stucky, G. D. (1994). "Generalized synthesis of periodic surfactant/inorganic composite materials." Nature, 368, 317-321.
Iler, R. K. (1979). The chemistry o f silica, John Wiley & Sons, NY, NY.Irving, H., and Williams, R. J. P. (1953). Journal o f Chemical Society, 3192-3210.Isaacs, L. (2007). "Lead leaching from soils and in storm waters at twelve military
shooting ranges." Journal o f Hazardous Substance Research, VI, 1-30.Isaacs, L. K. (2003). "Lead Immobilization in Soil and Stormwater from a Small Arms
Range Using Phosphate, Sedimentation, Filtration, and Organo-silicate Nanocomposite Adsorption Treatments," Report, Christopher Newport University, Newport News, VA.
Isaacs, L. K., Kull, R., and Montalvo, M. (2005). "Small Arms Range Lead Migration in Stormwater Run-off." U.S. Air Force Environmental Training Symposium, Louisville, KY, 525-535.
Jaroniec, M., Kruk, M., Shin, H. J., Ryoo, R., Sakamoto, Y., and Terasaki, O. (2001). "Comprehensive characterization of highly ordered MCM-41 silicas using nitrogen adsorption, thermogravimetry, X-ray diffraction and transmission electron microscopy." Microporous and Mesoporous Materials, 48, 127-134.
John, P. C. (2002). "Pollution hazards from sporting shooting ranges: Environmental and economic considerations illustrated from a proposal at Bodalla state forest Australia." Australian National University.
Johnson, C. A., Moench, H., Wersin, P., Kugler, P., and Wenger, C. (2005). "Solubility of antimony and other elements in samples taken from shooting ranges." Journal Environmental Quality, 34, 248-254.
Jorgensen, S. S., and Willems, M. (1987). "The Fate of Lead in Soils: TheTransformation of Lead Pellets in Shooting-Range Soils." Ambio: A Journal o f the Human Environment, 16(1), 11-15.
Juang, L.-C., Wang, C.-C., and Lee, C.-K. (2006). "Adsorption of basic dyes onto MCM- 41." Chemosphere, 64(11), 1920-1928.
Kaiser, H. (1970). "Report for analytical chemists. II. Quantitation in elemental analysis." Analytical Chemistry, 42(4), 26A-59A.
Reproduced with permission of the copyright owner. Further reproduction prohibited without permission.

146
Kisler, J. M., Stevens, G. W., and O'Connor, A. J. (2001). "Adsorption of proteins on mesoporous molecular sieves." Mater. Phys. Meek, 4, 89-93.
Kostal, J., Prabhukumar, G., Lao, U. L., Chen, A., Matsumoto, M., Mulchandani, A., and Chen, W. (2005). "Customizable biopolymers for heavy metal remediation." Journal o f Nanoparticle Research, 7, 517-523.
Kresge, C. T., Leonowica, M. E., Roth, W. J., Vartuli, J. C., and Beck, J. S. (1992)."Ordered mesoporous molecular sieves synthesized by a liquid-crystal template mechanism." Nature, 359, 710.
Lam, K. F., Yeung, K. L., and McKay, G. (2006). "An investigation of gold adsorption from a binary mixture with selective mesoporous silica adsorbents." Journal o f Physical Chemistry, 110, 2187-2194.
Lam, K. F., Yeung, K. L., and McKay, G. (2006). "A rational approach in the design of selective mesoporous adsorbents." Langmuir, 22(23), 9632-9641.
Lanouette, K. H. (1977). "Heavy Metals Removal." Chemical Engineering Deskbook, 73- 80.
Lim, M. H., Blanford, C. F., and Stein, A. (1998). "Synthesis of ordered microporous silicates with organosulfur surface groups and their applications as solid acid catalysts." Chemical Materials, 10, 467-470.
Lin, Z., Comet, B., Qvarfort, U., and Herbert, R. (1995). "The chemical andmineralogical behaviour of Pb in shooting range soils from central Sweden." Environmental Pollution, 89(3), 303-309.
Logsdon, G. S., Kohne, R., Abel, S., and LaBonde, S. (2002). "Slow sand filtration for small water systems." Journal o f Environmental Engineering and Science, 1(5), 339-348.
London, J. W., Shaw, L. M., Theodorsen, L., and Stromme, J. H. (1982). "Application of response surface methodology to the assay of gamma-glutamyltransferase." Clinical Chemistry, 28, 1140-1143.
Long, G. L., and Winefordner, J. D. (1983). "Limit of detection. A closer look at the IUPAC definition." Analytical Chemistry, 55(7), 712A-724A.
Ma, L. Q., Cao, R. X., Hardison, D., Chen, M., Harris, W. G., and Sartain, J. (2002)."Environmental impacts of lead pellets at shooting ranges and arsenical herbicides on golf courses in Florida." Florida Center for Solid and Hazardous Waste Management, University of Florida, Report No. 02-01.
Macquarrie, D. J. (1996). "Direct preparation of organically modified MCM-type materials. Preparation and characterisation of aminopropyl-MCM and 2- cyanoethyl-MCM." Chemical Communications, 16, 1961-1962.
McBride, M. B., Richards, B., Steenhuis, T., Russo, J. J., and Suave, S. (1997). "Mobility and solubility of toxic metals and nutrients in soils fifteen years after sludge application." Soil Science, 162, 487-496.
McLean, J. E., and Bledsoe, B. E. (1992). "Behavior of metals in soils." EPA/540/S- 92/018, Environmental Protection Agency.
McPherson, T. N., Burian, S. J., Stenstrom, M. K., Turin, H. J., Brown, M. J., and Suffet,I. H. (2005). "Trace Metal Pollutant Load in Urban Runoff from a Southern California Watershed." Journal o f Environmental Engineering, 131(7), 1073- 1080.
Mercier, L., and Pinnavaia, T. J. (1998). "A Functionalized Porous Clay Heterostructure for Heavy Metal Ion (Hg2+) Trapping." Microporous and Mesoporous Materials, 2 0 , 101-106.
Reproduced with permission of the copyright owner. Further reproduction prohibited without permission.

147
Mercier, L., and Pinnavaia, T. J. (1998). "Heavy metal ion adsorbents formed by the grafting of a thiol functionality to mesoporous silica molecular sieves: Factors affecting Hg(II) uptake." Environmental Science & Technology, 32(18), 2749- 2754.
Mokaya, R. (1999). "Improving the stability of mesoporous MCM-41 silica via thickermore highly condensed pore walls." Journal Physical Chemistry, 103(46), 10204- 10208.
Mokaya, R., Zhou, W., and Jones, W. (2000). "Restructuring of mesoporous silica: high quality large crystal MCM-41 via a seeded a recrystallisation route." Journal o f Materials Chemistry, 10, 1139-1145.
Montgomery, D. C. (2005). Design and analysis o f experiments, John Wiley & Sons,Inc., Hoboken, NJ.
Moriyama, K., Mori, T., Arayaskiki, H., Saito, A., and Chino, M. (1989). "The amount of heavy metals derived from domestic sources." Water Science and Technology, 21, 1913-1916.
Muhammad, N., Parr, J., Smith, M. D., and Wheatley, A. D. (1998). "Adsorption of Heavy Metals in Slow Sand Filters." 24th WEDC Conference, Islamabad, Pakistan, 346-349.
Muroyama, N., Ohsuna, T., Ryoo, R., Kubota, Y., and Terasaki, O. (2006). "Ananalytical approach to determine the pore shape and size of MCM-41 materials from X-ray diffraction data." Journal Physical Chemistry, 110(22), 10630-10635.
Murray, K., Bazzi, A., Carter, C., Ehlert, A., Harris, A., Kopec, M., Richardson, J., and Sokol, H. (1997). "Distribution and mobility of lead in soils at an outdoor shooting range." Journal o f Soil Contamination, 6 , 79-93.
Murray, K. S., Rogers, D. T., and Kaufman, M. M. (2004). "Heavy Metals in an Urban Watershed in Southeastern Michigan." Journal o f Environmental Quality, 33, 163-172.
Noll, K. E., Gounaris, V., and Hou, W.-S. (1992). Adsorption Technology for Air and Water Pollution Control, Lewis Publishers, Inc., Chelsea, MI.
Olkhovyk, O., Antochshuk, V., and Jaroniec, M. (2005). "Thermogravimetric studies of benzoylthiourea-modified MCM-41 after adsorption of mercury ions from aqueous solutions." Chemical Communications, 130(104-108).
Olkhovyk, O., and Jaroniec, M. (2005). "Ordered mesoporous silicas with 2.5-dimercapto-l,3,4-Thiadiazole ligand: High capacity adsorbents for mercury ions ."Adsorption, 11(3-4), 205-214.
Paulson, C., and Amy, G. (1993). "Regulating metal toxicity in stormwater." Water Environment & Technology, 5(7), 44-49.
Pauwels, B., Tendeloo, G. V., Thoden, C., Rhizn, W. V., and Jacobs, P. A. (2001)."Structure determination of spherical MCM-41 particles." Advanced Materials, 13(17), 1317-1320.
Perez-Quintanilla, D., Hierro, I. d., Fajardo, M., and Sierra, I. (2006). "Adsorption ofcadmium(II) from aqueous media onto a mesoporous silica chemically modified with 2-mercaptopyrimidine." Journal o f Materials Chemistry, Advance Article.
Pinnavaia, T. J. (2006). "Leaching behavior of mesoporous material surfactants in flow through systems." Personal Communication to L. K. Isaacs, Yorktown, VA, 25 Apr 06.
Reproduced with permission of the copyright owner. Further reproduction prohibited without permission.

148
Pitcher, S. K., Slade, R. C. T., and Ward, N. I. (2004). "Heavy metal removal frommotorway stormwater using zeolites." Science o f the Total Environment, 334-335, 161-166.
Puigdomenech, I. (2004). "MEDUSA, Make Equilibrium Diagrams Using Sophisticated Algorithms and HYDRA, Hydro Chemical Equilibrium - Constant Database." Downloaded 3 Apr 2006, http:/www.kemi.kth.se/medusa.
Raimondo, M., Perez, G., Sinibaldi, M., DeStefanis, A., and Tomlinson, A. A. G. (1997). "Mesoporous M41S materials in capillary gas chromatography." Chemical Communications, 15, 1343-1344.
Rao, C. N. R , and Cheetham, A. K. (2001). "Science and technology of nanomaterials: current status and future prospects." J o f Materials Chemistry, 11, 2887-2894.
Reed, B. E., Vaughan, R., and Jiang, L. (2000). "As(III), As(V), Hg, and Pb removal by Fe-oxide impregnated activated carbon." Journal o f Environmental Engineering, 126(9), 869-873.
Richer, R. (1998). "Direct synthesis of functionalized mesoporous silica by non-ionic alkylpolyethyleneoxide surfactant assembly." Chem. Comm, 16,1775-1777.
Roco, M. C. (2003). "National nanotechnology initiative: Overview and environmental aspects." National nanotechnolgoy coordinating office (NNCO) interagency research Meeting/workshop- Nanotechnology and the environment: Applications and Implications, Washington D.C.
Rouquerol, F., Rouquerol, J., and Sing, K. (1999). Adsorption by Powders and Porous Solids, Academic Press, London, UK.
Royce, S. E., Nastoff, T., Rush, V., Tucker, P., and Wigington, P. S. (2000). "LeadToxicity." Agency for Toxic Substances and Disease Registry, U.S. Department of Health and Human Services, 56p.
Rutgers, A.T. and Hendrikx, Y. (1962). Trans. Faraday Soc., 58, 2184-2196.Rule, K. L., Comber, S. D. W., Ross, D., Thornton, A., Makropoulos, C. K., and Rautiu,
R. (2006). "Diffuse sources of heavy metals entering an urban wastewater catchment." Chemosphere, 63, 64-72.
Sansalone, J. J. (1999). "Adsorptive infiltration of metals in urban drainage - media characteristics." Science o f the Total Environment, 235(1), 179-188.
Sansalone, J. J., Koran, J. M., Smithson, J. A., and Buchberger, S. G. (1998). "Physical Characteristics of Urban Roadway Solids Transported during Rain Events." Journal o f Environmental Engineering, 124(5), 427-440.
Sanz-Medel, A. (1998). "Toxic trace metal speciation: Importance and tools forenvironmental and biological analysis." Pure and Applied Chemistry, 70(12), 2281-2285.
Sauve, S., McBride, M., and Hendershot, W. (1998). "Soil solution speciation of lead(II): Effects of organic matter and pH." Soil Sci. Soc. Am. J., 62, 618-621.
Savage, N., and Diallo, M. S. (2005). "Nanomaterials and water purification:Opportunities and challenges." Journal o f Nanoparticle Research, 7, 331-342.
Sayari, A., Hamoudi, S., and Yang, Y. (2005). "Applications of pore-expandedmesoporous silica. 1. Removal of heavy metal cations and organic pollutants from wastewater." Chemical Materials, 17(1), 212-216.
Sayari, A., and Yang, Y. (1999). "Expanding the pore size of MCM-41 silicas: Use ofamines as expanders in direct synthesis and postsynthesis procedures." Journal o f Physical Chemistry, 103(18), 3651-3658.
Reproduced with permission of the copyright owner. Further reproduction prohibited without permission.

149
Scheuhammer, A. M., and Norris, S. L. (1995). "A review of the environmental impacts of lead shotshell ammunition and lead fishing weights in Canada." Canadian Wildlife Service, 56 pp.
Schueler, T. R. (1992). "A current assessment of urban best management practices." Metropolitan Washington Council of Governments.
Skoog, D. A., Holler, F. J., andNieman, T. A. (1998). Principles o f Instrumental Analysis, 5th Ed., Brooks/Cole.
Sorme, L., and Lagerkvist, R. (2002). "Sources of heavy metals in urban wastewater in Stockholm." The Science o f the Total Environment, 298(1), 131-145.
Stansley, W., Kosenak, M. A., Huffman, J. E., and Roscoe, D. E. (1997). "Effects oflead-contaminated surface water from a trap and skeet range on frog hatching and development." Environmental Pollution, 96(1), 69-1A.
Stansley, W., Widjeskog, L., and Roscoe, D. E. (1992). "Lead contamination andmobility in surface water at trap and skeet ranges." Bulletin o f Environmental Contamination and Toxicology, 49(5), 640-647.
Strawn, D. G., and Sparks, D. L. (2000). "Effects of Soil Organic Matter on the Kinetics and Mechanisms of Pb(II) Sorption and Desorption in Soil." Soil Science Society AmJ, 64,144-156.
Stumm, W. (1992). Chemistry o f the So lid-Water Interface, John Wiley & Sons, Inc., New York, NY.
Stumm, W., and Morgan, J. J. (1996). Aquatic chemistry, Chemical equilibria and rates in natural waters, 3rd, John Wiley & Sons, Inc., New York, NY.
Tanev, P. T., and Pinnavaia, T. J. (1995). "A neutral templating route to mesoporous molecular sieves." Science, 267(5199), 865-867.
Tao, N. J. (2003). "Detection of heavy metal ions using polymer nanojunctions." National nanotechnolgoy coordinating office (NNCO) interagency research Meeting/workshop- Nanotechnology and the environment: Applications and Implications, Washington D.C.
Tchobanoglous, G., Burton, F. L., and Stensel, H. D. (2003). Wastewater Engineering Treatment and Reuse, 4th Ed., McGraw Hill, Boston, MA.
Thornton, L., Butler, D., Docx, P., Hession, M., Makropoulos, C., McMullen, M.,Nieuwenhuijsen, M., Pitman, A., Rautiu, R., Sawyer, R., Smith, S., and White, D. (2001). "Pollutants in urban waste water and sewage sludge." European Commission, ISBN 92-894-1735-8, 273pp.
Toshiyuki, Y., Takashi, T., and Hideaki, Y. (2003). "Selective selenate adsorption oncationated amino-functionalized MCM-41." Bulleting o f the Chemical Society o f Japan, 76(11), 2225-2232.
Treybal, R. E. (1980). Mass transfer operations, third ed., McGraw Hill, New York, NY.Tun, Z., and Mason, P. C. (2002). "Observation of adsorption of water in MCM-41 with
neutron diffraction." Langmuir, 18, 975-977.U.S.EPA. (1983). "Results of the Nationwide Urban Runoff Program." 200 p.U.S.EPA. (2001). "Best Management Practices for Lead at Outdoor Shooting Ranges."
EPA-902-B-01-001, 8 6 pp.Urbonas, B. R. (2002). "Stormwater sand filter sizing and design: A unit operations
approach." Urban Drainage and Flood Control District, Denver, CO, 19p.VanDerVoort, P., Mathieu, M., Mees, F., and Vansant, E. F. (1998). "Synthesis of high-
quality MCM-48 and MCM-41 by means of the GEMINI surfactant method." Journal Physical Chemistry, 102, 8847-8851.
Reproduced with permission of the copyright owner. Further reproduction prohibited without permission.

150
Vantelon, D., Lanzirotti, A., Scheinost, A. S., and Kretzschmar, R. (2005). "Spatialdistribution and speciation of lead around corroding bullets in a shooting range soil studied by Micro-x-ray fluorescence and absorption spectroscopy." Environmental Science & Technology, 39(13), 4808-4815.
Vartuli, J. S., Malek, A., Rloth, W. J., Kresge, C. T., and McCullen, S. B. (2001). "The sorption properties of as-synthesized and calcined MCM-41 and MCM-48." Microporous and Mesoporous Materials, 44-45, 691-695.
Vaze, J., and Chiew, F. (2004). "Nutrient loads associated with different sediment sizes in urban stormwater and surface pollutants." Journal o f Environmental Engineering, 130(4), 391-396.
Viklander, M. (1998). "Particle Size Distribution and Metal Content in Street Sediments." Journal o f Environmental Engineering, 124(8), 761-766.
Vralstad, T. (2005). "Synthesis and characterization of cobalt-containing mesoporousmodel catalysts," Dissertation, Norwegian University of Science and technology.
Walcarius, A., Etienne, M., and Lebeau, B. (2003). "Rate of access to the binding sites in organically modified silicates. 2. Ordered mesoporous silicas grafted with amine or thiol groups." Chemical Materials, 15(11), 2161-2173.
Wang, J., Huang, C. P., and Allen, H. E. (2006). "Predicting metals partitioning in wastewater treatment plant influents." Water Research, 40, 1333-1340.
Weng, C.-H. (2004). "Modeling Pb(II) Adsorption Onto Sandy Loam Soil." Journal o f Colloid and Interface Science, 272, 262-270.
Wigington, P. J. J., Randall, C. W., and Grizzard, T. J. (1986). "Accumulation of selected trace metals in soils of urban runoff swale drains." Water Resource Bulletin,22(1), 73-79.
Wilkie, P. J., Hatzimihalis, G., Koutoufides, P., and Connor, M. A. (1996). "Thecontribution of domestic sources to levels of key organic and inorganic pollutants in sewage: The case of Melbourne, Australia." Water Science Technology, 34(3- 4), 63-70.
Xu, Y.-M., Wang, R.-S., and Wu, F. (1999). "Surface Characters and AdsorptionBehavior of Pb(II) onto a Mesoporous Titanosilicate Molecular Sieve." Journal o f Colloid and Interface Science, 209, 380-385.
Yang, C.-M., and Chao, K.-J. (2002). "Functionalization of molecularly templated mesoporous silica." Journal o f the Chinese Chemical Society, 49, 883-893.
Yao, K.-M., Habibian, M. T., and OMelia, C. R. (1971). "Water and wastewaterfiltration: Concepts and applications." Environmental Science & Technology, 5(11), 1105-1112.
Yokoi, T., Yoshitake, H., and Tatsumi, T. (2004). "Synthesis of amino-functionalized MCM-41 via direct co-condensation and post-synthesis grafting methods using mono-, di= and tri-amino-organoalkoxysilznes." Chemical Communications, 14.
Yoshitake, H., Yokoi, T., and Tatsumi, T. (2002). "Adsorption of chromate and arsenate by amino-functionalized MCM-41 andSBA-1." Chemical Materials, 14(11), 4603-4610.
Yoshitake, H., Yokoi, T., and Tatsumi, T. (2003). "Adsorption behavior of arsenate at transition metal cations captured by amino-functionalized mesoporous silicas." Chemical Materials, 15(8), 1713-1721.
Yu, B., Zhang, Y., Shukla, A., Shukla, S. S., and Dorris, K. L. (2001). "The Removal of Heavy Metals from Aqueous Solutions by Sawdust Adsorption - Removal of
Reproduced with permission of the copyright owner. Further reproduction prohibited without permission.

151
Lead and Comparison of its Adsorption with Copper." Journal o f Hazardous Materials, B84, 83-94.
Zhang, L., Zhang, W., Shi, J., Hua, Z., Li, Y., and Yan, J. (2003). "A new thioetherfunctionalized organic-inorganic mesoporous composite as a highly selective and capacious Hg2+ adsorbent." Chemical Communications, 210-211.
Zhang, W., Pauly, T. R., and Pinnavaia, T. J. (1997). "Tailoring the framework and textural mesopores of HMS molecular sieves through an electrically neutral (Solo) assembly pathway." Chemistry o f Materials, 9(11), 2491-2498.
Zhao, G. X. S., Lee, J. L., and Chia, P. A. (2003). "Unusual Adsorption Properties of Microporous Titanosilicate ETS-10 toward Heavy Metal Lead." Langmuir, 19, 1977-1979.
Zhao, X. S., Audsley, F., and Lu, G. Q. (1998). "Irreversible change of pore structure of MCM-41 upon hydration at room temperature." Journal o f Physical Chemistry, 102(21), 4143-4146.
Zhao, X. S., Lu, G. Q., and Millar, G. J. (1996). "Advances in mesoporous molecular sieve MCM-41." Industrial Engineering Chemical Research, 35(7), 2075-2090.
Zhao, X. S., Ma, Q., and Lu, G. Q. (1998). "VOC removal: Comparison of MCM-41 with hydrophobic zeolites and activated carbon." Energy and Fuels, 12, 1051-1054.
Zhou, C., Zhang, B., Li, Q., Cai, Y., Chen, Y., and Ge, Z. (2001). "Synthesis and Characterization of Mesoporous Molecular Sieves MCM-41 Modified in Framework by B and Al." Gaoxiao Huaxue Gongcheng Huebao, 15(5), 425-428.
Reproduced with permission of the copyright owner. Further reproduction prohibited without permission.

APPENDICES
Reproduced with permission of the copyright owner. Further reproduction prohibited without permission.

153
A. ACRONYMS AND DEFINITIONS
AFB Air Force Base
ARC Applied Research Center, Jefferson Laboratory, Newport News, Virginia
ANOVA Analysis of Variation
BV Bed Volume
Ce / Co Breakthrough level (ratio of equilibrium to original concentration)
CCC Criteria Continuous Concentration
CMC Criteria Maximum Concentration
CTAB Cetyltrimethylammonium bromide
DI Deionized, typically used as DI water
EBCT Empty Bed Contact Time
EMC Event Mean Concentration
EtOH Ethanol
ICP-MS Inductively Coupled Plasma - Mass Spectroscopy
FTIR Fourier Transform Infrared
GFAA Graphite Furnace Atomic Adsorption
HSAB Hard Soft Acid Base
IR Infrared Spectroscopy
IUP AC International Union of Pure and Applied Chemistry
Kd Partition or Distribution Coefficient
Kf Coefficient of Formation
MEDUSA Make Equilibrium Diagrams Using Sophisticated Algorithms
MCM-41 Not an acronym, but a designation for a family of synthesized mesoporousmaterials to include MCM-48, SBA-15, HMS, etc., which differ in synthesis, morphology, structure, porosity, and pore diameters. Amato
Reproduced with permission of the copyright owner. Further reproduction prohibited without permission.

154
NAD
NOM
NPDES
NURP
OSNP
PSD
PWT
RCRA
RSM
S
SBA-15
SSMR
TDS
TEM
TEOS
TMAOH
TMB
TSS
UC
(1993) suggested MCM stands for Mobile Composition of Matter and Rouquerol et al. (1999) describes the materials as Mobil Catalytic Material, number 41. In this paper MCM is used as presented by the original researchers without interpretation to the designation MCM-41.
No Known Anthropogenic Additive; Used in a soil contamination context
Natural Organic Matter
National Pollutant Discharge Elimination System
National Urban Runoff Program conducted in 1982 by the U.S. EPA
Organosilicate Nanoporous
Precipitation Storm Depth
Pore Wall Thickness
Resource Conservation and Recovery Act
Response Surface Methodology
Schmidt Number, a dimensionless number used to characterize the ratio of fluid flows momentum diffusivity or viscosity to mass diffasivity.
Hexagonal mesoporous silica structure with thicker walls than MCM-41
Surfactant/silica molar ratio
Total Dissolved Solids
Transmission Electron Microscopy
T etraethylorthosilicate
Tetramethylammonium hydroxide
1,3,5 trimethylbenzene
Total Suspended Solids
Uniformity Coefficient
Reproduced with permission of the copyright owner. Further reproduction prohibited without permission.

155
B. JOURNAL PAPER: LEAD LEACHING FROM SOILS AND IN STORM WATERS AT TWELVE MILITARY SHOOTING RANGES
Manuscript was submitted Mar 27,2006. Review comments were received Jul 25, 2006 and a revised manuscript submitted Aug 17, 2006. The revised manuscript was submitted Aug 25, 2006 and approved for publication on Aug 29, 2006. The paper published Feb 22, 2007
Isaacs, L.K. (2007) Lead leaching from soils and in stormwaters at twelve military shooting ranges, Journal o f Hazardous Substance and Research, VI, 1-30.
The following is the release authorization from the editor to use the paper in this dissertation:
Original Message----From: [email protected] [mailto:[email protected]]Sent: Tuesday, Nov 21, 2006 8:18 AM To: Isaacs Larry K Civ ACC/A7VQ Cc: [email protected]; [email protected]: Re: Manuscript "Lead Leaching from Soils and in Storm Waters at Twelve Military Ranges"
Dear Mr. Isaacs,
Your request to include this manuscript or any parts of it in your dissertation is approved.
Larry E. EricksonEditor, Journal of Hazardous Substance Research Professor of Chemical Engineering and Director, Center for Hazardous Substance Research Kansas State University [email protected] Phone: (785) 532-4313
On Mon, Nov 20, 2006, Isaacs Larry K Civ ACC/A7VQ wrote:
Dear Dr. Erickson,
I would like to request permission to include subject manuscript in my dissertation. The dissertation is planned for publication in May 2007 at Old Dominion University in partial fulfillment of the requirement for the degree of Doctor of Philosophy in Environmental Engineering. Your favorable approval is greatly appreciated.
Respectfully,
Larry K. Isaacs, P.E.
Reproduced with permission of the copyright owner. Further reproduction prohibited without permission.

156
LEAD LEACHING FROM SOILS AND IN STORM WATERS AT TWELVE MILITARY SHOOTING RANGES
L.K. Isaacs
U.S. Air Force, Headquarters Air Combat Command, Environmental Division, Environmental Quality Branch, Langley AFB, Virginia 23665-2769. Phone: (757) 764- 9342; Fax: (757) 764-9369.
ABSTRACT
Soils from impact berms at twelve military shooting ranges were evaluated for
lead leaching by particle size distribution, sequential extractions, stormwater analysis,
batch studies with amendments of crushed apatite (FB) and triple super phosphate (TSP),
and column leaching studies with amendments of ashed apatite (FBa) and TSP. Soil
particle fractions were determined by ASTM D422-63 and by x-ray diffraction; lead
leaching was found by EPA’s SPLP and TCLP. Total and dissolved lead in soils and
stormwaters were determined by ICP-MS. The residual fraction averaged 79.8% of total
mass of lead in all soils. There was significant correlation between TCLP results and
lead in the less than 0.075 mm size fraction for all soils in the study (r2 = 0.82, P «
0.001, n = 13), along with a significant correlation of lead in stormwater and soil Fe (r2 =
0.56, P = 0.03, n = 8 ) and Mn (r2 = 0.59, P = 0.03, n = 8 ). Average dissolved lead in
stormwater = 104 pg/L (SD = 152, n = 17). Batch study of FB 3% and 5% amendments
sorbed 85.3% and 88.2% lead, respectively. TSP 3% and 5% amendments created
phosphate precipitates that captured 97.6% and 92.7% lead, respectively. In column
studies, FBa amended soils had mixed effectiveness as lead adsorbents and TSP amended
soils leached more lead than control in all, but Virginia (VA) soils. Control, non
amended soils, did not leach lead for three soil combination types, New Mexico range b
(NMb), Nevada (NV) and South Dakota range 2 (SD2). NMb soil had no lead leachate
Reproduced with permission of the copyright owner. Further reproduction prohibited without permission.

157
presumably due to the high organic matter, pH = 8.2 and very high sulfides. In the NV
range soil a combination of pH = 8.7, low moisture = 1.2% and mostly fine gravels had
no lead leachate. SD2 range had no leachate with pH = 8.2, moderate clay and organic
matter content. Both TSP and FBa amendments leachate pH were significantly different
than control leachate pH (FBa: F = 9.47, P = 0.003, n = 120; TSP: F = 115.5, P « 0.001,
n = 135). Leachate pH dropped an average 3.7 standard units (SD = 0.93, n = 13) in the
first week for TSP amended soils. Soil pH was the most significant indicator of soil
leaching behavior. While TSP can be an effective lead immobilization mechanism, the
reduction of soil pH can have an unintended consequence for lead ions not precipitated as
phosphates. Range operators would be prudent to monitor soil pH regularly and to know
their soil clay and organic matter content.
Keywords: Lead Leaching; Column Study; Stormwater Pollutant; Soil Particle Size;Shooting Range
Reproduced with permission of the copyright owner. Further reproduction prohibited without permission.

158
INTRODUCTION
Shooting range soils have elevated concentrations of elemental lead as high as 10
to 100 times background levels (Murray et al., 1997). Concern for migration of this
anthropogenic source has been a focus of research by many (Abdel-Fattah et al., 2003;
Bruell et al., 1999; Cao et al., 2003; Craig et al., 1999; Dermatas et al., 2006; Hardison et
al., 2004; Jorgensen and Willems, 1987; Lin et al., 1995; Murray et al., 1997;
Scheuhammer and Norris, 1995; Stansley et al., 1992; U.S.EPA, 2001). Shooting ranges
contain large amounts of lead contaminated soil that may become mobile through two
primary pathways: physical abrasion and weathering. The physical abrasion of bullets
has been found to be a significant source of lead contamination in the soils (Hardison et
al., 2004). The abraded residue transforms into hydrocerussite (2 Pb(COs)(OH)2) and to a
lesser degree cerussite (PbCOa), and massicot (PbO) in as little as one week (Cao et al.,
2003; Hardison et al., 2004; Jorgensen and Willems, 1987). Weathering of elemental
lead forms from shooting ranges have also been documented as visible corrosion on lead
fragments as crusts of white, gray or brown material and as hydrocerussite, cerussite and
some amounts of anglesite (PbS0 4 ) (Cao et al., 2003; Lin et al., 1995). The lead of
weathered bullets exists as particulate or ionic forms and may provide a steady source of
potentially labile constituents, which can appear in various soil fractions and in
stormwaters (Cao et al., 2003). These oxidized lead compounds in earthen bullet impact
berms provide a constant source of lead in the soil matrix, where the rate of elemental
lead dissolution is regulated by both physical and chemical factors.
Reproduced with permission of the copyright owner. Further reproduction prohibited without permission.

159
Lead dissolution
Lead mobility in soil is driven by redox potential, available anions (e.g.
carbonates, phosphates, and sulfates), pH, soil organic matter, and cation exchange
capacity (Basta et al., 1993; Dragun, 1998; Pickering, 1986). Both aerobic and acidic
conditions in soils increase elemental lead dissolution, whereas anaerobic and alkaline
conditions decrease it (Scheuhammer and Norris, 1995). Organic carbon has been found
to enhance lead adsorption (Basta et al., 1993; Sauve et al., 1998). Soil colloids have
been found to be active participants in transporting lead to groundwater and limiting lead
interaction with reactive soil constituents (Citeau et al., 2003). Surface and sub-surface
soils lead migration has been reported (Abdel-Fattah et al., 2003; Craig et al., 1999;
Murray et al., 1997). Dissolution and subsequent migration may require implementation
of best management practices (BMPs) to control and immobilize lead complexes.
Lead Immobilization
In-situ immobilization of lead may be accomplished by soil amendments with
phosphoric acid (H3PO4) (Yang et al., 2001); TSP (triple super phosphate) which in
concentrated form is composed of monocalcium phosphate hydrate, Ca(H2P0 4 )2 -H2 0 and
generally contains 43-50% P2 O5 (Budavari, 1989); or apatites (Caio(PC>4)6 (OH)2 ) to
convert soluble lead to pyromorphite species [Pbs(P04)3(0H, Cl, F ...)]. Pyromorphite
is extremely stable (Ksp = 1 0 '80) and its precipitate formation an immobilization
objective. Pyromorphite can be formed from soil lead compounds like cerrusite (PbC03),
anglesite (PbS04) and galena (PbS) when exposed to phosphates. Some studies have
suggested pyromorphites can also be a natural weathering product in soil (Cotter-Howells
et al., 1994; Klein and Hurlburt, 1993). Changing the available lead to less soluble
forms using phosphates has been shown effective, (Brown et al., 2005; Fayiga and Ma,
Reproduced with permission of the copyright owner. Further reproduction prohibited without permission.

160
2006; Ownby et al., 2005). TSP amended 3.2% and 1% phosphoric acid soils have been
reported the most effective lead treatments to bioavailability reduce in fescue grass
(Brown et al., 2005). Hydroxyapatite has also been shown to be an effective calcium
phosphate-based [Ca5(P0 4 )3 (0 H)] lead immobilizing amendment (Ryan et al., 2001).
Phosphate sources of various types have been used to include fish hard parts as an
effective metal adsorbent (Wright et al., 1995).
Objectives
Researchers, previously mentioned, have studied and reported the distribution of
lead contamination at shooting ranges, the distribution and geochemistry of metals in
range soils, the effectiveness of different amendments and mechanisms of metal sorption,
remediation technologies, and other edaphic topics. These research efforts have advanced
our understanding of shooting range environmental knowledge. The challenge to range
managers is to translate this information into effective range BMPs. In this study key soil
characteristics of shooting range impact berms are identified to assist the range
environmental professional to predict the lead leaching behavior of range soils. To
clarify lead leaching characteristics of range soils the objectives of this research focused
in three areas: 1) Quantification of the physical and mineralogical associations of lead in
shooting range impact berm soils; 2) Measurement of the lead concentrations in range
stormwaters, and 3) Characterization of the soil lead leaching behavior via laboratory
batch and column studies with apatite and TSP amendments. Statistical correlations are
presented where appropriate.
Range Site Description
The twelve small arms firing ranges (SAFRs) were located in nine states and are
hereafter referred to by the alphanumeric codes: CA: California - one range, LAI, LA2,
Reproduced with permission of the copyright owner. Further reproduction prohibited without permission.

161
and LA3: Louisiana - three ranges at same site, MO: Missouri - one range, NE: Nebraska
- one range, NMa: New Mexico - one range and NMb: New Mexico - one range (Note:
The two ranges in New Mexico were at two different military installations approximately
350 km apart.), NV: Nevada - one range, SC: South Carolina - one range, SD2: South
Dakota - one range (Note: SD2 is used to differentiate from range SD1 at this same site,
but SD1 was not included in this paper), and VA1 and VA2: Virginia - one range with
two berms, one 5 y aged berm in front of a 40 y aged berm, respectively. Site
approximate locations are depicted in Figure 42.
Each range consists of a firing line, a target line, and an impact berm located
behind the target line, except the NV range did not have an impact berm. The distance
from the firing line to the target line was 25 m to 100 m for pistol ranges, and 100 m to
950 m for rifle ranges. Impact earthen berms varied in height from 1.5 m to 15 m, with
an average height of 6 m. Soil volumes in these impact berms ranged from 75 m3 to
15,000 m . In 2003 these small arms training ranges averaged approximately 371,430
rounds of 5.56 mm, 7.62 mm, and 9 mm size fired per range complex per year, adding
about 1,960 kg of lead to each range complex annually. Typical operations and
maintenance for SAFR berms included periodic sieving soil to remove and recycle lead
shot from the berm areas, repairing berm erosion caused by storm events and bullets, and
replacement of berm soils to reduce ricochet (ITRC 2004).
MATERIALS and METHODS
Soil characterization
Approximately 25 kg of berm soil from surface depths of 2 to 20 cm was
collected at each shooting range using stainless steel shovels and trowels. Soil was
Reproduced with permission of the copyright owner. Further reproduction prohibited without permission.

162
collected across the face of berms equal distance apart, within impact zones, and along a
single transect. Aliquots of soil were thoroughly mixed and homogenized. Large, visible
organic constituents including roots, twigs or leaves were removed. Berm soils, although
likely indigenous to the area, were not necessarily from the immediate location of the
shooting ranges. Range operators were not aware of the original source of berm soils.
Geotechnical characteristics of soil are shown in Table 33. Soil particle fractions were
determined by ASTM D422-63. Lead particle sizes were evaluated using standard sieve
sizes 4,10, 60, and 200. Lead chemical associations were determined by sequential
extraction following Ryan et al., 2001. EPA’s Synthetic Precipitation Leaching
Procedure (SPLP) SW846-1312 and Toxicity Characteristic Leaching Procedure (TCLP)
SW846-1311 were completed on each size fraction, and chemical analysis for metals in
soils followed SW846-6010B and 3050B (USEPA, 1999). Soil clays and crystalline
components were characterized by Perkin Elmer XRD using Cu Ka radiation.
Measurements were made using continuous scanning techniques, and XRD patterns were
obtained from 2 to 60° 20. Triplicate distilled/de-ionized (DDI) blanks, triplicate reverse
osmosis water blanks, and triplicate quality control (QC) reagent standards were used for
each analysis. The percent standard deviation of the reagent QC standards < 5 percent.
Blank values were subtracted from the measured values. Soil crystalline phases are
reported in Table 34.
To evaluate lead leaching from operational ranges into stormwater, run-off
samples were taken when possible during field visits. Stormwater samples were
collected from ranges at CA, LAI, LA3, MO, NMa, SD2, VA1 and VA2. Stormwater
samples at the other sites were not collected. Two to four samples were collected with
one duplicate sample from surface storm waters down gradient of berms in natural swales
Reproduced with permission of the copyright owner. Further reproduction prohibited without permission.

163
or constructed drainage, and from 1 to 150 m from range boundaries. Samples were
collected in the middle of streams or channels width and stormwater depth. Dissolved
samples were filtered using a 0.45 pm hourglass filter. Samples were analyzed for total
and dissolved metals following USEPA method SW846-6020.
Batch Study
Batch studies were completed on each soil with and without amendments.
Amendments for batch studies were added at 3% and 5% by mass. Crushed apatite II
(FB) was used as supplied by PIMS NW Inc., and TSP was as potassium phosphate
(KH2PO4) and phosphoric acid (H3PO4 ), which generally contains 43-50% P2 O5
(Budavari, 1989). Soils and amendments were air dried after mixing in the batch test
vessel. Amended soils TCLP solutions were added to batch samples and continuously
shaken for 24 ± 2hr. Leachates from each batch sample were filtered with a 0.45 pm
filter and analyzed using Perkin Elmer Inductively Coupled Plasma Optima 4300 DV.
Columns Set-up
A preliminary screening batch analysis of the VA1 and VA2 soils found the 3%
amendment effective and equilibrated at 28 d. Therefore, 150 g of hand mixed soil was
added with 3% ashed apatite II (FBa) and 3% triple super phosphate (TSP) to 4 cm inside
diameter borosilicate columns that were 30 cm long. Ashed apatite II was utilized to
avoid the build-up of biofilm experienced in the preliminary 28 d study with VA soils.
A column of each soil with no amendment was prepared as controls. The soil for
the test filled approximately 20 cm of each column. TSP and FBa were supplied as
previously referenced, but FBa was further prepared to remove organics by heating in a
muffle furnace for 24 h at 450 °C. To each column 35 mL of tap water was added daily
Monday through Friday, for 5 weeks (approximately 35 days). Effluent was collected in
Reproduced with permission of the copyright owner. Further reproduction prohibited without permission.

164
Nalgene bottles twice weekly (Mondays and Fridays) and analyzed for total As, Cr, Cu,
Fe, Ni, P, Pb, Mn, Mo, Sb, Sn, V, W and Zn by EPA SW846 Method 6010B ICP-MS.
Only total lead results are reported in this paper. Effluent pH was recorded ±0.05 and
masses within ±0.05 g. Each analytical run included triplicate DDI blanks, triplicate RO
water blanks, and triplicate QC reagent standards. Percent standard deviation of the
reagent QC standards was typically less than 5 percent. Leachates from columns were
analyzed by ICP-MS.
RESULTS and DISCUSSION
Physical soil parameters from berm soils had a CEC average = 15.8 meq/100 mL
(SD = 8.1, from 31.5 (SD2) to 4.4 (SC), n =12), pH average = 7.7 (SD = 0.6, from 6 . 8
(LAI) to 8.7 (NV), n = 12), moisture content average = 15.3% (SD = 8.3, from 1.2%
(NV) to 25.8% (LAI), n = 12), and soil texture generally as sand, with some silt and clay
elements (Table 33). Berm average age = 33.7 y (SD = 19.8, from 5 y (VA1) to 60 y
(LAI, LA3, MO), n = 13) indicating seasoned and well weathered impact earthen berms.
Iron and manganese concentrations were within typical soil U.S. nationwide averages.
Edaphic lead associations were reviewed and are presented below in three areas: 1)
particle size and physical characteristics, 2) crystalline phases as determined by XRD,
and 3) metal partitioning by sequential extraction. Results and discussions of field
stormwater sampling, batch and column leaching studies are then presented.
Particle size and physical characteristics:
Particle size distributions are depicted in Figures 43 and 44. The order from
largest to least percent clay for the first three soils were SD2 > LA3 > MO, which were
the same soils as the XRD analysis, but in a slightly different order, LA3 > MO > SD2
Reproduced with permission of the copyright owner. Further reproduction prohibited without permission.

(Table 34). Tables 35, 36 and 37 provide the results of the sequential extraction, lead
associations by fraction and leaching, and stormwater lead concentrations, respectively.
The SD2 and LA3 soils also had small exchangeable lead associations, however, the MO
soil had the highest lead associations in the exchangeable fraction of any soil in this study
(Table 35). The silt-clay fraction has been shown to be an effective transporting
mechanism of heavy metals in stormwaters (King, 1988). Heavy metal associations
generally decreased with smaller size fractions (Table 36), contrary to findings by Zhang
et al., (2003) who noted heavy metal attachment increased with the smaller aggregate
size. This phenomenon may have been due to lead fragments in the larger size fractions
as it is well established surface attachment mechanisms have dominant control of the
distribution of the heavy metals among the various fragment sizes (Zhang et al., 2003).
Lead in stormwaters with suspended solids seem to corroborate the potential for
lead migration. For example, stormwater dissolved lead concentrations for SD2 and MO
were 440 and 118 pg/L, respectively (Table 37). The SD2 and MO ranges topography
had been graded to direct range surface runoff to stormwater collection basins and ditches
where samples for this study were collected. LA3 had a much lower dissolved
concentration at 4.2 pg/L, which likely was a result of the application of TSP
approximately one year prior to this study, implementation of a stormwater BMP that re
sloped the range infield to reduce stormwater surface velocity, and seeded indigenous
Bermuda grass {Cynodon dactylon) in the drainage pattern. The high clay content soil of
LA3, and prior to the BMP implemented in previous work to this study, found 2001
stormwaters had total lead = 2,350 pg/L and in 2002 = 3,730 pg/L (Abdel-Fattah et al.,
2003).
Reproduced with permission of the copyright owner. Further reproduction prohibited without permission.

166
The size and lead association relationship may be further supported in part by the
correlation of the smallest soil fractions and the TCLP results. For example, TCLP and
lead in the < 0.075 mm fraction was significantly correlated for all soils in the study (r2 =
0.82, P « 0.001, n = 13). Similarly, but not as strong was the TCLP and lead correlation
in the from 0.075 to 0.250 grain size (r2 = 0.54, P = 0.004, n = 13), and TCLP and lead in
the from 0.250 to 2.00 grain size (r2 - 0.38, P = 0.02, n - 13). Less lead leached with the
smaller fractions similar to results by Dermatas et al. (2006).
Stormwater field sample results are in Table 37. Order of largest to smallest
dissolved lead concentrations were SD2 > LAI > MO > YA1 > CA > VA2 > LA3 >
NMa. The SD2 and LAI soils lead associations had 13,623 and 172,800 mg/kg in the
from 0.250 to 2.00 mm soil fraction, 5,548 and 2,441 mg/kg lead in the from 0.075 to
2.50 mm fraction and 817 and 11,137 mg/kg in the less than 0.075 mm fraction,
respectively (Table 36). Suspended colloids may be contributing to the total and
dissolved lead in shooting range stormwaters, however no statistical correlation with
stormwater total or dissolved lead and grain size was found. The second soil in the series
was LAI, which had stormwater from a combined M-9 (pistol) and M-60 (machine gun)
range. The LA3 stormwater was from a M-16 range that had the TSP treatment
previously mentioned. This analysis seems to indicate that the LA3 soil treatment may
have reduced lead mobility compared with the LAI soil, with no treatment.
The third soil in the dissolved lead in stormwater series, MO, did not show a
tendency to lead leaching in the batch and column studies. The iron content in the MO
soil at 18,210 mg/kg was greater than any other soil in this survey (Table 33), and may be
inhibiting lead cation exchange with soil micelles, and therefore, contributing to the
elevated lead in stormwaters.
Reproduced with permission of the copyright owner. Further reproduction prohibited without permission.

167
The fourth, fifth, and sixth soils in the series were VA1, CA and YA2 soils,
respectively had high lead amounts in the <0.075 mm fraction than other soils, 8,294
mg/kg, 18,587 mg/kg and 6,111 mg/kg, respectively, potentially providing a ready source
of lead cation surface attached colloids (Table 36). The NMa soil had the least dissolved
lead of those measured (Table 37). The NMa soil also had high gypsum content (75%),
which decreases the electrical double layer between the clay surface and the soil solution
as the double charged calcium ions balance the charge rather than monovalent ions such
as sodium (Quirk, 1994). Because the double charge calcium ions are more strongly
attracted to clay surfaces, sulfate anions are available to bind with free cations such asfy I
Pb to form the insoluble lead sulfate salt.
Lead stormwater concentrations were positively correlated with Fe soil
concentration (r2 = 0.56, P = 0.03, n = 8 ) and Mn soil concentration (r2 = 0.59, P = 0.03, n
= 8 ), which agree with King (1988). However, this disagrees with findings reported by
Amacher et al., (1986) who found a negative correlation. The correlation may be
attributable simply to the soil colloidal transport mechanism that can carry metal cations
in stormwaters.
Heavy metal contaminants in soils have been reported to interfere with adsorption
by apatite. This may have had similar impacts on the natural adsorbent mechanisms in
MO soils of this study and contributed to the observed correlation. Seaman et al. (2001)
found other metals in the soil can reduce the amount and rate at which PO4 becomes
available for precipitation with the heavy metal of concern, changing the formation of
secondary phosphate precipitates. For example, the MO soil with 18,210 mg/kg Fe could
form strengite (FeP0 4 -2 H2 0 ) inhibiting the formation of the desired Pb phosphate
precipitates. Lead also sorbs readily to manganese hydroxides over iron oxides by a
Reproduced with permission of the copyright owner. Further reproduction prohibited without permission.

168
factor of 40 potentially further restricting the mobilization of lead (Hettiarachchi et al.,
2000). MO soil was 875 mg/kg Mn, the highest of the range soils studied.
Crystalline phases
Most soils were dominated by sand or crystalline phase quartz (70-85%) (Table
34). Sandy soils are characteristic of soil types used for small arms firing range impact
berms to reduce ricochet (ITRC, 2004; US EPA, 2001). There were two soils that were
not dominated by quartz; NMa and NV soils had quartz = 5% and 40%, respectively.
The NV soil contained 50% carbonates and 40% quartz, and this range did not
have a constructed impact berm. The NV soil was sampled along the firing lane beds of
an alluvial fan and had the least amount of clay soil of those surveyed. The NV soil also
had the highest gravel content of soil types, which does not readily adsorb heavy metals
(Bradl, 2004). NV soil also had a very low exchangeable lead association (Table 35).
Pb(II) metal partitioning
The sequential extraction found in the residual an average 10,114 mg/kg lead (SD
= 7,783, from 13 to 44,500 mg/kg, n = 13) representing 79.8% of the total lead mass.
This would suggest lead in the earthen berms is mostly in metallic form and not likely
bioavailable or tending to dissolution naturally (Tessier et al., 1979). However, research
by others has found lead pellets and fragments can transform quickly into lead
compounds on the surface of lead fragments and soils (Jorgensen and Willems, 1987).
Berm average age = 33.7 y would provide ample time for oxidization of lead to
hydrocerussite (2 Pb(C0 3 )(0 H)2 ), cerussite (PbCC>3) and massicot (PbO), the most
commonly found Pb(II) forms in range soils (Hardison et al, 2004; Jorgensen and
Willems, 1987). The high lead residual association differed from Cao et al., (2003) who
Reproduced with permission of the copyright owner. Further reproduction prohibited without permission.

169
found shooting range soils in Florida primarily associated with the carbonate fraction,
and Bruell et al., (1999) found 40% of the total lead at a Connecticut shooting range was
in the exchangeable fraction. This difference suggests lead fraction associations will be
uniquely defined for each shooting range.
The exchangeable lead fraction averaged 105 kg (SD = 260.8, from non-detect to
797 mg/kg, n = 13) for all soils (Table 35). The two soils with the highest exchangeable
amounts were CA = 797 mg/kg and SC = 85.1 mg/kg. Average lead in soils extracted as
lead carbonates was 1055 mg/kg (SD = 3,059, from non-detect to 10,270 mg/kg, n = 13),
with the highest carbonates CA =10,270 mg/kg, SD2 = 379 mg/kg, and NE = 303.4
mg/kg. The top four OM & sulfide associations in decreasing order were CA = 6,312
mg/kg, SD2 = 1,793 mg/kg, NE = 448 mg/kg and SC = 372.1 mg/kg. Soil organic
matter, sulfides and carbonates affect the desorption of lead as observed by Suave et al.
(1998) where soils from pH 6.5 to 8 and with higher OM content contribute to a more
labile lead species. There was no correlation between OM & sulfide and lead leachate
(less than 0.075 mm fraction) observed probably because these fractions were such low
percentages of the total lead in the sample. For example, the SD2 soil for all fractions,
excluding the residual, was 0 .1 % of the lead mass (Table 35).
Total soil lead was negatively correlated with moisture and not statistically
significant in this study (r2 = 0.24, P = 0.10, n = 12). This negative correlation agrees
with Lee et al., (2002) who found a significant negative correlation with moisture content
(r2 = 0.95, P < 0.001). There was no correlation found between stormwater lead
concentrations and moisture content (Table 37).
Batch Results
Reproduced with permission of the copyright owner. Further reproduction prohibited without permission.

170
The batch test procedure was used to determine the adsorption effectiveness of
amended versus not amended soils. Non-amended soils served as control. FB and TSP,
as supplied, were both generally effective adsorbents of lead cations with some
exceptions (Table 38). Immobilization of lead for all soils by FB 3% and 5%
amendments averaged 85.3% (SD = 24.5, from 12.4 to 99.7%, n=13) and 88.3% (SD =
24.3, from 19.5 to 100%, n=13), respectively. TSP 3% and 5% amendments average
lead adsorption results were 97.6% (SD = 3.13, from 90.8 to 99.7%, n=13) and 92.7%
(SD = 22.7, from 17.3 to 99.8%, n=13), respectively.
CA, NMb, and SD2 soils had less than optimum adsorption performance by both
amendments. The CA had 631 mg/L OM & sulfides and pH = 7.2, which combination,
OM and near neutral pH, has been shown to preferably form lead OM complexes (Sauve
et al., 1998). NMb and SD2 had high OM compared to other soils in this study at 593
and 179 mg/L, respectively, however soil pH = 8.2 for both. Although a pH = 8.2 is not
near neutral, it is still within the less soluble range for lead compounds and would
partially contribute to the reduced leachate in the NMb and SD2 soils. Likely, the
combination of pH and OM content synergistically operates to sorb metal cations.
Increasing OM was likely a significant contributor to the decreased sorption in all three
soils (Strawn and Sparks, 2000).
The CA soil also had other significant presence of other metals, which has been
shown to inhibit heavy metal immobilization by apatite (Seaman et al., 2001). The CA
soil had 12,727 mg/kg iron, and then coupled with the higher CA exchangeable (797
mg/L) and OM & sulfide (6,312 mg/L) lead fractions, this could further explain the low
FB sorption of the CA soil. In other soils, total iron for MO soil = 18,210 mg/kg, NMb
Reproduced with permission of the copyright owner. Further reproduction prohibited without permission.

171
soil = 5,833 mg/kg, and SD2 soil = 16,993 mg/kg (Table 33). Each of these three soils,
MO, NMb and SD2, also showed reduced FB adsorption.
The TSP 5 % amendment was not effective on the NMa soil (17.3%). The NMa
soil had the highest CEC of the soils in this study group (26 meq/100 mL), and uniquely
the only soil with 75% gypsum content (Table 34). Gypsum (CaS0 4 ) calcium cations
likely dominated the soil colloid exchange sites, and inhibited PO4 ' from reacting with
lead cations. TSP 5% amendment for NMa soil performed poorly, and this was the only
soil with inhibited TSP lead adsorption. TSP performance may be less effective in soils
with high Pb concentrations although no statistical correlation was found in this data set
and the control Pb concentration range was significant, from 1.04 to 1,294 mg/L.
The 3% FB amendment had the lowest overall general adsorption performance
(85.3% , from 12.4 to 99.7%, SD = 24.5, n = 13) and the 3% TSP the best (97.6%, from
90.8 to 99.7 %, SD = 3.1, n = 13). Brown et al. (2005) also found TSP amended 3.2%
acidic soils effective for lead immobilization.
Pb Soil Leaching Behavior in Column Studies
Results of soil column leaching with and without amendments are shown in
Figure 45. The FBa amended soils leached less lead than control for LA3, NMa, SC,
SD2, VA1, and VA2 soils. The TSP amendment leached less lead than control for the
VA1 and VA2 soils likely due to the more porous soil allowing phosphate precipitate
compounds to form more readily. All soils leached lead from control soils except NMb,
NV and SD2 soils. For NMb the combination of pH = 8.2, low clay content, and high
OM/sulfides yielded no lead in leachate during the 5 week period. In the NV soil, a
combination of pH = 8.7, very low moisture = 1.2%, and mostly fine gravel, a moderate
lead amount in the < 0.075 mm fraction, also resulted in no leaching. The SD2 control
Reproduced with permission of the copyright owner. Further reproduction prohibited without permission.

172
soil did not leach during the 5 week study, but for different reasons than the NMb and
NV soils. SD2 had the common denominator of higher pH = 8.2, a higher CEC = 31.5
meq/100 mL, and moderate clay and OM content, which was sufficient to hold metal
cations.
The change in leachate pH from control was an important result as depicted
Figure 46. For both amendments, leachate pH was significantly different than control
leachate pH (FBa: F = 9.47, P = 0.003, n = 120; TSP: F = 115.5, P « 0.001, n = 135).
In general, in the first week leachate pH dropped an average of 3.7 (SD = 0.93, n = 13)
standard units for the TSP amended soils. The TSP leachate pH gradually increased and
approached the control pH by week 5 and did not return to original values except for the
NMa soil as gypsum is known to ameliorate soil acidity. The effects of the TSP leachate
pH reduction can be illustrated by observing the MO soil. The MO soil pH at week 1 =
4.0, week 2 = 4.6, week 3 = 5.0, week 4 = 5.3, and week 5 = 5.6 (Figure 47). The MO
leachate control pH at end of week 1 = 8.5 and by the end of the 5-week study = 8.8. The
MO soil at low pH would see orthophosphate ions precipitated or adsorbed by species of
Fe(III) and other metal di- and trivalent cations capturing available surface and inter
phase micelle Pb(II) adsorption sites. Then presumably available lead cations were
released. The MO soil had the highest iron content of all soils in the study.
An analysis of variance of only the control leachate amounts between the highest
6 clay content soils and the remaining 6 soils as reported above in particle size
distribution found a significant difference in the two groups. This held true using either
the particle size series sequence or XRD series order (F = 11.0, P = 0.002, n = 60 and F =
7.5, P = 0.007, n = 60, respectively). This observation of clay correlation with lead
retention in soils agrees with others (Bradl, 2004; King, 1988; Zhang et al., 2003).
Reproduced with permission of the copyright owner. Further reproduction prohibited without permission.

173
CONCLUSIONS
Soils and stormwaters from impact berms at twelve military shooting ranges were
evaluated for lead leaching. The residual fraction accounted for 79.8% of total lead mass
in all soils studied. All soils leached lead in excess of the EPA RCRA hazardous waste
TCLP limit of 5 mg/L, except the MO soil which had high clay content. Clay content
and grain size are factors in the transport of lead in stormwaters. Significant correlation
was found between lead in stormwater and total iron and manganese in soils. Total soil
lead was negatively correlated with moisture content. FB, FBa and TSP amended soils
generally performed as effective lead adsorbents, although ashed apatite may have had
impacted performance from a degraded internal structure presumably caused by the high
temperature ash process. Column studies found most soils tended to leach lead, except
for those soils with high clay (MO) or high pH (NMb and NV). Amendments containing
3% TSP caused a significant decrease in pH. TSP pH changes may have caused
increased lead leaching in soils as pH was reduced to less than 5 in the first week of
application. The FBa 3% amendment pH generally reflected the control pH for the study
period. Apatite and phosphorus can be effective amendment soil treatments.
The twelve range soils were uniquely characteristic, however essential range
edaphic data can provide the necessary information to effectively manage and control
lead leaching. While no single soil parameter can explicitly predict lead leaching
behavior, each range environmental steward should understand the impact on berm soil
of pH, particle size distribution, CEC, and soil concentration of iron, manganese, and
organic matter. With this minimal information shooting range managers can tailor
appropriate BMP responses, minimize soil leaching behavior and estimate the propensity
of lead cation migration to stormwater.
Reproduced with permission of the copyright owner. Further reproduction prohibited without permission.

174
ACKNOWLEDGEMENTSThe support provided by the U.S. Air Force for this study and the support of
Parsons Inc. staff, Mr. Bob Kull, Mr. John Ledbetter, Ms. Dawn DeMartino, and Mr. Ken
Rice who completed the field and analytical work is gratefully acknowledged. Special
thanks to Dr. Steven Larson, U.S. Army, Vicksburg, MS for volunteering to complete the
soil column study, helped interpret the data, and his corporate expert knowledge of
shooting range soil chemistry; and for Ms. Michelle Thompson, U.S. Army, Vicksburg,
MS who spent many hours laboring to make sure all the sequential extraction, daily pore
volumes, and analysis got done. To Dr. Judith Wright, PIMS NW Inc., whose
professional skill, knowledge and advice were greatly appreciated. A grateful thank you
to the reviewers who made very useful and constructive improvements to the manuscript.
The views expressed in this article are those of the author and do not necessarily reflect
the official views of the U.S. Air Force or Department of Defense.
REFERENCES
Abdel-Fattah, T. M., L. K. Isaacs, and K. B. Payne, 2003. Small arms range lead management issues: activated carbon, molecular sieves (5A and 13X), and naturally occurring zeolites as lead adsorbents. Federal Facilities Environ. J., 14(2), 113-126.
Amacher, M. C., J. Kotuby-Amacher, H. M. Selim, and I. K. Iskandar, 1986. Retention and release of metals by soils: evaluation of several models. Geoderma, 38,131- 154.
Basta, N. T., D. J. Pantone, and M. A. Tabatabai, 1993. Path analysis of heavy metal adsorption. Soil Agron. J, 85, 1054-1057.
Bradl, H. B., 2004. Adsorption of heavy metal ions on soils and soils constituents.Journal of Colloid and Interface Science, 277,1-18.
Brown, S., B. Christensen, E. Lombi, M. McLaughlin, S. McGrath, J. Colpaert, and J. Vangronsveld, 2005. An inter-laboratory study to test the ability of amendments
Reproduced with permission of the copyright owner. Further reproduction prohibited without permission.

175
to reduce the availability of Cd, Pb, and Zn in situ. Environmental Pollution, 138, 34-35.
Bruell, R., N. P. Nikolaidis, and R. P. Long, 1999. Evaluation of remedial alternatives of lead from shooting range soil. Environmental Engineering Science, 16(5), 403- 414.
Budavari, S., ed. 1989. Merck Index. Merck & Co., Inc., Rahway, NJ.
Cao, X., L. Q. Ma, M. Chen, D. W. Hardison, and W. G. Harris, 2003. Leadtransformation and distribution in the soils of shooting ranges in Florida, USA. Science Total Environ, 307, 179-189.
Citeau, L., I. Lamy, F. vanOort, and F. Elsass, 2003. Colloidal facilitated transfer ofmetals in soils under different land use. Colloids and Surfaces A: Physicochem. Eng. Aspects, 217, 11-19.
Cotter-Howells, J., P. Champness, J. Chamock, and R. Pattrick, 1994. Identification of pryomorphites in mine-waste contaminated soils by ATEM and EXAFS. Eur. J. Soil Science, 45, 393-402.
Craig, J. R., J. D. Rimstidt, C. A. Bonnaffon, T. K. Collins, and P. F. Scanlon, 1999.Surface Water Transport of Lead at a Shooting Range. Bulletin of Environmental Contamination and Toxicology, 63(3), 312-319.
deMatos, A. D., M. P. F. Fontes, L. M. D. Costa, and M. A. Martinez, 2001. Mobility of heavy metals as related to soil chemical and mineralogical characteristics of Brazilian soils. Environmental Pollution, 111(3), 429-435.
Dermatas, D., N. Menounou, M. Dadachov, P. Dutko, G. Shen, X. Xu, and V. Tsaneva, 2006. Lead leachability in firing range soils. Environmental Engineering Science, 23(1), 88-101.
Dragun, J. 1998. The soil chemistry of hazardous materials, 2nd ed. Amherst Scientific Publishers, Amherst.
Fayiga, A. O., and L. Q. Ma, 2006. Using phosphate rock to immobilize metals in soil and increase arsenic uptake by hyperaccumulator Pteris vittata. Science Total Environ, 359(1-3), 17-25.
Hardison, D. W., L. Q. Ma, T. Luongo, and W. G. Harris, 2004. Lead contamination in shooting range soils from abrasion of lead bullets and subsequent weathering. Science of the Total Environment, 328,175-183.
Hettiarachchi, G. M., G. M. Pierzynski, and M. D. Ransom, 2000. In situ stabilization of soil lead using phosphorus and manganese oxide. Environmental Science & Technology, 34(21), 4614-4619.
Reproduced with permission of the copyright owner. Further reproduction prohibited without permission.

176
ITRC, 2004. Technical Guideline: Environmental Management at Operation Outdoor Small Arms Firing Ranges, Interstate Technology & Regulatory Council, 22-67.
Jorgensen, S. S., and M. Willems, 1987. The Fate of Lead in Soils: The Transformation of Lead Pellets in Shooting-Range Soils. Ambio: A Journal of the Human Environment, 16(1), 11-15.
King, L. D., 1988. Retention of metals by several soils of the Southeastern United States. Journal of Environmental Quality, 17, 239-246.
Klein, C., and C. Hurlburt. 1993. Manual of Mineralogy. John Wiley & Sons, New York.
Lee, I.-S., O. K. Kim, Y.-Y. Chang, B. Bae, H. H. Kim, and H. H. Baek, 2002. HeavyMetal Concentrations and Enzyme Activities in Soil from a Contaminated Korean Shooting Range. Journal of Bioscience and Bioengineering, 94(5), 406-411.
Lin, Z., B. Comet, U. Qvarfort, and R. Herbert, 1995. The chemical and mineralogical behaviour of Pb in shooting range soils from central Sweden. Environ. Pollution, 89(3), 303-309.
Murray, K., A. Bazzi, C. Carter, A. Ehlert, A. Harris, M. Kopec, J. Richardson, and H. Sokol, 1997. Distribution and mobility of lead in soils at an outdoor shooting range. J. Soil Contamination, 6, 79-93.
Ownby, D. R., K. A. Galvan, and M. J. Lydy, 2005. Lead and zinc bioavailability to Eisenia fetida after phosphorous amendment to repository soils. Environ. Pollution, 136,315-321.
Pickering, W. F., 1986. Ore Geol. Rev. 1.83-146. in Rampley, C.G.and Ogden, K.L.1998. Preliminary studies for removal of lead from surrogate and real soils using a water soluble chelator: adsorption and batch extraction. Environ. Science & Technology, 32(7), 987-993.
Quirk, J.P., 1994. Interparticle forces: A basis for the interpretation of soil physical behaviour. Advances in Agronomy, 53,121-183.
Ryan, J. A., D. Zhang, D. Hesterberg, J. Chou, and D. E. Sayers, 2001. Formation of chlorophyromorphite in a lead-contaminated soil amended with hydroxyapatite. Environ. Science & Technology, 35(18), 3798-3803.
Sauve, S., M. McBride, and W. Hendershot, 1998. Soil solution speciation of lead(II): Effects of organic matter and pH. Soil Sci. Soc. Am. J., 62, 618-621.
Scheuhammer, A. M., and S. L. Norris. 1995. A review of the environmental impacts of lead shotshell ammunition and lead fishing weights in Canada, Rep. No. 88. Minister of Environment Canadian Wildlife Service. Ottawa.
Reproduced with permission of the copyright owner. Further reproduction prohibited without permission.

177
Seaman, J. C., J. S. Arey, and P. M. Bertsch, 2001. Immobilization of nickel and other metals in contaminated sediments by hydroxyapatite addition. Journal of Environmental Quality, 30, 460-469.
Sposito, G. 1989. The Chemistry of Soils. Oxford University Press, New York.
Stansley, W., L. Widjeskog, and D. E. Roscoe, 1992. Lead contamination and mobility in surface water at trap and skeet ranges. Bulletin of Environmental Contamination and Toxicology, 49, 640-647.
Strawn, D. G., and D. L. Sparks, 2000. Effects of Soil Organic Matter on the Kinetics and Mechanisms of Pb(II) Sorption and Desorption in Soil. Soil Science Society Am j, 64, 144-156.
Tessier, A., P. G. C. Campbell, and M. Blisson, 1979. Analytical Chemistry, 51, 844-851.
US EPA. 2001. Best Management Practices for Lead at Outdoor Shooting Ranges. EPA- 902-B-01-001, 86 pp.
US EPA. 1999. Test methods for evaluating solid waste, physical/chemical methods. Washington, D.C., USEPA/SW-846.
Wright, J., L. M. Peurrung, T. E. Moody, J. L. Conca, X. Chen, P. P. Didzerekis, and E. Wyse. 1995. In situ immobilization of heavy metals in apatite mineral formulations. SERDP Technical Report, Dept, of Defense. 154 p.
Yang, J., D. Mosby, S. Casteel, and R. Blanchar, 2001. Lead immobilization using phosphoric acid in a smelter-contaminated urban soil. Environ. Science & Technology, 35, pp. 3553-3559.
Zhang, M. K., Z. L. He, D. V. Calvert, P. J. Stoffella, X. E. Yang, and Y. C. Li, 2003. Phosphorus and Heavy Metal Attachment and Release in Sandy Soil Aggregate Fractions. Journal of Environmental Quality, 67(4), 1158-1167.
Reproduced with permission of the copyright owner. Further reproduction prohibited without permission.

• ShootingRange Locations
Fig. 42. Locations of Military Small Arms Firing Ranges in Nine States
Reproduced with permission of the copyright owner. Further reproduction prohibited without permission.

Reproduced
with perm
ission of the
copyright ow
ner. Further
reproduction prohibited
without
permission.
Table 33. Geotechnical Characteristics of Shooting Range Berm SoilsSoil color followed Munsell method, that is 2.5YR6/8 is hue or measure of chromatic composition - 2.5Yellow-Red, value is degree of lightness or darkness - 6 (black = 0; white =10) and chroma is strength of spectral color - 8 (neutral = 0; strongest = 8). Berm ages are estimates based on interviews with range operations personnel. Soil texture abbreviations are: Cly-clay, Fn - Fine, Lm - Loam, Slty - Silty, Snd - Sand, Sndy - Sandy. LA2 and SD1 impact berm soils were not analyzed.
Parameter CA LAI LA3 MO NE NMa NMb
Moisture % 2.1 25.8 20.9 18.9 15.4 24 14.4
Bulk Density (g/cm3) 1.89 1.59 1.58 1.62 1.59 1.36 1.61
Specific Gravity 2.64 2.64 2.71 2.52 2.59 2.94 2.50
pH 7.2 6.8 7.3 7.2 8.1 7.4 8.2
CEC (meq/100 ml) 13.5 5.6 9.4 20.1 15.5 26.0 17.9
Fe (mg/kg) 12727 1656 4237 18210 1312 1068 5834
Mn (mg/kg) 502 37.9 93.9 875 41.5 13.3 155
Soil color 2.5YR6/8 2.5YR3/6 5YR3/4 10YR4/3 7.5YR3/1 5YR6/6 5YR4/6
Soil Texture Lm Cly Lm Slty Cly Slty Cly Lm Sndy Lm Sndy Cly Lm
Berm Age (yr) 41 60 60 60 34 39 10+
+ S AFR was constructed in 1961. In 1994 an earthen berm was constructed 25 m from firing line. Old berm at 100 m was abandoned.++ There is no impact earthen berm at this range. Sample was taken approximately 350 m on centerline from firing line.+++ SAFR was constructed in 1967, but after a storm in 1986, the berm was pushed back and a new berm constructed.

Reproduced
with perm
ission of the
copyright ow
ner. Further
reproduction prohibited
without
permission.
Table 33 continuedParameter NV SC SD2 VA1 VA2
Moisture % 1.2 7.9 23.8 11.3 17.7
Bulk Density (g/cm3) 1.80 1.86 1.47 1.87 1.67
Specific Gravity 2.66 2.54 2.62 2.62 2.60
pH 8.7 8.1 8.2 7.7 7.7
CEC (meq/100 ml) 19.3 4.4 31.5 8.7 17.7
Fe (mg/kg) 6971 2710 16993 653 385
Mn (mg/kg) 185 7.63 914 6.90 5.45
Soil color 10YR6/3 2.5YR4.5/8 10YR4/2 7.5YR4/1 7.5YR2.5/1
Soil Texture Fn Slty Snd Sndy Cly Lm Cly Sndy Lm Sndy Lm
Berm Age (yr) 22++ 18t+t 15 5 40
+ SAFR was constructed in 1961. In 1994 an earthen berm was constructed 25 m from firing line. Old berm at 100 m was abandoned.++ There is no impact earthen berm at this range. Sample was taken approximately 350 m on centerline from firing line.+++ SAFR was constructed in 1967, but after a storm in 1986, the berm was pushed back and a new berm constructed.
00o

Reproduced with
permission
of the copyright owner.
Further reproduction prohibited
without permission.
Table 34. Percent Soil Crystalline Phases as Determined by XRDQuartz and cristobalite are forms of SiC>2 . Impact berm soil crystalline phases were predominantly sands with some clay. ND = not detected
CrystallinePhases
CA LAI LA2 LA3 MO NE NMa. NMb NV SC SD2 VA1 VA2
Clay -12-14 -16-18 -18-20 -25 -20-22 -14-16 1 i -4 -13-15 -4 -6 1I -17-19 -16-18 -10-12
Quartz -70 -75 -75 -70 -70
o00I -5 -80 -40 -85 -70 -80 -85
Cristobalite -10 ND ND ND ND ND ND ND ND ND ND ND ND
Feldspar -2-3 -5 -5 -2 -5-7 -5 -2 -5 -2-3 -1-2 -2-3 -2 -2
Carbonates ND ND ND ND ND ND -10 ND -50 ND -10 -1 -1
Gypsum ND ND ND ND ND ND -75 ND ND ND ND ND ND
Iron Oxide -1-2 <0.5 <0.5 <0.5 ND -1 ND ND <1 ND ND ND ND

182
coarse gra\el | fine gravel |crs sand| med sand fine sand claysiltr 100
- 90
- 80 £
- 70
60
- 50
40
- 30
- 10
100000 10000 1000 100
Particle Size (pm)
CA LA1 LA3 MO NE
Fig. 43. Particle Size DistributionSample LA2 was not analyzed for particle sizes.
Reproduced with permission of the copyright owner. Further reproduction prohibited without permission.
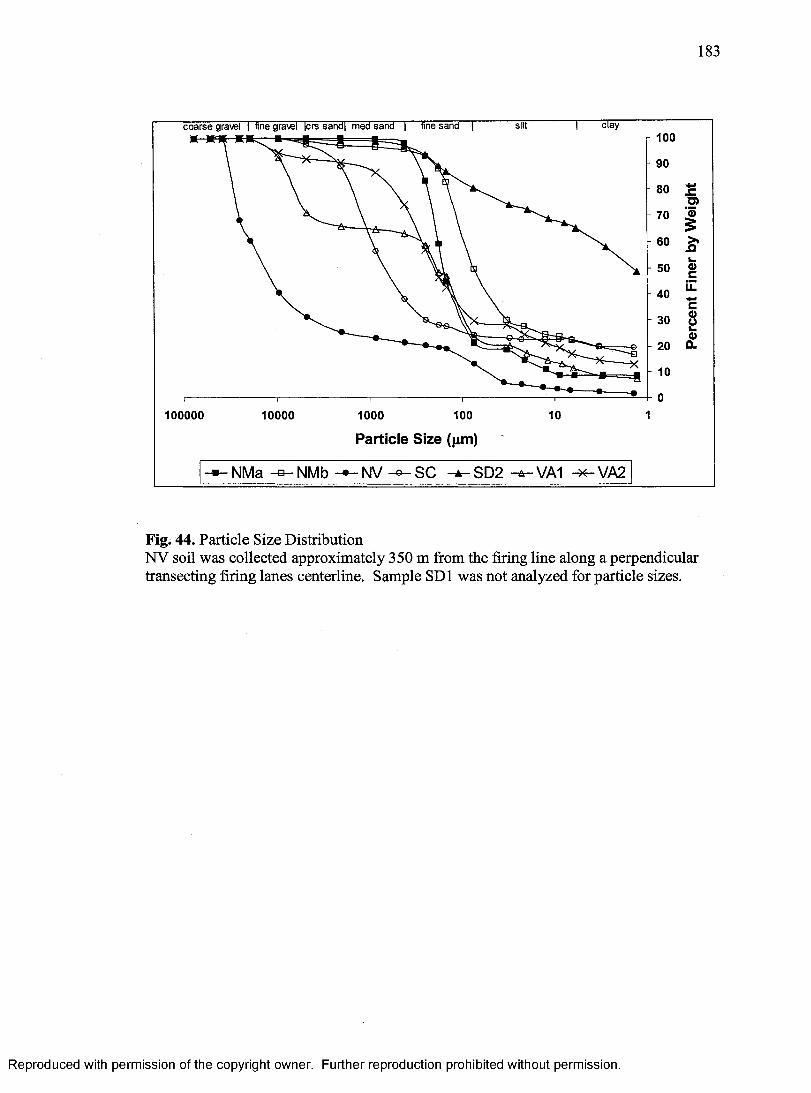
183
coarse gravel I fine gravel |crs sand | med sandK K-M K-Mc—■ -41____1 »___
claysiltfine sand |100
90
70
60
50
40
k.
20
100000 10000 1000
Particle Size (pm)100
NMa NMb SD2
Fig. 44. Particle Size DistributionNV soil was collected approximately 350 m from the firing line along a perpendicular transecting firing lanes centerline. Sample SD1 was not analyzed for particle sizes.
Reproduced with permission of the copyright owner. Further reproduction prohibited without permission.

Reproduced with
permission
of the copyright owner.
Further reproduction prohibited
without permission.
Table 35. Bulk Soil Sequential Extraction Pb Associations in mg/kgValues are the average o f triplicate samples. Values <0.05 indicate results less than the detection limit o f 0.050 mg/L. OM = Organic Matter; SD - Standard Deviation._________________________________________________________________________________ _
Parameter CA LAI LA2 LA3 MO NE NMa NMb NV SC SD2 VA1 VA2
Exchangeable797.0 <0.05 <0.05 6 . 1 24.4 1 0 . 6 0 . 1 2.5 <0.05 85.1 6.9 12.3 <0.05
SD79.8 0 . 0 0 . 0 0.4 1 . 6 0 . 1 0 . 0 0 . 0 0 . 0 36.9 1.3 21.3 0 . 0
Percent 1 . 2 0 . 0 0 . 0 0.5 4.3 0 . 1 0 , 0 4.6 0 . 0 2 . 8 0 . 1 0.7 0 . 0
Carbonates 10,270.2 <0.05 98.0 50.6 127.7 303.4 2 . 2 1 0 . 2 39.0 234.4 379.3 8 6 . 0 <0.05
SD 2,851.3 0 . 0 169.8 1 2 . 2 34.6 124.0 0,7 1 . 8 38.1 16.3 40.2 2 . 8 0 . 0
Percent 15.0 0 . 0 2.4 3.8 22.3 2.7 0 . 0 18.5 0.5 7.6 2 . 8 4.7 0 . 0
Fe-Mn 4,673.4 <0.05 61.2 6 8 . 6 139.7 127.6 0 , 8 16.5 33.2 74.6 398.2 <0.05 <0.05SD 3,957.5 0 . 0 33.1 24.1 24.7 60.2 0.4 2.9 14.7 22.9 2 1 0 . 6 0 . 0 0 . 0
Percent 6 . 8 0 . 0 1.5 5.2 24.4 1 . 1 0 . 0 30.1 0.5 2.4 3.0 0 . 0 0 . 0
OM & sulfides
6,312.0 <0.05 158.2 163.0 72.0 447.8 1 . 6 13.1 104.0 372.1 1,792.5 <0.05 <0.05
SD 636.2 0 . 0 23.5 41.8 46.5 57.6 0.4 3.4 83.3 68.3 1,693.1 0 . 0 0 . 0
Percent 9.2 0 . 0 3.8 12.4 1 2 . 6 3.9 0 . 0 23.8 1.5 1 2 . 1 13.5 0 . 0 0 . 0
Residual 46,466 1,475 3,816 1,030 208 10,491 44,500 12.7 6,925 2,321 10,747 1,736 1,742SD 35,089 640 5,809 1,123 38 4,834 23,160 0.7 11,417 1,040 17,553 141 326Percent 67.8 1 0 0 . 0 92.3 78.1 36.4 92.2 1 0 0 . 0 23.1 97.5 75.2 80.7 94.6 1 0 0 . 0
Total 68,519 1,475 4,134 1,319 572.4 11,381 44,504 54 7,102 3,087 13,324 1,834 1,742Percent 1 0 0 1 0 0 1 0 0 1 0 0 1 0 0 1 0 0 1 0 0 . 1 0 0 1 0 0 1 0 0 1 0 0 1 0 0 . 1 0 0
004

Reproduced with
permission
of the copyright owner.
Further reproduction prohibited
without permission.
Table 36. Lead Fractional and Soil Leaching AssociationsTotals are in units mg/kg and SPLP and TCLP are in units mg/L. SD = stand ard deviation. Results are averages of triplicates.
Grain Size (mm)
AnalysisCA+ LAI LA2 LA3 MO NE NMa NMb
>4.75 Total - 42523 100903 8462 408 - 3060 -
SD - 6476 132868 10192 64.1 - 161 -
2.00 to 4.75 Total 45240 165700 211500 10110 745 33487 3227 176SD 401 13811 54784 0 86.1 9497 156 12.2
0.250 to 2.00 Total 68597 172800 86863 114 1377 70690 8955 49.6SD 15216 29012 10533 137 50.1 66113 1252 11.5
0.250 to 2.00 SPLP 4.93 24.5 5.17 10.4 5.13 4.19 0.387 0.053SD 0.71 2.25 0.578 4.05 2.17 1.37 0.142 0.005
0.250 to 2.00 TCLP 1323 2629 1637 1115 0.304 5786 267 5.13SD 13.0 66.7 85.1 210 0.105 7496 24.5 2.17
0.075 to 0.250 Total 22383 2441 1047 <0.05 857 11057 2436 19.6SD 382 152 40.1 0 14.5 136 95.6 0.850
0.075 to 0.250 SPLP 3.30 0.326 0.299 0.580 0.794 0.840 0.203 <0.050SD 0.23 0.284 0.005 0.186 0.874 0.383 0.134 0.0
0.075 to 0.250 TCLP 970 617 92.2 313 0.237 744 137 0.794SD 23.9 54.8 18.8 14.4 0.169 22.3 7.73 0.874
< 0.075 Total 18587 11137 3753 1.36 136 7166 3799 41.3SD 2843 297 45.2 0.47 118 488 72.3 5.35
<0.075 SPLP 1.58 2.11 0.064 0.521 0.121 0.391 0.151 <0.050SD 0.13 0.358 0.009 0.034 0.026 0.144 0.023 0.0
< 0.075 TCLP 716 349 106 56.7 0.050 308 333 0.054SD 5.69 262 3.24 7.02 0.0 13.2 227 0.007
+ 2,00 to 4.75 mm SPLP: CA = 0.718 mg/L, SD=-.635; NV = 0.050 mg/L, SD = 0.0 and 0.250 to 2.00 mm TCLP: CA = 967 mg/L, SD = 221 and NV = 0.469 mg/L, SD = 0.030
00

Reproduced with
permission
of the copyright owner.
Further reproduction prohibited
without permission.
Table 36 continued
Grain Size (mm) Analysis
NV+ SC SD2 VA1 VA2
>4.75 Total 7685 13297 - 36710 32100SD 0.0 172 - 7948 1806
2.00 to 4.75 Total 12111 48883 - 36410 13323SD 4877 8274 - 27622 1539
0.250 to 2.00 Total 3534 4.95 13623 3475 7497SD 395 1.79 3718 138.2 2893.9
0.250 to 2.00 SPLP 1.01 0.064 - 3.79 2.06SD 0.22 0.016 - 0.809 0.816
0.250 to 2.00 TCLP 292 605 96.4 417 727SD 224 42.6 34.0 32.09 98.18
0.075 to 0.250 Total 668 2634 5548 1239 1636SD 93.7 2287 7017 15.52 112.9
0.075 to 0.250 SPLP 0.212 0.180 0.050 1.21 0.944SD 0.020 0.057 0.0 0.287 0.313
0.075 to 0.250 TCLP 32.7 484 6.04 77.4 96.2SD 2.54 15.1 0.622 2.32 6.37
< 0.075 Total 907 12530 817 8294 6111SD 14.8 244 45.1 198.03 67.55
< 0.075 SPLP 0.156 1.24 0.053 3.31 0.930SD 0.051 0.674 0.005 0.698 0.229
< 0.075 TCLP 8.10 727 1.29 11.7 6.54SD 2.97 14.2 0.069 5.16 4.63
00ON

Reproduced with
permission
of the copyright owner.
Further reproduction prohibited
without permission.
Table 37. Measured Stormwater Lead ConcentrationsMeasurements are in Dg/L. Average dissolved Pb = 104.0 Dg/L (SD = 152, n — 17). At least one field duplicate was taken for each sampling event. NS = not sampled, n = number of samples. Std Dev = standard deviation. Not applicable fields were left blank.
Parameter CA LAI LA2 LA3 MO NE NMa NMb
Total Pb 46.0 490 NS 5.2 26008 NS 27.8 NSStd Dev 34.3 44163 19.8
Dissolved Pb 29.2 310 NS 4.2 118 NS 4.1 NSStd Dev 20.9 99.1 2.7
n 4 1 1 3 4
Parameter NV SC SD2 VA1 VA2
Total Pb NS NS 9250 600 1600
Std Dev 6718
Dissolved Pb NS NS 440 61 26
Std Dev 14.1
n 2 1 1
00-4

Reproduced with
permission
of the copyright owner.
Further reproduction prohibited
without permission.
Table 38. Batch Study ResultsAmendments with percent adsorbed < 90.3% have been highlighted by bold-lined boxes. Control and adsorbed amounts are in units mg/L. Results are averages of triplicates. FB = Apatite II; TSP = triple super phosphate; SD = Standard Deviation. <0.050 indicates instrument detection limit.
Amendment CA LAI LA2 LA3 MO NE NMa NMb
ControlSD
129492.1
26376.7
15459.4
839115.8
1.0420.49
70391.1
84.370.3
153.951.3
3% FB SD
113495.2
2.380.89
3.202.00
105164.5
0.1980.03
27151.1
0.6870.12
<0.050.0
% Adsorbed 12.4 99.1 97.9 87.5 81.0 61.5 99.2 99.0
5% FB SD
104293.0
1.000.23
0.820.12
3.700.88
0.1400.16
6.574.52
0.6750.12
<0.050.0
% Adsorbed 19.5 99.6 99.5 99.6 86.6 99.1 99.2 99.0
3% TSP SD
9.040.57
1.070.19
0.490.09
3.981.11
0.0860.20
2.290.29
171+35.1
<0.050.0
% Adsorbed 99.3 99.6 99.7 99.5 91.8 99.7 - 99.0
5% TSP SD
4.870.35
0.440.17
0.290.22
1.790.72
<0.050.0
1.860.55
69.734.1
2.870.96
% Adsorbed 99.6 99.8 99.8 99.8 95.2 99.7 17.3 98.0
+ Mass removed was greater than control. ^0000

Reproduced with
permission
of the copyright owner.
Further reproduction prohibited
without permission.
Table 38 continued_______________________Amendment NV SC SD2
Control 44.7 566 15.5
SD 26.0 55.6 5.0
3% FB 1.37 5.35 2.30SD 1.62 4.0 1.6
% Adsorbed 97.0 90.3 85.2
5% FB 20.7 1.23 1.29SD 23.0 0.18 0.36
% Adsorbed 53.7 99.8 91.7
3% TSP 0.599 2.37 0.492SD 0.12 0.27 0.13
% Adsorbed 98.7 99.6 96.8
5% TSP 0.389 1.59 0.248SD 0.82 0.13 0.16
% Adsorbed 99.1 99.7 98.4
ass removed was greater than control.
VA1 VA2
266 311133.1 91.3
1.01 1.050.55 0.40
99.6 99.7
0.110 1.080.05 0.25
99.9 100.0
8.87 28.67.00 16.1
96.7 90.8
2.15 3.230.66 3.53
99.2 99.0
00VO

Reproduced with
permission
of the copyright owner.
Further reproduction prohibited
without permission.
Pb Leaching from CA Soil (30610 mgfkg)
2.500 2.000
« 1.500 | 1.000 - 0.500
0.000dCL
2 40 53
Veek
- Control FBa • ■ TSP
Pb Leaching from LA3 Soil (1213 mgfkg)
P Aet 0.040E0.030
exo*mt
0.020
0.010 • -
£ 0.000 ! h 0 51 2 3 4
Veek
- Control - ■ FBa - ■ TSP
Pb Leaching from NMa Soil (2739 mgfkg)
m 0.100
£ 0.000
Veek
■ Control - - FBa - -T S P
Pb Leaching from MO Soil (519 mgfkg)
Pb Leaching from NE Soil (1694 mgfkg)
Pb Leaching from LAI Soil (4402 mgfkg)
5 0.200
1 0-150'£ 0.100 ()2 0.050
£ 0.00020 4 53
'B 0.200 s0.150cn e
x 0.100
* 0.050
£ 0.000 9 -
2 50 1 3 4
0.200
0.150
0.100
0.050
0.00052 430 1
Veek Veek Veek
■ Control - . FB a- •TSP - Control - - FBa - -T SP - Control - - FBa - -T S P
Fig. 45. Lead Leaching Behavior in Soils From Column StudiesControl had no amendments added. Amounts are accumulative over 5 week study period. Original soil lead concentration is shown in parenthesis. Amendment 3% FBa reduced the amount of lead released compared to control for LA3 and NMa soils. Amendment 3% TSP did not reduce the amount of lead released compared to control for any of these soils.
h-*LOO

Reproduced with
permission
of the copyright owner.
Further reproduction prohibited
without permission.
Pb Leaching from NMb Soil (71 mgfkg)
AASi 0.050JL0.040Sie 0.030x0 0.0204>mi 0.010
CL 0.000 -9----- *-2 3
Veek
■ Control • •F B a- •TSP
Pb Leaching from NV Soil (4518 mgfkg]
atejtoaa-jaCL
0030 •0020 •
noon ■------------« ----------- V----------- « ----------- EB----------- 11
2 3
Veek
- Control FB a- •T S P
Pb Leaching from SC Soil (2677 mgfkg)
0.050
A 0.040
S 0.030
2 0.020■J 0.010
a. 0.000
Veek
- Control - - FBa - •T SP
Pb Leaching from SD2 Soil (1822 mgfkg)
Pb Leaching from VA1 Soil (2672 mgfkg)
Pb Leaching from VA2 Soil (788 mgfkg)
5 0.080 E" 0.060 fIE 0.040 o• 0.020
£ 0.0002 3
Veek
a 0.200
f£ 0.100 «»* 0.050
£ 0.000o 2 3 54
0.400
“ 0.300
1 0.200
52 3 40Veek Veek
■ Control ■ -F B a - ■TSP - Control FBa - • TSP - Control ■ ■ FBa - ■TSP
Fig. 45. ContinuedControl had no amendments added. Amounts are accumulative over 5 week study period, except VA1 and VA2 study period was 27 days. Original soil lead concentration is shown in parenthesis. Amendment 3% FBa reduced the amount of lead released compared to control for the SC, YA1 and VA2 soils. Amendment 3% TSP reduced the amount of lead released compared to control for VA1 and VA2 soils.

Reproduced with
permission
of the copyright owner.
Further reproduction prohibited
without permission.
L eachate pH from NM a S o ilL eachate pH from CA S o il
VeekControl ControlControl
L eachate pH from MO S o il
ControlControlControl
Fig. 46. Column Study Leachate pHFBa leachate pH was significantly different than control (F = 9.47, P = 0.002, n = 119) and TSP leachate pH was also significantly different than control (F = 115.5, P « 0.001, n = 135). Initial pH drop after TSP treatment was substantial and in most cases never returned to control value. LA3 soil with TSP amendment had no leachate at the end of week 1, and FBa amended soil had no leachate at the end of week 1,3,4 and 5. NE soil with FBa amendment had no leachate at the end of weeks 3 and 5.

Reproduced with
permission
of the copyright owner.
Further reproduction prohibited
without permission.
Leachate pH from NMb Sofl Leachate pH from NV Soil
FBa TSP Control TSPFBa
Leachate pH (rom SD2 Soil Leachate pH (rom SC Soil
TSPControl Control FBa TSP
Fig. 46. ContinuedFBa and TSP leachate pH were significantly different than control (see Figure 47 note). VA1 and VA2 soils leachate pH were not measured. TSP leachate pH drop was significant in the first week of use, and returned within 1 pH standard unit for NV and SD2 soils by the end of the 5-week study period.

194
C. FORMATION CONSTANTSFormation constants are from Puigdomenech, I. (2004), "MEDUSA, Make Equilibrium Diagrams Using Sophisticated Algorithms and HYDRA, Hydro Chemical Equilibrium - Constant Database." Royal Institute of Technology. Downloaded 3 Apr 2006 from http:/www.kemi.kth.se/medusa.
Equilibrium Complexes Log K Cation Soluble or Solid________________________________________________________ Complexes_____34 H+ + 19Mo04 2- = Mol9059 4- 198 Mo2+ Soluble3 P04 3- + Cl- + 5 Pb 2+ = Pb5(P04)3Cl 84.43 Pb2+ Solid11 H+ + 7 Mo04 2- = H3Mo7024 3- 67.92 Mo2+ Soluble10 H+ + 7Mo04 2- = H2Mo7024 4- 64.27 Mo2+ Soluble3 P04 3- + 5 Pb 2+ = H+ + Pb5(P04)30H 62.79 Pb2+ Solid9H+ + 7 Mo04 2- = HMo7024 5- 59.44 Mo2+ Soluble8 H+ + 7 Mo04 2- = Mo7024 6- 52.99 Mo2+ SolubleH+ + 4 Ca2+ + 3 P04 3- = Ca4H(P04)3 46.9 Ca2+ Solid2 P04 3- + 3 Pb 2+ = Pb3(P04)2 44.362 Pb2+ Solid5 Ca 2+ + 3 P04 3- = H+ + Ca5(P04)30H 40.459 Ca2+ Solid4 H+ + 2 P04 3- + Cu2+ = Cu(H2P04)2 40.15 Cu2+ Soluble4 H+ + Ca 2+ +2 P04 3- = Ca(H2P04)2 39.05 Ca2+ Soluble2 P04 3- + 3 Cu 2+ = Cu3(P04)2 36.85 Cu2+ Solid3H+ + 2P043- + Cu2+ = CuH3(P04)2 36.41 Cu2+ Soluble2 P04 3- + 3 Fe 2+ = Fe3(P04)2:8H20 36.0 Fe2+ Solid2 P04 3- + 3 Cu 2+ = Cu3(P04)2:3H20 35.12 Cu2+ Solid2 P04 3- + 3 Zn 2+ = Zn3(P04)2:4H20 32.04 Zn2+ Solid2 H+ + P04 3- + Cu2+ = CuH2(P04)2 2- 31.76 Cu2+ Soluble2 P04 3- + 3 Ni 2+ = Ni3(P04)2 31.3 Ni2+ SolidCa 2+ + 4 C03 2- + 3 Mg 2+ = CaMg3(C03)4 29.968 Ca2+,
Mg2+Solid
3 Ca2 + 2 P043- = Ca3(P04)2 28.92 Ca2+ SolidH+ + P04 3- + Mn 2+ = MnHP04 25.293 Mn2+ Solid2 P04 3- + 3 Mn 2+ = Mn3(P04)2 23.827 Mn2+ SolidH+ + P04 3- + Pb 2+ = PbHP04 23.806 Pb2+ Solid3 Mg 2+ + 2 P04 3- = Mg3(P04)2 23.28 Mg2+ Solid2 H+ + P04 3- + Fe2+ = FeH2P04+ 22.253 Fe2+ Soluble3 H+ + P04 3- = H3P04 21.702 Soluble2H+ + P043- + Cu2+ = CuH2P04+ 21.45 Cu2+ Soluble2H+ + P04 3- + Pb 2+ = PbH2P04+ 21.073 Pb2+ Soluble2 H+ + Mg 2+ + P04 3- = MgH2P04+ 21.066 Mg2+ Soluble2H+ + Ca2+ + P04 3- = CaH2P04+ 20.961 Ca2+ SolubleC03 2- + 2 Cl- + 2 Pb 2+ = PbC12:PbC03 19.81 Pb2+ Solid2H+ + P04 3- = H2P04- 19.553 Mo2+ SolubleH+ + Ca 2+ + P04 3- = CaHPQ4 2H20 18.955 Ca2+ Solid
Reproduced with permission of the copyright owner. Further reproduction prohibited without permission.

Equilibrium Complexes
H+ + Mg 2+ + P04 3- = MgHP04.3H20 2 C03 2- + 3 Pb 2+ = 2 H+ + Pb(0H)2:2PbC03 Ca 2+ + 2 C03 2- + Mg 2+ = CaMg(C03)2
2 C03 2- + 3 CU 2+ = 2H+ + Cu3(C03)2(0H)22 H+ + C03 2- = H2C03H+ + P04 3- + Cu2+ = CuHP04H+ + P04 3- + Fe 2+ = FeHP04Mo04 2- + Pb 2+ = PbMo04
H+ + P04 3- + Pb2+ = PbHP04 H+ + Mg2+ + P04 3- = MgHP04 H+ + Ca2+ + P04 3- = CaHP04 Na+ + 7 Si(OH)4 = H+ + NaSi7013(0H)3:3H20 H+ + C03 2- + Pb 2+ = PbHC03+C03 2- + Pb 2+ = PbC03H+ + C03 2-+ Cu2+ = CuHC03+H + NH3 + P043- + Fe 2+ = FeNH4P04 H+ + Na+ + P04 3- = NaHP04- H+ + NH3 + Mg 2+ + P04 3- = MgNH4P04 4 NH3 + Cu 2+ = Cu(NH3)4+2 H+ + C03 2- + Ni 2+ = NiHC03+H+ + C03 2- + Zn 2+ = ZnHC03+2 Sb(OH)3 = a-Sb203H+ + P04 3-=HP04 2-H+ + C032- + Fe2+ = FeHC03+H+ + C03 2- + Mn 2+ = MnHC03+2H+ + Mo04 2- = H2Mo04 H+ + Ca2+ + C032- = CaHC03+H+ C03 2- + Mg2+ = MgHC03+C03 2- + Mn 2+ = MnC03 H+ + 2 C03 2- + 3 Na+ =NaHC03 :Na2C03:2H20 H+ + C03 2- + Na+ = NaHC032 C03 2- + Pb 2+ = Pb(C03)2 2- C03 2- + Fe 2+ = FeC03H+ + NH3 + S04 2- = NH4S04- H+ + C03 2- = HC03-3 NH3 + Cu2+ = Cu(NH3)3+2 C03 2- + Zn 2+ = ZnC03:H20 2 C03 2- + Ni 2+ = Ni(C03)2 2-
Log K Cation Soluble or Solid___________________Complexes
18.175 Mg2+ Solid17.46 Pb2+ Solid17.09 Ca2+,
Mg2+Solid
16.908 Cu2+ Solid16.681 Soluble16.45 Cu2+ Soluble
15.946 Fe2+ Soluble15.62 Pb2+,
Mo2+Solid
15.475 Pb2+ Soluble15.216 Mg2+ Soluble15.085 Ca2+ Soluble
14.3 Na+ Solid
13.229 Pb2+ Soluble13.13 Pb2+ Solid
13.029 Cu2+ Soluble13.0 Fe2+ Solid
12.636 Na+ Soluble12.6 Mg2+ Solid12.5 Cu2+ Soluble
12.469 Ni2+ Soluble12.429 Zn2+ Soluble12.365 Sb3+ Soluble12.346 Soluble12.329 Fe2+ Soluble12.279 Mn2+ Soluble11.67 Mo2+ Solid
11.435 Ca2+ Soluble11.399 Mg2+ Soluble11.13 Mn2+ Solid
11.124 Na+ Solid
10.877 Na+ Solid10.64 Pb2+ Soluble10.45 Fe2+ Solid
10.362 Soluble10.329 Soluble
10.3 Cu2+ Soluble10.26 Zn2+ Solid10.11 Ni2+ Soluble
Reproduced with permission of the copyright owner. Further reproduction prohibited without permission.

196
Equilibrium Complexes
H+ + C03 2- + Na+ = NaHC03 C03 2- + Zn 2+ = ZnC03 2 C03 2- + Cu2+ = Cu(C03)2 2- P04 3- + Cu 2+ + 2 Pb 2+ = 3 H+ + Pb2CuP04(OH)3:3H20 2 C03 2- + Zn 2+ = Zn(C03)2 2- C03 2- = Cu 2+ = CuC034 NH3 + Zn 2+ = An(NH3)4 2+H+ + NH3 = NH4+6 NH3 + Ni 2+ = Ni(NH3)6+25 NH3 + Ni 2+ = Ni(NH3)4+2 4 C03 2- + 5 Mg 2+ = 2 H+ + Mg5(C03)4(0H)2:4H20Ca 2+ + C03 2- = CaC03 2 Sb(OH)3 = Sb203 2 H+ + Mo04 2- = H2Mo04 C03 2- + Mg 2+ = MgC03 Ca 2+ + Mo04 2- = CaMo04
4 NH3 + Ni 2+ = Ni(NH3)4+2 S04 2- + Pb 2+ = PbS042 NH3 + Cu2+ = Cu(NH3)2+2 C03 2- + Pb 2+ = PbC033 NH3 + Zn 2+ = Zn(NH3)3 2+C03 2- + Ni 2+ = NiC03 C03 2- + Ni 2+ = NiC03 C03 2- + Cu2+ = CuCo33 NH3 + Ni 2+ = Ni(NH3)3+2Mg2+ + P04 3- = MgP04-4H+ + 2C1- + Mo04 2- = Mo02C12Ca2+ + P04 3- = CaPOr-C03 2- + Mg 2+ = MgC03:3H20C03 2- + Zn 2+ = ZnC03C03 2- + 2 Cu 2+ = 2 H+ + Cu2C03(OH)2C03 2- + Mn 2+ = MnC032 NH3 + Ni 2+ = Ni(NH3)2+22 NH3 + Zn 2+ = Zn(NH3)2 2+2 Cl- + Pb 2+ = PbC12 Ca 2+ + S04 2- = CaS04:2H20 C03 2- + Fe 2+ = FeC03 Ca 2++ S04 2-= CaS04 H+ + Mo04 2- = HMo04-
LogK Cation Soluble or Solid Complexes
10.079 P04- Soluble10 Zn2+ Solid
9.83 Cu2+ Soluble9.79 Pb2+,
Cu2+Solid
9.63 Zn2+ Soluble9.63 Cu2+ Solid9.3 Zn2+ Soluble
9.237001 Soluble9 Ni2+ Soluble
8.9 Ni2+ Soluble8.762 Mg2+ Solid
8.48 Ca2+ Solid8.48 Sb3+ Solid8.22 Mo2+ Soluble
8.029 Mg2+ Solid7.95 Ca2+,
Mo2+Solid
7.8 Ni2+ Soluble7.79 Pb2+ Solid7.45 Cu2+ Soluble7.24 Pb2+ Soluble7.1 Zn2+ Soluble
6.87 Ni2+ Soluble6.84 Ni2+ Solid6.73 Cu2+ Soluble6.7 Ni2+ Soluble
6.589 Mg2+ Soluble6.5 Mo2+ Soluble
6.459 Ca2+ Soluble5.621 Mg2+ Solid
5.3 Zn2+ Soluble5.179 Cu2+ Solid
4.9 Mn2+ Soluble4.89 Ni2+ Soluble4.8 Zn2+ Soluble
4.77 Pb2+ Solid4.58 Ca2+ Solid4.38 Fe2+ Soluble4.36 Ca2+ Solid4.23 Mo2+ Soluble
Reproduced with permission of the copyright owner. Further reproduction prohibited without permission.

197
Equilibrium Complexes
NH3 + Cu2+ = CuNH3+2 Si(OH)4 = S i02 (crystalline)2 S04 2- + Pb 2+ = Pb(S04)2 2-2 S04 2- + Zn 2+ = Zn(S04)2 2- Ca 2+ + C03 2- = CaC034 NH3 + Fe2+ = Fe(NH3)4+2 H+ + Ca2+ + S 04 2- = CaHS04+H+ + S 04 2- + Fe2+ = FeHS04+3 NH3 + Fe2+ = Fe(NH3)3+2 C03 2- + Mg 2+ = MgC03 S04 2- + Pb 2+ = PbS04 NH3 + N i2 + = NiNH3+2 Si(OH)4 = S i02 (amorphous)3 H+ + 4 Cl- + Sb(OH)3 = SbC14-2 Cl- + Sn 2+ = SnC123 Cl- + Sn 2+ = SnC13-S 04 2- + Cu 2+ = CuS04:5H20 2 NH3 + Fe2+ = Fe(NH3)2+2 Mg2+ + S 04 2- = M gS04 S04 2- + Zn 2+ = ZnS04 S 04 2- + Ni 2+ - NiS04:7H 20 S042- + Cu2+ = CuS04 Ca2+ + S 04 2- = CaS04 NH3 + Zn 2+ = ZnNH3 2+S04 2- + Ni 2+ = N iS04 S04 2- + Fe 2+ = FeS04 S04 2- + Mn 2+ = M nS04 S04 2- + Fe 2+ = FeS04:7H20 Mg 2+ + S 04 2- = M gS04:7H20 S04 2- + Ni 2+ = NiS04:6H 20 H+ + S 04 2- = H S04- Mg 2+ + M o04 2- = MgMo04
2 Cl- + Pb 2+ = PbC12 Cl- + Sn2+ = SnCl+S04 2- + Zn 2+ = ZnS04:6H203 Cl- + Pb 2+ = PbC13-3 S04 2- + Zn 2+ = Zn(S04)3 4-4 S 04 2- + Zn 2+ = Zn(S04)4 6- Cl- + Pb 2+ = PbCl+3 NH3 + Cu2+ = H+ + Cu(NH3)30H+
Log K Cation Soluble or Solid___________________Complexes
4.05 Cu2+ Soluble3.98 Solid3.47 Pb2+ Soluble3.28 Zn2+ Soluble
3.224 Ca2+ Soluble3.2 Fe2+ Soluble
3.068 Ca2+ Soluble3.068 Fe2+ Soluble
3.0 Fe2+ Soluble2.98 Mg2+ Soluble2.75 Sb3+ Soluble2.73 Ni2+ Soluble2.71 Solid2.7 Sb3+ Soluble2.7 Sn2+ Soluble2.7 Sn2+ Soluble
2.64 Cu2+ Solid2.5 Fe2+ Soluble
2.37 Mg2+ Soluble2.37 Zn2+ Soluble2.36 Ni2+ Solid2.31 Cu2+ Soluble2.3 Ca2+ Soluble2.3 Zn2+ Soluble
2.29 Ni2+ Soluble2.25 Fe2+ Soluble2.25 Mn2+ Soluble
2.209 Mo2+ Solid2.14 Mg2+ Solid2.04 Ni2+ Solid1.98 Soluble1.85 Mg2+,
Mo2+Solid
1.8 Pb2+ Soluble1.8 Sn2+ Soluble
1.765 Zn2+ Solid1.7 Pb2+ Soluble1.7 Zn2+ Soluble1.7 Zn2+ Soluble1.6 Pb2+ Soluble
1.55 Cu2+ Soluble
Reproduced with permission of the copyright owner. Further reproduction prohibited without permission.

Equilibrium Complexes
3 NH3 + Mn2+ = Mn(NH3)3+2 NH3 + Fe2+ = FeNH3+2 NH3 + Pb2+ = PbNH3 2+4 NH3 + Mn 2+ = Mn(NH3)4+2 H+ + Sb(OH)3 = Sb(OH)2+2 N03- + Pb 2+ = Pb(N03)2 4 Cl- + Pb 2+ = PbC14 2- 2 NH3 + Mn 2+ = Mn(NH3)2+2 C03 2- + 2 Na+ = Na2CO3:10H2O C03 2- + Na+ = NaC03- N03- +Pb2+ = PbN03 2 Na+ + S04 2- = Na2S04:10H2O 2 S04 2- + Ni 2+ = Ni(S04)2 2- 2 Cl- + Ni 2+ = NiC12 NH3 + Mn 2+ = MnNH3+2 Na+ + S04 2- = NaS04- Cl- + Cu 2+ = CuCl+Cl- + Mn2+ = MnCl+NH3 + Mg 2+ = MgNH3+22 N03- + Ca 2+ = Ca(N03)23 Cl- + Zn 2+ = ZnC13-C03 2- + 2 Pb2+ = 2 H+ + Pb0:PbC03 N03- + Ca 2+ = CaN03+N03- + Cu 2+ = CuN03+2 Cl- + Zn 2+ = ZnC12 Cl- + Zn 2+ = ZnCl+Cl- + Ni 2+ = NiCl+S04 2- + 2 Pb 2+ = 2 H+ + PbO:PbS04 2 Cl- + Mn 2+ = MnC12 Ca2+ + NH3 = CaNH3+2 2 Cl- + Cu2+ = CuC12 2 NH3 + Mg2+ = Mg(NH3)2+24 Cl- + Zn 2+ = ZnC14 2-2 Na+ + S04 2- = Na2S04 Cl- + Fe2+ = FeCl+2H++S04 2- = H2S04C03 2- + 2 Na+ = Na2C03.H20 Ca2+ + Cl- = CaCl+Ca2+ + 2 NH3 = Ca(NH3)2+23 Cl- + Mn 2+ = MnC13-2 N03- + Cu 2+ = Cu(N03)2
LogK Cation Soluble or Solid Complexes
1.55 Mn2+ Soluble1.5 Fe2+ Soluble1.5 Pb2+ Soluble
1.45 Mn2+ Soluble1.41 Sb3+ Soluble1.4 Pb2+ Soluble
1.38 Pb2+ Soluble1.35 Mn2+ Soluble
1.311 Na+ Solid1.27 Soluble1.17 Pb2+ Soluble
1.114 Na+ Solid1.02 Ni2+ Soluble0.96 Ni2+ Soluble0.85 Mn2+ Soluble0.7 Na+ Soluble
0.64 Cu2+ Soluble0.61 Mn2+ Soluble0.6 Mg2+ Soluble0.6 Ca2+ Soluble0.5 Zn2+ Soluble0.5 Pb2+ Solid0.5 Ca2+ Soluble0.5 Cu2+ Soluble
0.45 Zn2+ Soluble0.43 Zn2+ Soluble0.4 Ni2+ Soluble
0.28 Pb2+ Solid0.25 Mn2+ Soluble0.2 Ca2+ Soluble0.2 Cu2+ Soluble0.2 Mg2+ Soluble0.2 Zn2+ Soluble
0.179 Na+ Solid0.14 Fe2+ Soluble0.0 Mo2+ Soluble
-0.125 Na+ Solid-0.14 Ca2+ Soluble-0.15 Ca2+ Soluble-0.31 Mn2+ Soluble-0.4 Cu2+ Soluble
Reproduced with permission of the copyright owner. Further reproduction prohibited without permission.

199
Equilibrium Complexes
3 H+ + 3 Cl- + Sb(OH)3 = SbC13N03- + Na+ = NaN03Cl- + Pb 2+ = H+ + PbOHCl3 Cl- + Cu2+ =CuC13- H+ + N03- = HN03 Na+ + Cl- = NaClSn 2+ = 2 H+ + SnO NH3 = NH3(g)S04 2- + Mn 2+ = Mn S04 NH3 + Cu2+ = H+ + CuNH30H+2 Cl- + Mn 2+ = MnC12:4H20 Si(OH)4 + Zn 2+ = 2 H+ + ZnSi03 S04 2- + Cu 2+ = CuS04 S04 2- + Zn 2+ = ZnS04 Sn 2+ = H+ + SnOH+2 N03- + Zn 2+ = Zn(N03)2:6H204 Cl- + Cu2+ = CuC14 2- 2 Cl- + Cu 2+ = CuC122 Sn 2+ = 2 H+ + Sn2(OH)2 2+2 Pb2+ = H+ + Pb20H 3+Si(OH)4 + Cu 2+ = 2 H+ + CuSi03.H202 Cu2+ = H+ + Cu20H 3+3 Sn 2+ = 4 H+ + Sn3(OH)4 2+2 Cl- + Zn 2+ = ZnC12Sn 2+ = 2 H+ + Sn(OH)2 Si(OH)4 + Pb 2+ = 2 H+ + PbSi03 Cl- + Zn 2+ = H+ + ZnClOH Zn 2+ = H+ + ZnOH+S04 2- + 2 Zn 2+ = 2 H+ + Zn2(0H)2S04 Cu 2+ = 2 H+ + CuO Pb 2+ = H+ + PbOH+Cu2+ = H+ + CuOH+2 Si(OH)4 = H+ + Si202(0H)5-Pb 2+ = 2 H+ + Pb(OH)2S04 2- + 3 Cu 2+ = 4 H+ + Cu3S04(0H)4Mg2+ + Si(OH)4 = H+ + MgHSi03+Cu 2+ = 2 H+ + Cu(OH)2Cl- + 2 Pb 2+ = 3 H+ + Pb2(OH)3Cl
Ca2+ + Si(OH)4 = H+ + CaHSi03+2 Zn 2+ = H+ + Zn20H 3+
Log K Cation Soluble or Solid___________________Complexes
-0.59 Sb3+ Solid-0.6 Na+ Soluble
-0.623 Pb2+ Solid-1.2 Cu2+ Soluble
-1.283 Soluble-1.582 Na+ Solid-1.76 Sn2+ Solid-1.77 Soluble
-2.669 Mn2+ Solid-2.69 Cu2+ Soluble-2.71 Mn2+ Solid-2.93 Zn2+ Solid-3.01 Cu2+ Solid-3.01 Zn2+ Solid-3.4 Sn2+ Soluble
-3.44 Zn2+ Solid-3.6 Cu2+ Soluble
-3.73 Cu2+ Solid-4.77 Sn2+ Soluble-6.36 Pb2+ Soluble-6.5 Cu2+ Solid-6.7 Cu2+ Soluble
-6.88 Sn2+ Soluble-7.03 Zn2+ Solid-7.06 Sn2+ Soluble-7.32 Pb2+ Solid-7.48 Zn2+ Soluble-7.5 Zn2+ Soluble-7.5 Zn2+ Solid
-7.675 Cu2+ Solid-7.71 Pb2+ Soluble-7.96 Cu2+ Soluble-8.1 Si4+ Soluble
-8.15 Pb2+ Solid-8.29 Cu2+ Solid-8.56 Mg2+ Soluble-8.64 Cu2+ Solid
-8.793 Pb2+,Cu2+
Solid
-8.81 Ca2+ Soluble-9.0 Zn2+ Soluble
Reproduced with permission of the copyright owner. Further reproduction prohibited without permission.

200
Equilibrium Complexes Log K Cation Soluble or Solid________________________________________________________ ComplexesN03- + 2 Cu 2+ = 3 H+ + Cu2N03(0H)3 -9.24 Cu2+ SolidNi 2+ = H+ + NiOH+ -9.5 Ni2+ SolubleC03 2- + 2 Mg 2+ = 2 H+ + -9.6 Mg2+ SolidMgC03:Mg(OH)2:3H20 2 C03 2- + 5 Zn 2+ = 6 H+ + Zn5(0H)6(C03)2 -9.69 Zn2+ Solid2 Ni 2+ = H+ + Ni20H 3+ -9.8 Ni2+ SolubleSi(OH)4 = H+ + SiO(OH)3- -9.83 Si4+ SolubleFe2+ = H+ + FeOH+ -10.2 Fe2+ Soluble2 Cu2+ = 2H+ + Cu2(OH)2 2+ -10.35 Cu2+ SolubleS04 2- + 3 Pb 2+ = 4 H+ + PbS04:2Pb0 -10.4 Pb2+ SolidNi 2+ = 2 H+ + Ni(OH)2 -10.5 Ni2+ Solid2Mn2+ = H+ + Mn20H 3+ -10.56 Mn2+ SolubleMn 2+ = H+ + MnOH+ -10.59 Mn2+ SolubleCr 2+ = 2 H+ + Cr(OH)2 -10.99 Cr2+ SolidC03 2- + 3 Pb 2+ = 4 H+ + PbC03:2PBO -11.02 Pb2+ SolidZn 2+ = 2 H+ + ZnO -11.2 Zn2+ Solid2 NH3 + Cu2+ = 2 H+ + Cu(NH3)2(OH)2 -11.33 Cu2+ SolubleMg 2+ + Si(OH)4 = 2HY + MgSi03 -11.342 Mg2+ SolidMg2+ = H+ + MgOH+ -11.44 Mg2+ SolubleZn 2+ = 2 H+ + e-Zn(OH)2 -11.5 Zn2+ SolidS04 2- + 2 Cu 2+ = 2H+ + CuO.CuS04 -11.53 Cu2+ SolidSb(OH)3 = H+ + Sb(OH)4- -11.82 Sb3+ Soluble4 NH3 + Cu2+ = H+ + Cu(NH3)40H+ -12.42 Cu2+ SolubleZn 2+ = 2 H+ + a-Zn(OH)2 -12.45 Zn2+ SolubleNi 2+ = 2 H+ + NiO (c) -12.45 Ni2+ SolidNi 2+ = 2 H+ + NiO (cr) -12.67 Ni2+ SolidCa2+ = H+ + CaOH+ -12.78 Ca2+ SolublePb 2+ = 2 H+ + PbO -12.91 Pb2+ SolidFe 2+ = 2 H+ + Fe(OH)2 -12.996 Fe2+ SolidH20 = H+ + OH- -14.0 Pb2+ SolubleNa+ = H+ + NaOH -14.18 Na+ SolubleSi(OH)4 + 2 Ni 2+ = 4 H+ + Ni2Si04 -14.54 Ni2+ SolidMg2+ + 2 Si(OH)4 = 2H+ + Mg(HSi03)2 -14.88 Mg2+ Soluble2 Cl- + 4 Cu 2+ = 6 H+ + CuC12:3Cu(OH)2 -14.99 Cu2+ SolidMn 2+ = 2 H+ + Mn(OH)2 -15.2 Mn2+ SolidCl- + 2 Zn 2+ = 3 H+ + Zn2(OH)3Cl -15.2 Zn2+ SolidSi(OH)4 + 2Zn 2+ = 4 H+ + Zn2Si04 -15.33 Zn2+ SolidS04 2- + 4 Cu 2+ = 6 H+ + Cu4S04(OH)6 -15.34 Cu2+ Solid2 Mg 2+ + 3 Si(OH)4 = 4 H+ + -15.76 Mg2+ SolidMg2Si307.50H:3H20Ca2+ + 2 Si(OH)4 = 2H+ + Ca(HSi03)2 -15.81 Ca2+ Soluble
Reproduced with permission of the copyright owner. Further reproduction prohibited without permission.

Equilibrium Complexes
Ca 2+ + Si(OH)4 = 2 H+ + CaSi03Cu2+ = 2H+ + Cu(OH)2Zn 2+ = 2 H+ + Zn(OH)2Sn 2+ = 3 H+ + Sn(OH)3-S04 2- + 4 Cu 2+ = 6 H+ + Cu4S0r(0H)6:H20Mg 2+ = 2 H+ + Mg(OH)2Pb 2+ = 2 H+ + Pb(OH)2Mg2+ + Si(OH)4 = 2H+ + MgSi032 N03- + 4 Cu 2+ = 6 H+ +Cu(N03)2:3Cu(0H)2Mn2+ = 2H+ + Mn(OH)2Ca2+ + Si(OH)4 = 2H+ + CaSi032 Si(OH)4 = 2H+ + Si203(0H)4 2-2 S04 2- + 3 Zn 2+ = 2H+ + Zn30(S04)2Si(OH)4 + 2 Pb 2+ = 4 H+ + Pb2Si04Ca 2+ + Mg 2+ + 2 Si(OH)4 = 4 H+ +CaMgSi206Ni 2+ = 2 H+ + Ni(OH)2 Fe2+ = 2 H+ + Fe(OH)22 Si(OH)4 + 3 Fe 2+ = 6 H+ + Fe3Si205(0H)4 4 Pb 2+ = 4 H+ + Pb4(OH)4 4+3 Cu2+ = 4 H+ + Cu3(OH)4 2+S04 2- + 4 Pb 2+ = 6 H+ + Pb4(0H)6S04 3 Mg 2+ + 4 Si(OH)4 = 6 H+ +Mg3 Si4010(OH)2Mg 2+ = 2 H+ + MgOS04 2- + 4 Pb 2+ = 6 H+ + PbS04:3Pb0Ca 2+ = 2 H+ + Ca(OH)2Si(OH)4 = 2H+ + Si02(0H)2 2-3 Pb 2+ = 4 H+ + Pb3(OH)4 2+2Mn2+ = 3H+ + Mn2(OH)3+NH3 + Cu2+ = 3 H+ + CuNH3(OH)3-4 Si(OH)4 = 3H+ + Si407(0H)5 3-2 Pb 2+ = 4 H+ + PbO:Pb(OH)2 Cu2+ = 3H+ + Cu(OH)3-4 Zn 2+ = 4 H+ + Zn4(OH)4 4+3 Si(OH)4 = 3 H+ + Si308(0H)5 3-4 Ni 2+ = 4 H+ + Ni4(OH)4 4+Pb 2+ = 3 H+ + Pb(OH)3-Zn 2+ = 3 H+ + Zn(OH)3- 2 Mg 2+ + Si(OH)4 = 4 H+ + Mg2Si04 S04 2- + 4 Zn 2+ = 6 H+ + Zn4(0H)6S04
LogK Cation Soluble or Solid Complexes
-15.94 Ca2+ Solid-16.24 Cu2+ Soluble-16.4 Zn2+ Soluble
-16.61 Sn2+ Soluble-16.79 Cu2+ Solid-16.84 Mg2+ Solid-17.12 Pb2+ Soluble-17.75 Mg2+ Soluble-18.48 Cu2+ Solid
-18.54 Mn2+ Soluble-18.83 Ca2+ Soluble-19.0 Si4+ Soluble
-19.02 Zn2+ Solid-19.76 Pb2+ Solid
-19.894 Ca2+,Mg2+
Solid
-20.01 Ni2+ Soluble-20.8 Fe2+ Soluble
-20.81 Fe2+ Solid-20.88 Pb2+ Soluble-21.1 Cu2+ Soluble-21.1 Pb2+ Solid
-21.399 Mg2+ Solid
-21.51 Mg2+ Solid-22.1 Pb2+ Solid-22.8 Ca2+ Soluble-23.0 Si4+ Soluble
-23.88 Pb2+ Soluble-23.9 Mn2+ Soluble
-24.73 Cu2+ Soluble-25.5 Si4+ Soluble-26.2 Pb2+ Solid-26.7 Cu2+ Soluble-27.0 Zn2+ Soluble-27.5 Si4+ Soluble-27.9 Ni2+ Soluble
-28.06 Pb2+ Soluble-28.2 Zn2+ Soluble
-28.306 Mg2+ Solid-28.4 Zn2+ Solid
Reproduced with permission of the copyright owner. Further reproduction prohibited without permission.

202
Equilibrium Complexes Log K Cation Soluble or Solid________________________________________________________ Complexes3 Si(OH)4 = 3 H+ + Si3Q6(OH)3 3- -28.6 Si4+ SolubleNi 2+ = 3H+ + Ni(OH)3- -29.7 Ni2+ SolubleCa 2+ + Mg 2+ + Si(OH)4 = 4 H+ + CaMgSi04 -30.272 Ca2+,
Mg2+Solid
S04 2- + 4 Ni 2+ = 6 H+ + Ni4(0H)6S04 -32 Ni2+ Solid3 Mg 2+ + 2 Si(OH)4 = 6 H+ + -32.2 Mg2+ SolidMg3Si205(0H)4Ca 2+ = 2 H+ + CaO -32.797 Ca2+ SolidFe2+ = 3 H+ + Fe(OH)3- -33.4 Fe2+ SolubleMn2+ = 3H+ + Mn(OH)3- -34.8 Mn2+ Soluble4 Si(OH)4 = 4 H+ + Si408(0H)4 4- -36.3 Si4+ Soluble2 Ca 2+ + Si(OH)4 = 4 H+ + Ca2Si04 -37.649 Ca2+ Solid2 Cl- + 5 Zn 2+ = 8 H+ + Zn5(OH)8C12 -38.5 Zn2+ SolidCu2+ = 4H+ + Cu(OH)4 2- -39.6 Cu2+ SolublePb 2+ = 4 H+ + Pb(OH)4 2- -39.7 Pb2+ Soluble4 Mg2+ = 4 H+ + Mg4(OH) 4+ -39.71 Mg2+ SolubleZn 2+ = 4 H+ + Zn(OH)4 2- -41.3 Zn2+ Soluble6 Pb 2+ = 8 H+ + Pb6(OH)8 4+ -43.61 Pb2+ SolubleNi 2+ = 4H+ + Ni(OH)4 2- -45.0 Ni2+ SolubleFe2+ = r H+ + Fe(OH)4 2- -46.35 Fe2+ Soluble2 Ca 2+ + Mg 2+ + 2 Si(OH)4 = 6H+ + -47.472 Ca2+ SolidCa2MgSi207Mn2+ = 4H+ + Mn(OH)4 2- -48.3 Mn2+ Soluble2 Zn 2+ = 6 H+ + Zn2(OH)6 20 -54.3 Zn2+ Soluble2 Ca 2+ + 5 Mg 2+ + 8 Si(OH)4 = 14 H+ -56.574 Ca2+, Soluble+Ca2Mg5Si8022(0H)2 Mg2+3Ca 2+ + Mg 2+ + 2 Si(OH)4 = 8 H+ + -68.543 Ca2+, SolidCa3MgSi208 Mg2+3 Ca 2+ + Si(OH)4 = 6 H+ + Ca3Si05 -73.867 Ca2+ Solid2 S04 2- + 8 Cl- + 37 Cu 2+ = 62 H+ + -238.259 Cu2+ SolidCu37C18(S04)2(0H)62:8H20
Reproduced with permission of the copyright owner. Further reproduction prohibited without permission.

203
VITA
LARRY KEITH ISAACS
DEGREES:
Master of Science (Environmental Science), Christopher Newport University, Newport News, VA, May 2003
Bachelor of Science (Electrical Engineering), University of New Mexico, Albuquerque, NM, May 1972
STATES WITHIN WHICH REGISTERED:Licensed Professional Engineer, New Mexico, 1979, License No. 7083
PROFESSIONAL CHRONOLOGY:
1995 to Present, Chief, Environmental Compliance, Langley AFB, VA1992 to 1995, Air Toxics Program Manager, Langley AFB, VA1990 to 1992, Commander, Engineering Squadron, Mt Home AFB, ID1988 to 1990, Chief Construction Programs Division, Langley AFB, VA1986 to 1988, Chief Engineering Inspections Division, Langley AFB, VA1985 to 1986, Base Engineer, Shemya AFB, AK1979 to 1985, Airborne Weapons Director, Tinker AFB, OK1977 to 1979, Chief Construction Programs Branch, Cannon AFB, NM1974 to 1977, Chief Engineer Technical Design, Kadena AB, Japan1972 to 1974, Electrical Engineer, Webb AFB, TX
SCIENTIFIC AND PROFESSIONAL SOCIETIES MEMBERSHIP:
American Society of Civil Engineers American Water Works Association Soil Science Society of America
PUBLICATIONS
Isaacs, L.K. (2007) Lead leaching from soils and in stormwaters at twelve military shooting ranges, Journal o f Hazardous Substance and Research. VI, 1-30.
Abdel-Fattah, T.M.; Isaacs, L.K.; Payne, K.B. (2003). “Small Arms Range LeadManagement Issues: Activated Carbon, Molecular Sieves (5A and 13X), and Naturally Occurring Zeolites as Lead Adsorbents." Federal Facilities Environmental Journal. 14(2). 113-126
Reproduced with permission of the copyright owner. Further reproduction prohibited without permission.

Reproduced with permission of the copyright owner. Further reproduction prohibited without permission.