Feasibility of Ultrasound Attenuation Imaging for Assessing ...
12
Citation: Song, K.; Son, N.-H.; Chang, D.R.; Chae, H.W.; Shin, H.J. Feasibility of Ultrasound Attenuation Imaging for Assessing Pediatric Hepatic Steatosis. Biology 2022, 11, 1087. https://doi.org/10.3390/ biology11071087 Academic Editors: Bin Qiu and Yi Luan Received: 15 June 2022 Accepted: 18 July 2022 Published: 20 July 2022 Publisher’s Note: MDPI stays neutral with regard to jurisdictional claims in published maps and institutional affil- iations. Copyright: © 2022 by the authors. Licensee MDPI, Basel, Switzerland. This article is an open access article distributed under the terms and conditions of the Creative Commons Attribution (CC BY) license (https:// creativecommons.org/licenses/by/ 4.0/). biology Article Feasibility of Ultrasound Attenuation Imaging for Assessing Pediatric Hepatic Steatosis Kyungchul Song 1 , Nak-Hoon Son 2 , Dong Ryul Chang 3 , Hyun Wook Chae 1 and Hyun Joo Shin 3, * 1 Department of Pediatrics, Severance Children’s Hospital, Endocrine Research Institute, Yonsei University College of Medicine, Seoul 03722, Korea; [email protected] (K.S.); [email protected] (H.W.C.) 2 Department of Statistics, Keimyung University, Daegu 42601, Korea; [email protected] 3 Department of Radiology, Research Institute of Radiological Science and Center for Clinical Imaging Data Science, Yongin Severance Hospital, Yonsei University College of Medicine, Yongin-si 16995, Korea; [email protected] * Correspondence: [email protected]; Tel.: +82-31-5189-8321; Fax: +82-31-5189-8377 Simple Summary: Hepatic steatosis is associated with cardiovascular disease, diabetes mellitus, and liver cirrhosis. The increasing prevalence of hepatic steatosis among children has become a public health concern. Although liver biopsy is the gold standard for the diagnosis of hepatic steatosis, it has limited value because of invasiveness. Among imaging studies, ultrasonography is readily accessible and can be used to exclude other pathology, but its accuracy is limited by low sensitivity and specificity. Although magnetic resonance imaging is highly accurate for liver steatosis and fibrosis, its application is curbed in children as it requires sedation and longer scan time. Recently, attenuation imaging (ATI) has emerged as a new modality for quantifying fat deposition in the liver in real time. However, investigations of ATI for pediatric hepatic steatosis are still in their preliminary stages. Thus, we investigated the feasibility of ultrasound attenuation imaging (ATI) for assessing pediatric hepatic steatosis. This study demonstrated that ATI can differentiate fatty liver from normal liver as well as moderate to severe fatty liver from mild fatty liver. Thus, ATI may be useful for identifying children who require liver biopsy and early treatment. Abstract: We investigated the feasibility of ultrasound attenuation imaging (ATI) for assessing pedi- atric hepatic steatosis. A total of 111 children and adolescents who underwent liver ultrasonography with ATI for suspected hepatic steatosis were included. Participants were classified into the normal, mild, or moderate–severe fatty liver group according to grayscale US findings. Associations between clinical factors, magnetic resonance imaging proton density fat fraction, steatosis stage and ATI values were evaluated. To determine the cutoff values of ATI for staging hepatic steatosis, areas under the curve (AUCs) were analyzed. Factors that could cause measurement failure with ATI were assessed. Of 111 participants, 88 had successful measurement results. Median ATI values were significantly increased according to steatosis stage (p < 0.001). Body mass index (BMI) was a significant factor for increased ATI values (p = 0.047). To differentiate fatty liver from normal liver, a cutoff value of 0.59 dB/cm/MHz could be used with an AUC value of 0.853. To differentiate moderate to severe fatty liver from mild fatty liver, a cutoff value of 0.69 dB/cm/MHz could be used with an AUC value up to 0.91. ATI can be used in children as an effective ultrasonography technique for quantifying and staging pediatric hepatic steatosis. Keywords: ultrasonography; liver steatosis; attenuation imaging; fat quantification; children 1. Introduction Non-alcoholic fatty liver disease (NAFLD) is a chronic disease induced by excessive fat accumulation in the liver that includes simple steatosis, steatohepatitis, fibrosis, and cirrhosis [1,2]. As NAFLD is associated with cardio-metabolic risk factors, it has been Biology 2022, 11, 1087. https://doi.org/10.3390/biology11071087 https://www.mdpi.com/journal/biology
-
Upload
khangminh22 -
Category
Documents
-
view
0 -
download
0
Transcript of Feasibility of Ultrasound Attenuation Imaging for Assessing ...

Citation: Song, K.; Son, N.-H.; Chang,
D.R.; Chae, H.W.; Shin, H.J.
Feasibility of Ultrasound Attenuation
Imaging for Assessing Pediatric
Hepatic Steatosis. Biology 2022, 11,
1087. https://doi.org/10.3390/
biology11071087
Academic Editors: Bin Qiu and
Yi Luan
Received: 15 June 2022
Accepted: 18 July 2022
Published: 20 July 2022
Publisher’s Note: MDPI stays neutral
with regard to jurisdictional claims in
published maps and institutional affil-
iations.
Copyright: © 2022 by the authors.
Licensee MDPI, Basel, Switzerland.
This article is an open access article
distributed under the terms and
conditions of the Creative Commons
Attribution (CC BY) license (https://
creativecommons.org/licenses/by/
4.0/).
biology
Article
Feasibility of Ultrasound Attenuation Imaging for AssessingPediatric Hepatic SteatosisKyungchul Song 1 , Nak-Hoon Son 2 , Dong Ryul Chang 3, Hyun Wook Chae 1 and Hyun Joo Shin 3,*
1 Department of Pediatrics, Severance Children’s Hospital, Endocrine Research Institute, Yonsei UniversityCollege of Medicine, Seoul 03722, Korea; [email protected] (K.S.); [email protected] (H.W.C.)
2 Department of Statistics, Keimyung University, Daegu 42601, Korea; [email protected] Department of Radiology, Research Institute of Radiological Science and Center for Clinical Imaging Data
Science, Yongin Severance Hospital, Yonsei University College of Medicine, Yongin-si 16995, Korea;[email protected]
* Correspondence: [email protected]; Tel.: +82-31-5189-8321; Fax: +82-31-5189-8377
Simple Summary: Hepatic steatosis is associated with cardiovascular disease, diabetes mellitus, andliver cirrhosis. The increasing prevalence of hepatic steatosis among children has become a publichealth concern. Although liver biopsy is the gold standard for the diagnosis of hepatic steatosis,it has limited value because of invasiveness. Among imaging studies, ultrasonography is readilyaccessible and can be used to exclude other pathology, but its accuracy is limited by low sensitivityand specificity. Although magnetic resonance imaging is highly accurate for liver steatosis andfibrosis, its application is curbed in children as it requires sedation and longer scan time. Recently,attenuation imaging (ATI) has emerged as a new modality for quantifying fat deposition in the liverin real time. However, investigations of ATI for pediatric hepatic steatosis are still in their preliminarystages. Thus, we investigated the feasibility of ultrasound attenuation imaging (ATI) for assessingpediatric hepatic steatosis. This study demonstrated that ATI can differentiate fatty liver from normalliver as well as moderate to severe fatty liver from mild fatty liver. Thus, ATI may be useful foridentifying children who require liver biopsy and early treatment.
Abstract: We investigated the feasibility of ultrasound attenuation imaging (ATI) for assessing pedi-atric hepatic steatosis. A total of 111 children and adolescents who underwent liver ultrasonographywith ATI for suspected hepatic steatosis were included. Participants were classified into the normal,mild, or moderate–severe fatty liver group according to grayscale US findings. Associations betweenclinical factors, magnetic resonance imaging proton density fat fraction, steatosis stage and ATI valueswere evaluated. To determine the cutoff values of ATI for staging hepatic steatosis, areas under thecurve (AUCs) were analyzed. Factors that could cause measurement failure with ATI were assessed.Of 111 participants, 88 had successful measurement results. Median ATI values were significantlyincreased according to steatosis stage (p < 0.001). Body mass index (BMI) was a significant factorfor increased ATI values (p = 0.047). To differentiate fatty liver from normal liver, a cutoff value of0.59 dB/cm/MHz could be used with an AUC value of 0.853. To differentiate moderate to severefatty liver from mild fatty liver, a cutoff value of 0.69 dB/cm/MHz could be used with an AUC valueup to 0.91. ATI can be used in children as an effective ultrasonography technique for quantifying andstaging pediatric hepatic steatosis.
Keywords: ultrasonography; liver steatosis; attenuation imaging; fat quantification; children
1. Introduction
Non-alcoholic fatty liver disease (NAFLD) is a chronic disease induced by excessivefat accumulation in the liver that includes simple steatosis, steatohepatitis, fibrosis, andcirrhosis [1,2]. As NAFLD is associated with cardio-metabolic risk factors, it has been
Biology 2022, 11, 1087. https://doi.org/10.3390/biology11071087 https://www.mdpi.com/journal/biology

Biology 2022, 11, 1087 2 of 12
additionally related to all-cause deaths due to cardiovascular disease and diabetes mellitusas well as liver cirrhosis [3–5]. The prevalence of NAFLD among youths increased from19.34 million in 1990 to 29.49 million in 2017 according to the Global Burden of Diseasedatabase-based study, and corresponding values increased 2.7-fold from the 1980s to2007–2010 in the USA [6,7]. In Korea, the prevalence of NAFLD increased from 8.17% in2009 to 12.05% in 2018 among children and adolescents [8].
As NAFLD is often asymptomatic and reversible with treatment in its initial stages, anearly diagnosis is important to prevent severe complications [1,9]. The gold standard forthe diagnosis of NAFLD is liver biopsy, but it has limited value because of its invasiveness,the small size of the samples collected and the non-uniformity of the disease itself [1,10].Although the alanine aminotransferase (ALT) test is recommended for screening NAFLD,serum ALT can be elevated in other liver diseases and NAFLD can be detected even inchildren with normal ALT [11]. Among imaging studies, ultrasonography (US) is readilyaccessible and can be used to exclude other pathology, but its accuracy is limited by lowsensitivity and specificity [1,12]. Although MRI is highly accurate for liver steatosis andfibrosis, its application is curbed in children as it requires sedation and longer scan time [9].
Based on evidence that showed increased attenuation of the US beam in hepatic steato-sis, the controlled attenuation parameter (CAP) was a widely accepted imaging modalityused to quantify liver fat [12,13]. However, the clinical application of CAP was restrictedby frequent measurement failure and non-available anatomic imaging [13]. In response,attenuation imaging (ATI) has emerged as a new modality for quantifying fat depositionin the liver using real-time US [12,14]. Recent studies have reported high correlationsbetween ATI and the MRI proton density fat fraction (PDFF), and ATI has shown excel-lent performance for detecting hepatic steatosis in adults [12,15]. Gatos et al. reportedthat liver ultrasound attenuation helped to accurately grade hepatic steatosis in adultswith NAFLD [16]. Jeon et al. reported that 2-D ultrasound ATI was useful when assess-ing hepatic steatosis in adults with chronic liver disease with MRI-PDFF as the referencestandard [15]. Ferraioli et al. recently summarized cutoff values for diagnosing hepaticsteatosis in adults with liver biopsy as a reference standard [17]. However, investigationsof ATI for pediatric hepatic steatosis are still in their preliminary stages [18]. Because theearly detection and correction of hepatic steatosis is important in the pediatric population,validating the use of ATI for the accurate quantification of hepatic steatosis is of clinicalnecessity in children.
Therefore, the purpose of this study was to demonstrate the feasibility of ATI forassessing hepatic steatosis in children and to determine cutoff values for ATI to achieveacceptable diagnostic performance for staging hepatic steatosis.
2. Materials and Methods2.1. Subjects
Children and adolescents (≤18 years old) who underwent liver US with ATI fromMarch to December 2021 according to clinical demand to evaluate liver disease due toobesity or increased liver function test results were included. We separated participantswho failed to attain reliable ATI values. Measurement failure was defined when any of threecriteria was met: (1) R2 value < 0.8, (2) interquartile range (IQR)/median of ATI value > 0.3,or (3) no visible homogeneous color map for more than half of the intended region-of-interest (ROI). These criteria were from the vendor’s provided methods for adults, becausethere are no criteria applicable for children yet. The R2 value represents the coefficientof determination and R2 ≥ 0.8 is considered to indicate a valid measurement from anappropriate ROI location. The IQR/median value was used to evaluate the reliability ofthe measurements [14,15].
Participants with successful ATI measurements were then classified into the normal,mild fatty liver and moderate–severe fatty liver group according to liver parenchymalechogenicity on US, which is a classification method generally used to evaluate hepaticsteatosis [17–19]. The mild fatty liver group included participants whose livers showed

Biology 2022, 11, 1087 3 of 12
brighter echogenicity compared with the renal cortex on US [19]. The moderate to severefatty liver group included participants whose portal vein wall was blurred from increasedliver parenchymal echogenicity and who had diaphragms that were poorly visualized fromUS beam attenuation [19]. We classified participants according to liver echogenicity andnot by BMI, because liver parenchymal conditions can differ from BMI, and we consideredliver echogenicity as a more direct representation of the parenchymal condition.
Age, sex, height, weight, body mass index (BMI), systolic blood pressure (SBP), dias-tolic blood pressure (DBP), aspartate transaminase (AST), and ALT values obtained duringthe outpatient clinic visit within 7 days of the US examination were reviewed retrospectivelyusing electronic medical records.
2.2. MRI Acquisition
When participants underwent liver MRI including PDFF within one month of the USexamination, PDFF values were also included in the analyses. Abbreviated liver MRI wasperformed according to clinical demand when participants were suspected of fatty liverafter the initial US examination and when clinicians wished to know the quantitative fatamount. MRI was performed in a 3T system (Ingenia Elition X, Philips Medical Systems,Veenpluis, Best, The Netherlands) using a pediatric body coil. Included sequences were(1) axial and coronal single-shot fast spin echo T2 weighted images for anatomic imaging,(2) axial 3D volumetric multi-echo gradient sequence for PDFF and T2* decay quantification,and (3) axial gradient echo MR elastography (MRE) for liver fibrosis quantification. TheMRI parameters for PDFF were as follows; repetition time (TR) 5.7 ms, echo time (TE)2.6 ms, matrix 160 × 160, slice thickness 6 mm, flip angle 3◦, number of signal averages 1,with six gradient echoes from 0.9 to 4.4 ms. The total acquisition time was 15 s. In addition,the MRI parameters for MRE were as follows; TR 1000 ms, TE 60 ms, matrix 64 × 64, slicethickness 10 mm, flip angle 90◦, number of signal averages 2, with a total acquisition timeof 24 s. The chosen MRE techniques were the same as those used in previous studies in ourinstitution. Only participants who could cooperate without sedation underwent MRI.
After the acquisition, the maximum longitudinal diameter of the right liver lobe (cm),PDFF (%), T2* (ms) value, and MRE (kPa) value of the liver were collected. To obtain PDFF,T2*, and MRE values, four ROIs were drawn in the liver avoiding hepatic vessels and arti-facts using the axial slices of each sequence by an experienced pediatric radiologist and themean value of the four measurements was used as a representative value (Figures 1 and 2).Steatosis grades could be also categorized using cutoff values of PDFF identified in a pre-vious study; S1 (mild) for PDFF > 6%~<17.5%, S2 (moderate) for PDFF ≥ 17.5%~<23.3%,and S3 (severe) for PDFF ≥ 23.3% [20].
Figure 1. A 7-year-old girl in the mild fatty liver group according to grayscale US. (a) The ATI valuewas 0.65 dB/cm/MHz and (b) MRI-PDFF value was 8.9% (S1: PDFF > 6%). US: ultrasonography;ATI: attenuation imaging; MRI: magnetic resonance imaging; PDFF: proton density fat fraction.

Biology 2022, 11, 1087 4 of 12
Figure 2. An 11-year-old girl in the moderate to severe fatty liver group according to grayscale US.(a) The ATI value was 0.83 dB/cm/MHz and (b) MRI-PDFF value was 30.7% (S3: PDFF > 23.3%). US:ultrasonography; ATI: attenuation imaging; MRI: magnetic resonance imaging; PDFF: proton densityfat fraction.
2.3. ATI Acquisition
Liver US with ATI was performed by a pediatric radiologist with 12 years of experienceusing a C1-8MHz convex transducer (PVI-475BX) of the Aplio i800 (Canon Medical Systems,Otawara, Japan) machine. ATI can measure fat deposition in the liver by quantifyingattenuation coefficient in fatty liver. The higher the attenuation, the more US echo decreasesaccording to depth, resulting in a steeper slope. ATI can quantify this slope, otherwiseknown as the attenuation coefficient [21]. For abdominal US evaluation including ATI,participants were in the supine position with their right arm elevated. They were asked tofast for 4 h before the examination. Participants were in shallow breathing or stable freebreathing to avoid forced breath-holds or artifacts from poor cooperation. The transducerwas placed perpendicular to the skin in the right intercostal space without compression toavoid shadowing or artifacts. After activating the ATI mode during grayscale US, a largefan-shaped color-coded sampling box automatically appeared in the liver parenchyma.Smaller fan-shaped ROIs approximately 2 × 4 cm in size were placed to include adequateliver parenchyma when color seemed homogeneous with a R2 value equal to or more than0.8 (Figures 1 and 2). A total of five measurements were repeated at separate intervals andthe median values of ATI, IQR and IQR/median values were obtained. In addition to ATI,shear-wave elastography (SWE) and shear-wave dispersion (SWD) were measured, andmedian values were chosen as representative values after ten repeated measurements.
2.4. Statistical Analysis
Statistical analyses were performed using SPSS version 26.0 (IBM Corp., Armonk, NY,USA). Variables followed normal distribution with p-values > 0.05 for the Kolmogorov–Smirnov test. Participant demographics, MRI and US results were compared among thethree fatty liver groups using one-way analysis of variance (ANOVA) with a subgroupanalysis being performed using Bonferroni correction to suppress the increase in type Ierrors. The Chi-square test was used for categorical variables and the independent two-sample t-test was used for MRI values. To identify significant factors for fatty liver, ordinallogistic regression analyses were performed. In addition, a linear regression analysis wasperformed to identify significant factors that could predict increased ATI values in theliver. To identify cutoff values and diagnostic performance of ATI for predicting fatty liveraccording to US and PDFF, areas under the curve (AUCs) were analyzed. An optimal cutoffvalue was chosen for each parameter to maximize the sum of sensitivity and specificity inAUC analysis. Furthermore, we analyzed factors that could cause measurement failure

Biology 2022, 11, 1087 5 of 12
with ATI using the independent t-test, Chi-square test and logistic regression test. P-valuesless than 0.05 were considered statistically significant.
3. Results3.1. Demographics
During the study period, 111 pediatric participants underwent liver US with ATIand 23 participants had measurement failure. A total of 88 participants (79.3%, mean10.4 ± 2.6 years old, age range 6–17.8 years, M:F = 47:41) had successful results and theywere classified into the normal (n = 31), mild fatty liver (n = 30) and moderate–severe fattyliver (n = 27) groups according to grayscale US. With only a relatively small number ofparticipants with moderate or severe fatty liver, participants with moderate fatty liver andthose with severe fatty liver could not be analyzed as separate groups. Age, BMI, SBP, ASTand ALT were significantly different between the three groups (Table 1). Height, weight,and BMI progressively increased across fatty liver grade. Therefore, we included age as avariable in the regression analysis to adjust for age difference.
Table 1. Comparison of participant demographics and MRI and US measurements among the threefatty liver groups (normal, mild, and moderate–severe) according to grayscale US.
VariablesNormal Liver
Group 1
(n = 31)
Mild FattyLiver Group 2
(n = 30)
Moderate–Severe Fatty
Liver Group 3
(n = 27)
Overallp-Value
Correctedp-Value(1 vs. 2)
Correctedp-Value(2 vs. 3)
Correctedp-Value(1 vs. 3)
Demographics
Age (years) 9.4 ± 2.5 10.2 ± 2.4 11.8 ± 2.3 0.001 0.661 0.037 0.001Sex (M:F) 13:18 15:15 19:08 0.086 * 0.527 0.118 0.056Height (cm) 139.4 ± 12.7 145.1 ± 10.7 153.9 ± 14.4 <0.001 0.253 0.03 <0.001Weight (kg) 42.1 ± 10.5 51.4 ± 13.0 69.8 ± 19.6 <0.001 0.044 <0.001 <0.001BMI (kg/m2) 21.5 ± 3.4 24.8 ± 3.2 27.9 ± 3.4 <0.001 0.001 0.002 <0.001SBP (mmHg) 112.3 ± 10.9 117.3 ± 10.9 120.2 ± 11.9 0.041 0.326 0.999 0.039DBP (mmHg) 64.8 ± 10.5 66.5 ± 9.2 68.8 ± 10.3 0.363 0.999 0.999 0.469AST (IU/L) 26.8 ± 14.2 25.7 ± 8.7 44.9 ± 26.5 <0.001 0.999 <0.001 0.001ALT (IU/L) 17.8 ± 11.9 28.4 ± 16.7 64.4 ± 52.4 <0.001 0.564 <0.001 <0.001
MRI(mild: n = 5,
moderate to severe: n = 15)
Liver longitudinaldiameter (cm) 16.0 ± 1.0 18.0 ± 2.3 0.089 **
PDFF (%) 12.9 ± 10.4 25.2 ± 10.8 0.04 **T2* (ms) 19.0 ± 3.5 16.5 ± 2.5 0.087 **MRE (kPa) 2.1 ± 0.2 2.0 ± 0.3 0.805 **
US
ATI median(dB/cm/MHz) 0.54 ± 0.09 0.63 ± 0.08 0.73 ± 0.11 <0.001 0.001 <0.001 <0.001
ATI IQR 0.09 ± 0.1 0.06 ± 0.03 0.06 ± 0.03 0.125 0.287 0.999 0.201ATI IQR/median 0.14 ± 0.07 0.1 ± 0.06 0.08 ± 0.04 0.001 0.028 0.575 0.001SWE median(m/s) 1.19 ± 0.07 1.29 ± 0.16 1.26 ± 0.14 0.009 0.019 0.999 0.026
SWE IQR 0.12 ± 0.06 0.12 ± 0.07 0.13 ± 0.09 0.995 0.999 0.999 0.999SWE IQR/median 0.10 ± 0.05 0.09 ± 0.06 0.09 ± 0.06 0.721 0.999 0.999 0.999SWE median (kPa) 4.39 ± 0.62 5.1 ± 1.46 5.04 ± 1.44 0.059 0.092 0.999 0.156SWD median[(m/s)/kHz] 12.39 ± 1.41 12.45 ± 1.10 12.57 ± 1.26 0.872 0.999 0.999 0.999
SWD IQR 1.6 ± 0.82 1.76 ± 1.05 1.4 ± 0.77 0.327 0.999 0.999 0.999SWD IQR/med 0.13 ± 0.07 0.14 ± 0.08 0.11 ± 0.06 0.302 0.999 0.374 0.999
One-way ANOVA with Bonferroni correction. * Chi-square test. ** independent two-sample t-test. US: ultra-sonography; BMI: body mass index; SBP: systolic blood pressure; DBP: diastolic blood pressure; AST: aspartatetransaminase; ALT: alanine aminotransferase; PDFF: proton density fat fraction; MRE: MR elastography; ATI:attenuation imaging; IQR: interquartile range; SWE: shear-wave elastography; SWD: shear-wave dispersion.
Among 88 participants, only 20 participants (22.7%, mean 11.1 ± 1.9 years old) under-went liver MRI with PDFF (mean 22.1 ± 11.7 %, range 6.1–43.4%). Based on the grayscaleUS findings, five participants were included in the mild fatty liver group, while the re-maining 15 participants were included in the moderate–severe fatty liver group. Nonehad normal liver parenchymal echogenicity on US. For MRI measurements, PDFF wassignificantly higher in the moderate–severe fatty liver group compared with the mild fattyliver group (mean 25.2% vs. 12.9 %, p = 0.04).
Among the US measurements, median ATI values significantly and gradually in-creased as the severity of steatosis increased (0.54, 0.63, and 0.73 dB/cm/MHz, respectively,p < 0.001) (Figure 3). SWE values significantly increased in the fatty liver group comparedwith the normal group (1.26–1.29 m/s vs. 1.19 m/s, p = 0.019–0.026).

Biology 2022, 11, 1087 6 of 12
Figure 3. Box–whisker plots of median ATI values for each hepatic steatosis group (a) accordingto US echogenicity and (b) MRI-PDFF value. US: ultrasonography; ATI: attenuation imaging; MRI:magnetic resonance imaging; PDFF: proton density fat fraction.
3.2. Results of the Ordinal Logistic Regression Test for the Fatty Liver Groups
On the univariate ordinal logistic regression test, age, sex, height, weight, BMI, SBP,AST, and ALT were significant variables for predicting the three fatty liver groups deter-mined by US echogenicity (Table 2). Among the US measurements, median ATI values(odds ratio [OR] 15.536, 95% confidence interval [CI] 10.186–20.886, p < 0.001) and SWEvalues (OR 3.746, 95% CI 0.511–6.980, p = 0.023) were significant factors for grading fattyliver. Of these variables, only BMI (OR 0.453, p = 0.197–0.709, p = 0.001) and ATI values (OR22.09, 95% CI 11.949–32.23, p < 0.001) remained significant after the multivariate analysis
Table 2. Results of the ordinal logistic regression analysis for the three fatty liver groups (normal,mild, and moderate–severe) according to grayscale US.
VariablesUnivariate Analysis Multivariate Analysis
OR 95% CI p-Value OR 95% CI p-Value
Demographics
Age (years) 0.311 0.137–0.485 <0.001 0.122 −0.163–0.407 0.401Sex (male) 0.854 0.065–1.643 0.034 −0.792 −2.120–0.535 0.242(female) (Reference) (Reference)Height (cm) 0.068 0.035–0.102 <0.001Weight (kg) 0.09 0.056–0.123 <0.001BMI (kg/m2) 0.385 0.247–0.524 <0.001 0.453 0.197–0.709 0.001SBP (mmHg) 0.048 0.010–0.086 0.013 −0.029 −0.091–0.034 0.364DBP (mmHg) 0.032 −0.010–0.074 0.136AST (IU/L) 0.055 0.023–0.088 0.001 0.085 −0.058–0.227 0.246ALT (IU/L) 0.06 0.034–0.087 <0.001 0.007 −0.063–0.076 0.852
US
ATI median(dB/cm/MHz) 15.536 10.186–20.886 <0.001 22.09 11.949–32.230 <0.001
ATI IQR −10.53 −22.387–1.326 0.082ATI IQR/median −13.46 −21.190–−5.729 0.001SWE median (m/s) 3.746 0.511–6.980 0.023 0.725 −3.773–5.224 0.752SWE IQR 0.099 −4.682–4.879 0.968SWE IQR/median −2.252 −8.895–4.390 0.506SWE median (kPa) 0.302 −0.045–0.649 0.088SWD median[(m/s)/kHz] 0.089 −0.225–0.402 0.579
SWD IQR −0.157 −0.596–0.282 0.483SWD IQR/median −2.369 −7.961–3.223 0.406
US: ultrasonography; OR: odds ratio; CI: confidence interval; BMI: body mass index; SBP: systolic blood pressure;DBP: diastolic blood pressure; AST: aspartate transaminase; ALT: alanine aminotransferase; ATI: attenuationimaging; IQR: interquartile range; SWE: shear-wave elastography; SWD: shear-wave dispersion.

Biology 2022, 11, 1087 7 of 12
3.3. Results of the Linear Regression Test for ATI Values
On univariate linear regression analysis, weight, BMI, SBP, AST, ALT, PDFF and T2*values of MRI were significant factors for increased ATI values (Table 3). We included thosevariables except for AST which was excluded due to multicollinearity (variance inflationfactor [VIF] 20.116 for AST and 19.836 for ALT), in the multivariate linear regressionanalysis. As a result, BMI was found to be the only significant factor for increased ATIvalues (p = 0.047).
Table 3. Results of the linear regression analysis for ATI median values in all groups.
Variables
Univariate Analysis Multivariate Analysis
Estimate StandardError p-Value Estimate Standard
Error p-Value
Demographics
Age (years) 0.008 0.005 0.131Sex −0.044 0.025 0.089Height (cm) 0.001 0.001 0.122Weight (kg) 0.002 0.001 0.006BMI (kg/m2) 0.008 0.003 0.013 −0.019 0.009 0.047SBP (mmHg) 0.003 0.001 0.011 0.002 0.002 0.314DBP (mmHg) 0.002 0.001 0.08AST (IU/L) 0.002 0.001 0.002ALT (IU/L) 0.001 0.001 <0.001 0.001 0.001 0.998
MRI(mild: n = 5,
moderate to severe:n = 15)
Liver longitudinaldiameter (cm) −0.012 0.01 0.235
PDFF (%) 0.005 0.002 0.014 0.007 0.005 0.147T2* (ms) −0.019 0.007 0.012 0.009 0.019 0.653MRE (kPa) −0.017 0.098 0.863
USSWE median (m/s) 0.067 0.093 0.473SWD median[(m/s)/kHz] −0.003 0.011 0.765
BMI: body mass index; SBP: systolic blood pressure; DBP: diastolic blood pressure; AST: aspartate transam-inase; ALT: alanine aminotransferase; MRI: magnetic resonance imaging; PDFF: proton density fat fraction;MRE: MR elastography; US: ultrasonography; ATI: attenuation imaging; SWE: shear-wave elastography; SWD:shear-wave dispersion.
3.4. Diagnostic Performance of ATI Values
After AUC analysis, using a cutoff value of 0.59 dB/cm/MHz, ATI showed an AUCvalue of 0.853 (95% CI 0.762–0.920) with a sensitivity of 80.7% and specificity of 77.4% fordifferentiating fatty liver (mild, moderate, severe) from the normal group according to theUS criteria (Table 4, Figure 4a). When differentiating moderate to severe fatty liver frommild fatty liver, a cutoff value of 0.69 dB/cm/MHz showed an AUC value of 0.778 (95% CI0.649–0.878) with a sensitivity of 70.4% and specificity of 83.3% (Figure 4b).
Table 4. Diagnostic performance of median ATI values for staging hepatic steatosis according to thegrayscale US and MRI-PDFF.
ReferenceModalities
Hepatic SteatosisGroups
Cutoff Value ofATI (dB/cm/MHz) AUC 95% CI Sensitivity
(%)Specificity
(%)
Grayscale US
normal vs.mild/moderate/severe 0.59 0.853 0.762–0.920 80.7 77.4
mild vs.moderate/severe 0.69 0.778 0.649–0.878 70.4 83.3
MRI-PDFF S1 (mild) vs. S2–3(moderate–severe) 0.69 0.909 0.695–0.990 81.8 88.9
US: ultrasonography; PDFF: proton density fat fraction; ATI: attenuation imaging; AUC: area under the curve; CI:confidence interval.
Biology 2022, 11, 1087 8 of 12
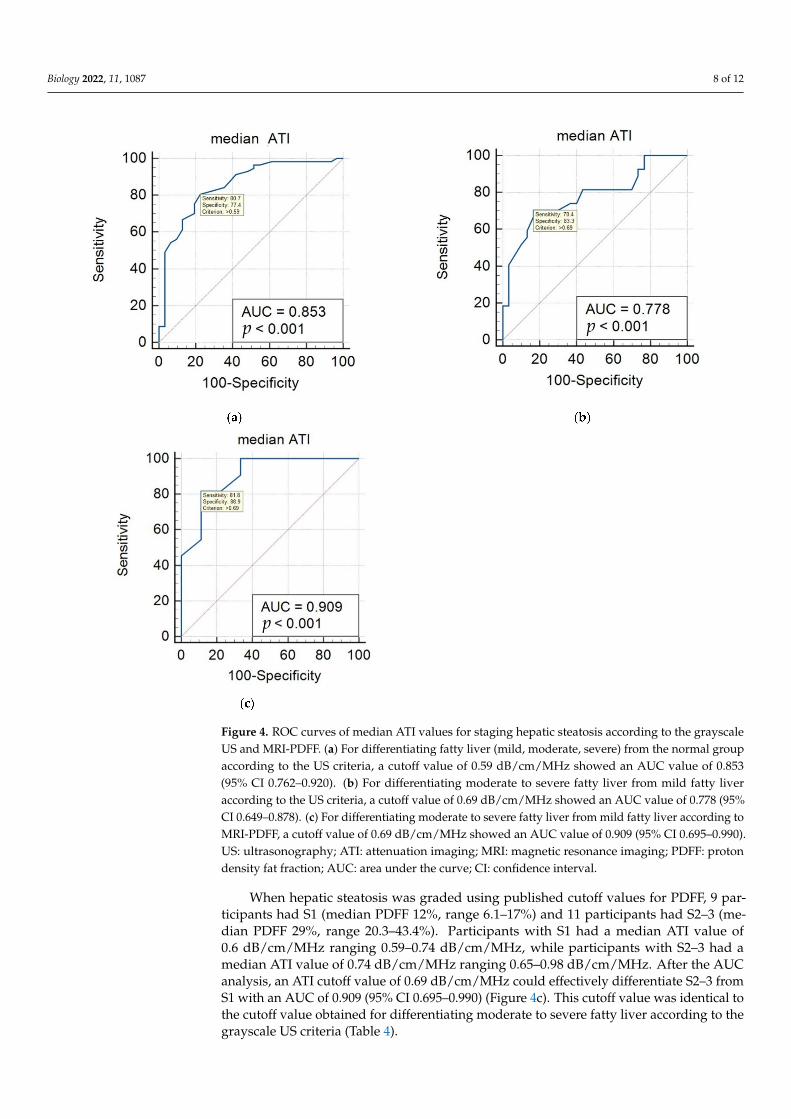
Figure 4. ROC curves of median ATI values for staging hepatic steatosis according to the grayscaleUS and MRI-PDFF. (a) For differentiating fatty liver (mild, moderate, severe) from the normal groupaccording to the US criteria, a cutoff value of 0.59 dB/cm/MHz showed an AUC value of 0.853(95% CI 0.762–0.920). (b) For differentiating moderate to severe fatty liver from mild fatty liveraccording to the US criteria, a cutoff value of 0.69 dB/cm/MHz showed an AUC value of 0.778 (95%CI 0.649–0.878). (c) For differentiating moderate to severe fatty liver from mild fatty liver according toMRI-PDFF, a cutoff value of 0.69 dB/cm/MHz showed an AUC value of 0.909 (95% CI 0.695–0.990).US: ultrasonography; ATI: attenuation imaging; MRI: magnetic resonance imaging; PDFF: protondensity fat fraction; AUC: area under the curve; CI: confidence interval.
When hepatic steatosis was graded using published cutoff values for PDFF, 9 par-ticipants had S1 (median PDFF 12%, range 6.1–17%) and 11 participants had S2–3 (me-dian PDFF 29%, range 20.3–43.4%). Participants with S1 had a median ATI value of0.6 dB/cm/MHz ranging 0.59–0.74 dB/cm/MHz, while participants with S2–3 had amedian ATI value of 0.74 dB/cm/MHz ranging 0.65–0.98 dB/cm/MHz. After the AUCanalysis, an ATI cutoff value of 0.69 dB/cm/MHz could effectively differentiate S2–3 fromS1 with an AUC of 0.909 (95% CI 0.695–0.990) (Figure 4c). This cutoff value was identical tothe cutoff value obtained for differentiating moderate to severe fatty liver according to thegrayscale US criteria (Table 4).

Biology 2022, 11, 1087 9 of 12
3.5. Factors Related to Measurement Failure with ATI in Pediatric Participants
Measurement failure occurred in 23 of the 111 pediatric participants and participantswith measurement failure were of younger age (mean 8.3 ± 1.4 vs. 10.0 ± 2.6 years old,p < 0.001), decreased weight (36.4 ± 8.3 vs. 53.8 ± 18.4 kg, p < 0.001), decreased BMI(19.9 ± 3.6 vs. 24.6 ± 4.2 kg/m2, p < 0.001) and normal liver echo on US (78.3% vs. 35.3%,p < 0.001), compared with participants with successful measurements (Table 5). On theunivariate logistic regression test, age, sex, BMI and normal liver echo on US were allsignificant variables associated with measurement failure, and only BMI showed significantassociation on the multivariate analysis.
Table 5. Comparison of factors related to measurement failure with ATI.
Success(n = 88)
Failure(n = 23) p-Value * OR ** 95% CI ** p-Value **
Age (years) 10.4 ± 2.6 8.5 ± 1.4 0.065 1.638 1.042–2.576 0.033Sex 47:41 5:18 0.007 0.242 0.083–0.710 0.01Height (cm) 145.8 ± 13.8 134.7 ± 9.9 0.069 1.078 1.030–1.129 0.001Weight (kg) 53.8 ± 18.4 36.4 ± 8.3 <0.001 1.124 1.057–1.196 <0.001BMI (kg/m2) 24.6 ± 4.2 19.9 ± 3.6 0.421 1.361 1.168–1.585 <0.001Liver echo on US(normal vs. abnormal) 31:57 18:05 <0.001 6.619 2.241–19.552 0.001
* independent two-sample t-test or Chi-square test. ** univariate logistic regression result. US: ultrasonography;BMI: body mass index; ATI: attenuation imaging; OR: odds ratio; CI: confidence interval.
4. Discussion
ATI has been suggested as an answer to an increasing need for accurate fat quan-tification in the liver, and shows advantages over other techniques as ATI values can besimply obtained with grayscale US examinations [22]. With ATI, radiologists measure thedegree of US beam attenuation according to depth by using a rudimentary echo decayprofile after removing systemic influences on US [23]. Operators can easily measure ATIvalues during grayscale US through the automatic removal of vessels and artifacts. ATIhas shown better reproducibility in its results, lower measurement failure, and comparablediagnostic performance compared to CAP in adult studies [24,25]. In adults, the AUCvalues of ATI for staging steatosis grades 1–3 have been reported to range from 0.76 to0.99 [23]. In addition, the quantification of hepatic steatosis using ATI is not affected by thedegree of liver fibrosis [26].
Our study is meaningful because ATI has not been assessed extensively in the pedi-atric population. In comparison to the broad research already done in adults, pediatricstudies on ATI have been limited to healthy children [18]. Cailloce et al. demonstratedthat the median ATI value was 0.65 dB/cm/MHz with a range of 0.5–0.81 dB/cm/MHz in77 healthy children [18]. In their study, 89.5% of the children had valid measurements [18].They suggested that a thickened hepatocyte layer pattern in younger children could explain theincreased US beam attenuation seen on ATI and be the reason for the slightly increased medianATI value compared to previously published values in adults (0.31–0.75 dB/cm/MHz) [18].In our study, 79.3% of participants had successful ATI measurements. The median ATIvalue in the normal group was 0.54 ± 0.09 dB/cm/MHz and it was comparable withpast studies. One recent study demonstrated that CAP showed better performance thangrayscale US for diagnosing hepatic steatosis in a pediatric population but there is noestablished data for ATI in diseased children [27].
Using MRI-PDFF as reference, the known cutoff value for diagnosing hepatic steato-sis in adults is 0.59 dB/cm/MHz for ATI with an AUC of 0.76, sensitivity of 88%, andspecificity 62.2% [15]. In addition, for discriminating S2–3 from S0–1, a cutoff value of0.72 dB/cm/MHz was used for adults with an AUC of 0.95, sensitivity of 100%, andspecificity of 78% [17,28]. These results were comparable to our study which showed cutoffvalues of 0.59 and 0.69 dB/cm/MHz, with AUC values of 0.853 and 0.909, respectively. To

Biology 2022, 11, 1087 10 of 12
our knowledge, our study is the first to demonstrate a specific cutoff value for ATI usingUS and MRI as references for pediatric hepatic steatosis.
In our retrospective study, 20.7% of the examinations ended with measurement failure.This was a relatively higher rate of failure compared to adults and possibly because weapplied a strict definition for measurement failure. Decreased R2 values were frequentlyencountered during examination and this tendency also needs be further validated inyounger participants. In addition, we repeated measurements for the ATI values five timesseparately. Obtaining stable results during longer scan times with repeated measurementsis not easy for children and steady breath holding is also difficult. This might have affectedthe number of valid measurements in our study population. Apart from the measurementtechnique, there was also a tendency for increased measurement failure in the normal liverand younger children with lower BMI. In healthy younger children, decreased liver volumeand a smaller measurable area in the liver parenchyma without vessels could be the reasonfor fewer valid measurements. Further research on the reliability of ATI measurements andthe definition of measurement failure in the pediatric population is warranted.
Additionally, we performed SWE and SWD during US acquisition. SWE is usedto quantify liver fibrosis and SWD is related to tissue viscosity that can be seen in liverinflammation [18,29]. These are new techniques, especially SWD, and expected to quantifypathophysiologic characteristics of the liver independently [29]. In our study population,SWE was significantly increased in the fatty liver group compared to the normal group,even though SWE and SWD did not show significant results in regression tests. This mightbe because our study cohort included a relatively small number of participants in themoderate to severe fatty liver group and participants with liver fibrosis accompanied bysteatosis. Further studies with a larger population are needed to demonstrate the clinicalimplications of SWD in pediatric NAFLD.
Our study has several limitations. First, we did not obtain a histologic confirmationof hepatic steatosis in children. Instead, we assessed fatty liver and steatosis degreewith the generally acknowledged method of using grayscale US and the most accuratemethod of using MRI-PDFF. Using these methods, we found cutoff values that were notvery different from those reported in other studies. Second, one radiologist performedthe US examinations and inter- and intra-observer variability was not assessed in thisretrospective study. However, the performing radiologist was thought to have adequateexperience with pediatric US including shear-wave elastography and we believe that theresults were consistent and trustworthy. In addition, another study demonstrated that ATIhad high intra- and inter-observer reproducibility [30]. Third, a relatively small numberof participants were included in our study. Only a few of the participants included in ourstudy population had moderate to severe fatty liver, and we could not classify them further.In addition, children with normal liver echogenicity on grayscale US did not undergo MRIand MRI results were only available for participants with fatty liver. Substantial number ofthe participants did not undergo MRI due to matter of cost and time in this retrospectivestudy. Thus, accuracy of validation is limited due to a small number of the participantswho underwent MRI. However, we validated the feasibility of ATI through comparing theATI cutoff value for predicting mild fatty liver and moderate to severe fatty liver graded bygray scale US and those by MRI. A larger study population is needed to validate the ATItechnique for pediatric hepatic steatosis.
5. Conclusions
Our study showed that successful ATI measurement was possible in approximately80% of children and ATI values significantly increased with the degree of fatty liver andBMI values. Using cutoff values of 0.59 and 0.69 dB/cm/MHz, ATI could effectivelydiscriminate the presence of fatty liver and differentiate moderate to severe fatty liver inchildren, respectively. ATI has the potential to be an effective US technique for quantifyingpediatric hepatic steatosis, but measurement methods need to be further validated to assurereliable results in children.

Biology 2022, 11, 1087 11 of 12
Author Contributions: Conceptualization, K.S. and H.J.S.; Data curation, K.S. and H.J.S.; Formalanalysis, N.-H.S. and H.J.S.; Investigation, K.S. and H.J.S.; Methodology, K.S., N.-H.S. and H.J.S.;Project administration, K.S. and H.J.S.; Resources, K.S.; Software, N.-H.S. and H.J.S.; Supervision,D.R.C. and H.W.C.; Validation, D.R.C. and H.W.C.; Visualization, H.J.S.; Writing—original draft, K.S.and H.J.S.; Writing—review and editing, D.R.C. and H.W.C. All authors have read and agreed to thepublished version of the manuscript.
Funding: This research received no external funding.
Institutional Review Board Statement: The study was conducted in accordance with the Declara-tion of Helsinki and was approved by the Institutional Review Board of Yonsei University YonginSeverance Hospital (IRB, 9-2022-0001).
Informed Consent Statement: The Institutional Review Board approved this retrospective studyand the requirement for informed consent was waived due to its retrospective nature.
Data Availability Statement: The data that support the findings of this study are available from thecorresponding author upon reasonable request.
Conflicts of Interest: The authors declare no conflict of interest.
References1. Vos, M.B.; Abrams, S.H.; Barlow, S.E.; Caprio, S.; Daniels, S.R.; Kohli, R.; Mouzaki, M.; Sathya, P.; Schwimmer, J.B.; Sundaram, S.S.; et al.
Naspghan clinical practice guideline for the diagnosis and treatment of nonalcoholic fatty liver disease in children: Recommenda-tions from the expert committee on nafld (econ) and the north american society of pediatric gastroenterology, hepatology andnutrition (naspghan). J. Pediatric Gastroenterol. Nutr. 2017, 64, 319–334.
2. Nobili, V.; Mantovani, A.; Cianfarani, S.; Alisi, A.; Mosca, A.; Sartorelli, M.R.; Maffeis, C.; Loomba, R.; Byrne, C.D.; Targher, G.Prevalence of prediabetes and diabetes in children and adolescents with biopsy-proven non-alcoholic fatty liver disease. J. Hepatol.2019, 71, 802–810. [CrossRef] [PubMed]
3. Song, K.; Park, G.; Lee, H.S.; Lee, M.; Lee, H.I.; Choi, H.S.; Suh, J.; Kwon, A.; Kim, H.S.; Chae, H.W. Comparison of the triglycerideglucose index and modified triglyceride glucose indices to predict nonalcoholic fatty liver disease in youths. J. Pediatrics 2022,242, 79–85. [CrossRef] [PubMed]
4. Alam, S.; Mustafa, G.; Alam, M.; Ahmad, N. Insulin resistance in development and progression of nonalcoholic fatty liver disease.World J. Gastrointest. Pathophysiol. 2016, 7, 211–217. [CrossRef]
5. Song, K.; Lee, H.W.; Choi, H.S.; Park, G.; Lee, H.S.; Kim, S.J.; Lee, M.; Suh, J.; Kwon, A.; Kim, H.S.; et al. Comparison of themodified tyg indices and other parameters to predict non-alcoholic fatty liver disease in youth. Biology 2022, 11, 685. [CrossRef]
6. Zhang, X.; Wu, M.; Liu, Z.; Yuan, H.; Wu, X.; Shi, T.; Chen, X.; Zhang, T. Increasing prevalence of nafld/nash among children,adolescents and young adults from 1990 to 2017: A population-based observational study. BMJ Open 2021, 11, e042843. [CrossRef]
7. Welsh, J.A.; Karpen, S.; Vos, M.B. Increasing prevalence of nonalcoholic fatty liver disease among united states adolescents,1988-1994 to 2007-2010. J. Pediatrics 2013, 162, 496–500. [CrossRef]
8. Song, K.; Park, G.; Lee, H.S.; Lee, M.; Lee, H.I.; Ahn, J.; Lee, E.; Choi, H.S.; Suh, J.; Kwon, A.; et al. Trends in prediabetes andnon-alcoholic fatty liver disease associated with abdominal obesity among korean children and adolescents: Based on the koreanational health and nutrition examination survey between 2009 and 2018. Biomedicines 2022, 10, 584. [CrossRef]
9. Shin, H.J.; Kim, H.G.; Kim, M.J.; Koh, H.; Kim, H.Y.; Roh, Y.H.; Lee, M.J. Normal range of hepatic fat fraction on dual- andtriple-echo fat quantification mr in children. PLoS ONE 2015, 10, e0117480. [CrossRef]
10. Shah, J.; Okubote, T.; Alkhouri, N. Overview of updated practice guidelines for pediatric nonalcoholic fatty liver disease.Gastroenterol. Hepatol. 2018, 14, 407–414.
11. Molleston, J.P.; Schwimmer, J.B.; Yates, K.P.; Murray, K.F.; Cummings, O.W.; Lavine, J.E.; Brunt, E.M.; Scheimann, A.O.;Unalp-Arida, A. Histological abnormalities in children with nonalcoholic fatty liver disease and normal or mildly elevatedalanine aminotransferase levels. J. Pediatrics 2014, 164, 707–713. [CrossRef] [PubMed]
12. Ferraioli, G.; Maiocchi, L.; Savietto, G.; Tinelli, C.; Nichetti, M.; Rondanelli, M.; Calliada, F.; Preda, L.; Filice, C. Performance of theattenuation imaging technology in the detection of liver steatosis. J. Ultrasound Med. 2021, 40, 1325–1332. [CrossRef] [PubMed]
13. Tamaki, N.; Ajmera, V.; Loomba, R. Non-invasive methods for imaging hepatic steatosis and their clinical importance in nafld.Nat. Rev. Endocrinol. 2022, 18, 55–66. [CrossRef]
14. Sugimoto, K.; Moriyasu, F.; Oshiro, H.; Takeuchi, H.; Abe, M.; Yoshimasu, Y.; Kasai, Y.; Sakamaki, K.; Hara, T.; Itoi, T. The roleof multiparametric us of the liver for the evaluation of nonalcoholic steatohepatitis. Radiology 2020, 296, 532–540. [CrossRef][PubMed]
15. Jeon, S.K.; Lee, J.M.; Joo, I.; Yoon, J.H.; Lee, D.H.; Lee, J.Y.; Han, J.K. Prospective evaluation of hepatic steatosis using ultrasoundattenuation imaging in patients with chronic liver disease with magnetic resonance imaging proton density fat fraction as thereference standard. Ultrasound Med. Biol. 2019, 45, 1407–1416. [CrossRef] [PubMed]

Biology 2022, 11, 1087 12 of 12
16. Gatos, I.; Drazinos, P.; Yarmenitis, S.; Theotokas, I.; Koskinas, J.; Koullias, E.; Mitranou, A.; Manesis, E.; Zoumpoulis, P.S.Liver ultrasound attenuation: An ultrasound attenuation index for liver steatosis assessment. Ultrasound Q. 2022, 38, 124–132.[CrossRef]
17. Ferraioli, G.; Berzigotti, A.; Barr, R.G.; Choi, B.I.; Cui, X.W.; Dong, Y.; Gilja, O.H.; Lee, J.Y.; Lee, D.H.; Moriyasu, F.; et al.Quantification of liver fat content with ultrasound: A wfumb position paper. Ultrasound Med. Biol. 2021, 47, 2803–2820. [CrossRef][PubMed]
18. Cailloce, R.; Tavernier, E.; Brunereau, L.; Fievet, A.; Falip, C.; Dujardin, F.; Willot, S.; Patat, F.; Morel, B. Liver shear waveelastography and attenuation imaging coefficient measures: Prospective evaluation in healthy children. Abdom. Radiol. 2021, 46,4629–4636. [CrossRef]
19. Bae, J.S.; Lee, D.H.; Suh, K.S.; Kim, H.; Lee, K.B.; Lee, J.Y.; Han, J.K. Noninvasive assessment of hepatic steatosis using a pathologicreference standard: Comparison of ct, mri, and us-based techniques. Ultrasonography 2022, 41, 344–354. [CrossRef]
20. Shin, J.; Kim, M.J.; Shin, H.J.; Yoon, H.; Kim, S.; Koh, H.; Lee, M.J. Quick assessment with controlled attenuation parameter forhepatic steatosis in children based on mri-pdff as the gold standard. BMC Pediatr. 2019, 19, 112. [CrossRef]
21. Bae, J.S.; Lee, D.H.; Lee, J.Y.; Kim, H.; Yu, S.J.; Lee, J.H.; Cho, E.J.; Lee, Y.B.; Han, J.K.; Choi, B.I. Assessment of hepatic steatosis byusing attenuation imaging: A quantitative, easy-to-perform ultrasound technique. Eur. Radiol. 2019, 29, 6499–6507. [CrossRef][PubMed]
22. Jang, J.K.; Choi, S.H.; Lee, J.S.; Kim, S.Y.; Lee, S.S.; Kim, K.W. Accuracy of the ultrasound attenuation coefficient for the evaluationof hepatic steatosis: A systematic review and meta-analysis of prospective studies. Ultrasonography 2022, 41, 83–92. [CrossRef][PubMed]
23. Lee, D.H. Quantitative assessment of fatty liver using ultrasound attenuation imaging. J. Med. Ultrason. 2021, 48, 465–470.[CrossRef] [PubMed]
24. Tamaki, N.; Kurosaki, M.; Yasui, Y.; Tsuchiya, K.; Izumi, N. Attenuation coefficient (att) measurement for liver fat quantificationin chronic liver disease. J. Med. Ultrason. 2021, 48, 481–487. [CrossRef] [PubMed]
25. Podrug, K.; Sporea, I.; Lupusoru, R.; Pastrovic, F.; Mustapic, S.; Bâldea, V.; Bozin, T.; Bokun, T.; Salkic, N.; S, irli, R.; et al. Diagnosticperformance of 2-d shear-wave elastography with propagation maps and attenuation imaging in patients with non-alcoholic fattyliver disease. Ultrasound Med. Biol. 2021, 47, 2128–2137. [CrossRef]
26. Dioguardi Burgio, M.; Ronot, M.; Reizine, E.; Rautou, P.E.; Castera, L.; Paradis, V.; Garteiser, P.; Van Beers, B.; Vilgrain, V.Quantification of hepatic steatosis with ultrasound: Promising role of attenuation imaging coefficient in a biopsy-proven cohort.Eur. Radiol. 2020, 30, 2293–2301. [CrossRef]
27. Runge, J.H.; van Giessen, J.; Draijer, L.G.; Deurloo, E.E.; Smets, A.; Benninga, M.A.; Koot, B.G.P.; Stoker, J. Accuracy of controlledattenuation parameter compared with ultrasound for detecting hepatic steatosis in children with severe obesity. Eur. Radiol. 2021,31, 1588–1596. [CrossRef]
28. Ferraioli, G.; Maiocchi, L.; Raciti, M.V.; Tinelli, C.; De Silvestri, A.; Nichetti, M.; De Cata, P.; Rondanelli, M.; Chiovato, L.;Calliada, F.; et al. Detection of liver steatosis with a novel ultrasound-based technique: A pilot study using mri-derived protondensity fat fraction as the gold standard. Clin. Transl. Gastroenterol. 2019, 10, e00081. [CrossRef]
29. Sugimoto, K.; Moriyasu, F.; Oshiro, H.; Takeuchi, H.; Yoshimasu, Y.; Kasai, Y.; Itoi, T. Clinical utilization of shear wave dispersionimaging in diffuse liver disease. Ultrasonography 2020, 39, 3–10. [CrossRef]
30. Yoo, J.; Lee, J.M.; Joo, I.; Lee, D.H.; Yoon, J.H.; Kang, H.J.; Ahn, S.J. Reproducibility of ultrasound attenuation imaging for thenoninvasive evaluation of hepatic steatosis. Ultrasonography 2020, 39, 121–129. [CrossRef]