
Practical Guide to Emergency Ultrasound
468
Karen S. Cosby, MD, FACEP Director, Emergency Ultrasound Fellowship Senior Attending Physician Department of Emergency Medicine Cook County Hospital (Stroger) Associate Professor Rush Medical College Chicago, Illinois John L. Kendall, MD, FACEP Director, Emergency Ultrasound Denver Health Medical Center Associate Professor Department of Emergency Medicine University of Colorado School of Medicine Denver, Colorado PRACTICAL GUIDE TO EMERGENCY ULTRASOUND Second Edition
-
Upload
khangminh22 -
Category
Documents
-
view
1 -
download
0
Transcript of Practical Guide to Emergency Ultrasound

Karen S. Cosby, MD, FACEPDirector, Emergency Ultrasound Fellowship
Senior Attending PhysicianDepartment of Emergency Medicine
Cook County Hospital (Stroger)Associate Professor
Rush Medical CollegeChicago, Illinois
John L. Kendall, MD, FACEPDirector, Emergency UltrasoundDenver Health Medical Center
Associate ProfessorDepartment of Emergency Medicine
University of Colorado School of MedicineDenver, Colorado
PRACTICAL GUIDE TO
EMERGENCY ULTRASOUNDS e c o n d E d i t i o n

Executive Editor: Rebecca S. GaertnerProduct Manager: Ashley FischerVendor Manager: Bridgett DoughertyManufacturing Manager: Beth WelshMarketing Manager: Lisa LawrenceDesign Coordinator: Teresa MallonProduction Service: S4Carlisle Publishing Services
© 2014 by LIPPINCOTT WILLIAMS & WILKINS, a WOLTERS KLUWER business
Two Commerce Square2001 Market StreetPhiladelphia, PA 19103 USALWW.com
All rights reserved. This book is protected by copyright. No part of this book may be reproduced in any form by any means, including photocopying, or utilized by any information storage and retrieval system without written permission from the copyright owner, except for brief quotations embodied in critical articles and reviews. Materials appearing in this book prepared by individuals as part of their official duties as U.S. government employees are not covered by the above-mentioned copyright.
Printed in China
Library of Congress Cataloging-in-Publication Data
Practical guide to emergency ultrasound / editors, Karen S. Cosby, John L. Kendall.—2nd ed. p. ; cm. Includes bibliographical references and index. ISBN 978-1-4511-7555-4 (alk. paper) I. Cosby, Karen S. II. Kendall, John L. [DNLM: 1. Ultrasonography—methods. 2. Emergencies. WN 208] RC78.7.U4 616.07'543—dc23 2013012308
Care has been taken to confirm the accuracy of the information presented and to describe generally accepted practices. However, the authors, editors, and publisher are not responsible for errors or omissions or for any consequences from application of the information in this book and make no warranty, expressed or implied, with respect to the currency, completeness, or accuracy of the contents of the publication. Application of the information in a particular situation remains the professional responsibility of the practitioner.
The authors, editors, and publisher have exerted every effort to ensure that drug selection and dosage set forth in this text are in accordance with current recommendations and practice at the time of publication. However, in view of ongoing research, changes in government regulations, and the constant flow of information relating to drug therapy and drug reactions, the reader is urged to check the package insert for each drug for any change in indications and dosage and for added warnings and precautions. This is particularly important when the recommended agent is a new or infrequently employed drug.
Some drugs and medical devices presented in the publication have Food and Drug Administration (FDA) clearance for limited use in restricted research settings. It is the responsibility of the health care provider to ascertain the FDA status of each drug or device planned for use in their clinical practice.
To purchase additional copies of this book, call our customer service department at (800) 638-3030 or fax orders to (301) 223-2320. International customers should call (301)223-2300.
Visit Lippincott Williams & Wilkins on the Internet: at LWW.com. Lippincott Williams & Wilkins customer service representatives are available from 8:30 am to 6 pm, EST.
10 9 8 7 6 5 4 3 2 1

To our families
Whose patience and tolerance make everything possible
To our contributors
Who have given us countless hours and valuable expertise
To our students, residents, and fellows
Who test our ideas and sharpen our skills
To our patients
Who hopefully benefit from all our labor.


v
Contributors
Srikar Adhikari, MD, MS, RDMSAssociate ProfessorDepartment of Emergency MedicineUniversity of Arizona Medical
CenterTucson, AZ
Eric J. Adkins, MD, MScLead Administrative PhysicianDirector of Emergency Medicine
Critical CareAssistant Professor of Emergency
Medicine & Internal MedicineDepartment of Emergency MedicineDepartment of Internal MedicineDivision of Pulmonary, Allergy,
Critical Care & Sleep MedicineWexner Medical Center at The Ohio
State UniversityColumbus, OH
David P. Bahner, MD, RDMSAssociate Professor Director of
UltrasoundFounder Ultrasound AcademyDepartment of Emergency MedicineThe Ohio State University Medical
CenterColumbus, OH
Caitlin Bailey, MDEmergency MedicineAlameda County Medical CenterOakland, CA
John Bailitz, MD, FACEP, RDMSEmergency US Director Department
of Emergency MedicineCook County Hospital (Stroger)Chicago, IL
Aaron E. Bair, MD, MScAssociate Professor Emergency
MedicineMedical Director, Center for Health
and Technology
Ashraf Fayad, MBBCh, FRCPC, FACC, FASE
Associate ProfessorDirector, Perioperative Echocardiogra-
phy for Non-cardiac SurgeryThe Ottawa Hospital Department
of AnesthesiologyUniversity of OttawaOttawa, ON
Matthew Flannigan, DO, FACEPAssistant Ultrasound Program
DirectorDepartment of Emergency MedicineMichigan State University-Grand
RapidsSpectrum Health Hospital SystemGrand Rapids, MI
J. Christian Fox, MD, RDMS, FACEP, FAAEM, FAIUM
Professor of Clinical Emergency Medicine
Department of Emergency MedicineUniversity of CaliforniaIrvine, CA
Bradley W. Frazee, MDDepartment of Emergency MedicineAlameda County Medical Center –
Highland HospitalOakland, CAClinical Professor of Emergency
MedicineUniversity of California
San FranciscoSan Francisco, CA
Andrew J. French, MDAssociate Director, Emergency
UltrasoundDepartment of Emergency MedicineDenver Health Medical CenterAssistant Professor University of
Colorado School of MedicineDenver, CO
Medical Director, Center for Virtual Care
University of California Davis Health System
Sacramento, California
Gregory R. Bell, MDAssistant Clinical ProfessorDirector of Emergency Ultrasound
University of Iowa HospitalIowa City, IA
Michael Blaivas, MDProfessor of MedicineUniversity of South Carolina School
of MedicineColumbia, SC
Keith P. Cross, MD, MS, MScAssistant Professor of PediatricsDepartment of PediatricsUniversity of LouisvilleKosair Children’s HospitalLouisville, KY
Anthony J. Dean, MDAssociate Professor of Emergency
MedicineAssociate Professor of Emergency
Medicine in RadiologyDirector, Division of Emergency
UltrasonographyDepartment of Emergency
MedicineUniversity of Pennsylvania Medical
CenterPhiladelphia, PA
Joy English, MDUniversity of Utah Visiting
InstructorDepartment of Surgery, Division of
Emergency MedicineFellow, Primary Care Sports
MedicineSalt Lake City, UT

vi Contributors
Richard Gordon, MDUltrasound Fellow, Emergency
MedicineGeorgia Health Sciences
UniversityAugusta, GA
John Gullett, MDAssistant ProfessorCo-Director of Emergency UltrasoundDepartment of Emergency MedicineUniversity of Alabama at BirminghamBirmingham, AL
Michael Heller, MDProfessor of Clinical Emergency
MedicineAlbert Einstein School of MedicineDirector Emergency Ultrasound Beth
Israel Medical CenterNew York, NY
Stephen R. Hoffenberg, MD, FACEP
President, CarePoint Medical GroupAttending Emergency PhysicianRose Medical CenterDenver, CO
Russ Horowitz, MD, RDMSDirector Emergency UltrasoundEmergency DepartmentAnn & Robert H. Lurie Children’s
Hospital of ChicagoAssistant Professor, Northwestern
University Feinberg School of Medicine
Chicago, IL
Calvin Huang, MD, MPHUltrasound FellowDepartment of Emergency MedicineMassachusetts General HospitalBoston, MA
Nicole Danielle Hurst, MDEmergency Physician and Emergency
Ultrasound FellowDenver HealthDenver, CO
Jeanne Jacoby, MDVice Chair Emergency Department,
Pocono Medical CenterEast Stroudsburg, PA
Timothy Jang, MDAssociate Professor of Clinical
MedicineDirector of Emergency
UltrasonographyHarbor-UCLA Medical Center
David Geffen School of Medicine at UCLA
Los Angeles, CA
Dietrich Jehle, MD, ACEP, RDMSDirector of Emergency
Ultrasonography and Professor of Emergency Medicine
SUNY Buffalo, School of Medicine Associate Medical Director
Erie County Medical CenterBuffalo, NY
Ken Kelley, MDAssistant ProfessorFellowship Director, Emergency
UltrasoundDepartment of Emergency MedicineUniversity of California DavisSacramento, CA
R. Starr Knight, MDEmergency Ultrasound FellowDepartment of Emergency MedicineUniversity of California, San
FranciscoSan Francisco, CA
Brooks T. Laselle, MD, FACEPFellowship Director, Emergency
UltrasoundUltrasound Director, Emergency
Medicine ResidencyDepartment of Emergency MedicineMadigan Army Medical CenterTacoma, WAClinical Instructor, U of Washington
School of Medicine, Seattle, WA
Stephen J. Leech, MD, RDMSUltrasound Director, Graduate
Medical EducationOrlando Health, Orlando FLAssistant Clinical Professor,
University of Central Florida College of Medicine
Andrew S. Liteplo, MD, RDMSEmergency Ultrasound FellowshipDirector, Department of Emergency
MedicineMassachusetts General HospitalBoston, MA
Matthew Lyon, MD, FACEPProfessorVice Chairman for Academic
ProgramsDirector, Section of Emergency and
Clinical UltrasoundDepartment of Emergency
Medicine
Medical College of GeorgiaGeorgia Regents UniversityAugusta, GA
Daniel Mantuani, MD/MPHUltrasound FellowDepartment of Emergency MedicineAlameda County Medical CenterOakland, CA
David J. McLario, DO, MS, FACEP, FAAP
Department of PediatricsUniversity of LouisvilleLouisville, KY
Jacob C. Miss, MDResident PhysicianDepartment of Emergency
MedicineUniversity of California, San Fran-
cisco and San Francisco General Hospital
San Francisco, CA
Matthew A. Monson, DOAssistant Professor of RadiologyUniversity of Colorado School of
MedicineDenver Health Medical CenterDenver, CO Children’s Hospital
ColoradoAurora, CO
Christopher L. Moore, MD, RDMS, RDCS
Associate ProfessorDepartment of Emergency MedicineYale University School of MedicineNew Haven, CT
Arun Nagdev, MDDirector, Emergency UltrasoundAlameda County Medical CenterHighland General HospitalClinical Assistant ProfessorUniversity of CaliforniaSan Francisco School of MedicineSan Francisco, CA
Bret P. Nelson, MD, RDMS, FACEPDirector, Emergency UltrasoundAssociate Professor of Emergency
MedicineDepartment of Emergency MedicineMount Sinai School of MedicineNew York, NY
Vicki E. Noble, MDDirector, Division of Emergency
UltrasoundMassachusetts General Hospital

Contributors vii
Associate ProfessorHarvard Medical SchoolBoston, MA
David C. Pigott, MD, RDMS, FACEP
Co-Director of Emergency UltrasoundAssociate Professor and Vice Chair
for Academic DevelopmentDepartment of Emergency MedicineThe University of Alabama at
BirminghamBirmingham, AL
John S. Rose, MD, FACEPProfessor, Department of Emergency
MedicineUniversity of California, Davis Health
SystemSacramento, CA
Sachita P. Shah, MD, RDMSAssistant Professor, University of
Washington School of MedicineDivision of Emergency MedicineHarborview Medical CenterSeattle, WA
Paul R. Sierzenski, MD, RDMS, FACEP, FAAEM
Director, Emergency, Trauma and Critical Care Ultrasound
Assoc Dir, Emergency Medicine Ultrasound Fellowship
Christiana Care Health CenterNewark, DE
Michael B. Stone, MD, FACEPChief, Division of Emergency
UltrasoundDepartment of Emergency MedicineBrigham & Women’s HospitalBoston, MA
Richard Andrew Taylor, MDClinical Instructor, Department of
Emergency MedicineYale University School of MedicineNew Haven, CT
Amanda Greene Toney, MDAssistant Professor, Department of
PediatricsSection of Emergency MedicineUniversity of Colorado DenverAurora, CO
Negean Vandordaklou, MDClinical Instructor/Fellow
of Emergency UltrasoundEmergency DepartmentUniversity of California Irvine
Medical CenterOrange, CA
Ralph C. Wang, MD, RDMSAssistant ProfessorDirector of Emergency Ultrasound
FellowshipDepartment of Emergency
MedicineUniversity of California, San
FranciscoSan Francisco, CA
Juliana Wilson, DOUltrasound Fellow, University of
Buffalo Emergency Medicine Residency
Erie County Medical CenterBuffalo, NY
Michael Y. Woo, MD, CCFP (EM), RDMS
Associate ProfessorDirector and Fellowship DirectorEmergency Medicine
Ultrasonography Department of Emergency Medicine
University of Ottawa and The Ottawa Hospital
Ottawa, ON


ix
Preface
Emergency ultrasound has expanded well beyond most expecta-tions of even a decade ago. This text too has changed in signifi-cant ways. The scope of the book is unapologetically expansive. We are well aware of the need for innovation to keep pace with the rapid rate of change in medical knowledge and technology. Our goal is to make as much information as possible acces-sible to the reader. As ultrasound finds its way into undergradu-ate education, and as it spreads to other medical disciplines, we believe the potential for ultrasound will only continue to grow.
This book differs from many in our approach to scanning. Rather than present only a traditional region- or organ-specific approach, we have added sections with a problem/symptom-based approach. The opening section on “Resuscitation of Acute Injury or Illness” describes use of ultrasound in solving clinical questions to resuscitate patients with shock or acute dyspnea. In addition, we present material in the manner in which we understand ultrasound is used; thus, content on pro-cedural assistance is placed adjacent to sections on related diag-nosis. Increasingly, we find that as ultrasound is incorporated into the physical exam, one application melds into another. At first, a diagnosis is considered, possibly excluded, then another one entertained. Therapeutic interventions are made (possibly with ultrasound assistance), and then the patient reassessed (again with ultrasound). Thus, ultrasound becomes an inte-gral tool for the dynamic process of diagnosis, treatment, and reassessment. In order to make the content relevant for both adults and children, we have added special highlighted inserts (“Pediatric Considerations”) for helpful guidance to modify technique or improve interpretation and use of ultrasound for children when content differs from adults.
This revised edition adds video clips that display more realistic three-dimensional views of anatomy. We have increased the number and variety of images that are included in the electronic version of the book. The result is a rich resource with a library of images to learn from.
In an increasingly digital era, many readers might ques-tion if textbooks are even necessary. Our answer rests with this book. In one place we have condensed expertise across emergency ultrasound, complete with photos, images, and videos that demonstrate a wide range of pathology. We have focused on technique and recognition of images without repeating content on pathophysiology that can be gained from general medical sources.
Point of care ultrasound can improve the ability to make rapid decisions and optimize care in many settings ranging from the high-tech environment of critical care to the frontline of disaster relief in third world countries. By arming the bedside clinician with rapid access to infor-mation, we believe ultrasound improves both quality and safety for patients in situations where either time or re-sources are limited. Even in routine situations, ultrasound can augment the physical exam and help decisions about diagnosis and care to be made earlier and with greater certainty. The ability to take advantage of ultrasound technology has changed the nature of frontline medicine. We are thrilled to participate in spreading this skill to clinicians.
Karen S. Cosby, MDJohn L. Kendall, MD


xi
Preface to First Edition
Change comes slowly. The first paper pertaining to emer-gency ultrasound appeared more than 15 years ago, and while the concept of physicians performing a “limited” ultrasound examination took root and gained favor from clinicians and educators, the growth of this imaging modality has been slower than expected. Formal teaching in ultrasound is now a part of most Emergency Medicine residencies, yet, as educa-tors, we find that there is a dramatic drop-off in the applica-tion of ultrasound skills once residents leave their academic training grounds and enter practice. There are many barriers that impede the widespread acceptance and use of bedside ultrasound in real-life practice. This book was born from our efforts to identify and understand these difficulties, and writ-ten with the intent to empower the reader to surmount them.
From an educator’s perspective, the ability to incorporate ultrasound into clinical practice requires at least four criti-cal elements. First, the skill must be seen as valuable, one worth learning. Secondly, the skill itself requires specialty knowledge, awareness of ultrasound-relevant anatomy and landmarks. The clinician must have technical knowledge and skill to acquire the image. Lastly, the clinician must be able to take the information and use it in real-time decision making. This text is organized around these four goals. Each chapter begins with indications for ultrasound, then focuses on a review of normal ultrasound anatomy, techniques for acquiring the image, and guidelines for using the information to make clinical decisions.
The emergency physician faces other challenges as well, factors that ultimately may limit his/her ability to incorpo-rate ultrasound into clinical practice. There are administra-tive pressures to be efficient. There are financial pressures to optimize billing and reimbursement. There are political pressures within each institution that influence the ability to change clinical practice, especially when it entails interaction with other specialties. We have attempted to address these challenges up front, with guidelines for introducing emer-gency ultrasound into a new practice, suggestions for quality assurance and credentialing, and practical ideas for making ultrasound efficient and accurate.
As this text enters production, we face an interesting paradox. The widespread integration of ultrasound into clini-cal practice has occurred relatively slowly, while the tech-nology and potential applications are expanding at a rapid
rate. New applications for bedside ultrasound are continually being found, and keeping up with and predicting these trends in a textbook is nearly impossible. Recognizing that limi-tation, this text includes sections pertaining to many of the applications that are currently considered cutting-edge. Our goal is to narrow the gap between where we stand today and where we hope to be in the next decade of growth. Besides, it is becoming increasingly apparent that bedside ultrasound is not an imaging modality specific to emergency medicine, but rather one that is useful to many different clinicians ( physicians, nurses, and prehospital personnel) across a vari-ety of specialties (surgeons, intensivists, cardiologists, and internists). While the authors of this textbook are all practic-ing emergency physicians, the content of this text is appli-cable to many different practitioners who seek to realize the benefits of bedside ultrasound.
Bedside ultrasound is an evolving standard. In the early years, the use of ultrasound by emergency physicians was viewed as an encroachment into an area that belonged to other specialists. This is no longer the case. Emergency medicine has adopted the technology and developed it for our own purpose, just as other specialties have done. We have contributed significantly to the ultrasound literature. We have developed it for practical bedside applications, applying it to many types of exams not traditionally performed by radiolo-gists. Ultrasound manufacturers have introduced equipment that is designed specifically for bedside use, with increased portability, rapid boot-up times, and improved versatility appropriate for a wide range of applications. Emergency ultrasound can no longer be considered a borrowed skill, nor even an alternative to consultative scans; rather, it has become a discipline in itself.
Change is inevitable. Emergency medicine has a history and philosophy accepting of change and a drive to contin-ually raise the standard of care. We are proud to continue that tradition with this book. Our hope is that this text will help bedside clinicians, regardless of their specialty or level of training, to acquire or improve basic bedside ultrasound skills, enhance their clinical practice, and ultimately raise the standard of care for our patients.
Karen S. Cosby, MDJohn L. Kendall, MD


xiii
Contents
Contributors ..................................................................................... v
Preface ............................................................................................ ix
Preface to First Edition .................................................................... xi
Index to Procedures ........................................................................xv
SECTION IGetting Started with Bedside Ultrasound
1 The History and Philosophy of Emergency Ultrasound ............................................. 1
Stephen R. Hoffenberg
2 Fundamentals of Ultrasound ...................................... 10 Ken Kelley, John S. Rose, and Aaron E. Bair
SECTION IIUltrasound in the Resuscitation of Acute Injury or Illness
3 Trauma ....................................................................... 21 Brooks T. Laselle and John L. Kendall
4 Echocardiography ...................................................... 55 Richard Andrew Taylor and Christopher L. Moore
5 Lung and Thorax ........................................................ 75 Calvin Huang, Andrew S. Liteplo, and Vicki E. Noble
6 Inferior Vena Cava ......................................................84 Richard Gordon and Matthew Lyon
7 A Problem-Based Approach to Resuscitation of Acute Illness or Injury: Resuscitative Ultrasound ...........................................96
John Bailitz
8 Critical Procedures for Acute Resuscitations ........... 108 Michael Y. Woo and Ashraf Fayed
SECTION IIIEvaluation of Abdominal Conditions
9 Right Upper Quadrant: Liver, Gallbladder, and Biliary Tree ..................................... 133
Karen S. Cosby and John L. Kendall
10 Abdominal Aorta ....................................................... 156 Anthony J. Dean
11 Kidneys ..................................................................... 172 Michael Blaivas
12 Bedside Sonography of the Bowel ............................ 186 Timothy Jang
13 Abdominal Procedures ............................................. 195 Gregory R. Bell
SECTION IVEvaluation of Pelvic Complaints
14 Pelvic Ultrasound in the Nongravid Patient ............... 202 Jeanne Jacoby and Michael Heller
15 First Trimester Pregnancy ......................................... 218 Ralph C. Wang and R. Starr Knight
16 Second and Third Trimester Pregnancy .................... 236 John Gullett and David C. Pigott
SECTION VVascular Emergencies
17 Lower Extremity Venous Studies .............................. 254 J. Christian Fox and Negean Vandordaklou
18 Arterial Emergencies ................................................. 264 Caitlin Bailey, Daniel Mantuani, and Arun Nagdev
SECTION VIScrotal Emergencies
19 Scrotal Emergencies ................................................. 271 Paul R. Sierzenski and Stephen J. Leech
SECTION VIISoft Tissue and Musculoskeletal Conditions
20 Skin and Soft Tissue ................................................. 284 Jacob C. Miss and Bradley W. Frazee

xiv Contents
21 Musculoskeletal ........................................................ 303 Joy English
22 Soft Tissue and Musculoskeletal Procedures ............ 319 Andrew J. French, Joy English, Michael B. Stone,
and Bradley W. Frazee
SECTION VIIIProblems of the Head and Neck
23 Eye Emergencies ....................................................... 350 Matthew Flannigan, Dietrich Jehle,
and Juliana Wilson
24 Infections of the Head and Neck ............................... 365 Srikar Adhikari
25 Head and Neck Procedures ....................................... 383 Srikar Adhikari
SECTION IXPediatric Ultrasound
26 General Pediatric Problems ...................................... 388 Russ Horowitz
27 Pediatric Abdominal Emergencies ............................ 394 Keith P. Cross, Matthew A. Monson,
and David J. McLario
28 Pediatric Procedures ................................................. 407 Amanda Greene Toney and Russ Horowitz
SECTION XImplementing Ultrasound into the Clinical Setting
29 Implementing Ultrasound into the Community Emergency Department ............................................ 413
Bret P. Nelson and Stephen R. Hoffenberg
30 Implementing Ultrasound into the Academic Emergency Department ............................ 421
David P. Bahner, Eric J. Adkins, and John L. Kendall
31 Implementing Ultrasound in the Prehospital Setting ................................................... 428
Nicole Danielle Hurst
32 Implementing Ultrasound in Developing Countries ................................................ 435
Sachita Shah
Index ............................................................................................ 441
Highlighted Sections on Pediatric Considerations authored by Russ Horowitz.

xv
Index to Procedures
Ultrasound Guided Procedures
Arthrocentesis ......................................................... Chap 22
Bladder, suprapubic aspiration ................................ Chap 28
Endotracheal intubation, confirmation of ................ Chap 8
Foreign body, localization ....................................... Chap 20
Foreign body, removal ........................................... Chap 22
Fracture reduction ................................................... Chap 22
Hernia reduction ...................................................... Chap 13
Incision and drainage of abscessCutaneous ...................................................... Chap 20Head and neck ............................................... Chap 25Pediatric ......................................................... Chap 28Peritonsillar ................................................... Chap 25
Lumbar puncture ..................................................... Chap 22
Nerve blocks ........................................................... Chap 22
Pacemaker, placement ............................................... Chap 8
Paracentesis ............................................................. Chap 13
Pediatric procedures ................................................ Chap 28
Pericardiocentesis ..................................................... Chap 8
Thoracentesis ............................................................ Chap 8
Venous access, central ............................................... Chap 8
Venous access, central (peds) .................................. Chap 28
Venous access, peripheral ......................................... Chap 8
Venous access, peripheral (peds) ............................ Chap 28


1
delay between signal generation and display of the image. In addition, sufficient images were generated by real-time ultrasound to allow the visualization of continuous motion. Prior to the development of real-time ultrasound the com-plexity of acquiring images prevented the practical applica-tion of ultrasound for most emergency patients and was an absolute barrier to use at the bedside. Real-time scanning changed how ultrasound would be used, who would use ultrasound, and where studies would be performed.
Ultrasound devices continued to improve, and during the 1980s and 1990s, smaller, faster, and more portable ultra-sound equipment was developed in accompaniment with other enhancements, such as the transvaginal transducer, multi-frequency probes, and color Doppler. These improve-ments accelerated the movement of technology from the ultrasound suite to the bedside for immediate use in emer-gency patients.
The growth in clinical applications paralleled tech-nological advancements. As early as 1970, surgeons in Germany were the first to experiment with ultrasound for the detection of free fluid in the abdomen (14,15). In 1976, an American surgeon used ultrasound to describe and grade splenic injuries (16). Emergency physicians began inves-tigating the clinical use of ultrasound in the late 1980s,
INTRODUCTIONEmergency ultrasound is a standard emergency physician skill (1,2). It is taught in emergency medicine residencies (3,4), tested on board examinations (5,6), and is endorsed by emergency medicine professional societies (1,2,7). The use of ultrasound performed by the treating emergency physi-cian, interpreted as images are displayed and immediately used for diagnosis or for procedural assistance, differs sig-nificantly from the traditional approach of consultative imag-ing services. Bedside emergency ultrasound has proven to be an appropriate use of technology demonstrated to speed care (8–10), enhance patient safety (11,12), and save lives (13).
THE HISTORY OF EMERGENCY ULTRASOUNDUltrasound became available for clinical use in the 1960s following more than a decade of investigation. The tech-nology was initially found only in specialized imaging laboratories; however, by the 1970s, ultrasound was being adopted in diverse settings by a variety of clinical specialties. Ultrasound technology and devices improved rapidly, and real-time ultrasound was developed in the early 1980s that allowed the viewing of ultrasounds without an appreciable
ACEP Emergency Ultrasound Guidelines . . . . . . . . . . . . . 5The Core Content for Emergency Medicine and the
Model of the Clinical Practice of Emergency Medicine . . 5Model Curriculum for Physician Training in
Emergency Ultrasonography . . . . . . . . . . . . . . . . . . . 6AMA Approach to Ultrasound Privileging . . . . . . . . . . . . 6Additional Positions – AIUM, ASE, and ACR . . . . . . . . . . 6American Institute of Ultrasound Medicine . . . . . . . . . . . 6American Society of Echocardiography . . . . . . . . . . . . . . 6American College of Radiology . . . . . . . . . . . . . . . . . . . . 6
EMERGENCY ULTRASOUND AS AN EVOLVING STANDARD OF CARE . . . . . . . . . . . . . . . . . . . . . . . . . . . . . . 7
CONCLUSION . . . . . . . . . . . . . . . . . . . . . . . . . . . . . . . . . . . . . . 7
INTRODUCTION . . . . . . . . . . . . . . . . . . . . . . . . . . . . . . . . . . . . 1THE HISTORY OF EMERGENCY ULTRASOUND . . . . . . . . . . . . . 1GROWTH OF EMERGENCY ULTRASOUND . . . . . . . . . . . . . . . . 2
Recognition of Ultrasound’s Value . . . . . . . . . . . . . . . . . 2Timely Access to Imaging . . . . . . . . . . . . . . . . . . . . . . . . 2Imaging Availability . . . . . . . . . . . . . . . . . . . . . . . . . . . . . 2Improving Technology . . . . . . . . . . . . . . . . . . . . . . . . . . . 3Specialty Endorsement by Emergency Medicine . . . . . . . 3
THE PARADIGM OF EMERGENCY ULTRASOUND . . . . . . . . . . . 3CHARACTERISTICS OF THE EMERGENCY ULTRASOUND . . . . . 4CORE DOCUMENTS . . . . . . . . . . . . . . . . . . . . . . . . . . . . . . . . . 5
ACEP and SAEM Policy Statements on Emergency Ultrasound . . . . . . . . . . . . . . . . . . . . . . . . . . . . . . . . . 5
Stephen R. Hoffenberg
The History and Philosophy of Emergency Ultrasound
1

2 Section i / Getting Started with Bedside Ultrasound
while the first emergency ultrasound publication appeared in 1988, which addressed the utility of echocardiography performed by emergency physicians (17). From the late 1980s through the mid 1990s significant investigation was done in both the United States and Germany on the detec-tion of hemoperitoneum and hemopericardium in trauma victims. This research ultimately led to the description of the Focused Assessment with Sonography for Trauma or the FAST examination (13,18–22). The FAST examina-tion has essentially replaced diagnostic peritoneal lavage in all but a handful of patients, and has been fully integrated into Advanced Trauma Life Support (ATLS) teaching. This examination remains the standard initial ultrasound exami-nation for trauma victims by emergency physicians and trauma surgeons, and is often equated with “emergency ultrasonography.”
The American College of Emergency Physicians (ACEP) offered its initial course in the emergency applications of ultrasound in 1990. In 1991, both ACEP and the Society of Academic Emergency Medicine (SAEM) published position papers recognizing the utility of ultrasound for emergency patients (1,7). These documents endorsed not only the clini-cal use of ultrasound, but also ongoing research and educa-tion. The SAEM policy added that resident physicians should receive training leading to the performance and interpreta-tion of emergency ultrasound examinations. In 1994, SAEM published the Model Curriculum for Physician Training in Emergency Ultrasonography outlining recommended train-ing standards for emergency medicine residents (23). Shortly following the development of this curriculum, the first text-book dedicated to emergency ultrasound was published in 1995 (24).
In 2001, ACEP published the Emergency Ultrasound Guidelines more clearly defining the scope of practice and clinical indications for emergency ultrasonography (2). This policy statement advanced recommendations for credential-ing, quality assurance, and the documentation of emergency ultrasounds, as well as representing current best practices and standards for ultrasound provided by emergency phy-sicians. These guidelines were updated in 2008, reflecting the broader adoption, maturation, and expanded use of emer-gency ultrasound. A comprehensive approach to training, quality, documentation, and credentialing is provided in this document, as well as evidence-based additions to the list of core applications.
Over the past two decades, results of emergency physician-performed ultrasound have been examined for a wide spec-trum of clinical conditions and applications, including trauma (13,18–22,25,26), intrauterine pregnancy (8,27–31), abdomi-nal aortic aneurysm (AAA) (32–34), cardiac (13,35–39), biliary disease (40–43), urinary tract (44–46), deep venous thrombosis (DVT) (10,47,48), soft–tissue/musculoskeletal (49–58), thoracic (59), ocular (60–63) and procedure guid-ance (11,12,64–72). Each of these is now considered a primary indication for emergency ultrasound. Ongoing research will likely establish the efficacy of additional emergency applica-tions (Table 1.1).
GROWTH OF EMERGENCY ULTRASOUNDA number of factors have driven the development of emer-gency ultrasound. They include a growing recognition of the utility of ultrasound information, a need for timely access
to diagnostic imaging, declining access to consultative ser-vices, improved ultrasound technology, and the endorse-ment of immediate ultrasound by the specialty of emergency medicine.
Recognition of Ultrasound’s ValueA key factor contributing to the growth of emergency ultra-sound is an increased recognition of ultrasound’s clinical utility. The primary indications for diagnostic emergency ultrasound are now well established. Where immediate ultra-sound is available, it has essentially replaced invasive tech-niques such as peritoneal lavage and culdocentesis, as well as obviating the need for blind pericardiocentesis. Use for pro-cedure guidance, such as central venous access, has become a standard of care in many practice settings. Interestingly, the management of cardiac arrest assisted by diagnostic ultra-sound (36,39) or the evaluation of patients with nontraumatic hypotension (73,74) are examples of ultrasound usage not contemplated prior to the growth of emergency ultrasound.
Timely Access to ImagingFor many emergency conditions, ultrasound is needed on an immediate basis. Immediate may mean within minutes of patient presentation. Examples include central line place-ment under ultrasound guidance in the hypotensive patient, or hemodynamically unstable patients with suspected aortic aneurysm or blunt trauma. In addition, patients in cardiac arrest, with penetrating chest injuries, or those with undif-ferentiated hypotension are all candidates for immediate bedside ultrasound. These examinations are extremely time dependent, and typically they cannot be supplied in a clini-cally useful time-frame by even the best-staffed radiology departments or echocardiography laboratories. For some of these conditions, both diagnostic ultrasound (e.g., abdomi-nal) and echocardiography are required for the same patient, but in most hospitals these studies are supplied by separate consulting services. The ultrasound-trained emergency phy-sician is typically in the best position to utilize immediate ultrasound for a number of emergency conditions.
Imaging AvailabilityPatients present to the emergency department 24 hours a day, 7 days a week, and a predictable subset require ultra-sound evaluation. While recognition of the positive impact
TABLE 1.1 Core Emergency Ultrasound Applications
Trauma
Intrauterine pregnancy
AAA
Cardiac
Biliary
Urinary tract
DVT
Soft-tissue/musculoskeletal
Thoracic
Ocular
Procedural guidance

chapter 1 / The History and Philosophy of Emergency Ultrasound 3
of ultrasound imaging on patient care has grown, consulting imaging services have become progressively less available for emergency patients. This has been particularly true at night and on weekends. The reasons most often cited for decreasing access include higher costs incurred by the imaging service for “off-hours” studies and the lack of an adequate number of sonographers to perform these examinations. As a result, emergency physicians may be asked to hold patients that require imaging until the following day, to treat patients prior to diagnostic testing, or to send patients home with poten-tially life-threatening conditions pending a scheduled outpa-tient study. Common examples include holding a patient with undiagnosed abdominal pain pending a right upper quadrant study, treating a patient with anticoagulants prior to a deep venous ultrasound exam, or sending home a patient with sus-pected ectopic pregnancy prior to pelvic imaging.
Delays and decreased access to consultative imaging increase the medical risk to patients, can result in emergency department overcrowding, and increase medical liability for the emergency physician. Immediate imaging by the emergency physician can provide needed data, significantly decrease requirements for costly consultative studies, and avoid associated delays (8–10,42,75–77).
Improving TechnologyTechnology improvements in ultrasound devices have made an essential contribution to the development of emergency ultrasound programs. The stationary and operationally com-plex devices historically associated with ultrasound have been replaced with a variety of highly portable and more intuitive devices. Hardware improvements have been accom-panied by software enhancements resulting in increased speed, flexibility, image quality, and ease of use. These tech-nological advancements have increased the practical utility of ultrasound and have allowed the movement of this tech-nology from the laboratory to the bedside.
Specialty Endorsement by Emergency MedicineThe use of emergency ultrasound has been endorsed by emergency medicine professional societies, such as ACEP and SAEM (1,2,7). Assumptions underlying these endorse-ments are that specialists in emergency medicine are in the best position to recognize the needs of emergency patients and, in addition, have an obligation to utilize available tech-nologies that have been demonstrated to improve patient care. Finally, since ultrasound training has been included in residency education (3,4), emergency specialists now enter practice with the reasonable expectation of utilizing this standard emergency physician skill (1,2,5,6).
THE PARADIGM OF EMERGENCY ULTRASOUNDThe approach to ultrasound performed by the emergency physician differs significantly from that embraced by con-sultative imaging services. Who performs the study, where the examination is conducted, how quickly it is accom-plished, and how study results are communicated all differ. In addition, the scope of the examination and study goals may be quite different. Physician work associated with the
examination, the expense of test performance, and how data is integrated into patient care are also unique to each of these approaches. Understanding and communicating the para-digm of emergency ultrasound is an essential step in program implementation.
The paradigm of emergency ultrasound is reflected in the 2001 ACEP policy on Use of Ultrasound Imaging by Emergency Physicians (1).
Ultrasound imaging enhances the physician’s ability to evaluate, diagnose, and treat emergency depart-ment patients. Because ultrasound imaging is often time-dependent in the acutely ill or injured patient, the emergency physician is in an ideal position to use this technology. Focused ultrasound examinations provide immediate information and can answer specific ques-tions about the patient’s physical condition. Such bed-side ultrasound imaging is within the scope of practice of emergency physicians.
The paradigm of emergency ultrasound begins with ultra-sound performance by the treating physician at the patient’s bedside. The examination is contemporaneous with patient care and is performed on an immediate basis. In this con-text, immediate means within minutes of an identified need. Interpretation of images is done by the treating physician and occurs as the images are generated and displayed. In this approach, permanent images document what has already been interpreted by the emergency physician, rather than becoming a work-product for delayed interpretation by a consultant. Finally, the scope of the examination is focused, or limited, in nature. The treating physician is seeking an answer to a specific question for immediate use that will drive a clinical decision, or is utilized to guide a difficult or high-risk procedure. In this paradigm, the work-product is care of the patient that is improved by the appropriate use of ultrasound technology, and it is not the image or a report. It should be emphasized that the focused examina-tions performed in this paradigm meet the medical needs of the patient without providing unnecessary services.
The paradigm of consultative ultrasound imaging begins when a treating physician requests a study. The patient is usually transported to an ultrasound suite where a sono-graphic technician images the patient. The completed study is presented, or transmitted, to an interpreting physician who documents the study results and communicates these results to the treating physician. The treating physician incorporates reported data into clinical decision making. Ultrasound guid-ance of emergent procedures is rarely pursued or available under this paradigm. Diagnostic studies are stored as hard copies in file rooms or in a digital format. The consulting physician’s work product is an image and a report.
The paradigm of the consulting imaging service repre-sents a complex system that involves multiple providers, movement of the patient, and several steps in a chain of communications. Delays, high costs, and the opportunity for miscommunication are inherent in this approach. For exam-ple, one must wait for a sonography technician who may be remotely located in the hospital, completing a study in prog-ress, summoned from home, or not available for emergency studies. All this must occur before the study is obtained, interpreted, or reported for clinical use. Delays associated with this paradigm predictably negate many of the clinical benefits of ultrasound. Finally, consulting studies are usually

4 Section i / Getting Started with Bedside Ultrasound
comprehensive or complete in scope and often seemingly exceed both the treating physician’s requirements as well as criteria for medical necessary services.
The paradigm of emergency ultrasound has been a dif-ficult concept for many traditional providers of ultrasound to understand or to accept. Emergency ultrasound is not a lesser imitation of comprehensive consulting imaging ser-vices, but rather it is a focused and appropriate application of technology that provides essential diagnostic information and guidance of high-risk procedures. Unfortunately, the development of emergency ultrasound has been accompa-nied by a great deal of misunderstanding. Issues of physi-cian credentialing, the ownership of technology, exclusive contracts, reimbursement, and specialty society advocacy positions have tended to overshadow clinical evidence and the practical experience of improved emergency patient care. Not only does the paradigm of emergency ultrasound offer tangible benefits in patient care, but it represents a technology that emergency physicians will continue to uti-lize and refine.
CHARACTERISTICS OF THE EMERGENCY ULTRASOUNDIndicated emergency ultrasound studies share a common set of characteristics that reflect their clinical utility, as well as the practicality of performance in the emergency depart-ment setting. The primary indications for emergency studies address the clinical conditions of trauma, intrauterine preg-nancy, abdominal aortic aneurysm, cardiac, biliary disease, urinary tract, DVT, soft-tissue/musculoskeletal, thoracic, ocular, and procedures that would benefit from assistance of ultrasound (1,2). As research, technology, and experience grows, indications and standards for emergency ultrasound will evolve. Characteristics common to effective emergency ultrasound studies include the following:
1. US examinations should be performed only for defined emergency indications that meet one or more of the fol-lowing criteria:• A life threatening or serious medical condition
where emergency ultrasound would assist in diag-nosis or expedite care. An example would be evalu-ation of a patient with suspected AAA and signs of instability.
• Aconditionwhereanultrasoundexaminationwouldsignificantly decrease the cost or time associated with patient evaluation. An example would be locating an intrauterine pregnancy in a patient with early preg-nancy and vaginal bleeding.
• Acondition inwhichultrasoundwouldobviate theneed for an invasive procedure. An example would be echocardiography to rule out pericardial effusion and the need for pericardiocentesis in a patient with pulse-less electrical activity.
• A condition where ultrasound guidance would in-crease patient safety for a difficult or high risk proce-dure. An example would be ultrasound guidance for central line placement.
• Aconditioninwhichultrasonographyisacceptedasthe primary diagnostic modality. An example would be identifying gallstones in a patient with suspected biliary colic. Note that establishing a diagnosis may
often obviate the need for additional testing or acute hospital admission.
2. Emergency physicians conduct focused, not comprehen-sive examinations.
Emergency ultrasound diagnostic studies are goal-directed and designed to answer specific questions that guide clinical care. They frequently focus on the pres-ence or absence of a single disease entity or a significant finding such as hemoperitoneum in the blunt trauma patient. These studies are quite different from the com-plete examinations typically performed by consulting imaging services. Complete studies evaluate all struc-ture and organs within an anatomic region. They are typically more expensive and time consuming as they may address issues outside of those medically necessary for patient management.
3. Emergency ultrasound studies should demonstrate one or two easily recognizable findings.
Carefully designed indications result in simple ques-tions, straightforward examinations, and useful answers. For example, free intraperitoneal fluid, a gestational sac, absence of a heart beat, or the presence of pericardial fluid are all easily recognizable and have clear and immediate clinical utility.
4. Emergency ultrasounds should directly impact clinical decision making.
Patient care algorithms should be developed for each focused ultrasound indication and the result of the study should be used to determine subsequent care. Any exam that will not reasonably be expected to change clinical decision-making should be performed on an elective basis.
5. Emergency ultrasounds should be easily learned.Some findings, such as the presence or absence of
an intrauterine pregnancy with an intracavitary probe, are relatively easy to learn. Other evaluations such as evaluation for focal myocardial wall motion abnor-malities in ischemic heart disease are more difficult to learn. A body of evidence has been accumulated by emergency physicians, which identifies studies that are most reasonably learned and result in reliable clinical data (78–82).
6. Emergency physicians should conduct ultrasound stud-ies that are relatively quick to perform.
Emergency physicians have limited time with each patient, and they generally have responsibility for the safety of many patients in the department at any given time. Ultrasound procedures selected by emergency physicians should be completed in a reasonable amount of time. Selecting focused examinations that are more quickly performed does not diminish the value of the data, intensity of the service, or the positive impact on patient care. For example, an echocardiography per-formed in the presence of penetrating cardiac injury may be quickly performed, yet it provides potentially life-saving information that cannot be obtained by physical examination.
7. Emergency departments should have the capacity to perform ultrasound examinations at the bedside on an immediate basis for the unstable patient and in a timely fashion for the stable patient.
This requires that the emergency physician be pre-pared to conduct and interpret emergency ultrasound

chapter 1 / The History and Philosophy of Emergency Ultrasound 5
examinations and that equipment is available for imme-diate use. ACEP policy recommends that optimal patient care is provided when dedicated ultrasound equipment is located within the emergency department (1).
CORE DOCUMENTSAn understanding of emergency ultrasound includes a review of policy statements and clinical guidelines addressing the use of ultrasound. These documents should be utilized not only in formulating a program, but should be referenced in discussions with members of the medical staff and with hos-pital administration as well as being used to establish guide-lines and standards for training, credentialing, and quality improvement. The core documents include:
ACEP and SAEM Policy Statements on Emergency UltrasoundIn 1991, the ACEP policy on Ultrasound Use for Emergency Patients stressed the clinical need for the immediate avail-ability of diagnostic ultrasound on a 24-hour basis (1). In addition, the policy called for training and credentialing of physicians providing these services and encouraged research for the optimal use of emergency ultrasound. This position was endorsed by the SAEM policy in the same year (7). SAEM added language to their policy that encouraged research to determine optimal training requirements for per-formance of emergency ultrasound, and suggested that spe-cific training should be included during residency.
The ACEP policy was updated in 1997 and in 2001. The most recent version of the policy has been incorporated into the 2008 Emergency Ultrasound Guidelines (Table 1.2). This ACEP endorsement articulates the value of emergency ultrasound, outlines the primary diagnostic and procedural uses of ultrasound, and recognizes ultrasound as a standard emergency physician skill. In addition, it states that residents should be trained in ultrasound, EDs should be equipped with dedicated ultrasound equipment, and that emergency physicians should be reimbursed for the added work of ultra-sound performance. Finally, the policy states that ultrasound
is within the scope of practice of emergency physicians and that the hospital’s medical staff should grant privileges based upon specialty-specific guidelines.
ACEP Emergency Ultrasound GuidelinesACEP published the Emergency Ultrasound Guidelines in 2001 with a robust revision in 2008 that describes the scope of practice for emergency ultrasound as well as providing recommendations for training and proficiency, specialty-specific credentialing, quality improvement, and documentation criteria for emergency ultrasound (2). This comprehensive 2008 document is the clearest statement addressing emergency medicine’s approach to diagnostic and procedural ultrasound, and delineates ultrasound standards that are broadly accepted by the specialty of emergency med-icine. The Emergency Ultrasound Guidelines is an authorita-tive resource and should be referenced when formulating an ultrasound program or providing informational materials to credentials committee, hospital administration, or interested specialists.
The Core Content for Emergency Medicine and the Model of the Clinical Practice of Emergency MedicineIn 1997, a joint policy statement was published by ACEP, the American Board of Emergency Medicine (ABEM), and SAEM titled the Core Content for Emergency Medicine (5). The purpose of this joint policy was to represent the breadth of the practice of emergency medicine, to outline the content of emergency medicine at risk for board examinations, and to serve to develop graduate and continuing medical edu-cation programs for the practice of emergency medicine. Bedside ultrasonography was included in the procedure and skills section for cardiac, abdominal, traumatic, and pelvic indications.
In 2001, and most recently in 2009, this document was updated and published as The Model of the Clinical Practice of Emergency Medicine (6). This publication includes bed-side ultrasound in the list of procedures and skills integral
TABLE 1.2 ACEP Endorsements—Section 8—Emergency Ultrasound Guidelines 2008
This statement originally appeared in June 1991 as ACEP Policy Statement Ultrasound Use for Emergency Patients . This statement was updated in 1997 and again in 2001 as Use of Ultrasound Imaging by Emergency Physicians . In 2008 this statement was updated and incorporated into Emergency Ultrasound Guidelines 2008 .
ACEP endorses the following statements on the use of emergency ultrasound: 1 . Emergency ultrasound performed and interpreted by emergency physicians is a fundamental skill in the practice of emergency medicine . 2 . The scope of practice of emergency ultrasound can be classified into categories of resuscitation, diagnostic, symptom or sign-based, procedural guidance,
and monitoring/therapeutics in which a variety of emergency ultrasound applications, including the below listed core applications, can be integrated . 3 . Current core applications in emergency ultrasound include trauma, pregnancy, abdominal aorta, cardiac, biliary, urinary tract, deep venous thrombosis,
thoracic, soft-tissue/musculoskeletal, ocular, and procedural guidance . 4 . Dedicated ED ultrasound equipment is requisite to the optimal care of critically ill and injured patients . 5 . Training and proficiency requirements should include didactic and experiential components as described within this document . 6 . Emergency ultrasound training in emergency medicine residency should begin early and be fully integrated into patient care . 7 . Emergency physicians after initial didactic training should following competency guidelines as written within this document . 8 . Credentialing standards used by EDs and health care organizations should follow specialty-specific guidelines as written within this document . 9 . Quality assurance and improvement of emergency ultrasound is fundamental to the education and credentialing processes . 10 . Emergency physicians should be appropriately compensated by payors in the provision of these procedures . 11 . Emergency ultrasound research should continue to explore the many levels of clinical patient outcomes research . 12 . The future of emergency ultrasound involves adaptation of new technology, broadening of education, and continued research into an evolving emer-
gency medicine practice .

6 Section i / Getting Started with Bedside Ultrasound
to the practice of emergency medicine. These documents are often used to establish core privileges for emergency physicians.
Model Curriculum for Physician Training in Emergency UltrasonographyIn 1994, the SAEM Ultrasound Task Force published the Model Curriculum for Physician Training in Emergency Ultrasonography (Model Curriculum) outlining resource materials, as well as recommended hours of didactic and hands-on education (23). The model was constructed pri-marily for residents in training; however, it did address the practicing emergency physician by stating that instruction, covering topics that follow the Task Force outline, and a total of 150 examinations, constitute training in emergency medicine ultrasonography. The Model Curriculum was comprehensive and has proven invaluable in guiding the development of residency training programs as well as the initial training and continuing education for the practicing emergency physician. The 2008 Emergency Ultrasound Guidelines has revisited and updated training and profi-ciency, including training pathways, continuing education, and the role of fellowship training (2).
AMA Approach to Ultrasound PrivilegingThe American Medical Association (AMA) developed a policy in 1999 on Privileging for Ultrasound Imaging (83). This policy recognizes the diverse uses of ultrasound imaging in the practice of medicine. Further, the AMA recommended that training and educational standards be developed by each physician’s respective specialty and that those standards should serve as the basis for hospital privi-leging. The AMA policy is in full agreement with ACEP policy and affirms the use of ultrasound by a variety of phy-sician specialties rather than restricting ownership of the technology of ultrasound.
While the AMA and ACEP’s approach may seem ratio-nal, experience in hospital credentialing has demonstrated opposition to the concept of individual specialties developing training and education standards for their use of ultrasound. Providers of consultative ultrasound services, most notably radiology, have been quite active in developing a policy that recommends training standards for practitioners outside their own specialties, and their publications have been used in debates regarding hospital credentialing as well as third party reimbursement.
Additional Positions – AIUM, ASE, and ACRPolicy statements regarding physician qualifications and ultra-sound training standards have been published by a number of professional organizations such as the American Institute of Ultrasound Medicine (AIUM), the American Society of Echocardiography (ASE), and the American College of Radiology (ACR). Over the past several years there has been significant progress in understanding the positive role of cli-nician performed ultrasound at the patient’s bedside. Current position statements of the AIUM and ASE are supportive of the clinical utility of ultrasound performed by qualified emergency physicians, as well as endorsing ACEP’s edu-cation and training requirements for focused emergency applications. The policy of the ACR remains unchanged and
differs substantially from those published by the specialty of emergency medicine, the AIUM, and the ASE. In discussions regarding ultrasound, the emergency physician should be pre-pared to address these various advocacy positions as they may be quoted as published and authoritative standards that apply to emergency practitioners using ultrasound.
American Institute of Ultrasound MedicineThe AIUM is a multidisciplinary association of physicians, sonographers, and scientists supporting the advancement of research and the science of ultrasound in medicine. In 2007, they published the AIUM Practice Guideline for the Performance of the Focused Assessment With Sonography for Trauma (FAST) Examination in conjunction with ACEP (84). The AIUM recognized the FAST examination as proven and useful in the evaluation of both blunt and penetrating trauma. In addition, the AIUM recognized training in com-pliance with ACEP guidelines as qualifying a physician for the performance and interpretation of the FAST examina-tion. Finally, they recommended that credentialing for the FAST examination be based on published standards of the physician’s specialty society such as ACEP or the AIUM. In 2011, the AIUM provided a broader endorsement of ultra-sound by emergency physicians by officially recognizing the ACEP Emergency Ultrasound Guidelines education and training requirements as meeting qualifications for perform-ing focused ultrasounds, and acknowledged the clinical util-ity of diagnostic and procedural emergency examinations in clinical practice (85).
American Society of EchocardiographyThe ASE is a professional organization of physicians, cardiac sonographers, nurses, and scientists involved in echocardiography. In 2010, the ASE published Focused Cardiac Ultrasound in the Emergent Setting: A Consensus Statement of the American Society of Echocardiography and the American College of Emergency Physicians (86). This statement termed the use of bedside echocardiography an “indispensible first-line test for the cardiac evaluation of symptomatic patients” that “has become a fundamental tool to expedite the diagnostic evaluation of the patient at the bed-side and to initiate emergent treatment and triage decisions by the emergency physician.” Finally, the statement outlined emergency indications for echocardiography and endorsed ACEP specialty specific guidelines for training and the per-formance of focused cardiac ultrasound as described in the Emergency Ultrasound Guidelines.
American College of RadiologyThe ACR-SPC-SRU Practice Guideline for Performing and Interpreting Diagnostic Ultrasound Examinations (87) was updated in 2011 and has not evolved from the historical per-spective of consultative imaging. This practice guideline requires that physicians who have not completed a radiol-ogy residency interpret and report 500 supervised ultra-sound examinations during the previous 36 months and for each subspecialty they practice in order to be deemed qualified. Subspecialties as defined in this document ref-erence applications and anatomic regions thus abdomen is separate from musculoskeletal and each are separate from echocardiography.

chapter 1 / The History and Philosophy of Emergency Ultrasound 7
This guideline is designed with the assumption that physi-cians will perform and interpret comprehensive studies and as such, the focused ultrasound examinations utilized by emer-gency physicians have not been contemplated. In addition, the numbers of studies this policy requires far exceeds train-ing standards accepted by emergency medicine authorities including ABEM, ACEP, SAEM, the Council of Emergency Medicine Residency Directors, and the Residency Review Committee for Emergency Medicine (88), as well as exceeding those recognized by other relevant professional societies such as the AIUM and ASE. Finally, this policy is not in agreement with ACEP, the AMA, the AIUM, the ASE, and others recom-mending that hospital privileging should be in accordance with the recommended training and education standards developed by each physician’s respective specialty (1,83,85,86).
EMERGENCY ULTRASOUND AS AN EVOLVING STANDARD OF CAREA frequently asked question is “what is the standard of care for ultrasound?” Is the standard of care the study performed by a consultative imaging service or is it the immediate use of ultrasound at the bedside for indications demonstrated to improve patient outcomes? How does a standard of care relate to a best practice? Would the failure of an emergency physician to utilize ultrasound constitute substandard care?
The simplest definition of a standard of care is how a similarly-qualified practitioner would manage a patient’s care under the same or similar circumstances. Standards are based in peer-reviewed literature and in consensus opin-ion regarding clinical judgment. They are national in scope rather than based on community norms and are tested in a court of law, where they are generally established by expert witness testimony.
A best practice is a technique that through experience and research has proven to reliably lead to a desired outcome. A best practice is based in evidence and represents a com-mitment to using all the knowledge and technology at one’s disposal to ensure improved patient care. As best practices become more broadly adopted, they eventually become rec-ognized as standards of care. Substantial peer-reviewed evi-dence has demonstrated that emergency physician performed ultrasound is reliable for each of the primary indications of emergency ultrasound and would therefore be regarded by the specialty of emergency medicine as best practices.
Central venous catheter placement facilitated by ultra-sound is an interesting example. Ultrasound guidance has been found to reduce the number of needle passes, the time to catheter placement and to decrease the complication rate for central venous access (11,12). Peer-reviewed litera-ture has demonstrated the effectiveness of this technique in the emergency department where the treatment of critically ill and injured patients often requires immediate central vas-cular access (65–67). The Agency for Healthcare Research and Quality report Making Health Care Safer—A Critical Analysis of Patient Safety Practices cited the use of real-time ultrasound guidance during central line insertion to reduce complications as “one of the most highly rated patient safety practices based upon potential impact of the practice and the strength of supporting evidence” (11). This is a best practice that has been adopted by a growing number of emergency physicians, and it represents an evolving standard of care.
CONCLUSIONImprovements in technology have allowed the movement of ultrasound from the imaging laboratory to the patient’s bedside. Technology enhancements have been accompanied by an evidence-based recognition of the value of immedi-ate ultrasound in a variety of clinical conditions encoun-tered in the emergency department. The demonstrated value of emergency ultrasound has led to endorsement by emer-gency medicine professional organizations, inclusion into emergency medicine residency training, and integration into clinical practice. The focused use of emergency ultrasound and the characteristics of these examinations have been well described, and there is a broadening acceptance of bedside ultrasound by the emergency physician. Despite meaning-ful progress, emergency ultrasound may be misunderstood, mischaracterized, or undervalued, and clinical issues may be confused with hospital politics and physician econom-ics. In this context an understanding of a variety of policy statements by emergency medicine professional societies and by other professional societies is helpful in discussions surrounding the use of ultrasound by emergency physicians. Most importantly, the use of ultrasound by the treating emer-gency physician represents an advance in the care of emer-gency patients, an appropriate use of technology, a clinical best practice, and an evolving standard of care.
REFERENCES 1. ACEP Policy Statement. Ultrasound use for emergency patients. June
1991, updated 1997 and 2001 as: use of ultrasound imaging by emer-gency physicians. Incorporated into emergency ultrasound guidelines 2008. http://www.acep.org. Accessed August 21, 2012.
2. ACEP Policy Statement. ACEP emergency ultrasound guidelines. 2001. Policy #400327. Updated 2008 emergency ultrasound guidelines. http://www.acep.org/. Accessed August 21, 2012.
3. Moore CL, Gregg S, Lambert M. Performance, training, quality assurance, and reimbursement of emergency physician-performed ultrasonography at academic medical centers. J Ultrasound Med. 2004;23:459–466.
4. The Accreditation Council for Graduate Medical Education (ACGME); Emergency Medicine Residency Review Committee. Program Requirements; Guidelines; Procedures and Resuscitations; Bedside ultrasound. 2002. http://www.acgme.org.
5. Allison EJ Jr, Aghababian RV, Barsan WG, et al. Core content for emergency medicine. Task Force on the Core Content for Emergency Medicine Revision. Ann Emerg Med. 1997;29:792–811.
6. Hockberger RS, Binder LS, Graber MA, et al. The model of the clinical practice of emergency medicine. Ann Emerg Med. 2001;37:745–770.
7. SAEM. Ultrasound Position Statement. 1991. http://www.saem.org. 8. Shih CH. Effect of emergency physician-performed pelvic sonogra-
phy on length of stay in the emergency department. Ann Emerg Med. 1997;29:348–351.
9. Blaivas M, Harwood RA, Lambert MJ. Decreasing length of stay with emergency ultrasound examination of the gallbladder. Acad Emerg Med. 1999;6:1020–1023.
10. Theodoro D, Blaivas M, Duggal S, et al. Real-time B-mode ultrasound in the ED saves time in the diagnosis of deep vein thrombosis (DVT). Am J Emerg Med. 2004;22:197–200.
11. Agency for Healthcare Research and Quality. Making health care safer: a critical analysis of patient safety practices; Chapter 21: ultrasound guidance of central vein catheterization. http://www.ahcpr.gov/clinic/ptsafety/chap21.htm. Accessed August 24, 2012.
12. Hind D, Calvert N, McWilliams R, et al. Ultrasonic locating devices for central venous cannulation: meta-analysis. BMJ. 2003;327:361.
13. Plummer D, Brunette D, Asinger R, et al. Emergency department echo-cardiography improves outcome in penetrating cardiac injury. Ann Emerg Med. 1992;21:709–712.

8 Section i / Getting Started with Bedside Ultrasound
14. Goldberg BB, Goodman GA, Clearfield HR. Evaluation of ascites by ultrasound. Radiology. 1970;96:15–22.
15. Kristensen JK, Beumann B, Kühl E. Ultrasonic scanning in the diagnosis of splenic haematomas. Acta Chir Scand. l971;137:653–657.
16. Asher WM, Parvin S, Virgillo RW, et al. Echographic evaluation of splenic injury after blunt trauma. Radiology. 1976;118:411–415.
17. Mayron R, Gaudio FE, Plummer D, et al. Echocardiography performed by emergency physicians: impact on diagnosis and therapy. Ann Emerg Med. 1988;17:150–154.
18. Tiling T, Boulion B, Schmid A, et al. Ultrasound in blunt abdomino-thoracic trauma. In: Border JR, Allgöwer M, Hanson ST, eds. Blunt Multiple Trauma: Comprehensive Pathophysiology and Care. New York, NY: Marcel Dekker; 1990:415–433.
19. Tso P, Rodriguez A, Cooper C, et al. Sonography in blunt abdominal trauma: a preliminary progress report. J Trauma. 1992;33:39–43.
20. Rozycki GS, Ochsner MG, Jaffin JH, et al. Prospective evaluation of sur-geons’ use of ultrasound in the evaluation of trauma patients. J Trauma. 1993;34:516–526.
21. Ma OJ, Mateer JR, Ogata M, et al. Prospective analysis of a rapid trauma ultrasound examination performed by emergency physicians. J Trauma. 1995;38:879–885.
22. McKenney MG, Martin L, Lentz K, et al. 1,000 consecutive ultrasounds for blunt abdominal trauma. J Trauma. 1996;40:607–610.
23. Mateer J, Plummer D, Heller M, et al. Model curriculum for phy-sician training in emergency ultrasonography. Ann Emerg Med. 1994;23:95–102.
24. Heller M, Jehle D. Ultrasound in Emergency Medicine. Philadelphia, PA: WB Saunders; 1995.
25. Tayal VS, Beatty MA, Marx JA, et al. FAST (focused assessment with sonography in trauma) accurate for cardiac and intraperitoneal injury in penetrating anterior chest trauma. J Ultrasound Med. 2004;23:467–472.
26. Melniker LA, Leibner E, McKenney MG, et al. Randomized controlled clinical trial of point-of-care, limited ultrasonography for trauma in the emergency department: the first sonography outcomes assessment pro-gram trial. Ann Emerg Med. 2006;48:227–235.
27. Mateer JR, Aiman EJ, Brown MH, et al. Ultrasonographic examination by emergency physicians of patients at risk for ectopic pregnancy. Acad Emerg Med. 1995;2:867–873.
28. Mateer JR, Valley VT, Aiman EJ, et al. Outcome analysis of a protocol including bedside endovaginal sonography in patients at risk for ectopic pregnancy. Ann Emerg Med. 1996;27:283–289.
29. Durham B, Lane B, Burbridge L, et al. Pelvic ultrasound performed by emergency physicians for the detection of ectopic pregnancy in compli-cated first-trimester pregnancies. Ann Emerg Med. 1997;29:338–347.
30. Burgher SW, Tandy TK, Dawdy MR. Transvaginal ultrasonography by emergency physicians decreases patient time in the emergency depart-ment. Acad Emerg Med. 1998;5:802–807.
31. Dart RG. Role of pelvic ultrasonography in evaluation of symptomatic first-trimester pregnancy. Ann Emerg Med. 1999;33:310–320.
32. Kuhn M, Bonnin RL, Davey MJ, et al. Emergency department ultra-sound scanning for abdominal aortic aneurysm: accessible, accurate, and advantageous. Ann Emerg Med. 2000;36:219–223.
33. Knaut AL, Kendall JL, Dobbins J, et al. Ultrasonographic measurement of abdominal aortic diameter by emergency physicians approximates results obtained by computed tomography [abstract]. Acad Emerg Med. 2000;7:493.
34. Tayal VS, Graf CD, Gibbs MA. Prospective study of accuracy and out-come of emergency ultrasound for abdominal aortic aneurysm over two years. Acad Emerg Med. 2003;10:867–871.
35. Mandavia DP, Hoffner RJ, Mahaney K, et al. Bedside echocardiography by emergency physicians. Ann Emerg Med. 200;38:377–382.
36. Blaivas M, Fox JC. Outcome in cardiac arrest patients found to have cardiac standstill on the bedside emergency department echocardiogram. Acad Emerg Med. 2001;8:616–621.
37. Salen P, O’Connor R, Sierzenski P, et al. Can cardiac sonography and capnography be used independently and in combination to predict resus-citation outcomes? Acad Emerg Med. 2001;8:610–615.
38. Moore CL, Rose GA, Tayal VS, et al. Determination of left ventricu-lar function by emergency physician echocardiography of hypotensive patients. Acad Emerg Med. 2002;9:186–193.
39. Tayal VS, Kline JA. Emergency echocardiography to detect pericar-dial effusion in patients in PEA and near-PEA states. Resuscitation. 2003;59:315–318.
40. Rosen CL, Brown DF, Chang Y, et al. Ultrasonography by emergency physicians in patients with suspected cholecystitis. Am J Emerg Med. 2001;19:32–36.
41. Kendall JL, Shimp RJ. Performance and interpretation of focused right upper quadrant ultrasound by emergency physicians. J Emerg Med. 2001;2:7–13.
42. Durston W, Carl ML, Guerra W, et al. Comparison of quality and cost-effectiveness in the evaluation of symptomatic cholelithiasis with differ-ent approaches to ultrasound availability in the ED. Am J Emerg Med. 2001;19:260–269.
43. Miller AH, Pepe PE, Brockman CR, et al. ED ultrasound in hepatobili-ary disease. J Emerg Med. 2006;30:69–74.
44. Henderson SO, Hoffner RJ, Aragona JL, et al. Bedside emergency department ultrasonsography plus radiography of the kidneys, ureters, and bladder vs intravenous pyelography in the evaluation of suspected ureteral colic. Acad Emerg Med. 1998;5:666–671.
45. Rosen CL, Brown DF, Sagarin MJ, et al. Ultrasonography by emer-gency physicians in patients with suspected ureteral colic. J Emerg Med. 1998;16:865–870.
46. Gaspari RJ, Horst K. Emergency ultrasound and urinalysis in the evalu-ation of flank pain. Acad Emerg Med. 2005;12:1180–1184.
47. Blaivas M, Lambert MJ, Harwood RA, et al. Lower-extremity Doppler for deep venous thrombosis-can emergency physicians be accurate and fast? Acad Emerg Med. 2000;7:120–126.
48. Burnside PR, Brown MD, Kline JA. Systematic review of emergency physician-performed ultrasonography for lower-extremity deep vein thrombosis. Acad Emerg Med. 2008;15:493–498.
49. Roy S, Dewitz A, Paul I. Ultrasound-assisted ankle arthrocentesis. Am J Emerg Med. 1999;17:300–301.
50. Valley VT, Stahmer SA. Targeted musculoarticular sonography in the detection of joint effusions. Acad Emerg Med. 2001;8:361–367.
51. Leech SJ, Gukhool J, Blaivas M, et al. ED ultrasound evaluation of the index flexor tendon: a comparison of water-bath evaluation tech-nique (WET) versus direct contact ultrasound. Acad Emerg Med. 2003;10:573.
52. Squire B, Fox JC, Zlidenny AM, et al. ABSCESS: applied bedside sonography for convenient evaluation of superficial soft tissue infec-tions. Ann Emerg Med. 2004;44:S62.
53. Marshburn TH, Legome E, Sargsyan A, et al. Goal-directed ultrasound in the detection of long-bone fractures. J Trauma. 2004;57:329–332.
54. Tayal VS, Hasan N, Norton HJ, et al. The effect of soft-tissue ultra-sound on the management of cellulitis in the emergency department. Acad Emerg Med. 2006;13:384–388.
55. Pariyadath M, Tayal VS, Norton HJ. Randomized controlled trial of ultrasound-guided knee arthrocentesis in the emergency department. Acad Emerg Med. 2006;13:S197a.
56. Tayal V, Pariyadath M, Norton HJ. Randomized controlled trial of ultrasound-guided peripheral non-knee arthrocentesis in the emergency department. Acad Emerg Med. 2006;13:S122-b–S123-b.
57. Freeman K, Dewitz A, Baker WE. Ultrasound guided hip arthrocentesis in the ED. Am J Emerg Med. 2007;25:80–86.
58. LaRocco BG, Zlupko G, Sierzenski P. Ultrasound diagnosis of quadri-ceps tendon rupture. J Emerg Med. 2008;35:293–295.
59. Blaivas M, Lyon M, Duggal S. A prospective comparison of supine chest radiography and bedside ultrasound for the diagnosis of traumatic pneu-mothorax. Acad Emerg Med. 2005;12:844–849.
60. Blaivas M. Bedside emergency department ultrasonography in the evalu-ation of ocular pathology. Acad Emerg Med. 2000;7:947–950.
61. Blaivas M, Theodoro D, Sierzenski PR. A study of bedside ocu-lar ultrasonography in the emergency department. Acad Emerg Med. 2002;9:791–799.
62. Harbison H, Shah S, Noble V. Validation of ocular nerve sheath diameter measurements with ultrasound. Acad Emerg Med. 2006;13:S198-b–S199-b.
63. Tayal VS, Neulander M, Norton HJ, et al. Emergency department sono-graphic measurement of optic nerve sheath diameter to detect findings of increased intracranial pressure in adult head injury patients. Ann Emerg Med. 2007;49:508–514.
64. Gochman RF, Karasic RB, Heller MB. Use of portable ultrasound to assist urine collection by suprapubic aspiration. Ann Emerg Med. 1991;20:631–635.

chapter 1 / The History and Philosophy of Emergency Ultrasound 9
65. Hilty WM, Hudson PA, Levitt MA, et al. Real-time ultrasound-guided femoral vein catheterization during cardiopulmonary resuscitation. Ann Emerg Med. 1997;29:331–336; discussion 337.
66. Hudson PA, Rose JS. Real-time ultrasound guided internal jugular vein catheterization in the emergency department. Am J Emerg Med. 1997;15:79–82.
67. Miller AH, Roth BA, Mills TJ, et al. Ultrasound guidance versus the landmark technique for the placement of central venous catheters in the emergency department. Acad Emerg Med. 2002;9:800–805.
68. Blaivas M, Theodoro D, Duggal S. Ultrasound-guided drainage of peritonsillar abscess by the emergency physician. Am J Emerg Med. 2003;21:155–158.
69. Nazeer SR, Dewbre H, Miller AH. Ultrasound-assisted paracentesis per-formed by emergency physicians vs the traditional technique: a prospec-tive, randomized study. Am J Emerg Med. 2005;23:363–367.
70. Costantino TG, Parikh AK, Satz WA, et al. Ultrasonography-guided peripheral intravenous access versus traditional approaches in patients with difficult intravenous access. Ann Emerg Med. 2005;46:456–461.
71. Leung J, Duffy M, Finckh A. Real-time ultrasonographically-guided internal jugular vein catheterization in the emergency department increases success rates and reduces complications: a randomized, pro-spective study. Ann Emerg Med. 2006;48:540–547.
72. Nomura JT, Leech SJ, Shenbagamurthi S, et al. A randomized con-trolled trial of ultrasound-assisted lumbar puncture. J Ultrasound Med. 2007;26:1341–1348.
73. Rose JS, Bair AE, Mandavia D, et al. The UHP ultrasound protocol: a novel ultrasound approach to the empiric evaluation of the undifferenti-ated hypotensive patient. Am J Emerg Med. 2001;19:299–302.
74. Jones AE, Tayal VS, Sullivan DM, et al. Randomized, controlled trial of immediate versus delayed goal-directed ultrasound to identify the cause of nontraumatic hypotension in emergency department patients. Crit Care Med. 2004;32:1703–1708.
75. Branney SW, Moore EE, Cantrill SV, et al. Ultrasound based key clinical pathway reduces the use of hospital resources for the evaluation of blunt abdominal trauma. J Trauma. 1997;42:1086–1090.
76. Frezza EE, Ferone T, Martin M. Surgical residents and ultrasound tech-nician accuracy and cost-effectiveness of ultrasound in trauma. Am Surg. 1999;65:289–291.
77. Durston WE, Carl ML, Guerra W, et al. Ultrasound availability in the evaluation of ectopic pregnancy in the ED: comparison of quality
and cost-effectiveness with different approaches. Am J Emerg Med. 2000;18:408–417.
78. Lanoix R, Baker WE, Mele JM, et al. Evaluation of an instruc-tional model for emergency ultrasonography. Acad Emerg Med. 1998;5:58–63.
79. Mandavia DP, Aragona J, Chan L, et al. Ultrasound training for emergency physicians—a prospective study. Acad Emerg Med. 2000;7:1008–1014.
80. Jones AE, Tayal VS, Kline JA. Focused training of emergency medicine residents in goal-directed echocardiography: a prospective study. Acad Emerg Med. 2003;10:1054–1058.
81. Smith RS, Kern SJ, Fry WR, et al. Institutional learning curve of surgeon- performed trauma ultrasound. Arch Surg. 1998;133:530–535; discussion 535–536.
82. McCarter FD, Luchette FA, Molloy M, et al. Institutional and individual learning curves for focused abdominal ultrasound for trauma: cumula-tive sum analysis. Ann Surg. 2000;231:689–700.
83. American Medical Association House of Delegates. H-230.960 privileg-ing for ultrasound imaging. 802.99. 2001. Accessed August 24, 2012.
84. AIUM practice guideline for the performance of the focused assessment with sonography for trauma (FAST) examination; AIUM practice guide-lines October 2007. http://www.aium.org/resources/guidelines/fast.pdf. Accessed August 24, 2012.
85. AIUM officially recognizes ACEP emergency ultrasound guidelines; December 8, 2011. www.acep.org/News-Media-top-banner/AIUM-Officially-Recognizes-ACEP-Emergency-Ultrasound-Guidelines/. Accessed August 24, 2012.
86. Labovitz AJ, Noble VE, Bierig M, et al. Focused cardiac ultrasound in the emergent setting: a consensus statement of the American Society of Echocardiography and American College of Emergency Physicians. J Am Soc Echocardiogr. 2010;23:1225–1230.
87. American College of Radiology, Society for Pediatric Radiology and the Society of Radiologists in Ultrasound. ACR-SPR-SRU practice guideline for performing and interpreting diagnostic ultrasound exami-nations. ACR practice guideline. Revised 2011. http://www.acr.org/~/media/13B896B9F4844E3082E7D7ED66AFC148.pdf. Accessed August 24, 2012.
88. Heller MB, Mandavia D, Tayal VS, et al. Residency training in emergency ultrasound: fulfilling the mandate. Acad Emerg Med. 2002;9:835–839.

10
defined as the length over which one cycle occurs. A high-frequency wave has a short cycle and a short wavelength; a lower-frequency wave travels more distance per cycle, and thus has a longer wavelength. This inverse relationship between frequency and wavelength impacts the frequency chosen to image tissues at different depths. Transducers are designed to generate sound waves of different frequencies. General-purpose transducers for abdominal scans typically use 3- to 5-MHz frequencies (and long wavelengths) to penetrate and image objects between 5 and 15 cm deep. In contrast, transducers for vascular and soft tissue use frequen-cies between 10 and 12 MHz (higher frequencies and thus shorter wavelengths) to optimally image objects between 2 and 4 cm deep.
The manner in which ultrasound interacts with tissue is largely determined by impedance. Impedance is an inher-ent characteristic of each tissue, defined as the product of propagation velocity and density. In turn, propagation veloc-ity is defined as the speed with which a wave moves and is determined by the density and stiffness of the medium trav-eled through (or tissue). As ultrasound interacts with tissue, its behavior is largely determined by the intrinsic impedance of each tissue, and impedance changes at tissue interfaces. Each of these definitions has significance when ultrasound interacts with tissue.
IntroductIonThe clinical application of ultrasound relies on a founda-tional understanding of the physical properties of sound waves. The better one’s understanding of the principles gov-erning sound transmission, the more able one will be to both acquire and interpret meaningful images. This chapter will review the basics of ultrasound transmission and image ac-quisition, describe common artifacts, and give an overview of basic ultrasound equipment.
BASIc dEFInItIonS And PrIncIPLESProperties of Mechanical WavesThe practical application of ultrasound is improved by un-derstanding some basic physical principles and definitions. Ultrasound is a form of sound energy that behaves like and follows the properties of a longitudinal mechanical wave. The “wave” is the propagation of an acoustical variable (e.g., pressure) over time; the most basic repeatable unit of a wave defines a cycle. Frequency is defined as the number of cycles per second and is measured in megahertz (MHz). Medical applications for ultrasound typically use transduc-ers with a frequency range of 2 to 12 MHz. Wavelength is
tWo-dIMEnSIonAL uLtrASound IMAGInG . . . . . . . . . . . . 15PrIMEr on EQuIPMEnt . . . . . . . . . . . . . . . . . . . . . . . . . . . . 16
Transducers . . . . . . . . . . . . . . . . . . . . . . . . . . . . . . . . . 16Exam Presets . . . . . . . . . . . . . . . . . . . . . . . . . . . . . . . . 17Gain . . . . . . . . . . . . . . . . . . . . . . . . . . . . . . . . . . . . . . . . 17Time Gain Compensation . . . . . . . . . . . . . . . . . . . . . . . 18Depth . . . . . . . . . . . . . . . . . . . . . . . . . . . . . . . . . . . . . . 18Focus . . . . . . . . . . . . . . . . . . . . . . . . . . . . . . . . . . . . . . 18Tissue Harmonics . . . . . . . . . . . . . . . . . . . . . . . . . . . . . 19Freeze . . . . . . . . . . . . . . . . . . . . . . . . . . . . . . . . . . . . . . 19Calipers . . . . . . . . . . . . . . . . . . . . . . . . . . . . . . . . . . . . . 19B-Mode . . . . . . . . . . . . . . . . . . . . . . . . . . . . . . . . . . . . . 19M-Mode . . . . . . . . . . . . . . . . . . . . . . . . . . . . . . . . . . . . 19Doppler . . . . . . . . . . . . . . . . . . . . . . . . . . . . . . . . . . . . . 19
IMAGE AcQuISItIon . . . . . . . . . . . . . . . . . . . . . . . . . . . . . . . 19
IntroductIon . . . . . . . . . . . . . . . . . . . . . . . . . . . . . . . . . . . 10BASIc dEFInItIonS And PrIncIPLES . . . . . . . . . . . . . . . . . 10
Properties of Mechanical Waves . . . . . . . . . . . . . . . . . . 10Impedance . . . . . . . . . . . . . . . . . . . . . . . . . . . . . . . . . . 11Attenuation . . . . . . . . . . . . . . . . . . . . . . . . . . . . . . . . . . 11Resolution . . . . . . . . . . . . . . . . . . . . . . . . . . . . . . . . . . . 12Interaction of Ultrasound with Tissue . . . . . . . . . . . . . . 12
ArtIFActS . . . . . . . . . . . . . . . . . . . . . . . . . . . . . . . . . . . . . . 13Shadowing . . . . . . . . . . . . . . . . . . . . . . . . . . . . . . . . . . 13Enhancement . . . . . . . . . . . . . . . . . . . . . . . . . . . . . . . . 13Reverberation . . . . . . . . . . . . . . . . . . . . . . . . . . . . . . . . 14Comet Tail . . . . . . . . . . . . . . . . . . . . . . . . . . . . . . . . . . . 14Mirror Image . . . . . . . . . . . . . . . . . . . . . . . . . . . . . . . . . 14Ring Down . . . . . . . . . . . . . . . . . . . . . . . . . . . . . . . . . . 14Edge Artifact . . . . . . . . . . . . . . . . . . . . . . . . . . . . . . . . . 14Side Lobe and Beam Width Artifact . . . . . . . . . . . . . . . . 15
Kenneth Kelley, John S. Rose, and Aaron E. Bair
Fundamentals of Ultrasound2

Chapter 2 / Fundamentals of Ultrasound 11
As sound waves travel through a medium, they cause mol-ecules to vibrate. The molecules vibrate at a given frequency depending on the frequency of the sound. The sound wave then propagates through the medium (tissue) at that frequency. The frequency of these wavelengths determines how they penetrate tissue and affect image detail. The energy of a sound wave is affected by many factors. The spatial pulse length (SPL) is the basic unit of imaging. The SPL is a sound wave packet that is emitted from the transducer. Much like sonar, where the sound wave is sent out at a given frequency and then bounces off an object to locate it, diagnostic ultrasound can use sound waves to generate an anatomic picture. In essence, the sound waves “interrogate” the tissues to create an image. By adjust-ing various parameters of the sound wave and its production, the ultrasound wave can be used to gather information.
Sound waves are generated by piezoelectric elements in the probe. Piezoelectric elements are crystals that vibrate when alternating current is applied. Similarly, if ultrasonic waves hit these crystals, they vibrate and generate an electric current (Fig. 2.1). This characteristic enables them to act as both an emitter and receiver of sound waves and thereby func-tion as a transducer. In medical ultrasound, piezoelectric crys-tals are placed in a sealed container, the “probe.” The probe houses the transducer and comes in contact with the patient.
ImpedanceAll mediums have an inherent impedance or resistance to the propagation of sound. As a sound wave travels through a medium of one impedance and crosses into a medium of another impedance, it encounters a change in impedance at the interface between the two media. Reflection of the sound occurs at this interface (Fig. 2.2). If the body had only one uniform density with tissues of similar or identical imped-ance, then no image could be generated because no reflec-tion would occur. The amount of reflection is proportional to the difference in the acoustic impedance between the two media. The faces of ultrasound transducers are designed with material that has an impedance similar to that of epidermis to allow the signal to penetrate biological tissue. Ultrasound gel is used to prohibit air from interfering with the transmission of the signal. In general, tissues that interface with objects of high acoustic impedance, such as bone, reflect much (if not all) of the signal back to the transducer, generating a strong echogenic image. The fact that different tissues have differ-ent impedance allows detailed imaging by ultrasound.
AttenuationAs sound waves leave the transducer and propagate into biological tissue, they start to undergo a process of attenu-ation, the loss of amplitude and intensity. The frequency of
Figure 2.1. Piezoelectric effect. Notice that if a current is applied to the crystal on the left, a signal is generated . As sound waves return and hit the crystal, it will vibrate and generate a current .
Figure 2.2. The illustration on the left demonstrates that as the sound waves hit an object, the impedance difference between the mediums causes a portion of the signal to return to the transducer and a portion to continue . The continuing signal is attenuated . The amount of reflected signal depends on the degree of impedance change encountered . In the illustration on the right, if the object is very dense, the entire signal is attenuated and there is acoustic silence or an anechoic signal on the monitor . The top images illustrate a sound wave striking an object . The bottom figures illustrate the image generated on the monitor .
Figure 2.3. The figure on the left demonstrates good perpendicular scan-ning . The entire signal is returning to the transducer . The signal on the right is hitting the object of interest at an angle, causing poor signal return, resulting in a less sharp image .
the wave, the distance of travel (i.e., depth in tissue), as well as the angle of the ultrasound transducer will affect attenua-tion of sound waves. In general, high-frequency signals have a high attenuation coefficient. Thus, high-frequency waves undergo rapid attenuation; they have excellent resolution of shallow structures but limited penetration. Lower-frequency waves have less attenuation and penetrate deeper structures. Attenuation occurs through four processes: absorption, reflection, refraction, and scatter.
Absorption is the conversion of the sound wave to heat and is responsible for the majority of attenuation that takes place.
Reflection causes the signal to return to the transducer to generate an image.
Reflection occurs as a result of impedance mismatches between tissue layers. The angle of reflection is important in producing good ultrasound images. In order to ensure that the majority of sound is reflected back to the transducer and not reflected away at an angle, it is important that the trans-ducer is perpendicular to the structure of interest (Fig. 2.3).
There are two types of reflectors: specular and diffuse. Specular reflectors are smooth, well-defined structures that are larger than the incident sound wave. Examples of specular
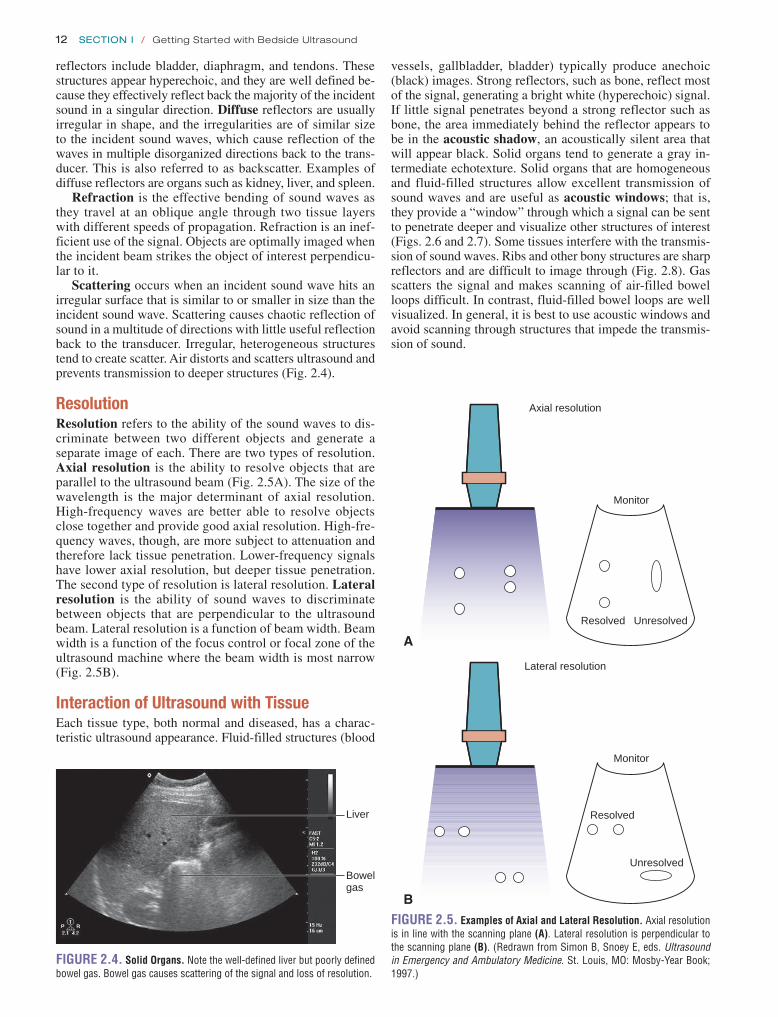
12 SeCtion i / Getting Started with Bedside Ultrasound
vessels, gallbladder, bladder) typically produce anechoic (black) images. Strong reflectors, such as bone, reflect most of the signal, generating a bright white (hyperechoic) signal. If little signal penetrates beyond a strong reflector such as bone, the area immediately behind the reflector appears to be in the acoustic shadow, an acoustically silent area that will appear black. Solid organs tend to generate a gray in-termediate echotexture. Solid organs that are homogeneous and fluid-filled structures allow excellent transmission of sound waves and are useful as acoustic windows; that is, they provide a “window” through which a signal can be sent to penetrate deeper and visualize other structures of interest (Figs. 2.6 and 2.7). Some tissues interfere with the transmis-sion of sound waves. Ribs and other bony structures are sharp reflectors and are difficult to image through (Fig. 2.8). Gas scatters the signal and makes scanning of air-filled bowel loops difficult. In contrast, fluid-filled bowel loops are well visualized. In general, it is best to use acoustic windows and avoid scanning through structures that impede the transmis-sion of sound.
reflectors include bladder, diaphragm, and tendons. These structures appear hyperechoic, and they are well defined be-cause they effectively reflect back the majority of the incident sound in a singular direction. Diffuse reflectors are usually irregular in shape, and the irregularities are of similar size to the incident sound waves, which cause reflection of the waves in multiple disorganized directions back to the trans-ducer. This is also referred to as backscatter. Examples of diffuse reflectors are organs such as kidney, liver, and spleen.
Refraction is the effective bending of sound waves as they travel at an oblique angle through two tissue layers with different speeds of propagation. Refraction is an inef-ficient use of the signal. Objects are optimally imaged when the incident beam strikes the object of interest perpendicu-lar to it.
Scattering occurs when an incident sound wave hits an irregular surface that is similar to or smaller in size than the incident sound wave. Scattering causes chaotic reflection of sound in a multitude of directions with little useful reflection back to the transducer. Irregular, heterogeneous structures tend to create scatter. Air distorts and scatters ultrasound and prevents transmission to deeper structures (Fig. 2.4).
resolutionResolution refers to the ability of the sound waves to dis-criminate between two different objects and generate a separate image of each. There are two types of resolution. Axial resolution is the ability to resolve objects that are parallel to the ultrasound beam (Fig. 2.5A). The size of the wavelength is the major determinant of axial resolution. High-frequency waves are better able to resolve objects close together and provide good axial resolution. High-fre-quency waves, though, are more subject to attenuation and therefore lack tissue penetration. Lower-frequency signals have lower axial resolution, but deeper tissue penetration. The second type of resolution is lateral resolution. Lateral resolution is the ability of sound waves to discriminate between objects that are perpendicular to the ultrasound beam. Lateral resolution is a function of beam width. Beam width is a function of the focus control or focal zone of the ultrasound machine where the beam width is most narrow (Fig. 2.5B).
Interaction of ultrasound with tissueEach tissue type, both normal and diseased, has a charac-teristic ultrasound appearance. Fluid-filled structures (blood
Figure 2.5. examples of Axial and Lateral resolution. Axial resolution is in line with the scanning plane (A) . Lateral resolution is perpendicular to the scanning plane (B) . (Redrawn from Simon B, Snoey E, eds . Ultrasound in Emergency and Ambulatory Medicine . St . Louis, MO: Mosby-Year Book; 1997 .)
Axial resolution
Monitor
Resolved Unresolved
A
Lateral resolution
Monitor
Resolved
Unresolved
B
Liver
Bowelgas
Figure 2.4. Solid Organs. Note the well-defined liver but poorly defined bowel gas . Bowel gas causes scattering of the signal and loss of resolution .

Chapter 2 / Fundamentals of Ultrasound 13
Bladder
Foleyballoon
Uterus
Figure 2.6. Acoustic Window. The bladder displaces bowel gas and provides an acoustic window to the uterus . (Note the inflated Foley balloon in the bladder .)
Figure 2.7. A: The liver is an excellent acoustic window for the fluid-filled gallbladder . B: The large gallstone creates a dark shadow . In addition, the tis-sue behind the gallbladder is more echogenic than surrounding tissue . This is enhancement artifact .
A
B
A
B
Figure 2.8. ribs Cause the Complete Attenuation of Signal and gener-ate a Shadow. Rib shadows interfere with scanning through an intercos-tal approach for the liver (A) . Ribs commonly interfere with imaging the kidneys (B) .
ArtIFActSArtifacts are echo signals and images that do not accurately represent the tissue. Artifacts can cause images to appear that are not present, may fail to visualize something that is pres-ent, or may show structures at an incorrect location, size, or brightness. Artifacts are, however, predictable and useful. At times, they provide a distraction; at other times they may be used to make a diagnosis. Some artifacts are characteris-tic for normal tissue (A-lines in lung ultrasound); others are
used to diagnose pathology (e.g., shadowing characteristic of gallstones). The following section lists commonly encoun-tered artifacts.
ShadowingShadowing is one of the most common and useful artifacts to understand in diagnostic ultrasound. Shadowing is an an-echoic signal caused by failure of the sound beam to pass through an object. It is typically seen when bone is encoun-tered. Bone is a sharp reflector that prevents the transmis-sion of the signal beyond it. This leaves an acoustically silent space that appears black in the ultrasound image, creating a “shadow.” Shadowing beyond bone tends to be black and sharply defined, referred to as “clean” shadows. In contrast, the ultrasound may be scattered and distorted by gas, creat-ing a gray ill-defined shadow that is referred to as “dirty” shadows. Clean shadowing is often a sign of a gallstone (Fig. 2.7); dirty shadows may indicate gas in the soft tissues in the face of a necrotizing infection.
EnhancementEnhancement occurs when an object attenuates less than other surrounding tissue, which is commonly seen as a hyperechoic or bright area on the far side of a fluid-filled structure; this is also referred to as increased through transmission (Fig. 2.7). The back wall of a fluid-filled

14 SeCtion i / Getting Started with Bedside Ultrasound
artifact to locate a needle when doing an ultrasound-guided procedure.
comet tailComet tail artifact is seen with highly reflective surfaces (i.e., foreign material, needles, air interface). Comet tails are a form of reverberation, but differ in having a triangu-lar, tapered shape (Fig. 2.10; VIdEo 2 .1). A signal of tightly compressed waves emanates from the object inter-face. Comet tails are seen proximate to foreign bodies as well as at the pleural interface of the lung.
Mirror ImageMirror image artifact is produced when an object is located in front of a very strong reflector. In essence, a second repre-sentation of the object is visualized at the incorrect location behind the strong reflector in the image. If a sonographic structure has a curved appearance, it may focus and reflect the sound like a mirror. This occurs as a result of the machine processor interpreting all reflected sound waves as having traveled in a straight line. This commonly occurs at the dia-phragm (Fig. 2.11; VIdEo 2 .2).
ring downRing down is an image artifact created when a tissue sur-rounded by a collection of air molecules responds to incident sound waves by vibrating at a resonance frequency, which causes a constant source of sound echoes back to the trans-ducer. This creates a resultant image that is displayed as ei-ther a series of compact horizontal lines or a continuous line that propagates downward from the air interface (Fig. 2.12). Ring down is commonly seen from bowel gas, especially after a meal.
Edge ArtifactSound waves travel in straight lines. When they encounter a rounded or curved tissue interface with different speeds of propagation, the sound wave is refracted away from the original line of propagation, leaving an acoustically silent space. This generates a shadow. This distorted image is com-monly seen along the sides of cystic structures such as the liver and gallbladder (Fig. 2.13).
structure will appear thicker and brighter (more echogenic) than the anterior wall; this is known as posterior acoustic enhancement. These properties are especially noticeable when an echogenic structure, such as a gallstone, is imaged in the gallbladder. The echogenic gallstone is especially noticeable in the echo-free space of the gallbladder lumen. In addition, the echo-free shadow produced by the stone is sharply contrasted to the surrounding area behind the gall-bladder that is enhanced by increased through transmission.
reverberationReverberation occurs when a sound wave is reflected back and forth between two highly reflective interfaces. The initial sound wave is reflected back to the transducer and is displayed, as it exists anatomically; however, when the sound waves bounce back and forth between the reflective interfaces and the transducer, the time delay is interpreted by the machine processor as coming from a greater distance. This produces numerous equidistant horizontal lines on the display (Fig. 2.9A, B; VIdEo 2 .1). Reverberation can be limited by changing the angle of the transducer. Common examples of reverberation can be seen in lung (A-lines and comet tails), fluid-filled structures, and nonanatomic foreign bodies (needles in procedural guidance, intrauterine de-vices, pacer wires). One can take advantage of reverberation
Figure 2.9. reverberation Artifact. Note the horizontal lines that repeat at equidistant intervals from one another starting from the pleural interface . These are A-lines, a type of reverberation artifact seen in lung ultrasound (A) . Note the lines in the fossa of the gallbladder . This is a reverberation artifact (B) .
A
B
Figure 2.10. Comet Tail Artifact is Seen Descending from Pleural interface.

Chapter 2 / Fundamentals of Ultrasound 15
Liver
Mirrorartifact
Diaphragm
A
Figure 2.11. Mirror Artifact. A: There appears to be liver parenchyma on both sides of the diaphragm . This represents a mirror artifact caused by reflected signal . B: Identical images of the uterus are seen side by side .
Uterus
Mirrorartifact
B
Figure 2.12. This is an example of ring Down Artifact Seen from Bowel gas.
Figure 2.13. edge Artifact. Shadows are seen along the curved sides of cystic structures, caused by refraction of the sound wave along the curved interface . In this image, an oblique view of the inferior vena cava is seen .
Edgeartifact
Side Lobe and Beam Width ArtifactWhen a strong reflector outside the main beam width is de-tected, it is processed by the transducer as though it exists within the main beam. Similarly, side lobe sound waves may reflect off highly reflective structures and create a signal interpreted by the machine as coming from the main beam (Fig. 2.14). The resulting artifact is most commonly visual-ized and noticeable in anechoic structures, resulting in the appearance of echogenic debris within an otherwise anechoic space. Side lobe artifact can be seen especially around the bladder. Beam width artifact can be avoided or minimized by placing the object of interest in the midfield so that it is centered in the main ultrasound beam.
tWo-dIMEnSIonAL uLtrASound IMAGInGWhen sound is sent out from the transducer, it is important to conceptualize the form the sound takes. The sound trav-els from the transducer in flat two-dimensional (2-D) planes (Fig. 2.15). At any one moment objects are only visualized in one plane. The transducer can be “fanned” or tilted from side to side to better visualize an object (Fig. 2.16). Scanning in
Figure 2.14. Hyperechoic Curved Line Seen in the Lumen of Bladder is an example of Side Lobe Artifact.
Figure 2.15. Two-Dimensional Planes of imaging. This figure illus-trates the 2-D signal that comes out of the transducer . Note that the trans-ducer needs to be rotated to visualize the object in two planes perpendicular to each other .

16 SeCtion i / Getting Started with Bedside Ultrasound
two planes perpendicular to each other and fanning through an object allow for more of a three-dimensional (3-D) con-ceptualization. This can be difficult to see from a 2-D text-book page.
In order to keep relationships consistent, reference tools are used. Each transducer has a position marker (indicator) that corresponds with the position marker on the ultrasound monitor. This is a guide to help remind the sonographer what orientation the transducer is positioned. Scanning protocols are not just random images; rather, they are accepted views of a particular anatomic area.
If possible, the object of interest should be scanned in two planes perpendicular to each other to give the best 3-D representation available. Images can be referenced in one of two ways. Some organs have an orientation conveniently imaged in reference to the major axis of the body. A longi-tudinal orientation refers to a cephalad-caudad (or sagittal) view (Fig. 2.17A). A transverse orientation refers to a cross-sectional view similar to that produced by conventional com-puted tomography (CT). If an object lies in an oblique plane relative to the body (e.g., kidney), it is best referenced by its own axis. These objects are typically imaged in their long and short axes. When a longitudinal orientation is desired, by convention, the transducer indicator is positioned toward the patient’s head (Fig. 2.17A). The ultrasound monitor projects the image closest to the patient’s head on the left side of the ultrasound monitor and the image closest to the patient’s feet toward the right. When a transverse orientation is desired, the transducer indicator is placed toward the patient’s right side (Fig. 2.17B). In this position the ultrasound monitor projects the patient’s right side to the left of the monitor and the image closest to the patient’s left side toward the right. Clinicians will recognize this view because it is the same orientation provided on traditional CT cuts. In most common applica-tions the position marker on the monitor is on the left side. This differs from classic echocardiography orientation, where it is placed on the right side of the image. The guides help develop a better image when scanning in two dimensions.
Figure 2.16. rocking or Fanning the Transducer Produces a 3-D Perspective of the Object of interest. (Redrawn from Simon B, Snoey E, eds . Ultrasound in Emergency and Ambulatory Medicine. St . Louis, MO: Mosby-Year Book; 1997 .)
Transducer movement
Figure 2.17. A: Longitudinal axis . Long-axis scanning with the posi-tion marker (indicator) toward the patient’s head . The arrow notes the indicator position . B: Transverse axis . Short-axis scanning with the po-sition marker (indicator) toward the patient’s right side . (Redrawn from Heller M, Jehle D, eds . Ultrasound in Emergency Medicine. Philadelphia, PA: W .B . Saunders; 1995 .)
A
B
PrIMEr on EQuIPMEntAll ultrasound units share some common features. Although each manufacturer will have certain specific components, all machines have some basic knobs and features. The follow-ing section explores the basics of each of these features and describes variations and the practical nature of each.
transducersThe transducer is the functioning element of the ultrasound machine that generates and receives signals. The probe houses the transducer. There are three main types of transducers available on the market. Each type has its advantages and dis-advantages. Generally, most transducers today are sealed and

Chapter 2 / Fundamentals of Ultrasound 17
have limited serviceability. In addition, many manufacturers claim their transducers are multifrequency. A transducer may have a range of effective frequency (i.e., 3.5 to 5.0 MHz).
Most modern ultrasound transducers are composed of multiple active elements arranged in arrays. The arrays can be organized in a straight line (the linear array), a curve (the convex, or curvilinear array), or in concentric circles (annular array) (Figs. 2.18–2.20). An endocavitary probe is considered a type of curvilinear array probe that sits at the end of a stick.
Transducers can be further described based on the se-quence of element activation. Each element can be activated separately or in a predetermined sequence. Sequential array transducers fire in a sequence, starting at one end of the ar-ray to the other. In contrast, phased array transducers fire through an elaborate electronic scheme that controls beam steering and focusing. Each transducer has advantages and disadvantages for different applications. Straight linear transducers are typically of higher frequency and appropri-ate for vascular, soft tissue, and small part imaging. They produce a rectangular field with consistent lateral resolution regardless of depth. Curvilinear transducers are excellent for achieving appropriate tissue penetration and a wide field of view for abdominal and pelvic applications, although lateral resolution diminishes with depth. Sector phased transducers achieve deeper penetration through small foot-prints and are ideal for imaging between ribs. Phased array transducers generate an image similar to that generated by a curvilinear transducer, but have improved lateral resolution.
A
B
Figure 2.18. Curvilinear Array Transducer. Image A illustrates the foot-print generated by a curvilinear transducer (B) . Note the curved image at the top of the screen .
Exam PresetsUltrasound machines come with exam presets that are spe-cific to each transducer type and clinical application. The exam presets maximize the dynamic range, compound har-monics, mechanical index, and other parameters to enhance the image quality of the exam type being performed. These are optimal starting points. For example, the curvilinear transducer may have presets for abdominal, obstetric (OB), gynecologic, and renal options. The exam presets also have corresponding software to convert measurements for clinical use (e.g., selecting the OB preset allows the sonographer to select crown rump length measurement; the software con-verts that measurement to a gestational age). Presets can be quite helpful in producing high-quality ultrasound images of the desired anatomy. Conversely, using incorrect presets may affect images negatively. Presets can be customized for specific needs (e.g., presets for obese or thin patients).
GainThe gain control adjusts the signal that returns to the unit. It can be compared to the volume knob on a stereo system. The intensity of the reflected sound wave is amplified to pro-duce a visual image. As the volume is turned up on a stereo, the music becomes clearer until it is too loud. Similarly, as gain is increased, the amount of signal processed is increased
A
Figure 2.19. Straight Array Transducer. Image A illustrates the image footprint generated by a straight array transducer (B) . Note the straight image at the top of the screen .
B
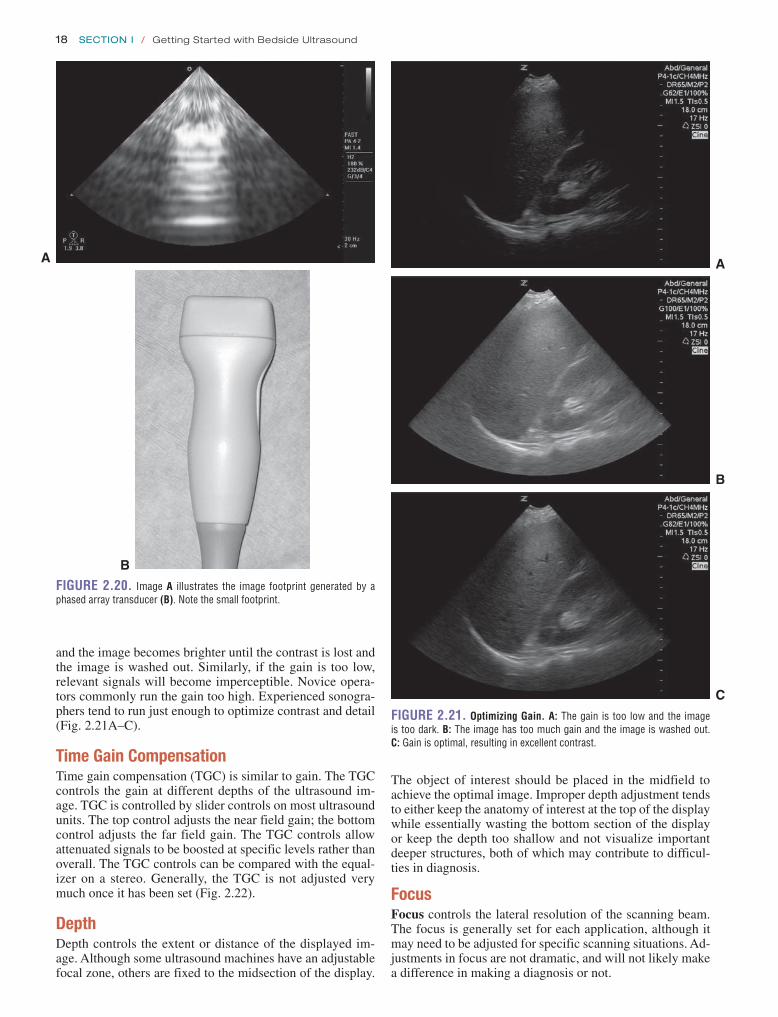
18 SeCtion i / Getting Started with Bedside Ultrasound
Figure 2.20. Image A illustrates the image footprint generated by a phased array transducer (B) . Note the small footprint .
A
B
A
Figure 2.21. Optimizing gain. A: The gain is too low and the image is too dark . B: The image has too much gain and the image is washed out . C: Gain is optimal, resulting in excellent contrast .
C
B
and the image becomes brighter until the contrast is lost and the image is washed out. Similarly, if the gain is too low, relevant signals will become imperceptible. Novice opera-tors commonly run the gain too high. Experienced sonogra-phers tend to run just enough to optimize contrast and detail (Fig. 2.21A–C).
time Gain compensationTime gain compensation (TGC) is similar to gain. The TGC controls the gain at different depths of the ultrasound im-age. TGC is controlled by slider controls on most ultrasound units. The top control adjusts the near field gain; the bottom control adjusts the far field gain. The TGC controls allow attenuated signals to be boosted at specific levels rather than overall. The TGC controls can be compared with the equal-izer on a stereo. Generally, the TGC is not adjusted very much once it has been set (Fig. 2.22).
depthDepth controls the extent or distance of the displayed im-age. Although some ultrasound machines have an adjustable focal zone, others are fixed to the midsection of the display.
The object of interest should be placed in the midfield to achieve the optimal image. Improper depth adjustment tends to either keep the anatomy of interest at the top of the display while essentially wasting the bottom section of the display or keep the depth too shallow and not visualize important deeper structures, both of which may contribute to difficul-ties in diagnosis.
FocusFocus controls the lateral resolution of the scanning beam. The focus is generally set for each application, although it may need to be adjusted for specific scanning situations. Ad-justments in focus are not dramatic, and will not likely make a difference in making a diagnosis or not.

Chapter 2 / Fundamentals of Ultrasound 19
Gaincontrol
TGCcontrols
Figure 2.22. gain and Time gain Compensation (TgC). Note the gain knob in the lower right . The TGC levers are in the upper right of the keyboard .
tissue HarmonicsSome ultrasound machines allow the user to adjust the tissue harmonics. Tissue harmonics refers to the frequency of the re-turning sound echo that the machine uses to create an image. The initial sound wave leaves the transducer at a fundamental frequency. As this sound wave propagates through tissues, other harmonic frequencies are produced. For example, a 2-MHz fundamental frequency sound wave will produce 4-, 6-, and 8-MHz harmonic sound waves. Returning sound echoes can be “listened” to by the machine in the fundamen-tal frequency or in a harmonic of that frequency, typically the second harmonic (or 2× the fundamental frequency) while the fundamental frequency is filtered out. These higher-frequency harmonic echoes reduce some of the distorting image artifacts such as side lobes and can create a higher-quality, clearer im-age. Typically, exam presets will automatically adjust the tis-sue harmonics to optimize their use for a given application.
FreezeA selected image in the real-time acquisition is designated for continuous display until this mode is turned off. The freeze button holds an image still and allows printing, mea-suring, and manipulation.
calipersThese markers are available to measure distances. Some ultra-sound units add a feature for ellipsoid measurement. This fea-ture provides a dotted line that can be drawn around the outline of a structure to calculate either the circumference or the area.
B-ModeThis is termed “brightness mode scanning”; it modulates the brightness of a dot to indicate the amplitude of the signal displayed at the location of the interface. B-mode is the 2-D scanning customarily done for diagnostic ultrasound.
M-ModeM-mode is “motion mode.” If a series of B-mode dots are displayed on a moving time base, the motion of the mobile structures can be observed. Each piezoelectric channel is plotted over time. This gives a real-time representation of a moving object such as the heart (Fig. 2.23; VIdEo 2 .3).
dopplerDoppler superimposes a color-based directional signal over a gray scale. Echoes from stationary structures have the same frequency as the transducer output. Axial motion away from the transducer shifts this frequency lower; axial mo-tion toward the transducer shifts it higher. This is known as the Doppler effect. Doppler can be used in different flow modes. Each form has advantages and disadvantages. Spec-tral Doppler examines flow at one site (Fig. 2.24). It allows detailed analysis of flow, and velocities can be measured. Color Doppler displays directionality of flow but gives lim-ited information regarding the intensity of flow (Fig. 2.25;
VIdEo 2 .4). Power Doppler detects the presence of flow, including low flow states, but does not illustrate directional-ity or allow for calculations (Fig. 2.26).
IMAGE AcQuISItIonIt is important to understand a few basic principles to opti-mize image acquisition. Each of these principles highlights essential points.
Figure 2.23. B- and M-Mode images. A B-mode scan of the heart in a parasternal long axis in a patient with decreased left ventricular function . The reference channel cursor is aligned over the anterior leaflet of the mitral valve throughout the cardiac cycle . This single channel is plotted over time, giving the M-mode image seen at the bottom .
Figure 2.24. Spectral Doppler imaging of the Testicle. Shows an arterial wave form as the gate is placed over a small artery .
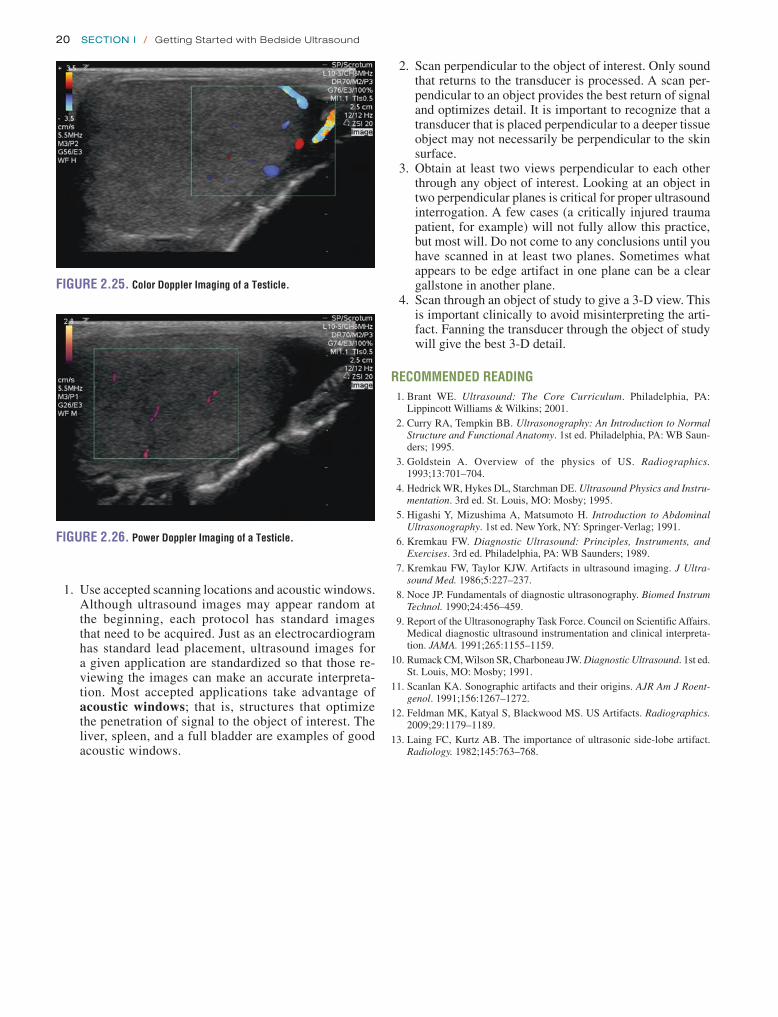
20 SeCtion i / Getting Started with Bedside Ultrasound
1. Use accepted scanning locations and acoustic windows. Although ultrasound images may appear random at the beginning, each protocol has standard images that need to be acquired. Just as an electrocardiogram has standard lead placement, ultrasound images for a given application are standardized so that those re-viewing the images can make an accurate interpreta-tion. Most accepted applications take advantage of acoustic windows; that is, structures that optimize the penetration of signal to the object of interest. The liver, spleen, and a full bladder are examples of good acoustic windows.
2. Scan perpendicular to the object of interest. Only sound that returns to the transducer is processed. A scan per-pendicular to an object provides the best return of signal and optimizes detail. It is important to recognize that a transducer that is placed perpendicular to a deeper tissue object may not necessarily be perpendicular to the skin surface.
3. Obtain at least two views perpendicular to each other through any object of interest. Looking at an object in two perpendicular planes is critical for proper ultrasound interrogation. A few cases (a critically injured trauma patient, for example) will not fully allow this practice, but most will. Do not come to any conclusions until you have scanned in at least two planes. Sometimes what appears to be edge artifact in one plane can be a clear gallstone in another plane.
4. Scan through an object of study to give a 3-D view. This is important clinically to avoid misinterpreting the arti-fact. Fanning the transducer through the object of study will give the best 3-D detail.
reCOMMeNDeD reADiNg 1. Brant WE. Ultrasound: The Core Curriculum. Philadelphia, PA:
Lippincott Williams & Wilkins; 2001. 2. Curry RA, Tempkin BB. Ultrasonography: An Introduction to Normal
Structure and Functional Anatomy. 1st ed. Philadelphia, PA: WB Saun-ders; 1995.
3. Goldstein A. Overview of the physics of US. Radiographics. 1993;13:701–704.
4. Hedrick WR, Hykes DL, Starchman DE. Ultrasound Physics and Instru-mentation. 3rd ed. St. Louis, MO: Mosby; 1995.
5. Higashi Y, Mizushima A, Matsumoto H. Introduction to Abdominal Ultrasonography. 1st ed. New York, NY: Springer-Verlag; 1991.
6. Kremkau FW. Diagnostic Ultrasound: Principles, Instruments, and Exercises. 3rd ed. Philadelphia, PA: WB Saunders; 1989.
7. Kremkau FW, Taylor KJW. Artifacts in ultrasound imaging. J Ultra-sound Med. 1986;5:227–237.
8. Noce JP. Fundamentals of diagnostic ultrasonography. Biomed Instrum Technol. 1990;24:456–459.
9. Report of the Ultrasonography Task Force. Council on Scientific Affairs. Medical diagnostic ultrasound instrumentation and clinical interpreta-tion. JAMA. 1991;265:1155–1159.
10. Rumack CM, Wilson SR, Charboneau JW. Diagnostic Ultrasound. 1st ed. St. Louis, MO: Mosby; 1991.
11. Scanlan KA. Sonographic artifacts and their origins. AJR Am J Roent-genol. 1991;156:1267–1272.
12. Feldman MK, Katyal S, Blackwood MS. US Artifacts. Radiographics. 2009;29:1179–1189.
13. Laing FC, Kurtz AB. The importance of ultrasonic side-lobe artifact. Radiology. 1982;145:763–768.
Figure 2.25. Color Doppler imaging of a Testicle.
Figure 2.26. Power Doppler imaging of a Testicle.
21
ARTIFACTS AND PITFALLS . . . . . . . . . . . . . . . . . . . . . . . . . . 40General Issues. . . . . . . . . . . . . . . . . . . . . . . . . . . . . . . . 40Perihepatic View . . . . . . . . . . . . . . . . . . . . . . . . . . . . . . 41Perisplenic View . . . . . . . . . . . . . . . . . . . . . . . . . . . . . . 42Pelvic View . . . . . . . . . . . . . . . . . . . . . . . . . . . . . . . . . . 42Pericardial View. . . . . . . . . . . . . . . . . . . . . . . . . . . . . . . 43Thoracic Views . . . . . . . . . . . . . . . . . . . . . . . . . . . . . . . 44
USE OF THE IMAGE IN MEDICAL DECISION MAKING . . . . . . 44Blunt Trauma . . . . . . . . . . . . . . . . . . . . . . . . . . . . . . . . . 45Penetrating Trauma . . . . . . . . . . . . . . . . . . . . . . . . . . . . 46Expanded Applications: Thoracic Trauma . . . . . . . . . . . 47Special Considerations . . . . . . . . . . . . . . . . . . . . . . . . . 47
COMPARISON WITH OTHER DIAGNOSTIC MODALITIES . . . . 48INCIDENTAL FINDINGS . . . . . . . . . . . . . . . . . . . . . . . . . . . . . 50
Cysts . . . . . . . . . . . . . . . . . . . . . . . . . . . . . . . . . . . . . . . 50Masses . . . . . . . . . . . . . . . . . . . . . . . . . . . . . . . . . . . . . 50Abnormal Organ Size or Chambers . . . . . . . . . . . . . . . . 50
CLINICAL CASES . . . . . . . . . . . . . . . . . . . . . . . . . . . . . . . . . . 50Case 1 . . . . . . . . . . . . . . . . . . . . . . . . . . . . . . . . . . . . . . 50Case 2 . . . . . . . . . . . . . . . . . . . . . . . . . . . . . . . . . . . . . . 50
INTRODUCTION . . . . . . . . . . . . . . . . . . . . . . . . . . . . . . . . . . . 21CLINICAL APPLICATIONS . . . . . . . . . . . . . . . . . . . . . . . . . . . . 22IMAGE ACQUISITION . . . . . . . . . . . . . . . . . . . . . . . . . . . . . . . 22
Equipment . . . . . . . . . . . . . . . . . . . . . . . . . . . . . . . . . . . 22Timing and Speed . . . . . . . . . . . . . . . . . . . . . . . . . . . . . 22Basic Exam . . . . . . . . . . . . . . . . . . . . . . . . . . . . . . . . . . 22Order . . . . . . . . . . . . . . . . . . . . . . . . . . . . . . . . . . . . . . . 27
NORMAL ULTRASOUND ANATOMY . . . . . . . . . . . . . . . . . . . . 28Peritoneal Space . . . . . . . . . . . . . . . . . . . . . . . . . . . . . . 28Liver and Gallbladder . . . . . . . . . . . . . . . . . . . . . . . . . . 28Spleen . . . . . . . . . . . . . . . . . . . . . . . . . . . . . . . . . . . . . . 28Bowel . . . . . . . . . . . . . . . . . . . . . . . . . . . . . . . . . . . . . . 28Kidneys . . . . . . . . . . . . . . . . . . . . . . . . . . . . . . . . . . . . . 29Uterus . . . . . . . . . . . . . . . . . . . . . . . . . . . . . . . . . . . . . . 29Bladder . . . . . . . . . . . . . . . . . . . . . . . . . . . . . . . . . . . . . 29Thorax . . . . . . . . . . . . . . . . . . . . . . . . . . . . . . . . . . . . . . 29
PATHOLOGY . . . . . . . . . . . . . . . . . . . . . . . . . . . . . . . . . . . . . . 31Free Peritoneal Fluid . . . . . . . . . . . . . . . . . . . . . . . . . . . 31Pericardial Effusion . . . . . . . . . . . . . . . . . . . . . . . . . . . . 34Pleural Abnormalities . . . . . . . . . . . . . . . . . . . . . . . . . . 36Solid Organ Injury . . . . . . . . . . . . . . . . . . . . . . . . . . . . . 38
Brooks T. Laselle and John L. Kendall
Trauma3
INTRODUCTIONFor many, “trauma ultrasound” is synonymous with “emer-gency ultrasound.” The use of ultrasound in the evaluation of the traumatically injured patient originated in the 1970s when trauma surgeons in Europe and Japan first described sonography for rapid detection of life-threatening hemor-rhage. While the original studies set conservative goals of determining whether ultrasound could in fact detect perito-neal fluid (1–3), they shortly evolved to a point where ultra-sound was lauded as a replacement for diagnostic peritoneal lavage (DPL) (4–8). This rapid ascension was fueled by evi-dence that ultrasound could not only accurately detect free fluid in body cavities, but also do it quickly, noninvasively, at the bedside, and without exposing the patient to radiation. The experience of physicians in the United States with ultra-sound in the setting of trauma came to publication in the early 1990s as a number of papers reported similar results to those out of Europe and Japan (9). From these studies came the
first description of the examination being performed as the “Focused Abdominal Sonography for Trauma,” or the FAST examination (10). Later this terminology was changed to “Fo-cused Assessment with Sonography for Trauma” (11), fol-lowed by “Extended Focused Assessment with Sonography in Trauma (EFAST)” (12), but the goal remained the same: the evaluation of trauma patients with the aid of ultrasound.
Beyond a purely historical perspective, trauma ultrasound is also equated with emergency ultrasound due to its wide-spread acceptance in Emergency Departments (ED). Ultra-sound proved to be such a practical and valuable bedside resource for trauma that it received approval by the American College of Surgeons and was incorporated into standard teaching of the Advanced Trauma Life Support curriculum. With this endorsement, the use of ultrasound became a new standard for trauma centers throughout the world. In fact, in many trauma centers bedside ultrasound has become the ini-tial imaging modality used to evaluate the abdomen and chest in patients who present with blunt and penetrating trauma to

22 Section ii / Ultrasound in the Resuscitation of Acute Injury or Illness
A single general-purpose transducer used for most ab-dominal scanning is sufficient for the EFAST examination. While the exam can be done with a curvilinear abdominal transducer, a smaller footprint can facilitate imaging between and around ribs, making it easier to assess the upper quad-rant, cardiac, and thoracic regions. Some physicians prefer a phased array transducer for cardiac imaging and a high fre-quency linear transducer (with better near field resolution) for the detection of pneumothorax and for procedural guidance.
Timing and SpeedThe acronym “EFAST” suggests a quick survey of the peri-toneal, thoracic, and pericardial areas. Usually, the exam can be completed in 3 to 5 minutes, and is done simultaneously with resuscitation or as part of the secondary survey in the stable patient. Though the study should be done relatively quickly, this does not mean that the ultrasound exam should be done haphazardly (15). The transducer should be maneu-vered to insure a thorough, three-dimensional assessment of each area of interest. This involves a combination of slid-ing, angling, and rotating the transducer 90 degrees to assess structures in two planes.
For archiving purposes, typically a representative, static image of a region is frozen and saved digitally or printed to paper. If possible, however, a short video clip is preferred, because it provides more detailed information about the vi-sualized structures.
Serial sonographic examinations have been proposed in order to improve the sensitivity for fluid detection. While very few studies have assessed this approach, it may have merit in the era of minimizing ionizing radiation exposure and nonop-erative intervention for solid organ injuries (16–18).
Basic ExamThe EFAST examination includes six areas of assessment (Fig. 3.1) (11):
1. Perihepatic (right upper quadrant) 2. Perisplenic (left upper quadrant)
the torso. As emergency physicians gained basic ultrasound skills for trauma, it became only natural to expand those skills to other applications. Presently, trauma ultrasound is one of many applications in the evolving field of “Point of Care Ul-trasound (POCUS),” which is inclusive of limited, bedside, and emergency ultrasound (13). POCUS is a resource that greatly expands the ability to assess and treat all patients.
CLINICAL APPLICATIONSThe primary goal of the FAST examination in its original de-scription was the noninvasive detection of fluid (blood) within the peritoneal and pericardial spaces. Ultrasound provides a method to detect quantities of fluid within certain spaces that are either undetectable by the physical exam or without the use of other invasive (DPL), expensive [computed tomogra-phy (CT)], or potentially delayed (clinical observation) meth-ods. As experience has been gained, trauma ultrasound has been expanded to include assessment for specific solid organ injury and the detection of pleural effusions (hemothorax) and pneumothorax. The clinical scenarios where this information becomes exceedingly useful are in the evaluation of patients with suspected abnormal fluid or air collections in the abdo-men or chest. This chapter will discuss the clinical applica-tions, techniques, and use of the EFAST examination as well as expanded applications for those with more advanced skills.
IMAGE ACQUISITIONEquipmentMost EFAST examinations are performed with compact or cart-based systems using multiple transducers that have fre-quency and depth controls. These controls allow adjustment for a variety of applications and body habitus to optimize imaging. For instance, in larger adults, a lower frequency (2 MHz) may be optimal to allow deeper abdominal imag-ing, whereas in children and thin adults, a higher frequency (5 MHz) provides improved shallow imaging but limited depth assessment (14).
A.
C.
G.
D.
B.F.E.
H.
Figure 3.1. Transducer Placement for Views of the eFAST exam. A: Subxyhoid; B: perihepatic; C: perisplenic; D: pelvic; e, F: extended thoracic views; g: thoracic views; H: paracolic gutter views.

chapter 3 / Trauma 23
Figure 3.2. right upper Quadrant Transducer Positioning for the FAST exam.
3. Pelvic (pouch of Douglas or retrovesicular) 4. Pericardial (cardiac) 5. Paracolic gutters (bilateral) 6. Thoracic (bilateral)
PerihepaticThe right upper quadrant view, also known as the Mori-son’s pouch or perihepatic view, is commonly viewed as the classic image of trauma ultrasound. It allows for visualiza-tion of free fluid in the potential space between the liver and right kidney. In addition, fluid above and below the diaphragm in the costophrenic angle or subdiaphragmatic space can be seen. The transducer is initially placed in a coronal orientation in the midaxillary line over an intercos-tal space of one of the lower ribs (Fig. 3.2). The indicator on the transducer should be directed toward the patient’s head. Once Morison’s pouch is visualized (Fig. 3.3), the transducer should be angled in all directions to fully visualize the potential spaces of the right upper quadrant ( VIDEO 3 .1A). Angling anteriorly and posteriorly will allow for the complete interrogation of Morison’s pouch. The sonographer will need to manipulate the transducer to minimize artifact from the ribs. The real-time image can be optimized by gently rocking the transducer to create a mental three-dimensional view of the space. In addition, the transducer can be directed cephalad to visualize the thoracic (supradiaphragmatic) and subdiaphragmatic areas (Fig. 3.4). Moving the transducer caudad brings the inferior pole of the kidney and the superior aspect of the right para-colic gutter into view (Fig. 3.5).
Figure 3.3. ultrasound image Demonstrating Normal Appearance of Morison’s Pouch.
Figure 3.4. Normal ultrasound Anatomy of the right Subdiaphrag-matic Space.
Figure 3.5. Normal inferior Pole of the right Kidney and the Paracolic gutter.
PerisplenicThe left upper quadrant view is also known as the peri-splenic or, less accurately, the splenorenal view. It can be challenging to obtain because the spleen does not provide as large a sonographic window as the liver, and the examiner frequently needs to reach across the patient in order to ac-cess the left upper quadrant. In contrast to the perihepatic view, ideal placement of the transducer in the left upper quadrant is generally more cephalad and posterior. A good starting point is the posterior axillary line in the 9th and 10th intercostal space (Fig. 3.6). The indicator should be directed toward the patient’s head. If the splenorenal space
Figure 3.6. Left upper Quadrant Transducer Positioning for the FAST exam.

24 Section ii / Ultrasound in the Resuscitation of Acute Injury or Illness
Figure 3.7. Normal ultrasound image of the Spleen and Left Kidney.
Figure 3.8. Normal Sonographic Anatomy Visualized in the Left Sub-diaphragmatic Space.
Figure 3.9. Normal Appearance of the inferior Pole of the Left Kidney and the Paracolic gutter.
is not visualized, it is typically because the transducer is not posterior or superior enough, so movement in either or both of these directions will improve the image. The transducer should be angled to see the anterior, posterior, superior, and inferior portions of the perisplenic space. Important landmarks to visualize include the spleen-kidney interface (Fig. 3.7; VIDEO 3 .1B), the spleen-diaphragm interface (Fig. 3.8), and the inferior pole of the kidney- paracolic gutter transition (Fig. 3.9). In addition, the transducer should be directed cephalad to better visualize the thoracic (supradiaphragmatic) area.
PelvicThe pelvis is an important and potentially underappreciated area for detecting free peritoneal fluid. Since it is one of the most dependent and easily visualized portions of the peri-toneal cavity, fluid collections may be seen here before be-ing detected in other areas (Fig. 3.10). As well, it is away from the chest and upper abdomen, so images can be ob-tained simultaneously with the evaluation and resuscitation of the trauma patient. The key to success is scanning through a moderately full bladder to facilitate visualization of the underlying and adjacent structures, so imaging should be done before placement of a Foley catheter or spontaneous voiding. The transducer is initially placed just superior to the symphysis pubis in a transverse orientation with the indica-tor directed to the patient’s right (Fig. 3.11A, B). From here
Diaphram
Pelvic brim
Symphysis pubis
Figure 3.10. Locations of the Dependent Areas of the Peritoneal Cavity.
the transducer can be angled cephalad, caudad, and side-to-side to fully visualize the perivesicular area. It is also impor-tant to image the bladder in a sagittal orientation. To obtain this view, the transducer should be rotated clockwise, direct-ing the indicator toward the patient’s head (Fig. 3.11B). The transducer can then be angled side to side, superiorly and inferiorly to gain a full appreciation of the perivesicular area (Fig. 3.11C, D; VIDEO 3 .2).
PericardialThe subxyphoid and the parasternal long views are the most commonly used and convenient ways to visualize the pericardial area. The four-chamber subxyphoid view is per-formed with the transducer oriented transversely in the sub-costal region and the indicator directed to the patient’s right. The transducer should be held almost parallel to the skin of the anterior torso as it is pointed to a location just to the left of the sternum toward the patient’s head (Fig. 3.12A). Gas in the stomach frequently obscures views of the heart, but this can be minimized by using the left lobe of the liver as an acoustic window. This is accomplished by moving the transducer further to the patient’s right. The liver should come into view, as well as the interface between the liver and the right side of the heart (Fig. 3.12B; VIDEO 3 .3A). Alternatively, the parasternal long axis view is performed by placing the transducer to the left of the sternum, in the fourth, fifth or sixth intercostal space (Fig. 3.12C). The transducer is rotated slightly so that the indicator is pointed toward the patient’s right shoulder, yielding a long-axis

chapter 3 / Trauma 25
Figure 3.11. Transverse (A) and sagittal (B) pelvic transducer positioning for the FAST exam. C: Normal transverse transabdominal anatomy of a male bladder. D: Normal sagittal transabdominal anatomy of a male bladder.
A B
DC
view of the heart (Fig. 3.12D; VIDEO 3 .3B). The trans-ducer may be slid cephalad or caudad to improve visualiza-tion of the heart. Alternative views may aid in the cardiac assessment when difficulty is encountered with these ap-proaches. A more detailed discussion on obtaining alterna-tive cardiac views can be found in the echochardiography chapter (Chapter 4).
Paracolic guttersAssessing the paracolic gutters may increase the sensitiv-ity of the standard FAST examination for the detection of peritoneal fluid. This is done by placing the transducer in the upper quadrant in a coronal plane and then sliding it caudally from the inferior pole of the kidney (Fig. 3.13A, B;
VIDEO 3 .4A, B). Alternatively, the transducer can be placed in a transverse orientation medial to the iliac crests. It can be angled inferiorly and superiorly to assess for the pres-ence of loops of bowel outlined by peritoneal fluid.
ThoracicCostrophrenic angle or pleural baseThe sonographic evaluation of the pleural interface for fluid is an important adaptation of the right and left upper quad-rant views described in the standard FAST exam. The trans-ducer is initially placed in position to obtain a right or left upper quadrant view. It is then angled or moved superiorly to visualize the diaphragm and supradiaphragmatic space of the thorax (Fig. 3.14A, B; VIDEO 3 .5). The region im-mediately above the diaphragm should be imaged to detect
fluid. In the normal patient, air from lung tissue will scatter the signal and create shadowing and artifact. When pleural fluid is present it can be visualized above the diaphragm. Visualization can be improved if the liver or spleen is used as an acoustic window to the pleural space (Fig. 3.15), but even with optimal transducer placement, only a small portion of the pleural space is typically accessible in patients without pathology.
Anterior thorax (pneumothorax)Interrogation of the anterior pleura for the presence of pneu-mothorax can be done with a number of transducers. There is no consensus on the exact placement of the transducer or the minimum number of rib interspaces to investigate, but a recent evidence-based consensus statement recommended “exploration of the least gravitationally dependent areas pro-gressing more laterally” (19). A reasonable approach in the supine trauma patient is to begin with the transducer oriented in the sagittal plane placed in the midclavicular line over the third or fourth intercostal space (Fig. 3.16A). A proper sag-ittal image should portray at least two ribs and the pleural line immediately deep to the posterior aspect of the ribs. When performed correctly, the image created is termed the “bat wing” sign, with the body of the bat represented by the pleural line, and the wings represented by the ribs (Fig. 3.16B; VIDEO 3 .6). In most cases, an anterior chest assessment will rule out a large pneumothorax, but a more thorough assessment is required to exclude small or locu-lated pneumothoraces.

A B
C D
Figure 3.12. A: Subxyphoid transducer position for the FAST exam. B: Normal ultrasound anatomy visualized from the subxyphoid transducer position. RV, right ventricle; RA, right atrium; LV, left ventricle. C: Parasternal long axis transducer postion for the FAST exam. D: Normal ultrasound anatomy visualized from the parasternal long axis transducer position.
Figure 3.13. A: Right paracolic gutter transducer position for the FAST exam. B: Typical ultrasound appearance of the paracolic gutter.
A B
26

chapter 3 / Trauma 27
A
Figure 3.14. A: Pleural base transducer position for the FAST exam. B: Sonographic appearance of the inferior aspect of a normal pleural cavity.
B
Figure 3.15. ultrasound image of the Liver as an Acoustic Window to the Costophrenic Angle. Note how the scan plane uses as much of the liver tissue as possible to view the pleural base.
Figure 3.16. A: Anterior thorax transducer placement for the evaluation of pneumothorax. B: Sonographic appearance of the normal anterior chest wall, ribs, and pleural interface in a sagittal plane, demonstrating the “bat wing” sign.
A
B
OrderWhile there is no current standard for the order in which the views of the EFAST examination are obtained, arguments have been made for starting with certain windows. For in-stance, the right upper quadrant view is a common starting point because it is one of the most sensitive and specific lo-cations for detecting hemoperitoneum, and many physicians routinely scan from the patient’s right side (20–22). Alterna-tively, the pelvic view may be the first view obtained, as it is one of the most dependent portions of the peritoneal cavity, so smaller fluid collections may be detected here before other locations (20). As well, placement of a urinary catheter to de-compress the bladder essentially eliminates the sonographic window to the pelvis, so there is a priority in obtaining this
window before the Foley is placed. One could argue that the left-upper quadrant is a reasonable starting location in cases of blunt abdominal trauma because the spleen is the most commonly injured organ and the left upper quadrant is the most likely positive location in splenic injury (23). Finally, particularly for penetrating trauma, there is merit in first evaluating the area with the most concerning or obvious in-jury. For example, if the patient has penetrating trauma to the chest, the exam might begin with evaluations for pericardial

28 Section ii / Ultrasound in the Resuscitation of Acute Injury or Illness
effusion and hemopneumothorax. All in all, there is no stan-dard order for performing the EFAST examination, and in many instances the order will be dictated by the patient’s clinical presentation and institutional preferences.
NORMAL ULTRASOUND ANATOMYPeritoneal SpaceThe basic FAST examination requires the sonographer to be familiar with the sonographic appearance of the major abdominal solid viscera (liver, spleen, uterus), to have the ability to recognize fluid collections in potential spaces, and to have the technical ability to acquire standard FAST exami-nation views. The most important skill for trauma ultrasound of the abdomen is the ability to detect free fluid in the poten-tial recesses within the peritoneal cavity (Fig. 3.17). These include the perihepatic space, the perisplenic space, the para-colic gutters, and the pelvis.
Liver and GallbladderThe normal liver has a homogeneous, medium-level echo-genicity (Fig. 3.18). Glissen’s capsule outlines the liver with an echogenic, defined border. The liver parenchyma is punc-tuated by a variety of vascular and biliary vessels that appear as anechoic linear structures. A detailed knowledge of the hepatic architecture is helpful, but not necessary because the FAST exam relies only on recognizing normal homogenous hepatic architecture from a disrupted or inhomogenous pat-tern of a traumatized liver.
The gallbladder is a round or oval cystic structure within the liver. It is located on the medial, inferior surface of the
Figure 3.17. Typical Transducer Positions used to evaluate Potential Spaces within the Peritoneal Cavity.
Figure 3.18. ultrasound image Demonstrating the Appearance of Normal Liver Tissue.
liver, and will commonly be seen during scanning of the perihepatic area if the transducer is angled anteriorly from Morison’s pouch (Fig. 3.19). It is not necessary to iden-tify the gallbladder during the FAST exam, although the gallbladder may be seen to float in free fluid and may be sonographically enhanced by surrounding fluid. As the gall-bladder is, itself, fluid filled, it is important to recognize the differences between fluid in the gallbladder and free intra-peritoneal fluid.
SpleenThe spleen is a solid organ with a homogenous cortex and echogenic capsule and hilum (Fig. 3.20). It has a medium-gray echotexture similar to that of the liver, but is smaller in size. The vessels within the parenchyma are less ap-parent than those in the liver. Since the spleen occupies a posterior-lateral location, it may be difficult to assess the entirety of the parenchyma using a single transducer loca-tion, and multiple planes may be needed to visualize the whole organ.
BowelThe bowel can have a number of different sonographic ap-pearances, depending upon its contents. Air within the lumen
Figure 3.19. Sonographic Appearance of the gallbladder while Scan-ning in the Perihepatic region.
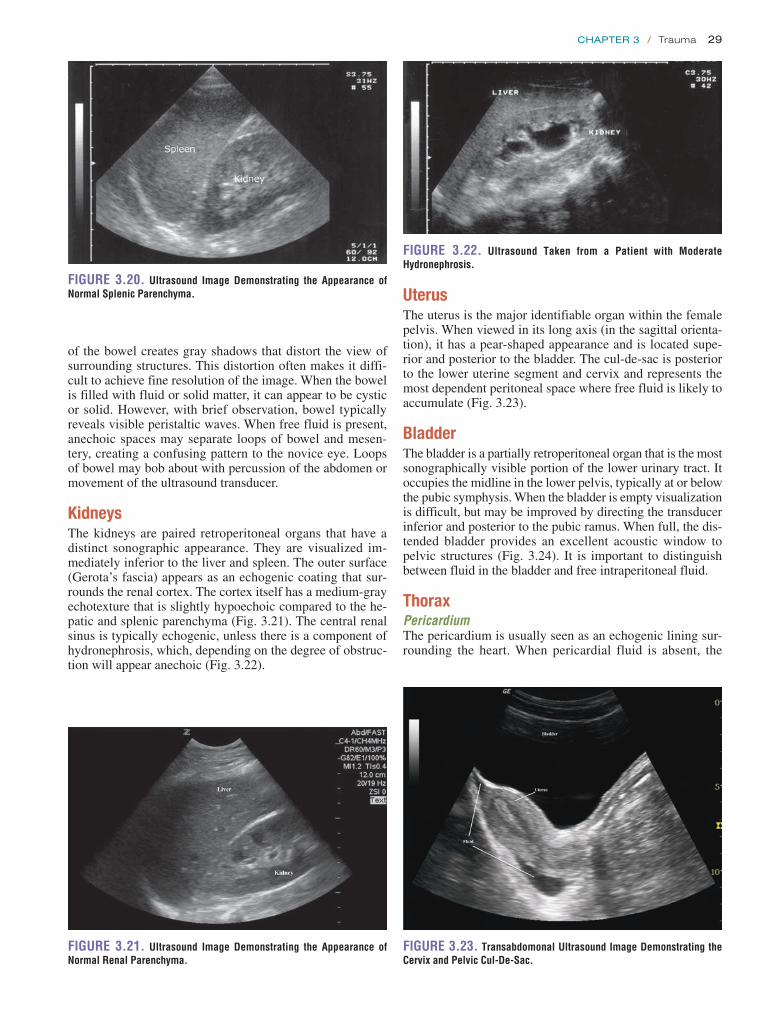
chapter 3 / Trauma 29
UterusThe uterus is the major identifiable organ within the female pelvis. When viewed in its long axis (in the sagittal orienta-tion), it has a pear-shaped appearance and is located supe-rior and posterior to the bladder. The cul-de-sac is posterior to the lower uterine segment and cervix and represents the most dependent peritoneal space where free fluid is likely to accumulate (Fig. 3.23).
BladderThe bladder is a partially retroperitoneal organ that is the most sonographically visible portion of the lower urinary tract. It occupies the midline in the lower pelvis, typically at or below the pubic symphysis. When the bladder is empty visualization is difficult, but may be improved by directing the transducer inferior and posterior to the pubic ramus. When full, the dis-tended bladder provides an excellent acoustic window to pelvic structures (Fig. 3.24). It is important to distinguish between fluid in the bladder and free intraperitoneal fluid.
ThoraxPericardiumThe pericardium is usually seen as an echogenic lining sur-rounding the heart. When pericardial fluid is absent, the
Figure 3.20. ultrasound image Demonstrating the Appearance of Normal Splenic Parenchyma.
Figure 3.21. ultrasound image Demonstrating the Appearance of Normal renal Parenchyma.
of the bowel creates gray shadows that distort the view of surrounding structures. This distortion often makes it diffi-cult to achieve fine resolution of the image. When the bowel is filled with fluid or solid matter, it can appear to be cystic or solid. However, with brief observation, bowel typically reveals visible peristaltic waves. When free fluid is present, anechoic spaces may separate loops of bowel and mesen-tery, creating a confusing pattern to the novice eye. Loops of bowel may bob about with percussion of the abdomen or movement of the ultrasound transducer.
KidneysThe kidneys are paired retroperitoneal organs that have a distinct sonographic appearance. They are visualized im-mediately inferior to the liver and spleen. The outer surface (Gerota’s fascia) appears as an echogenic coating that sur-rounds the renal cortex. The cortex itself has a medium-gray echotexture that is slightly hypoechoic compared to the he-patic and splenic parenchyma (Fig. 3.21). The central renal sinus is typically echogenic, unless there is a component of hydronephrosis, which, depending on the degree of obstruc-tion will appear anechoic (Fig. 3.22).
Figure 3.22. ultrasound Taken from a Patient with Moderate Hydronephrosis.
Figure 3.23. Transabdomonal ultrasound image Demonstrating the Cervix and Pelvic Cul-De-Sac.
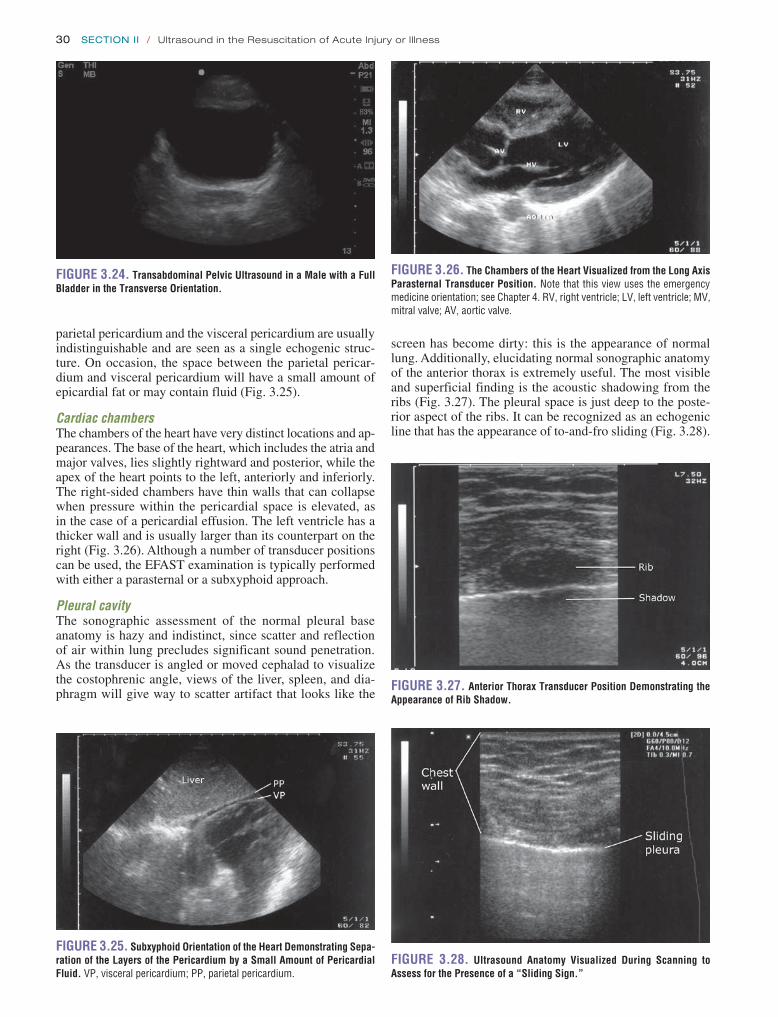
30 Section ii / Ultrasound in the Resuscitation of Acute Injury or Illness
Figure 3.28. ultrasound Anatomy Visualized During Scanning to Assess for the Presence of a “Sliding Sign.”
Figure 3.24. Transabdominal Pelvic ultrasound in a Male with a Full Bladder in the Transverse Orientation.
Figure 3.25. Subxyphoid Orientation of the Heart Demonstrating Sepa-ration of the Layers of the Pericardium by a Small Amount of Pericardial Fluid. VP, visceral pericardium; PP, parietal pericardium.
Figure 3.26. The Chambers of the Heart Visualized from the Long Axis Parasternal Transducer Position. Note that this view uses the emergency medicine orientation; see Chapter 4. RV, right ventricle; LV, left ventricle; MV, mitral valve; AV, aortic valve.
parietal pericardium and the visceral pericardium are usually indistinguishable and are seen as a single echogenic struc-ture. On occasion, the space between the parietal pericar-dium and visceral pericardium will have a small amount of epicardial fat or may contain fluid (Fig. 3.25).
Cardiac chambersThe chambers of the heart have very distinct locations and ap-pearances. The base of the heart, which includes the atria and major valves, lies slightly rightward and posterior, while the apex of the heart points to the left, anteriorly and inferiorly. The right-sided chambers have thin walls that can collapse when pressure within the pericardial space is elevated, as in the case of a pericardial effusion. The left ventricle has a thicker wall and is usually larger than its counterpart on the right (Fig. 3.26). Although a number of transducer positions can be used, the EFAST examination is typically performed with either a parasternal or a subxyphoid approach.
Pleural cavityThe sonographic assessment of the normal pleural base anatomy is hazy and indistinct, since scatter and reflection of air within lung precludes significant sound penetration. As the transducer is angled or moved cephalad to visualize the costophrenic angle, views of the liver, spleen, and dia-phragm will give way to scatter artifact that looks like the
screen has become dirty: this is the appearance of normal lung. Additionally, elucidating normal sonographic anatomy of the anterior thorax is extremely useful. The most visible and superficial finding is the acoustic shadowing from the ribs (Fig. 3.27). The pleural space is just deep to the poste-rior aspect of the ribs. It can be recognized as an echogenic line that has the appearance of to-and-fro sliding (Fig. 3.28).
Figure 3.27. Anterior Thorax Transducer Position Demonstrating the Appearance of rib Shadow.

chapter 3 / Trauma 31
model (27–30). In one study using DPL as a model for in-traperitoneal fluid, the mean volume detected in Morison’s pouch was 619 mL (standard deviation, 173 mL). Only 10% of the sonographers could detect fluid volumes of 400 mL or less, although most sonographers were novices and they were only allowed to visualize Morison’s pouch (28). Using a similar DPL model, another study assessed the minimum volume detected using the pelvic view (31). They determined that the average minimum detectable volume was 157 mL by one participant and 129 mL by an independent reviewer, thus suggesting that the pelvic view may be more sensitive than Morison’s pouch for small volumes of peritoneal fluid.
Patient positioning has also been studied as a factor in detecting peritoneal fluid. For instance, one study found that the optimal positions for detecting minimal volumes of fluid in a cadaver model were right lateral decubitus or facing downward while being supported on both hands and knees (1). Since neither of these positions is practical for scanning the trauma patient, other positioning has been investigated. For example, a small amount (5 degrees) of Trendelenburg positioning has been shown to increase the sensitivity for detecting peritoneal fluid in the right upper quadrant (32).
Finally, attempts have been made to correlate fluid mea-surements on ultrasound and scoring systems with intraperi-toneal fluid volumes. In a DPL model, a mean stripe width of 1.1 cm in Morison’s pouch was found after 1 L of saline had been instilled (29). Other studies predicted large volumes of peritoneal fluid based on fluid stripes (>2 mm wide), fluid in multiple locations, and a fluid score of three or greater, sug-gesting the need for therapeutic laparotomy (33,34).
Fluid flow patternsFluid in the peritoneal cavity can collect and spread in a pre-dictable manner, which can aid in its detection. One study found that in the supine position, the pelvis is the most de-pendent portion of the peritoneal cavity and the right para-colic gutter is the main communication between the upper and lower abdominal compartments (Fig. 3.30) (35). Mea-sured flow patterns have shown that fluid tracking up the
Figure 3.29. Peritoneal Fluid Visualized in the Perihepatic region.
This is termed lung sliding and it represents the absence of a pneumothorax because the visceral and parietal pleura are in contact, sliding past one another (Fig. 3.16B; VIDEO 3 .6). Another finding that supports the absence of pneumothorax are “comet tails” or “B-lines.” These linear artifacts arise from the moving pleural interface and spread to the edge of the screen (24). B-lines may be present or absent in nor-mal lung and are believed to correlate with interstitial fluid. Improved sensitivity for lung sliding may also be achieved by using power Doppler (25,26). Using the “power slide” technique, normal pleural approximation is easily noted by the presence of color signal enhancement at the pleura, in-dicating motion.
PATHOLOGYFree Peritoneal FluidFluid (blood) in the trauma patient is usually detected in the dependent areas of the peritoneal cavity, including the hepa-torenal space (Morison’s pouch), the perisplenic space, the pelvis, and the paracolic gutters. In general, free fluid appears anechoic (black) and is defined by the borders of the poten-tial spaces it occupies (Fig. 3.29). As an example, free fluid in Morison’s pouch will be bounded by Glisson’s capsule or the liver anterolaterally and Gerota’s fascia or the kidney posteromedially. There are a number of variables that affect the appearance and location of fluid within the peritoneal cavity. These include the site of origin of the bleeding, the rate of accumulation, time since the injury, and movement of fluid within the peritoneal cavity.
Minimum amount of fluidThe ability to detect free intraperitoneal fluid by ultrasound was first illustrated in a cadaver study in 1970 that demon-strated that as little as 100 cc of instilled peritoneal fluid was detectable by ultrasound when the body was placed in a hand-knee position and scanned from the abdomen (1). Ad-ditional studies have been done since, including one finding that as little as 10 mL of fluid could be consistently visual-ized in the pouch of Douglas (27). The minimal amount of fluid detected by ultrasound depends on a number of factors, most notably, the location of the fluid and the positioning of the patient. Most studies that have assessed the ability of ultrasound to detect minimal volumes of peritoneal fluid have focused on Morison’s pouch using a saline infusion
Pleural
Subphrenic
Subhepatic Lesser sac
Pelvic
Perinephric
Right paracolicgutter
Figure 3.30. Potential Spaces within the Torso where Fluid can Collect.

32 Section ii / Ultrasound in the Resuscitation of Acute Injury or Illness
A
B
Figure 3.34. examples of Peritoneal Fluid Visualized at the Tip of the Liver.
Figure 3.31. ultrasound Appearance of Free Fluid in Morison’s Pouch.
Figure 3.32. image of Fluid Visualized in the right Subdiaphragmatic space. SDF, subdiaphragmatic.
right paracolic gutter preferentially collects in Morison’s pouch before progressing to the right subphrenic space. In-terestingly, the phrenicocolic ligament restricts similar flow between the left paracolic gutter to the left upper quadrant, so fluid in the supramesocolic space actually spreads across the midline into the right upper quadrant. Clinical studies support these findings as the majority of peritoneal fluid col-lections are detected in the perihepatic region (20,36).
Perihepatic fluidFluid can accumulate and be found in a variety of perihe-patic locations. Most commonly it will be detected in the hepatorenal space or Morison’s pouch. While the echo-genicity may vary (depending on age and composition), free intraperitoneal fluid typically has well-defined edges that are bordered by Glisson’s capsule of the liver and Gerota’s fascia of the right kidney (Fig. 3.31). Fluid can also collect in the subphrenic space and will appear as a crescent-shaped anechoic collection that is bordered by the diaphragm superiorly and the liver inferiorly (Fig. 3.32; eFig. 3.1). Other less common areas where fluid may be de-tected are at the superior pole of the kidney in Morison’s pouch (Fig. 3.33; eFig. 3.2) or at the inferior margin of the liver (Fig. 3.34; eFig. 3.3; VIDEO 3 .7A).
Perisplenic fluidFree fluid in the left upper quadrant collects differently than in the perihepatic area, primarily because the phrenicocolic
A
B
Figure 3.33. examples of the Appearance of Peritoneal Fluid Collect-ing at the Superior Pole of the right Kidney.

chapter 3 / Trauma 33
Figure 3.35. Peritoneal Fluid Detected in the Left Subdiaphragmatic Space.
Figure 3.36. image of the Perisplenic Area with Fluid Visualized at the Tip of the Spleen.
Figure 3.37. ultrasound image of the Left upper Quadrant Demon-strating Fluid in the interface between the Spleen and Kidney.
ligament restricts fluid from filling the splenorenal inter-face. Consequently, fluid is most commonly detected in the subphrenic space and appears as a crescent-shaped fluid collection that is bordered superiorly by the diaphragm and inferiorly by the spleen (Fig. 3.35; VIDEO 3 .7B).
Alternatively, fluid may be seen at the inferior margin of the spleen (Fig. 3.36; eFig. 3.4). On rare occasions when large amounts of fluid are present, fluid can be found be-tween the spleen and the kidney (Fig. 3.37).
Pelvic fluidFree fluid in the pelvis has a variety of appearances, de-pending on patient gender and transducer orientation. In the transverse plane, fluid in a male pelvis can be seen in the retrovesicular space outlining the posterior wall of the bladder, but also may appear lateral to the bladder (Fig. 3.38; eFig. 3.5). In the transverse orientation of the female pel-vis, fluid will collect posterior to the uterus (Fig. 3.39) or, if enough fluid is present, between the body of the uterus and the bladder. When viewing the pelvis in the sagittal orienta-tion, fluid will collect in the same places as in the transverse orientation, but it will appear differently. For instance, in the male pelvis, the fluid will collect posterior and superior to
the bladder between the dome of the bladder and the bowel wall (Fig. 3.40; eFig. 3.6). It has a similar appearance in the female patient, except that it collects in the space between the uterus and bowel, and in significant volumes, may even extend anterior to the uterus (Fig. 3.41; eFig 3.7). As with all scanning applications, both transverse and sagittal planes are critical to fully evaluate the pelvis for fluid, as there are many imaging artifacts and confusing structures that can confound the examination.
A
B
Figure 3.38. Sonographic Appearance of Fluid Collecting Posterior to the Bladder in Male Patients with the Transducer in the Transverse Orientation.

34 Section ii / Ultrasound in the Resuscitation of Acute Injury or Illness
Figure 3.39. ultrasound image of Free Fluid Located Posterior and Lateral to the Bladder and Posterior to the uterus with the Transducer in the Axial Orientation.
A
B
Figure 3.40. Sagittal Orientation of Male Pelvis Demonstrating Fluid at the Superior Aspect of the Bladder.
C
Paracolic gutter fluidFluid in the paracolic gutter has a specific appearance as it forms a sharp-edged border around loops of bowel in the area (Fig. 3.42; eFig. 3.8). The fluid pockets will vary in size, and the space between loops of bowel will change with peristalsis. Bowel may appear to float within the free fluid ( VIDEO 3 .8).
Echogenic hemorrhage and clotMost fresh peritoneal hemorrhage will appear anechoic; however, as clot forms and organizes, it becomes more echogenic. Clotted blood can be echogenic or have a mid-level echo pattern that has some sonographic similarities to tissue, such as the spleen or liver parenchyma (Fig. 3.43). Collections of clotted blood can be found in patients with long transport times or large volumes of peritoneal bleeding. The ability to differentiate clotted peritoneal blood from nor-mal parenchyma can at times be difficult, but in most cases, thorough inspection of the area in question will demonstrate that an anechoic stripe, representing free peritoneal fluid, borders the clotted blood (Fig 3.44).
Pericardial EffusionHemorrhage can accumulate quickly in the potential space between the visceral and parietal pericardium and create hypotension due to a cascade of increasing intrapericar-dial pressure, leading to impairment of right heart filling and subsequently left heart filling, followed by decreased left ventricular stroke volume. Fluid in the pericardial space may appear as an anechoic stripe that conforms to the outline of the cardiac structures. In many cases, the fluid will have the same anechoic character as blood within the cardiac chambers. From the subxyphoid orientation, fluid will initially be seen between the right side of the heart and the liver, which is the most dependent area visualized (Fig. 3.45). In the parasternal orientation, fluid will initially be seen posteriorly as it outlines the free wall of the left atria and ventricle, but may also be seen anterior to the right ventricle, particularly in cases of circumferential effusion
(Fig. 3.46). The descending aorta is an important landmark for differentiating pericardial from pleural effusions. Peri-cardial fluid collects anterior to the descending aorta, while pleural fluid will be seen posterior to this level (Fig. 3.47; eFig. 3.9; VIDEO 3 .9).
Circumferential effusionVarious methods have been suggested for quantify-ing pericardial effusions by ultrasound. One of the most straightforward methods is to determine whether the effusion is circumferential. Those that are circumfer-ential or >2 cm in width are considered large, whereas

chapter 3 / Trauma 35
A
B
Figure 3.41. Sagittal Orientation of Female Pelvis Demonstrating Fluid at the Superior Aspect of the Bladder and uterus.
A
B
Figure 3.42. Paracolic gutter ultrasound images with Fluid Outlining Loops of Bowel.
Figure 3.43. Perihepatic View with Clotted Blood Visualized between the Liver and the Kidney. Note the similar echo pattern between the clotted blood and the liver tissue.
noncircumferential effusions between 1 and 2 cm are con-sidered moderate (Fig. 3.48) (37,38). It is important to note that even small pericardial effusions can cause tamponade, so quantifying the amount of fluid within the pericardial space is secondary to assessing the patient’s hemodynamic status.
Echogenic effusionsEffusions that are echogenic present a diagnostic challenge. Echogenic effusions may occur if blood clots are present, but may be due to preexisting pathology such as infection (pus), inflammation (fibrinous material), or malignancy. Instead of an anechoic appearance to the effusion, the fluid may have a similar echogenic character to surrounding structures such as the liver or ventricular tissue (Fig. 3.49A, B; eFig. 3.10). This isoechoic character can make the assessment for pericardial effusion challenging.
Cardiac tamponadeAfter determining that a pericardial effusion is present, the next step is to determine whether there is sonographic evidence of cardiac tamponade. The pathophysiology of tamponade is characterized by increasing pericardial pressure that eventually exceeds atrial and ventricular pressures, thus inhibiting cardiac filling. As pericardial pressure increases, there is sequential collapse of the right
atrium and subsequently the right ventricle, which mani-fests as impaired relaxation during diastole (Fig. 3.50;
VIDEO 3 .10). Although the right atrial collapse occurs sooner than right ventricular collapse, this finding is less

36 Section ii / Ultrasound in the Resuscitation of Acute Injury or Illness
Figure 3.44. A Positive Morison’s Pouch View with Free Fluid Outlin-ing Clotted Blood.
Figure 3.45. ultrasound image Taken from the Subxyphoid Transducer Position Demonstrating Fluid in the Pericardial Space.
Figure 3.46. Parasternal Long Axis View of the Heart Showing Fluid in the Pericardial Space.
Figure 3.47. ultrasound image Demonstrating Pericardial and Pleural effusions from the Long Axis Parasternal Transducer Position. Note that the descending aorta is the structure that delineates pericardial from pleural fluid. RV, right ventricle; LV, left ventricle; LA, left atrium.
Figure 3.48. ultrasound image Demonstrating a Circumferential Peri-cardial effusion Viewed from the Subxyphoid transducer position.
inferior vena cava (IVC) that does not change in diameter during the respiratory cycle suggests elevated central venous pressure (CVP) and is supportive of tamponade physiology (Fig. 3.51A–C; VIDEO 3 .11).
Pleural AbnormalitiesPleural fluidThe sonographic appearance of hemothorax is a fluid col-lection localized to the costophrenic angle between the visceral and parietal pleura. This collection can appear an-echoic, isoechoic, or echogenic, depending on whether clot-ting has occurred (eFig. 3.11; VIDEO 3 .12). While it is imperative to visualize the diaphragm in order to be assured that the fluid is contained within the pleural cavity, other structures will frequently be seen, such as the lung. When a pleural effusion is present, lung tissue appears as a tri-angular structure superior to the diaphragm that may ex-hibit wave-like movement, as if floating within the fluid (Fig. 3.52; eFig. 3.12).
specific for diagnosing tamponade (39). Another potentially helpful sonographic finding is flattening or bowing of the interventricular septum toward the left ventricle. This late finding is very specific for tamponade (40). Finally, a dilated

chapter 3 / Trauma 37
Figure 3.49. images Demonstrating Clotted Hemopericardium.
A
B
Figure 3.50. Long Axis Parasternal ultrasound image Demonstrating Collapse of the right Ventricle in a Patient with Cardiac Tamponade.
PneumothoraxThe ultrasound diagnosis of pneumothorax is made by con-firming the absence of normal findings. Therefore, the pres-ence of normal findings is compelling evidence against the diagnosis of pneumothorax. Accordingly, the value of the ul-trasound for the evaluation of pneumothorax is in its negative predictive value, which may be as high as 100% (41). If the lung sliding, comet tail artifact (“B lines”), or the power slide
A
B
C
Figure 3.51. A: Image taken of a patient with a moderate-sized pericar-dial effusion. Note how the vena cava collapses with respiration. B: Image taken of another patient with a moderate sized pericardial effusion. In this case, note how there is no evidence of collapse of the vena cava with res-piration. This patient had cardiac tamponade. C: M-mode ultrasound image demonstrating minimal respiratory variation of the IVC diameter in a patient with a large pericardial effusion, concerning for tamponade physiology.
sign are present, the diagnosis of pneumothorax is essentially excluded at that location. The seashore sign is a finding on M-mode ultrasound that also supports the absence of pneu-mothorax (Fig. 3.53; VIDEO 3 .13). The “seashore” is a

38 Section ii / Ultrasound in the Resuscitation of Acute Injury or Illness
Figure 3.55. Lung Point is the Transition Point Where Normal Pleu-ral Sliding Meets an Area Without Lung Sliding or B-lines. This finding is difficult to demonstrate on a still image and is depicted more clearly in
VIDEO 3 .16.
A
B
Figure 3.52. ultrasound images Demonstrating Fluid in the Costro-phrenic Angle and the Triangular Appearance of Lung Tissue.
Figure 3.53. M-Mode image Demonstrating the “Seashore Sign” which Supports the Absence of Pneumothorax at this Location.
Figure 3.54. M-Mode image Demonstrating the “Stratosphere Sign” in which the “Seashore” is Absent, which Supports the Diagnosis of Pneu-mothorax at this Location.
result of pleural sliding, and probably does not increase the accuracy of diagnosis, but rather serves as an alternate way to assess for and document the sliding side. When sliding is ab-sent, as in a pneumothorax, the stratosphere sign is observed (Fig. 3.54; VIDEO 3 .14). Absence of pleural sliding, B lines, and power slide ( VIDEO 3 .15) while suggestive of pneumothorax, is not highly specific for the diagnosis as other abnormalities (pulmonary blebs, adhesions, etc) may eliminate these normal artifacts. The finding of a lung point,
however, is highly specific for pneumothorax (24,42). Lung point is the location where pneumothorax meets normally ap-posed pleura. The transition point can be seen where normal pleural sliding meets an area without lung sliding or B-lines (Fig. 3.55; VIDEO 3 .16). Ultrasound can also be utilized to estimate the size of a pneumothorax. Smaller pneumothoraces tend to occupy the anterior chest in a supine patient, whereas larger pneumothoraces occupy lateral and even posterior ar-eas. Therefore, the absence of normal lung sliding, comet tails, and power slide in the anterior, lateral, and posterior thorax correlates with a large pneumothorax (43).
Solid Organ InjuryThe sonographic appearance of specific organ injury varies. The ultrasound appearance of parenchymal damage in the liver can appear as anechoic or echogenic distortion of the normal architecture (Fig. 3.56; eFig. 3.13), and manifesta-tions of injury can include subcapsular fluid collections and intraperitoneal fluid (44–48). The most common pattern of parenchymal liver injury identified by ultrasonography in

chapter 3 / Trauma 39
Figure 3.57. Liver injury Manifesting Sonographically as a Hyper-echoic Lesion within the Parenchyma.
A
Figure 3.56. example of Liver injuries Visualized as a Distortion of the Normal Tissue Anatomy.
B
A
B
Figure 3.58. injury Seen by ultrasound as a Heterogeneous Appear-ance to the Splenic Tissue.
patients with blunt abdominal trauma is a discrete region of increased echoes followed by a diffuse hyperechoic pattern (Fig. 3.57; eFig. 3.14).
Spleen injuries, much like liver injuries, can have a va-riety of appearances. The most sensitive finding is either hemoperitoneum or a subcapsular fluid collection, whereas the most specific finding is an alteration in the normal ho-mogenous architecture of the parenchyma (49–51). Sono-graphic patterns of splenic parenchymal injury include (most commonly) a diffuse heterogeneous appearance (Fig. 3.58; eFig. 3.15), hyperechoic and hypoechoic splenic crescents (Fig. 3.59; eFig. 3.16), and discrete hyperechoic or hy-poechoic regions within the spleen.
A
B
Figure 3.59. ultrasound images of Splenic injuries Seen as Hypoechoic Crescent-Shaped Lesions.

40 Section ii / Ultrasound in the Resuscitation of Acute Injury or Illness
Figure 3.60. ultrasound image of Hemoperitoneum in Morison’s Pouch. The gain is set too high, making the fluid difficult to discern.
Data on the accuracy of bedside ultrasound for solid organ injury detection by emergency physicians is limited (52). In general, the sensitivity reported in the literature is variable, but may improve with high-grade solid organ injury (48,50), repeat examinations (53) and user experience (54). Recent developments in contrast enhanced ultrasound for solid organ injury show highly encouraging results that approach the performance of computed tomography and offer promise for the future (55–57).
ARTIFACTS AND PITFALLSGeneral IssuesA variety of conditions create particular challenges for ultra-sound in the trauma patient.
1. Obese patients can be difficult scanning subjects. Adi-pose tissue increases the distance from transducer to the target structure and impedes ultrasound, thereby limiting resolution. In addition, fat that collects in and around organs can distort normal anatomy.
2. Subcutaneous emphysema is problematic for scanning. Just as air in the lung or bowel distorts the ultrasound signal due to scatter, air in the subcutaneous tissue pre-vents or limits the usefulness of ultrasound imaging. On the other hand, subcutaneous emphysema in the trauma patient can be a useful finding suggestive of traumatic injury to the lungs or gastrointestinal tract.
3. Prior surgery with accompanying adhesions can af-fect how fluid will collect and move within the perito-neal cavity. As a result, fluid may be seen in different areas than those scanned during the standard FAST examination. Particular attention should be paid to the examination performed on patients with evidence of prior abdominal surgery. If the suspicion for injury is high and the ultrasound is negative for fluid, CT scan-ning is recommended.
4. Pleural blebs and prior pleurodesis can eliminate lung sliding at that site and may result in false-positives for pneumothorax.
Types of fluidUltrasound is extremely sensitive for detecting peritoneal fluid, but it does not discriminate between types of fluid,
that is, blood versus ascites, succus entericus, or urine. The following are types of fluid that may cause false-positive ul-trasound examinations.
1. Preexisting ascites is the main diagnostic pitfall in the evaluation of trauma patients with free peritoneal fluid. Clues to this condition include physical stigmata of liver disease such as caput medusa, spider angiomas, or jaundice; past medical history for liver disease; or sono-graphic findings such as a small, contracted, nodular, or echogenic liver (eFig. 3.17).
2. Hollow viscus injuries are another etiology of positive ultrasound exams. Examples include bowel, gallbladder, and intraperitoneal bladder rupture. While these may be considered false-positive exams for hemoperitoneum, in fact, each requires some form of operative intervention and, therefore, in the authors’ opinion, should be consid-ered true-positive exams.
3. Fluid contained within a hollow viscus also may be mistaken for pathologic intraperitoneal fluid. Important distinguishing features are familiarity that free fluid in general has sharp edges, while fluid within a viscus has a rounded border.
Examination qualityWhile many pathologic findings of the trauma ultrasound examination are straightforward and easy to detect, a poor-quality study can obscure even the most obvious abnormali-ties. The following are some of the technical factors that can affect the quality of the trauma ultrasound examination.
1. Too much overall gain creates artifact and may obscure the presence of anechoic fluid (Fig. 3.60).
2. “Static imaging,” or failing to scan through the full extent of an anatomical area, is a frequent error that limits the examination. At any one moment, ultrasound only provides a two-dimensional image. However, a three-dimensional view can be created by gently rock-ing and maneuvering the transducer to view multiple planes through an anatomical space. Each potential space should be interrogated with biplanar views and frequent angling of the transducer. Static imaging limits the view, minimizes the amount of information gained from the scan, and can miss small fluid collections (Fig. 3.61).
Figure 3.59. (continued)
C
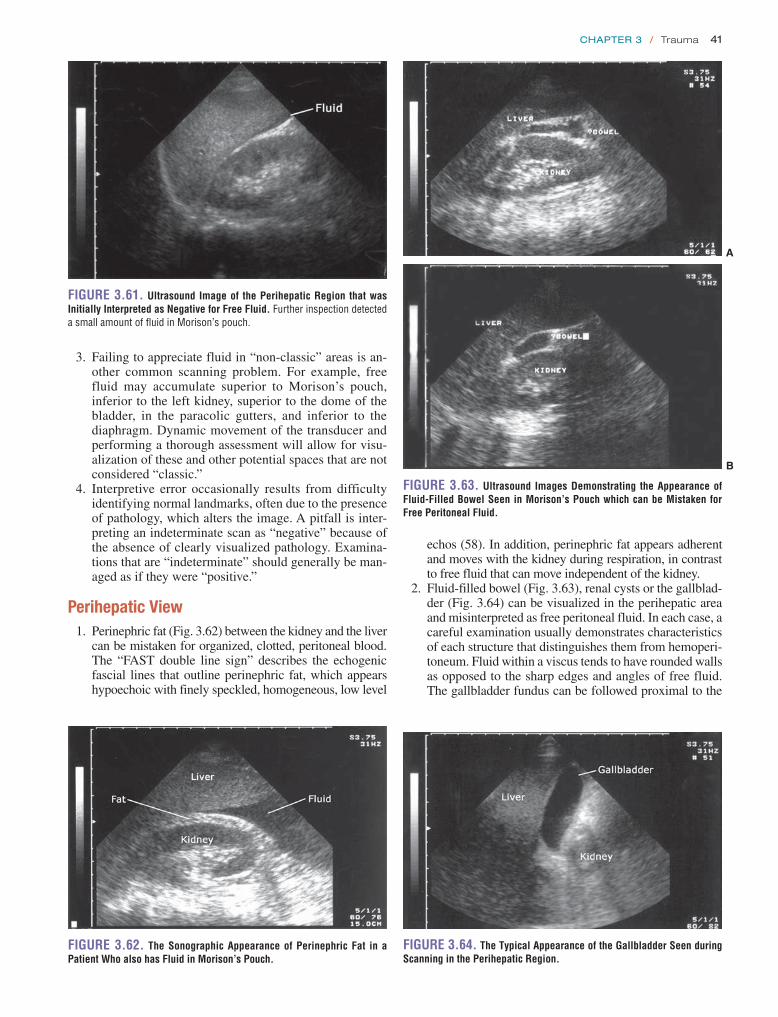
chapter 3 / Trauma 41
echos (58). In addition, perinephric fat appears adherent and moves with the kidney during respiration, in contrast to free fluid that can move independent of the kidney.
2. Fluid-filled bowel (Fig. 3.63), renal cysts or the gallblad-der (Fig. 3.64) can be visualized in the perihepatic area and misinterpreted as free peritoneal fluid. In each case, a careful examination usually demonstrates characteristics of each structure that distinguishes them from hemoperi-toneum. Fluid within a viscus tends to have rounded walls as opposed to the sharp edges and angles of free fluid. The gallbladder fundus can be followed proximal to the
Figure 3.61. ultrasound image of the Perihepatic region that was initially interpreted as Negative for Free Fluid. Further inspection detected a small amount of fluid in Morison’s pouch.
3. Failing to appreciate fluid in “non-classic” areas is an-other common scanning problem. For example, free fluid may accumulate superior to Morison’s pouch, inferior to the left kidney, superior to the dome of the bladder, in the paracolic gutters, and inferior to the diaphragm. Dynamic movement of the transducer and performing a thorough assessment will allow for visu-alization of these and other potential spaces that are not considered “classic.”
4. Interpretive error occasionally results from difficulty identifying normal landmarks, often due to the presence of pathology, which alters the image. A pitfall is inter-preting an indeterminate scan as “negative” because of the absence of clearly visualized pathology. Examina-tions that are “indeterminate” should generally be man-aged as if they were “positive.”
Perihepatic View 1. Perinephric fat (Fig. 3.62) between the kidney and the liver
can be mistaken for organized, clotted, peritoneal blood. The “FAST double line sign” describes the echogenic fascial lines that outline perinephric fat, which appears hypoechoic with finely speckled, homogeneous, low level
Figure 3.62. The Sonographic Appearance of Perinephric Fat in a Patient Who also has Fluid in Morison’s Pouch.
A
B
Figure 3.63. ultrasound images Demonstrating the Appearance of Fluid-Filled Bowel Seen in Morison’s Pouch which can be Mistaken for Free Peritoneal Fluid.
Figure 3.64. The Typical Appearance of the gallbladder Seen during Scanning in the Perihepatic region.

42 Section ii / Ultrasound in the Resuscitation of Acute Injury or Illness
Figure 3.66. ultrasound image of a Fluid and Food-Filled Stomach Seen in the Left upper Quadrant.
Figure 3.67. A View of the Perisplenic region that illustrates the Close Proximity of the Spleen and Stomach.
A
Figure 3.65. A: Ultrasound image of retroperitoneal and intraperitoneal hemorrhage that outlines Gerota’s fascia. B: Renal parenchymal injury seen as disruption of the normal renal architecture and subcapsular fluid.
B
gallbladder neck, which leads to the portal triad. Fluid-filled bowel is an uncommon finding of the FAST exam (59). It can usually be distinguished by an echogenic wall bounding the lateral aspects of the fluid. As well, there will typically be several discrete, echogenic lines that appear to originate from and run perpendicular to the echogenic wall. These structures represent the valvulae conniventes or haustral sacculations of the bowel (60).
3. Retroperitoneal hemorrhage from a renal parenchyma laceration may initially appear as fluid within Morison’s pouch. A more detailed examination will demonstrate that the anechoic fluid collection is deep to the echo-genic line of Gerota’s fascia (Fig. 3.65A). The fluid may also form an anechoic rim surrounding the kidney, or the architecture of the kidney may be distorted (Fig. 3.65B; eFig. 3.18).
4. Clotted blood in Morison’s pouch can have a similar echogenic appearance to the liver parenchyma and there-fore can be challenging to assess (Fig. 3.43). In most cases there will be a rim of anechoic fluid outlining the clotted blood and the absence of an echogenic line ad-jacent to the liver that helps discern the presence of a pathologic condition (Fig. 3.44).
Perisplenic View 1. The most challenging aspect of scanning the left upper
quadrant is obtaining adequate views. Not only does the spleen offer a much smaller acoustic window than the liver, but it is also more posterior and superior. If an
acceptable image of the perisplenic area is not obtained, it is usually because the transducer is not cephalad and posterior enough.
2. Another common error is assuming that fluid in the left upper quadrant collects in a manner similar to the right upper quadrant. The phrenicocolic ligament restricts the amount of fluid that will collect in the splenorenal space, so the focus of the exam should be directed to-wards the subdiaphragmatic area and the caudal margin of the spleen.
3. The stomach is commonly visualized and may confuse the exam of the perisplenic area. It has a variable so-nographic appearance, depending on its contents. If the stomach contains fluid, it may appear anechoic. If it contains mostly air and food particles, it may appear echogenic (Fig. 3.66). When seen, it almost appears con-tiguous with the spleen (Fig. 3.67), but angling the trans-ducer slightly posterior will usually remove it from view.
Pelvic View 1. A common mistake is assuming that free fluid will col-
lect posterior to the bladder (male) or uterus (female) be-cause these are the most dependent areas. Free fluid in the pelvis actually may be apparent superior to the bladder in the sagittal view (Fig. 3.68A) or lateral to the bladder in the axial view (Fig. 3.68B; VIDEO 3 .17A, B).
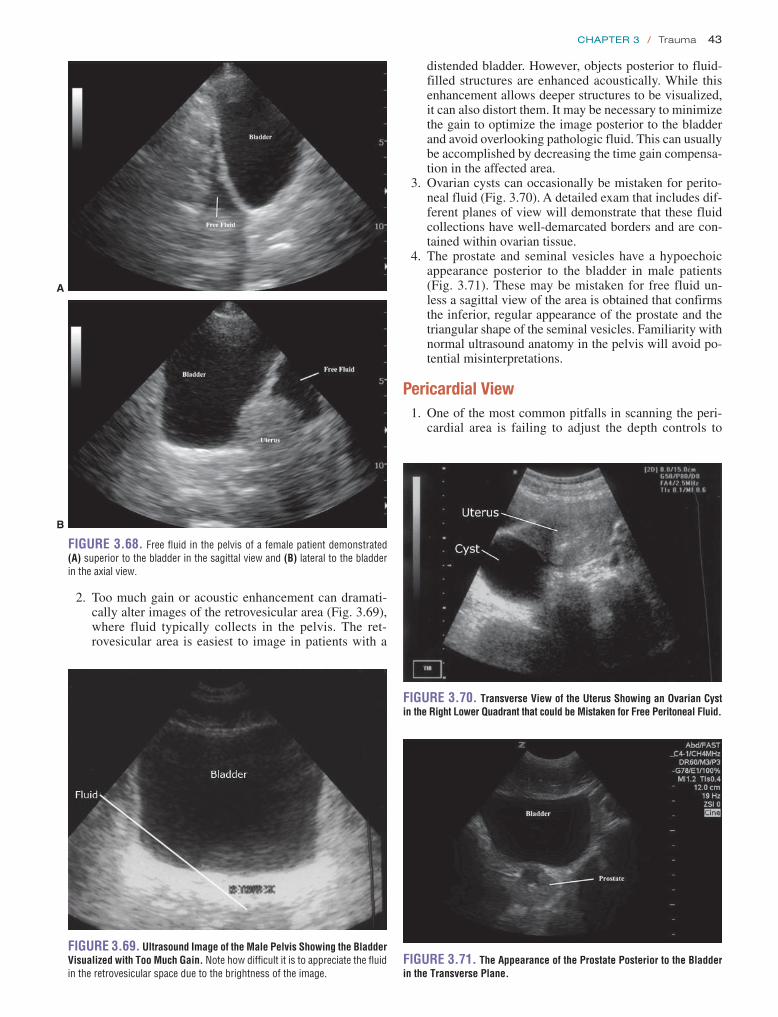
chapter 3 / Trauma 43
2. Too much gain or acoustic enhancement can dramati-cally alter images of the retrovesicular area (Fig. 3.69), where fluid typically collects in the pelvis. The ret-rovesicular area is easiest to image in patients with a
Figure 3.68. Free fluid in the pelvis of a female patient demonstrated (A) superior to the bladder in the sagittal view and (B) lateral to the bladder in the axial view.
A
B
Figure 3.69. ultrasound image of the Male Pelvis Showing the Bladder Visualized with Too Much gain. Note how difficult it is to appreciate the fluid in the retrovesicular space due to the brightness of the image.
distended bladder. However, objects posterior to fluid-filled structures are enhanced acoustically. While this enhancement allows deeper structures to be visualized, it can also distort them. It may be necessary to minimize the gain to optimize the image posterior to the bladder and avoid overlooking pathologic fluid. This can usually be accomplished by decreasing the time gain compensa-tion in the affected area.
3. Ovarian cysts can occasionally be mistaken for perito-neal fluid (Fig. 3.70). A detailed exam that includes dif-ferent planes of view will demonstrate that these fluid collections have well-demarcated borders and are con-tained within ovarian tissue.
4. The prostate and seminal vesicles have a hypoechoic appearance posterior to the bladder in male patients (Fig. 3.71). These may be mistaken for free fluid un-less a sagittal view of the area is obtained that confirms the inferior, regular appearance of the prostate and the triangular shape of the seminal vesicles. Familiarity with normal ultrasound anatomy in the pelvis will avoid po-tential misinterpretations.
Pericardial View 1. One of the most common pitfalls in scanning the peri-
cardial area is failing to adjust the depth controls to
Figure 3.70. Transverse View of the uterus Showing an Ovarian Cyst in the right Lower Quadrant that could be Mistaken for Free Peritoneal Fluid.
Figure 3.71. The Appearance of the Prostate Posterior to the Bladder in the Transverse Plane.

44 Section ii / Ultrasound in the Resuscitation of Acute Injury or Illness
adequately visualize deep structures. Without optimal depth adjustment, scans may fail to visualize all the car-diac structures and miss posterior pericardial effusions.
2. A pleural effusion, especially on the left side, may mimic a pericardial effusion. The parasternal long-axis view is the best approach to conclusively differentiate pericardial from pleural fluid. Using this transducer position, the descending aorta is viewed in transverse orientation posterior to the heart. Fluid in the pleural space is localized posterior to the descending aorta, whereas pericardial fluid will collect between the pos-terior wall of the left ventricle and the descending aorta (Fig. 3.47) (61).
3. Occasionally, large amounts of perihepatic fluid can be mistaken for a pericardial effusion when imaged from the subxyphoid transducer position. This can be dis-tinguished from a pericardial effusion by an echogenic band (pericardium) that is between the echo-free space and the free wall of the right ventricle. Additionally, peri-hepatic fluid collections will conform to Glisson’s cap-sule, whereas a pericardial effusion will conform to the rounded aspect of the pericardium adjacent to the apex of the heart (Fig. 3.72).
4. Epicardial fat appears as an echo-free space anterior to the heart that can be as wide as 15 mm (Fig. 3.73). This space will generally narrow toward the apex of the heart, whereas an echo–free space caused by a pericardial ef-fusion tends to be broader near the left ventricular apex than near its base. Additionally, although epicardial fat appears grossly as an echo-free space, there will usually be scattered, soft, isolated reflections adhering to and moving with the myocardium.
Thoracic Views 1. Patient positioning typically influences the location of
the pneumothorax. An upright evaluation of the anterior chest may miss a pneumothorax that rises to the apical thorax.
2. A small or loculated pneumothorax can be overlooked with a cursory evaluation of the chest.
3. Pleural adhesions or pulmonary blebs may result in loss of normal pleural sliding, mimicking a pneumothorax.
4. Subcutaneous emphysema associated with a pneumo-thorax will create scatter, characteristic of air, which
Figure 3.72. ultrasound image Demonstrating the Appearance of Peri-toneal Fluid Seen from the Subxyphoid Transducer Position.
Figure 3.73. Subxyphoid Orientation with epicardial Fat Visualized between the Free Wall of the right Ventricle and the Liver.
may mimic the appearance of lung tissue. Visualization of normal rib and pleural anatomy will often be im-paired, however, by subcutaneous emphysema.
5. The cardiac notch represents a reflection of the pleura around the heart. This can give the impression of a loss of normal lung sliding, which could be falsely inter-preted as pneumothorax.
6. Loss of ventilation abolishes lung sliding in cases of breath holding, paralysis prior to intubation, or incor-rect placement of an endotracheal tube (esophageal or right main stem intubation). This loss of sliding can be distinguished from a pneumothorax by the finding of a lung pulse. Lung pulse is the rhythmic, pulsatile ap-pearance at the pleural interface resulting from heartbeat reverberations. It is a normal finding and will be present when pneumothorax is absent, regardless of the ventila-tory status of the lung.
7. Pleural fluid detected during trauma ultrasound should be interpreted in the clinical context of the effusion, as pre-existing effusions may be present due to medical conditions.
USE OF THE IMAGE IN MEDICAL DECISION MAKINGThe most practical and significant use of ultrasound in all trauma patients is the rapid identification of the source of hypotension and detection of immediate life-threatening in-juries, including hemoperitoneum, hemopneumothorax, and pericardial effusion. In the setting of hypotension and trauma, ultrasound may help identify patients who need immediate surgical intervention, bypassing all other diagnostic proce-dures. In the setting of mass casualties, ultrasound can help prioritize operative intervention and direct the use of limited resources to those most in need of immediate definitive care. In rural areas and settings remote from trauma centers, ultra-sound can help rapidly identify victims who should be moved to higher levels of care. In some cases, ultrasound alone may be sufficient to triage patients to the operating room, while in others, ultrasound will be used in conjunction with CT and DPL. Thus the use of ultrasound in decision making depends upon the stability of the patient, the nature of the trauma, the number of patients undergoing simultaneous evaluation, the

chapter 3 / Trauma 45
resources and level of care available at the hospital, the qual-ity of the ultrasound images obtained, and the comfort level of the sonologist with interpreting the examination.
Blunt TraumaThe FAST exam is best known for its role in the detection of free fluid in patients with blunt abdominal trauma, although with the EFAST examination, evaluation for hemopneumothorax is highly useful and accurate. General guidelines for how ultra-sound impacts immediate, bedside decisions follow (Fig. 3.74).
Peritoneal free fluid in the unstable patientThe finding of free peritoneal fluid in the unstable trauma-tized patient suggests the findings of intraperitoneal injury necessitating immediate operative intervention. The deci-sion to operate will depend on the patient’s other injuries, the amount and location of free peritoneal fluid, and whether the vital signs stabilize after resuscitation. Large peritoneal fluid collections associated with unstable vital signs usually require laparotomy (34,62–64).
Peritoneal free fluid in the stable patientA patient with stable vital signs, but an ultrasound that dem-onstrates peritoneal fluid is a candidate for nonoperative management. Therefore, regardless of whether any other ultrasound findings such as specific organ injury are pres-ent, a CT of the abdomen and pelvis should be performed. This form of management utilizes the strength of the CT scan for determining the source of hemoperitoneum; thus, it can usually differentiate between lesions that are operable versus those that can be managed nonoperatively. Recently, studies on fluid scoring systems have suggested that the estimated volume of fluid present may be useful in predicting the need for therapeutic laparotomy with a good but not excellent de-gree of accuracy (34,62,63).
YesNoYes
Blunt abdominal trauma
Four-view Trauma Ultrasound
Positive for free fluid Negative for free fluid
Hemodynamicallystable
Hemodynamicallystable
Hemodynamicallystable
Asses for othersources of
bleeding DPL λ
ORCT Follow clinically:
-Repeat exam-Serial US
Indeterminate(consider
Trendelenburg)
No
CT ^
Yes
Legends: ^ Serial ultrasounds may show fluid.λ May repeat ultrasound prior to performing DPL.CT = Abdominal/pelvic CT scan,OR = Exploratory laparotomy, DPL 5 Diagnostic peritoneal lavage.
Figure 3.74. Algorithm for the evaluation of Blunt Abdominal Trauma using ultrasound.
No free fluid in the unstable patientUltrasound is highly sensitive for hemoperitoneum in the hypotensive patient (63,65–68). However, the patient with unstable vital signs and a negative ultrasound remains prob-lematic, since hemoperitoneum remains a lethal, albeit re-mote, possibility. While a negative ultrasound suggests that the source of hypotension is outside the peritoneum, false negative examinations can occur (18). A few options exist for this diagnostic dilemma. Some have suggested a repeat ultrasound, potentially by a more experienced operator (69). Others opt for an immediate DPL, which may be more sensi-tive than ultrasound. Ultimately, a thorough FAST by an ex-perienced provider should rule out an intraabdominal source of hypotension in most cases. It is important to remain vigi-lant for extraperitoneal causes such as retroperitoneal hem-orrhage from pelvic fracture, bleeding from a long bones, thoracic injury, or neurogenic shock.
No free fluid in the stable patientThe finding of no free fluid in a hemodynamically stable patient does not “clear” that patient of injury or free fluid (18,68,70–72). Patients may still have encapsulated solid organ injury, mesenteric or bowel injury, retroperitoneal hemorrhage, delayed or minimal intraperitoneal bleeding. Patients who are at higher risk of missed free fluid may be those with severe head injuries and non-severe abdominal in-juries. Other studies have suggested an association between missed free fluid and kidney injury, fractures of the lower ribs, lumbar spine, or pelvis, (71,73,74). Prior to discharge, every patient should have a repeat clinical exam, and any new findings of abdominal pain, tenderness, distracting injury, or laboratory abnormalities should prompt consideration for further diagnostic evaluation. Management of the patient will be influenced largely by the mechanism of trauma, suspicion of occult injury, and the presence of other injuries.

46 Section ii / Ultrasound in the Resuscitation of Acute Injury or Illness
Penetrating TraumaPatients with penetrating trauma confront physicians with many of the same diagnostic dilemmas as in blunt trauma: the need to make a diagnosis is imperative, but the diagnostic options are sometimes limited. The utility of ultrasound in this setting should not be underestimated.
AbdomenTrauma patients with isolated penetrating abdominal wounds who have an obvious indication for laparotomy (eviscerated bowel or peritonitis) do not need an ultrasound, although a positive ultrasound exam is very specific for injury (80,81). The role of a positive FAST in a stable patient is debated. While it is highly specific for injury and may allow reduction in CT and DPL, it cannot be relied upon to absolutely predict a therapeutic laparotomy, and some providers may elect to perform CT (81–85). A negative FAST cannot exclude sig-nificant injury. For example, a patient with a stab wound and a negative ultrasound exam can have significant mesenteric or bowel injury. However, in patients with multiple penetrating wounds, the sonographic evaluation of the peritoneum and pericardium can direct the operative approach to the chest, abdomen, or both. As well, the presence or absence of hemo-pericardium and hemopneumothorax from obvious or even innocuous-appearing wounds to the chest or epigastrium can be assessed with sonographic evaluation of the chest. As in blunt abdominal trauma, ultrasound can also estimate the amount of free fluid and potential for sudden deterioration.
Indeterminate findingsAn “indeterminate” interpretation is appropriate when impor-tant structures are incompletely visualized. Anatomic defects (pectus excavatum), acquired pathology (open wounds, sub-cutaneous air), difficult habitus (obesity), and poor acoustic windows (evacuated bladder) are situations that may result in an indeterminate ultrasound examination (75). The safe approach is generally to manage indeterminate examinations as if they were positive. These patients may require further diagnostic evaluation.
Pericardial effusionTransthoracic cardiac ultrasound can detect pericardial effu-sion associated with blunt cardiac rupture (76–78). Patients with a pericardial effusion should be evaluated for cardiac tamponade, which includes both a targeted physical exam and echocardiographic evaluation (Fig. 3.75). Echocardiog-raphy is much more sensitive than physical examination for tamponade, and right ventricular diastolic collapse is highly specific for tamponade. Those with tamponade require an immediate procedure—either a temporizing pericardiocen-tesis, pericardiocentesis with pigtail catheter placement, or a therapeutic thoracotomy. Those without signs of tampon-ade might be considered for consultative echocardiography. Although it is a diagnosis of exclusion, pericardial effusion detected incidentally has been described as a finding of the FAST examination and may be physiologic or a result of pre-existing medical conditions (79).
Suspected Pericardial Effusion / Tamponade:
Blunt trauma Penetrating trauma
Pericardial effusion by echocardiography
No
Consider alternative dx orconsultative echo byCardiology
Yes
Physical exam or echoSigns of tamponade?
Tamponade Present
Yes No
Emergent: 1) US-guided pericardiocentesis or2) Pigtail catheter placement 3) Pericardial window or 4) Thoracotomy
Consider consultative echoby Cardiology
Figure 3.75. Algorithm for the evaluation of Traumatic Pericardial effusion using ultrasound.

chapter 3 / Trauma 47
or more specifically, the detection of a lung point. In stable patients plain radiography or CT should generally confirm these findings. If the patient is unstable and tension pneu-mothorax is suspected, however, critical intervention should proceed prior to chest radiography. Ultrasound is probably most useful in its negative predictive value. In other words, if the ultrasound performed by an experienced sonographer is interpreted as negative for pneumothorax, the diagnosis can be excluded or considered highly unlikely.
Solid organ injuryThe clinical utility of positive and negative sonographic ex-aminations for specific organ injuries is limited. Some stud-ies have inferred that a negative exam, in certain patients, is sufficient to rule out injury (100,101). Each of these studies recommended that ultrasound be the initial diagnostic mo-dality for evaluating patients with renal trauma. If a stable, nomotensive patient has a normal renal ultrasound, no hema-turia, and no other significant injuries, then his/her evaluation was complete. There have been no similar recommendations for the ultrasound evaluation of other organs.
A positive result, on the other hand, may direct certain aspects of the diagnostic evaluation. For instance, in most series, identification of solid organ injury in a hemodynami-cally stable patient is an indication for additional diagnostic testing. Commonly, this is a CT scan of the abdomen and pel-vis, which provides specific information regarding the extent and severity of the organ injuries. Another benefit is that CT can reveal other injuries, if present.
The identification of solid organ injury in the hemody-namically unstable patient is generally low yield. If the pa-tient has free intraperitoneal fluid, laparotomy is warranted regardless of whether a specific etiology for the hypoten-sion is identified. Knowing that a specific organ injury exists does not change the approach, technique, or decision mak-ing in hemodynamically unstable patients. Another impor-tant issue is that ultrasound is poor at identifying injuries to multiple organs, so there is no assurance that an injury identified sonographically is the primary or only etiology of the instability. As a result, there are no widely recognized algorithms that include the presence or absence of specific organ injury identified by ultrasound into clinical decision making. It is logical to obtain a CT scan in hemodynamically stable patients without free fluid but with solid organ injury. The EFAST evaluation, however, is most effective when it is used to identify the surrogate of solid organ injury (free fluid) rather than the solid organ injury itself.
Special ConsiderationsCritical care: assessing shock and directing resuscitationThe EFAST examination is a critical component of the RUSH examination (Rapid Ultrasound in SHock), which defines a bedside ultrasound approach to identifying the source of shock and guiding resuscitation for critically ill patients (102). EFAST may identify a large pneumothorax, cardiac tamponade, hemothorax, or hemoperitoneum as po-tential sources of shock. Alternatively, left heart failure, hy-povolemia (collapsing IVC with a hyperdynamic heart), and pulmonary embolism (right heart strain with or without deep venous thrombosis) may be identified.
Cardiac injury (Fig. 3.75)The ultrasound finding of pericardial fluid can rapidly iden-tify patients who need immediate treatment to avoid hemo-dynamic deterioration secondary to cardiac tamponade. In the setting of penetrating trauma to the torso, the presence of pericardial fluid suggests penetration of the pericardium and possible injury to a cardiac chamber (83,86). Sonographic signs of impending cardiovascular collapse include right atrial systolic collapse, right ventricular diastolic collapse, a dilated inferior vena cava without respiratory variation, and intraventricular septal flattening.
The patient with penetrating trauma to the torso and no pericardial fluid should have a period of observation prior to ruling out the possibility of cardiac injury (87,88). Delayed presentations of pericardial effusions have occurred, espe-cially with injuries to the right atrium and ventricle, which are lower pressure chambers that may not leak until in-creased intravascular volume causes clot breakdown. An-other concern is the presence of a left-sided pleural effusion. It should alert the resuscitating physician that penetration of both anterior and posterior surfaces of the pericardium may have occurred, thus allowing spontaneous evacuation of the pericardial effusion into the pleural space (89–91).
Extended Applications: Thoracic TraumaThe sonographic assessment of the pleural spaces for blood or air is an important adjunct to the traditional FAST examination.
Pleural fluidThe detection of hemothorax in a supine trauma patient can be problematic as the supine portable chest radiograph can be insensitive for small fluid collections. Ultrasound, on the other hand, has been estimated to detect as little as 20 mL of pleural fluid (92) and can be very useful for the detec-tion of hemothorax in both blunt and penetrating thoracic trauma (93–95). Studies on the sensitivity of ultrasound for the detection of hemothorax have yielded mixed re-sults (93–96). Applying this information clinically, a negative ultrasound should not be interpreted as eliminating hemotho-rax from the differential, especially in the patient with blunt chest trauma (95). In contrast, the specificity of ultrasound for hemothorax is very high (96). Ultrasound may therefore be used to expedite diagnosis and tube thoracostomy, and can allow for tube placement even before the initial chest radiograph.
PneumothoraxThe use of ultrasound to evaluate for pneumothorax is highly useful. In contrast to standard radiography, which is insensi-tive and rendered even less accurate in a supine trauma pa-tient, ultrasound is highly sensitive, and the natural migration of a pneumothorax to the anterior chest makes ultrasound an ideal imaging modality. Numerous studies, including two recent meta-analyses, have demonstrated that ultra-sound is more sensitive than standard supine radiography (86% to 98% for ultrasound vs. 28% to 75% for x-ray) and with comparable specificity (97% to 99% for ultrasound and 100% for x-ray) when performed by experienced operators (41,97–99). Ultrasound findings that suggest pneumothorax include the absence of a lung sliding and comet tail artifact

48 Section ii / Ultrasound in the Resuscitation of Acute Injury or Illness
that the sensitivity for any intra-abdominal injury is poor (119). This is not surprising given that abdominal injury without free fluid is fairly common in pediatric patients (118,120,121). As a result, prior studies using intraabdominal injury rather than free fluid as the end point for FAST accuracy are misleading and suggest a falsely low sensitivity. Although the sensitivity for free fluid may be lower in pediatric patients than adults, the specificity is still excellent.
Even more discouraging have been the pediatric studies cit-ing the accuracy of ultrasound in the evaluation of solid organ injury. CT is far superior in this regard, although the high speci-ficity means that identification of solid organ injury may change management by prompting CT or prioritizing care.
Ultimately, the role of ultrasound is limited by the moderate sensitivity for free fluid and the fact that many pediatric abdom-inal injuries are not associated with free fluid (118,120,121). Positive findings may alter management decisions by prompt-ing CT, prioritizing patient care, or leading to operative interven-tion in unstable patients. For the majority of pediatric patients with significant abdominal pain or tenderness, however, a CT will be needed to delineate the location and extent of injury.7
Pelvic fractureThere are a number of confounding factors to be considered when interpreting a FAST examination in the patient with a pelvic fracture. The first is that a significant amount of bleeding from a pelvic fracture may be isolated to the retro-peritoneum, which is an area where ultrasound is unreliable (72). Second, patients with pelvic fractures may have missed free fluid on ultrasound, and some recommend a DPL to rule out hemoperitoneum in unstable patients (122). One can de-bate whether the volume of missed hemoperitoneum in such cases is significant enough to account for the hypotension. Another concern is the association of intraperitoneal blad-der rupture with pelvic fractures, especially in the patient with hemodynamic instability (123). In this case, free fluid detected by ultrasound may represent urine, not blood. As a result, it has been suggested that the patient with a posi-tive ultrasound and severe pelvic fractures undergo a DPL as their next diagnostic test (123).
Triage of multiple patients, disaster situations, and austere environmentsUltrasound is an ideal imaging modality for the evaluation of large numbers of traumatically injured patients and in re-source limited environments, because it allows assessments that are rapid, noninvasive, portable, and accurate. In trauma centers it is not unusual to experience the simultaneous pre-sentation of multiple, critically injured patients. Decisions regarding patient priority for the operating room, CT scan, or procedural intervention are magnified when resources are stretched to their limits. One study demonstrated that the results of a FAST examination could be used to deter-mine patient priority for operative intervention (124). Oth-ers have incorporated an ultrasound into the evaluation of patients sustaining injuries on the battlefield and during a natural disaster (125–130).
COMPARISON WITH OTHER DIAGNOSTIC MODALITIESThe diagnostic approach to the traumatically injured patient typically involves a variety of diagnostic tests, including
Fluid responsiveness can be assessed and monitored with assessment of the IVC as a marker of CVP. Studies have shown that incomplete collapse (<40% to 50%) of the IVC during the respiratory cycle correlates well with normal to elevated CVP (Fig. 3.51C) (103,104). These patients are un-likely to be responsive to fluid boluses. A recent emergency medicine study assessed patients during normal respira-tions and found that IVC collapse >50% suggests the central venous pressure is <8 mm Hg (105). These patients likely would benefit from fluid resuscitation. Various other studies support the correlation of IVC parameters and CVP in the ICU and in ventilated patients (106–109). Predicting the pre-cise CVP based on IVC parameters (size, degree of collapse) however, seems less reliable.
Practically speaking, assessment of the IVC can be highly valuable when caring for a patient with shock or hy-potension. Collapse >50% suggests preload is low; monitor-ing for improvement in collapsibility to <50% during fluid resuscitation is a useful means for guiding therapy. Con-versely, a dilated, non-phasic IVC suggests that preload is unlikely the source of the problem in a patient with shock or hypotension.
Obstetric patientsThe use of ultrasound for the diagnostic evaluation of the pregnant blunt trauma patient has the benefits of not expos-ing the mother and fetus to ionizing radiation and invasive procedures, while also being able to assess for peritoneal fluid and fetal viability (110–112). The primary application of trauma ultrasound in the pregnant patient is no different than that in the nonpregnant patient, which is the noninva-sive evaluation of the peritoneal and thoracic cavities for free blood or air. While the peritoneal anatomy will change in pregnancy, especially in the late second and third trimesters, the EFAST technique is the same, and fluid is still readily identifiable in the standard locations.
A useful application of ultrasound in the pregnant trauma patient is the assessment of fetal gestational age and fetal cardiac activity. In later pregnancy, the easiest estimation of gestational age is obtained by measuring the biparietal diam-eter. Although there is some institutional variation, fetuses >24 weeks gestational age are generally considered viable. Fetal cardiac activity should be assessed. Bradycardia is a marker of fetal distress caused by poor perfusion or hypoxia. The fetus may die or be in distress before the mother exhibits obvious signs of injury or shock.
Pediatric patients8PEDIATRIC CONSIDERATIONS One of the primary roles of bedside ultrasound for pediatric patients is the evaluation of blunt abdominal trauma. While the finding of peritoneal fluid is a similar primary goal for adult and pediatric patients, re-sults have been somewhat discouraging for the latter (67,77–82,113–118). A possible misconception, however, is that the sensitivity of FAST is poor in pediatric patients. While one re-cent study supports this theory (118), residents did the majority of examinations in this study, and the thoroughness of the ex-aminations was not clearly described in the methodology. This may be problematic because operator experience and examina-tion thoroughness have drastic effects on FAST performance. A recent meta-analysis of FAST in pediatric patients points out that the sensitivity for free fluid is moderate (65% to 81%), but
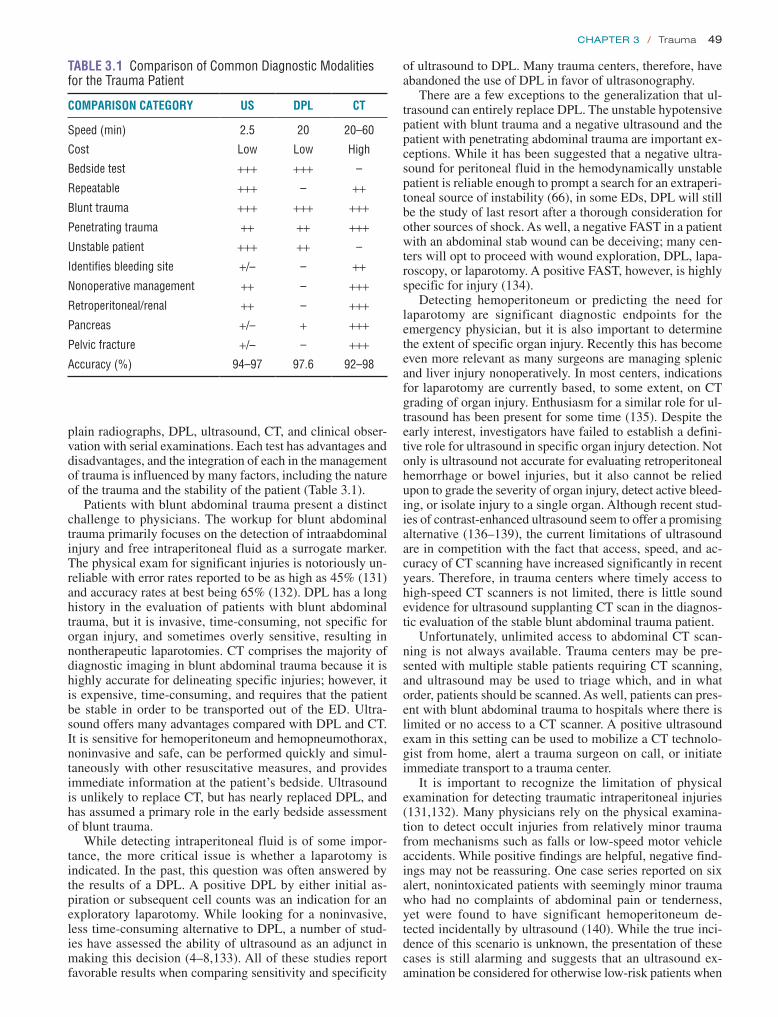
chapter 3 / Trauma 49
plain radiographs, DPL, ultrasound, CT, and clinical obser-vation with serial examinations. Each test has advantages and disadvantages, and the integration of each in the management of trauma is influenced by many factors, including the nature of the trauma and the stability of the patient (Table 3.1).
Patients with blunt abdominal trauma present a distinct challenge to physicians. The workup for blunt abdominal trauma primarily focuses on the detection of intraabdominal injury and free intraperitoneal fluid as a surrogate marker. The physical exam for significant injuries is notoriously un-reliable with error rates reported to be as high as 45% (131) and accuracy rates at best being 65% (132). DPL has a long history in the evaluation of patients with blunt abdominal trauma, but it is invasive, time-consuming, not specific for organ injury, and sometimes overly sensitive, resulting in nontherapeutic laparotomies. CT comprises the majority of diagnostic imaging in blunt abdominal trauma because it is highly accurate for delineating specific injuries; however, it is expensive, time-consuming, and requires that the patient be stable in order to be transported out of the ED. Ultra-sound offers many advantages compared with DPL and CT. It is sensitive for hemoperitoneum and hemopneumothorax, noninvasive and safe, can be performed quickly and simul-taneously with other resuscitative measures, and provides immediate information at the patient’s bedside. Ultrasound is unlikely to replace CT, but has nearly replaced DPL, and has assumed a primary role in the early bedside assessment of blunt trauma.
While detecting intraperitoneal fluid is of some impor-tance, the more critical issue is whether a laparotomy is indicated. In the past, this question was often answered by the results of a DPL. A positive DPL by either initial as-piration or subsequent cell counts was an indication for an exploratory laparotomy. While looking for a noninvasive, less time-consuming alternative to DPL, a number of stud-ies have assessed the ability of ultrasound as an adjunct in making this decision (4–8,133). All of these studies report favorable results when comparing sensitivity and specificity
TABLe 3.1 Comparison of Common Diagnostic Modalities for the Trauma Patient
COMPAriSON CATegOrY uS DPL CT
Speed (min) 2.5 20 20–60
Cost Low Low High
Bedside test +++ +++ –
Repeatable +++ – ++Blunt trauma +++ +++ +++Penetrating trauma ++ ++ +++Unstable patient +++ ++ –
Identifies bleeding site +/– – ++Nonoperative management ++ – +++Retroperitoneal/renal ++ – +++Pancreas +/– + +++Pelvic fracture +/– – +++Accuracy (%) 94–97 97.6 92–98
of ultrasound to DPL. Many trauma centers, therefore, have abandoned the use of DPL in favor of ultrasonography.
There are a few exceptions to the generalization that ul-trasound can entirely replace DPL. The unstable hypotensive patient with blunt trauma and a negative ultrasound and the patient with penetrating abdominal trauma are important ex-ceptions. While it has been suggested that a negative ultra-sound for peritoneal fluid in the hemodynamically unstable patient is reliable enough to prompt a search for an extraperi-toneal source of instability (66), in some EDs, DPL will still be the study of last resort after a thorough consideration for other sources of shock. As well, a negative FAST in a patient with an abdominal stab wound can be deceiving; many cen-ters will opt to proceed with wound exploration, DPL, lapa-roscopy, or laparotomy. A positive FAST, however, is highly specific for injury (134).
Detecting hemoperitoneum or predicting the need for laparotomy are significant diagnostic endpoints for the emergency physician, but it is also important to determine the extent of specific organ injury. Recently this has become even more relevant as many surgeons are managing splenic and liver injury nonoperatively. In most centers, indications for laparotomy are currently based, to some extent, on CT grading of organ injury. Enthusiasm for a similar role for ul-trasound has been present for some time (135). Despite the early interest, investigators have failed to establish a defini-tive role for ultrasound in specific organ injury detection. Not only is ultrasound not accurate for evaluating retroperitoneal hemorrhage or bowel injuries, but it also cannot be relied upon to grade the severity of organ injury, detect active bleed-ing, or isolate injury to a single organ. Although recent stud-ies of contrast-enhanced ultrasound seem to offer a promising alternative (136–139), the current limitations of ultrasound are in competition with the fact that access, speed, and ac-curacy of CT scanning have increased significantly in recent years. Therefore, in trauma centers where timely access to high-speed CT scanners is not limited, there is little sound evidence for ultrasound supplanting CT scan in the diagnos-tic evaluation of the stable blunt abdominal trauma patient.
Unfortunately, unlimited access to abdominal CT scan-ning is not always available. Trauma centers may be pre-sented with multiple stable patients requiring CT scanning, and ultrasound may be used to triage which, and in what order, patients should be scanned. As well, patients can pres-ent with blunt abdominal trauma to hospitals where there is limited or no access to a CT scanner. A positive ultrasound exam in this setting can be used to mobilize a CT technolo-gist from home, alert a trauma surgeon on call, or initiate immediate transport to a trauma center.
It is important to recognize the limitation of physical examination for detecting traumatic intraperitoneal injuries (131,132). Many physicians rely on the physical examina-tion to detect occult injuries from relatively minor trauma from mechanisms such as falls or low-speed motor vehicle accidents. While positive findings are helpful, negative find-ings may not be reassuring. One case series reported on six alert, nonintoxicated patients with seemingly minor trauma who had no complaints of abdominal pain or tenderness, yet were found to have significant hemoperitoneum de-tected incidentally by ultrasound (140). While the true inci-dence of this scenario is unknown, the presentation of these cases is still alarming and suggests that an ultrasound ex-amination be considered for otherwise low-risk patients when

50 Section ii / Ultrasound in the Resuscitation of Acute Injury or Illness
Figure 3.78. Case 1. FAST exam, image 1.
suspicion for abdominal injury exists despite a benign physi-cal examination.
INCIDENTAL FINDINGSAs clinicians apply bedside ultrasound, they will inevitably encounter a variety of incidental conditions, both normal and pathological. The responsible clinician should be prepared to recognize common variants and appreciate abnormalities that require follow-up.
CystsCysts may be found in the liver, spleen, kidneys, or ovaries. Sonographically, benign cysts appear as unilocular round structures that exhibit good sound transmission, lack inter-nal substance, and have thin walls and an anechoic center (Fig. 3.76). All cysts, whether or not they appear benign, should have follow-up arranged after their ED visit or inpa-tient hospitalization.
MassesMasses may take different forms with variable patterns of echogenicity (Fig. 3.77). Concerning findings include het-erogeneity of solid organs, abnormal patterns of normal layers, and abnormal organ size. All masses should have confirmatory diagnostic testing and follow-up.
Figure 3.76. The Appearance of a renal Cyst that was Detected during a FAST exam.
Figure 3.77. ultrasound image of a Lesion in the Liver that was Detected during a FAST exam. It was determined by CT to be a hemangioma.
Abnormal Organ Size or ChambersThe EFAST exam may also detect organs that appear smaller or larger than normal. Examples include cardiomegaly, ab-dominal aortic aneurysm, small or absent kidneys, or large uteri or ovaries. The severity of the abnormality and clinical circumstances will dictate the immediacy, type, and location of the follow-up.
CLINICAL CASESCASe 1A 31-year-old male was brought in by paramedics after being involved in a head-on motor vehicle accident. His initial blood pressure was 110/40 mm Hg with a pulse rate of 130 beats per minute. The patient is intubated and unresponsive to all stimuli. He has been given 750 cc of crystalloid via two intravenous lines. On arrival at the ED, his primary survey is significant for decreased breath sounds bilaterally with associated vital signs of a pulse of 140 beats per minute and a blood pressure of 70 mm Hg systolic. Blood products are given, and an ultrasound is performed simultaneously with radiographs of the chest and pelvis. The chest and pelvis x-rays were interpreted as normal. The FAST examination findings are shown in Figures 3.78 and 3.79.
The resuscitating physician’s impression of the trauma ul-trasound was that free peritoneal fluid was present in Mori-son’s pouch, the pelvis, and the right pleural cavity. The left flank and the subxyphoid view were interpreted as negative for fluid, and the bilateral chest evaluation was negative for pneumothorax. Based on the patient’s ultrasound findings and hemodynamic status, the decision was made to insert a right tube thoracostomy and then proceed directly to the operating room. The exploratory laparotomy was significant for a grade-IV spleen laceration with 1500 cc of associated hemoperitoneum. The patient had a splenectomy with con-trol in peritoneal bleeding and made an uneventful postop-erative recovery.
CASe 2A 45-year-old male was brought to the ED by ambulance with a single stab wound to the left anterior chest. The injury

chapter 3 / Trauma 51
reFereNCeS 1. Goldberg BB, Goodman GA, Clearfield HR. Evaluation of ascites by
ultrasound. Radiology. 1970;96:15–22. 2. Goldberg BB, Clearfield HR, Goodman GA, et al. Ultrasonic determina-
tion of ascites. Arch Intern Med. 1973;131:217–220. 3. Goldberg BB. Ultrasonic evaluation of intraperitoneal fluid. JAMA.
1976;235:2427–2430. 4. Gruessner R, Mentges B, Duber C, et al. Sonography versus peritoneal
lavage in blunt abdominal trauma. J Trauma. 1989;29:242–244. 5. Bode PJ, Niezen RA, van Vugt AB, et al. Abdominal ultrasound as a
reliable indicator for conclusive laparotomy in blunt abdominal trauma. J Trauma. 1993;34:27–31.
6. Glaser K, Tschmelitsch J, Klingler P, et al. Ultrasonography in the management of blunt abdominal and thoracic trauma. Arch Surg. 1994;129:743–747.
7. McKenney M, Lentz K, Nunez D, et al. Can ultrasound replace diag-nostic peritoneal lavage in the assessment of blunt trauma? J Trauma. 1994;37:439–441.
8. Lentz KA, McKenney MG, Nunez DB Jr, et al. Evaluating blunt abdominal trauma: role for ultrasonography. J Ultrasound Med. 1996;15:447–451.
9. Tso P, Rodriguez A, Cooper C, et al. Sonography in blunt abdominal trauma: a preliminary progress report. J Trauma. 1992;33:39–43; discus-sion 43–44.
10. Rozycki GS, Shackford SR. Ultrasound, what every trauma surgeon should know. J Trauma. 1996;40:1–4.
11. Scalea TM, Rodriguez A, Chiu WC, et al. Focused Assessment with Sonography for Trauma (FAST): results from an international consensus conference. J Trauma. 1999;46:466–472.
12. Kirkpatrick AW, Sirois M, Laupland KB, et al. Hand-held thoracic sonography for detecting post-traumatic pneumothorax: the Extended Focused Sonography for Trauma (EFAST). J Trauma. 2004;57: 288–295.
13. American College of Emergency Physicians. Emergency ultrasound guidelines. Ann Emerg Med. 2009;53:550–570.
14. Stengel D, Bauwens K, Sehouli J, et al. Discriminatory power of 3.5 MHz convex and 7.5 MHz linear ultrasound probes for the imaging of traumatic splenic lesions: a feasibility study. J Trauma. 2001;51: 37–43.
15. Biffl WL, Moore EE, Kendall J. Postinjury torso ultrasound: FAST should be SLOH. J Trauma. 2000;48:781–782.
16. Henderson SO, Sung J, Mandavia D. Serial abdominal ultrasound in the setting of trauma. J Emerg Med. 2000;18:79–81.
17. Branney SW, Moore EE, Cantrill SV, et al. Ultrasound based key clinical pathway reduces the use of hospital resources for the evaluation of blunt abdominal trauma. J Trauma. 1997;42:1086–1090.
Figure 3.79. Case 1. FAST exam, image 2.
Figure 3.80. Case 2. An ultrasound exam of the heart significant for a moderate-sized pericardial effusion.
Figure 3.81. Case 2. A repeat ultrasound done 4 minutes after the first was interpreted as being free of pericardial fluid.occurred approximately 20 minutes prior to ED arrival by
an unknown assailant with an unknown object. Prehospital vital signs were a systolic blood pressure of 110 mm Hg, pulse of 100 beats per minute, and respirations of 24 per minute. Upon arrival at the ED, the patient’s vital signs were a systolic blood pressure of 70 mm Hg, pulse rate of 110 beats per minute, and a respiratory rate of 30 breaths per minute. His physical exam was remarkable for a 2-cm wound to the left anterior chest with no other wounds visualized after full exposure. The patient was awake, alert, diaphoretic, and in moderate distress. The physical exam was otherwise unremarkable. An ultrasound exam of his heart was per-formed immediately on arrival, which was significant for a moderate-sized pericardial effusion (Fig. 3.80). The patient was then intubated and a successful pericardiocentesis was performed. A repeat ultrasound done 4 minutes after the first was interpreted as being free of pericardial fluid (Fig. 3.81). The patient was taken emergently to the operating room where a 1-cm laceration in his right ventricle was repaired. He was discharged from the hospital 2 days later after an uneventful hospital course.

52 Section ii / Ultrasound in the Resuscitation of Acute Injury or Illness
43. Blaivas M, Lyon M, Duggai S. A prospective comparison of supine chest radiography and bedside ultrasound for the diagnosis of traumatic pneu-mothorax. Acad Emerg Med. 2005;12:844–849.
44. Van Sonnenberg E, Simeone JF, Mueller PR, et al. Sonographic appear-ance of hematoma in liver, spleen, and kidney: a clinical, pathologic, and animal study. Radiology. 1983;147:507–510.
45. Yoshii H, Sato M, Yamamoto S, et al. Usefulness and limitations of ultrasonography in the initial evaluation of blunt abdominal trauma. J Trauma. 1998;45:45–50; discussion 50–51.
46. Lam AH, Shulman L. Ultrasonography in the management of liver trauma in children. J Ultrasound Med. 1984;3:199–203.
47. Froelich JW, Simeone JF, McKusick KA, et al. Radionuclide imag-ing and ultrasound in liver/spleen trauma: a prospective comparison. Radiology. 1982;145:457–461.
48. Richards JR, McGahan JP, Pali MJ, et al. Sonographic detection of blunt hepatic trauma: hemoperitoneum and parenchymal patterns of injury. J Trauma. 1999;47:1092–1097.
49. Weill F, Bihr E, Rohmer P, et al. Ultrasonic study of hepatic and splenic traumatic lesions. Eur J Radiol. 1981;1:245–249.
50. Richards JR, McGahan JP, Jones CD, et al. Ultrasound detection of blunt splenic injury. Injury. 2001;32:95–103.
51. Richards JR, McGahan PJ, Jewell MG, et al. Sonographic patterns of intraperitoneal hemorrhage associated with blunt splenic injury. J Ultrasound Med. 2004;23:387–394; quiz 395–396.
52. Kendall JL, Faragher J, Hewitt GJ, et al. Emergency department ultra-sound is not a sensitive detector of solid organ injury. West J Emerg Med. 2009;10:1–5.
53. Poletti PA, Kinkel K, Vermeulen B, et al. Blunt abdominal trauma: should US be used to detect both free fluid and organ injuries? Radiology. 2003;227:95–103.
54. Yoshi H, Sato M. Reevaluation of ultrasonography for solid-organ injury in blunt abdominal trauma. J Ultrasound Med. 2004;23:1583–1596.
55. Clevert DA, Weckbach S, Minaifar N. Contrast-enhanced ultrasound versus MS-CT in blunt abdominal trauma. Clin Hemorheol Microcirc. 2008;39:155–169.
56. Catalano O, Aiani L, Barozzi L. CEUS in abdominal trauma: multi-center study. Abdom Imaging. 2009;34:225–234.
57. Valentino M, Ansaloni L, Catena F. Contrast-enhanced ultrasonography in blunt abdominal trauma: considerations after 5 years of experience. Radiol Med. 2009;114:1080–1093.
58. Sierzenski PR, Schofer JM, Bauman MJ. The double-line sign: a false positive finding on the Focused Assessment with Sonography for Trauma (FAST) examination. J Emerg Med. 2011;40:188–189.
59. Kendall JL, Ramos JP. Fluid-filled bowel mimicking hemoperitoneum: a false-positive finding during sonographic evaluation for trauma. J Emerg Med. 2003;25:79–82.
60. Fleischer AC, Dowling AD, Weinstein ML, et al. Sonographic patterns of distended, fluid-filled bowel. Radiology. 1979;133:681–685.
61. Lewandowski BJ, Jaffer NM, Winsberg F. Relationship between the peri-cardial and pleural spaces in cross-sectional imaging. J Clin Ultrasound. 1981;9:271–274.
62. Ma OJ, Kefer MP, Stevison KF, et al. Operative versus nonoperative management of blunt abdominal trauma: role of ultrasound-measured intraperitoneal fluid levels. Am J Emerg Med. 2001;19:284–286.
63. Farahmand N, Sirlin CB, Brown MA, et al. Hypotensive patients with blunt abdominal trauma: performance of screening US. Radiology. 2005;235:436–443.
64. Rose JS, Richards JR, Battistella F. The fast is positive, now what? Deri-vation of a clinical decision rule to determine the need for therapeu-tic laparotomy in adults with blunt torso trauma and a positive trauma ultrasound. J Emerg Med. 2005;29:15–21.
65. Rozycki GS, Ballard RB, Feliciano DV, et al. Surgeon-performed ul-trasound for the assessment of truncal injuries: lessons learned from 1540 patients. Ann Surg. 1998;228:557–567.
66. Wherrett LJ, Boulanger BR, McLellan BA, et al. Hypotension after blunt abdominal trauma: the role of emergent abdominal sonography in surgical triage. J Trauma. 1996;41:815–820.
67. Holmes JF, Brant WE, Bond WF, et al. Emergency department ul-trasonography in the evaluation of hypotensive and normotensive children with blunt abdominal trauma. J Pediatr Surg. 2001;36: 968–973.
18. Laselle BT, Byyny RL, Haukoos JS, et al. False-negative FAST exami-nation: associations with injury characteristics and patient outcomes. Ann Emerg Med. 2012;60:326–334.e3.
19. Volpicelli G, Elbarbary M, Blaivas M, et al. International evidence-based recommendations for point-of-care lung ultrasound. Intensive Care Med. 2012;38:577–591.
20. Ma OJ, Kefer MP, Mateer JR, et al. Evaluation of hemoperitoneum using a single- vs multiple-view ultrasonographic examination. Acad Emerg Med. 1995;2:581–586.
21. Rozycki GS, Ochsner MG, Feliciano DV, et al. Early detection of he-moperitoneum by ultrasound examination of the right upper quadrant: a multicenter study. J Trauma. 1998;45:878–883.
22. Jehle D, Guarino J, Karamanoukian H. Emergency department ultra-sound in the evaluation of blunt abdominal trauma. Am J Emerg Med. 1993;11:342–346.
23. Richards JR, McGahan PJ, Jewell MG. Sonographic patterns of intra-peritoneal hemorrhage associated with blunt splenic injury. J Ultrasound Med. 2004;23:387–394.
24. Lichtenstein D, Meziere G, Lascols N, et al. Ultrasound diagnosis of occult pneumothorax. Crit Care Med. 2005;33:1231–1238.
25. Islam NB, Levy PD. Emergency bedside ultrasound to detect pneumo-thorax. Acad Emerg Med. 2003;10:819–820; author reply 820–821.
26. Cunningham J, Kirkpatrick AW, Nicolaou S, et al. Enhanced recognition of “lung sliding” with power color Doppler imaging in the diagnosis of pneumothorax. J Trauma. 2002;52:769–771.
27. Forsby J, Henriksson L. Detectability of intraperitoneal fluid by ultraso-nography. An experimental investigation. Acta Radiol Diagn (Stockh). 1984;25:375–378.
28. Branney SW, Wolfe RE, Moore EE, et al. Quantitative sensitiv-ity of ultrasound in detecting free intraperitoneal fluid. J Trauma. 1995;39:375–380.
29. Branney SW, Wolfe RE, Albert NP. The reliability of estimating intra-peritoneal fluid volume with ultrasound. Acad Emerg Med (abstract). 1995;2:345.
30. Jehle D, Adams B, Sukumvanich P, et al. Ultrasound for the detection of intraperitoneal fluid: the role of Trendelenburg positioning. Acad Emerg Med (abstract). 1995;2:407.
31. Von Kuenssberg Jehle D, Stiller G, Wagner D. Sensitivity in detecting free intraperitoneal fluid with the pelvic views of the FAST exam. Am J Emerg Med. 2003;21:476–478.
32. Abrams BJ, Sukumvanich P, Seibel R, et al. Ultrasound for the detec-tion of intraperitoneal fluid: the role of Trendelenburg positioning. Am J Emerg Med. 1999;17:117–120.
33. Huang MS, Liu M, Wu JK, et al. Ultrasonography for the evaluation of hemoperitoneum during resuscitation: a simple scoring system. J Trauma. 1994;36:173–177.
34. McKenney KL, McKenney MG, Cohn SM, et al. Hemoperitoneum score helps determine need for therapeutic laparotomy. J Trauma. 2001;50:650–654; discussion 654–656.
35. Meyers MA. The spread and localization of acute intraperitoneal effu-sions. Radiology. 1970;95:547–554.
36. Hahn DD, Offerman SR, Holmes JF. Clinical importance of intraperi-toneal fluid in patients with blunt intra-abdominal injury. Am J Emerg Med. 2002;20:595–600.
37. Galderisi M, Marra F, Esposito R. Cancer therapy and cardiotoxicity: the need for serial Doppler echocardiography. Cardiovasc Ultrasound. 2007;5:4.
38. Pepi M, Muratori M, Barbier P. Pericardial effusion after cardiac sur-gery: incidence, site, size and haemodynamic consequences. Br Heart J. 1994;72:327–331.
39. Singh S, Wann LS, Schuchard GH, et al. Right ventricular and right atrial collapse in patients with cardiac tamponade—a combined echo-cardiographic and hemodynamic study. Circulation. 1984;70:966–971.
40. Reddy PS, Curtiss EI, Uretsky BF. Spectrum of hemodynamic changes in cardiac tamponade. Am J Cardiol. 1990;66:1487–1491.
41. Dulchavsky SA, Schwarz KL, Kirkpatrick AW, et al. Prospective evalua-tion of thoracic ultrasound in the detection of pneumothorax. J Trauma. 2001;50:201–205.
42. Lichtenstein D, Meziere G, Biderman P, et al. The “lung point”: an ultrasound sign specific to pneumothorax. Intensive Care Med. 2000;26:1434–1440.

chapter 3 / Trauma 53
93. Sisley AC, Rozycki GS, Ballard RB, et al. Rapid detection of trau-matic effusion using surgeon-performed ultrasonography. J Trauma. 1998;44:291–296; discussion 296–297.
94. Ma OJ, Mateer JR. Trauma ultrasound examination versus chest ra-diography in the detection of hemothorax. Ann Emerg Med. 1997;29: 312–315; discussion 315–316.
95. Abboud PA, Kendall J. Emergency department ultrasound for hemo-thorax after blunt traumatic injury. J Emerg Med. 2003;25:181–184.
96. McEwan K, Thompson P. Ultrasound to detect haemothorax after chest injury. Emerg Med J. 2007;24:581–582.
97. Knudtson JL, Dort JM, Helmer SD, et al. Surgeon-performed ultrasound for pneumothorax in the trauma suite. J Trauma. 2004;56:527–530.
98. Wilkerson G, Stone M. Sensitivity of bedside ultrasound and supine an-teroposterior chest radiographs for the identification of pneumothorax after blunt trauma. Acad Emerg Med. 2010;17:11–17.
99. Ding W, Yuehong S, Yang J, et al. Diagnosis of pneuomothorax by radiography and ultrasonography: a meta-analysis. Chest. 2011;140: 859–866.
100. Furtschegger A, Egender G, Jakse G. The value of sonography in the diagnosis and follow-up of patients with blunt renal trauma. Br J Urol. 1988;62:110–116.
101. Rosales A, Arango O, Coronado J, et al. The use of ultrasonography as the initial diagnostic exploration in blunt renal trauma. Urol Int. 1992;48:134–137.
102. Perera P, Mailhot T, Riley D, et al. The RUSH exam: rapid ultrasound in shock in the evaluation of the critically ill. Emerg Med Clin N Am. 2010;28:29–56.
103. Moreno FL, Hagan AD, Holmen JR, et al. Evaluation of size and dy-namics of the inferior vena cava as an index of right-sided cardiac func-tion. Am J Cardiol. 1984;53:579–585.
104. Kircher BJ, Himelman RB, Schiller NB. Noninvasive estimation of right atrial pressure from the inspiratory collapse of the inferior vena cava. Am J Cardiol. 1990;66:493–496.
105. Nagdev AD, Merchant RC, Tirado-Gonzalez A, et al. Emergency de-partment bedside ultrasonographic measurement of the caval index for noninvasive determination of low central venous pressure. Ann Emerg Med. 2010;55:290–295.
106. Shefold JC, Storm C, Bercker S, et al. Inferior vena cava diameter correlates with invasive hemodynamic measures in mechanically ventilated intensive care unit patients with sepsis. J Emerg Med. 2010;38:632–637.
107. Stawicki SP, Braslow BM, Panebianco NL, et al. Intensivist use of hand-carried ultrasonography to measure IVC collapsibility in estimat-ing intravascular volume status: correlations with CVP. J Am Coll Surg. 2009;209:55–61.
108. Gunst M, Ghaemmaghami V, Sperry J. Accuracy of cardiac function and volume status estimates using the bedside echocardiographic as-sessment in trauma/critical care. J Trauma. 2008;65;509–516.
109. Lorsomradee S, Lorsomradee S, Cromheecke S, et al. Inferior vena cava diameter and central venous pressure correlation during cardiac surgery. J Cardiothorac Vasc Anesth. 2007;21:492–496.
110. Ma OJ, Mateer JR, DeBehnke DJ. Use of ultrasonography for the evaluation of pregnant trauma patients. J Trauma. 1996;40:665–668.
111. Goodwin H, Holmes JF, Wisner DH. Abdominal ultrasound examina-tion in pregnant blunt trauma patients. J Trauma. 2001;50:689–693; discussion 694.
112. Bochicchio GV, Haan J, Scalea TM. Surgeon-performed focused as-sessment with sonography for trauma as an early screening tool for pregnancy after trauma. J Trauma. 2002;52:1125–1128.
113. Thourani VH, Pettitt BJ, Schmidt JA, et al. Validation of surgeon-performed emergency abdominal ultrasonography in pediatric trauma patients. J Pediatr Surg. 1998;33:322–328.
114. Partrick DA, Bensard DD, Moore EE, et al. Ultrasound is an effective triage tool to evaluate blunt abdominal trauma in the pediatric popula-tion. J Trauma. 1998;45:57–63.
115. Coley BD, Mutabagani KH, Martin LC, et al. Focused abdominal so-nography for trauma (FAST) in children with blunt abdominal trauma. J Trauma. 2000;48:902–906.
116. Emery KH, McAneney CM, Racadio JM, et al. Absent peritoneal fluid on screening trauma ultrasonography in children: a prospective com-parison with computed tomography. J Pediatr Surg. 2001;36:565–569.
68. Holmes JF, Harris D, Battistella FD. Performance of abdominal ultra-sonography in blunt trauma patients with out-of-hospital or emergency department hypotension. Ann Emerg Med. 2004;43: 354–361.
69. Forster R, Pillasch J, Zielke A, et al. Ultrasonography in blunt ab-dominal trauma: influence of the investigators’ experience. J Trauma. 1993;34:264–269.
70. Chiu WC, Cushing BM, Rodriguez A, et al. Abdominal injuries without hemoperitoneum: a potential limitation of focused abdominal sonography for trauma (FAST). J Trauma. 1997;42:617–623; discussion 623–625.
71. Sirlin CB, Brown MA, Deutsch R, et al. Screening US for blunt abdomi-nal trauma: objective predictors of false-negative findings and missed injuries. Radiology. 2003;229:766–774.
72. Sirlin CB, Brown MA, Andrade–Barreto OA, et al. Blunt abdomi-nal trauma: clinical value of negative screening US scans. Radiology. 2004;230:661–668.
73. Tayal VS, Nielsen A, Jones AE. Accuracy of trauma ultrasound in major pelvic injury. J Trauma. 2006;61:1453–1457.
74. Hoffman L, Pierce D, Puumala S. Clinical predictors of injuries not identified by focused abdominal sonogram for trauma (FAST) examina-tions. J Emerg Med. 2009;36:271–279.
75. Boulanger BR, Brenneman FD, Kirkpatrick AW, et al. The indeter-minate abdominal sonogram in multisystem blunt trauma. J Trauma. 1998;45:52–56.
76. Pretre R, Chilcott M. Blunt trauma to the heart and great vessels. N Engl J Med. 1997;336:626–632.
77. Schiavone WA, Ghumrawi BK, Catalano DR, et al. The use of echocar-diography in the emergency management of nonpenetrating traumatic cardiac rupture. Ann Emerg Med. 1991;20:1248–1250.
78. Brevetti GR, Zetterlund P, Spowart G. Delayed cardiac tamponade complicating airbag deployment. J Trauma. 2002;53:104–105.
79. Lukan JK, Franklin GA, Spain DA, et al. “Incidental” pericardial effu-sion during surgeon-performed ultrasonography in patients with blunt torso trauma. J Trauma. 2001;50:743–745.
80. Udobi KF, Rodriguez A, Chiu WC, et a1. Role of ultrasonography in penetrating abdominal trauma: a prospective clinical study. J Trauma. 2001;50:475–479.
81. Soffer D, McKenney MG, Cohn S, et al. A prospective evaluation of ultrasonography for the diagnosis of penetrating torso injury. J Trauma. 2004;56:953–957; discussion 957–959.
82. Quinn AC, Sinert R. What is the utility of the Focused Assessment with Sonography in Trauma (FAST) exam in penetrating torso trauma? Injury. 2011;42:482–487.
83. Tayal VS, Beatty MA, Marx JA, et al. FAST (focused assessment with sonography in trauma) accurate for cardiac and intraperitoneal injury in penetrating anterior chest trauma. J Ultrasound Med. 2004;23: 467–472.
84. Boulanger BR, Kearney PA, Tsuei B, et al. The routine use of so-nography in penetrating torso injury is beneficial. J Trauma. 2001;51:320–325.
85. Kirkpatrick AW, Sirois M, Ball CG, et al. The hand-held ultra-sound examination for penetrating abdominal trauma. Am J Surg. 2004;187:660–665.
86. Plummer D, Brunette D, Asinger R, et al. Emergency department echo-cardiography improves outcome in penetrating cardiac injury. Ann Emerg Med. 1992;21:709–712.
87. Harris DG, Janson JT, Van Wyk J, et al. Delayed pericardial effu-sion following stab wounds to the chest. Eur J Cardiothorac Surg. 2003;23:473–476.
88. Nagy KK, Lohmann C, Kim DO, et al. Role of echocardiogra-phy in the diagnosis of occult penetrating cardiac injury. J Trauma. 1995;38:859–862.
89. Meyer DM, Jessen ME, Grayburn PA. Use of echocardiography to de-tect occult cardiac injury after penetrating thoracic trauma: a prospec-tive study. J Trauma. 1995;39:902–907; discussion 907–909.
90. Chan D. Echocardiography in thoracic trauma. Emerg Med Clin North Am. 1998;16:191–207.
91. Ball CG, Williams BH, Wyrzykowski AD, et al. A caveat to the per-formance of pericardial ultrasound in patients with penetrating cardiac wounds. J Trauma. 2009;67:1123–1124.
92. Rothlin MA, Naf R, Amgwerd M, et al. Ultrasound in blunt abdominal and thoracic trauma. J Trauma. 1993;34:488–495.

54 Section ii / Ultrasound in the Resuscitation of Acute Injury or Illness
129. Strode CA, Rubal BJ, Gerhardt RT, et al. Satellite and mobile wireless transmission of focused assessment with sonography in trauma. Acad Emerg Med. 2003;10:1411–1414.
130. Everett JJ, Laselle B, Kendall J. Splenic injury sustained during body hardening drills and the utility of ultrasound in a prehospital combat medical environment. Mil Med. 2010;175:182–184.
131. Olsen WR, Hildreth DH. Abdominal paracentesis and peritoneal lavage in blunt abdominal trauma. J Trauma. 1971;11:824–829.
132. Powell DC, Bivins BA, Bell RM. Diagnostic peritoneal lavage. Surg Gynecol Obstet. 1982;155:257–264.
133. Porter RS, Nester BA, Dalsey WC, et al. Use of ultrasound to de-termine need for laparotomy in trauma patients. Ann Emerg Med. 1997;29:323–330.
134. Quinn Ac, Sinert R. What is the utility of the Focused Assessment with Sonography in Trauma (FAST) exam in penetrating torso trauma? Injury. 2011;42:482–487.
135. Asher WM, Parvin S, Virgillo RW, et al. Echographic evaluation of splenic injury after blunt trauma. Radiology. 1976;118:411–415.
136. Valentino M, Serra C, Pavlica P, et al. Blunt abdominal trauma: diag-nostic performance of contrast-enhanced US in children—initial expe-rience. Radiology. 2008;246:903–909.
137. Valentino M, Ansaloni L, Catena F, et al. Contrast-enhanced ultraso-nography in blunt abdominal trauma: considerations after 5 years of experience. Radiol Med. 2009;114;1080–1093.
138. Tang J, Li W, Lv F, et al. Comparison of gray-scale contrast-enhanced ultrasonography with contrast-enhanced computed tomography in dif-ferent grading of blunt hepatic and splenic trauma: an animal experi-ment. Ultrasound Med Biol. 2009;35:566–575.
139. Lv F, Tang J, Luo Y, et al. Contrast-enhanced ultrasound imaging of ac-tive bleeding associated with hepatic and splenic trauma. Radiol Med. 2011;116:1076–1082.
140. Blaivas M, Sierzenski P, Theodoro D. Significant hemoperitoneum in blunt trauma victims with normal vital signs and clinical examination. Am J Emerg Med. 2002;20:218–221.
117. Ong AW, McKenney MG, McKenney KA, et al. Predicting the need for laparotomy in pediatric trauma patients on the basis of the ultrasound score. J Trauma. 2003;54:503–508.
118. Fox JC, Boysen M, Gharahbaghian L, et al. Test characteristics of fo-cused assessment of sonography for trauma for clinically significant abdominal free fluid in pediatric blunt abdominal trauma. Acad Emerg Med. 2011;18:477–482.
119. Holmes JF, Gladman A, Chang CH. Performance of abdominal ultraso-nography in pediatric blunt trauma patients: a meta-analysis. J Pediatr Surg. 2007;42:1588–1594.
120. Emery KH, McAneney CM, Racadio JM, et al. Absent peritoneal fluid on screening trauma ultrasonography in children: a prospective com-parison with computed tomography. J Pediatr Surg. 2001;36;565–569.
121. Becker A, Lin G, McKenney MG, et al. Is the FAST exam reliable in severely injured patients? Injury. 2010;41:479–483.
122. Cullinane DC, Schiller HJ, Zielinski MD, et al. Eastern Association for the Surgery of Trauma practice management guidelines for hem-orrhage in pelvic fracture—update and systematic review. J Trauma. 2011;71:1850–1868.
123. Jones AE, Mason PE, Tayal VS, et al. Sonographic intraperitoneal fluid in patients with pelvic fracture: two cases of traumatic intraperitoneal bladder rupture. J Emerg Med. 2003;25:373–377.
124. Blaivas M. Triage in the trauma bay with the focused abdominal sonog-raphy for trauma (FAST) examination. J Emerg Med. 2001;21:41–44.
125. Miletic D, Fuckar Z, Mraovic B, et al. Ultrasonography in the evalua-tion of hemoperitoneum in war casualties. Mil Med. 1999;164:600–602.
126. Sarkisian AE, Khondkarian RA, Amirbekian NM, et al. Sonographic screening of mass casualties for abdominal and renal injuries following the 1988 Armenian earthquake. J Trauma. 1991;31:247–250.
127. Morgan AR, Vasios WN, Hubler DA, et al. Special operator level clini-cal ultrasound: an experience in application and training. J Spec Oper Med. 2010;10:16–21.
128. Brooks AJ, Price V, Simms M. FAST on operational military deploy-ment. Emerg Med J. 2005;22:263–265.

55
done regarding the training and utility of echo by emergency physicians, the most high-yield presentations that may ben-efit from emergency echocardiography, especially when the diagnosis is in doubt, are:
• circulatory shock (6,10)• shortness of breath (7)• chest pain (11)
The use of emergency echo may provide valuable informa-tion in the diagnosis of:
• pulseless electrical activity (PEA) or asystole (12)• hypovolemia (13)• congestive heart failure (14)• pulmonary embolus (2,15,16)• cardiogenic shock (6,10,17)• pericardial effusion with tamponade (5,18–20).
It can also assist in bedside procedures (discussed further in Chapter 8) such as:
• pericardiocentesis (21)• pacemaker placement as well as aid in the identifica-
tion of mechanical pacer capture (either external or internal) (22).
IMAGE ACQUISITIONThere are three basic sonographic windows to the heart: subxyphoid, parasternal long axis (PSLA), and apical four-chamber views (Figs. 4.1–4.5). Many emergency physicians
INTRODUCTIONEmergency echocardiography is one of the most challeng-ing ultrasound examinations for the emergency physician to become comfortable with, but is potentially the most re-warding. Some images and landmarks can be difficult to be obtained consistently and orientation may be confusing at times. However, certain focused applications are well within the scope of all emergency physicians and can provide im-mediate, valuable diagnostic information in a variety of presentations, from arrest situations to unexplained shock, dyspnea, or chest pain (1,2).
CLINICAL APPLICATIONSEmergency echocardiography has been shown to provide diagnostic and prognostic information in an emergency department (ED) population with a variety of suspected cardiac-related symptoms (3–9). Emergency echocardiogra-phy is most likely to be effective when it is used in popula-tions with a relatively high likelihood of pathology that is discernible by focused emergency echo: pericardial effusion, left ventricular systolic dysfunction, severe right ventricular strain, or aortic dilation. The great benefit of emergency echo is that it lowers the threshold for testing, and may aid in mak-ing diagnoses that might otherwise be missed if obtaining an echocardiogram is time-consuming, difficult, or even impos-sible in the ED setting. While much research still needs to be
ARTIFACTS AND PITFALLS . . . . . . . . . . . . . . . . . . . . . . . . . . 68Artifacts. . . . . . . . . . . . . . . . . . . . . . . . . . . . . . . . . . . . . 68Pitfalls . . . . . . . . . . . . . . . . . . . . . . . . . . . . . . . . . . . . . . 68
USE OF THE IMAGE IN CLINICAL DECISION MAKING . . . . . . . . . . . . . . . . . . . . . . . . . . . . . . . . . . . . . . 70Circulatory Shock—Code Situation to Unexplained
Hypotension . . . . . . . . . . . . . . . . . . . . . . . . . . . . . . . 70Shortness of Breath . . . . . . . . . . . . . . . . . . . . . . . . . . . 71Chest Pain . . . . . . . . . . . . . . . . . . . . . . . . . . . . . . . . . . . 71
INCIDENTAL FINDINGS . . . . . . . . . . . . . . . . . . . . . . . . . . . . . 71CLINICAL CASE . . . . . . . . . . . . . . . . . . . . . . . . . . . . . . . . . . . 72
INTRODUCTION . . . . . . . . . . . . . . . . . . . . . . . . . . . . . . . . . . . 55CLINICAL APPLICATIONS . . . . . . . . . . . . . . . . . . . . . . . . . . . . 55IMAGE ACQUISITION . . . . . . . . . . . . . . . . . . . . . . . . . . . . . . . 55NORMAL ULTRASOUND ANATOMY AND PRIMARY
CARDIAC WINDOWS . . . . . . . . . . . . . . . . . . . . . . . . . . . . . 58Subxyphoid Window . . . . . . . . . . . . . . . . . . . . . . . . . . . 59Parasternal Long Axis View . . . . . . . . . . . . . . . . . . . . . . 60Apical Four-Chamber View . . . . . . . . . . . . . . . . . . . . . . 61Alternate Views . . . . . . . . . . . . . . . . . . . . . . . . . . . . . . . 61
PATHOLOGY . . . . . . . . . . . . . . . . . . . . . . . . . . . . . . . . . . . . . . 62Pericardial Effusion, Tamponade . . . . . . . . . . . . . . . . . . 62Left Ventricular Systolic Function . . . . . . . . . . . . . . . . . 65Right Ventricular Strain. . . . . . . . . . . . . . . . . . . . . . . . . 65Aortic Disease . . . . . . . . . . . . . . . . . . . . . . . . . . . . . . . . 67
Richard Andrew Taylor and Christopher L. Moore
Echocardiography4

Cardiac Anatomy
RV
RV
LV
LV
RA
RA
LA
LA
Figure 4.1. Cardiac Anatomy. The heart is cut from the apex to the base (long axis) and folded down to expose the internal anatomy. The lower cut shows the structures in the orientation obtained from a subxyphoid window. RV, Right ventricle; LV, Left ventricle; RA, Right atrium; LA, Left atrium.
A.
B.
C.
D.
Figure 4.2. Transducer Placement. This diagram shows transducer placement and direction for the three primary windows (subxyphoid, para-sternal long axis, and apical four-chamber) as well as two secondary windows (parasternal short axis and suprasternal). The arrow indicates direction of the indicator, generally to the patient’s right or patient’s head. A, Subxyphoid; B, long and short axis parasternal; C, apical; D, suprasternal.
D
Figure 4.3. Transducer Placement, Orientation, and Anatomy for the Subxyphoid (Subcostal) Cardiac View. Transducer placement is below the xyphoid process with the indicator to the patient’s right and the beam angled up into the chest (A). The heart is seen as if it were cut in the plane of the ultrasound beam and folded down (B), with the lower image show-ing the anatomy as it appears on the ultrasound screen (C). Ultrasound image of the heart seen from the subxyphoid transducer position (D).
56
Xyphoidprocess
A. B.
C.
Subxyphoid View

Chapter 4 / Echocardiography 57
B.
A.
C.Xyphoidprocess
Parasternal Long Axis View
D
Figure 4.4. Transducer Placement, Orientation, and Anatomy for the Parasternal Long Axis Cardiac View in the emergency Medicine Orienta-tion. The transducer is placed to the left of the sternum at the fourth intercos-tal space with indicator to the patient’s right shoulder and the beam cutting along the long axis of the heart (A). The heart is seen as if it were cut in the plane of the ultrasound beam and folded down (B), with the lower image showing the anatomy as it appears on the ultrasound screen (C). Ultrasound image of the heart seen in the long axis parasternal transducer position (D). Note how the emergency medicine long axis orientation has left-sided struc-tures, such as the apex of the heart, on the right side of the screen, which is the opposite of traditional cardiology orientation. Right ventricle (RV), left ventricle (LV), aorta (Ao), left atrium (LA), mitral valve (MV).
are most familiar with the subxyphoid (or subcostal) view as it is commonly taught as part of the trauma exam, although the parasternal window may be easier to obtain and often provides superior visualization of many cardiac structures. It can be difficult to obtain all three windows in all patients, but comfort with different views should allow some visualization in even the most difficult patients. Additional windows that may be of use to the emergency physician are the parasternal short axis and the suprasternal notch views (Fig. 4.2).
Begin with patients supine and completely flat if they are able to tolerate the position. Some windows may also be im-proved by having the patient assume a left lateral decubitus position, which pulls the heart away from behind the sternum and toward the ribs of the left chest. Because the heart is on the left side of the body, some sonographers choose to position the machine on this side of the patient, although scanning from the right side of the patient is typically not too difficult and may be more comfortable if other examinations are done from this side.
The transducer choice is typically a small footprint phased-array transducer with a frequency range of 2 to 5 MHz,
allowing visualization between the ribs, although, if unavail-able, a curvilinear probe may be used, particularly for the subxyphoid view. Many machines have a cardiac setting or application for the transducer that is optimized for cardiac visualization allowing improved differentiation between myocardium and blood. If available, tissue harmonic imag-ing should be turned on to enhance visualization.
In contrast to many other areas of the body in which there are well-defined and separate internal anatomic landmarks, such as the vertebral body for abdominal aorta identifica-tion, the landmarks for sonographic images of the heart are structures within the heart itself, making it often difficult to initially orient oneself when scanning. The position of the heart in relation to external landmarks may vary remarkably from patient to patient. Obese patients tend to have a heart that is high up in the chest with a more transverse axis, while patients with chronic obstructive lung disease often have a heart in a nearly longitudinal axis and dropped down almost to the costal margin.
Scanning technique and transducer orientation may be a source of confusion in echocardiography. Cardiologists

58 SeCtion ii / Ultrasound in the Resuscitation of Acute Injury or Illness
B.A.
C.Xyphoidprocess
Apical Four Chamber View
D
Figure 4.5. Transducer Placement, Orientation, and Anatomy for the Apical Four-Chamber Cardiac View. The transducer is placed lateral to the nipple line with the indicator directed to the patient’s right (may be toward the ceiling on the lateral chest wall of a supine patient) (A). The heart is seen as if it were cut in the plane of the ultrasound beam (B) and folded down, with the lower image showing the anatomy as it appears on the ultrasound screen (C). Ultrasound image of the heart seen in the apical transducer position (D). Right ventricle (RV), left ventricle (LV), right atrium (RA), left atrium (LA).
typically perform echocardiography from the left side of the patient, with the transducer indicator corresponding to the right side of the screen. 8PEDIATRIC CONSIDER-ATIONS: Pediatric cardiologists perform echocardiograms with the image originating from the inferior portion of the screen (i.e., upside down as compared with standard ultrasound imaging).7 This is in contrast to other emergency ultrasound examinations that are typically performed from the right side of the patient with the indicator corresponding to the left side of the screen. The net result is that in emergency echo, two of the three primary cardiac windows (subxyphoid and apical four-chamber) are consistent with a cardiology orientation. However, the PSLA view traditionally described by cardi-ologists is flipped so that the apex of the heart appears on the left side of the screen. This leaves the emergency physi-cian with two choices in obtaining the PSLA view: either reverse the indicator in order to get an image that differs from typical emergency ultrasound orientation, or obtain a PSLA view that is consistent with abdominal applications, but reversed from a typical cardiology scan. In this text we have chosen to use an orientation consistent with the rest of emergency ultrasound, in which all windows (including the PSLA) are obtained by keeping the transducer to the patient’s
right, with right-sided cardiac structures appearing on the left side of the screen as they are viewed. Regarding the primary cardiac views, the only image that will appear significantly different from illustrations in cardiology texts is the PSLA (Fig. 4.6) (14). With practice, using a consistent orientation (indicator in the arc from the patient’s right to the patient’s head), each of the three views will meld into a coherent pic-ture of the heart, with the PSLA being slightly higher than the subxyphoid and rotated clockwise from the apical view, but with structures consistently oriented on the same side of the screen throughout (Fig. 4.6).
NORMAL ULTRASOUND ANATOMY AND PRIMARY CARDIAC WINDOWSThe heart is a three-dimensional structure that sits obliquely in the chest. The base of the heart, which includes the atria and major valves, is to the right and slightly posterior, while the apex of the heart points to the left, anteriorly and inferi-orly (Fig. 4.1). Blood flowing from the right-sided inferior vena cava (IVC) joins the right atrium (RA), and then pro-ceeds through the tricuspid valve to the right ventricle (RV).

Chapter 4 / Echocardiography 59
PSLA – EM
PSLA – Cardiology
SX A4C
Figure 4.6. Primary Bedside echo Windows. The subxyphoid (SX), apical four chamber (A4C), and parasternal long axis (PSLA) views are shown. Note how the subxyphoid is similar to the apical four-chamber, only the apical four-chamber image is rotated slightly counterclockwise. The parasternal long axis is very similar to the subxyphoid, only the parasternal long axis is at a higher level (includes aortic root). The image typically seen in a cardiology parasternal long axis is shown for reference; it is flipped 180 degrees. If desired, this image may be obtained by rotating the probe 180 degrees or flipping the screen orientation. Right ventricle (RV), left ventricle (LV), right atrium (RA), left atrium (LA), mitral valve (MV), aorta (Ao).
Typically, hepatic veins in the liver can be followed sono-graphically into the IVC and then through the RA to the RV from a subxyphoid approach, which is often a useful maneu-ver for ultrasound orientation. The RV is anterior and to the right, with the free wall frequently seen adjacent to the liver. The left atrium (LA) is posterior and drains across the mitral valve to the muscular left ventricle (LV). The left ventricular outflow tract (aortic valve and aortic root) is in the center of the base of the heart and is typically best seen on the PSLA view. In general, the “long axis” of the heart may be thought of as a line that runs from the center of the base of the heart to the apex, corresponding to a line from the patient’s right shoulder to left lower flank. A long axis view is one in which the ultrasound plane is parallel to this line, while a short axis is perpendicular to this axis and typically cuts across the left ventricle, providing a “donut” type of image.
Subxyphoid WindowThe subxyphoid view is obtained by placing the transducer below the sternum at the costal margin with the transducer indicator to the patient’s right (Fig. 4.3). The plane of the ultrasound transducer should be angled up toward the left chest, 8PEDIATRIC CONSIDERATIONS: The heart in young children sits more in the center of the chest. Therefore the plane of the beam is directed toward the chin as opposed to the left shoulder.7 with the transducer pressed nearly flat on
the abdomen and a firm amount of pressure applied in order to get the plane of the ultrasound beam below the rib cage. A helpful technique is to ask patients to bend their knees slightly to allow the physician to press the transducer flat and into the abdomen more deeply below the costal margin. 8PEDIATRIC CONSIDERATIONS: Probe position under the cos-tal margin is often uncomfortable for children. Slide the probe more caudal toward the umbilicus to reduce discomfort. It is often easier to push into the more protuberant abdomen than under the relatively recessed xyphoid process.7 Although it may be somewhat counterintuitive (as the heart is a left-sided structure), it is also sometimes helpful to move the trans-ducer slightly to the right to use the liver as a sonographic window into the left chest. Remember that the subxyphoid window is obtained from the abdomen and the heart is in the chest and requires the ultrasound beam to be directed cepha-lad. One of the most frequent causes of novice sonographers being unable to obtain a subxyphoid image is that they are placing the transducer on the abdominal wall and imaging straight down (i.e., toward the back), instead of flattening the transducer against the abdomen and applying adequate pressure to image the chest cavity. Placing the scanning hand over the top of the transducer with the thumb on the indicator and pressing into the abdomen with the transducer nearly flat on the abdomen will help to avoid this tendency. If the sub-xyphoid scan is done as a part of the focused assessment with sonography for trauma (FAST) scan, it will be necessary to

60 SeCtion ii / Ultrasound in the Resuscitation of Acute Injury or Illness
keeping the ultrasound plane along the long axis of the heart (Fig. 4.4). 8PEDIATRIC CONSIDERATIONS: In children 3 months and younger, the heart is more midline. Better quality images can often be obtained by scanning on the right of the sternum. Subtle shifts in position (more tilting than sliding) will produce dramatic changes in image quality. The sternum pro-vides less acoustic interference in young children, so scanning directly through the sternum may be possible.7 If a cardiol-ogy orientation for the PSLA view is desired, the indicator can be reversed (either on the machine or by directing the transducer indicator toward the patient’s left hip).
The PSLA view typically includes the RV anteriorly, with LA, mitral valve, LV, and left ventricular outflow tract more posteriorly (Figs. 4.4 and 4.8; VIDEO 4 .2). The anterior and posterior leaflets of the mitral valve are often clearly seen, along with the accompanying chordae tendinae and papillary muscles. The aortic valve can usually be seen to open in systole. The descending aorta can be seen pass-ing down the chest posterior to the left ventricle (Fig. 4.8). Pericardial effusions are often located posteriorly on the PSLA view (Fig. 4.9; VIDEO 4 .3). As they enlarge, they may also be seen anteriorly between the RV free wall and the pericardium as well as circumferentially, and it may be help-ful to tilt the transducer in order to include the apex of the heart (Figs. 4.10 and 4.11). Again, be careful to visualize the posterior (deep) pericardium as well, which may harbor an isolated effusion (Fig. 4.12). If feasible, the PSLA window may be enhanced by having the patient lie in a left lateral
increase the focus depth to completely visualize the posterior pericardial space. 8PEDIATRIC CONSIDERATIONS: With the relative tachycardia, it may be difficult to evaluate the pediatric heart in real time. Record video clips then play them back at half speed (an option or setting on most ultrasound machines) for easier analysis.7
When correctly obtained, the subxyphoid view is a four-chamber image that includes the RA, RV, LA, and LV (Figs. 4.3 and 4.7; VIDEO 4 .1). The RA, tricuspid valve, and RV are somewhat anterior and to the right. The LA, mitral valve, and LV are more posterior. The apex of the LV should be anterior and to the right side of the screen (patient’s left). It may be helpful to trace the hepatic veins draining from the liver into the IVC and up into the RA. The subxyphoid view is an excellent view for pericardial effusion, which is typi-cally seen as a significant anechoic space between the right ventricular free wall and the liver, corresponding to an infe-rior location of the fluid around the heart, but seen anteriorly on the screen (near the transducer). Be aware that the subxy-phoid window may overemphasize the relative size of the RV if it cuts across it in an oblique plane, but overall is a good window for comparing the RV:LV ratio. The subxyphoid view is typically excellent in patients with chronic obstructive lung disease, as chest hyperexpansion moves the heart closer to the abdomen, but may be limited in patients who are obese or have other causes of abdominal distension. If the patient is cooperative, the subxyphoid view may often be enhanced by having the patient take and hold a deep breath.
Parasternal Long Axis (PSLA) ViewThe PSLA view is an outstanding window to the heart and is often complementary to the subxyphoid view. Patients with a heart that is high up in the chest or with abdominal disten-sion often have a poor subxyphoid window, but an excellent PSLA window. Conversely, patients with hyperexpanded lungs (chronic lung disease or on a ventilator) typically have a good subxyphoid view, but lack the PSLA view.
The PSLA view is obtained with the transducer lateral to the sternum at the left fourth or fifth intercostal space 8 PEDIATRIC CONSIDERATIONS: As the pediatric heart lies higher in the chest, begin at the third or fourth interspace.7 And the indicator directed toward the patient’s right shoulder,
Figure 4.7. Subxyphoid View. The RV is seen as a small wedge against the liver.
Figure 4.8. Parasternal Long Axis View. The aortic valve and aortic root are clearly seen. Note the descending aorta (Ao).
Figure 4.9. Parasternal Long Axis View. Small pericardial fluid is seen both posteriorly and anteriorly.

Chapter 4 / Echocardiography 61
most potential information (Fig. 4.5). The ability to obtain an apical view may be greatly enhanced by having the patient assume a left lateral decubitus position, allowing the apex of the heart to be pressed against the left chest. The apical view is obtained laterally at about the level of the nipple in males. In females, the transducer will frequently need to be placed lateral to and somewhat beneath the breast tissue. As in all emergency ultrasounds, the transducer indicator should be directed to the patient’s right, although this may be more toward the ceiling in a supine patient when obtaining a very lateral apical view. (Think of the direction of the indicator as wrapping around the torso.) To obtain a window, a rib inter-space should be found. The transducer may need to be rotated somewhat to obtain an unobstructed view between the ribs.
In a properly obtained apical view, the apex of the heart is close to and near the center of the transducer face. The ventricles will be toward the face of the transducer, and the atria will be deeper. The interventricular septum should run nearly vertically down the screen, with the right-sided struc-tures (RV and RA) on the left of the screen and the left-sided structures (LV and LA) on the right side of the screen. The tricuspid valve should be seen between the RV and the RA and the mitral valve between the LV and the LA (Fig. 4.13). A common pitfall with this approach is not being sufficiently lateral on the patient when obtaining the image, resulting in an image that appears more like a subxyphoid view, with the septum running diagonally toward the apex on the right side of the screen.8PEDIATRIC CONSIDERATIONS: Given the more midline po-
sition of the heart, proper positioning for this view will be more medial—closer to the sternum than the nipple.7 When prop-erly obtained, this view is excellent in assessing for pericar-dial effusion, LV function, as well as RV size relative to LV (Fig. 4.14 and 4.15; VIDEO 4 .4). For users comfortable with Doppler examination, this view is ideal for obtaining Doppler flow across the tricuspid, mitral, and aortic valves due to the parallel alignment of flow across these valves and the ultrasound wave propagation (Fig 4.16; VIDEO 4 .5).
Alternate ViewsOf the numerous other cardiac windows, two are of particu-lar interest to the emergency physician: the parasternal short
Figure 4.10. Parasternal Long Axis View. Large pericardial effusion both posterior and anterior.
Figure 4.11. Parasternal Long Axis View. Fluid seen posteriorly as well as anteriorly.
Figure 4.12. Parasternal Long Axis View. Predominant posterior peri-cardial effusion (Effsn). This is a moderate-sized effusion, but only trace fluid is seen anteriorly.
decubitus position, allowing gravity to pull the heart from behind the sternum into a better window.
Apical Four-Chamber ViewThe apical four-chamber view is typically the most difficult of the three primary windows to obtain, but also holds the
Figure 4.13. Apical Four-Chamber View. The closed mitral valve is clearly seen between LA and LV. Note the descending aorta (Ao).

62 SeCtion ii / Ultrasound in the Resuscitation of Acute Injury or Illness
Figure 4.14. Apical Four-Chamber View. Large circumferential pericar-dial effusion.
A
B
Figure 4.15. Apical Four-Chamber View. Diastole (A) and systole (B).
Figure 4.16. Apical Four-Chamber. Large mitral regurgitant jet.
axis and suprasternal notch views. The parasternal short axis view is obtained by rotating the transducer 90 degrees clockwise from the PSLA view. This view cuts across the ventricle in sort of a “donut” configuration, and may allow for excellent assessment of overall circumferential LV con-traction. There are several levels for the short axis (Figs. 4.17 and 4.18; VIDEO 4 .6). Typically the papillary muscle level is most useful, with higher levels showing the mitral and aortic valves.
The suprasternal notch view is obtained by placing the transducer just above the sternum. This view is difficult be-cause of the small size of this notch as well as the many
vascular structures that cross the superior mediastinum, but when properly obtained will show the aortic arch allow-ing assessment for dilation, aneurysm, and dissection flaps (Fig. 4.19).
PATHOLOGYPericardial Effusion, TamponadeThe space between the epicardium and the pericardium typi-cally has a small amount of epicardial fat and may contain up to 10 mL of serous physiologic fluid. A variety of traumatic and medical conditions may cause this area to be filled by fluid, pus, or blood. Ultimately fluid collecting in this space impedes the ability of the right side of the heart to fill, caus-ing tamponade. 8PEDIATRIC CONSIDERATIONS: The more outlying myocardium has a less echogenic appearance than the inner myocardium. Do not confuse this with a pericardial effusion. This region will move coordinately with the rest of the heart. Increasing the gain will reveal its echogenicity and distinguish it from pericardial effusion.7
The amount of fluid necessary to cause tamponade typi-cally depends on how rapidly it has accumulated. An acute traumatic tamponade may result from as little as 50 mL in the pericardial space, especially in the presence of other sources of blood loss, while the gradual accumulation of pericardial fluid in a cancer patient may be relatively well tolerated over 200 mL. Because small effusions tend to collect inferiorly and posteriorly, the subxyphoid approach is typically the best window, providing a view of the inferior pericardium be-tween the liver and the RV (Figs. 4.20–4.22; VIDEO 4 .7). Particular care should be taken to look posteriorly if only a parasternal view is obtained (Figs. 4.12 and 4.18). As effu-sions increase in volume, they may be seen anteriorly and circumferentially. Pericardial effusions are typically charac-terized as small, moderate, or large. This is often somewhat subjective, and grading systems differ, but typically an ef-fusion is considered small if the posterior echo-free space measures <1 cm, moderate if 1 to 2 cm, and large if >2 cm (23,24).
B-mode or gray-scale echocardiographic evidence of tamponade is present when there is either mid-systolic (de-fined in relation to ventricular contraction) collapse of the RA or diastolic collapse of the RV secondary to a pericardial

Chapter 4 / Echocardiography 63
AC
B D
Figure 4.17. Parasternal Short Axis View Showing the Typical Donut View of the LV. Papillary muscle level (A), mitral valve level (B), aortic valve level (C). D: Zoomed view of the trileaflet aortic valve in short axis showing the Mercedes Benz sign.
Figure 4.18. Parasternal Short Axis View, Small Pericardial effusion. The effusion is seen only posteriorly. Note the descending aorta (Ao).
Figure 4.19. Aortic Arch, Seen via the Suprasternal Notch. The brachiocephalic (BC), left common carotid (LCC), left subclavian (LS) arteries are well visualized coming off the arch.
effusion (Figs. 4.23–4.25) (25). This is indicative of pericar-dial fluid preventing filling of these chambers. In addition to right-sided collapse, a plethoric IVC with lack of inspiratory

64 SeCtion ii / Ultrasound in the Resuscitation of Acute Injury or Illness
Figure 4.20. Small Pericardial effusion, Seen Only between the rV Free Wall and Liver in this Subxyphoid View. This effusion was not seen on the parasternal view.
Figure 4.21. Subxyphoid View. Moderate to large pericardial effusion.
Figure 4.22. Subxyphoid View. Small pericardial effusion.
Figure 4.23. Parasternal Long Axis View. Large effusion with evidence of RV collapse, seen anteriorly.
Figure 4.24. Apical Four-Chamber View with Large Circumferential effusion and evidence of right Atrial Collapse. Note the fibrinous material adjacent to the left ventricle.
Figure 4.25. Short Axis View. Anterior effusion with RV collapse.
collapse is also frequently noted with tamponade, because the blood is prevented from flowing into the heart and backs up into the IVC. Doppler examination showing marked in-spiratory increase in flow across the mitral or tricuspid valve also indicates tamponade physiology (the ultrasound version of pulsus paradoxus) (18).

Chapter 4 / Echocardiography 65
Left Ventricular Systolic FunctionLeft ventricular systolic function is typically quantified as an ejection fraction (EF), representing the percentage of blood ejected from the ventricle during systole. While there are quantitative methods for estimating the EF, it is frequently determined by visual estimation using echo (26). It has been shown that with goal-directed training, emergency physicians can learn to estimate left ventricular systolic function and are accurate when compared to cardiologists (8). A normal EF is typically 55% or above, and may be qualitatively graded as normal (>50%), moderately depressed (30% to 50%), or severely depressed (<30%). The most severe degree of left ventricular systolic dysfunction is the absence of detectable cardiac activity, and although valvular motion may be ob-served, it typically signifies agonal cardiac activity.
Estimating the EF is an acquired skill requiring the so-nographer to see multiple examples of normal and depressed systolic function before competency is achieved. When at-tempting to estimate left ventricular systolic function, it is important to watch the border of the endocardium, which usually appears slightly echogenic and represents the inner-most layer of the heart. The myocardium should thicken uni-formly as the endocardium moves in a healthy heart. When possible, the left ventricular cavity should be imaged in two planes, ideally orthogonal to each other (i.e., PSLA and para-sternal short axis). A uniformly and circumferentially con-tracting endocardium that moves significantly (achieves a 50% reduction in chamber volume) from diastole to systole is indicative of good function. While better seen with dy-namic images, Figure 4.26 shows a heart with good function in diastole and systole that is contrasted with a dilated LV that is minimally contractile in Figure 4.27 ( VIDEOS 4 .8 and 4 .9). Poor LV function is often coupled with a dilated or plethoric IVC, indicating fluid overload and congestive heart failure (Fig. 4.28; VIDEO 4 .10).
An additional aid in estimating the EF is measurement of the E-point septal separation (EPSS). EPSS is the minimal distance from the septal wall and the anterior mitral valve leaflet in a PSLA view during diastolic filling (Fig. 4.29;
VIDEO 4 .11). For a normally contracting heart, the EPSS should be <1 cm, corresponding to an EF of >50% (27). As the EF worsens, this distance tends to increase, but measure-ments only somewhat correspond to actual EF percentages (Fig. 4.30; VIDEO 4 .12). Also, the EPSS may be falsely elevated in patients with septal or diffuse LV hypertrophy or underestimated in valvular disease.
It is tempting to look for focal wall motion abnormali-ties, as these may be indicative of cardiac ischemia. While occasionally these may be grossly obvious, the interobserver variability is high even among cardiologists, and this is gen-erally beyond the scope of emergency echo.
Right Ventricular StrainIn the absence of a shunt, the change in volume from diastole to systole is the same per cardiac cycle in both the RV and the LV. However, the thin-walled and lower-pressure RV is anatomically wrapped around the muscular LV and thus ap-pears to be less wide on most ultrasound windows, particu-larly the PSLA and apical views. In a process where there is outflow obstruction the RV will bow into the LV septum making it appear large relative to the LV. This finding may be appreciated by echo. Other echo signs of RV strain include
Figure 4.26. A Parasternal Long Axis View of a Patient with excellent Systolic Function. The cardiac cycle is shown in diastole (A), mid-systole (B), and end-systole (C). There is essentially complete cavity collapse. This patient was initially hypotensive and tachycardic, but responded well to intravenous fluids.
A
B
C
RV hypokinesis and paradoxical septal motion, where the interventricular septum actually appears to bow out some-what toward the LV during systole. While many processes may cause RV strain, the acute process causing increased RV outflow obstruction and RV dilatation that is of most interest to the emergency physician is massive pulmonary embolus,
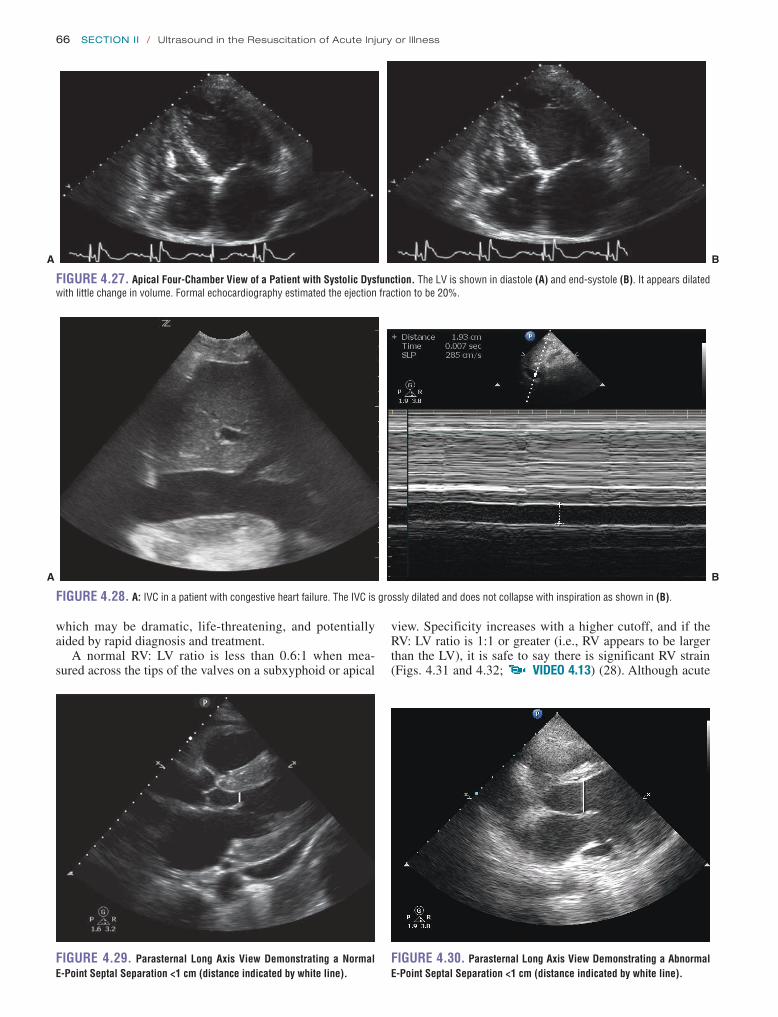
66 SeCtion ii / Ultrasound in the Resuscitation of Acute Injury or Illness
A B
Figure 4.27. Apical Four-Chamber View of a Patient with Systolic Dysfunction. The LV is shown in diastole (A) and end-systole (B). It appears dilated with little change in volume. Formal echocardiography estimated the ejection fraction to be 20%.
A B
Figure 4.28. A: IVC in a patient with congestive heart failure. The IVC is grossly dilated and does not collapse with inspiration as shown in (B).
Figure 4.29. Parasternal Long Axis View Demonstrating a Normal e-Point Septal Separation <1 cm (distance indicated by white line).
Figure 4.30. Parasternal Long Axis View Demonstrating a Abnormal e-Point Septal Separation <1 cm (distance indicated by white line).
which may be dramatic, life-threatening, and potentially aided by rapid diagnosis and treatment.
A normal RV: LV ratio is less than 0.6:1 when mea-sured across the tips of the valves on a subxyphoid or apical
view. Specificity increases with a higher cutoff, and if the RV: LV ratio is 1:1 or greater (i.e., RV appears to be larger than the LV), it is safe to say there is significant RV strain (Figs. 4.31 and 4.32; VIDEO 4 .13) (28). Although acute

Chapter 4 / Echocardiography 67
Figure 4.31. Parasternal Long Axis View, Showing rV Dilatation relative to LV. The ratio of RV to LV is greater than 1:1.
Figure 4.32. Apical Four-Chamber View Showing a Dilated rV. This patient was found to have a saddle embolus. The view is slightly medial, as the apex of the heart is off the screen with the septum not quite vertical.
RV strain is poorly sensitive for pulmonary embolus, it may be reasonably specific (29). RV strain provides prognostic information in patients with proven pulmonary emboli, and mortality of patients with pulmonary emboli and RV strain is 10 times the mortality without RV strain (16,30). While some authors have suggested that RV strain in the presence of proven pulmonary embolism may be an indication for thrombolytic therapy, a definite mortality benefit has not been demonstrated (31,32).
It is important to keep in mind that there are many chronic conditions that cause RV strain, including chronic lung dis-ease, pulmonary hypertension, pulmonary stenosis, and others. Typically these are accompanied by RV hypertrophy, and a RV free wall in excess of 5 mm likely indicates a more chronic condition (Figs. 4.33 and 4.34; VIDEO 4 .14).
The identification of RV strain should be made with cau-tion by the emergency physician and followed by consulta-tive echocardiography if the situation allows. RV strain is not sensitive for pulmonary embolus, as many pulmonary emboli
Figure 4.33. rV Dilatation with rV Hypertrophy. This patient had a history of chronic obstructive pulmonary disease.
Figure 4.34. Massive rV Dilatation. This was secondary to chronic pulmonary hypertension.
do not have any identifiable increase in RV pressure, even by consultative echo. However, identification of RV strain by emergency echo may at times be fairly obvious and dramatic, and may help to guide the diagnostic and therapeutic course in patients with suspected pulmonary emboli.
Aortic DiseaseThe thoracic aortic root and proximal ascending aorta can be well visualized on the PSLA view interposed between the RV and LA on the left side of the screen (Fig. 4.8). Visualization can be enhanced by sliding up a rib space and slightly rocking the probe downward to achieve a longer segment of the ascending thoracic aorta. Assessment for dilation and aneurysm involves measurement of the widest visible portion along this segment with caliper placement using a leading-edge-to- leading-edge method similar to biparietal diameter measurements used in fetal dating (Figs. 4.35 and 4.36). Bedside echo cutoffs for thoracic aortic aneurysmal disease are <4 cm (normal), 4 to 4.5 cm (borderline), and >4.5 cm (abnormal) with over-all good accuracy when compared to computed tomographic angiography (33). In addition to the above, a cross-sectional

68 SeCtion ii / Ultrasound in the Resuscitation of Acute Injury or Illness
2. Side lobe artifact occurs when sound is deflected from the sides of a fluid-filled object. While more typically en-countered in the urinary bladder or gallbladder, side lobe may occasionally make it appear as if there is a mass in-side the atrial or ventricular cavity. If artifact is suspected, imaging the structure in a different window usually will identify it. Confirmatory or follow-up consultative echoes should occur if there still appears to be an abnormality.
Pitfalls 1. Perhaps the greatest potential pitfall of emergency echo
is the temptation to call or rule out diagnoses that are beyond the scope of the typical emergency physician, especially in the absence of accurate Doppler evaluation. These include, but are not limited to, valvular stenosis or regurgitation, diastolic dysfunction, focal wall motion abnormalities, and endocarditis.
2. It takes some experience to distinguish between epicardial fat and normal or physiologic fluid in the pericardial space from small effusions (Figs. 4.37
Figure 4.35. Measurement of the Aortic root on Parasternal Long Axis View.
Figure 4.36. Thoracic Aortic Dilatation. Normal is usually considered below 4 cm.
view of the descending aorta can be seen lying underneath the LV in the PSLA view; by rotating the probe to a parasternal short axis view, a long axis view of the aorta can be obtained. To further enhance thoracic aortic visualization the arch may be viewed through the suprasternal notch approach.
It is tempting to try to identify aortic dissection by bedside echo; however, it is fraught with potential false positives, and previous studies demonstrate a low sensitivity with the trans-thoracic approach. Emergency physicians should recognize these limitations and seek either consultation or further di-agnostic imaging when the diagnosis is not absolutely clear.
ARTIFACTS AND PITFALLSArtifactsThe most common sonographic artifacts encountered in echo are mirror image and side lobe artifact.
1. Mirror image artifact occurs when sound encounters a strong reflector, and the more proximal structure ap-pears to be duplicated on the other side of the reflector. Occasionally, there may appear to be another structure contracting on the other side of the pericardium due to mirror image.
Figure 4.37. Anterior Fat Pad, Seen on Parasternal Long Axis View. The relative echo-free space (arrow) may be mistaken for pericardial effusion, but is small and not seen in the posterior pericardium. With dynamic images the space diminishes in diastole (VIDEO 4.4).
Figure 4.38. Subxyphoid View, Showing a Fat Pad Anterior to the rV. There appear to be some echoes in the space, indicating fat and not fluid.

Chapter 4 / Echocardiography 69
and 4.38; VIDEO 4 .15). A key to this is appreciating the mottled echogenicity of fat in contrast to the typi-cally anechoic effusion. Take care that the gain is neither too low nor too high, and watch to see if an anechoic space continues to be present throughout the cardiac cycle. A space that appears and disappears is less likely to be a significant effusion. If effusion is suspected on any view, it is helpful to try to confirm using another view. If obtainable, the subxyphoid is typically most helpful and sensitive. While large effusions may track anteriorly, they typically do not exist there in isolation. In particular, the anterior pericardium in the PSLA view often appears to have a small echo-free space that should not be taken to be effusion if there is no fluid seen pos-teriorly or on the subxyphoid view.
3. Fluid in other spaces, particularly the pleural spaces, may be mistaken for pericardial fluid. On the right side, the IVC should be followed and may show a border be-tween the vessel and the effusion (Figs. 4.39 and 4.40). A left pleural effusion may be particularly difficult to distinguish as it may appear to be directly against the ventricular free wall of the apex of the heart (Fig. 4.41). When differentiating fluid on the left side of the heart as pleural or pericardial effusion, if possible it is helpful to visualize the descending aorta. Pericardial fluid will tend to interpose itself between the posterior heart and aorta, while pleural fluid will not (Fig. 4.42). In either case, if pleural effusion is suspected, a quick coronal
A
B
Figure 4.39. right Pleural effusion, from Subxyphoid Approach. In (A) the arrow shows the edge of the RA. In (B) the RA can be seen as separate from the pleural effusion.
Figure 4.40. Pleural and Pericardial Fluid, Subxyphoid View. The peri-cardium is seen between the large right pleural effusion and the pericardial effusion.
Figure 4.41. Apical View, Large Left Pleural effusion. The serpiginous structure is lung tissue within the pleural effusion.
Figure 4.42. Pleural and Pericardial effusion, Low Parasternal View. The circular structure is the descending aorta (Ao), sitting on the thoracic spine. The line on the right side of the screen is the pericardium, separating pericardial (PCE) from pleural fluid (PLE). Note how the pericardial fluid is beginning to interpose itself between the heart and the descending aorta, while the pleural effusion is lateral to the aorta.
view in the right and left flanks (as in a trauma scan) should be able to establish whether there is fluid in the pleural space. If pleural fluid is present, use caution in calling a pericardial effusion in addition to the pleural effusion unless fluid can be seen on both sides of the pericardium (Figs. 4.40 and 4.42).

70 SeCtion ii / Ultrasound in the Resuscitation of Acute Injury or Illness
and 4.43), as contrasted with a poorly contractile LV and a dilated IVC, indicating cardiogenic shock (Figs. 4.27, 4.28 and 4.44).
In patients with penetrating chest trauma, especially those with shock, emergency echo may be truly lifesaving in its ability to rapidly identify traumatic tamponade. In a retro-spective review of patients with penetrating cardiac injury, immediate emergency echo evaluation for pericardial fluid decreased the time to operative intervention and increased survival (9).
Emergency echo has shown great potential for patients with nontraumatic unexplained hypotension. Emergency echo may be incorporated as a portion of a focused sono-graphic examination that quickly screens for important and treatable causes of hypotension or PEA. When approach-ing the patient with unexplained hypotension, an emergency physician should first rule out effusion, then assess overall LV function with attention to volume status. Transthoracic
4. When attempting to determine overall left ventricular systolic function, two orthogonal views should be ob-tained (i.e., PSLA and parasternal short axis), allow-ing for the possibility of significant focal wall motion abnormalities.
5. Right ventricular dilatation is best visualized from a PSLA or apical view, as the subxyphoid view may cut obliquely across the RV, overemphasizing the size. 8 PEDIATRIC CONSIDERATIONS: Congenital cardiac anat-omy is very difficult to image even for the experienced echosonographer. Advanced imaging techniques are nec-essary to visualize extracardiac lesions (e.g., coarctation of the aorta, patent ductus arteriosus, transposition of the great vessels, total anomalous pulmonary venous return), and septal defects require infusion studies for optimal visualization. Complex congenital lesions, including hypo-plastic left heart and tetralogy of Fallot, have abnormally shaped and positioned hearts, making imaging and inter-pretation challenging. The presence of congenital heart disease is supported by signs of congestive heart failure, including poor function, plethoric IVC with little respiratory variability, and pleural and pericardial effusions.7
USE OF THE IMAGE IN CLINICAL DECISION MAKINGCirculatory Shock—Code Situation to Unexplained HypotensionIncreasingly, the assessment of critical patients incorpo-rates information from a number of ultrasound applica-tions, including echo, IVC, thoracic, and FAST images. A comprehensive approach to the unstable patient combining these applications is presented in Chapter 7. Emergency echo is the first and potentially most useful study in unsta-ble patients.
Perhaps the most dramatic use of emergency echo is in assessing the patient in circulatory shock, whether from a medical or a traumatic cause where a visual picture of the heart and IVC may quickly establish whether poor perfu-sion is due to a “pump problem” or a “volume problem.” In true arrest situations emergency echo may be valuable in assessing the need for further interventions (34). In a series of 169 patients in a code situation, absence of cardiac activity by ultrasound was found to be 100% predictive of death in the ED (4). In patients without organized electrical activity, either asystole or ventricular fibrillation, it is not expected that there would be any degree of left ventricular contrac-tion. However, ultrasound may be useful in distinguishing between the two, and some authors have suggested that fine ventricular fibrillation may at times be misinterpreted as asystole (3). The ultrasound appearance of fibrillation is that of a “shivering” myocardium.
PEA was formerly known as electromechanical dissocia-tion; however emergency echo has demonstrated that in many cases there was some cardiac activity, and thus this description is a misnomer (35). For patients who are in PEA, ultrasound may be able to quickly diagnose or ex-clude several treatable causes, most notably tamponade and hypovolemia (12). The typical appearance of hypovolemia is a well contracting endocardium and a flat IVC (Figs. 4.26
Figure 4.43. Subxyphoid View of iVC During inspiration. The IVC nearly collapses, indicating a low preload.
Figure 4.44. Sagittal View of the iVC Showing a Dilated iVC. This subxyphoid view is obtained with the transducer indicator directed toward the patient’s head. It is a particularly useful view for watching the IVC during inspiration, as diaphragmatic movement will not move the IVC out of view (as in a transverse view). Note the small inferior pericardial effusion.

Chapter 4 / Echocardiography 71
causes and etiologies. In patients presenting with chest pain concerning for pericarditis, emergency echo can determine if there is any significant pericardial effusion. Additionally bedside echocardiography can serve to modify probabilities of thoracic aortic disease as a cause of chest pain through the identification of dilation or aneurysm, while occasion-ally picking up an aortic dissection flap (Figs. 4.36 and 4.45) (19,40).
INCIDENTAL FINDINGSGoal-directed echo should focus primarily on finding and rul-ing out the pathologic findings described above. Inevitably, as more echocardiograms are performed, other findings will be discovered. Some of these are simple and may be obvious from the patient’s history and electrocardiogram (EKG), that is, presence of a pacer wire (Fig. 4.46; VIDEO 4 .16) or left ventricular hypertrophy (Fig. 4.47; VIDEO 4 .17). Others
echo by emergency physicians has been shown to be ac-curate in determining left ventricular function in patients with unexplained hypotension (8). A collapsed IVC with a well- contracting LV indicates the need for initial fluid resuscitation, while adequate volume status with LV dys-function may indicate the need for additional pressor agents. The presence of severe RV strain may indicate the possi-bility of a large pulmonary embolus or other pulmonary process resulting in cor pulmonale and hypotension. An ultrasound protocol for the undifferentiated hypotensive pa-tient has been suggested, utilizing views of the heart for ef-fusion as well as imaging the abdominal aorta and peritoneal spaces for free fluid (17). A trial of over 200 patients pre-senting with nontraumatic hypotension randomized patients to immediate or delayed ultrasound evaluation that included seven sonographic windows, both cardiac and abdominal. They found a significant improvement in speed and diag-nostic accuracy for patients who underwent initial versus delayed ultrasound (36).
Shortness of BreathWhen patients present with shortness of breath, emergency physicians typically look first for a pulmonary cause. When the physical exam and initial studies fail to determine the cause of dyspnea, echo offers a useful adjunct to detect etiologies such as pericardial effusion, congestive heart fail-ure, myocardial infarction, and pulmonary embolism. One study of ED patients who presented with dyspnea of unclear etiology following standard evaluation found that the inci-dence of pericardial effusion found by emergency echo was nearly 14%, with a significant number of large pericardial effusions (5).
Emergency echo may also be able to demonstrate evi-dence of congestive heart failure that may be difficult to de-termine from physical examination alone (37). In addition to the assessment of left ventricular systolic function, evidence of increased central venous pressure may be assessed by ex-amining the IVC during inspiration. Dilatation of the IVC with absence of inspiratory collapse indicates fluid overload, while a collapsed IVC is unlikely in congestive heart failure (Figs. 4.28, 4.43 and 4.44). Ultrasound is one of the most sensitive indicators of pleural effusion, often present with heart failure. A screening examination that includes echo as well as thoracic ultrasound may quickly add to the evalua-tion of the patient with unexplained shortness of breath (38).
Chest PainIn a study of 124 patients with “suspected cardiac disease,” including chest pain, dyspnea, palpitations, and syncope, a screening ultrasound performed by an emergency physi-cian was helpful in diagnosing significant abnormalities not found by initial evaluation as well as providing prognostic value for length of stay of admitted patients (39). While a consultative echocardiogram may be sensitive for ischemia if chest pain is ongoing, it is not recommended that emergency physicians attempt to determine if focal wall motion abnor-malities are present in ruling out myocardial infarction (11). However, the presence of significant left ventricular systolic dysfunction may indicate more serious disease.
Because the differential diagnosis for chest pain is broad, emergency echocardiography can help limit the possible
Figure 4.45. Transesophageal echocardiogram Showing the Descend-ing Aorta with an intimal Flap (Dissection). This is the preferred echocardio-graphic approach for diagnosis of dissection, if available.
Figure 4.46. Pacer Wire, Subxyphoid View. The wire can be seen trav-eling from the right atrium through the RV to the RV apex.

72 SeCtion ii / Ultrasound in the Resuscitation of Acute Injury or Illness
discovered, liberal use of consultative echo or other imaging modalities as available is recommended.
CLINICAL CASEA 65-year-old male presents with a chief complaint of short-ness of breath that he states has been progressive for the last 3 days. He has some sharp chest discomfort that is worse with movement. He is otherwise healthy and takes no medi-cations, but does note that last week he had a brief febrile illness with a slightly persistent cough. Further review of sys-tems is unremarkable. His blood pressure is 105/85, pulse is 106 beats per minute, temperature is 99.6°F, and oxygen saturation is 99% on room air. He does not appear mark-edly uncomfortable. On physical examination his lungs are clear and there is no evident jugular venous distension. His heart is tachycardic without audible gallop, murmur, or rub. An EKG shows sinus tachycardia with nonspecific T-wave abnormalities and no ST-segment changes. Laboratory stud-ies are pending. A chest radiograph is obtained, shown in Figure 4.50. It is interpreted as mild cardiomegaly without pulmonary infiltrate.
Consultative echocardiography is not available, and the emergency physician performs a bedside echocardiography that demonstrates a large pericardial effusion with evidence of RV collapse (Fig. 4.51; VIDEO 4 .18). Cardiology is consulted and the patient is given intravenous fluids. The pa-tient is admitted, and an urgent pericardial window is placed. Serous fluid (350 cm3) is drained, which later shows malig-nant cells on pathology. The patient is found to have meta-static colon cancer.
While certainly few would argue that the above patient requires admission, the most likely diagnostic concern with the above patient following initial workup is heart failure, although certainly not severe. The treatment for heart failure is typically diuretics, opposite of the treatment for pericar-dial effusions, which require fluids to keep preload high. An alternate echo finding that would be equally plausible in this patient is shown in Figure 4.52 ( VIDEO 4 .19), which shows a dilated LV (with significant systolic dysfunction on real-time echo). If these were the findings, intravenous
Figure 4.47. Parasternal Short Axis View, Left Ventricular Hyper-trophy. The short axis is a particularly good view for seeing the concentric hypertrophy of the myocardium.
Figure 4.48. intracardiac Mass, Subxyphoid View. The mass can be seen prolapsed across the tricuspid valve between the RA and the RV. The differential diagnosis includes myxoma, thrombus, or endocardial vegetation. This turned out to be a clot in a patient with metastatic renal carcinoma.
Figure 4.49. Apical Four-Chamber View. Left ventricular aneurysm.
Figure 4.50. Chest X-ray. Interpreted as mild cardiomegaly.
may be infrequent but require attention, that is, intracardiac mass (Fig. 4.48), or ventricular aneurysm (Fig. 4.49). When unusual findings that may require change in management are

Chapter 4 / Echocardiography 73
reFereNCeS 1. Moore C, Copel JA. Point-of-care ultrasonography. New Engl J Med.
2011;364:749–757. 2. Labovitz AJ, Noble VE, Bierig M, et al. Focused cardiac ultrasound in
the emergent setting: a consensus statement of the American Society of Echocardiography and American College of Emergency Physicians. J Am Soc Echocardiogr. 2010;23(12):1225–1230.
3. Amaya SC, Langsam A. Ultrasound detection of ventricular fibrillation disguised as asystole. Ann Emerg Med.1999;33(3):344–346.
4. Blaivas M, Fox JC. Outcome in cardiac arrest patients found to have cardiac standstill on the bedside emergency department echocardiogram. Acad Emerg Med. 2001;8:616–621.
5. Blaivas M. Incidence of pericardial effusion in patients presenting to the emergency department with unexplained dyspnea. Acad Emerg Med. 2001;8(12):1143–1146.
6. Jones AE, Tayal VS, Sullivan DM, et al. Randomized, controlled trial of immediate versus delayed goal-directed ultrasound to identify the cause of nontraumatic hypotension in emergency department patients. Crit Care Med. 2004;32:1703–1708.
7. Manson W, Hafez NM. The rapid assessment of dyspnea with ultra-sound: RADiUS. Ultrasound Clin. 2011;6:261–276.
8. Moore CL, Rose GA, Tayal VS, et al. Determination of left ventricu-lar function by emergency physician echocardiography of hypotensive patients. Acad Emerg Med. 2002;9:186–193.
9. Plummer D, Brunette D, Asinger R, et al. Emergency department echo-cardiography improves outcome in penetrating cardiac injury. Ann Emerg Med. 1992;21:709–712.
10. Perera P, Mailhot T. The RUSH Exam 2012: rapid ultrasound in shock in the evaluation of the critically ill patient. Ultrasound Clin. 2012;7(2):255–278.
11. Peels CH, Visser CA, Kupper AF, et al. Usefulness of two-dimensional echocardiography for immediate detection of myocardial ischemia in the emergency room. Am J Cardiol. 1990;65(11):687–691.
12. Tayal VS, Kline JA. Emergency echocardiography to detect pericar-dial effusion in patients in PEA and near-PEA states. Resuscitation. 2003;59(3):315–318.
13. Nagdev AD, Merchant RC, Tirado-Gonzalez A, et al. Emergency de-partment bedside ultrasonographic measurement of the caval index for noninvasive determination of low central venous pressure. Ann Emerg Med. 2010;55(3):290–295.
14. Moore C. Current issues with emergency cardiac ultrasound probe and image conventions. Acad Emerg Med. 2008;15(3):278–284.
15. ten Wolde M, Söhne M, Quak E, et al. Prognostic value of echocar-diographically assessed right ventricular dysfunction in patients with pulmonary embolism. Arch Intern Med. 2004;164(15):1685–1689.
16. Ribeiro A, Lindmarker P, Juhlin-Dannfelt A, et al. Echocardiography Doppler in pulmonary embolism: right ventricular dysfunction as a pre-dictor of mortality rate. Am Heart J. 1997;134(3):479–487.
17. Rose JS, Bair AE, Mandavia D, et al. The UHP ultrasound protocol: a novel ultrasound approach to the empiric evaluation of the undifferen-tiated hypotensive patient. Am J Emerg Med. 2001;19(4):299–302.
18. Appleton CP, Hatle LK, Popp RL. Cardiac tamponade and pericardial effusion: respiratory variation in transvalvular flow velocities stud-ied by Doppler echocardiography. J Am Coll Cardiol. 1988;11(5): 1020–1030.
19. Blaivas M, DeBehnke D, Phelan MB. Potential errors in the diagnosis of pericardial effusion on trauma ultrasound for penetrating injuries. Acad Emerg Med. 2000;7(11):1261–1266.
20. Mazurek B, Jehle D, Martin M. Emergency department echo in the diagnosis and therapy of cardiac tamponade. J Emerg Med. 1990; 9:27–31.
21. Callahan JA, Seward JB. Pericardiocentesis guided by two-dimensional echocardiography. Echocardiography. 1997;14(5):497–504.
22. Aguilera PA, Durham BA, Riley DA. Emergency transvenous car-diac pacing placement using ultrasound guidance. Ann Emerg Med. 2000;36(3):224–227.
23. Shabetai R, Fowler NO, Guntheroth WG. The hemodynamics of cardiac tamponade and constrictive pericarditis. Am J Cardiol. 1970;26(5):480–489.
24. Soler-Soler J, Sagristà-Sauleda J, Permanyer-Miralda G. Management of pericardial effusion. Heart. 2001;86(2):235–240.
Figure 4.52. Parasternal Long Axis View. While better seen with dy-namic images, the LV is clearly dilated and was seen to be hypocontractile with an estimated ejection fraction of 15%.
Figure 4.51. Apical Four-Chamber View. Large pericardial effusion (A). Evidence of diastolic RV collapse is seen (B). Similar appearing subxyphoid in VIDEO 4.18.
A
B
diuretics would be appropriate. In this case the ability of the emergency physician to perform echocardiography provides definitive diagnosis and markedly alters patient treatment and course.
74 SeCtion ii / Ultrasound in the Resuscitation of Acute Injury or Illness
with intravenous tissue plasminogen activator. J Am Coll Cardiol. 1987;10(5):971–978.
33. Taylor RA, Oliva I, Van Tonder R, et al. Point-of-care focused cardiac ultrasound for the assessment of thoracic aortic dimensions, dilation, and aneurysmal disease. Acad Emerg Med. 2012;19(2):244–247.
34. Cardenas E. Limited bedside ultrasound imaging by emergency medi-cine physicians. Western J Med. 1998;168(3):188–189.
35. Bocka JJ, Overton DT, Hauser A. Electromechanical dissociation in human beings: an echocardiographic evaluation. Ann Emerg Med. 1988;17(5):450–452.
36. Jones AE, Tayal VS, Sullivan DM, et al. Randomized, controlled trial of immediate versus delayed goal-directed ultrasound to identify the cause of nontraumatic hypotension in emergency department patients. Crit Care Med. 2004;32(8):1703–1708.
37. Chizner M. The diagnosis of heart disease by clinical assessment alone. Curr Prob Cardiol. 2001;26(5):285–379.
38. Zanobetti M, Poggioni C, Pini R. Can chest ultrasonography replace standard chest radiography for evaluation of acute dyspnea in the ED? Chest. 2011;139(5):1140–1147.
39. Kimura BJ, Bocchicchio M, Willis CL, et al. Screening cardiac ultraso-nographic examination in patients with suspected cardiac disease in the emergency department. Am Heart J. 2001;142(2):324–330.
40. Roudaut RP, Billes MA, Gosse P, et al. Accuracy of m-mode and two-dimensional echocardiography in the diagnosis of aortic dis-section: an experience with 128 cases. Clinical Cardiol. 1988;11(8): 553–562.
25. Sanflippo A, Arthur E. Pericardial disease. In: Weyman A, ed. Prin-ciples and Practice of Echocardiography. Philadelphia, PA: Lippincott Williams & Wilkins; 1994:1102–1134.
26. Rumberger JA, Behrenbeck T, Bell MR. Subspecialty clinics: cardiology determination of ventricular ejection fraction: a comparison of available imaging methods. Mayo Clin Proc. 1997;72(9):860–870.
27. Secko MA, Lazar JM, Salciccioli LA, et al. Can junior emergency physicians use E-point septal separation to accurately estimate left ventricular function in acutely dyspneic patients? Acad Emerg Med. 2011;18(11):1223–1226.
28. Nazeyrollas P, Metz D, Jolly D, et al. Use of transthoracic Doppler echocardiography combined with clinical and electrocardiographic data to predict acute pulmonary embolism. European Heart J. 1996;17(5):779–786.
29. Grifoni S, Olivotto I, Cecchini P, et al. Utility of an integrated clini-cal, echocardiographic, and venous ultrasonographic approach for tri-age of patients with susupected pulmonary embolism. Am J Cardiol. 1998;82:1230–1235.
30. Kasper W, Konstantinides S, Geibel A, et al. Prognostic significance of right ventricular afterload stress detected by echocardiography in patients with clinically suspected pulmonary embolism. Heart. 1997;77(4):346–349.
31. Goldhaber SZ, Hare WD, Feldstein ML, et al. Alteplase versus heparin in acute pulmonary embolism. Lancet. 1993;341:507–511.
32. Come PC, Kim D, Parker JA, et al. Early reversal of right ventricular dysfunction in patients with acute pulmonary embolism after treatment

75
instances, it has been shown to be more sensitive and specific than radiation-based imaging (1–5). There are four main cat-egories of thoracic ultrasound diagnoses: (1) pleural-based diseases (pneumothorax), (2) interstitial-based diseases (pulmonary edema, fibrosis), (3) consolidative diseases (acute respiratory distress syndrome (ARDS) and pneumo-nia), and (4) effusions.
Pneumothorax is the primary diagnostic question for most point-of-care sonographers when evaluating the pleura. Evaluating this diagnosis is one of the most com-mon questions critical care clinicians have, and ranks high in the life- threatening differential diagnosis in any patient with chest pain or dyspnea. Pneumothorax can be spontane-ous, traumatic, or iatrogenic. Iatrogenic causes include direct injury during internal jugular or subclavian line placement, as well as barotrauma from positive pressure ventilation. Point-of-care thoracic ultrasound can quickly and effectively evaluate for pneumothorax.
Thoracic ultrasound can also examine for interstitial fluid. The constellation of pathology that can lead to this fluid accu-mulation is referred to as interstitial syndrome, and includes congestive heart failure (CHF), ARDS, fibrotic processes, and early pulmonary contusion or infarct. The presence of interstitial fluid on thoracic ultrasound, in combination with secondary ultrasound findings and an understanding of the clinical picture, can lead to the correct diagnosis.
Pleural effusion has multiple etiologies, including trauma, malignancy, CHF, and hepatorenal failure. The presence of pleural effusion can be evaluated in both the upright and supine patient. This imparts benefit when com-pared to radiography in that some patients are unable to
INTRODUCTIONBefore the emergence of point-of-care ultrasound, the eval-uation of thoracic complaints comprised history, physical exam findings, including lung auscultation and percussion, x-ray imaging, and chest computed tomography (CT). Apart from pre-procedural marking for thoracentesis, ultrasound applications were initially limited to evaluating solid organs or fluid-filled spaces, typically the abdomen and vascular structures. Even then, it was common for marking to occur in the radiology suite, and for thoracentesis to be performed at the bedside by another medical team. Thoracic ultrasound was perceived to be limited due to the relative inability of sound waves to pass through regions of air. The drastic change in tissue impedance when sound waves transition from soft tissue to air causes scatter, resulting in the loss of a traditional organ image. However, point-of-care sonog-raphers have recognized that while the lung tissue itself is often visualized poorly, the presence or absence of specific artifacts caused by this large change in impedance gives valuable clinical information, often faster and more accu-rately than traditional imaging modalities. Research and acceptance of this very useful ultrasound application has since rapidly grown.
CLINICAL APPLICATIONSThoracic ultrasound is extremely useful in the emergency and critical care setting, not only because it can be per-formed in a timely fashion at the bedside and repeated infi-nitely without risk of radiation, but also because, in many
Interstitial Fluid . . . . . . . . . . . . . . . . . . . . . . . . . . . . . . . 79Pleural Effusion . . . . . . . . . . . . . . . . . . . . . . . . . . . . . . . 80Lung Consolidation . . . . . . . . . . . . . . . . . . . . . . . . . . . . 80
ARTIFACTS AND PITFALLS . . . . . . . . . . . . . . . . . . . . . . . . . . 81USE OF ThE IMAGE IN CLINICAL DECISION MAKING . . . . . . 81COMPARISON WITh OThER DIAGNOSTIC MODALITIES . . . . 81CLINICAL CASES . . . . . . . . . . . . . . . . . . . . . . . . . . . . . . . . . . 82
Case 1 . . . . . . . . . . . . . . . . . . . . . . . . . . . . . . . . . . . . . . 82Case 2 . . . . . . . . . . . . . . . . . . . . . . . . . . . . . . . . . . . . . . 82
INTRODUCTION . . . . . . . . . . . . . . . . . . . . . . . . . . . . . . . . . . . 75CLINICAL APPLICATIONS . . . . . . . . . . . . . . . . . . . . . . . . . . . . 75IMAGE ACQUISITION . . . . . . . . . . . . . . . . . . . . . . . . . . . . . . . 76
Pneumothorax . . . . . . . . . . . . . . . . . . . . . . . . . . . . . . . . 76Interstitial Fluid or Lung Consolidation . . . . . . . . . . . . . 76Pleural Effusion . . . . . . . . . . . . . . . . . . . . . . . . . . . . . . . 76
NORMAL ULTRASOUND ANATOMY . . . . . . . . . . . . . . . . . . . . 77PAThOLOGY . . . . . . . . . . . . . . . . . . . . . . . . . . . . . . . . . . . . . . 78
Pneumothorax . . . . . . . . . . . . . . . . . . . . . . . . . . . . . . . . 78
Calvin Huang, Andrew S. Liteplo, and Vicki E. Noble
Lung and Thorax5

76 Section ii / Ultrasound in the Resuscitation of Acute Injury or Illness
lie flat for traditional imaging due to dyspnea and some patients who are critically ill or intubated cannot sit up for a chest x-ray. Furthermore, bedside localization with ultra-sound of fluid allows for simple transition into procedural guidance.
Finally, lung ultrasound can also be helpful in the detec-tion of lung consolidation. Even further, when consolidation is detected on chest x-ray, secondary sonographic signs can help differentiate between the different causes of consolida-tion, which include atelectasis, pneumonia, and pulmonary embolus (PE).
IMAGE ACQUISITIONThe technique for image acquisition depends upon the spe-cific clinical indication for which thoracic ultrasound is being performed. The depth, type of transducer, and scanning protocol are determined by the clinical question.
PneumothoraxThe presence or absence of pneumothorax is commonly evaluated with the patient in a supine position. The high- frequency linear probe is placed perpendicular to the ribs on the anterior chest. This region is targeted because air in the pleural space is likely to rise anteriorly in the supine patient. The ribs and their shadows will be seen in a short axis view, and they should be placed at the edges of the window (Fig. 5.1). The depth should be adjusted so that the pleural line is centered in view. M-mode imaging can be employed for additional confirmation and is described below. The M-mode axis should be set perpendicular to the pleural line, midway between two rib shadows (Fig. 5.2).
Multiple anterior zones, as well as the apical region, should be scanned to increase sensitivity. In previously normal lung, pleural adhesions are rare, and as such, the likelihood of a loculated pneumothorax is low. However, in patients with prior abnormal lung pathology, pneumothora-ces can be loculated. The lateral and posterior lung fields should be scanned when concern for pneumothorax is high as previous scarring may prevent air from moving to the most anterior or superior location.
Because the pleural line is only a few centimeters below the skin surface, the linear probe is generally employed. However, the lower frequency curvilinear or phased array probe may be utilized without any change in technique, and may be necessary in patients with a large amount of subcu-taneous tissue. However, the curvilinear probe is generally pre-set to view deeper structures and as such, the focus depth will usually need to be decreased.
Interstitial Fluid or Lung ConsolidationThe location of interstitial fluid or lung consolidation is dependent upon the pathology and as such, can be diffuse (severe CHF, interstitial pneumonia, pulmonary fibrosis) or focal (pneumonia, early CHF, atelectasis, pulmonary contusion/infarct). Scanning can be performed in the seated or supine patient; in patients with severe orthopnea, a supine position might not be feasible. There are multiple scanning protocols described, and they range from a rapid sweep of the probe anteriorly to evaluating 26 distinct zones of the thoracic cavity. Obviously, different clinical scenarios will call for different levels of sensitivity, and in general, the more zones that are evaluated, the more sensitive and specific the exam for identifying and qualifying interstitial fluid (6–8). The most common scanning protocol in the emergency department (ED) is to investigate eight zones—superior and inferior zones of the anterior and lateral chest on both sides (Fig. 5.3) (6).
A low-frequency probe is selected for this exam—either a phased array or a curvilinear probe. Because B-lines are defined as reverberation artifacts that extend radially from the pleural line to a depth of 18 cm, the field depth for inter-stitial fluid must be set to at least this extent when evaluating for interstitial fluid. Lung consolidation can vary in depth, and the depth should be adjusted dynamically to obtain the optimal view. The probe is placed perpendicular to the ribs so that they are viewed in short axis. The pleural line should be centered and in view between two rib shadows.
Pleural EffusionPleural effusion can be detected in the seated or supine patient. In the seated patient, gravity-dependent fluid is best
FIGURE 5.1. Image Demonstrating Two Rib Shadows on Either Side of the Frame with the Bright Hyperechoic Pleural Line just Deep to the Rib Shadow. Also known as the “bat-sign .” Comet tails are visible .
FIGURE 5.2. M-Mode Line should be Placed Midline between the Two Rib Shadows. Seashore sign is present, indicating a normal lung (no pneumothorax) .

chapter 5 / Lung and Thorax 77
interface between the spleen and the diaphragm is more superior and posterior when compared to the right. As such, the probe is best positioned at the posterior axillary line and adjacent to the costal margin.
Of note, large pleural effusions can also be detected in the supine patient when obtaining parasternal cardiac views. While there are no studies comparing the sensitivity of the different acoustic windows, because fluid is gravity- dependent, a small pleural effusion is unlikely to be detected from the anterior parasternal view. It is more common that pleural fluid is detected as an incidental finding, prompting further thoracic evaluation. With the phased array probe, the parasternal long axis view is obtained by placing the trans-ducer just lateral to the left sternal border at the fourth or fifth intercostal space. The probe axis is held in a line connecting the right shoulder and left hip. Once the cardiac window is obtained, a pleural effusion may be visualized posterior (far field) to the descending thoracic aorta (Fig. 5.5).
NORMAL ULTRASOUND ANATOMYIn the normal thorax, the interior chest wall and lung parenchyma are surrounded by a continuous membrane, which comprises the visceral pleural as it lines the lung, and the parietal pleura as it lines the interior of the chest cavity. These two layers are in constant contact and slide back and forth against each other as the lung and chest wall expand and contract. The pleural space contains several milliliters of fluid, which acts as a lubricant and facilitates sliding.
The basic ultrasound view of the pleural space is called the bat sign (9). It is obtained with the probe axis perpen-dicular to the rib shadows. The pleural line is visible as a hyperechoic line parallel to the transducer surface, deep to the anterior surfaces of the rib (Fig. 5.1). The pleural line comprises the body of the “bat,” and the anterior rib surfaces with underlying shadows generate the wings. Recognizing the bat sign is key when identifying the relevant anatomy. 8PEDIATRIC CONSIDERATIONS: Because of reduced reflection of ultrasound through pediatric bones, the pleural line is readily visible below the ribs. The pleural sliding is often even more noticeable in these areas.8
visualized from a posterior approach. Fluid will accumulate on the diaphragm. The linear or curvilinear probe is utilized and held in the sagittal plane with the probe marker pointing toward the patient’s head. When evaluating either the right or the left hemithorax in the seated patient, the probe should be placed at the posterior costal margin in the mid-scapular line and the diaphragm identified. If fluid is seen, there will be an anechoic stripe separating the visceral and parietal pleural (Fig. 5.4). The height of the effusion can be evaluated by sliding the probe in a cephalad direction until the normal pleural line reconnects.
In the supine patient, gravity-dependent fluid will accu-mulate posteriorly and inferiorly, and as such, the largest pocket of pleural fluid will be located superior to the dia-phragm. The curvilinear probe should be utilized. In the right upper quadrant of the abdomen/right lower chest the probe should be positioned in the coronal plane, in the mid-axillary line near the level of the costal margin. The probe marker will point toward the patient’s head. The liver parenchyma should be visualized, and superior to this, the diaphragm. The depth should then be decreased so the liver/diaphragm interface is maximized in the window. On the left chest the
FIGURE 5.3. Picture of the Eight Zones (the Ones Shown Plus the Four Contralateral Zones) Commonly Used to Identify the Presence or Absence of Interstitial Fluid.
FIGURE 5.4. Pleural Effusion (Arrow) Present with the Parietal and Visceral Pleura Separated by the Hypoechoic Fluid.
FIGURE 5.5. Image of Pleural Effusion (Arrow) in the Parasternal Long Axis View. The fluid tapers, is posterior to the descending thoracic aorta, and does not cross the midline .

78 Section ii / Ultrasound in the Resuscitation of Acute Injury or Illness
PAThOLOGYPneumothoraxThe presence of pneumothorax can be diagnosed by the absence of lung sliding. The presence of air between the two pleura prevents visualization of the two layers passing each other as the visceral pleura has dropped below this air bar-rier ( VIDEO 5 .2). On M-mode imaging there is loss of the seashore sign, and the entire field is replaced by the static horizontal lines. This pattern is called the barcode sign or stratosphere sign (Fig. 5.8).
While the presence of lung sliding or the seashore sign rules out a pneumothorax, if respirations are decreased, lung sliding or the seashore sign might not be evident. In addition, false positives can occur in cases where there is scarring, pleurodesis, or adhesions. Sometimes in these cases there are secondary findings that can lead to the cor-rect diagnosis. As described above, the lung can be evaluated for the presence of B-lines or vertical hyper-echoic artifacts that originate from the visceral pleura (Fig. 5.9). Since these artifacts can be generated only when the parietal and visceral pleura are adherent, the presence of these can help rule out pneumothorax.
Power Doppler is a form of color overlay Doppler that does not show direction of velocity, but measures amplitude of motion. As such, power Doppler is very sensitive to low flow states or small velocities. Power Doppler can be placed on the pleural line, and if there is subtle lung movement and no pneumothorax, a velocity signal will be generated ( VIDEO 5 .3). Conversely, the presence of pneumothorax will prevent generation of power Doppler signal below the pleural line. Care must be directed toward ensuring no motion of the transducer on the soft tissue—even small movements can generate a false positive power Doppler signal.
A lung point is the location along the pleural line where the edge of a pneumothorax ends (9). This indicates the transi-tion point where the visceral and parietal pleura rejoin. On one side of the lung point normal lung sliding can be observed, whereas on the other side there is loss of lung sliding where
Lung sliding can be visualized sonographically and indicates that there is no pneumothorax. As the visceral and pleural parietal layers slide past one another, the pleural line will be seen moving back and forth horizontally. Reverbera-tion artifacts, known as B-lines, may also be seen emanating from the pleural line. While these may indicate pathology in the interstitial spaces, the presence of comet tails or B-lines rules out a pneumothorax because air between the two pleura prevents the reverberation artifact between the two pleura ( VIDEO 5 .1).
The use of M-mode imaging can help confirm the pres-ence or absence of lung sliding. Furthermore, for image stor-age systems that cannot save video clips, M-mode imaging can be a method to document lung sliding in still picture form. M-mode imaging graphically displays a linear seg-ment of the acoustic window over time. As such, tissue that is not moving or changing appears as a set of horizontal lines. Tissue that is moving will generate a different signal over time and appears as a grainy pattern. In the normal lung, as the soft tissue above the pleural line is relatively fixed while the lung below the pleural line is moving, this gener-ates a pattern of horizontal lines on top of a sandy region. This is known as a seashore sign and indicates normal lung sliding (Fig. 5.2).
A-lines are thin, regularly spaced hyper-echoic lines that are parallel to the transducer surface/pleural line and are caused by reverberation of sound waves between the pleura and the skin surface (Fig. 5.6). A-lines or an A- predominance (presence of A-lines in multiple lung zones) suggest an aerated lung and are considered a normal finding. A-lines generally exist on the opposite end of a spectrum from a B-predominance (multiple B-lines in multiple lung zones).
When the lower thoracic areas are imaged from the right and left upper abdominal quadrants, the lung is not normally visualized. The tight curved interface between the liver/spleen and the diaphragm creates a sonographic mirror that generates a mirror image for the solid organ above the dia-phragm (Fig. 5.7). This artifact is lost when pleural effusion is present. Furthermore, when there is no effusion, the visu-alization of the vertebral bodies and their shadows is inter-rupted by the overlying diaphragm and mirror artifact.
FIGURE 5.6. Image Demonstrating A-lines (Arrows). Note the evenly spaced reverberation artifacts that are parallel to the pleural line .
FIGURE 5.7. Mirror Image. There is the appearance of the liver superior to (to the left of) the diaphragm, created by reflection of sound beams off the diaphragm . This image also demonstrates how the spinal shadow stops at the diaphragm when the lung is well aerated, as sound cannot be transmitted to the thoracic spine to generate an image .

chapter 5 / Lung and Thorax 79
the movement of the lung with the cardiac cycle can be observed. As such, visualization of the lung pulse rules out the diagnosis of a pneumothorax in that location.
Interstitial FluidInterstitial fluid is indicated by the presence of B-lines, and the interstitial syndrome is the constellation of pathology that causes diffuse interstitial fluid. This includes pulmo-nary edema, diffuse interstitial pneumonia, and interstitial lung disease such as pulmonary fibrosis. B-lines are vertical hyper-echoic lines that represent artifacts generated from the pleural line; by definition, they must extend to a depth of at least 18 cm (Fig. 5.9). They cannot be seen when pneumo-thorax is present. A region is considered positive for B-lines when there are three or more vertical artifacts present along the pleural line within one rib interspace, and they can be seen to slide back and forth with lung sliding. The positive region is then said to have a B-predominance. There is no clear consensus on the measurement of diffuse B-lines—technique ranges from examining the bilateral anterior chest
the two pleura have separated. With the respiratory cycle not only will the lung sliding be observed, but the lung point will shift back and forth as well (Fig. 5.10; VIDEO 5 .4). While the lung point is not always identified in pneumothorax, the presence of lung point is diagnostic of pneumothorax. In addi-tion, if the lung point is followed around the chest cavity, an estimation of pneumothorax size can be made.
Finally, when lung sliding is not evident, there are no comet tails or B-lines to aid in diagnosis, power Doppler is not diagnostic, and lung point is not observed, the pres-ence or absence of pneumothorax might still be suspected in a patient with high pretest odds of pneumothorax utiliz-ing additional sonographic findings. Lung pulse is defined as subtle movement/lung sliding along the pleural line that occurs with the cardiac cycle as opposed to lung slid-ing that occurs with the respiratory cycle (Fig. 5.11; VIDEO 5 .5) (9). When there is no pneumothorax, but res-pirations are decreased, lung sliding is difficult to detect. However, cardiac contractions cause subtle movement of the lung, which in turn is transmitted along the chest wall. As long as the visceral and parietal pleura are touching,
FIGURE 5.8. On the left, barcode sign signifying pneumothorax . On the right, seashore sign signifying no pneumothorax .
FIGURE 5.9. Image of B-lines—hyperechoic beams radiating radially from the pleural line .
FIGURE 5.10. Lung Point—as shown by still image and also seen in VIDEO 5 .4 .
劉政亨
劉政亨

80 Section ii / Ultrasound in the Resuscitation of Acute Injury or Illness
seated/upright position, an effusion appears as a hypoechoic region between the visceral and parietal pleura (Fig. 5.4). With varying pathology, the fluid may appear homogenous (transudative effusion) or may be heterogenous with dynamic hyper-echoic signal (hemothorax with clot, empyema). Depending on the size of the effusion, sometimes only the parietal pleura and effusion can be seen, and at other times the lung can be noted within the fluid. Unless loculation is present, the size of the effusion visualized will decrease as the probe is moved cephalad. In the supine patient, there is loss of the normal mirror image artifact of the liver or spleen superior to the diaphragm when the chest is viewed from the right and left upper abdominal quadrants. When fluid is present in the thoracic space, the region above the diaphragm can be visualized. The lung may or may not be visible within the fluid collection. Additionally, if the vertebral bodies are seen, they may now continue past the diaphragm as the mir-ror image artifact is no longer prohibitory. This is called the spine sign; the presence of a pleural fluid causes loss of the usual mirror image artifact and provides a sonographic win-dow to the spine (Fig. 5.13). Finally, as mentioned earlier, when the cardiac views are obtained, a large pleural effu-sion can be detected posterior to the pericardial sac. This hypo-echoic region will be located posterior or taper to the descending thoracic aorta (Fig. 5.5).
Lung ConsolidationLung consolidation is the tissue-like appearance of the lung; the appearance is most akin to the liver parenchyma (Fig. 5.14). Sonographic consolidation, like its radiographic counterpart, can be caused by atelectasis, pneumonia, and pulmonary infarct (evolved from PE). A limitation of the sonographic evaluation of lung consolidation as compared to radiography is that consolidation must extend to the pleural line to be visible on bedside ultrasound. However, ultrasound can help differentiate between atelectasis and pneumonia by the evaluation of air bronchograms. Air bronchograms are the preservation of the larger air-spaces that do not have com-plete collapse due to their more rigid structure. They tend to be central, and exhibit branching; as such, they may resem-ble vasculature which further contributes toward the hepatic appearance of consolidated lung (referred to as hepatization of the lung). In consolidation caused by pneumonia, the air
and forming a gestalt impression to examining each individ-ual rib space and calculating a score. A common approach mentioned previously evaluates four anterior zones anteri-orly and four zones laterally for a total of eight zones bilater-ally (Fig. 5.3). The presence of two or more positive zones bilaterally indicates interstitial syndrome.
Acute respiratory distress syndrome (ARDS) can gener-ate interstitial fluid and thus also generate B-lines. Apart from the patient’s clinical picture, there are several addi-tional sonographic findings to suggest ARDS over pulmo-nary edema. Acute respiratory distress syndrome will create diffuse B-lines, but some rib interspaces will be spared, and thus there is no uniform pattern. Furthermore, the presence of an irregular pleural line and/or sub-pleural consolida-tions can be present and are specific for ARDS (Fig. 5.12). Finally, because of pleural inflammation, lung sliding may be reduced (10).
Pleural EffusionSonographically, pleural effusions can be visualized directly, whereas artifacts are used to suggest no effusion. In the
FIGURE 5.13. Pleural Effusion. This image demonstrates the spine sign and the loss of the mirror image both indicating pleural fluid .
FIGURE 5.12. Irregular Pleural Line and Subpleural Consolidations Seen in ARDS.
FIGURE 5.11. Lung Pulse—note the rhythmic alternating seashore and barcode signs created by cardiac contractions (also seen in VIDEO 5 .5) .
劉政亨
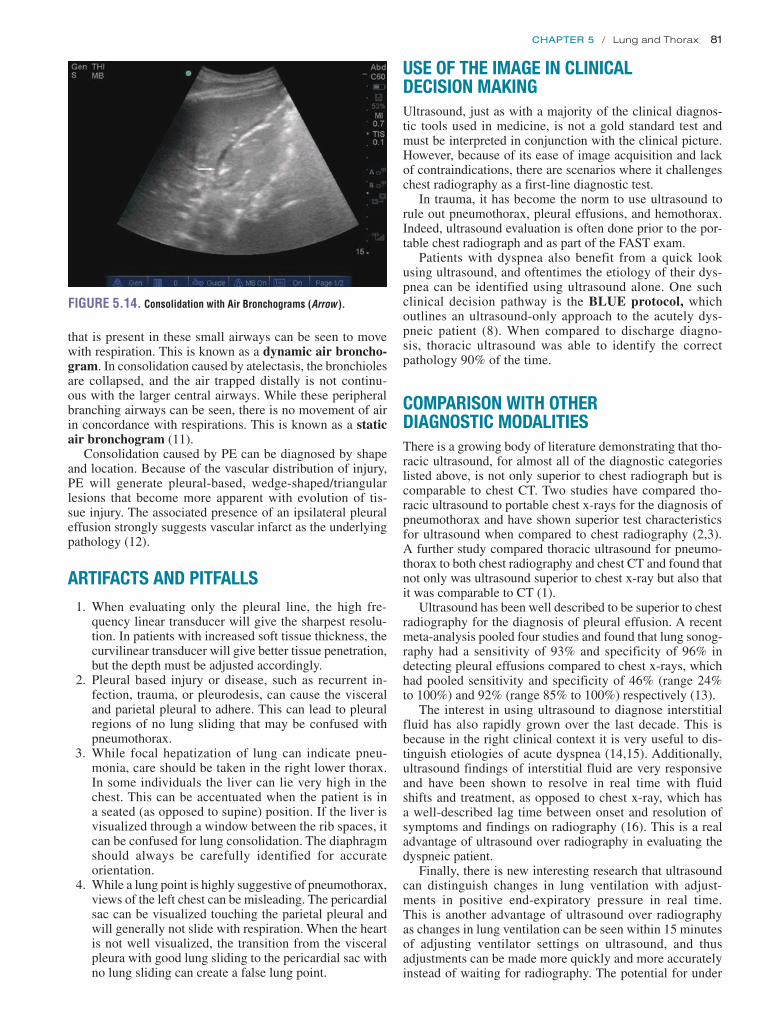
chapter 5 / Lung and Thorax 81
USE OF ThE IMAGE IN CLINICAL DECISION MAKINGUltrasound, just as with a majority of the clinical diagnos-tic tools used in medicine, is not a gold standard test and must be interpreted in conjunction with the clinical picture. However, because of its ease of image acquisition and lack of contraindications, there are scenarios where it challenges chest radiography as a first-line diagnostic test.
In trauma, it has become the norm to use ultrasound to rule out pneumothorax, pleural effusions, and hemothorax. Indeed, ultrasound evaluation is often done prior to the por-table chest radiograph and as part of the FAST exam.
Patients with dyspnea also benefit from a quick look using ultrasound, and oftentimes the etiology of their dys-pnea can be identified using ultrasound alone. One such clinical decision pathway is the BLUE protocol, which outlines an ultrasound-only approach to the acutely dys-pneic patient (8). When compared to discharge diagno-sis, thoracic ultrasound was able to identify the correct pathology 90% of the time.
COMPARISON WITh OThER DIAGNOSTIC MODALITIESThere is a growing body of literature demonstrating that tho-racic ultrasound, for almost all of the diagnostic categories listed above, is not only superior to chest radiograph but is comparable to chest CT. Two studies have compared tho-racic ultrasound to portable chest x-rays for the diagnosis of pneumothorax and have shown superior test characteristics for ultrasound when compared to chest radiography (2,3). A further study compared thoracic ultrasound for pneumo-thorax to both chest radiography and chest CT and found that not only was ultrasound superior to chest x-ray but also that it was comparable to CT (1).
Ultrasound has been well described to be superior to chest radiography for the diagnosis of pleural effusion. A recent meta-analysis pooled four studies and found that lung sonog-raphy had a sensitivity of 93% and specificity of 96% in detecting pleural effusions compared to chest x-rays, which had pooled sensitivity and specificity of 46% (range 24% to 100%) and 92% (range 85% to 100%) respectively (13).
The interest in using ultrasound to diagnose interstitial fluid has also rapidly grown over the last decade. This is because in the right clinical context it is very useful to dis-tinguish etiologies of acute dyspnea (14,15). Additionally, ultrasound findings of interstitial fluid are very responsive and have been shown to resolve in real time with fluid shifts and treatment, as opposed to chest x-ray, which has a well-described lag time between onset and resolution of symptoms and findings on radiography (16). This is a real advantage of ultrasound over radiography in evaluating the dyspneic patient.
Finally, there is new interesting research that ultrasound can distinguish changes in lung ventilation with adjust-ments in positive end-expiratory pressure in real time. This is another advantage of ultrasound over radiography as changes in lung ventilation can be seen within 15 minutes of adjusting ventilator settings on ultrasound, and thus adjustments can be made more quickly and more accurately instead of waiting for radiography. The potential for under
that is present in these small airways can be seen to move with respiration. This is known as a dynamic air broncho-gram. In consolidation caused by atelectasis, the bronchioles are collapsed, and the air trapped distally is not continu-ous with the larger central airways. While these peripheral branching airways can be seen, there is no movement of air in concordance with respirations. This is known as a static air bronchogram (11).
Consolidation caused by PE can be diagnosed by shape and location. Because of the vascular distribution of injury, PE will generate pleural-based, wedge-shaped/triangular lesions that become more apparent with evolution of tis-sue injury. The associated presence of an ipsilateral pleural effusion strongly suggests vascular infarct as the underlying pathology (12).
ARTIFACTS AND PITFALLS 1. When evaluating only the pleural line, the high fre-
quency linear transducer will give the sharpest resolu-tion. In patients with increased soft tissue thickness, the curvilinear transducer will give better tissue penetration, but the depth must be adjusted accordingly.
2. Pleural based injury or disease, such as recurrent in-fection, trauma, or pleurodesis, can cause the visceral and parietal pleural to adhere. This can lead to pleural regions of no lung sliding that may be confused with pneumothorax.
3. While focal hepatization of lung can indicate pneu-monia, care should be taken in the right lower thorax. In some individuals the liver can lie very high in the chest. This can be accentuated when the patient is in a seated (as opposed to supine) position. If the liver is visualized through a window between the rib spaces, it can be confused for lung consolidation. The diaphragm should always be carefully identified for accurate orientation.
4. While a lung point is highly suggestive of pneumothorax, views of the left chest can be misleading. The pericardial sac can be visualized touching the parietal pleural and will generally not slide with respiration. When the heart is not well visualized, the transition from the visceral pleura with good lung sliding to the pericardial sac with no lung sliding can create a false lung point.
FIGURE 5.14. Consolidation with Air Bronchograms (Arrow ).

82 Section ii / Ultrasound in the Resuscitation of Acute Injury or Illness
CAsE 2A 70-year-old man is admitted to the intensive care unit for urosepsis. He was covered with broad-spectrum antibiot-ics with improving vitals, but during his course of volume resuscitation, the patient develops respiratory distress and is intubated. Following this, the patient has a left-sided subcla-vian central venous line placed and immediately arrives in the unit. The patient is found to have hypoxia to 90% on an FiO2 of 100% and five of PEEP. Lung sounds are slightly rhonchorous, but seem to be equal bilaterally. Portable chest x-ray prior to transfer to the unit is reviewed and shows slight under-penetration, with mild to minimal pulmonary edema. Bedside ultrasound is performed; ultrasound of the left chest is abnormal (Fig. 5.16).
The differential diagnosis for the intubated patient with recent volume resuscitation, recent intubation, and recent line placement includes worsening pulmonary edema, ETT malposition, pneumothorax, and hemothorax. The lack of a seashore sign is concerning for a pneumothorax; however, the presence of lung pulse indicates no pneumothorax. Right main-stem bronchus intubation is suspected. The patient’s ETT was withdrawn 3 cm with improvement in ventilation and oxygenation. Portable chest x-ray following this con-firms ETT in good position 2 cm above the carina with no pneumo/hemothorax.
REFERENCES 1. Rowan KR, Kirkpatrick AW, Liu D, et al. Traumatic pneumothorax
detection with thoracic US: correlation with chest radiography and CT—initial experience. Radiology. 2002;225(1):210–214.
2. Wilkerson RG, Stone MB. Sensitivity of bedside ultrasound and supine anteroposterior chest radiographs for the identification of pneumothorax after blunt trauma. Acad Emerg Med. 2010;17(1):11–17.
3. Blaivas M, Lyon M, Duggal S. A prospective comparison of supine chest radiography and bedside ultrasound for the diagnosis of traumatic pneu-mothorax. Acad Emerg Med. 2005;12(9):844–849.
4. Ma OJ, Mateer JR. Trauma ultrasound examination versus chest radiogra-phy in the detection of hemothorax. Ann Emerg Med. 1997;29(3):312–315; discussion 315–316.
5. Eibenberger KL, Dock WI, Ammann ME, et al. Quantification of pleural effusions: sonography versus radiography. Radiology. 1994;191(3):681–684.
or over-ventilating patients could possibly be avoided using this strategy (17).
These studies have started to produce research that sug-gests a “thoracic ultrasound first” strategy could decrease the utilization of chest radiographs and chest CT in critically ill patients (18).
CLINICAL CASESCAsE 1A 60-year-old female with a history of chronic obstruc-tive pulmonary disease (COPD) and CHF presents to the ED with shortness of breath and malaise. Because of her fatigue, she has not left her recliner for several days. She has had decreased fluid intake, and has also neglected to take her regular diuretic. She has mild hypoxia, but this is improved on oxygen by nasal cannula. Her physical exam is remarkable for faint bilateral wheezing, but also faint bibasilar rales. She has symmetric, pitting, bilateral lower extremity edema. Her jugular venous distension (JVD) is not visible due to body habitus. Her electrocardiogram (EKG) is unchanged from baseline. Her laboratory testing is significant for a borderline elevation in cardiac enzymes. Her chest x-ray is performed and is limited secondary to a poor inspiratory effort, but otherwise shows no overt pul-monary edema, and possible right lower lobe opacity ver-sus atelectasis. Bedside thoracic ultrasound is performed (Fig. 5.15).
This patient’s presentation is suggestive of both COPD flare as well as CHF (with cardiac wheeze). The patient has some findings consistent with volume overload: specifically her history of CHF, lower extremity edema, and noncompli-ance with diuretic. However, the patient does have decreased fluid intake, no pulmonary edema on chest x-ray, and lung findings consistent with a possible COPD exacerbation. Her thoracic ultrasound shows A-lines with no B-lines (i.e., an A- predominance). The patient is treated with nebulized alb-uterol, steroids, and covered for atypical bacterial infection. Her oxygenation is improved, and she is admitted for COPD exacerbation.
FIGURE 5.15. Clinical Case 1. This image shows an A-line profile, which indicates no interstitial fluid, and thus is suggestive of a COPD exacerbation and not CHF in this patient .
FIGURE 5.16. Clinical Case 2. This clip shows the transmitted pulsations of the heart resulting in a regular “lung pulse” beat as demonstrated here in M-mode . The “lung pulse” indicates that the two pleura are in opposition as the heartbeat is being transmitted through to the parietal pleura . Therefore, there can be no air separating the two pleural layers, that is, there is no pneumothorax .

chapter 5 / Lung and Thorax 83
13. Grimberg A, Shigueoka DC, Atallah AN, et al. Diagnostic accuracy of sonography for pleural effusion: systematic review. Sao Paulo Med J. 2010;128(2):90–95.
14. Liteplo AS, Marill KA, Villen T, et al. Emergency thoracic ultrasound in the differentiation of the etiology of shortness of breath (ETUDES): sono-graphic B-lines and N-terminal pro-brain-type natriuretic peptide in diag-nosing congestive heart failure. Acad Emerg Med. 2009;16(3):201–210.
15. Gargani L, Frassi F, Soldati G, et al. Ultrasound lung comets for the differential diagnosis of acute cardiogenic dyspnoea: a comparison with natriuretic peptides. Eur J Heart Fail. 2008;10(1):70–77.
16. Noble VE, Murray AF, Capp R, et al. Ultrasound assessment for extra-vascular lung water in patients undergoing hemodialysis. Time course for resolution. Chest. 2009;135(6):1433–1439.
17. Bouhemad B, Brisson H, Le-Guen M, et al. Bedside ultrasound assess-ment of positive end-expiratory pressure-induced lung recruitment. Am J Respir Crit Care Med. 2011;183(3):341–347.
18. Peris A, Tutino L, Zagli G, et al. The use of point-of-care bedside lung ultrasound significantly reduces the number of radiographs and computed tomography scans in critically ill patients. Anesth Analg. 2010;111(3):687–692.
6. Volpicelli G, Mussa A, Garofalo G, et al. Bedside lung ultrasound in the assessment of alveolar-interstitial syndrome. Am J Emerg Med. 2006;24(6):689–696.
7. Agricola E, Bove T, Oppizzi M, et al. “Ultrasound comet-tail images”: a marker of pulmonary edema: a comparative study with wedge pressure and extravascular lung water. Chest. 2005;127(5):1690–1695.
8. Lichtenstein DA, Mezière GA. Relevance of lung ultrasound in the diagnosis of acute respiratory failure: the BLUE protocol. Chest. 2008;134(1):117–125.
9. Lichtenstein DA. General Ultrasound in the Critically Ill. New York, NY: Springer; 2007.
10. Copetti R, Soldati G, Copetti P. Chest sonography: a useful tool to dif-ferentiate acute cardiogenic pulmonary edema from acute respiratory distress syndrome. Cardiovasc Ultrasound. 2008;6:16.
11. Lichtenstein D, Mezière G, Seitz J. The dynamic air bronchogram. A lung ultrasound sign of alveolar consolidation ruling out atelectasis. Chest. 2009;135(6):1421–1425.
12. Mathis G, Blank W, Reissig A, et al. Thoracic ultrasound for diagnosing pulmonary embolism: a prospective multicenter study of 352 patients. Chest. 2005;128(3):1531–1538.

84
right heart pressure, intrathoracic pressure, and abdominal pressure. Since the 1970s, sonographic description of IVC caliber variation with respiratory cycling has been widely re-ported (9–14). In 1990, Kircher et al. reported a noninvasive estimation of right atrial pressure by measuring IVC collapse (caval index) with end inspiration. The caval index opened the door for numerous studies correlating CVP with IVC diameter and degree of IVC respiratory collapse (Fig. 6.1) (15–23). Today, bedside ultrasound assessment of the IVC provides the emergency physician with a quick, inexpensive, noninvasive, valuable hemodynamic parameter that serves to narrow the differential for undifferentiated hypotension and guide initial resuscitation efforts.
CLINICAL APPLICATIONSThere are three principal clinical scenarios in which bedside ultrasound evaluation of IVC collapse is beneficial: (1) Ad-junct to the clinical assessment of the undifferentiated hy-potensive patient, (2) Adjunct to volume resuscitation of the volume-depleted patient, (3) Adjunct to the clinical assess-ment of acute dyspnea.
Undifferentiated HypotensionThe differential diagnosis for hypotension is broad with certain diagnoses requiring rapid and very specific ther-apy. To determine whether the patient needs large volume
INTRODUCTIONUltrasound evaluation of dynamic change in inferior vena cava (IVC) diameter has become useful for the diagnosis and treat-ment of acutely ill patients with hypotension, dehydration, and dyspnea. In the early 2000s, goal-directed therapy became the standard of care for the management of patients with septic shock. Central venous pressure (CVP) was specifically recog-nized as the best hemodynamic parameter to determine vol-ume responsiveness (1–5). Central venous access required for CVP monitoring carries risk for complications such as arterial puncture, venous thrombosis, and infection. Not only is the procedure to obtain central venous access time consuming, but placement is often delayed until after intravenous (IV) fluid boluses fail or after elevated lactic acid is reported. Practi-cal limitations exist as well, ranging from expensive and spe-cialized equipment to the availability of trained personnel to monitor CVP continuously (6,7). A survey conducted in 2004 highlighted these limitations after reporting that only 7% of academic emergency departments (ED) had initiated protocols for invasive hemodynamic monitoring (8). Interest in dynamic measurement of the IVC grew as investigators began to search for a widely available, rapidly employed, cost-effective, and noninvasive means of quantifying CVP.
The IVC is a distensible conduit for return of blood from the inferior systemic circuit to the right heart. Because the IVC is so distensible, the diameter is dependent on an as-sortment of variables, including circulating blood volume,
USE OF THE IMAGE IN CLINICAL DECISION MAKING . . . . . . . . . . . . . . . . . . . . . . . . . . . . . . . . 90
Hypotension and Fluid Responsiveness . . . . . . . . . . . . 90Dehydration . . . . . . . . . . . . . . . . . . . . . . . . . . . . . . . . . . 90Shortness of Breath . . . . . . . . . . . . . . . . . . . . . . . . . . . 91
PITFALLS . . . . . . . . . . . . . . . . . . . . . . . . . . . . . . . . . . . . . . . . 91CORRELATION WITH OTHER IMAGING MODALITIES . . . . . . . . . . . . . . . . . . . . . . . . . . . . . . . . . . . . . 92CLINICAL CASES . . . . . . . . . . . . . . . . . . . . . . . . . . . . . . . . . . 92
Case 1 . . . . . . . . . . . . . . . . . . . . . . . . . . . . . . . . . . . . . . 92Case 2 . . . . . . . . . . . . . . . . . . . . . . . . . . . . . . . . . . . . . . 92
INTRODUCTION . . . . . . . . . . . . . . . . . . . . . . . . . . . . . . . . . . . 84CLINICAL APPLICATIONS . . . . . . . . . . . . . . . . . . . . . . . . . . . . 84
Undifferentiated Hypotension . . . . . . . . . . . . . . . . . . . . 84Guide to Volume Resuscitation . . . . . . . . . . . . . . . . . . . 85Evaluation of Dyspnea . . . . . . . . . . . . . . . . . . . . . . . . . . 85
IMAGE ACQUISITION . . . . . . . . . . . . . . . . . . . . . . . . . . . . . . . 85NORMAL ANATOMY . . . . . . . . . . . . . . . . . . . . . . . . . . . . . . . . 87PATHOLOGY . . . . . . . . . . . . . . . . . . . . . . . . . . . . . . . . . . . . . . 88
Volume Responsiveness . . . . . . . . . . . . . . . . . . . . . . . . 88Dehydration in the Pediatric Patient . . . . . . . . . . . . . . . 89Congestive Heart Failure . . . . . . . . . . . . . . . . . . . . . . . . 90
Richard Gordon and Matthew Lyon
Inferior Vena Cava6

Chapter 6 / Inferior Vena Cava 85
resuscitation, thoracostomy, pericardiocentesis, thromboly-sis, vasopressor support, inotropic support, surgical interven-tion, or a combination of these therapies can be extremely difficult based on clinical merits alone. The emergency phy-sician can gain rapid insight into cardiac preload hemody-namics with bedside analysis of the IVC.
In the face of hypotension, identification of a plethoric IVC suggests high right atrial pressure (23), prompting the physician to heavily consider diagnoses such as pulmonary embolus (PE), cardiac tamponade, tension pneumothorax, and cardiogenic shock. In contrast, visualization of a col-lapsible IVC suggests a low right atrial filling pressure (23), prompting the clinician sonographer to initiate volume re-placement while considering underlying diagnoses for hypovolemia. Ultrasound evaluation of undifferentiated hy-potension will be discussed further in Chapter 7.
Guide to Volume ResuscitationAcute care physicians frequently administer IV fluids with the goal of increasing preload and ultimately cardiac output (24). Patients who have increased cardiac output in response to an increase in preload are considered fluid responsive. On the other hand, overzealous administration of IV fluids may be deleterious, increasing the risk of Acute Respiratory Distress syndrome (ARDS), pulmonary edema, peripheral edema, ce-rebral edema, electrolyte abnormalities, and dilutional coagu-lopathy (25,26). The challenge resuscitative physicians face is how much fluid to give without giving too much. Bedside evaluation of the caval index can help identify patients who are fluid responsive at presentation (15–22,27–29), while serial measurements can identify patients who remain fluid responsive despite initial fluid resuscitation (18,22).
Evaluation of DyspneaEmergency physicians also frequently treat patients with acute dyspnea. Differentiating illness such as obstructive pulmonary disease from decompensated congestive heart failure (CHF) is challenging because the physical exam is unreliable and no single test is adequate (30). A study of 46 patients conducted by Blehar and colleagues demonstrated the usefulness of the caval index in differentiating dyspnea from CHF and fluid overload from non-CHF causes. They reported an IVC collapse of 9.6% in the volume-overloaded patients and an IVC collapse of 46% in non-CHF patients (31). Other diagnostic considerations include patients with massive PE, pericardial tamponade, and tension pneumotho-rax. There are numerous echocardiographic findings that di-agnose elevated right heart pressures secondary to obstructed IVC return or pulmonary outflow tract (Table 6.1) (32–34).
IMAGE ACQUISITIONTo image the IVC, place the patient in a supine position. A curvilinear 3 to 5 MHz probe or phased array 2 to 5 MHz probe provides adequate penetration to interrogate the IVC. The scan should begin in a midline sagittal orientation just below the xyphoid process with the probe indicator pointing to the patient’s head. The sonographer then slides the probe 1 to 2 cm to the patient’s right to bring the IVC into the field of view (Fig. 6.2). Slight angling of the probe to aim under the costal margin will reveal the entry point of the IVC
FIGURE 6.1. Graph Showing Correlation between CVP and IVC Diam-eter . (From Arthur ME, Landolfo C, Wade M, et al . Inferior vena cava diameter (IVCD) measured with transesophageal echocardiography (TEE) can be used to derive the central venous pressure (CVP) in anesthetized mechanically ven-tilated patients . Echocardiography . 2009;26:140–149 .)
TABLE 6.1 Ultrasound Appearance of the Right Ventricle, Left Ventricle, Right Atria, and Inferior Vena Cava Relative to the Different Categories of Shock
CATEGORY OF SHOCK CARDIAC FUNCTION IVC
Distributive (septic) Hyperdynamic LV (May be hypodynamic) Slit like or fully collapsible
Cardiogenic Hypodynamic LV Dilated with minimal collapse
Hypovolemic Hyperdynamic LV Slit like or fully collapsible
Obstructive (tamponade) Pericardial Effusion Dilated with no collapse
RV diastolic collapse
LV hyperdynamic
Obstructive (PE) Dilated RA and RV Dilated with minimal collapse
Hyperdynamic LV
RV, right ventricle; LV, left ventricle; RA, right atria; IVC, inferior vena cava; PE, pulmonary embolus.

86 SeCtion ii / Ultrasound in the Resuscitation of Acute Injury or Illness
into the right atrium. Ideally, the hepatic vein inlet should be visualized entering the IVC about 1 cm caudal to the right atrium (Fig. 6.3). The hepatic vein inlet is a key point of ref-erence because measurements of the caval index are typically conducted 1 cm caudal to this location. In volume-depleted patients the hepatic veins may not be visible secondary to complete collapse of the vessel. If this is the case, the sonog-rapher should conduct caval index measurements 2 to 3 cm caudal to the right atrium (Fig. 6.4).
In instances of extreme volume depletion the hepatic seg-ment of the IVC may be completely collapsed and not be easily visualized in a longitudinal axis (Fig. 6.5). In instances where the hepatic segment of the IVC cannot be identi-fied in the longitudinal axis the sonographer can switch to a subxyphoid view of the heart to identify the right atrium (Fig. 6.6). After identifying the right atrium the probe is slid to the patient’s right, bringing the right atrium center on the ultrasound screen. The probe is then angled nearly perpen-dicular to the skin surface to identify the IVC (Fig. 6.7), followed by a 90-degree clockwise rotation of the probe to turn the probe indicator to the patient’s head and obtain a long-axis view of the IVC (Fig. 6.8). It is worth mentioning however, that if the hepatic segment is not visible secondary
FIGURE 6.2. Long-Axis Orientation Slightly Right of the Patient’s Midline to Obtain a Long-Axis Image of the IVC.
FIGURE 6.3. Long-Axis Image of the IVC Traversing the Liver to Enter the Right Atrium (RA) . The hepatic vein (HV ) is seen joining the IVC just before entry into the right atrium .
FIGURE 6.4. Long-Axis Image of the IVC Entering the Right Atrium (RA) . The hepatic vein inlet is not visualized .
FIGURE 6.5. Slit Like Inferior Vena Cava (IVC) Entering the Right Atrium (RA).
FIGURE 6.6. Subcostal View of the Heart . The right atrium (RA), right ventricle (RV ), and inferior vena cava (IVC ) are identified .
to collapse, then clinical concern for low volume status is an-swered. If clinically indicated, the patient should be bolused with IV fluids followed by repeat ultrasound of the IVC with the patient remaining in the supine position to evaluate for change in diameter.

Chapter 6 / Inferior Vena Cava 87
Various locations for sampling the IVC diameter have been reported, ranging from just cephalad to the hepatic vein inlet to the inlet of the left renal vein (21,23,31,35–44). Loca-tions between the hepatic vein inlet and the right atrium are not ideal because the muscular attachment of the diaphragm may result in decreased compliance (44). The most frequent location for sampling is 1 cm distal to the hepatic vein inlet or 2 to 3 cm from the right atrium if the hepatic vein inlet is not visualized. However, Lichtenstein reports a saber profile or bulge of the IVC, caused by the incoming hepatic vein giving concern for unreliable diameter measurements (36). In addition, the collapsibility of the hepatic segment may be influenced by the surrounding parenchyma, with liver fibrosis or cirrhosis causing impaired diminution (35). In instances where the hepatic segment appears to be an unre-liable location for diameter sampling, a feasible alternative is the inlet of the left renal vein to the IVC (Fig. 6.9) (45).
NORMAL ANATOMYThe IVC is most easily imaged using the liver as an acoustic window. Familiarity with the normal ultrasound appearance of the liver and biliary tract (reviewed in Chapter 9) will make visualization of the IVC easier. The basic anatomy of
FIGURE 6.7. Cross-Section at the Confluence of the Hepatic Veins (HV ) with the IVC.
FIGURE 6.8. Long-Axis Orientation of the IVC.
FIGURE 6.9. Short-Axis View of the IVC and Aorta at the Confluence of the IVC and Left Renal Vein.
the IVC, aorta, and heart is essential for the clinical applica-tions presented here.
The IVC is a thin-walled retroperitoneal structure arising from union of the common iliac veins. The IVC lies just to the right of the vertebral column and enters the caval fossa of the liver. The portion of IVC that is encapsulated by the liver is called the hepatic segment. After piercing the diaphragm at the level of the T8 vertebra, the IVC enters the right atrium. Numerous vascular structures contribute venous blood to the IVC as it traverses the retroperitoneum, but the hepatic vein inlet carries the most significance for the ultrasound evalua-tion of this area. The most common IVC diameter sampling location is 1 cm caudal to the hepatic vein inlet (Fig. 6.10). The IVC diameter is measured in an anterior to posterior fashion directly through the midline of the vessel lumen. It is important to sample across the midline to avoid false measurements secondary to cylinder tangent effect. In long axis orientation the sonographer can identify the midline by keeping the hepatic inlet in-plane or measuring through the section with the widest diameter (45).
FIGURE 6.10. Long-Axis View of the Hepatic Segment of the Inferior Vena Cava (HS IVC) . The double arrowhead shows the ideal diameter sam-pling location . Also identified are the liver and right atrium (RA) .

88 SeCtion ii / Ultrasound in the Resuscitation of Acute Injury or Illness
point of minimal diameter represents the point of end inspira-tion (end expiration of mechanically ventilated). The maximal and minimal diameter can then be used to calculate the caval index. The limitation with M-mode IVC diameter sampling is the IVC slides caudal with inspiration and cephalad with expiration. Effectively, the clinician sonographer is sampling multiple locations along the IVC as it moves back and forth through the single piezoelectric channel used for M-mode.
PATHOLOGYVolume ResponsivenessThe volume responsive patient is one who has an increased cardiac output after an IV fluid bolus. The concept of im-proving cardiac output with an IV fluid bolus comes from the Frank-Starling mechanism. Starling’s law states that increased preload leads to increased cardiac myocyte stretch, which in turn leads to more forceful cardiac con-tractility. Evaluation of the Frank-Starling curve shows the volume-responsive patient plotted on the steep portion of the curve. However, there is also the volume-nonresponsive patient who would be plotted on the flat portion of the curve (Fig. 6.12). The emergency physician is frequently chal-lenged with the task of identifying those who are volume responsive and those who are not volume responsive. Once the volume-responsive patient is identified, the emergency physician is then faced with the task of giving enough fluid to maximize fluid responsiveness, but not so much that the patient is placed in harm’s way (25,26). Ultrasound has proven helpful to noninvasively identify those who are vol-ume responsive as well as to provide an endpoint for preload resuscitation.
Ultrasound evaluation of the IVC for fluid responsiveness begins with an analysis of the degree of IVC diameter varia-tion with respiration. Patients who have a slit-like (Figs. 6.5 and 6.13) or fully collapsible ( VIDEO 6 .1) IVC should be volume responsive, whether they are breathing spontane-ously or mechanically ventilated (22,23).
The spontaneously breathing patientThere have been no studies directly comparing fluid respon-siveness with respiratory collapse of the IVC in a spontane-ously breathing patient. However, there have been numerous
Once the IVC diameter sampling location is selected, the clinician sonographer should calculate the caval index (in the spontaneously breathing patient) (23) or the distensibility index (in the mechanically ventilated patient) (22). The caval index is defined as:
IVC expiratory diameter − IVC inspiratory diameterIVC expiratory diameter
× 100
A caval index ≥50% predicts the patient will be respon-sive to further volume resuscitation. The distensibility index is defined as:
IVC inspiratory diameter − IVC expiratory diameterIVC expiratory diameter
× 100
A distensibility index ≥16% predicts the patient will be responsive to further volume resuscitation (22,46).
Some sonographers may choose to use M-mode instead of a cine-loop for interrogation of the IVC when assessing volume status. M-mode allows the physician to plot IVC di-ameter over time. The IVC can be identified on the time plot as a black stripe that has an undulating diameter over time (Fig. 6.11). The point of maximal diameter will represent end expiration (end inspiration if mechanically ventilated) and the
FIGURE 6.12. The Frank-Starling Curve. Shows transition point from fluid responder to nonresponder indicated by the transition from the steep portion to flat portion of the plotted line .
FIGURE 6.11. A: M-mode image of the inferior vena cava (IVC) diameter at inhalation (I ) and exhalation (E) . B: M-mode image of the IVC diameter at exhalation (caliper a) and inhalation (caliper b) .
A
B

Chapter 6 / Inferior Vena Cava 89
blood volume has been well reported in the adult population (28,49). It is widely accepted that the adult patient with an IVC diameter collapse of 50% or more can tolerate fluid resuscita-tion if clinically indicated. However, very little research has been conducted on the utility of IVC diameter variation in the pediatric population. From a practical point of view, it may be difficult to get pediatric patients to fully cooperate enough to obtain consistent and accurate end-inspiratory and end- expiratory images. In addition there have been no published reference values for pediatric IVC diameter. However, com-paring IVC to aortic diameter (IVC/Ao) seems to be a promis-ing alternative. Acquisition of a short-axis view of the IVC and aorta at the level of the left renal vein allows the clinician sonographer to measure the anterior to posterior diameter of both the IVC and the aorta (Fig. 6.9). Care should be taken to measure the IVC diameter at end exhalation and the aortic diameter at end systole. An IVC/Ao ratio of less than approxi-mately 0.8 has been reported to identify dehydrated pediatric patients with a sensitivity ranging from 86% to 93% (29,50–52).
studies comparing right atrial/central venous pressure with absolute IVC diameter and caval index in the spontaneously breathing patient (23,42,45). An IVC diameter of <1.5 cm with complete inspiratory collapse is associated with a CVP of <5 cm of water. An IVC diameter between 1.5 and 2.5 cm and >50% collapse is associated with a CVP between 6 and 10 cm of water. Ultrasound serves as a rapid and noninvasive surro-gate for central venous pressure, which remains the mainstay for early fluid resuscitation (1,47,48). The emergency physi-cian should have confidence in further fluid administration for the hypotensive, spontaneously breathing patient with an IVC that collapses at least 50% (23,42,45).
The mechanically ventilated patientAnalysis of IVC diameter variability is different for the me-chanically ventilated patient. Mechanical ventilation relies on positive thoracic pressure to inflate the lungs as opposed to negative thoracic pressure in the spontaneously breath-ing patient. A positive pressure breath leads to dilation of the IVC followed by return to baseline with exhalation; the percentage of IVC dilation with inhalation is called the distensibility index (Fig. 6.14). In 2004, Barbier and col-leagues used the distensibility index in mechanically ven-tilated patients as a way to identify fluid responders (22). Their study showed a sensitivity of 90% and specificity of 100% for volume responsiveness in patients with a distensi-bility index >18% (22). This study showed that ultrasound could rapidly and noninvasively identify patients who re-quired volume expansion. In 2010, Moretti and colleagues published a similar study of mechanically ventilated pa-tients found to be volume responsive with a distensibility index >16% (46). Of note, the patients included in these studies had no spontaneous breathing effort and had a tidal volume between 8 and 10 cc per kg. The distensibility in-dex for volume responsiveness has not been validated for patients with spontaneous breathing effort and/or receiv-ing a tidal volume outside the 8 to 10 cc per kg ideal body weight range.
Dehydration in Pediatric Patients8PEDIATRIC CONSIDERATIONS Ultrasound evaluation of IVC diameter variation with respiration as a marker for circulating
FIGURE 6.13. Long-Axis View of a Flat IVC in a Volume Depleted Patient.
FIGURE 6.14. A: Long-axis view of the IVC in a mechanically ventilated patient during end inhalation . B: Long-axis view of the IVC in a mechanically ventilated patient during end exhalation . The IVC diameter at end inhalation was 1 .01 and at in exhalation was 0 .87 . The distensibility index was 16% .
A
B
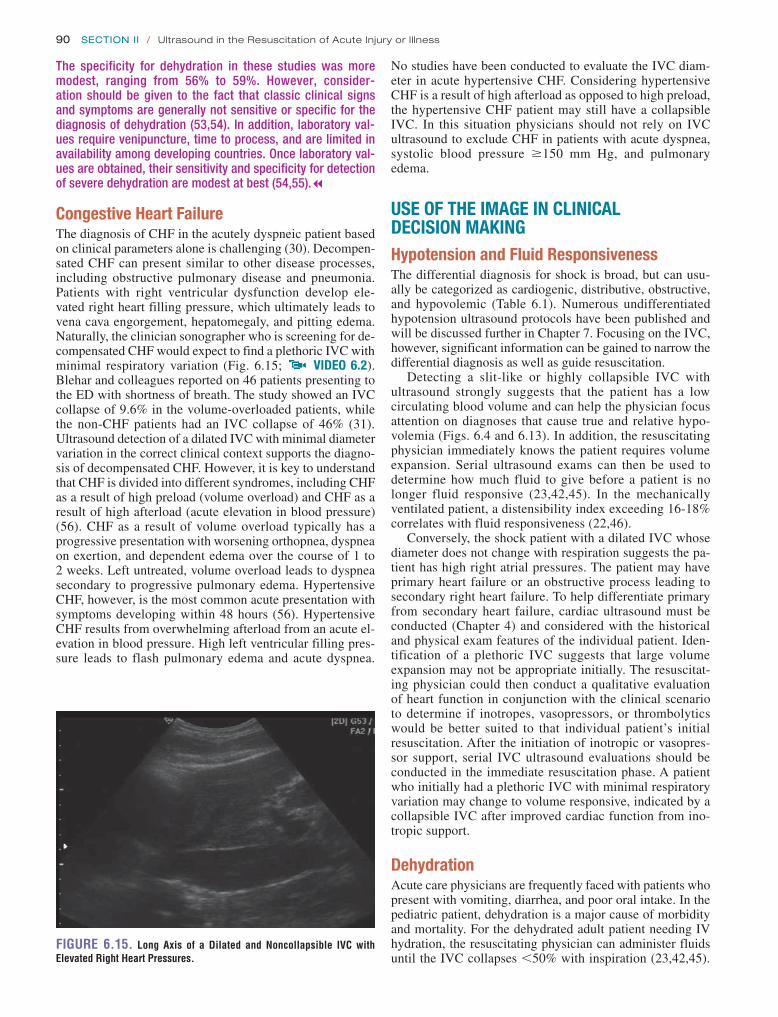
90 SeCtion ii / Ultrasound in the Resuscitation of Acute Injury or Illness
No studies have been conducted to evaluate the IVC diam-eter in acute hypertensive CHF. Considering hypertensive CHF is a result of high afterload as opposed to high preload, the hypertensive CHF patient may still have a collapsible IVC. In this situation physicians should not rely on IVC ultrasound to exclude CHF in patients with acute dyspnea, systolic blood pressure ≥150 mm Hg, and pulmonary edema.
USE OF THE IMAGE IN CLINICAL DECISION MAKINGHypotension and Fluid ResponsivenessThe differential diagnosis for shock is broad, but can usu-ally be categorized as cardiogenic, distributive, obstructive, and hypovolemic (Table 6.1). Numerous undifferentiated hypotension ultrasound protocols have been published and will be discussed further in Chapter 7. Focusing on the IVC, however, significant information can be gained to narrow the differential diagnosis as well as guide resuscitation.
Detecting a slit-like or highly collapsible IVC with ultrasound strongly suggests that the patient has a low circulating blood volume and can help the physician focus attention on diagnoses that cause true and relative hypo-volemia (Figs. 6.4 and 6.13). In addition, the resuscitating physician immediately knows the patient requires volume expansion. Serial ultrasound exams can then be used to determine how much fluid to give before a patient is no longer fluid responsive (23,42,45). In the mechanically ventilated patient, a distensibility index exceeding 16-18% correlates with fluid responsiveness (22,46).
Conversely, the shock patient with a dilated IVC whose diameter does not change with respiration suggests the pa-tient has high right atrial pressures. The patient may have primary heart failure or an obstructive process leading to secondary right heart failure. To help differentiate primary from secondary heart failure, cardiac ultrasound must be conducted (Chapter 4) and considered with the historical and physical exam features of the individual patient. Iden-tification of a plethoric IVC suggests that large volume expansion may not be appropriate initially. The resuscitat-ing physician could then conduct a qualitative evaluation of heart function in conjunction with the clinical scenario to determine if inotropes, vasopressors, or thrombolytics would be better suited to that individual patient’s initial resuscitation. After the initiation of inotropic or vasopres-sor support, serial IVC ultrasound evaluations should be conducted in the immediate resuscitation phase. A patient who initially had a plethoric IVC with minimal respiratory variation may change to volume responsive, indicated by a collapsible IVC after improved cardiac function from ino-tropic support.
DehydrationAcute care physicians are frequently faced with patients who present with vomiting, diarrhea, and poor oral intake. In the pediatric patient, dehydration is a major cause of morbidity and mortality. For the dehydrated adult patient needing IV hydration, the resuscitating physician can administer fluids until the IVC collapses ,50% with inspiration (23,42,45).
The specificity for dehydration in these studies was more modest, ranging from 56% to 59%. However, consider-ation should be given to the fact that classic clinical signs and symptoms are generally not sensitive or specific for the diagnosis of dehydration (53,54). In addition, laboratory val-ues require venipuncture, time to process, and are limited in availability among developing countries. Once laboratory val-ues are obtained, their sensitivity and specificity for detection of severe dehydration are modest at best (54,55).7
Congestive Heart FailureThe diagnosis of CHF in the acutely dyspneic patient based on clinical parameters alone is challenging (30). Decompen-sated CHF can present similar to other disease processes, including obstructive pulmonary disease and pneumonia. Patients with right ventricular dysfunction develop ele-vated right heart filling pressure, which ultimately leads to vena cava engorgement, hepatomegaly, and pitting edema. Naturally, the clinician sonographer who is screening for de-compensated CHF would expect to find a plethoric IVC with minimal respiratory variation (Fig. 6.15; VIDEO 6 .2). Blehar and colleagues reported on 46 patients presenting to the ED with shortness of breath. The study showed an IVC collapse of 9.6% in the volume-overloaded patients, while the non-CHF patients had an IVC collapse of 46% (31). Ultrasound detection of a dilated IVC with minimal diameter variation in the correct clinical context supports the diagno-sis of decompensated CHF. However, it is key to understand that CHF is divided into different syndromes, including CHF as a result of high preload (volume overload) and CHF as a result of high afterload (acute elevation in blood pressure) (56). CHF as a result of volume overload typically has a progressive presentation with worsening orthopnea, dyspnea on exertion, and dependent edema over the course of 1 to 2 weeks. Left untreated, volume overload leads to dyspnea secondary to progressive pulmonary edema. Hypertensive CHF, however, is the most common acute presentation with symptoms developing within 48 hours (56). Hypertensive CHF results from overwhelming afterload from an acute el-evation in blood pressure. High left ventricular filling pres-sure leads to flash pulmonary edema and acute dyspnea.
FIGURE 6.15. Long Axis of a Dilated and Noncollapsible IVC with Elevated Right Heart Pressures.

Chapter 6 / Inferior Vena Cava 91
effect. Keeping the hepatic vein inlet in view through the entire respiratory cycle ensures the IVC midline is maintained. If the hepatic vein inlet is not visible or there is still uncertainty about midline probe location, the clinician sonographer can convert to a short-axis view of the IVC.
3. All studies conducted using IVC diameter variation with spontaneous respiration have used measurements taken with deep inhalation. It is important to ask the patient to take a deep breath or sniff when taking inspiratory IVC diameter measurements.
4. Calculating an IVC distensibility index of the mechani-cally ventilated patient with tidal volumes outside an 8 to 10 cc per kg of ideal body weight range has not been studied. Therefore, the tidal volume should be temporar-ily adjusted to 8 to 10 cc per kg ideal body weight for the short term required to calculate the distensibility index. Transient high-pressure alveolar recruitment maneuvers used for acute lung injury patients have not been shown to cause barotrauma; therefore, transient increase in tidal volume is not likely to cause barotrauma either.
For most adult patients, access for IV fluids is relatively easy. In contrast, IV access in the pediatric patient may be time-consuming and traumatic. 8PEDIATRIC CONSIDERATIONS Ultrasound evaluation of the IVC/Ao ratio as a screening tool for dehydrated pediatric patients is currently a promising area of study.7 The literature available today suggests patients with an IVC/Ao ratio >0.8 are likely not severely dehy-drated, potentially allowing the physician to forgo IV access (29,50,52).
Shortness of BreathDifferentiating cardiac from isolated pulmonary disease processes as the source for acute dyspnea is a challenge emergency physicians face daily. Ultrasound evaluation of the IVC is a rapid noninvasive adjunct to the workup of the acutely dyspneic patient. Identifying a plethoric IVC that collapses 10% or less with spontaneous inspiratory effort suggests volume overload and CHF (31). It is important for the clinician sonographer to understand that a plethoric noncollapsible IVC confirms elevated right heart pressures. Any disease process causing poor right heart function in-cluding baseline right heart dysfunction, massive PE, peri-cardial tamponade, or tension pneumothorax could lead to a plethoric noncollapsible IVC. Conversely, it is possible that flash pulmonary edema from acute hypertensive heart fail-ure could present so rapidly that the patient may still have a collapsible IVC with inspiration. Therefore, it is essential that the clinician sonographer consider IVC collapsibility and qualitative cardiac ultrasound (Chapter 4) in conjunc-tion with the entire clinical picture.
PITFALLS 1. A common pitfall with ultrasound of the IVC is mis-
taking the abdominal aorta for the IVC. Typically the abdominal aorta is just left of midline running parallel to the IVC. In long axis orientation the aorta looks very similar in appearance to the IVC as both are large bore pulsatile vessels. Various anatomic landmarks help the clinician sonographer avoid this pitfall. In long axis, identification of the hepatic vein inlet entering the IVC assures the physician that they are indeed interrogating the IVC. If the hepatic vein inlet is not visible, tilt-ing the probe slightly under the costal margin should show the IVC entering the right atrium of the heart. On the other hand, the aorta can be identified by the take-off of the celiac trunk and superior mesenteric artery (Fig. 6.16). If these landmarks are not easily identified, the physician can rotate counterclockwise 90 degrees to a short-axis view. From the short-axis view a shadow from the vertebral body can be identified. The abdomi-nal aorta will be slightly anterior and left of the pa-tient’s midline, while the IVC is slightly anterior and right of the patient’s midline (Fig. 6.17). The physician can either conduct measurements in the short-axis view or rotate back to the long axis once the IVC has been clearly identified.
2. Another common pitfall is allowing the probe to slide off the IVC midline as the patient breathes in. Interrogating the IVC off the midline leads to inaccu-rate measurements secondary to the cylinder tangent
FIGURE 6.16. Long-Axis or “Banana Peel” View of the Aorta . The celiac trunk and superior mesenteric artery are visualized branching from the aorta .
VBS
FIGURE 6.17. Short-Axis View of the Aorta and IVC Relative to the Vertebral Body Shadow (VBS).

92 SeCtion ii / Ultrasound in the Resuscitation of Acute Injury or Illness
while the drip is being mixed, the physician performs bedside IVC ultrasound to make sure the patient is no longer fluid responsive (Fig. 6.18).
The ultrasound shows that the patient’s IVC is nearly completely collapsible. In the spontaneously breathing patient a collapse of .50% with deep inspiration is predic-tive of a patient who needs more fluid. The patient is given an additional 3 L of normal saline based on serial IVC ultra-sounds. After 3 L, repeat ultrasound of the IVC with deep inspiration reveals the following (Fig. 6.19). Repeat blood pressure is now 130/75 with a heart rate of 95. The patient stays overnight in a monitored bed, and is discharged 4 days later after a relatively uncomplicated hospital course receiv-ing IV antibiotics. The patient never required vasopressor support.
Case 2A 75-year-old woman with a history of alcoholism, diabetes, and hypertension presents to the ED by ambulance complain-ing of abdominal pain. The patient is confused and therefore a poor historian. Her vital signs on presentation are blood
5. Calculating the IVC distensibility index on mechanically ventilated patients requires that the patient not have spontaneous breathing effort. Concurrent negative pres-sure and positive pressure ventilation will create a mixed picture, making the IVC distensibility index unreliable.
6. The clinician sonographer must remember to repeat IVC ultrasound on patients who are started on inotropic medi-cations. Prior to inotropic support, the IVC may appear plethoric without much respiratory variation, indicating a patient who does not require volume expansion. However, inotropic support changes the hemodynamic picture and could unmask a patient who is actually volume depleted.
7. The most important pitfall is the belief that IVC diam-eter variation is a strict marker of volume status when in reality it is a marker of right heart pressure. A flat highly collapsible IVC typically indicates that the patient needs volume expansion. However, a plethoric IVC with little variability does not necessarily indicate a patient who is volume overloaded. Rather, it indicates a patient with high right heart pressures, which could be a result of baseline poor right heart function, massive PE, pericar-dial tamponade, or tension pneumothorax. Before draw-ing conclusions about a patient’s volume status based on IVC diameter, the clinician sonographer must consider the clinical picture in conjunction with qualitative car-diac ultrasound.
CORRELATION WITH OTHER IMAGING MODALITIESEvaluation of dynamic IVC change for use in clinical de-cision making is only done by ultrasound. Numerous other hemodynamic measurements are used to make a determina-tion regarding further fluid resuscitation in the shock patient. A discussion regarding the current popular techniques for determining fluid responsiveness can be found in the on-line text of this publication.
CLINICAL CASESCase 1A 60-year-old man with a history of diabetes, hypertension, and congestive heart failure presents to the ED with 1 week of productive cough associated with vomiting, body aches, and fever. The patient has no other complaints. On presenta-tion his vital signs include a blood pressure 85/50, heart rate 125, respiratory rate 23, oxygen saturation 91% on room air, and a temperature of 38.8°C. Physical exam shows a patient who is tachypneic with nasal flaring but no use of accessory muscles for breathing, and he is able to speak in complete sentences. His cardiopulmonary exam shows rales in the right middle and lower lung fields. He has warm extremities, but no hepatomegaly, jugular venous distention, or lower extrem-ity edema. The patient is given nasal cannula oxygen, which improves his saturation to 98%. IV access is obtained, and the patient is given 2 L of normal saline bolus over 15 minutes. Antipyretics are given, blood cultures are taken, and broad-spectrum antibiotics started. A chest x-ray shows right-sided pneumonia with a blunted costophrenic angle. Repeat vital signs after the fluid bolus shows a blood pressure of 95/55 and a heart rate of 115. A norepinephrine drip is ordered, but
FIGURE 6.18. Clinical Case 1. IVC in a 60-year-old man with history of heart failure and pneumonia . A: At rest . B: With deep inspiration .
A
B

Chapter 6 / Inferior Vena Cava 93
pressure 70/30, heart rate 140, respiratory rate 35, oxygen saturation 95% on room air, and temperature 37.5°C. On exam the patient is tachypneic, and groaning while holding her abdomen. She is not answering questions or following commands. Her abdominal exam shows diffuse tenderness but no rebound, guarding, or rigidity. After establishing IV access and starting a fluid bolus, the patient is noted to have increased somnolence. The patient is intubated for air-way protection and anticipated hospital course. After 2 L of bolused normal saline, the patient’s repeat vital signs include a blood pressure of 75/40 with a heart rate of 130. The resus-citating physician was planning to start vasopressor support, but she wants to make sure the patient was no longer fluid responsive. A bedside IVC distensibility index is performed (Fig. 6.20).
The bedside IVC ultrasound shows a distensibility in-dex $16%, which in the mechanically ventilated patient is
predictive of a patient who is fluid responsive. Using serial IVC ultrasound the patient is given an additional 4 L of nor-mal saline before the following images of the IVC are re-corded (Fig. 6.21). The distensibility index is 13%. Repeat vital signs include a BP of 105/80 with a heart rate of 110. At this point the resuscitating physician evaluates for pulse pres-sure variation of the arterial waveform with mechanical ven-tilation. The pulse pressure variation is 18%, so additional fluid is given before the patient was admitted to the ICU. Ultimately, the patient is diagnosed with severe pancreatitis. The patient has a very rocky hospital course requiring pro-longed support from the mechanical ventilator, vasopressors, and IV antibiotics. The patient also requires operative inter-vention for necrotic pancreatic tissue 3 weeks after presen-tation. However, the patient was eventually discharged to a rehab facility 3 months after initial presentation, and is back home with family today.
FIGURE 6.19. Clinical Case 1. After fluids . Change in IVC collapsibility is seen after fluid resuscitation . A: At rest . B: With deep inspiration .
AB
FIGURE 6.20. Clinical Case 2. Bedside distensibility index performed on intubated patient predicting fluid responsiveness . A: Inspiration . B: Exhalation .
A B
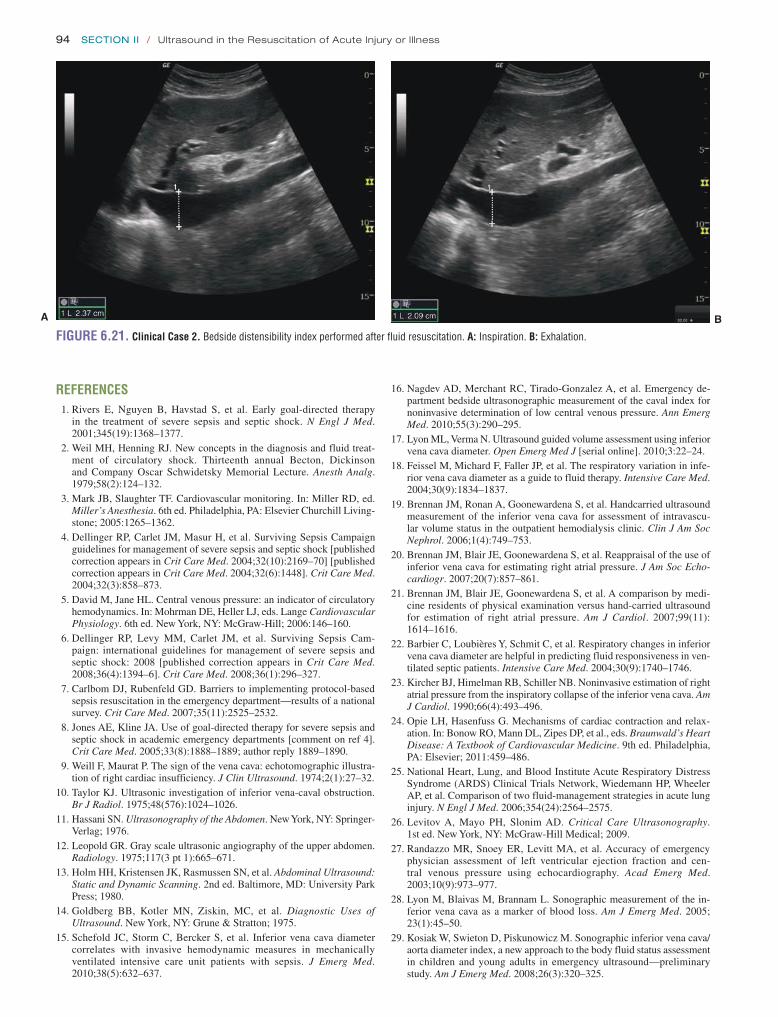
94 SeCtion ii / Ultrasound in the Resuscitation of Acute Injury or Illness
16. Nagdev AD, Merchant RC, Tirado-Gonzalez A, et al. Emergency de-partment bedside ultrasonographic measurement of the caval index for noninvasive determination of low central venous pressure. Ann Emerg Med. 2010;55(3):290–295.
17. Lyon ML, Verma N. Ultrasound guided volume assessment using inferior vena cava diameter. Open Emerg Med J [serial online]. 2010;3:22–24.
18. Feissel M, Michard F, Faller JP, et al. The respiratory variation in infe-rior vena cava diameter as a guide to fluid therapy. Intensive Care Med. 2004;30(9):1834–1837.
19. Brennan JM, Ronan A, Goonewardena S, et al. Handcarried ultrasound measurement of the inferior vena cava for assessment of intravascu-lar volume status in the outpatient hemodialysis clinic. Clin J Am Soc Nephrol. 2006;1(4):749–753.
20. Brennan JM, Blair JE, Goonewardena S, et al. Reappraisal of the use of inferior vena cava for estimating right atrial pressure. J Am Soc Echo-cardiogr. 2007;20(7):857–861.
21. Brennan JM, Blair JE, Goonewardena S, et al. A comparison by medi-cine residents of physical examination versus hand-carried ultrasound for estimation of right atrial pressure. Am J Cardiol. 2007;99(11): 1614–1616.
22. Barbier C, Loubières Y, Schmit C, et al. Respiratory changes in inferior vena cava diameter are helpful in predicting fluid responsiveness in ven-tilated septic patients. Intensive Care Med. 2004;30(9):1740–1746.
23. Kircher BJ, Himelman RB, Schiller NB. Noninvasive estimation of right atrial pressure from the inspiratory collapse of the inferior vena cava. Am J Cardiol. 1990;66(4):493–496.
24. Opie LH, Hasenfuss G. Mechanisms of cardiac contraction and relax-ation. In: Bonow RO, Mann DL, Zipes DP, et al., eds. Braunwald’s Heart Disease: A Textbook of Cardiovascular Medicine. 9th ed. Philadelphia, PA: Elsevier; 2011:459–486.
25. National Heart, Lung, and Blood Institute Acute Respiratory Distress Syndrome (ARDS) Clinical Trials Network, Wiedemann HP, Wheeler AP, et al. Comparison of two fluid-management strategies in acute lung injury. N Engl J Med. 2006;354(24):2564–2575.
26. Levitov A, Mayo PH, Slonim AD. Critical Care Ultrasonography. 1st ed. New York, NY: McGraw-Hill Medical; 2009.
27. Randazzo MR, Snoey ER, Levitt MA, et al. Accuracy of emergency physician assessment of left ventricular ejection fraction and cen-tral venous pressure using echocardiography. Acad Emerg Med. 2003;10(9):973–977.
28. Lyon M, Blaivas M, Brannam L. Sonographic measurement of the in-ferior vena cava as a marker of blood loss. Am J Emerg Med. 2005; 23(1):45–50.
29. Kosiak W, Swieton D, Piskunowicz M. Sonographic inferior vena cava/aorta diameter index, a new approach to the body fluid status assessment in children and young adults in emergency ultrasound—preliminary study. Am J Emerg Med. 2008;26(3):320–325.
REFERENCES 1. Rivers E, Nguyen B, Havstad S, et al. Early goal-directed therapy
in the treatment of severe sepsis and septic shock. N Engl J Med. 2001;345(19):1368–1377.
2. Weil MH, Henning RJ. New concepts in the diagnosis and fluid treat-ment of circulatory shock. Thirteenth annual Becton, Dickinson and Company Oscar Schwidetsky Memorial Lecture. Anesth Analg. 1979;58(2):124–132.
3. Mark JB, Slaughter TF. Cardiovascular monitoring. In: Miller RD, ed. Miller’s Anesthesia. 6th ed. Philadelphia, PA: Elsevier Churchill Living-stone; 2005:1265–1362.
4. Dellinger RP, Carlet JM, Masur H, et al. Surviving Sepsis Campaign guidelines for management of severe sepsis and septic shock [published correction appears in Crit Care Med. 2004;32(10):2169–70] [published correction appears in Crit Care Med. 2004;32(6):1448]. Crit Care Med. 2004;32(3):858–873.
5. David M, Jane HL. Central venous pressure: an indicator of circulatory hemodynamics. In: Mohrman DE, Heller LJ, eds. Lange Cardiovascular Physiology. 6th ed. New York, NY: McGraw-Hill; 2006:146–160.
6. Dellinger RP, Levy MM, Carlet JM, et al. Surviving Sepsis Cam-paign: international guidelines for management of severe sepsis and septic shock: 2008 [published correction appears in Crit Care Med. 2008;36(4):1394–6]. Crit Care Med. 2008;36(1):296–327.
7. Carlbom DJ, Rubenfeld GD. Barriers to implementing protocol-based sepsis resuscitation in the emergency department—results of a national survey. Crit Care Med. 2007;35(11):2525–2532.
8. Jones AE, Kline JA. Use of goal-directed therapy for severe sepsis and septic shock in academic emergency departments [comment on ref 4]. Crit Care Med. 2005;33(8):1888–1889; author reply 1889–1890.
9. Weill F, Maurat P. The sign of the vena cava: echotomographic illustra-tion of right cardiac insufficiency. J Clin Ultrasound. 1974;2(1):27–32.
10. Taylor KJ. Ultrasonic investigation of inferior vena-caval obstruction. Br J Radiol. 1975;48(576):1024–1026.
11. Hassani SN. Ultrasonography of the Abdomen. New York, NY: Springer-Verlag; 1976.
12. Leopold GR. Gray scale ultrasonic angiography of the upper abdomen. Radiology. 1975;117(3 pt 1):665–671.
13. Holm HH, Kristensen JK, Rasmussen SN, et al. Abdominal Ultrasound: Static and Dynamic Scanning. 2nd ed. Baltimore, MD: University Park Press; 1980.
14. Goldberg BB, Kotler MN, Ziskin, MC, et al. Diagnostic Uses of Ultrasound. New York, NY: Grune & Stratton; 1975.
15. Schefold JC, Storm C, Bercker S, et al. Inferior vena cava diameter correlates with invasive hemodynamic measures in mechanically ventilated intensive care unit patients with sepsis. J Emerg Med. 2010;38(5):632–637.
FIGURE 6.21. Clinical Case 2. Bedside distensibility index performed after fluid resuscitation . A: Inspiration . B: Exhalation .
A B

Chapter 6 / Inferior Vena Cava 95
44. Wallace DJ, Allison M, Stone MB. Inferior vena cava percentage col-lapse during respiration is affected by the sampling location: an ul-trasound study in healthy volunteers. Acad Emerg Med. 2010;17(1): 96–99.
45. Adler C, Büttner W, Veh R. Relations of the ultrasonic image of the inferior vena cava and central venous pressure [in German]. Aktuelle Gerontol. 1983;13(6):209–213.
46. Moretti R, Pizzi B. Inferior vena cava distensibility as a predictor of fluid responsiveness in patients with subarachnoid hemorrhage. Neurocrit Care. 2010;13(1):3–9.
47. Murphy CV, Schramm GE, Doherty JA, et al. The importance of fluid management in acute lung injury secondary to septic shock. Chest. 2009;136(1):102–109.
48. Rivers EP, Katranji M, Jaehne KA, et al. Early interventions in severe sepsis and septic shock: a review of the evidence one decade later. Minerva Anestesiol. 2012;78(6):712–724.
49. Yanagawa Y, Nishi K, Sakamoto T, et al. Early diagnosis of hypovole-mic shock by sonographic measurement of inferior vena cava in trauma patients. J Trauma. 2005;58(4):825–829.
50. Chen L, Hsiao A, Langhan M, et al. Use of bedside ultrasound to assess degree of dehydration in children with gastroenteritis. Acad Emerg Med. 2010;17(10):1042–1047.
51. Chen L, Kim Y, Santucci KA. Use of ultrasound measurement of the inferior vena cava diameter as an objective tool in the assessment of children with clinical dehydration. Acad Emerg Med. 2007;14(10): 841–845.
52. Levine AC, Shah SP, Umulisa I, et al. Ultrasound assessment of severe dehydration in children with diarrhea and vomiting. Acad Emerg Med. 2010;17(10):1035–1041.
53. Gorelick MH, Shaw KN, Murphy KO. Validity and reliability of clinical signs in the diagnosis of dehydration in children. Pediatrics. 1997;99(5):E6.
54. Steiner MJ, DeWalt DA, Byerley JS. Is this child dehydrated? JAMA. 2004;291(22):2746–2754.
55. Chen L, Baker MD. Novel applications of ultrasound in pediatric emergency medicine. Pediatr Emerg Care. 2007;23(2):115–123; quiz 124–126.
56. Peacock WF. Congestive heart failure and acute pulmonary edema. In: Tintinalli J, Stapczynski J, Ma OJ, et al., eds. Tintinalli’s Emergency Medicine: A Comprehensive Study Guide. 7th ed. New York, NY: McGraw-Hill; 2011.
30. McCullough PA, Nowak RM, McCord J, et al. B-type natriuretic peptide and clinical judgment in emergency diagnosis of heart failure: analysis from Breathing Not Properly (BNP) Multinational Study. Circulation. 2002;106(4):416–422.
31. Blehar DJ, Dickman E, Gaspari R. Identification of congestive heart failure via respiratory variation of inferior vena cava diameter. Am J Emerg Med. 2009;27(1):71–75.
32. Isenhour JL, Marx J. Advances in abdominal trauma. Emerg Med Clin North Am. 2007;25(3):713–733, ix.
33. Field JM, Bresler MJ, Mattu A, et al. Textbook of Emergency Cardiovascu-lar Care and CPR. Philadelphia, PA: Lippincott Williams & Wilkins; 2008.
34. Mauro MA, Murphy K, Thomson K, et al. Image-Guided Interventions. Philadelphia, PA: Saunders Elsevier; 2008.
35. Kitamura H, Kobayashi C. Impairment of change in diameter of the he-patic portion of the inferior vena cava: a sonographic sign of liver fibro-sis or cirrhosis. J Ultrasound Med. 2005;24(3):355–359; quiz 360–361.
36. Lichtenstein DA. General Ultrasound in the Critically Ill. Berlin, Ger-many: Springer-Verlag; 2004.
37. Mintz GS, Kotler MN, Parry WR, et al. Real-time inferior vena caval ultrasonography: normal and abnormal findings and its use in assessing right-heart function. Circulation. 1981;64(5):1018–1025.
38. Minutiello L. Non-invasive evaluation of central venous pressure derived from respiratory variations in the diameter of the inferior vena cava [in Italian]. Minerva Cardioangiol. 1993;41(10):433–437.
39. Mitaka C, Nagura T, Sakanishi N, et al. Two-dimensional echocardio-graphic evaluation of inferior vena cava, right ventricle, and left ven-tricle during positive-pressure ventilation with varying levels of positive end-expiratory pressure. Crit Care Med. 1989;17(3):205–210.
40. Moreno FL, Hagan AD, Holmen JR, et al. Evaluation of size and dynam-ics of the inferior vena cava as an index of right-sided cardiac function. Am J Cardiol. 1984;53(4):579–585.
41. Natori H, Tamaki S, Kira S. Ultrasonographic evaluation of ventila-tory effect on inferior vena caval configuration. Am Rev Respir Dis. 1979;120(2):421–427.
42. Simonson JS, Schiller NB. Sonospirometry: a new method for noninva-sive estimation of mean right atrial pressure based on two-dimensional echographic measurements of the inferior vena cava during measured inspiration. J Am Coll Cardiol. 1988;11(3):557–564.
43. Tamaki S. Relationship between ventilatory change of the inferior vena cava and central venous pressure [in Japanese]. Nihon Kyobu Shikkan Gakkai Zasshi. 1981;19(7):460–469.

96
The Thoracic Exam: Detecting Pneumothorax . . . . . . . . . . . . . . . . . . . . . . . . . . . . 103
The Thoracic Exam: Detecting Interstitial Fluid . . . . . . . . . . . . . . . . . . . . . . . . . . . 104
The FAST Scan: Detecting Intra-Abdominal Hemorrhage . . . . . . . . . . . . . . . . . . . . . . . . . . . . . . 104
Assessment of the Aorta: Detecting Abdominal Aortic Aneurysm, Aortic Dissection . . . 105
Detecting Venous Thromboembolism . . . . . . . . . . . . . 105RESUSCITATIVE ULTRASOUND IN AIRWAY
MANAGEMENT AND THE CRASHING POST INTUBATION PATIENT . . . . . . . . . . . . . . . . . . . . . . . . . . . 105
CLINICAL CASES . . . . . . . . . . . . . . . . . . . . . . . . . . . . . . . . . 105Case 1 . . . . . . . . . . . . . . . . . . . . . . . . . . . . . . . . . . . . . 105Case 2 . . . . . . . . . . . . . . . . . . . . . . . . . . . . . . . . . . . . . 105
INTRODUCTION . . . . . . . . . . . . . . . . . . . . . . . . . . . . . . . . . . . 96THE BASIC EXAM . . . . . . . . . . . . . . . . . . . . . . . . . . . . . . . . . 96DECISION MAKING WITH RESUSCITATIVE ULTRASOUND . . 100RESUSCITATIVE ULTRASOUND IN CARDIAC ARREST . . . . . 101RESUSCITATIVE ULTRASOUND IN UNDIFFERENTIATED
HYPOTENSION AND ACUTE DYSPNEA . . . . . . . . . . . . . . 101Assessment of the Heart: General Goals . . . . . . . . . . . 101Assessment of the Heart: Contractility
and Left Ventricular Function . . . . . . . . . . . . . . . . . 101Assessment of the Heart: Pericardial
Effusion and Tamponade . . . . . . . . . . . . . . . . . . . . 102Assessment of the Heart: Detecting Right
Heart Strain and Possible Pulmonary Embolism . . 102Assessment of the Inferior Vena Cava: Estimation
of Preload and Volume Status . . . . . . . . . . . . . . . . 103
A Problem-Based Approach to Resuscitation of Acute
Illness or Injury
7
John Bailitz
INTRODUCTIONThe opening sections of this text focus on ultrasound skills that are most useful in the assessment and treatment of criti-cal illness and injury. Individually, each study (echo, inferior vena cava (IVC), thoracic) is useful, but the greatest potential impact is gained when one shifts from an organ-based to a problem-based approach that utilizes a number of applica-tions in a systematic fashion to answer specific questions. The ultrasound exam becomes less of an instrument defining anatomy and more of a tool that reveals physiology. By as-sessing the heart, circulatory, and respiratory systems at one point in time, the scan can assist in defining the physiological status as well as potential diagnoses. A systematic problem-based approach to acute resuscitation can detect or rule out many immediate life-threatening conditions, help determine initial treatment priorities, and further guide reassessments and needed interventions. A variety of algorithms have been
proposed for the use of ultrasound in the acute care of the un-stable patient (1–9), and there is evidence that they alter pa-tient management in 78% of cases (10), reduce the number of potential diagnoses (8), and help provide a more timely and accurate final diagnosis (Fig. 7.1; Table 7.1) (8). The FAST exam changed the initial management of trauma. Now, with improved access and training, ultrasound has been found to be extraordinarily useful in the management of nontraumatic cardiac arrest, undifferentiated hypotension/shock, and acute dyspnea.
THE BASIC EXAMThe purpose of an algorithmic approach to resuscitative ultrasound is to provide a basic exam that is comprehensive yet still practical and covers most of the relevant questions in a timely, efficient manner. However, no single approach fits

Chapter 7 / A Problem-Based Approach to Resuscitation of Acute Illness or Injury 97
every clinical scenario, and the exam is not intended to be rigid. In fact, depending upon one’s skill level and the clinical setting, certain portions of the exam may not be integrated at all. There is value in learning and using portions of the exam and gradually adding others as one’s proficiency improves.
A designated ultrasound machine should be immediately available in the resuscitation suite at all times, at the bed-side, ready for use. The exam begins with an examination of the heart. Many prefer a small footprint phased array probe to begin with, although a curvilinear probe allows one to transition from the cardiac exam to other applications without delay. Begin with a subxyphoid approach. If a good window is obtained, assess for myocardial contractility, determine if a pericardial effusion is present, and note the
relative sizes of the left and right ventricles. The probe can then be turned into a longitudinal orientation and the scan oriented more to the left to obtain a short view of the right and left ventricle similar in appearance to the parasternal short view (Fig. 7.2; VIDEO 7 .1) (11). If the subxyphoid view is inadequate, other cardiac views can be used based on the individual patient and the sonographer’s experience. If the examiner is comfortable with other views, a more thorough kinesis assessment may be completed from the parasternal views. From the parasternal long view, assess for vigorous and synchronous motion of the anterior leaflet of the mitral valve, left ventricle septal and posterior wall, and aortic valve. Qualitative visual estimates of left ven-tricular function have been demonstrated across multiple
Resuscitative Ultrasound Question Based Algorithm
Undifferentiated Shock Patient
Pericardial Effusion Present? Anechoic or mixed echogenic material in dependent portions of the heart.If yes, then is tamponade present? Clinical diagnosis based on unstable vital signs with a significant pericardial effusion. Right heart collapse and IVC dilation confirm diagnosis.
Right Heart Strain? Right heart size greater than left heart size on four-chamber view of the heart often accompanied by loss of normal septal deviation seen as a D shape LV in short axis.
If yes, in appropriate clinical context findings are specific for massive pulmonary embolism. Consider thrombolysis with severe hypotension or cardiac arrest. Not sensitive for pulmonary embolism. >5 mm right ventricular wall thickness suggests chronic right heart strain.
Left Heart Function?Visual Estimation in 2 Planes and E Point Septal SeparationPoor Ejection Fraction: Minimal change in thickness of the septal and posterior endocardium resulting in minimal change in the ventricular cavity size. E Point septal separation >1.8 cm.Nonarrhythmogenic Cardiac Arrest:
o Hypovolemia: Empty/Flat hearto Thrombosis, Pulmonary: Enlarged right heart > left hearto Tamponade: Aboveo Tension Pneumothorax: Loss of lung sliding, distended IVC, empty heart
Assess the Pump
Assess the Tank
Volume Status? Is the CVP low or high? Low CVP: <1.5 cm with complete or near complete collapse with respirationHigh CVP: >2.5 with minimal collapse with respiration
What is the Site of Fluid loss? Free Fluid on FAST exam
Tank Compromise?Pneumothorax: Lung sliding sensitive for pneumothorax. Lung point specific.Pulmonary Congestion: three or more B lines present in 2 of 4 lung zones on both sides of thechest
Assess the Pipes
Aortic Aneurysm? Nearly 100% sensitive and specific for the presence of a AAA. But not accurate in detecting retroperitoneal rupture.
Aortic Dissection?Excellent specificity with the visualization of an undulating flap. Low sensitivity.
DVT? Compressibility rules out DVT
FIGURE 7.1. Resuscitative Ultrasound Algorithm . (Adapted from RUSH Exam in Perera P, Mailhot T, Riley D, et al . The RUSH exam: rapid ultrasound in shock in the evaluation of the critically ill . Emerg Med Clin North Am . 2010;28:29–56 .)

98 SeCtion ii / Ultrasound in the Resuscitation of Acute Injury or Illness
Once the cardiac views have been obtained, next focus on assessment of the IVC (and volume status of the patient). From the subxyphoid position, the probe can be moved in-feriorly toward the abdomen to visualize the junction of the right atrium and IVC, then the hepatic veins draining into the IVC. The IVC will be in transverse orientation using this technique. Clear consensus on the optimal patient position, scanning plane, and point at which to measure the IVC has yet to be established. The transverse view prevents imaging errors such as the cylinder tangential effect; it also prevents a common problem with mistaking the aorta for the IVC in
specialties to be a reliable indicator of overall contractility (4,12,13). Rotate the probe to the short axis view to confirm the overall contractility and identify regional wall motion abnormalities.
Should time allow, measuring the E-point septal sepa-ration (EPSS) provides a rapid and simple quantitative confirmation of the initial subjective impression of systolic function. From the parasternal long view, measure the dis-tance between the anterior leaflet of the mitral valve and the septum utilizing M-mode (Fig. 7.3) (13).
TABLE 7.1 Resuscitative Ultrasound Question-Based Approach
Begin with a stepwise baseline physiologic assessment: 1 . Subxyphoid view:
a . Left ventricle function?
b . Effusion . Tamponade?
c . Acute right heart strain: right heart size vs . left?
2 . IVC view: volume status?
3 . FAST:
a . RUQ: pleural effusion? Intraperitoneal fluid?
4 . Thoracic
a . Increase interstitial fluid—B lines?
b . Pneumothorax—lung sliding?
Then move to focused patient specific assessments as indicated:
FAST: LUQ and pelvic views for additional evidence of free fluid?
Abdomen: 1 . Acute cholecystitis?
2 . Hydronephrosis/obstruction in a patient with urosepsis?
3 . Abscess?
4 . AAA? Dissection? If dissection, then consider visualizing the thoracic aorta from the PSL and PSS views, as well as the supraclavicular notch view .
Suspected PE based on acute right heart strain: 1 . Compression ultrasound of femoral vein
2 . Compression ultrasound of popliteal vein
FIGURE 7.2. Still Image Obtained from the Subxyphoid Position by Angling the Probe from a Longitudinal Position to the Left Chest . A short axis view of the muscular and circular left ventricle is seen immediately below a portion of the right ventricle in this normal patient .
FIGURE 7.3. M-Mode of E-Point Separation . Still image obtained from the parasternal position of a long axis view through the left ventricle . M-Mode cursor places over the tip of the anterior leaflet of the mitral valve in this patient with a normal ejection fraction .

Chapter 7 / A Problem-Based Approach to Resuscitation of Acute Illness or Injury 99
the difficult to visualize patient (14). Other investigators have also described the long axis approach to IVC visual-ization; this can be obtained simply by turning the probe from the subxyphoid position into a longitudinal scanning plane (15,16). In this view the scanner can avoid less accu-rate measurements near the diaphragm where the IVC may be narrowed. In either plane, visualize and measure the IVC 1 to 2 cm below the diaphragm. Record a cine loop, then scroll through still images to identify the smallest and largest diameters. When the borders of the IVC are clearly visual-ized, both visual estimation and M-mode measurements pro-vide reliable measurements (Fig. 7.4; VIDEO 7 .2) (17).
On occasion, visualization of the IVC may be difficult. The internal jugular (IJ) vein provides an alternative site to estimate central venous pressure. However, it requires the sonographer to move to an alternate site, and may re-quire use of a different probe. These disadvantages add time and complexity to the basic exam; the information gained may be worth it in patients in whom the IVC simply can-not be visualized. Clinicians are likely to be familiar with this anatomy since an assessment is always completed as part of ultrasound-guided IJ line placement. A linear probe provides the best view, but in obese patients, a curvilinear or phased array probe may be better. To avoid inadvertent compression by the probe, in the transverse plane begin by purposely compressing the IJ. Then release pressure until visualizing the vein’s greatest diameter. In a normal upright patient, the IJ is collapsed during respiration. Progressively reclining the normal patient to a more recumbent position causes the IJ to become increasingly visible throughout respiration. Most basic scans will not require visualization of the IJ. It is included to provide an option for the occa-sional patient.
After completing the IVC scan, it is easy to move to an extended FAST scan. After viewing the IVC, a minor change in probe position will easily obtain a view of Morison’s pouch; a slight move cephalad is all that is necessary to view the right costophrenic angle to look for a right pleural effu-sion. At this point the sonographer can choose which scan is most important to prioritize. If the patient has a flat or highly compressible IVC and hypovolemia or hemorrhage is suspected, the priority may be to complete the FAST scan.
If the patient has evidence of a full, distended IVC and poor cardiac function, or the patient is dyspneic, there may be a higher priority to scan the chest. The sonographer can obtain views of the splenorenal space and pelvis next, or move to the thoracic scan.
The scan of the thorax can be completed with the cur-vilinear transducer, although some will prefer a linear higher frequency transducer for improved resolution, par-ticularly if there is significant concern for pneumothorax. If scanning to assess for interstitial fluid, the curvilinear transducer offers deeper penetration and a better view of B-lines. Begin the scan by placing the probe of choice in a longitudinal scanning plane on the anterior superior surface of the chest, and adjust the depth of view to visualize the pleural line between two ribs. Normal lung sliding excludes the presence of a pneumothorax (Fig. 7.5; VIDEOS 7 .3 and 7 .4). Color flow and power Doppler make this move-ment readily visible. Likewise, M-mode may be helpful to confirm the normal seashore sign, or detect the barcode sign suggestive of pneumothorax. The focal depth should be increased to inspect the lung for B-lines. Looking deep from the pleural, determine if there is a predominance of A-lines ( horizontal lines deep to the pleura, reverberation artifact seen in normal lung) or B-lines (echogenic verti-cal ray-like projections that extend from the pleural surface to deep in the chest). B-lines erase A-lines; scans typically have predominance of A-lines or B-lines. B-line predomi-nance suggests interstitial fluid or abnormal lung. Increas-ing number of B-lines corresponds to severity of interstitial fluid. Different protocols have been proposed for a com-plete evaluation of the chest (5,18,19). For the emergency department (ED) scan, the chest may be divided into eight zones: superior and inferior, anterior and lateral, to give four zones each in the right and left chest. During the general in-spection of the chest, the scan may also detect large pleural effusions or consolidated lung segments.
Once the cardiac, IVC, and thoracic scans are done, the clinician has a fairly complete assessment of the physiologic status of the patient to guide the initial resuscitation and help classify the type of shock. Depending upon the results, the sonographer can take a directed approach to further imaging based on their differential diagnosis.
The sonographer may return to the abdomen to complete the FAST exam to look for intra-abdominal fluid, or con-sider surveying the abdomen for a potential source of sep-sis. By adding the views of the splenorenal space and the pelvis, the FAST is easily completed. The scan may also be used to check other intra-abdominal conditions such as acute cholecystitis, hydronephrosis with urosepsis, or an intra-abdominal or pelvic abscess. If concern exists for an abdominal aortic aneurysm (AAA), the aorta can be in-cluded in the abdominal survey. Obviously, in cases of sud-den back pain and hypotension, hypotension in face of an abdominal mass, or a known AAA, the clinician will likely have prioritized this application early in the assessment of the patient. To examine the abdominal aorta, place the cur-vilinear or phased array probe in the midline epigastrium in the transverse scanning plane to quickly visualize the hy-perechoic vertebral body in the far field, with the pulsating aorta just anterior and to the right of the prevertebral stripe, and the teardrop-shaped compressible IVC to the left. Lift and press in 1-cm caudad “jumps” to displace bowel gas in between the probe and the aorta, bringing the proximal
+1
+
+2
+
FIGURE 7.4. Distended IVC with M-Mode Measurement . Distended IVC confirmed by M-mode measurements on this patient with congestive heart failure .
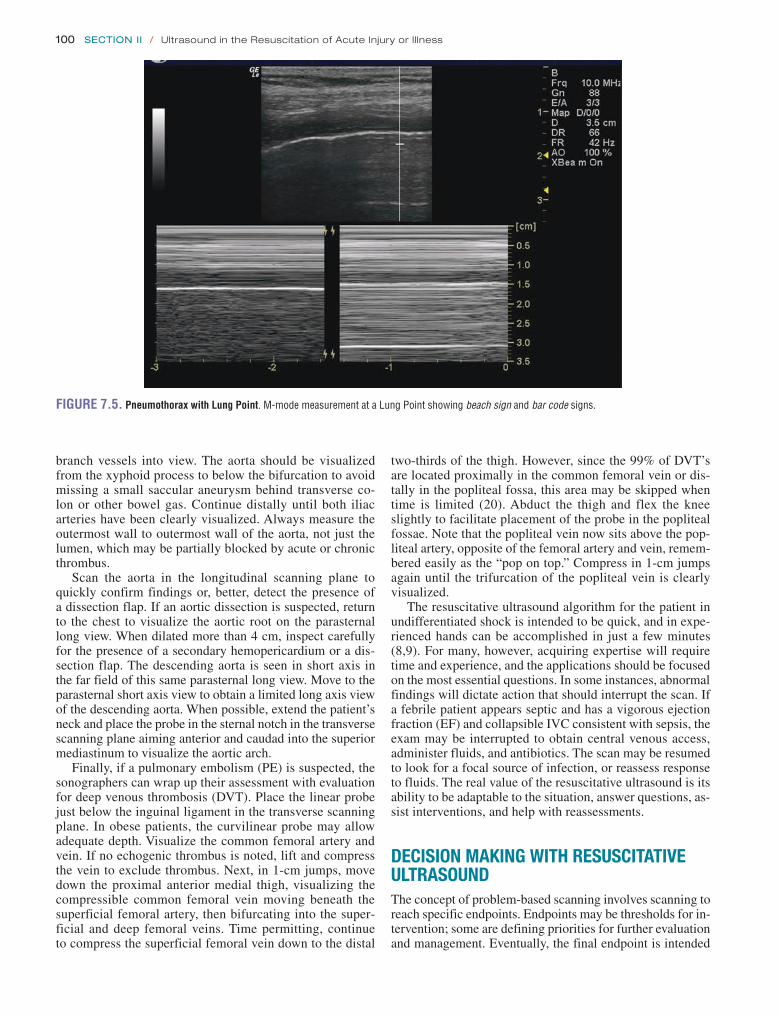
100 SeCtion ii / Ultrasound in the Resuscitation of Acute Injury or Illness
two-thirds of the thigh. However, since the 99% of DVT’s are located proximally in the common femoral vein or dis-tally in the popliteal fossa, this area may be skipped when time is limited (20). Abduct the thigh and flex the knee slightly to facilitate placement of the probe in the popliteal fossae. Note that the popliteal vein now sits above the pop-liteal artery, opposite of the femoral artery and vein, remem-bered easily as the “pop on top.” Compress in 1-cm jumps again until the trifurcation of the popliteal vein is clearly visualized.
The resuscitative ultrasound algorithm for the patient in undifferentiated shock is intended to be quick, and in expe-rienced hands can be accomplished in just a few minutes (8,9). For many, however, acquiring expertise will require time and experience, and the applications should be focused on the most essential questions. In some instances, abnormal findings will dictate action that should interrupt the scan. If a febrile patient appears septic and has a vigorous ejection fraction (EF) and collapsible IVC consistent with sepsis, the exam may be interrupted to obtain central venous access, administer fluids, and antibiotics. The scan may be resumed to look for a focal source of infection, or reassess response to fluids. The real value of the resuscitative ultrasound is its ability to be adaptable to the situation, answer questions, as-sist interventions, and help with reassessments.
DECISION MAKING WITH RESUSCITATIVE ULTRASOUNDThe concept of problem-based scanning involves scanning to reach specific endpoints. Endpoints may be thresholds for in-tervention; some are defining priorities for further evaluation and management. Eventually, the final endpoint is intended
branch vessels into view. The aorta should be visualized from the xyphoid process to below the bifurcation to avoid missing a small saccular aneurysm behind transverse co-lon or other bowel gas. Continue distally until both iliac arteries have been clearly visualized. Always measure the outermost wall to outermost wall of the aorta, not just the lumen, which may be partially blocked by acute or chronic thrombus.
Scan the aorta in the longitudinal scanning plane to quickly confirm findings or, better, detect the presence of a dissection flap. If an aortic dissection is suspected, return to the chest to visualize the aortic root on the parasternal long view. When dilated more than 4 cm, inspect carefully for the presence of a secondary hemopericardium or a dis-section flap. The descending aorta is seen in short axis in the far field of this same parasternal long view. Move to the parasternal short axis view to obtain a limited long axis view of the descending aorta. When possible, extend the patient’s neck and place the probe in the sternal notch in the transverse scanning plane aiming anterior and caudad into the superior mediastinum to visualize the aortic arch.
Finally, if a pulmonary embolism (PE) is suspected, the sonographers can wrap up their assessment with evaluation for deep venous thrombosis (DVT). Place the linear probe just below the inguinal ligament in the transverse scanning plane. In obese patients, the curvilinear probe may allow adequate depth. Visualize the common femoral artery and vein. If no echogenic thrombus is noted, lift and compress the vein to exclude thrombus. Next, in 1-cm jumps, move down the proximal anterior medial thigh, visualizing the compressible common femoral vein moving beneath the superficial femoral artery, then bifurcating into the super-ficial and deep femoral veins. Time permitting, continue to compress the superficial femoral vein down to the distal
FIGURE 7.5. Pneumothorax with Lung Point . M-mode measurement at a Lung Point showing beach sign and bar code signs .
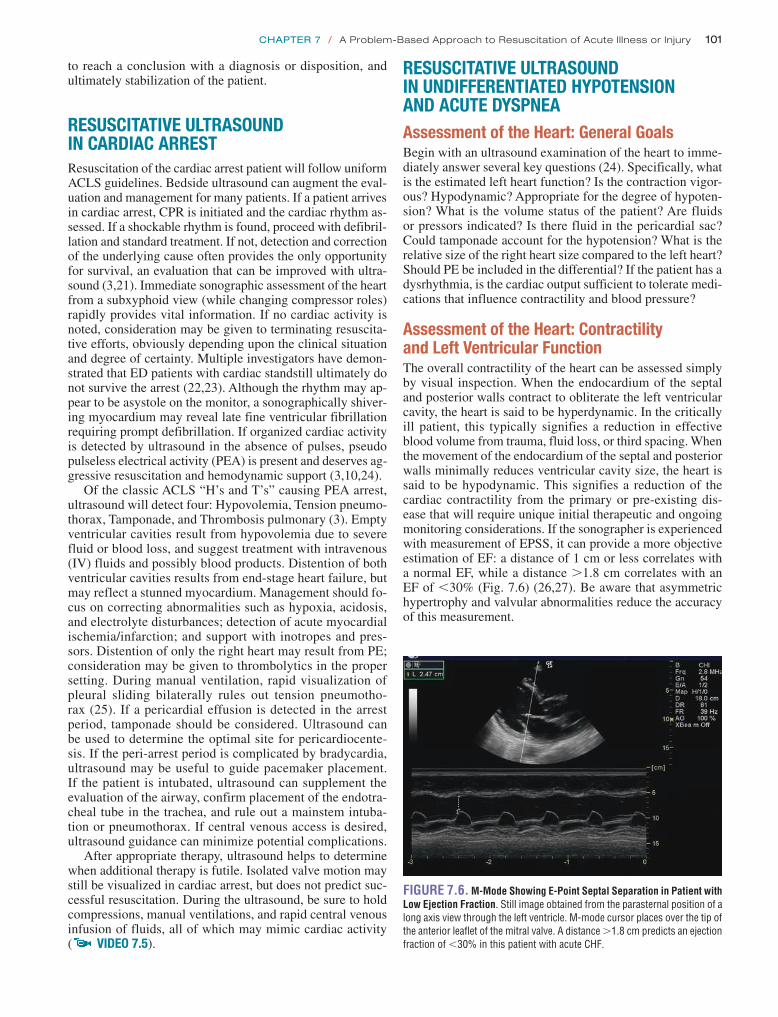
Chapter 7 / A Problem-Based Approach to Resuscitation of Acute Illness or Injury 101
RESUSCITATIVE ULTRASOUND IN UNDIFFERENTIATED HYPOTENSION AND ACUTE DYSPNEAAssessment of the Heart: General GoalsBegin with an ultrasound examination of the heart to imme-diately answer several key questions (24). Specifically, what is the estimated left heart function? Is the contraction vigor-ous? Hypodynamic? Appropriate for the degree of hypoten-sion? What is the volume status of the patient? Are fluids or pressors indicated? Is there fluid in the pericardial sac? Could tamponade account for the hypotension? What is the relative size of the right heart size compared to the left heart? Should PE be included in the differential? If the patient has a dysrhythmia, is the cardiac output sufficient to tolerate medi-cations that influence contractility and blood pressure?
Assessment of the Heart: Contractility and Left Ventricular FunctionThe overall contractility of the heart can be assessed simply by visual inspection. When the endocardium of the septal and posterior walls contract to obliterate the left ventricular cavity, the heart is said to be hyperdynamic. In the critically ill patient, this typically signifies a reduction in effective blood volume from trauma, fluid loss, or third spacing. When the movement of the endocardium of the septal and posterior walls minimally reduces ventricular cavity size, the heart is said to be hypodynamic. This signifies a reduction of the cardiac contractility from the primary or pre-existing dis-ease that will require unique initial therapeutic and ongoing monitoring considerations. If the sonographer is experienced with measurement of EPSS, it can provide a more objective estimation of EF: a distance of 1 cm or less correlates with a normal EF, while a distance .1.8 cm correlates with an EF of ,30% (Fig. 7.6) (26,27). Be aware that asymmetric hypertrophy and valvular abnormalities reduce the accuracy of this measurement.
to reach a conclusion with a diagnosis or disposition, and ultimately stabilization of the patient.
RESUSCITATIVE ULTRASOUND IN CARDIAC ARRESTResuscitation of the cardiac arrest patient will follow uniform ACLS guidelines. Bedside ultrasound can augment the eval-uation and management for many patients. If a patient arrives in cardiac arrest, CPR is initiated and the cardiac rhythm as-sessed. If a shockable rhythm is found, proceed with defibril-lation and standard treatment. If not, detection and correction of the underlying cause often provides the only opportunity for survival, an evaluation that can be improved with ultra-sound (3,21). Immediate sonographic assessment of the heart from a subxyphoid view (while changing compressor roles) rapidly provides vital information. If no cardiac activity is noted, consideration may be given to terminating resuscita-tive efforts, obviously depending upon the clinical situation and degree of certainty. Multiple investigators have demon-strated that ED patients with cardiac standstill ultimately do not survive the arrest (22,23). Although the rhythm may ap-pear to be asystole on the monitor, a sonographically shiver-ing myocardium may reveal late fine ventricular fibrillation requiring prompt defibrillation. If organized cardiac activity is detected by ultrasound in the absence of pulses, pseudo pulseless electrical activity (PEA) is present and deserves ag-gressive resuscitation and hemodynamic support (3,10,24).
Of the classic ACLS “H’s and T’s” causing PEA arrest, ultrasound will detect four: Hypovolemia, Tension pneumo-thorax, Tamponade, and Thrombosis pulmonary (3). Empty ventricular cavities result from hypovolemia due to severe fluid or blood loss, and suggest treatment with intravenous (IV) fluids and possibly blood products. Distention of both ventricular cavities results from end-stage heart failure, but may reflect a stunned myocardium. Management should fo-cus on correcting abnormalities such as hypoxia, acidosis, and electrolyte disturbances; detection of acute myocardial ischemia/ infarction; and support with inotropes and pres-sors. Distention of only the right heart may result from PE; consideration may be given to thrombolytics in the proper setting. During manual ventilation, rapid visualization of pleural sliding bilaterally rules out tension pneumotho-rax (25). If a pericardial effusion is detected in the arrest period, tamponade should be considered. Ultrasound can be used to determine the optimal site for pericardiocente-sis. If the peri-arrest period is complicated by bradycardia, ultrasound may be useful to guide pacemaker placement. If the patient is intubated, ultrasound can supplement the evaluation of the airway, confirm placement of the endotra-cheal tube in the trachea, and rule out a mainstem intuba-tion or pneumothorax. If central venous access is desired, ultrasound guidance can minimize potential complications.
After appropriate therapy, ultrasound helps to determine when additional therapy is futile. Isolated valve motion may still be visualized in cardiac arrest, but does not predict suc-cessful resuscitation. During the ultrasound, be sure to hold compressions, manual ventilations, and rapid central venous infusion of fluids, all of which may mimic cardiac activity ( VIDEO 7 .5).
+
1+
FIGURE 7.6. M-Mode Showing E-Point Septal Separation in Patient with Low Ejection Fraction . Still image obtained from the parasternal position of a long axis view through the left ventricle . M-mode cursor places over the tip of the anterior leaflet of the mitral valve . A distance .1 .8 cm predicts an ejection fraction of ,30% in this patient with acute CHF .

102 SeCtion ii / Ultrasound in the Resuscitation of Acute Injury or Illness
critical threshold where no additional fluid can be accommo-dated, the so-called last drip phenomenon (28). In contrast, rapidly accumulating hemopericardium may cause tampon-ade at a much smaller total volume in the trauma patient whose cardiac preload is already compromised by other sites of ongoing hemorrhage. The identification of even a small amount of pericardial blood requires immediate notification of surgical teams and preparation for temporizing measures while additional sonographic views are obtained. If a sig-nificant pericardial effusion is present in the unstable patient, then tamponade is clinically present and requires immediate intervention. Should tamponade be detected and the patient too unstable to move, ultrasound can determine the optimal site for emergency drainage at the bedside.
Assessment of the Heart: Detecting Right Heart Strain and Possible Pulmonary EmbolismNext, the right heart size is compared to the left heart size to evaluate for right heart strain, one indicator of a possi-ble PE. The relatively low-pressure, thin-walled right heart wraps anteriorly around the high-pressure, thick-walled left heart, resulting in a sonographically smaller right heart size compared to the left in normal patients. A right heart size greater than or equal to the left heart indicates right heart strain. Clinical context always guides interpretation. Echo-cardiographic findings in acute PE are often indirect, un-less a rare intracardiac thrombus is identified. Typical echo findings in PE include right ventricular dilatation, tricuspid regurgitation, paradoxical septal motion (right ventricular bowing into the left), resulting in a “D” shape to the normally circular left ventricular cavity seen best on the parasternal short axis view, and McConnell’s sign (regional akinesis of the right ventricular mid-free wall, but preserved motion of the right ventricular apex—a finding that is highly specific for PE) (29). These findings may be more easily appreciated on video loops (Fig. 7.8; VIDEO 7 .7).
The diagnostic utility of echocardiography in an ED pa-tient depends upon whether the PE is massive (i.e., associated
The information from the initial cardiac exam may help direct treatment in the first minutes of care. For example, in a 70-year-old critically ill patient with hypotension, a hy-perdynamic heart suggests preserved cardiac function with hypovolemia. Fluids are appropriate. In the same patient, a hypodynamic heart suggests a primary cardiac condition, or myocardial depression in late sepsis. More careful fluid titra-tion is now appropriate. Although an exact diagnosis is not yet certain, treatment priorities can be established as further evaluation is done.
Assessment of the Heart: Pericardial Effusion and TamponadeFrom the subxyphoid or other readily accessible cardiac win-dow, first determine whether a pericardial effusion is present. Most effusions are easily recognized as an anechoic black space collecting in the dependent portions of the pericardial sac. A false positive may result from an epicardial fat pad, vi-sualized as a layer of mixed echogenicity typically confined to the anterior right ventricle. False negatives may result from overlooking areas of mixed echogenicity from clotted blood or pus, or an isolated posterior effusion in postopera-tive patients.
Once the presence of a pericardial effusion is confirmed in a clinically stable patient, or one who has responded to ini-tial fluid resuscitation, sonographic evidence of impending tamponade should be considered. The most characteristic finding is right heart collapse (28). This has been described as a scalloping, or a child jumping on the trampoline of the right ventricle (Fig. 7.7; VIDEO 7 .6). Early sensitive find-ings include right atrial diastolic collapse, followed later by more specific findings such as right ventricular diastolic collapse (2). Additionally, downstream effects of tampon-ade lead to inadequate cardiac filling, which manifests so-nographically as a distended or plethoric IVC that does not collapse with inspiration (28).
Slowly accumulating pericardial effusions, typically caused by medical conditions, gradually distend the rela-tively noncompliant pericardial sac before finally reaching a
FIGURE 7.7. Scalloping of the Right Ventricle . Image obtained from the subxyphoid scanning position demonstrating a large pericardial effusion with collapse of the right ventricle in the patient with clinical evidence of cardiac tamponade .
FIGURE 7.8. Parasternal Short Axis View Demonstrates Paradoxical Septal Deviation from the Right Heart Creating a D-Ring Sign in a Patient with Acute Pulmonary Embolus.

Chapter 7 / A Problem-Based Approach to Resuscitation of Acute Illness or Injury 103
Although IVC size does not correlate perfectly with CVP monitor readings, a small and collapsed central vein pre-dicts the need for intravascular volume replacement (16). To keep it simple, remember that a normal IVC is 1.5 to 2.5 cm in diameter, nearly or briefly collapsing with res-piration or a quick “sniff” inspiration. Greater than 2.5 cm without collapse suggests an elevated CVP (14); smaller than 1.5 with complete collapse suggests a low CVP (Fig. 7.10;
VIDEO 7 .8) (15). With positive pressure ventilation, respi-ratory changes in IVC size are less pronounced and reversed.
If the IJ is used to estimate volume status, begin by exam-ining the long axis of the vein. At end expiration, identify the point on the neck at which the IJ can be seen to collapse, what some have called the sonographic meniscus or wine bottle sign. Estimate the vertical distance between this point and the Angle of Louis, then add 5 cm to obtain the CVP (33,34). Or simply recall that patients with a low CVP will have a nearly collapsed IJ even when entirely supine, and patients with a high CVP will have a distended IJ even when upright.
Brief serial examinations during fluid replacement help guide the need for additional fluid therapy. In trauma patients, a lack of change in IVC size despite a brief improve-ment in vital signs following IV fluids helps identify tran-sient responders, i.e., patients in whom clinical shock will likely recur (35). When the IVC returns to normal size and respiratory variation, the tank is full (36). However, when the IVC is large at the start of resuscitation with minimal respiratory variation, the tank is already full, or the pump is not functioning adequately. In the ED, distension of the IVC most commonly results from heart failure, but may also occur with other potentially life-threatening diagnoses such as PE, pericardial tamponade, and tension pneumothorax (3). These patients require optimization of pump function, care-ful titration of fluids, and immediate treatment of other life-threatening conditions.
The Thoracic Exam: Detecting PneumothoraxIn the critically ill patient with respiratory distress, the tho-racic scan is often utilized early in the ultrasound evaluation. With the appropriate clinical context, loss of lung sliding
with hypotension or shock) or sub-massive. Echocardiogra-phy has a pivotal role in cases of suspected PE; the absence of echocardiographic signs of right ventricular overload or dys-function practically excludes PE as a cause of hemodynamic compromise (30). Conversely, the presence of right ventricular dysfunction on echocardiography could be used to presume massive PE and justify aggressive reperfusion therapy (31).
Two important caveats should be noted. While right heart strain with the appropriate clinical presentation strongly supports the diagnosis of acute PE, patients may have pre- existing pulmonary hypertension and chronic right heart strain (from COPD, poorly controlled/chronic asthma, obesity hypoventilation syndrome, pulmonary fibrosis); a hypertrophic right ventricular wall thickness .5 mm sug-gests preexisting, chronic right heart strain (Fig. 7.9). Sec-ondly, echo is specific but not sensitive for PE (32). Small distal PE are unlikely to result in significant sonographic findings (or hypotension, for that matter). Thus, a negative scan for right ventricular distension does not necessarily rule out PE, although it argues that PE is an unlikely primary cause of clinical instability.
When PE is suspected, the sonographer may choose to deviate from the algorithm to scan the lower extremities in search of a likely DVT. Although not necessary, the detec-tion of a DVT in face of suspected PE may be useful to add certainty or reach a treatment endpoint.
Assessment of the Inferior Vena Cava: Estimation of Preload and Volume StatusOne of the most important determinations that must be made in the resuscitation of a patient with hypotension is whether or not the patient is likely to be fluid responsive. Should the patient receive fluids? Blood? How much? When should pressors be added? When should noninvasive ventilation be used? Should the patient be intubated? Can the patient toler-ate medications for sedation should invasive procedures be necessary? Ultrasound examination of the IVC provides a surrogate marker of central venous pressure (CVP) and pre-dicts fluid responsiveness. The combined results of the echo and IVC exams can help classify the type of shock and opti-mize targeted interventions.
+
1+
FIGURE 7.9. Subxyphoid View of Chronic Right Ventricular Hypertrophy . Still image obtained from subxyphoid view demonstrates a right ventricle free wall thickness at end diastole of .5 mm suggesting chronic right ventricular strain and hypertrophy in this patient with COPD .
FIGURE 7.10. Small IVC in Volume Depleted Patient . Still image obtained from a subxyphoid longitudinal position scanning into the abdomen just to the patient’s right . Small collapsed IVC noted in this septic shock patient .

104 SeCtion ii / Ultrasound in the Resuscitation of Acute Injury or Illness
radiography (19). When the results of the thoracic scan are coupled with bedside echocardiography evidence of poor left ventricular function and central venous distension, the presence of interstitial fluid supports a diagnosis of conges-tive heart failure and facilitates earlier diagnosis and appro-priate initial treatment.
The FAST Scan: Detecting Intra-Abdominal HemorrhageA FAST exam is performed to evaluate for the presence of free intra-abdominal fluid. In the critically ill trauma patient, free fluid is presumed to be blood until proven otherwise. Carefully inspect for anechoic areas of acute blood collec-tion as well as areas of mixed echogenicity from clotted blood. Depending on patient factors and physician experi-ence, approximately 500 mL of free fluid must be present in Morison’s pouch and 150 mL of free fluid in the pelvis for re-liable detection (37,38). A 1.1-cm stripe in Morison’s pouch corresponds to 1 L of free fluid (Fig. 7.12; VIDEO 7 .10). Persistently unstable patients with intra-abdominal bleeding require operative intervention. Traumatic hemothorax re-quires tube thoracostomy.
Likewise, in the medical patient with a known AAA, or a pregnant female with an empty uterus, significant free fluid is again presumed to be blood, requiring immediate operative intervention. Free fluid in Morison’s pouch in the pregnant patient has a 99.5% specificity for the diagnosis of ectopic pregnancy requiring operative intervention (39). Free fluid above the diaphragm may represent pleural effu-sions or empyema from heart failure or pneumonia. Intra- abdominal fluid may confirm the presence of ascites in obese patients. Ultrasound is very helpful in localizing the largest pocket of fluid and preventing complications during both thoracentesis and paracentesis. Furthermore, the rapid assessment of the abdomen may demonstrate other sources of sepsis such as acute cholecystitis, unilateral hydronephro-sis in the patient with pyelonephritis, appendicitis, diverticu-litis, or fluid collections from secondary abscesses. In the septic shock patient with an unknown source of infection, consideration of each of these conditions may facilitate life-saving drainage (40).
confirms the need for a tube thoracostomy. For example, demonstration of loss of normal lung sliding in an 18-year-old with a stab wound to the chest is sufficient confirmation to justify placement of a chest tube. The diagnosis of pneumo-thorax could be confirmed by the presence of a sonographic lung point (juxtaposition of inflated lung adjacent to pneu-mothorax); however, this finding typically takes longer to acquire, and may be absent altogether with complete collapse of the lung. Likewise, there is no reason to delay treatment for a chest radiograph; plain radiographs are less accurate than ultrasound in the detection of pneumothorax (25). Some clinical situations are not as straightforward. In patients with COPD and bullous disease, loss of lung sliding at one point should be confirmed by additional views inferiorly and lat-erally on the chest to avoid placing a chest tube for bullous disease. In an intubated patient, loss of lung sliding may in-dicate a mainstem intubation; adjustment of the endotracheal tube and suctioning should be attempted before assuming a pneumothorax.
The Thoracic Exam: Detecting Interstitial FluidThe thoracic scan should determine if there is an A-line pre-dominance (normal lung) or B-line predominance. B-line predominance indicates interstitial edema. A few scattered B-lines is a normal finding, particularly in the posterior lateral lung fields. However, with increasing intersti-tial fluid, an increased number of B-lines become visible throughout all lung fields. The presence of three or more B-lines in one intercostal space defines B-line predomi-nance (Fig. 7.11; VIDEO 7 .9). B-line predominance in two zones in each side of the chest indicates increased in-terstitial fluid (18). B-lines decrease in number as clinical improvement is seen in treatment of pulmonary edema, and can be used to monitor response to treatment.
The thoracic scan can be helpful when looking for evidence of heart failure, particularly when asthma or COPD coexist. Sonographic evidence of interstitial edema may be detectable before changes are detectable by
FIGURE 7.11. Multiple B-lines . Images obtained by scanning over the left superior chest in a patient with acute CHF . Numerous B-lines noted extending from the pleural line to the far field .
FIGURE 7.12. Positive Right Upper Quadrant of FAST View . Images obtained from the traditional right upper quadrant position in this blunt trauma patient .

Chapter 7 / A Problem-Based Approach to Resuscitation of Acute Illness or Injury 105
infection or trauma, longitudinal ultrasound examination of the proximal trachea identifies the cricothyroid membrane facilitating cricothyrotomy (47). After tube placement, ul-trasound has been reported to immediately detect esopha-geal intubation (48). By placing the probe transversely over the proximal neck just above the sternal notch, ultrasound accurately detects tracheal intubation in patients requiring emergent airway management (49). Additionally, lung slid-ing has been demonstrated to be accurate in both confirm-ing tracheal intubation and excluding a pneumothorax in the crashing patient immediately following intubation (25,50).
CLINICAL CASESCASE 1A 22-year-old female is brought in by ambulance after col-lapsing in the shower at 5 am. She is pale and lethargic. Vital signs are significant for a heart rate of 135 and a blood pres-sure of 70/palp. The physical exam is remarkable for pallor, poor inspiratory effort, and lower quadrant abdominal disten-sion. Paramedics state that she was discharged the afternoon prior from an outside hospital after a miscarriage.
As staff quickly draw blood and insert IV lines, a bedside ultrasound is performed. No pericardial effusion is visual-ized, right heart size is smaller than left, and the left ventricle is markedly hyperdynamic. The IVC is small and collaps-ing completely with respiration. The FAST scan reveals free fluid in Morison’s pouch and pelvis as well as a slightly en-larged yet empty uterus. The obstetrical (OB) service is im-mediately paged.
The patient is intubated with placement confirmed by ul-trasound visualization of the endotracheal tube in the trachea and confirmation of bilateral lung sliding and diaphragmatic motion. A cordis is placed in the patient’s right IJ under direct ultrasound visualization. Flush into the right heart is confirmed on subxyphoid view and rapid blood transfusion is begun.
The OB service requests transfer to a larger sister hos-pital. However, the OB attending agrees to see the patient immediately in the ED. Upon review and discussion of the sonographic findings at the bedside, the patient is taken im-mediately to the operating room. A right interstitial ectopic pregnancy is removed while 3 L of blood are suctioned from the abdomen. A partial hysterectomy is performed to pre-serve the patient’s fertility.
This case illustrates the ability of ultrasound to rapidly evaluate for a multiple life-threatening diagnosis, guide and confirm invasive procedures, and facilitate appropriate and timely management. The patient recovered well and was dis-charged 5 days after the surgery.
CASE 2A 35-year-old female with lupus and chronic renal failure presents to the hospital after missing hemodialysis for the past week. A potassium level of 6.4 with peaked T waves on the electrocardiogram was initially treated. The patient is noted to be hypotensive and tachycardic, but states she always has low blood pressure readings. Ten minutes after the calcium gluconate, her peaked T waves improve. While awaiting hemodialysis 30 minutes later, the patient suddenly becomes unresponsive with bradycardia on the monitor but no pulse.
Assessment of the Aorta: Detecting Abdominal Aortic Aneurysm, Aortic DissectionBedside ultrasound is very sensitive and specific in the de-tection of an AAA and shortens the time to operative inter-vention (41). With a critically ill hypotensive patient with an AAA on ultrasound, presume rupture until proven otherwise and obtain emergent surgical consultation. In more stable patients a computed tomography scan helps to detect the more common retroperitoneal rupture. Bedside ultrasound is less sensitive in excluding aortic dissection. However, since ultrasound is specific for aortic dissection when an undulat-ing flap is present, these findings again require emergent surgical consultation in the unstable patient (Fig. 7.13;
VIDEO 7 .11) (42,43).
Detecting Venous ThromboembolismThe presence of echogenic venous thrombus is diagnostic of DVT. However, since thrombus may be small and of variable echogenicity depending on age, compression is needed to re-liably exclude thrombus. Complete compression of the vein without significant deformation or spasm of the artery rules out DVT. With incomplete compression, comprehensive ra-diology studies are needed to definitively rule out DVT. The overall accuracy for emergency physician performed com-pression ultrasound has been found to be excellent among experts and in the novice sonographer after limited training (44,45).
RESUSCITATIVE ULTRASOUND IN AIRWAY MANAGEMENT AND THE CRASHING POSTINTUBATION PATIENTRecently, the concept of resuscitative ultrasound has been further expanded to include airway management, from ini-tial airway assessment, to confirmation, and finally detecting complications immediately post intubation. Resuscitative ul-trasound has been demonstrated to be more accurate than traditional clinical screening techniques in detecting the dif-ficult airway (46). In cases of significant airway edema from
FIGURE 7.13. Aortic Dissection . Images obtained from the midline lon-gitudinal view of the mid aorta demonstrating a flap undulating in the aortic lumen .

106 SeCtion ii / Ultrasound in the Resuscitation of Acute Injury or Illness
16. De Lorenzo RA, Morris MJ, Williams JB, et al. Does a simple bedside sonographic measurement of the inferior vena cava correlate to central venous pressure? J Emerg Med. 2012;42:429–436.
17. Fields JM, Lee PA, Jenq KY, et al. The interrater reliability of inferior vena cava ultrasound by bedside clinician sonographers in emergency department patients. Acad Emerg Med. 2011;18:98–101.
18. Volpicelli G, Mussa A, Garofalo G, et al. Bedside lung ultrasound in the assessment of alveolar-interstitial syndrome. Am J Emerg Med. 2006;24:689–696.
19. Volpicelli G, Elbarbary M, Blaivas M, et al. International evidence-based recommendations for point-of-care lung ultrasound. Intensive Care Med. 2012;38:577–591.
20. Cogo A, Lensing AW, Prandoni P, et al. Distribution of thrombosis in patients with symptomatic deep vein thrombosis. Implications for sim-plifying the diagnostic process with compression ultrasound. Arch Intern Med. 1993;153:2777–2780.
21. Neumar RW, Otto CW, Link MS, et al. Part 8: adult advanced cardio-vascular life support 2010 American Heart Association guidelines for cardiopulmonary resuscitation and emergency cardiovascular care. Circulation. 2010;122(18 suppl 3):S729–S767.
22. Blaivas M, Fox JC. Outcome in cardiac arrest patients found to have cardiac standstill on the bedside emergency department echocardiogram. Acad Emerg Med. 2001;8:616–621.
23. Salen P, Melniker L, Chooljian C, et al. Does the presence or absence of sonographically identified cardiac activity predict resuscitation outcomes of cardiac arrest patients? Am J Emerg Med. 2005;23:459–462.
24. Labovitz AJ, Noble VE, Bierig M, et al. Focused cardiac ultrasound in the emergent setting: a consensus statement of the American Society of Echocardiography and American College of Emergency Physicians. J Am Soc Echocardiogr. 2010;23:1225–1230.
25. Blaivas M, Lyon M, Duggal S. A prospective comparison of supine chest radiography and bedside ultrasound for the diagnosis of traumatic pneu-mothorax. Acad Emerg Med. 2005;12:844–849.
26. Dawson M, Mallin M. Ultrasound podcast: epsiode 25 E point sep-tal separation. Ultrasound Podcasts. 2012. Available at: http://www . ultrasoundpodcast.com/. Accessed August 24, 2012.
27. Silverstein JR, Laffely NH, Rifkin RD. Quantitative estimation of left ventricular ejection fraction from mitral valve E-point to septal sepa-ration and comparison to magnetic resonance imaging. Am J Cardiol. 2006;97:137–140.
28. Spodick DH. Acute cardiac tamponade. N Engl J Med. 2003;349: 684–690.
29. Lodato JA, Ward RP, Lang RM. Echocardiographic predictors of pul-monary embolism in patients referred for helical CT. Echocardiography. 2008;25:584–590.
30. Torbicki A, Perrier A, Konstantinides S, et al. Guidelines on the di-agnosis and management of acute pulmonary embolism: The Task Force for the Diagnosis and Management of Acute Pulmonary Em-bolism of the European Society of Cardiology (ESC). Eur Heart J. 2008;29:2276–2315.
31. Kucher N, Goldhaber SZ. Management of massive pulmonary embo-lism. Circulation. 2005;112:e28–e32.
32. Grifoni S, Olivotto I, Cecchini P, et al. Utility of an integrated clinical, echocardiographic, and venous ultrasonographic approach for triage of patients with suspected pulmonary embolism. Am J Cardiol. 1998; 82:1230–1235.
33. Lipton B. Estimation of central venous pressure by ultrasound of the internal jugular vein. Am J Emerg Med. 2000;18:432–434.
34. Jang T, Aubin C, Naunheim R, et al. Ultrasonography of the internal jugular vein in patients with dyspnea without jugular venous distention on physical examination. Ann Emerg Med. 2004;44:160–168.
35. Yanagawa Y, Sakamoto T, Okada Y. Hypovolemic shock evaluated by sonographic measurement of the inferior vena cava during resuscitation in trauma patients. J Trauma. 2007;63:1245–1248; discussion 1248.
36. Ferrada P, Anand RJ, Whelan J, et al. Qualitative assessment of the infe-rior vena cava: useful tool for the evaluation of fluid status in critically ill patients. Am Surg. 2012;78:468–470.
37. Branney SW, Wolfe RE, Moore EE, et al. Quantitative sensitivity of ultra-sound in detecting free intraperitoneal fluid. J Trauma. 1995;39:375–380.
38. Von Kuenssberg Jehle D, Stiller G, Wagner D. Sensitivity in detecting free intraperitoneal fluid with the pelvic views of the FAST exam. Am J Emerg Med. 2003;21:476–478.
Chest compressions are started immediately. In between pulse checks, a quick subxyphoid view is performed reveal-ing minimal cardiac activity secondary to a large circumfer-ential pericardial effusion. Chest compressions are continued for 2 minutes while preparations are made for emergent peri-cardiocentesis. The largest pocket of fluid is visualized just medial to the left midclavicular line in the fifth intercostal space. Under ultrasound guidance, a long angiocatheter is placed into the pericardial sac, and 200 mL of serous fluid are removed, after which return of spontaneous circulation occurs.
This case illustrates the utility of resuscitative ultrasound in the setting of asystolic cardiac arrest. Survival from PEA or asystolic arrest depends on the rapid identification and management of the classic H’s and T’s. Ultrasound readily detects hypovolemia, tension pneumothorax, evidence of pul-monary embolism, and tamponade. Life-saving procedures can be rapidly performed with greater physician confidence and improved patient safety. After initial stabilization, the patient was transferred to the operating room for a pericardial window and ultimately discharged home 10 days later.
REFERENCES 1. Bahner DP. Trinity: a hypotensive ultrasound protocol. J Diagn Med
Sonogr. 2002;18:193–198. 2. Weingart SD. The RUSH Exam—rapid ultrasound for shock and hy-
potension. EMCrit Blog. 2007. http://emcrit.org/rush-exam/. Accessed August 24, 2012.
3. Hernandez C, Shuler K, Hannan H, et al. C.A.U.S.E.: Cardiac arrest ultra-sound exam—a better approach to managing patients in primary non-arrhythmogenic cardiac arrest. Resuscitation. 2008;76:198–206.
4. Pershad J, Myers S, Plouman C, et al. Bedside limited echocardiography by the emergency physician is accurate during evaluation of the criti-cally ill patient. Pediatrics. 2004;114:e667–e671.
5. Lichtenstein DA, Mezière GA. Relevance of lung ultrasound in the diagnosis of acute respiratory failure: the BLUE protocol. Chest. 2008;134:117–125.
6. Plummer D, Heegaard W, Dries D, et al. Ultrasound in HEMS: its role in differentiating shock states. Air Med J. 2003;22:33–36.
7. Breitkreutz R, Walcher F, Seeger FH. Focused echocardiographic evalu-ation in resuscitation management: concept of an advanced life support-conformed algorithm. Crit Care Med. 2007;35(5 suppl):S150–S161.
8. Jones AE, Tayal VS, Sullivan DM, et al. Randomized, controlled trial of immediate versus delayed goal-directed ultrasound to identify the cause of nontraumatic hypotension in emergency department patients. Crit Care Med. 2004;32:1703–1708.
9. Perera P, Mailhot T, Riley D, et al. The RUSH exam: rapid ultrasound in shock in the evaluation of the critically ill. Emerg Med Clin North Am. 2010;28:29–56.
10. Breitkreutz R, Price S, Steiger HV, et al. Focused echocardiographic evaluation in life support and peri-resuscitation of emergency patients: a prospective trial. Resuscitation. 2010;81:1527–1533.
11. Levitov A, Mayo PH, Slonim AD. Critical Care Ultrasonography. New York, NY: McGraw Hill; 2009.
12. Moore CL, Rose GA, Tayal VS, et al. Determination of left ventricu-lar function by emergency physician echocardiography of hypotensive patients. Acad Emerg Med. 2002;9:186–193.
13. Secko MA, Lazar JM, Salciccioli LA, et al. Can junior emergency physicians use E-point septal separation to accurately estimate left ventricular function in acutely dyspneic patients? Acad Emerg Med. 2011;18:1223–1226.
14. Blehar DJ, Dickman E, Gaspari R. Identification of congestive heart failure via respiratory variation of inferior vena cava diameter. Am J Emerg Med. 2009;27:71–75.
15. Nagdev AD, Merchant RC, Tirado-Gonzalez A, et al. Emergency de-partment bedside ultrasonographic measurement of the caval index for noninvasive determination of low central venous pressure. Ann Emerg Med. 2010;55:290–295.

Chapter 7 / A Problem-Based Approach to Resuscitation of Acute Illness or Injury 107
45. Crisp JG, Lovato LM, Jang TB. Compression ultrasonography of the lower extremity with portable vascular ultrasonography can accurately detect deep venous thrombosis in the emergency department. Ann Emerg Med. 2010;56:601–610.
46. Adhikari S, Zeger W, Schmier C, et al. Pilot study to determine the utility of point-of-care ultrasound in the assessment of difficult laryn-goscopy. Acad Emerg Med. 2011;18:754–758.
47. Curtis K, Ahern M, Dawson M, et al. Ultrasound-guided, Bougie- assisted cricothyroidotomy: a description of a novel technique in cadaveric mod-els. Acad Emerg Med. 2012;19:876–879.
48. Hoffmann B, Gullett JP. Emergency ultrasound for the detection of esophageal intubation. Acad Emerg Med. 2010;17:464–465.
49. Chou HC, Tseng WP, Wang CH, et al. Tracheal rapid ultrasound exam (T.R.U.E.) for confirming endotracheal tube placement during emer-gency intubation. Resuscitation. 2011;82:1279–1284.
50. Weaver B, Lyon M, Blaivas M. Confirmation of endotracheal tube place-ment after intubation using the ultrasound sliding lung sign. Acad Emerg Med. 2006;13:239–244.
39. Moore C, Todd WM, O’Brien E, et al. Free fluid in Morison’s pouch on bedside ultrasound predicts need for operative intervention in suspected ectopic pregnancy. Acad Emerg Med. 2007;14:755–758.
40. Lichtenstein DA. Point-of-care ultrasound: infection control in the intensive care unit. Crit Care Med. 2007;35(5 suppl):S262–S267.
41. Tayal VS, Graf CD, Gibbs MA. Prospective study of accuracy and out-come of emergency ultrasound for abdominal aortic aneurysm over two years. Acad Emerg Med. 2003;10:867–871.
42. Taylor RA, Oliva I, Van Tonder R, et al. Point-of-care focused cardiac ultrasound for the assessment of thoracic aortic dimen-sions, dilation, and aneurysmal disease. Acad Emerg Med. 2012;19: 244–247.
43. Fojtik JP, Costantino TG, Dean AJ. The diagnosis of aortic dissec-tion by emergency medicine ultrasound. J Emerg Med. 2007;32: 191–196.
44. Burnside PR, Brown MD, Kline JA. Systematic review of emergency physician-performed ultrasonography for lower-extremity deep vein thrombosis. Acad Emerg Med. 2008;15:493–498.

108
ENDOTRACHEAL TUBE CONFIRMATION . . . . . . . . . . . . . . . 125Clinical Indications . . . . . . . . . . . . . . . . . . . . . . . . . . . 125Image Acquisition . . . . . . . . . . . . . . . . . . . . . . . . . . . . 125Anatomy and Landmarks . . . . . . . . . . . . . . . . . . . . . . 125Procedure . . . . . . . . . . . . . . . . . . . . . . . . . . . . . . . . . . 126Pitfalls and Complications . . . . . . . . . . . . . . . . . . . . . . 126Use in Decision Making . . . . . . . . . . . . . . . . . . . . . . . . 126
PERICARDIOCENTESIS . . . . . . . . . . . . . . . . . . . . . . . . . . . . 126Clinical Indications . . . . . . . . . . . . . . . . . . . . . . . . . . . 126Image Acquisition . . . . . . . . . . . . . . . . . . . . . . . . . . . . 126Anatomy and Landmarks . . . . . . . . . . . . . . . . . . . . . . 127Procedure . . . . . . . . . . . . . . . . . . . . . . . . . . . . . . . . . . 127Pitfalls and Complications . . . . . . . . . . . . . . . . . . . . . . 129Use in Decision Making . . . . . . . . . . . . . . . . . . . . . . . . 129
TRANSVENOUS PACEMAKER PLACEMENT AND CAPTURE . . . . . . . . . . . . . . . . . . . . . . . . . . . . . . . . 130Clinical Indications . . . . . . . . . . . . . . . . . . . . . . . . . . . 130Image Acquisition and Anatomy . . . . . . . . . . . . . . . . . 130Procedure . . . . . . . . . . . . . . . . . . . . . . . . . . . . . . . . . . 131Pitfalls and Complications . . . . . . . . . . . . . . . . . . . . . . 131Use in Decision Making . . . . . . . . . . . . . . . . . . . . . . . . 131
INTRODUCTION . . . . . . . . . . . . . . . . . . . . . . . . . . . . . . . . . . 108ADULT CENTRAL VENOUS ACCESS . . . . . . . . . . . . . . . . . . . 108
Clinical Indications . . . . . . . . . . . . . . . . . . . . . . . . . . . 108Image Acquisition . . . . . . . . . . . . . . . . . . . . . . . . . . . . 109Anatomy and Landmarks . . . . . . . . . . . . . . . . . . . . . . 112Procedure . . . . . . . . . . . . . . . . . . . . . . . . . . . . . . . . . . 117Pitfalls and Complications . . . . . . . . . . . . . . . . . . . . . . 118Use in Decision Making . . . . . . . . . . . . . . . . . . . . . . . . 119
PERIPHERAL VENOUS ACCESS . . . . . . . . . . . . . . . . . . . . . . 120Clinical Indications . . . . . . . . . . . . . . . . . . . . . . . . . . . 120Image Acquisition . . . . . . . . . . . . . . . . . . . . . . . . . . . . 120Anatomy and Landmarks . . . . . . . . . . . . . . . . . . . . . . 120Procedure . . . . . . . . . . . . . . . . . . . . . . . . . . . . . . . . . . 121Pitfalls and Complications . . . . . . . . . . . . . . . . . . . . . . 122Use in Decision Making . . . . . . . . . . . . . . . . . . . . . . . . 122
THORACENTESIS . . . . . . . . . . . . . . . . . . . . . . . . . . . . . . . . . 123Clinical Indications . . . . . . . . . . . . . . . . . . . . . . . . . . . 123Image Acquisition . . . . . . . . . . . . . . . . . . . . . . . . . . . . 123Anatomy and Landmarks . . . . . . . . . . . . . . . . . . . . . . 124Procedure . . . . . . . . . . . . . . . . . . . . . . . . . . . . . . . . . . 124Pitfalls and Complications . . . . . . . . . . . . . . . . . . . . . . 125Use in Decision Making . . . . . . . . . . . . . . . . . . . . . . . . 125
Michael Y. Woo and Ashraf Fayad
Critical Procedures for Acute Resuscitations
8
INTRODUCTIONThe resuscitation of acute illness often involves simultaneous diagnostic efforts (gathering data, forming hypotheses) and active interventions to treat the acutely ill patient. Most of the preceding chapters in this section devoted to acute injury and illness have focused on diagnosis. This chapter focuses on ultrasound assistance for emergent bedside procedures in the most critical moments of emergency medicine practice.
ADULT CENTRAL VENOUS ACCESSClinical IndicationsIn the Emergency Department (ED), central venous catheter (CVC) insertion is not uncommon and is often a lifesaving
procedure. Once established, CVCs can be used for fluid resuscitation, administration of medications, and monitor-ing of central venous pressures. Occasionally, the CVC can simply serve as an alternative venous access when peripheral venous access is limited, or can facilitate the placement of a transvenous pacemaker wire. Blind central venous punc-tures guided only by external landmarks are associated with significant morbidity and rarely mortality. Failure rates for placement of CVCs have been reported to be 10% to 19% (1,2). Mechanical complication rates are reported to occur in 5% to 19% of patients (1–5). These complications are depen-dent upon the site chosen for insertion, nature of underlying disease (emphysema, bleeding dyscrasia, mechanical ven-tilation), patient anatomy, prior CVC insertion, and physi-cian experience (1–3,6). The most common complications

Chapter 8 / Critical Procedures for Acute Resuscitations 109
include arterial puncture, hematoma, and pneumothorax (1). Other reported complications include catheter malposition, adjacent nerve injury, artery or vein wall laceration, cardiac arrhythmias, hemothorax, chylothorax, pericardial tampon-ade, hemomediastinum, pneumomediastinum, air embolism, guidewire embolism, and death (6–12).
Traditionally, CVCs have been inserted using “blind techniques” that rely on anatomical landmarks and their relationship to the underlying target vessel. Real-time two-dimensional ultrasound machines have been used to aid CVC insertion. Advantages of ultrasound include exact localization of the target vein, visualization of the rela-tionship of the target vein to the adjacent artery (13,14), detection of anatomic variations (15–17), avoidance of veins with preexisting thrombosis, and real-time guidance of the needle into the target vein. There have been numer-ous prospective, randomized, controlled trials revealing that real-time ultrasound guidance is superior to traditional landmark techniques (18–27). This literature has been critically evaluated with several meta-analyses (28–32). Real-time ultrasound guidance improves catheter inser-tion success rates, reduces the number of venipuncture attempts prior to successful placement, and reduces the number of complications associated with catheter inser-tion (30,31). The strength of evidence has prompted the Agency for Healthcare Research and Quality (AHRQ) to publish a report stating that ultrasound-guided insertion of CVCs is a top 10 patient safety practice to prevent hospital iatrogenesis and is specifically among the practices “. . . most highly rated in terms of strength of evidence support-ing more widespread implementation” (32). The National Institute of Clinical Excellence performed a technology appraisal for the United Kingdom’s National Health Ser-vice that stated, “. . .the use of 2-D imaging ultrasound guidance should be considered in most clinical circum-stances where CVC insertion is necessary either electively or in an emergency situation” (33).
Image AcquisitionA 7.5- to 10-MHz linear array transducer is typically used for real-time ultrasound-guided CVC insertion. Other nec-essary components include a sterile ultrasound transducer
sleeve, gel, and rubber bands (Fig. 8.1). Ultrasound images of central vessels may be obtained in short or long axis using either a static or a dynamic approach (Figs. 8.2–8.5). Ultrasound-guided needle insertion has been described using both approaches. In general, visualizing and subse-quently accessing the target vessel in short axis has been
FIGURE 8.1. Sterile Ultrasound Transducer Packet Includes a Nonlatex Sleeve, Rubber Bands, and Gel.
FIGURE 8.2. Photo of Transducer in Transverse Orientation for Imaging the Right Internal Jugular Vein.
FIGURE 8.3. Ultrasound of internal jugular vein noncompressed (A) and compressed (B) .
A
B

110 SeCtion ii / Ultrasound in the Resuscitation of Acute Injury or Illness
shown in one study to be easier to learn for novice users, but either approach may be employed, depending on the site of access and the experience of the person performing the procedure (34).
General principles: static ultrasound (landmarking)This technique involves ultrasound visualization of land-marks in relation to internal structures. The area of interest is first centered on the screen and anatomical structures are identified. Indelible ink is then used to mark the patient’s skin at either end of the transducer. The transducer is then turned 90 degrees while keeping the area of interest in the center of the screen. Indelible ink is again used to mark the skin at either end of the transducer. Lines are then drawn to connect the dots and the ‘X’ mark is used to identify needle entry points (Fig. 8.6). It is important to ensure that the transducer is placed perpendicular to the skin to mimic the direction and angle of the needle. This will give an accurate depiction of the depth of the target and therefore the distance for the needle advancement. This method is appropriate for larger targets and when the risk of needle injury to other structures is low. The static ultrasound technique is more efficient and safer when compared to the blind landmarking method (35).
Dynamic ultrasound (real-time)Dynamic ultrasound is the real-time visualization of the needle while hitting the target. This method can be more technically challenging, especially while maintaining con-tinuous needle visualization. However, it is the ideal method for accessing smaller targets and when there is risk of needle injury to the surrounding structures. Limitations of this tech-nique depend on the ability to correctly position the probe and visualize the needle in certain anatomic areas. Needle visualization can be facilitated through the in-plane (long-axis) or out-of-plane (short-axis) approach.
In-plane (long-axis) techniqueThe in-plane or long-axis technique involves inserting the needle off the end and along the long axis of the transducer (Fig. 8.7; VIDEO 8 .1). Both the target and the needle are visualized at the same time without having to move the trans-ducer during the procedure. This technique allows the opera-tor to visualize the needle from the skin to the target area of interest. Visualization of the vertical depth of the needle tip during insertion is optimal using this approach versus the out-of-plane or short-axis technique. Visualization of the needle is dependent on the angle of the needle relative to the skin. The shallower the angle, the easier it is to visualize the needle (Fig. 8.8). Many of the newer ultrasound machines have now incorporated needle visualization software and hardware to make visualization less dependent on the angle of the needle.
Needle insertion is usually at a more shallow angle (15 to 30 degrees) compared with the out-of-plane technique (45 to 60 degrees). As a result, the needle will need to travel further to reach the target. The operator should ensure that the needle is of sufficient length to reach the target prior to commencing the procedure.
Out-of-plane (short-axis) techniqueThe out-of-plane or short-axis technique involves inserting the needle at the middle of the transducer that is centered over the target. The needle is inserted at a steep angle of 45 to 60 degrees. The distance the needle must be inserted is a closer approximation to what is visualized on the screen as a result of the steeper angle of insertion (Fig. 8.9A). Care must be taken to first visualize the needle tip anterior to the target. The needle tip appears as an echogenic point (Fig. 8.9B). Once the tip is visualized, it is important to advance the nee-dle while moving the transducer distally in order to continu-ally visualize the needle tip. If the transducer is not moved to keep up with the needle tip, a ring-down artifact will often be visualized, but this corresponds to the needle shaft rather than the needle tip (Fig. 8.9C).
General approachOnce the approach is planned, position the patient in the usual fashion according to the desired anatomic approach. Position the ultrasound screen directly in front of the opera-tor while performing the procedure. The screen should be in the same line of sight as the direction that the needle is inserted. The transducer should be oriented correctly so that the screen side is the same as the operator side. For example, if the left side of the footprint of the transducer is depressed by a finger, this should correspond to the left side of the screen and therefore applied to the skin of the patient so that this is on the left side of the operator (Fig. 8.10).
FIGURE 8.4. Photo of Longitudinal Orientation of Transducer for Imaging Right Internal Jugular Vein.
FIGURE 8.5. Corresponding Ultrasound of the Long-Axis View of the Internal Jugular Vein.

FIGURE 8.6. Landmarking . The transducer is placed perpendicular to the skin with the area of interest centered on the screen, and the skin is marked on either side of the transducer with indelible ink (A) . The transducer is rotated 90 degrees and the skin marking is repeated (B, C) . The marks on the skin are then connected . The center of the “X” indicates the point of insertion (D) .
A
C
B
D
FIGURE 8.7. Model Demonstrates an In-Plane (Long-Axis) Technique . The needle is inserted at the end of the transducer and advanced by maintaining its position directly under the transducer (A) . The needle shaft and tip appear on the screen (B) .
A B
111

112 SeCtion ii / Ultrasound in the Resuscitation of Acute Injury or Illness
rounder, smaller in diameter, and more prominently pulsa-tile. The central vein is larger, more irregular in shape, and has a subtle undulating pulsatile quality. Localize the vein definitively by applying gentle pressure with the ultrasound transducer. The vein should compress easily and completely, while the artery will stay patent (Fig. 8.3B).
Prepare the ultrasound transducer for sterile use as shown in Figures 8.11–8.13. Apply a copious amount of ultrasound gel (sterile or nonsterile) directly to the transducer footprint. Slip the sterile sleeve over the transducer. Smooth all air bubbles away from the scanning surface to prevent imaging artifact. Secure the sleeve with rubber bands. Sterile gel on the skin will then be required to image the vessels. Although some physicians have advocated for using a sterile glove to insert central lines, it is important to note that this method of making the probe sterile does not meet recommended maximum sterile barrier precautions for the prevention of catheter-related blood stream infections (36).
Anatomy and LandmarksInternal jugular vein approachPlace the patient in the Trendelenburg position with head turned contralaterally 30 degrees. Place the ultrasound transducer just superior to the clavicle between the two heads of the sterno-cleidomastoid muscle (Fig. 8.14). The right internal jugular vein anatomy and corresponding normal ultrasound findings are shown in Figures 8.15 and 8.16. For typical anatomy, the internal jugular vein is anterior and lateral to the carotid artery with the widest diameter just superior to the clavicle. Scan the length of the vein from the clavicle to the thyroid cartilage, tak-ing into account the widest diameter, relationship to the carotid artery, and any variations of normal anatomy. Although the in-plane technique is the preferred dynamic method due to its superior visualization of the needle throughout the procedure, the out-of-plane technique is often used in this area due to the limited space and large footprint of the transducer.
Subclavian vein approachThe subclavian vein is more difficult to visualize due to the presence of the clavicle. The clavicle creates shadow-ing posteriorly and partially obscures the vessels and pleura. The subclavian vein, however, has the lowest incidence of
FIGURE 8.8. Ultrasound Showing Advancement of a Needle at a Shallow Angle . The shaft and needle tip are highly echogenic when the angle of the needle to the skin is shallow .
Perform a brief nonsterile ultrasound scan of the CVC insertion site. Regardless of anatomic approach, there is typi-cally a pair of nonechogenic blood vessels running side by side (Fig. 8.3A). Adjust the gain and the depth so that the vessels are in the center of the screen. The artery is usually
FIGURE 8.9. Model Demonstrates the Orientation of an Out-of-Plane (Short-Axis) Technique . The needle is inserted at the middle of the transducer that overlies the target (A) . The needle tip appears as an echogenic dot using this approach (B) .
A
B
FIGURE 8.9. (Continued ) Ring-down artifact indicates the needle shaft (C) .
C
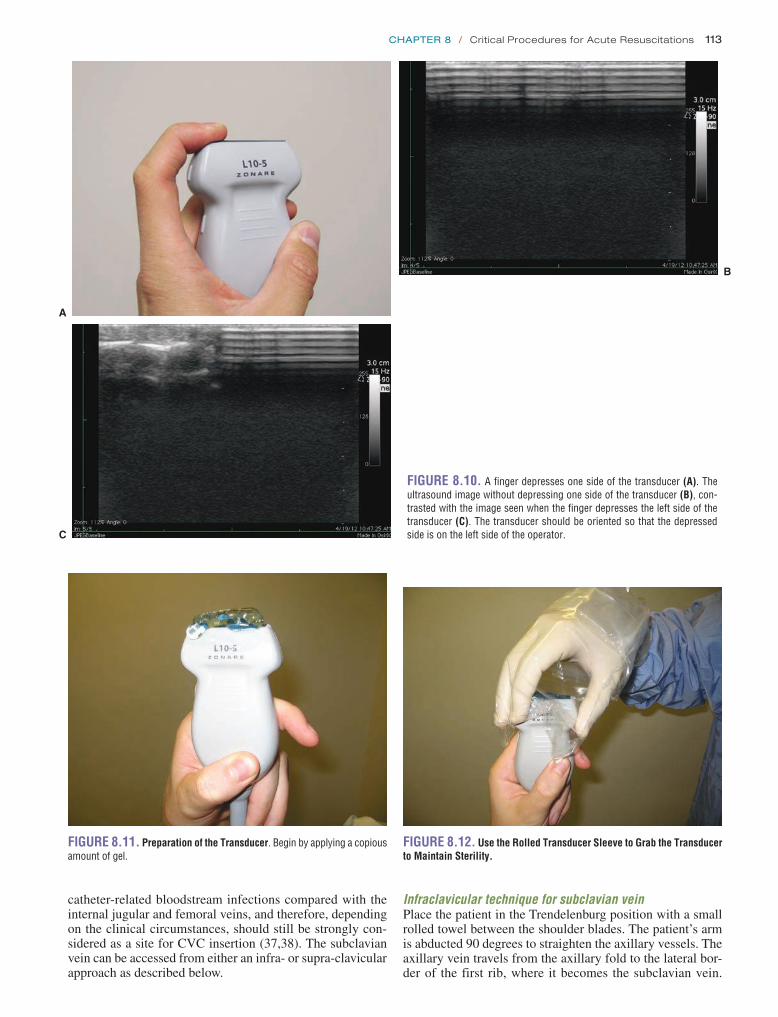
Chapter 8 / Critical Procedures for Acute Resuscitations 113
FIGURE 8.10. A finger depresses one side of the transducer (A) . The ultrasound image without depressing one side of the transducer (B), con-trasted with the image seen when the finger depresses the left side of the transducer (C) . The transducer should be oriented so that the depressed side is on the left side of the operator .C
A
B
FIGURE 8.11. Preparation of the Transducer . Begin by applying a copious amount of gel .
FIGURE 8.12. Use the Rolled Transducer Sleeve to Grab the Transducer to Maintain Sterility.
catheter-related bloodstream infections compared with the internal jugular and femoral veins, and therefore, depending on the clinical circumstances, should still be strongly con-sidered as a site for CVC insertion (37,38). The subclavian vein can be accessed from either an infra- or supra-clavicular approach as described below.
Infraclavicular technique for subclavian veinPlace the patient in the Trendelenburg position with a small rolled towel between the shoulder blades. The patient’s arm is abducted 90 degrees to straighten the axillary vessels. The axillary vein travels from the axillary fold to the lateral bor-der of the first rib, where it becomes the subclavian vein.

114 SeCtion ii / Ultrasound in the Resuscitation of Acute Injury or Illness
FIGURE 8.14. Transducer Orientation for the Transverse (Short-Axis) Approach to the Right Internal Jugular Vein . The transducer is placed just above the clavicle in between the two heads of the sternocleidomastoid .
FIGURE 8.15. Corresponding Ultrasound Short-Axis View of the Right Internal Jugular Vein and Carotid Artery.
Subclavian vein
Clavicle
Carotid artery
Internal jugular vein
FIGURE 8.16. Anatomy of the Right Internal Jugular Vein and Carotid Artery.
FIGURE 8.13. A: Smooth away any air bubbles that are seen in the gel . B: Secure the sleeve with rubber bands .
A B

Chapter 8 / Critical Procedures for Acute Resuscitations 115
The subclavian vein runs obliquely and posterior to the clavicle, making ultrasound imaging of this vessel nearly impossible. The more distal axillary vein, on the other hand, is exposed for ultrasound examination. Place the ultrasound transducer just inferior to the most lateral aspect of the clavi-cle as in Figure 8.17. Right axillary vessel anatomy and cor-responding ultrasound findings are depicted in Figures 8.18 and 8.19. With the transducer indicator directed toward the patient’s head, the axillary vein is typically anterior and infe-rior to the axillary artery. Note that transducer pressure may not collapse the vein completely due to its slightly deeper location beneath the skin. The axillary vein will completely collapse when the patient inhales against a closed glottis; this technique should be used to identify the vein and ensure absence of thrombus (Fig. 8.20; VIDEO 8 .2). The vein and artery can also be distinguished from each other using color Doppler (Fig. 8.21; VIDEO 8 .3). As the axillary vein travels medially, it runs adjacent to the pleura of the lung (Fig. 8.22). To avoid pneumothorax, care must be taken to place the transducer several centimeters lateral to the tho-racic cage. Alternatively, approaching the cannulation of the axillary vein in-plane will allow for the tip of the needle to be identified through the entirety of its course, thereby avoiding puncturing the posterior vessel wall and entering the pleural space (39).
Supraclavicular technique for subclavian veinThe landmark technique was first described by Yoffa in 1965 using the insertion landmark of the sternocleidomastoid angle (40). The right side is usually chosen due to the lower pleu-ral dome and absence of the thoracic duct. The linear array transducer is placed just superior and along the medial border of the clavicle (Fig. 8.23). In some circumstances, the supra-clavicular area is challenging when using larger footprint lin-ear array transducers given anatomical space limitations. An endocavitary transducer may be used instead with its much smaller footprint (Fig. 8.24). The transducer is first applied to the neck in a nonsterile fashion to visualize the internal jugular vein and the carotid artery. The transducer is then slid distally until the confluence of the internal jugular and
FIGURE 8.17. Transducer Placement for an Infraclavicular Approach to the Subclavian Vein . The transducer is placed inferior to the most lateral aspect of the clavicle .
FIGURE 8.18. Corresponding Short-Axis View of the Axillary Vein and Artery . Note the shadow generated by the clavicle as well as the increased depth of the vein and artery .
Internal jugular veinClavicle
Subclavian vein
Axillary vein
Carotid artery
Sternum
FIGURE 8.19. Corresponding Anatomy of the Axillary and Subclavian Vessels.

116 SeCtion ii / Ultrasound in the Resuscitation of Acute Injury or Illness
subclavian veins is encountered (Fig. 8.25; VIDEO 8 .4). This area is further scanned to identify the subclavian artery and the pleura. The transducer can then be rotated to obtain a longitudinal view of the subclavian vein. Although tech-nically more challenging, dynamic guidance using the in-plane technique should be used. If necessary, static guidance using ultrasound land-marking for the depth and angle in which the cannulating needle needs to be advanced can be performed (41).
Femoral vein approachThe patient should be in the supine position. Place the ultra-sound transducer transversely just inferior to the inguinal ligament. The anatomy of the right femoral vessels and cor-responding ultrasound images are shown in Figures 8.26 and 8.27. The femoral vein is just medial to the femoral artery at this level. As the femoral vessels course more distally in the leg, they migrate toward each other with the femoral artery
FIGURE 8.21. With the Addition of Color Doppler, the Axillary Artery (red) and Vein (blue) can be Further Distinguished from Each Other . The lower flow of the vein is identified and flowing in the opposite direction of the artery .
FIGURE 8.22. Short-Axis View of the Right Axillary Artery, Vein and Lung . This is seen when the transducer is placed several centimeters medial to the proper position . Note that the axillary vein is adjacent to the lung and CVC insertion at this site is at risk for pneumothorax .
FIGURE 8.20. Complete Collapse of the Axillary Vein . This is achieved by asking the patient to place a thumb in his/her mouth . Request the patient to breathe in through the imaginary straw . The negative inspiratory force achieved by inhaling against a closed glottis collapses the axillary vein .
FIGURE 8.23. Transducer Positioning for a Supraclavicular Approach to the Subclavian Vein . The transducer is placed just superior and along the medial border of the clavicle .
FIGURE 8.24. An Endocavitary Transducer may be Used in the Supra-clavicular Approach Since it has a Smaller Footprint.
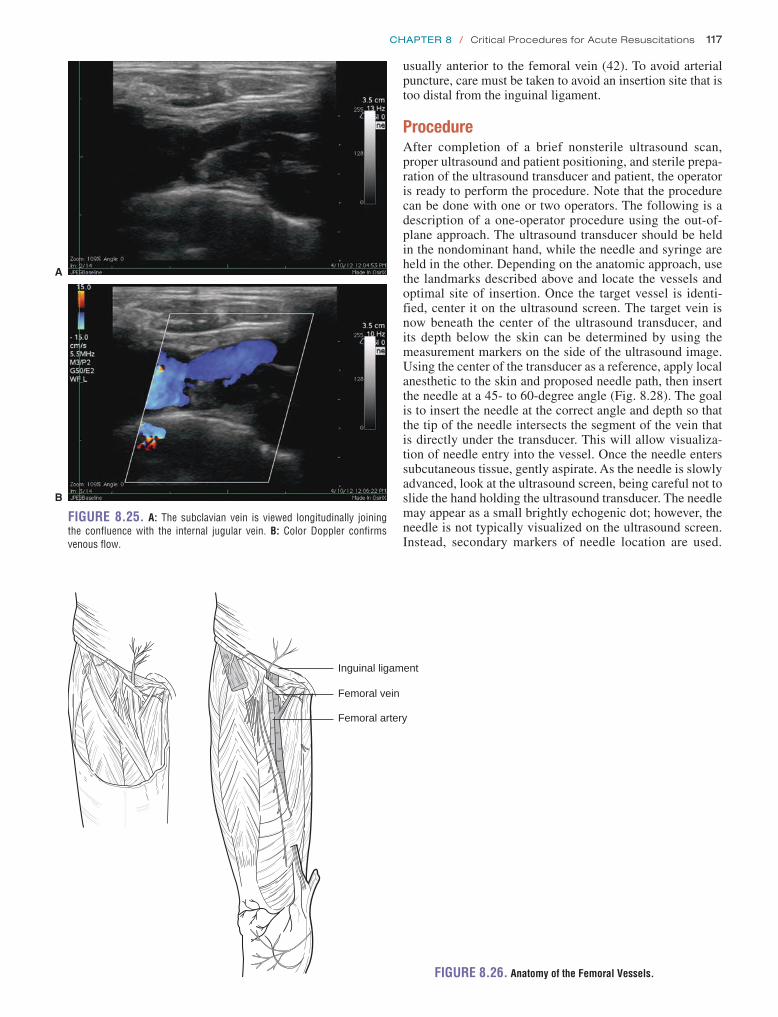
Chapter 8 / Critical Procedures for Acute Resuscitations 117
usually anterior to the femoral vein (42). To avoid arterial puncture, care must be taken to avoid an insertion site that is too distal from the inguinal ligament.
ProcedureAfter completion of a brief nonsterile ultrasound scan, proper ultrasound and patient positioning, and sterile prepa-ration of the ultrasound transducer and patient, the operator is ready to perform the procedure. Note that the procedure can be done with one or two operators. The following is a description of a one-operator procedure using the out-of-plane approach. The ultrasound transducer should be held in the nondominant hand, while the needle and syringe are held in the other. Depending on the anatomic approach, use the landmarks described above and locate the vessels and optimal site of insertion. Once the target vessel is identi-fied, center it on the ultrasound screen. The target vein is now beneath the center of the ultrasound transducer, and its depth below the skin can be determined by using the measurement markers on the side of the ultrasound image. Using the center of the transducer as a reference, apply local anesthetic to the skin and proposed needle path, then insert the needle at a 45- to 60-degree angle (Fig. 8.28). The goal is to insert the needle at the correct angle and depth so that the tip of the needle intersects the segment of the vein that is directly under the transducer. This will allow visualiza-tion of needle entry into the vessel. Once the needle enters subcutaneous tissue, gently aspirate. As the needle is slowly advanced, look at the ultrasound screen, being careful not to slide the hand holding the ultrasound transducer. The needle may appear as a small brightly echogenic dot; however, the needle is not typically visualized on the ultrasound screen. Instead, secondary markers of needle location are used.
FIGURE 8.26. Anatomy of the Femoral Vessels.
Inguinal ligament
Femoral vein
Femoral artery
FIGURE 8.25. A: The subclavian vein is viewed longitudinally joining the confluence with the internal jugular vein . B: Color Doppler confirms venous flow .
B
A

118 SeCtion ii / Ultrasound in the Resuscitation of Acute Injury or Illness
These include ring down artifact, acoustic shadowing, and buckling of the vein contour correlating with the needle entering the vessel (Figs. 8.29–8.31). If the acous-tic shadow or ring down artifact is off-center of the vessel, slowly withdraw the needle and redirect appropriately. Free return of venous blood confirms vessel entry. Frequently, the needle tip will traverse both the anterior and posterior
FIGURE 8.28. An Out of Plane Short-Axis Approach to Venipuncture.
walls of the vessel as the needle hits and buckles the vein. When this happens, little or no flash of blood will occur. Using continued gentle aspiration, slowly withdraw the needle until the tip is pulled back into the lumen of the ves-sel, resulting in venous blood return. With free return of blood, the ultrasound transducer can be placed aside onto the sterile drape. Continue central line placement with the usual standard Seldinger technique.
Pitfalls and ComplicationsFor the internal jugular vein approach, the transducer is located just a few centimeters away from the lung. Typi-cally the widest diameter of the internal jugular vein is just superior to the clavicle. This location of needle insertion is much closer to the lung than the traditional landmark “cen-tral approach,” which inserts the needle at the apex of the triangle formed by the joining of the two heads of the sterno-cleidomastoid muscle. Hence, at the skin surface, the needle must be inserted steeply at a 45- to 60-degree angle in order to safely avoid the lung and improve visualization of the needle tip using the out of plane technique. It is important to note that the ring-down artifact may not correspond to the needle tip, but the needle shaft. As a result, the needle shaft may appear directly above the target vessel, but the needle tip may be lateral to the actual target vessel. By landmark-ing with ultrasound the longitudinal path of the vein prior
FIGURE 8.27. Approach to the Femoral Vein. The trans-ducer is placed just below the inguinal ligament (A) . Ultrasound of the femoral artery and vein (B), noncompressed (left) and compressed (right) .
Femoralartery
Femoralvein
B
A

Chapter 8 / Critical Procedures for Acute Resuscitations 119
presence of the clavicle. Once the transducer is placed sev-eral centimeters lateral to the thoracic cage, introduction of the needle should be 45 to 60 degrees to avoid pneumothorax using the out of plane technique. A more shallow approach of about 15 to 30 degrees may be used for an in plane technique.
A steady ultrasound transducer position is necessary throughout the entire procedure. Slippery ultrasound gel causes subtle drifts in transducer position that are detrimen-tal to proper needle insertion. Rest both the hand and the transducer onto the patient’s body so that there is no drift of the transducer during the procedure; however, be careful not to place undue pressure that will collapse the target vessel during the procedure (Fig. 8.32).
Use in Decision MakingPerforming a brief ultrasound scan of the proposed CVC insertion site before preparing a sterile field is extremely useful. This allows the operator to affirm normal anatomic relationships, ensure absence of thrombosis, and determine the optimal segment of the target vein for catheterization. This optimal segment, regardless of anatomic approach, is one where the vein has the largest diameter, least overlap of the adjacent artery, and no evidence of thrombosis. Any abnormality will often preclude insertion at the initial site, and an alternate location should be chosen.
FIGURE 8.29. Ring-Down Artifact . This artifact is cre-ated by the needle and can be used as a marker for where the needle is located relative to the target vessel . Here the artifact is directly centered over the internal jugular vein .
Carotidartery
Internaljugularvein
Ringdownartifact
FIGURE 8.30. Acoustic Shadow . This arti-fact is created by the needle and can be used as a marker for where the needle is located relative to the target vessel . Here the artifact is directly centered over the internal jugular vein .
Carotidartery
Internaljugularvein
Acousticshadowof needle
FIGURE 8.31. Buckling of the Vein Contour . This is created when the needle tip is entering the vessel . To actually visualize this, the needle tip has to enter the segment of bleed vessel directly underneath the ultrasound trans-ducer . Otherwise, the needle tip will enter a portion of the vein not “visualized” by the ultrasound .
to insertion, missing the target is less likely to occur. Simi-larly, the infraclavicular axillary vein approach requires a lateral transducer placement to avoid puncture of the lung and allow adequate visualization of the vessels due to the

120 SeCtion ii / Ultrasound in the Resuscitation of Acute Injury or Illness
PERIPHERAL VENOUS ACCESSClinical IndicationsIn the ED, establishing peripheral intravenous access can be challenging. Patients with peripheral edema, obesity, trauma, severe dehydration, blood loss, intravenous drug abuse, and nonvisible, nonpalpable veins are all predis-posed for this difficulty. Ultrasound guidance can be used to obtain peripheral venous catheter (PVC) insertion. This has best been shown in adult and pediatric studies describ-ing ultrasound-guided placement of peripherally inserted central venous catheters (PICCs) in the vessels of the upper extremity (43–46). Ultrasound-guided PICCs are success-fully placed by both physicians and nurses (47–50). PICCs are long small-caliber catheters inserted through a periph-eral extremity vein and then positioned in the central circu-lation for long-term therapy with antibiotics, chemotherapy, or total parenteral nutrition. These same vessels of the upper extremity can be used for short-term vascular access in the ED with smaller catheters. One study using ultrasound guidance to cannulate the deep brachial or basilic veins showed a 91% success rate with 73% of these achieved on the first attempt. Complications included brachial artery puncture (2%), brachial nerve irritation (1%), and catheter dislodgement or intravenous fluid infiltration (8%) (51).
This ultrasound-guided technique is a safe, rapid, and suc-cessful method of gaining peripheral intravenous access when traditional methods fail (52).
Image AcquisitionA 7.5- to 10-MHz linear array transducer is used to per-form the procedure. Because this is peripheral intravenous access, full barrier precautions as per CVC insertion are not required. Standard sterile technique for PVC should be used. Ultrasound images of the vessels may be obtained in either short or long axis, depending on the orientation of the ultra-sound transducer. Position the ultrasound screen directly in front of the operator while performing the procedure. This allows smooth transitions between viewing the PVC inser-tion site and the ultrasound screen.
Anatomy and LandmarksThe patient is placed supine with the upper extremity abducted exposing the anteromedial aspect of the upper arm. Place a tourniquet on the upper extremity as close to the axilla as possible. The ultrasound transducer is placed transversely, and the vessels from the antecubital fossa to the proximal humerus are scanned.
A reliable image pattern seen at the mid humerus is depicted in Figure 8.33. The hyperechoic cortical rim of the
FIGURE 8.32. Proper Technique to Brace the Ultrasound Transducer During CVC Insertion . By bracing the hand as well as probe onto the patient’s skin, subtle transducer drift is prevented (A) . Contrast with improper technique that will allow transducer movement (B) .
BA
FIGURE 8.33. Ultrasound Image of the Short-Axis Views of the Two Brachial Veins, Brachial Artery, and Basilic Vein . Note that the basilic vein is typically larger in diameter, closer to the skin, and has no corresponding artery (A) . Ultrasound image demonstrating the relationship of the humerus to the upper arm vessels (B) .
Bicepsmuscle
Basilicvein
Brachialvein
Brachialartery
Brachialvein
Cortical rimof humerus
A

Chapter 8 / Critical Procedures for Acute Resuscitations 121
FIGURE 8.34. Corresponding Anatomy of the Vessels Located in the Midhumerus . (Redrawn from Netter, FH . Atlas of Human Anatomy . 2nd ed . East Hanover, NJ: Novartis Medial Education; 1997, plate 410 .)
Brachial artery and veins
Basilic vein
Brachial artery and veins
Basilic vein
Biceps brachii muscle
Brachial artery and veins
Basilic vein
humerus is seen in the far field. Several round anechoic ves-sels are seen in short axis cross section just anterior to the humerus. These are the deep brachial veins (on either side of the brachial artery) and the more superficial basilic vein. The corresponding anatomy is depicted in Figure 8.34. Veins can be identified by applying gentle pressure on the transducer, which causes complete collapse of these vessels, compared to the noncollapsible artery (Fig. 8.35; VIDEO 8 .5). By scanning the entire length of the upper arm, one can find the ideal insertion site. This is the segment of vein that has the largest diameter (ideally .0.4 cm) and is away from an adjacent artery. Veins that are closer to the skin surface
(,1.5 cm) and travel in a straight course will have improved success rates (53–55). Sometimes the cephalic vein, located anterolaterally, is also a suitable option. Like the basilic, the cephalic vein has no adjacent nerve or artery (56).
ProcedureIt is important to note that regular PVCs are too short for this ultrasound-guided technique. At least a 2.5-inch angio-cath, shown in Figure 8.36, is required due to the increased depth of the vein. Shorter catheters used for most peripheral lines are unable to reach or stay within the lumen of the vein.
FIGURE 8.33. (Continued )
Bicepsmuscle
Brachialartery
Cortical rimof humerus
B

122 SeCtion ii / Ultrasound in the Resuscitation of Acute Injury or Illness
This procedure can be done with one or two operators. The following is a description of a one-operator procedure using the short-axis approach. Once the target vein and ideal inser-tion site have been identified, the operator holds the ultra-sound transducer in the nondominant hand and the needle in the other. Center the vessel on the ultrasound screen.
The target vein is now beneath the center of the ultrasound transducer, and its depth below the skin can be determined by using the measurement markers on the side of the ultrasound image. Veins .1.5 cm depth should be approached with cau-tion. Local anesthetic can be applied to the skin and proposed needle path using the center of the transducer as a reference. Again using the center of the ultrasound transducer as a refer-ence, insert the needle at a 30- to 45-degree angle (Fig. 8.37). The goal is to insert the needle at the correct angle and depth so that the tip of the needle intersects the segment of the vein that is directly under the transducer. This will allow visual-ization of needle entry into the vessel. As the needle is slowly advanced, look at the ultrasound screen, being careful not to slide the hand holding the ultrasound transducer. The needle
may appear as a small brightly echogenic dot (Fig. 8.38); however, the needle is not typically visualized on the ultra-sound screen. Instead, secondary markers of needle location are used. These include ring down artifact, acoustic shadow-ing, and buckling of the vein contour correlating with needle entering the vessel (Fig. 8.39). If the acoustic shadow or ring down artifact is off-center of the vessel, slowly withdraw the needle and redirect appropriately. When free returning blood flash confirms vessel entry, the ultrasound transducer can be placed to the side. The angle of the needle to skin may need to be decreased before sliding the plastic angiocath-eter sheath over the needle. After withdrawal of the needle, ensure proper catheter placement with obvious free flow of blood and infusion of saline without infiltration.
Pitfalls and ComplicationsSometimes as the angiocatheter hits and buckles the vein, the needle tip will traverse both the anterior and posterior walls of the vessel. When this happens, blood flash might occur but, after advancing the plastic sheath, there will be no free return of blood because the catheter is not in the lumen. In this case leave the indwelling catheter in place, and attach it to a saline-filled syringe. Apply continuous gentle aspiration, and slowly withdraw the catheter until the tip is pulled back into the lumen of the vessel. Once blood return is observed, the catheter is then advanced in the lumen and secured in place.
A second pitfall involves intravenous line infiltration. Make sure to take down the tourniquet prior to flushing the peripheral line. This simple mistake will frequently result in a ruptured vessel and a nonworking line. Alternatively, this approach can be attempted without using a tourniquet, but the veins are likely to collapse with either transducer pres-sure or catheter advancement.
Use in Decision MakingAll physicians and nurses in the ED have encountered patients who have difficult peripheral intravenous access. Often, these patients are not critically ill and simply need intravenous fluid, medication, or possibly an imaging study that requires intravenous contrast. Each of these situations
FIGURE 8.37. Technique for One-Operator Technique for Ultrasound-Guided Peripheral Venous Catheter Insertion in the Short-Axis (Out-of-Plane) Technique . The arm is supinated to provide access to the medial aspect of the arm .
FIGURE 8.36. Longer Angiocatheter Used for Brachial or Basilic Vein Cannulation Adjacent to a Usual Peripheral IV Angiocatheter.
FIGURE 8.35. Image Showing Complete Collapse of the Two Brachial Veins and Basilic Vein . Only the brachial artery remains patent when gentle transducer pressure is used to compress the vessels . Note the hyperechoic cortical rim of the humerus in the far field . This is a useful reference to find the blood vessels that typically course several centimeters superficial to it .

Chapter 8 / Critical Procedures for Acute Resuscitations 123
FIGURE 8.38. Ultrasound of Basilic Vein in Short-Axis View . Note the echogenic dot of the needle with acoustic shadow cast down the center of the vein .
Echogenicneedle
Basilicvein
Acoustic shadowcast by needle
FIGURE 8.39. Ultrasound of Basilic Vein Contour Buckling . This corresponds to the needle tip entering the vein .
Biceps
Basilic veincontourindentation
requires venous access. When venous access represents a challenge, clinicians may use CVCs or venous cutdowns. Both procedures are relatively invasive and could be associ-ated with complications. Ultrasound-guided PVC insertion is an extremely useful safe alternative technique that, in many instances, obviates the need for more invasive procedures and their associated risks.
THORACENTESISClinical IndicationsThe presence of fluid in the pleural space is a common clinical entity. Ultrasound is an ideal diagnostic tool to identify pleural effusions and facilitate fluid removal. Thoracentesis performed under ultrasound guidance has a lower complication rate than thoracentesis performed blindly. The incidence of pneumo-thorax using the ultrasound-guided thoracentesis technique is significantly reduced (1.3% to 2.5%) (57,58) compared to 4% to 30% in the blind traditional thoracentesis (59–62). Chest ultrasound not only aids in the diagnosis of pleural effu-sions, but assists in the identification of important structures such as solid organs, diaphragm, and lung to aid in aspiration.
Image AcquisitionPleural effusions are frequently detected on images obtained during abdominal scanning using a 3.5-MHz transducer. The fluid appears as an echo-free space cepha-lad to the hyperechoic line of the diaphragm when scanning from the mid- or posterior axillary line in the right and left upper quadrants. In this position, the liver and spleen act as excellent acoustic windows, so the fluid can usually be seen easily. Interestingly, it is also possible for ultrasound to detect subpulmonic effusions that may not be detected on plain chest radiographs (63). Occasionally the ultra-sound appearance of the fluid may provide further infor-mation of the etiology. For instance, internal echoes may be present in the effusion. This echogenicity may be homoge-neous, which occurs with proteinaceous or highly cellular effusions, while a heterogeneous appearance may indicate septated effusions or pleural metastases. When looking for pleural fluid, it is important to appreciate dynamic changes associated with the patient’s respiratory cycle. These may include alterations in the shape of the echo-free fluid, lung compression, and swirling of fluid with the patient breathing.

124 SeCtion ii / Ultrasound in the Resuscitation of Acute Injury or Illness
Anatomy and LandmarksIt is important to identify the diaphragm sonographically to confirm that the fluid is in the thorax and not the peritoneum and to aid in landmarking appropriately. The diaphragm is a hyperechoic curved line that moves dynamically with res-pirations. The pleural effusion will appear as a dependent hypoechoic fluid collection above the diaphragm (Fig. 8.40). Scan the relevant hemithorax from the paravertebral region to the anterior axillary line, observing the fluid collection during normal breathing, and note how high the diaphragm rises with expiration ( VIDEO 8 .6).
ProcedureTechnique with patient sitting uprightThe patient should be directed to sit upright facing away from the physician performing the procedure. Place a 3.5-MHz transducer on the patient’s posterior hemithorax in the transverse orientation in between the ribs (Fig. 8.41). Once the largest area of fluid collection is identified, the chest will be marked using the landmarking technique described previously (Fig. 8.6). The depth of the needle insertion can be estimated by measuring the distance from the skin to the
fluid on the ultrasound screen. This spot is typically located along the midscapular line. Once the area has been identified, the patient is prepared using the standard aseptic technique for thoracentesis.
Technique with patient in lateral decubitus positionThe patient is positioned in lateral decubitus with the pleural effusion side directed down. Facing away from the physi-cian performing the procedure, the hemithorax is scanned with ultrasound in a horizontal plane parallel to the bed (Fig. 8.42). The hemithorax is scanned from the midscapular line to the edge of the bed to assess the size of the effusion. Once the largest fluid collection is identified and well delin-eated, the area on the chest wall is marked for the needle insertion. This should generally be done no lower than the level of the eighth rib interspace. Remember to use caution to avoid the diaphragm as well as the intercostal vessels when aspirating fluid.
Technique with patient in a supine positionHave the patient lie flat on the back in a semi-recumbent position with the affected hemithorax facing the physi-cian performing the procedure and close to the edge of the bed. The ipsilateral arm should be abducted and flexed at the elbow and positioned either over or under the patient’s head (Fig. 8.43). The patient’s anterior and lateral chest is scanned from the mid-clavicular line to the posterior axillary line looking for hypoechoic/anechoic fluid (Fig. 8.44). Once the largest fluid collection is identified and well delineated, the area on the chest wall is marked for needle insertion. In this position when performing the procedure on the left hemithorax, the heart should be visualized and the needle path mapped carefully.
Dynamic (real-time) ultrasound guidanceIf the procedure is chosen to be performed using continuous real-time ultrasound guidance, the patient is positioned as described above, and the ultrasound transducer is covered by a sterile sheath. The needle is then inserted superior to the rib where the fluid has been identified. The needle is visualized as a hyperechoic streak on the ultrasound screen. Note that using real-time guidance is usually not necessary for large effusions and requires more time to perform.
FIGURE 8.40. Pleural Effusion Seen as a Dependent Hypoechoic Fluid Collection Above the Diaphragm.
FIGURE 8.41.Transducer Placement for Thoracentesis with Patient Sitting Upright.
FIGURE 8.42. Transducer Placement for Thoracentesis Using a Lateral Decubitus Position.

Chapter 8 / Critical Procedures for Acute Resuscitations 125
Pitfalls and ComplicationsWhen selecting the optimal insertion site, it is important to avoid vital structures. By choosing an entry site with a clear path to the effusion, the lungs are typically avoided because the ultrasound image is obscured when there is interposed air. One must be careful not to enter the chest wall too low and damage intraperitoneal organs such as the liver or spleen. One must also be careful to avoid the neurovascular bundle that runs along the inferior edge of each rib. Occasionally, despite good visualization it is possible to cause an iatro-genic pneumothorax. Although possible, it is probably much less likely to cause a vascular injury.
Use in Decision MakingThe availability of portable ultrasound and ease in perform-ing ultrasound-guided thoracentesis should result in its use as being standard of care. Although complications are rare, the use of ultrasound minimizes this as much as possible.
ENDOTRACHEAL TUBE CONFIRMATIONClinical IndicationsConfirmation of endotracheal tube (ETT) placement requires multiple forms of verification. Although direct visualization of the ETT passing through the vocal cords provides firm evidence of correct placement, other methods of confirma-tion should also be used (64). Capnography is the most reli-able adjunct of confirming ETT placement (65). However, capnography may be inaccurate in patients with cardiac arrest or markedly decreased perfusion. In addition, occa-sionally, capnography may have indeterminate results or may be unavailable. Bedside ultrasound is a rapid and reliable adjunct to confirm tube placement (66,67).
Image AcquisitionA 7.5- to 10-MHz linear array transducer is used to visualize the trachea. The transducer is placed transversely over the trachea in the suprasternal notch (Fig. 8.45).
Anatomy and LandmarksThe thyroid gland can be visualized anterior to the trachea (Fig. 8.46). The hyperechoic line represents the trachea just posterior to the thyroid gland. The ETT should be visualized
FIGURE 8.43. Transducer Placement for Thoracentesis Using a Semi-recumbent Position.
FIGURE 8.44. A Large Pleural Effusion is Seen with Hypoechoic Fluid Above the Diaphragm and Spleen.
FIGURE 8.45. Transducer Position to Image the Trachea . The transducer is placed in the short-axis view at the level of the sternoclavicular joints .
FIGURE 8.46. The Thyroid is Visualized Just Anterior to the Trachea.

126 SeCtion ii / Ultrasound in the Resuscitation of Acute Injury or Illness
at the level of the sternal notch as it is often a few centimeters above the sternal angle, which is the surface landmark for the carina.
ProcedureAfter the ETT has been advanced, the position can be con-firmed by the presence of only one air–mucosa interface with associated comet-tail artifact (Fig. 8.47; VIDEO 8 .7). In the setting of an esophageal intubation two air–mucosa interfaces will occur with two associated comet-tail artifacts (Fig. 8.48;
VIDEO 8 .8). In addition to tracheal ultrasound, lung ultra-sound can be used to visualize the lung sliding sign, lung pulse sign, and diaphragmatic excursion to assist in deter-mining ETT placement. With ventilation, lung sliding and diaphragmatic excursion should be observed for proper ETT placement (Chapter 5). Should lung sliding and diaphrag-matic excursion only be visualized in the right hemithorax and not in the left hemithorax, then a right main stem intuba-tion should be strongly suspected, as the left lung receives no ventilation. However, the absence of lung sliding may also
occur in the presence of a pneumothorax. To help rule out a pneumothorax sonographically in this clinical setting, the lung pulse sign should be identified. This occurs when there is no pneumothorax and the cardiac pulsations transmit through the lung, whereby pulsations of the pleural line are visualized in the ultrasound image ( VIDEO 8 .9) (68,69).
Pitfalls and ComplicationsSonographic verification of ETT placement should not be the only form of verification. Clinical judgment should always be used in conjunction with multiple adjuncts for ETT verification.
Use in Decision MakingAlthough capnography is the most accurate adjunct to deter-mine ETT placement, it may be less reliable in the setting of cardiac arrest and low perfusion states. The accuracy of bed-side ultrasound to confirm ETT placement allows this modal-ity to be another helpful adjunct to determine ETT placement.
PERICARDIOCENTESISClinical IndicationsIn the ED, patients with pericardial effusions exhibiting tam-ponade or impending hemodynamic instability have been tra-ditionally managed by blind percutaneous puncture of the pericardium for the removal of fluid. The usual method is the insertion of a needle via the subxyphoid approach. This blind technique has been associated with morbidity and mor-tality rates as high as 50% and 19%, respectively (70–75). Complications include right ventricular puncture, pneumo-thorax, pneumopericardium, liver puncture, and puncture of the coronary arteries. Despite the safeguards of electrocar-diographic needle monitoring and fluoroscopic guidance, complication rates persist (70,74,75). Some authors have advocated the complete abandonment of the blind pericar-dial puncture technique because of the associated risks (76).
Two-dimensional (2-D) echocardiography has been rou-tinely used to diagnose and evaluate pericardial effusions since the 1970s. The natural progression of its use has extended to the guidance of pericardiocentesis. Since 1980, the Mayo Clinic has described and developed 2-D–echoguided percutaneous pericardiocentesis (77–80). The procedure can be performed rapidly under emergent conditions and has been described in the emergency medicine literature (81). This method combines the simplicity of percutaneous punc-ture with the safety of direct visualization and is considered the gold standard for the management of pericardial effusion and cardiac tamponade (77,82–84).
Image AcquisitionAn ultrasound system equipped with a 2.5- to 5-MHz trans-ducer is used to perform the examination. A small footprint phased array transducer is ideal due to its ability to scan between rib spaces, but is not required. The curvilinear array transducer used for general abdominal imaging can be used as well. The patient is placed supine with the head of the bed at 30 degrees. The pericardial effusion should be assessed first with the standard cardiac views (described in Chapter 4) before the ideal entry site for needle insertion is chosen.
FIGURE 8.47. An Endotracheal Tube is Seen within the Trachea Forming a Single Air–Mucosa Interface. (Image courtesy of John Kendall .)
FIGURE 8.48. Esophageal Intubation is Seen with a Single Trachea Air–Mucosa Interface, with Another Air–Mucosa Interface Lateral to the Trachea. (Image courtesy of John Kendall .)

Chapter 8 / Critical Procedures for Acute Resuscitations 127
Anatomy and LandmarksParasternal approachThe parasternal long-axis view provides a cross section of the longitudinal axis of the heart. The transducer is placed obliquely on the left sternal border between the fourth and fifth ribs with the transducer indicator aimed at the right shoulder (Fig. 8.49). Normal ultrasound anatomy and
pericardial effusion is shown in Figures 8.50 and 8.51. This transducer position reveals a three-chamber view of the heart and the best approach to visualize posterior effusions.
Apical approachThe apical view provides a coronal cross section down the long axis of the heart and visualization of all four chambers. The transducer is placed at the patient’s point of maximal impulse (PMI) and aimed at the patient’s right shoulder (Fig. 8.52). The normal four-chamber view and a pericardial effusion are depicted in Figures 8.53 and 8.54.
Subxyphoid approachThis approach uses the liver as an acoustic window to provide a four-chamber view of the heart. The transducer is placed just inferior to the xyphoid process and left costal margin with the signal aimed at the left shoulder (Fig. 8.55). This view can be physically difficult to obtain in obese patients. Normal ultrasound anatomy and with a pericardial effusion is depicted in Figures 8.56 and 8.57.
ProcedureOnce the pericardial effusion is evaluated thoroughly with all standard echocardiographic views, the ideal needle inser-tion site is determined. This is the point where the effusion is closest to the transducer, fluid accumulation is maximal, and the track of the needle will most effectively avoid any
FIGURE 8.49. Transducer Position for a Parasternal Long-Axis Orienta-tion of the Heart.
FIGURE 8.50. Ultrasound of a Normal Heart in Parasternal Long-Axis Orientation . This is a three-chamber view of the heart . The right ventricle is closest to the transducer in the near field . Counterclockwise is the septum, left ventricle, mitral valve with anterior and posterior leaflets, left atrium, and the aorta outflow tract .
Septum
Leftventricle
Rightventricle
Aorta
Leftatrium
FIGURE 8.51. Large Circumferential Pericardial Effusion Seen in the Parasternal Long Axis View.
Largepericardialeffusion
Rightventricle
Leftventricle

128 SeCtion ii / Ultrasound in the Resuscitation of Acute Injury or Illness
FIGURE 8.52. Transducer Orientation for Apical View of the Heart.
FIGURE 8.53. Normal Heart as Seen in an Apical View . This is a four-chamber view of the heart . Note the bright hyperechoic pericardium without fluid .
Leftventricle
Rightventricle
Rightatrium
Leftatrium
FIGURE 8.54. Pericardial Effusion as Seen in Apical View . There is a large amount of anechoic fluid surrounding the heart . Note the right ventricle is collapsed during dias-tole, an echocardiographic sign of cardiac tamponade .
Pericardialeffusion
Leftventricle
Rightventricle
screen. The patient is kept in the exact same position while the area is prepped with chlorhexidine alcohol and a sterile drape is placed. The ultrasound transducer is also prepared with a sterile sleeve. Once the patient’s skin and the ultra-sound transducer are prepared in a sterile fashion, confirm the optimal insertion site and needle trajectory repeatedly until it is visualized in the operator’s mind. Local anesthetic is applied to the skin and needle path. A 16- to 18-gauge needle with plastic “angiocath” sheath or pigtail catheter is attached to a saline-filled syringe. Figure 8.58 shows how the needle is inserted at the predetermined site and trajec-tory. As the needle is advanced, gentle aspiration is applied until there is a flash of fluid. Once flash occurs, insert the needle 2 to 3 mm and advance the plastic sheath into the pericardial space. The needle is withdrawn, leaving only the plastic sheath within the pericardial space. Placement can be confirmed with direct sonographic visualization of the plastic sheath within the pericardial effusion or with color flow detection of agitated saline administered through the sheath. The agitated saline is prepared by using two syringes connected to a three-way stopcock. One syringe has 5 mL of saline and the other syringe is empty. The saline is agi-tated by rapidly injecting the saline back and forth between the two syringes. The ultrasound transducer is placed so that the pericardial effusion is well visualized. The saline is then quickly injected into the pericardiocentesis sheath (attached to the third port of the three-way stopcock) ( VIDEO 8 .10).
vital structures, such as the lung (80,81). Note that the ultra-sound transducer is not used for real-time guidance of needle insertion in this procedure. Once the site has been chosen, mark the skin with a pen. The trajectory of needle insertion is determined by the trajectory of the transducer used to obtain the best image of the effusion. The depth of insertion is also assessed using the centimeter marks on the ultrasound

Chapter 8 / Critical Procedures for Acute Resuscitations 129
Color flow ultrasound can also be used to visualize the dynamic injection of saline in the pericardial sac. This con-firms proper placement, allowing for the safe continuation of the procedure in which the pericardial fluid is aspirated into a syringe. Once clinical improvement is achieved, the indwelling sheath can be withdrawn or replaced with a pig-tail catheter over a guidewire.
Pitfalls and ComplicationsWhen selecting the optimal insertion site, it is important to avoid vital structures. By choosing an entry site with a clear path to the pericardial effusion, the lungs are typically avoided because the ultrasound image is obscured when there is under-lying air. One must be careful to avoid the left internal mam-mary artery, which travels in a cephalad-caudal direction 3 to 5 cm lateral to the left sternal border (85). Though extremely rare, damage to this artery can result in significant bleeding and cardiac tamponade. One must also be careful to avoid the neu-rovascular bundle that runs along the inferior edge of each rib.
Use in Decision MakingIn the ED, a pericardial effusion can present with a spec-trum of clinical presentations from the asymptomatic to the classic Beck’s triad associated with cardiac tamponade.
FIGURE 8.55. Transducer Position for a Subxyphoid Orientation of the Heart.
FIGURE 8.56. Normal Heart as Imaged from a Subxy-phoid Orientation.
Left lobeof liver
Rightventricle
Left ventricle
pericardium
FIGURE 8.57. Pericardial Effusion as Imaged from a Subxyphoid Orientation.
FIGURE 8.58. Approach for Pericardiocentesis . The optimal site, trajec-tory, and depth are determined using the transducer .

130 SeCtion ii / Ultrasound in the Resuscitation of Acute Injury or Illness
The emergency physician is likely to perform bedside peri-cardiocentesis in an emergent situation when the patient is hemodynamically unstable, in respiratory extremis, or in pulseless electrical activity. 2-D echocardiography can still be used in these situations (86). An abbreviated 2-D scan of the heart is done to localize the pericardial fluid, choose the ideal insertion site, and determine the trajectory of needle insertion.
TRANSVENOUS PACEMAKER PLACEMENT AND CAPTUREClinical IndicationsWhen placing a transvenous cardiac pacemaker it is impor-tant that it be placed in the apex of the right ventricle for capture. Unfortunately, in the ED it can be difficult to get real-time localization of the pacer wires; therefore they are often passed blindly while watching a monitor for capture. Ultrasound can be used for direct visualization of correct positioning of the catheter in the heart while also confirming electrical and mechanical capture (86–91).
Image Acquisition and AnatomySeveral approaches can be used to confirm placement of the pacemaker electrode, but the subcostal position is relatively easy to perform and provides visualization of all four chambers
of the heart. In some instances, other views such as the para-sternal long axis or the apical approach may also be useful.
For the subcostal view the transducer is placed in the subxyphoid area with the transducer indicator toward the patient’s left shoulder. The liver provides an acoustic win-dow that allows good visualization of the heart. The liver is the structure closest to the transducer at the top of the screen. The right ventricle is seen just beyond the liver and has a somewhat triangular shape projected on the left side of the ultrasound monitor. The right atrium can also be visualized as a more rounded structure adjacent to the right ventricle. The left ventricle and atria are seen deep to the right atria and ventricle. A properly placed pacemaker lead should be seen longitudinally as it enters the right atria and, as it is inserted further, the right ventricle. Proper insertion into the apex of the right ventricle is seen in Figure 8.59.
The parasternal long axis and apical views are described in Chapter 4. Both allow for excellent visualization of the right ventricle and can be used as additional views to confirm correct placement of the pacemaker lead.
It may also be helpful to visualize the inferior vena cava (IVC) because a pacemaker lead can occasionally traverse the right atrium and enter the IVC. This is best done through a subcostal approach with the transducer oriented in the sagittal plane. Figure 8.60 shows the IVC emptying into the right atria.
FIGURE 8.59. Subcostal View of the Heart Showing a Pacemaker Lead Inserted into the Apex of the Right Ventricle.
Liver
Apexof rightventricle
Leftventricle
Pacerwire
FIGURE 8.60. Subcostal Longitudinal View of the Inferior Vena Cava Emptying into the Right Atrium . In the near field the left lobe of the liver serves as an acoustic window .
Left lobeof liver
Diaphragm
Rightatriumof heart
Inferiorvenacava

Chapter 8 / Critical Procedures for Acute Resuscitations 131
ProcedureThe standard procedure for insertion of a transvenous pace-maker should be followed. Ultrasound can be used to follow the pacemaker lead through the right atrium and into the right ventricle with ultimate placement in the apex. It can also be used after insertion to confirm placement and capture.
Pitfalls and ComplicationsThe pitfalls associated with this procedure are the same pit-falls seen with transvenous pacemaker implantation without ultrasound guidance.
Use in Decision MakingTransvenous pacemaker insertion is done in emergency situ-ations. The use of ultrasound to assist with insertion and placement provides an added level of confidence for the phy-sician. When capture does not occur, correct placement of the pacemaker can be immediately ascertained with bedside ultrasound and therefore help troubleshoot in determining the causes for failure of electrical and mechanical capture.
REFERENCES 1. Sznajder JI, Zveibil FR, Bitterman H, et al. Central vein catheterization.
Failure and complication rates by three percutaneous approaches. Arch Intern Med. 1986;146:259–261.
2. Mansfield PF, Hohn DC, Fornage BD, et al. Complications and failures of subclavian-vein catheterization. N Engl J Med. 1994;331:1735–1738.
3. McGee DC, Gould MK. Preventing complications of central venous catheterization. N Engl J Med. 2003;348:1123–1133.
4. Steele R, Irvin CB. Central line mechanical complication rate in emer-gency medicine patients. Acad Emerg Med. 2001;8:204–207.
5. Merrer J, De Jonghe B, Golliot F, et al. Complications of femoral and subclavian venous catheterization in critically ill patients: a randomized controlled trial. JAMA. 2001;286:700–707.
6. Polderman KH, Girbes AJ. Central venous catheter use. Part 1: mechani-cal complications. Intensive Care Med. 2002;28:1–17.
7. Droll KP, Lossing AG. Carotid-jugular arteriovenous fistula: case report of an iatrogenic complication following internal jugular vein catheteriza-tion. J Clin Anesth. 2004;16:127–129.
8. Schummer W, Schummer C, Hoffman E. Chylothorax after central venous catheterization. Considerations to anatomy, differential diagnosis and therapy. Anaesthetist. 2003;52:919–924.
9. Yoshida S. A lethal complication of central venous catheterization. Lancet. 2003;362:569.
10. Shields LB, Hunsaker DM, Hunsaker JC III. Iatrogenic catheter-related cardiac tamponade: a case report of fatal hydropericardium follow-ing subcutaneous implantation of a chemotherapeutic injection port. J Forensic Sci. 2003;48:414–418.
11. Fangio P, Mourgeon E, Romelaer A, et al. Aortic injury and cardiac tamponade as a complication of subclavian venous catheterization. Anesthesiology. 2002;96:1520–1522.
12. Reddy G, Coombes A, Hubbard AD. Horner’s syndrome following inter-nal jugular vein cannulation. Intensive Care Med. 1998;24:194–196.
13. Denys BG, Uretsky BF. Anatomical variations of the internal jugu-lar vein location: impact on central venous access. Crit Care Med. 1991;19:1516–1519.
14. Lin BS, Kong CW, Tarng DC, et al. Anatomical variation of the inter-nal jugular vein and its impact on temporary haemodialysis vascular access: an ultrasonographic survey in uraemic patients. Nephrol Dial Transplant. 1998;13:134–138.
15. Gordon AC, Saliken JC, Johns D, et al. US-guided puncture of the inter-nal jugular vein: complications and anatomic considerations. J Vasc Interv Radiol. 1998;9:333–338.
16. Lichtenstein D, Saifi R, Augarde R, et al. The internal jugular veins are asymmetric. Usefulness of ultrasound before catheterization. Intensive Care Med. 2001;27:301–305.
17. Forauer AR, Glockner JF. Importance of US findings in access plan-ning during jugular vein hemodialysis catheter placements. J Vasc Interv Radiol. 2000;11:233–238.
18. Mallory DL, McGee WT, Shawker TH, et al. Ultrasound guidance improves the success rate of internal jugular vein cannulation. A pro-spective, randomized trial. Chest. 1990;98:157–160.
19. Troianos CA, Jobes DR, Ellison N. Ultrasound-guided cannulation of the internal jugular vein. A prospective, randomized study. Anesth Analg. 1991;72:823–826.
20. Denys BG, Uretsky BF, Reddy PS. Ultrasound-assisted cannulation of the internal jugular vein. A prospective comparison to the external landmark-guided technique. Circulation. 1993;87:1557–1562.
21. Gualtieri E, Deppe S, Sipperly ME, et al. Subclavian venous catheteriza-tion: greater success rate for less experienced operators using ultrasound guidance. Crit Care Med. 1995;23:692–697.
22. Hilty WM, Hudson PA, Levitt MA, et al. Real-time ultrasound-guided femoral vein catheterization during cardiopulmonary resuscitation. Ann Emerg Med. 1997;29:331–336.
23. Teichgraber UK, Benter T, Gebel M, et al. A sonographically guided technique for central venous access. AJR Am J Roentgenol. 1997;169:731–733.
24. Slama M, Novara A, Safavian A, et al. Improvement of internal jugular vein cannulation using an ultrasound-guided technique. Intensive Care Med. 1997;23:916–919.
25. Miller AH, Roth BA, Mills TJ, et al. Ultrasound guidance versus the landmark technique for the placement of central venous catheters in the emergency department. Acad Emerg Med. 2002;9:800–805.
26. Kwon TH, Kim YL, Cho DK. Ultrasound-guided cannulation of the femoral vein for acute haemodialysis access. Nephrol Dial Transplant. 1997;12:1009–1012.
27. Sulek CA, Blas ML, Lobato EB. A randomized study of left ver-sus right internal jugular vein cannulation in adults. J Clin Anesth. 2000;12:142–151.
28. Randolph AG, Cook DJ, Gonzales CA, et al. Ultrasound guidance for placement of central venous catheters: a meta-analysis of the literature. Crit Care Med. 1996;24:2053–2058.
29. Keenan SP. Use of ultrasound to place central lines. J Crit Care. 2002;17:126–137.
30. Hind D, Calvert N, McWilliams R, et al. Ultrasonic locating devices for central venous cannulation: meta-analysis. BMJ. 2003;327:361.
31. Abboud PA, Kendall JL. Ultrasound guidance for vascular access. Emerg Med Clin North Am. 2004;22(3):749–773.
32. Rothschild JM. Ultrasound guidance of central vein catheterization. In: Markowitz AJ, ed. Making Health Care Safer: A Critical Analysis of Patient Safety Practices. Evidence Report/Technology. Rockville, MD: US Department of Health and Human Services; 2001. Assessment No. 43, AHRQ Publication No. 01-E058.
33. National Institute for Clinical Excellence. Guidance on the Use of Ultra-sound Locating Devices for Placing Central Venous Catheters. Technol-ogy Appraisal Guidance No. 49, September 2002. www.nice.org.uk.
34. Blaivas M, Brannam L, Fernandez E. Short-axis versus long-axis approaches for teaching ultrasound-guided vascular access on a new inanimate model. Acad Emerg Med. 2003;10:1307–1311.
35. MillingTJ Jr, Rose J, Briggs WM, et al. Randomized, controlled clini-cal trial of point-of-care limited ultrasonography assistance of central venous cannulation: the Third Sonography Outcomes Assessment Pro-gram (SOAP-3) Trial. Crit Care Med. 2005; 33(3):1764–1769.
36. Nagashima G, Kikuchi T, Tsuyuzaki H, et al. To reduce catheter-related bloodstream infections: is the subclavian route better than the jugular route for central venous catheterization? J Infect Chemother. 2006;12:363–365.
37. O-Grady NP, Alexander M, Burns LA, et al. Guidelines for the Prevention of Intravascular Catheter-Related Infections, 2011. Centers for Disease Control and Prevention (CDC) and Healthcare Infection Control Practices Advisory Committee. http://www.cdc.gov/hicpac/pdf/guidelines/bsi-guidelines-2011.pdf. Accessed August 28, 2012.
38. Ruesch S, Walder B, Tramer MR. Complications of central venous cath-eters: internal jugular versus subclavian access—a systematic review. Crit Care Med. 2002;30:454–456.
39. Gualtieri E, Deppe SA, Sipperly ME, et al. Subclavian venous catheter-ization: greater success rate for less experienced operators using ultra-sound guidance. Crit Care Med. 1995;23:692–697.

132 SeCtion ii / Ultrasound in the Resuscitation of Acute Injury or Illness
40. Yoffa D. Supraclavicular subclavian venipuncture and catheterisation. Lancet 1965;2:614.
41. Rhondali O, Attof R, Combet S, et al. Pediatric Anesthesia. 2011; 21:1136–1141.
42. Beaudoin FL, Merchant RC, Lincoln J, et al. Bedside ultrasonogra-phy detects significant femoral vessel overlap: implications for central venous cannulation. CJEM. 2011;13(4):245–250.
43. Sofocleous CT, Schur I, Cooper SG, et al. Sonographically guided place-ment of peripherally inserted central venous catheters: review of 355 procedures. AJR Am J Roentgenol. 1998;170:1613–1616.
44. Parkinson R, Gandhi M, Harper J, et al. Establishing an ultrasound guided peripherally inserted central catheter (PICC) insertion service. Clin Radiol. 1998;53:33–36.
45. Chrisman HB, Omary RA, Nemcek AA, et al. Peripherally inserted cen-tral venous catheters: guidance with the use of US versus venography in 2,650 patients. J Vasc Interv Radiol. 1999;10:473–475.
46. Donaldson JS, Morello FP, Junewick JJ, et al. Peripherally inserted cen-tral venous catheters: US-guided vascular access in pediatric patients. Radiology. 1995;197:542–544.
47. LaRue GD. Efficacy of ultrasonography in peripheral venous cannula-tion. J Intraven Nurs. 2000;23:29–34.
48. Moureau NL. Using ultrasound to guide PICC insertion. Nursing. 2003;33:20.
49. McMahon DD. Evaluating new technology to improve patient outcomes: a quality improvement approach. J Infus Nurs. 2002;25:250–255.
50. Brannam L, Blaivas M, Lyon M et al. Emergency nurses’ utilization of ultrasound guidance for placement of peripheral intravenous lines in difficult-access patients. Acad Emerg Med. 2004;11(12):1361–1363.
51. Keyes LE, Frazee BW, Snoey ER, et al. Ultrasound-guided brachial and basilic vein cannulation in emergency department patients with difficult intravenous access. Ann Emerg Med. 1999;34:711–714.
52. Costantino TG, Parikh AK, Satz WA, et al. Ultrasonography-guided peripheral intravenous access versus traditional approaches in patients with difficult intravenous access. Ann Emerg Med. 2005;46(5):456–461.
53. Witting MD, Schenkel SM, Lawner BJ, et al. Effects of vein width and depth on ultrasound-guided peripheral intravenous success rates. J Emerg Med. 2010;39(1):70–75.
54. Panebianco NL, Fredette JM, Szyld D, et al. What you see (sonographi-cally) is what you get: vein and patient characteristics associated with successful ultrasound-guided peripheral intravenous placement in patients with difficult access. Acad Emerg Med. 2009;16(12):1298–1303.
55. Fields JM, Dean AJ, Todman RW, et al. The effect of vessel depth, diam-eter, and location on ultrasound-guided peripheral intravenous catheter longevity. Am J Emerg Med. 2012;30(7):1134–1140.
56. Sandhu NP, Sidhu DS. Mid-arm approach to basilic and cephalic vein cannulation using ultrasound guidance. Br J Anaesth. 2004;93:292–294.
57. Jones PW, Moyers JP, Rogers JT, et al. Ultrasound-guided thoracentesis: is it a safer method? Chest. 2003;123:418–423.
58. Mayo PH, Goltz HR, Tafreshi M, et al. Safety of ultrasound-guided thoracentesis in patients receiving mechanical ventilation. Chest. 2004;125:1059–1062.
59. Grogan DR, Irwin RS, Channick R, et al. Complications associated with thoracentesis: a prospective, randomized study comparing three different methods. Arch Intern Med. 1990;150:873–877.
60. Sennef MG, Corwin RW, Gold LH, et al. Complications associated with thoracentesis. Chest. 1986;90:97–100.
61. Collins TR, Sahn SA. Thoracocentesis. Clinical value, complications, technical problems, and patient experience. Chest. 1987;9:817–822.
62. Bartter T, Mayo PD, Pratter MR, et al. Lower risk and higher yield for thoracentesis when performed by experienced operators. Chest. 1993;103:1873–1876.
63. Heller M, Jehle D. Ultrasound in Emergency Medicine. Philadelphia, PA: WB Saunders; 1995:160–162.
64. Verification of endotracheal tube placement: policy statement. 2009 http://www.acep.org/Clinical—Practice-Management/Verification-of-Endotracheal-Tube-Placement/. Accessed August 28, 2012.
65. ECC Committee, Subcommittees and Task Forces of the American Heart Association. 2010 American Heart Association Guidelines for cardiopulmonary resuscitation and emergency cardiovascular care. Part 8.1: Adjuncts for airway control and ventilation. Circulation. 2010;112:S729–S735.
66. Chou HC, Tseng WP, Wang CH, et al. Tracheal rapid ultrasound exam (T.R.U.E.) for confirming endotracheal tube placement during emer-gency intubation. Resuscitation. 2011;82:1279–1284.
67. Sim SS, Lien WC, Chou HC, et al. Ultrasonographic lung sliding sign in confirming proper endotracheal intubation during emergency intubation. Resuscitation. 2012;83:307–312.
68. Lichtenstein DA, Lascols N, Prin S, et al. The “lung pulse”: an early ultrasound sign of complete atelectasis. Intensive Care Med. 2003;29(12):2187–2192.
69. Blaivas M, Tsung JW. Point-of-care sonographic detection of left endo-bronchial main stem intubation and obstruction versus endotracheal intubation. J Ultrasound Med. 2008;27:785–789.
70. Wong B, Murphy J, Chang CJ, et al. The risk of pericardiocentesis. Am J Cardiol. 1979;44:1110–1114.
71. Krikorian JG, Hancock EW. Pericardiocentesis. Am J Med. 1978;65:808–814.
72. Morin JE, Hollomby D, Gonda A, et al. Management of uremic pericar-ditis: a report of 11 patients with cardiac tamponade and a review of the literature. Ann Thorac Surg. 1976;22:588–592.
73. Kwasnik EM, Koster K, Lazarus JM, et al. Conservative manage-ment of uremic pericardial effusions. J Thorac Cardiovasc Surg. 1978;76:629–632.
74. Ball JB, Morrison WL. Cardiac tamponade. Postgrad Med J. 1997;73:141–145.
75. Bishop LH Jr, Estes EH Jr, McIntosh HD. Electrocardiogram as a safe-guard in pericardiocentesis. JAMA. 1956;162:264–265.
76. Guberman BA, Fowler NO, Engel PJ, et al. Cardiac tamponade in medi-cal patients. Circulation. 1981;64:633–640.
77. Callahan JA, Seward JB, Tajik AJ, et al. Pericardiocentesis assisted by two-dimensional echocardiography. J Thorac Cardiovasc Surg. 1983;85:877–879.
78. Callahan JA, Seward JB, Nishimura RA, et al. Two-dimensional echo-cardiographically guided pericardiocentesis: experience in 117 consecu-tive patients. Am J Cardiol. 1985;55:476–479.
79. Callahan JA, Seward JB, Tajik AJ. Cardiac tamponade: pericardiocen-tesis directed by two-dimensional echocardiography. Mayo Clin Proc. 1985;60:344–347.
80. Tsang TS, Freeman WK, Sinak LJ, et al. Echocardiographically guided pericardiocentesis: evolution and state-of-the-art technique. Mayo Clin Proc. 1998;73:647–652.
81. Mazurek B, Jehle D, Martin M. Emergency department echocardiogra-phy in the diagnosis and therapy of cardiac tamponade. J Emerg Med. 1991;9:27–31.
82. Spodick D. Pericardial diseases. In: Braunwald E, ed. Heart Disease: A Textbook of Cardiovascular Medicine. 6th ed. New York, NY: WB Saunders; 2001:1847–1848.
83. Tsang TSM, Oh JK, Seward JB. Review: Diagnosis and management of cardiac tamponade in the era of echocardiography. Clin Cardiol. 1999;22:446–452.
84. Salem K, Mulji A, Lonn E. Echocardiographically guided pericardiocentesis—the gold standard for the management of pericardial effusion and cardiac tamponade. Can J Cardiol. 1999;15:1251–1255.
85. Kronzon I, Glassman LR, Tunick PA. Avoiding the left internal mam-mary artery during anterior pericardiocentesis. Echocardiography. 2003;20:533–534.
86. Tam MM. Ultrasound for primary confirmation of mechanical cap-ture in emergency transcutaneous pacing. Emerg Med (Fremantle). 2003;15:192–194.
87. Macedo W Jr, Sturmann K, Kim JM, et al. Ultrasonographic guidance of transvenous pacemaker insertion in the emergency department: a report of three cases. J Emerg Med. 1999;17:491–496.
88. Aguilera PA, Durham BA, Riley DA. Emergency transvenous car-diac pacing placement using ultrasound guidance. Ann Emerg Med. 2000;36:224–227.
89. Tobin AM, Grodman RS, Fisherkeller M, et al. Two-dimensional echo-cardiographic localization of a malpositioned pacing catheter. Pacing Clin Electrophysiol. 1983;6:291–299.
90. Meier B, Felner JM. Two-dimensional echocardiographic evalua-tion of intracardiac transvenous pacemaker leads. J Clin Ultrasound. 1982;10:421–425.
91. Gondi B, Nanda NC. Real-time, two-dimensional echocardiographic features of pacemaker perforation. Circulation. 1981;64:97–106.

133
Karen S. Cosby and John L. Kendall
Right Upper Quadrant: Liver, Gallbladder,
and Biliary Tree
9
INTRODUCTION . . . . . . . . . . . . . . . . . . . . . . . . . . . . . . . . . . 133CLINICAL APPLICATIONS . . . . . . . . . . . . . . . . . . . . . . . . . . 133GUIDE TO IMAGE ACQUISITION . . . . . . . . . . . . . . . . . . . . . 134NORMAL ANATOMY . . . . . . . . . . . . . . . . . . . . . . . . . . . . . . 135
The Liver . . . . . . . . . . . . . . . . . . . . . . . . . . . . . . . . . . . 135Hepatic Veins . . . . . . . . . . . . . . . . . . . . . . . . . . . . . . . 135Portal Veins . . . . . . . . . . . . . . . . . . . . . . . . . . . . . . . . 137Hepatic Artery . . . . . . . . . . . . . . . . . . . . . . . . . . . . . . . 138Bile Ducts . . . . . . . . . . . . . . . . . . . . . . . . . . . . . . . . . . 138Gallbladder . . . . . . . . . . . . . . . . . . . . . . . . . . . . . . . . . 138Morison’s Pouch . . . . . . . . . . . . . . . . . . . . . . . . . . . . . 140Standard Views of the Right Upper Quadrant . . . . . . . 140
PATHOLOGY . . . . . . . . . . . . . . . . . . . . . . . . . . . . . . . . . . . . . 141Cholelithiasis . . . . . . . . . . . . . . . . . . . . . . . . . . . . . . . 141Cholecystitis: Acute, Chronic, and Acalculous . . . . . . 144
Jaundice . . . . . . . . . . . . . . . . . . . . . . . . . . . . . . . . . . . 147Ascites . . . . . . . . . . . . . . . . . . . . . . . . . . . . . . . . . . . . 150Other Pathology . . . . . . . . . . . . . . . . . . . . . . . . . . . . . 150
ARTIFACTS AND PITFALLS . . . . . . . . . . . . . . . . . . . . . . . . . 151Side Lobe Artifact . . . . . . . . . . . . . . . . . . . . . . . . . . . . 151Shadowing . . . . . . . . . . . . . . . . . . . . . . . . . . . . . . . . . 151Common Pitfalls . . . . . . . . . . . . . . . . . . . . . . . . . . . . . 152
USE OF THE IMAGE IN CLINICAL DECISION MAKING . . . . . . . . . . . . . . . . . . . . . . . . . . . . . 152
CORRELATION WITH OTHER IMAGING MODALITIES . . . . . . . . . . . . . . . . . . . . . . . . . . . . . . . . . . 153
INCIDENTAL FINDINGS . . . . . . . . . . . . . . . . . . . . . . . . . . . . 153CLINICAL CASE . . . . . . . . . . . . . . . . . . . . . . . . . . . . . . . . . . 153
INTRODUCTIONAbdominal pain is a leading cause for visits to the emer-gency department (ED). The evaluation of the abdomen frequently utilizes many resources, not the least of which is the time often invested in serial exams, use of consultants, and imaging procedures. Focused bedside ultrasound offers a valuable adjunct for the assessment of abdominal pain. With even a moderate amount of training and limited experience, emergency physicians can obtain sufficient skill to incorpo-rate right upper quadrant (RUQ) ultrasound into their bed-side exams and clinical decisions (1–6). Most studies can be completed in ,10 minutes (5). The current literature verifies that emergency ultrasound of the RUQ is accurate, improves time to diagnosis and treatment, decreases ED length of stay, and improves patient satisfaction (7–9). Ultrasound of the RUQ is included in the list of recommended applications for emergency ultrasound and is part of the model ultrasound curriculum of emergency medicine residency training pro-grams (10).
CLINICAL APPLICATIONSRUQ ultrasound is useful in assessing three common problems:
1. Right upper quadrant and epigastric pain 2. Jaundice 3. Ascites
There are four common practical applications for bedside ultrasound of the RUQ, including the detection of:
1. Gallstones 2. Cholecystitis 3. Dilated bile ducts and biliary obstruction 4. Ascites
Ultrasound can also potentially help in the search for a focal source of infection in patients who are septic, those with al-tered mental status and unreliable exams, and in the elderly or immunocompromised who may be less likely to have focal findings (11).

134 Section iii / Evaluation of Abdominal Conditions
The liver is the major acoustic window to the abdomen. Familiarity with the liver and its surrounding structures will open up a variety of applications for abdominal scanning beyond those listed here. As clinicians become proficient in RUQ scans, they will likely become more confident in the Focused Assessment by Sonography for Trauma (FAST) exam (to assess for free fluid in Morison’s pouch) and in the scan of the proximal abdominal aorta (to detect aneu-rysms and dissections). Although RUQ ultrasound is primar-ily focused on the liver, gallbladder, and biliary tree, it may incidentally reveal pathology in adjacent areas in the right kidney, pleural space, pancreas, and aorta.
GUIDE TO IMAGE ACQUISITIONThe liver, gallbladder, and biliary tree can be imaged from a number of approaches (subcostal, intercostal, and flank) with the patient in a variety of positions (supine, semirecumbent, erect, left lateral decubitus, and prone). The optimal technique will vary based on differences in anatomy, body habitus, and bowel gas patterns. Ideally, the sonographer should begin with a few standard approaches, modified and guided by both external and internal land-marks (Fig. 9.1).
The subcostal approach is the most commonly used initial approach to imaging the gallbladder. Begin with the patient supine, and place the transducer in the midline at the epi-gastrium with the transducer oriented in the sagittal plane (Fig. 9.1A). If there is a large left hepatic lobe, the liver may be easily seen in this position. Leaving the transducer in the midline, tilt the transducer to project the sound wave toward the patient’s right side. In some cases, this will be sufficient to localize the gallbladder. If it is not seen, move the transducer down the costal margin while projecting it cephalad under the rib margin to scan through the dome of
the liver. In many patients, the liver is mostly intrathoracic. In these patients, an improved image can be obtained by plac-ing the transducer between the ribs (intercostal approach) (Fig. 9.1B). Alternatively, the patient can be positioned to bring the liver down below the costal margin. Have patients sit erect or semirecumbent, and instruct them to breathe deeply with their “belly out.” As the liver descends, the liver and gallbladder may be more easily imaged. If these maneu-vers fail, move the patient to a left lateral decubitus position. This position brings the liver and gallbladder more toward the midline and closer to the transducer. Scan again from the subcostal approach, then continue to move the transducer along the costal margin toward the right flank. If the anterior subcostal approach is unsuccessful, leave the patient in a left lateral decubitus position, and scan through the right flank to identify the right kidney and Morison’s pouch (Fig. 9.1C). Once the right kidney is in view, the transducer should be angled slightly cephalad and anterior. The fundus of the gall-bladder lies in close proximity to the right kidney and will often pop into view with this maneuver. Occasionally, it is useful to roll the patient from a left lateral decubitus posi-tion into a nearly prone position and scan from a subcostal approach. This position brings the gallbladder anterior. If heavy shadowing is seen from the gallbladder fossa, mov-ing the patient prone may help the stones fall forward and make the echogenic stones more visible themselves, helping distinguish the shadows of a gallbladder packed with stones from artifact created by bowel gas (12).
If these external landmarks do not produce a good im-age, focus on obtaining the best possible acoustic window of the liver and follow internal landmarks. The portal triad and main lobar fissure (MLF) are useful landmarks that can be used to locate the gallbladder fossa. If the portal triad is used to define the center of a clock face, the gallbladder is usually found around 2 o’clock. The MLF can be seen as an
A B C
FIGURE 9.1. Transducer Placement. The liver and gallbladder can be imaged from an epigastric, subcostal (A), intercostal (B), or flank (C) approach with the patient in any of several positions, including supine, semirecumbent, erect, left lateral decubitus, or prone. Begin with the transducer in the epigastrium and scan below the right costal margin, moving from the epigastrium toward the right flank (A). A high liver can be imaged through the intercostal space (B). A flank approach (C) can minimize interference from bowel gas.
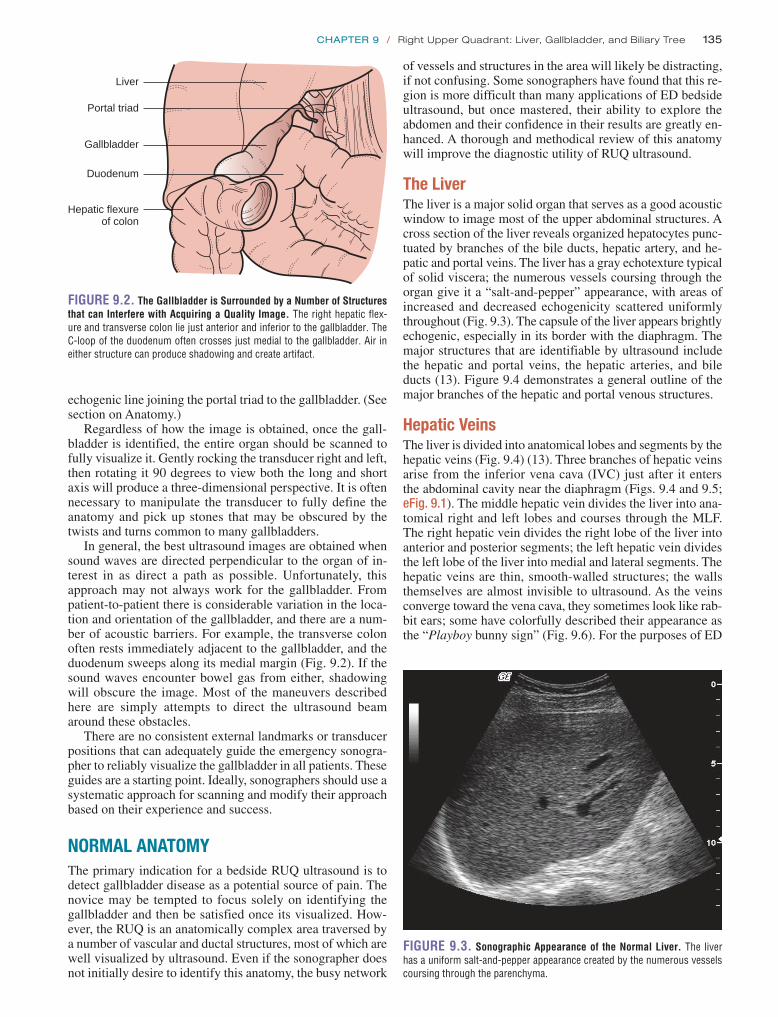
chapter 9 / Right Upper Quadrant: Liver, Gallbladder, and Biliary Tree 135
of vessels and structures in the area will likely be distracting, if not confusing. Some sonographers have found that this re-gion is more difficult than many applications of ED bedside ultrasound, but once mastered, their ability to explore the abdomen and their confidence in their results are greatly en-hanced. A thorough and methodical review of this anatomy will improve the diagnostic utility of RUQ ultrasound.
The LiverThe liver is a major solid organ that serves as a good acoustic window to image most of the upper abdominal structures. A cross section of the liver reveals organized hepatocytes punc-tuated by branches of the bile ducts, hepatic artery, and he-patic and portal veins. The liver has a gray echotexture typical of solid viscera; the numerous vessels coursing through the organ give it a “salt-and-pepper” appearance, with areas of increased and decreased echogenicity scattered uniformly throughout (Fig. 9.3). The capsule of the liver appears brightly echogenic, especially in its border with the diaphragm. The major structures that are identifiable by ultrasound include the hepatic and portal veins, the hepatic arteries, and bile ducts (13). Figure 9.4 demonstrates a general outline of the major branches of the hepatic and portal venous structures.
Hepatic VeinsThe liver is divided into anatomical lobes and segments by the hepatic veins (Fig. 9.4) (13). Three branches of hepatic veins arise from the inferior vena cava (IVC) just after it enters the abdominal cavity near the diaphragm (Figs. 9.4 and 9.5; eFig. 9.1). The middle hepatic vein divides the liver into ana-tomical right and left lobes and courses through the MLF. The right hepatic vein divides the right lobe of the liver into anterior and posterior segments; the left hepatic vein divides the left lobe of the liver into medial and lateral segments. The hepatic veins are thin, smooth-walled structures; the walls themselves are almost invisible to ultrasound. As the veins converge toward the vena cava, they sometimes look like rab-bit ears; some have colorfully described their appearance as the “Playboy bunny sign” (Fig. 9.6). For the purposes of ED
echogenic line joining the portal triad to the gallbladder. (See section on Anatomy.)
Regardless of how the image is obtained, once the gall-bladder is identified, the entire organ should be scanned to fully visualize it. Gently rocking the transducer right and left, then rotating it 90 degrees to view both the long and short axis will produce a three-dimensional perspective. It is often necessary to manipulate the transducer to fully define the anatomy and pick up stones that may be obscured by the twists and turns common to many gallbladders.
In general, the best ultrasound images are obtained when sound waves are directed perpendicular to the organ of in-terest in as direct a path as possible. Unfortunately, this approach may not always work for the gallbladder. From patient-to-patient there is considerable variation in the loca-tion and orientation of the gallbladder, and there are a num-ber of acoustic barriers. For example, the transverse colon often rests immediately adjacent to the gallbladder, and the duodenum sweeps along its medial margin (Fig. 9.2). If the sound waves encounter bowel gas from either, shadowing will obscure the image. Most of the maneuvers described here are simply attempts to direct the ultrasound beam around these obstacles.
There are no consistent external landmarks or transducer positions that can adequately guide the emergency sonogra-pher to reliably visualize the gallbladder in all patients. These guides are a starting point. Ideally, sonographers should use a systematic approach for scanning and modify their approach based on their experience and success.
NORMAL ANATOMYThe primary indication for a bedside RUQ ultrasound is to detect gallbladder disease as a potential source of pain. The novice may be tempted to focus solely on identifying the gallbladder and then be satisfied once its visualized. How-ever, the RUQ is an anatomically complex area traversed by a number of vascular and ductal structures, most of which are well visualized by ultrasound. Even if the sonographer does not initially desire to identify this anatomy, the busy network
Hepatic flexureof colon
Gallbladder
Liver
Portal triad
Duodenum
FIGURE 9.2. The Gallbladder is Surrounded by a Number of Structures that can Interfere with Acquiring a Quality Image. The right hepatic flex-ure and transverse colon lie just anterior and inferior to the gallbladder. The C-loop of the duodenum often crosses just medial to the gallbladder. Air in either structure can produce shadowing and create artifact.
FIGURE 9.3. Sonographic Appearance of the Normal Liver. The liver has a uniform salt-and-pepper appearance created by the numerous vessels coursing through the parenchyma.

136 Section iii / Evaluation of Abdominal Conditions
Inferior vena cava
Portal vein
Ligamentum teres
Falciform ligament
Left branch portal vein
Left hepatic veinRight hepatic
vein
Middle hepaticvein
Right branchportal vein
FIGURE 9.4. The Hepatic Veins and Portal Venous System. The inferior vena cava (IVC) gives rise to three main hepatic veins that travel in the interlobar segments of the liver. The portal vein has two main branches that travel within the lobes of the liver.
A
FIGURE 9.5. The Inferior Vena Cava and Hepatic Veins. A: The inferior vena cava (IVC) pierces the diaphragm and enters the abdominal cavity where it can be seen posteriorly. B: It gives rise to three main hepatic veins that define the major lobes and segments of the liver.
B
FIGURE 9.6. Sometimes the Hepatic Veins Take on the Appearance of Bunny Ears. In (A), the bunny has long floppy ears. The appearance in (B) has been described as the “Playboy Bunny sign.” This description is an easy way to learn to recognize hepatic veins. (Image B courtesy of Mark Deutchman, MD.)
A
B
劉政亨
劉政亨
劉政亨
劉政亨

chapter 9 / Right Upper Quadrant: Liver, Gallbladder, and Biliary Tree 137
vein joins it (14). The portosplenic convergence defines the origin of the portal vein. As the portal vein enters the liver, it lies just anterior to the IVC; this point defines the hilum of the liver (Fig. 9.9) (13). When the long axis of the main portal vein is viewed, the common bile duct can be seen to accompany it toward the porta hepatis (Figs. 9.9 and 9.10; eFigs. 9.3 and 9.4; VIDEO 9 .1). The normal common bile duct is barely visible as an irregular struc-ture just anterior to the portal vein. The portal vein rapidly gives rise to two main branches, the right and left portal veins (Figs. 9.4 and 9.11). The right portal vein is the major landmark of the portal triad in the porta hepatis. The portal veins are characterized by bright echogenic walls that help distinguish them from other vessels in the liver. This pecu-liar echogenicity gives the appearance of a halo surrounding the portal venous vessels.
ultrasound, the middle hepatic vein serves as a landmark for the MLF, a valuable guide to the gallbladder. The appearance of the hepatic veins and IVC can give indirect evidence of fluid status and cardiac performance. The vessels may be engorged and especially prominent in the face of fluid over-load and/or elevated right heart pressures (Fig. 9.7). For ex-perienced sonographers, the hepatic veins can help localize pathology to specific lobes or segments.
Portal VeinsThe portal vein forms the most recognizable part of the por-tal triad and is usually an easy landmark to identify in the liver. For the emergency sonographer, it helps to identify the common bile duct and gallbladder. The portal venous sys-tem returns blood from the intestines to the liver. The main portal vein is formed by the union of the splenic, inferior, and superior mesenteric veins. The splenic vein can be seen in a transverse section of the midline abdominal vascula-ture, where it courses just anterior to the superior mesen-teric artery (Fig. 9.8; eFig. 9.2). In a plane transverse to the body, the long axis of the splenic vein is seen as a regular tubular structure that suddenly balloons out at the porto-splenic convergence, formed when the inferior mesenteric
IVC
A
B
FIGURE 9.7. The Appearance of the Inferior Vena Cava (IVC) (A) and Hepatic Veins (B). An engorged inferior vena cava (IVC) is seen in a patient with congestive heart failure. The hepatic veins are prominent (B).
FIGURE 9.8. Origin of the Portal Vein. In a transverse section through the midline abdominal vasculature, the splenic vein is seen in its long axis cross-ing anterior to the superior mesenteric artery (SMA). As it is joined by the inferior mesenteric artery (running perpendicular to this view, not imaged), the portal vein (PV) is formed. The portal vein (PV) then enters the hilum of the liver, just anterior to the inferior vena cava (IVC).
CBD
PV
IVC
FIGURE 9.9. The Portal Vein (PV ) Crosses Just Anterior to the Inferior Vena Cava (IVC ). It then travels toward the porta hepatis, where it forms the most visible landmark in the liver, the portal triad. The common bile duct (CBD ) lies just anterior to the portal vein (PV ).
劉政亨

138 Section iii / Evaluation of Abdominal Conditions
gastroduodenal artery follows the course of the C-loop of the duodenum and defines the head of the pancreas. The proper hepatic artery ascends toward the porta hepatis to join the portal vein in the portal triad (Fig. 9.12). Its value in ED ul-trasound is limited. For experienced sonographers it can be used to localize the pancreas (15).
Bile DuctsThe hepatocytes are drained by tiny biliary radicles that con-verge toward the porta hepatis. Eventually, they drain into the common hepatic duct. Just before the portal triad, the com-mon hepatic and cystic ducts join to form the common bile duct. Common bile duct stones and pancreatic head tumors can obstruct outflow from the common bile duct, resulting in an enlarged duct. A dilated common bile duct is the hallmark of obstructive jaundice.
Bile ducts follow the path of the portal venous system throughout the liver. In routine scans of the liver the periph-eral biliary radicles are typically not visualized unless they are enlarged. The larger common bile duct can be identified at the portal triad. If a transverse section is obtained through the portal triad, the common bile duct is seen just anterior to and to the right of the portal vein (Fig. 9.12). The diameter of the common bile duct is much smaller than the main por-tal vein, and is often almost imperceptible. When the por-tal vein is viewed in its long axis, the common duct can be seen to accompany it in its course toward the duodenum. It may be difficult to see if it is not enlarged, but it can be appreciated by the irregular beaded appearance it gives just anterior to the main portal vein (Fig. 9.10; eFigs. 9.3 and 9.4;
VIDEO 9 .1).
GallbladderThe gallbladder is a pear-shaped cystic structure that occu-pies the region between the right and the left lobes of the liver and typically lies on the inferior surface of the liver (Fig. 9.13). The normal gallbladder has the typical sono-graphic features of a cyst:
1. The lumen is an echo-free space, bounded by 2. Smooth regular walls, with 3. Posterior wall enhancement (more echogenic than sur-
rounding tissue), and 4. Increased “through-transmission.” (The region immedi-
ately behind a simple cyst appears more echogenic than surrounding tissue. This artifact is created as the sound waves hit the interface between liquid and solid media.)
When a longitudinal or long axis view of the gallbladder is obtained, it appears to be connected to the portal triad by a visible echogenic line, the MLF. The MLF runs between the gallbladder and the IVC. The MLF View is a convenient view that defines much of the relevant anatomy for examinations of the gallbladder (Figs. 9.14 and 9.15; eFigs. 9.5–9.7). In that one view, abnormalities of the gallbladder and common bile duct can be seen.
There are a number of congenital variants in gallbladders. Gallbladders may have folds, internal septums, and duplica-tions. It is important to explore the full dimensions of the gallbladder and cystic duct to avoid missing stones. Folds, twists, turns, and septums complicate imaging of the gall-bladder by creating shadows and artifacts that can mimic
Hepatic ArteryThe hepatic artery (usually) originates as a branch off the celiac trunk. The main hepatic artery branches into the gastroduodenal artery and the proper hepatic artery. The
FIGURE 9.10. A: In a long axis of the portal vein (PV), the common bile duct (CBD) is seen as an irregular beaded structure just anterior to the vein. B: Color Doppler can be used to verify that the cbd is not a vascular structure.
FIGURE 9.11. The Main Portal Vein Divides into Two Main Branches. Note the echogenic halo that surrounds the portal vessels, a characteristic that can be used to distinguish the portal veins (PV) from other structures.
A
B

chapter 9 / Right Upper Quadrant: Liver, Gallbladder, and Biliary Tree 139
Common bile duct
Hepatic artery
Gallbladder
Portal vein
Common bile duct
Hepatic artery
Portal vein
Gastroduodenalartery
Aorta
Celiac trunk
FIGURE 9.12. The Portal Triad. The hepatic artery, common bile duct (CBD), and the portal vein (PV) are seen together at the portal triad. The origin of the gastroduodenal artery is seen branching from the proper hepatic artery after its take-off from the celiac trunk. A short axis view of the portal triad has the appearance of a face with two ears, sometimes referred to as the “Mickey Mouse Sign” (see inset).
Gallbladder
Cystic duct
Common bile ductHepatic artery
Portal vein
Inferior vena cava
FIGURE 9.13. The Gallbladder and Portal Triad. The relative position of the gallbladder, portal vein (PV), hepatic artery, and common bile duct (CBD) is shown. (Redrawn from Simon B, Snoey E, eds. Ultrasound in Emergency and Ambulatory Medicine. St. Louis, MO: Mosby-Year Book; 1997.)
FIGURE 9.14. Normal Gallbladder. The gallbladder, main lobar fissure (MLF), and portal vein (PV) are seen. A tear-shaped gallbladder points toward the MLF and portal triad.
Gallbladder
MLF View
Hepatic arteryMLF
Portal triad
Portal vein
Common bile duct
FIGURE 9.15. The Gallbladder, Main Lobar Fissure (MLF), and Portal Triad are all Seen in this View.
劉政亨
劉政亨
劉政亨
劉政亨
劉政亨

140 Section iii / Evaluation of Abdominal Conditions
Standard Views of the Right Upper QuadrantA few specific views define most of the anatomy relevant for the focused bedside exam of the RUQ. A longitudinal cut through the long axis of the gallbladder should include a view of the MLF and portal triad (Figs. 9.14 and 9.15). A second view through the short axis of the gallbladder should be obtained. The emergency sonographer should acquire a minimum of two views perpendicular to each other for any organ of interest, then scan from side to side. This creates a three-dimensional view of the object in the mind’s eye.
Before completing the examination of the gallbladder, the portal triad should be examined. The portal vein, hepatic ar-tery, and common bile duct are all viewed in their transverse orientation in the portal triad, as shown in Figure 9.15. The normal portal triad looks something like Mickey Mouse, with the portal vein making up Mickey’s face, his ears formed anteriorly by the hepatic artery on the left and the common bile duct on the right (Fig. 9.12 inset). In the nor-mal portal triad, the “ears” are symmetrical. If they are not symmetrical, a more detailed exam should be done to mea-sure the common bile duct and trace its path back toward the duodenum looking for a source and site of obstruction. In order to better visualize the common bile duct, the sonogra-pher first identifies the portal vein in transverse orientation, then twists the probe to obtain a longitudinal view. When the portal vein is viewed in its long axis, the common bile duct should be seen just anterior to it. The normal common duct will be barely visible as it travels alongside the por-tal vein and sometimes has a beaded irregular appearance (Fig. 9.10). The normal common bile duct measures ,6 mm in cross-sectional diameter. Although the hepatic artery oc-cupies the portal triad, it ascends in a different plane than the portal vein and bile duct and tends to disappear when the long axis of the portal vein is viewed. Sometimes, the common duct can be seen to loop over the hepatic artery in its course toward the duodenum.
Although it is helpful to recognize the major structures of the liver described above, it is not necessary to identify each of them in every exam. The ability to recognize the normal hepatic architecture can help to improve the quality of the
stones. Small stones can hide in these regions as well. The sonographer will need to view each turn of the gallbladder in two dimensions to distinguish between shadows created by anatomical structures from those caused by stones (Figs. 9.16 and 9.17; VIDEO 9 .2).
Occasionally, the gallbladder may not be visualized. Agenesis of the gallbladder has been described, but is rare. Most likely, the scan is simply inadequate. Formal ultrasound protocols request a fasting state to minimize bowel gas and optimize gallbladder distention. The sonographer should recognize the limitations of bedside scans in the unprepped patient and be willing to declare the exam “indeterminate.”
Morison’s PouchThe interface between the liver and the right kidney can be visualized from a flank approach. This potential space, Mori-son’s pouch, is an area where free fluid may accumulate. A view of Morison’s pouch is useful when looking for free intra-abdominal fluid, either from ascites or intra-abdominal hemorrhage (Fig. 9.18).
FIGURE 9.16. This Normal Gallbladder Takes a Sharp Turn as it Emp-ties into the Cystic Duct. Such curves and twists can create shadows, as well as serve as sites where stones can become lodged.
FIGURE 9.17. Normal Gallbladders can have Septums and Unsuspect-ing Twists. Stones can hide easily in tortuous gallbladders. Failure to visualize the entire gallbladder is a potential source of false-negative scans. (Courtesy of Mark Deutchman, MD.)
FIGURE 9.18. Morison’s Pouch. This potential space is a common site for free fluid to collect.

chapter 9 / Right Upper Quadrant: Liver, Gallbladder, and Biliary Tree 141
wall with heavy shadow; this “WES” (Wall-Echo-Shadow) phenomenon is well described for gallbladders filled with stones (Fig. 9.26; VIDEO 9 .8) (16,18,22). A second possi-bility when heavy shadows come from the gallbladder fossa is a calcified, or porcelain gallbladder. Calcified gallbladders are associated with gallbladder cancer and require additional imaging and referral (23). The inexperienced scanner should beware when considering these possibilities. Bowel gas from the duodenum and adjacent colon can also create shadow-ing near the gallbladder fossa (Fig. 9.27). Distinguishing be-tween these entities may be difficult. In general, shadowing from intrinsic gallbladder disease persists when viewed in different orientations and with changes in patient position-ing, unlike shadowing from artifact, which disappears or changes with orientation.
The sonographer may encounter echogenic structures within the gallbladder that do not meet the usual character-istics of stones. Gallbladder polyps are regular-appearing structures that may adhere to the gallbladder wall. They are less echogenic than stones, immobile, and are sometimes
study. Sonographers who are familiar with the anatomy of the liver, biliary tract, and abdominal vasculature will likely be less distracted or confused by anatomical details, able to recognize subtle variations from normal, and better able to complete definitive exams in a timely manner.
PATHOLOGYCholelithiasisThe most common ED application for a scan of the RUQ is for detection of gallstones in patients suspected of having bil-iary colic or cholecystitis. Gallstones have four sonographic features (11,16).
1. They are echogenic structures within the usual echo-free gallbladder lumen. Most are round, curvilinear, or multifaceted in shape. They range in shape from just a few millimeters to over a centimeter in size.
2. They create acoustic shadows. The typical gallstone shadow is described as “clean,” meaning black with well-defined, discrete margins. Since the usual space behind the gallbladder has enhanced echogenicity, the shadow created by a stone is pronounced. In contrast, shadows created by artifact and bowel gas are described as “dirty,” meaning they are grayish and poorly delin-eated. Bowel gas, in particular, scatters the ultrasound beam, creating a snowstorm of grayish artifact with poorly defined margins. Classically, stones were be-lieved to create shadows because they contain calcium. In fact, the shadow created by a stone is more dependent upon the size of the stone than on its mineral content. Very small (1 to 3 mm) stones may not create shadows and are one source of false-negative scans (17).
3. They are dependent. They seek the most dependent portion of the gallbladder. Cholesterol stones are an ex-ception; they are known to float (17).
4. They are typically mobile and move with changes in body position. Some stones may be embedded and fail to move; if they have the other three characteristics of stones, failure to move suggests chronic inflammation or impaction. An important caveat is that a stone impacted in the neck of the gallbladder may not move.
Gallstones may be single or multiple; they have a variety of sizes and shapes and may lodge in a variety of positions within the gallbladder (Figs. 9.19–9.22; eFigs. 9.8–9.10;
VIDEOS 9 .3–9 .6).The lumen of the gallbladder may contain lithogenic
bile, known as “sludge” (Figs. 9.23–9.25; VIDEO 9 .7). Sludge has low-level echogenicity (it appears less “white” than stones), tends to layer out in the dependent portion of the gallbladder with a flat fluid:fluid interface, and fails to shadow. It is viscous and moves slowly with changes in po-sition (18). When it coexists with small stones, it may pro-duce a gray shadow. The clinical relevance depends upon the patient’s clinical signs and symptoms, associated stones, and secondary abnormalities of the gallbladder wall (11,16, 18–21). Nonetheless, biliary sludge is not a normal finding and typically connotes a diseased gallbladder.
In some cases, heavy shadowing may obscure details of the gallbladder fossa. This may occur when the gallbladder is packed with stones, or when a contracted gallbladder encom-passes a stone. Closer examination may reveal a gallbladder
FIGURE 9.19. A Single Gallstone is Seen with a Sharp Echogenic Interface and a “Clean” Well-Defined Shadow.
FIGURE 9.20. A Single Gallstone is Seen in this Gallbladder.
劉政亨

142 Section iii / Evaluation of Abdominal Conditions
FIGURE 9.22. Impacted Stones. It is not unusual for stones to move to the most dependent part of the gallbladder where they may become impacted (A). Failure to visualize the neck of the gallbladder is a common cause of missing gallstones in otherwise normal appearing gallbladders (B).
A B
FIGURE 9.21. A: Multiple gallstones tend to clump together and create a broad shadow. B: They move with repositioning of the patient. When sepa-rated, individual stones have narrow shadows. C: Stones should be visualized in both long and short axis of gallbladder.C
AB

chapter 9 / Right Upper Quadrant: Liver, Gallbladder, and Biliary Tree 143
found on nondependent areas of the gallbladder. Although rare, irregular thickening or luminal masses may be the only sign of gallbladder cancers. If there is any suspicion of tumor, additional imaging is necessary.
FIGURE 9.24. Sludge. The usual anechoic lumen of this gallbladder is replaced with gray material typical of sludge.
A
FIGURE 9.23. Stones and Sludge. The gray fluid level in this gallbladder is sludge accompanied by small stones, seen in longitudinal (A) and trans-verse (B) views.
B
A
FIGURE 9.25. A: Thick lithogenic bile (sludge) layers out in this gallbladder. B: Sludge should be mobile. It may or may not shadow.
B
FIGURE 9.26. Gallbladder Fossa Obscured by Shadow. Sometimes the gallbladder may be difficult to see when obscured by shadowing from large stones. The Wall-Echo-Shadow (WES) phenomenon is seen.

144 Section iii / Evaluation of Abdominal Conditions
be detected that are of no clinical significance in the asymp-tomatic patient. When there is a history of postprandial pain, the diagnosis of biliary colic is supported by the presence of stones in an otherwise normal gallbladder. In the acutely ill patient with active pain and tenderness, the sonographic diagnosis of acute cholecystitis is based on the presence of stones or sludge with any of the following (16,18,21,24,25):
1. Sonographic Murphy’s sign 2. Gallbladder distension 3. Gallbladder wall thickening 4. Intramural gallbladder wall edema 5. Pericholecystic fluid 6. Intraluminal material 7. Increased flow with color Doppler
The likelihood of acute cholecystitis increases with each positive finding (26).
Sonographic Murphy’s signThe “sonographic Murphy’s sign” is a variation of the clas-sical “Murphy’s sign” detected during the physical exam. It is elicited by localizing the gallbladder with the ultrasound transducer and then attempting to find the point of maximal tenderness. If the point of maximal tenderness corresponds to the area overlying the gallbladder, a sonographic Murphy’s sign is noted (27). The literature reports a wide variation in the sensitivity and specificity of the Murphy’s sign in cho-lecystitis, although in the hands of emergency physicians, it can be a valuable aid (5,27). The sonographic Murphy’s sign is thought to be a reliable indicator for a diseased gallblad-der, but there are reports of false-negative Murphy’s signs in cases of gangrenous cholecystitis attributed to possible denervation of the gallbladder wall (28). However, in those cases the patients were ill enough to have a high pretest prob-ability of disease and other abnormalities on the imaging.
Gallbladder distensionGallbladders come in assorted shapes and sizes, and no single criterion exists for defining the normal dimensions. A width of 4 cm or more is described in most cases of acute cho-lecystitis in a classical sonographic-pathologic study (29). A “distended” gallbladder tends to have convex walls and subjectively appears full (Fig. 9.28; VIDEO 9 .9) (30). Since cholecystitis occurs because of obstruction, a relaxed or nondistended gallbladder argues against cholecystitis. A distended gallbladder is suspicious for an obstructing stone and warrants a careful search down through the neck of the gallbladder and cystic duct.
Gallbladder wall edemaThe normal gallbladder wall is defined as ,3 mm wide. When it is distended, the gallbladder has a smooth, regu-lar, thin wall. However, once the gallbladder contracts af-ter a meal, the wall can be seen to be composed of three distinct layers that can exceed the “normal” thickness. The appearance of the gallbladder wall at any particular time is influenced by many factors, both local and systemic. The wall can be thickened in a variety of pathological conditions, including hypoalbuminemia, hepatitis, portal hypertension, congestive heart failure, and pancreatitis, as well as in the normal postprandial state (Figs. 9.29 and 9.30; eFig. 9.11) (16,18,25,31,32). In the face of biliary tract disease, the wall may be thickened by edema and hemorrhage (as in acute cholecystitis) or muscular hypertrophy and fibrosis (as in
FIGURE 9.27. Artifact versus Stones. Bowel gas can distort and create an image similar to shadowing from stones, sometimes referred to as “dirty” shadows (A). In contrast, shadowing intrinsic to the gallbladder from small stones (B) persists when the gallbladder is viewed in different orientations.
A
B
Cholecystitis: Acute, Chronic, and AcalculousThere is a broad spectrum of gallstone-related disease, as well as a wide range of clinical presentations and sonographic findings. Gallstones may persist in asymptomatic patients for many years without apparent harm. Some patients with gallstones describe brief postprandial pain secondary to un-complicated biliary colic. In others, the chronic presence of stones may set off an inflammatory process leading to hyper-trophy of the muscular layer of the wall and fibrosis of the subserosa (24). These patients may have recurrent episodes of pain secondary to chronic cholecystitis. Once the gallblad-der becomes obstructed, the severe inflammatory process characterizing acute cholecystitis is set up as the gallbladder becomes distended and the intraluminal pressure rises. The inflammation results in edema and inflammatory cells ac-cumulating in and around the gallbladder wall. In the most severe cases, the mucosa may slough or the wall may become necrotic and perforate (24). These patients commonly present with fever, leukocytosis, and intractable pain and vomiting.
Ultrasound demonstrates a range of findings that paral-lels this spectrum of disease. Occasionally, gallstones may
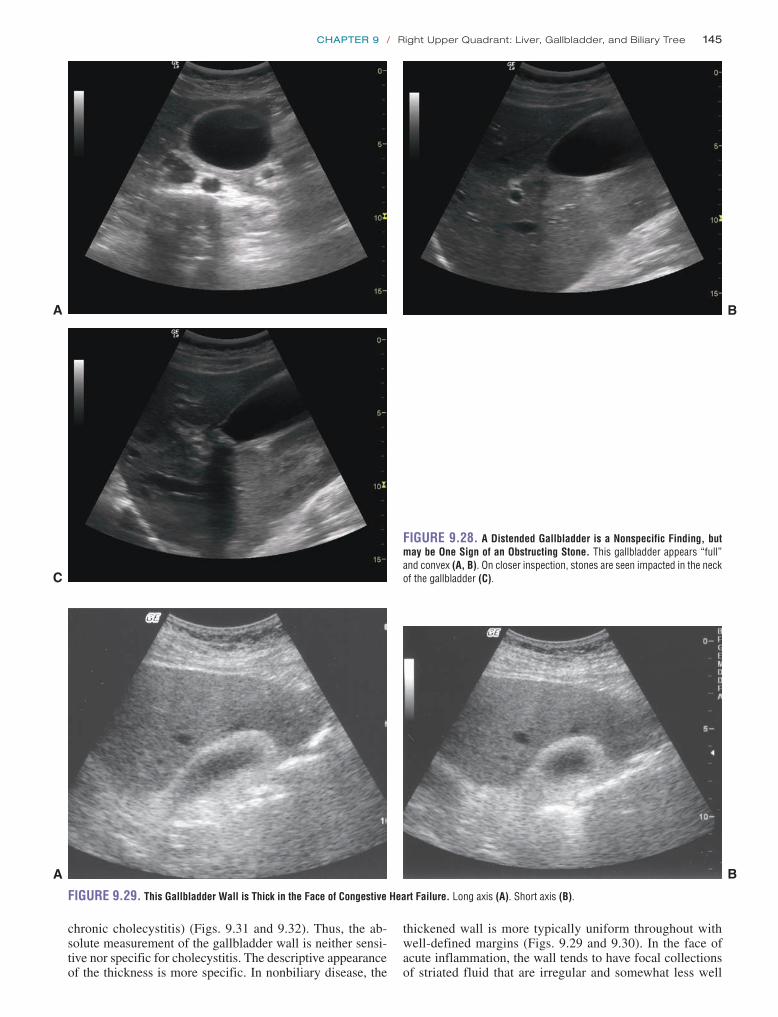
chapter 9 / Right Upper Quadrant: Liver, Gallbladder, and Biliary Tree 145
chronic cholecystitis) (Figs. 9.31 and 9.32). Thus, the ab-solute measurement of the gallbladder wall is neither sensi-tive nor specific for cholecystitis. The descriptive appearance of the thickness is more specific. In nonbiliary disease, the
thickened wall is more typically uniform throughout with well-defined margins (Figs. 9.29 and 9.30). In the face of acute inflammation, the wall tends to have focal collections of striated fluid that are irregular and somewhat less well
A B
FIGURE 9.28. A Distended Gallbladder is a Nonspecific Finding, but may be One Sign of an Obstructing Stone. This gallbladder appears “full” and convex (A, B). On closer inspection, stones are seen impacted in the neck of the gallbladder (C).C
A
FIGURE 9.29. This Gallbladder Wall is Thick in the Face of Congestive Heart Failure. Long axis (A). Short axis (B).
B

146 Section iii / Evaluation of Abdominal Conditions
defined (Fig. 9.33) (18). In early cholecystitis, the develop-ment of gallbladder thickening and edema may be delayed; the absence of wall edema should not dissuade the clinician from considering the diagnosis of acute cholecystitis (33). Although the presence of gallbladder thickening and wall edema is considered an important finding consistent with cholecystitis, sonographers should cautiously interpret their findings and correlate the sonographic findings with the clinical setting.
Pericholecystic fluidAs the inflammation progresses, fluid may accumulate out-side the gallbladder (Figs. 9.34 and 9.35; VIDEOS 9 .10 and 9 .11). If this pericholecystic fluid is loculated or focal, it may mark the beginning of an abscess or a perforation (Fig. 9.36). In advanced cases, the gallbladder wall may ap-pear disrupted, surrounded by complex pericholecystic fluid, consistent with a perforation or fistula formation (Fig. 9.37;
VIDEO 9 .12). The sonographic appearance of the dis-rupted wall has been described as the “sonographic hole sign” (Fig. 9.38) (34,35).
Mucosal sloughingIn severe cases, the ischemic mucosal surface of the gallblad-der may ulcerate and slough, sometimes leaving debris that can be seen to float in the gallbladder lumen (Figs. 9.38). This typically represents advanced disease.
Increased vascularityAs with any inflammatory state, the inflamed gallbladder may be hypervascular. Power Doppler may demonstrate this increased vascularity.
Typical findings in acute cholecystitis are seen in Figures 9.33–9.38 and VIDEOS 9 .10–9 .12. The most basic and practical criteria applied for the diagnosis of acute cholecystitis is the presence of stones in the face of a positive sonographic Murphy’s sign. In the proper clinical setting, particularly in emergency medicine, this straightfor-ward approach may be appropriate. The variety of secondary sonographic findings for acute cholecystitis described above have a wide range of sensitivity and specificity, probably
Ascites
Liver
Gallbladder
FIGURE 9.30. This Thick Gallbladder Wall Occurs in a Patient with Hema-chromatosis, Hepatitis, and Ascites. The diseased liver is more echogenic than normal. Ascites is present. The gallbladder wall is thickened; however there is no intrinsic gallbladder disease.
FIGURE 9.31. This Patient has a Thickened Gallbladder Wall from Chronic Cholecystitis.
FIGURE 9.32. Thickened Gallbladder Wall in Patient with Gallstones.
FIGURE 9.33. An Inflamed Gallbladder Tends to have Irregular, Striated Pockets of Fluid in the Wall.

chapter 9 / Right Upper Quadrant: Liver, Gallbladder, and Biliary Tree 147
ill patients with biliary stasis. This is most likely to occur in hospitalized patients in critical care units.
Gallstones may make their way into the common bile duct and lodge at the ampulla of Vater. They can contribute to a clinical picture of cholangitis and pancreatitis.
JaundiceOne of the first steps in evaluating the patient with jaundice is distinguishing between obstructive and nonobstructive causes. This distinction frequently determines the need for specialty consultation and intervention and may dictate the pace at which the diagnostic workup and treatment should proceed. For the emergency physician it may determine the need for admission and the urgency of further treatment. The ability to make this determination at the bedside can avoid unnecessary tests in some and facilitate appropriate aggres-sive care in others. Although this distinction has traditionally relied on historical and laboratory criteria, the clinical distinc-tion often requires imaging. RUQ pain, fever, and jaundice can be a sign of viral hepatitis (a condition that can often be
FIGURE 9.34. Acute Cholecystitis. This gallbladder has multiple stones, a thickened wall, and pericholecystic fluid.
A
B
FIGURE 9.36. This Gallbladder has a Pocket of Free Fluid Around the Fundus, Suspicious for Perforation and Early Abscess Formation.
FIGURE 9.37. Gangrenous Gallbladder.
FIGURE 9.35. Pericholecystic Fluid in Acute Cholecystitis.
reflecting the variety of clinical, laboratory, imaging, and pathology criteria used in the literature to define acute cholecystitis.
Occasionally the signs, symptoms, and sonographic find-ings of acute cholecystitis occur in the absence of stones. Acalculous cholecystitis is described, although it is less com-mon than calculous disease and typically occurs in seriously

148 Section iii / Evaluation of Abdominal Conditions
managed as an outpatient) or a presenting picture of chol-angitis in obstructive jaundice (a condition requiring more aggressive intervention).
Ultrasound is a quick and noninvasive means to detect bili-ary obstruction (36,37). The normal common bile duct is easi-est to identify at the portal triad. The normal common bile duct is ,6 mm in diameter when measured adjacent to the right or main portal vein. As the common bile duct dilates, it gives the usual Mickey Mouse view of the portal triad the appear-ance of a swollen right ear (Fig. 9.39). When the portal vein and common bile duct are viewed in their long axis coursing toward the midline, the abnormal common bile duct becomes more prominent. When the common bile duct approximates or exceeds the diameter of the portal vein, the two vessels look like two parallel structures that resemble a “double barrel shotgun” (Figs. 9.40 and 9.41; VIDEO 9 .13) (38). As the obstruction persists and the peripheral biliary radicles dilate, they emanate outward from the portal triad like spokes of a wheel in a stellate pattern (Figs. 9.42 and 9.43) (39). Normally these peripheral biliary radicles are not visible by ultrasound (31). When they are seen, they are pathological. The formal rule of thumb is that any biliary radicle .40% of the diameter of its adjacent portal vein is pathological (32). As peripheral bile ducts enlarge, they can be seen along with the branches of the portal veins; this gives the appearance of “parallel chan-nels” of branching vessels in the parenchyma (Figs. 9.42 and 9.43) (32). When biliary obstruction is noted, the gallbladder
CBD HA
PV
FIGURE 9.39. Dilated Common Bile Duct Seen in Transverse Orienta-tion at the Portal Triad. This appearance has been described as a “Mickey Mouse face” with a swollen right ear (the dilated cbd).
FIGURE 9.40. A: A dilated common bile duct (CBD) travels parallel to the portal vein, giving rise to the appearance of a “double barrel shotgun.” B: Color Doppler of the same patient demonstrating lack of flow in the common bile duct (CBD) relative to the portal vein.
A
B
FIGURE 9.38. Acute Cholecystitis. Marked changes consistent with acute cholecystitis are seen with an irregular thickened gallbladder wall, intramural edema, and stones (B). The mucosal surface appears ulcerated. In (B), a “sonographic hole sign” suggests perforation.
Hole Sign
A
B
劉政亨
劉政亨
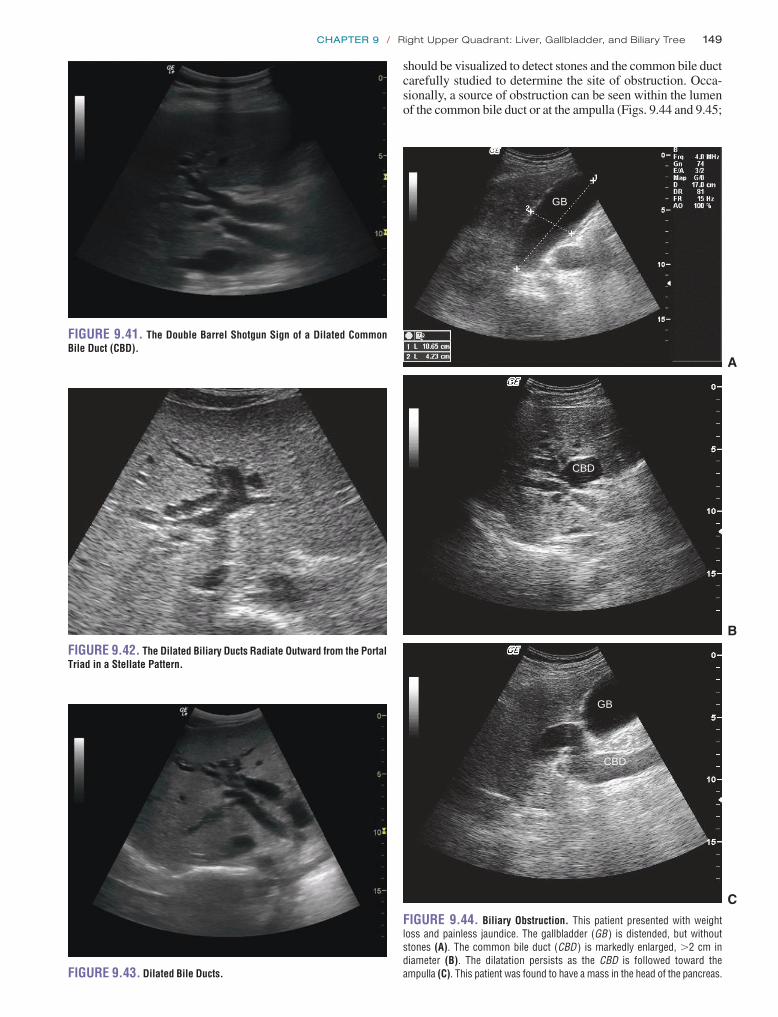
chapter 9 / Right Upper Quadrant: Liver, Gallbladder, and Biliary Tree 149
should be visualized to detect stones and the common bile duct carefully studied to determine the site of obstruction. Occa-sionally, a source of obstruction can be seen within the lumen of the common bile duct or at the ampulla (Figs. 9.44 and 9.45;
FIGURE 9.41. The Double Barrel Shotgun Sign of a Dilated Common Bile Duct (CBD).
FIGURE 9.42. The Dilated Biliary Ducts Radiate Outward from the Portal Triad in a Stellate Pattern.
FIGURE 9.43. Dilated Bile Ducts.
GB
CBD
GB
CBD
FIGURE 9.44. Biliary Obstruction. This patient presented with weight loss and painless jaundice. The gallbladder (GB ) is distended, but without stones (A). The common bile duct (CBD ) is markedly enlarged, .2 cm in diameter (B). The dilatation persists as the CBD is followed toward the ampulla (C). This patient was found to have a mass in the head of the pancreas.
A
B
C

150 Section iii / Evaluation of Abdominal Conditions
FIGURE 9.47. Loops of Bowel are Seen Surrounded by Ascitic Fluid.
A
B
FIGURE 9.45. A, B: This gallbladder is seen to have stones impacted deep in the neck of the gallbladder into the cystic duct. C: On closer inspection, a stone is seen within the common bile duct (CBD).
C
FIGURE 9.46. Ascites Seen Surrounding a Cirrhotic Liver.
VIDEOS 9 .14 and 9 .15) (32,36,40). If a source of obstruc-tion is not seen, additional imaging is necessary to find the source.
AscitesPatients may present with abdominal distension and sus-pected ascites. When the physical findings are indefinite,
particularly in mild to moderate ascites, ultrasound can clarify if free fluid is present within the peritoneal cavity. A view of Morison’s pouch, the flanks, or the pelvis is ad-equate to view ascites (Figs. 9.46 and 9.47; VIDEO 9 .16). If necessary, ultrasound can help guide paracentesis for diagnosis and treatment of ascites and suspected spontaneous bacterial peritonitis. (See Chapter 13 for ultrasound-guided paracentesis.)
Other PathologyThe occasional scan may encounter unsuspected findings. Changes in the usual character and organization of the he-patic parenchyma may occur with hepatitis. The architecture may be disrupted by liver masses. The recognition of hepati-tis, cirrhosis, portal hypertension, and liver masses is gener-ally beyond the scope of emergency physician– performed ultrasound. However, emergency sonographers will likely encounter these conditions and should recognize them as variations from normal (Figs. 9.48–9.51). Once they are de-tected, the physician should pursue additional imaging and appropriate follow-up.

chapter 9 / Right Upper Quadrant: Liver, Gallbladder, and Biliary Tree 151
ARTIFACTS AND PITFALLSA variety of sources of artifacts is common in imaging gallbladders.
Side Lobe ArtifactSound waves travel in straight lines. When cysts with rounded edges (like the gallbladder) are imaged, an acoustically silent space is created around the curvature of the structure. This space creates a shadow simply because the sound waves never get there to generate a signal. Side lobe artifact should be recognized and not confused with shadowing from stones.
ShadowingA variety of shadows are generated by surrounding structures in the RUQ. When the intercostal approach is used to visual-ize the liver and gallbladder, the ribs create a dark shadow that traverses the entire image. Their shadows usually have a clear origin from the rib that is outside the margin of the gall-bladder. Their appearance is typical of calcified structures, with an echogenic proximal surface and sharply marginated distal shadows as well.
Bowel gas commonly interferes with images of the gall-bladder. When the gallbladder is viewed in its long axis, the medial margin lies in close proximity to the duodenum and colon. The scatter of bowel gas may produce shadows that create an appearance of stones (Fig. 9.27). The sonographer can evaluate the source of shadow by changing the orienta-tion of the transducer and patient position. A shadow intrin-sic to the gallbladder will remain; shadows created by other objects will change or disappear. If bowel loops are fluid-filled, they can create the appearance of a cystic mass that can be mistaken for the gallbladder. By scanning through the entire gallbladder and objects of interest, this common mistake can be avoided (Fig. 9.52; VIDEO 9 .17).
Occasionally, shadows will appear if the gallbladder or cystic duct is tortuous. This may represent side lobe artifact, but could arise from a small impacted stone. The best way to distinguish artifact from stone is to trace the structure dis-tally, elongating each segment of the gallbladder neck or cys-tic duct by rotating the ultrasound transducer. Artifacts will disappear, while stones persist or become more apparent.
FIGURE 9.48. Liver Mass. Hyperechoic liver masses are noted, most consistent with a neoplasm.
FIGURE 9.49. Liver Mass Seen in a Patient with Gastric Cancer.
FIGURE 9.50. A Simple but Large Cyst is Noted in the Liver.
FIGURE 9.51. Renal Cancer. A large renal neoplasm is seen invading the liver.
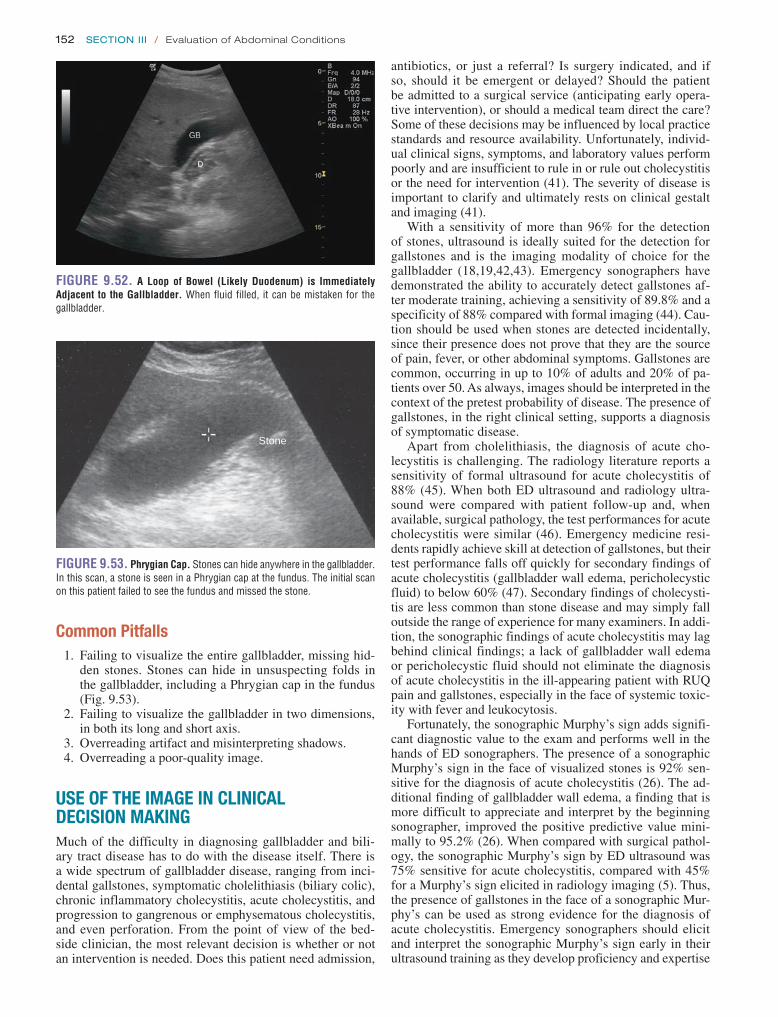
152 Section iii / Evaluation of Abdominal Conditions
antibiotics, or just a referral? Is surgery indicated, and if so, should it be emergent or delayed? Should the patient be admitted to a surgical service (anticipating early opera-tive intervention), or should a medical team direct the care? Some of these decisions may be influenced by local practice standards and resource availability. Unfortunately, individ-ual clinical signs, symptoms, and laboratory values perform poorly and are insufficient to rule in or rule out cholecystitis or the need for intervention (41). The severity of disease is important to clarify and ultimately rests on clinical gestalt and imaging (41).
With a sensitivity of more than 96% for the detection of stones, ultrasound is ideally suited for the detection for gallstones and is the imaging modality of choice for the gallbladder (18,19,42,43). Emergency sonographers have demonstrated the ability to accurately detect gallstones af-ter moderate training, achieving a sensitivity of 89.8% and a specificity of 88% compared with formal imaging (44). Cau-tion should be used when stones are detected incidentally, since their presence does not prove that they are the source of pain, fever, or other abdominal symptoms. Gallstones are common, occurring in up to 10% of adults and 20% of pa-tients over 50. As always, images should be interpreted in the context of the pretest probability of disease. The presence of gallstones, in the right clinical setting, supports a diagnosis of symptomatic disease.
Apart from cholelithiasis, the diagnosis of acute cho-lecystitis is challenging. The radiology literature reports a sensitivity of formal ultrasound for acute cholecystitis of 88% (45). When both ED ultrasound and radiology ultra-sound were compared with patient follow-up and, when available, surgical pathology, the test performances for acute cholecystitis were similar (46). Emergency medicine resi-dents rapidly achieve skill at detection of gallstones, but their test performance falls off quickly for secondary findings of acute cholecystitis (gallbladder wall edema, pericholecystic fluid) to below 60% (47). Secondary findings of cholecysti-tis are less common than stone disease and may simply fall outside the range of experience for many examiners. In addi-tion, the sonographic findings of acute cholecystitis may lag behind clinical findings; a lack of gallbladder wall edema or pericholecystic fluid should not eliminate the diagnosis of acute cholecystitis in the ill-appearing patient with RUQ pain and gallstones, especially in the face of systemic toxic-ity with fever and leukocytosis.
Fortunately, the sonographic Murphy’s sign adds signifi-cant diagnostic value to the exam and performs well in the hands of ED sonographers. The presence of a sonographic Murphy’s sign in the face of visualized stones is 92% sen-sitive for the diagnosis of acute cholecystitis (26). The ad-ditional finding of gallbladder wall edema, a finding that is more difficult to appreciate and interpret by the beginning sonographer, improved the positive predictive value mini-mally to 95.2% (26). When compared with surgical pathol-ogy, the sonographic Murphy’s sign by ED ultrasound was 75% sensitive for acute cholecystitis, compared with 45% for a Murphy’s sign elicited in radiology imaging (5). Thus, the presence of gallstones in the face of a sonographic Mur-phy’s can be used as strong evidence for the diagnosis of acute cholecystitis. Emergency sonographers should elicit and interpret the sonographic Murphy’s sign early in their ultrasound training as they develop proficiency and expertise
Common Pitfalls 1. Failing to visualize the entire gallbladder, missing hid-
den stones. Stones can hide in unsuspecting folds in the gallbladder, including a Phrygian cap in the fundus (Fig. 9.53).
2. Failing to visualize the gallbladder in two dimensions, in both its long and short axis.
3. Overreading artifact and misinterpreting shadows. 4. Overreading a poor-quality image.
USE OF THE IMAGE IN CLINICAL DECISION MAKINGMuch of the difficulty in diagnosing gallbladder and bili-ary tract disease has to do with the disease itself. There is a wide spectrum of gallbladder disease, ranging from inci-dental gallstones, symptomatic cholelithiasis (biliary colic), chronic inflammatory cholecystitis, acute cholecystitis, and progression to gangrenous or emphysematous cholecystitis, and even perforation. From the point of view of the bed-side clinician, the most relevant decision is whether or not an intervention is needed. Does this patient need admission,
FIGURE 9.52. A Loop of Bowel (Likely Duodenum) is Immediately Adjacent to the Gallbladder. When fluid filled, it can be mistaken for the gallbladder.
Stone
FIGURE 9.53. Phrygian Cap. Stones can hide anywhere in the gallbladder. In this scan, a stone is seen in a Phrygian cap at the fundus. The initial scan on this patient failed to see the fundus and missed the stone.

chapter 9 / Right Upper Quadrant: Liver, Gallbladder, and Biliary Tree 153
availability of bedside ultrasound in the diagnosis of gall-bladder and biliary tract disease.
INCIDENTAL FINDINGSRUQ ultrasound is useful to detect gallbladder and biliary disease. However, in the absence of liver or biliary tract dis-ease, it may reveal unsuspected pathology and suggest an alternative diagnosis in a significant number of cases. In one report, ultrasound done for RUQ pain identified an al-ternative nonbiliary source of pain in 21% of cases (50). In the authors’ experience alone, RUQ scans have picked up unexpected diagnoses in adjacent areas, including pleural effusion, empyema, liver masses, hepatic abscess, renal cell cancer, infected renal cyst, hydronephrosis, aortic dissection, pancreatic mass, and pancreatic pseudocyst. Once bedside ultrasound is widely used in daily practice, the sonogram can be a useful tool that greatly improves bedside diagnosis of a variety of conditions.
CLINICAL CASEA 55-year-old woman presented with painless jaundice. She denied a history of abdominal pain, weight loss, fever, or other systemic illness. On exam, she was a well-appearing but icteric woman. Her vital signs, including her tempera-ture, were normal. She had mild RUQ tenderness, but no guarding or rebound. Her bedside ultrasound is shown in Figure 9.54. The scans demonstrate a distended gallbladder with a thickened wall, the absence of gallstones, a dilated common bile duct, and several echogenic focal areas within her liver that produced shadows. A CT scan confirmed an ob-structed common bile duct with a single large multilaminated gallstone impacted at the ampulla of Vater. The liver lesions noted by ultrasound were found to be due to “milk of bile reflux” secondary to chronic obstruction. She was admitted for surgical management.
in detecting the more advanced secondary findings of acute cholecystitis.
Bedside ED ultrasound can facilitate the decision making of patients with suspected gallbladder disease. If the patient has pain consistent with biliary colic and symptoms have re-solved, a bedside ultrasound for cholelithiasis is sufficient to refer for care as an outpatient (44). A negative ED ultrasound accurately predicts patients who will not require intervention (admission or surgery) within 2 weeks of their visit (46,48). The use of ED ultrasound improves the quality of care for patients by decreasing the time to the first diagnosis of cho-lelithiasis, potentially avoiding the need for repeat visits and progression to more serious illness, and providing early re-ferral and treatment for symptoms (7).
CORRELATION WITH OTHER IMAGING MODALITIESUltrasound is the imaging modality of choice for the detec-tion of gallstones and the diagnosis of acute cholecystitis. It is rapid, noninvasive, and generally well tolerated. Computed tomography (CT) is a valuable adjunct in the assessment of abdominal pain, but has a variable sensitivity for cholelithia-sis (25% to 88%) (30,49). A bedside ultrasound can be used to screen for gallbladder, biliary, or renal disease. In cases of biliary colic, cholecystitis, cholangitis, and perhaps renal colic, the sonogram may be sufficient to reach diagnosis and treatment endpoints. When findings are inconclusive, or con-cern exists for other diagnostic possibilities, CT can be added as a second study.
Cholescintigraphy is still considered the gold standard for the diagnosis of acute cholecystitis. However, it is not practical as a screening test. The study requires several hours to complete and is not typically available around the clock. As such, it typically plays a complementary role once a pre-sumptive diagnosis of acute cholecystitis is strongly consid-ered but clinical uncertainty remains. There is no alternative imaging choice that competes with the sensitivity, ease, and
FIGURE 9.54. Painless Jaundice. In (A), note a thickened, septated gallbladder. In (B), a dilated common bile duct is seen adjacent to the portal vein.
GB
A
CBD
PV
B

154 Section iii / Evaluation of Abdominal Conditions
REFERENCES 1. Gaspari RJ, Dickman E, Blehar D. Learning curve of bedside ultrasound
of the gallbladder. J Emerg Med. 2009;37(1):51–56. 2. Jang T, Aubin C, Naunheim R. Minimum training for right up-
per quadrant ultrasonography. Am J Emerg Med. 2004;22(6): 439–443.
3. Rosen CL, Brown DF, Chang Y, et al. Ultrasonography by emergency physicians in patients with suspected cholecystitis. Am J Emerg Med. 2001;19:32–36.
4. Schlager D, Lazzareschi G, Whitten D, et al. A prospective study of ultrasonography in the ED by emergency physicians. Am J Emerg Med. 1994;12:185–189.
5. Kendall JL, Shimp RJ. Performance and interpretation of focused right upper quadrant ultrasound by emergency physicians. J Emerg Med. 2001;21:7–13.
6. Jehle D, Davis E, Evans T, et al. Emergency department sonography by emergency physicians. Am J Emerg Med. 1989;7:605–611.
7. Durston W, Carl ML, Guerra W, et al. Comparison of quality and cost-effectiveness in the evaluation of symptomatic cholelithiasis with differ-ent approaches to ultrasound availability in the ED. Am J Emerg Med. 2001;19(4):260–269.
8. Blaivas M, Harwood RA, Lambert MJ. Decreasing length of stay with emergency ultrasound examination of the gallbladder. Acad Emerg Med. 1999;6:1020–1023.
9. Durston W, Carl ML, Guerra W. Patient satisfaction and diagnostic ac-curacy with ultrasound by emergency physicians. Am J Emerg Med. 1999;17:642–646.
10. Akhtar S, Theodoro D, Gaspari R, et al. Resident training in emer-gency ultrasound: consensus recommendations from the 2008 Council of Emergency Medicine Residency Directors Conference. Acad Emerg Med. 2009;16:S32–S36.
11. Romano WM, Platt JF. Ultrasound of the abdomen. Crit Care Clin. 1994;10:297–319.
12. Hough DM, Glazebrook KN, Paulson EK, et al. Value of prone position-ing in the ultrasonographic diagnosis of gallstones: prospective study. J Ultrasound Med. 2000;19:633–638.
13. Marks WM, Filly RA, Callen PW. Ultrasonic anatomy of the liver: a review with new applications. J Clin Ultrasound. 1979;7:137–146.
14. Filly RA, Laing FC. Anatomic variation of portal venous anatomy in the porta hepatis: ultrasonographic evaluation. J Clin Ultrasound. 1978;6:83–89.
15. Ralls PW, Quinn MF, Rogers W, et al. Sonographic anatomy of the hepatic artery. AJR Am J Roentgenol. 1981;136:1059–1063.
16. Zeman RK, Garra BS. Gallbladder imaging. The state of the art. Gastro-enterol Clin North Am. 1991;2:127–156.
17. Good LI, Edell SL, Soloway RD, et al. Ultrasonic properties of gall-stones. Effect of stone size and composition. Gastroenterology. 1979;77:258–263.
18. Gore RM, Yaghmai V, Newmark GM, et al. Imaging benign and malignant disease of the gallbladder. Radiol Clin North Am. 2002;40:1307–1323.
19. Johnston DE, Kaplan MM. Pathogenesis and treatment of gallstones. N Engl J Med. 1993;328:412–421.
20. Angelico M, De Santis A, Capocaccia L. Biliary sludge: a critical up-date. J Clin Gastroenterol. 1990;12:656–662.
21. Laing FC. Ultrasonography of the acute abdomen. Radiol Clin North Am. 1992;30:389–404.
22. Rybicki FJ. The WES sign. Radiology. 2000;214:881–882. 23. Kane RA, Jacobs R, Katz J, et al. Porcelain gallbladder: ultrasound and
CT appearance. Radiology. 1984;152:137–141. 24. Lim JH, Ko YT, Kim SY. Ultrasound changes of the gallbladder wall
in cholecystitis: a sonographic-pathological correlation. Clin Radiol. 1987;38:389–393.
25. Burrell MI, Zeman RK, Simeone JF, et al. The biliary tract: imaging for the 1990s. AJR Am J Roentgenol. 1991;157:223–233.
26. Ralls PW, Colletti PM, Lapin SA, et al. Real-time sonography in sus-pected acute cholecystitis. Prospective evaluation of primary and sec-ondary signs. Radiology. 1985;155:767–771.
27. Bree RL. Further observations on the usefulness of the sonographic Murphy sign in the evaluation of suspected acute cholecystitis. J Clin Ultrasound. 1995;23:169–172.
28. Simeone JF, Brink IA, Mueller PR, et al. The sonographic diagnosis of acute gangrenous cholecystitis: importance of the Murphy sigh. AJR Am J Roentgenol. 1989;152:289–90.
29. Raghavendra BN, Feiner HD, Subramanyam BR, et al. Acute cho-lecystitis: sonographic-pathologic analysis. AJR Am J Roentgenol. 1981;137:327–332.
30. Brook OR, Kane RA, Tyagi G, et al. Lessons learned from quality as-surance: errors in the diagnosis of acute cholecystitis on ultrasound and CT. AJR Am J Roentgenol. 2011;196(3):597–604.
31. Marchal G, Van de Voorde P, Van Dooren W, et al. Ultrasonic ap-pearance of the filled and contracted normal gallbladder. J Clin Ultrasound.1980;8:439–442.
32. Baron RL, Tublin ME, Peterson MS. Imaging the spectrum of biliary tract disease. Radiol Clin North Am. 2002;40:1325–1354.
33. Engel JM, Deitch EA, Sikkema W. Gallbladder wall thickness; so-nographic accuracy and relation to disease. AJR Am J Roentgenol. 1980;134:907–909.
34. Sood BP, Kalra N, Gupta S, et al. Role of sonography in the diagnosis of gallbladder perforation. J Clin Ultrasound. 2002;30:270–274.
35. Chau WK, Wong KB, Chan SC, et al. Ultrasonic “hole sign”: a re-liable sign of perforation of the gallbladder? J Clin Ultrasound. 1992;20:294–299.
36. Haubek A, Pedersen JH, Burcharth F, et al. Dynamic sonography in the evaluation of jaundice. AJR Am J Roentgenol. 1981;136:1071–1074.
37. Sample WF, Sarti DA, Goldstein LI, et al. Gray-scale ultrasonography of the jaundiced patient. Radiology. 1978;128:719–725.
FIGURE 9.54. (continued) In (C), hyperechoic masses are seen within the liver. The initial impression was suspicious for a pancreatic neoplasm. However, follow-up studies found a large stone embedded at the ampulla. The hyperechoic masses were attributed to “milk of bile reflux” from chronic biliary obstruction.
Milk of bile
C

chapter 9 / Right Upper Quadrant: Liver, Gallbladder, and Biliary Tree 155
45. Ralls PW, Colletti PM, Halls JM, et al. Prospective evaluation of 99m Tc-IDA cholescintigraphy and gray-scale ultrasound in the diagnosis of acute cholecystitis. Radiology. 1982;144(2):369–371.
46. Summers SM, Scruggs W, Menchine MD, et al. A prospective evaluation of emergency department bedside ultrasonography for the detection of acute cholecystitis. Ann Emerg Med. 2010;56(2):114–122.
47. Jang TB, Ruggeri W, Dyne P, et al. The learning curve of resident physi-cians using emergency ultrasonography for cholelithiasis and cholecys-titis. Acad Emerg Med. 2010;17(11):1247–1252.
48. Blaivas M, Adhikari S. Diagnostic utility of cholescintigraphy in emergency department patients with suspected acute cholecysti-tis: comparison with bedside RUQ ultrasonography. J Emerg Med. 2007;33(1):47–52.
49. Shakespear JS, Shaaban AM, Rezvani M. CT findings of acute cholecystitis and its complications. AJR Am J Roentgenol. 2010; 194(6):1523–1529.
50. Shuman WP, Mack LA, Rudd TG, et al. Evaluation of acute right upper quadrant pain: sonography and 99mTc-PIPIDA cholescintigraphy. AJR Am J Roentgenol. 1982;139:61–64.
38. Weill F, Eisencher A, Zeltner F. Ultrasonic study of the normal and dilated biliary tree. The “shotgun” sign. Radiology. 1978;127:221–224.
39. Laing FC, London LA, Filly RA. Ultrasonographic identification of di-lated intrahepatic bile ducts and their differentiation from portal venous structures. J Clin Ultrasound. 1978;6:90–94.
40. Laing FC, Jeffrey RB Jr. Choledocholithiasis and cystic duct obstruction: difficult ultrasonographic diagnosis. Radiology. 1983;146:475–479.
41. Trowbridge RL, Rutkowski NK, Shojania KG. Does this pa-tient have acute cholecystitis? The Rational Clinical Exam. JAMA. 2003;289(1):80–86.
42. Cooperberg PL, Burhenne HJ. Real-time ultrasonography. Diagnostic technique of choice in calculous gallbladder disease. N Engl J Med. 1980;302:1277–1279.
43. Shea JA, Berlin JA, Escarce JJ, et al. Revised estimates of diagnostic test sensitivity and specificity in suspected biliary tract disease. Arch Intern Med. 1994;154:2573–2581.
44. Ross M, Brown M, McLaughlin K, et al. Emergency physician- performed ultrasound to diagnosis cholelithiasis: a systematic review. Acad Emerg Med. 2011;18(3):227–235.

156
Most AAAs are asymptomatic until they rupture, mak-ing this a disease that can only be effectively managed by early detection (9,10). The utility of emergency bedside ultrasonography is most compelling in time-sensitive and potentially lethal diseases. Emergency bedside ultrasound is highly sensitive (>90%) in the detection of AAA when performed by emergency physicians (11–15). It will reli-ably identify all AAAs when performed in a systematic and thorough way unless impeded by bowel gas or a very large pannus (an “indeterminate exam”). Thus, while the accurate interpretation of images is essential, an even more important task is the determination of whether or not a complete and adequate exam has been performed. The cardinal virtue of an emergency physician—to know with certainty what one does or does not know—applies especially when wielding an ultrasound probe. This chapter, in addition to describing the sonographic findings of a normal and abnormal aorta exam, will focus on techniques to promote, and pitfalls to avoid, in obtaining a complete exam.
CLINICAL APPLICATIONSThe primary application for ultrasound of the aorta is the rapid bedside detection of an AAA. Since patients with an AAA present with a variety of symptoms (Table 10.2), early bedside imaging might detect AAAs in patients whose di-agnosis might otherwise be delayed or missed altogether while awaiting other testing either in the ED or as an outpa-tient. The majority present with back pain and/or abdominal pain (16,17). In one series, 39% of patients presented with vomiting (17). Fewer than one-quarter of patients are aware that they have an aneurysm before presenting with compli-cations (16). The physical exam is also unreliable for the detection of AAA (16,18). The triad of hypotension, back pain, and a pulsatile mass is present in only a quarter of cases of ruptured AAA (19). Based on clinical exam alone, acute AAA is misdiagnosed 30% to 60% of the time (16,17,20).
INTRODUCTIONTimely emergency department (ED) diagnosis of acute ab-dominal aortic aneurysm (AAA) is vital. An AAA is usually defined as focal dilatation of the abdominal aorta of 150% of normal (1). Since the normal mean aortic diameter is 2 cm (range 1.4 to 3.0 cm), aneurysm is defined as an infrarenal aortic diameter of >3 cm. The upper limit of normal size of the iliac arteries, which may be involved in aneurysmal dis-ease alone, or (more commonly) with AAA, is 1.5 cm. Once an aorta becomes aneurysmal, growth rate is highly variable, with 20% of AAAs not expanding, and 20% expanding at >5 mm per year (2–4). For those that do expand, growth rate is exponential: the larger the aneurysm, the more rapidly it expands (2,4,5). The likelihood of rupture is also strongly linked to size (Table 10.1). Rupture of an AAA causes about 6000 deaths annually in the United States (6,7). Mortality rates from AAA have fallen significantly in the past decade, most likely due to the combined benefits of earlier diagno-sis through screening programs leading to higher rates of elective repair, and improved surgical techniques leading to lower elective operative mortality (6–8).
ARTIFACTS AND PITFALLS . . . . . . . . . . . . . . . . . . . . . . . . . 166USE OF THE IMAGE IN CLINICAL DECISION MAKING . . . . . 167COMPARISON WITH OTHER IMAGING
MODALITIES . . . . . . . . . . . . . . . . . . . . . . . . . . . . . . . . . . 169CLINICAL CASE . . . . . . . . . . . . . . . . . . . . . . . . . . . . . . . . . . 170
INTRODUCTION . . . . . . . . . . . . . . . . . . . . . . . . . . . . . . . . . . 156CLINICAL APPLICATIONS . . . . . . . . . . . . . . . . . . . . . . . . . . . 156IMAGE ACQUISITION . . . . . . . . . . . . . . . . . . . . . . . . . . . . . . 157NORMAL ULTRASOUND ANATOMY . . . . . . . . . . . . . . . . . . . 160PATHOLOGY . . . . . . . . . . . . . . . . . . . . . . . . . . . . . . . . . . . . . 161
Anthony J. Dean
Abdominal Aorta10
TABLE 10.1 One- and Five-Year Rupture Rates from AAAs of Various Sizes
SIZE (cm)1-YEAR RUPTURE
RATE (%)5-YEAR RUPTURE
RATE (%)
3–4 <1
4–5 1 (4–5.5 cm) 2–4
5–6 9 (5.5–6.0 cm) 25
6–7 10 35
>7 32 75
Note: Data from Zollner, Vardulakia, and Guirguis (2,4,5)
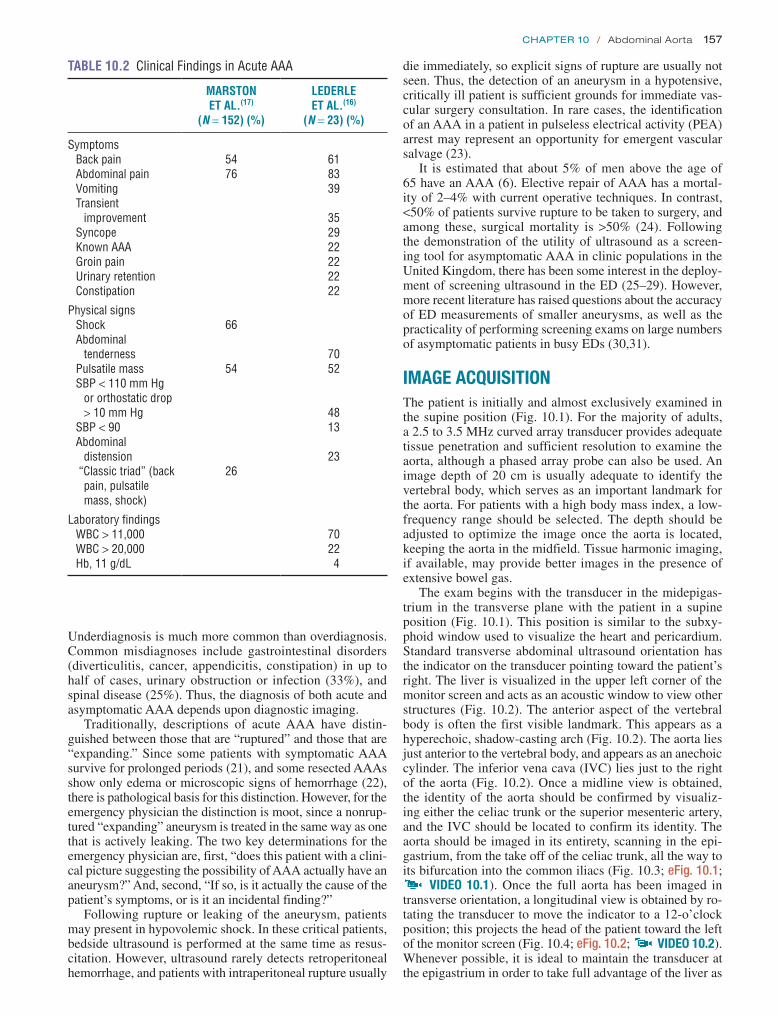
Chapter 10 / Abdominal Aorta 157
TABLE 10.2 Clinical Findings in Acute AAA
MARSTON ET AL.(17)
(N = 152) (%)
LEDERLE ET AL.(16)
(N = 23) (%)
SymptomsBack painAbdominal painVomitingTransient
improvementSyncopeKnown AAAGroin painUrinary retentionConstipation
5476
618339
352922222222
Physical signsShockAbdominal
tendernessPulsatile massSBP < 110 mm Hg
or orthostatic drop > 10 mm Hg
SBP < 90Abdominal
distension “Classic triad” (back
pain, pulsatile mass, shock)
66
54
26
7052
4813
23
Laboratory findingsWBC > 11,000WBC > 20,000Hb, 11 g/dL
70224
Underdiagnosis is much more common than overdiagnosis. Common misdiagnoses include gastrointestinal disorders (diverticulitis, cancer, appendicitis, constipation) in up to half of cases, urinary obstruction or infection (33%), and spinal disease (25%). Thus, the diagnosis of both acute and asymptomatic AAA depends upon diagnostic imaging.
Traditionally, descriptions of acute AAA have distin-guished between those that are “ruptured” and those that are “expanding.” Since some patients with symptomatic AAA survive for prolonged periods (21), and some resected AAAs show only edema or microscopic signs of hemorrhage (22), there is pathological basis for this distinction. However, for the emergency physician the distinction is moot, since a nonrup-tured “expanding” aneurysm is treated in the same way as one that is actively leaking. The two key determinations for the emergency physician are, first, “does this patient with a clini-cal picture suggesting the possibility of AAA actually have an aneurysm?” And, second, “If so, is it actually the cause of the patient’s symptoms, or is it an incidental finding?”
Following rupture or leaking of the aneurysm, patients may present in hypovolemic shock. In these critical patients, bedside ultrasound is performed at the same time as resus-citation. However, ultrasound rarely detects retroperitoneal hemorrhage, and patients with intraperitoneal rupture usually
die immediately, so explicit signs of rupture are usually not seen. Thus, the detection of an aneurysm in a hypotensive, critically ill patient is sufficient grounds for immediate vas-cular surgery consultation. In rare cases, the identification of an AAA in a patient in pulseless electrical activity (PEA) arrest may represent an opportunity for emergent vascular salvage (23).
It is estimated that about 5% of men above the age of 65 have an AAA (6). Elective repair of AAA has a mortal-ity of 2–4% with current operative techniques. In contrast, <50% of patients survive rupture to be taken to surgery, and among these, surgical mortality is >50% (24). Following the demonstration of the utility of ultrasound as a screen-ing tool for asymptomatic AAA in clinic populations in the United Kingdom, there has been some interest in the deploy-ment of screening ultrasound in the ED (25–29). However, more recent literature has raised questions about the accuracy of ED measurements of smaller aneurysms, as well as the practicality of performing screening exams on large numbers of asymptomatic patients in busy EDs (30,31).
IMAGE ACQUISITIONThe patient is initially and almost exclusively examined in the supine position (Fig. 10.1). For the majority of adults, a 2.5 to 3.5 MHz curved array transducer provides adequate tissue penetration and sufficient resolution to examine the aorta, although a phased array probe can also be used. An image depth of 20 cm is usually adequate to identify the vertebral body, which serves as an important landmark for the aorta. For patients with a high body mass index, a low-frequency range should be selected. The depth should be adjusted to optimize the image once the aorta is located, keeping the aorta in the midfield. Tissue harmonic imaging, if available, may provide better images in the presence of extensive bowel gas.
The exam begins with the transducer in the midepigas-trium in the transverse plane with the patient in a supine position (Fig. 10.1). This position is similar to the subxy-phoid window used to visualize the heart and pericardium. Standard transverse abdominal ultrasound orientation has the indicator on the transducer pointing toward the patient’s right. The liver is visualized in the upper left corner of the monitor screen and acts as an acoustic window to view other structures (Fig. 10.2). The anterior aspect of the vertebral body is often the first visible landmark. This appears as a hyperechoic, shadow-casting arch (Fig. 10.2). The aorta lies just anterior to the vertebral body, and appears as an anechoic cylinder. The inferior vena cava (IVC) lies just to the right of the aorta (Fig. 10.2). Once a midline view is obtained, the identity of the aorta should be confirmed by visualiz-ing either the celiac trunk or the superior mesenteric artery, and the IVC should be located to confirm its identity. The aorta should be imaged in its entirety, scanning in the epi-gastrium, from the take off of the celiac trunk, all the way to its bifurcation into the common iliacs (Fig. 10.3; eFig. 10.1;
VIDEO 10 .1). Once the full aorta has been imaged in transverse orientation, a longitudinal view is obtained by ro-tating the transducer to move the indicator to a 12-o’clock position; this projects the head of the patient toward the left of the monitor screen (Fig. 10.4; eFig. 10.2; VIDEO 10 .2). Whenever possible, it is ideal to maintain the transducer at the epigastrium in order to take full advantage of the liver as

158 SeCtion iii / Evaluation of Abdominal Conditions
A B
FIGURE 10.1. Guide to Image Acquisition: The Aorta. Begin in the midline of the epigastrium and scan down the abdomen to the umbilicus in both transverse (A) and longitudinal (B) orientations.
Liver
C
Aorta
Vertebra
Inferiorvena cava
FIGURE 10.2. Ultrasound of the Aorta. A: The transducer is placed in a transverse orientation at the epigastrium below the xyphoid process. B, C: A short axis view of the aorta (seen just to the left of midline in the prevertebral space) and the inferior vena cava (IVC) (seen just to the right of midline).
Abdominalaorta
A
Aorta
Vertebra
Inferiorvena cava
B
an acoustic window. It can then be projected caudad without actually moving the transducer from the epigastrium, and the aorta can be followed as inferiorly as possible. Because 95% of AAAs are distal to the renal arteries, it is important to visualize the abdominal aorta in its entirety from the dia-phragm to the bifurcation (14).
Bowel gas and obesity are constant challenges to aortic imaging. Gentle, constant pressure, sometimes assisted by a jiggling motion, is often successful in displacing loops of gas-filled bowel ( VIDEO 10 .3). In fact, one of the pitfalls in imaging the aorta is moving the transducer away from an area of bowel gas too quickly. In refractory cases, an

Chapter 10 / Abdominal Aorta 159
Abdominalaorta
A
Rectusabdominismuscles
Right commonlliac artery
Left commonlliac arteryInferior venacava
Vertebra
C
B
FIGURE 10.3. A: Short axis view of the aorta at the umbilicus, the level of the bifurcation. B: Ultrasound at the aortic bifurcation. C: Bifurcation of the aorta into the common iliac arteries. IVC, inferior vena cava; RI, right iliac; LI, left iliac; VB, vertebral body.
A
Abdominalaorta
C
Superiormesentericartery
Celiactrunk
Aortaseen inlongitudinalview
B
FIGURE 10.4. A: Transducer placement for longitudinal orientation of the aorta (Ao). B, C: Long axis view of the aorta showing the celiac and SMA branches.
alternative to the supine position is placing the patient in the left lateral decubitus position and scanning in a coronal plane in the midaxillary line between the ribs or below the costal margin (Fig. 10.5; eFig. 10.3). This approach takes advantage of the liver as an acoustic window and provides a longitudi-nal image of the aorta. Views of the infrarenal aorta are likely to be limited using this window, so that a complete evaluation is rarely possible; but if an aneurysm is identified, manage-ment decisions can be expedited. If difficulty is encountered in scanning the distal aorta, views from the left side of the umbilicus or below it can sometimes be helpful.
A wide variety of methods of measuring the aorta have been described (inner vs. outer walls, side-to-side vs. antero-posterior [AP], longitudinal images vs. transverse images) (32). Because the primary clinical concern in the ED is the avoidance of underdiagnosis, standard practice in emergency medicine has been to use the most conservative method: measurement from outer wall to outer wall (Fig. 10.6). A variety of opinions have been expressed regarding the advantages of AP versus side-to-side measurements. The ad-vantage of the former is that due to the angle of insonation, much crisper ultrasound images are obtained of the anterior

160 SeCtion iii / Evaluation of Abdominal Conditions
other is obviously greater, in which case the largest diameter should be measured and recorded (33). Both longitudinal and transverse scanning planes are subject to potential errors of measurement.
NORMAL ULTRASOUND ANATOMYThe aorta passes through the diaphragm at the level of the 12th thoracic vertebral body. It lies slightly to the left of the midline, and gives rise to a number of branches before bifurcating at the level of the fourth lumbar vertebral body (Fig. 10.7). The surface anatomy landmarks corresponding to these two points are the xyphoid process and the umbilicus. The length of the abdominal aorta is about 13 cm (6 inches): less than the length of the iliacs from the bifurcation to the inguinal ligament. The scanning of the abdominal aorta will therefore take place in the short distance between the ster-num and the umbilicus.
The aorta has five major branches in the abdomen proxi-mal to its bifurcation (the unpaired celiac trunk, superior mesenteric artery (SMA), and inferior mesenteric artery; and the paired renal arteries). Most of the landmarks and branches are best viewed in a transverse orientation. Beginning in a transverse imaging plane immediately be-low the diaphragm, the celiac trunk is the first vessel to arise from the aorta in the midline anteriorly. This short (usually <1 cm) vessel can often be seen sonographically in the transverse plane, dividing in a “wide Y” (Fig. 10.8;
VIDEOS 10 .1 and 10 .4–10 .6). The fork on the patient’s right (screen left) is the common hepatic artery, heading to the porta hepatis; the fork on the patient’s left (screen right) is the splenic artery. This sonographic view is often referred to as the seagull sign (with the splenic and hepatic arteries forming the arching wings of the bird). Because the celiac axis divides and comes out of the sagittal plane, it appears as a short vessel when viewed longitudinally (Fig. 10.4; VIDEO 10 .2). The SMA arises from the aorta about 1 cm caudad to the celiac trunk, although it is sometimes so close that the two vessels share a com-mon origin (Fig. 10.9; eFig. 10.4). This vessel runs directly parallel and immediately anterior to the aorta and can be followed alongside the aorta when imaged in the agittal plane (Fig. 10.4; VIDEO 10 .2). The SMA is surrounded by fibrofatty tissue that gives it a distinctly echogenic appearance. In cross section it appears to be surrounded by a bright halo. This characteristic aids in identifying it and makes it a valuable ultrasound landmark. Measure-ments of the “proximal” aorta to use as a comparison with distal measurements are made at this level. The renal arteries and inferior mesenteric artery (typically not visu-alized) arise just below the SMA (Fig. 10.10; eFig. 10.5;
VIDEO 10 .5). The renal arteries are not typically seen on a sagittal view of the aorta, but can sometimes be seen with careful transverse scanning (Fig. 10.11). The three major vessels (celiac, SMA, renal arteries) branch from the aorta within about 3 cm of the diaphragm. Ninety per-cent of all AAA’s will occur between this point and the bifurcation. The aorta terminates at the bifurcation into the common iliac arteries at the level of the umbilicus or fourth lumbar vertebra. Dynamic imaging of the aorta should visualize the entire length to safely exclude aneurysmal dilation ( VIDEOS 10 .1, 10 .2, and 10 .4–10 .6).
FIGURE 10.5. View of the Aorta with the Patient in a Left Lateral Decubitus Position and the Transducer in the Midaxillary Line Using the Liver as an Acoustic Window.
B
A
FIGURE 10.6. Measurements of the Aorta Taken in Transverse (A) and Longitudinal (B) Views.
and posterior walls than of the lateral walls. Against this is the view that aneurysms tend to have larger side-to-side than AP diameters (22). Given that most aneurysms expand asym-metrically, and that the differences are usually at or below the range of interobserver variability, it is acceptable in practice to get either measurement except in cases where one or the

Chapter 10 / Abdominal Aorta 161
External iliac vein
Internal iliac vein
Middle sacral vein
Common iliac vein
Testicular or ovarian veins
Inferior vena cava
Right renal vein
Suprarenal vein
Hepatic veins
Phrenic veinLeft gastric artery
Inferior phrenic artery
Suprarenal artery
Celiac trunk
Splenic artery
Hepatic artery
Abdominal aorta
Left renal artery
Superior mesenteric artery
Testicular or ovarian artery
Common iliac artery
Middle sacral artery
External iliac artery
ASplenic artery
Left renal artery
Right renal artery
Left gonadal artery
Right gonadal artery
Superior mesenteric artery
Left common iliac artery
Right common iliac artery
Hepatic artery
Celiac trunk
B
FIGURE 10.7. The Abdominal Aorta. The relationship of the vasculature of the retroperitoneum is demonstrated in (A). The main branches of the aorta are seen in (B).
It is important to distinguish between the aorta and the IVC; the two structures are both seen in their short axis when scanning in the transverse plane, and their appearances are somewhat similar. The aorta typically lies just to the left of midline in the immediate prevertebral space, and has a thick-ened, echogenic, and sometimes irregular wall. An athero-sclerotic aorta may contain plaque and calcium and often creates shadows. Some aortas are tortuous and actually cross the midline, particularly in patients with abnormal curvature of the spine. In contrast, the IVC lies just to the right of the midline (and always right of the aorta) and has a smooth, regular wall. The ultrasound appearance of the IVC depends largely upon the degree of hydration and is affected by vol-ume and blood pressure. The normal IVC takes on a tear shape and often appears to drape over the vertebral column (Fig. 10.2). The IVC is the most posterior vascular structure
in the retroperitoneum. With deliberate scanning, the IVC and aorta are usually easy to distinguish. Distinguishing features are listed in Table 10.3. The different appearances of the IVC in the transverse view can be appreciated in Figure 10.12 and VIDEOS 10 .1 and 10 .4–10 .6. Of note: pulsatility should not be used to distinguish the two vessels: the IVC is a pulsatile vessel ( VIDEO 10 .7).
PATHOLOGYAn AAA is defined as an aortic diameter >3 cm (Figs. 10.13–10.16; eFigs. 10.6 and 10.7; VIDEO 10 .8 and 10 .9). An aorta that fails to taper distally is also aneurysmal, but clini-cal decisions will still be made based on its diameter. By far the largest single risk factor for AAA is smoking. In one large screening study, the excess prevalence of smoking

162 SeCtion iii / Evaluation of Abdominal Conditions
Abdominalaorta
A
Hepatic artery
Splenic arteryCeliac trunk
Aorta
Vertebra
Inferiorvena cava
C
Liver
B
FIGURE 10.8. Transverse View of the Proximal Abdominal Aorta at the Level of the Celiac Axis. The transducer is placed in the epigastrium in a transverse orientation using the liver as an acoustic window (A, B, C). The aorta is seen just anterior and slightly to the left of the vertebral body (VB). The celiac trunk (thick arrow) branches off the aorta, dividing into the com-mon hepatic artery (CHA) that joins the portal vein (PV) at the porta hepatis, and the splenic artery, coursing to the patient’s left. The IVC can be seen, larger than the aorta to the right of midline.
FIGURE 10.9. Transverse View of the Aorta at the Level of the SMA (Black Arrow). The SMA is best identified by fanning the transducer inferiorly from a view of the celiac trunk without actually moving it on the patient’s skin. Hence a segment of liver (L) can still be seen anteriorly. At this level, the IVC (white arrowheads) gives rise to the left renal vein (black arrowheads) that passes anatomically posterior to the SMA. The splenic vein (white arrow) crosses anterior to the SMA and joins the superior mesenteric vein to form the portal vein at the portal confluence (C). The portal confluence might be confused with the IVC which is almost collapsed (white arrowheads). The left renal vein is distended due to pressure from the transducer through the SMA (black arrow). The splenic vein is seen compressed anterior to the SMA, and then runs out of the scanning plane on the right side of the image. The soft tis-sue density of the pancreas (P) is seen anterior to the confluence and the SMA.
FIGURE 10.10. Transverse Scan of the Aorta at the Level of the Renal Arteries. The renal arteries (above white arrows), Aorta (Ao), the IVC, left renal vein (below arrowheads), SMA (black arrow), splenic vein, and portal confluence (C) can all be seen with their typical relationships to one another.
between matched groups with and without AAA was sta-tistically responsible for 75% of the AAAs of >4 cm (34). Other risk factors include age, male sex, hypertension, high cholesterol, and family history. Both height and weight are risk factors, while African-American race and diabetes are
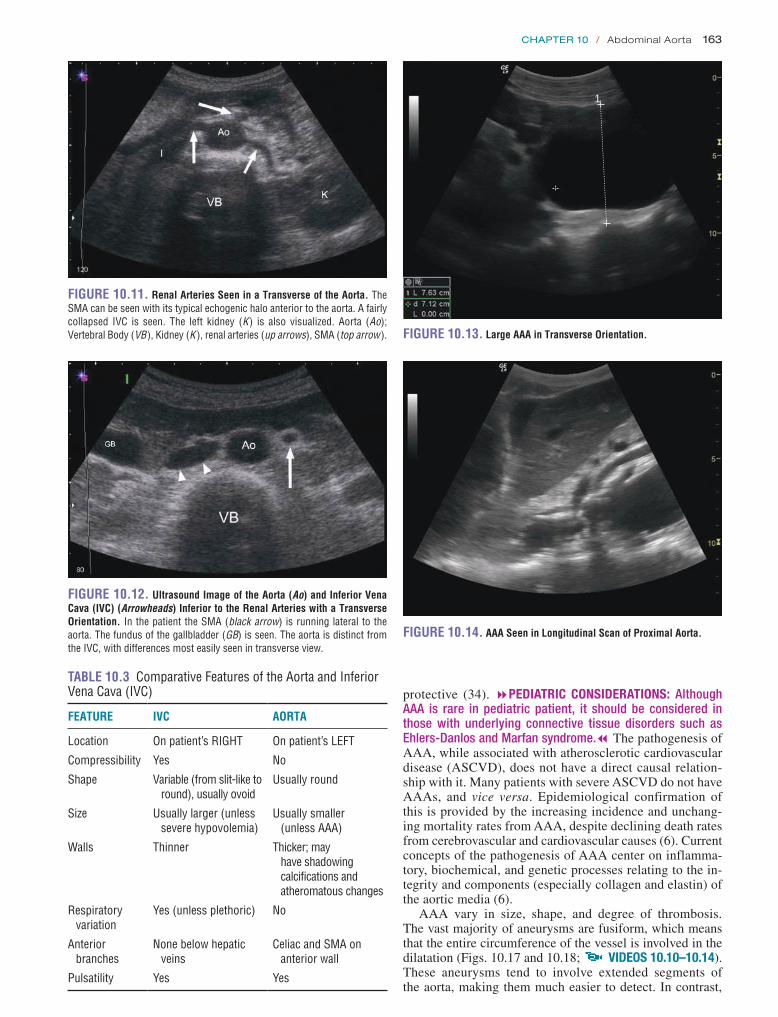
Chapter 10 / Abdominal Aorta 163
FIGURE 10.11. Renal Arteries Seen in a Transverse of the Aorta. The SMA can be seen with its typical echogenic halo anterior to the aorta. A fairly collapsed IVC is seen. The left kidney (K) is also visualized. Aorta (Ao); Vertebral Body (VB), Kidney (K ), renal arteries (up arrows), SMA (top arrow ).
FIGURE 10.12. Ultrasound Image of the Aorta (Ao) and Inferior Vena Cava (IVC) (Arrowheads) Inferior to the Renal Arteries with a Transverse Orientation. In the patient the SMA (black arrow) is running lateral to the aorta. The fundus of the gallbladder (GB) is seen. The aorta is distinct from the IVC, with differences most easily seen in transverse view.
TABLE 10.3 Comparative Features of the Aorta and Inferior Vena Cava (IVC)
FEATURE IVC AORTA
Location On patient’s RIGHT On patient’s LEFT
Compressibility Yes No
Shape Variable (from slit-like to round), usually ovoid
Usually round
Size Usually larger (unless severe hypovolemia)
Usually smaller (unless AAA)
Walls Thinner Thicker; may have shadowing calcifications and atheromatous changes
Respiratory variation
Yes (unless plethoric) No
Anterior branches
None below hepatic veins
Celiac and SMA on anterior wall
Pulsatility Yes Yes
1
FIGURE 10.13. Large AAA in Transverse Orientation.
FIGURE 10.14. AAA Seen in Longitudinal Scan of Proximal Aorta.
protective (34). 8PEDIATRIC CONSIDERATIONS: Although AAA is rare in pediatric patient, it should be considered in those with underlying connective tissue disorders such as Ehlers-Danlos and Marfan syndrome.7 The pathogenesis of AAA, while associated with atherosclerotic cardiovascular disease (ASCVD), does not have a direct causal relation-ship with it. Many patients with severe ASCVD do not have AAAs, and vice versa. Epidemiological confirmation of this is provided by the increasing incidence and unchang-ing mortality rates from AAA, despite declining death rates from cerebrovascular and cardiovascular causes (6). Current concepts of the pathogenesis of AAA center on inflamma-tory, biochemical, and genetic processes relating to the in-tegrity and components (especially collagen and elastin) of the aortic media (6).
AAA vary in size, shape, and degree of thrombosis. The vast majority of aneurysms are fusiform, which means that the entire circumference of the vessel is involved in the dilatation (Figs. 10.17 and 10.18; VIDEOS 10 .10–10 .14). These aneurysms tend to involve extended segments of the aorta, making them much easier to detect. In contrast,
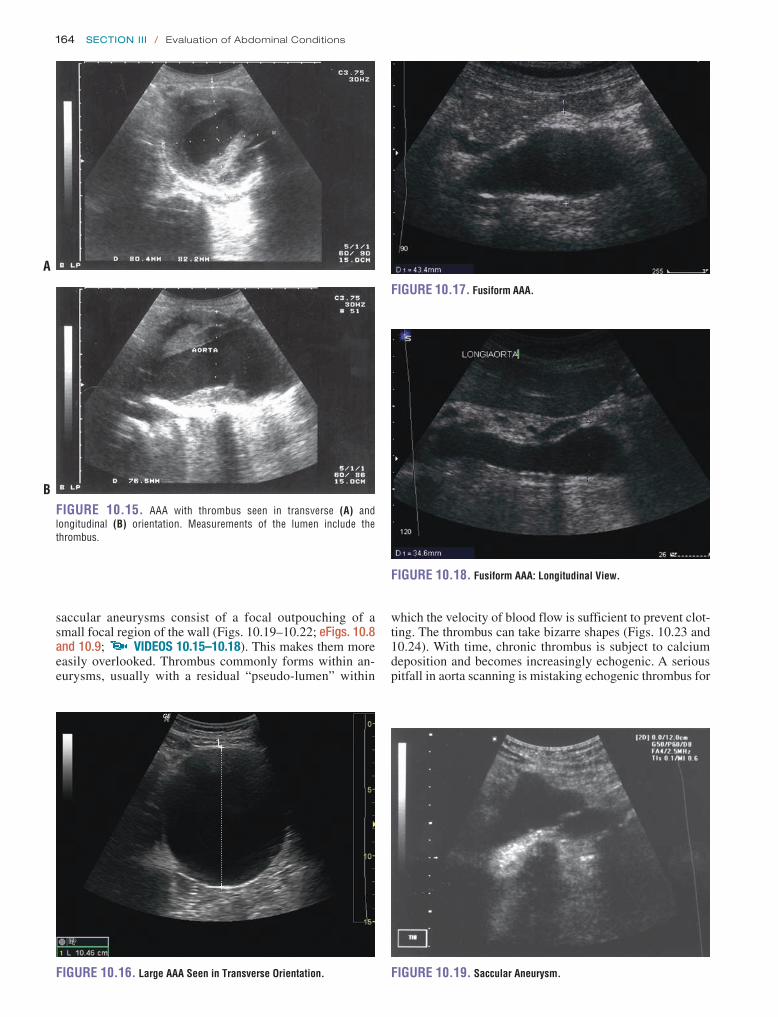
164 SeCtion iii / Evaluation of Abdominal Conditions
FIGURE 10.15. AAA with thrombus seen in transverse (A) and longitudinal (B) orientation. Measurements of the lumen include the thrombus.
A
B
1
FIGURE 10.16. Large AAA Seen in Transverse Orientation.
saccular aneurysms consist of a focal outpouching of a small focal region of the wall (Figs. 10.19–10.22; eFigs. 10.8 and 10.9; VIDEOS 10 .15–10 .18). This makes them more easily overlooked. Thrombus commonly forms within an-eurysms, usually with a residual “pseudo-lumen” within
FIGURE 10.17. Fusiform AAA.
FIGURE 10.18. Fusiform AAA: Longitudinal View.
FIGURE 10.19. Saccular Aneurysm.
which the velocity of blood flow is sufficient to prevent clot-ting. The thrombus can take bizarre shapes (Figs. 10.23 and 10.24). With time, chronic thrombus is subject to calcium deposition and becomes increasingly echogenic. A serious pitfall in aorta scanning is mistaking echogenic thrombus for

Chapter 10 / Abdominal Aorta 165
FIGURE 10.20. Large Saccular Aneurysm.FIGURE 10.21. Saccular Aneurysm.
A B
FIGURE 10.22. A, B: CT Reconstruction of the Aorta Showing a Saccular Aneurysm (Arrows) and Fusiform Aneurysm (Arrowheads).
A BFIGURE 10.23. AAA with Large Amount of Thrombus in Long (A) and Short (B) Axis.

166 SeCtion iii / Evaluation of Abdominal Conditions
FIGURE 10.24. Occluded, Thrombosed AAA.
FIGURE 10.25. Endovascular Graft.
periaortic soft tissues and resultant failure to recognize an AAA. In most cases, this is due to excessively high gain set-tings and can be avoided by adjusting gain so that the lumen of the aorta appears black (not gray) on the screen. Dynamic range might also need to be reduced to emphasize the dif-ference in echodensity between thrombus and tissue outside the vessel (Fig. 10.23). As noted, it is very rare for a small AAA to rupture. However, since such AAAs are much more prevalent, such events do occur, so symptoms consistent with acute AAA in a patient with a small aneurysm cannot be ignored (22).
It is increasingly common for older patients to present to the ED with abdominal complaints after endovascular aor-tic repair (EVAR) of an AAA. These patients still have their original AAA in situ with a graft running from a proximal area of healthy vessel to a distal zone of healthy vessel, usu-ally well below the bifurcation (Fig. 10.25; VIDEO 10 .19). One of the commonest long-term complications of these grafts is “endoleak”: a communication from the systemic cir-culation to the space between the graft and the aneurysmal native aorta (35). In the vast majority of cases, these leaks arise from communication by visceral branches of the na-tive aorta (approximately 66%) or from breakdown of the proximal or distal anastomoses (approximately 33%) (36). In either case, color flow and/or Doppler ultrasound should
ILIACS
FIGURE 10.26. Aneurysms Involving the Bifurcation of the Aorta and the Common Iliac Arteries.
be used to identify the presence of pulsatile flow of blood in the perigraft space (37).
Up to 40% of aneurysms extend into the iliac arteries, so attempts should be made to scan these vessels when an an-eurysm is identified (Fig. 10.26). Occasionally, compression of the ureter by an expanding aneurysm or retroperitoneal hematoma can lead to hydronephrosis. As previously noted, hemoperitoneum is rare in patients surviving a ruptured AAA to the ED. While ultrasound is not a primary modal-ity for evaluating aortic dissections; sometimes an intimal flap is seen on an abdominal aortic evaluation (Fig. 10.27;
VIDEO 10 .20) (38,39).
ARTIFACTS AND PITFALLS 1. By far the greatest pitfall in the sonographic evaluation
of the abdominal aorta is failing to fully visualize the entirety of its course from the takeoff of the SMA to the iliac bifurcation (Fig. 10.28). Saccular aneurysms are particularly easy to overlook. The most common ob-stacle to obtaining a complete and systematic scan is overlying bowel gas. As noted, gentle pressure with the transducer may displace the bowel gas and improve the image. When a complete systematic real-time scan through all tissue planes cannot be obtained, the limita-tions of the scan should be identified and documented. Further evaluation by alternative imaging modalities should be obtained as clinically indicated.
2. Both longitudinal and transverse scanning planes have potential pitfalls in making accurate aortic measure-ments. Off-plane longitudinal images will underestimate the diameter of the vessel due to the cylinder-tangent effect (Fig. 10.29). A transverse image may result in underestimation of the aortic diameter if not obtained at the level of maximal dilatation. Transverse images of a tortuous vessel may result in overestimations of aor-tic diameter if not obtained exactly perpendicular to the main axis of the vessel at that point. As a person ages, the aorta may become tortuous, making it more difficult to define and measure it accurately (Fig. 10.30).

Chapter 10 / Abdominal Aorta 167
FIGURE 10.27. Longitudinal (A) and Transverse (B) Views of an Aortic Dissection Extending into the Abdominal Aorta. The fine line of the intimal flap can be seen in both images within the aortic lumen.
A
BFIGURE 10.28. A Small Aortic Aneurysm is Seen in the Distal Abdominal Aorta Near the Bifurcation. This aneurysm would be missed if the scan did not include the distal aorta. Longitudinal view (A). Transverse view (B).
B
A
FIGURE 10.29. The Cylinder Tangential Effect. An oblique view of a cylinder will underestimate the diameter.
3. Gain and dynamic range settings should be adjusted to make the aortic lumen black to avoid mistaking aneurys-mal thrombus for aortic wall. Because aortic diameter is measured from outside wall to outside wall, any throm-bus within the lumen of an AAA should by definition be included in its measurement. Measurements of the pseudolumen within the thrombus will seriously underestimate the diameter of the aneurysm (Figs. 10.31 and 10.32).
4. In a patient with symptoms consistent with AAA, a small aneurysm of 3 to 5 cm does not preclude rupture.
5. The presence of retroperitoneal hemorrhage or he-matoma cannot be reliably identified by ultrasound. However, occasionally a rupture may be visualized (Fig. 10.33; VIDEO 10 .21).
6. The absence of free peritoneal fluid is never a reason to exclude acute AAA (8). If an AAA is identified, it is still possible that it is not the cause of a patient’s symptoms.
USE OF THE IMAGE IN CLINICAL DECISION MAKINGThere are two factors that influence decision making in the ED after an AAA has been detected: the diameter of the aorta and the stability of the patient.

168 SeCtion iii / Evaluation of Abdominal Conditions
A B
C DFIGURE 10.30. Tortuous Aorta Seen by Ultrasound (A) and CT (B–D). The aortic aneurysm crosses the midline and can be seen on either side of the vertebral body in different planes.
A
+
+1
1
BFIGURE 10.31. Tortuous and Heavily Thrombosed Aortic Aneurysm in Long (A) and Short (B) Axis. Note that the sonographer failed to recognize the thrombus in the longitudinal view, seriously underestimating the diameter of the aneurysm. A more accurate measurement (that still underestimates the size of the aneurysm) is seen in the transverse view (B).
As noted, the rate of growth of aneurysms is unpredictable (2,4,6,40). Thus any person with an incidentally discovered aneurysm should receive follow-up. Patients with inciden-tally discovered aneurysms of <5 cm who can reliably obtain follow-up can be managed as outpatients (Table 10.1). As-ymptomatic patients whose aneurysms are >5 cm probably warrant at least discussion with a vascular consultant, with
increasingly urgent follow-up depending on the diameter of the vessel, bearing in mind that a 5-cm aneurysm carries a 25% risk of rupture in 5 years. Therefore, most surgeons recommend elective repair of the aneurysm once it reaches 5 cm. The patient should receive careful instructions to re-turn to the ED immediately if he or she develops any symp-toms suggestive of an expanding or leaking aneurysm.

Chapter 10 / Abdominal Aorta 169
+1
2
+
+
+
FIGURE 10.32. Heavily Thrombosed Aortic Aneurysm.
FIGURE 10.33. Ultrasound Image Demonstrating a Ruptured AAA. See corresponding video to demonstrate the site of rupture.
FIGURE 10.34. Lateral Radiograph Demonstrating the Outline of a Calcified Aneurysm.
FIGURE 10.35. CT of an AAA.
In all patients whose symptoms might be the result of an identified AAA, the rapid detection of an AAA facilitated by bedside ultrasonography allows for immediate vascular surgery consultation. Plummer et al. demonstrated that the time to the operating room was decreased from an average of 90 minutes to 12 minutes when an ED ultrasound was performed to detect the aneurysm (41).
COMPARISON WITH OTHER IMAGING MODALITIESUp to two-thirds of AAAs may develop mural calcifications, some of which are visible on plain film, although they may belie the actual dimension of an aorta that has dilated rapidly (Fig. 10.34). Plain films might also identify erosion of verte-bral bodies or an obscured renal shadow. Radiographs have almost no place in settings where there is readily available ultrasound and computed tomography (CT).
CT is highly sensitive for the detection of AAA (Figs. 10.35 and 10.36). It reliably identifies retroperitoneal
hemorrhage and other signs of rupture and demonstrates the extent of aneurysmal involvement, information that is help-ful in planning a surgical repair. Abdominal CT also has the advantage of revealing alternative diagnoses, such as renal stones or bowel pathology (23). On the other hand, CT scan-ning is relatively time consuming and requires removal of the patient from the resuscitation area, both of which may be problematic in an unstable patient. Both CT and ultra-sound (performed by radiologists) have been compared for interobserver variations in assessment of aortic diameter. Both modalities resulted in remarkably similar interobserver discrepancies (33). There was a >2-mm difference in one-third of patients. More strikingly, both modalities resulted in an approximately 15% rate of “clinically significant” dif-ferences (defined as a >5-mm discrepancy). These findings are in alignment with published investigations of emergency ultrasound and are a reminder that no test in medicine is in-fallible, and that imaging test results should be correlated by other aspects of the overall clinical picture (14,28).

170 SeCtion iii / Evaluation of Abdominal Conditions
A BFIGURE 10.36. Reformatted Images from a Computed Tomography (CT) Scan of an Infrarenal Aortic Aneurysm.
The role of arteriography in the evaluation of AAA has diminished in recent years. Arteriography is useful in defin-ing the extent of involvement of the branch vessels and gives an accurate assessment of the lumen diameter. However, ar-teriography may underestimate the diameter of the aneurysm because of thrombus in the vessel wall. Arteriography is also time intensive, invasive, requires intravenous contrast, and necessitates moving the patient from the ED.
Magnetic resonance imaging (MRI) is very sensitive for the detection of AAA and signs of rupture. Because of the limited availability of MRI in most EDs, as well as the time and resources required to obtain the images, MRI is usually not practical in the acute setting, especially in the unstable patient.
CLINICAL CASEA 74-year-old man presents to the ED with a chief com-plaint of light-headedness. He has a history of hypertension and hypercholesterolemia. He currently takes metoprolol and lisinopril. He has no known drug allergies and quit smoking over 10 years ago. Along with a sensation of light-headedness on standing for the last 2 to 3 days, he also notes a dull abdominal pain most severe in the right lower quadrant, as well as occasional right back pain. He is afe-brile, has a heart rate of 78 beats per minute, blood pressure of 88/52 mm Hg, and 18 breaths per minute. The physical examination of his head, lungs, and heart is unremarkable. His abdomen is slightly distended with normoactive bowel sounds. He is moderately tender in the right lower quad-rant and periumbilical region without rebound or guarding. There are no palpable masses. He is guaiac negative on rec-tal exam. His vascular exam reveals a 2+ left femoral pulse and a 1+ right femoral pulse. The rest of his physical exam is normal.
After adequate intravenous access is established, the pa-tient is started on crystalloid fluids and his blood pressure
improves to 104/64. A bedside ultrasound in the ED reveals an AAA in excess of 8 cm that extended to the bifurcation (Fig. 10.32; VIDEO 10 .22). An emergent vascular sur-gery consult is obtained. The patient’s hematocrit returns at 22, and a blood transfusion is initiated. He remains hemody-namically stable until transfer to the operating room, where he has successful repair of his 6.4 cm AAA. The patient is discharged to home on hospital day 7.
REFERENCES 1. Johnston KW, Rutherford RB, Tilson MD, et al. Suggested standards for
reporting on arterial aneurysms. Subcommittee on Reporting Standards for Arterial Aneurysms, Ad Hoc Committee on Reporting Standards, Society for Vascular Surgery and North American Chapter, Interna-tional Society of Cardiovascular Surgery. J Vasc Surg. 1991;13(3): 452–458.
2. Zöllner N, Zoller WG, Spengel F, et al. The spontaneous course of small abdominal aortic aneurysms. Aneurysmal growth rates and life expec-tancy. Klin Wochenschr. 1991;699(14):633–639.
3. Ernst CB. Abdominal aortic aneurysm. N Engl J Med. 1993;328(16): 1167–1172.
4. Vardulaki KA, Prevost TC, Walker NM, et al. Growth rates and risk of rupture of abdominal aortic aneurysms. Br J Surg. 1998;58: 1674–1680.
5. Guirguis EM, Barber GG. The natural history of abdominal aortic aneu-rysms. Am J Surg. 1991;162(5):481–483.
6. Nordon IM, Hinchliffe RJ, Loftus IM, et al. Pathophysiology and epidemiology of abdominal aortic aneurysms. Nat Rev Cardiol. 2011;8(2):92–102.
7. Centers for Disease Control and Prevention, National Center for Health Statistics. Underlying Cause of Death 1999–2009 on CDC WONDER Online Database, released 2012. http://wonder.cdc.gov/ucd-icd10.html. Accessed September 7, 2012.
8. Choke E, Vijaynagar B, Thompson J, et al. Changing epidemiology of abdominal aortic aneurysms in England and Wales: older and more benign? Circulation. 2012;125(13):1617–1625.
9. Minino AM, Arias E, Kochanek KD, et al. Deaths: final data for 2000. Natl Vital Stat Rep. 2002;50(15):1–119.
10. Johansson G, Swedenborg J. Ruptured abdominal aortic aneurysms: a study of incidence and mortality. Br J Surg. 1986;73(2):101–103.
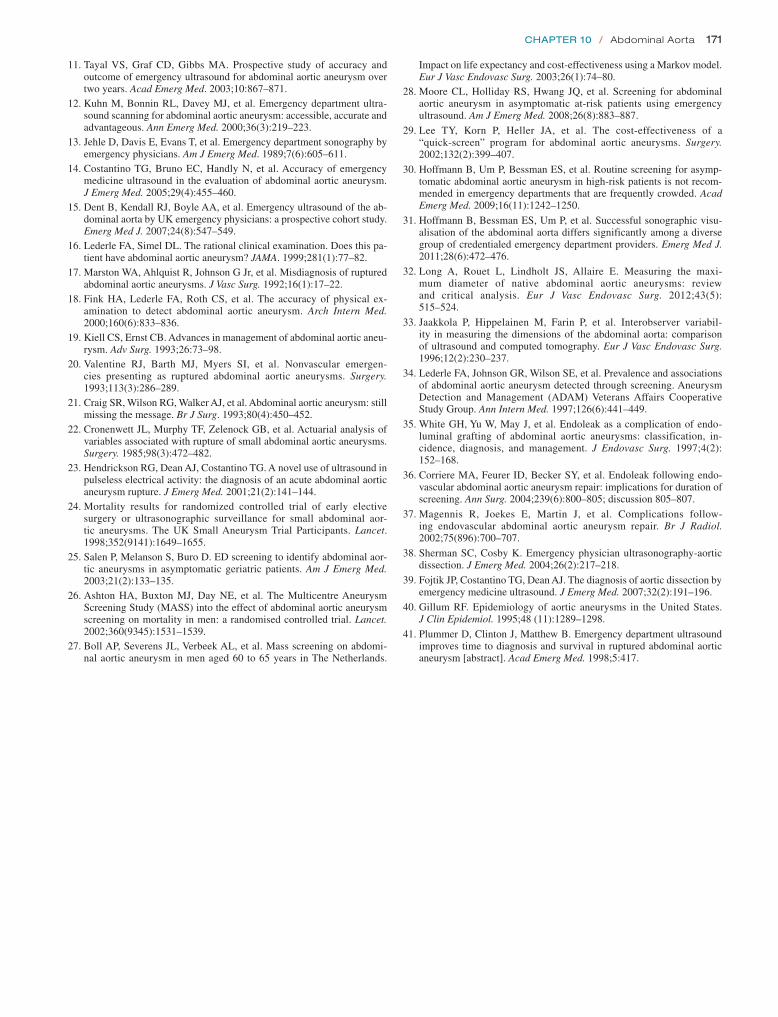
Chapter 10 / Abdominal Aorta 171
Impact on life expectancy and cost-effectiveness using a Markov model. Eur J Vasc Endovasc Surg. 2003;26(1):74–80.
28. Moore CL, Holliday RS, Hwang JQ, et al. Screening for abdominal aortic aneurysm in asymptomatic at-risk patients using emergency ultrasound. Am J Emerg Med. 2008;26(8):883–887.
29. Lee TY, Korn P, Heller JA, et al. The cost-effectiveness of a “quick-screen” program for abdominal aortic aneurysms. Surgery. 2002;132(2):399–407.
30. Hoffmann B, Um P, Bessman ES, et al. Routine screening for asymp-tomatic abdominal aortic aneurysm in high-risk patients is not recom-mended in emergency departments that are frequently crowded. Acad Emerg Med. 2009;16(11):1242–1250.
31. Hoffmann B, Bessman ES, Um P, et al. Successful sonographic visu-alisation of the abdominal aorta differs significantly among a diverse group of credentialed emergency department providers. Emerg Med J. 2011;28(6):472–476.
32. Long A, Rouet L, Lindholt JS, Allaire E. Measuring the maxi-mum diameter of native abdominal aortic aneurysms: review and critical analysis. Eur J Vasc Endovasc Surg. 2012;43(5): 515–524.
33. Jaakkola P, Hippelainen M, Farin P, et al. Interobserver variabil-ity in measuring the dimensions of the abdominal aorta: comparison of ultrasound and computed tomography. Eur J Vasc Endovasc Surg. 1996;12(2):230–237.
34. Lederle FA, Johnson GR, Wilson SE, et al. Prevalence and associations of abdominal aortic aneurysm detected through screening. Aneurysm Detection and Management (ADAM) Veterans Affairs Cooperative Study Group. Ann Intern Med. 1997;126(6):441–449.
35. White GH, Yu W, May J, et al. Endoleak as a complication of endo-luminal grafting of abdominal aortic aneurysms: classification, in-cidence, diagnosis, and management. J Endovasc Surg. 1997;4(2): 152–168.
36. Corriere MA, Feurer ID, Becker SY, et al. Endoleak following endo-vascular abdominal aortic aneurysm repair: implications for duration of screening. Ann Surg. 2004;239(6):800–805; discussion 805–807.
37. Magennis R, Joekes E, Martin J, et al. Complications follow-ing endovascular abdominal aortic aneurysm repair. Br J Radiol. 2002;75(896):700–707.
38. Sherman SC, Cosby K. Emergency physician ultrasonography-aortic dissection. J Emerg Med. 2004;26(2):217–218.
39. Fojtik JP, Costantino TG, Dean AJ. The diagnosis of aortic dissection by emergency medicine ultrasound. J Emerg Med. 2007;32(2):191–196.
40. Gillum RF. Epidemiology of aortic aneurysms in the United States. J Clin Epidemiol. 1995;48 (11):1289–1298.
41. Plummer D, Clinton J, Matthew B. Emergency department ultrasound improves time to diagnosis and survival in ruptured abdominal aortic aneurysm [abstract]. Acad Emerg Med. 1998;5:417.
11. Tayal VS, Graf CD, Gibbs MA. Prospective study of accuracy and outcome of emergency ultrasound for abdominal aortic aneurysm over two years. Acad Emerg Med. 2003;10:867–871.
12. Kuhn M, Bonnin RL, Davey MJ, et al. Emergency department ultra-sound scanning for abdominal aortic aneurysm: accessible, accurate and advantageous. Ann Emerg Med. 2000;36(3):219–223.
13. Jehle D, Davis E, Evans T, et al. Emergency department sonography by emergency physicians. Am J Emerg Med. 1989;7(6):605–611.
14. Costantino TG, Bruno EC, Handly N, et al. Accuracy of emergency medicine ultrasound in the evaluation of abdominal aortic aneurysm. J Emerg Med. 2005;29(4):455–460.
15. Dent B, Kendall RJ, Boyle AA, et al. Emergency ultrasound of the ab-dominal aorta by UK emergency physicians: a prospective cohort study. Emerg Med J. 2007;24(8):547–549.
16. Lederle FA, Simel DL. The rational clinical examination. Does this pa-tient have abdominal aortic aneurysm? JAMA. 1999;281(1):77–82.
17. Marston WA, Ahlquist R, Johnson G Jr, et al. Misdiagnosis of ruptured abdominal aortic aneurysms. J Vasc Surg. 1992;16(1):17–22.
18. Fink HA, Lederle FA, Roth CS, et al. The accuracy of physical ex-amination to detect abdominal aortic aneurysm. Arch Intern Med. 2000;160(6):833–836.
19. Kiell CS, Ernst CB. Advances in management of abdominal aortic aneu-rysm. Adv Surg. 1993;26:73–98.
20. Valentine RJ, Barth MJ, Myers SI, et al. Nonvascular emergen-cies presenting as ruptured abdominal aortic aneurysms. Surgery. 1993;113(3):286–289.
21. Craig SR, Wilson RG, Walker AJ, et al. Abdominal aortic aneurysm: still missing the message. Br J Surg. 1993;80(4):450–452.
22. Cronenwett JL, Murphy TF, Zelenock GB, et al. Actuarial analysis of variables associated with rupture of small abdominal aortic aneurysms. Surgery. 1985;98(3):472–482.
23. Hendrickson RG, Dean AJ, Costantino TG. A novel use of ultrasound in pulseless electrical activity: the diagnosis of an acute abdominal aortic aneurysm rupture. J Emerg Med. 2001;21(2):141–144.
24. Mortality results for randomized controlled trial of early elective surgery or ultrasonographic surveillance for small abdominal aor-tic aneurysms. The UK Small Aneurysm Trial Participants. Lancet. 1998;352(9141):1649–1655.
25. Salen P, Melanson S, Buro D. ED screening to identify abdominal aor-tic aneurysms in asymptomatic geriatric patients. Am J Emerg Med. 2003;21(2):133–135.
26. Ashton HA, Buxton MJ, Day NE, et al. The Multicentre Aneurysm Screening Study (MASS) into the effect of abdominal aortic aneurysm screening on mortality in men: a randomised controlled trial. Lancet. 2002;360(9345):1531–1539.
27. Boll AP, Severens JL, Verbeek AL, et al. Mass screening on abdomi-nal aortic aneurysm in men aged 60 to 65 years in The Netherlands.

172
to a pelvic mass or bladder outlet obstruction such as occurs with benign prostatic hypertrophy, prostate cancer, and blad-der cancer (5). The absence of hydronephrosis in the face of acute abdominal pain may, in some cases, lead the clinician to an alternative diagnosis.
Assessment of ureteral jets in the bladder may give addi-tional information regarding ureteral obstruction and its de-gree. Further, evaluation of the bladder is being emphasized more than ever due to an increased recognition of bladder infection after catheterization. Evaluation of postvoid resid-ual, still a necessary procedure in the emergency department (ED), can be accomplished solely with ultrasound. Addition-ally, unnecessary catheterization of empty bladders can also be avoided, and is especially problematic in young children who cannot communicate whether their bladders are full or empty.
In addition, renal ultrasound may aid the clinician in the initial assessment of acute renal failure to rapidly detect bilateral obstruction, which could lead to salvage of renal function (6). This is especially true in patients who may not be able to provide their own histories or make complaints. Such patients may suffer a bladder outlet obstruction and subsequent renal failure without anyone knowing the patient has any discomfort. The clinical presentation of renal colic, pyelonephritis, biliary colic, and aortic aneurysm may over-lap. Thus, the renal ultrasound examination will often flow into evaluation of other structures such as the gallbladder, liver, common bile duct, and aorta to detect other possible etiologies of acute pain. Once proficiency has been achieved, this simple bedside assessment for hydronephrosis can ex-pedite the evaluation and treatment for many patients with complaints of flank and abdominal pain.
INTRODUCTIONFrequently viewed by emergency physicians as part of other ultrasound examinations, ultrasound of the kidneys is often overlooked as a valuable diagnostic tool. With computed to-mography (CT) readily available in many institutions, renal ultrasound is often thought of as a second-line modality (1). However, a focused renal ultrasound can give valuable and rapid information at the bedside about renal obstruction. Consequently, once proficient at this exam, the emergency physician has a powerful tool in the evaluation of flank, ab-dominal, and pelvic pain. Recent years have seen the recogni-tion that excess medical radiation is not only costly, but also dangerous as seen by expected increased future cancer rates among patients receiving multiple imaging studies, including CT, intravenous pyelograms (IVP), and plain radiography. This provides additional strength to arguments for the use of ultrasound by emergency physicians that can be used to gain support from hospital administration for start-up ultrasound programs.
CLINICAL APPLICATIONSThe primary clinical utility of focused renal ultrasound in the emergency setting is for evaluation of acute flank pain, abdominal pain, and hematuria (2). After appropri-ate training, emergency physicians can learn to identify hydronephrosis and intrarenal stones (3). The detection of hydronephrosis supports a clinical diagnosis of renal colic and possibly ureteral obstruction (4). The presence of bilat-eral hydronephrosis, in contrast, may be an important clue
ARTIFACTS AND PITFALLS . . . . . . . . . . . . . . . . . . . . . . . . . 181USE OF THE IMAGE IN CLINICAL
DECISION MAKING . . . . . . . . . . . . . . . . . . . . . . . . . . . . . 181CORRELATION WITH OTHER IMAGING
MODALITIES . . . . . . . . . . . . . . . . . . . . . . . . . . . . . . . . . . 182INCIDENTAL FINDINGS . . . . . . . . . . . . . . . . . . . . . . . . . . . . 182
Renal Masses . . . . . . . . . . . . . . . . . . . . . . . . . . . . . . . 182CLINICAL CASE . . . . . . . . . . . . . . . . . . . . . . . . . . . . . . . . . . 184
INTRODUCTION . . . . . . . . . . . . . . . . . . . . . . . . . . . . . . . . . . 172CLINICAL APPLICATIONS . . . . . . . . . . . . . . . . . . . . . . . . . . 172IMAGE ACQUISITION . . . . . . . . . . . . . . . . . . . . . . . . . . . . . . 173
Patient Preparation . . . . . . . . . . . . . . . . . . . . . . . . . . . 173Imaging Technique . . . . . . . . . . . . . . . . . . . . . . . . . . . 174
NORMAL ULTRASOUND ANATOMY AND LANDMARKS . . . . 177PATHOLOGY . . . . . . . . . . . . . . . . . . . . . . . . . . . . . . . . . . . . . 178
Hydronephrosis . . . . . . . . . . . . . . . . . . . . . . . . . . . . . . 178Nephrolithiasis . . . . . . . . . . . . . . . . . . . . . . . . . . . . . . 180Urinary Retention . . . . . . . . . . . . . . . . . . . . . . . . . . . . 181
Michael Blaivas
Kidneys11

Chapter 11 / Kidneys 173
IMAGE ACQUISITIONThe ability to obtain quality renal images is one of the easier skills to master in emergency sonography (2). Both kidneys are relatively superficial; both are located adjacent to solid viscera (liver, spleen) that provide favorable acoustic win-dows. In addition, the kidneys are often used as reference structures for other abdominal ultrasound examinations, par-ticularly the trauma or Focused Assessment with Sonogra-phy for Trauma (FAST) scan. It is important, nonetheless, to follow the same basic principles of all ultrasound examina-tions: scan slowly, scan methodically, and image in at least two planes in order to conceptually convert two-dimensional information into three-dimensional mental images.
Patient PreparationPatients requiring emergency renal ultrasounds are often in considerable pain, especially those with renal colic. In order to obtain an adequate examination, it is essential that pain be controlled. It will be necessary for the patient to cooperate
with instructions to position themselves and control their re-spiratory rate and pattern upon request by the sonographer. Movement by the patient should be minimized if possible, and some renal colic patients cannot remain still enough without analgesia.
The kidneys are best visualized in a fasted and hydrated patient (7). However, this is not always possible in the emer-gency setting. Bowel gas, ideally absent in the fasted patient, can present considerable interference during a renal ultra-sound examination. Hydration status also affects the sono-graphic appearance of the kidney and bladder. Indeed, the state of hydration can mislead the examiner when attempt-ing to determine the presence or absence of hydronephrosis. A well-hydrated patient may have a dilated renal pelvis that appears similar to mild hydronephrosis (8). A markedly dehydrated patient with obstruction may not demonstrate a dilated renal collecting system (9).
Most sonographers begin with the patient in a supine position similar to that used for general abdominal scans (Figs. 11.1 and 11.2). This position provides the most
A B
C D
FIGURE 11.1. Guide to Image Acquisition. The kidneys can be imaged with the patient in the supine or lateral decubitus posi-tion . Place the transducer in the right flank and first image in the long axis of the kidney (A) . Rotate the transducer 90 degree to view the short axis . Alternatively, the kidney may be viewed through an intercostal approach (B) . The left kidney can be imaged through the spleen from a left flank (C) or intercostal (D) approach .

174 SeCtion iii / Evaluation of Abdominal Conditions
intuitive location for anatomical structures when imaged with ultrasound. In order to build a three-dimensional men-tal image of the kidney from two-dimensional frames, all of the anterior, posterior, superior, inferior, medial, and lateral relationships of the kidney must be understood. Relation-ships between the liver and the right kidney and between the spleen and the left kidney are easy to conceptualize (Fig. 11.3).
It is important when using the supine view to have the patient lie as flat as possible. When the head or the trunk is el-evated, the kidney tends to tuck under the rib margin, making
FIGURE 11.2. A Patient is Seen in the Supine Position. This is the typical starting point for an emergency ultrasound of the kidneys .
Diaphragm
Adrenal gland
Renal artery
Aorta
Kidney
Renal vein
Ureter
Inferior vena cava
FIGURE 11.3. The Kidneys and Surrounding Structures. Note the relative positions of the aorta, inferior vena cava (IVC), renal vessels, collecting system, and ureters .
renal imaging more difficult. In some circumstances, how-ever, adequate visualization is not obtainable from the supine position. In these instances the patient can be moved to alter-native positions, such as the right and left lateral decubitus or prone positions (Fig. 11.1B, D). In the decubitus position the kidney of interest is elevated, that is, the left lateral decubitus position is used to visualize the right kidney. This allows for better use of both the liver and the spleen as acoustic windows for kidney visualization. The prone position is rarely utilized, but may be necessary occasionally. In this position, a pillow is placed under the abdomen to use the paraspinal muscles as an acoustic window. Often these positions are utilized in a stepwise fashion to obtain the best view of the kidney.
During the renal ultrasound examination, it may be neces-sary for patients to hold their breath or vary their respirations. When the patient takes a large breath, the expanding lungs push down the diaphragm and kidney toward the pelvis. This allows more of the kidney to be visualized from an anterior or midaxillary approach. Further, rapid breathing can create so much motion that image quality degrades and interpreta-tion is made more difficult. Therefore, it is often necessary for the patient to hold his/her breath, usually at maximal in-spiration, especially if motion-sensitive Doppler ultrasound is utilized during the examination.
Imaging TechniqueA 3 to 5 MHz curvilinear array transducer commonly used for general abdominal scanning is appropriate for most renal scans as well (Fig. 11.4). This frequency provides a good compromise between adequate penetration and good reso-lution of renal structures. However, the sonographer should

Chapter 11 / Kidneys 175
FIGURE 11.4. An Image of a Curved Linear Array Typically Used for Abdominal Ultrasound.
FIGURE 11.5. The Ultrasound Transducer is Positioned High Over the Patient’s Ribs to Attempt Visualization of the Kidney Through the Intercostal Spaces.
FIGURE 11.6. An Image of a Phased Array Typically Used for Cardiac Ultrasound. But one that can be very useful for imaging the kidneys through tight rib spaces .
recognize that small stones that may be encountered in the renal parenchyma might not be visualized at this resolution. Higher frequency transducers, up to 7.5 MHz, may be used if the person is thin or if a small child is being scanned. If a curvilinear array transducer is used, it is important to recog-nize that only structures directly in line with the footprint of the probe are optimally imaged; thus, structures of interest should be visualized in the central field of the probe. Phased array cardiac probes can be used to image the kidneys as well, but do so better when using an abdominal setting. These transducers perform comparatively well when scan-ning in between ribs, but tend to give lower quality images than a curvilinear transducer.
When the standard axillary approach fails to provide a good image, a trans-thoracic approach provides an alterna-tive approach (Fig. 11.5). If the sonographer has a choice, this is when a phased array transducer offers advantages over the curvilinear array transducer; its small footprint facilitates imaging through the narrow rib space, although it offers less definition and a somewhat poorer image qual-ity (Fig. 11.6).
FIGURE 11.7. A Longitudinal Image of the Right Kidney is Seen. No hydronephrosis or other pathology is noted . The superior pole of the kidney is on the left side of the image and inferior pole on the right side .
The images required for a renal ultrasound include both the longitudinal and the transverse views through both kid-neys (Figs. 11.7 and 11.8). Generally, the contralateral side is imaged first. This is done in order to have a baseline com-parison to evaluate the potentially abnormal kidney. Again, each kidney needs to be imaged in at least two planes in entirety and “spot checks” scanning only through a portion of the kidney such as the hilar area are not advisable.
To image the kidney, place the probe below the ribs in the axillary line with the probe indicator at a 12 o’clock position perpendicular to the costal margin (Figs. 11.1A, B and 11.9). Sweep the probe from an anterior to a posterior direction until the kidney is located. It may be necessary in some cases to direct the ultrasound beam cranially, under the costal margin. Once located, rotate the probe until the long axis of the kidney is in full view (Fig. 11.7). In this longitudinal view, the superior pole of the kidney should be on the left side of the ultrasound screen and the inferior pole on the right side of the screen (Fig. 11.10). As the probe is swept in this plane, a three-dimensional construct of the long axis of the kidney can be mentally assembled. In most

176 SeCtion iii / Evaluation of Abdominal Conditions
FIGURE 11.9. An Ultrasound Transducer is Positioned on the Patient’s Right Side in Preparation for a Renal Scan.
FIGURE 11.10. Image of the Kidney on an Ultrasound Machine Screen.
FIGURE 11.11. Short Axis Image of the Right Kidney through the Hilum. The artery (A), vein (V ), and ureter (U ) are seen exiting the kidney .
it is important to position the probe in such a manner as to minimize rib shadowing. It should be noted that the kidneys lie in an oblique orientation relative to the long axis of the body (Fig. 11.3). A true long-axis view of the kidney may require the transducer to be rotated slightly away from the long axis of the body. For the right kidney, the probe indica-tor more commonly comes to rest at a 10 o’clock position to view the long axis; for the left kidney, the indicator may need to be oriented at 2 o’clock (Figs. 11.1B, D). Once the kidney is visualized, proper images should be based on in-ternal guidelines and not artificial external landmarks. In other words, the image on the screen is matched to a mental image of a standard renal view.
The transverse position view is obtained by rotating 90 degrees counterclockwise from the longitudinal view (Fig. 11.8). Transverse images of the kidney are made from the cranial to the caudal poles by angling the transducer along the length of the kidney. The hilum (located in the mid-portion of the kidney) should be imaged to assess the renal artery, vein, and ureter (Fig. 11.11).
The right kidney is usually best imaged near the anterior to mid-axillary line. This kidney is slightly more inferior in location than the left because the right kidney is displaced by the liver. The left kidney is best imaged between the midaxil-lary line and the posterior axillary line, depending upon the size and location of the spleen (Fig. 11.12).
Once both kidneys are imaged in both the longitudinal and transverse views, comparison views are made. The dual function on the ultrasound allows display of both kidney images on one screen (Fig. 11.13). Similar views of each kidney are obtained. This allows for the comparison of the two kidneys. Labeling of each kidney is essential to prevent confusion.
Before concluding the renal scan, the bladder should also be imaged. The transducer should be placed in the midline just above the pubis and the bladder imaged in two dimensions (Fig. 11.14). The bladder provides additional information that is often relevant to the renal scan. Occa-sionally, pelvic pathology may be noted that will explain abnormalities detected in the kidneys, such as a dilated ( obstructed bladder).
FIGURE 11.8. The Normal Right Kidney is Shown in Short Axis.
cases, the liver or spleen is used as an acoustic window to provide an optimal image of the kidney. A noticeable dif-ference will be appreciated in most cases when the liver or kidney is no longer under the transducer to provide a favorable window. When the transcostal approach is used

Chapter 11 / Kidneys 177
adrenal glands, renal hila, proximal collecting system, and the perinephric fat. The right kidney is bounded by the liver anteriorly, the liver and diaphragm superiorly, and the psoas and quadratus lumborum muscles posteriorly. The left kid-ney is bounded by the spleen, large and small bowel, and stomach anteriorly; the diaphragm superiorly; and the psoas and quadratus lumborum muscles posteriorly. Both kidneys lie between the 12th thoracic and the 4th lumbar vertebrae. Usually, the right kidney is located more inferior than the left due to displacement by the liver, but position will vary with changes in posture and respiration.
The kidneys are connected to the body via the renal ar-tery and vein and the ureter (Fig. 11.15). The renal arteries branch directly from the aorta laterally (10). Most of the population has a single renal artery; an accessory artery is present in 30% of the population (11). The renal vein drains directly into the inferior vena cava (IVC). The left renal vein crosses the midline of the body and can be seen in a transverse plane crossing between the aorta and the superior mesenteric artery as it crosses the midline toward the IVC. The right renal vein lies more proximate to the IVC and has a shorter course. The renal pelvis drains into the ureter that travels parallel to the psoas muscles en route to the bladder (Fig. 11.3).
The kidneys are bean-shaped structures that average 9 to 13 cm in length, 4 to 6 cm in width, and 2.5 to 3.5 cm in thickness (Fig. 11.15) (12). Each kidney is surrounded by a fibrous capsule, the true capsule; an adipose capsule that contains perirenal fat; and the renal fascia known as Gerota’s fascia. The kidney can be divided into two major parts: the parenchyma and the renal sinus.
The central portion of the kidney is referred to as the renal sinus. The sinus comprises the major and minor calyces, ar-teries, veins, lymphatics, and peripelvic fat (Fig. 11.15). The fibrofatty tissue within the renal sinus imparts a characteris-tic echogenicity. When the sinus is distended by excessive hydration or in the face of obstruction, the central renal sinus will be anechoic. The entrance to the sinus is referred to as the hilum. The minor calyces join to form the major calyces, which in turn join to form the renal pelvis.
The parenchyma surrounds the renal sinus on all sides ex-cept at the hilum and is composed of the cortex and the me-dulla. The cortex outlines the medulla, the functional unit of the kidney that is responsible for the formation of urine. The renal cortex tends to be slightly less echodense than the adja-cent liver and spleen. Abnormalities in this echotexture may reflect suboptimal gain control or intrinsic renal disease. The
NORMAL ULTRASOUND ANATOMY AND LANDMARKSThe kidneys are paired retroperitoneal organs that lie lateral to the aorta and the inferior vena cava and inferior to the diaphragm (Fig. 11.3). The kidneys are bounded by Gero-ta’s fascia, a tough connective tissue that also surrounds the
FIGURE 11.12. The Transducer is Positioned More Posteriorly on the Left Side. This position will be required in many patients .
FIGURE 11.13. Both Kidneys are Shown Side by Side, Allowing for Direct Comparison.
FIGURE 11.14. The Bladder is Seen in Long and Short Axis. This should be part of every complete renal ultrasound examination . Longitudinal view (left), Transverse view (right) .
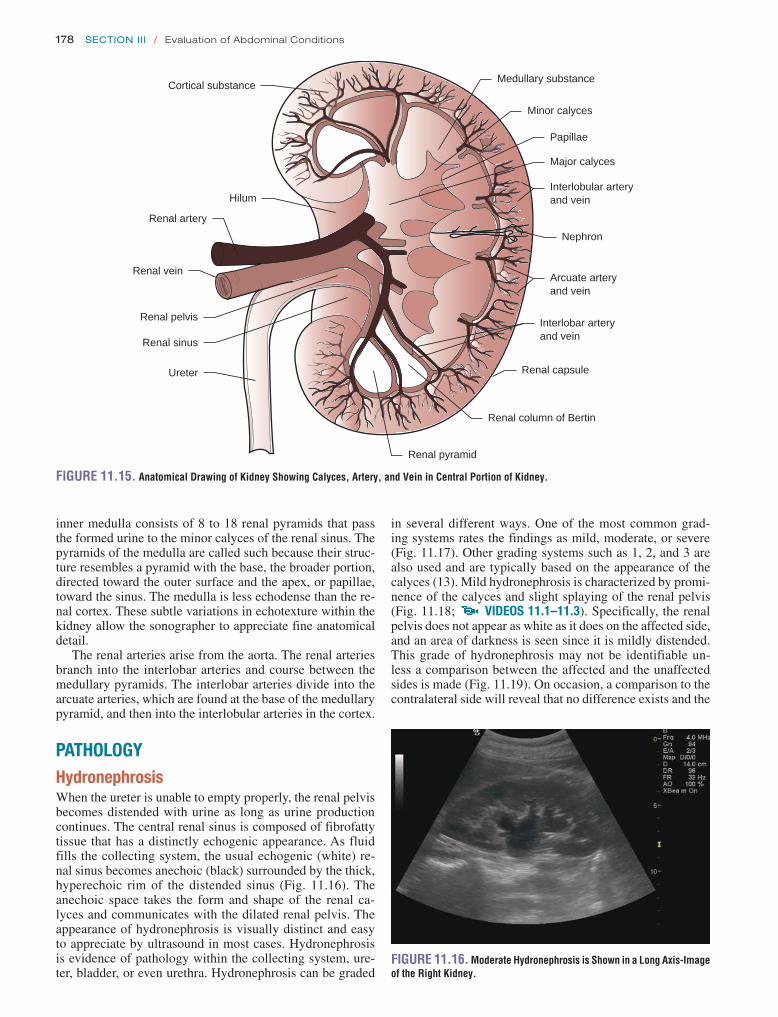
178 SeCtion iii / Evaluation of Abdominal Conditions
in several different ways. One of the most common grad-ing systems rates the findings as mild, moderate, or severe (Fig. 11.17). Other grading systems such as 1, 2, and 3 are also used and are typically based on the appearance of the calyces (13). Mild hydronephrosis is characterized by promi-nence of the calyces and slight splaying of the renal pelvis (Fig. 11.18; VIDEOS 11 .1–11 .3). Specifically, the renal pelvis does not appear as white as it does on the affected side, and an area of darkness is seen since it is mildly distended. This grade of hydronephrosis may not be identifiable un-less a comparison between the affected and the unaffected sides is made (Fig. 11.19). On occasion, a comparison to the contralateral side will reveal that no difference exists and the
inner medulla consists of 8 to 18 renal pyramids that pass the formed urine to the minor calyces of the renal sinus. The pyramids of the medulla are called such because their struc-ture resembles a pyramid with the base, the broader portion, directed toward the outer surface and the apex, or papillae, toward the sinus. The medulla is less echodense than the re-nal cortex. These subtle variations in echotexture within the kidney allow the sonographer to appreciate fine anatomical detail.
The renal arteries arise from the aorta. The renal arteries branch into the interlobar arteries and course between the medullary pyramids. The interlobar arteries divide into the arcuate arteries, which are found at the base of the medullary pyramid, and then into the interlobular arteries in the cortex.
PATHOLOGYHydronephrosisWhen the ureter is unable to empty properly, the renal pelvis becomes distended with urine as long as urine production continues. The central renal sinus is composed of fibrofatty tissue that has a distinctly echogenic appearance. As fluid fills the collecting system, the usual echogenic (white) re-nal sinus becomes anechoic (black) surrounded by the thick, hyperechoic rim of the distended sinus (Fig. 11.16). The anechoic space takes the form and shape of the renal ca-lyces and communicates with the dilated renal pelvis. The appearance of hydronephrosis is visually distinct and easy to appreciate by ultrasound in most cases. Hydronephrosis is evidence of pathology within the collecting system, ure-ter, bladder, or even urethra. Hydronephrosis can be graded
Cortical substance
Hilum
Renal artery
Renal vein
Renal pelvis
Renal sinus
Ureter
Minor calyces
Medullary substance
Renal pyramid
Papillae
Major calyces
Nephron
Arcuate arteryand vein
Interlobar arteryand vein
Interlobular arteryand vein
Renal capsule
Renal column of Bertin
FIGURE 11.15. Anatomical Drawing of Kidney Showing Calyces, Artery, and Vein in Central Portion of Kidney.
FIGURE 11.16. Moderate Hydronephrosis is Shown in a Long Axis-Image of the Right Kidney.

Chapter 11 / Kidneys 179
Mild Moderate Severe
FIGURE 11.17. The Grading of Hydronephrosis. Mild hydronephrosis is noted by distension of the typically echogenic renal pelvis . Moderate hydronephrosis is seen to splay the calyces and distend the medullary pyramids . Marked hydro-nephrosis extends to the cortex . (Redrawn from Ma J, Mateer J, eds . Emergency Ultrasound . New York, NY: McGraw-Hill; 2003 .)
A
FIGURE 11.18. Mild Hydronephrosis is Seen in the Right Kidney. Long axis (A), short axis (B) .
B
FIGURE 11.19. Dual View for Comparison of Mild Hydronephrosis on Left and Normal Kidney on Right.
FIGURE 11.20. Dual View for Comparison of Mild Hydronephrosis on Left and Identical on Right.
FIGURE 11.21. Moderate Hydronephrosis is Seen in the Long Axis of the Right Kidney.
patient may simply be well hydrated (Fig. 11.20). Moder-ate hydronephrosis is typically obvious without comparison to the contralateral side, a comparison that should still be made for completeness. The typically white renal pelvis is dilated with a large amount of dark space. The cortex is of normal echogenicity, but the distention involves the medul-lary pyramids (Fig. 11.21; VIDEOS 11 .4–11 .9). It is of utility to use color Doppler to insure that what appears to be hydroureter is not actually ureter, renal vein, and artery ly-ing side by side and giving the appearance of a dilated ureter (Fig. 11.22). Severe hydronephrosis shows significant dila-tion of the renal pelvis (Fig. 11.23; VIDEOS 11 .10–11 .12). The cortex is typically more echogenic, and when the ob-struction has been present for a long time can become very bright and may signify damage. Again, a comparison of the two sides is warranted.
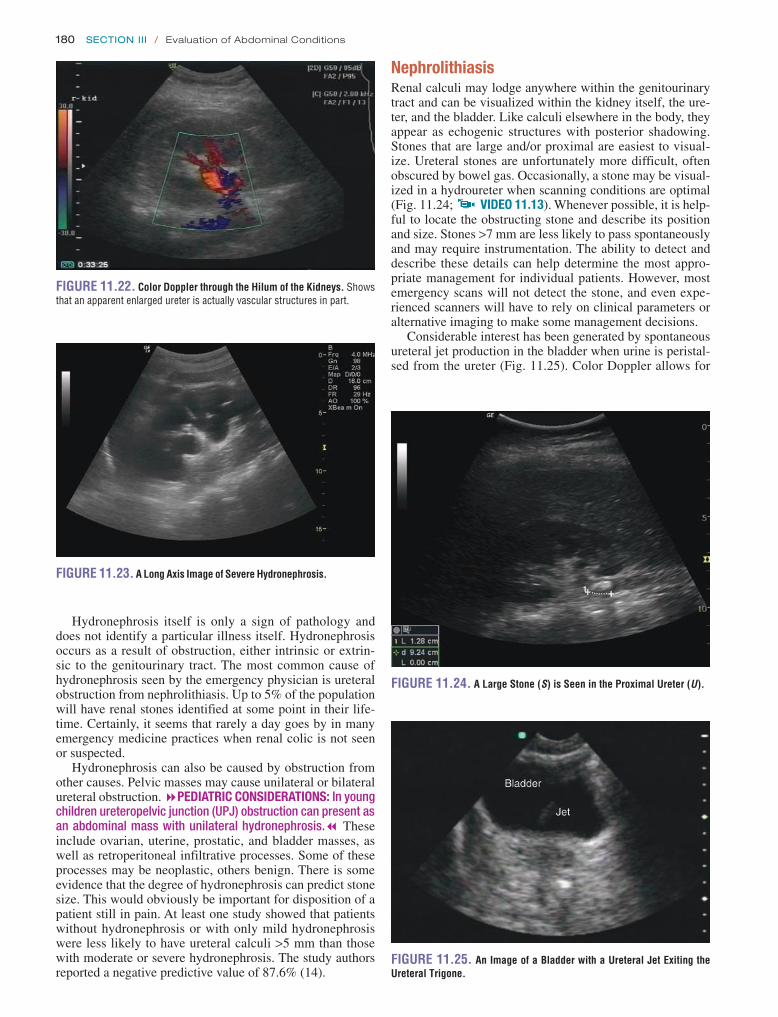
180 SeCtion iii / Evaluation of Abdominal Conditions
NephrolithiasisRenal calculi may lodge anywhere within the genitourinary tract and can be visualized within the kidney itself, the ure-ter, and the bladder. Like calculi elsewhere in the body, they appear as echogenic structures with posterior shadowing. Stones that are large and/or proximal are easiest to visual-ize. Ureteral stones are unfortunately more difficult, often obscured by bowel gas. Occasionally, a stone may be visual-ized in a hydroureter when scanning conditions are optimal (Fig. 11.24; VIDEO 11 .13). Whenever possible, it is help-ful to locate the obstructing stone and describe its position and size. Stones >7 mm are less likely to pass spontaneously and may require instrumentation. The ability to detect and describe these details can help determine the most appro-priate management for individual patients. However, most emergency scans will not detect the stone, and even expe-rienced scanners will have to rely on clinical parameters or alternative imaging to make some management decisions.
Considerable interest has been generated by spontaneous ureteral jet production in the bladder when urine is peristal-sed from the ureter (Fig. 11.25). Color Doppler allows for
Hydronephrosis itself is only a sign of pathology and does not identify a particular illness itself. Hydronephrosis occurs as a result of obstruction, either intrinsic or extrin-sic to the genitourinary tract. The most common cause of hydronephrosis seen by the emergency physician is ureteral obstruction from nephrolithiasis. Up to 5% of the population will have renal stones identified at some point in their life-time. Certainly, it seems that rarely a day goes by in many emergency medicine practices when renal colic is not seen or suspected.
Hydronephrosis can also be caused by obstruction from other causes. Pelvic masses may cause unilateral or bilateral ureteral obstruction. 8PEDIATRIC CONSIDERATIONS: In young children ureteropelvic junction (UPJ) obstruction can present as an abdominal mass with unilateral hydronephrosis.7 These include ovarian, uterine, prostatic, and bladder masses, as well as retroperitoneal infiltrative processes. Some of these processes may be neoplastic, others benign. There is some evidence that the degree of hydronephrosis can predict stone size. This would obviously be important for disposition of a patient still in pain. At least one study showed that patients without hydronephrosis or with only mild hydronephrosis were less likely to have ureteral calculi >5 mm than those with moderate or severe hydronephrosis. The study authors reported a negative predictive value of 87.6% (14).
FIGURE 11.22. Color Doppler through the Hilum of the Kidneys. Shows that an apparent enlarged ureter is actually vascular structures in part .
FIGURE 11.23. A Long Axis Image of Severe Hydronephrosis.
FIGURE 11.24. A Large Stone (S) is Seen in the Proximal Ureter (U).
FIGURE 11.25. An Image of a Bladder with a Ureteral Jet Exiting the Ureteral Trigone.
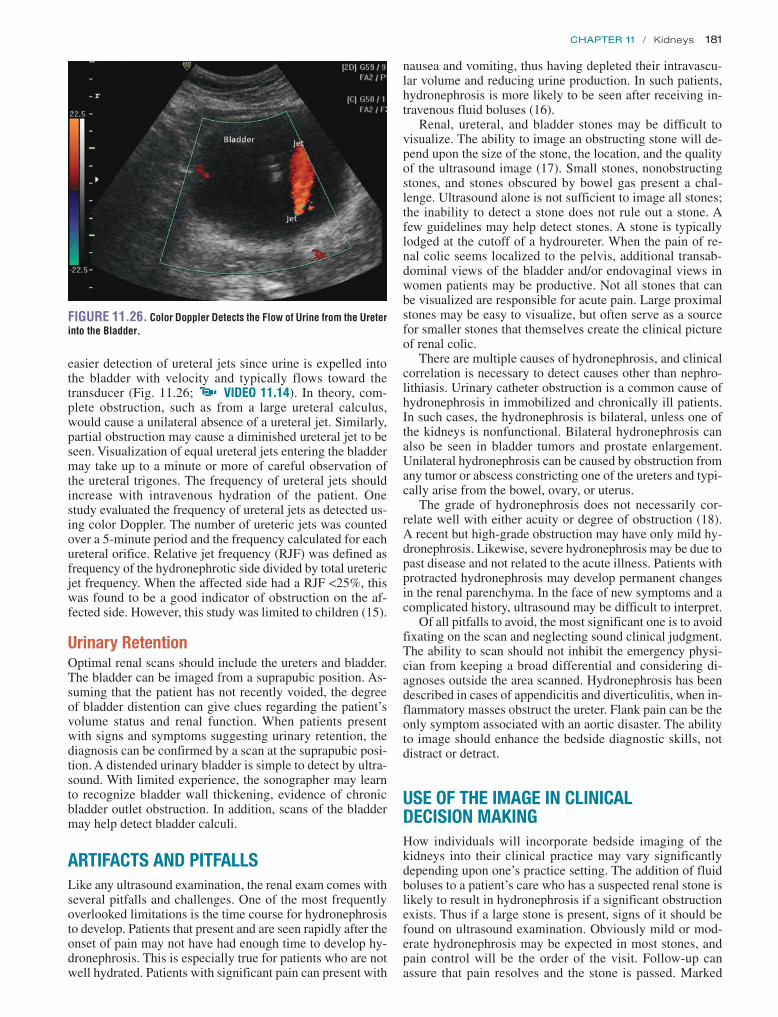
Chapter 11 / Kidneys 181
nausea and vomiting, thus having depleted their intravascu-lar volume and reducing urine production. In such patients, hydronephrosis is more likely to be seen after receiving in-travenous fluid boluses (16).
Renal, ureteral, and bladder stones may be difficult to visualize. The ability to image an obstructing stone will de-pend upon the size of the stone, the location, and the quality of the ultrasound image (17). Small stones, nonobstructing stones, and stones obscured by bowel gas present a chal-lenge. Ultrasound alone is not sufficient to image all stones; the inability to detect a stone does not rule out a stone. A few guidelines may help detect stones. A stone is typically lodged at the cutoff of a hydroureter. When the pain of re-nal colic seems localized to the pelvis, additional transab-dominal views of the bladder and/or endovaginal views in women patients may be productive. Not all stones that can be visualized are responsible for acute pain. Large proximal stones may be easy to visualize, but often serve as a source for smaller stones that themselves create the clinical picture of renal colic.
There are multiple causes of hydronephrosis, and clinical correlation is necessary to detect causes other than nephro-lithiasis. Urinary catheter obstruction is a common cause of hydronephrosis in immobilized and chronically ill patients. In such cases, the hydronephrosis is bilateral, unless one of the kidneys is nonfunctional. Bilateral hydronephrosis can also be seen in bladder tumors and prostate enlargement. Unilateral hydronephrosis can be caused by obstruction from any tumor or abscess constricting one of the ureters and typi-cally arise from the bowel, ovary, or uterus.
The grade of hydronephrosis does not necessarily cor-relate well with either acuity or degree of obstruction (18). A recent but high-grade obstruction may have only mild hy-dronephrosis. Likewise, severe hydronephrosis may be due to past disease and not related to the acute illness. Patients with protracted hydronephrosis may develop permanent changes in the renal parenchyma. In the face of new symptoms and a complicated history, ultrasound may be difficult to interpret.
Of all pitfalls to avoid, the most significant one is to avoid fixating on the scan and neglecting sound clinical judgment. The ability to scan should not inhibit the emergency physi-cian from keeping a broad differential and considering di-agnoses outside the area scanned. Hydronephrosis has been described in cases of appendicitis and diverticulitis, when in-flammatory masses obstruct the ureter. Flank pain can be the only symptom associated with an aortic disaster. The ability to image should enhance the bedside diagnostic skills, not distract or detract.
USE OF THE IMAGE IN CLINICAL DECISION MAKINGHow individuals will incorporate bedside imaging of the kidneys into their clinical practice may vary significantly depending upon one’s practice setting. The addition of fluid boluses to a patient’s care who has a suspected renal stone is likely to result in hydronephrosis if a significant obstruction exists. Thus if a large stone is present, signs of it should be found on ultrasound examination. Obviously mild or mod-erate hydronephrosis may be expected in most stones, and pain control will be the order of the visit. Follow-up can assure that pain resolves and the stone is passed. Marked
easier detection of ureteral jets since urine is expelled into the bladder with velocity and typically flows toward the transducer (Fig. 11.26; VIDEO 11 .14). In theory, com-plete obstruction, such as from a large ureteral calculus, would cause a unilateral absence of a ureteral jet. Similarly, partial obstruction may cause a diminished ureteral jet to be seen. Visualization of equal ureteral jets entering the bladder may take up to a minute or more of careful observation of the ureteral trigones. The frequency of ureteral jets should increase with intravenous hydration of the patient. One study evaluated the frequency of ureteral jets as detected us-ing color Doppler. The number of ureteric jets was counted over a 5-minute period and the frequency calculated for each ureteral orifice. Relative jet frequency (RJF) was defined as frequency of the hydronephrotic side divided by total ureteric jet frequency. When the affected side had a RJF <25%, this was found to be a good indicator of obstruction on the af-fected side. However, this study was limited to children (15).
Urinary RetentionOptimal renal scans should include the ureters and bladder. The bladder can be imaged from a suprapubic position. As-suming that the patient has not recently voided, the degree of bladder distention can give clues regarding the patient’s volume status and renal function. When patients present with signs and symptoms suggesting urinary retention, the diagnosis can be confirmed by a scan at the suprapubic posi-tion. A distended urinary bladder is simple to detect by ultra-sound. With limited experience, the sonographer may learn to recognize bladder wall thickening, evidence of chronic bladder outlet obstruction. In addition, scans of the bladder may help detect bladder calculi.
ARTIFACTS AND PITFALLSLike any ultrasound examination, the renal exam comes with several pitfalls and challenges. One of the most frequently overlooked limitations is the time course for hydronephrosis to develop. Patients that present and are seen rapidly after the onset of pain may not have had enough time to develop hy-dronephrosis. This is especially true for patients who are not well hydrated. Patients with significant pain can present with
FIGURE 11.26. Color Doppler Detects the Flow of Urine from the Ureter into the Bladder.

182 SeCtion iii / Evaluation of Abdominal Conditions
Emphasis for these patients can be focused on hydration and pain control. Patients with equivocal scans, those with marked hydronephrosis, those without hydronephrosis after adequate hydration, or patients in whom alternative diagno-ses are under consideration may benefit from CT. Neverthe-less, the use of bedside emergent ultrasound can expedite the evaluation and treatment for most patients.
INCIDENTAL FINDINGSRenal MassesA variety of masses may be detected incidentally during re-nal ultrasound examinations (28). Renal masses may pres-ent with acute flank pain from rapid expansion, mass effect with obstruction, bleeding, or abscess formation. The most common renal masses are simple cysts; occasionally, more complex cysts and solid masses are seen (29). Renal masses can originate from the kidney or from adjacent organs. Dif-ferentiating whether the kidney is involved or not from a mass that simply abuts the kidney may be difficult. 8PEDIATRIC CONSIDERATIONS: Pediatric malignancies in the area of the kidney may produce an abdominal mass or painless hematuria. Neuroblastoma arising from the adrenal gland will displace or compress the kidney. Wilm’s tumor is the most common renal malignancy in children and arises from the kidney itself. These conditions should be considered in children with hematuria.7
Simple cysts have a relatively smooth internal contour and few if any internal echoes (Fig. 11.27; VIDEOS 11 .15 and 11 .16). They typically occur in the cortical surface of the kidney and are peripheral, distinguishing them from an abnormal collecting system in the central kidney. How-ever, peri-hilar cysts can occur and are sometimes confus-ing, simulating hydronephrosis (Fig. 11.28). Simple renal cysts are common and rarely of any clinical significance unless they enlarge to a significant enough size to impair function of the kidney (30). If large enough, they can dis-tort the normal renal architecture. Occasionally, renal cysts may become infected and present with flank pain and fever. In such cases, the patient may need emergent evaluation for drainage and antibiotics. Multiple simple cysts should raise the suspicion of polycystic renal disease, a diagnosis that will require long-term follow-up to detect and treat poten-tial complications such as pain, hypertension, renal failure,
hydronephrosis will be more likely to require earlier con-sultation and intervention. It is important to remember that unlike IVP and CT scans, the ultrasound examination does not assess renal function to any degree. If bilateral severe hydronephrosis is identified, then suspicion of decreased re-nal function is raised. Unilateral severe hydronephrosis may damage renal function on the affected side, but a check of the blood urea nitrogen (BUN) and creatinine may not indicate this if the other kidney is working properly.
Hydronephrosis itself does not pose a significant immedi-ate danger to renal function (19). Studies differ on just how long is safe. Most cases of hydronephrosis secondary to re-nal stones will eventually resolve on their own as the stone traverses the ureter, bladder, and finally, the urethra (20). With relief of short-lived obstruction the hydronephrosis should decrease rapidly. If the hydronephrosis is severe and persists longer than 2 weeks, permanent renal damage may occur. This timeline is debated, although most physicians are surprised to find that hydronephrosis can be tolerated for so long. The management of obstructing renal stones and hydronephrosis will require consultation with and follow-up by a urologist to optimize outcome.
In all cases of flank pain, the clinician should always harbor some concern of the risk of aortic disease in the ap-propriate patient population. Whenever indicated, renal scans done to assess flank pain should progress to views of the aorta, particularly in the older patient.
CORRELATION WITH OTHER IMAGING MODALITIESIVP is the former gold standard for the evaluation of suspected renal stones and is still favored by some urologists (21). However, it has a number of disadvantages compared to newer imaging modalities (22). The use of intravenous contrast poses a risk of allergy and renal toxicity. In the ab-normal scan, delayed images that are labor-intensive and time- consuming limit its usefulness clinically (23). IVP has largely been replaced by newer generations of spiral CT scan-ners that are now available in most hospitals. CT scans can give an indication of renal function (when contrast is used), and are excellent in visualizing renal stones. They provide ad-ditional information when the source of pain lies outside the genitourinary tract (24). Ultrasound plays a unique role in the evaluation of flank pain. The use of bedside ultrasound by cli-nicians caring for the patient allows a rapid, noninvasive, and essentially risk-free method to rapidly detect hydronephrosis. Because the scan is quick and available at the bedside, se-rial exams can be performed if desired. Ultrasound is highly sensitive for the detection of hydronephrosis and is the test of choice for hydronephrosis (25). Compared to spiral CT, it is less sensitive for the detection and localization of renal stones (26). The combination of plain abdominal films with ultrasound may improve the ability to detect stones (27). The ability to detect other abdominal pathology is determined by the skill level and expertise of the sonographer. However, CT offers excellent detail and is generally cited as better than ultrasound at visualizing other conditions.
In general, ultrasound is unequivocally the best screening test for hydronephrosis, available at the bedside at all hours. In patients with very typical renal colic and mild to moderate hydronephrosis, additional imaging may not be necessary. FIGURE 11.27. A Large Simple Renal Cyst is Shown.

Chapter 11 / Kidneys 183
and associated liver disease (Fig. 11.29; eFigs. 11.1 and 11.2; VIDEOS 11 .17–11 .20).
Complex cysts have a combination of echo-poor and echogenic areas (Fig. 11.30). They differ from solid masses that have no cystic component. Complex cysts are more con-cerning than simple renal cysts; they may signify abscess, hemorrhage, or cancer. Occasionally, solid masses may be identified within the kidney. Ultrasound criteria alone can-not distinguish benign from neoplastic masses. Renal cell carcinoma has a variable appearance by ultrasound and can be hypoechoic, hyperechoic, or complex. All solid masses need definitive follow-up plans.
It is important to note that while some masses are obvious, some isoechoic masses may be difficult to detect by ultra-sound. Emergency physicians should not consider screening for renal masses a goal for emergency sonography. However, in the course of routine scanning of symptomatic patients, emergency sonographers will likely encounter incidental findings and should be prepared to obtain confirmatory im-aging studies and appropriate, timely care. Nonetheless, the ability to detect and refer patients with renal masses is valu-able, and such findings should not be discounted or ignored
FIGURE 11.28. A Perihilar Cyst is Shown. Such cysts can be confused for hydronephrosis or hydroureter .
FIGURE 11.29. An Example of a Polycystic Kidney. The original architecture of kidney is completely obscured by multiple cysts of various size .
FIGURE 11.30. A Complex Renal Cyst is Shown with a Mixture of Fluid (F ) and Solid (S) Components. The rest of the kidney is obscured by the abscess .
FIGURE 11.31. A Well-Circumscribed Hematoma is Visible Inside the Kidney.
because of indecision concerning the relevance of such abnormalities.
Complaints of flank pain can include renal injury. This is typically encountered in patients who do not recall or cannot communicate a history of trauma. Spontaneous hematomas of the kidney can also be encountered. The hematoma can be of variable size and depends on the severity of the trauma when an impact has occurred. The hematoma may be well circumscribed or outlined (Fig. 11.31). Alternatively, it may be subcortical and harder to visualize. Using color Doppler may aid in identifying a hematoma and in some cases dif-ferentiating it from a renal mass. A hematoma will not have flow in it on color Doppler, but may have increased flow on the periphery of the hematoma (Fig. 11.32).
On some occasions, the sonographer may fail to visu-alize a kidney. The most likely cause is simply technique, when bowel gas obscures the image in an obese or inade-quately prepped patient. However, the sonographer should scan down to the pelvis, as occasionally a pelvic kidney may be found. This anatomical variant predisposes to stasis and infection and should have follow-up. Rarely, a patient may have renal agenesis. Again, such a finding deserves recogni-tion and follow-up.

184 SeCtion iii / Evaluation of Abdominal Conditions
REFERENCES 1. Kobayashi T, Nishizawa K, Watanabe J, et al. Clinical characteristics
of ureteral calculi detected by nonenhanced computerized tomography after unclear results of plain radiography and ultrasonography. J Urol. 2003;170:799–802.
2. American College of Emergency Physicians. ACEP emergency ultra-sound guidelines-2001. Ann Emerg Med. 2001;38:470–481.
3. Noble VE, Brown DF. Renal ultrasound. Emerg Med Clin North Am. 2004;22:641–659.
4. Mostbeck GH, Zontsich T, Turetschek K. Ultrasound of the kidney: obstruction and medical diseases. Eur Radiol. 2001;11:1878–1889.
5. Tan YH, Foo KT. Intravesical prostatic protrusion predicts the out-come of a trial without catheter following acute urine retention. J Urol. 2003;170:2339–2341.
6. Knobel B, Rosman P, Gewurtz G. Bilateral hydronephrosis due to fecaloma in an elderly woman. J Clin Gastroenterol. 2000;30: 311–313.
7. Nicolau C, Vilana R, Del Amo M, et al. Accuracy of sonography with a hydration test in differentiating between excretory renal obstruction and renal sinus cysts. J Clin Ultrasound. 2002;30:532–536.
8. Morse JW, Hill R, Greissinger WP, et al. Rapid oral hydration results in hydronephrosis as demonstrated by bedside ultrasound. Ann Emerg Med. 1999;34:134–140.
9. Morin ME, Baker DA. The influence of hydration and bladder disten-sion on the sonographic diagnosis of hydronephrosis. J Clin Ultrasound. 1979;7:192–194.
10. Rha SE, Byun JY, Jung SE, et al. The renal sinus: pathologic spectrum and multimodality imaging approach. Radiographics. 2004;24(suppl 1): S117–S131.
11. Kapoor A, Kapoor A, Mahajan G, et al. Multispiral computed tomo-graphic angiography of renal arteries of live potential renal donors: a review of 118 cases. Transplantation. 2004;77:1535–1539.
12. Lewis E, Ritchie WG. A simple ultrasonic method for assessing renal size. J Clin Ultrasound. 1980;8:417–420.
13. Hagen-Ansert S. ed. Textbook of Diagnostic Ultrasonography. 4th ed. St. Louis, MO: Mosby; 1995:219–230.
14. Goertz JK, Lotterman S. Can the degree of hydronephrosis on ultrasound predict kidney stone size? Am J Emerg Med. 2010;28: 813–816.
15. de Bessa J Jr, Dénes FT, Chammas MC, et al. Diagnostic accuracy of color doppler sonographic study of the ureteric jets in evaluation of hydronephrosis. J Pediatr Urol. 2008;4:113–117.
16. Chau WK, Chan SC. Improved sonographic visualization by fluid chal-lenge method of renal lithiasis in the nondilated collecting system. Experience in seven cases. Clin Imaging. 1997;21:276–283.
17. Fowler KA, Locken JA, Duchesne JH, et al. US for detecting renal calculi with nonenhanced CT as a reference standard. Radiology. 2002;222:109–113.
18. Coll DM, Varanelli MJ, Smith RC. Relationship of spontaneous passage of ureteral calculi to stone size and location as revealed by unenhanced helical CT. AJR Am J Roentgenol. 2002;178:101–103.
CLINICAL CASEA 26-year-old female presents to the ED with the chief com-plaint of right-sided abdominal pain. The patient states that the pain began 2 days ago primarily in her right flank and has moved over the last 24 hours to the right middle abdomen. The pain is constant and throbbing, but waxes and wanes throughout the day. There are no modifying factors, and she has never had this type of pain before. There is no history of trauma.
She has no past medical history, but is pregnant at 32 weeks’ gestation. This is her first pregnancy, and she has had routine prenatal care and an uncomplicated prenatal course. She has had no past surgery. She takes prenatal vita-mins and has no allergies.
Her review of systems is positive for several episodes of nausea and vomiting and mild dysuria. She denies fever, vaginal discharge or bleeding, and hematuria.
On exam, her temperature is 37.8°C, her blood pressure is 110/70 Hg, pulse is 95 beats per minute, and respirations are 18 breaths per minute. She has a gravid uterus consistent with 30 weeks’ gestation. Her abdomen is nontender except for mild right flank pain and right costovertebral angle ten-derness. She has fetal heart tones at 156 beats per minute. She has no vaginal discharge or bleeding; the cervical os is closed.
Significant laboratory results include 20 to 50 white blood cells and 20 to 50 red blood cells per high-power field, positive leukocyte esterase, small blood, bacteria, and negative nitrate. Her emergency ultrasound is shown in Figure 11.33.
The differential diagnosis in this patient is quite varied. Though most consistent with a urinary tract infection (UTI) or pyelonephritis, other diagnosis include renal colic due to an obstructing stone, biliary colic/cholecystitis, preterm labor, appendicitis, or placental abruption. Though a renal ultrasound may be useful in the evaluation of these other diagnosis, the presence of bilateral hydronephrosis may be confusing to the novice user of ultrasound. In this case, the bilateral hydronephrosis is likely due to ureteral compression due to the growing uterus and fetus.
FIGURE 11.33. Bilateral Hydronephrosis is Seen.
FIGURE 11.32. Color Doppler Shows Flow Adjacent of a Hematoma, in Which No Flow is Detected in the Color Doppler Window.

Chapter 11 / Kidneys 185
25. Webb JA. Ultrasonography in the diagnosis of renal obstruction. BMJ. 1990;301:944–946.
26. Smith RC, Coll DM. Helical computed tomography in the diagnosis of ureteric colic. BJU Int. 2000;86(suppl 1):33–41.
27. Henderson SO, Hoffner RJ, Aragona JL, et al. Bedside emergency de-partment ultrasonography plus radiography of the kidneys, ureters, and bladder vs intravenous pyelography in the evaluation of suspected ure-teral colic. Acad Emerg Med. 1998;5:666–671.
28. Mandavia DP, Pregerson B, Henderson SO. Ultrasonography of flank pain in the emergency department: renal cell carcinoma as a diagnostic concern. J Emerg Med. 2000;18:83–86.
29. Terada N, Arai Y, Kinukawa N, et al. Risk factors for renal cysts. BJU Int. 2004;93:1300–1302.
30. Holmberg G. Diagnostic aspects, functional significance and therapy of simple renal cysts. A clinical, radiologic and experimental study. Scand J Urol Nephrol Suppl. 1992;145:1–48.
19. Sibai H, Salle JL, Houle AM, et al. Hydronephrosis with diffuse or segmental cortical thinning: impact on renal function. J Urol. 2001; 165(6, pt 2):2293–2295.
20. Irving SO, Calleja R, Lee F, et al. Is the conservative management of ureteric calculi of >4 mm safe? BJU Int. 2000;85:637–640.
21. Juul N, Brons J, Torp-Pedersen S, et al. Ultrasound versus intravenous urography in the initial evaluation of patients with suspected obstructing urinary calculi. Scand J Urol Nephrol Suppl. 1991;137:45–47.
22. Stewart C. Nephrolithiasis. Emerg Med Clin North Am. 1988;6: 617–630.
23. Pfister SA, Deckart A, Laschke S, et al. Unenhanced helical computed tomography vs intravenous urography in patients with acute flank pain: accuracy and economic impact in a randomized prospective trial. Eur Radiol. 2003;13:2513–2520.
24. Colistro R, Torreggiani WC, Lyburn ID, et al. Unenhanced helical CT in the investigation of acute flank pain. Clin Radiol. 2002;57:435–441.

186
to diagnose since they can mimic other causes of abdominal pain (2). Classically, diagnosis has been made by history and physical exam with confirmation by plain film radiography, which is frequently nondiagnostic (1,2) and insensitive (2,3). CT is an accurate diagnostic modality that is often used to assess for SBO, but bowel sonography can be done quickly to assess patients for possible SBO at decreased cost with-out radiation exposure and can be repeated easily to assess resolution of symptoms.
Clinical ApplicationsBedside sonography is useful to:
1. Evaluate patients with abdominal pain, nausea, vomiting, and/or abdominal distension
2. Screen for bowel obstructions 3. Identify characteristics of ischemia suspicious for a
strangulated obstruction 4. Locate site (transition point) and potential source of
obstruction 5. Identify abnormal bowel thickness seen in a variety of
conditions (inflammatory, infectious, neoplastic, and ischemic)
INTRODUCTIONIn the United States, sonography has given way to com-puterized tomography (CT) as the primary imaging modal-ity for bowel. However, CT may not always be available in a timely fashion, exposes patients to contrast, involves radiation, requires technician time, and may be associated with a delay in diagnosis. Although the presence of air in the bowel may limit sonographic visualization, sonography can decrease the time to diagnosis without requiring con-trast administration, radiation exposure, or technician time for the diagnosis of important abdominal conditions such as bowel obstruction, inflammatory disorders of the bowel (including appendicitis, diverticulitis, and inflammatory bowel disease), and the presence of hernias or abdominal wall masses.
BOWEL OBSTRUCTIONIntroductionSmall bowel obstructions (SBOs) represent 20% of surgi-cal admissions for acute abdominal pain (1), but are difficult
HERNIAS . . . . . . . . . . . . . . . . . . . . . . . . . . . . . . . . . . . . . . . 190Introduction . . . . . . . . . . . . . . . . . . . . . . . . . . . . . . . . 190Clinical Applications . . . . . . . . . . . . . . . . . . . . . . . . . . 191Image Acquisition . . . . . . . . . . . . . . . . . . . . . . . . . . . . 191Normal Ultrasound Anatomy . . . . . . . . . . . . . . . . . . . . 191Pathology . . . . . . . . . . . . . . . . . . . . . . . . . . . . . . . . . . 191Artifact and Pitfalls . . . . . . . . . . . . . . . . . . . . . . . . . . . 192Use of the Image in Clinical Decision Making . . . . . . . 192Incidental Findings . . . . . . . . . . . . . . . . . . . . . . . . . . . 193Correlation with Other Imaging Modalities . . . . . . . . . 193
CLINICAL CASE . . . . . . . . . . . . . . . . . . . . . . . . . . . . . . . . . . 193
INTRODUCTION . . . . . . . . . . . . . . . . . . . . . . . . . . . . . . . . . . 186BOWEL OBSTRUCTION . . . . . . . . . . . . . . . . . . . . . . . . . . . . 186
Introduction . . . . . . . . . . . . . . . . . . . . . . . . . . . . . . . . 186Clinical Applications . . . . . . . . . . . . . . . . . . . . . . . . . . 186Image Acquisition . . . . . . . . . . . . . . . . . . . . . . . . . . . . 187Normal Ultrasound Anatomy . . . . . . . . . . . . . . . . . . . . 187Pathology . . . . . . . . . . . . . . . . . . . . . . . . . . . . . . . . . . 187Artifacts and Pitfalls . . . . . . . . . . . . . . . . . . . . . . . . . . 190Use of the Image in Clinical
Decision Making . . . . . . . . . . . . . . . . . . . . . . . . . . . 190Correlation with Other
Imaging Modalities . . . . . . . . . . . . . . . . . . . . . . . . . 190
Timothy Jang
Bedside Sonography of the Bowel
12

Chapter 12 / Bedside Sonography of the Bowel 187
Image AcquisitionThe highest frequency probe possible is selected based on the patient’s habitus (typically 7.5 MHz in small, thin children vs. 3.0 to 5.0 MHz in larger adults). Even in adults, once an ab-normality is identified, switching to a higher frequency trans-ducer may provide improved resolution and visualization of an identified area of pathology.
Two main approaches can be used to evaluate the bowel. The first is to place the probe over the site of maximal tender-ness and then scan the area in the transverse and longitudinal planes. This often reduces the time of the examination, but may miss pathology due to referred pain. The second tech-nique is called lawnmowering, where the probe is placed in the right lower quadrant in the transverse plane, then moved up and down the abdominal wall until the entire abdomen is imaged ending in the left lower quadrant (Figs. 12.1 and 12.2). This method is then repeated starting in the left lower quadrant in the longitudinal plane with the probe moved side to side until the entire abdomen is imaged (Figs. 12.3 and 12.4). This approach takes more time than a simple, localized exam, but may detect referred causes of pain.
The scan can be optimized using the technique of graded compression, by gently and gradually applying pressure to the anterior abdominal wall. Graded compression will dis-place, and then compress, normal bowel, thus helping to identify abnormal, pathologic bowel.
Normal Ultrasound AnatomyThe abdominal wall is comprised of skin, subcutaneous adi-pose, muscle and its surrounding fascia, and finally bowel. The normal bowel wall is comprised of an innermost echo-genic superficial mucosa, surrounded by five alternating hypoechoic and echogenic layers that represent the mus-cularis mucosa, muscularis propia, serosa, and their inter-faces (4). However, most of the time, especially in adults, these layers appear as a nearly singular echogenic layer, and
operators should not spend a tremendous amount of time dif-ferentiating these layers. The sonographer should carefully assess the following:
1. Bowel contents (aerated or fluid-filled) 2. Luminal diameter (normal small bowel is <2.5 cm; nor-
mal large bowel lumen is <5 cm) (1–3,5,6) 3. Appearance and thickness of the bowel wall (normal is
regular and <4 mm thick) (4) 4. Peristalsis (normal bowel has visible movement, a
to-and-fro of bowel contents) 5. Compressibility (normal bowel compresses with gentle
pressure)
PathologySmall bowel obstructionThe diagnosis of an SBO is made by detecting dilated, noncompressible small bowel proximal to collapsed, com-pressible small bowel (Figs. 12.5–12.8; VIDEO 12 .1). When the bowel is dilated, it suggests either the presence
FIGURE 12.1. Placement of Probe in Right Lower Quadrant to Begin Lawnmowering Sweep of Abdomen Using Transverse Probe Orientation.
FIGURE 12.2. End of Lawnmowering Sweep of Abdomen in Left Lower Quadrant Using Transverse Probe Orientation.
FIGURE 12.3. Placement of Probe in a Longitudinal Lawnmower Sweep of the Mid-Abdomen.

188 SeCtion iii / Evaluation of Abdominal Conditions
FIGURE 12.4. Sagittal View of an Area of Abnormality Identified during Lawnmowering.
FIGURE 12.5. A: Dilated, fluid-filled bowel in the left pericolic gutter . B: Corresponding abdominal x-ray .
A
B
of an ileus or obstruction (Fig. 12.9). Lack of compress-ibility makes an obstruction more likely than an ileus, but does not definitively differentiate between an ileus and an obstruction, while lack of peristalsis can be associated with either etiology. If abnormal bowel is encountered, its course should be followed until normal bowel is visualized. This allows for identification of a transition point and other obstructive causes such as intussusception or compressing masses.
Large bowel versus small bowelAlthough large bowel obstruction (LBO) is much less com-mon than SBO, approximately 15% of patients with LBO may appear initially to have an SBO (7). LBO can be dif-ferentiated from SBO sonographically by the accumulation of gas in the colon, resulting in the appearance of periph-erally located (vs. centrally located small bowel), dilated bowel filled with dense spot echoes that represent feculent, fluid contents, including small bubbles of gas. A large bowel diameter >5 cm is abnormal, suggesting an obstruction or toxic megacolon.
Bowel dilationThe differential diagnosis for bowel dilation includes partial and complete SBO, partial and complete LBO, ileus, sprue, colitis, and toxic megacolon.
Bowel strangulationSonographic findings that suggest bowel strangulation in-clude (1) dilated, noncompressible, non-peristalsing or akinetic bowel, (2) rapid accumulation of localized free fluid around abnormal bowel, and (3) asymmetric bowel wall edema with abnormal diameter and/or nonperistalsis. Lack of compressibility suggests a complete obstruction with increased intraluminal pressure, raising concern for strangulation. FIGURE 12.6. Dilated, Fluid-Filled Bowel in the Supra-Umbilical Region.

Chapter 12 / Bedside Sonography of the Bowel 189
obstruction), but is typically a late finding and thus lacks sen-sitivity (Fig. 12.6; VIDEOS 12 .2 and 12 .3). Other causes of decreased peristalsis include Hirschsprung disease, Crohn disease, gallstone ileus, paralytic ileus, opiate toxicity, an-ticholinergic syndrome, and gastroparesis. Hyperperistalsis may indicate early disease (analogous to hyperactive bowel sounds on physical exam), but is an extremely operator- dependent finding, and likely has limited application for most clinicians.
Peri-bowel, localized free fluidLocalized intraperitoneal free fluid is another prognostic so-nographic finding in the evaluation of the bowel (12). When found around dilated, noncompressible, nonperistaltic bowel, it is highly suggestive of severe pathology such as ruptured appendicitis or a high-grade, complete obstruction. As this is also a late finding, clinicians should not spend a large amount of time assessing for localized fluid collections unless there is a focal area of dilated, abnormal bowel. At the same time, the clinician should also consider the possibility that a large
FIGURE 12.7. Measurement of Bowel Luminal Diameter in the Left Pericolic Gutter Demonstrating Dilated Bowel.
FIGURE 12.8. Measurement of Bowel Luminal Diameter in the Supra-umbilical Region Demonstrating Dilated Bowel.
D1
D2
A
BFIGURE 12.9. A: Fluid-filled bowel measuring at the upper limits of normal (25 mm) consistent with an ileus versus early partial obstruction . B: Corresponding abdominal x-ray .
Bowel wall thickeningA thickened bowel wall is important to note, but is non-specific. Bowel wall thickening can be seen in cases of in-flammation (e.g., colitis and angioedema), strangulation, or infiltration (e.g., amyloidosis, Behcet’s disease). Diffuse thickening is associated with systemic or diffuse conditions such as inflammatory bowel disease, celiac disease, amyloi-dosis, or Behcet disease, whereas focal thickening can occur from an obstruction, as well as local extra-bowel etiologies such as pancreatitis, cholecystitis, and pelvic inflammatory disease that may cause irritation of abutting bowel.
Bowel peristalsisAbnormal peristalsis is a secondary finding in the sono-graphic evaluation of the bowel that has prognostic impor-tance (8–11). With the transducer on the abdominal wall, the bowel is evaluated for peristalsis using as little pressure as possible. Peristalsis is demonstrated by the back-and-forth movement of spot echoes inside the bowel. Absence of peri-stalsis is indicative of severe disease (e.g., complete bowel

190 SeCtion iii / Evaluation of Abdominal Conditions
and dyskinetic bowel suggests a partial obstruction, ileus, or other adynamic process such as opiate toxicity, toxic mega-colon, etc. Dilated, noncompressible, dyskinetic bowel sug-gests a high-grade obstruction or strangulation and warrants surgical consultation.
Wall edema or thickening should be characterized as local or diffuse. Local thickening suggests a focal process such as compressing mass or adhesions. Diffuse thickening suggests a more diffuse or systemic process such as inflammatory bowel disease, infectious colitis, or ischemic colitis. Further workup depends upon the clinical setting and could include CT, colonoscopy, barium enema, or laparoscopy.
Correlation with Other Imaging ModalitiesThe main benefits of using ultrasound include the potential to decrease time to diagnosis and provide prognostic informa-tion. Ultrasound has the advantage of being easily repeated to assess response to treatment or evolution of disease. It does not involve radiation and has better accuracy than either physical exam or plain film radiography. Plain film radiog-raphy may be delayed, requires the services of an x-ray tech-nician, is only diagnostic for SBO 50% to 65% of the time (1,3) with sensitivity <70% (2,3), and often requires confir-mation with CT (5,6). For example, compare Figures 12.5B and 12.9B, which are nondiagnostic plain film radiographs of the abdomen, with their corresponding ultrasounds. Likewise, although CT has been shown to be an accurate imaging modality (1,3,5,6), it exposes patients to radiation, involves the administration of contrast, and requires technician time, all of which can be avoided with the use of ultrasound. On the other hand, ultrasound is operator dependent and lacks the sensitivity to rule out SBO in high-risk patients (2,8–11).
HERNIASIntroductionIncarcerated external hernias are a frequent cause of bowel obstruction, and commonly present with focal pain. Approx-imately 10% to 19% of incarcerated hernias will become strangulated and require emergent resection (14–16). Com-mon external hernias include inguinal, femoral, ventral,
extraluminal abscess or pocket of fluid could be the cause of obstructive symptoms.
Artifacts and PitfallsBowel imaging is subject to artifact from air that can disperse and distort the image.
Potential pitfalls include:
1. Misinterpretation of images. Patients with ascites may have prominent bowel walls. Chronic inflammatory bowel disease, amyloidosis, and Behcet’s disease may have chronic bowel thickening
2. Not applying enough pressure to displace gas and com-press normal bowel
3. Not imaging in orthogonal planes to clearly distinguish bowel from other cystic structures
4. Mistaking large bowel for small bowel or vice versa 5. Measuring the posterior wall of the bowel where poste-
rior acoustic enhancement could lead to falsely enlarged measurements
6. Misidentifying adjacent structures such as the gallblad-der, stomach, or bladder as evidence of local free fluid
7. Mistaking ascites for local free fluid
Use of the Image in Clinical Decision MakingPatients at risk for bowel obstruction require radiographic imaging because the history and physical exam have poor sensitivity and specificity for obstruction (13). Ultra-sound can be performed at the bedside during the initial point-of-care and may decrease the time to diagnosis and provide important prognostic information. This can be done prior to the return of laboratory tests or the performance of other radiographic imaging, and can be repeated to assess response to treatment or evolution of disease.
The abdomen should be evaluated in a systemic fash-ion noting the bowel contents and diameter, wall thickness, compressibility, presence of peristalsis, and any adjacent fluid collections. If an abnormality is noted, further imaging and treatment is indicated (Fig. 12.10). If no abnormality is noted, alternative diagnoses should be considered.
Dilated, compressible, and hyperkinetic bowel suggests either a partial or early obstruction. Dilated, compressible,
Lawnmower sweep of abdomen
Abnormality noted
Ileus, toxic megacolon, partial obstruction
Dilated, edematous, non-compressible, non-peristaltic bowel
High gradeobstruction or strangulation
Dilated, compressible, dyskinetic bowel
Early vs. partial obstruction
Dilated, compressible, hyperkinetic bowel
FIGURE 12.10. Approach to Ultrasound Evaluation of Dilated Bowel.

Chapter 12 / Bedside Sonography of the Bowel 191
Normal Ultrasound AnatomyThe anatomy visible during hernia imaging depends on the location being assessed. The abdominal wall has normal skin, subcutaneous tissue, musculature, and fascia. Fascia appears as a bright, echogenic line at the posterior-most aspect of the abdominal wall. A hernia can be seen as a defect in this fascial layer; a hernia sac presents as a sac or outpouching with contents such as bowel or adipose through the fascial defect.
Experienced sonographers will locate the inferior epi-gastric artery and localize hernias relative to it. Less ex-perienced sonographers may focus primarily on detecting a fascial defect and determining if a mass or site of ten-derness on exam corresponds to a defect. Abdominal wall hernias are relatively easy to visualize even with limited experience.
Inguinal herniasThe inguinal canal is bordered inferiorly by the inguinal liga-ment, medially by the lateral margin of the rectus abdomi-nus, and superiorly by the inferior epigastric artery. Inguinal hernias are defined by their location relative to the inferior epigastric artery: direct hernias are seen medial to the infe-rior epigastric artery; indirect hernias are seen lateral to the inferior epigastric artery.
Femoral herniasThe femoral canal is bordered anterosuperiorly by the in-guinal ligament, posteriorly by the pectineal ligament lying anterior to the superior pubic ramus, medially by the lacunar ligament, and laterally by the femoral vein. Femoral hernias occur below the inguinal ligament and medial to the femoral vein.
Spigelian/ventral herniasThe spigelian fascia is bordered by the rectus abdominus me-dially and the semilunar line laterally. The lack of a posterior rectus sheath means that hernias can originate at the linea arcuata just superior to the inferior epigastric artery in the lateral margin of the rectus abdominus. These hernias do not lie below the subcutaneous fat, but penetrate between the muscles of the abdominal wall; therefore, they are usually small with higher risks of strangulation.
Other variants of ventral hernias (umbilical, incisional, and epigastric) share similar sonographic qualities of a defect in the fascial layer with a sac or outpouching of contents such as bowel or adipose through the fascial defect.
PathologyThe primary pathology that is encountered during hernia im-aging is the presence of bowel within a hernia sac (Fig. 12.12;
VIDEO 12 .4). When reducible, the bowel in the hernia sac should appear normal with normal contents, diameter, wall thickness, compression, and peristalsis (Fig. 12.13;
VIDEO 12 .5). When incarcerated, the bowel may not be completely compressible or reducible. When strangulated, the bowel will be dilated and often noncompressible with thickened, edematous walls and dyskinesis, and may have localized free fluid. Other pathology that can be encountered depending on anatomical location includes cysts, abscesses, vascular aneurysms, and herniated adipose.
umbilical, and incisional hernias. The diagnosis of incar-ceration is made by detecting loops of bowel in the hernia sac that cannot be reduced. The diagnosis of a strangulated, incarcerated hernia is made when other findings such as loss of peristalsis, bowel wall edema, and localized free fluid are present.
Clinical ApplicationsBedside sonography is useful to:
1. Evaluate patients with focal abdominal pain and abdom-inal swelling
2. Screen for hernias 3. Identify characteristics suspicious for compromised
ischemic bowel from a strangulated hernia 4. Differentiate a hernia from other sources of pain and
swelling such as an abscess
Image AcquisitionThe techniques used to assess for bowel obstruction can be used to assess for hernias. Sonography for hernia assessment involves obtaining orthogonal images of the area of interest, most commonly the inguinal canal, but also including other areas such as the abdominal wall and umbilicus. The highest frequency probe possible should be selected to visualize the area of concern (typically 5.0 to 7.5 MHz).
The sonographer should assess the area of interest for the presence of bowel contents as opposed to a fluid pocket (e.g., abscess, Fig. 12.11), solid mass, or other abnormality. If bowel is identified, then the sonographer should assess the luminal diameter of the bowel, the appearance and thickness of the bowel wall, and bowel peristalsis and kinesis. Any ab-normality would suggest that the bowel is incarcerated and possibly strangulated.
The use of color Doppler ultrasound may help to differen-tiate aneurysms and vascular structures from bowel and other possibilities such as abscesses and cysts. Doppler ultrasound may also help to detect peristalsis of the bowel, but is typi-cally not necessary.
FIGURE 12.11. Abscess Found in Area of Suspected Hernia.

192 SeCtion iii / Evaluation of Abdominal Conditions
1. Necrotic fat in a hernia sac can appear like free fluid, giving the appearance of a fluid pocket
2. Partially digested food may make the intraluminal portion of the bowel difficult to differentiate from the bowel wall
3. In obese patients, the hernia may lie deep to a thick fatty layer of Camper fascia overlying the abdominal muscles, and may not appear as a large outpouching on physical exam
Pitfalls 1. Not applying enough pressure to compress normal bowel 2. Not imaging in orthogonal planes to clearly distinguish
bowel from other structures such as aneurysms, cysts, or abscesses
3. Mistaking ascites for local free fluid 4. Mistaking bowel peristalsis for vascularity when using
Doppler ultrasound
Use of the Image in Clinical Decision MakingPatients with suspected hernias often require radiographic imaging because the history and physical exam may be in-accurate. Ultrasound should be performed at the bedside during the initial point-of-care as it can decrease the time to diagnosis and provide important prognostic information. This can be done prior to the return of laboratory tests or the performance of other radiographic imaging, utilized to facilitate reduction, and can be repeated to assess response to treatment or evolution of disease.
The area of suspected hernia should be imaged in or-thogonal planes, assessing for the presence of bowel versus structures such as cysts, aneurysms, or abscesses. If bowel is identified, then assessment should be done to detect evidence of obstruction or strangulation as well as note any adjacent structures (abscess, mass, cyst). If normal bowel is identi-fied, then reduction should be attempted (Chapter 13) and appropriate treatment followed. If abnormal bowel is identi-fied, the clinician-sonographer should differentiate between incarceration versus strangulation and initiate appropriate care (Fig. 12.14). When incarcerated, the bowel may not be completely compressible or reducible. When strangulated, the bowel will be dilated and often noncompressible with thickened, edematous walls, and dyskinesis, and may have localized free fluid.
Artifacts and PitfallsArtifactsCommon artifacts that may interfere with imaging interpretation:
FIGURE 12.12. Non-IncarceratedVentral Hernia. Bowel (B); Fascial defect (FD) .
FIGURE 12.13. Postreduction Ultrasound Demonstrating Fascial Defect (FD) with Visualization of Bowel (B) Now within the Abdominal Cavity.
Orthogonal ultrasound imagesof suspicious area
Abnormality noted
Cyst/aneurysm localized
Abscess localized
Bowel visualized
I&D vs. surgical management
Assess for strangulation and incarceration
Treatment asindicated FIGURE 12.14. Approach to Ultrasound Evaluation of
Hernias.

Chapter 12 / Bedside Sonography of the Bowel 193
ultrasound is done (Figs. 12.16–12.18). The x-ray demon-strates a nonspecific bowel gas pattern without air-fluid levels to suggest an obstruction. Some air-filled, prominent loops of bowel can be seen. The ultrasound, however, demonstrates dilated, fluid-filled bowel measuring >4 cm in diameter con-sistent with an obstructive process. A nasogastric tube was
Incidental FindingsThe physical exam for hernias is often inaccurate, which is why radiographic imaging is often required. Other findings that can mimic a hernia and are easily differentiated with ultrasound include lymph nodes, aneurysms, cysts, lipomas, subcutaneous masses, and abscesses.
Correlation with Other Imaging ModalitiesThe primary benefit to using ultrasound is that it can decrease the time to diagnosis, provide prognostic informa-tion, be used to perform therapeutic intervention (see hernia reduction, Chapter 13), is easily repeated to assess response to treatment or evolution of disease, and can differentiate important mimics such as abscesses, cysts, and aneurysms that may not be differentiated by physical exam or plain film radiography. Plain film radiology has been an adjunct in imaging for hernias primarily for the detection of an obstruc-tion, which would suggest incarceration of the hernia. Plain films, however, do not have any other role in assessing for hernias. CT, on the other hand, is superior to ultrasound for the diagnosis of hernias and determining whether or not they are strangulated. However, it exposes patients to significant radiation, involves the administration of contrast, requires technician time, and can be associated with a delay in diag-nosis, all of which can be avoided with the use of ultrasound.
CLINICAL CASEA 40-year-old male presents with abdominal cramping, con-stipation, and vomiting for 2 days. He has a history of diabe-tes and underwent appendectomy at the age of 19. On exam, his abdomen is not distended, but has mild diffuse tender-ness to palpation without guarding or rebound. His mucous membranes are moist, the skin has good turgor, and he does not appear toxic. Labs are ordered. An x-ray is done 45 min-utes later, but is nondiagnostic (Fig. 12.15). Therefore, an
FIGURE 12.15. Clinical Case. Abdominal x-ray of patient in clinical case .
FIGURE 12.16. Clinical Case. Bowel sonography in right upper quadrant .
FIGURE 12.17. Clinical Case. Bowel sonography in left upper quadrant .
D1
D2
FIGURE 12.18. Clinical Case. Bowel sonography in supra-umbilical area with measurements .

194 SeCtion iii / Evaluation of Abdominal Conditions
8. Ogata M, Mateer JR, Condon RE. Prospective evaluation of abdomi-nal sonography for the diagnosis of bowel obstruction. Ann Surg. 1996; 223:237–241.
9. Ogata M, Imai S, Hosotani R, et al. Abdominal sonography for the diagnosis of strangulation in small bowel obstruction. Br J Surg. 1994;81:421–424.
10. Schmutz GR, Benko A, Fournier L, et al. Small bowel obstruction: role and contribution of sonography. Eur Radiol. 1997;7:1054–1058.
11. Meisser G, Meissner K. Ileus and intestinal obstruction— ultrasonographic findings as a guide to therapy. Hepatogastroenterology. 1987;34:194–199.
12. Di Mizio R, Grassi R, Marchese E, et al. “Uncompensated” small bowel obstruction in adults. Ultrasonographic findings of free fluid between loops and its prognostic value [in Italian with English abstract]. Radiol Med. 1995;89:787–791.
13. Jang TB, Schindler D, Kaji AH. The predictive value of signs and symp-toms for small bowel obstruction in patients with prior surgery. Emerg Med J. 2012;29:769–770.
14. Andrews NJ. Presentation and outcome of strangulated external hernia in a district general hospital. Br J Surg. 1981;68:329–332.
15. Kulah B, Duzqun AP, Moran M, et al. Emergency hernia repairs in elderly patients. Am J Surg. 2001;182:455–459.
16. Kulah B, Kulacoqlu IH, Oruc MT, et al. Presentation and outcome of incarcerated external hernias in adults. Am J Surg. 2001;181:101–104.
placed and a CT was performed, which demonstrated a par-tial SBO due to adhesions. The patient was hospitalized and improved with conservative management.
REFERENCES 1. Delabrousse E, Destrumelle N, Brunelle S, et al. CT of small bowel
obstruction in adults. Abdom Imaging. 2003;28:257–266. 2. Jang TB, Schindler D, Kaji AH. Bedside ultrasonography for the detec-
tion of small bowel obstruction in the emergency department. Emerg Med J. 2001;28:676–678.
3. Maglinte DD, Kelvin FM, Sandrasegaran K, et al. Radiology of small bowel obstruction: contemporary approach and controversies. Abdom Imaging. 2005;30:160–178.
4. Ledermann HP, Borner N, Strunk H, et al. Bowel wall thickening on transabdominal sonography. AJR Am J Roentgenol. 2000;174:107–117.
5. Maglinte DDT, Herlinger H, Turner WW, et al. Radiologic manage-ment of small bowel obstruction: a practical approach. Emerg Radiol. 1994;1:138–149.
6. Taourel P, Kessler N, Lesnik A, et al. Helical CT of large bowel obstruction. Abdom Imaging. 2003;28:267–275.
7. Ogata M, Imai S, Hosotani R, et al. Abdominal sonography for the diagnosis of large bowel obstruction. Surg Today. 1994;24:791–794.

195
commonly used, including fluid wave and shifting dullness, are inaccurate and may provide the clinician a false impres-sion of ascites. This false positive conclusion may increase the risk of performing an unnecessary paracentesis, and therefore the potential for invasive complications (4). With ultrasound guidance, the anechoic ascites is clearly seen jux-taposed with the echogenic abdominal organs and abdominal wall (Fig. 13.1). Volumes as low as 100 mL can reportedly be detected with ultrasound (5).
Image AcquisitionScanning for a paracentesis site will usually require two transducers, depending on the abundance or paucity of
INTRODUCTIONUltrasound is a valuable tool when performing procedures on the abdomen. Ultrasound guidance improves the ease and efficiency of procedures and increases the likelihood of suc-cessful completion (1). Using ultrasound to guide procedures lowers the risk of complications compared to the traditional method of using anatomic landmarks (2). This chapter will discuss techniques of using ultrasound to guide common procedures on the abdomen, including paracentesis, hernia reduction, and estimation of bladder volume.
PARACENTESISClinical IndicationsThere are three indications for ultrasound-guided paracentesis:
1. To obtain fluid for analysis to establish the etiology, primarily for patients with new onset ascites. Most cases of new onset ascites are due to liver cirrhosis (over 75%), although malignancy, congestive heart failure, and pancreatitis may also be responsible (3).
2. To obtain fluid for culture, to rule out infection as a cause of worsening ascites, abdominal pain, and/or fever.
3. To provide symptomatic relief for patients with tense ascites, particularly when it causes respiratory embarrassment.
Fluid within the peritoneal cavity is difficult to appreci-ate using physical exam techniques. The exam maneuvers
Anatomy and Landmarks . . . . . . . . . . . . . . . . . . . . . . 198Procedure . . . . . . . . . . . . . . . . . . . . . . . . . . . . . . . . . . 198Pitfalls and Complications . . . . . . . . . . . . . . . . . . . . . . 199
DETERMINATION OF BLADDER VOLUME . . . . . . . . . . . . . . . 199Introduction . . . . . . . . . . . . . . . . . . . . . . . . . . . . . . . . 199Clinical Indications . . . . . . . . . . . . . . . . . . . . . . . . . . . 199Image Acquisition . . . . . . . . . . . . . . . . . . . . . . . . . . . . 199Anatomy and Landmarks . . . . . . . . . . . . . . . . . . . . . . 199Procedure . . . . . . . . . . . . . . . . . . . . . . . . . . . . . . . . . . 200Pitfalls and Complications . . . . . . . . . . . . . . . . . . . . . . 201
INTRODUCTION . . . . . . . . . . . . . . . . . . . . . . . . . . . . . . . . . . 195PARACENTESIS . . . . . . . . . . . . . . . . . . . . . . . . . . . . . . . . . . 195
Clinical Indications . . . . . . . . . . . . . . . . . . . . . . . . . . . 195Image Acquisition . . . . . . . . . . . . . . . . . . . . . . . . . . . . 195Anatomy and Landmarks . . . . . . . . . . . . . . . . . . . . . . 196Procedure . . . . . . . . . . . . . . . . . . . . . . . . . . . . . . . . . . 196Pitfalls and Complications . . . . . . . . . . . . . . . . . . . . . . 198
HERNIA REDUCTION . . . . . . . . . . . . . . . . . . . . . . . . . . . . . . 198Clinical Indications . . . . . . . . . . . . . . . . . . . . . . . . . . . 198Image Acquisition . . . . . . . . . . . . . . . . . . . . . . . . . . . . 198
Gregory R. Bell
Abdominal Procedures13
FIGURE 13.1. Ascites and Mesentery Seen Deep to the Abdominal Wall. Note the reverberation artifact caused by peritoneal fascial layers .

196 Section iii / Evaluation of Abdominal Conditions
ascitic fluid. A 3 to 5 MHz curvilinear or phased array probe is the best choice for determining the site for cath-eter placement. Scanning with this probe provides a broad view for the abdominal contents and offers a quick assess-ment of the presence of fluid. When ascitic fluid is present, one can see where it has accumulated. The other suggested probe to use during paracentesis is a 5 to 10 MHz linear probe. Its purpose is to guide needle placement. This probe is especially important if the volume of ascites is limited, thus creating a small target for fluid aspiration. All imaging is performed using the brightness or B-mode.
Anatomy and LandmarksWhen scanning for fluid, the organs in the abdomen need to be clearly delineated. Organs that may contain fluid, such as the urinary bladder or obstructed bowel, will appear anechoic and may be mistaken for ascitic fluid. To delineate ascites from fluid within an organ, the clinician will need to inspect the periphery of the fluid. Fluid within the bowel or bladder is bordered by the wall of that organ, which tends to be rounded or tubular ( VIDEO 13 .1). Ascitic fluid will conform to the exterior surface of organs such as mesentery and bowel, creating an irregular outline ( VIDEO 13 .2). It may also be seen adjacent to the interior surface of the abdominal wall.
When imaging ascites with the low frequency transducer, and especially when a large volume of ascites is present, small bowel loops are seen suspended from mesentery. Mes-entery will vary in appearance from long and stalk-like to thick and sessile. If mesentery is long, the bowel will be seen floating freely and will sway in response to patient move-ments, to breathing, and to bowel peristalsis. When adhe-sions are present, the mesentery and bowel loops may be less mobile. With certain clinical conditions, loculations may form within the ascitic fluid which will limit movement of the bowel. This is clinically important since mesentery that is immobile may yield less to the advancing paracentesis needle and is thus more likely to be punctured.
Ultrasonic appearance of mesentery is relatively hyper-echoic compared to the liver and spleen. Mesentery may also have a spotty hypoechoic appearance due to deposits of adipose. The ultrasonic appearance of small bowel may be either solid or tubular, depending on its contents. If the lumen content is digested matter, it appears somewhat less echoic than its mesenteric stalk. Large bowel is notable in appearance for its characteristic gas, creating a hyperechoic leading edge with deeper gray scale or “dirty” shadowing. While the small bowel will be seen throughout the abdomen, the large bowel is seen in particular locations. The ascending colon lies anterior to the right kidney in the paravertebral gutter, while the descending bowel is seen in the same loca-tion on the opposite side. The transverse colon can be identi-fied suspended from the mesocolon in the area caudal to the stomach antrum.
Two other organs to be particularly cautious of when performing paracentesis are the liver and spleen. In patients with cirrhosis the liver will be relatively small and dense. Cirrhotic livers will appear high in the abdomen and adher-ent to the posterior and apical abdominal walls. If the liver is enlarged, it may extend deep into the peritoneal cavity, especially the right lobe, which may remain close to the abdominal wall. Scanning the left upper quadrant will
identify splenomegaly, if present. An enlarged spleen will also extend into the peritoneal cavity, remaining close to the anterior and left lateral abdominal wall.
If the paracentesis is performed with an infraumbilical approach, the urinary bladder may be seen along the anterior abdominal wall above the symphysis pubis. It is easily dis-tinguished by its spherical shape and dense hyperechoic wall surrounding anechoic fluid (Fig. 13.2). Because the bladder is easy to discriminate, the risk of puncture is low unless it is overdistended. If the bladder is overdistended, the anterior wall may abut the lower abdominal wall and be mistaken for the peritoneal space.
In addition to scanning the abdominal contents, the abdominal wall must be closely inspected and scanned for abnormalities. Certain conditions will preclude an area from paracentesis, including abdominal wall abscess or cellulitis, any hernias, or an area of collected superficial veins. One also needs to be aware of, and to avoid, the inferior epigastric artery. This artery runs from the femoral outlet to the distal one-third of the rectus abdominus muscle. At this point the artery runs cephalad, usually along the posterior aspect of the muscle to join with the superior epigastric artery. In the abdo-minus rectus, the artery is 4 to 8 cm off the midline (Fig. 13.3).
ProcedureIn preparation for scanning, the patient should be in a com-fortable supine, semi-reclined position. This position will al-low the ascites to accumulate in the lower abdomen. When deciding where to perform the paracentesis, the right or left lower quadrants are generally favored over the more tradi-tional infraumbilical approach. One study compared the left lower quadrant to the infraumbilical area and found the depth of the fluid was generally greater in the lateral abdomen (6). In any given patient, however, the most accumulated fluid may be in any of these three areas, and ultrasound provides the advantage of locating the largest and most accessible fluid.
Scanning for a paracentesis site needs to be systematic, beginning in one location and progressing through the oth-ers (Fig. 13.4). With the lateral quadrants, place the low frequency transducer just above the anterior superior iliac crest, and work in a cephalad direction along the perico-lic gutter. As the transducer is moved up the abdomen, fan the probe in a medial direction toward the midline and in
FIGURE 13.2. Rounded Wall of Urinary Bladder with Ascites in the Peritoneal Cavity. B, Bladder; FF, free fluid .

chapter 13 / Abdominal Procedures 197
of ultrasound guidance, a depth of 2 cm may be acceptable. The decision to proceed with paracentesis is determined by the clinical situation.
After an insertion site is chosen and the skin is prepared for asepsis, the clinician can choose between a static and a dynamic technique. If the fluid collection is large, a static approach is satisfactory, as long as the patient remains in the same position. In general, a dynamic technique is safer and recommended. If a dynamic technique is chosen, the linear probe is covered with a sterile sleeve and placed on the ster-ile field or on a sterile procedure tray. The two techniques used for any needle guidance procedure using ultrasound are the in-plane or long axis approach and the out-of-plane or short axis approach. Whichever the clinician is more comfortable with is acceptable. The short axis approach is easier, although it carries a risk of inserting the needle too deep, since only the section of the needle directly under the transducer is seen. When there is an abundance of fluid, this method should not be a problem. When there is little fluid to access, particularly when sensitive structures are nearby, the long axis approach is preferred. This approach, though more difficult, provides real-time visualization of the entire length of the needle as it enters the peritoneum. Either technique can be performed by one clinician using the sterile trans-ducer; the needle is inserted with the dominant hand while the other hand holds the transducer.
Whichever approach is used, one must be sure to reex-amine the chosen site in two perpendicular planes to assure an adequate volume of fluid. Bowel will tend to move over time due to peristalsis. It also moves when the patient adjusts his/her upper body position or coughs. If the fluid is no longer present at the premarked site, scan the adja-cent sterilized area, and if need be, repeat the entire search and aseptic preparation. After the proposed site and path of the needle catheter is determined, local anesthesia should be injected down to and including the parietal peritoneum. Using the short axis approach the needle catheter is inserted next to the middle of the long edge of the linear probe as the probe is held perpendicular to the skin. The transducer should be moved forward as the needle advances, ideally scanning the tip of the needle. If need be, the clinician can halt the needle and shift the transducer away from and then back toward the needle to clarify where the tip of the needle is located. When the needle is about to enter the peritoneum,
a lateral direction toward the edge of the peritoneum. The transducer may need to be shifted in a medial or lateral direc-tion, depending on the size of the patient’s abdomen. When a potential site for paracentesis is identified, rotate the probe 90 degrees to ensure that the fluid is present in two planes. When scanning the infraumbilical area, place the probe a couple of centimeters below the umbilicus in the midline, and move in a caudal direction. Again, check each area of fluid in two perpendicular planes. The minimal depth of fluid needed to safely attempt paracentesis is generally considered about 3 cm (Fig. 13.5). For those experienced with the use
FIGURE 13.3. Schemata of the Inferior Epigastric Artery Distribution.
FIGURE 13.4. Lower Abdominal Areas to Scan for a Potential Paracentesis Site.
FIGURE 13.5. Image of an Adequate Depth of Ascites Needed to Per-form Ultrasound-Guided Paracentesis. The image includes mesentery and bowel deep to the fluid .

198 Section iii / Evaluation of Abdominal Conditions
Image AcquisitionAbdominal wall hernias are scanned using a high frequency (5 to 10 MHz) linear probe placed directly over the mass. Using B-mode, the echo characteristics of the hernia sac and the abdominal wall defect are usually easy to identify. The hernia should be visualized in two perpendicular planes to properly determine the size of the hernia and the size of the wall defect. In patients with obesity, the hernia may lie deep to a thick fatty layer of Camper’s fascia overlying the abdominal muscles. In this situation a lower frequency probe (3 to 5 MHz) is recommended. The large curvilinear trans-ducer is best because the large footprint is helpful to use when applying pressure to reduce the hernia back into the abdomen.
Anatomy and LandmarksMost abdominal wall hernias contain protruding loops of small bowel or peritoneal fat, although they may rarely contain large bowel or even urinary bladder wall. Loops of small bowel have a characteristic circular appearance when viewed in cross section, and are elongated when viewed more obliquely. Bowel wall appears hyperechoic compared with fluid within the lumen. However, if the lumen contains digested food, the bowel walls and contents are nearly isoechoic. The peristaltic movement of bowel gives a swaying to-and-fro appearance. This gives bowel wall a spotty echogenic character and pro-vides for easy identification within a hernia sac.
If the hernia sac contains intraperitoneal fat, peristalsis is absent and the contents are relatively isoechoic and homoge-neous to the surrounding subcutaneous fat of Camper’s fascia. This can make the hernia sac more difficult to identify. To assist, look for the spherical perimeter of the sac dividing the confluence of its contents from the surrounding subcutaneous tissue (Fig. 13.6; VIDEO 13 .5).
If incarcerated bowel becomes ischemic, one can begin to identify certain changes. Bowel will become akinetic. Gradually, there is swelling of the bowel wall, and fluid may begin to accumulate both inside the bowel lumen and within the sac of the hernia. These findings are specific for incar-cerated bowel (20). If these findings are present, one may also find that the small bowel within the peritoneal cavity is dilated, suggesting obstruction. This is further support for the diagnosis of an incarcerated hernia.
ProcedureTo reduce an abdominal wall hernia using ultrasound guid-ance, one should first scan to find the defect in the abdominal wall and also to evaluate the hernia sac contents and size. Gauging the defect size and the area of the hernia sac will require that the area be scanned in two perpendicular planes. This anatomic information is important when the clinician attempts to reduce the hernia. Using dynamic ultrasound guidance, the clinician applies constant gradual pressure to the perimeter of the hernia sac while directing the contents toward the opening in the abdominal wall. This is done with the transducer held like a writing instrument in one hand as both sets of fingers, and if needed, the hypothenar bases of the hand, encircle the perimeter of the hernia sac (Fig. 13.7). Pressure is applied with both the hands and the footprint of the transducer. Applying a moderate amount of pressure for several minutes is the proper technique. One can tell if the pressure is adequate by seeing if the superficial wall of the
the inner wall of the abdomen will be seen tenting inward. At this point, short controlled jabs with the needle may help to pierce the peritoneal fascia. Once in the peritoneal cav-ity, the needle is seen as a hyperechoic point within the anechoic fluid. If the long axis approach is used, the en-tire needle is followed as it tracks through the abdominal wall and into the peritoneum ( VIDEO 13 .3). With either approach, make sure that the needle has advanced about a centimeter into the ascites before collecting fluid and ad-vancing the catheter. At this stage the ultrasound transducer can be set aside and the procedure can be completed in the usual manner.
Pitfalls and ComplicationsWhen performing any procedure using needle place-ment, the inherent risk is penetrating a sensitive struc-ture. This risk is reduced with ultrasound guidance, and is related to the experience one has with both ultrasound and paracentesis. The most common complication of ultrasound-guided paracentesis is bleeding. Bleeding can occur from penetrating a solid organ or from penetrating an abdominal wall vessel. The organs most at risk of penetra-tion are an enlarged liver or spleen. Bowel is less at risk of penetration, presumably because it is suspended from mesentery and freely floating in ascites ( VIDEO 13 .4). Even if bowel is penetrated, the risk of peritonitis is gener-ally believed to be low. Bleeding complications have been observed in ,1% of patients using ultrasound guidance (7). Rates of peritonitis or infection within the abdominal wall ranged from 0.06% to 0.16% in two studies using ultra-sound guidance (2,7).
HERNIA REDUCTIONClinical IndicationsTraditionally, abdominal wall and inguinal hernias have been diagnosed by physical examination and confirmed by either plain abdominal films or computed tomography (CT). More recently bedside ultrasound has become an efficient and reli-able imaging tool for diagnosing external hernias. It can also assist the clinician in real-time reduction of hernias.
Abdominal wall hernias are usually asymptomatic, but if bowel becomes incarcerated, the patient’s condition be-comes emergent. Studies state this incidence is 0.3% to 3% per year (8–10). Of further concern is that 10% to 19% of incarcerated bowel will eventually strangulate, neces-sitating bowel resection (11–13). There are no defined clinical indicators that reliably help to differentiate incar-cerated bowel from strangulated bowel (14). Despite this, attempting to manually reduce painful incarcerated hernias is believed to be safe. Manual reduction of an incarcerated hernia may effectively change the patient’s treatment plan from emergent surgery with probable bowel resection to an elective hernia repair, thus greatly decreasing the risk of complications (15). Manual reduction of incarcerated bowel is reported to be successful in about 60% of the cases (16). Ultrasound can potentially guide the direction and amount of pressure used to reduce the hernia and may increase the rate of successful reduction (17–19). Further, ultrasound can be used to visualize the success or failure of attempts at reduction.

chapter 13 / Abdominal Procedures 199
ultrasound-guided reduction is successful, if the patient had evidence of inflamed bowel, they will need to be observed for improvement.
DETERMINATION OF BLADDER VOLUMEIntroductionAcute anuresis is usually caused by increased resistance to outflow, either from an obstructive problem or from a dy-namic problem involving neurogenic control. By far the most common reason is prostatic hypertrophy in older males, but there are many etiologies for urinary retention in both males and females. The usual presentation is distention of the lower abdomen with fullness or pain. Another concern for acute anuresis is intrinsic renal failure.
Clinical IndicationsClinical indications for using ultrasound to determine blad-der volume include:
1. Detection of urinary retention 2. Measurement of bladder volume 3. Assessment of volume in patients undergoing suprapu-
bic aspiration
Image AcquisitionIn most adults the bladder can be imaged best by using a 3 to 5 MHz curvilinear transducer typically used for general abdominal/pelvic applications. In children, a higher frequency 7.5 to 10 MHz transducer may be used. The scan should be-gin just above the pubic symphysis. In a distended bladder, the bladder will typically be easy to visualize as a midline anechoic structure that displaces other structures. If the blad-der is empty or not visualized, tilt the transducer inferiorly to image into the pelvis below and behind the pubis. The bladder should be viewed in both sagittal and transverse orientations.
Anatomy and LandmarksThe urinary bladder is a triangle-shaped, hollow, distensible, muscular organ located in the lower abdomen behind the pubic bone. In males it sits above the prostate. The rectum is posterior to it. In females, the bladder sits superior to the uterus. The bladder is held in place by ligaments that are
hernia sac is deforming. If the reduction is successful, the contents will be seen entering back into the abdominal cavity.
Pitfalls and ComplicationsAn abdominal wall mass may be in the proper location for a wall hernia, but may have another appearance by ultra-sound ( VIDEO 13 .6). Ultrasound will differentiate a her-nia from other masses such as hematoma, abscess, lipoma, lymphatic tissue, tumor, or endometrioma. In those patients presenting with clinical and ultrasonographic findings of incarceration, attempting to reduce the hernia is considered a safe procedure. Despite this, reduction of necrotic bowel has been reported in rare cases, though there have been no studies calculating the estimated risk (16). The clinician should consider the clinical risk of bowel strangulation for each patient. Bowel strangulation tends to occur in hernias that have narrow orifices (femoral, umbilical, and inci-sional). These hernias are typically more difficult to reduce (11,16,21). Patients who have ultrasound findings of edema-tous incarcerated bowel and who have been symptomatic for more than 24 hours have been found at greater risk for bowel strangulation (11). Vigorous attempts to reduce her-nias in these patients should be avoided. Surgery should be involved early for cases of possible strangulation. Even when
A
B
FIGURE 13.6. A: Ventral hernia defect with a hernia sac containing intra-peritoneal fat . B: A schemata of the hernia as shown .
FIGURE 13.7. Dynamic Imaging of Abdominal Wall Hernia during Manual Reduction.

200 Section iii / Evaluation of Abdominal Conditions
multiply the product of height, width, and depth by a correc-tion coefficient that takes into account the shape of a bladder. These formulas are simple and practical for clinical use, but the correction coefficients vary greatly in the literature, from 0.47 to 1.39, owing presumably to the variety of shapes the bladder can assume (25,27–30,32–36). The percent error of these formulas ranges from 11.5% to 35% (37). To determine the most accurate correlation coefficient, Bih et al. tested 10 different formulas using linear regression. They found that height 3 transverse depth 3 width 3 0.72 yielded the op-timal results. The mean error was 16.9% ± 11.9% (36). In one study on children, the correlation coefficient of 0.9 yielded a mean error of 11.5% in patients with normal bladders (28).
Some ultrasound machines are designed to only measure bladder volume. These machines are capable of estimating bladder shape, and thus can offer slightly more accurate mea-surements than conventional ultrasound. These handheld or cart-based units are easy to operate and provide fast read-ings. The most studied instrument (BladderScan, BVI 300) is operated by holding the scanning head above the symphy-sis pubis in the midline. A 2 MHz transducer head rotates in 15-degree increments and obtains 12 cross-sectional area measurements. The machine provides a mean error range of 18% to 22% (38,39). Other machines are capable of real-time three-dimensional images. In several studies, three- dimensional is as accurate as two-dimensional equipment and likely more accurate at small volumes ,100 cm3 (40).
Bladder scanning and volume measurement using con-ventional point-of-care ultrasound is performed using a 2 to 5 MHz abdominal transducer. The transverse plane is visu-alized and the greatest diameter for depth is measured us-ing the cursor. In the same way, the width is measured. The probe is switched to the longitudinal plane, and the height is measured. Each of these values is entered into the calcu-lation software that computes a value for the total volume (Fig. 13.8).
attached to other organs and to the pelvic bones. The ultra-sound appearance of the bladder is typical of a fluid-filled anechoic structure with a discrete wall. Occasionally, echo-genic debris may be seen if there is significant hemorrhage or hematuria with blood clots. An enlarged prostate may impinge into the lower bladder in patients with prostatic hypertrophy.
ProcedureUrethral catheterization is recognized as a standard for mea-suring postvoid residual urine volumes (22). However, cath-eterization has several clinical limitations. The procedure is uncomfortable and increases risk of urinary infection, prostate infection, and urethral trauma. In women, the risk of obtain-ing a urinary infection from in-and-out catheterization is esti-mated between 1% and 20% (23). Ultrasound measurement of bladder volume has become a reasonable alternative to cath-eterization. As with other applications of ultrasound, bladder volume measurement is quick, safe, noninvasive, and painless.
Measuring bladder volume is the first step in the evaluation of urinary retention. Because the feeling of bladder fullness or pressure starts with about 300 cm3 of filling, anyone who has sensation of pelvic fullness, especially with decreased urinary output, should have his or her bladder volume mea-sured after voiding. If the postvoid residual is greater than approximately 200 cm3, the patient has urinary retention that is at risk of progressing to large volume retention.
Bladder volume measurement is based upon the volume calculation of a sphere, or 4/3 p r 3. The shape of the bladder, however, is quite unlike that of a sphere. Shape also differs according to age, disease, and gender, and in response to external structures encroaching upon it, like the uterus and prostate (22–26).
Many formulas have been proposed to more accurately cal-culate bladder volume using conventional ultrasound machine measurement (25,27–35). The most commonly used formulas
+
+
+
+
+
+
1 3
2
FIGURE 13.8. The Bladder is Visualized in a Midline Suprapubic Scan in Sagittal and Transverse Orientations. Measurement in three dimensions provides an estimate of bladder volume .

chapter 13 / Abdominal Procedures 201
19. Koseoglu K, Ozsunar Y, Taskin F, et al. Partial preoperative reduction of inguinal hernia through compression with an ultrasound transducer. J Clin Ultrasound. 2003;31(7):379–382.
20. Rettenbacher T, Hollerweger A, Macheiner P, et al. Abdominal wall hernias: cross-sectional imaging signs of incarceration determined with sonography. AJR Am J Roentgenol. 2001;177(5):1061–1066.
21. Alvarez JA, Baldonedo RF, Bear IG, et al. Incarcerated groin hernias in adults: presentation and outcome. Hernia. 2004;8(2):121–126.
22. Mainprize TC, Drutz HP. Accuracy of total bladder volume and residual urine measurements: comparison between real-time ultrasonography and catheterization. Am J Obstet Gynecol. 1989;160(4):1013–1016.
23. Stamey TA, Pfau A. Urinary infections: a selective review and some observations. Calif Med. 1970;113(6):16–35.
24. Kiely EA, Hartnell GG, Gibson RN, et al. Measurement of bladder volume by real-time ultrasound. Br J Urol. 1987;60(1):33–35.
25. Hakenberg OW, Ryall RL, Langlois SL, et al. The estimation of bladder volume by sonocystography. J Urol. 1983;130(2):249–251.
26. Hiraoka M, Hori C, Tsuchida S, et al. Ultrasonographic evaluation of bladder volume in young children. Pediatr Nephrol. 1995;9(3): 351–353.
27. Kjeldsen-Kragh J. Measurement of residual urine volume by means of ultrasonic scanning: a comparative study. Paraplegia. 1988; 26(3):192–199.
28. Bis KG, Slovis TL. Accuracy of ultrasonic bladder volume measurement in children. Pediatr Radiol. 1990;20(6):457–460.
29. Poston, GJ, Joseph AE, Riddle PR. The accuracy of ultrasound in the mea-surement of changes in bladder volume. Br J Urol. 1983;55(4):361–363.
30. Hartnell GG, Kiely EA, Williams G, et al. Real-time ultrasound mea-surement of bladder volume: a comparative study of three methods. Br J Radiol. 1987;60(719):1063–1065.
31. Espuela Orgaz R, Zuluaga Gomez A, Torres Ramirez C, et al. Applica-tions of bladder ultrasonography. I. Bladder content and residue. J Urol. 1981;125(2):174–176.
32. McLean GK, Edell SL. Determination of bladder volumes by gray scale ultrasonography. Radiology. 1978;128(1):181–182.
33. Pedersen JF, Bartrum RJ, Grytter C. Residual urine determination by ultrasonic scanning. Am J Roentgenol Radium Ther Nucl Med. 1975;125(2):474–478.
34. Holmes JH. Ultrasonic studies of the bladder. J Urol. 1967;97(4):654–663. 35. Paltieli Y, Degani S, Aharoni A, et al. Ultrasound assessment of the
bladder volume after anterior colporrhaphy. Gynecol Obstet Invest. 1989;28(4):209–211.
36. Bih LI, Ho CC, Tsai SJ, et al. Bladder shape impact on the accuracy of ultrasonic estimation of bladder volume. Arch Phys Med Rehabil. 1998;79(12):1553–1556.
37. Huang YH, Bih LI, Chen SL, et al. The accuracy of ultrasonic estimation of bladder volume: a comparison of portable and stationary equipment. Arch Phys Med Rehabil. 2004;85(1):138–141.
38. Cardenas DD, Kelly E, Krieger JN, et al. Residual urine volumes in patients with spinal cord injury: measurement with a portable ultrasound instrument. Arch Phys Med Rehabil. 1988;69(7):514–516.
39. Revord JP, Opitz JL, Murtaugh P, et al. Determining residual urine volumes using a portable ultrasonographic device. Arch Phys Med Rehabil. 1993;74(5):457–462.
40. Ghani KR, Pilcher J, Rowland D, et al. Portable ultrasonography and bladder volume accuracy—a comparative study using three-dimensional ultrasonography. Urology. 2008;72(1):24–28.
Pitfalls and ComplicationsThe bladder is a simple structure, and recognition of a dis-tended bladder is typically obvious by simple observation. Occasionally, large fluid-filled bowel loops or large ovarian cysts can be mistaken for the bladder. Consistently viewing all structures in two perpendicular planes minimizes the risk of misidentifying structures.
REFERENCES 1. Nazeer SR, Dewbre H, Miller AH. Ultrasound-assisted paracentesis per-
formed by emergency physicians vs the traditional technique: a prospec-tive, randomized study. Am J Emerg Med. 2005;23(3):363–367.
2. Cervini P, Hesley GK, Thompson RL, et al. Incidence of infec-tious complications after an ultrasound-guided intervention. AJR Am J Roentgenol. 2010;195(4):846–850.
3. Salerno F, Guevara M, Bernardi M, et al. Refractory ascites: pathogen-esis, definition and therapy of a severe complication in patients with cirrhosis. Liver Int. 2010;30(7):937–947.
4. Cattau EL Jr, Benjamin SB, Knuff TE, et al. The accuracy of the physical examination in the diagnosis of suspected ascites. JAMA. 1982;247(8):1164–1166.
5. Williams JW Jr, Simel DL. The rational clinical examination. Does this patient have ascites? How to divine fluid in the abdomen. JAMA. 1992;267(19):2645–2648.
6. Sakai H, Sheer TA, Mendler MH, et al. Choosing the location for non-image guided abdominal paracentesis. Liver Int. 2005;25(5):984–986.
7. De Gottardi A, Thévenot T, Spahr L, et al. Risk of complications after abdominal paracentesis in cirrhotic patients: a prospective study. Clin Gastroenterol Hepatol. 2009;7(8):906–909.
8. Gallegos, NC, Dawson J, Jarvis M, et al. Risk of strangulation in groin hernias. Br J Surg. 1991;78(10):1171–1173.
9. Hair A, Paterson C, Wright D, et al. What effect does the duration of an inguinal hernia have on patient symptoms? J Am Coll Surg. 2001;193(2):125–129.
10. Rai S, Chandra SS, Smile SR. A study of the risk of strangulation and obstruction in groin hernias. Aust N Z J Surg. 1998;68(9):650–654.
11. Andrews NJ. Presentation and outcome of strangulated external hernia in a district general hospital. Br J Surg. 1981;68(5):329–332.
12. Kulah B, Duzgun AP, Moran M, et al. Emergency hernia repairs in elderly patients. Am J Surg. 2001;182(5):455–459.
13. Kulah B, Kulacoglu IH, Oruc MT, et al. Presentation and outcome of incarcerated external hernias in adults. Am J Surg. 2001;181(2):101–104.
14. Bekoe S. Prospective analysis of the management of incarcerated and strangulated inguinal hernias. Am J Surg. 1973;126(5):665–668.
15. Nyhus LM, Condon RE, eds. Hernia. 4th ed. Philadelphia, PA: JB Lippincott; 1995.
16. Harissis HV, Douitsis E, Fatouros M. Incarcerated hernia: to reduce or not to reduce? Hernia. 2009;13(3):263–266.
17. Chen SC, Lee CC, Liu YP, et al. Ultrasound may decrease the emergency surgery rate of incarcerated inguinal hernia. Scand J Gastroenterol. 2005;40(6):721–724.
18. Torzilli G, Del Fabbro D, Felisi R, et al. Ultrasound-guided reduc-tion of an incarcerated Spigelian hernia. Ultrasound Med Biol. 2001;27(8):1133–1135.

202
the emergency sonographer should be able to recognize the findings discussed in this chapter.
IMAGE ACQUISITIONTransabdominal sonography (TAS) and transvaginal sonog-raphy (TVS) complement each other; each offers unique advantages and disadvantages in terms of visualizing pelvic anatomy. Transabdominal sonography is noninvasive and affords a broad view of all of the pelvic structures (includ-ing the uterus, cervix, vagina, and ovaries) and their relative relationship to each other and any mass seen. The utility of TAS is strikingly dependent on the degree of bladder fill-ing; this is a serious disadvantage in ED practice, where a urine sample has usually been obtained prior to the exam. In contrast, a relatively empty bladder is optimal for TVS. The full bladder optimizes transabdominal scanning for two rea-sons. First, it provides an excellent acoustic window, which allows for greater resolution of the pelvic structures in ques-tion. And second, the full bladder displaces bowel loops from the pelvis and acts as a spacer between the transducer and the pelvic organs, allowing the areas of interest to be more optimally aligned with the focal length of the usual transab-dominal probe (3.5 to 5 MHz). In contrast to TVS, visualiza-tion of pelvic anatomy with TAS may be limited somewhat by marked obesity due to the attenuation that occurs as the
INTRODUCTIONThe use of pelvic ultrasound for the threatened first trimester pregnancy has long been well accepted in emergency depart-ment (ED) practice; however, its application to the nonpreg-nant patient has become better defined only in the last few years (1–3). The ability of pelvic ultrasound (both trans-vaginal and transabdominal) to characterize solid and cystic masses and to identify abnormal fluid collections makes it well suited to the investigation of many types of pelvic pa-thology (4). The purpose of this chapter is to describe both the normal and the abnormal anatomy of the nongravid fe-male, identify common variants, and outline how pelvic ul-trasound may be incorporated into routine ED practice.
CLINICAL APPLICATIONSThe pelvic ultrasound examination may be performed as part of the evaluation of pelvic pain or masses reported by the pa-tient, found on physical exam, or visualized by other imaging modalities. Indeed, many clinicians have found that perform-ing a pelvic ultrasound contemporaneously with each pelvic exam, regardless of pregnancy status, increases skill level and appreciation for normal anatomy as well as providing additional valuable clinical information. Once comfortable with the sonographic appearance of normal pelvic anatomy,
ARTIFACTS AND PITFALLS . . . . . . . . . . . . . . . . . . . . . . . . . 213USE OF THE IMAGE IN CLINICAL
DECISION MAKING . . . . . . . . . . . . . . . . . . . . . . . . . . . . . 214COMPARISON wITH OTHER IMAGING MODALITIES . . . . . . 214INCIDENTAL FINDINGS . . . . . . . . . . . . . . . . . . . . . . . . . . . . 214
Uterine Anomalies . . . . . . . . . . . . . . . . . . . . . . . . . . . . 214Vaginal and Cervical Findings . . . . . . . . . . . . . . . . . . . 215Free Fluid . . . . . . . . . . . . . . . . . . . . . . . . . . . . . . . . . . . 215
CLINICAL CASE . . . . . . . . . . . . . . . . . . . . . . . . . . . . . . . . . . 215
INTRODUCTION . . . . . . . . . . . . . . . . . . . . . . . . . . . . . . . . . . 202CLINICAL APPLICATIONS . . . . . . . . . . . . . . . . . . . . . . . . . . 202IMAGE ACQUISITION . . . . . . . . . . . . . . . . . . . . . . . . . . . . . . 202NORMAL ULTRASOUND ANATOMY . . . . . . . . . . . . . . . . . . . 205
Uterine Anatomy . . . . . . . . . . . . . . . . . . . . . . . . . . . . . 205Ovarian Anatomy . . . . . . . . . . . . . . . . . . . . . . . . . . . . . 206
PATHOLOGY . . . . . . . . . . . . . . . . . . . . . . . . . . . . . . . . . . . . . 208Uterine Pathology . . . . . . . . . . . . . . . . . . . . . . . . . . . . 208Ovarian Pathology . . . . . . . . . . . . . . . . . . . . . . . . . . . . 209
Jeanne Jacoby and Michael Heller
Pelvic Ultrasound in the Nongravid Patient
14
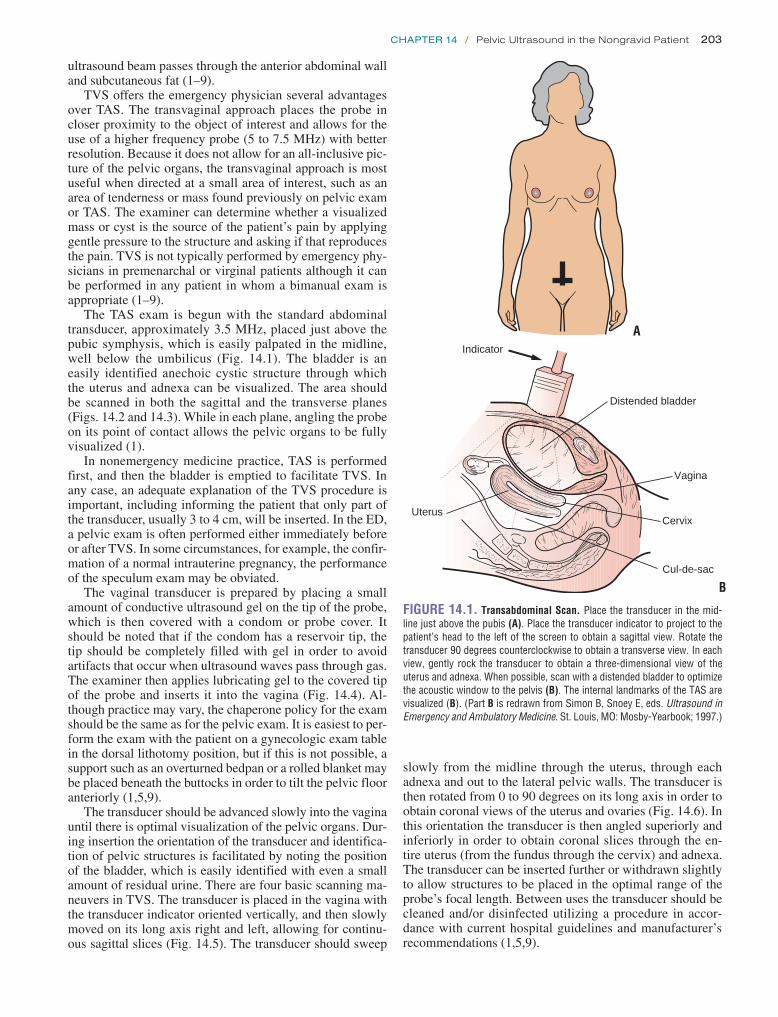
Chapter 14 / Pelvic Ultrasound in the Nongravid Patient 203
ultrasound beam passes through the anterior abdominal wall and subcutaneous fat (1–9).
TVS offers the emergency physician several advantages over TAS. The transvaginal approach places the probe in closer proximity to the object of interest and allows for the use of a higher frequency probe (5 to 7.5 MHz) with better resolution. Because it does not allow for an all-inclusive pic-ture of the pelvic organs, the transvaginal approach is most useful when directed at a small area of interest, such as an area of tenderness or mass found previously on pelvic exam or TAS. The examiner can determine whether a visualized mass or cyst is the source of the patient’s pain by applying gentle pressure to the structure and asking if that reproduces the pain. TVS is not typically performed by emergency phy-sicians in premenarchal or virginal patients although it can be performed in any patient in whom a bimanual exam is appropriate (1–9).
The TAS exam is begun with the standard abdominal transducer, approximately 3.5 MHz, placed just above the pubic symphysis, which is easily palpated in the midline, well below the umbilicus (Fig. 14.1). The bladder is an easily identified anechoic cystic structure through which the uterus and adnexa can be visualized. The area should be scanned in both the sagittal and the transverse planes (Figs. 14.2 and 14.3). While in each plane, angling the probe on its point of contact allows the pelvic organs to be fully visualized (1).
In nonemergency medicine practice, TAS is performed first, and then the bladder is emptied to facilitate TVS. In any case, an adequate explanation of the TVS procedure is important, including informing the patient that only part of the transducer, usually 3 to 4 cm, will be inserted. In the ED, a pelvic exam is often performed either immediately before or after TVS. In some circumstances, for example, the confir-mation of a normal intrauterine pregnancy, the performance of the speculum exam may be obviated.
The vaginal transducer is prepared by placing a small amount of conductive ultrasound gel on the tip of the probe, which is then covered with a condom or probe cover. It should be noted that if the condom has a reservoir tip, the tip should be completely filled with gel in order to avoid artifacts that occur when ultrasound waves pass through gas. The examiner then applies lubricating gel to the covered tip of the probe and inserts it into the vagina (Fig. 14.4). Al-though practice may vary, the chaperone policy for the exam should be the same as for the pelvic exam. It is easiest to per-form the exam with the patient on a gynecologic exam table in the dorsal lithotomy position, but if this is not possible, a support such as an overturned bedpan or a rolled blanket may be placed beneath the buttocks in order to tilt the pelvic floor anteriorly (1,5,9).
The transducer should be advanced slowly into the vagina until there is optimal visualization of the pelvic organs. Dur-ing insertion the orientation of the transducer and identifica-tion of pelvic structures is facilitated by noting the position of the bladder, which is easily identified with even a small amount of residual urine. There are four basic scanning ma-neuvers in TVS. The transducer is placed in the vagina with the transducer indicator oriented vertically, and then slowly moved on its long axis right and left, allowing for continu-ous sagittal slices (Fig. 14.5). The transducer should sweep
slowly from the midline through the uterus, through each adnexa and out to the lateral pelvic walls. The transducer is then rotated from 0 to 90 degrees on its long axis in order to obtain coronal views of the uterus and ovaries (Fig. 14.6). In this orientation the transducer is then angled superiorly and inferiorly in order to obtain coronal slices through the en-tire uterus (from the fundus through the cervix) and adnexa. The transducer can be inserted further or withdrawn slightly to allow structures to be placed in the optimal range of the probe’s focal length. Between uses the transducer should be cleaned and/or disinfected utilizing a procedure in accor-dance with current hospital guidelines and manufacturer’s recommendations (1,5,9).
FIGURE 14.1. Transabdominal Scan. Place the transducer in the mid-line just above the pubis (A) . Place the transducer indicator to project to the patient’s head to the left of the screen to obtain a sagittal view . Rotate the transducer 90 degrees counterclockwise to obtain a transverse view . In each view, gently rock the transducer to obtain a three-dimensional view of the uterus and adnexa . When possible, scan with a distended bladder to optimize the acoustic window to the pelvis (B) . The internal landmarks of the TAS are visualized (B) . (Part B is redrawn from Simon B, Snoey E, eds . Ultrasound in Emergency and Ambulatory Medicine . St . Louis, MO: Mosby-Yearbook; 1997 .)
Distended bladder
Indicator
UterusCervix
Cul-de-sac
Vagina
A
B

Bladder
AdnexaUterus
Distended bladder
Uterus
Indicator
Cul-de-sac
Cervix
A
Bladder
Uterus
CervixCul-de-sac B
FIGURE 14.2. Transabdominal Scan of the Female Pelvis, Sagittal View. The transducer is placed in the midline, just above the pubis, using the bladder as an acoustic window (A) . The arrow notes the indicator positioned toward the patient’s head to obtain a sagittal orientation (A) . A schematic of the anatomy of the normal female pelvis (B) . Ultrasound of the normal female pelvis (C) . The vaginal stripe is visible . The angle between the cervix and the uterine fundus approximates 90 degrees . (Part A is redrawn from Simon B, Snoey, E, eds . Ultrasound in Emergency and Ambulatory Medicine . St . Louis, MO: Mosby-Yearbook; 1997 .)C
Anterior
Indicator
A B
204
FIGURE 14.3. Transabdominal Scan of the Female Pelvis, Transverse View. The transducer is placed in the midline just above the pelvis in a trans-verse orientation (A) . The indicator points to the patient’s right (A) . A schematic of the anatomy of the normal female pelvis is seen in transverse orientation (B) . Ultrasound of the normal female pelvis in transverse orientation (C) . (Part A is redrawn from Simon B, Snoey E, eds . Ultrasound in Emergency and Ambula-tory Medicine . St . Louis, MO: Mosby-Yearbook; 1997 .)C

Chapter 14 / Pelvic Ultrasound in the Nongravid Patient 205
NORMAL ULTRASOUND ANATOMYUterine AnatomyThe uterus is a muscular, hollow organ with an average size of 7 3 4 cm in nulliparous and 8.5 3 5.5 cm in multipa-rous women. It is bounded by the rectum posteriorly, the
bladder anteriorly, and the two bands of the broad ligament laterally (10). In TAS, the bladder acts as an acoustic window through which the uterus can be visualized. The position of the uterus can vary with the relative state of distention of the bladder and rectum. Except when displaced by a distended bladder, the uterus usually forms a right angle with the cer-vix; this is also called anteflexion (Fig. 14.7). Version refers to the axis of the cervix relative to the vagina, and flexion, the axis of the uterine body to the cervix. The uterus may be retroflexed (Fig. 14.8); this normal variant may make it dif-ficult to visualize the uterine fundus.
The deep layer of the endometrium does not change sig-nificantly during menses, unlike the mucosal lining of the uterine canal whose function and appearance varies through-out the menstrual cycle. The opposing surfaces of the endo-metrial lining form a hyperechoic line that is referred to as the endometrial stripe or endometrial echo complex. The proliferative phase immediately follows menses and begins with a thin, 1- to 2-mm lining that grows under the influence of estrogen in preparation for implantation of the fertilized ovum (Fig. 14.9). Ovulation occurs near day 14 of the men-strual cycle and is followed by the secretory phase. Under the influence of progesterone secreted by the corpus luteum, the endometrium develops protein-rich secretory products and grows up to 12 mm in width (Fig. 14.10) (11–14). The endometrial echo complex is best visualized in the sagittal plane. The central canal, when viewed in the coronal plane, appears as an echogenic “core” (Fig. 14.6). The thickness of the endometrial lining should be measured between the basal layers, which appear as hyperechoic lines surrounding the hypoechoic functional layer (Fig. 14.11) (1–9,14,15).
Bladder
Vagina
Indicator
Uterus
FIGURE 14.4. The Transvaginal Scan of the Female Pelvis. Place the endovaginal transducer in the vaginal vault, just as you would a speculum . Begin in the sagittal plane with the transducer indicator pointed up . Advance only as far as necessary to visualize the uterus . Find the endometrial stripe to identify the midline of the uterus . Rotate the transducer 90 degrees coun-terclockwise (indicator pointing toward the patient’s right side) to obtain a coronal view . In each orientation, gently rock the transducer in all planes to obtain a three-dimensional view of the uterus and adnexa . (Redrawn from Simon B, Snoey E, eds . Ultrasound in Emergency and Ambulatory Medicine . St . Louis, MO: Mosby-Yearbook; 1997 .)
FIGURE 14.5. Transvaginal Ultrasound of the Normal Female Pelvis, Sagittal Orientation. The transducer is placed in the vaginal vault and ad-vanced until the uterus is seen (A) . The indicator is placed up to obtain a sagittal orientation (A) . A schematic of the anatomy of the normal female pelvis (B) . An ultrasound of a normal anteverted uterus as seen in sagittal orientation (C) . Compare (C) to Figure 14 .2C (same patient) . Note the im-proved visualization of the endometrial echo complex with the higher resolu-tion transvaginal transducer . (Part A is redrawn from Simon B, Snoey E, eds . Ultrasound in Emergency and Ambulatory Medicine . St . Louis, MO: Mosby-Yearbook; 1997 .)C
Bladder
Vagina
Indicator
Uterus
Bladder
Uterus
A B

206 SeCtion iV / Evaluation of Pelvic Complaints
FIGURE 14.7. A: Transabdominal Scan of the Uterus-Anteflexion . The uterine fundus (left) usually forms a right angle with the cervix (right), called anteflexion . B: Schematic representation of ultrasound image .
Ovarian AnatomyThe ovaries are paired oval-shaped organs that are approxi-mately 3 cm long, 1.5 cm wide, and 1 cm thick. The ovaries lie anterior and medial to the internal iliac vessels, which can serve as a useful landmark when attempting to locate the ovary (Figs. 14.12 and 14.13). The ovaries effectively have a dual arterial blood supply; the ovarian artery arises from the aorta and runs in the suspensory ligament of the ova-ries, where it anastomoses with branches of the uterine ar-tery (9,10). This additional blood supply becomes important
when evaluating a patient for ovarian torsion as evidence of some blood flow to the ovaries does not rule out torsion.
On ultrasound examination of the premenopausal woman, ovaries often appear as foamy structures secondary to the presence of multiple follicles (Fig. 14.14). Prior to the on-set of menses, fluid accumulates in a cohort of follicles that increase in size. When they reach 1 to 2 mm in size, they can be visualized on TVS. Multiple small follicles are seen from day 5 to 7, and by day 8 to 12 one or more dominant follicles can be seen. Although up to 10% of women have
Bladder
Vagina
IndicatorUterus
A
Cul-de-sac
Uterus
B
FIGURE 14.6. Transvaginal Ultrasound of the Normal Female Pelvis, Coronal Orientation. The transducer is placed in the vaginal vault and ad-vanced until the uterus is seen (A) . The indicator is placed on the patient’s right side to obtain a coronal view (A) . A schematic of the anatomy of the female pelvis (B) . An ultrasound of a normal anteverted uterus (C) . Com-pare Part C to Figure 14 .3C (same patient) . Note the improved visualization with the transvaginal view . In this coronal view of the uterus, the endo-metrial echo complex appears as a core in the center of the image . (Part A is redrawn from Simon B, Snoey E, eds . Ultrasound in Emergency and Ambulatory Medicine . St . Louis, MO: Mosby-Yearbook; 1997 .)C
A
Bladder
Uterus
Cervix
B

Chapter 14 / Pelvic Ultrasound in the Nongravid Patient 207
FIGURE 14.9. Transvaginal Scan of the Uterus—Proliferative Endome-trium. During the proliferative phase of the menstrual cycle, the endometrial echo complex grows in preparation for ovulation (usually occurring on day 14 of the cycle) . One should expect to see variations in the width and echogenic texture of the endometrium during different phases of the menstrual cycle .
FIGURE 14.11. Transvaginal Scan of the Uterus. The endometrial echo complex should be measured in the sagittal plane between the two hyper-echoic lines surrounding the hypoechoic functional layer .
FIGURE 14.10. Transvaginal Scan of the Uterus—Secretory Endome-trium. During the secretory phase of the menstrual cycle, the endometrium develops protein-rich secretory products and may reach 12 mm in width .
I
FIGURE 14.12. Transvaginal Scan of the Left Ovary. The left ovary is visible just medial to the internal iliac vein (I) . This vessel is a useful landmark when attempting to locate the ovary .
FIGURE 14.8. A: Transabdominal Scan of the Uterus—Retroflexion . The uterine fundus is “tipped” and is seen almost immediately below the cervix . This is called retroflexion . B: Schematic representation of ultrasound image .
A
Bladder
Uterus
Cervix
B

208 SeCtion iV / Evaluation of Pelvic Complaints
the next 4 to 5 days and increase in size to 2 to 3 cm. If preg-nancy does not occur, the corpus luteum gradually involutes and atrophies (5,9).
PATHOLOGYUterine PathologyLeiomyomas (fibroids)The uterine appearance can be distorted by leiomyomas ( fibroids), which are composed of bundles of smooth muscle. Fibroids are not uncommon; 25% of women older than 30 have at least one. Risk factors include African American race, early menarche, nulliparity, and obesity. Leiomyomas can be subserosal, intramucosal, or submucosal; in the uterus or cervix, within the broad ligament, or outside of the uterus attached by a pedicle (Figs. 14.15–14.17). They may occur singly or as multiples. Although the majority of leiomyomas are asymptomatic, presenting only as incidental findings, fi-broids may cause symptoms of pelvic pain and pressure. It is important to recognize that the ultrasound appearance of uterine fibroids is extremely variable; they may appear as either hyper- or hypoechoic and may vary greatly in size and shape. Fibroids tend to enlarge during pregnancy and regress after menopause (8,16–19).
Endometrial cancerEighty-one percent of postmenopausal women have an en-dometrial thickness of ,8 mm (Fig. 14.18). When a patient presents with postmenopausal bleeding, the clinical sus-picion for endometrial cancer is high; follow-up is always recommended. An endometrial echo complex .5 mm is of particular concern. Patients taking cyclic hormone replace-ment therapy or tamoxifen, used as adjunctive therapy after breast cancer, have more variation in endometrial thickness, but a stripe .5 mm is still considered presumptively abnor-mal (5,15,20–23).
Intrauterine devicesIntrauterine devices (IUDs) inserted to prevent pregnancy are highly echogenic and are therefore easily identified on ultra-sound examination (Fig. 14.19). IUDs are widely used inter-nationally and are not uncommon in domestic EDs (.5% of all contraceptive users) (24). Identification of an IUD is
FIGURE 14.13. Transvaginal Scan of the Right Ovary. The right ovary (2 .5 3 2 .4 cm) is visible just medial to the internal iliac vessels (I) .
two dominant follicles, each month there is usually only one follicle that achieves complete maturation (Fig. 14.14). Non-dominant follicles are usually ,14 mm in diameter. In the 4 to 5 days prior to ovulation (usually day 14 of the menstrual cycle), the dominant follicle grows 2 to 3 mm per day, reach-ing a maximum diameter of 16 to 28 mm. At the time of ovulation, bleeding occurs into the follicle, which decreases in size and may become filled with echogenic debris. The follicle, now called the corpus luteum, may retain fluid over
FIGURE 14.15. Transvaginal Scan—Leiomyoma. A leiomyoma (fibroid) (2 .2 3 1 .7 3 1 .7 cm) seen in the fundus of the uterus .
FIGURE 14.14. A: Transvaginal scan—left ovary . Note the multiple small follicles seen in this normal ovary (LO) . B: Right ovary . Note the large domi-nant follicle on the right ovary of the same patient in (A) . In most patients a single unilateral dominant follicle is seen by midcycle .
LO
A
B

Chapter 14 / Pelvic Ultrasound in the Nongravid Patient 209
Ovarian PathologySimple cystsSimple (functional) cysts include follicular cysts, corpus lu-teum cysts, and theca lutein cysts (which result from high levels of b -hCG in trophoblastic disease or from iatrogenic stimulation with exogenous b -hCG). Simple cysts are most common during the reproductive years and are usually as-ymptomatic. Causes include increases in anterior pituitary gonadotropins, low-dose contraceptives, and exogenous gonadotropin-releasing hormones. Most regress within two months. Functional cysts have thin walls, are unilocular, and range from 3 to 8 cm in diameter (Fig. 14.20) (9,18,25,26). After a follicular cyst (.3 cm) is diagnosed, a 6-week fol-low-up ultrasound is recommended to ensure that the cyst is resolving (6). Emergency physicians should remember that ovarian cysts are very common in women of reproductive age; simply finding a cyst does not establish that the cyst is the cause of the patient’s abdominal or pelvic pain.
Complex cystsDuring the reproductive years, most (up to 85%) ovarian masses are benign. Ovarian tumors are usually asymptom-atic; when present, the symptoms they produce are character-istically abdominal distention, pain, or pressure. A complex ovarian cyst is a cyst with one or more of the following char-acteristics: septations, irregular wall thickening, and shadow-ing echodensity. Septations and/or a cyst wall .2 to 3 mm
especially useful when a female with a history of IUD use does not have a string visible in the cervical os. Ultrasound can be utilized to determine whether the device is actually in place (Fig. 14.19). If clinically indicated, as in the presence of pelvic inflammatory disease (PID), the IUD may be eas-ily removed by simply applying gentle traction to the string.
FIGURE 14.16. Transvaginal Scan—Leiomyoma. Note the fibroid (2 .3 3 2 .2 3 2 cm) projecting into the endometrial cavity .
FIGURE 14.17. Transvaginal Scan—Leiomyoma. There is an intramural fibroid (1 .1 3 0 .8 3 1 .3 cm) seen within the myometrium .
FIGURE 14.18. Transvaginal Scan Thickened Endometrial Stripe. This 1 .6-cm endometrial echo complex is abnormal for this postmenopausal fe-male . When the endometrial echo complex exceeds 5 mm in width, especially when accompanied by vaginal bleeding, the patient should be referred for evaluation for endometrial cancer .
FIGURE 14.19. Transvaginal Scan—IUD. A: Sagittal view . The highly echogenic IUD can be easily seen within the endometrial cavity of this sagittal section of the uterus . B: Coronal view . The highly echogenic IUD can be seen in the center of this coronal section of the uterus .
A
B

210 SeCtion iV / Evaluation of Pelvic Complaints
teeth. The sonographic appearance is usually that of a hyper-echoic solid mass (Fig. 14.22 A, B); hyperechoic lines and dots, and fluid-fluid levels may also be seen. When a dermoid is suspected, further evaluation by computed tomography (CT) or magnetic resonance imaging (MRI) is recommended for confirmation (Fig. 14.22 C, D) (9,18,24,25,29–32).
Chocolate cystsEndometriosis is defined as the presence of endometrial tissue outside of the uterus. Although endometriosis may be found in a wide variety of locations, the ovaries, uterine ligaments, rectovaginal septum, cul-de-sac, and pelvic peritoneum are the most common sites. Most cases are asymptomatic, but the recurrent, cyclic, hormone-dependent changes that occur in endometrial tissue within the uterus also occur in the ec-topic tissue, and are considered to be the cause of symptoms. Endometrial rests on the ovary are often covered with dense adhesions, resulting in fixation to adjacent structures; they are thick and fibrotic, and are often called chocolate cysts because they contain semifluid chocolate-colored material. Such cysts vary widely in size and often have a sonographic appearance of homogenous hypoechoic low-level echoes (Figs. 14.23 and 14.24) (9,25,33,34).
Polycystic ovarian syndromePolycystic Ovarian Syndrome (PCOS) is an endocrine disorder associated with chronic anovulation and is found in a wide spectrum of patients, from lean hyperandrogenic women who menstruate normally to patients with classic Stein-Leventhal syndrome, associated with obesity, hir-sutism, and oligo- or amenorrhea (35). The disease is not
are worrisome and considered by some to be a sign of malig-nancy (Fig. 14.21) (8,18,25–28).
Dermoid cystsMature cystic teratomas (dermoid cysts) are the most com-mon benign germ cell tumors and the most common ovarian neoplasm. More than 80% of dermoid cysts occur during the reproductive years (although they can occur from infancy to old age), and malignant transformation occurs in ,2%. Der-moids are composed of three germ cell layers: ectoderm, me-soderm, and endoderm, and often contain hair, fat, and even
FIGURE 14.20. Transvaginal Scan—Simple Ovarian Cyst. This is a 5 3 6-cm simple cyst (anechoic, unilocular, and without septations) which should be followed by a repeat ultrasound in 6 weeks to assess for resolution .
A
FIGURE 14.21. Complex Ovarian Cyst. A: TAS . This large complex ovar-ian cyst is easily seen on TAS and is suspicious for malignancy because of its size, thick walls, and echogenic solid-appearing components . B: TVS . This is the same patient as in (A); note the improved resolution of the complex features of this cyst with the TVS technique . C: TVS . Another view of the cyst seen in parts A and B .C
B

Chapter 14 / Pelvic Ultrasound in the Nongravid Patient 211
ovary, which usually occur in the periphery but can occur within the parenchyma (Fig. 14.25) (15,25,35,38).
Ovarian hyperstimulation syndromeOvarian Hyperstimulation Syndrome (OHS) occurs in as many as 65% of women undergoing ovulation induction, and is an entirely iatrogenic disease. In mild OHS, patients com-plain of mild abdominal distention, nausea, and vomiting, and ovaries can enlarge to 5 to 12 cm (Fig. 14.26). Moderate disease is characterized by abdominal ascites on ultrasound examination. Severe disease occurs when there are signs of tense ascites, hydrothorax, dyspnea, hemoconcentration due to massive third-spacing of fluids, or any of the complica-tions of OHS, including renal failure, thromboembolism, and acute respiratory distress syndrome. In all but the mild-est cases, inpatient management is recommended, and care includes intravenous hydration, treatment of oliguria, and thromboembolic prophylaxis. Even with mild disease, these patients should only be discharged with very close follow-up as the severity of OHS may change at any time (39–41). OHS is important to the emergency physician as it may be confused with ruptured ectopic pregnancy and ruptured ovar-ian cysts.
uncommon, occurring in up to 27% of reproductive age women (36,37). Polycystic ovaries are generally two to five times normal size and are described as having more than five microcysts (ranging from 0.5 to 0.8 cm in diameter) in each
A B
C D
FIGURE 14.22. Dermoid. A: TAS . Note the characteristic solid-appearing dermoid cyst with hyperechoic lines and dots . B: TVS . Note the improved resolu-tion by TVS . C: MRI . Coronal section of the dermoid as seen by MRI . D: MRI . Transverse section of the dermoid as seen by MRI .
FIGURE 14.23. Transvaginal Scan—Endometrial (Chocolate) Cyst. Note the characteristic homogenous echogenic material within this cyst .

212 SeCtion iV / Evaluation of Pelvic Complaints
ultrasound. Tubo-ovarian abscess (TOA) is diagnosed when a true abscess develops, which is often noted as a tender het-erogeneous mass in the adnexa (Fig. 14.27). Hydrosalpinx is a condition in which the normally very thin fallopian tubes become greatly enlarged (.5 mm) and fluid-filled, present-ing a characteristic appearance that has been likened to that
Tubo-ovarian abscess and hydrosalpinxAscending infection in the genital tract progresses from the cervix (cervicitis), up the fallopian tube (salpingitis), to the peritoneal cavity (PID). There are no distinct ultrasound findings of cervicitis or salpingitis, but at least three com-plications of PID have been described that may be seen on
A B
C
FIGURE 14.24. Endometrial Cyst—Right Ovary. A: Transabdominal scan: A chocolate cyst is seen on the right ovary (RO); a normal ovary is also seen on the left side (LO) . B: Transvaginal scan: The normal appearing left ovary of the patient in part A . Note the improved resolution with TVS . C: Transvaginal scan: Right ovary with endometrioma . Note the homogenous solid-appearing characteristic appearance of this chocolate cyst and the improved resolution with transvaginal scan .
FIGURE 14.25. Transvaginal Scan—Polycystic Ovarian Syndrome. This patient with polycystic ovarian syndrome has 10 small follicles visible on this transvaginal scan .
FIGURE 14.26. Transvaginal Scan—Ovarian Hyperstimulation Syn-drome. Note the enlarged ovary and multiple large cysts visible in this patient with ovarian hyperstimulation syndrome .

Chapter 14 / Pelvic Ultrasound in the Nongravid Patient 213
OHS, and PCOS. Primary ovarian torsion is more common in children (6,8,15,25,47,48).
ARTIFACTS AND PITFALLSBoth TAS and TVS are subject to the usual pitfalls encoun-tered with any sonographic examination, for example, the inability to visualize anatomy with poor skin contact or in the presence of free air. However, several artifacts and pitfalls are specific to the sonographic exam of the pelvis.
of a winding river (Fig. 14.28). Pyosalpinx is said to exist when the tube is thickened and filled with nonsonolucent material (15,25,42–47).
Ovarian torsionOvarian torsion is a difficult diagnosis to make. It is sug-gested when there is acute unilateral pelvic pain, but is quite rare, accounting for only 3% of emergent gynecologic sur-geries. Torsion occurs when the ovary either partially or completely twists on its axis with the fallopian tube. Ovarian torsion usually occurs in the first three decades of life. Ultra-sound is the initial imaging modality and must be done emer-gently as torsion requires surgical repair. The most common ultrasound finding of a torsed ovary is unilateral enlargement and increased volume secondary to edema from venous and lymphatic congestion (Fig. 14.29). Other less common find-ings are engorged blood vessels at the periphery and mul-tiple enlarged follicles from transudation of fluid into the follicles. As the ovary has a dual blood supply, ultrasound is not 100% sensitive even with the addition of Doppler to gray-scale ultrasound imaging. In women of reproduc-tive age, ovarian torsion is usually precipitated by ovarian masses, including both complex and large functional cysts,
FIGURE 14.27. Transvaginal Scan—Tubo-Ovarian Abscess (TOA). Note the breakdown of defined ovarian borders . This mass, in a patient with a his-tory of PID, proved to be a TOA .
FIGURE 14.28. Transvaginal Scan—Hydrosalpinx. Note the dilated fal-lopian tube (not usually visible on ultrasound); it has the characteristic ap-pearance of a meandering river .
FIGURE 14.29. Ovarian Torsion. A: This patient (8-year-old female) has the finding of a unilaterally enlarged right ovary . B: The left ovary is normal contrasted to the right . C: MRI reveals an abnormally enlarged right ovary . Subsequent laparotomy revealed a right ovarian torsion .
RO
A
B
C

214 SeCtion iV / Evaluation of Pelvic Complaints
limited availability of MRI, the diagnosis of OVT can also be made by CT scan. Examples of gynecologic cases that can be nonemergently imaged by MRI are: congenital abnor-malities of the uterus, leiomyomas, endometrial and cervical carcinoma diagnosis and staging, and evaluation of ovarian masses (5,47).
INCIDENTAL FINDINGSUterine AnomaliesCongenital variations of the uterus and vagina are not un-common, generally occurring secondary to failure of fusion of the Mullerian ducts, which normally fuse caudally in the midline with the unfused cranial portions of the ducts giv-ing rise to the fallopian tubes. Failure of fusion, or failure to resorb septae, can result in several variations of uterine anatomy. The mildest version results in an arcuate uterus, a variant of normal characterized by a concave portion of the fundus. Other congenital anomalies include bicornu-ate, septate, didelphic (two complete uteri which can extend down to include the cervix and involve a septated vagina), and unicornuate uteri (Fig. 14.30). In women with septate,
1. Bladder fullness: TAS is best performed with a rela-tively full bladder. This aids in image acquisition as it serves as an acoustic window through which pelvic structures can be visualized. In contrast, when perform-ing TVS, a relatively empty bladder greatly improves visualization of the uterus and adnexa.
2. Bowel: In both TAS and TVS, fluid in the bowel can be mistaken for free fluid in the pelvis.
3. Physiologic free fluid: In many reproductive age women, a small amount of physiologic free fluid is of-ten seen on TVS; a less-experienced sonographer could mistake this as pathologic.
4. Limited field of view: TVS offers a focused view of the uterus and adnexa, but when used without TAS, may miss pelvic masses outside of its limited field of view.
5. Ovaries: Despite their characteristic follicular appear-ance, it is possible to mistake other pelvic structures, such as vessels on end, for ovaries.
6. Endovaginal probe preparation: The sonographer must be careful to put an adequate amount of conductive gel in the tip of the condom prior to placing it on the endovagi-nal probe, and must be sure to get any air bubbles out of the tip, as ultrasound waves are not conducted through air.
USE OF THE IMAGE IN CLINICAL DECISION MAKINGManagement of ovarian cysts relates to the size and charac-teristics of the cyst. In a premenopausal female with a sim-ple cyst (either with or without hemorrhage), a cyst #3 cm is functional and no follow-up is needed. If a simple cyst is $3 cm, it is probably functional, but a follow-up TVS is recommended in 6 weeks, preferably during the first week of a cycle. Postmenopausal cysts #5 cm are usually benign, but follow-up is recommended, and when $5 cm, surgical removal or very close follow-up is recommended there is an increased risk of malignancy. Complex ovarian cysts and solid or predominantly solid-appearing ovarian masses are evaluated further with CT or MRI as certain findings such as dermoids, endometriomas, and fibroids permit conserva-tive follow-up. Persistent or malignant-appearing masses are removed surgically (8,25).
COMPARISON wITH OTHER IMAGING MODALITIESCT has several uses in gynecologic practice, including fur-ther definition of pelvic masses, staging of pelvic cancer, and evaluation of tumor recurrence; it is also useful for guided aspiration and biopsy. In the ED, CT is utilized for better definition of pelvic masses when the ultrasound exam has not clarified the cause of the pelvic symptoms (36,39–40). In such cases the use of oral, intravenous, and even rectal contrast may be very helpful in defining the nature and scope of the mass in question.
MRI provides excellent soft tissue imaging without ar-tifact, but is not indicated emergently for gynecologic con-ditions except possibly in the evaluation of ovarian vein thrombosis (OVT). OVT usually occurs postpartum and occurs in approximately 1 in 600 deliveries. OVT is poten-tially fatal as embolization can occur. Importantly, given the
FIGURE 14.30. Transvaginal Scan—Transverse View, Bicornuate Uterus. Both horns of this bicornuate uterus are labeled .
F
C
B
FIGURE 14.31. Transabdominal Scan—Transverse View, Hydrometro-colpus. The bladder (B ) is seen above the dilated vagina which is seen with a large clot (C) above which an anechoic fluid stripe (F) is seen . This represents blood and clot in the vagina of a patient with an imperforate hymen .
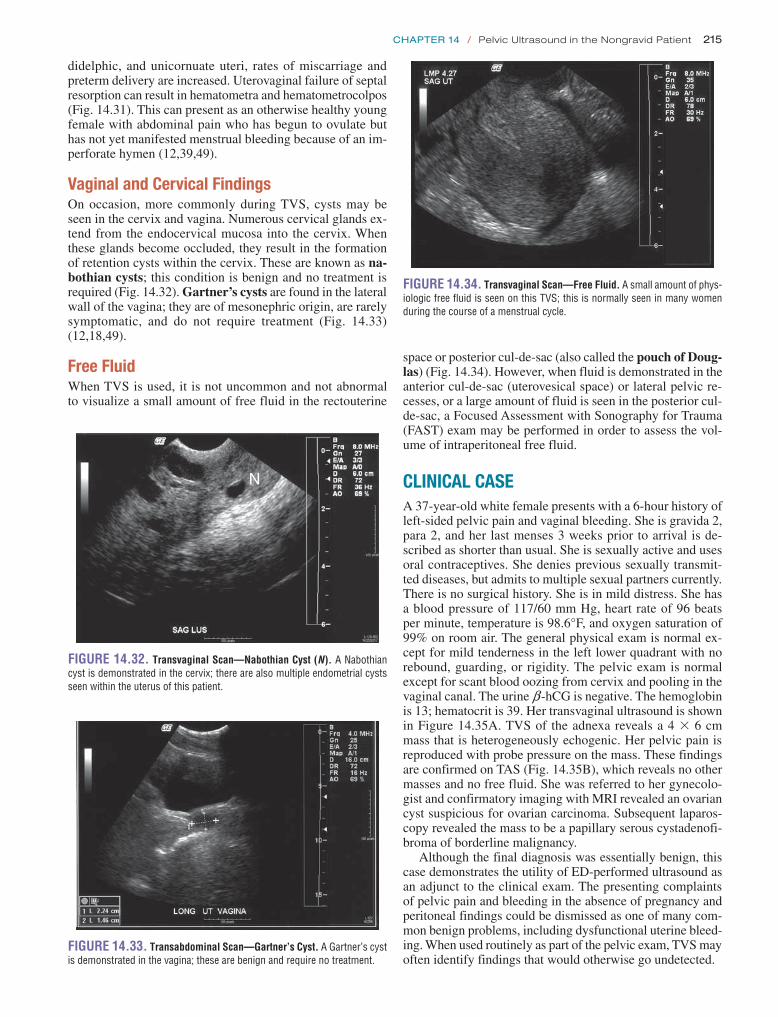
Chapter 14 / Pelvic Ultrasound in the Nongravid Patient 215
space or posterior cul-de-sac (also called the pouch of Doug-las) (Fig. 14.34). However, when fluid is demonstrated in the anterior cul-de-sac (uterovesical space) or lateral pelvic re-cesses, or a large amount of fluid is seen in the posterior cul-de-sac, a Focused Assessment with Sonography for Trauma (FAST) exam may be performed in order to assess the vol-ume of intraperitoneal free fluid.
CLINICAL CASEA 37-year-old white female presents with a 6-hour history of left-sided pelvic pain and vaginal bleeding. She is gravida 2, para 2, and her last menses 3 weeks prior to arrival is de-scribed as shorter than usual. She is sexually active and uses oral contraceptives. She denies previous sexually transmit-ted diseases, but admits to multiple sexual partners currently. There is no surgical history. She is in mild distress. She has a blood pressure of 117/60 mm Hg, heart rate of 96 beats per minute, temperature is 98.6°F, and oxygen saturation of 99% on room air. The general physical exam is normal ex-cept for mild tenderness in the left lower quadrant with no rebound, guarding, or rigidity. The pelvic exam is normal except for scant blood oozing from cervix and pooling in the vaginal canal. The urine b -hCG is negative. The hemoglobin is 13; hematocrit is 39. Her transvaginal ultrasound is shown in Figure 14.35A. TVS of the adnexa reveals a 4 3 6 cm mass that is heterogeneously echogenic. Her pelvic pain is reproduced with probe pressure on the mass. These findings are confirmed on TAS (Fig. 14.35B), which reveals no other masses and no free fluid. She was referred to her gynecolo-gist and confirmatory imaging with MRI revealed an ovarian cyst suspicious for ovarian carcinoma. Subsequent laparos-copy revealed the mass to be a papillary serous cystadenofi-broma of borderline malignancy.
Although the final diagnosis was essentially benign, this case demonstrates the utility of ED-performed ultrasound as an adjunct to the clinical exam. The presenting complaints of pelvic pain and bleeding in the absence of pregnancy and peritoneal findings could be dismissed as one of many com-mon benign problems, including dysfunctional uterine bleed-ing. When used routinely as part of the pelvic exam, TVS may often identify findings that would otherwise go undetected.
didelphic, and unicornuate uteri, rates of miscarriage and preterm delivery are increased. Uterovaginal failure of septal resorption can result in hematometra and hematometrocolpos (Fig. 14.31). This can present as an otherwise healthy young female with abdominal pain who has begun to ovulate but has not yet manifested menstrual bleeding because of an im-perforate hymen (12,39,49).
Vaginal and Cervical FindingsOn occasion, more commonly during TVS, cysts may be seen in the cervix and vagina. Numerous cervical glands ex-tend from the endocervical mucosa into the cervix. When these glands become occluded, they result in the formation of retention cysts within the cervix. These are known as na-bothian cysts; this condition is benign and no treatment is required (Fig. 14.32). Gartner’s cysts are found in the lateral wall of the vagina; they are of mesonephric origin, are rarely symptomatic, and do not require treatment (Fig. 14.33) (12,18,49).
Free FluidWhen TVS is used, it is not uncommon and not abnormal to visualize a small amount of free fluid in the rectouterine
N
FIGURE 14.32. Transvaginal Scan—Nabothian Cyst (N). A Nabothian cyst is demonstrated in the cervix; there are also multiple endometrial cysts seen within the uterus of this patient .
FIGURE 14.33. Transabdominal Scan—Gartner’s Cyst. A Gartner’s cyst is demonstrated in the vagina; these are benign and require no treatment .
FIGURE 14.34. Transvaginal Scan—Free Fluid. A small amount of phys-iologic free fluid is seen on this TVS; this is normally seen in many women during the course of a menstrual cycle .

216 SeCtion iV / Evaluation of Pelvic Complaints
10. Williams PL, Warwick R, eds. Gray’s Anatomy. 36th British ed. Philadelphia, PA: WB Saunders; 1980:1423–1433.
11. Palter SF, Olive DL. Reproductive physiology. In: Berek JS, ed. Novak’s Gynecology. 13th ed. Philadelphia, PA: Lippincott Williams & Wilkins; 2002:149–171.
12. Richenberg J, Cooperberg P. Ultrasound of the uterus. In: Callen PW, ed. Ultrasonography in Obstetrics and Gynecology. 4th ed. Philadelphia, PA: WB Saunders; 2000:814–846.
13. Bakos O, Lundkvist O, Wide L, et al. Ultrasonographical and hormonal description of the normal ovulatory menstrual cycle. Acta Obstet Gyne-col Scand. 1994;73(10):790–796.
14. Griffin Y, Sudigali V, Jacques A. Radiology of benign disorders of men-struation. Semin Ultrasound CT MR. 2010;31(5):414–432.
15. Goldstein RB, Bree RL, Benson CB, et al. Evaluation of the woman with postmenopausal bleeding: Society of Radiologists in Ultrasound-Sponsored Consensus Conference Statement. J Ultrasound Med. 2001;20(10):1025–1036.
16. Robboy SJ, Duggan MA, Kurman RJ. Gynecologic pathology. In: Rubin E, Farber JL, eds. Pathology. Philadelphia, PA: JB Lippincott Co; 1988:942–989.
17. Flake GP, Anderson J, Dixon D. Etiology and pathogenesis of uter-ine leiomyomas: a review. Environ Health Perspect. 2003;111(8): 1037–1054.
18. Hillard Adams PJ. Benign diseases of the female reproductive tract: symptoms and signs. In: Berek JS, ed. Novak’s Gynecology. 13th ed. Philadelphia, PA: Lippincott Williams & Wilkins; 2002:351–420.
19. Lethaby A, Vollenhoven B. Fibroids (uterine myomatosis, leiomyomas). Clin Evid (Online). 2011;2011. pii: 0814.
20. Lin MC, Gosink BB, Wolf SI, et al. Endometrial thickness after menopause: effect of hormone replacement. Radiology. 1991;180(2): 427–432.
21. Karlsson B, Granberg S, Wikland M, et al. Transvaginal ultrasonography of the endometrium in women with postmenopausal bleeding—a Nordic multicenter study. Am J Obstet Gynecol. 1995;172(5):1488–1494.
22. Smith-Bindman R, Kerlikowske K, Feldstein VA, et al. Endovaginal ultrasound to exclude endometrial cancer and other endometrial abnor-malities. JAMA. 1998;280(17):1510–1517.
23. Merz E, Miric-Tesanic D, Bahlmann F, et al. Sonographic size of uterus and ovaries in pre- and postmenopausal women. Ultrasound Obstet Gynecol. 1996;7(1):38–42.
24. Mosher WD, Jones J. Use of contraception in the United States: 1982–2008. Vital Health Stat. 2010;23(29):1–44.
25. Dill-Macky MJ, Atri M. Ovarian sonography. In: Callen PW, ed. Ultrasonography in Obstetrics and Gynecology. 4th ed. Philadelphia, PA: WB Saunders; 2000:857–896.
26. Clement PB. Nonneoplastic lesions of the ovary. In: Kurman RJ, ed. Blaustein’s Pathology of the Female Genital Tract. 4th ed. New York, NY: Springer-Verlag; 1994:597–645.
27. Atri M, Nazarnia S, Bret PM, et al. Endovaginal sonographic appearance of benign ovarian masses. Radiographics. 1994;14(4):747–760.
28. Pérez-López FR, Chedraui P, Troyano-Luque JM. Peri- and post-meno-pausal incidental adnexal masses and the risk of sporadic ovarian ma-lignancy: new insights and clinical management. Gynecol Endocrinol. 2010;26(9):631–643.
29. Valentin L. Imaging in gynecology. Best Pract Res Clin Obstet Gynae-col. 2006;20(6):881–906.
30. Sheth S, Fishman EK, Buck JL, et al. The variable sonographic appear-ances of ovarian teratomas: correlation with CT. AJR Am J Roentgenol. 1988;151(2):331–334.
31. Patel MD, Feldstein VA, Lipson SD, et al. Cystic teratomas of the ovary: diagnostic value of sonography. AJR Am J Roentgenol. 1998;171(4):1061–1065.
32. Talerman A. Germ cell tumors of the ovary. In: Kurman RJ, ed. Blaus-tein’s Pathology of the Female Genital Tract. 4th ed. New York, NY: Springer-Verlag; 1994:849–914.
33. Kupfer MC, Schwimer SR, Lebovic J. Transvaginal sonographic ap-pearance of endometriomata: spectrum of findings. J Ultrasound Med. 1992;11(4):129–133.
34. Clement PB. Diseases of the peritoneum. In: Kurman RJ, ed. Blaustein’s Pathology of the Female Genital Tract. 4th ed. New York, NY: Springer-Verlag; 1994:647–703.
ACKNOwLEDGMENTSThe authors would like to acknowledge the work of Mary Whitsett, RT, AS, RVT, RDMS and Kerri Lyn Wheeler, RT, BS, RDMS, whose assistance in image acquisition was invaluable.
REFERENCES 1. Heller M, Jehle D, eds. Ultrasound in Emergency Medicine. 2nd ed.
Philadelphia, PA: WB Saunders; 2002. 2. Cicchiello LA, Hamper UM, Scoutt LM. Ultrasound evaluation of
gynecologic causes of pelvic pain. Obstet Gynecol Clin North Am. 2011;38(1):85–114, viii.
3. Kruszka PS, Kruszka SJ. Evaluation of acute pelvic pain in women. Am Fam Physician. 2010;82(2):141–147.
4. Testa AC, Bourne TH. Characterising pelvic masses using ultrasound. Best Pract Res Clin Obstet Gynaecol. 2009;23(5):725–738.
5. Levi CS, Holt SC, Lyons EA, et al. Normal anatomy of the female pel-vis. In: Callen PW, ed. Ultrasonography in Obstetrics and Gynecology. 4th ed. Philadelphia, PA: WB Saunders; 2000:781–813.
6. Bau A, Atri M. Acute female pelvic pain: ultrasound evaluation. Semin Ultrasound CT MR. 2000;21(1):78–93.
7. Sivyer P. Pelvic ultrasound in women. World J Surg. 2000;24(2):188–197. 8. Laing FC, Brown DL, DiSalvo DN. Gynecologic ultrasound. Radiol
Clin North Am. 2001;39(3):523–540. 9. Salem S. The uterus and adnexa. In: Rumack CM, Wilson SR,
Charboneau JW, eds. Diagnostic Ultrasound. 2nd ed. St. Louis, MO: Mosby; 1998:521–573.
FIGURE 14.35. Complex Cyst. A: Transvaginal scan . Note the frond-like projections in this 10 3 7-cm complex cyst; this is suspicious for malig-nancy . B: Transabdominal scan . Appearance of the cyst by a transabdominal approach .
A
B

Chapter 14 / Pelvic Ultrasound in the Nongravid Patient 217
42. Timor-Tritsch IE, Lerner JP, Monteagudo A, et al. Transvaginal sonographic markers of tubal inflammatory disease. Ultrasound Obstet Gynecol. 1998;12(1):56–66.
43. Lee DC, Swaminathan AK. Sensitivity of ultrasound for the diagnosis of tubo-ovarian abscess: a case report and literature review. J Emerg Med. 2011;40(2):170–175.
44. Khan A, Muradali D. Imaging acute obstetric and gynecologic abnor-malities. Semin Roentgenol. 2001;36(2):165–172.
45. Ignacio EA, Hill MC. Ultrasound of the acute female pelvis. Ultrasound Q. 2003;19(2):86–98.
46. Kaakaji Y, Nghiem HV, Nodell C, et al. Sonography of obstetric and gynecologic emergencies: Part II, Gynecologic emergencies. AJR Am J Roentgenol. 2000;174(3):651–656.
47. Harrison BP, Crystal CS. Imaging modalities in obstetrics and gynecol-ogy. Emerg Med Clin North Am. 2003;21(3):711–735.
48. Huchon C, Fauconnier A. Adnexal torsion: a literature review. Eur J Obstet Gynecol Reprod Biol. 2010;150(1):8–12.
49. Droegemueller W. Benign gynecologic lesions. In: Mishell DR Jr, Stenchever MA, Droegemueller W, et al., eds. Comprehensive Gynecology. 3rd ed. St. Louis, MO: Mosby; 1997:467–516.
35. Hershlag A, Peterson CM. Endocrine disorders. In: Berek JS, ed. Novak’s Gynecology. 13th ed. Philadelphia, PA: Lippincott Williams & Wilkins; 2002:871–930.
36. Botsis D, Kassanos D, Pyrgiotis E, et al. Sonographic incidence of poly-cystic ovaries in a gynecological population. Ultrasound Obstet Gyne-col. 1995;6(3):182–185.
37. Carmina E, Oberfield SE, Lobo RA. The diagnosis of polycystic ovary syndrome in adolescents. Am J Obstet Gynecol. 2010;203(3): 201.e1–201.e5.
38. Nardo LG, Buckett WM, Orio F Jr. Ultrasonography in polycystic ovary syndrome: an update. J Reprod Med. 2007;52(5):390–396.
39. Yao MW, Schust DJ. Infertility. In: Berek JS, ed. Novak’s Gyne-cology. 13th ed. Philadelphia, PA: Lippincott Williams & Wilkins; 2002:973–1066.
40. Wiseman DA, Greene CA, Pierson RA. Infertility. In: Rumack CM, Wilson SR, Charboneau JW, eds. Diagnostic Ultrasound. 2nd ed. St. Louis, MO: Mosby; 1998:1407–1439.
41. Battaglia C, Mancini F, Persico N, et al. Ultrasound evaluation of PCO, PCOS and OHSS. Reprod Biomed Online. 2004;9(6); 614–619.

218
1. Detecting abnormal pregnancies, including ectopic pregnancy and nonviable pregnancy
2. Detecting hemoperitoneum in patients with suspected ectopic pregnancy
3. Determining gestational age 4. Detecting fetal heart rate to determine viability
Ectopic pregnancy, a common and potentially fatal condition, should be considered in all symptomatic first trimester patients who present to the ED. History and physical examination are often insufficient to reliably establish the definitive diagnosis of normal (or abnormal) pregnancy (2). Ultrasound is widely used as the most efficient and accurate means to detect and evaluate early gestations. Emergency physicians who are trained to perform and interpret bedside pelvic ultrasound should first answer the focused question: “Is there an IUP?” Ectopic pregnancy can be safely excluded in patients in whom an IUP is visualized, with the notable exception of patients who have received fertility treatments, who are at increased risk for multiple gestations and heterotopic pregnancy (3,4).
INTRODUCTIONSonography of first trimester pregnancy is a core bedside ul-trasound application, and an essential component of the evalu-ation of patients who present with vaginal bleeding, abdominal pain, syncope or shock in early pregnancy (1). In most cases, bedside ultrasound allows emergency physicians to rapidly and accurately determine whether an intrauterine pregnancy (IUP) is present. Along with other clinical data, ultrasound findings allow emergency physicians to arrive at an accurate diagnosis and appropriate disposition, thus providing efficient care that benefits both patients and emergency department (ED) flow.
CLINICAL APPLICATIONSThe role of emergency physicians is to rule out life threats, and as such, the primary role of bedside pelvic ultrasound in the ED is to exclude ectopic pregnancy (1). Secondary aims include the following:
USE OF THE IMAGE IN CLINICAL DECISION MAKING . . . . . . . . . . . . . . . . . . . . . . . . . . . . . 230The General Approach . . . . . . . . . . . . . . . . . . . . . . . . . 230The Pregnant Patient with Hemodynamic
Instability . . . . . . . . . . . . . . . . . . . . . . . . . . . . . . . . 230IUP Detected . . . . . . . . . . . . . . . . . . . . . . . . . . . . . . . . 231Ectopic Pregnancy Detected . . . . . . . . . . . . . . . . . . . . 231No Definite IUP or Ectopic Pregnancy Detected:
The Indeterminate Scan . . . . . . . . . . . . . . . . . . . . . 232Use of Quantitative b-hCG . . . . . . . . . . . . . . . . . . . . . . 232Evolving Trends: Nomenclature and Standards . . . . . . 233The Utility of Emergency Ultrasound . . . . . . . . . . . . . . 233
COMPARISON WITH OTHER IMAGING MODALITIES . . . . . . . . . . . . . . . . . . . . . . . . . . . . . . . . . . 233
INCIDENTAL FINDINGS . . . . . . . . . . . . . . . . . . . . . . . . . . . . 234Ovarian Cysts . . . . . . . . . . . . . . . . . . . . . . . . . . . . . . . 234Corpus Luteum . . . . . . . . . . . . . . . . . . . . . . . . . . . . . . 234Multiple Gestations . . . . . . . . . . . . . . . . . . . . . . . . . . . 234Adnexal Masses . . . . . . . . . . . . . . . . . . . . . . . . . . . . . 234
CLINICAL CASE . . . . . . . . . . . . . . . . . . . . . . . . . . . . . . . . . . 234
INTRODUCTION . . . . . . . . . . . . . . . . . . . . . . . . . . . . . . . . . . 218CLINICAL APPLICATIONS . . . . . . . . . . . . . . . . . . . . . . . . . . . 218IMAGE ACQUISITION . . . . . . . . . . . . . . . . . . . . . . . . . . . . . . 219NORMAL ULTRASOUND ANATOMY . . . . . . . . . . . . . . . . . . . 219
Findings Suggestive of an Early IUP: The Gestational Sac . . . . . . . . . . . . . . . . . . . . . . . . 219
Definitive Findings of IUP . . . . . . . . . . . . . . . . . . . . . . 220Determining Fetal Viability: Fetal Heart Activity . . . . . . 220Determining Gestational Age . . . . . . . . . . . . . . . . . . . . 221
PATHOLOGY . . . . . . . . . . . . . . . . . . . . . . . . . . . . . . . . . . . . . 223Ectopic Pregnancy . . . . . . . . . . . . . . . . . . . . . . . . . . . . 223Fluid in the Cul-de-sac . . . . . . . . . . . . . . . . . . . . . . . . . 226Abnormal or Nonviable IUP . . . . . . . . . . . . . . . . . . . . . 227Molar Pregnancy . . . . . . . . . . . . . . . . . . . . . . . . . . . . . 227Echogenic Material within the Uterus . . . . . . . . . . . . . 227Subchorionic Hemorrhage . . . . . . . . . . . . . . . . . . . . . 229
ARTIFACTS AND PITFALLS . . . . . . . . . . . . . . . . . . . . . . . . . 229Artifacts . . . . . . . . . . . . . . . . . . . . . . . . . . . . . . . . . . . . 229Pitfalls of Image Acquisition . . . . . . . . . . . . . . . . . . . . 229Pitfalls of Image Interpretation . . . . . . . . . . . . . . . . . . 230
Ralph C. Wang and R. Starr Knight
First Trimester Pregnancy15
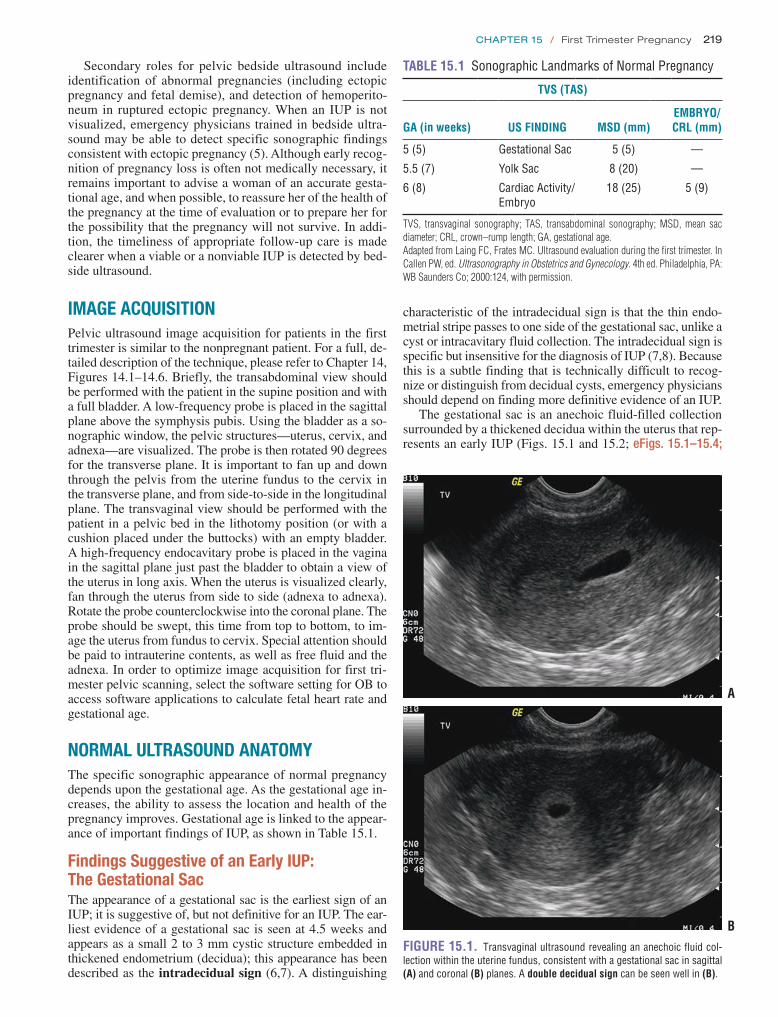
Chapter 15 / First Trimester Pregnancy 219
Secondary roles for pelvic bedside ultrasound include identification of abnormal pregnancies (including ectopic pregnancy and fetal demise), and detection of hemoperito-neum in ruptured ectopic pregnancy. When an IUP is not visualized, emergency physicians trained in bedside ultra-sound may be able to detect specific sonographic findings consistent with ectopic pregnancy (5). Although early recog-nition of pregnancy loss is often not medically necessary, it remains important to advise a woman of an accurate gesta-tional age, and when possible, to reassure her of the health of the pregnancy at the time of evaluation or to prepare her for the possibility that the pregnancy will not survive. In addi-tion, the timeliness of appropriate follow-up care is made clearer when a viable or a nonviable IUP is detected by bed-side ultrasound.
IMAGE ACQUISITIONPelvic ultrasound image acquisition for patients in the first trimester is similar to the nonpregnant patient. For a full, de-tailed description of the technique, please refer to Chapter 14, Figures 14.1–14.6. Briefly, the transabdominal view should be performed with the patient in the supine position and with a full bladder. A low-frequency probe is placed in the sagittal plane above the symphysis pubis. Using the bladder as a so-nographic window, the pelvic structures—uterus, cervix, and adnexa—are visualized. The probe is then rotated 90 degrees for the transverse plane. It is important to fan up and down through the pelvis from the uterine fundus to the cervix in the transverse plane, and from side-to-side in the longitudinal plane. The transvaginal view should be performed with the patient in a pelvic bed in the lithotomy position (or with a cushion placed under the buttocks) with an empty bladder. A high-frequency endocavitary probe is placed in the vagina in the sagittal plane just past the bladder to obtain a view of the uterus in long axis. When the uterus is visualized clearly, fan through the uterus from side to side (adnexa to adnexa). Rotate the probe counterclockwise into the coronal plane. The probe should be swept, this time from top to bottom, to im-age the uterus from fundus to cervix. Special attention should be paid to intrauterine contents, as well as free fluid and the adnexa. In order to optimize image acquisition for first tri-mester pelvic scanning, select the software setting for OB to access software applications to calculate fetal heart rate and gestational age.
NORMAL ULTRASOUND ANATOMYThe specific sonographic appearance of normal pregnancy depends upon the gestational age. As the gestational age in-creases, the ability to assess the location and health of the pregnancy improves. Gestational age is linked to the appear-ance of important findings of IUP, as shown in Table 15.1.
Findings Suggestive of an Early IUP: The Gestational SacThe appearance of a gestational sac is the earliest sign of an IUP; it is suggestive of, but not definitive for an IUP. The ear-liest evidence of a gestational sac is seen at 4.5 weeks and appears as a small 2 to 3 mm cystic structure embedded in thickened endometrium (decidua); this appearance has been described as the intradecidual sign (6,7). A distinguishing
A
BFIGURE 15.1. Transvaginal ultrasound revealing an anechoic fluid col-lection within the uterine fundus, consistent with a gestational sac in sagittal (A) and coronal (B) planes . A double decidual sign can be seen well in (B) .
characteristic of the intradecidual sign is that the thin endo-metrial stripe passes to one side of the gestational sac, unlike a cyst or intracavitary fluid collection. The intradecidual sign is specific but insensitive for the diagnosis of IUP (7,8). Because this is a subtle finding that is technically difficult to recog-nize or distinguish from decidual cysts, emergency physicians should depend on finding more definitive evidence of an IUP.
The gestational sac is an anechoic fluid-filled collection surrounded by a thickened decidua within the uterus that rep-resents an early IUP (Figs. 15.1 and 15.2; eFigs. 15.1–15.4;
TABLE 15.1 Sonographic Landmarks of Normal Pregnancy
TVS (TAS)
GA (in weeks) US FINDING MSD (mm)EMBRYO/CRL (mm)
5 (5) Gestational Sac 5 (5) —
5 .5 (7) Yolk Sac 8 (20) —
6 (8) Cardiac Activity/Embryo
18 (25) 5 (9)
TVS, transvaginal sonography; TAS, transabdominal sonography; MSD, mean sac diameter; CRL, crown–rump length; GA, gestational age.Adapted from Laing FC, Frates MC. Ultrasound evaluation during the first trimester. In Callen PW, ed. Ultrasonography in Obstetrics and Gynecology. 4th ed. Philadelphia, PA: WB Saunders Co; 2000:124, with permission.

220 SeCtion iV / Evaluation of Pelvic Complaints
Although emergency physicians are cautioned not to rely on the presence of an intradecidual sign, a double decidual sign, or gestational sac to establish a definitive diagnosis of IUP, it is also important to recognize that the absence of these findings does not exclude the possibility of an IUP (12).
Definitive Findings of IUPYolk sacThe visualization of a yolk sac is the first definitive sign of an IUP (15). The yolk sac has the appearance of a brightly echogenic ring within the gestational sac (Fig. 15.4; eFigs. 15.6–15.8; VIDEOS 15.4 and 15.5) (16). Using cur-rent transvaginal ultrasound technology, the yolk sac can be seen at a gestational age of approximately 5 weeks (3). The yolk sac may be small (3 mm) and challenging to demon-strate (Fig. 15.5; VIDEO 15.6). The upper size limit of a normal yolk sac is 5 to 6 mm in diameter. In a normal IUP, it is generally accepted that the yolk sac should be observed when a gestational sac measures >8 mm by the transvaginal approach and >20 mm by transabdominal approach (16).
Fetal poleThe fetal pole is also a reliable sign of IUP. A fetal pole should be visualized by the time the gestational sac reaches 18 mm by transvaginal approach and 25 mm by the transabdominal ap-proach (Figs. 15.6–15.8; eFigs. 15.9 and 15.10; VIDEO 15.5). After the fetal pole has reached 5 mm, a cardiac flicker can be visualized by transvaginal ultrasound and fetal heart rate measured using M-mode ( VIDEOS 15.7–15.9) (17).
Determining Fetal Viability: Fetal Heart ActivityM-mode (motion mode) sonography is useful in measuring fetal heart rate in the first trimester. M-mode detects the mo-tion of reflectors in an ultrasound image with respect to a cur-sor displayed over time. Fetal heart rate can be documented in M-mode using the built-in fetal heart rate calculators of most current equipment (Figs. 15.9 and 15.10; eFig. 15.11). Several radiology studies have demonstrated the predictive value of fetal heart activity on pregnancy outcome. From 5 to 9 weeks of gestation, the mean heart rate ranges from 110 to 175 beats per minutes. Fetal heart rate increases with increas-ing size, and abnormally low fetal heart rates are associated
VIDEOS 15.1 and 15.2). Unfortunately, what appears to be a gestational sac may in fact be a pseudogestational sac, an intrauterine fluid collection visualized in association with ectopic pregnancy due to hormonal stimulation of the endo-metrium (Fig. 15.3) (9). Differentiating between a true ges-tational sac and a pseudogestational sac requires care and experience, and the presence of an intrauterine fluid collec-tion alone should not be considered definitive evidence of IUP (10). Studies in the radiology literature have suggested that the presence of a double decidual sign may aid in the differentiation of gestational sac from pseudogestational sac (11). The double decidual sign is created by the separation of the decidua vera from the decidual capsularis, creating a double echogenic ring around early IUPs (Fig. 15.1B; eFig. 15.5; VIDEOS 15.3 and 15.4). Although this is con-sidered a useful sign, it is present in the minority of IUPs (12). Gestational sacs are characterized by several sono-graphic criteria, including size, shape, location within the uterus, and appearance of the border (13,14). Normal gesta-tional sacs are smooth, well defined, rounded or oval, have an echogenic border of decidua that is 2 mm or greater, and are situated in the upper uterine body. Sacs that are low lying (near the cervix), irregularly shaped, or surrounded by thin decidua are suspicious for abnormal pregnancies.
FIGURE 15.2. Transvaginal Scan of an Empty Gestational Sac.
FIGURE 15.3. Transvaginal Ultrasound in a Sagittal Plane. An in-trauterine sac in a patient with a proven ectopic pregnancy is shown . This intrauterine fluid collection has decidualized endometrium and represents a pseudogestational sac .
FIGURE 15.4. Transvaginal Ultrasound of an IUP in a Sagittal Plane Showing a Yolk Sac.

Chapter 15 / First Trimester Pregnancy 221
A
BFIGURE 15.5. Transvaginal Ultrasound of an IUP in a Coronal Plane. The yolk sac can be difficult to visualize (A) . In the same patient the yolk sac can be better visualized with the zoom feature (B) .
FIGURE 15.6. Early Fetal Pole, Transvaginal Scan.
FIGURE 15.7. First Trimester Fetus, 8 Weeks 2 Days Gestation as Measured by Crown-Rump Length (CRL).
with embryonic demise (18). Several studies have shown a high rate of miscarriage in first trimester patients with fetal heart rates <85 beats per minute (19).
Determining Gestational AgeThe gestational age in early pregnancy can be accu-rately determined based on sonographic measurements at different stages of pregnancy. Standard measurements of gestational age are referenced from the onset of the last normal menstrual period, but may be inaccurate.
FIGURE 15.8. Early IUP with Yolk Sac and Fetal Pole (9 Weeks 3 Days).
FIGURE 15.9. M-Mode Demonstrates Fetal Cardiac Activity Measured at 176 Beats per Minute.
Underserved populations with poor access to obstetric care may also require ED determination of gestational age. Recent studies have shown that emergency physicians can accurately estimate gestational age using bedside pelvic ultrasound (20,21).

222 SeCtion iV / Evaluation of Pelvic Complaints
Gestational age may be determined using functions in currently available ultrasound machines. The following measurements can be obtained to provide estimates of ges-tational age.
1. Mean Sac Diameter (MSD), or Gestational Sac Size (GSS). In early pregnancy the gestational age can be determined from the diameter of the gestational sac (Fig. 15.11; eFig. 15.12). The earliest that the gestational sac can be visualized by transvaginal ultrasound is at a diameter of 2 to 3 mm, which correlates with a gesta-tional age between 4 and 5 weeks.
2. Crown–Rump Length (CRL). When an embryo is pres-ent, the CRL can be measured with calipers defining the length of embryo (excluding the legs and yolk sac) (Figs. 15.7 and 15.12; eFigs. 15.13 and 15.14).
3. Once the fetus has reached 13 weeks gestational age, other methods of determining gestational age are used, such as head circumference (HC), biparietal diameter (BPD), abdominal circumference (AC) and femur length (FL) (Figs. 15.13 and 15.14; eFig. 15.15).
FIGURE 15.10. Live IUP with Fetal Cardiac Activity Demonstrated by M-Mode.
FIGURE 15.11. Gestational Age Calculated by Gestational Sac Size (5 Weeks 1 Day).
FIGURE 15.12. Fetus with Gestational Age 10 Weeks 2 Days by Crown–Rump Length.
++1
1 CRL 3.38 cm 10w2d
FIGURE 15.13. Gestational Age Measured at 14 Weeks by Biparietal Diameter (BPD).
FIGURE 15.14. Gestational Age Measured at 26 Weeks by Biparietal Diameter (BPD).

Chapter 15 / First Trimester Pregnancy 223
PATHOLOGYThe term abnormal pregnancy refers to a number of enti-ties, including ectopic pregnancy, nonviable pregnancy/ embryonic demise and molar pregnancies. These pathologic entities maybe identified on the initial evaluation by ultra-sound during the initial ED visit or on subsequent visits. Because the management of IUP, ectopic pregnancy, and em-bryonic demise differ significantly, it is important to differen-tiate them accurately and expeditiously. Abnormal pregnancy should be suspected when an IUP is not initially visualized on bedside ultrasound or when the normal appearance of the gestational sac, yolk sac, or the fetal heart rate is absent. Definitive diagnosis of IUP or abnormal pregnancy can be made on the initial visit with ultrasound, b-hCG levels, and surgical evaluation, or on subsequent visits. However, the emphasis of bedside ultrasound should be to identify IUP rather than abnormal pregnancy.
Ectopic PregnancyThe simplest, albeit nonspecific, finding in ectopic pregnancy is failure to visualize an IUP in a patient who is known to be pregnant (positive pregnancy test). Specific sonographic findings for ectopic pregnancies depend upon location, ges-tational age, and whether they have ruptured. There are sev-eral types of ultrasound findings for ectopic pregnancy that provide varying degrees of certainty. Ultrasound is diagnos-tic for ectopic pregnancy when an extrauterine gestational sac is visualized containing a fetus or yolk sac, although this is a relatively uncommon finding (Figs. 15.15–15.17;
FIGURE 15.16. Ectopic Pregnancy . A transvaginal scan through the midline of the uterus fails to find an IUP in this patient with a b-hCG of 2,477 . Sagittal orientation (A); Coronal orientation (B). On closer inspection an ectopic pregnancy is seen in the adnexa (C, D).
FIGURE 15.15. A: Transvaginal sagittal view of an empty uterus with a tubal ring seen in the right adnexa . Free fluid is present . B: Color flow demonstrates a ring of fire surrounding the right adnexal mass, indicating hypervascularity around the gestational sac .
A
B
A
B
C
D

224 SeCtion iV / Evaluation of Pelvic Complaints
eFigs. 15.16 and 15.17; VIDEOS 15.10–15.13). In some cases, the extrauterine gestational sac appears as a tubal ring, a thick-walled echogenic mass surrounding a cystic fluid col-lection. The tubal ring is highly suspicious for ectopic preg-nancy; when seen, the risk of ectopic pregnancy is reported to exceed 95%, although it occurs in only 20% of ectopic pregnancies diagnosed by ultrasound (Figs. 15.15 and 15.18; eFigs. 15.18 and 15.19) (22). A complex adnexal mass sepa-rate from the ovary is highly suggestive of ectopic pregnancy, and is seen in 60% of ectopic pregnancies (Figs. 15.19–15.22; eFig. 15.20; VIDEOS 15.14–15.16). While any adnexal mass other than a simple cyst is less specific than a visual-ized extrauterine gestational sac or tubal ring, it is the most sensitive for ectopic pregnancy (22). In a study of bedside ultrasound to detect ectopic, emergency sonologists detected the tubal ring and complex adnexal mass in proportions simi-lar to those identified by radiologists (5).
There are several indirect findings suggestive of ectopic pregnancy when the extrauterine gestation is not visualized, such as free fluid in the cul-de-sac, or empty uterus. Patients with an empty uterus are five times more likely to have an ectopic pregnancy compared with those with a fluid collec-tion or debris in the uterus (Fig. 15.23; VIDEOS 15.17 and 15.18) (13). Free fluid, especially large or complex fluid (echogenic, layering, or clotted blood), is strongly associated with ectopic pregnancy.
FIGURE 15.18. Transabdominal Sagittal View of an Empty Uterus with Visible Empty Gestational Sac or Tubal Ring Seen Underneath the Uterus. Free fluid can be seen surrounding the uterus .
Cornual, interstitial, cervical ectopicsThe vast majority of ectopic pregnancies are located in the fallopian tubes, but ectopic pregnancies have been identified in interstitial, cervical, ovarian, abdominal, and cesarean scar locations (3,23,24). Pregnancies that are placed eccentrically
FIGURE 15.17. Unusual Presentation of a Twin Ectopic Pregnancy of Advanced Gestation. A transvaginal scan fails to demonstrate an IUP in either sagittal (A) or coronal (B) views . A scan of the right adnexa reveals a well-formed fetus (C) . On closer inspection, a twin ectopic is seen (D) .
BA
DC

Chapter 15 / First Trimester Pregnancy 225
FIGURE 15.19. Transvaginal Coronal View of Right Adnexal Mass.
FIGURE 15.20. A Complex Adnexal Mass (Arrow ) is Seen on this Transvaginal Coronal View. The ovary is highlighted by the asterisk . Free fluid can also be seen .
1
OV
1
22
FIGURE 15.21. Complex Adnexal Mass (Arrow) Seen On Transvaginal Coronal Ultrasound. The right ovary is also visualized (Ov) .
in relation to the normal uterine site of implantation may be misinterpreted as an IUP. Pregnancies may implant in any portion of the periphery of the uterus (cornual, intersti-tial, and cervical) and be easily misdiagnosed as a normal IUP. It is important that the sonographer detects myome-trium surrounding the entire gestational sac and it be at least 5 mm thick to help rule out an interstitial ectopic pregnancy (Fig. 15.24; VIDEO 15.19). Rupture may result in massive bleeding. Management of these pregnancies may vary, but in general are treated by surgical resection and usually in an open manner, although more conservative approaches have been suggested (25,26).
FIGURE 15.22. Ectopic Pregnancy . A complex mass in the adnexa (A) has a fetal pole and active cardiac activity (B).
A
B
A
FIGURE 15.23. Transvaginal Sagittal View of Empty Uterus with Small Free Fluid (A) . Coronal view of the same patient, showing empty uterus (B) .
B

226 SeCtion iV / Evaluation of Pelvic Complaints
HeterotopicHeterotopic pregnancy is the presence of a simultaneous intrauterine gestation and ectopic pregnancy (Fig. 15.25; eFig. 15.21; VIDEO 15.20). The risk of heterotopic preg-nancy increases from 1 case per 4,000 women in the general population to 1 case per 100 women who have undergone fertility treatment (3). The diagnosis of heterotopic depends on a high clinical suspicion and a thorough sonographic eval-uation of the pelvis, particularly of the adnexa, as an IUP is to be expected. Even in the absence of fertility treatment,
FIGURE 15.25. Transabdominal Transverse View of a Heterotopic Pregnancy . The right adnexal ectopic can be seen with a visible yolk sac .
heterotopic pregnancy should be considered in certain clini-cal scenarios—for example, continued symptoms despite visualization of an IUP. In a review of the heterotopic litera-ture, a clear-cut ultrasonographic diagnosis prior to surgery could be made in only 14% of cases, where both viable intra- and extrauterine fetuses were observed (27).
Fluid in the Cul-de-sacFree fluid in the pelvis can be characterized by its quantity and appearance. A “small” amount of free fluid tracks less than a third of the way up the posterior wall of the uterus (Fig. 15.26; eFig. 15.22; VIDEO 15.21). Free fluid is “moderate” if
FIGURE 15.26. A Small Amount of Free Fluid can be Seen in the Cul- De-Sac (Arrow ).
FIGURE 15.24. Interstitial Pregnancy in a Patient with Vaginal Bleeding. No IUP is seen in the transvaginal ultrasound in sagittal (A) or coronal (B) views through the midline of the uterus . Further survey of the pelvis reveals an interstitial pregnancy with active fetal heart activity (C) . A ring of fire is seen by Doppler, indicating hypervascularity around the gestational sac (D) .
A B
C D

Chapter 15 / First Trimester Pregnancy 227
embryonic or fetal development. The ultrasonographic find-ings of fetal loss vary depending on the developmental stage, but in general can be detected based on the abnormal appear-ance of the gestational sac or embryo. Sonographic signs of abnormal pregnancy are listed in Table 15.2. Anembryonic gestation (or blighted ovum), in which the embryo never develops within the gestational sac, is radiologically defined as the absence of an embryo when the mean gestational sac diameter is 20 mm or more (Fig. 15.31) (16). Abnormal embryonic growth (embryonic demise or failed pregnancy) is indicated by the absence of fetal heart activity at the normal gestational age of 8 weeks, which may be measured by crown–rump length (13,17). Another sign of embryonic demise is the irregular appearance of the gestational sac border (sometimes described as a scalloped border) (Figs. 15.32–15.34). Some intrauterine fetal demise occurs after fetal heart activity devel-ops, secondary to subchorionic hemorrhage, faulty implanta-tion, or genetic flaws. Loss of identifiable fetal parts and a thickened, irregular endometrium may reflect debris of a fetal loss. Finally, fetal heart rate can be used to predict fetal loss, described in more detail below (17).
Molar PregnancyMolar pregnancy is a complication of pregnancy in which chorionic villi proliferate in a disordered fashion, usually without the development of a fetus. Bleeding commonly is seen in the late first trimester or second trimester, and b-hCG levels are markedly elevated. The typical sonographic ap-pearance of a molar pregnancy is that of an enlarged uterus with multiple small cystic areas, often referred to as a cluster of grapes (Fig. 15.35). However, in two-thirds of cases, the sonographic findings are nonspecific, including debris in the uterus. The diagnosis can be made by histological examina-tion. Neoplastic gestational disease develops in about 15% of molar pregnancies after dilatation and curettage (28,29).
Echogenic Material within the UterusEchogenic material in the uterus without a gestational sac is likely to represent an abnormal pregnancy, including spontaneous abortion or ectopic pregnancy. Echogenic ma-terial or debris within the endometrial canal may represent
it tracks two-thirds up the posterior wall of the uterus and “large” if it tracks beyond two-thirds of the posterior uter-ine wall, or if it is free-flowing in the pelvis or visualized in Morison’s pouch (Figs. 15.27–15.30; eFigs. 15.23–15.25;
VIDEOS 15.22–15.26) (14). Increased echogenicity of pelvic fluid or clot suggests the presence of blood and is con-cerning for ectopic pregnancy. The positive predictive value of echogenic pelvic fluid is 90% for ectopic pregnancy (23). On the other hand, the presence of a small amount of anechoic fluid is not useful diagnostically, as it may be found in patients with either ectopic or IUPs.
Abnormal or Nonviable IUPSpontaneous abortion occurs in about 20% to 25% of clini-cally recognized pregnancies. About 80% of fetal loss occurs in the first trimester and may occur at several stages of
FIGURE 15.27. Transvaginal Sagittal View of an Empty Uterus with Free Fluid. FF, free fluid .
FIGURE 15.28. Transvaginal Sagittal View of an Empty Uterus with Large Free Fluid Noted by Free Fluid in the Cul-De-Sac (Asterisk ) Which Extends to the Uterine Fundus (Arrow ).
FIGURE 15.29. Transvaginal Sagittal View of an Empty Uterus with Large Free Fluid (Arrow ).
FIGURE 15.30. A Large Amount of Free Fluid is Seen within Morison’s Pouch.

228 SeCtion iV / Evaluation of Pelvic Complaints
FIGURE 15.31. Empty Gestational Sac of an Intrauterine Fetal Demise.
FIGURE 15.32. Intrauterine Fetal Demise.
FIGURE 15.33. Intrauterine Fetal Demise . Fetus lacks a fetal heartbeat . Gestational sac has a scalloped appearance .
FIGURE 15.34. Scalloped Gestational Sac Seen in a Fetal Demise.
TABLE 15.2 Transvaginal Sonographic Guidelines for Diagnosing Pregnancy Failure in an Intrauterine Pregnancy of Uncertain Viability
PARAMETER FINDINGS DIAGNOSTIC OF PREGNANCY FAILUREFINDINGS SUSPICIOUS FOR, BUT NOT DIAGNOSTIC OF, PREGNANCY FAILURE*
CRL ≥7 mm and no heartbeat <7 mm and no heartbeat
MSD ≥25 mm and no embryo 16–24 mm and no embryo
Time — Absence of embryo ≥6 weeks after LMP
Absence of embryo with heartbeat ≥2 weeks after a scan that showed a gestational sac without yolk sac
Absence of embryo with heartbeat 7–13 days after a scan that showed a gestational sac without yolk sac
Absence of embryo with heartbeat ≥11 days after a scan that showed a gestational sac with yolk sac
Absence of embryo with heartbeat 7–10 days after a scan that showed a gestational sac with yolk sac
Other Empty amnion (amnion seen adjacent to yolk sac, with no visible embryo)
Enlarged yolk sac (>7 mm)
Small gestational sac size in relation to the embryo (MSD – CRL < 5 mm)
*Follow-up ultrasound at 7-10 days to assess for viability is generally appropriate after suspicious findingsAdapted from Doubilet PM, Benson CB, Bourne T, et al. Early first trimester diagnosis of nonviable pregnancy. NEJM. 2013

Chapter 15 / First Trimester Pregnancy 229
FIGURE 15.35. Molar Pregnancy with Visible Classic “Grapelike Vesicles” within the Uterus. Sagittal view (A); Coronal view (B).
A
B
are not necessarily poor prognostic signs. Subchorionic hemorrhage is a common cause of first trimester vaginal bleeding. It appears as a wedge-shaped or crescent-shaped fluid collection between the chorion and the uterine myo-metrium (Fig. 15.37; VIDEO 15.28). The association with embryonic loss is strongest with large fluid collec-tions (30).
ARTIFACTS AND PITFALLSArtifactsArtifacts encountered when performing the ultrasound exam of the pelvis are covered in Chapter 14. Briefly, the following artifacts may require attention in the setting of pelvic ultra-sound for pregnant patients in their first trimester:
• Image drop out may occur with insufficient transducer gel. Gel should be applied both inside and outside of the probe cover with special attention paid to avoid trapping air bubbles.
• Posterior acoustic enhancement produced by the blad-der may result in poor image quality of the uterus in the transverse transabdominal views. Decrease far field gain accordingly.
• Ghost image artifact has been reported. This artifact is an uncommon example of refraction artifact and may result in duplication of the image of interest, that is, a yolk sac.
Pitfalls of Image Acquisition 1. Don’t wait for a b-hCG to perform an ultrasound. IUP
or ectopic can be diagnosed in many patients without knowing the level, and pertinent findings can be present with low b-hCG values.
2. Avoid transabdominal scanning with an empty bladder. The bladder provides an acoustic window that optimizes views.
3. Utilize both the transabdominal and transvaginal views; the views complement each other.
4. Scan the pelvis in several planes (transverse, sagittal, coronal); avoid scanning in only one plane.
5. Be sure to identify the midline of the uterus, and then fan through the uterus and adnexa to fully interrogate the pelvis. Take time to identify landmarks.
FIGURE 15.36. Transvaginal Sagittal Scan of a Failed Pregnancy with Debris within the Endometrial Cavity.
FIGURE 15.37. Subchorionic Hemorrhage.
retained products of conception or clotted blood (Fig. 15.36; VIDEO 15.27). For the purposes of bedside ultrasound,
echogenic material should be interpreted as “No intrauter-ine pregnancy” (13). In a consecutive series of 78 patients presenting with echogenic material, patients were ultimately found to have embryonic demise and ectopic pregnancy (29).
Subchorionic HemorrhageSubchorionic hemorrhage, intrauterine hematomas, or sub-chorionic blood collections may be seen on ultrasound and

230 SeCtion iV / Evaluation of Pelvic Complaints
pelvic ultrasound (Fig. 15.39). Ectopic pregnancy occurs in about 2% of all pregnancies, but in the cohort of symptom-atic first trimester patients presenting to the ED, the preva-lence has been found to be 5% to 13% (4). Although early detection during the last two decades has greatly improved outcomes, ectopic pregnancy remains a leading cause of maternal morbidity and mortality (3). Ectopic pregnancy is excluded in patients in whom an IUP is visualized (with the notable exception of those patients who have received fer-tility treatments); conversely ectopic pregnancy remains on the differential if no IUP is visualized. Therefore, while per-forming the bedside pelvic ultrasound, emergency physicians should focus first on the basic question: “Can I visualize an IUP?” In order to answer this question, it is important to rec-ognize the normal ultrasound appearance of IUP at various gestational ages, keeping in mind the definition of IUP: the presence of a yolk sac or fetal parts within a gestational sac (which implies a fundal position) (1,3).
As gestational age increases, the gestational sac and its contents become more clearly visible. Since b-hCG is a sur-rogate marker for gestational age, the quantitative value of b-hCG may be helpful in assessing early pregnancies. The higher the b-hCG, the more likely a sonographer can iden-tify an IUP. At some point, the size of the gestation and the value of the b-hCG indicate a pregnancy advanced enough that it should be detectable by ultrasound. The discrimina-tory zone has been defined as the value of the b-hCG at which ultrasound should detect a normal IUP with 100% sensitivity (31,32). The established values of the discrimina-tory zones for transabdominal and transvaginal sonography are based on historical standards that have recently been challenged, and caution should be used in how the value of b-hCG is used to influence management decisions. In gen-eral, a quantitative b-hCG may be obtained for symptomatic first trimester patients to provide a baseline that can be fol-lowed in subsequent visits.
The Pregnant Patient with Hemodynamic InstabilityThe first trimester pregnant patient with abnormal vital signs (hypotension, tachycardia) or an acute abdomen requires an immediate transabdominal ultrasound exami-nation of the Morison’s pouch. This will allow for rapid identification of free fluid and facilitate triage of patients with ruptured ectopic pregnancy or other sources of hemor-rhage to the operating room (Fig. 15.30) (33). The identi-fication of free fluid in Morison’s pouch has been shown to predict the need for operative management in patients with suspected ectopic pregnancy. In fact, the specificity of bedside ultrasound for fluid in the right upper quad-rant in a pregnant patient for the outcome of ectopic preg-nancy requiring operative treatment was 99.5%, resulting in a positive likelihood ratio of 112 for need for operative management (34). Emergency physicians should strongly consider avoiding sending these patients to the radiology department, and instead keep these patients in the safety of the ED. When an IUP can be identified at the bedside, the differential shifts towards nongynecologic causes of shock, though a hemorrhagic corpus luteum cyst rupture or hetero-topic pregnancy cannot be excluded.
6. Avoid transvaginal ultrasound with a full bladder. The bladder may displace the uterus away from the probe, decreasing image quality (Fig. 15.38).
7. Avoid air bubbles at the probe face by carefully applying gel to both the probe cover and surface.
Pitfalls of Image Interpretation 1. Avoid completely discounting the possibility of hetero-
topic pregnancy. Be aware that spontaneous heterotopy can occur, although it is rare (about 1 in 4,000 pregnan-cies). The incidence in patients with fertility treatment can be as high as 1:100.
2. Recognize the possibility of pseudogestational sac. Most authors require a yolk sac or fetal pole within a gesta-tional sac to define IUP. An early sac can be difficult to distinguish from a pseudogestational sac.
3. Be aware of and recognize uncommon implantation sites, such as cornual or cervical ectopics. Sacs visualized near the periphery should trigger a measurement of the sur-rounding myometrium. A sac with a thin (<5 mm) myo-metrium can be seen with a cervical or corneal ectopic.
4. Recognize findings associated with ectopic pregnancy, including empty uterus, abnormal (echogenic, clotted, or large amount) free fluid, and adnexal masses.
5. Realize that a small amount of cul-de-sac fluid can be normal. Echogenic fluid and larger volumes of perito-neal fluid are associated with ectopic pregnancy.
6. Understand that debris in the uterus does not necessarily exclude an ectopic pregnancy. Debris in the uterus can represent retained products of conception or may be as-sociated with ectopic pregnancy.
USE OF THE IMAGE IN CLINICAL DECISION MAKINGThe General ApproachPatients in the first trimester of pregnancy with symptoms of vaginal bleeding, abdominal/pelvic pain, or syncope require an immediate evaluation for ectopic pregnancy, including a
FIGURE 15.38. Transvaginal Sagittal Scan with a Full Bladder Displac-ing the Uterus . There is free fluid within the cul-de-sac .

Chapter 15 / First Trimester Pregnancy 231
FIGURE 15.39. Approach to the First Trimester Pregnancy Presenting with Vaginal Bleeding or Pelvic Pain. TAS, transabdominal scan; TVS . transvagainal scan; CLC, corpus luteal cyst; EP, ectopic pregnancy; ED, emergency department .
First Trimester PregnancyVaginal Bleeding or Pelvic Pain
Unstable Patient:
Severe PainPeritoniteal IrritationHypotension
Stable Patient
FAST ScanResuscitation
ED TAS/TVS US
+IUP −IUP
Consider heterotopic,CLC rupture,non-GYN possibilities
High suspicion of EP
Laparotomy/Laparoscopy
ED TAS
+IUP−IUP
+EP
Quant β−hCG withadditional imaging andspecialty consultation
−IUP
hCG > 2,000 mIU/mL* hCG ≤ 2,000 mIU/mL*
GYN Consult r/o EPFinal management decisionsmust be based on individualclinical scenario
ExcludeHeterotopic
Consider:1. CLC rupture2. non-GYN DDx3. threatened miscarriage
DDx:1. ectopic pregnancy2. IUP failure3. molar pregnancy4. multiple gestations
DDx:1. ectopic pregnancy2. IUP failure3. normal IUP
Quant hCG +GYN Consult
TVS
*Although 2,000 mIU/mL isrepresented here, thequantitative β−hCG level is anevolving standard with a rangefrom 1,500–3,000 mlU/mL
−IUP
Ectopic Pregnancy DetectedThe primary focus of bedside pelvic ultrasound is to simply exclude ectopic pregnancy by the identification of an IUP. How-ever, emergency physicians may detect findings that are diag-nostic for, or suggestive of, ectopic pregnancy. This is reflected in ACEP ultrasound guidelines that describe the identification of IUP as the primary indication for bedside pelvic ultrasound and identification of ectopic pregnancy as secondary (1). The diag-nosis of ectopic pregnancy is established by the presence of a clearly visible extrauterine yolk sac or embryo; it is highly likely if a tubal ring or complex adnexal mass is detected. Several studies have reported the identification of ectopic pregnancy by emergency physicians. In a large prospective study of bedside ultrasound, emergency physicians detected ectopic pregnancy in 2% of symptomatic first trimester patients, which accounted for 24 of 68 ectopics identified in the trial. Interestingly, the ectopic pregnancies found on bedside ultrasound by emergency physi-cians were managed surgically at more than double the rate than those found after an initial indeterminate ultrasound (40). With increasing experience, emergency physicians can accurately identify findings associated with ectopic pregnancy (5). In a small study, two highly experienced emergency sonographers have found that adnexal masses that separated from the adjacent ovary were more likely to represent ectopic pregnancies (41).
IUP DetectedIn a stable first trimester pregnancy, the identification of an IUP on bedside ultrasound is sufficient to exclude ectopic pregnancy (except in cases where patients have received fertility treatment). The ability to safety exclude ectopic pregnancy is based on the excellent test characteristics of bedside ultrasound (4, 34-39). An alternative cause of symptoms, particularly if the presenting complaint is ab-dominal or pelvic pain, should be considered. Alternative diagnoses, including ruptured corpus luteum cyst, subcho-rionic hemorrhage, ovarian torsion, appendicitis, or other intra-abdominal process are important to identify, and are facilitated by the exclusion of ectopic pregnancy. In patients with vaginal bleeding, the Rh status should be clarified and Rhogam given if appropriate. Patients should be counselled about the risks of spontaneous abortion and be referred to obstetrical care.
The proportion of patients in whom an IUP is diagnosed varies due to exam protocol, operator training and experi-ence, and technology, ranging from 49% to 70% for institu-tions using transvaginal scanning. Thus, depending on the individual scanning unit, emergency physicians can safely discharge 49% to 70% of stable symptomatic first trimester patients (4).

232 SeCtion iV / Evaluation of Pelvic Complaints
not be used to determine the initial management of sus-pected ectopics in stable patients (44,45). At least one series reports nine patients who presented with an empty uterus by transvaginal ultrasound and a b-hCG >2,000 mIU/mL who ultimately delivered term infants (44). In order to avoid premature termination of potentially viable IUPs (not yet visualized on initial ultrasound) alternative discriminatory values have been proposed by Connally, including a b-hCG of 3,510 mIU/mL for gestational sacs; 17,716 mIU/mL for yolk sac; and 47,685 mIU/mL for fetal pole (by transvaginal US) (46). Although the discriminatory zone has been widely cited and used, it deserves further study. A useful discrimina-tory threshold for ED transvaginal ultrasound has not been determined, and so the b-hCG level may not be as helpful as once hoped in the setting of an indeterminate bedside ultra-sound (47). A recent ACEP clinical policy concluded that no single value for b-hCG could be used to exclude an ectopic with an indeterminate ultrasound (48). Once an indetermi-nate result is obtained, all cases need specialty consultation and follow-up.
The decision to intervene (with either surgery or meth-otrexate) should be highly individualized, taking into ac-count the prevalence of disease in one’s setting, the patient’s presentation, their ectopic risk profile, the practitioner’s judgment, the ability to obtain reliable follow-up, and the patient’s desire to keep the pregnancy. Many stable patients with reliable follow-up can be managed as outpatients with serial exams, repeat b-hCG levels, and repeat ultrasounds provided there is a system set up to provide care until there is a resolution, or until diagnostic certainty or treatment thresh-olds are reached.
Although no single value of b-hCG is sufficient to deter-mine the location or viability of a pregnancy, follow-up visits can track serial levels and doubling times to help distinguish normal from abnormal pregnancies. The expected rate of rise for growing viable pregnancies is 53% in 2 days; although some advocate applying 35% as the lower limit of normal to avoid terminating viable IUPs (49,50). Hormone levels that drop 50% or more over 48 hours are almost always non-viable spontaneous abortions and least likely to be ectopic pregnancies (49). There is unfortunately no single value of b-hCG and no pattern of change that accurately predicts the presence of an ectopic (50,51). Any follow-up plans should coordinate care with obstetrical consults to decide criteria for intervention and goals of follow-up visits.
Occasionally, the question arises in the management of symptomatic first trimester patients of whether to obtain a b-hCG level before obtaining an ultrasound. Although there has been no trial directly comparing the two strategies (b-hCG level first versus ultrasound first), there are good reasons not to delay the ultrasound until the results of the b-hCG are known. The quantitative b-hCG level alone does not predict ectopic pregnancy. The majority of ectopic preg-nancies present to the ED with a b-hCG <3,000 mIU/mL, and many never rise above the discriminatory zone where an IUP or gestational sac should be seen (52,53). Secondly, useful findings by ultrasound are frequently encountered even when the b-hCG is below the discriminatory zone. In one study, 39% (9 of 23) of women ultimately diagnosed with ectopic pregnancy who had b-hCG levels <1,000 mIU/mL had diagnostic ultrasounds for ectopic embryo or com-plex adnexal mass in studies performed by radiology (54). Bedside ultrasound is convenient, available round the clock, and the majority (50% to 70%) of patients can have
No Definite IUP or Ectopic Pregnancy Detected: The Indeterminate ScanThe third category of bedside ultrasound result is the indeter-minate scan, when no IUP or ectopic pregnancy is visualized (40). The proportion of patients categorized as indeterminate depends on multiple factors, including operator experience, training, available technology, study protocol (transabdomi-nal alone vs. in combination with transvaginal), and patient factors (3). In 11 bedside ultrasound studies performed by emergency physicians in whom all patients were followed up, the proportion of patients categorized as indeterminate ranged from 20% to 50% (4). Indeterminate ultrasounds may ultimately be diagnosed with embryonic demise (53%), IUP (29%), or ectopic pregnancy (15%) (40).
The risk of an extrauterine pregnancy in the indeterminate category should be clinically assessed, taking into account the patient’s history, risk factors, severity of symptoms, and physical exam. Although only IUP has been shown to safely exclude ectopic pregnancy, authors have examined the out-comes of the various subclasses of indeterminate radiology ultrasounds. The empty uterus is the indeterminate finding most associated with ectopic pregnancy. Interestingly, none of 53 patients with the indeterminate finding of a gestational sac were found to have ectopic pregnancy as an outcome (42).
A symptomatic first trimester patient with an indetermi-nate bedside ultrasound should receive a consultative study relatively expeditiously. Many authors recommend a manage-ment algorithm for the indeterminate result that includes a formal study or obstetrical consultation (38,40,43). The con-sultative ultrasound may provide a definitive diagnosis of IUP or ectopic pregnancy. The sensitivity of consultative trans-vaginal ultrasonography for the diagnosis of intrauterine and ectopic pregnancy is dependent on the gestational age and the expertise of the ultrasonographer. In gestations longer than 5.5 weeks, a radiology-performed transvaginal ultrasonographic examination should identify an IUP with almost 100% sen-sitivity (40). The rate of indeterminate studies in studies of consultative ultrasound ranges from 8% to 31%, and the sen-sitivity for ectopic pregnancy ranges from 73% to 93% (3).
Use of Quantitative a-hCGIf the consultative ultrasound study also does not suggest a diagnosis, that is, “the indeterminate result,” a quantita-tive serum b-hCG is typically obtained and correlated to the institutional discriminatory zone. Early work with trans-abdominal ultrasound defined the discriminatory zone for a gestational sac as a b-hCG level of 6,500 mIU/mL (31). Transvaginal ultrasound discriminatory zones have been re-ported to be lower (1,000 to 3,000 mIU/mL), but vary de-pending on the equipment used, operator skills, and patient population. One important exception to the discriminatory zone should be noted: a multiple gestation pregnancy will have a relatively high b-hCG for the gestational age. Since it is impossible to know if the pregnancy is multiple before visualizing it, there is an added risk of failing to detect a healthy pregnancy with a multiple gestation at the usual dis-criminatory zone. It is worth noting as well that these zones have been defined for the visualization of a gestational sac, not for visualization of a yolk sac or fetal pole as recom-mended for a definitive identification of IUP. A number of recent reports suggest that the discriminatory zone may not be as reliable as once thought in excluding IUPs and should
Chapter 15 / First Trimester Pregnancy 233
likely to receive an ultrasound during off hours (evenings and weekends) (59). The increasing use of bedside ultrasound has allowed emergency physicians to evaluate these patients with an appropriate study. While bedside ultrasound should be regarded as focused and operator dependent, it is clear that the application to rule out ectopic pregnancy is of excel-lent quality. In 11 emergency physician studies of bedside ul-trasound test characteristics, the specificity for IUP has been perfect. Conversely, when bedside ultrasound is considered a screening exam for ectopic pregnancy (“No intrauterine pregnancy” considered positive for disease), the sensitivity has been found to be 99.26% with 95% confidence inter-vals from 96.5% to 100%. The negative predictive value in an emergency population with a mean prevalence of ectopic of 8% was 99.96%. Therefore, when an IUP is visualized clearly, the diagnosis of ectopic pregnancy can be safely ex-cluded, and further testing may be avoided (4).
How often ectopic is excluded depends on the sensitivity of bedside ultrasound for IUP. This test characteristic varies considerably depending on machine, operator experience, and study protocol (i.e., transabdominal alone vs. in combi-nation with transvaginal). When bedside ultrasound is used as a diagnostic test to exclude ectopic pregnancy, the speci-ficity for ectopic is approximately 70%, ranging from 49% to 87% (4). In the largest prospective trial to date, 70% of patients had an IUP visualized (40). Therefore, bedside ul-trasound allows emergency physicians to safely and reliably exclude ectopic pregnancy in a majority of symptomatic first trimester patients presenting to the ED.
Several studies have shown that the finding of IUP on bedside ultrasound is associated with increased efficiency as measured by decreased ED length of stay. Three studies have shown that pelvic ultrasound performed by emergency physi-cians reduces the time of the patient encounter significantly, especially when patients present during off hours (35,60,61). Authors reported that the decreased length of stay associated with the bedside visualization of IUP was attributed to the ability to avoid radiology-performed ultrasound and obstetri-cal consultation. Again, it is the patient in whom an IUP is visualized who receives the benefit of decreased length of stay, so efforts should be made to increase the proportion of patients in which IUP is diagnosed through quality as-surance, training, updating technology, and study protocols.
Finally, bedside ultrasound allows emergency physicians to evaluate unstable patients in the relative safety of the ED, rapidly identify patients with hemoperitoneum, and facilitate care of those who require operative management (34). For the stable patient with an IUP, bedside ultrasound improves the length of stay and facilitates a quick and accurate disposi-tion for the patient.
COMPARISON WITH OTHER IMAGING MODALITIESThe comprehensive imaging modality for the evalua-tion of stable patients with suspected ectopic pregnancy is radiology-performed ultrasound. Few studies directly com-pare bedside ultrasound to radiology or consultative ultra-sound. It is generally accepted that radiology ultrasound can reliably detect an IUP at 5.5 weeks or approximately a b-hCG of 1,500 mIU; however, there is variation between scanning units given the same gestational age due to dif-ferences in technology, training, and scanning protocol.
ectopic pregnancy excluded. Experienced sonographers may be able to accurately detect ectopic pregnancy as well (4,5). Therefore, it is reasonable to obtain an ultrasound in all symptomatic first trimester patients without delay, and use the level of b-hCG primarily for follow-up of pregnan-cies with an indeterminate ultrasound or with questionable viability (48).
Evolving Trends: Nomenclature and StandardsMuch of existing literature has classified early gestations as IUP, ectopic, or indeterminate based on initial ultrasound findings. More recent international and multispecialty con-sensus guidelines advocate a change in nomenclature that more specifically defines diagnostic criteria and revises rec-ommendations for interventions (55,56). The classification divides findings into five categories:
1. Definite IUP: a visualized gestational sac with yolk sac and/or fetus, with or without fetal heart activity.
2. Definite ectopic: a visualized gestational sac with yolk sac and or fetus in an extrauterine location.
3. Probable IUP: intrauterine echogenic sac-like structure. 4. Probable ectopic: inhomogeneous adnexal mass or sac-
like structure in the absence of a visualized IUP. 5. Pregnancy of Unknown Location (PUL): positive
pregnancy test, but no intrauterine or ectopic pregnancy visualized on transvaginal ultrasound.
PUL at time of initial evaluation may eventually declare themselves to be normal IUPs, ectopics, or nonviable preg-nancies. PULs require follow-up until they reach a threshold for intervention or resolve (either by declaring their location or declining to an undetectable b-hCG).
There has been a growing awareness that well-intended but overzealous treatment of symptomatic first trimester pregnan-cies have led to unintended termination of viable IUPs, as well as births of deformed infants after in utero exposure to metho-trexate (12,57,58). The dilemma emergency physicians face is to be sensitive enough to not miss ectopics while not overly stating risks to either the patient or consultant. In patients who are reliable for follow-up, and who desire to maintain their pregnancy, more conservative guidelines for intervention may be used (45,46,49,50). Indeed, the guidelines for suspecting ectopic may be set to be sensitive; stricter, more conservative, and more specific criteria might be appropriate for interven-tion. Criteria for intervention should be established in collabo-ration with obstetrical and radiology consultants so that the appropriate diagnostic information is obtained and communi-cated. While 70% of initial patients presenting with symptom-atic first trimester pregnancies can be managed definitively with information available at their initial visit, the remaining will require a reliable system for follow-up and specialty care. In cases of indeterminate ultrasounds and PUL, several visits may be required to establish a final diagnosis (8).
The Utility of Emergency UltrasoundThe utility of bedside ultrasound lies in round-the-clock availability, increased efficiency, and patient safety. Histori-cally, EDs caring for symptomatic first trimester patients faced a serious problem of unavailability of ultrasound dur-ing off hours. According to one ED survey of national data, patients with suspected ectopic pregnancy were 50% less

234 SeCtion iV / Evaluation of Pelvic Complaints
an unusually short period, lasting only 2 days. She denies any pelvic pain or other complaints. Her blood pressure is 88/56 mm Hg, pulse is 107 beats per minute, respirations are 18 per minute, and temperature is 37.4°C. Pelvic exam reveals bleeding coming from an otherwise normal cervical os and slight tenderness and fullness in the left adnexa, but is otherwise normal.
A rapid urine pregnancy test is positive. The ED physi-cian performs a transabdominal ultrasound, and free fluid is visualized in the right upper quadrant (Fig. 15.30). An ED transvaginal ultrasound is then performed. The uterus appears empty and a large amount of pelvis free fluid is visualized. The operator also notes that there is a moderate amount of free fluid of mixed echogenicity in the cul-de-sac (Fig. 15.28). The obstetrical consultant requests that the patient be sent to radiology for a formal exam to confirm the bedside ultrasound findings. The patient is resuscitated with fluid but remains tachycardic. The emergency physician contacts the consul-tant again and repeats that the patient has been identified with hemoperitoneum. The consultant performs a bedside ultrasound in the ED and confirms the findings. The patient is taken to the operating room and the ectopic pregnancy is iden-tified. There are a number of points illustrated by this case:
1. While the presenting complaints of abdominal pain, pelvic pain, and vaginal bleeding typically trigger the work-up of ectopic pregnancy, the first trimester patient presenting with syncope or shock should be evaluated as well.
2. Patients who are unstable should receive an ultrasound examination of Morison’s pouch for free fluid.
3. Patients with suspected ectopic pregnancy and free fluid identified in Morison’s pouch likely require operative management.
4. Patients diagnosed with hemoperitoneum should remain in the safety of the ED where they can be monitored and resuscitated.
REFERENCES 1. American College of Emergency Physicians. Emergency ultrasound
guidelines—2008. Ann Emerg Med. 2009;53(4):550–570. 2. Dart RG, Kaplan B, Varaklis K. Predictive value of history and physical
examination in patients with suspected ectopic pregnancy. Ann Emerg Med. 1999;33:283–290.
3. Barnhart KT. Clinical practice. Ectopic pregnancy. N Engl J Med. 2009;361(4):379–387.
4. Stein JC, Wang R, Adler N, et al. Emergency physician ultrasonography for evaluating patients at risk for ectopic pregnancy: a meta-analysis. Ann Emerg Med. 2010;56(6):674–683.
5. Adhikari S, Blaivas M, Lyon M. Diagnosis and management of ecto-pic pregnancy using bedside transvaginal ultrasonography in the ED: a 2-year experience. Am J Emerg Med. 2007;25(6):591–596.
6. Yeh HC. Efficacy of the intradecidual sign and fallacy of the double decidual sac sign in the diagnosis of early intrauterine pregnancy. Radiology. 1999;210(2):579–582.
7. Chiang G, Levine D, Swire M, et al. The intradecidual sign: is it reliable for diagnosis of early intrauterine pregnancy? AJR Am J Roentgenol. 2004;183(3):725–731.
8. Laing FC, Brown DL, Price JD, et al. Intradecidual sign: is it effec-tive in diagnosis of an early intrauterine pregnancy? Radiology. 1999;204:655–660.
9. Marks WM, Filly RA, Callen PW, et al. The decidual cast of ecto-pic pregnancy: a confusing ultrasonographic appearance. Radiology. 1979;133(2):451–454.
10. Benson CB, Doubilet PM, Peters HE, et al. Intrauterine fluid with ecto-pic pregnancy: a reappraisal. J Ultrasound Med. 2013;32:389–393.
Similarly, there is a range of sensitivities of radiology ultra-sound for the identification of extrauterine gestations, from 73% to 93% (3). In contrast, a single-center study of mainly practice-based pathway trained emergency physicians (as op-posed to residency trained) showed that bedside ultrasound did not reliably detect IUPs at the same b-hCG level as ra-diologists (4).
INCIDENTAL FINDINGSIn the course of scanning pregnant patients, a number of in-cidental findings may be encountered. Many of these are not yet considered within the domain of emergency ultrasound. However, frequent use of bedside ultrasound will probably result in recognition of many of these findings, and enhance image interpretation.
Ovarian CystsOvarian cysts are common. There are a wide variety of ovar-ian cysts and masses with differing sonographic appearances. The expertise to distinguish between these is beyond the scope of ED ultrasound, although it is important to recog-nize ovarian cysts as problems that should eventually be ad-dressed and referred. Ovarian cyst rupture can present with sudden pain and peritoneal irritation in the first trimester and can result in free fluid in the pelvis. The cyst itself may collapse, making diagnosis less straightforward.
Corpus LuteumThe corpus luteum cyst specifically develops from the ovar-ian follicle following ovulation and normally involutes after 14 days. In pregnancy, the corpus luteum is maintained and supports the pregnancy for the first 6 to 7 weeks. It may be-come cystic and may rupture or torse. Some corpus luteum cysts fail to involute and continue into the second or third trimester. Rupture of the corpus luteum cyst in the first tri-mester results in pelvic pain and free fluid in the cul-de-sac and confounds first trimester differential diagnosis.
Multiple GestationsDichorionic twins will have two chorionic sacs (gestational sacs) and two yolk sacs, whereas monochorionic twins will only have one chorionic sac and either one or two yolk sacs depending upon mono- or diamnionicity.
Adnexal MassesComplex masses raise the suspicion for ectopic pregnancy, especially when no IUP is seen. Patients should be referred for a consultative ultrasound and specialty consultation. The differential diagnosis includes incidental ovarian pathology.
CLINICAL CASEA 25-year-old woman presents to the ED with one episode of syncope while riding the bus. The patient felt faint and then lost consciousness that morning while seated on the bus. According to paramedics, the patient was diaphoretic, sat down, and then slumped to the ground. No seizure-like activity was witnessed, and the patient was alert and oriented during the ambulance transport. She believes her last men-strual period was about 28 days earlier, but admits it was

Chapter 15 / First Trimester Pregnancy 235
38. Mateer JR, Valley VT, Aiman EJ, et al. Outcome analysis of a protocol including bedside endovaginal sonography in patients at risk for ectopic pregnancy. Ann Emerg Med. 1996;27(3):283–289.
39. Wong TW, Lau CC, Yeung A, et al. Efficacy of transabdominal ultra-sound examination in the diagnosis of early pregnancy complications in an emergency department. J Accid Emerg Med. 1998;15(3):155–158.
40. Tayal VS, Cohen H, Norton HJ. Outcome of patients with an indetermi-nate emergency department first-trimester pelvic ultrasound to rule out ectopic pregnancy. Acad Emerg Med. 2004;11(9):912–917.
41. Blaivas M, Lyon M. Reliability of adnexal mass mobility in distinguish-ing possible ectopic pregnancy from corpus luteum cysts. J Ultrasound Med. 2005;24(5):599–603; quiz 605.
42. Dart RG, Burke G, Dart L. Subclassification of indeterminate pelvic ultrasonography: prospective evaluation of the risk of ectopic pregnancy. Ann Emerg Med. 2002;39(4):382–388.
43. Moore C, Promes SB. Ultrasound in pregnancy. Emerg Med Clin North Am. 2004;22(3):697–722.
44. Doubilet PM, Benson CB. Further evidence against the reliability of the human chorionic gonadotropin discriminatory level. J Ultrasound Med. 2011;30:1637–1642.
45. MehtaTS, Levine D, Beckwith B. Treatment of ectopic pregnancy: is a human chorionic gonadotropin level of 2,000 mIU/ml a reasonable threshold? Radiology. 1997;205:569–573.
46. Connolly A, Ryan DH, Stuebe AM, et al. Reevaluation of discrimina-tory and threshold levels for serum β-hCG in early pregnancy. Obstet Gynecol. 2013;121:65–70.
47. Wang R, Reynolds TA, West HH, et al. Use of a β-hCG discrimina-tory zone with bedside pelvic ultrasonography. Ann Emerg Med. 2011;58(1):12–20.
48. American College of Emergency Physicians. Clinical policy: critical issues in the initial evaluation and management of patients present-ing to the emergency department in early pregnancy. Ann Emerg Med. 2012;60:381–390.
49. Barnhart KT, Sammel MD, Rinaudo PF, et al. Symptomatic patients with an early viable intrauterine pregnancy: HCG curves redefined. Obstet Gynecol. 2004;104(1):50–55.
50. Seeber BE, Samuel MD, Guo W, et al. Application of redefined human chorionic gonadotropin curves for the diagnosis of women at risk for ectopic pregnancy. Fertil Steril. 2006;86:454–459.
51. Silva C, Sammel MD, Zhou Lan, et al. Human chorioic gonado-tropin profile for women with ectopic pregnancy. Obstet Gynecol. 2006;107:605–610.
52. Kohn MA, Kerr K, Malkevich D, et al. Beta-human chorionic gonado-tropin levels and the likelihood of ectopic pregnancy in emergency de-partment patients with abdominal pain or vaginal bleeding. Acad Emerg Med. 2003;10(2):119–126.
53. Kaplan BC, Dart RG, Moskos M, et al. Ectopic pregnancy: prospec-tive study with improved diagnostic accuracy. Ann Emerg Med. 1996;28(1):10–17.
54. Dart RG, Kaplan B, Cox C. Transvaginal ultrasound in patients with low beta-human chorionic gonadotropin values: how often is the study diagnostic? Ann Emerg Med. 1997;30(2):135–140.
55. Barnhart K, van Mello NM, Bourne T, et al. Pregnancy of unknown loca-tion: a consensus statement of nomenclature, definitions, and outcome. Fertil Steril. 2011;95:857–866.
56. Doubilet PM, Benson CB, Bourne T, et al. Early first trimester diagnosis of nonviable pregnancy. NEJM. 2013. In press.
57. Barnhart KT. Early pregnancy failure: beware of the pitfalls of modern management. Fertil Steril. 2012;98:1061–1065.
58. Nurmohamed L, Moretti ME, Schechter T, et al. Outcome following high-dose methotrexate in pregnancies misdiagnosed as ectopic. Am J Obstet Gynecol. 2011;205:533.e1–533.e3.
59. Stein JC, Jacoby VL, Vittinghoff E, et al. Differential use of diagnostic ultrasound in U.S. emergency departments by time of day. West J Emerg Med. 2011;12(1):90–95.
60. Blaivas M, Sierzenski P, Plecque D, et al. Do emergency physicians save time when locating a live intrauterine pregnancy with bedside ultraso-nography? Acad Emerg Med. 2000;7(9):988–993.
61. Shih CH. Effect of emergency physician-performed pelvic sonogra-phy on length of stay in the emergency department. Ann Emerg Med. 1997;29(3):348–351; discussion 352.
11. Nyberg DA, Laing FC, Filly RA, et al. Ultrasonographic differentiation of the gestational sac of early intrauterine pregnancy from the pseudo-gestational sac of ectopic pregnancy. Radiology. 1983;146(3):755–759.
12. Doubilet PM, Benson CB. First do no harm. . . . .to early pregnancies. J Ultrasound Med. 2010;29:685–689.
13. Dart R, Howard K. Subclassification of indeterminate pelvic ultra-sonograms: stratifying the risk of ectopic pregnancy. Acad Emerg Med. 1998;5(4):313–319.
14. Dart RG. Role of pelvic ultrasonography in evaluation of symptomatic first-trimester pregnancy. Ann Emerg Med. 1999;33:310–320.
15. Nyberg DA, Mack LA, Harvey D, et al. Value of the yolk sac in evaluat-ing early pregnancies. J Ultrasound Med. 1988;7(3):129–135.
16. Tan S, Pektas MK, Arslan H. Sonographic evaluation of the yolk sac. J Ultrasound Med. 2012;31(1):87–95.
17. Paspulati RM, Bhatt S, Nour SG. Sonographic evaluation of first-trimes-ter bleeding. Radiol Clin North Am. 2004;42(2):297–314.
18. Doubilet PM, Benson CB. Embryonic heart rate in the early first trimes-ter: what rate is normal? J Ultrasound Med. 1995;14(6):431–434.
19. Jauniaux E, Johns J, Burton GJ. The role of ultrasound imaging in di-agnosing and investigating early pregnancy failure. Ultrasound Obstet Gynecol. 2005;25(6):613–624.
20. Bailey C, Carnell J, Vahidnia F, et al. Accuracy of emergency physicians using ultrasound measurement of crown-rump length to estimate gesta-tional age in pregnant females. Am J Emerg Med. 2012;30(8):1627–1629.
21. Shah S, Teismann N, Zaia B, et al. Accuracy of emergency physicians using ultrasound to determine gestational age in pregnant women. Am J Emerg Med. 2010;28(7):834–838.
22. Brown DL, Doubilet PM. Transvaginal sonography for diagnosing ectopic pregnancy: positivity criteria and performance characteristics. J Ultrasound Med. 1994;13(4):259–266.
23. Bhatt S, Ghazale H, Dogra VS. Sonographic evaluation of ectopic preg-nancy. Radiol Clin North Am. 2007;45(3):549–560, ix.
24. Levine D. Ectopic pregnancy. Radiology. 2007;245(2):385–397. 25. Jafri SZ, Loginsky SJ, Bouffard JA, et al. Sonographic detection of in-
terstitial pregnancy. J Clin Ultrasound. 1987;15(4):253–257. 26. Rothe DJ, Birnbaum SJ. Cervical pregnancy: diagnosis and manage-
ment. Obstet Gynecol. 1973;42(5):675–680. 27. van Dam PA, Vanderheyden JS, Uyttenbroeck F. Application of ultra-
sound in the diagnosis of heterotopic pregnancy—a review of the litera-ture. J Clin Ultrasound. 1988;16(3):159–165.
28. Sebire NJ, Rees H, Paradinas F, et al. The diagnostic implications of routine ultrasound examination in histologically confirmed early molar pregnancies. Ultrasound Obstet Gynecol. 2001;18(6):662–665.
29. Dart R, Dart L, Mitchell P. Normal intrauterine pregnancy is unlikely in patients who have echogenic material identified within the endo-metrial cavity at transvaginal ultrasonography. Acad Emerg Med. 1999;6(2):116–120.
30. Dickey RP, Olar TT, Curole DN, et al. Relationship of first-trimester subchorionic bleeding detected by color Doppler ultrasound to subcho-rionic fluid, clinical bleeding, and pregnancy outcome. Obstet Gynecol. 1992;80(3, pt 1):415–420.
31. Kadar N, Taylor KJ, Rosenfield AT, et al. Combined use of serum HCG and sonography in the diagnosis of ectopic pregnancy. AJR Am J Roent-genol. 1983;141(3):609–615.
32. Nyberg DA, Filly RA, Mahony BS, et al. Early gestation: correlation of HCG levels and sonographic identification. AJR Am J Roentgenol. 1985;144(5):951–954.
33. Hsu S, Martin D, Aly A. Operative laparoscopy in tubal pregnancy: pre-operative ultrasonographic measurement of hemoperitoneum as a pre-dictor of blood loss and outcome. J Reprod Med. 2005;50(2):117–122.
34. Moore C, Todd WM, O’Brien E, et al. Free fluid in Morison’s pouch on bedside ultrasound predicts need for operative intervention in suspected ectopic pregnancy. Acad Emerg Med. 2007;14(8):755–758.
35. Burgher SW, Tandy TK, Dawdy MR. Transvaginal ultrasonography by emergency physicians decreases patient time in the emergency depart-ment. Acad Emerg Med. 1998;5(8):802–807.
36. Durham B, Lane B, Burbridge L, et al. Pelvic ultrasound performed by emergency physicians for the detection of ectopic pregnancy in compli-cated first-trimester pregnancies. Ann Emerg Med. 1997;29(3):338–347.
37. Jehle D, Davis E, Evans T, et al. Emergency department sonography by emergency physicians. Am J Emerg Med. 1989;7(6):605–611.

236
ultrasound necessitates caution on the part of the emergency physician. A 1998 study by Sanders found that 75% of all ultrasound-related lawsuits related to obstetrics (1). Many of these relate to failure to diagnose abnormalities on rou-tine, elective ultrasounds; some relate to the failure to obtain an ultrasound when indicated. Emergency physicians, who are knowledgeable in ultrasound anatomy, and trained and skilled in pregnancy applications, may be in a position to ob-tain valuable information in emergency situations but should exercise professional judgment in the use of late trimester ultrasound.
ED ultrasound is directed at obtaining specific, focused information that is relevant to the patient’s presentation to guide immediate clinical decision making. In pregnancy, this may include basic skills such as gestational dating, fetal heart rate measurement, determination of fetal lie and placental location, and recognition of specific pathologic conditions. ED ultrasound can facilitate the evaluation of pregnant patients who present with trauma, abdominal pain, vaginal bleeding, labor, as well as nonobstetric emergencies, such as cholecystitis and appendi-citis. Sonography of the second and third trimester patient may be needed infrequently in high-volume EDs in countries with well-developed health systems. However, these skills may be
INTRODUCTIONClinician-performed evaluation of pregnancy with ultra-sound is standard practice in obstetrics and the primary mo-dality for radiologic assessment of pregnancy. Emergency physicians have established first trimester sonography as a standard part of emergency medicine training and practice, primarily to address the risk of undiagnosed ectopic preg-nancy. Emergency department (ED) ultrasound evaluation of second and third trimester pregnancies by emergency phy-sicians is less well defined and little studied. This is most likely due to the relative infrequency of ED presentations at this gestational age as complications are fewer and pre-natal care is more commonly established and available to the patient. Nevertheless, emergency physicians are still con-fronted with second or third trimester patients with a variety of complaints, complications, and emergencies. It is essential that the emergency physician understand the role bedside ul-trasound can play at these stages of pregnancy, as well as its indications, techniques, findings, and limitations.
Although there is a vast body of literature on the use of ultrasound throughout pregnancy, the lack of a well- defined scope for point-of-care second and third trimester ED
Intrauterine Fetal Demise . . . . . . . . . . . . . . . . . . . . . . 245Molar Pregnancy . . . . . . . . . . . . . . . . . . . . . . . . . . . . . 246Placental Abruption . . . . . . . . . . . . . . . . . . . . . . . . . . . 246Placenta Previa . . . . . . . . . . . . . . . . . . . . . . . . . . . . . . 247Nuchal Cord . . . . . . . . . . . . . . . . . . . . . . . . . . . . . . . . 248Uterine Perforation . . . . . . . . . . . . . . . . . . . . . . . . . . . 249Uterine Rupture . . . . . . . . . . . . . . . . . . . . . . . . . . . . . . 249Retained Products of Conception . . . . . . . . . . . . . . . . 250
ARTIFACTS AND PITFALLS . . . . . . . . . . . . . . . . . . . . . . . . . 250USE OF THE IMAGE IN CLINICAL DECISION MAKING . . . . . 251INCIDENTAL FINDINGS . . . . . . . . . . . . . . . . . . . . . . . . . . . . 251
Uterus . . . . . . . . . . . . . . . . . . . . . . . . . . . . . . . . . . . . . 251Cervix . . . . . . . . . . . . . . . . . . . . . . . . . . . . . . . . . . . . . 252
CLINICAL CASE . . . . . . . . . . . . . . . . . . . . . . . . . . . . . . . . . . 252
INTRODUCTION . . . . . . . . . . . . . . . . . . . . . . . . . . . . . . . . . . 236CLINICAL APPLICATIONS . . . . . . . . . . . . . . . . . . . . . . . . . . . 237IMAGE ACQUISITION . . . . . . . . . . . . . . . . . . . . . . . . . . . . . . 237
Transabdominal Imaging . . . . . . . . . . . . . . . . . . . . . . 237Transvaginal Imaging . . . . . . . . . . . . . . . . . . . . . . . . . 237Transperineal (Translabial) Imaging . . . . . . . . . . . . . . 238
NORMAL ULTRASOUND ANATOMY . . . . . . . . . . . . . . . . . . . 239Gestational Dating . . . . . . . . . . . . . . . . . . . . . . . . . . . . 239Fetal Cardiac Activity . . . . . . . . . . . . . . . . . . . . . . . . . . 241Fetal Lie . . . . . . . . . . . . . . . . . . . . . . . . . . . . . . . . . . . . 241Placental Location . . . . . . . . . . . . . . . . . . . . . . . . . . . . 242Cervical Assessment . . . . . . . . . . . . . . . . . . . . . . . . . . 242Amniotic Fluid Assessment . . . . . . . . . . . . . . . . . . . . . 244
PATHOLOGY . . . . . . . . . . . . . . . . . . . . . . . . . . . . . . . . . . . . . 245
John Gullett and David C. Pigott
Second and Third Trimester Pregnancy
16

Chapter 16 / Second and Third Trimester Pregnancy 237
amniotic fluid, which provides an acoustic window surround-ing the fetus. Technique is largely guided by the needs of the clinician as well as by the position of the fetus, placenta, and other structures. The sonographer may have to spend some time placing the transducer in multiple positions on the ab-domen, orienting to a given pregnancy’s individual anatomy in order to appreciate the positions of important structures (Figs. 16.1 and 16.2).
The normal second and third trimester uterus appears as a homogeneous muscular wall of medium to low echogenicity. Throughout pregnancy it decreases in thickness as it stretches to accommodate the pregnancy. The lower uterine segment can sometimes be seen in the pelvis (Fig. 16.3; eFig. 16.1). Transabdominal ultrasound of this area may be impaired by maternal habitus. However, with a moderately full bladder, the lower uterus and cervix can often be visualized.
Transvaginal ImagingWhile transabdominal ultrasound is the technique of choice for most late trimester evaluations, transvaginal sonogra-phy affords superior views of the lower uterine segment
particularly useful when bedside ultrasound is the most imme-diate resource at hand, such as rural practice settings, austere environments, or in developing countries. One report on the uti-lization of acute ultrasound in Liberia found that 53% were for obstetric-related complaints; 17% of the patients were second or third trimester, and management was altered in 77% (2).
CLINICAL APPLICATIONSEmergency ultrasound is designed to focus on limited goal-directed exams to guide therapy, consults, hospital transfers, and risk stratification. The goal of the emergency physician is not to perform comprehensive fetal biometry or anatomical surveys, but rather to quickly gather relevant data necessary for immediate care.
Some of the ultrasound evaluation done in the second and third trimester performed by technicians and radiolo-gists is beyond the scope of emergency physicians. However, point-of-care ultrasound can be a critical diagnostic tool for patients with third trimester bleeding, trauma, abdominal pain, fluid leakage, and labor. Emergency pathology such as placenta previa, uterine rupture, premature rupture of membranes, fetal viability, pregnancy dating, and fetal car-diac activity may all be assessed by emergency physicians (Table 16.1).
Other indications for emergency ultrasound, discussed in other sections of this book, apply to the pregnant patient as well. It is necessary to maintain a wide differential when evaluating a pregnant patient with abdominal pain. For in-stance, the discomfort of cholecystitis or appendicitis may be mistaken for labor pains. It is important to remember that, if used properly, point-of-care ultrasound can narrow the dif-ferential diagnosis or redirect the clinician toward a difficult diagnosis.
IMAGE ACQUISITIONTransabdominal Imaging Transabdominal sonography is virtually always sufficient in the second and third trimester for ED exams. At this stage the gravid uterus is large relative to other organs, and a low- frequency curvilinear or phased array transducer provides adequate depth of penetration. A curvilinear transducer provides the greatest field of view and is preferable.
Transabdominal visualization of the normal second and third trimester pregnancy is typically an intuitive and straightforward process. The sonographer is aided by ample
TABLE 16.1 Indications for Point-of-Care Ultrasound in Second/Third Trimester Pregnancy
PRESENTATIONS ANATOMIC/PATHOLOGIC
Trauma Placenta location, previa
Abdominal pain Fetal lie, breech
Vaginal bleeding Cervical length
Labor Fetal cardiac activity
Free abdominal fluid
Nonobstetric conditions (cholecystitis, etc .)
FIGURE 16.1. Transabdominal Ultrasound of the Uterus Shown with a Curvilinear Transducer. The placenta is seen posterior to the fetus .
FIGURE 16.2. Transabdominal Ultrasound of the Uterus with a Phased Array Transducer. The placenta is seen anteriorly . The uterine walls can be thinner and more difficult to distinguish as the pregnancy progresses .

238 SeCtion iv / Evaluation of Pelvic Complaints
For these reasons, the tip of the transducer should reach no further than 2 to 3 cm from the cervix.
Transperineal (Translabial) Imaging Transperineal (or translabial) ultrasound, unfamiliar to most emergency physicians, may be useful in situations when the digital exam is undesirable, unclear, or contraindicated, and the transvaginal approach is unfavorable, or when an endo-cavitary probe is simply unavailable. The technique is safe in all stages of pregnancy and labor, except for the potential danger from an inexperienced clinician who may misinter-pret findings. The transperineal approach is used to visualize the lower uterine segment and cervix.
With the patient in the supine lithotomy position, a low-frequency curvilinear or phased array transducer is usually covered with a plastic barrier or glove and placed on the perineum or between the labia major and labia minora in a sagittal plane (Figs. 16.5 and 16.6) (3). This technique does not require a full bladder, but some urine makes the bladder a distinctive and useful landmark for anatomic orientation. The transducer surface should be inferior to the urethra and anterior to the vaginal orifice. The image and anatomic orientation is similar to that obtained by the transvaginal approach. The cervix is identified posterior to the bladder by its thick muscular walls and the thin line of the endocervical canal, which may appear hyperechoic or hypoechoic, but is typically a distinctive straight line (Fig. 16.7). The far field should include the internal cervi-cal os, the lower uterine segment, and some amniotic fluid. The relationship of the placenta, if present, can be noted at the internal cervical os. During labor the fetal head can be seen as well.
There is a statistically significant correlation between the digital cervical exam and the transperineal sonographic as-sessment of cervical dilation, length, and station (4). In one study, in 97% of cases (n = 184) adequate diagnostic infor-mation regarding the lower uterine segment was obtained with the transperineal approach (5). This technique has not
and cervix, as well as their position relative to the placenta (Fig. 16.4). The transvaginal approach is not recommended in the setting of premature rupture of membranes, and its use should be considered with caution in the setting of potential placenta previa, though it is not, in fact, contraindicated. In the ED a transabdominal exam should always be performed first, with the transvaginal ultrasound generally a second-line choice. Nonetheless, the combination of transabdominal and transvaginal views may provide synergistic information for an otherwise unclear diagnosis.
The technique does not differ from that described in Chapter 14, although it is advisable in later pregnancy to in-sert the transducer with careful, gentle, pressure so as not to disrupt a friable vascular structure (if concerned for placenta previa) or distort the cervix (if measuring cervical length).
FIGURE 16.3. Transabdominal Ultrasound of the Lower Uterine Segment in Sagittal Plane. The fetal head (left) is superior to the bladder (right), and the cervix is seen posterior to the bladder . The endocervical canal appears as a hyperechoic line between two hypoechoic muscular cervical walls .
FIGURE 16.4. Transvaginal Ultrasound of a Normal Second Trimester Pregnancy. The fetal head is anterior/cranial, and the placenta is seen in the posterior uterus .
Fetal head
Cervix
Placenta
FIGURE 16.5. Placement of a Curvilinear Transducer for Transperineal Ultrasound.

Chapter 16 / Second and Third Trimester Pregnancy 239
in certain circumstances, with good understanding of the technique, it may be a reasonable approach to consider.
NORMAL ULTRASOUND ANATOMYGestational DatingThere are numerous approaches to determining gestational age with ultrasound. The emergency physician requires a gesta-tional dating technique that is brief, yet reliable for clinical decision making. When faced with a patient of indeterminate gestational age, an accurate estimate of gestational age is nec-essary to anticipate the types of complications they may expe-rience, as well as to determine if the presenting complaint is related to the pregnancy or a coexisting medical condition, and to decide what management options are best for the mother and fetus. Determining age of viability by date is a major reason that emergency physicians need to have some rapid method of determining gestational age. This factor may affect decision making when the mother is in medical or traumatic distress.
In the second and third trimester, emergency physicians have several options for fetal dating: biparietal diameter (BPD), head circumference (HC), femur length (FL), and abdominal circumference (AC). The accuracy of these meth-ods varies at different stages of pregnancy, with all three de-creasing in accuracy through the third trimester, but each has been shown to have a high intra- and interobserver reliabil-ity (6,7). The ease of measurement depends on fetal lie and anatomy, as well as uterine/placental anatomy, body habitus, and the presence of fetal anomalies. In general, the emergency physician should be familiar with all three techniques, and may use any of these with reasonable reliability for the purpose of an emergency ultrasound assessment.
The three techniques outlined here are comparable, but use of multiple parameters provides a greater degree of ac-curacy. For the emergency physician, an adequate and rapid assessment may be made with whichever technique affords the greatest confidence on the part of the sonographer. How-ever, it should be noted that multiple techniques should al-ways be used for each pregnancy to ensure agreement within approximately a week to reveal any technical error on one method or an outlier result due to congenital anomalies or growth retardation.
Chervenak et al. studied 152 singleton gestations and found that HC was the best predictor of gestational age (8). Other studies have supported this finding as well, though it is still not considered an established fact (9–11). The term “fetal biometry” refers to the use of multiple techniques in combination, which produces the greatest accuracy.
Biparietal diameterBPD is an easily obtained metric with distinctive landmarks that are relatively easy to acquire. Its accuracy when used alone may be inferior, since it depends on fetal head shape, which varies more in the third trimester (8). Nonetheless, for general use in the ED, BPD is an appropriate choice for either second or third trimester dating.
BPD is measured with an axial view of the fetal head. The important landmarks are (1) the midline falx cerebri, (2) the hypoechoic central thalami, (3) the septum pellucida anterior to the thalamus, and (4) the hyperechoic bulb-like choroid plexus, which may be seen bilaterally and slightly posterior. Measuring calipers are placed at the outer skull table located
FIGURE 16.6. Transperineal Scan of the Female Pelvis. The transducer is placed in a saggital plane between the labia major and labia minora (A) . Schematic of the anatomy in the transperineal view (B) .
A
B
FIGURE 16.7. Transperineal/Translabial Ultrasound of the Lower Uterine Segment. The curvilinear transducer is placed on the labia in sagittal plane with the fetus visible in the lower uterine segment .
been validated as a point-of-care emergency ultrasound ap-plication to augment a digital cervical exam by emergency physicians, or replace it in the setting of possible previa, but

240 SeCtion iv / Evaluation of Pelvic Complaints
Femur lengthThough generally less accurate than BPD, FL can be mea-sured as early as 10 weeks and is a good choice for ED ges-tation age determination due to its simple and consistent anatomy (6,14,15). Jeanty et al. found FL to be accurate to within ±2.8 weeks at any point in pregnancy (14). The femur is located by following the knee or hip/pelvis. The spine is an easy landmark to follow down to the pelvis to locate the fe-mur from the hip. Care must be taken to align the transducer parallel exactly along the long axis of the femur (Fig. 16.11; eFig. 16.4). Only the shaft of the femur is measured from the greater trochanter to the distal femoral diaphysis. The epiphyses are excluded, and only osseus bone is measured, not cartilage. This technique is only accurate in an orthopedi-cally normal fetus; growth retardation and skeletal dysplasias will alter the calculated date. Pitfalls include nonvisualiza-tion of the entire femoral diaphysis, failure to align precisely along the long axis of the femur, measuring the epiphysis, and misidentification of other bones as the femur.
Abdominal circumferenceAbdominal circumference is obtained in the axial plane through a section of the fetal abdomen at the level of the liver. Other landmarks that should be visible are the fetal
closest to the transducer and then on the inner skull table that is furthest from the transducer. Most ultrasound devices have software applications that will calculate the gestational age based on this measurement (Figs. 16.8 and 16.9; eFig. 16.2).
Head circumferenceHC provides a simple and accurate estimate of gestational age in the second and third trimester. Even in the setting of many growth disorders that may skew other techniques, HC has acceptable accuracy (6,8,12,13). Ott reviewed 1278 cases in 710 normal pregnancies, and calculated the mean error of HC, BPD, and last menstrual period (LMP). He found the error of HC superior to both LMP and BPD (13). The proper plane in which to measure HC is essentially the same as described for BPD: an axial plane containing the thalamus, cavum septum pellucidum, and the falx cerebri. The goal is to obtain the plane of greatest anterior–posterior cranial length. Caliper cursors should be placed on the outer calvarial man-tles anterior and posterior (Fig. 16.10; eFig. 16.3) (12). Avoid including the skin overlying the skull, as this will falsely increase the calculated gestational age.
FIGURE 16.8. Technique for Gestational Dating with Biparietal Diameter. Note the measurements span from the outer table on the near field skull to the inner table of the skull that is in the far field .
FIGURE 16.9. Anatomic Landmarks for Biparietal Diameter.
FIGURE 16.10. Technique for Measuring Head Circumference. The hypoechoic thalamus is visible in the center of the head with the falx cerebri bisecting from anterior to posterior .
FIGURE 16.11. Technique for Measuring Femur Length. This a transab-dominal approach using a curvilinear transducer .

Chapter 16 / Second and Third Trimester Pregnancy 241
Fetal LieDetermining the fetal position with ultrasound is indicated when a patient is in active labor and obstetric consultation is not immediately available. The goal-directed question un-der these circumstances is whether the fetus is in vertex or breech position. If the presence of a breech position is known early, the emergency physician is able to make an informed decision on how best to proceed, for example, prepare for a breech delivery in the ED if imminent, or initiate tocolysis while arranging obstetrician involvement.
The technique is simple and intuitive. Transabdominal sonography is used to locate the position of the fetal head (Fig. 16.14). The preferable position is vertex with the head down into the pelvis and occiput anterior (Fig. 16.15). This allows the smallest part of the fetal head to exit first. If the head is difficult to locate, this may be because it is engaged in the maternal pelvis. A simplified approach is to confirm that the fetal head is not anywhere in the fundus. If the head is seen in the fundus, then the fetus is in breech position (Fig. 16.16). If the lower extremities are adjacent to the fetal head in the fundus, a frank breech is present. This is the most common type of breech presentation. In a complete breech presentation, the feet are down in the pelvis instead of upward near the fetal head in the fundus. Transverse lie will be evident when the fetal head is seen in the midlateral aspect of the uterus. In this position a shoulder presentation may be anticipated. The fetal spine is a good landmark as it produces a strikingly characteristic appearance on ultra-sound. Once located, the spine may be followed to the fetal head or pelvis. The orientation of the spine to the maternal body indicates vertical or transverse lie. It is important to remember that abnormal positions will usually self-correct as pregnancy progresses; however, in the setting of active la-bor or rupture of membranes, the emergency physician may have to anticipate a complicated delivery or indication for cesarean section.
stomach, gallbladder, and ductus venosus. The plane should be perpendicular to the spine, and ribs should be seen sym-metrically containing the area. Similar to HC, a measuring circle is arranged along the perimeter of this axial section (Fig. 16.12; eFig. 16.5). This measurement is the least ac-curate in terms of gestational dating, but most predictive of fetal growth (10). Fetal growth patterns are less concerning to the emergency physician, so this method may be useful mainly as a secondary or confirmatory application.
Fetal Cardiac ActivityAs in first trimester ultrasound, fetal heart rate (FHR) is eas-ily measured in the second and third trimester using M-mode. The fetal heart is easily identified in the chest by its rapid contractions. To measure the heart rate, first identify the fe-tal heart at a point where cardiac motion is greatest. Next, activate M-mode and identify the characteristic rapid motion tracing that stands out from other movements as a regular high-frequency repeating waveform that represents cardiac contractions. Most ultrasound units contain a FHR calcula-tion function to activate and place two caliper markers at similar points on the tracing of two adjacent heartbeats. The machine will calculate a heart rate in real time as the second caliper end is moved in place (Fig. 16.13; VIDEO 16 .1). It is difficult, but possible, to count a pulse visually. Some basic machines may not have the M-mode function, in which case a video clip of the beating heart may be recorded sim-ply as a record of fetal cardiac activity. The use of color or spectral Doppler is not recommended in pregnancy as these modalities transmit slightly greater energy than gray-scale sonography, which, theoretically, may damage vulnerable fetal cells.
While easy to perform and potentially clinically useful, analyzing FHR other than to say it is within normal limits is beyond the scope of emergency ultrasound. Tocometry is preferential for detecting changes in heart rate that may indicate fetal distress. Nonetheless, bedside ultrasound is capable of measuring FHR, and is easily repeatable to re-check the rate as circumstances dictate or if tocography is unavailable.
Portal Vein
FIGURE 16.12. Abdominal Circumference. An 18-week fetus in trans-verse plane with calipers measuring circumference at the level of the portal vein in the liver with ribs surrounding .
FIGURE 16.13. M-Mode Measurement of Fetal Heart Rate. The calipers are placed on corresponding points on two adjacent heartbeats .
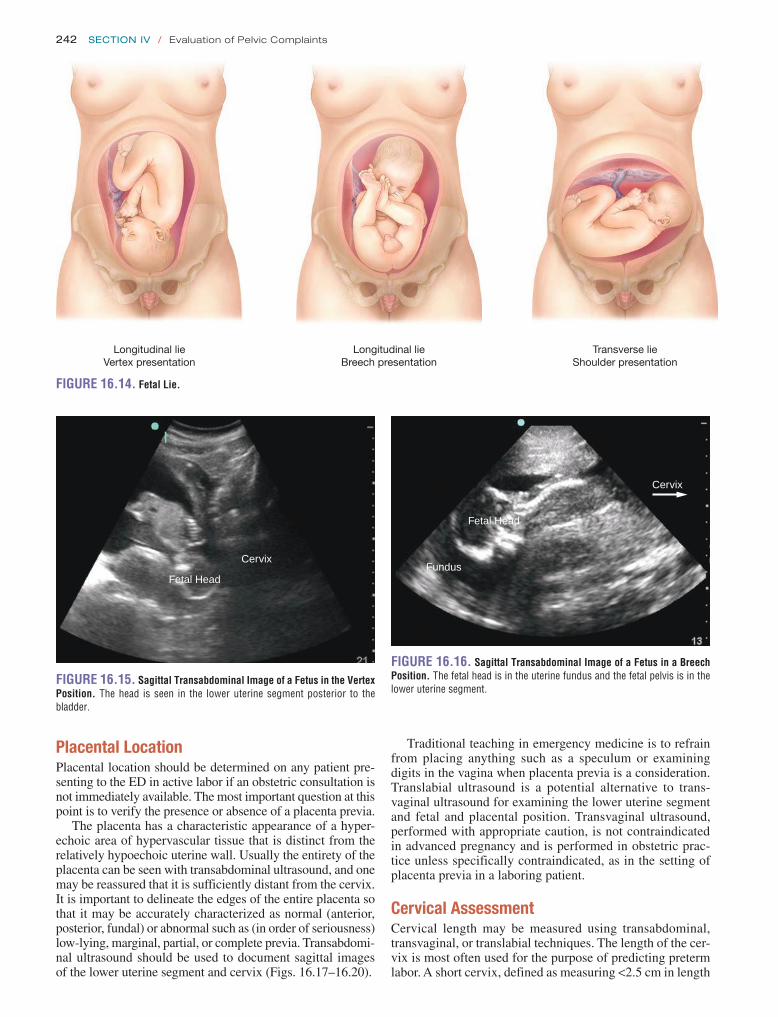
242 SeCtion iv / Evaluation of Pelvic Complaints
Placental LocationPlacental location should be determined on any patient pre-senting to the ED in active labor if an obstetric consultation is not immediately available. The most important question at this point is to verify the presence or absence of a placenta previa.
The placenta has a characteristic appearance of a hyper-echoic area of hypervascular tissue that is distinct from the relatively hypoechoic uterine wall. Usually the entirety of the placenta can be seen with transabdominal ultrasound, and one may be reassured that it is sufficiently distant from the cervix. It is important to delineate the edges of the entire placenta so that it may be accurately characterized as normal (anterior, posterior, fundal) or abnormal such as (in order of seriousness) low-lying, marginal, partial, or complete previa. Transabdomi-nal ultrasound should be used to document sagittal images of the lower uterine segment and cervix (Figs. 16.17–16.20).
Traditional teaching in emergency medicine is to refrain from placing anything such as a speculum or examining digits in the vagina when placenta previa is a consideration. Translabial ultrasound is a potential alternative to trans-vaginal ultrasound for examining the lower uterine segment and fetal and placental position. Transvaginal ultrasound, performed with appropriate caution, is not contraindicated in advanced pregnancy and is performed in obstetric prac-tice unless specifically contraindicated, as in the setting of placenta previa in a laboring patient.
Cervical AssessmentCervical length may be measured using transabdominal, transvaginal, or translabial techniques. The length of the cer-vix is most often used for the purpose of predicting preterm labor. A short cervix, defined as measuring <2.5 cm in length
Longitudinal lieVertex presentation
Longitudinal lieBreech presentation
Transverse lieShoulder presentation
FIGURE 16.14. Fetal Lie.
FIGURE 16.15. Sagittal Transabdominal Image of a Fetus in the Vertex Position. The head is seen in the lower uterine segment posterior to the bladder .
Cervix
Fetal Head
FIGURE 16.16. Sagittal Transabdominal Image of a Fetus in a Breech Position. The fetal head is in the uterine fundus and the fetal pelvis is in the lower uterine segment .
Fetal Head
Fundus
Cervix

Chapter 16 / Second and Third Trimester Pregnancy 243
FIGURE 16.17. Placental Location.
Complete Partial Marginal Low lying
FIGURE 16.18. Sagittal Transvaginal Image of a Normal Posterior/ Superior Placenta with a Fetus in Vertex Position. Note the bladder appears as an anechoic triangle just anterior to the transducer .
Bladder
Fetal Head
Placenta
Fundu
Cervix
FIGURE 16.19. Sagittal Transvaginal Ultrasound of a Vertex Fetus with an Anterior Low-Lying Placenta.
Bladder
PlacentaFetal
Cervix
before 24 weeks, predicts an increased risk of preterm labor at <35 weeks (5). Measuring cervical length has not been validated for emergent evaluation of active labor or by emer-gency physicians; however, the anatomy and technique are not overly complex, and may be useful in the ED setting. It is possible that, in the hands of practitioners less experi-enced than obstetricians, ultrasound may be more reliable than digital exam.
Regardless of approach, the cervix is identified in the sagittal plane posterior to the bladder, usually with a charac-teristic thin hyperechoic line representing the endocervical canal (Fig. 16.21). The measurement is taken from the in-ternal to external os (Fig. 16.22; eFig. 16.6). The cervix may be deformed by effacement, dilation, fluid or blood in the canal, placenta accreta, placenta previa, transvaginal trans-ducer pressure, or a distended bladder. As in the digital exam, the cervix can be assessed for effacement, which appears as
a shortened endocervical canal until it is obliterated com-pletely (Fig. 16.23). Dilation assessment appears to be more difficult and less accurate with ultrasound than with digital exam (16).
There is little data on using ultrasound to assess active cervical changes during labor; however, Ziliatni et al. stud-ied 86 patients by transperineal ultrasound during labor. They describe observing shortening of the endocervical canal with concomitant widening of the internal cervical os until complete effacement was achieved (17). In an-other study the same author evaluated 184 patients in early labor. They were able to establish absence of cervical ef-facement and dilatation in 65 patients in false labor, and measure cervical dilatation in 61 patients in early labor (5). Richey et al. found a significant correlation between digi-tal cervical examination and the transperineal sonographic assessment of cervical dilatation, length, and fetal station in 100 third trimester patients presenting to obstetrical tri-age (3). Other studies have similarly found a good correla-tion of ultrasound with digital exam of the cervix (18,19).

244 SeCtion iv / Evaluation of Pelvic Complaints
an emergent complication, most notably premature rupture of membranes, or an ongoing fetal abnormality. Reduced or increased fluid volume is associated with numerous com-plications such as poor perinatal outcomes and congenital defects (20–22).
Although there are numerous techniques to assess AFV, the simplest is the single deepest pocket (SDP) or maximum vertical pocket (MVP) technique (21). This technique entails identifying the largest pocket of fluid that does not contain a fetal extremity or umbilical cord, and measuring the vertical dimension of the pocket at a right angle to the uterine contour (Fig. 16.24; eFig. 16.7). Oligohydramnios is defined by the “1 cm rule,” meaning that <1 cm pocket depth was shown to be a good predictor of fetal growth restriction (21). Standard definitions for AFV include normal (2 to 8 cm), oligohydramnios (<2 cm), and polyhydramnios (>8 cm) (21,23).
Subjective assessment of AFV has not been shown to be accurate compared to sonographic techniques. One study of 63 pregnancies compared subjective assessment of fluid vol-ume as low, normal, or high to amniotic fluid index, SDP technique, and two-diameter pocket technique, showed that among a range of operator experience the subjective assess-ments were 65% to 70% accurate (23).
FIGURE 16.20. Sagittal Transabdominal Ultrasound of a Vertex Fetus with an Anterior Low-Lying Placenta.
PlacentaBladder
CervixFetal Head
FIGURE 16.21. Sagittal Transabdominal Image of the Lower Uterine Segment. The cervix is located just posterior to the distended anechoic blad-der . The hyperechoic endocervical canal is seen traversing laterally across the screen with the hypoechoic muscular cervical walls seen above and below .
Fetal HeadBladder
Cervix
FIGURE 16.22. Sagittal Transabdominal Measurement of Cervical Length.
This application should be used with caution in clinical decision making as further validation with emergency phy-sicians is needed.
Amniotic Fluid AssessmentAmniotic fluid volume (AFV) assessment can be a simple and relevant application in the ED. While a comprehensive sonographic fetal assessment is beyond the scope of emer-gency medicine practice, a quick and limited assessment of AFV may alert the emergency physician to the presence of
FIGURE 16.23. Sagittal Transvaginal Measurement of a Short Cervix (1.01 cm).
AnteriorFetal Head
CervixPosterior

Chapter 16 / Second and Third Trimester Pregnancy 245
and intrauterine hematoma or echogenic debris. Appropriate management at this point must include urgent obstetric con-sultation for likely dilation and evacuation versus expectant management.
Bedside ultrasound of the patient with IUFD may also demonstrate a gestational sac or hypoechoic fluid collection in the lower uterine segment, cervix, or within the vaginal vault. In these patients, clear identification of fetal structures may not be possible. The absence of fetal cardiac activity or fetal movement, combined with an abnormal position of the gestational sac, may signify an inevitable abortion or abor-tion in progress.
During the third trimester, IUFD becomes increasingly uncommon. The emergency physician sonographer, how-ever, should carefully evaluate the patient for the presence of fetal movement and fetal cardiac activity, particularly if a
PATHOLOGYAlthough the majority of patients presenting to the ED for pregnancy-related complaints during the second and third trimesters of pregnancy will have a normal intrauterine pregnancy, as well as a normal bedside ultrasound exam, a number of pathologic or atypical conditions may exist, which may require urgent or emergent intervention, consultation, or referral. These conditions include fetal abnormalities such as molar pregnancy, fetal distress or fetal demise, abnormal pla-cental position or structure, for example, placenta previa or placental abruption, or even traumatic injury to the pregnant mother, gravid uterus or fetus. Peripartum complications may also lend themselves to bedside ultrasound evaluation, including the diagnosis of nuchal cord, abnormalities of fetal position, as well as labor-related cervical changes. Uterine rupture, a potential devastating cause of both maternal and fetal mortality, may also be seen on bedside ultrasound. Patients in the early postpartum period or after certain obstet-ric procedures such as dilation and curettage, dilation and evacuation, amniocentesis or voluntary termination may present with retained products of conception, uterine perfo-ration, or other complaints appropriate for evaluation with bedside ultrasound.
Intrauterine Fetal DemiseThe diagnosis of intrauterine fetal demise (IUFD), while emotionally difficult for both patient and practitioner, is not an uncommon finding on bedside ultrasound. Although this diagnosis is more common during early pregnancy, the diagnosis of fetal demise is one with which the emergency physician should become familiar. The lack of discernable fetal cardiac activity is the clearest evidence of fetal demise. Using M-mode, the cursor is placed over the fetal heart. If no motion is identified (i.e., a flat line on M-mode), fetal demise is present (Fig. 16.25). The patient who presents with pre-mature, preterm rupture of membranes (PPROM) should be rapidly evaluated for fetal viability. An absence of amniotic fluid, combined with a contracted, misshapen, or atypical-appearing fetus, is another sign of impending or inevitable fetal demise (Fig. 16.26). In the patient with little or no am-niotic fluid, identification of the fetal spine or other fetal bony structures may help distinguish between fetal demise
FIGURE 16.24. Transabdominal Assessment of Amniotic Fluid Volume Using The Single Deepest Pocket Method. This pocket is within normal limits (2 to 8 cm) at 3 .7 cm .
FIGURE 16.25. First Trimester Fetal Demise. M-mode is used to docu-ment an absent heart beat .
FIGURE 16.26. Second Trimester Fetal Demise. Transabdominal ultra-sound of the uterus with a curvilinear transducer . A 16-week fetus with no cardiac activity is seen here with essentially no surrounding amniotic fluid, consistent with preterm premature rupture of membranes (PPROM) in the second trimester .
Placent
No Amniotic FluidFetal Head
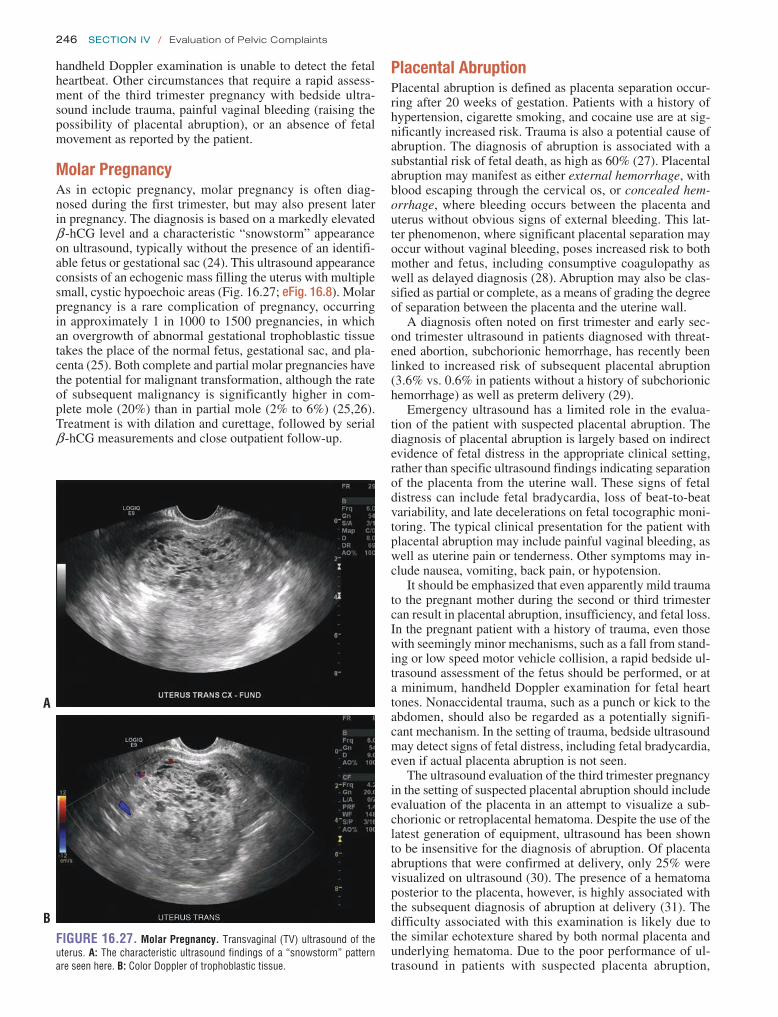
246 SeCtion iv / Evaluation of Pelvic Complaints
Placental AbruptionPlacental abruption is defined as placenta separation occur-ring after 20 weeks of gestation. Patients with a history of hypertension, cigarette smoking, and cocaine use are at sig-nificantly increased risk. Trauma is also a potential cause of abruption. The diagnosis of abruption is associated with a substantial risk of fetal death, as high as 60% (27). Placental abruption may manifest as either external hemorrhage, with blood escaping through the cervical os, or concealed hem-orrhage, where bleeding occurs between the placenta and uterus without obvious signs of external bleeding. This lat-ter phenomenon, where significant placental separation may occur without vaginal bleeding, poses increased risk to both mother and fetus, including consumptive coagulopathy as well as delayed diagnosis (28). Abruption may also be clas-sified as partial or complete, as a means of grading the degree of separation between the placenta and the uterine wall.
A diagnosis often noted on first trimester and early sec-ond trimester ultrasound in patients diagnosed with threat-ened abortion, subchorionic hemorrhage, has recently been linked to increased risk of subsequent placental abruption (3.6% vs. 0.6% in patients without a history of subchorionic hemorrhage) as well as preterm delivery (29).
Emergency ultrasound has a limited role in the evalua-tion of the patient with suspected placental abruption. The diagnosis of placental abruption is largely based on indirect evidence of fetal distress in the appropriate clinical setting, rather than specific ultrasound findings indicating separation of the placenta from the uterine wall. These signs of fetal distress can include fetal bradycardia, loss of beat-to-beat variability, and late decelerations on fetal tocographic moni-toring. The typical clinical presentation for the patient with placental abruption may include painful vaginal bleeding, as well as uterine pain or tenderness. Other symptoms may in-clude nausea, vomiting, back pain, or hypotension.
It should be emphasized that even apparently mild trauma to the pregnant mother during the second or third trimester can result in placental abruption, insufficiency, and fetal loss. In the pregnant patient with a history of trauma, even those with seemingly minor mechanisms, such as a fall from stand-ing or low speed motor vehicle collision, a rapid bedside ul-trasound assessment of the fetus should be performed, or at a minimum, handheld Doppler examination for fetal heart tones. Nonaccidental trauma, such as a punch or kick to the abdomen, should also be regarded as a potentially signifi-cant mechanism. In the setting of trauma, bedside ultrasound may detect signs of fetal distress, including fetal bradycardia, even if actual placenta abruption is not seen.
The ultrasound evaluation of the third trimester pregnancy in the setting of suspected placental abruption should include evaluation of the placenta in an attempt to visualize a sub-chorionic or retroplacental hematoma. Despite the use of the latest generation of equipment, ultrasound has been shown to be insensitive for the diagnosis of abruption. Of placenta abruptions that were confirmed at delivery, only 25% were visualized on ultrasound (30). The presence of a hematoma posterior to the placenta, however, is highly associated with the subsequent diagnosis of abruption at delivery (31). The difficulty associated with this examination is likely due to the similar echotexture shared by both normal placenta and underlying hematoma. Due to the poor performance of ul-trasound in patients with suspected placenta abruption,
handheld Doppler examination is unable to detect the fetal heartbeat. Other circumstances that require a rapid assess-ment of the third trimester pregnancy with bedside ultra-sound include trauma, painful vaginal bleeding (raising the possibility of placental abruption), or an absence of fetal movement as reported by the patient.
Molar PregnancyAs in ectopic pregnancy, molar pregnancy is often diag-nosed during the first trimester, but may also present later in pregnancy. The diagnosis is based on a markedly elevated b -hCG level and a characteristic “snowstorm” appearance on ultrasound, typically without the presence of an identifi-able fetus or gestational sac (24). This ultrasound appearance consists of an echogenic mass filling the uterus with multiple small, cystic hypoechoic areas (Fig. 16.27; eFig. 16.8). Molar pregnancy is a rare complication of pregnancy, occurring in approximately 1 in 1000 to 1500 pregnancies, in which an overgrowth of abnormal gestational trophoblastic tissue takes the place of the normal fetus, gestational sac, and pla-centa (25). Both complete and partial molar pregnancies have the potential for malignant transformation, although the rate of subsequent malignancy is significantly higher in com-plete mole (20%) than in partial mole (2% to 6%) (25,26). Treatment is with dilation and curettage, followed by serial b -hCG measurements and close outpatient follow-up.
FIGURE 16.27. Molar Pregnancy. Transvaginal (TV) ultrasound of the uterus . A: The characteristic ultrasound findings of a “snowstorm” pattern are seen here . B: Color Doppler of trophoblastic tissue .
A
B

Chapter 16 / Second and Third Trimester Pregnancy 247
the diagnosis continues to be made primarily through the presenting symptoms of painful vaginal bleeding, uterine contractions and, in later stages, signs of fetal distress. Sec-ond and third trimester ultrasound findings suggestive of ret-roplacental fluid or hematoma are an indication for urgent obstetric consultation.
Placenta PreviaPlacenta previa, an abnormality of placental position wherein the placenta implants either completely or partially cover-ing the internal cervical os, is an important cause of third trimester bleeding, placental abruption, and emergency ce-sarean delivery. The diagnosis of placenta previa on bedside ultrasound can significantly impact the subsequent obstetric management of a patient presenting with lower abdominal pain or vaginal bleeding during the second or third trimester.
Complete placenta previa occurs when the placenta com-pletely covers the internal cervical os. Partial placenta previa indicates that the internal os is partially covered by the placenta. Marginal placenta previa indicates that the placental edge is at the margin of the internal os (Fig. 16.17). A related but rare phenomenon known as vasa previa occurs when fetal vessels embedded in the amniotic membrane pass directly across the internal cervical os. Subsequent rupture of membranes or vagi-nal delivery in the setting of vasa previa may result in advertent tearing of these vessels, leading to fetal exsanguination and fetal loss. The diagnosis of vasa previa is made by identifying fetal vessels at the internal os via color Doppler (32).
Placenta previa occurs in approximately 1 in 200 pregnan-cies (1 in 100 pregnancies in women >35 years of age), and markedly increases the risk of placental abruption (up to 14 times greater risk than in patients without placenta previa) (28,31). Risk of subsequent cesarean delivery is also elevated in patients with placenta previa (up to four times greater risk). Additional risk factors for placenta previa include mul-tiparity, multiple gestations, and prior cesarean section. The risk for placenta previa is particularly increased (up to 3%) in patients with >5 prior cesarean sections (33).
Rates of placenta previa during initial ultrasound evalu-ation during the second trimester have been reportedly as high as 45%, using transabdominal scanning. A more recent study using routine transvaginal scanning between 15 and 20 weeks have reported a much lower rate of 1.1% (34). It should be noted that most patients with placenta previa diag-nosed during the second trimester go on to deliver normally, without evidence of placenta previa at delivery. A large study of over 4000 women demonstrated a low-lying placenta in 12% of patients. Of those who had an ultrasound showing a low-lying placenta after 20 weeks that did not cover the in-ternal cervical os, this study demonstrated that these patients did not go on to have placenta previa at term (35). If, how-ever, midpregnancy ultrasound does show a placenta previa, that is, covering the internal os, 40% of these patients will have placenta previa at delivery (35).
Placental migration is a term that has been used to de-scribe the resolution of placenta previa diagnosed in the second trimester that is not present at delivery. The reasons behind this apparent change in placental location are likely due to a combination of factors: difficulty defining the three-dimensional location of the placenta using two-dimensional ultrasound techniques as well as disparate rates of growth in the upper and lower uterine segments. These findings
have led some authors to suggest that in these patients with so-called “placental migration,” true chorionic villus inva-sion and placental implantation were never actually covering the internal cervical os (28).
The diagnosis of placenta previa should be suspected in any second or third trimester pregnancy where a low-lying placenta is seen. A low-lying placenta is generally defined as a placenta that extends into the lower uterine segment, within 2 cm of the internal cervical os (36,37). Partial pla-centa previa is typically diagnosed only when the internal os is at least partially dilated. In this setting, a portion of the widened internal os may be covered by the placenta. The initial ultrasound examination should begin with trans-abdominal scanning of the gravid uterus. The placenta can be identified as a thick, roughly crescent-shaped structure adherent to the inner wall of the uterus with a uniform, ho-mogenous echotexture. Between the placenta and uterine wall lies a hypoechoic rim or “retroplacental clear space,” which corresponds to a layer of dilated venous vessels in the decidua basalis (Fig. 16.28) (31). Later in pregnancy, the pla-centa may have small hypoechoic areas, “placental lakes,” as well as hyperechoic areas signifying placental calcifica-tions (38). The placenta is generally located in the anterior or posterior wall of the uterus. In patients in whom the exact location of the placenta cannot be identified, vaginal scan-ning should be performed.
Vaginal ultrasound during the second and especially dur-ing the third trimester has been regarded as a potential cause of serious bleeding in the patient with suspected placenta previa. There is a growing body of evidence to suggest that this concern is unfounded. There is no evidence to support the notion that transvaginal ultrasound increases the risk of bleeding in the evaluation of placenta previa, and multiple studies have documented its safety in this setting (39,40). The angle at which the transvaginal ultrasound probe ap-proaches the cervix is approximately 35 degrees from the axis of the cervix, toward the anterior lip of the cervix rather than toward the internal os (Figs. 16.29–16.33) (37). During the transvaginal ultrasound evaluation of the gravid uterus,
FIGURE 16.28. Decidua Basalis. Transabdominal ultrasound of the uterus with a curvilinear transducer . Note the presence of a layer of blood ves-sels posterior to the placenta . This “retroplacental clear space” demonstrates significant vascularity on power Doppler imaging . The use of power Doppler here is confined to the placenta and is not used in the assessment of the fetus .
Decidua Basalis
Placenta

248 SeCtion iv / Evaluation of Pelvic Complaints
FIGURE 16.29. Diagram Demonstrating the Relationship between the Endocavity Transducer and the Cervix in the Ultrasound Evaluation of the Patient with Placenta Previa.
T
Placenta edge
Internal cervical os
Placenta
FIGURE 16.30. Transabdominal Image of the Lower Uterine Segment. The wedge-shaped anechoic bladder is seen in the right upper quadrant of the image . The cervix is posterior to the bladder, and the placenta is seen as a slab of hyperechoic tissue that overlies the cervix .
BladderPlacenta
Lower Uterine Segment
the operator should ensure that the end of the transducer remains approximately 2 to 3 cm away from the cervix and should monitor the screen as the transducer is carefully inserted.
The accuracy of transvaginal scanning for the diagnosis of placenta previa has been reported to be as high as 96% to 98%. This exam also avoids intervening structures that may obscure the true location of the placenta, including overly-ing bowel gas, the echogenic fetal skeleton, and soft tissue related to the patient’s body habitus. Studies comparing transabdominal and transvaginal scanning for placenta previa have found the transvaginal technique to be superior.
FIGURE 16.31. Transvaginal Image Showing the Hyperechoic Placenta Overlying the Cervix, which is Identified By the Thin Straight Hyperechoic Line of the Endocervical Canal. The fetal head is noted adjacent to the placenta . In this image the bladder is empty and collapsed .
Fetal Head
Cervix
Placenta
FIGURE 16.32. Partial Previa. The cervix and endocervical canal is iden-tified just distal to the transducer tip, amniotic fluid is seen in the left upper quadrant of the image, and the placenta appears as a rounded hyperechoic tissue mass just encroaching over the endocervical canal .
Amniotic Fluid
Placenta
Cervix
Another alternative method for verification of placen-tal location is translabial or transperineal scanning. This method avoids the theoretical risk of vaginal bleeding due to direct contact with the cervix. It provides visualization of the internal cervical os superior to that obtained through transabdominal scanning. Given the superiority and safety of transvaginal scanning, however, this method should be the method of choice for definitive evaluation of patients with suspected placenta previa.
It should be noted that definitive diagnosis of placenta previa does not typically fall into the purview of emer-gency bedside ultrasound. Ultrasound findings suggestive of placenta previa, however, should be urgently communicated to a consulting obstetrician.
Nuchal CordUltrasound diagnosis of umbilical cord abnormalities, such as a nuchal cord, where the umbilical cord is wrapped around the fetus’ neck, is not a part of the routine bedside

Chapter 16 / Second and Third Trimester Pregnancy 249
of the umbilical cord in close proximity to the fetal neck might be misleading, as this finding may simply represent an adjacent loop of umbilical cord without the presence of a true nuchal cord.
Uterine PerforationUterine perforation is usually the result of an iatrogenic in-jury to the uterus, typically occurring during a procedure such as a dilation and curettage or voluntary termination of preg-nancy. While it can also occur due to a penetrating injury to the uterus from a stab wound or gunshot wound, the majority of cases occur as a result of therapeutic misadventure. The finding of uterine perforation is often not suspected during the procedure and later becomes apparent due to the subse-quent discovery of pelvic or intraperitoneal hemorrhage. In patients with a delayed presentation, life-threatening sepsis can also occur as bacterial infection spreads through the peritoneal cavity.
Ultrasound findings in the case of uterine perforation may include free intraperitoneal fluid, with or without an obvious defect in the uterine wall. Intraperitoneal or pelvic hema-toma may also be seen (Fig. 16.36). Penetrating traumatic or iatrogenic causes of uterine perforation may also cause other life-threatening intraperitoneal, retroperitoneal, or pelvic in-juries. Patients with ultrasound findings suggestive of uterine perforation, either from traumatic causes or as a procedural complication, should receive aggressive resuscitative mea-sures as well as emergent obstetric consultation.
Uterine RuptureUterine rupture is a catastrophic event that can potentially jeopardize the life of both mother and fetus. Uterine rupture can be classified as a complete rupture, involving separation of all layers of the uterus, or incomplete rupture (also known as uterine dehiscence), in which the visceral peritoneum remains intact (27). While it can occur spontaneously, it is most often seen in women with a history of prior cesarean delivery. In these patients, separation of the uterine cesarean
ultrasound assessment of the second or third trimester preg-nant female. A nuchal cord is estimated to occur in up to 20% of deliveries and is rarely a cause of adverse neonatal outcomes (41). Because of the sonolucent nature of the um-bilical vessels; it can be difficult to see on bedside ultrasound (Fig. 16.34). Additional factors such as the small size of the free-floating umbilical cord as well as fetal positioning can contribute to difficulty in the visualization of the umbilical cord (42). Color Doppler flow can assist with the diagnosis (Fig. 16.35). It should be noted that ultrasound visualization
FIGURE 16.33. Complete Previa. In this transabdominal image the pla-centa can be seen covering the entire lower uterine segment .
FIGURE 16.34. Nuchal Cord. Longitudinal image of the fetal neck with hypoechoic loops of cord seen lying across and indenting the neck .
Umbilical Cord
Fetal Neck
FIGURE 16.35. Nuchal Cord. Transverse image of the fetal neck with dis-tinct highly vascular loops seen encircling the neck as seen with color Doppler .
Fetal Neck
Umbilical Cord
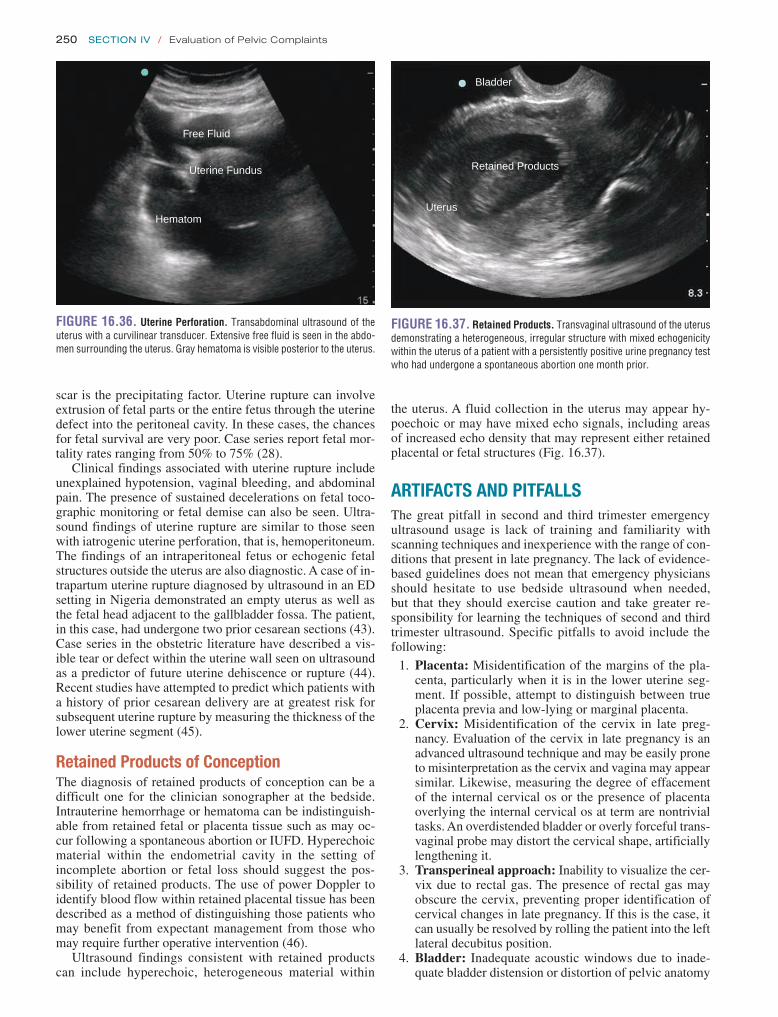
250 SeCtion iv / Evaluation of Pelvic Complaints
the uterus. A fluid collection in the uterus may appear hy-poechoic or may have mixed echo signals, including areas of increased echo density that may represent either retained placental or fetal structures (Fig. 16.37).
ARTIFACTS AND PITFALLSThe great pitfall in second and third trimester emergency ultrasound usage is lack of training and familiarity with scanning techniques and inexperience with the range of con-ditions that present in late pregnancy. The lack of evidence-based guidelines does not mean that emergency physicians should hesitate to use bedside ultrasound when needed, but that they should exercise caution and take greater re-sponsibility for learning the techniques of second and third trimester ultrasound. Specific pitfalls to avoid include the following:
1. Placenta: Misidentification of the margins of the pla-centa, particularly when it is in the lower uterine seg-ment. If possible, attempt to distinguish between true placenta previa and low-lying or marginal placenta.
2. Cervix: Misidentification of the cervix in late preg-nancy. Evaluation of the cervix in late pregnancy is an advanced ultrasound technique and may be easily prone to misinterpretation as the cervix and vagina may appear similar. Likewise, measuring the degree of effacement of the internal cervical os or the presence of placenta overlying the internal cervical os at term are nontrivial tasks. An overdistended bladder or overly forceful trans-vaginal probe may distort the cervical shape, artificially lengthening it.
3. Transperineal approach: Inability to visualize the cer-vix due to rectal gas. The presence of rectal gas may obscure the cervix, preventing proper identification of cervical changes in late pregnancy. If this is the case, it can usually be resolved by rolling the patient into the left lateral decubitus position.
4. Bladder: Inadequate acoustic windows due to inade-quate bladder distension or distortion of pelvic anatomy
scar is the precipitating factor. Uterine rupture can involve extrusion of fetal parts or the entire fetus through the uterine defect into the peritoneal cavity. In these cases, the chances for fetal survival are very poor. Case series report fetal mor-tality rates ranging from 50% to 75% (28).
Clinical findings associated with uterine rupture include unexplained hypotension, vaginal bleeding, and abdominal pain. The presence of sustained decelerations on fetal toco-graphic monitoring or fetal demise can also be seen. Ultra-sound findings of uterine rupture are similar to those seen with iatrogenic uterine perforation, that is, hemoperitoneum. The findings of an intraperitoneal fetus or echogenic fetal structures outside the uterus are also diagnostic. A case of in-trapartum uterine rupture diagnosed by ultrasound in an ED setting in Nigeria demonstrated an empty uterus as well as the fetal head adjacent to the gallbladder fossa. The patient, in this case, had undergone two prior cesarean sections (43). Case series in the obstetric literature have described a vis-ible tear or defect within the uterine wall seen on ultrasound as a predictor of future uterine dehiscence or rupture (44). Recent studies have attempted to predict which patients with a history of prior cesarean delivery are at greatest risk for subsequent uterine rupture by measuring the thickness of the lower uterine segment (45).
Retained Products of ConceptionThe diagnosis of retained products of conception can be a difficult one for the clinician sonographer at the bedside. Intrauterine hemorrhage or hematoma can be indistinguish-able from retained fetal or placenta tissue such as may oc-cur following a spontaneous abortion or IUFD. Hyperechoic material within the endometrial cavity in the setting of incomplete abortion or fetal loss should suggest the pos-sibility of retained products. The use of power Doppler to identify blood flow within retained placental tissue has been described as a method of distinguishing those patients who may benefit from expectant management from those who may require further operative intervention (46).
Ultrasound findings consistent with retained products can include hyperechoic, heterogeneous material within
FIGURE 16.36. Uterine Perforation. Transabdominal ultrasound of the uterus with a curvilinear transducer . Extensive free fluid is seen in the abdo-men surrounding the uterus . Gray hematoma is visible posterior to the uterus .
Free Fluid
Uterine Fundus
Hematom
FIGURE 16.37. Retained Products. Transvaginal ultrasound of the uterus demonstrating a heterogeneous, irregular structure with mixed echogenicity within the uterus of a patient with a persistently positive urine pregnancy test who had undergone a spontaneous abortion one month prior .
Bladder
Retained Products
Uterus

Chapter 16 / Second and Third Trimester Pregnancy 251
the emergency physician to better determine the need for such resources as transport, specialists, and ED diagnostics. These assets differ greatly among EDs. Decisions must be made as to whether a patient needs to be transferred and by what method, use of obstetric consultation, mobilization of high-level resources such as blood products, intensive care, trauma, surgery, anesthesia, or the operating room.
INCIDENTAL FINDINGSUterusArcuate vessels are normal vasculature of the uterus and on ultrasound form anechoic lakes within the myome-trium. These should not be mistaken for hemorrhage or free fluid (Fig. 16.38). Benign irregularities of the myometrium such as leiomyomas (fibroids) are frequently seen and ap-pear as bulges or rounded swellings within the uterine wall (Fig. 16.39). They may also contain round arcs or circular hyperechoic calcification if chronic. Leiomyomas often en-large during pregnancy and may be a source of significant abdominal pain (48–51).
caused by an overdistended bladder. The bladder should be full for transabdominal scan, empty for transvaginal scanning, and may be empty or partially full for trans-perineal ultrasound.
5. Transvaginal technique: Inability to identify the lower uterine segment. If difficulty is encountered identifying the lower uterine segment, take care that the endocavi-tary transducer is not inserted too deeply. Often retract-ing the transducer will provide a better field of view.
6. Placental abruption: Failure to obtain immediate ob-stetric consultation in the setting of suspected placental abruption in the third trimester pregnant patient. Do not attempt to “rule it out” with bedside ultrasound.
7. Fetal and placental abnormalities: Failure to provide information about suspected fetal or placental abnormal-ities to your consulting obstetrician. Ultrasound find-ings consistent with molar pregnancy, placenta previa, or nuchal cord can be important factors in the patient’s subsequent clinical course.
8. Trauma in pregnancy: Failure to perform serial fetal ultrasound examinations (if fetal tocographic monitoring is unavailable) in patients with a history of trauma during the second or third trimester to verify normal fetal cardiac activity. Just as the patient’s clinical status may change during their ED stay, the status of the fetus is similarly at risk.
USE OF THE IMAGE IN CLINICAL DECISION MAKINGThe role that ED ultrasound plays in decision making for patients with second and third trimester pregnancy should be approached with caution. There are currently no guide-lines for point-of-care ultrasound for these patients (47). This places greater responsibility on the emergency physician in how he or she chooses to use bedside sonography. The only boundaries that can be delineated at this time are that the exam should be emergently indicated, limited/goal-directed, and appropriate to the training and confidence level of the operator.
Within these confines the use of point-of-care ultrasound can be life-saving. In a setting where obstetric and radiologic resources are limited, point-of-care ultrasound can provide a crucial branch-point in decision making. For instance, a term pregnancy with pain and bleeding where a digital exam is con-traindicated may be found to have placenta previa, a breech fetus, rupture of membranes, or may be completely normal. The clinical presentation can then be risk stratified in three ways.
The first factor is timing. For instance, if birth is imminent or fetal parts are seen in the cervix, transfer may be unwise. If findings indicate a stable situation, then admission, await-ing obstetric services, or transfer is usually reasonable.
The second factor is severity of the presentation in ques-tion. If complete placenta previa is discovered in a term patient with bleeding and abdominal pain, the potential consequences to both mother and fetus can be severe. Blood products and resuscitation should be readied or initiated, and the nearest high-level obstetric care sought immediately. However, if there is abdominal pain, but no bleeding, and a normally lo-cated placenta, then local or ED workup can be pursued.
Finally, resources should be assessed and employed in the context of ultrasound findings. Bedside ultrasound allows
FIGURE 16.38. Arcuate Vessels. Anechoic areas of the myometrium are part of the normal vasculature of the uterus .
Uterus
Arcuate vessels
Free Fluid
FIGURE 16.39. Leiomyoma. Transvaginal sagittal image of a fibroid tumor is seen in the uterine fundus .
Fibroid
Uterine stripe

252 SeCtion iv / Evaluation of Pelvic Complaints
of the emergency physician should be the assessment and support of critical organ systems.
3. The presence of a moderate or large amount of free fluid in a postprocedure obstetric patient—especially in a pa-tient with signs of hemodynamic instability or sepsis—should suggest iatrogenic injury, such as from uterine or bowel perforation or vascular injury.
REFERENCES 1. Sanders RC. Legal problems related to obstetrical ultrasound. Ann N Y
Acad Sci. 1998;847:220–227. 2. Kotlyar S, Moore CL. Assessing the utility of ultrasound in Liberia.
J Emerg Trauma Shock. 2008;1(1):10–14. 3. Richey SD, Ramin KD, Roberts SW, et al. The correlation between
transperineal sonography and digital examination in the evaluation of the third-trimester cervix. Obstet Gynecol. 1995;85(5, pt 1):745–748.
4. Ruffin JD, Pearson J, Woods KT. The fundamentals of transperineal ul-trasound. J Diagn Med Sonog. 1992;8(4):188–192.
5. Zilianti M, Azuaga A, Calderon F, et al. Transperineal sonography in second trimester to term pregnancy and early labor. J Ultrasound Med. 1991;10(9):481– 485.
CervixThe cervix may contain anechoic nabothian cysts (Fig. 16.40). These are benign retention cysts that form from occluded cer-vical glands. No treatment or follow-up is needed. Rarely, in the case of an incompetent cervix, amniotic membranes can balloon through the cervix into the vagina. This requires follow-up and obstetric consultation if the situation is stable for outpatient management. In the case of abdominal pain and possible contractions, it may herald a premature delivery.
CLINICAL CASEAn 18-year-old woman is brought to the ED, 7 days follow-ing a 21-week elective abortion. The family reports that the patient has been confused and agitated over the last few days and has also complained of shortness of breath with fever to 102°F. On the day of her visit, the patient was noted to be unresponsive and EMS was called. On examination, the patient is minimally responsive to pain, blood pressure is 140/70 mm Hg, pulse is 165 beats per minute, and respira-tory rate is markedly tachypneic at 70 per minute. She is afebrile. The abdomen is distended, and pelvic exam shows mild bleeding from the cervical os.
Transabdominal ultrasound is performed by the ED physi-cian that demonstrates complex-appearing free fluid through-out the abdomen and pelvis (Fig. 16.41). Morison’s pouch demonstrates a clear stripe of hypoechoic fluid (Fig. 16.42). The patient is intubated and undergoes aggressive fluid re-suscitation and broad-spectrum antibiotic administration in the ED and is subsequently taken for exploratory laparotomy. Intra- operative findings reveal a 1-cm tear in the posterior uterine wall as well as >2 L of purulent material within the peritoneal cavity. The patient recovers well and is discharged after a prolonged hospitalization. This case illustrates several important points.
1. Be careful in the assessment of patients who have had recent invasive obstetric procedures. The complications of these procedures, although rare, can be serious and even life threatening.
2. In critical patients, ensure that the initial focus is on the appropriate resuscitation of the patient. The ultrasound findings may assist in the diagnosis, but the first concern
FIGURE 16.41. Uterine Perforation. Transabdominal ultrasound of the uterus with a curvilinear transducer . Extensive free fluid is seen in the abdo-men with small bowel loops seen surrounded by fluid .
FIGURE 16.40. Sagittal Transvaginal Image of a Cervix Containing a Nabothian Cyst.
Bladder Cyst
CervixFree fluid
Small bowel
Uterus
FIGURE 16.42. Uterine Perforation. Right upper quadrant coronal view of the hepatorenal recess, or Morison’s Pouch, with an anechoic stripe between the liver and kidney indicating free intraperitoneal fluid .
Liver
Free Fluid
Kidney

Chapter 16 / Second and Third Trimester Pregnancy 253
29. Norman SM, Odibo AO, Macones GA, et al. Ultrasound-detected sub-chorionic hemorrhage and the obstetric implications. Obstet Gynecol. 2010;116(2, pt 1):311–315.
30. Glantz C, Purnell L. Clinical utility of sonography in the diag-nosis and treatment of placental abruption. J Ultrasound Med. 2002;21(8):837–840.
31. Lazebnik N, Lazebnik RS. The role of ultrasound in pregnancy-related emergencies. Radiol Clin North Am. 2004;42(2):315–327.
32. Lee W, Lee VL, Kirk JS, et al. Vasa previa: prenatal diagnosis, natural evolution, and clinical outcome. Obstet Gynecol. 2000;95(4):572–576.
33. Silver RM, Landon MB, Rouse DJ, et al. Maternal morbidity as-sociated with multiple repeat cesarean deliveries. Obstet Gynecol. 2006;107(6):1226–1232.
34. Lauria MR, Smith RS, Treadwell MC, et al. The use of second-trimester transvaginal sonography to predict placenta previa. Ultrasound Obstet Gynecol. 1996;8(5):337–340.
35. Sanderson DA, Milton PJD. The effectiveness of ultrasound screen-ing at 18–20 weeks gestational age for predication of placenta praevia. J Obstet Gynaecol. 1991;11(5):320–323.
36. Elsayes KM, Trout AT, Friedkin AM, et al. Imaging of the pla-centa: a multimodality pictorial review. Radiographics. 2009; 29(5):1371–1391.
37. Oyelese Y, Smulian JC. Placenta previa, placenta accreta, and vasa previa. Obstet Gynecol. 2006;107(4):927–941.
38. Moran M, McAuliffe FM. Imaging and assessment of placental function. J Clin Ultrasound. 2011;39(7):390–398.
39. Leerentveld RA, Gilberts EC, Arnold MJ, et al. Accuracy and safety of transvaginal sonographic placental localization. Obstet Gynecol. 1990;76(5, pt 1):759–762.
40. Timor-Tritsch IE, Yunis RA. Confirming the safety of transvaginal sonography in patients suspected of placenta previa. Obstet Gynecol. 1993;81(5, pt 1):742–744.
41. Mastrobattista JM, Hollier LM, Yeomans ER, et al. Effects of nuchal cord on birthweight and immediate neonatal outcomes. Am J Perinatol. 2005;22(2):83–85.
42. Sherer DM, Manning FA. Prenatal ultrasonographic diagnosis of nuchal cord(s): disregard, inform, monitor or intervene? Ultrasound Obstet Gynecol. 1999;14(1):1–8.
43. Ogbole GI, Ogunseyinde OA, Akinwuntan AL. Intrapartum rupture of the uterus diagnosed by ultrasound. Afr Health Sci. 2008;8(1):57–59.
44. Vikhareva Osser O, Valentin L. Clinical importance of appearance of ce-sarean hysterotomy scar at transvaginal ultrasonography in nonpregnant women. Obstet Gynecol. 2011;117(3):525–532.
45. Bujold E, Jastrow N, Simoneau J, et al. Prediction of complete uterine rupture by sonographic evaluation of the lower uterine segment. Am J Obstet Gynecol. 2009;201(3):320.e1–320.e6.
46. Casikar I, Lu C, Oates J, et al. The use of power Doppler colour scoring to predict successful expectant management in women with an incom-plete miscarriage. Hum Reprod. 2012;27(3):669–675.
47. American College of Emergency Physicians. ACEP emergency ultra-sound guidelines—2001. Ann Emerg Med. 2001;38(4):470–481.
48. Laing FC, Brown DL, DiSalvo DN. Gynecologic ultrasound. Radiol Clin North Am. 2001;39(3):523–540.
49. Robboy SJ, Duggan MA, Kurman RJ, et al. Gynecologic pathology. In: Rubin E, Farber JL, eds. Pathology. Philadelphia, PA: JB Lippincott; 1988:942–989.
50. Flake GP, Anderson J, Dixon D. Etiology and pathogenesis of uterine leio-myomas: a review. Environ Health Perspect. 2003;111(8):1037–1054.
51. Hillard PJA. Benign diseases of the female reproductive tract: symp-toms and signs. In: Berek JS, Hillard PJA, Adashi EY, eds. Novak’s Gynecology. 13th ed. Philadelphia, PA: Lippincott Williams & Wilkins; 2002:351–420.
6. Hadlock FP, Harrist RB, Martinez-Poyer J. How accurate is second trimester fetal dating? J Ultrasound Med. 1991;10(10):557–561.
7. Perni SC, Chervenak FA, Kalish RB, et al. Intraobserver and interob-server reproducibility of fetal biometry. Ultrasound Obstet Gynecol. 2004;24(6):654–658.
8. Chervenak FA, Skupski DW, Romero R, et al. How accurate is fetal biometry in the assessment of fetal age? Am J Obstet Gynecol. 1998;178(4):678–687.
9. Hohler CW. Ultrasound estimation of gestational age. Clin Obstet Gynecol. 1984;27(2):314–326.
10. Degani S. Fetal biometry: clinical, pathological, and technical consider-ations. Obstet Gynecol Surv. 2001;56(3):159–167.
11. Rosati P, Guariglia L. Transvaginal fetal biometry in early pregnancy. Early Hum Dev. 1997;49(2):91–96.
12. Hill LM, Guzick D, Hixson J, et al. Composite assessment of gestational age: a comparison of institutionally derived and published regression equations. Am J Obstet Gynecol. 1992;166(2):551–555.
13. Ott WJ. The use of ultrasonic fetal head circumference for predicting expected date of confinement. J Clin Ultrasound. 1984;12(7):411–415.
14. Jeanty P, Beck GJ, Chervenak FA, et al. A comparison of sector and linear array scanners for the assessment of the fetal femur. J Ultrasound Med. 1985;4(10):525–530.
15. Hadlock FP, Harrist RB, Deter RL, et al. Fetal femur length as a predic-tor of menstrual age: sonographically measured. AJR Am J Roentgenol. 1982;138(5):875–878.
16. Eggebø TM, Økland I, Heien C, et al. Can ultrasound measurements replace digitally assessed elements of the Bishop score? Acta Obstet Gynecol Scand. 2009;88(3):325–331.
17. Zilianti M, Azuaga A, Calderon F, et al. Monitoring the effacement of the uterine cervix by transperineal sonography: a new perspective. J Ultrasound Med. 1995;14(10):719–724.
18. Mahony BS, Nyberg DA, Luthy DA, et al. Translabial ultrasound of the third-trimester uterine cervix. Correlation with digital examination. J Ultrasound Med. 1990;9(12):717–723.
19. Onderoglu LS. Digital examination and transperineal ultrasonographic measurement of cervical length to assess risk of preterm delivery. Int J Gynaecol Obstet. 1997;59(3):223–228.
20. Manning FA, Platt LD, Sipos L. Antepartum fetal evaluation: de-velopment of a fetal biophysical profile. Am J Obstet Gynecol. 1980;136(6):787–795.
21. Manning FA, Hill LM, Platt LD. Qualitative amniotic fluid volume de-termination by ultrasound: antepartum detection of intrauterine growth retardation. Am J Obstet Gynecol. 1981;139(3):254–258.
22. Ott WJ. Reevaluation of the relationship between amniotic fluid volume and perinatal outcome. Am J Obstet Gynecol. 2005;192(6):1803–1809.
23. Magann EF, Perry KG Jr, Chauhan SP, et al. The accuracy of ultrasound evaluation of amniotic fluid volume in singleton pregnancies: the effect of operator experience and ultrasound interpretative technique. J Clin Ultrasound. 1997;25(5):249–253.
24. Lazarus E, Hulka C, Siewert B, et al. Sonographic appearance of early complete molar pregnancies. J Ultrasound Med. 1999;18(9):589–594.
25. Copeland LJ, Landon MB. Malignant diseases and pregnancy. In: Gabbe SG, Niebyl JR, Simpson JL, eds. Obstetrics: Normal and Problem Pregnancies. 4th ed. New York, NY: Churchill Livingstone; 2002:1273–1275.
26. Soto-Wright V, Bernstein M, Goldstein DP, et al. The changing clinical presentation of complete molar pregnancy. Obstet Gynecol. 1995;86(5):775–779.
27. Ananth CV, Wilcox AJ. Placental abruption and perinatal mortality in the United States. Am J Epidemiol. 2001;153(4):332–337.
28. Cunningham FG, Williams JW. Williams Obstetrics. 23rd ed. New York, NY: McGraw-Hill Medical; 2010.

254
of the lower extremity venous system to evaluate for the presence of DVT. Although traditional venous compression ultrasonography is thorough and time-consuming, a limited approach that is more practical for emergency medicine prac-tice can be applied. Poppiti et al. demonstrated that limited venous ultrasound can be done with a dramatic reduction in the usual time required for a complete consultative exam, tak-ing 5.5 minutes for a targeted emergency ultrasound compared with 37 minutes for the complete vascular exam of the lower extremity (5,6). It has been shown that emergency physicians can accurately detect DVT on focused ultrasound (3,7–11). Another study showed that 2-point ultrasound performed by emergency physicians had sensitivity and specificity of 100% and 99% respectively when compared to radiology-performed ultrasounds (12). Similarly, Kline et al. found that emergency sonographers who had done at least five prior studies achieved sensitivity of 100% and specificity of 98% (13). Bernardi et al. compared a 2-point ultrasound in combination with a D-dimer assay to whole leg ultrasound. The purpose of this study was to limit the number of patients who had to return for a repeat DVT ultrasound in 1 week after a negative emergency physi-cian performed ultrasound, which is currently common prac-tice. If patients had a negative 2-point ultrasound and negative D-dimer, they did not have to return for a repeat ultrasound; however, if they had a negative 2-point ultrasound and a posi-tive D-dimer, they were advised to return in 5 to 7 days for a repeat ultrasound. This method proved to be highly accu-rate when compared to whole leg ultrasound (14). Limited emergency ultrasound is thus both accurate and fast enough to be practical for typical emergency medicine practice (3,8).
INTRODUCTIONThe possibility of a lower extremity deep venous thrombosis (DVT) is a frequent clinical concern in emergency medicine, arising in patients with varied presentations, from painless leg swelling to impending cardiopulmonary arrest. DVT and pulmonary embolus (PE) can be difficult to diagnose and carry significant morbidity and mortality. Physical exam findings have a low sensitivity for the detection of DVT (1). Historical factors can aid in risk stratification, but not ulti-mate diagnosis (2). Although there are numerous diagnostic possibilities for patients in whom a DVT is suspected, ve-nous compression ultrasonography is the most practical test for the emergency department (ED) setting.
In many institutions, consultative vascular studies are not available outside of regular business hours (3). Given this lack of availability, many clinical decision rules combining risk factor assessment and the use of a quantitative D-dimer assay have been proposed (4). These protocols decrease the need for vascular studies in low-risk patients, but still leave many patients requiring a service that is often not available. When a DVT is suspected, emergency physicians are often faced with three options: admit the patient, hold the patient in the ED awaiting the availability of venous studies, or discharge the patient after anticoagulation in the ED with arrangement for an outpatient study as soon as possible. This is especially trou-blesome for patients without primary care physicians, patients presenting early in the weekend, or patients without reliable follow-up. In response to these many concerns, emergency physicians began performing their own bedside examinations
PATHOLOGY . . . . . . . . . . . . . . . . . . . . . . . . . . . . . . . . . . . . . 258ARTIFACTS AND PITFALLS . . . . . . . . . . . . . . . . . . . . . . . . . 260USE OF THE IMAGE IN CLINICAL DECISION
MAKING . . . . . . . . . . . . . . . . . . . . . . . . . . . . . . . . . . . . . 261CORRELATION WITH OTHER IMAGING
MODALITIES . . . . . . . . . . . . . . . . . . . . . . . . . . . . . . . . . . 261INCIDENTAL FINDINGS . . . . . . . . . . . . . . . . . . . . . . . . . . . . 262CLINICAL CASE . . . . . . . . . . . . . . . . . . . . . . . . . . . . . . . . . . 262
INTRODUCTION . . . . . . . . . . . . . . . . . . . . . . . . . . . . . . . . . . 254CLINICAL APPLICATIONS . . . . . . . . . . . . . . . . . . . . . . . . . . . 255IMAGE ACQUISITION . . . . . . . . . . . . . . . . . . . . . . . . . . . . . . 255
Primary Component . . . . . . . . . . . . . . . . . . . . . . . . . . 255Secondary Component . . . . . . . . . . . . . . . . . . . . . . . . 256Consultative Technique Contrasted with
Limited Emergency Ultrasound . . . . . . . . . . . . . . . 256NORMAL ULTRASOUND ANATOMY . . . . . . . . . . . . . . . . . . . 258
J. Christian Fox and Negean Vandordaklou
Lower Extremity Venous Studies
17

Chapter 17 / Lower Extremity Venous Studies 255
8PEDIATRIC CONSIDERATIONS: Although DVT’s in the pediat-ric population are often rare, they still do occur. They are mostly related to central venous catheter complications or secondary to underlying diseases such as malignancy or genetic coagulopa-thies. Nonetheless, the emergency physician can successfully identify DVT’s in this population using the same techniques as in the adult population (15).7
CLINICAL APPLICATIONSLower extremity venous compression ultrasonography is in-dicated any time there is a suspicion of a lower extremity DVT. In terms of clinical presentation, leg pain, leg swelling, or symptoms concerning for PE may prompt a clinician to proceed with the exam. There are no absolute contraindica-tions to this noninvasive exam.
IMAGE ACQUISITIONThe bedside exam has primary and secondary components. The primary component visualizes the venous structures and detects gray-scale compressibility. The literature suggests that only the primary component can be adequately relied upon for confirming the presence or absence of a DVT (16,17). Lack of compressibility defines a DVT. The secondary component involves the use of Doppler to evaluate for abnormalities in flow. The Doppler exam is an adjunct measure of lesser im-portance. Note that the diagnosis of DVT does not rest with direct visualization of thrombus within the lumen.
Primary ComponentLower extremity studies are best performed with a high- resolution linear transducer with a frequency of 5 to 10 MHz. Use of higher frequency will give images with better resolu-tion, but lower frequency may be needed in larger patients. Depth should be adjusted based on the physical character-istics of the patient. There are several options for patient positioning, the choice of which will vary with the patient’s clinical condition, body habitus, and physician choice. Gener-ally, the patient is supine. If the patient’s hemodynamic status will allow it, placing the patient in 35 to 40 degrees of reverse Trendelenburg (head up) will increase venous distention and aid in visualization. Also, the patient’s leg can be slightly flexed at the knee and hip, and the hip externally rotated to ease visualization of the vessels (Figs. 17.1 and 17.2).
Begin the exam in the region of the common femoral vein, in the transverse plane just distal to the inguinal ligament (Fig. 17.3). Gel should be applied to the transducer or along the course of the vessel. The transverse view is first used to locate the vessel and to evaluate for compression. Once a good transverse view of both the common femoral vein and the artery is obtained (Fig. 17.4), apply direct pressure. In a normal exam, complete coaptation of the vein occurs with pressure (Figs. 17.5 and 17.6; VIDEO 17 .1). In cases in which the vein does not appear to completely compress, there are two main possibilities: (1) presence of a clot, or (2) inadequate pressure on the transducer. Adequate pressure has been applied to the vein when one can observe the artery being deformed by the pressure (Fig. 17.7; VIDEO 17 .2). Next, proceed distally and medially, following the course of the vessel (Fig. 17.2). In general, visualization of the com-mon femoral vein should continue in 1-cm increments until
FIGURE 17.1. Guide to Image Acquisition . Begin with the patient semi-recumbent, with hip externally rotated and leg slightly flexed (A) . Scan in a transverse orientation, beginning just distal to the inguinal ligament . Identify the common femoral vein, then scan distally to view the junction of the com-mon femoral, deep femoral, and superficial femoral vessels . To view the popliteal vein, begin with the patient sitting with leg dangling (B) . Scan in the popliteal fossa and identify the popliteal vein in transverse view .
A
B
the vein descends into the adductor canal, generally about two-thirds down the thigh.
Now begin evaluation of the popliteal region. If possible, have the patient dangle his/her leg off the bed to improve access to the region (Figs. 17.1B and 17.8). Apply gel to the transducer or the skin surface at the popliteal fossa. Visualize the popliteal artery and vein in the transverse view, noting that the vein is more superficial than the artery (Fig. 17.9; VIDEO 17 .3). The rhyme “the vein comes to the top in the pop” may be helpful to remember this. Then proceed with compression in 1-cm increments through-out the popliteal fossa until the division of the popliteal vein (Fig. 17.10). The popliteal vein requires significantly less pressure than the common femoral vein, and in some

256 SeCtion v / Vascular Emergencies
FIGURE 17.2. Position for the Venous Examination of the Lower Extremity . The leg is externally rotated and flexed at the knee . The line repre-sents the surface landmark of the femoral vein .
FIGURE 17.3. The Venous Study of the Lower Extremity Begins with the Femoral Vessels.
patients even the pressure from the transducer on the skin may be enough to collapse the vessel.
Secondary ComponentThe use of Doppler, while confusing at first, can provide ad-ditional useful information. Doppler measures the frequency shift from approaching and/or receding red blood cells. This can aid the emergency physician by identifying which struc-tures have flow (blood vessels) and which do not (cysts or
FIGURE 17.4. Transverse View of the Left Femoral Region Showing the Common Femoral Vein (CFV), Superficial Femoral Artery (SFA), and the Deep Femoral Artery (DFA), with Color Doppler.
fluid-filled organs). Veins have a characteristic color flow pat-tern in a normal individual. Loss of this pattern may suggest occlusion at a site directly beneath the transducer, or more proximally. There are three aspects to the Doppler exam for DVT: augmentation, spontaneity, and phasic variation. Augmentation occurs when the examiner or an assistant uses their hand to squeeze the calf while the Doppler signal is being taken. In the normal individual a blush of color fills the vein (augments); a filling defect is observed in patients with DVT (Fig. 17.11). Spontaneity is the detection of flow in the larger vessels that should occur without squeezing the calf. Variation of the venous flow that occurs during the respiratory cycle is termed phasic variation. In the normal study, the Doppler signal of the lower extremity veins increases during expira-tion and decreases during inspiration. The mechanism of this seemingly counterintuitive Doppler signal is as follows: on inspiration the diaphragm descends, causing intra-abdominal pressure to rise, compressing the vena cava and impeding ve-nous outflow from the legs. Loss of phasic variation and loss of spontaneity of flow in the face of a negative compressibility study can be a result of a clot in the inferior vena cava (IVC).
Consultative Technique Contrasted with Limited Emergency UltrasoundTraditionally, lower extremity venous Doppler studies per-formed by the department of radiology or vascular laborato-ries visualize the entire deep venous system in the affected extremity, a process that can be very time- consuming. This comprehensive method involves compressing the deep venous system of the leg in 1-cm increments, starting proximally at the level of the common femoral vein and proceeding down through the superficial femoral canal. This is followed by an evaluation of the popliteal system, extending distally to the level of the trifurcation in the upper calf. In contrast, emer-gency physicians perform a limited examination involving

Chapter 17 / Lower Extremity Venous Studies 257
Femoralartery
Femoralvein
BA
Normal,compressible
Abnormal,noncompressible
Withoutcompression
C
FIGURE 17.5. The Venous Exam . Visualize the relevant vein (A) . A normal vein will com-press with pressure (B) . No compressibility indicates an abnormal vein, consistent with a deep venous thrombosis (C) .
A
BFIGURE 17.6. A: Ultrasound showing normal uncompressed right com-mon femoral vein (CFV) . B: Ultrasound showing normal compression of right CFV . (Images courtesy of John Kendall .)
FIGURE 17.7. Ultrasound Showing Compression of the Common Femoral Vein (CFV) in Addition to Common Femoral Artery (CFA). (Image courtesy of John Kendall .)
evaluation of vein compressibility at the common femoral and popliteal veins (Fig. 17.12). This limited evaluation of the deep venous system has been shown to be adequate be-cause of the rarity with which clots are isolated to the super-ficial femoral canal. Pezzullo reviewed 146 scans that were positive for DVT and concluded that only 1% of clots were isolated to the superficial femoral canal (6,16,18). There is some debate regarding the sonography of the calf veins. At this time, it remains controversial whether the treatment of DVT’s distal to the trifurcation of the popliteal vein is neces-sary. It is thought that many of these thromboses resolve on their own. Also, the risk of an embolic event is <1% accord-ing to some studies (19).
FIGURE 17.8. The Leg is Dangled Off the Bed for the Venous Study of the Popliteal Vessels . Also note probe placement for the examination of the popliteal vessels .

258 SeCtion v / Vascular Emergencies
the external iliac vein at the level of the inguinal ligament. At the level of the inguinal ligament, the great saphenous vein (a superficial vein) merges with the common femoral vein. In relation to the companion arteries, the popliteal vein is su-perficial to the artery. The common femoral vein lies medial to the artery only in the region immediately surrounding the inguinal ligament. The vein abruptly runs posterior to the artery distal to the inguinal region.
There is limited anatomic variation in this area. Approxi-mately one-third of the population will have a duplicated popliteal vein. Additionally, although the common femoral vein is classically taught to be medial to the artery, there is some variability in its position relative to the artery. In some situations it may be necessary to confirm a venous structure. This is done by placing spectral flow Doppler onto the vein to observe for venous waveforms.
PATHOLOGYThe most common pathological finding in lower ex-tremity venous studies is noncompression of the vessel. Noncompression is the inability to completely compress the vessel with proper pressure (enough to slightly deform the artery) after ensuring good position. It is important to re-member that only complete compression of the vessel rules out DVT, and only the lack of total compression is a hard finding for DVT. Although findings such as direct visualiza-tion of clot or the absence of flow may suggest a DVT, only compression findings stand alone as rule-out/rule-in criteria (Fig. 17.13; eFig. 17.1; VIDEO 17 .4).
FIGURE 17.9. Ultrasound of the Popliteal Area in Transverse Orientation . PopA, popliteal artery; PopV, popliteal vein .
NORMAL ULTRASOUND ANATOMY The deep veins of the lower extremity include the popliteal, deep femoral, superficial femoral, and common femoral veins. It is worth noting that despite its name, the superficial femoral vein is in fact part of the deep system, not the su-perficial system. To avoid confusion, it is sometimes simply referred to as the femoral vein (Fig. 17.12). The popliteal vein is formed by the merger of the anterior and posterior tibial veins with the peroneal vein. Continuing proximally, the popliteal vein becomes the superficial femoral vein in the distal thigh. The superficial femoral vein joins the deep fem-oral vein to form the common femoral vein, which becomes
FIGURE 17.10. Popliteal Vein Division Below Popliteal Fossa.
FIGURE 17.11. Filling Defect is Seen during Augmentation . A: Transverse orientation . B: Longitudinal orientation . (Images courtesy of Karen Cosby .)
A
B

Chapter 17 / Lower Extremity Venous Studies 259
FIGURE 17.13. A: Thrombus in the common femoral vein (CFV) with lack of compression . (Image courtesy of Karen Cosby .) B: Noncompress-ible femoral vein with visible thrombus . (Image courtesy of John Kendall .) C: Noncompressible common femoral vein (CFV) . (Image courtesy of Karen Cosby .) D: Image on left demonstrates noncompressible right popliteal vein indicating presence of deep vein thrombosis (DVT) . Image on right demonstrates a fully compressible left popliteal vein .
A
A
V
L FEM COMP
A
A
L FEM
V
C
D
B
FIGURE 17.12. A: The venous sys-tem of the lower extremity . B: The entire system is visualized by traditional studies . C: The more focused exam for emergency ultrasound targets the inguinal and popliteal regions .
Common iliac vein
Common femoral veinSaphenous vein
Internal iliac vein
Deep femoral vein
Femoral vein
Popliteal vein
Posterior tibial vein
Peroneal vein
A B C
External iliac vein
Anterior tibial vein

260 SeCtion v / Vascular Emergencies
FIGURE 17.14. An Echogenic Clot in the Femoral Vein.
FIGURE 17.15. A: The common femoral vein (CFV) demonstrates artifact resembling thrombus (arrow) . B: Same CFV demonstrating full compression . GS, great saphenous vein; SFA, superficial femoral artery .
A
B
ARTIFACTS AND PITFALLS 1. In general, clot echogenicity increases with the age of
the clot (Fig. 17.14; VIDEO 17 .5). However, this is highly variable and therefore not clinically reliable. The direct visualization of clot in the lumen of the vessel is potentially misleading for three reasons. First, the flow of blood can occasionally be echogenic and therefore mimic the presence of a clot. Second, artifact can often appear as echogenic material in the vessel lumen and be mistaken for a clot (Fig. 17.15). This is especially true in larger patients. Finally, the nonvisualization of a clot does not rule out DVT because clots themselves may lack echogenicity altogether.
2. Cysts will sometimes be encountered in the popliteal region. The most common cyst seen during lower ex-tremity scanning is a Baker’s cyst in the popliteal fossa (Fig. 17.16; VIDEO 17 .6). Following the Baker’s cyst in a longitudinal plane will typically reveal its confluency with the joint space. It may be helpful in equivocal cases to help differentiate a cyst from a vessel by using Doppler.
3. In addition to misinterpretation of images, pitfalls in bedside venous ultrasonography include challeng-ing subjects and lack of understanding of the limits of bedside ultrasonography. Subjects who are obese or have significant edema are more difficult to image. In these patients, it is often necessary to use lower frequencies (3.5- to 5.0-MHz range) for tissue penetration, which decreases the image quality.
4. It is important to understand the limits of bedside ultra-sonography. The focused exam is not a complete vascu-lar study in which every vessel is interrogated along its entire course. Focused venous ultrasound is not a good choice to evaluate for isolated calf DVT. Several stud-ies suggest that calf vein DVTs can propagate to more proximal locations. Hollerweger et al. showed that the embolic frequency for isolated calf vein thrombosis and muscular calf vein thrombosis was 48% and 50%, respectively (20). In a patient for whom there exists a moderate to high clinical suspicion for DVT with a negative focused ultrasound exam, it is advisable to
FIGURE 17.16. Image of Baker’s Cyst (BC) in the Popliteal Fossa. The popliteal vein (PV) and artery (PA) are shown deep to the fluid collection . (Image courtesy of John Kendall .)

Chapter 17 / Lower Extremity Venous Studies 261
probability is assessed using the Wells criteria that take into account both historical features and physical exam findings to risk-stratify patients (Table 17.1) (22). Patients in whom there is a clinical suspicion of PE but who are either too unstable to leave the department for diagnostic testing or in whom testing is not available in a timely fashion can be evaluated at the bedside for DVT. In the appropriate clinical setting, a positive lower extremity study can strongly support the diagnosis of PE.
In many cases an emergency ultrasound can guide disposition and treatment decisions. When the vascular structures are adequately visualized but lack compressibil-ity, the diagnosis of DVT is established and treatment is indicated. If the ultrasound examination is normal (vessels are visualized and compressible), disposition depends upon the pretest probability guided by Wells criteria. Low-risk patients with normal ultrasounds can be discharged home with no need for a repeat study. If patients have moderate to high probability, two options are available. Either an al-ternative test can be done (CT, MRI, or venogram) or ar-rangements made for a follow-up ultrasound in 3 to 5 days, assuming that the patient has access to care and is reliable. If any ultrasound is indeterminate, alternative testing will be necessary.
CORRELATION WITH OTHER IMAGING MODALITIESCompression sonography remains the primary diagnostic modality in the evaluation of the lower extremity venous system. Additional modalities include contrast venography, CT, and MRI. Contrast venography is the gold standard for the diagnosis of DVT, especially for calf veins and upper extremity vessels. It is particularly helpful in differentiat-ing between acute and chronic DVT. However, venography is invasive; painful; expensive; time-consuming; cannot be performed at the bedside; and places the patient at risk for phlebitis, hypersensitivity reactions, and even DVTs (23). For these reasons, it is typically used only when other tests are nondiagnostic or unavailable.
CT has been well studied in the literature and compared to ultrasonography and contrast venography (24,25). CT pro-vides the ability to simultaneously evaluate for both PE and DVT. It is accurate; less operator-dependent; and not limited by casts, burns, open wounds, obesity, or severe pain. Also, CT enables one to visualize the opposite limb, IVC, superior vena cava, and heart. CT has the disadvantage of exposing the patient to radiation and risk of contrast reaction. In ad-dition, it requires potentially unstable patients to be moved from the ED.
MRI is an alternative seldom used by EDs. It has the abil-ity to directly image the thrombi and visualize nonocclusive clots (23). MRI is also effective for imaging pelvic, IVC, and upper extremity vessels. It can help differentiate acute from chronic DVT’s. As opposed to CT, there is no radiation, and the scan can be performed without contrast, making it useful for pregnant patients. However, an accurate study requires the active involvement of an experienced radiologist and re-sources that are often not available at all hours.
Venous ultrasound can aid in the evaluation of PE as well as DVT. In patients who are being evaluated for PE but are unable to undergo CT or ventilation perfusion scans,
obtain confirmatory studies in a timeframe in keeping with the level of clinical suspicion, in 3 to 5 days.
5. A few common technical problems may be encountered. If the vein is not visualized, pressure from the trans-ducer may be collapsing the vein. Consider lessening the transducer pressure. If that does not help, reposition the patient and check landmarks. If the vein does not compress but no clot is seen, consider repositioning the patient and/or the transducer to apply pressure from a different angle.
USE OF THE IMAGE IN CLINICAL DECISION MAKINGA focused lower extremity ultrasound exam will generate two data points for each vein: the ability to compress the vein, and Doppler findings. A normal exam will have com-plete compression of the vessel and a phasic Doppler signal that augments with distal compression. In an abnormal exam the vessel will either be able to be compressed partially, or not at all. The Doppler signal may be normal or abnormal. It is important to stress that the most important finding is the presence or absence of complete compression.
The question of whether or not a lower extremity DVT can be excluded by normal findings on a venous ultrasound was reviewed by the American College of Emergency Physi-cians Clinical Policies Subcommittee on Suspected Lower Extremity Deep Venous Thrombosis (21). Its conclusion was that in patients with a low clinical probability for DVT, negative findings on a single venous ultrasound scan in symptomatic patients exclude proximal DVT and clinically significant distal DVT. However, in patients with moderate to high pretest probability of DVT, serial ultrasound exams are needed. Furthermore, patients with a high suspicion of pelvic or IVC thrombosis may require additional imaging techniques such as contrast venography, computed tomog-raphy (CT), or magnetic resonance imaging (MRI). Pretest
TABLE 17.1 Wells Criteria
WELLS ExPLICIT ASSESSmEnT
• Active cancer• Paralysis, paresis or recent plaster, or immobilization of lower limb• Recently bedridden for more than 3 days or major surgery in the past
4 weeks or more• Localized tenderness• Entire leg swollen• Calf swelling >3 cm compared with asymptomatic leg• Pitting edema• Collateral superficial veins• Alternative diagnosis as likely or greater than deep venous thrombosis
Each positive response is 1 point, except if an alternative diagnosis is as likely or greater than deep vein thrombosis (DVT), where 2 points are deducted
Low probability: 0 or fewer pointsModerate probability: 1 to 2 pointsHigh probability: 3 or more points
From Wells PS, Anderson DR, Rodger M, et al. Excluding pulmonary embolism at the bedside without diagnostic imaging: management of patients with suspected pulmonary embolism presenting to the emergency department by using a simple clinical model and d-dimer. Ann Intern Med. 2001;135(2):98–107.

262 SeCtion v / Vascular Emergencies
popliteal vein that compressed easily, with no visible echo-genicity in the lumen ( VIDEO 17 .7). Doppler evaluation was normal. The patient was discharged home from the ED on an anti-inflammatory for presumed arthritis, and followed up for complete vascular evaluation on Thursday, to be fol-lowed by his primary physician.
The application of focused bedside ultrasound of the lower extremity saved this gentleman 3 to 4 days of unnec-essary anticoagulation or Greenfield filter, and possibly un-necessary hospitalization.
REFEREnCES 1. Kennedy D, Setnik G, Li J. Physical examination findings in deep ve-
nous thrombosis. Emerg Med Clin North Am. 2001;19:869–876. 2. Kahn SR, Joseph L, Abenhaim L, et al. Clinical prediction of deep
vein thrombosis in patients with leg symptoms. Thromb Haemost. 1999;81:353–357.
3. Blaivas M, Lambert MJ, Harwood RA, et al. Lower-extremity Doppler for deep venous thrombosis—can emergency physicians be accurate and fast? Acad Emerg Med. 2000;7:120–126.
4. Anderson DR, Wells PS, Stiell I, et al. Management of patients with sus-pected deep vein thrombosis in the emergency department: combining use of a clinical diagnosis model with D-dimer testing. J Emerg Med. 2000;19:225–230.
5. Poppiti R, Papanicolaou G, Perese S, et al. Limited B-mode venous im-aging versus complete color-flow duplex venous scanning for detection of proximal deep venous thrombosis. J Vasc Surg. 1995;22:553–557.
6. Pezzullo JA, Perkins AB, Cronan JJ. Symptomatic deep vein thrombosis: diagnosis with limited compression US. Radiology. 1996;198:67–70.
7. Theodoro D, Blaivas M, Duggal S, et al. Real-time B-mode ultrasound in the ED saves time in the diagnosis of deep vein thrombosis (DVT). Am J Emerg Med. 2004;22:197–200.
8. Jang T, Docherty M, Aubin C, et al. Resident-performed compression ultrasonography for the detection of proximal deep vein thrombosis: fast and accurate. Acad Emerg Med. 2004;11:319–322.
9. Frazee BW, Snoey ER, Levitt A. Emergency department compression ultrasound to diagnose proximal deep vein thrombosis. J Emerg Med. 2001;20:107–112.
10. Frazee BW, Snoey ER. Diagnostic role of ED ultrasound in deep venous thrombosis and pulmonary embolism. Am J Emerg Med. 1999;17:271–278.
11. Shriver S, Lyon M, Blaivas M, et al. Prospective comparison of the emergency physician-performed venous ultrasound and CT venography for deep venous thrombosis. Am J Emerg Med. 2010;28:354–358.
12. Crisp JG, Levato LM, Jang TB. Compression ultrasonography of the lower extremity with portable vascular ultrasonography can accu-rately detect deep venous thrombosis in the ED. Acad Emerg Med. 2010;56(6):601–610.
13. Kline JA, O’Malley PM, Tayal V. Emergency clinician-performed com-pression ultrasonography for DVT of lower extremity. Acad Emerg Med. 2008;52(4):437.
14. Bernardi E, Camporese G, Buller HR, et al. Serial 2-point ultrasonogra-phy plus D-dimer or whole leg color-coded Doppler ultrasonography for diagnosing suspected symptomatic DVT: a randomized controlled trial. JAMA. 2008;300(14):1653–1659.
15. Tay ET, Stone MB, Tsung JW. Emergency ultrasound diagnosis of DVT in the pediatric ED: a case series. Ped Emerg Care. 2012;28(1):90–95.
16. Lensing AW, Prandoni P, Brandjes D, et al. Detection of deep-vein thrombosis by real-time B-mode ultrasonography. N Engl J Med. 1989;320:342–345.
17. Birdwell BG, Raskob GE, Whitsett TL, et al. The clinical validity of normal compression ultrasonography in outpatients suspected of having deep venous thrombosis. Ann Intern Med. 1998;128:1–7.
18. Frederick MG, Hertzberg BS, Kliewer MA, et al. Can the US exami-nation for lower extremity deep venous thrombosis be abbreviated? A prospective study of 755 examinations. Radiology. 1996;199:45–47.
19. Rhigini M. Is it worth diagnosing and treating distal deep venous throm-bosis? J Throm Haemost. 2007;5:55–59.
the presence of a DVT on ultrasound greatly simplifies the evaluation. This can be especially helpful in an unstable, hypotensive patient in whom the rapid diagnosis of a DVT may significantly alter management. Combining the use of bedside ultrasound for DVT and bedside cardiac ultra-sound for right ventricular strain in patients unstable for CT or angiography may, in some cases, prove lifesaving (Chapter 4) (26).
INCIDENTAL FINDINGSMany patients in whom the diagnosis of DVT is considered actually have cellulitis causing their legs to be swollen. Lymph nodes, especially in the femoral region, can be mistaken for a vessel with intraluminal clot (Fig. 17.17). Lymph nodes can be differentiated from DVT’s in two ways. First, lymph nodes are superficial structures located 2 to 3 cm from the skin surface, while the deep venous system is significantly more posterior, in the range of 4 to 5 cm from the skin surface. Second, enlarged lymph nodes are highly vascularized structures and therefore exhibit high Doppler signals in contrast to a venous clot.
CLINICAL CASEA 65-year-old male presents at 7 pm on a Friday complain-ing of right leg swelling and pain, worst behind the knee, for 1 day. His medical history includes congestive heart failure and significant osteoarthritis, and a recent hospitalization for subdural hematoma. His vital signs include a heart rate of 94 beats per minute, blood pressure of 147/82 mm Hg, respira-tory rate 14 breaths per minute, oxygen saturation 95% on room air, and temperature 99.2°F. On exam, his right knee is swollen and tender to palpation in the popliteal region. The swelling appears to extend distally; however, he has 2+ edema bilaterally, making it difficult to compare. On direct measurement, the right calf measures 2.5 cm larger than the left. A focused bedside ultrasound showed a femoral and
FIGURE 17.17. A Lymph node (Arrow) can be mistaken for a Vessel with Intraluminal Clot . GS, greater saphenous vein; SFA, superficial femoral artery; CFV, common femoral vein .

Chapter 17 / Lower Extremity Venous Studies 263
24. Lim KE, Hsu WC, Hsu YY, et al. Deep venous thrombosis: comparison of indirect multidetector CT venography and sonography of lower ex-tremities in 26 patients. Clin Imaging. 2004;28:439–444.
25. Baldt MM, Zontsich T, Stumpflen A, et al. Deep venous throm-bosis of the lower extremity: efficacy of spiral CT venography compared with conventional venography in diagnosis. Radiology. 1996;200:423–428.
26. Lim KE, Hsu YY, Hsu WC, et al. Combined computed tomography ve-nography and pulmonary angiography for the diagnosis PE and DVT in the ED. Am J Emerg Med. 2004;22:301–306.
27. Wells PS, Anderson DR, Rodger M, et al. Excluding pulmonary embo-lism at the bedside without diagnostic imaging: management of patients with suspected pulmonary embolism presenting to the emergency department by using a simple clinical model and d-dimer. Ann Intern Med. 2001;135(2):98–107.
20. Hollerweger A, Macheiner P, Rettenbacher T, et al. Sonographic diag-nosis of thrombosis of the calf muscle veins and the risk of pulmonary embolism [in German]. Ultraschall Med. 2000;21:66–62.
21. American College of Emergency Physicians (ACEP) Clinical Policies Committee; ACEP Clinical Policies Subcommittee on Suspected Lower-Extremity Deep Venous Thrombosis. Clinical policy: critical issues in the evaluation and management of adult patients presenting with sus-pected lower-extremity deep venous thrombosis. Ann Emerg Med. 2003;42:124–135.
22. Wells PS, Anderson DR, Bormanis J, et al. Value of assessment of pre-test probability of deep venous thrombosis in clinical management. Lancet. 1997;350:1795–1798.
23. Kelly J, Hunt BJ, Moody A. Magnetic resonance direct thrombus im-aging: a novel technique for imaging venous thromboemboli. Thromb Haemost. 2003;89:773–782.
264
prioritize diagnostic tests and specialty consultation for con-ditions that are notoriously difficult to evaluate. For exam-ple, while aortic dissection is a true vascular emergency for which increased mortality has been linked to delay in diagno-sis, signs and symptoms suggestive of dissection are unfortu-nately insensitive (1). 8PEDIATRIC CONSIDERATIONS: Aortic dissection is very rare in normal children. However, children with underlying conditions such as Marfan syndrome, Ehlers-Danlos syndrome, collagen vascular disorders and Kawasaki disease are at risk. These children must be evaluated when they present with symptoms typically found only in adults.7 Aortic dissection can present with chest, back, or abdominal pain; syncope, acute neurological deficits, or limb ischemia (2). While most patients have hypertension, some can be de-ceptively normo- or hypotensive on presentation (2). Given the broad range of clinical presentations, aortic dissection is frequently not the leading diagnosis considered; one small retrospective series reported that emergency physicians ini-tially suspected the diagnosis in only 43% of patients with an ultimate diagnosis of aortic dissection (3). In these challeng-ing circumstances, imaging is required whenever dissection is suspected. Bedside ultrasound can detect findings suggestive of an aortic dissection, which may lead to an earlier diagnosis.
Similarly, acute arterial occlusion can present in a variety of ways, and diagnosis is often delayed. Acute arterial occlu-sion may present with severe abdominal pain and evidence of distal ischemia in the form of leg pain and paresthesias, weakness, pallor, poikilothermia, and a pulse deficit. Acute worsening of chronic ischemia may present in a more subtle
INTRODUCTIONThe bedside ultrasound examination in the patient with a sus-pected arterial emergency has continually advanced since its introduction into clinical practice. Initial exams were limited to gray scale measurements of aortic diameters in patients sus-pected of a leaking abdominal aortic aneurysm, although over time clinicians have begun to recognize the potential value of bedside ultrasound for the rapid detection of aortic dissections and disorders of the peripheral vasculature, and for evaluation of problematic dialysis access. Many emergency physicians have developed technical skills and obtained clinical expe-rience in advanced imaging techniques (color and spectral Doppler), allowing a more thorough evaluation in cases of suspected arterial emergencies. Although these applications are outside the expertise of some, with additional and focused training they are an evolving application that may expedite and prioritize the care of patients with vascular emergencies.
CLINICAL APPLICATIONSArterial vascular emergencies present in a number of forms and clinical acuities, but those most commonly evaluated by sonography include: (1) aortic dissection, (2) acute arterial occlusion, (3) pulsatile masses, and (4) nonfunctioning di-alysis access. While abdominal aortic aneurysm is also an arterial emergency, it is covered in Chapter 10.
The utility of ultrasound for vascular emergencies lies in its ability to improve diagnostic certainty, expedite care, and
Pseudoaneurysm . . . . . . . . . . . . . . . . . . . . . . . . . . . . 267Traumatic Arteriovenous Fistula . . . . . . . . . . . . . . . . . 267Renal Dialysis Access Thrombosis . . . . . . . . . . . . . . . 268
PITFALLS . . . . . . . . . . . . . . . . . . . . . . . . . . . . . . . . . . . . . . . 268Evaluation of Aortic Dissection . . . . . . . . . . . . . . . . . . 268Evaluation of the Renal Dialysis Access . . . . . . . . . . . 269
USE OF THE IMAGE IN CLINICAL DECISION MAKING . . . . . . . . . . . . . . . . . . . . . . . . . . . . . 269
COMPARISON WITH OTHER IMAGING MODALITIES . . . . . . . . . . . . . . . . . . . . . . . . . . . . . . . . . . 269
INCIDENTAL FINDINGS . . . . . . . . . . . . . . . . . . . . . . . . . . . . 269CLINICAL CASE . . . . . . . . . . . . . . . . . . . . . . . . . . . . . . . . . . 269
INTRODUCTION . . . . . . . . . . . . . . . . . . . . . . . . . . . . . . . . . . 264CLINICAL APPLICATIONS . . . . . . . . . . . . . . . . . . . . . . . . . . . 264GUIDE TO IMAGE ACQUISITION . . . . . . . . . . . . . . . . . . . . . . 265
Thoracic Aorta . . . . . . . . . . . . . . . . . . . . . . . . . . . . . . . 265Peripheral Arteries . . . . . . . . . . . . . . . . . . . . . . . . . . . . 265Renal Dialysis Access . . . . . . . . . . . . . . . . . . . . . . . . . 265
NORMAL ULTRASOUND ANATOMY . . . . . . . . . . . . . . . . . . . 266Arteries . . . . . . . . . . . . . . . . . . . . . . . . . . . . . . . . . . . . 266Renal Dialysis Access . . . . . . . . . . . . . . . . . . . . . . . . . 266
PATHOLOGY . . . . . . . . . . . . . . . . . . . . . . . . . . . . . . . . . . . . . 267Aortic Dissection . . . . . . . . . . . . . . . . . . . . . . . . . . . . . 267Arterial Occlusion . . . . . . . . . . . . . . . . . . . . . . . . . . . . 267
Caitlin Bailey, Daniel Mantuani, and Arun Nagdev
Arterial Emergencies18
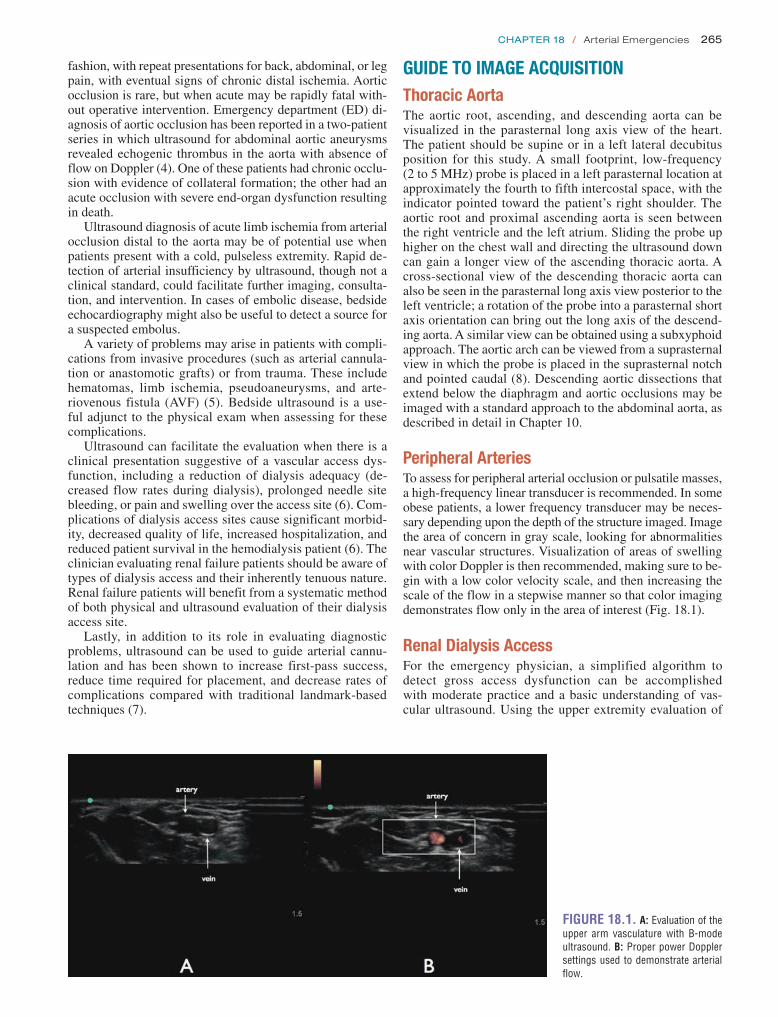
Chapter 18 / Arterial Emergencies 265
fashion, with repeat presentations for back, abdominal, or leg pain, with eventual signs of chronic distal ischemia. Aortic occlusion is rare, but when acute may be rapidly fatal with-out operative intervention. Emergency department (ED) di-agnosis of aortic occlusion has been reported in a two-patient series in which ultrasound for abdominal aortic aneurysms revealed echogenic thrombus in the aorta with absence of flow on Doppler (4). One of these patients had chronic occlu-sion with evidence of collateral formation; the other had an acute occlusion with severe end-organ dysfunction resulting in death.
Ultrasound diagnosis of acute limb ischemia from arterial occlusion distal to the aorta may be of potential use when patients present with a cold, pulseless extremity. Rapid de-tection of arterial insufficiency by ultrasound, though not a clinical standard, could facilitate further imaging, consulta-tion, and intervention. In cases of embolic disease, bedside echocardiography might also be useful to detect a source for a suspected embolus.
A variety of problems may arise in patients with compli-cations from invasive procedures (such as arterial cannula-tion or anastomotic grafts) or from trauma. These include hematomas, limb ischemia, pseudoaneurysms, and arte-riovenous fistula (AVF) (5). Bedside ultrasound is a use-ful adjunct to the physical exam when assessing for these complications.
Ultrasound can facilitate the evaluation when there is a clinical presentation suggestive of a vascular access dys-function, including a reduction of dialysis adequacy (de-creased flow rates during dialysis), prolonged needle site bleeding, or pain and swelling over the access site (6). Com-plications of dialysis access sites cause significant morbid-ity, decreased quality of life, increased hospitalization, and reduced patient survival in the hemodialysis patient (6). The clinician evaluating renal failure patients should be aware of types of dialysis access and their inherently tenuous nature. Renal failure patients will benefit from a systematic method of both physical and ultrasound evaluation of their dialysis access site.
Lastly, in addition to its role in evaluating diagnostic problems, ultrasound can be used to guide arterial cannu-lation and has been shown to increase first-pass success, reduce time required for placement, and decrease rates of complications compared with traditional landmark-based techniques (7).
GUIDE TO IMAGE ACQUISITIONThoracic AortaThe aortic root, ascending, and descending aorta can be visualized in the parasternal long axis view of the heart. The patient should be supine or in a left lateral decubitus position for this study. A small footprint, low-frequency (2 to 5 MHz) probe is placed in a left parasternal location at approximately the fourth to fifth intercostal space, with the indicator pointed toward the patient’s right shoulder. The aortic root and proximal ascending aorta is seen between the right ventricle and the left atrium. Sliding the probe up higher on the chest wall and directing the ultrasound down can gain a longer view of the ascending thoracic aorta. A cross-sectional view of the descending thoracic aorta can also be seen in the parasternal long axis view posterior to the left ventricle; a rotation of the probe into a parasternal short axis orientation can bring out the long axis of the descend-ing aorta. A similar view can be obtained using a subxyphoid approach. The aortic arch can be viewed from a suprasternal view in which the probe is placed in the suprasternal notch and pointed caudal (8). Descending aortic dissections that extend below the diaphragm and aortic occlusions may be imaged with a standard approach to the abdominal aorta, as described in detail in Chapter 10.
Peripheral ArteriesTo assess for peripheral arterial occlusion or pulsatile masses, a high-frequency linear transducer is recommended. In some obese patients, a lower frequency transducer may be neces-sary depending upon the depth of the structure imaged. Image the area of concern in gray scale, looking for abnormalities near vascular structures. Visualization of areas of swelling with color Doppler is then recommended, making sure to be-gin with a low color velocity scale, and then increasing the scale of the flow in a stepwise manner so that color imaging demonstrates flow only in the area of interest (Fig. 18.1).
Renal Dialysis AccessFor the emergency physician, a simplified algorithm to detect gross access dysfunction can be accomplished with moderate practice and a basic understanding of vas-cular ultrasound. Using the upper extremity evaluation of
FIGURE 18.1. A: Evaluation of the upper arm vasculature with B-mode ultrasound . B: Proper power Doppler settings used to demonstrate arterial flow .

266 SeCtion V / Vascular Emergencies
be thin-walled and easily compressible. B-mode is often ad-equate for the differentiation between arteries and veins. For indeterminate cases, color and/or spectral Doppler may be useful. Patients with peripheral vascular disease may demon-strate calcific deposits, which are echogenic foci with poste-rior shadowing (Fig. 18.3).
Renal Dialysis AccessNormal renal dialysis access will have no focal areas of thrombosis on gray scale and color Doppler imaging. The clinician can easily detect the difference between a graft and a fistula on ultrasound (simply by looking for the graft mate-rial), and should recognize that the graft will have one more anastomotic location (between artery and graft and then graft
radiocephalic fistula (connection between the radial artery and the cephalic vein) as an example, a stepwise evaluation will allow the clinician to detect access dysfunction. Place the patient in a supine position with the arm relaxed and slightly abducted. The ultrasound screen should be in clear view of the examiner during the exam. Focus on the arterio-venous anastomosis and proximal venous outflow, areas that have been noted to have the highest rate of stenosis. Areas of persistent postdialysis bleeding should also be examined (9). Place a linear transducer in a transverse plane across the arm. Large amounts of ultrasound gel and gentle pres-sure are important to prevent arterial and especially venous compression. In gray scale/B-mode slowly move the probe distally from 2 cm proximal to the anastomosis (on the arte-rial aspect). The anastomosis can be difficult to image sec-ondary to the nonlinear directional change. Rotation of the probe in both a clockwise and counterclockwise manner will help in evaluation of the entire anastomosis. This location is often the most difficult aspect of ultrasound imaging, but must be interrogated in detail due to the high prevalence of thrombosis. The proximal venous outflow (approximately the first 2 cm) should also be evaluated in a similar manner (B-mode and then color), looking for areas of focal narrow-ing and thrombosis. Areas of swelling or postdialysis bleed-ing should be evaluated in a similar manner (B-mode and Doppler), looking for both vascular luminal narrowing and/or aneurysmal dilatation. The goal of the focused bedside exam is to identify emergent thrombosis of the access site, not to determine subtle reductions in flow velocities that require evaluation with spectral Doppler (Fig. 18.2) (9).
A complete evaluation of dialysis access can be an exten-sive/time-consuming examination requiring B-mode, color and spectral Doppler measurements. Subtle changes in flow velocities via spectral Doppler are often difficult to assess for even experienced vascular sonographers, and serial examina-tions are often needed. Techniques to obtain peak systolic velocities in dialysis access sites are beyond the scope of this chapter (8). The emergency physician should begin with a simplified exam to screen for thrombosis, but recognize the limitations of this approach.
NORMAL ULTRASOUND ANATOMYArteriesVascular structures are straightforward to identify on ultra-sound. In cross-section, arteries are circular, thick-walled, pulsatile, echolucent structures. Conversely, veins tend to
FIGURE 18.2. Clearly Clotted Vasculature Noted in the Radial Region of a Patient with a Dialysis Artriovenous Graft . Further inspection with spectral Doppler indicated minimal flow through the graft .
FIGURE 18.3. Femoral Artery with Large Calcification.
FIGURE 18.4. A: Longitudinal B-mode evaluation of the arteriove-nous (AV) fistula/graft in an effort to determine type of shunt and location of the anastomosis . B: Transverse view at the site of anastomosis evaluating the presence of the high velocity/low resis-tance pattern on spectral Doppler .
Graft
Thrombosis

Chapter 18 / Arterial Emergencies 267
flow, typically present in chronic occlusion or Leriche syn-drome, may not be visualized on ultrasound. Distal arterial occlusion may be detected as absence of color-flow Doppler signal or pulse Doppler waveform in the artery of interest, which will vary based on clinical presentation. Echogenic thrombus may be visible within the vessel lumen (Fig. 18.7).
PseudoaneurysmPseudoaneurysms or false aneurysms are an uncommon complication from arterial puncture or trauma. Pseudoan-eurysms result when a puncture of the arterial wall fails to seal, allowing blood to extravasate from the vessel, causing a local hematoma. This contained fluid collection forms a fibrous sac outside of the vessel that communicates with the artery. Since the wall of the pseudoaneurysm is com-prised only of an unstable fibrous hematoma under high arterial pressure, risk of leakage or rupture is high. In addi-tion, an expanding pseudoaneurysm can cause local isch-emia and tissue damage as well as become a nidus for the formation of emboli. Prompt diagnosis and treatment are paramount. This contrasts with a true aneurysm in which the dilated portion of the artery contains all layers of the arterial vessel wall.
There are ultrasound features that classically characterize pseudeoaneurysms: a pulsatile mass that is separate from an adjacent artery, color flow within a tract leading from the ar-tery to the mass (neck of the pseudoaneurysm), and a swirling color-flow pattern within the mass on Doppler ultrasound (10). This swirling pattern, called the Ying-yang or To-and-fro sign, is a pattern of turbulent blood flow that is considered pathognomonic of pseudoaneurysms (Fig. 18.8) (11). The he-matoma wall of the pseudoaneurysm often has variable echo-genicity and may represent previous episodes of bleeding and rebleeding. Bedside ultrasound is able to exclude a pseudoa-neurysm and may be useful when evaluating any mass in the emergency setting ( VIDEO 18 .2). In particular, when plan-ning to incise a presumed abscess over a vascular territory (such as the groin or neck), we recommend a simple duplex examination to ensure that a pseudoaneurysm is not present.
Traumatic Arteriovenous FistulaArteriovenous fistulas (AVF) are a well-known complication of femoral artery catheterization, but are also known to occur
and vein) (Fig. 18.4). As previously mentioned, the clinician should carefully interrogate the anastamosis and proximal venous aspect, looking for thrombosis and focal narrowing. Spectral Doppler imaging will demonstrate high-velocity flow with low resistance (noted by a high diastolic compo-nent) (Fig. 18.5).
PATHOLOGYAortic DissectionAortic dissection may be visualized as an echogenic, mo-bile, linear flap within the lumen of the aorta (Fig. 18.6;
VIDEO 18 .1). It should be visualized in two views for max-imum accuracy. Color flow may be seen in the true and false lumens. If dissection is diagnosed on abdominal ultrasound, a bedside echocardiogram should be performed for evidence of ascending aortic involvement and pericardial effusion. Very few dissections are limited to the abdominal aorta.
Arterial OcclusionAortic occlusion may be visualized as echogenic thrombus within the aortic lumen, with minimal or no flow. Collateral
FIGURE 18.5. Spectral Doppler Evaluation of Brachial Atriovenous Fistula. A high flow/low resistance anastomosis is demonstrated by a high diastolic component .
FIGURE 18.6. Abdominal Aortic Dissection Noted in Both Transverse and Longitudinal Orientations.

268 SeCtion V / Vascular Emergencies
FIGURE 18.7. A: Compression B-mode to differentiate vein from artery . B: Low flow color Doppler demonstrat-ing the lack of arterial flow, with the presence of venous flow .
FIGURE 18.8. A: Neck of the pseu-doaneurysm noted . B: “Ying-Yang” sign in a pseudoaneurysm .
imaging should be performed to look for areas of clear thrombosis. After gray scale imaging, color Doppler can be utilized to determine the presence of flow. The color velocity scale must be adjusted to determine presence of flow, with many sonographers initially starting at high-flow velocities. Because the fistula is a low-pressure/high-flow connection between the arterial and venous side, high-flow velocity pa-rameters are ideal. If flow is not seen, the flow velocity scale should be reduced (indicating some type of access thrombo-sis). Power Doppler can be used if needed, but in most cases it is not necessary since low-flow states in a dialysis access are clearly not normal (Fig. 18.9).
PITFALLSEvaluation of Aortic DissectionCalcified aortic plaques may be misdiagnosed as aortic dis-section flaps, as both are echogenic lesions at the periphery of the lumen. To avoid misdiagnosis, any echogenic flap suspi-cious for aortic dissection should be imaged in two views to assess for the mobility typically present in a dissection flap.
following other invasive procedures or penetrating trauma. Accidental puncture or trauma near a vascular territory can create a communication between two vessels and ultimately lead to the formation of an AVF. While many AVFs remain asymptomatic and may spontaneously close, some patients with persistent fistulas may progress to high-output heart failure (12,13).
Scanning with Doppler ultrasound, the arterial side will have a high-velocity diastolic component that is suggestive of low-resistance flow. The venous side will have an abnormally high-velocity flow signal for a vein that may be pulsatile, re-sembling an artery (13,14). The measurement of arterial and venous velocities and flow patterns is typically beyond the scope of the emergency physician, but recognizing a pulsatile femoral vein in either two-dimensional or color mode in a patient who has undergone femoral arterial catheterization should prompt comprehensive ultrasound studies.
Renal Dialysis Access ThrombosisThe most common site of stenosis is the arteriovenous anastomosis and proximal draining veins. Initial gray scale

Chapter 18 / Arterial Emergencies 269
COMPARISON WITH OTHER IMAGING MODALITIESBedside ultrasound for vascular emergencies does not re-place the need for formal imaging. The most significant role of bedside ultrasound is to assist the clinician with a tool that facilitates the recognition and early diagnosis of con-ditions that often require mobilization of resources, and in some cases, transfer to specialty centers. Time to diagnosis is critical, and delays are unfortunately common. The ability to achieve enough diagnostic certainty to move care forward is a significant advance for frontline clinicians.
INCIDENTAL FINDINGSGiven the nonspecific symptoms of many of the arterial emergencies that may be present with dissection and ab-dominal aneurysm, bedside ultrasound may detect several alternative findings. Specifically, a pericardial effusion may be detected in the context of a Type A dissection that ruptures into the pericardial sac. Recognition of this finding is critical if there is any hope of patient survival. While acute arterial occlusion is a surgical emergency, venous thrombosis may also present with similar symptoms of leg pain and swelling. Lastly, nonarterial complications of catheter placement can also be detected, including hematoma formation and local infection (abscess or cellulitis).
CLINICAL CASEA 57-year-old male presents to the ED with a chief com-plaint of chest pain, which began suddenly 1 hour prior to arrival. The pain is sharp, 10/10, and nonradiating. It is associated with nausea and diaphoresis but not shortness of breath. The patient has a history of hypertension for which he recently stopped taking his medications. Initial vital signs include a heart rate of 112 beats per minute, blood pressure of 180/105 mm Hg, respiratory rate 22, saturation 97% on room air, and temperature 98.9°F.
Evaluation of the Renal Dialysis AccessThe clinician should minimally evaluate the anastomosis, proximal venous outflow, and areas of swelling. For patients with arteriovenous grafts, even though the venous anastomo-sis is more commonly thrombosed, the arterial anastomosis should also be evaluated to ensure lack of thrombosis. And finally, knowledge of how to operate the color-velocity scale accurately is vital for the Doppler evaluation of the arterio-venous access.
USE OF THE IMAGE IN CLINICAL DECISION MAKINGIf evidence of aortic occlusion or a dissection flap is seen on bedside ultrasound, emergent consultation should be ini-tiated. Depending on the patient’s hemodynamic stability and the capabilities of the facility, the patient might proceed to further imaging, be transported elsewhere for a higher level of care, or go directly to the operating room. If dissec-tion is suspected clinically and the bedside exam is nega-tive, more sensitive imaging should be obtained. Bedside ultrasound should not be used to exclude the diagnosis of dissection.
If there is clinical evidence of ischemia and ultrasound reveals echogenic intraluminal thrombus or cessation of flow within an artery, emergent consultation should be obtained with an appropriate specialist. If ultrasound confirms a pseudoaneurysm or traumatic AVF, further im-aging and consultation is also necessary. As with aortic dissection, bedside ultrasound may allow early detection and minimize delay to definitive therapy. Ultrasound may provide added certainty in cases where diagnosis is dif-ficult and often delayed. If renal dialysis access dysfunc-tion is suspected based on clinical findings and bedside ultrasound, it is recommended that a comprehensive study be ordered to confirm the findings. Recognition of dialysis access failure can allow the clinician to speak with con-sultants to determine the optimal access for future dialysis sessions.
FIGURE 18.9. A: Clear throm-bus noted in a patient with signs and symptoms of AV graft dysfunction . B: No flow in the graft seen on spectral Doppler .

270 SeCtion V / Vascular Emergencies
3. Sullivan PR, Wolfson AB, Leckey RD, Burke JL. Diagnosis of Acute Thoracic Dissection in the Emergency Department. Am J Emerg Med. 2000;18:46–50.
4. Roxas R, Gallegos L, Bailitz J. Rapid detection of aortic occlusion with emergency ultrasonography. Ann Emerg Med. 2011;58(1):21–23.
5. Waksman R, King SB III, Douglas JS, et al. Predictors of groin compli-cations after balloon and new-device coronary intervention. Am J Car-diol. 1995;75(14):886–889.
6. Montagnana M, Meschi T, Borghi L, et al. Thrombosis and occlusion of vascular access in hemodialyzed patients. Semin Thromb Hemost. 2011;37(8):946–954.
7. Shiloh AL, Savel RH, Paulin LM, et al. Ultrasound-guided catheter-ization of the radial artery: a systematic review and meta-analysis of randomized controlled trials. Chest. 2011;139(3):524–529.
8. Rosenberg H, Al-Rajhi K. ED ultrasound diagnosis of a type B aortic dis-section using the suprasternal view. Am J Emerg Med. 2012;30(9):2084.e1–2084.e5.
9. AIUM Practice Guideline for the Performance of a Vascular Ultrasound Examination for Postoperative Assessment of Dialysis Access. 2007. http://www.aium.org/resources/guidelines/postDialysisAccess.pdf. Accessed September 8, 2012.
10. Pero T, Herrick J. Pseudoaneurysm of the radial artery diagnosed by bedside ultrasound. West J Emerg Med. 2009;10(2):89–91.
11. Rozen G, Samuels DR, Blank A. The to and fro sign: the hallmark of pseudoaneurysm. Isr Med Assoc J. 2001;3(10):781–782.
12. Malík J, Holaj R, Krupicková Z, et al. Arteriovenous fistula after femoral artery puncture leading to pulmonary edema: the role of ultrasonogra-phy. Prague Med Rep. 2012;113(1):49–52.
13. Thalhammer C, Kirchherr AS, Uhlich F, et al. Postcatheterization pseudo-aneurysms and arteriovenous fistulas: repair with percutaneous implan-tation of endovascular covered stents. Radiology. 2000;214(1):127–131.
14. Mittal SR. Radial arterio-venous fistula following transradial coronary angiography. J Assoc Physicians India. 2011;59:597–598.
On physical examination, the patient appears in acute distress from pain. His mucous membranes are dry. No murmur is auscultated and lung sounds are clear. Radial pulses are 2+ bilaterally. There is no abdominal pain or peripheral edema. The skin is diaphoretic.
IV access is established, and the patient is given morphine for pain. An electrocardiogram (EKG) reveals sinus tachy-cardia, left ventricular hypertrophy, and nonspecific T wave changes in the lateral leads. A portable chest x-ray shows no cardiomegaly or infiltrate. A bedside echocardiogram is performed, which demonstrates a pericardial effusion with good systolic function. Because of concerns for an aor-tic dissection, bedside evaluation of the aorta is performed demonstrating a mobile dissection flap in the ascending and descending aorta visible distal to the valve in the parasternal long and suprasternal notch views. An esmolol drip is initi-ated immediately for blood pressure control, and surgery is emergently consulted. Operating room staff is notified while the patient is transported for computed tomography (CT) an-giography, which confirms a Type A dissection. The patient proceeds directly to the OR for operative repair (Fig. 18.10).
REFERENCES 1. Jamieson WR, Munro AI, Miyagishima RT, et al. Aortic dissection: early
diagnosis and surgical management are the keys to survival. Can J Surg. 1982;25(2):145–149.
2. Hagan PG, Nienaber CA, Isselbacher EM, et al. The International Regis-try of Acute Aortic Dissection (IRAD): new insights into an old disease. JAMA. 2000;283(7):897–903.
FIGURE 18.10. A: Parasternal long view with a dissection flap noted in the descending thoracic aorta and a de-pendent pericardial effusion . B: Aortic dissection flap noted in the abdomen .

271
Ultrasound can facilitate the recognition and diagnosis of:
1. Testicular torsion 2. Epididymitis and orchitis 3. Testicular fracture 4. Scrotal masses (including hydroceles, solid tumors, and
hernias)
Testicular TorsionTesticular torsion represents a true surgical emergency, and any patient with acute scrotal pain or swelling should be suspected to have torsion until proven otherwise. Patients with a bell-clapper deformity lack the normal posterior fixation of the testicle to the scrotal wall, and thus twist-ing and torsion are more likely. Testicular torsion results from the twisting of redundant spermatic cord on its pedun-culated blood supply, causing testicular ischemia. Venous thrombosis then occurs, followed by arterial thrombosis. The degree of twisting of the testicle about its axis affects how rapidly testicular infarction can occur. In an animal model, 90 degrees of torsion caused no testicular necro-sis at 7 days, 360 degrees of torsion resulted in necrosis in 12 to 24 hours, and 1440 degrees of torsion caused necro-sis in 2 hours (13). It is generally thought that rotation of at least 450 degrees is needed to cause complete testicular torsion (14). In addition, spontaneous torsion–detorsion and incomplete torsion can occur. Torsion occurs at two age peaks, the first during infancy, and the second during
INTRODUCTIONThe patient presenting to the emergency department (ED) with acute scrotal pain represents a high-risk, time-urgent complaint. The differential diagnosis includes testicular tor-sion (with potential organ loss and loss of fertility) epididy-mitis, orchitis, trauma, hemorrhage, and tumor. The signs, symptoms, and physical findings of these conditions are nonspecific and do not discriminate between disease states. One series demonstrated that in up to 50% of cases of acute scrotal pain, the diagnosis could not be made on the basis of history, physical exam, and lab work alone (1). Diagnostic im-aging is often necessary. Testicular ultrasound with power and spectral Doppler has become the imaging modality of choice in patients with acute scrotal pain or swelling (2–9). Emer-gency physicians can utilize the increased availability of bed-side ultrasound in the ED to expedite patient care and prompt referral to specialists. Studies have shown that emergency physicians with expertise in ultrasound can accurately iden-tify and discriminate causes of the acute scrotum compared to radiology-based studies and surgical findings (10–12).
CLINICAL APPLICATIONSTesticular ultrasound is useful for the evaluation of:
1. Acute scrotal pain 2. Scrotal mass 3. Scrotal trauma
Testicular Trauma . . . . . . . . . . . . . . . . . . . . . . . . . . . . 276Extratesticular Causes of Scrotal Swelling or Masses . . . 277Scrotal Hernia . . . . . . . . . . . . . . . . . . . . . . . . . . . . . . . 277
ARTIFACTS AND PITFALLS . . . . . . . . . . . . . . . . . . . . . . . . . 278Artifacts . . . . . . . . . . . . . . . . . . . . . . . . . . . . . . . . . . . . 278Pitfalls . . . . . . . . . . . . . . . . . . . . . . . . . . . . . . . . . . . . . 279
USE OF THE IMAGE IN CLINICAL DECISION MAKING . . . . . 279CORRELATION WITH OTHER IMAGING MODALITIES . . . . . . 280INCIDENTAL FINDINGS . . . . . . . . . . . . . . . . . . . . . . . . . . . . 281
Testicular Mass . . . . . . . . . . . . . . . . . . . . . . . . . . . . . . 281Microlithiasis . . . . . . . . . . . . . . . . . . . . . . . . . . . . . . . . 281
CLINICAL CASES . . . . . . . . . . . . . . . . . . . . . . . . . . . . . . . . . 282Case 1 . . . . . . . . . . . . . . . . . . . . . . . . . . . . . . . . . . . . . 282Case 2 . . . . . . . . . . . . . . . . . . . . . . . . . . . . . . . . . . . . . 282
INTRODUCTION . . . . . . . . . . . . . . . . . . . . . . . . . . . . . . . . . . 271CLINICAL APPLICATIONS . . . . . . . . . . . . . . . . . . . . . . . . . . . 271
Testicular Torsion . . . . . . . . . . . . . . . . . . . . . . . . . . . . 271Epididymitis and Orchitis . . . . . . . . . . . . . . . . . . . . . . . 272Scrotal Trauma . . . . . . . . . . . . . . . . . . . . . . . . . . . . . . 272Scrotal Masses . . . . . . . . . . . . . . . . . . . . . . . . . . . . . . 272
IMAGE ACQUISITION . . . . . . . . . . . . . . . . . . . . . . . . . . . . . . 272Ultrasound Technique . . . . . . . . . . . . . . . . . . . . . . . . . 272Scanning Protocol . . . . . . . . . . . . . . . . . . . . . . . . . . . . 273Doppler . . . . . . . . . . . . . . . . . . . . . . . . . . . . . . . . . . . . 274
NORMAL ULTRASOUND ANATOMY . . . . . . . . . . . . . . . . . . . 275PATHOLOGY . . . . . . . . . . . . . . . . . . . . . . . . . . . . . . . . . . . . . 275
Epididymitis and Orchitis . . . . . . . . . . . . . . . . . . . . . . . 275Testicular Torsion, Ischemia, and Infarction . . . . . . . . 276
Paul R. Sierzenski and Stephen J. Leech
Scrotal Emergencies19

272 Section Vi / Scrotal Emergencies
puberty. However, the emergency physician must still con-sider the diagnosis of torsion after puberty, as up to 20% of cases occur postpubescently (15).
Prompt diagnosis and treatment lead to higher salvage rates. Reported salvage rates range from 80% to 100% for patients treated within 6 hours of symptom onset, 70% to 83% between 6 and 12 hours, and 20% to 80% after 12 hours (16–19). No successful testicular salvage has been reported after 48 hours of torsion (19).
Epididymitis and OrchitisEpididymitis is the most common cause of acute scrotal pain in adults and also represents the most common misdiagnosis in cases of missed testicular torsion (20). This misdiagno-sis usually occurs in men under age 35, in whom testicular torsion and epididymitis are both common. Epididymitis occurs in patients of all ages, from infants to the elderly. It can result from either viral or bacterial infection with inflammation.
In most cases, epididymitis is caused by extension of infection from the lower urinary tract. In men under 35 years, epididymitis is most often a sexually transmitted disease, with Chlamydia trachomatis or Neisseria gonor-rhoeae as common etiologic agents. In older males, epi-didymitis is usually caused by gram-negative pathogens as a result of a urinary tract infection or recent urinary instru-mentation (20). Occasionally, epididymitis results from trauma, and some cases are idiopathic with no definite cause. Severe cases of epididymitis can result in abscess formation.
Orchitis is an acute infection of the testis and usually follows an initial episode of epididymitis. The infectious agents implicated in orchitis are similar to those that cause epididymitis. In some cases, an isolated orchitis occurs in the setting of viral infection. Several etiologic agents have been implicated, with mumps being the most common cause.
Scrotal TraumaDirect trauma to the scrotum can result in contusion, hema-toma formation, testicular fracture, torsion, and testicular dislocation. Ultrasound is helpful in defining the location and extent of injury and helps to guide management. When the tunica albuginea is ruptured, surgical intervention is required to repair the tunica, and to prevent an autoimmune reaction against the testicle and resultant sterility (21).
Scrotal MassesUltrasound is very sensitive for the identification of scrotal masses, and can help differentiate intratesticular masses from extratesticular masses. The majority of extratesticular masses are benign, while intratesticular masses must be presumed to be neoplastic until proven otherwise. Testicular cancer ac-counts for 1% to 2% of all malignant tumors in men and is the fifth leading cause of death in men aged 15 to 34 years (22). The majority of testicular tumors are of germ cell origin; seminoma is the most common cell type. If ultrasound dem-onstrates an intratesticular mass, urgent urologic consulta-tion is required. Common extratesticular scrotal masses include hydroceles, spermatoceles, varicoceles, and inguinal hernias.
IMAGE ACQUISITIONUltrasound TechniqueThe patient should be placed in a supine position and made as comfortable as possible. The scrotum is elevated and im-mobilized by a towel rolled and placed between the patient’s thighs behind the scrotum (Fig. 19.1). The penis should be folded back onto the patient’s abdomen and covered with a towel. Ample amounts of warm gel should be used. A high-frequency linear array transducer provides the greatest detail and resolution (Fig. 19.2). Frequencies used range from 5 to 10 MHz, with lower frequencies being reserved for settings where increased tissue penetration and depth of field are needed. In some circumstances a standard curved transducer is required due to scrotal swelling and the need to image to a greater depth ( VIDEO 19 .1).
FIGURE 19.1. Patient Preparation for Testicular Ultrasound . Note the scrotum is supported for patient comfort and to facilitate testicular scanning .
FIGURE 19.2. A Linear High Frequency Transducer. (Courtesy of Sono Site, Inc . Vothell, WA .)

chapter 19 / Scrotal Emergencies 273
Scanning ProtocolWhen scanning the scrotum it is important to start with the unaffected testicle. This will allow for comparison of size, texture, and echogenicity between the testicles, as well as allowing for the Doppler settings to be oriented toward the unaffected side. A standard protocol should be followed to completely visualize the scrotal contents. Both testicles should be scanned in their entirety in the sagittal and trans-verse planes. In addition, a transverse view across the median raphe should be included to compare the gray scale anatomy and blood flow patterns between testicles (Fig. 19.3).
The normal sonographic appearance of the testicle has been described as similar to the liver, with a homogeneous, uniform echogenic pattern (Fig. 19.4). The mediastinum testis appears as a bright echogenic band running in the long axis of the testicle (Fig. 19.5). Attention should also be focused in the epididymis as it courses superiorly and posterior to the testicle (Fig. 19.6). Sonographically, the epi-didymis is usually isoechoic when compared to the testicle.
FIGURE 19.3. Transducer Placement for Ultrasound of the Testicle . a, sagittal orientation; b, transverse view; c, transverse comparative view of both testicles .
b.
c.
a.
FIGURE 19.5. Sagittal Image of Normal Testis Showing Mediastinum Testis as an Echogenic Band (Arrows).
FIGURE 19.6. Normal Testis . Sagittal B-mode image of a normal testis showing testicle (T ) and epididymis (E ) .
FIGURE 19.4. Transverse Comparative View . Transverse bilateral view of normal testes in B-mode allows comparison of testicular echotexture as well as a side-by-side comparison of color Doppler imaging .
The head is the most prominent portion, and the body and tail may be difficult to clearly visualize in its normal state.
After a thorough survey of the testicle in B-mode imag-ing, color or power Doppler should be used to identify in-tratesticular vessels (Fig. 19.7). This is best achieved in the transverse plane near the mediastinum testis. Spectral Dop-pler interrogation should then be used to identify both arte-rial and venous waveforms. It is important to demonstrate both arterial and venous flow to exclude testicular torsion with a high degree of certainty. Side-by-side comparisons should be performed to assess for symmetric flow, and any difference noted should raise the clinician’s suspicion for an incomplete torsion or torsion–detorsion.
The spermatic cord is located superior to the testicle. Arterial waveforms obtained in this area will have a high resistive pattern consistent with peripheral vessels. The sper-matic cord should be surveyed for evidence of a varicocele if clinical suspicion exists (Fig. 19.8).

274 Section Vi / Scrotal Emergencies
ultrasound, the detection of flow is the most important use of Doppler, and the increased sensitivity in detecting lower-flow states makes power Doppler imaging preferable to color Doppler for the evaluation of the testicles and scrotum.
Color and power Doppler are both helpful in identifying flow and excluding complete testicular torsion from arterial compromise. It is important to note that partial torsion, or early torsion where venous occlusion is the principal finding, is best excluded using spectral Doppler with the identification of venous flow by the presence of a spectral venous waveform. Spectral Doppler allows quantification of velocities and differ-entiates between arterial and venous blood flow (Figs. 19.9 and 19.10). The centripetal testicular arteries have a characteristic low-resistive pattern, with a low systolic peak and a wide dia-stolic peak. The testicular veins display a low-flow, phasic pat-tern (Fig. 19.10). It is important to document both arterial and venous waveforms during an exam for possible torsion. During torsion, the venous flow pattern is lost first, followed by damp-ening of the arterial waveform, and then all flow to the testicle is lost. By seeing both arterial and venous spectral waveforms, torsion and incomplete torsion can be essentially ruled out.
Doppler settings should be adjusted to allow for maxi-mum sensitivity. Physicians should review the adjustable Doppler parameters with the applications specialist for their ultrasound equipment. Briefly, the wall filter eliminates or diminishes unwanted echoes that occur from vessel wall mo-tion. The pulse repetition frequency (PRF) helps to determine
DopplerAn understanding of Doppler ultrasound is crucial to evalu-ating the patient with suspected testicular torsion or scrotal pain. The ultrasound transducer emits and receives ultrasound frequencies; the central processing unit in turn converts the signal into ultrasound images. When an ultrasound wave strikes a moving object, such as a blood cell inside a vessel, shifting of the original ultrasound frequency occurs. The dif-ference between the original and returned frequency is known as Doppler shift. The magnitude of the frequency shift is dependent on the angle at which sound strikes the moving object, as well as the direction and speed of the object. The usual frequency range of Doppler frequency shifts that occurs in normal circumstances in situations involving blood flow is measured in kilohertz. These shifts can provide important diagnostic information regarding flow in the testicle.
Two main types of Doppler are used in scanning the tes-ticles, color Doppler imaging (CDI) and spectral Doppler. CDI displays Doppler shift overlaid on a gray scale B-mode image, which provides information regarding flow velocity and flow direction. Colors are assigned to velocities either to-ward or away from the transducer, with the intensity of color increasing with increased velocity. Shift toward the trans-ducer is color coded in one color, and shift away from the transducer is coded in another. Power color Doppler displays only the intensity of the Doppler shift, without information regarding the direction of shift (Fig. 19.7). In testicular
FIGURE 19.8. Spermatic Cord . Note the complexity of the spermatic cord and the lie of the testicle, consistent with a twisted spermatic cord .
FIGURE 19.9. Arterial Spectral Doppler . Directional color and spec-tral Doppler waveform is displayed . A normal arterial spectral waveform is demonstrated .
FIGURE 19.10. Venous Spectral Doppler . A venous spectral Doppler wave-form from a normal testicle is displayed . A continuous waveform is visualized .
FIGURE 19.7. Color Doppler Imaging (CDI) . Power Doppler showing tes-ticular blood flow . Power Doppler displays color-coding in one color that can vary with the velocity of flow, but is not directionally dependent . (Courtesy of Phillips, Andover, MA .)

chapter 19 / Scrotal Emergencies 275
measures 1 to 1.2 cm in diameter (Fig. 19.6). The epididy-mis eventually becomes the vas deferens as it courses supe-riorly into the spermatic cord. The spermatic cord contains the testicular artery, cremasteric artery, pampiniform plexus, lymphatic structures, and genitofemoral nerve (Fig. 19.11).
The testicular artery is the primary arterial blood supply of the testicles and is a direct branch of the abdominal aorta. After entering the scrotum, the testicular artery runs poste-riorly to the testicle and forms capsular arteries that run just beneath the tunica albuginea. The capsular arteries give off centripetal branches that run toward the mediastinum testis. Additional blood supply to the scrotum is provided by the cremasteric and deferential arteries that supply the epididy-mis, vas deferens, and peritesticular tissues. Both of these arteries anastomose with the testicular artery, but their con-tribution to testicular blood flow is minimal. Testicular veins flow from the mediastinum testis outward to the pampiniform plexus in the spermatic cord. The right testicular vein empties directly into the inferior vena cava, while the left testicular vein empties into the left renal vein before draining into the inferior vena cava. As with other solid organs, the testicle has a low-resistive arterial waveform on spectral Doppler.
PATHOLOGYEpididymitis and OrchitisEpididymitis with or without orchitis represents a spectrum of testicular inflammation that is the most common diagnosis in patients presenting to the ED with testicular pain, swelling, or mass (20). Though epididymitis is the most common diag-nosis for those with testicular complaints, it is not the most
the measurable velocity by Doppler ultrasound. The PRF (sometimes called scale) and the wall filter should initially be programmed or adjusted to their lowest settings, then ad-justed to eliminate background noise and false signals. This will allow for visualization of the lower-flow velocities com-monly found in testicular ultrasound scanning. The Doppler gain should also be decreased to its lowest setting and then slowly increased as needed. This should ensure that any color flow seen inside the testicle represents true flow versus arti-fact from improper gain settings.
NORMAL ULTRASOUND ANATOMYThe scrotum is a cutaneous pouch divided into two lateral compartments by the median raphe, and each side contains a testicle, epididymis, vas deferens, and spermatic cord. The normal testes are oval in shape and measure approxi-mately 5 by 3 by 3 cm (Figs. 19.6 and 19.11). The normal lie of the testicles is within a vertical axis, with a slightly anterior tilt. The scrotal sac is lined by the tunica vaginalis, which is reflected over the exterior surface of each tes-ticle. The tunica albuginea forms the exterior capsule of the testicle and gives rise to multiple septations that run through the testicle and separate the testicle into lobules. The mediastinum testis is a dense band of connective tissue that provides structural support for the testicular vessels and ducts (Fig. 19.5).
The epididymis is the ductal system through which the sperm travel and is located posterior to the testicle. The epi-didymis is divided into the head, body, and tail. The head is located adjacent to the superior pole of the testis, and
FIGURE 19.11. Normal Testicular Anatomy.
Spermatic cord
Vas deferens
Deferential artery
Tail of epididymis
Seminiferous tubules
Tunica vaginalis
Tunica albuginea
Septulum of tunica albuginea
Rete testis
Efferent ductules
Body of epididymis
Pampiniform plexus
Testicular artery

276 Section Vi / Scrotal Emergencies
sonographic finding for epididymitis is increased color or power Doppler flow when compared to the asymptomatic testicle (Fig. 19.12B). If spectral Doppler ultrasound is per-formed, then a decreased resistive index (RI) <0.5 can often be identified, further supporting the diagnosis of orchitis (25).
Testicular Torsion, Ischemia, and InfarctionTesticular torsion occurs when the blood supply to the tes-ticle is partially or completely obstructed as a result of first venous, and then arterial compression during coiling of the testicles’ pedunculated blood supply. Since torsion may be complete or partial, the sonographic diagnosis of this entity can be difficult, even for the experienced sonographer. Previ-ous studies have consistently shown that the most accurate means to diagnose torsion, regardless of sonographic or ra-diographic findings, is via surgical exploration (26). There-fore, a high suspicion of testicular torsion should trigger one to obtain immediate urologic consultation. Since an observed difference in flow between the affected and unaffected tes-ticle is key to the diagnosis of torsion, a working and funda-mental understanding and performance of CDI and spectral Doppler ultrasound is essential.
The sonographic appearance of the torsed testicle is de-pendent upon the degree of testicular torsion, as well as the time from symptom onset (24). If the ultrasound is per-formed within the first 4 hours of torsion, the testicle will likely appear enlarged with a decreased echogenicity result-ing from venous congestion. CDI will reveal diminished or absent central testicular blood flow when compared to the asymptomatic testicle (Fig. 19.13). However, CDI alone may not be sufficient in the evaluation of patients with testicular pain with demonstrated flow in both testicles. The identifi-cation of intratesticular arterial and venous spectral Doppler waveforms has a greater negative predictive value than the presence of color or power Doppler flow (7). This is believed to be the result of the physiology of early torsion described earlier in this chapter.
Testicular TraumaTesticular fracture and testicular infarction are the prin-cipal concerns in patients presenting with either blunt or
time-critical, as testicular torsion represents the clinical di-agnosis that must be excluded. Since testicular torsion and epididymitis/orchitis are difficult to differentiate based on history, symptoms, and physical exam, diagnostic testing is often required. Today CDI has become the accepted modal-ity of choice for the diagnostic evaluation of the patient with acute testicular complaints (2–9).
Sonographic findings of epididymitis include thickening and enlargement of the epididymis (Fig. 19.12A). This oc-curs most frequently in the epididymal head, followed by the body, and least frequently the epididymal tail. However, in up to 50% of cases, the epididymis is inflamed from the body through the tail (23). Decreased echogenicity is com-mon on two-dimensional B-mode ultrasound with a coarse and heterogeneous appearance, the result of edematous inflammation. A reactive hydrocele is common in epidid-ymitis and orchitis, as well as nearly all acute testicular pa-thology including testicular torsion (24). The key diagnostic
FIGURE 19.13. Acute Left Testicular Torsion . Note absence of color power Doppler flow compared to right testicle . An edge artifact obscures a portion of the left testicle .
A
FIGURE 19.12. Sagittal Image from a 13-Year-Old Who Presented with a Painful Swollen Testicle. Note the enlarged epidymis superior to the testicle (A) . Power Doppler showing increased flow within and around the epidymis (B) .
B

chapter 19 / Scrotal Emergencies 277
VIDEO 19 .2). If the fluid collection in the hydrocele is blood, this is termed a hematocele ( VIDEO 19 .3), and internal echoes from blood cells can be noted. When associ-ated with inflammatory states, internal echoes from white blood cells and debris may be identified on ultrasound, and this is then termed a pyocele (Fig. 19.16).
A varicocele is an extratesticular dilatation and elonga-tion of the veins of the pampiniform plexus. Varicoceles generally occur in the left scrotum, a result of the anatomic venous connection of the left gonadal vein as it drains into the left renal vein. Anatomically, the left renal vein traverses between the aorta and superior mesenteric artery, placing it at risk for compression by the “nutcracker syndrome,” resulting in higher venous pressures throughout its distal venous sys-tem. This can result in the formation of varicoceles. Patients will present with either an asymptomatic or mildly painful mass. The classically defined “bag of worms” on physical exam is often only noted in patients with advanced large varicoceles. Sonographically, enlarged veins >2 to 3 mm in diameter are located superior to the testis, but may also be noted posterior and lateral to the testis (Fig. 19.17). When a patient stands or performs a Valsalva maneuver, these veins dilate with a classic increased flow on CDI or a reversal of venous flow noted on spectral Doppler analysis. Though varicoceles rarely represent an immediate testicular emer-gency (unless venous thrombosis is suspected), they have been implicated and are felt to be a significant cause of de-creased fertility or infertility in men. Therefore, the finding of a varicocele does require appropriate urology consultation and follow-up. Finally, the presence of an isolated right-sided varicocele should raise the possibility of potential right-sided venous obstruction such as a right renal mass.
Scrotal HerniaA scrotal hernia is a protrusion of intra-abdominal contents, which is often bowel, through the processes vaginalis into the scrotal sac. Patients often present with either acute onset of pain and swelling or with complications that may occur with chronic herniation such as bowel strangulation or even obstruction. Sonographically, one can usually distinguish
penetrating testicular trauma. A testicular fracture occurs when the integrity of the tunica albuginea is disrupted. The pathophysiology of testicular rupture is similar to that of a ruptured globe. If struck with sufficient force, the inter-nal pressure within the testicle exceeds that of the struc-tural resistance integrity of the tunica albuginea, with leakage of its internal contents. Sonographically, the pe-rimeter of the testicle is often noncontiguous and irregu-lar, with a hemorrhagic region at the area of the fracture (Fig. 19.14). A hematocele may be present and can be dif-ficult to distinguish from testicular tissue. A hematocele in the patient with acute scrotal trauma may be an indi-rect indicator of a testicular fracture, much like free fluid in the trauma exam may represent a solid organ injury. Furthermore, recognition of increased antiplatelets and anticoagulation use for patients who are of child- rearing age should raise the emergency physician’s concern of hematocele progression. Several case reports describe testicular ischemia and infarction resulting from vascular compromise following development of large hydroceles or hematoceles, requiring scrotal decompression (25). Testicular fracture and its associated findings represent a surgical emergency, as testicular function and fertility may be lost if the testicle is not repaired. The suspicion of a testicular fracture should prompt immediate urologic and potentially further radiologic evaluation.
Extratesticular Causes of Scrotal Swelling or MassesA hydrocele is defined as a fluid collection that is located between the visceral and the parietal layers of the tunica vaginalis. These can be congenital or acquired in nature and are often asymptomatic. However, acquired hydroceles or their associated scrotal swelling can represent the initial presenting symptom and finding associated with several clinical entities relevant to the emergency physician. Causes of acquired hydroceles include testicular torsion, epididymi-tis, trauma, orchitis, and tumors (24). Sonographically, most hydroceles are anechoic in nature, with low attenuating fluid that results in posterior acoustic enhancement (Fig. 19.15;
FIGURE 19.14. Hematocele . A large hematocele (H ) is noted superior to the testicle (T ) in this patient, who was involved in a motor vehicle crash . (Courtesy of Dr . John Kendall, MD .)
FIGURE 19.15. Hydrocele . An anechoic circumferential hydrocele is noted to surround the testicle .

278 Section Vi / Scrotal Emergencies
ARTIFACTS AND PITFALLSArtifactsSeveral artifacts can be encountered during testicular ultrasound.
1. Posterior acoustic enhancement. The far-field be-yond an anechoic or hypoechoic area will have increased echogenicity. This is commonly observed in the far-field beyond cysts (such as epididymal cysts), hydroceles, and varicoceles (Fig. 19.19).
2. Color Doppler flash artifact. Color or power Doppler artifact results from movement of the transducer or the testicle in the area of the Doppler box. This may be con-fused for blood flow. This commonly occurs when the Doppler gain is set too high, the color filter set too low, or when the patient or transducer is moved during evalu-ation ( VIDEO 19 .4).
3. Refraction (edge artifact, lateral cystic shadowing). The ultrasound image displayed may be lost from the curved border of a structure. This is commonly seen at the head of the epididymis, with some intra-testicular masses, or in this image where the medial
the testicle from this extratesticular mass if they are clearly distinct from each other, or if the mass has evidence of peri-stalsis, fluid, air artifact, or a reactive hydrocele (Fig. 19.18) (27,28).
FIGURE 19.18. Inguinal Hernia . An inguinal hernia is noted as intestine loops back upon itself in the inguinal canal .
FIGURE 19.16. Pyocele . Complex fluid collection in patient with epididymo-orchitis, marked by septations and echogenic debris (A, B) . (Image courtesy of Frances Russell MD .)
A B
FIGURE 19.17. Varicocele. Image in B-mode (A) and color Doppler (B). (Courtesy of Phillips, Andover, MA .)
A B

chapter 19 / Scrotal Emergencies 279
Doppler gain. If perimeter blood vessels appear hyper-emic with increased flow, yet clear central testis color and spectral arterial and venous Doppler signals are difficult to identify, then one of two scenarios exists. The system may not be optimized, or the patient has a central flow deficiency that may represent torsion, an intermittent tor-sion, or a focal infarct, all of which require immediate urology consultation and potentially further diagnostic evaluation; time is critical for the viability of the testis.
USE OF THE IMAGE IN CLINICAL DECISION MAKINGAn approach to the use of testicular ultrasound is presented in Figure 19.20. It is important to recognize that the his-tory, physical exam, and urinalysis are not 100% specific for the diagnosis of epididymitis or testicular torsion. Even pyuria is unreliable in distinguishing between infection and inflammation. The simplest use of emergency testicular ul-trasound is to use the positive predictive value for the in-clusion of inflammatory states. It is often easier to rule in a specific diagnosis with a positive result than it is to rule out a diagnosis such as torsion that relies on the absence of findings (i.e., blood flow). This is not an unusual con-cept in medicine. For example, an electrocardiogram (EKG) showing an inferior wall myocardial infarction can aid in rapid disposition and management of patients, while the nondiagnostic EKG in the patient with chest pain requires further evaluation. Using this same approach, consider an actual case. A 16-year-old male presents with 3 days of in-termittent testicular pain and swelling and admits to sexual activity and dysuria. He is afebrile. His exam shows a swol-len left testis that is tender but has a normal cremasteric reflex. At this point, let us presume two different potential emergency ultrasound results. The patient’s ultrasound scan reveals an enlarged testis with decreased echogenicity and hyperemic flow throughout the testicle and epididymis as compared to the asymptomatic side. Centrally, both arterial and venous spectral Doppler waveforms are identified. The
edges of both testes are obscured by edge artifact (Fig. 19.19B).
4. Shadowing. This is the loss of a displayed ultrasound image immediately beyond a structure with high acous-tic impedance such as a dense calcium-containing structure. This occurs with tissue calcifications and in some tumors with calcifications.
PitfallsPitfalls in testicular ultrasound may be divided into several categories. It is essential that the emergency sonographer be familiar with these in order to avoid misdiagnosis or a delay in care.
1. The most significant pitfall for performance and optimi-zation of the image and diagnostic information relates to understanding and the skill in using color, power, or spectral Doppler. The emergency sonographer should have an understanding of Doppler physics and its in-terplay in the performance of testicular ultrasound. Minimizing the effect of Doppler filters and using lower Doppler scales and PRFs should be emphasized and practiced. Our training in emergency medicine often has us focus on the patient’s area of complaint, and although we do this with testicular ultrasound, it is critical to first optimize Doppler settings on the asymptomatic side (if one exists) prior to evaluating the symptomatic testicle.
2. Diagnostically, testicular torsion, late torsion, intermit-tent torsion, and focal infarcts can present a sonographic color and spectral Doppler evaluation that is confusing. In all of these states there can exist the presence of pe-ripheral testicular blood flow, with a relative deficiency or absence of central testicular blood flow.
3. It is essential to realize that the diagnosis of testicular tor-sion does not mandate an “absence of any blood flow” on ultrasound, but rather a “critical deficiency” in testicular blood flow that can result in infarction. To avoid this po-tential pitfall it is critical that the emergency sonographer scan the asymptomatic testicle initially to obtain baseline Doppler settings, adjust the Doppler filter, PRF, and the
FIGURE 19.19. Artifacts in Scrotal Ultrasound. A: Posterior wall enhancement . A large anechoic hydrocele displays prominent posterior acoustic enhance-ment of the posterior wall and region immediately behind the fluid . The appendix testis is seen . B: Edge artifact (lateral cystic shadowing) . This bilateral scrotal image shows edge artifact (lateral cystic shadowing) extending from the medial borders of both testicles, extending into the far-field .
A B

280 Section Vi / Scrotal Emergencies
CORRELATION WITH OTHER IMAGING MODALITIESPrior to the widespread use of color Doppler ultrasound, nuclear imaging was the diagnostic test of choice for the assessment of the acute scrotum. In nuclear imaging, a radioactive isotope, generally technetium-99 with a chemi-cal vector, is intravenously injected into the patient. Serial time-dependent images using a gamma radiation detection scanner are obtained usually at 1-minute intervals, with de-layed images at 10 to 15 minutes as needed. This allows a radioisotope tagged assessment of perfusion of the testicle and the surrounding tissues. Several key differences exist between nuclear imaging and ultrasound. First, ultrasound does not employ ionizing radiation, and this is a clear benefit if diagnostic information can be obtained without radiation exposure. The second key difference is based on the time taken to obtain the diagnostic information. The diagnostic information by ultrasound is immediate; in contrast, nuclear imaging requires up to 60 minutes following isotope injec-tion. Although both modalities offer information about blood flow to the scrotum and testicles, ultrasound provides sono-graphic anatomic information that nuclear imaging cannot. While both modalities have a high sensitivity for detecting scrotal pathology, these advantages have made color Doppler
patient is diagnosed as epididymo-orchitis and appropri-ately discharged on analgesics and antibiotics with urology follow-up. If the ultrasound had instead shown peripheral hyperemia with the absence of central flow, torsion could not be ruled out. Urology should be consulted and the di-agnosis confirmed or excluded. This example illustrates a conservative approach to emergency testicular ultrasound that is likely to fit within the practice patterns of most emer-gency physicians, that is to say, when conditions other than torsion are evident and the testicular ultrasound supports a specific diagnosis, then disposition can be made. In the case of torsion, when complete torsion without central flow is evident on ultrasound, operative disposition and consulta-tion is immediate. However, when partial flow is noted on testicular ultrasound and inflammatory states ( epididymitis/orchitis) cannot be confirmed, further immediate consul-tative evaluation or diagnostic testing is reasonable and suggested.
The sonographic evidence for torsion or testicular emer-gencies may not be as clear as the presence or absence of an abdominal aortic aneurysm or a pericardial effusion. When doubt or clinical concern remains high, further testing be-yond the emergency ultrasound and immediate consultation with urology are essential, as a delay in diagnosis can result in a poor outcome.
FIGURE 19.20. Testicular Ultrasound Algorithm.
Patient with scrotal pain, swelling, ortesticular mass
ED Ultrasound performed with thefollowing results:
US Evidence of Epididymitis with orwithout Orchitis
(↑ size, increased Doppler flow, etc)
YES YESNO
Treat anddischarge with
outpatientfollow up
1. Attempt Detorsion2. Stat Urology Consult
1. Other Findings(mass, etc)?
2. Confirm Colorwith spectralDoppler
3. If spectralDoppler arterial andvenous flows arepresent thenconsider dischargewith explicitinstructions
1. Any other pathology?
2. Discharge patient
3. Consider consultativediagnostic testing ifclinical suspicion is highor US is equivocal
4. Urology Consult forpersistent severe pain ortesticular ischemiaconcerns
NO
US Evidence of testicular torsion(Absent or clearly ↓↓ central
arterial/venous flow)

chapter 19 / Scrotal Emergencies 281
Epididymal cysts and spermatoceles represent a common finding in patients presenting with either a painful or painless palpable scrotal mass. They can be located anywhere along the length of the epididymis, but are frequently found at the head of the epididymis. Sonographically, these cysts usually are anechoic, display posterior acoustic enhancement and lateral cystic shadowing (edge artifact), and have no internal CDI flow (Fig. 19.23). It is important to recognize that if the transmit frequency for the transducer can be increased, this may aid in the recognition of posterior acoustic enhancement and help with the sonographic diagnosis of cysts and fluid collections.
MicrolithiasisMicrolithiasis is noted on ultrasound as diffuse punctate echogenic calcifications throughout the testicles (Fig. 19.24;
VIDEO 19 .6). The image pattern is described sonographi-cally as a starry night. The clinical significance of this is debatable. Concern exists that intratesticular calcifications may represent a precancerous state. Any patient with this in-cidental finding should have appropriate specialist follow-up.
ultrasound the principal modality for evaluating scrotal and testicular pathology.
INCIDENTAL FINDINGSTesticular MassThe majority of intratesticular masses are malignant germ cell tumors. For this reason, it is essential that patients iden-tified with a testicular mass on ultrasound receive definitive and rapid consultative follow-up. Sonographic differentiation of testicular germ cell tumors is generally beyond the scope of practice for emergency physicians, and will not be dis-cussed in this chapter.
Patients with testicular masses can present with com-plaints including testicular or groin pain, testicular enlargement, a palpable mass, hematuria, or scrotal swell-ing. Sonographically, intratesticular masses are usually “hypoechoic” when compared to the surrounding testicular tissue (Fig. 19.21). They can further display heterogenicity, focal areas of necrosis, echogenic calcified foci, and necrotic or cystic regions (Fig. 19.22; VIDEO 19 .5). A reactive hy-drocele is frequently present, and CDI may reveal increased flow within the mass, unless infarction or hemorrhage occurs within the mass.
FIGURE 19.21. Left Testicular Mass . Hypoechoic mass at the inferior pole of the left testicle in a patient who presented with a painless, firm mass noted on self-exam . Microlithiasis is present, seen as tiny echogenic dots .
FIGURE 19.22. Intratesticular Mass . Longitudinal, sagittal view of a hypoechoic mass within the center of the testicle with hyperechoic borders .
FIGURE 19.23. Epididymal Cyst (EC) . An epididymal cyst is noted in the head of the epididymis superior to the testis (T ) .
FIGURE 19.24. Microlithiasis . Sagittal view of testicle demonstrating the “starry night” appearance of testicular calcifications .

282 Section Vi / Scrotal Emergencies
oblique position. An emergency ultrasound reveals a slightly enlarged testicle with some peripheral testicular flow but a significant decrease in color flow on Doppler as compared to the right testicle. (Figs. 19.25 and 19.26) A small hydrocele is also noted on the left. He is given intravenous analgesia with procedural sedation and manual detorsion is attempted without success. He is diagnosed with acute left testicular torsion with a stat urology consult for operative detorsion. Operative findings confirmed a testicular torsion with bell-clapper deformity requiring bilateral surgical repair.
REFERENCES 1. Mueller DL, Amundson GM, Rubin SZ, et al. Acute scrotal abnormali-
ties in children: diagnosis by combined sonography and scintigraphy. AJR Am J Roentgenol. 1988;150(3):643–646.
2. Nussbaum Blask AR, Bulas D, Shalaby-Rana E, et al. Color Doppler sonography and scintigraphy of the testis: a prospective, compara-tive analysis in children with acute scrotal pain. Pediatr Emerg Care. 2002;18(2):67–71.
3. Kravchick S, Cytron S, Leibovici O, et al. Color Doppler sonography: its real role in the evaluation of children with highly suspected testicular torsion. Eur Radiol. 2001;11(6):1000–1005.
4. Weber DM, Rösslein R, Fliegel C. Color Doppler sonography in the diag-nosis of acute scrotum in boys. Eur J Pediatr Surg. 2000;10(4):235–241.
5. Cook JL, Dewbury K. The changes seen on high-resolution ultrasound in orchitis. Clin Radiol. 2000;55(1):13–18.
6. Lerner RM, Mevorach RA, Hulbert WC, et al. Color Doppler US in the evaluation of acute scrotal disease. Radiology. 1990;176(2):355–358.
7. Sanelli PC, Burke BJ, Lee L. Color and spectral doppler sonogra-phy of partial torsion of the spermatic cord. AJR Am J Roentgenol. 1999;172(1):49–51.
8. Dogra VS, Sessions A, Mevorach RA, et al. Reversal of diastolic plateau in partial testicular torsion. J Clin Ultrasound. 2001;29(2):105–108.
9. Middleton WD, Middleton MA, Dierks M, et al. Sonographic prediction of viability in testicular torsion: preliminary observations. J Ultrasound Med. 1997;16(1):23–27.
10. Blaivas M, Sierzenski P. Emergency ultrasonography in the evaluation of the acute scrotum. Acad Emerg Med. 2001;8(1):85–89.
11. Blaivas M, Batts M, Lambert M. Ultrasonographic diagnosis of testicular torsion by emergency physicians. Am J Emerg Med. 2000;18(2):198–200.
12. Blaivas M, Sierzenski P, Lambert M. Emergency evaluation of patients presenting with acute scrotum using bedside ultrasonography. Acad Emerg Med. 2001;8(1):90–93.
CLINICAL CASESCaSe 1A 34-year-old male presents with complaints of 3 days of increasing persistent testicular pain and right testicular swell-ing. He complains of dysuria and states that the symptoms became worse today. His vitals include a temperature of 38.7°C, pulse of 105 beats per minute, and a blood pressure of 135/65 mm Hg. A urinalysis shows moderate bacteria with 30 to 40 white blood cell count (WBC) and 5 to 10 red blood cell count (RBC) per high-power field. On exam he has a swollen right testicle that is warm and tender to the touch. He has a cremasteric reflex present. An emergency ultrasound reveals an enlarged epididymal head and testicle with a sig-nificant increase color flow on Doppler as compared to the left testicle (Fig. 19.12). He is diagnosed with acute epididy-mitis with orchitis and placed on antibiotic therapy with an outpatient follow-up with a urologist.
CaSe 2A 16-year-old male presents with 3 days of intermittent tes-ticular pain that completely resolved during each episode. He states that while working out on an exercise bike he noted the sudden onset of severe left testicular and groin pain with nausea and vomiting. He presents in obvious distress 3 hours after the onset of pain today. His vitals include a temperature of 37.8°C, pulse of 115 beats per minute, and a blood pres-sure of 145/84 mm Hg. A urinalysis shows trace bacteria with 0 to 10 WBC and 5 to 10 RBC per high-power field. On exam he has a swollen left testicle that is tender to the touch. No cremasteric reflex is present, and the testicle rests in an
FIGURE 19.26. Sagittal Image of an Acutely Torsed Testicle with Absence of Flow with Power Doppler.
FIGURE 19.25. Acute Left Testicle Torsion . Sagittal images of patient’s testicles 3 hours after onset of acute left testicular pain . Note power color Doppler flow in the unaffected right testicle (A) compared to the absence of flow in the color gate for the left testicle with superior reactive hydrocele (B) .
A
B
chapter 19 / Scrotal Emergencies 283
22. Grantham JG, Charboneau JW, James EM, et al. Testicular neo-plasms: 29 tumors studied by high-resolution US. Radiology. 1985;157(3):775–780.
23. Benson CB, Doubilet PM, Richie JP. Sonography of the male genital tract. AJR Am J Roentgenol. 1989;153(4):705–713.
24. Dambro TJ, Stewart RR, Carroll BA. The scrotum. In: Rumack CM, Wilson SR, Charboneau JW, eds. Diagnostic Ultrasound. 2nd ed. St. Louis, MO: Mosby; 1998:791–821.
25. Dogra VS, Rubens DJ, Gottlieb RH, et al. Torsion and beyond: new twists in spectral Doppler evaluation of the scrotum. J Ultrasound Med. 2004;23(8):1077–1085.
26. Rivers KK, Rivers EP, Stricker HJ, et al. The clinical utility of sero-logic markers in the evaluation of the acute scrotum. Acad Emerg Med. 2000;7(9):1069–1072.
27. Korenkov M, Paul A, Troidl H. Color duplex sonography: diagnos-tic tool in the differentiation of inguinal hernias. J Ultrasound Med. 1999;18(8):565–568.
28. Ogata M, Imai S, Hosotani R, et al. Abdominal ultrasonography for the diagnosis of strangulation in small bowel obstruction. Br J Surg. 1994;81(3):421–424.
13. Williamson RC. Torsion of the testis and allied conditions. Br J Surg. 1976;63(6):465–476.
14. Janetschek G, Schreckenberg F, Grimm W, et al. Hemodynamic effects of experimental testicular torsion. Urol Res. 1987;15(5):303–306.
15. Krone KD, Carroll BA. Scrotal ultrasound. Radiol Clin North Am. 1985;23(1):121–139.
16. Hricak H, Lue T, Filly RA, et al. Experimental study of the sonographic diagnosis of testicular torsion. J Ultrasound Med. 1983;2(8):349–356.
17. Knight PJ, Vassy LE. The diagnosis and treatment of the acute scrotum in children and adolescents. Ann Surg. 1984;200(5):664–673.
18. Rampaul MS, Hosking SW. Testicular torsion: most delays occur outside the hospital. Ann R Coll Surg Engl. 1998;80(3):169–172.
19. Witherington R. The ‘acute’ scrotum. Lesions that require immediate attention. Postgrad Med. 1987;82(1):207–216.
20. Escobar JI, Eastman ER, Harwood-Nuss AL. Selected urologic prob-lems. In: Marx JA, Hockberger RS, Walss RM, et al., eds. Rosen’s Emer-gency Medicine Concepts and Clinical Practice. 5th ed. St. Louis, MO: Mosby; 2002:1422–1426.
21. Jeffrey RB, Laing FC, Hricak H, et al. Sonography of testicular trauma. AJR Am J Roentgenol. 1983;141(5):993–995.

284
transducer. A 3.5 MHz convex array probe may be prefer-able in the case of deep collections, such as an intramuscu-lar buttock abscess. 8PEDIATRIC CONSIDERATIONS: A high frequency (6 to 13 MHz) small footprint linear probe is indi-cated in young children. Often the vascular probe can serve this purpose. Given the high water content of the subcutaneous tissue of children, increase the gain to visualize subtle details of pediatric soft tissue infections.7Fluid collections should be interrogated in two planes to define their shape. Depth is estimated using the depth markers at the side of the display. It is helpful to compare the area of interest to the contralateral side to define the normal depth of subcutaneous tissue, fas-cial planes, and muscle. In the case of superficial infections, particularly of the hand, use of a standoff pad or water bath is recommended to optimize image quality where small ana-tomic structures and bones are located near the skin surface.
Normal Ultrasound AnatomyExamination of the skin and subcutaneous tissue reveals sev-eral layers of tissue, beginning with the cutaneous layer of epidermis and dermis, deep to which lies the subcutaneous fat which is separated from muscle by fascia. The cutaneous layer occupies only a few millimeters of the near field and is not visualized in detail using typical frequencies employed by most emergency department (ED) equipment. Normal subcutaneous tissue is composed primarily of fat, which ap-pears hypoechoic, and is traversed by irregular strands of
INTRODUCTIONSkin and soft tissue infections and foreign bodies are encoun-tered on a daily basis by emergency physicians. Ultrasound provides detailed images of subcutaneous and submucosal tis-sue, and is an extremely useful tool in the rapid assessment of these common problems. This chapter is divided into three sec-tions that cover the diagnosis and evaluation of skin and soft tissue infections, subcutaneous foreign bodies, and soft tissue masses. Soft tissue procedures are covered in Chapter 22.
SKIN AND SOFT TISSUE INFECTIONSClinical ApplicationsFaced with an undifferentiated skin and soft tissue infection, ultrasound is useful to:
1. Confirm the presence of cellulitis 2. Detect occult or deep abscesses 3. Localize abscess pockets for accurate aspiration or inci-
sion, and 4. Identify fluid adjacent to fascial planes, indicative of
necrotizing fasciitis.
Image AcquisitionSonographic evaluation of skin and soft tissue infections is usually best accomplished with a 5 to 7.5 MHz linear array
Pathology . . . . . . . . . . . . . . . . . . . . . . . . . . . . . . . . . . 291Artifacts and Pitfalls . . . . . . . . . . . . . . . . . . . . . . . . . . 292Comparison with Other Imaging Modalities . . . . . . . . 292Use of the Image in Clinical Decision Making . . . . . . . 294
EVALUATION OF SOFT TISSUE MASSES . . . . . . . . . . . . . . . 295Clinical Application . . . . . . . . . . . . . . . . . . . . . . . . . . . 295Image Acquisition . . . . . . . . . . . . . . . . . . . . . . . . . . . . 295Normal Ultrasound Anatomy . . . . . . . . . . . . . . . . . . . . 295Pathology . . . . . . . . . . . . . . . . . . . . . . . . . . . . . . . . . . 295Artifacts and Pitfalls . . . . . . . . . . . . . . . . . . . . . . . . . . 298Comparison with Other Imaging Modalities . . . . . . . . 298Use of the Image in Clinical Decision Making . . . . . . . 299
CLINICAL CASE . . . . . . . . . . . . . . . . . . . . . . . . . . . . . . . . . . 300
INTRODUCTION . . . . . . . . . . . . . . . . . . . . . . . . . . . . . . . . . . 284SKIN AND SOFT TISSUE INFECTIONS . . . . . . . . . . . . . . . . . 284
Clinical Applications . . . . . . . . . . . . . . . . . . . . . . . . . . 284Image Acquisition . . . . . . . . . . . . . . . . . . . . . . . . . . . . 284Normal Ultrasound Anatomy . . . . . . . . . . . . . . . . . . . . 284Pathology . . . . . . . . . . . . . . . . . . . . . . . . . . . . . . . . . . 286Artifacts and Pitfalls . . . . . . . . . . . . . . . . . . . . . . . . . . 287Comparison with Other Imaging Modalities . . . . . . . . 288Use of the Image in Clinical Decision Making . . . . . . . 290
SOFT TISSUE FOREIGN BODY . . . . . . . . . . . . . . . . . . . . . . . 290Clinical Applications . . . . . . . . . . . . . . . . . . . . . . . . . . 290Image Acquisition . . . . . . . . . . . . . . . . . . . . . . . . . . . . 291Ultrasound Anatomy . . . . . . . . . . . . . . . . . . . . . . . . . . 291
Jacob C. Miss and Bradley W. Frazee
Skin and Soft Tissue20

Chapter 20 / Skin and Soft Tissue 285
hyperechoic connective tissue. Fascia is comprised of con-nective tissue that is sharply defined, usually thin, regular, and hyperechoic. Fascia demarcates the subcutaneous fat from the underlying muscle fibers. Muscle fibers are orga-nized into bundles that are divided by fibroadipose septa. The muscle fibers themselves are hypoechoic (isoechoic with subcutaneous fat); the fibroadipose septa that traverse the muscle fibers are hyperechoic and regular. In the long axis of a muscle, these septa give a characteristic appearance described by some as “veins on a leaf” or “feather-like.” In short axis, the echogenic septa are scattered between the muscle fibers, giving a speckled appearance sometimes
referred to as a “starry night.” Vessels are tubular and an-echoic. In long axis, they appear retangular; in short axis, they are round or oval. Arteries usually are pulsatile, while veins compress with gentle transducer pressure. Both dem-onstrate color flow by Doppler. Lymph nodes are seen as irregular, circular structures, often with an echogenic center surrounded by a hypoechoic rim. Bones, with their brightly echogenic cortex and dense acoustic shadow, can often be seen in the far field of the image, providing a useful land-mark and depth perspective. Figure 20.1 demonstrates nor-mal sonographic appearance of the subcutaneous structures of the arm.
FIGURE 20.1. Normal Sonographic Appear-ance of the Subcutaneous Structures of the Arm. Shows skin, subcutaneous fat, fascial planes, muscle, deep brachial vessels, and humerus bone . A: Transverse view . B: Longitudinal view .
Skin and dermis
Subcutaneous fat layer
Fascia
Muscle
Deep brachialvessels
Humerous
Subcutaneous fat
Muscle
Brachial vessels
Humerous
A
B
FIGURE 20.2. Cellulitis and Comparison View. Cellulitis of the arm demonstrating hyperechoic appearance and diffuse thickening of the subcutaneous fat due to edema, few hypoechoic septae, and poor resolution of far field tissues (A) . Contralateral normal arm showing thin dermal layer and well-resolved muscle and bone in the far field (B) .
Thickenedsubcutaneousfat layerHypoechoic
septae
Thickenedsubcutaneousfat layerHypoechoic
septae
Normalsubcutaneoustissue
Muscle
Anterior cortexof bone
Normalsubcutaneoustissue
Muscle
Anterior cortexof bone
A B

286 SeCtion Vii / Soft Tissue and Musculoskeletal Conditions
palpation (Fig. 20.11; VIDEO 20 .1) (2,3). Figure 20.12 ( VIDEO 20 .2) demonstrates the typical appearance of a deep intramuscular abscess. Once an abscess is identi-fied, ultrasound is also useful to identify adjacent vascular
PathologyMost of the findings associated with cellulitis arise from edema formation and are nonspecific. Swelling is reflected in an increased distance between the skin and underlying fascia or bone (Fig. 20.2). The echogenicity of the subcuta-neous tissue is diffusely increased, and often is traversed by a lattice of broad hypoechoic bands, giving rise to a cobble-stone appearance (Figs. 20.3, 20.4 and 20.6). Differentiating interconnected bands of edema fluid from an irregular pus collection can be difficult (Figs. 20.5 and 20.6).
Although subcutaneous abscesses most commonly ap-pear as hypoechoic roughly spherical masses (Figs. 20.7 and 20.8), it is important to realize that the sonographic appearance can be quite variable (1). Abscesses are orga-nized collections of purulent material and debris. Some are well formed and sharply demarcated. However, in some, the contour may be lobulated or interdigitated with sur-rounding edema and tissue planes (Figs. 20.5 and 20.9). The interior may contain hyperechoic sediment (Fig. 20.7), septae, or gas and may be isoechoic or hyperechoic com-pared to surrounding tissue (Fig. 20.10). In the latter case, clues to the presence of liquefied pus are the findings of posterior acoustic enhancement (Figs. 20.7, 20.8, and 20.10) and the ability to induce motion of the material with
FIGURE 20.3. Cellulitis of the Forearm Demonstrating Prominent Hypoechoic Septae in the Subcutaneous Fat Layer, Giving Rise to a Cob-blestone or Lattice Appearance.
FIGURE 20.4. Cellulitis . Underlying muscle layer and bone are seen .
Musclelong axis
Muscleoblique axis
Anteriorcortex
of bone
Musclelong axis
Muscleoblique axis
Anteriorcortex
of bone
FIGURE 20.5. Right Lower Extremity Cellulitis with Fluid Collection . Notice the difficulty in distinguishing an irregular pus pocket from intercon-nected pockets of edema . (Courtesy of Martine Sargent, MD, San Francisco General Hospital .)
Irregularfluid
collection
FIGURE 20.6. Lower Extremity Cellulitis with Prominent Near Field Edema Fluid that could be Confused with Pus. (Courtesy of Arun Nagdev, MD, Highland Hospital .)
Edema
Muscle
FIGURE 20.7. Typical Abscess . Spherical abscess cavity containing hyperechoic debris . Note far field acoustic enhancement .

Chapter 20 / Skin and Soft Tissue 287
image for small structures such as digits (Figs. 20.15 and 20.16; VIDEO 20 .5).
The sonographic appearance of necrotizing fasciitis in-cludes marked thickening of the subcutaneous tissue when compared to the contralateral side (as seen in cellulitis) combined with a layer of anechoic fluid tracking along the fascia (Fig. 20.17; VIDEO 20 .6) (4). Yen and co-authors reported that the fluid layer should measure at least 4 mm, although this criteria has yet to be confirmed by others (1). Subcutaneous gas, which may give rise to acoustic shad-owing and reverberation artifact, is reliably detected by ultrasound (5), and is present in some cases of necrotizing fasciitis (Fig. 20.18; VIDEOS 20 .7 and 20 .8) (4–7). Yen and coworkers found that ED ultrasound had a sensitivity of 88.2% and specificity of 93.3% for necrotizing fasciitis in a case series of 62 patients (1).
Artifacts and PitfallsPotential pitfalls in the ultrasound assessment of soft tissue infections include the following.
1. Failure to recognize an isoechoic abscess cavity (evident by the presence of far field acoustic enhancement),
2. Failure to recognize that irregular hypoechoic areas may represent pus collections rather than simply edema, and
3. Failure to optimize scanning technique with use of a standoff pad to interrogate superficial infections, par-ticularly in the hand.
FIGURE 20.8. Axillary Abscess with Adjacent Cellulitis . Note the far field acoustic enhancement and deep muscle layer .
Abscess
Muscle
FIGURE 20.9. Atypical Appearing Subcutaneous Abscess . A broad ir-regular anechoic fluid collection is seen deep and adjacent to what appears to be cellulitis in the near field .
FIGURE 20.10. Iso-Hyperechoic Abscess Cavity Giving Rise to Promi-nent Far Field Acoustic Enhancement.
FIGURE 20.11. Subcutaneous Abcess. Subcutaneous abscess with diffuse echogenic debris with motion of the purulent material appreciated during palpation (A). See VIDEO 20 .1A . (Courtesy of Dan Price, MD, Highland Hospital .) Perianal abscess demonstrating motion of the purulent material (B) . See VIDEO 20 .1B . (Courtesy of Arun Nagdev, MD, High-land Hospital .)
Abscesscavity
with debris
Edema
Abscesscavity
with debris
Purulent materialmoving out
of cavity
structures prior to drainage to avoid inadvertent puncture (Figs. 20.13 and 20.14; VIDEOS 20 .3 and 20 .4). A standoff pad or water bath may be helpful to improve the
A
B
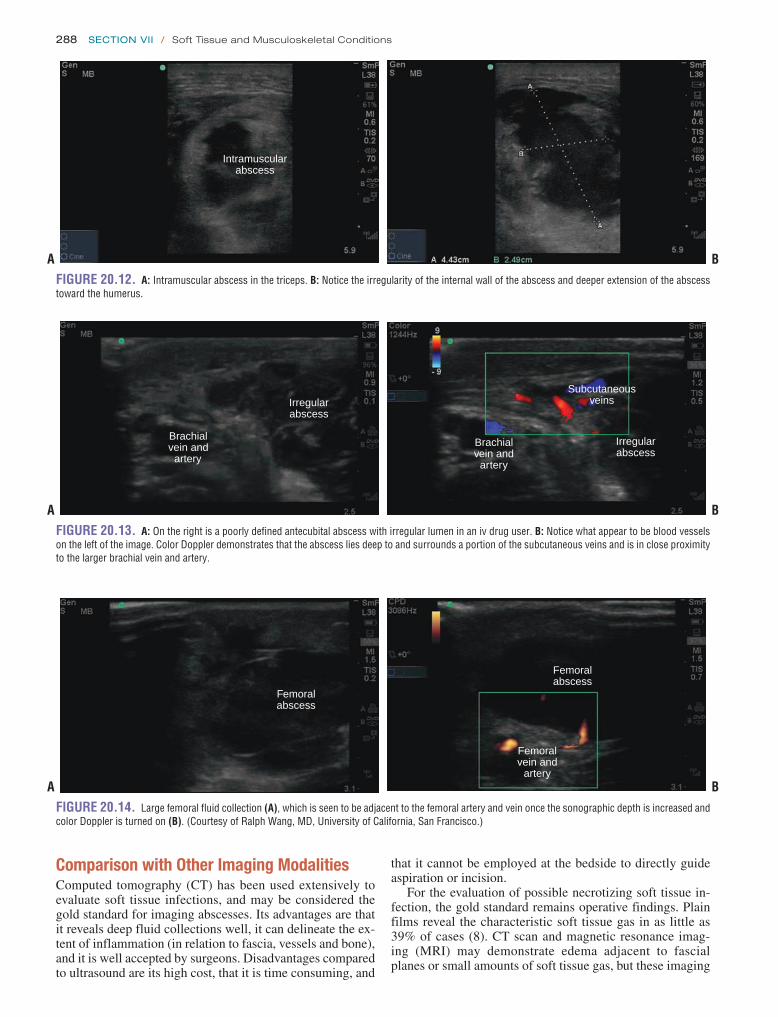
288 SeCtion Vii / Soft Tissue and Musculoskeletal Conditions
that it cannot be employed at the bedside to directly guide aspiration or incision.
For the evaluation of possible necrotizing soft tissue in-fection, the gold standard remains operative findings. Plain films reveal the characteristic soft tissue gas in as little as 39% of cases (8). CT scan and magnetic resonance imag-ing (MRI) may demonstrate edema adjacent to fascial planes or small amounts of soft tissue gas, but these imaging
Comparison with Other Imaging ModalitiesComputed tomography (CT) has been used extensively to evaluate soft tissue infections, and may be considered the gold standard for imaging abscesses. Its advantages are that it reveals deep fluid collections well, it can delineate the ex-tent of inflammation (in relation to fascia, vessels and bone), and it is well accepted by surgeons. Disadvantages compared to ultrasound are its high cost, that it is time consuming, and
FIGURE 20.12. A: Intramuscular abscess in the triceps . B: Notice the irregularity of the internal wall of the abscess and deeper extension of the abscess toward the humerus .
Intramuscularabscess
A B
FIGURE 20.14. Large femoral fluid collection (A), which is seen to be adjacent to the femoral artery and vein once the sonographic depth is increased and color Doppler is turned on (B) . (Courtesy of Ralph Wang, MD, University of California, San Francisco .)
Femoralabscess
Femoralabscess
Femoralvein and
arteryA B
FIGURE 20.13. A: On the right is a poorly defined antecubital abscess with irregular lumen in an iv drug user . B: Notice what appear to be blood vessels on the left of the image . Color Doppler demonstrates that the abscess lies deep to and surrounds a portion of the subcutaneous veins and is in close proximity to the larger brachial vein and artery .
Irregularabscess
Brachialvein and
artery
A B
Subcutaneousveins
Irregularabscess
Brachialvein and
artery

Chapter 20 / Skin and Soft Tissue 289
FIGURE 20.15. Fingertip Felon . A water-filled latex glove was used as a standoff pad . A: Longitudinal view . B: Transverse view .
A
B
FIGURE 20.16. Dorsal Finger Abscess . Images were obtained by placing the hand in a water bath . A: Longitudinal view . B: Transverse view .
Bone
Waterbath
Abscess
SkinSkin
Waterbath
Skin
Abscess
BoneBone
A
B
FIGURE 20.17. Necrotizing Fasciitis of the Thigh with Marked Subcu-taneous Edema and a Fluid Layer along the Fascia.
FIGURE 20.18. Necrotizing Fasciitis . Hyperechoic subcutaneous air with marked reverberation artifact and acoustic shadowing (A), along with edematous adjacent necrotic muscle (B) .
Subcutaneousgas
Reverberationartifact and
acousticshadowing
A
Subcutaneousgas
Reverberationartifact andacousticshadowing
Necroticmuscle
B

290 SeCtion Vii / Soft Tissue and Musculoskeletal Conditions
modalities are time consuming and may present an additional risk to an unstable patient (9). Ultrasound is an attractive alternative in this setting because it can be performed rap-idly at the bedside. While one prospective study has reported favorable results with screening ED ultrasound for suspected necrotizing fasciitis, published clinical experience from other centers remains limited to case reports, and data comparing ultrasound to more accepted imaging modalities such as CT or MRI are still lacking (1,6,7).
Use of the Image in Clinical Decision MakingAlthough CT scanning is known to reliably identify soft tissue fluid collections, bedside ultrasound may reveal the correct diagnosis much more rapidly and at less cost, and it provides real-time localization (8). Even novice ED sonog-raphers were capable of identifying abscesses by ultrasound with minimal training (10). A general approach to skin and soft tissue infections that incorporates bedside ultrasound is presented in Figure 20.19. In many cases the diagnosis of abscess is clinically obvious based on the finding of fluctu-ance or drainage. On the other hand, when cellulitis seems likely, the provider should be careful to consider the possi-bility of an occult or early abscess, or necrotizing soft tissue infection NSTI. When doubt exists about the possibility of an abscess, ultrasound is used to search below the surface for a subcutaneous or intramuscular fluid collection. In addition, ultrasound can be used to define the best location for aspira-tion or incision, where the collection is largest and closest to the skin surface.
The utility of such an approach in the ED setting has been investigated by multiple groups. In one study of 107 patients with skin and soft infections, addition of bedside ultrasound to the history and physical resulted in a change in clinical im-pression in 17% of cases, and led to successful abscess drain-age in eight cases in which it otherwise would not have been attempted (2). In another study of 126 patients, ultrasound correctly changed management in 48% of cases in which providers thought drainage was not needed on the basis of physical exam alone. Ultrasound also changed management in 73% of cases where drainage was thought to be needed, including 8 cases in which the location or depth of the incision was changed (11). Ultrasound has also been shown to improve
Skin and Soft Tissue Infection
Obvious abscessfluctuant or draining
Cellulitis nosuspicion of abscess
Possible or suspectedabscess no fluctuance
I&D
ED ultrasound Empiric antibioticsconsider
NSTI
Localizecollection
Abscess seen No abscess seenFIGURE 20.19. Approach to Skin and Soft Tissue Infections Incorporating Ultrasound. NSTI, necrotiz-ing soft tissue infection .
diagnostic accuracy and change management in pediatric skin and soft tissue infections (12,13). A study involving 50 chil-dren found that bedside ultrasound changed management in 22% of cases and had a sensitivity of 90% and a specificity of 83% in detecting fluid collections requiring drainage (14). 8PEDIATRIC CONSIDERATIONS: An important consideration in children is that abscess drainage may require conscious seda-tion with its attendant risks. Correct identification of soft tissue infections by ultrasound helps reduce unnecessary interven-tions.7 Ultrasound may be particularly useful in abscesses occurring around the head and neck and in the groin, where vascular structures are numerous (Figs. 20.13 and 20.14) and in sites where prior infections and surgical scars can alter the surface presentation of an underlying pus pocket (15–18). (See Case at the end of the chapter.)
NSTI can be rapidly fatal without prompt recognition and definitive surgical debridement. Yet accurate diagnosis remains notoriously difficult. Plain x-rays are insensitive, whereas CT and MRI may be impractical in an unstable patient. Although the role of bedside ultrasound remains to be defined, findings of marked subcutaneous edema, fluid adjacent to fascia and subcutaneous gas support the diagno-sis and may be sufficient confirmatory evidence to proceed to surgery (4–7). With the possible exception of MRI, no imaging modality is considered sensitive enough to exclude the diagnosis of necrotizing soft tissue infection once it is suspected on clinical grounds. A low threshold for surgical exploration should be maintained regardless of the results of imaging.
SOFT TISSUE FOREIGN BODYClinical ApplicationsRetained foreign bodies can complicate skin and soft tis-sue injuries. Despite their usual superficial location, foreign bodies are difficult to detect by history and physical exam alone and are frequently overlooked. In a retrospective re-view of 200 patients referred for evaluation of retained for-eign bodies in the hand, 38% were misdiagnosed on their index visit (19). Missed foreign bodies are also one of the most common causes of malpractice claims against emer-gency physicians (20,21). In the case of a suspected soft

Chapter 20 / Skin and Soft Tissue 291
described in the section on soft tissue infection. In addition, the hands and feet have superficial tendons that are easily visualized by ultrasound. Tendons have a characteristic in-ternal fibrillar pattern and appear as echogenic, ovoid, or linear structures, depending on whether scanned in trans-verse or longitudinal planes. Interestingly, tendons appear hypoechoic when imaged obliquely (27).
PathologyThe most common soft-tissue foreign bodies are glass, wood, and metal (19,28,29). All foreign bodies appear hyperechoic and, depending on their composition and proximity to cer-tain anatomic structures, will display variable degrees of acoustic shadowing or reverberation artifact (22,23,30–33). Gravel and wood cast a characteristic acoustic shadow sim-ilar to that of a gallstone (Fig. 20.21) (22,32,33). A large wood fragment with its brightly echogenic anterior surface can easily be mistaken for bone (Fig. 20.22). Metallic ob-jects frequently display a comet tail, or a reverberation artifact in which bright, regularly spaced parallel lines are seen distal to the foreign body (Fig. 20.23) (23,32,34). The acoustic profile of glass is less consistent—acoustic shad-ows, comet-tail artifacts, and diffuse beam scattering can be seen (Fig. 20.24) (22,32,35,36). Foreign bodies retained for longer than 24 to 48 hours are frequently surrounded by an echolucent halo, resulting from reactive hyperemia, edema,
tissue foreign body, ultrasound can be used to accomplish the following:
1. Detect radiolucent foreign bodies not visible on plain radiographs;
2. Localize and characterize foreign bodies and surround-ing structures; and
3. Facilitate foreign body removal. (Ultrasound-guided for-eign body removal will be discussed in Chapter 22.)
Image AcquisitionHigh frequency (7.5 to 10 MHz) linear array transducers are recommended for imaging small, superficially located foreign bodies because of their excellent resolution and shallow focal zone. Deeper objects may require a lower frequency transducer that affords greater tissue penetration. Foreign bodies are difficult to locate—a slow methodical scanning approach is mandatory. Foreign bodies are best visualized when the plane of scanning is either directly par-allel to the long axis of the object or directly perpendicu-lar to it (22,23). Scanning must occur in multiple planes because conventional transverse and longitudinal orienta-tions may miss small, obliquely oriented foreign bodies. Sterile technique has been recommended when scanning open wounds or performing ultrasound-guided procedures, but the necessity of this practice is doubtful, provided the wound is later irrigated. Probe covers should be used when scanning open wounds, however, to prevent nosocomial spread of pathogens.
Near-field acoustic dead space, which occurs immedi-ately adjacent to the transducer surface and is broader when scanning with lower frequencies, can impede the identifi-cation of very superficial objects. To compensate, standoff pads may be necessary. Standoff pads are made of a low acoustic impedance material and elevate the transducer from the skin surface, eliminating the near-field dead space and bringing superficial objects into the transducer’s focal zone. Standoff pads range from commercially manufactured mod-els to water-filled latex gloves or small bags of saline (250 to 500 cm3). In many cases, however, a liberal amount of acoustic gel will suffice. Commercial pads can be trimmed to various sizes and are less prone to slipping, which makes them useful for scanning small, awkward surfaces such as fingers, toes, and web spaces. A water-bath technique, in which the extremity is scanned while submerged in a bath of water, represents an alternative to the standoff pad. Com-pared to direct contact with gel, the water-bath technique is easy to perform and provides superior images of tendons and foreign bodies (24,25), and may be the preferred imag-ing technique when the area being scanned is too tender for the patient to tolerate direct contact of the ultrasound probe (26).
Ultrasound AnatomyForeign bodies frequently lodge in hands and feet in close proximity to sensitive structures with complex anatomy, which makes sonography difficult. Familiarity with the normal ultrasonographic anatomy is therefore essential (Fig. 20.20). The normal appearance of skin and subcuta-neous structures, including fascia, muscle, and bone, is
FIGURE 20.20. Normal Hand Anatomy . A: Volar surface of hand at meta-carpophalangeal (MCP) joint, longitudinal view . B: Volar surface of hand at MCP joint, transverse view . mc, metacarpal; pp, proximal phalanx; arrow-head, MCP joint; open arrow, flexor tendon .
mcpp
A
B

292 SeCtion Vii / Soft Tissue and Musculoskeletal Conditions
abscess, or granulation tissue, which may aid in their identi-fication (Fig. 20.25) (22,23,30,33,37).
Artifacts and PitfallsBoth detection and retrieval of foreign bodies using ultra-sound is technically very challenging. The relatively large lin-ear transducers available in EDs make scanning in areas such as the fingers and toes tricky. Contact may be limited to a small portion of the transducer surface, creating a small field of view and peripheral artifacts. Moreover, certain anatomic areas are almost impossible to scan, such as the web spaces between digits, which can lead to missed foreign bodies (22).
FIGURE 20.21. Wood Foreign Bodies . Tissue model containing a wood splinter demonstrating acoustic shadows, short (A) and long (B) axis views . (Courtesy of Brian Keegan .) Wood splinter in the plantar aspect of the heel (C) . Short axis view, using commercial standoff pad . Note shadowing . (Courtesy of Robert Jones, DO .)
FIGURE 20.22. Wood Foreign Body in Toe, Long Axis View. (Courtesy of Tim Gibbs, RDMS .)
Makeshift standoff pads are cumbersome and frequently slip off the area being scanned. Attempts at maintaining sterility may be futile. Ultrasound detection of foreign bodies is time consuming. In one report, exam times by radiologists aver-aged 10 minutes and extended up to 30 minutes (22).
Though most foreign bodies can be identified by ultra-sound, false-negative results can occur. Superficial foreign bodies may be overlooked when low-frequency transduc-ers are used and acoustic dead space is not overcome by standoff pads. Small objects may simply exceed the limit of a transducer’s resolution. Foreign bodies may be mis-taken for hyperechoic anatomic structures such as bone or tendon. Overlying bone or trapped air can hide foreign bod-ies (23,31). Air is usually present under large skin defects or introduced during anesthetic infiltration, probing, or dissec-tion. Steady transducer pressure over open wounds may dis-place air and help minimize artifact. False-positive results can arise from vascular and tissue calcifications, sesamoid bones, ossified cartilage, scar tissue, hemorrhage, entrapped air, and keratin plugs (29,31,38–40). Comparison to the contralateral extremity is an invaluable internal control, helping to distinguish a foreign body from normal anatomy. Finally, there is the potential for multiple foreign bodies, which in one study were correctly identified by emergency physicians only 25% to 36% of the time (41).
Comparison with Other Imaging ModalitiesNo single imaging technique will identify all foreign bodies. The majority of retained foreign bodies will be identified by standard, two-view radiography (19,28). X-rays are 100% sensitive for metallic objects and nearly 100% sensitive for
A B
C

Chapter 20 / Skin and Soft Tissue 293
FIGURE 20.23. Metallic Foreign Bodies . Tissue model containing sew-ing needle demonstrating reverberation artifact, short (A) and long (B) axis views . (Courtesy of Brian Keegan .) Copper wire in the foot with reverberation artifact (C) . (Courtesy of Tim Gibbs, RDMS .)
glass particles, regardless of composition (28,42). Gravel particles are also visible (43). However, x-ray does not readily identify radiolucent foreign bodies such as wood, plastic, and organic compounds such as thorns and cactus spines. Plain x-rays identify only 15% of retained wooden
particles (19). If clinical suspicion for a foreign body remains high despite negative x-rays, the diagnosis must be pursued with additional imaging modalities, such as ultrasound.
Ultrasound has emerged as the imaging modality of choice for foreign bodies that are radiolucent on plain films.
A B
C
FIGURE 20.24. Glass Foreign Bodies . A: Model containing a glass for-eign body demonstrating reverberation artifact . (Courtesy of Brian Keegan .) B: Glass foreign body in the foot without artifact . C: Glass foreign body (arrows) in the forearm with reverberation artifact . (B and C Courtesy of Tim Gibbs, RDMS .)
A
B
C

294 SeCtion Vii / Soft Tissue and Musculoskeletal Conditions
to 96.7% and a specificity of 70% to 82.9% for identification of sham and pre-implanted foreign bodies of glass, wood, metal, and gravel in a porcine belly model (41). The results were less impressive in a study of emergency physicians, with intentionally small, deep foreign bodies implanted in human cadavers. In 900 discreet foreign body or sham examinations, the sensitivity of ultrasound was 52.6% and specificity was 47.2% (59). In a prospective study of 131 wounds in a pediatric population, 12 foreign bodies were identified and recovered, producing a sensitivity of 66.2% and specificity of 96.6%, though the addition of plain x-ray identified two additional foreign bodies missed by ultra-sound (58).
Use of the Image in Clinical Decision MakingThe clinical approach to a suspected retained foreign body is outlined in Figure 20.26. The savvy clinician maintains a low threshold for ruling out foreign body in the face of a suspicious mechanism of injury or exam findings. Begin with plain x-rays. If radiographs are negative, and a radiolucent foreign body is a possible, proceed to ultrasound. If a foreign body is detected, one of three treatment strategies is chosen: expectant management, bedside extraction, or referral to a specialist.
Not all foreign bodies need to be extracted (60). As-ymptomatic, inert, and nonreactive foreign bodies, such as superficial shotgun pellets, may be left in place. Organic
Though CT and MRI have shown efficacy in detecting soft-tissue foreign bodies, their use is limited by cost, availability, and radiation exposure. Moreover, ultrasound was found to be more sensitive and accurate than CT in several studies. One study comparing ultrasound and CT demonstrated ac-curacies of 90% and 70% for radiolucent foreign body detec-tion, respectively (44). Other studies report the sensitivity of CT for the detection of soft-tissue foreign bodies to be poor, ranging from 0% to 60% (36,45,46).
Ultrasound can—in experienced hands—accurately de-tect small foreign bodies in a variety of tissue models, in-cluding beef cubes, chicken thighs, and human cadaver extremities (40,47–52). More importantly, ultrasound has been shown to be an accurate and sensitive modality for foreign body detection when used in the clinical setting (22,23,29,31,33,38,39,44,53). In 50 ED patients who were referred for sonography, radiologist-performed ultrasound was 95.4% sensitive and 89.2% specific in the detection of radiolucent foreign bodies (22). In a prospective analysis of 31 patients with suspected radiolucent foreign bodies who eventually underwent operative exploration, ultrasound by nonemergency physicians successfully identified 18 of 20 foreign bodies (44).
The literature on emergency physician-performed ultra-sound for foreign body detection is mostly limited to in vitro experiments and observational case series (54–59). A recent study of 6 emergency physicians and 14 trainees including 400 sonographic examinations found a sensitivity of 85.7%
FIGURE 20.25. Wood Foreign Bodies with Surrounding Halos . A: Wood foreign body with surrounding fluid in volar pad of distal phalanx, long axis view . (Courtesy of Robert Jones, DO .) B: Wood foreign body with surround-ing fluid overlying the proximal interphalangeal (PIP) joint, long axis view . C: Bee stinger in leg with surrounding inflammatory capsule . (Courtesy of Tim Gibbs, RDMS .)
A
B
C

Chapter 20 / Skin and Soft Tissue 295
Doppler on solid masses can demonstrate increased vascular-ity, which can assist with correct categorization of the mass. Pertinent local structures including vessels, musculoskeletal structures, thyroid, bladder, and peritoneum should be identi-fied in order to assess their relationship to the undifferenti-ated mass. Comparison to the contralateral anatomic location is often helpful.
Normal Ultrasound AnatomyNormal skin and soft tissue appearance has been described earlier in the chapter. Identification of important structures nearby or adjacent to the mass in question is vital. When evaluating the neck, the sonographer should recognize the normal thyroid; it has a homogenous echotexture similar to the spleen, is generally symmetrical, immediately anterior to the airway, and has a smooth contour. Reactive lymph nodes tend to have an oval shape, isoechoic cortex, and hyperechoic hilum (Fig. 20.27). When evaluating any mass, it is essential to recognize the surrounding normal anatomy.
PathologyThe first step in evaluating any mass is to define its location anatomically. Is it intrinsic to an identifiable structure (such as thyroid or testicle) or extrinsic? What are its anatomical relationships with surrounding structures? Once the location is defined, the mass should be characterized as solid or cystic (anechoic).
Simple cysts have four characteristics (Fig. 20.28; VIDEO 20 .9). They are typically round, with smooth reg-
ular walls containing anechoic fluid. Because they contain fluid, they demonstrate posterior wall enhancement (the far wall of a simple cyst is acoustically enhanced and appears thicker and more echogenic than the near wall) and increased through-transmission (the area immediately posterior to a cyst is more echogenic than the area to either side of a cyst). Some cysts are mostly anechoic, but have internal septations or floating debris. Cysts with internal echoes or floating de-bris are classified as complex cysts.
Solid masses may be isoechoic, hypoechoic, or hyper-echoic. They may be homogeneous or heterogeneous. Some contain swirling patterns or calcifications. All structures
and reactive materials, such as wood, thorns, and cactus spines, generally should be removed because they cause inflammation and infection. Infected foreign bodies and those that cause pain, compromise function, or penetrate joints should also be removed. Consider specialty consul-tation and referral when a foreign body is deeply embed-ded or in close proximity to an anatomically sensitive area, such as a joint (19).
Before attempting an extraction procedure, ultrasound should be used to precisely locate the foreign body. Unlike standard x-rays, ultrasound can accurately determine an ob-ject’s size, depth, course, three-dimensional orientation, and relationship with surrounding structures. This information is used to guide removal, allowing smaller incision sizes, and leading to less tissue dissection (23).
EVALUATION OF SOFT TISSUE MASSESClinical ApplicationBedside ultrasonography provides the ability to rapidly as-sess and categorize soft tissue masses. The case of an undif-ferentiated neck mass causing airway compromise represents an emergent scenario where rapid bedside ultrasound can profoundly affect the care of a patient (61). Distinguish-ing a simple cyst from a pseudoaneurysm can save a prac-titioner from catastrophe. While the correct categorization of most soft tissue masses is less emergent, ultrasound can nonetheless be invaluable in directing further evaluation and treatment.
Image AcquisitionSonographic evaluation of soft tissue masses is performed in a similar fashion as described for soft tissue infections and foreign body detection. Masses are best scanned with a 5 to 7.5 MHz linear array transducer. All masses should be interrogated in two planes to define their shape and depth. Superficial masses can be scanned using a standoff pad or water bath. The use of color Doppler is recommended for all hypoechoic masses. This is crucial for masses that lie near known vascular structures, because the mass may actu-ally be an aneurysm or pseudoaneurysm. The use of color
Foreign body?
X-ray
Radiolucent possible?
EDUltrasound
AssessriskLow risk FB
• Inert• Asymptomatic
Close f/u
Surgical referral
High risk FB• Organic material• Painful• Infected• Tendon, joint penetration
Management
Notremoved
Close f/u
Removed
No
Ultrasound-guided removal• Incision (superficial FB)• Forceps-removal (linear, superficial FB)• Needle-localization (irregularly shaped, deep FB)
Yes
+ –
–+
FIGURE 20.26. Approach to a Suspected Foreign Body.

296 SeCtion Vii / Soft Tissue and Musculoskeletal Conditions
should be checked for vascular flow with Doppler and char-acterized as vascularized or not.
Soft tissue masses can have a variety of appearances, depending on their origin. Table 20.1 lists the common enti-ties that produce soft tissue masses. Once a mass has been characterized in terms of its ultrasonographic appearance, a presumptive diagnosis can often be made. Types of hypoechoic masses include dermoid or epidermoid cysts (Fig. 20.28), abscess, seroma, or hematoma (if postopera-tive); and vascular structures such as aneurysm, pseudoan-eurysm, hemangioma; or malignancy, such as a sarcoma, which may be heterogeneous. An abscess or cyst should have little to no vascular flow. An aneurysm will display ve-nous or arterial pulsations, may be collapsible with pressure
FIGURE 20.27. A: Normal appearance of lymph node . (Courtesy of Brie Zaia, MD and Nathan Teismann, MD, Highland Hospital .) B: Reactive lymph node . (Courtesy Arun Nagdev, MD and Nathan Teismann, MD, Highland Hospital .)
HyperechoicHilum
Hypoechoiccortex
HyperechoicHilum
Hypoechoiccortex
A B
FIGURE 20.28. Subcutaneous Cyst . A: Nontender cyst on the upper back, present for 3 months . B: Ultrasonographic appearance of the cyst . Note the smooth border around an anechoic fluid collection without surrounding edema that would indicate cellulitis .
A
Cystcavity
Cyst wallwithoutedema
Cyst wallwithoutedema
Posterioracoustic
enhancement
B
TABLE 20.1 Potential Etiologies of Soft Tissue Masses
HYPOECHOIC
Vascular Artery or vein Aneurysm Pseudoaneurysm Hemangioma NeoplasmNonvascular Cyst (sebaceous, epidermal inclusion, etc) Abscess Hematoma Postoperative seroma Neoplasm
HYPERECHOIC OR ISOECHOIC
Lymph node, reactive Thyroid nodule Abscess or phlegmon Subacute hematoma or seroma Neoplasm
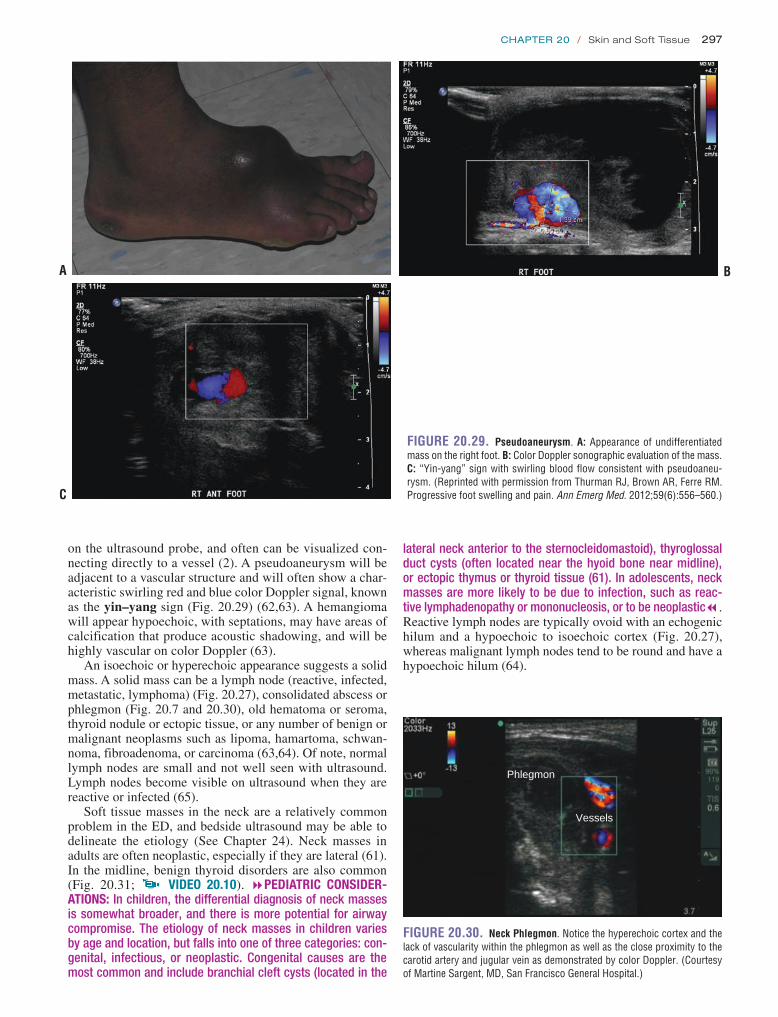
Chapter 20 / Skin and Soft Tissue 297
lateral neck anterior to the sternocleidomastoid), thyroglossal duct cysts (often located near the hyoid bone near midline), or ectopic thymus or thyroid tissue (61). In adolescents, neck masses are more likely to be due to infection, such as reac-tive lymphadenopathy or mononucleosis, or to be neoplastic7. Reactive lymph nodes are typically ovoid with an echogenic hilum and a hypoechoic to isoechoic cortex (Fig. 20.27), whereas malignant lymph nodes tend to be round and have a hypoechoic hilum (64).
on the ultrasound probe, and often can be visualized con-necting directly to a vessel (2). A pseudoaneurysm will be adjacent to a vascular structure and will often show a char-acteristic swirling red and blue color Doppler signal, known as the yin–yang sign (Fig. 20.29) (62,63). A hemangioma will appear hypoechoic, with septations, may have areas of calcification that produce acoustic shadowing, and will be highly vascular on color Doppler (63).
An isoechoic or hyperechoic appearance suggests a solid mass. A solid mass can be a lymph node (reactive, infected, metastatic, lymphoma) (Fig. 20.27), consolidated abscess or phlegmon (Fig. 20.7 and 20.30), old hematoma or seroma, thyroid nodule or ectopic tissue, or any number of benign or malignant neoplasms such as lipoma, hamartoma, schwan-noma, fibroadenoma, or carcinoma (63,64). Of note, normal lymph nodes are small and not well seen with ultrasound. Lymph nodes become visible on ultrasound when they are reactive or infected (65).
Soft tissue masses in the neck are a relatively common problem in the ED, and bedside ultrasound may be able to delineate the etiology (See Chapter 24). Neck masses in adults are often neoplastic, especially if they are lateral (61). In the midline, benign thyroid disorders are also common (Fig. 20.31; VIDEO 20 .10). 8PEDIATRIC CONSIDER-ATIONS: In children, the differential diagnosis of neck masses is somewhat broader, and there is more potential for airway compromise. The etiology of neck masses in children varies by age and location, but falls into one of three categories: con-genital, infectious, or neoplastic. Congenital causes are the most common and include branchial cleft cysts (located in the
B
FIGURE 20.29. Pseudoaneurysm . A: Appearance of undifferentiated mass on the right foot . B: Color Doppler sonographic evaluation of the mass . C: “Yin-yang” sign with swirling blood flow consistent with pseudoaneu-rysm . (Reprinted with permission from Thurman RJ, Brown AR, Ferre RM . Progressive foot swelling and pain . Ann Emerg Med . 2012;59(6):556–560 .)
A
C
FIGURE 20.30. Neck Phlegmon . Notice the hyperechoic cortex and the lack of vascularity within the phlegmon as well as the close proximity to the carotid artery and jugular vein as demonstrated by color Doppler . (Courtesy of Martine Sargent, MD, San Francisco General Hospital .)
Vessels
Phlegmon
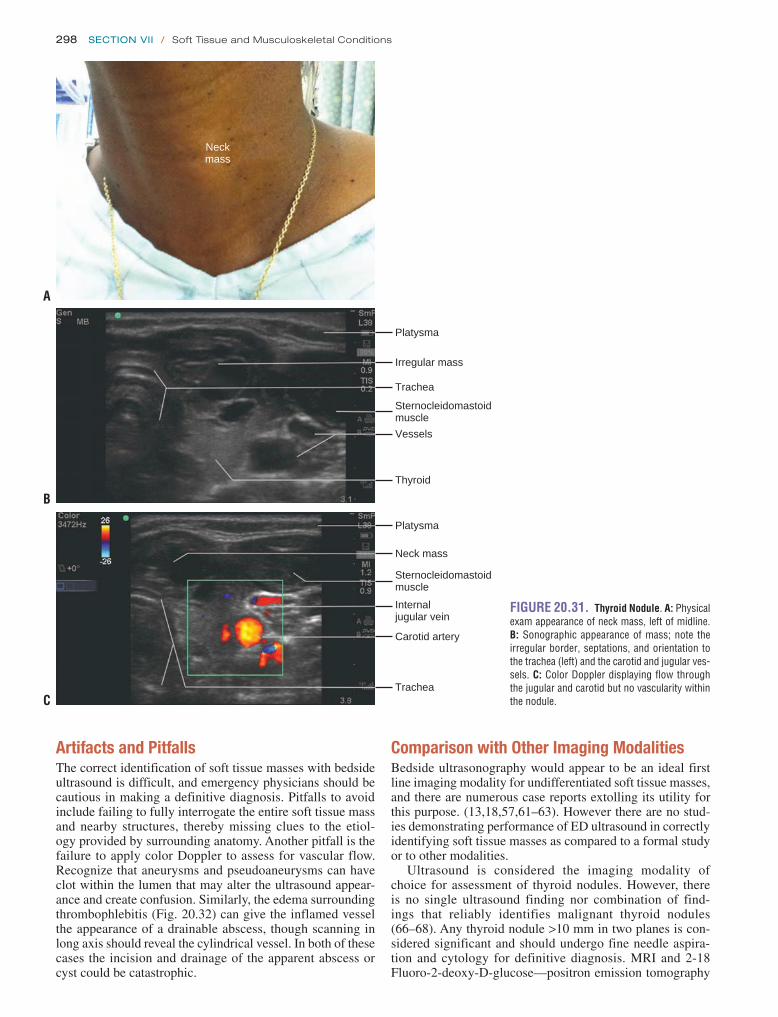
298 SeCtion Vii / Soft Tissue and Musculoskeletal Conditions
Comparison with Other Imaging ModalitiesBedside ultrasonography would appear to be an ideal first line imaging modality for undifferentiated soft tissue masses, and there are numerous case reports extolling its utility for this purpose. (13,18,57,61–63). However there are no stud-ies demonstrating performance of ED ultrasound in correctly identifying soft tissue masses as compared to a formal study or to other modalities.
Ultrasound is considered the imaging modality of choice for assessment of thyroid nodules. However, there is no single ultrasound finding nor combination of find-ings that reliably identifies malignant thyroid nodules (66–68). Any thyroid nodule >10 mm in two planes is con-sidered significant and should undergo fine needle aspira-tion and cytology for definitive diagnosis. MRI and 2-18 Fluoro-2-deoxy-D-glucose—positron emission tomography
FIGURE 20.31. Thyroid Nodule . A: Physical exam appearance of neck mass, left of midline . B: Sonographic appearance of mass; note the irregular border, septations, and orientation to the trachea (left) and the carotid and jugular ves-sels . C: Color Doppler displaying flow through the jugular and carotid but no vascularity within the nodule .
Neckmass
Platysma
Irregular mass
Trachea
Sternocleidomastoidmuscle
Vessels
Thyroid
Platysma
Neck mass
Trachea
Sternocleidomastoidmuscle
Carotid artery
Internaljugular vein
A
B
C
Artifacts and PitfallsThe correct identification of soft tissue masses with bedside ultrasound is difficult, and emergency physicians should be cautious in making a definitive diagnosis. Pitfalls to avoid include failing to fully interrogate the entire soft tissue mass and nearby structures, thereby missing clues to the etiol-ogy provided by surrounding anatomy. Another pitfall is the failure to apply color Doppler to assess for vascular flow. Recognize that aneurysms and pseudoaneurysms can have clot within the lumen that may alter the ultrasound appear-ance and create confusion. Similarly, the edema surrounding thrombophlebitis (Fig. 20.32) can give the inflamed vessel the appearance of a drainable abscess, though scanning in long axis should reveal the cylindrical vessel. In both of these cases the incision and drainage of the apparent abscess or cyst could be catastrophic.

Chapter 20 / Skin and Soft Tissue 299
In many cases, the ED ultrasound provides a tentative diagnosis. If the etiology seems benign, such as a sus-pected congenital or simple cyst, thyroid nodule or reac-tive lymph node, a consultative ultrasonographic study by radiology may be indicated for further evaluation in the outpatient setting. For those cases where a serious or emer-gent etiology is suspected based on the bedside ultrasound, such as a mass impinging on a vital structure (airway, great vessels), an aneurysm, pseudoaneurysm, or malignancy, an immediate definitive study such as a CT scan, MRI, or emergent formal ultrasound may be required. If a confident diagnosis cannot be made with the bedside ultrasound, fur-ther diagnostic studies may be needed depending on the concern such as consultative ultrasound, CT scan, MRI, or biopsy (61).
(FDG-PET) scans offer little advantage over high-resolution ultrasound for thyroid nodules (66,67). Ultrasound is also considered a modality of choice for assessment and diagno-sis of pseudoaneurysms (69), although angiography and CT angiography can also be used.
Use of the Image in Clinical Decision MakingThe clinical approach to undifferentiated soft tissue masses using bedside ultrasound is shown in Figure 20.33. The mass should be classified as hypoechoic or iso/hyperechoic, and further as homogeneous or heterogeneous. The relationship to surrounding structures should be fully assessed and color Doppler employed both to assess vascularity within the mass and to search for nearby vessels.
Deepmuscle
Irregular fluidfilled structurewith surroundingedema
Compressiblevein
Deep muscle
FIGURE 20.32. Thrombophlebitis . A: An apparent fluid-filled structure with surrounding edema fluid . B: Further scanning reveals the structure to be a vein that is easily compressible . (Courtesy Nathan Teismann, MD, University of California, San Francisco .)
A B
FIGURE 20.33. Approach to Undifferentiated Soft Tissue Mass.
Skin and soft tissue mass
Airway/vascular compromise? Immediate Intervention
Isoechoic or hyperechoic
NO
YES
Hypoechoic
Vascular Non-Vascular
• cyst• abscess• hematoma/seroma• neoplasm
• lymph node• abscess/phlegmon• old hematoma/seroma• thyroid• neoplasm
• blood vessel• aneurysm• pseudoaneurysm• hemangioma• neoplasm
Bedside Ultrasound

300 SeCtion Vii / Soft Tissue and Musculoskeletal Conditions
FIGURE 20.34. Occult Abdominal Wall Abscess. A: Physical exam of the abdominal wall demonstrating diffuse erythema and multiple scars, without drainage or fluctuance . B: ED ultrasound showing abdominal wall abscess and underlying peritoneum . C: CT scan showing abscess with sur-rounding inflammatory changes .
A
C
B
CLINICAL CASEA 55-year-old man presents to the ED complaining of abdominal wall pain. The previous day he was diagnosed with abdominal wall cellulitis, and oral antibiotics were prescribed, but erythema and pain had worsened and fever developed. There was a history of diabetes and renal fail-ure currently treated with hemodialysis, but previously treated with peritoneal dialysis. Surgical history included peritoneal dialysis catheter placement, incision and drain-age of a prior abdominal wall abscess, and appendectomy. The temperature was 38.2°C, and the abdominal wall had multiple old scars, was diffusely erythematous and ten-der (Fig. 20.34A). ED ultrasound revealed a hypoechoic spherical mass in the abdominal wall 1.5 cm below the skin (Fig. 20.34B). CT scan confirmed the presence of an abdominal wall abscess (Fig. 20.34C). The patient was admitted to the surgical service and the following day underwent an uncomplicated incision and drainage proce-dure in the operating room.
REFERENCES 1. Yen ZS, Wang HP, Ma HM, et al. Ultrasonographic screening
of clinically-suspected necrotizing fasciitis. Acad Emerg Med. 2002;9(12):1448–1451.
2. Squire BT, Fox JC, Anderson C. ABSCESS: applied bedside sonogra-phy for convenient evaluation of superficial soft tissue infections. Acad Emerg Med. 2005;12(7):601–606.
3. Loyer EM, Kaur H, David CL, et al. Importance of dynamic assessment of the soft tissues in the sonographic diagnosis of echogenic superficial abscesses. J Ultrasound Med. 1995;14(9):669–671.
4. Chau CL, Griffith JF. Musculoskeletal infections: ultrasound appear-ances. Clin Radiol. 2005;60(2):149–159.
5. Butcher CH, Dooley RW, Levitov AB. Detection of subcutaneous and intramuscular air with sonography: a sensitive and specific modality. J Ultrasound Med. 2011;30(6):791–795.
6. Hosek WT, Laeger TC. Early diagnosis of necrotizing fasciitis with soft tissue ultrasound. Acad Emerg Med. 2000;16(10):1033.
7. Wronski M, Slodkowski M, Cebulski W, et al. Necrotizing fasciitis: early sonographic diagnosis. J Clin Ultrasound. 2011;39(4):236–239.
8. Wall DB, de Virgilio C, Black S, et al. Objective criteria may assist in distinguishing necrotizing fasciitis from nonnecrotizing soft tissue infec-tion. Am J Surg. 2000;179:17–21.

Chapter 20 / Skin and Soft Tissue 301
magnetic resonance imaging, and ultrasound. An in vitro study. Int J Oral Maxillofac Surg. 1993;22(2):119–124.
37. Davae KC, Sofka CM, DiCarlo E, et al. Value of power Doppler imag-ing and the hypoechoic halo in the sonographic detection of foreign bodies: correlation with histopathologic findings. J Ultrasound Med. 2003;22(12):1309–1313; quiz1314–1316.
38. Crawford R, Matheson AB. Clinical value of ultrasonography in the detection and removal of radiolucent foreign bodies. Injury. 1989;20(6):341–343.
39. Blankstein A, Cohen I, Heiman Z, et al. Ultrasonography as a diagnostic modality and therapeutic adjuvant in the management of soft tissue for-eign bodies in the lower extremities. Isr Med Assoc J. 2001;3(6):411–413.
40. Jacobson JA, Powell A, Craig JG, et al. Wooden foreign bodies in soft tissue: detection at US. Radiology. 1998;206(1):45–48.
41. Nienaber A, Harvey M, Cave G. Accuracy of bedside ultrasound for the detection of soft tissue foreign bodies by emergency doctors. Emerg Med Australas. 2010;22(1):30–34.
42. Tandberg D. Glass in the hand and foot. Will an X-ray film show it? JAMA. 1982;248(15):1872–1874.
43. Chisholm CD, Wood CO, Chua G, et al. Radiographic detection of gravel in soft tissue. Ann Emerg Med. 1997;29(6):725–730.
44. Al-Zahrani S, Kremli M, Saadeddin M, et al. Ultrasonography detec-tion of radiolucent foreign bodies in soft tissue compared to computed tomography scan. Ann Saudi Med. 1995;15(2):110–112.
45. Bodne D, Quinn SF, Cochran CF. Imaging foreign glass and wooden bodies of the extremities with CT and MR. J Comput Assist Tomogr. 1988;12(4):608–611.
46. Ginsburg MJ, Ellis GL, Flom LL. Detection of soft-tissue foreign bodies by plain radiography, xerography, computed tomography, and ultraso-nography. Ann Emerg Med. 1990;19(6):701–703.
47. Bray PW, Mahoney JL, Campbell JP. Sensitivity and specificity of ultra-sound in the diagnosis of foreign bodies in the hand. J Hand Surg Am. 1995;20(4):661–666.
48. Blyme PJ, Lind T, Schantz K, et al. Ultrasonographic detection of for-eign bodies in soft tissue. A human cadaver study. Arch Orthop Trauma Surg. 1990;110(1):24–25.
49. Turner J, Wilde CH, Hughes KC, etal. Ultrasound-guided retrieval of small foreign objects in subcutaneous tissue. Ann Emerg Med. 1997;29(6):731–734.
50. Hill R, Conron R, Greissinger P, et al. Ultrasound for the detection of foreign bodies in human tissue. Ann Emerg Med. 1997;29(3):353–356.
51. Orlinsky M, Knittel P, Feit T, et al. The comparative accuracy of radio-lucent foreign body detection using ultrasonography. Am J Emerg Med. 2000;18(4):401–403.
52. Schlager D, Sanders AB, Wiggins D. Ultrasound for the detection of foreign bodies. Ann Emerg Med. 1991;20(2):189–191.
53. Blankstein A, Cohen I, Heiman Z, et al. Localization, detection and guided removal of soft tissue in the hands using sonography. Arch Or-thop Trauma Surg. 2000;120(9):514–517.
54. Orlinsky M, Knittel P, Feit T, et al. The comparative accuracy of radio-lucent foreign body detection using ultrasonography. Am J Emerg Med. 2000;18(4):401–403.
55. Graham DD Jr. Ultrasound in the emergency department: detection of wooden foreign bodies in the soft tissues. J Emerg Med. 2002;22:75–79.
56. Dean AJ, Gronczewski CA, Costantino TG. Technique for emergency medicine bedside ultrasound identification of a radiolucent foreign body. J Emerg Med. 2003;24(3):303–308.
57. Teng M, Doniger SJ. Subungual wooden splinter visualized with bedside sonography. Pediatr Emerg Care. 2012;28(4):392–394.
58. Friedman DI, Forti RJ, Wall SP. The utility of bedside ultrasound and patient perception in detecting soft tissue foreign bodies in children. Pediatr Emerg Care. 2005;21(8):487–492.
59. Crystal CS, Masneri DA, Hellums JS, et al. Bedside ultrasound for the detection of soft tissue foreign bodies: a cadaveric study. J Emerg Med. 2009;36(4):377–380.
60. Lammers RL, Magill T. Detection and management of foreign bodies in soft tissue. Emerg Med Clin North Am. 1992;10(4):767–781.
61. Chavez C, Dickman E, Haines L. The use of bedside ultrasonography in the evaluation of a neck mass. Am J Emerg Med. 2012;30(2):389.e3–389.e4.
9. Cardinal E, Bureau NJ, Aubin B, et al. Role of ultrasound in musculo-skeletal infections. Radiol Clin North Am. 2001;39:191–201.
10. Berger T, Garrido F, Green J, et al. Bedside ultrasound performed by novices for the detection of abscess in ED patients with soft tissue infec-tions. Am J Emerg Med. 2012;30(8):1569–1573.
11. Tayal VS, Hasan N, Norton HJ, et al. The effect of soft-tissue ultra-sound on the management of cellulitis in the emergency department. Acad Emerg Med. 2006;13(4):384–388.
12. Iverson K, Haritos D, Thomas R, et al. The effect of bedside ultrasound on diagnosis and management of soft tissue infections in a pediatric ED. Am J Emerg Med. 2012;30(8):1347–1351.
13. Ramirez-Schrempp D, Dorfman DH, Baker WE, et al. Ultrasound soft-tissue applications in the pediatric emergency department: to drain or not to drain? Pediatr Emerg Care. 2009;25(1):44–48.
14. Sivitz AB, Lam SH, Ramirez-Schrempp D, et al. Effect of bedside ultra-sound on management of pediatric soft-tissue infection. J Emerg Med. 2010;39(5):637–643.
15. Sandler MA, Alpern MB, Madrazo BL, et al. Inflammatory lesions of the groin: ultrasonic evaluation. Radiology. 1984;151(3):747–750.
16. Yusa H, Yoshida H, Ueno E, et al. Ultrasound-guided surgical drainage of face and neck abscesses. Int J Oral Maxillofac Surg. 2002;31(3):327–329.
17. Blaivas M. Ultrasound-guided breast abscess aspiration in a difficult case. Acad Emerg Med. 2001;8(4):398–401.
18. Gaspari RJ. Bedside ultrasound of the soft tissue of the face: a case of early Ludwig’s angina. J Emerg Med. 2006;31(3):287–291.
19. Anderson MA, Newmeyer WL, Kilgore ES Jr. Diagnosis and treatment of retained foreign bodies in the hand. Am J Surg. 1982;144(1):63–67.
20. Trautlein JJ, Lambert RL, Miller J. Malpractice in the emergency department—review of 200 cases. Ann Emerg Med. 1984;13(9, pt 1): 709–711.
21. Roberts J. Soft tissue foreign bodies. Emerg Med Amb Care News. 1988;10(2):2–6.
22. Gilbert FJ, Campbell RS, Bayliss AP. The role of ultrasound in the detec-tion of non-radiopaque foreign bodies. Clin Radiol. 1990;41(2):109–112.
23. Shiels WE, Babcock DS, Wilson JL, et al. Localization and guided re-moval of soft-tissue foreign bodies with sonography. AJR. Am J Roent-genol. 1990;155(6):1277–1281.
24. Siezenski PR, Leech SJ, Gukhool J, et al. ED ultrasound evaluation of the index flexor tendon: a comparison of water-bath evaluation tech-nique (WET) versus direct contact ultrasound. 2003;10:573a (abstract).
25. Leech SJ, Blaivas M, Gukhool J, et al. Water-bath vs direct contact ultra-sound: a randomized, controlled, blinded image review (abstract). Acad Emerg Med. 2003;10:573a.
26. Blaivas M, Lyon M, Brannam L, et al. Water bath evaluation technique for emergency ultrasound of painful superficial structures. Am J Emerg Med. 2004;22(7):589–593.
27. Fornage BD. The hypoechoic normal tendon. A pitfall. J Ultrasound Med. 1987;6(1):19–22.
28. Morgan WJ, Leopold T, Evans R. Foreign bodies in the hand. J Hand Surg Br. 1984;9(2):194–196.
29. Gooding GA, Hardiman T, Sumers M, et al. Sonography of the hand and foot in foreign body detection. J Ultrasound Med. 1987;6(8):441–447.
30. Fornage BD, Schernberg FL, Rifkin MD. Ultrasound examination of the hand. Radiology. 1985;155(3):785–788.
31. Banerjee B, Das RK. Sonographic detection of foreign bodies of the extremities. Br J Radiol. 1991;64(758):107–112.
32. Horton LK, Jacobson JA, Powell A, et al. Sonography and ra-diography of soft-tissue foreign bodies. AJR. Am J Roentgenol. 2001;176(5):1155–1159.
33. Rockett MS, Gentile SC, Gudas CJ, et al. The use of ultrasonography for the detection of retained wooden foreign bodies in the foot. J Foot Ankle Surg. 1995;34:478–484; discussion 510–511.
34. Scanlan KA. Sonographic artifacts and their origins. AJR. Am J Roent-genol. 1991;156(6):1267–1272.
35. Donaldson JS. Radiographic imaging of foreign bodies in the hand. Hand Clin. 1991;7(1):125–134.
36. Oikarinen KS, Nieminen TM, Mäkäräinen H, et al. Visibility of for-eign bodies in soft tissue in plain radiographs, computed tomography,

302 SeCtion Vii / Soft Tissue and Musculoskeletal Conditions
66. Khalessi A, Phan-Thien KC. Imaging of the thyroid gland. N Z Med J. 2011;124(1342):82–88.
67. Jin J, McHenry CR. Thyroid incidentaloma. Best Pract Res Clin Endo-crinol Metab. 2012;26(1):83–96.
68. Anil G, Hegde A, Chong FH. Thyroid nodules: risk stratification for malignancy with ultrasound and guided biopsy. Cancer Imaging. 2011;11:209–223.
69. Ahmad F, Turner SA, Torrie P, et al. Iatrogenic femoral artery pseudoan-eurysms—a review of current methods of diagnosis and treatment. Clin Radiol. 2008;63(12):1310–1316.
62. Thurman RJ, Brown AR, Ferre RM. Progressive foot swelling and pain: posttraumatic dorsalis pedis pseudoaneurysm. Ann Emerg Med. 2012;59(6):556–560.
63. Kim EY, Ko EY, Han BK, et al. Sonography of axillary masses: what should be considered other than the lymph nodes? J Ultrasound Med. 2009;28(7):923–939.
64. Schmid-Wendtner MH, Dill-Müller D. Ultrasound technology in derma-tology. Semin Cutan Med Surg. 2008;27(1):44–51.
65. Gritzmann N, Hollerweger A, Macheiner P, et al. Sonography of soft tissue masses of the neck. J Clin Ultrasound. 2002;30(6):356–373.

303
CLINICAL APPLICATIONsUltrasound can be used to diagnose acute traumatic mus-culoskeletal pathology including fractures, joint effusions, and tears of tendons, ligaments, and muscles. It can also fa-cilitate the diagnosis of acute inflammatory and infectious musculoskeletal pathologic states such as arthritis, tendinitis, tenosynovitis, myositis, and bursitis. Lastly, a number of musculoskeletal procedures can be performed with the aid of ultrasound guidance.
IMAGE ACQUIsITIONEvaluation of musculoskeletal pathology is typically per-formed with a high frequency (5 to 17 MHz) linear array transducer. The majority of ultrasound systems used in ED practice provide 5 to 12 MHz transducers for general- purpose imaging (Fig. 21.1A). Less often, a low-frequency (3 to 5 MHz) curvilinear transducer can be used when im-aging structures, such as the hip, that are >4 to 5 cm deep (Fig. 21.1B).
Unlike imaging for other applications, the evaluation of musculoskeletal structures does not always include a land-mark approach. Instead, the probe should be placed directly over the suspected site of pathology or the patient’s point of maximal tenderness. The area should be examined in a
INTRODUCTIONAccording to the Centers for Disease Control, there are 2.6 million visits yearly to the emergency department (ED) for sports-related injuries, the majority of which are musculo-skeletal in nature (1). This accounts for 1 in every 4 visits and, in the 5- to 24-year-old age group, equates to 33.9 visits per 1000 persons. Radiologists and physiatrists have utilized ultra-sound to diagnose musculoskeletal pathology for >50 years (2). Ultrasound is becoming the most widely used modality in the evaluation of tendon pathology even when other advanced imaging modalities are readily available (3). Ultrasound is also the first mode of imaging available for muscle evaluation and remains the most useful modality to follow muscular trauma over time (4). Ultrasound use has continued to expand, partic-ularly in the pediatric population, in part due to physician and public awareness of the negative effects of radiation exposure from computed tomography (CT) scanning (5).
In the emergency medical care setting, musculoskeletal ultrasound has been used in the evaluation of military per-sonnel during combat, athletes on the sideline, and patients in remote settings with little or no access to standard imag-ing techniques. In the ED setting, musculoskeletal ultrasound has been shown to reduce the time to diagnosis, assist with difficult diagnoses, improve outcomes, and increase physi-cian ease with musculoskeletal procedures (6–10).
PATHOLOGY: INFLAMMATORY OR INFECTIOUs . . . . . . . . . 312Tendon . . . . . . . . . . . . . . . . . . . . . . . . . . . . . . . . . . . . 312Muscle . . . . . . . . . . . . . . . . . . . . . . . . . . . . . . . . . . . . 312Joint . . . . . . . . . . . . . . . . . . . . . . . . . . . . . . . . . . . . . . 313Bursa . . . . . . . . . . . . . . . . . . . . . . . . . . . . . . . . . . . . . . 313
ARTIFACTs AND PITFALLs . . . . . . . . . . . . . . . . . . . . . . . . . 314Artifacts . . . . . . . . . . . . . . . . . . . . . . . . . . . . . . . . . . . . 314Pitfalls . . . . . . . . . . . . . . . . . . . . . . . . . . . . . . . . . . . . . 315
COMPARIsON WITH OTHER IMAGING MODALITIEs . . . . . . . . . . . . . . . . . . . . . . . . . . . . . . . . . . 315Bone . . . . . . . . . . . . . . . . . . . . . . . . . . . . . . . . . . . . . . 316Tendon and Ligament . . . . . . . . . . . . . . . . . . . . . . . . . 316Muscle . . . . . . . . . . . . . . . . . . . . . . . . . . . . . . . . . . . . 316Joint and Bursa . . . . . . . . . . . . . . . . . . . . . . . . . . . . . . 316
CLINICAL CAsE . . . . . . . . . . . . . . . . . . . . . . . . . . . . . . . . . . 316
INTRODUCTION . . . . . . . . . . . . . . . . . . . . . . . . . . . . . . . . . . 303CLINICAL APPLICATIONs . . . . . . . . . . . . . . . . . . . . . . . . . . . 303IMAGE ACQUIsITION . . . . . . . . . . . . . . . . . . . . . . . . . . . . . . 303NORMAL ULTRAsOUND ANATOMY . . . . . . . . . . . . . . . . . . . 304
Cortical Bone . . . . . . . . . . . . . . . . . . . . . . . . . . . . . . . . 304Tendon . . . . . . . . . . . . . . . . . . . . . . . . . . . . . . . . . . . . 305Skeletal Muscle . . . . . . . . . . . . . . . . . . . . . . . . . . . . . . 306Joints . . . . . . . . . . . . . . . . . . . . . . . . . . . . . . . . . . . . . 306Ligaments . . . . . . . . . . . . . . . . . . . . . . . . . . . . . . . . . . 306Bursa . . . . . . . . . . . . . . . . . . . . . . . . . . . . . . . . . . . . . . 306
PATHOLOGY: TRAUMA . . . . . . . . . . . . . . . . . . . . . . . . . . . . . 306Bone . . . . . . . . . . . . . . . . . . . . . . . . . . . . . . . . . . . . . . 306Tendon . . . . . . . . . . . . . . . . . . . . . . . . . . . . . . . . . . . . 309Muscle . . . . . . . . . . . . . . . . . . . . . . . . . . . . . . . . . . . . 311Joint . . . . . . . . . . . . . . . . . . . . . . . . . . . . . . . . . . . . . . 312
Joy English
Musculoskeletal21

304 Section Vii / Soft Tissue and Musculoskeletal Conditions
the area requiring examination are placed in a shallow basin filled with water. The water then acts as a medium to conduct ultrasound waves to and from the area of interest without in-terruption. The technique has been shown to improve image quality without increasing patient discomfort (11).
NORMAL ULTRAsOUND ANATOMYCortical BoneCortical bone appears as a bright (hyperechoic) line that is continuous without disruption (Fig. 21.4A, B). It should appear the same in both the long and short axes with notable posterior acoustic shadowing seen in the far field of the im-age due to the densely calcified cortex.
When evaluating cortical bone, the soft tissue directly ad-jacent to the bone should also be thoroughly examined. The overlying soft tissue should appear homogeneous (Fig. 21.4C). If clinical concern exists for a fracture in the presence of nor-mal or indeterminate plain radiographs, any soft tissue ab-normality, although nonspecific, is considered pathologic and should prompt further investigation or treatment.8PEDIATRIC CONsIDERATIONs: In children, the evaluation
of bone is more complex due to open physes, which may easily be mistaken for a fracture. An open physis appears as a smooth line that curves downward from both directions and occurs in the expected, more distal sites of the bone. In contrast to an acute fracture, it does not have an abrupt step-off (Fig. 21.4D).
systematic manner that includes views in the longitudinal and transverse axes. The evaluation of fractures additionally includes visualization of the anterior and posterior cortices (Fig. 21.2). It is common to scan the contralateral unaffected side to obtain images that can be used as a comparison in cases where questionable sonographic findings are encountered.
Musculoskeletal ultrasound presents a few unique chal-lenges to the sonographer. First, most musculoskeletal structures are superficial, and the abnormal contour of the skin surface makes maintaining transducer scanning surface contact difficult. Second, certain musculoskeletal ultrasound evaluations, such as flexor tendon laceration assessment, involve longitudinal visualization during range of motion, which is difficult when the transducer is placed on the flexor surface of the finger. Lastly, the suspected site of pathology is often exquisitely painful, making direct transducer con-tact uncomfortable. A few measures can be taken to combat these difficulties. First, a modest amount of ultrasound gel should be placed between the transducer and the structure of interest. If this does not yield an adequate image, a water bath immersion or a stand-off pad may be helpful (Fig. 21.3). Water bath immersion becomes an important tool when the area of interest has abnormal contours, a small surface area for probe contact, and is painful to the patient, such as ten-don assessment in a finger or toe. Both the transducer and
FIGURE 21.1. Transducer Differentiation in Hip Imaging. A: High frequency linear transducer showing excellent resolution in the near field . I, iliopsoas; H, femoral head; AJR, anterior joint recess; N, femoral neck . B: Low frequency curvilinear transducer showing poor resolution in the near field but improved penetration into deeper structures . A, acetabulum; L, labrum; I, iliopsoas; H, femoral head; AJR, anterior joint recess; N, femoral neck .
I
HAJR
N
1+
+
A
I
L
A HAJR
N
B
FIGURE 21.2. Evaluation of Musculoskeletal Structures. A: Tibia long axis . B: Tibia short axis . T, Tibia .
A
B

chapter 21 / Musculoskeletal 305
FIGURE 21.3. Adjuncts to Obtain Appropriate Images. A: Water bath immersion . B: Stand-off pad .
A B
In cases of questionable sonographic findings, comparison plain radiographs should be obtained.7
TendonTendons have a characteristic homogeneous echogenic fibrillar appearance that represents collagen fibers run-ning in parallel. They are more dense and echogenic than
muscle. They should appear continuous without disruption and are best visualized in the long axis (Fig. 21.5A, B;
VIDEO 21 .1).Tendons exhibit a phenomenon unique to musculoskeletal
imaging: anisotropy. Anisotropy is an artifact that occurs when imaging tendons, ligaments, and nerves with a linear trans-ducer. These structures are optimally imaged parallel to the transducer, but when the angle of incidence and reflection are
FIGURE 21.4. Cortical Bone Evaluation. A: Humerus in long axis with posterior acoustic shadowing . H, humerus . B: Humerus in short axis . C: Normal soft tissue overlying rib . D: Normal open tibial physis at the level of the knee in a child . PT, patellar tendon .
A
C
B
D
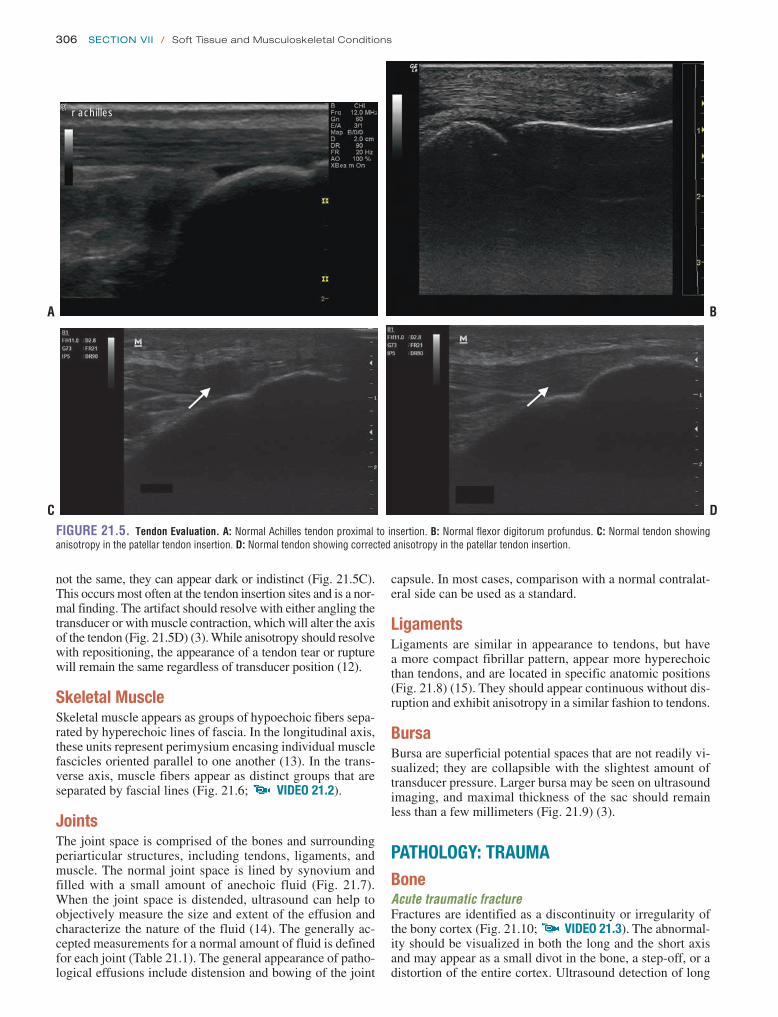
306 Section Vii / Soft Tissue and Musculoskeletal Conditions
not the same, they can appear dark or indistinct (Fig. 21.5C). This occurs most often at the tendon insertion sites and is a nor-mal finding. The artifact should resolve with either angling the transducer or with muscle contraction, which will alter the axis of the tendon (Fig. 21.5D) (3). While anisotropy should resolve with repositioning, the appearance of a tendon tear or rupture will remain the same regardless of transducer position (12).
skeletal MuscleSkeletal muscle appears as groups of hypoechoic fibers sepa-rated by hyperechoic lines of fascia. In the longitudinal axis, these units represent perimysium encasing individual muscle fascicles oriented parallel to one another (13). In the trans-verse axis, muscle fibers appear as distinct groups that are separated by fascial lines (Fig. 21.6; VIDEO 21 .2).
JointsThe joint space is comprised of the bones and surrounding periarticular structures, including tendons, ligaments, and muscle. The normal joint space is lined by synovium and filled with a small amount of anechoic fluid (Fig. 21.7). When the joint space is distended, ultrasound can help to objectively measure the size and extent of the effusion and characterize the nature of the fluid (14). The generally ac-cepted measurements for a normal amount of fluid is defined for each joint (Table 21.1). The general appearance of patho-logical effusions include distension and bowing of the joint
capsule. In most cases, comparison with a normal contralat-eral side can be used as a standard.
LigamentsLigaments are similar in appearance to tendons, but have a more compact fibrillar pattern, appear more hyperechoic than tendons, and are located in specific anatomic positions (Fig. 21.8) (15). They should appear continuous without dis-ruption and exhibit anisotropy in a similar fashion to tendons.
BursaBursa are superficial potential spaces that are not readily vi-sualized; they are collapsible with the slightest amount of transducer pressure. Larger bursa may be seen on ultrasound imaging, and maximal thickness of the sac should remain less than a few millimeters (Fig. 21.9) (3).
PATHOLOGY: TRAUMABoneAcute traumatic fractureFractures are identified as a discontinuity or irregularity of the bony cortex (Fig. 21.10; VIDEO 21 .3). The abnormal-ity should be visualized in both the long and the short axis and may appear as a small divot in the bone, a step-off, or a distortion of the entire cortex. Ultrasound detection of long
FIGURE 21.5. Tendon Evaluation. A: Normal Achilles tendon proximal to insertion . B: Normal flexor digitorum profundus . C: Normal tendon showing anisotropy in the patellar tendon insertion . D: Normal tendon showing corrected anisotropy in the patellar tendon insertion .
r achilles
A
C
B
D
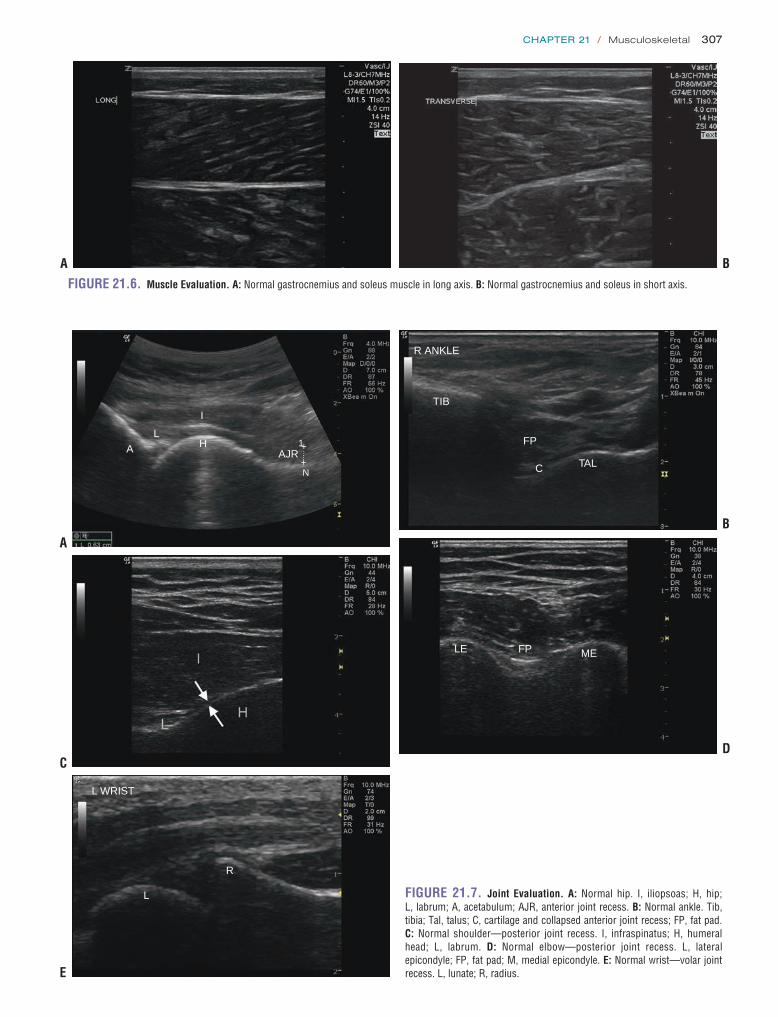
chapter 21 / Musculoskeletal 307
FIGURE 21.6. Muscle Evaluation. A: Normal gastrocnemius and soleus muscle in long axis . B: Normal gastrocnemius and soleus in short axis .
A B
FIGURE 21.7. Joint Evaluation. A: Normal hip . I, iliopsoas; H, hip; L, labrum; A, acetabulum; AJR, anterior joint recess . B: Normal ankle . Tib, tibia; Tal, talus; C, cartilage and collapsed anterior joint recess; FP, fat pad . C: Normal shoulder—posterior joint recess . I, infraspinatus; H, humeral head; L, labrum . D: Normal elbow—posterior joint recess . L, lateral epicondyle; FP, fat pad; M, medial epicondyle . E: Normal wrist—volar joint recess . L, lunate; R, radius .
AL
I
HAJR
N
1+
+
R ANKLE
TIB
FP
C TAL
LE FP ME
L WRIST
L
R
A
C
E
B
D

308 Section Vii / Soft Tissue and Musculoskeletal Conditions
TABLE 21.1 Normal Joint Space Size (mm)
JOINT SIzE
UPPeR exTReMITy
Shoulder, posterior joint recess 2–5
elbow
Posterior joint recess 1–2
Anterior joint recess 1–2
Wrist
Volar joint recess <1
Dorsal joint recess <1
LoWeR exTReMITy
Hip, anterior joint recess 5*
Knee, suprapatellar joint recess 1–2
Ankle, anterior joint recess 1 .8–3 .5
*Abnormal is also defined as >2 mm different from normal contralateral side
FIGURE 21.8. Ligament Evaluation. A: Medial collateral ligament . B: Ulnar collateral ligament .
LATLe
A
B
FIGURE 21.9. Normal Bursa. A: Retrocalcaneal bursa . B: Subacromial-subdeltoid bursa . D, deltoid muscle; B, bursa; SS, supraspinatus tendon . C: Infrapatellar bursa . PT, patellar tendon .
L SA-AD BURSA
SS
B
D
B
r achilles
A
C
also shown a significant reduction in mean time to diagnosis of fracture as well as a decrease in mean pain scores during the diagnostic procedure when compared with plain radiog-raphy (6). 8PEDIATRIC CONsIDERATIONs: In addition, ultra-sound can be used to narrow the area of interest in children who are often unable to localize the area of pain. They may simply limp or refuse to use an arm and state the entire extrem-ity hurts. Limiting radiographs to regions with definitive or sus-picious ultrasound findings may reduce radiation exposure.7
When cortical disruption is minimal, it may be difficult to detect on ultrasound. Pay particular attention to the sub-cutaneous tissues adjacent to the underlying bone and evalu-ate for heterogeneity, which may suggest an occult fracture (Fig. 21.10E). In the presence of normal plain radiographs, ultrasound has been shown to identify Salter-Harris Type-I fractures in the pediatric population (20).
bone fractures has been studied in the adult and pediatric literature, and sensitivity remains 89% to 95% with speci-ficity ranging from 85% to 100% when compared to plain radiographs (16,17). Ultrasound has greatest sensitivity in identifying long bone and midshaft fractures as compared to smaller bones and more distal sites (17,18). With regard to specific bones, ultrasound has proven useful in the evaluation of acute scaphoid fractures where initial plain radiographs are indeterminate or nondiagnostic and is superior to plain radiographs in evaluating rib fractures (7,8,19). Studies have

chapter 21 / Musculoskeletal 309
include a focal area of thinning in a tendon, presence of a hematoma, or failure to visualize the tendon in its expected position. This last finding is suggestive of a complete tendon tear (3). In complete tears the opposite ends of the tendon will be separated by an anechoic area consistent with acute hematoma formation (Fig. 21.11; VIDEO 21 .4). Complete tendon tears, whether from blunt and penetrating trauma, will appear similar on ultrasound (22). Complete tears are often difficult to visualize due to retraction of the severed ends, surrounding tissue edema, or air within wounds asso-ciated with tendon lacerations. Partial tears are associated with acute edema of the tendon. They are seen as enlarge-ment of the tendon, as compared to the contralateral unaf-fected tendon, and may either be hyperechoic or hypoechoic (Fig. 21.12). These are often easier to evaluate than complete
Acute/subacute stress fractureTypical sites for stress fracture include the tibia, and the second and third metatarsal shafts. Initially, hematoma for-mation over the bone may be identified as a focal area of hyopechogenicity with associated periosteal elevation. Dop-pler imaging may demonstrate increased vascularity in the surrounding tissues. Once callus has formed, the sonographic appearance is similar to a cortical deformity with associated posterior acoustic shadowing (21).
TendonTendon tear—partial or completeTendon injury should be suspected when there is a disrup-tion of the normal fibrillar pattern; other suspicious findings
FIGURE 21.10. Fracture Identification. A: Nondisplaced rib fracture . B: Nondisplaced tibial fracture . C: Displaced fibular fracture . Fx, fracture . D: Displaced tibial fracture . E: Hematoma overlying fracture site . F: Dorsally displaced distal radius fracture with soft tissue hematoma . A, proximal; B, distal .
A
FX
C
E
B
FX
D
F

310 Section Vii / Soft Tissue and Musculoskeletal Conditions
structures with ultrasound may help provide a clearer idea of pathology in the tissues. Furthermore, although certain ten-dons are located very superficially in the body, such as flexor tendons of the hand, they may still be difficult to image in the setting of acute trauma due to the abnormal contours. Remember that physical examination still provides very per-tinent information regarding tendon trauma. It is important to remember that the appearance of a partial tendon rupture or tear is similar to the appearance of anisotropy and can be mistaken for pathology if not interrogated appropriately.
tears because the tendon remains in its typical anatomic lo-cation and the difference from the healthy unaffected side is often striking.
The particular location of certain tendons makes them more amenable to imaging with ultrasound. For instance, the superficial nature of the Achilles tendon and the quadriceps tendon makes them good candidates for evaluation with ultra-sound. Other tendons situated deeper in the body, such as the biceps tendon, are not as readily imaged with ultrasound. In these circumstances evaluation of the tendon’s surrounding
FIGURE 21.11. Tendon Rupture. A: Complete Achilles tendon rupture . B: Complete biceps tendon rupture . (Images courtesy of John Kendall, MD) .
BA
FIGURE 21.12. Tendon Trauma. A: Patellar tendon tear (>50%) viewed in long axis . B: Short axis view of a >50% patellar tendon tear . C: Acute patellar tendon edema . D: Contralateral patellar tendon for comparison .
A
C
B
D

chapter 21 / Musculoskeletal 311
Rotator cuff evaluationIn patients presenting with acute traumatic shoulder pain where rotator cuff pathology is suspected, evaluation of the biceps long head tendon within the bicipital groove may pro-vide useful information. Because the biceps tendon sheath is contiguous with the glenohumeral joint, if >2 mm of fluid is visualized within the sheath in acute shoulder injury, the positive predictive value for associated acute rotator cuff injury is 60%. If fluid is also identified in the subacromial-subdeltoid bursa, the positive predictive value rises to 95% (Fig. 21.13) (23).
FIGURE 21.13. Biceps Tendon and Subacromial-Subdeltoid Bursa. A: Short axis of a normal biceps tendon within the biceps tendon sheath sitting between the greater tuberosity (gt) and the lesser tuberosity (lt) . B: Fluid within the subacromial-subdeltoid bursa .
A B
MuscleThe goal of muscle imaging is to determine whether or not an acute tear has occurred (13). The area of interest should be imaged in both contraction and relaxation to provide useful information about muscle function (13). Complete tears appear hyperechoic with muscle enlargement due to edema within the tissue, and a portion of the muscle may be seen floating within the hematoma (13). Larger tears will appear as a hypoechoic area within a more hyperechoic muscle (Fig. 21.14). Small muscle tears may not show up
FIGURE 21.14. Muscle Tear. A: Anterior tibialis (short axis) hematoma with clot present . B: Anterior tibialis (long axis) with clot present . C: Acute hema-toma between the superficial and deep compartment of the lower leg causing compartment syndrome . D: Bicep muscle tear with associated large hematoma distorting the normal sonographic architecture .
RLE
A
RLE
B
DC

312 Section Vii / Soft Tissue and Musculoskeletal Conditions
FIGURE 21.15. Acute Joint Trauma. Subacute hemorrhage with clot noted in the knee . eFF, effusion .
EFF
L KNEE
FIGURE 21.16. Acute Tendonitis. A: Acute patellar tendon edema; note the large difference in diameter created by the edema . B: Contralateral patellar tendon for comparison .
A
B
on ultrasound with the classic anechoic or hypoechoic he-matoma. The optimal time to image the affected muscle is between 2 and 48 hours after an acute injury. Prior to 2 hours and after 48 hours, the hematoma may be diffuse and not adequately visualized. At 2 hours, it will appear as a hy-poechoic area within the muscle (13).
JointUltrasound can be used to diagnose, localize, and character-ize joint effusions (Table 21.1) (14,24). A joint effusion is noted as a distended joint capsule filled with fluid. A joint ef-fusion in the setting of trauma, is by definition, a hemarthro-sis. A hemarthrosis is a complex joint effusion and carries the same properties as other complex joint effusions: lack of anechoic fluid, redistribution of contents with pressure and lack of increased signal with Doppler imaging (25). Initially the effusion is anechoic without debris due to acute bleeding, but after some time is noted to have particulate debris that redistributes with compression and movement (Fig. 21.15;
VIDEO 21 .5) (25,26).
PATHOLOGY: INFLAMMATORY OR INFECTIOUsTendonTendinitisIn acute tendinitis, tendons lacking a sheath will appear thick-ened in comparison to the contralateral side with hypoechoic areas due to acute edema (26). Tendons encased in a sheath will also appear thickened, but may appear either hypoechoic or hyperechoic (26). In acute tendonitis, the tendon will ap-pear thickened and hypoechoic with increased vascularity (Fig. 21.16). In chronic tendonitis, the tendon will appear very hypoechoic and less organized, have poorly defined margins, may be calcified or nodular, and have decreased vascularity (3).
TenosynovitisIn tenosynovitis, the tendon sheath becomes distended due to fluid accumulation between the tendon and the tendon
sheath (Fig. 21.17; VIDEO 21 .6). This is differentiated from acute tendinitis, which occurs when edema develops within the tendon itself and not within the tendon sheath. If there is any amount of fluid within the tendon sheath in a setting that is concerning for tenosynovitis, this confirms the diagnosis (3). Simple fluid is suggested if the fluid ap-pears anechoic. If the distention is not anechoic, the fluid can represent either synovitis versus complex fluid. In sy-novitis, the fluid is noncompressible with increased flow present on Doppler imaging. Characteristics concerning for complex fluid include compressibility, redistribution of con-tents with pressure, and lack of increased flow with Doppler imaging (25,27).
MuscleAcute myositisThe sonographic findings of acute myositis are notable for muscle that becomes edematous and enlarged, with septae that are hypoechoic (28). There can also be a loss of nor-mal architecture, and the borders appear fuzzy (Fig. 21.18;
VIDEO 21 .7). Evaluation of the contralateral muscle is critical, since the degree of anatomic distortion and muscle enlargement may not be obvious until a comparison with the unaffected muscle is performed.

chapter 21 / Musculoskeletal 313
JointA “simple” effusion is anechoic, compressible with pres-sure from the transducer, and lacks color flow by Doppler (Fig. 21.15). Complex effusions (septic fluid, inflammatory conditions, and hemarthroses) are noted by lack of anechoic fluid and presence of particulate debris that redistributes with compression and movement (25). Although these character-istics are useful, there is no specific finding by ultrasound that is reliable enough to distinguish between an acute in-flammatory effusion and a septic one; if septic arthritis is suspected, the provider should aspirate the joint for a defini-tive diagnosis.
Simple synovitisSimple synovitis is often the result of a sprain injury and may be either acute or chronic in nature. Joint effusions can be distinguished from the synovial proliferation and hyper-trophy seen in synovitis. In synovitis, the joint capsule may be filled with proliferative synovium that will fill the joint space and appear hypoechoic. On imaging, there will be an increased amount of fluid within the joint that appears anechoic without increased flow on Doppler imaging (29). No contents should be visualized floating within the joint space (Fig. 21.19; VIDEO 21 .8). Synovitis will be less
compressible than simple joint effusions. When acute, the hyperemia associated with active inflammation can be dem-onstrated with increased flow by Doppler.
Complex synovitisComplex fluid may be seen in septic joints, hemarthroses, and occasionally some of the inflammatory athritides. So-nographically, the fluid is compressible and redistributes with compression, with associated absence of increased flow with Doppler imaging (Fig. 21.20) (25,30). Addition-ally, the fluid in patients with septic arthritis may appear granular and turbid (31). Crystal arthropathies are notable for an increased amount of fluid within the space that ap-pears anechoic or hypoechoic, with multiple heterogeneous spots visualized within the fluid. This is classified as the snow-storm pattern (Fig. 21.21) (31). If suspicion for a sep-tic joint exists, you must always perform an arthrocentesis, even in the setting of ultrasound findings consistent with a simple synovitis.
BursaBursitis often occurs due to repetitive trauma to a spe-cific area, and is most often encountered in the subdeltoid,
FIGURE 21.17. Tenosynovitis. A: Tenosynovitis of the extensor tendon sheath in the hand . B: Contralateral tendon sheath for comparison . C: Tenosynovitis of extensor tendon sheath of the hand . D: Tenosynovitis of flexor tendon sheath of the hand .
R EXT TEN
A
C
L EXT TEN
B
D

314 Section Vii / Soft Tissue and Musculoskeletal Conditions
L QUAD AT KNEE
MUSCLE EDEMA
R QUAD AT KNEE
NL MUSCLE
L HIP DIST
MUSCLE EDEMA
R HIP
FIGURE 21.18. Myositis. A: Quadriceps myositis at the knee . B: Normal quadriceps at the knee for comparison . C: Quadriceps myositis proximally . D: Normal quadriceps proximally for comparison .
B
D
r knee r knee
qt
x
fp
FIGURE 21.19. Joint Effusion. A: Simple synovitis, knee, long axis . Note the large effusion and synovial proliferation (arrows) . B: Simple synovitis, knee, short axis . (Note the synovial hyperplasia (x) located over the prefemoral fat pad (fp) due to long standing inflammatory arthritis . qt, quadriceps tendon .
BA
A
C
olecranon, radiohumeral, patellar, and calcaneal regions. Ultrasound will reveal bursal distention >2 mm and bursal wall thickening (28).
Bursal fluid carries the same characteristics as joint fluid on ultrasound. Simple fluid is anechoic and lacks internal echoes or increased blood flow on Doppler imaging. Sterile inflammatory fluid should be anechoic or hypoechoic, and is suggested by increased internal flow on Doppler imag-ing. Complex fluid, suggestive of septic bursitis, is sug-gested by echoic or hyperechoic fluid, redistribution of
contents with pressure, and a lack of increased flow on Doppler imaging.
ARTIFACTs AND PITFALLsArtifactsPosterior acoustic shadowing occurs when a sound beam fails to pass through an object, creating an anechoic area
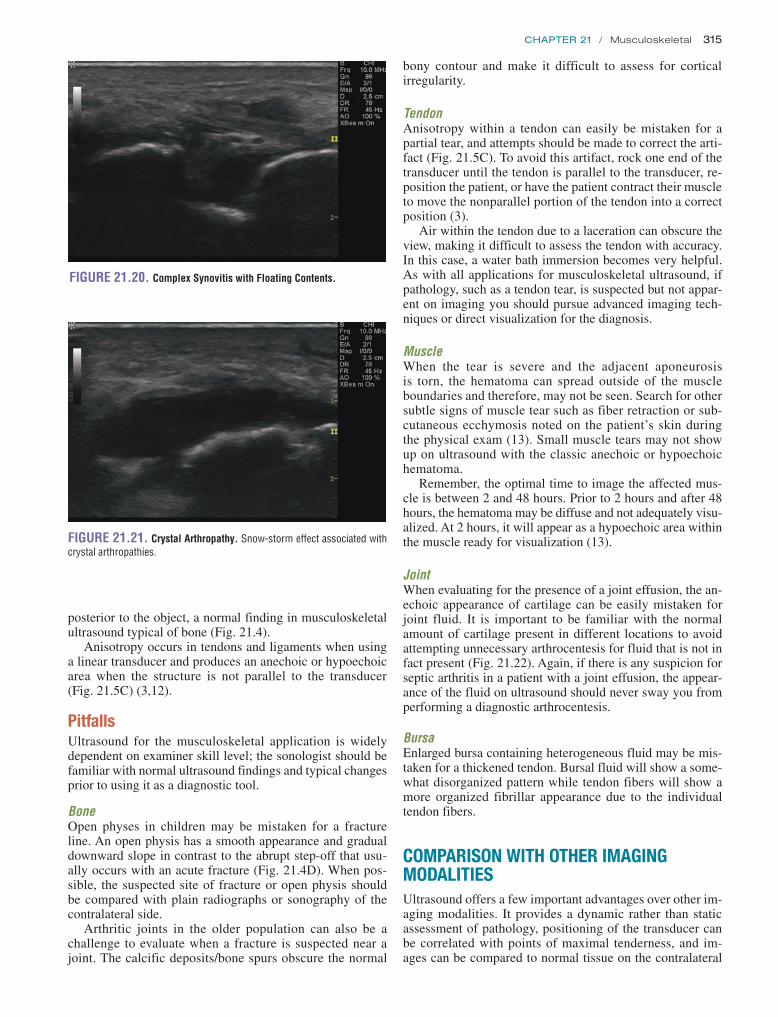
chapter 21 / Musculoskeletal 315
bony contour and make it difficult to assess for cortical irregularity.
TendonAnisotropy within a tendon can easily be mistaken for a partial tear, and attempts should be made to correct the arti-fact (Fig. 21.5C). To avoid this artifact, rock one end of the transducer until the tendon is parallel to the transducer, re-position the patient, or have the patient contract their muscle to move the nonparallel portion of the tendon into a correct position (3).
Air within the tendon due to a laceration can obscure the view, making it difficult to assess the tendon with accuracy. In this case, a water bath immersion becomes very helpful. As with all applications for musculoskeletal ultrasound, if pathology, such as a tendon tear, is suspected but not appar-ent on imaging you should pursue advanced imaging tech-niques or direct visualization for the diagnosis.
MuscleWhen the tear is severe and the adjacent aponeurosis is torn, the hematoma can spread outside of the muscle boundaries and therefore, may not be seen. Search for other subtle signs of muscle tear such as fiber retraction or sub-cutaneous ecchymosis noted on the patient’s skin during the physical exam (13). Small muscle tears may not show up on ultrasound with the classic anechoic or hypoechoic hematoma.
Remember, the optimal time to image the affected mus-cle is between 2 and 48 hours. Prior to 2 hours and after 48 hours, the hematoma may be diffuse and not adequately visu-alized. At 2 hours, it will appear as a hypoechoic area within the muscle ready for visualization (13).
JointWhen evaluating for the presence of a joint effusion, the an-echoic appearance of cartilage can be easily mistaken for joint fluid. It is important to be familiar with the normal amount of cartilage present in different locations to avoid attempting unnecessary arthrocentesis for fluid that is not in fact present (Fig. 21.22). Again, if there is any suspicion for septic arthritis in a patient with a joint effusion, the appear-ance of the fluid on ultrasound should never sway you from performing a diagnostic arthrocentesis.
BursaEnlarged bursa containing heterogeneous fluid may be mis-taken for a thickened tendon. Bursal fluid will show a some-what disorganized pattern while tendon fibers will show a more organized fibrillar appearance due to the individual tendon fibers.
COMPARIsON WITH OTHER IMAGING MODALITIEsUltrasound offers a few important advantages over other im-aging modalities. It provides a dynamic rather than static assessment of pathology, positioning of the transducer can be correlated with points of maximal tenderness, and im-ages can be compared to normal tissue on the contralateral
FIGURE 21.20. Complex Synovitis with Floating Contents.
FIGURE 21.21. Crystal Arthropathy. Snow-storm effect associated with crystal arthropathies .
posterior to the object, a normal finding in musculoskeletal ultrasound typical of bone (Fig. 21.4).
Anisotropy occurs in tendons and ligaments when using a linear transducer and produces an anechoic or hypoechoic area when the structure is not parallel to the transducer (Fig. 21.5C) (3,12).
PitfallsUltrasound for the musculoskeletal application is widely dependent on examiner skill level; the sonologist should be familiar with normal ultrasound findings and typical changes prior to using it as a diagnostic tool.
BoneOpen physes in children may be mistaken for a fracture line. An open physis has a smooth appearance and gradual downward slope in contrast to the abrupt step-off that usu-ally occurs with an acute fracture (Fig. 21.4D). When pos-sible, the suspected site of fracture or open physis should be compared with plain radiographs or sonography of the contralateral side.
Arthritic joints in the older population can also be a challenge to evaluate when a fracture is suspected near a joint. The calcific deposits/bone spurs obscure the normal
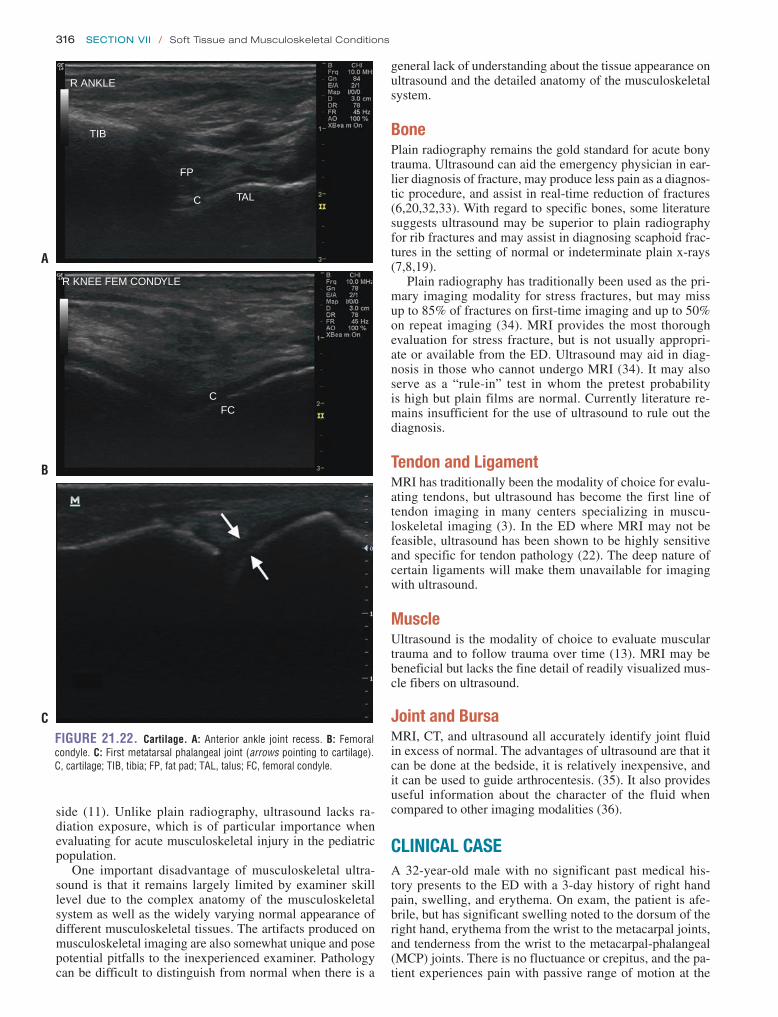
316 Section Vii / Soft Tissue and Musculoskeletal Conditions
general lack of understanding about the tissue appearance on ultrasound and the detailed anatomy of the musculoskeletal system.
BonePlain radiography remains the gold standard for acute bony trauma. Ultrasound can aid the emergency physician in ear-lier diagnosis of fracture, may produce less pain as a diagnos-tic procedure, and assist in real-time reduction of fractures (6,20,32,33). With regard to specific bones, some literature suggests ultrasound may be superior to plain radiography for rib fractures and may assist in diagnosing scaphoid frac-tures in the setting of normal or indeterminate plain x-rays (7,8,19).
Plain radiography has traditionally been used as the pri-mary imaging modality for stress fractures, but may miss up to 85% of fractures on first-time imaging and up to 50% on repeat imaging (34). MRI provides the most thorough evaluation for stress fracture, but is not usually appropri-ate or available from the ED. Ultrasound may aid in diag-nosis in those who cannot undergo MRI (34). It may also serve as a “rule-in” test in whom the pretest probability is high but plain films are normal. Currently literature re-mains insufficient for the use of ultrasound to rule out the diagnosis.
Tendon and LigamentMRI has traditionally been the modality of choice for evalu-ating tendons, but ultrasound has become the first line of tendon imaging in many centers specializing in muscu-loskeletal imaging (3). In the ED where MRI may not be feasible, ultrasound has been shown to be highly sensitive and specific for tendon pathology (22). The deep nature of certain ligaments will make them unavailable for imaging with ultrasound.
MuscleUltrasound is the modality of choice to evaluate muscular trauma and to follow trauma over time (13). MRI may be beneficial but lacks the fine detail of readily visualized mus-cle fibers on ultrasound.
Joint and BursaMRI, CT, and ultrasound all accurately identify joint fluid in excess of normal. The advantages of ultrasound are that it can be done at the bedside, it is relatively inexpensive, and it can be used to guide arthrocentesis. (35). It also provides useful information about the character of the fluid when compared to other imaging modalities (36).
CLINICAL CAsEA 32-year-old male with no significant past medical his-tory presents to the ED with a 3-day history of right hand pain, swelling, and erythema. On exam, the patient is afe-brile, but has significant swelling noted to the dorsum of the right hand, erythema from the wrist to the metacarpal joints, and tenderness from the wrist to the metacarpal-phalangeal (MCP) joints. There is no fluctuance or crepitus, and the pa-tient experiences pain with passive range of motion at the
FIGURE 21.22. Cartilage. A: Anterior ankle joint recess . B: Femoral condyle . C: First metatarsal phalangeal joint (arrows pointing to cartilage) . C, cartilage; TIB, tibia; FP, fat pad; TAL, talus; FC, femoral condyle .
R ANKLE
TIB
FP
C TAL
A
C
CFC
R KNEE FEM CONDYLE
B
side (11). Unlike plain radiography, ultrasound lacks ra-diation exposure, which is of particular importance when evaluating for acute musculoskeletal injury in the pediatric population.
One important disadvantage of musculoskeletal ultra-sound is that it remains largely limited by examiner skill level due to the complex anatomy of the musculoskeletal system as well as the widely varying normal appearance of different musculoskeletal tissues. The artifacts produced on musculoskeletal imaging are also somewhat unique and pose potential pitfalls to the inexperienced examiner. Pathology can be difficult to distinguish from normal when there is a
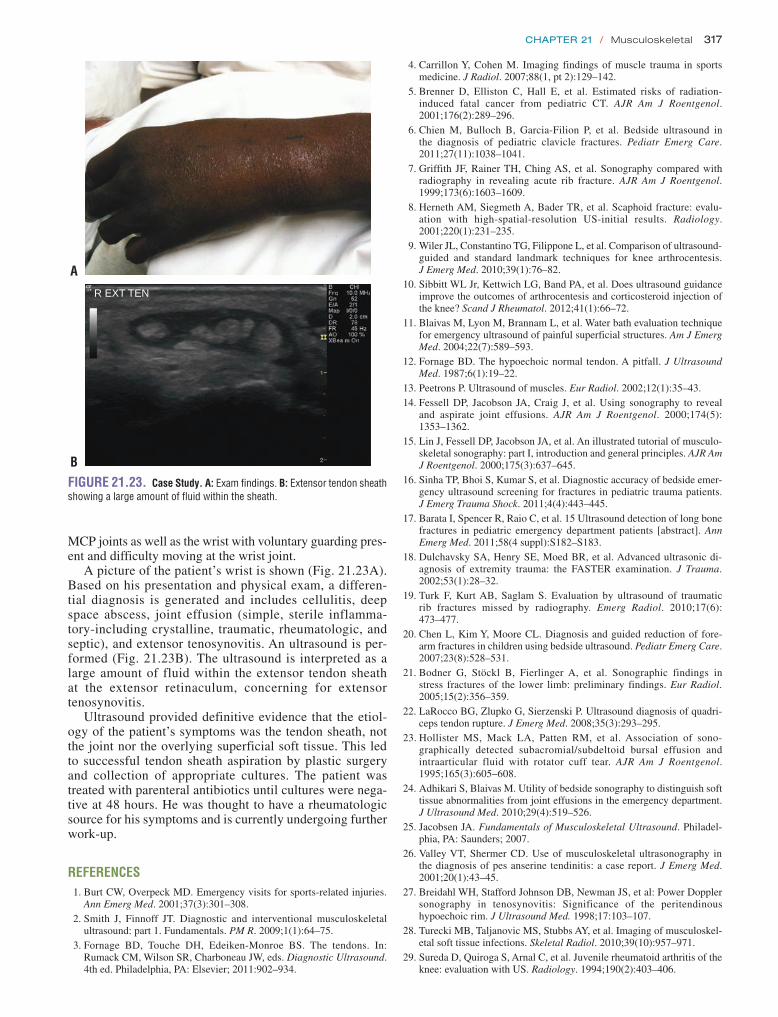
chapter 21 / Musculoskeletal 317
4. Carrillon Y, Cohen M. Imaging findings of muscle trauma in sports medicine. J Radiol. 2007;88(1, pt 2):129–142.
5. Brenner D, Elliston C, Hall E, et al. Estimated risks of radiation-induced fatal cancer from pediatric CT. AJR Am J Roentgenol. 2001;176(2):289–296.
6. Chien M, Bulloch B, Garcia-Filion P, et al. Bedside ultrasound in the diagnosis of pediatric clavicle fractures. Pediatr Emerg Care. 2011;27(11):1038–1041.
7. Griffith JF, Rainer TH, Ching AS, et al. Sonography compared with radiography in revealing acute rib fracture. AJR Am J Roentgenol. 1999;173(6):1603–1609.
8. Herneth AM, Siegmeth A, Bader TR, et al. Scaphoid fracture: evalu-ation with high-spatial-resolution US-initial results. Radiology. 2001;220(1):231–235.
9. Wiler JL, Constantino TG, Filippone L, et al. Comparison of ultrasound-guided and standard landmark techniques for knee arthrocentesis. J Emerg Med. 2010;39(1):76–82.
10. Sibbitt WL Jr, Kettwich LG, Band PA, et al. Does ultrasound guidance improve the outcomes of arthrocentesis and corticosteroid injection of the knee? Scand J Rheumatol. 2012;41(1):66–72.
11. Blaivas M, Lyon M, Brannam L, et al. Water bath evaluation technique for emergency ultrasound of painful superficial structures. Am J Emerg Med. 2004;22(7):589–593.
12. Fornage BD. The hypoechoic normal tendon. A pitfall. J Ultrasound Med. 1987;6(1):19–22.
13. Peetrons P. Ultrasound of muscles. Eur Radiol. 2002;12(1):35–43. 14. Fessell DP, Jacobson JA, Craig J, et al. Using sonography to reveal
and aspirate joint effusions. AJR Am J Roentgenol. 2000;174(5): 1353–1362.
15. Lin J, Fessell DP, Jacobson JA, et al. An illustrated tutorial of musculo-skeletal sonography: part I, introduction and general principles. AJR Am J Roentgenol. 2000;175(3):637–645.
16. Sinha TP, Bhoi S, Kumar S, et al. Diagnostic accuracy of bedside emer-gency ultrasound screening for fractures in pediatric trauma patients. J Emerg Trauma Shock. 2011;4(4):443–445.
17. Barata I, Spencer R, Raio C, et al. 15 Ultrasound detection of long bone fractures in pediatric emergency department patients [abstract]. Ann Emerg Med. 2011;58(4 suppl):S182–S183.
18. Dulchavsky SA, Henry SE, Moed BR, et al. Advanced ultrasonic di-agnosis of extremity trauma: the FASTER examination. J Trauma. 2002;53(1):28–32.
19. Turk F, Kurt AB, Saglam S. Evaluation by ultrasound of traumatic rib fractures missed by radiography. Emerg Radiol. 2010;17(6): 473–477.
20. Chen L, Kim Y, Moore CL. Diagnosis and guided reduction of fore-arm fractures in children using bedside ultrasound. Pediatr Emerg Care. 2007;23(8):528–531.
21. Bodner G, Stöckl B, Fierlinger A, et al. Sonographic findings in stress fractures of the lower limb: preliminary findings. Eur Radiol. 2005;15(2):356–359.
22. LaRocco BG, Zlupko G, Sierzenski P. Ultrasound diagnosis of quadri-ceps tendon rupture. J Emerg Med. 2008;35(3):293–295.
23. Hollister MS, Mack LA, Patten RM, et al. Association of sono-graphically detected subacromial/subdeltoid bursal effusion and intraarticular fluid with rotator cuff tear. AJR Am J Roentgenol. 1995;165(3):605–608.
24. Adhikari S, Blaivas M. Utility of bedside sonography to distinguish soft tissue abnormalities from joint effusions in the emergency department. J Ultrasound Med. 2010;29(4):519–526.
25. Jacobsen JA. Fundamentals of Musculoskeletal Ultrasound. Philadel-phia, PA: Saunders; 2007.
26. Valley VT, Shermer CD. Use of musculoskeletal ultrasonography in the diagnosis of pes anserine tendinitis: a case report. J Emerg Med. 2001;20(1):43–45.
27. Breidahl WH, Stafford Johnson DB, Newman JS, et al: Power Doppler sonography in tenosynovitis: Significance of the peritendinous hypoechoic rim. J Ultrasound Med. 1998;17:103–107.
28. Turecki MB, Taljanovic MS, Stubbs AY, et al. Imaging of musculoskel-etal soft tissue infections. Skeletal Radiol. 2010;39(10):957–971.
29. Sureda D, Quiroga S, Arnal C, et al. Juvenile rheumatoid arthritis of the knee: evaluation with US. Radiology. 1994;190(2):403–406.
FIGURE 21.23. Case Study. A: exam findings . B: extensor tendon sheath showing a large amount of fluid within the sheath .
A
R EXT TEN
B
MCP joints as well as the wrist with voluntary guarding pres-ent and difficulty moving at the wrist joint.
A picture of the patient’s wrist is shown (Fig. 21.23A). Based on his presentation and physical exam, a differen-tial diagnosis is generated and includes cellulitis, deep space abscess, joint effusion (simple, sterile inflamma-tory-including crystalline, traumatic, rheumatologic, and septic), and extensor tenosynovitis. An ultrasound is per-formed (Fig. 21.23B). The ultrasound is interpreted as a large amount of fluid within the extensor tendon sheath at the extensor retinaculum, concerning for extensor tenosynovitis.
Ultrasound provided definitive evidence that the etiol-ogy of the patient’s symptoms was the tendon sheath, not the joint nor the overlying superficial soft tissue. This led to successful tendon sheath aspiration by plastic surgery and collection of appropriate cultures. The patient was treated with parenteral antibiotics until cultures were nega-tive at 48 hours. He was thought to have a rheumatologic source for his symptoms and is currently undergoing further work-up.
REFERENCES 1. Burt CW, Overpeck MD. Emergency visits for sports-related injuries.
Ann Emerg Med. 2001;37(3):301–308. 2. Smith J, Finnoff JT. Diagnostic and interventional musculoskeletal
ultrasound: part 1. Fundamentals. PM R. 2009;1(1):64–75. 3. Fornage BD, Touche DH, Edeiken-Monroe BS. The tendons. In:
Rumack CM, Wilson SR, Charboneau JW, eds. Diagnostic Ultrasound. 4th ed. Philadelphia, PA: Elsevier; 2011:902–934.

318 Section Vii / Soft Tissue and Musculoskeletal Conditions
33. Chinnock B, Khaletskiy A, Kuo K, et al. Ultrasound-guided reduction of distal radius fractures. J Emerg Med. 2011;4(3):308–312.
34. Moran DS, Evans RK, Hadad E. Imaging of lower extremity stress fracture injuries. Sports Med. 2008;38(4):345–356.
35. Valley VT, Stahmer SA. Targeted musculoarticular sonography in the detection of joint effusions. Acad Emerg Med. 2001;8(4):361–368.
36. Wang SC, Chhem RK, Cardinal E, et al. Joint sonography. Radiol Clin North Am. 1999;37(4):653–668.
30. Kane D, Balint PV, Sturrock RD. Ultrasonography is supe-rior to clinical examination in the detection and location of knee joint effusion in rheumatoid arthritis. J Rheumatol. 2003;30(5): 966–971.
31. Farina A, Filippucci E, Grassi W. Sonographic findings for synovial fluid [in Italian]. Reumatismo. 2002;54(3):261–265.
32. Ang SH, Lee SW, Lam KY. Ultrasound-guided reduction of distal radius fractures. Am J Emerg Med. 2010;28(9):1002–1008.

319
traditionally been performed by a landmark approach with the assistance of nerve stimulation, the use of ultrasound-guidance provides multiple additional benefits to peripheral nerve blocks. A Cochrane review highlighted the following advantages of ultrasound-guided blocks compared to nonul-trasound techniques (3):
• Decreased rate of vascular puncture• Improved quality of both motor and sensory blocks• Faster time to onset nerve blockade• Decreased procedural time• Significantly lower volume of required anesthetic
Other studies have shown that the use of ultrasound decreases the number of needle passes, lowers the rate of block failure, and increases the duration of the block compared to nonultrasound techniques (4–6). Ultrasound guided nerve blocks have many applications in the ED, including pain relief from fractures and dislocations, and facilitation of procedures such as abscess drainage and closed reductions (7).
INTRODUCTIONAs ultrasound has been universally adopted in the practice of emergency medicine, its tremendous value in provid-ing procedural guidance has increasingly been recognized. Ultrasound guidance has been shown to improve the speed, accuracy, and safety of many common procedures in the emergency department (ED). The improved image qual-ity of newer ultrasound systems has contributed to the burgeoning list of procedures benefiting from ultrasound guidance, including many musculoskeletal and soft tissue applications.
PERIPHERAL NERVE BLOCKSClinical ApplicationsPeripheral nerve blocks have long been utilized for anal-gesia and anesthesia for invasive procedures and pain con-trol after acute trauma (1,2). While regional anesthesia has
Procedure . . . . . . . . . . . . . . . . . . . . . . . . . . . . . . . . . . 340Pitfalls and Complications . . . . . . . . . . . . . . . . . . . . . . 340
ABSCESS INCISION AND DRAINAGE . . . . . . . . . . . . . . . . . . 342Clinical Applications . . . . . . . . . . . . . . . . . . . . . . . . . . 342Image Acquisition . . . . . . . . . . . . . . . . . . . . . . . . . . . . 343Procedure . . . . . . . . . . . . . . . . . . . . . . . . . . . . . . . . . . 343Pitfalls and Complications . . . . . . . . . . . . . . . . . . . . . . 343
FOREIGN BODY REMOVAL . . . . . . . . . . . . . . . . . . . . . . . . . . 343Clinical Applications . . . . . . . . . . . . . . . . . . . . . . . . . . 343Image Acquisition . . . . . . . . . . . . . . . . . . . . . . . . . . . . 343Procedure . . . . . . . . . . . . . . . . . . . . . . . . . . . . . . . . . . 343Pitfalls and Complications . . . . . . . . . . . . . . . . . . . . . . 344
LUMBAR PUNCTURE . . . . . . . . . . . . . . . . . . . . . . . . . . . . . . 345Clinical Applications . . . . . . . . . . . . . . . . . . . . . . . . . . 345Image Acquisition . . . . . . . . . . . . . . . . . . . . . . . . . . . . 345Procedure . . . . . . . . . . . . . . . . . . . . . . . . . . . . . . . . . . 345Pitfalls and Complications . . . . . . . . . . . . . . . . . . . . . . 347
INTRODUCTION . . . . . . . . . . . . . . . . . . . . . . . . . . . . . . . . . . 319PERIPHERAL NERVE BLOCKS . . . . . . . . . . . . . . . . . . . . . . . 319
Clinical Applications . . . . . . . . . . . . . . . . . . . . . . . . . . 319Image Acquisition . . . . . . . . . . . . . . . . . . . . . . . . . . . . 320Anatomy and Landmarks . . . . . . . . . . . . . . . . . . . . . . 320General Approach to Nerve Blocks . . . . . . . . . . . . . . . 320Pitfalls and Complications . . . . . . . . . . . . . . . . . . . . . . 323Guide to Specific Nerve Blocks . . . . . . . . . . . . . . . . . . 324
ARTHROCENTESIS . . . . . . . . . . . . . . . . . . . . . . . . . . . . . . . . 332Clinical Applications . . . . . . . . . . . . . . . . . . . . . . . . . . 332Image Acquisition . . . . . . . . . . . . . . . . . . . . . . . . . . . . 332Anatomy and Procedure . . . . . . . . . . . . . . . . . . . . . . . 332Pitfalls and Complications . . . . . . . . . . . . . . . . . . . . . . 332
FRACTURE REDUCTION . . . . . . . . . . . . . . . . . . . . . . . . . . . . 340Clinical Applications . . . . . . . . . . . . . . . . . . . . . . . . . . 340Image Acquisition . . . . . . . . . . . . . . . . . . . . . . . . . . . . 340Normal Ultrasound Anatomy . . . . . . . . . . . . . . . . . . . . 340
Andrew J. French, Joy English, Michael B. Stone, and Bradley W. Frazee
Soft Tissue and Musculoskeletal Procedures
22
劉政亨
劉政亨

320 Section Vii / Soft Tissue and Musculoskeletal Conditions
Image AcquisitionDue to the small size and relatively superficial nature of peripheral nerves, a high-frequency linear array transducer should be used for identification and block guidance. A nerve preset should be utilized when available, with a frequency in the 14 to 10 MHz range. Patient positioning and preparation will vary depending on the particular block.
Anatomy and LandmarksIn the short axis, peripheral nerves appear as oval or round structures with a hyperechoic epineurium and internal hy-poechoic fascicles, which are encased in perineurium (Fig. 22.1). In general, large peripheral nerves above the clavicles have a predominantly hypoechoic appearance, and nerves below the clavicles are predominantly hyperechoic with small internal hypoechoic fascicles. Most nerves tar-geted for blocks are relatively superficial (<3 cm deep to skin) and are also often adjacent to a vascular structure. Diameter may vary from subcentimeter in larger nerves such as the femoral nerve to millimeters as with the radial nerve. Nerves may appear similar to tendons; however, tendons are internally brighter, move with range of motion, and will typi-cally transition into muscle as they are scanned more proxi-mally (Fig. 22.2; VIDEO 22 .1).
FIGURE 22.1. An Illustration of a Cross Section of a Peripheral Nerve. The solid line points to the epineurium (large outer circle) and the dashed line indicates a fascicle enclosed in a perineurium (smaller circles) .
FIGURE 22.2. A Peripheral Nerve (Left Arrow) is Immediately Adjacent to a Tendon (Right Arrow). The nerve contains internal hypoechoic fascicles .
General Approach to Nerve BlocksPatient preparationPrior to beginning any nerve block, it is recommended that a detailed motor and sensory exam be documented for the af-fected extremity for multiple reasons. Injured nerves may be prone to increased complications of regional anesthesia, and a thorough exam will insure that any pre-existing deficits are not falsely attributed to the block post recovery.
Patient and operator positioningPatient positioning depends on the type of block being per-formed. The ultrasound should be placed so that the screen is in the operator’s direct line of vision, which may necessitate placing the machine on the opposite side of the procedure site (Fig. 22.3). A survey scan both proximal and distal to the anticipated site of needle insertion will allow the operator to determine the optimal location for the procedure by helping to identify the site with the clearest image of the nerve with-out adjacent vasculature.
Equipment selectionThe next step in preparing for a nerve block includes selection of needles, anesthetic, and skin sterilizing solution. Equipment may vary depending on the type and indication of block.
Needle sizeSizes may range from 21 to 27 gauge needles (7–9). The size and location of the nerve may affect the gauge selec-tion. A larger needle may be beneficial for a deeper nerve block, as its size may improve visualization at steeper entry angles. A smaller peripheral nerve is often best anesthetized with a smaller needle as the entry angle is typically shal-lower and its size may facilitate fine adjustments in needle tip placement. Although larger needles are typically easier
FIGURE 22.3. Ideal Positioning for an Ulnar or Median Nerve Block from the Operator’s Vantage Point is Demonstrated. The probe, pertinent patient anatomy, and ultrasound screen are all in line with the operator’s immediate line of site .
劉政亨
劉政亨

chapter 22 / Soft Tissue and Musculoskeletal Procedures 321
to visualize under ultrasound guidance, histologic examina-tion reveals that smaller needles produce less nerve injury in cases of nerve penetration (10). Needle tip has also shown to play a histologic role in direct nerve trauma. Fascicular trauma is minimized with shorter beveled cutting needles (11,12). However long tapered (pencil-tip) needles have also shown to minimize the number of transected nerve fibers compared to cutting needles (13). The last consideration in needle selection concerns the use of echogenic needles. While the literature supports increased sonographic visual-ization of echogenic needles, no study has yet identified a clear benefit in safety or efficacy of echogenic needles in peripheral nerve blockade (14–16).
AnestheticOperators should choose an anesthetic agent based on the preferred duration of anesthesia. Bupivacaine is the most commonly used long-acting amide anesthetic, yet is signifi-cantly more cardiotoxic than lidocaine. As a result, if proce-dures can be adequately accomplished with lidocaine alone, it is our recommendation to avoid bupivacaine use until sufficiently experienced with these techniques.
Additional considerations with regard to anesthetic volume must be taken into account. Table 22.1 shows common an-esthetics and maximum doses. In peripheral nerve blocks, volume is an important issue as it relates to block effect and duration, as well as patient safety. While multiple studies have examined the minimum volume necessary for a given block, it is difficult to generalize the results as the concentra-tions and anesthetic additives may vary (17–20). The primary goal of the block should be to circumferentially surround the nerve with a volume of anesthetic, which does not exceed the mg/kg dose for the patient. One small study demonstrated that lower volumes of an equivalent concentration of anes-thetic primarily decrease block duration without altering ef-ficacy; therefore, increasing volume may help prolong block duration, but not change the degree of anesthesia (21).
Sterile barrierWhile some anesthesia literature describes most periph-eral nerve blocks as a sterile practice, this is often in the setting of an operative procedure and/or placement of a nerve block catheter. Alternative descriptions include skin prep with betadine or chlorohexadine with sterile gel and a sterile adhesive dressing covering over the ultrasound probe (Fig. 22.4) (7,8,22). Still others only describe skin prep without specific gel or probe covers (8). From a prac-tical standpoint, if the needle is visualized throughout its entire track from skin to nerve, ideally, only penetration of subcutaneous and muscular tissue will occur. Therefore,
while skin prep is still necessary, the procedure should not be significantly different than any other intramuscular or subcutaneous injection provided that the needle does not pass directly through nonsterile ultrasound gel prior to skin penetration.
TechniquePerformance of the block is often done using an in-plane technique wherein the needle is advanced in parallel to the long axis of the probe, while the nerve is imaged in the short axis (Fig. 22.5). A short axis view of the nerve pro-vides the best view for circumferential deposition of anes-thetic while viewing the surrounding structures and layers of the nerve bundle. Some practitioners favor an out-of-plane technique in which the nerve remains imaged in the short axis but the needle is placed perpendicular to the long axis of the probe. There is no clear evidence suggesting a clear
TABLE 22.1 Common Anesthetics and Maximum Dosing
ANESTHETIC
MAXIMUM DOSE WITHOUT EPI
(mg/kg)MAXIMUM DOSE WITH EPI (mg/kg)
Lidocaine 1% 4 .5 7
Mepivacaine 1% 4 .5 7
Bupivacaine 0 .5% 2 .5 3 .3
From Dinehart SM. Topical, local and regional anesthesia. In: Wheeland RG, ed. Cutaneous Surgery. Philadelphia, PA: WB Saunders; 1994:103, with permission.
FIGURE 22.4. A Semi-Sterile Barrier is Created Over the Probe Using a Sterile Adhesive Dressing. A generous gel layer should be used between the probe and dressing (arrow) to maximize acoustic enhancement and minimize air trapping between the barrier and probe .
FIGURE 22.5. The Needle (Arrow ) is Advanced in the Longitudinal Plane Toward the Nerve (Oval Arrow ) that is Imaged in the Transverse Plane.
劉政亨
劉政亨
劉政亨

322 Section Vii / Soft Tissue and Musculoskeletal Conditions
advantage to either approach. The probe should be held in the nondominant hand, with the needle and syringe held in the dominant hand, allowing finer control of the anesthetic. Prior to inserting the needle into the skin, any air remaining in the syringe or needle tip should be expelled, as inadvertent injection of air into the tissue will cause scatter artifact, mak-ing it difficult to visualize both needle and tissue anatomy (Fig. 22.6; VIDEO 22 .2). As the needle is advanced, anes-thetizing the tract to the nerve can help visualize the needle by decreasing the attenuation coefficient of the tissue. It is imperative that anesthetic should not be injected around the nerve or into tissue unless the needle tip is visualized. This is an essential step to decrease the risk of intravascular and intrafascicular injection. Minimizing the angle of the needle entry in relation to the probe will increase needle visualiza-tion by bringing it into a more perpendicular orientation
to the ultrasound beam (Fig. 22.7). Once the needle tip is clearly visualized with the nerve in short axis, anesthetic should be deposited circumferentially around the nerve to ensure a complete block. It is important to note that due to the depth and location of surrounding structures, circumfer-ential deposition of anesthetic may require needle redirection or more than one needle pass.
Perineural (around the nerve), intraneural (within the epineurium), and intrafasicular (within the perineurium) are all sonographically visible sites and have anatomic rel-evance in nerve blocks. A perineural block wherein the an-esthetic is placed completely outside of the epineurium is generally the most accepted location of block with minimal risk of nerve injury (Fig. 22.8; VIDEO 22 .3). Although an intraneural injection is considered unfavorable, there is little evidence to support this opinion (23). Multiple studies have
FIGURE 22.6. A: Prior to injection, the needle (solid arrow) is advanced toward the nerve (dashed arrow) . B: With initial injection a hyperechoic layer (dashed arrow) can be seen casting a dirty shadow (solid arrows) and obscuring the nerve .
A B
FIGURE 22.7. A: The needle is positioned at a steep angle of entry . This will minimize the appearance of the needle under ultrasound guidance . B: Positioning the needle at a more shallow angle brings the needle into a near perpendicular relation to the ultrasound beam that greatly enhances the appearance of the needle .
A B
劉政亨

chapter 22 / Soft Tissue and Musculoskeletal Procedures 323
demonstrated that intentional and unintentional intraneural injections do not result in neurologic dysfunction after a nor-mal recovery period (24). In some cases, intraneural injec-tion has actually shown to be favorable in block onset time (Fig. 22.9; VIDEO 22 .4) (12). In contrast, intrafascicular blocks are considered harmful and must be avoided, as dam-age to fascicles may result in near immediate damage (25). Also, the site of peripheral nerve blockade may play a role in the risk of fascicular damage as it relates to the ratio of cross-sectional fascicle to epineurium (25). For example, the sciatic nerve at the popliteal fossa contains more non-neural tissue than fascicles, which may explain the relatively low incidence of post-block neuropathy (26). Alternatively, the brachial plexus trunks are characterized by a higher ratio of neural to connective tissue. Subsequently, an advancing needle is more likely to encounter fascicles, thereby poten-tially increasing the risk of injury (25). This again highlights
the necessity to maintain visualization of the needle tip at all times during needle advancement.
Pitfalls and ComplicationsThe use of ultrasound in peripheral nerve blocks does not eliminate complications associated with regional anesthesia. A study of over 12,000 patients found that complications such as prolonged neurologic dysfunction, vascular puncture, and pneumothorax still occur with ultrasound. However, the incidence was not >0.2% (27). The root cause of complica-tions with ultrasound-guided nerve blocks can be linked to three major categories: patient exam, real-time needle guid-ance, and sonographic anatomy.
Animal studies suggest that pre-existing nerve pathol-ogy puts patients at risk for prolonged duration of blocks and increased neurotoxicity of local anesthetics (28). Therefore, failure to perform a detailed neurologic exam focused on detection of neurologic deficits can lead to unanticipated but avoidable complications. A standardized approach to examination of motor and sensory function for upper and lower extremities is recommended prior to execution of any block.
The skill set required to safely perform an ultrasound-guided nerve block should not be underestimated. A ca-daver study assessing needle guidance in peripheral nerve blockade demonstrated that a novice operator needs approximately 28 supervised trials with feedback to achieve competency (29). Therefore, proper training should be com-pleted prior to unsupervised block performance.
Theoretically, vascular puncture, misplacement of anes-thetic, fascicular trauma, and pneumothorax should not occur if the length of the needle tip is visualized throughout the entire procedure. Tissue distortion and movement are only indicators of needle location. Ultrasound provides two-dimen-sional imaging for a three-dimensional procedure therefore, advancement of the needle without complete visualization cannot identify which structures are penetrated. Anesthetic should never be injected without the needle tip in clear view, and injections should be halted immediately if spread of local anesthetic solution within the tissues is not visualized.
Despite preparation and training, complications do occur. Interscalene blocks are associated with temporary paralysis of the phrenic nerve; caution should be exercised to select patients with sufficient respiratory reserve to tolerate paraly-sis of the hemidiaphragm. The most feared complication of a peripheral nerve block is local anesthetic systemic toxic-ity (LAST). While ultrasound guidance and aspiration prior to injection can minimize intravascular injection, toxicity may still occur. Seizure, coma, respiratory arrest, ventricu-lar arrhythmias, and cardiac arrest can all be consequences of LAST. Initial treatment of these events still begins with standard ACLS algorithms, but lipid emulsion therapy may be indicated when these efforts fail. Prior to performing a peripheral nerve block, it is important to confirm that lipid emulsion is stocked in the ED and that it can be obtained quickly if needed.
When performed properly, ultrasound-guided peripheral nerve blocks can be a safe and effective alternative therapy for pain control in the ED in a variety of indications. Comfort with sonographic anatomy and needle guidance can enable the general emergency physician to successfully perform these blocks.
FIGURE 22.8. This Example of Perineural Ulnar Nerve Block Shows the Needle (Solid Arrow) Depositing the Hypoechoic Anesthetic around the Ulnar Nerve . The epineurium (dashed arrow) is intact and surrounds the internal fascicles . The ulnar artery sits adjacent to the nerve .
FIGURE 22.9. The Radial Nerve (Dashed Arrow ) Adjacent to the Radial Artery (A). The needle (solid arrow) is depositing hypoechoic anesthetic just beneath the epineurial sheath and the fascicles are floating freely within the fluid .

324 Section Vii / Soft Tissue and Musculoskeletal Conditions
Guide to Specific Nerve BlocksOnce the general principles of nerve blocks are un-derstood, each site requires a mastery of site specific anatomy and landmarks as shown in the following fig-ures. Anesthesia of the upper extremity can be achieved with a block of the brachial plexus (Figs. 22.10 and 22.11) (7,8,30–34); the hand, with forearm blocks
(Figs. 22.12–22.14) (9). Anesthesia to most of the lower extremity can be achieved with a proximal block of the femoral nerve (Fig. 22.15) (7,22,35–38). The lower leg can be anesthetized with a block of the sciatic nerve at the popliteal fossa (Fig. 22.16) (7,39). The sole of the foot can be anesthetized with a block of the posterior tibial nerve (Fig. 22.17) (40,41).
B. The interscalene nerve block provides anesthesia of the upper extremity from the shoulder to the elbow .
A. An interscalene block provides effective regional anesthesia for multiple procedures from the shoulder to the elbow .
FIGURE 22.10. Brachial Plexus Block: Interscalene Approach
1. Shoulder or elbow dislocation2. Humerus fractures3. Multiple or complex upper extremity lacerations4. Upper extremity incision and drainage
Indications
C. The head of the bed should be inclined 30 to 60 degrees with the patient’s head turned to the contralateral side . The probe is placed in a transverse ori-entation lateral to the carotid pulse at the approximate level of C5 . The needle approach should be from the posterior/lateral aspect . Patients may need to be turned slightly away from the provider or positioned with towels to allow access to the posterior aspect of the ultrasound transducer .
Probe Placement
D. The internal carotid artery and sternocleidomastoid muscle (SCM ) should first be identified in the transverse plane . By sliding laterally, the anterior and medial scalene muscles (ASM, MSM ) will appear deep to the sterno-cleidomastoid . The brachial plexus (arrow) lies between the scalenes (in the interscalene groove) at this level and is often only 1 to 2 cm deep to the skin . Note the hypoechoic roots of the brachial plexus (C5, C6, C7) representing the “traffic light” sign .
Sonoanatomy
Region of Anesthesia
劉政亨

chapter 22 / Soft Tissue and Musculoskeletal Procedures 325
FIGURE 22.11. Brachial Plexus Bock: Infraclavicular Approach
1. Fractures distal to the mid-humerus2. Elbow or wrist dislocations3. Multiple or complex upper extremity lacerations (below distal humerus)4. Upper extremity incision and drainage (below distal humerus)
A. Indications for an infraclavicular block are similar to those for a supracla-vicular block, and include procedures and pain relief from the mid-humerus distally through the hand . An infraclavicular approach performed in the delto-pectoral groove reduces the risk of iatrogenic pneumothorax compared to a supraclavicular approach .
Indications
D. The lateral (l ), medial (m), and posterior (p) branches (circles) of the bra-chial plexus are demonstrated in relation to the axillary artery (AA) and axillary vein (AV ) . While each cord may be anesthetized individually, a single injection aimed at the posterior cord has demonstrated non-inferiority compared to a triple injection technique (34) .
Sonoanatomy
B. The infraclavicular nerve block provides dense anesthesia distal to the shoulder .
Region of Anesthesia
C. With the patient supine, the probe is placed in the parasagittal orienta-tion in the deltopectoral groove . Abduction of the arm may facilitate image acquisition if the patient will tolerate positioning . The probe indicator (arrow) is aimed cephalad .
Probe Placement

326 Section Vii / Soft Tissue and Musculoskeletal Conditions
D. The oval hyperechoic median nerve (white arrow) will appear nearly mid-line in the volar compartment of the forearm between the flexor digitorum muscular bundles . As the probe is moved distally, the nerve will become more superficial, but may be more difficult to identify due to adjacent tendinous structures .
Sonoanatomy
C. The arm is abducted and supinated with the patient in a semi-recumbent position . The probe is placed in a transverse position over the mid to distal volar aspect of the forearm . The probe indicator (arrow) is aimed laterally .
Probe Placement
FIGURE 22.12. Median Nerve Block: Forearm Approach
1. Hand lacerations2. Fractures3. Foreign body removal4. Nail bed repair (2nd and 3rd digits)
A. Median nerve blocks are especially useful for trauma and procedures related to the palmar surface of the hand .
Indications
B. The median block provides anesthesia primarily to the volar surface of the hand as well as the dorsal aspect of digits 2 and 3 distally .
Region of Anesthesia

chapter 22 / Soft Tissue and Musculoskeletal Procedures 327
FIGURE 22.13. Radial Nerve Block: Forearm Approach
1. Dorsal hand lacerations2. Wound care3. Fracture/dislocation reduction
A. The radial nerve block is primarily indicated for procedures on the dorsum of the hand .
Indications
B. A radial nerve block provides excellent anesthesia to a significant percentage of the dorsal/radial hand .
Region of Anesthesia
C. The probe is accordingly placed along the radial side of the forearm over the estimated location of the radial artery . Using a transverse orientation, the indicator (arrow) is aimed toward the radial side of the arm .
Probe Placement
D. The radial nerve (solid arrow) often has a triangular appearance and lies to the radial side of the radial artery (A) . The radius (dashed arrow) sits deep to the artery and nerve .
Sonoanatomy

328 Section Vii / Soft Tissue and Musculoskeletal Conditions
1. 5th metacarpal fractures2. Lacerations3. Foreign body removal
B. An ulnar nerve block provides anesthesia to significant portions of the dorsal and volar aspects of the hand on the ulnar side .
A. Due to the region of anesthesia provided by the ulnar block, it may be indicated for trauma and related procedures to the volar and dorsal . The ulnar nerve block may be useful for management of trauma and procedures of the ulnar aspect of the hand .
FIGURE 22.14. Ulnar Nerve Block: Forearm Approach
Indications
C. Patient positioning is similar for all forearm blocks . The probe is accord-ingly placed along the ulnar side of the forearm over the estimated location of the ulnar artery . Using a transverse orientation, the indicator is aimed toward the ulnar side of the arm . As the probe is moved proximally, the nerve will typically separate from the ulnar artery .
Probe Placement
D. The ulnar nerve (solid arrow ) lies to the ulnar side of the ulnar artery (A) . The ulna is highlighted by the dashed arrow .
Sonoanatomy
Region of Anesthesia

chapter 22 / Soft Tissue and Musculoskeletal Procedures 329
FIGURE 22.15. Femoral Nerve Block
1. Hip fracture2. Femur fracture and reduction/traction 3. Incision and drainage of thigh abscess4. Patellar fracture
A. A femoral nerve block has excellent utility in many lower extremity injuries and procedures and may help avoid the need for prolonged and significant opioid use in patients with related trauma . Compared with parenteral anal-gesia, a femoral nerve block may reduce delirum and oligoanalgesia in the elderly (36,37) .
Indications
C. The patient should be in a supine position with the leg slightly abducted . The probe should initially be placed just caudal to the inguinal ligament over the region of the femoral artery with the probe indicator aimed laterally (arrow ) .
Probe Placement
D. The femoral nerve (white arrow) lies lateral to the femoral artery (FA) and femoral vein (FV ) . The nerve may have a triangular shape as it is slightly compressed by the inguinal ligament and sits at the junction of the muscular fascia laterally .
Sonoanatomy
B. The femoral nerve supplies sensation to the majority of the anterior leg proximal to the knee as well as the medial portion of the lower leg .
Region of Anesthesia
劉政亨

330 Section Vii / Soft Tissue and Musculoskeletal Conditions
FIGURE 22.16. Sciatic Nerve Block: Popliteal Fossa Approach
1. Tibia and/or fibula fracture2. Ankle or foot fracture/dislocation3. Achilles tendon injury
A. A popliteal fossa block of the sciatic nerve is indicated for fractures, lac-erations, or trauma to the foot, ankle, or lateral leg . Blocking the common peroneal and tibial nerves where they coexist in the shared epineurium at the sciatic bifurcation has a higher block success rate, provides better anesthesia with faster onset times and fewer needle passes, and decreases block per-formance times compared to targeted injections of the nerves distally (39) .
Indications
C. The patient is ideally placed in the prone position with the probe in a trans-verse orientation in the proximal popliteal fossa with the probe indicator ori-ented laterally (see eFig . 22 .1) . If the patient is unable to lie prone, the leg may be elevated and the probe positioned underneath the posterior aspect of the leg with the probe indicator (oval) aimed at the operator, as seen here in C .
Sonoanatomy
D. The sciatic nerve (white oval ) lies between the lateral biceps femoris (BF ) and the medial seimimembranosus (SM ) muscles . Sliding distally along the sciatic nerve allows for visualization of the division into the common peroneal (white circle) and tibial (blue and white circle) nerves as they sit superficial to the popliteal artery (PA) and popliteal vein (PV ), seen in eFig . 22 .2 .
Sonoanatomy
B. By anesthetizing the sciatic nerve or the combination of the tibial and common peroneal nerves, nerve blockade below the knee may be achieved for the region not affected by the femoral nerve block .
Region of Anesthesia
劉政亨
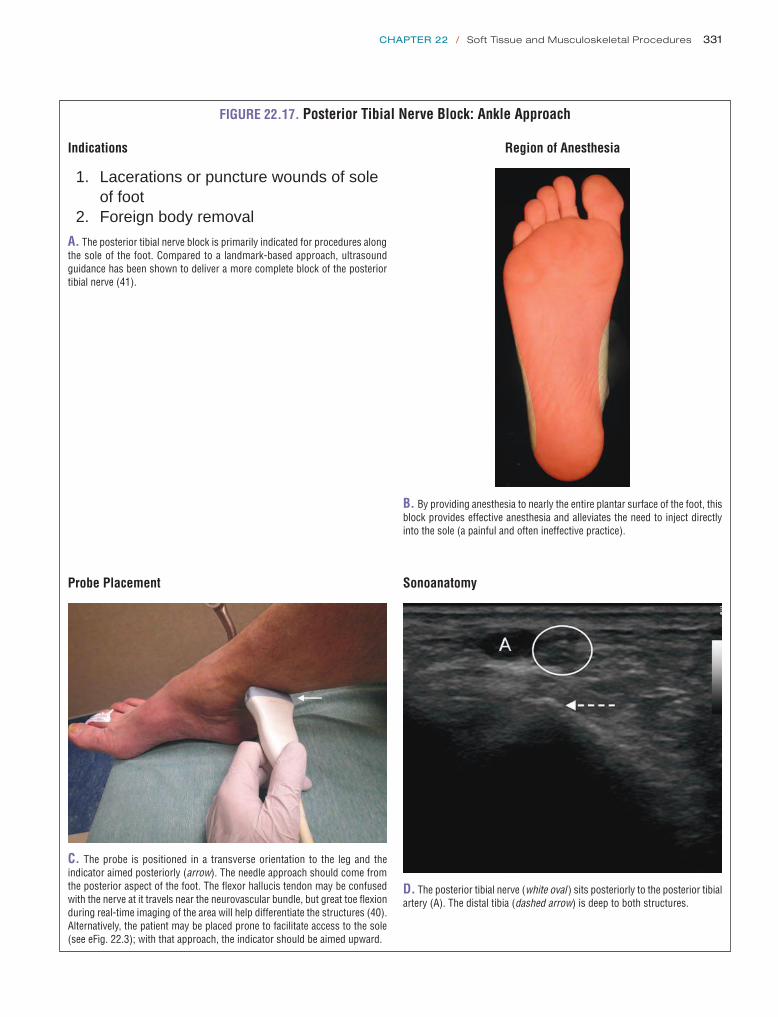
chapter 22 / Soft Tissue and Musculoskeletal Procedures 331
FIGURE 22.17. Posterior Tibial Nerve Block: Ankle Approach
1. Lacerations or puncture wounds of sole of foot2. Foreign body removal
A. The posterior tibial nerve block is primarily indicated for procedures along the sole of the foot . Compared to a landmark-based approach, ultrasound guidance has been shown to deliver a more complete block of the posterior tibial nerve (41) .
Indications
B. By providing anesthesia to nearly the entire plantar surface of the foot, this block provides effective anesthesia and alleviates the need to inject directly into the sole (a painful and often ineffective practice) .
Region of Anesthesia
Probe Placement
C. The probe is positioned in a transverse orientation to the leg and the indicator aimed posteriorly (arrow) . The needle approach should come from the posterior aspect of the foot . The flexor hallucis tendon may be confused with the nerve at it travels near the neurovascular bundle, but great toe flexion during real-time imaging of the area will help differentiate the structures (40) . Alternatively, the patient may be placed prone to facilitate access to the sole (see eFig . 22 .3); with that approach, the indicator should be aimed upward .
Sonoanatomy
D. The posterior tibial nerve (white oval ) sits posteriorly to the posterior tibial artery (A) . The distal tibia (dashed arrow) is deep to both structures .

332 Section Vii / Soft Tissue and Musculoskeletal Conditions
ARTHROCENTESISClinical ApplicationsUltrasound is useful for evaluating swelling around joints and determining whether the source is a joint effusion or soft tissue pathology (42). The normal joint space is lined by articular cartilage, a synovial membrane, and a fibrous joint capsule that is filled with a small amount of anechoic synovial fluid. The normal amount of fluid for each joint, and corresponding width of the anechoic fluid stripe, are listed in Table 21.2. When the joint space is distended, ultrasound can objectively measure the size of the effusion and characterize the fluid (43). In most cases, comparison with a normal contralateral joint can be used as a standard.
Once it has been determined that there is a pathologic joint effusion and that arthrocentesis is indicated, the procedure can be performed under ultrasound guidance. Compared to a landmark-based approach, ultrasound-guided arthrocente-sis of the knee has been shown to produce less procedural pain and improve success with a greater yield of synovial fluid. Use of ultrasound also improves confidence with arthrocentesis in novice physicians (44,45).
Throughout this chapter, we describe the procedure for real-time ultrasound guidance, in which case, a sterile probe cover and gel should be used after the skin has been prepped. In some cases, however, it may be appropriate to identify and measure the joint effusion and mark the best spot for arthrocentesis prior to sterile prep. When this technique is used, the joint should be imaged in the same position as used for arthrocentesis.
Image AcquisitionJoint scanning is typically performed with a high frequency (5 to 17 MHz) linear array transducer. A low frequency (3 to 5 MHz) curvilinear transducer may be required for imaging the shoulder and hip if the joint is >4 to 5 cm from the skin surface.
Anatomy and ProcedureJoint anatomy and approaches to specific sites for arthro-centesis are summarized in Figures 22.18–22.24 (46–52). In general, the joint should be visualized and the presence and location of effusion noted. Once a decision is made to aspirate, shallow joints (knee, ankle, elbow) can be accessed with 1½-inch needles; deeper joints (hip and shoulder) or larger patients may require longer 3½- to 5-inch needles. The ultrasound can localize the depth of an effusion and help determine the optimal needle length. In most cases, an 18-gauge needle is advised to aspirate tenacious joint fluid.
Pitfalls and Complications 1. When evaluating for the presence of a joint effusion,
the anechoic appearance of cartilage can be easily mis-taken for joint fluid. It is important to be familiar with the normal width of the cartilage in different joints to avoid unnecessary attempts at arthrocentesis. With experience, typical locations of cartilage can be identified; however, the potential for mistaking cartilage for effusion can most easily be minimized by comparing sides. In shallow joints or effusions near the skin surface, compressibility of fluid can be used to distinguish effusions from cartilage.
2. Remember to use an appropriate amount of anesthesia for the surrounding soft tissues when accessing a joint, especially in deeper structures where a more oblique approach is used (e.g., hip, shoulder).
3. When performing real-time ultrasound guidance for pro-cedures, it is the standard of care to keep a sterile field to reduce the risk of iatrogenic infection.
4. Ultrasound can determine sites that are most accessible for aspiration. However, arthrocentesis should only be done in suitable locations away from other vital struc-tures. Avoid the medial hip joint (femoral vessels), pop-liteal fossa (popliteal vessels), space between the anterior tibial and the extensor hallucis longus tendons (site of dorsalis pedis artery and deep peroneal nerve), and the medial elbow (ulnar nerve).

chapter 22 / Soft Tissue and Musculoskeletal Procedures 333
FIGURE 22.18. Arthrocentesis of Hip
The patient should be placed supine with the hip in a neutral position . The transducer should then be placed in the long axis of the femur just proximal to the midshaft and guided proximally toward the femoral neck . When the greater and lesser trochanters come into view, the probe should be turned into an oblique-sagittal plane at the level of the femoral head and neck junction . In this position, the anterior hip recess can be evaluated for a hip effusion .
A. Hip anatomy . B. Transducer and needle placement .
Greatertroch
C. Normal anterior hip recess: <5 mm . D. Abnormal anterior hip recess: >5 mm or >2 mm larger than the contralateral (normal) side .
Procedure
The joint should be approached from the distal and lateral position of the transducer to avoid the neurovascular structures which lie medially . The needle should be advanced in plane with the transducer close to a 45-degree angle toward the joint and visualized at all times underneath the transducer while approaching the joint . The needle should be visualized entering the most prominent portion of the anterior joint recess at which point the fluid can be aspirated freely (43,46,47) .
Pitfalls
The cartilage appears hypoechoic in all joints and can easily be mistaken for an effusion . This is of particular importance in the hip joint due to the moderate thickness of the cartilage and in all joints in children .

334 Section Vii / Soft Tissue and Musculoskeletal Conditions
Patella
Quadricepstendon
Quadricepsfat pad
Suprapatellerbursa
Prefemoralfat pad
Femur
C. Normal suprapatellar recess: 1 to 2 mm .
Quadricepstendon
r knee
Quadricepsfat pad
Distendedsuprapatellar
bursa
Prefemoralfat pad
D. Abnormal suprapatellar recess: >2 mm .
Procedure
With transducer positioned just off the midline, the needle can be inserted at the superior aspect of the transducer using an in-plane approach . The needle should be visualized entering the soft tissues and subsequently the suprapatellar bursa in plane with the transducer .
FIGURE 22.19. Arthrocentesis of the Knee-Longitudinal Approach
The patient should be placed in a supine position with the knee slightly flexed over a towel roll . The transducer should be placed in the long axis of the femur and guided distally almost to the level of the quadriceps tendon insertion on the patella .
A. Knee anatomy . B. Transducer and needle placement .

FIGURE 22.20. Arthrocentesis of the Knee-Transverse Approach
The transducer should be turned 90 degrees now in the short axis of the femur . At this level, the suprapatellar bursa, which is an exten-sion of the knee joint, may be seen deep to the quadriceps tendon and separates the quadriceps fat pad from the prefemoral fat pad .
A. Knee anatomy .
B. Transducer and needle placement .
Procedure
The transducer should be held in the short axis of the femur over the quadriceps tendon and the aspiration should be ap-proached from the lateral aspect of the joint just above the superior pole of the patella . The needle should be visualized entering the soft tissues and subsequently the suprapatellar bursa in plane with the transducer . Note this is different than the landmark-based approach, which recommends accessing the joint from the lateral midpole of the patella and angling the needle superiorly into the suprapatellar bursa (43–45,48) .
Pitfalls
If the patient’s knee is in full extension fluid may preferentially accumulate both medial and lateral to the patella making it difficult to visualize or obtain fluid in small effusions . Remember, to place the patient’s knee over a towel roll or something similar to keep the knee in about 30 degrees of flexion . If the patient has a Baker’s cyst, which is continuous with the joint space, fluid may accumulate posteriorly when the patient is in a supine position making it difficult to obtain fluid . If an effusion is suspected in this case, perform an ultrasound of the posterior knee and if a large Baker’s cyst is present, this structure can be drained and sent for laboratory analysis .
C. Knee: short axis view .
Quadricepsfat pad
Distendedsuprapatellar
bursaPrefemoral
fat pad
D. Abnormal suprapatellar recess: >2 mm . EFF, effusion .
335

336 Section Vii / Soft Tissue and Musculoskeletal Conditions
FIGURE 22.21. Arthrocentesis of the Ankle
The patient should be placed in a comfortable position with the ankle in a neutral position . The transducer should be placed in the long axis of the tibia and guided distally until the tibia, talar dome and navicular bone are visualized in a single screen .
A. Ankle anatomy . B. Transducer and needle placement .
Anterior joint recess
TalusTibia
C. Normal anterior joint recess: 1 to 2 mm .
MM
Lankle
D. Abnormal anterior joint recess: >2 mm .
Procedure
The joint can be approached from either the proximal or distal portion of the transducer depending on examiner preference . More importantly, the transducer should be placed medial to the anterior tibialis tendon or lateral to the extensor hallicus tendon, thus avoiding the dorsalis pedis artery and peroneal nerve . The needle should be visualized in plane at approximately a 45-degree angle while approaching the most prominent bulge of the anterior joint recess (49) .
Pitfalls
The hypoechoic stripe over the talar dome is easily mistaken for fluid . Be sure to evaluate in both the long and short axis, com-press the structure, or make a comparison with the contralateral side . Always visualize the dorsalis pedis artery which crosses from medial to lateral deep to the extensor hallicus longus tendon and the peroneal nerve (which runs deep to the artery) every time you perform an arthrocentesis under ultrasound-guidance to avoid passing through these structures .

chapter 22 / Soft Tissue and Musculoskeletal Procedures 337
B. Transducer and needle placement .
D. Abnormal posterior joint recess: >2 mm .
HumeralheadEffusion
Procedure
The joint should be approached along the lateral position of the transducer and the joint capsule itself is punctured along the me-dial border of the humeral head . This avoids neurovascular structures . The needle should be advanced at a 30 to 45 degree angle in plane with the transducer toward the joint and visualized entering the most prominent portion of the joint capsule (43,50) .
Pitfalls
Small effusions may only be visible in external rotation . Also, if no fluid can be visualized within the joint but there is a high suspi-cion for an intra-articular process, fluid may be visualized within the biceps tendon sheath, which is the most dependent portion of the joint, after the patient has been sitting for a period of time (see Chapter 21 for biceps tendon evaluation) . Do not attempt to obtain fluid from this location, but rather have it guide your decision-making about the presence or lack of fluid within the joint .
A. Shoulder anatomy .
FIGURE 22.22. Arthrocentesis of the Shoulder
The patient should be sitting in an upright position with the arm flexed to 90 degrees at the elbow and in slight external rota-tion at the shoulder . Place the transducer just below the scapular spine in the long axis of the infraspinatus tendon to view the posterior joint recess . This will bring into view the infraspinatus and teres minor muscles as well as the rounded humeral head sitting in the glenoid . Fluid usually first collects in the infraspinatus recess .
Infraspinatus
GlenoidPosterior
joint recess
Humeralhead
C. Normal posterior joint recess: 1 to 2 mm .

338 Section Vii / Soft Tissue and Musculoskeletal Conditions
Procedure
The posterior joint recess should be approached and identified in the long axis of the humerus . The joint can be accessed in the long axis of the humerus if the needle passes through the bulk of the triceps muscle and not the tendon itself .
A. Elbow anatomy . B. Transducer and needle placement .
Fat pad
Triceps
Humerus
Posteriorjoint recess
Olecranon
C. Normal joint recess: 1 to 2 mm .
Fat pad
Humerus
Distended posteriorjoint recess
Olecranon
D. Abnormal joint recess: >2 mm .
FIGURE 22.23. Arthrocentesis of the Elbow, Longitudinal Approach
The patient should be sitting in an upright position with the elbow flexed at 90 degrees and the forearm resting on a towel roll . The transducer should be placed in the long axis of the humerus and guided distally to the level of the triceps insertion on the olecranon . At this level, the posterior joint recess can be evaluated for an effusion .

chapter 22 / Soft Tissue and Musculoskeletal Procedures 339
Procedure
When the transducer is placed in the short axis of the humerus, the joint aspiration can be approached from the lateral aspect of the elbow to avoid passing through the triceps tendon and the ulnar neurovascular bundle . The needle should be visualized in plane with the transducer entering the soft tissues and the most prominent portion of the joint recess (43,51,52) .
Pitfalls
Although controversy exists on the best way to access the elbow joint between the lateral or proximal approach, it is known that the joint should not be accessed from a medial approach due to the neurovascular structures surrounding the joint . If the joint is to be accessed from the proximal approach it is frowned on to pass through the triceps tendon .
Synovial membrane(distended)
Medial epicondyle
Olecranonprocess
UlnaRadius
Lateral epicondyle
Humerus
A. Elbow anatomy . B. Transducer and needle placement .
Fat pad
Lateralepicondyle
ELBOW
Posterior joint recess
Medialepicondyle
C. Normal joint recess: 1 to 2 mm .
Fat pad
Lateralepicondyle Distended posterior
joint recess
Medialepicondyle
D. Abnormal joint recess: >2 mm .
FIGURE 22.24. Arthrocentesis of the Elbow, Transverse Approach
The patient should be sitting in an upright position with the elbow flexed at 90 degrees and the forearm resting on a towel roll . The transducer should be placed in the transverse axis of the humerus and guided distally to the level of the triceps insertion on the olecranon . At this level, the posterior joint recess can be evaluated for an effusion .

340 Section Vii / Soft Tissue and Musculoskeletal Conditions
FRACTURE REDUCTIONClinical ApplicationsAcute fracture is the ninth leading diagnosis given in the ED and accounts for 3.2% of ED visits annually (53). Ultra-sound detection of long bone fractures has been studied in the adult and pediatric populations, with reported sensitivity of 85% to 95% and specificity ranging from 90% to 100% when compared to plain radiographs (54,55). Sensitivity is highest in long bone and proximal fractures as compared to smaller bones and more distal sites (55–57). Use of ul-trasound for real-time guidance of fracture reduction has also been studied. One study showed a significant reduc-tion in mean time to fracture diagnosis as well as a decrease in mean pain scores during the diagnostic procedure when use of ultrasound was compared to plain radiographs (58). Ultrasound has also proven effective in the real-time man-agement of forearm fractures in the ED (59–61).
Image AcquisitionThe probe should be placed directly over the suspected frac-ture with the proximal aspect of the bone on the left of the image and the distal aspect on the right. The area of bony pathology should be scanned in a systematic manner, in the long and short axes as well as the anterior and posterior planes (Fig. 22.25).
Normal Ultrasound AnatomyThe appearance of normal bone and ultrasound findings of fractures are described in detail in Chapter 21 and seen in Figures 21.4 and 21.10.
ProcedureThe injured site is examined to localize the fracture. Frac-tures appear on ultrasound as an irregularity in the hyper-echoic line of the bony cortex (Figs. 22.25 and 22.26). When cortical disruption is minimal, it may be difficult to detect on ultrasound. Pay particular attention to the subcu-taneous tissues adjacent to the underlying bone and evalu-ate for heterogeneity, which may suggest an occult fracture (Fig. 22.26E). In the presence of normal plain radiographs ultrasound has been shown to identify Salter Harris Type I fractures in the pediatric population based on the patients’ symptoms and associated soft tissue abnormality (59). A unique advantage of ultrasound is that it can locate the sub-periosteal hematoma formed by a fracture. An ultrasound-guided hematoma block can then be performed prior to reduction (62).
The fracture reduction should be carried out just as it would with other imaging modalities such as fluoroscopy or with postreduction radiographs. After the reduction attempt, ultrasound images should be obtained in the longitudinal and transverse axes as well as the anterior and posterior planes (Fig. 22.27). If the ultrasound shows persistent malalign-ment, additional attempts at reduction can be performed in real time. Ultrasound offers the ease of multiple examina-tions without exposure to radiation. If the ultrasound image suggests that there is near anatomic alignment, proceed with splinting the extremity. FIGURE 22.26. Fracture Identification. A: Nondisplaced rib fracture .
A
FIGURE 22.25. Evaluation of Musculoskeletal Structures. A: Fibula frac-ture long axis with subacute soft tissue hematoma . B: Fibula fracture short axis . Arrows, subacute hematoma; m, muscle; p, periosteum .
A
B
Pitfalls and ComplicationsOpen physes in children may be mistaken for a fracture line. Familiarize yourself with the smooth appearance and gradual downward slope associated with open physes ver-sus the abrupt step off that usually occurs with an acute

chapter 22 / Soft Tissue and Musculoskeletal Procedures 341
FIGURE 22.26. (Continued ) B: Nondisplaced tibial fracture . C: Displaced fibular fracture . FX, fracture . D: Displaced tibial fracture . E: Hematoma overlying fracture site .
D E
CB
FIGURE 22.27. Fracture Reduction. A: Tibia prior to closed reduction .B: Tibia after closed reduction .
A B

342 Section Vii / Soft Tissue and Musculoskeletal Conditions
fracture (Fig. 22.28). Remember to compare the suspected site of fracture or open physis with plain radiographs if available.
ABSCESS INCISION AND DRAINAGEClinical ApplicationsSkin and soft tissue abscesses are an extremely com-mon problem in ED’s, especially since the emergence of community-associated MRSA. Abscesses located deep in the pannus around the buttocks, thigh, and breast (Fig. 22.29), as well as intramuscular abscesses associated with injection drug use (Fig. 22.30), may produce no overlying fluctuance and can be virtually impossible to locate by physical exam. Providing drainage is the essential treatment for all abscesses, but this requires that the pus collection be located. Bedside ultrasound can be invaluable in precisely locating a deep pus collection and providing real-time procedural guidance
FIGURE 22.29. A Subcutaneous Abscess on the Thigh. It is located 2 cm below the skin surface within the pannus layer .
FIGURE 22.28. Normal Open Tibial Physis at the Level of the Knee in a Child. PT, patellar tendon .
A
BFIGURE 22.30. Deltoid Muscle Abscess due to Injection of Heroin. The shoulder was swollen with cellulitic skin changes, but without a fluctuance or drainage . Differential diagnosis included septic arthritis and necrotizing fasciitis, until the abscess was found with bedside ultrasound . A: Longitudinal view . B: Transverse view . Note that the humerus is visible in the far field in both images .
(63,64). Ultrasound guidance also allows abscesses located near vessels and nerves, such as on the neck, wrist or antecu-bital fossa, and groin to be incised or aspirated and drained safely (65,66). In addition, ultrasound can be used to guide the local anesthetic injection, or perform a regional nerve block, before the painful incision and drainage procedure.
Purulent infections that require drainage, most commonly furuncles and abscesses, now account for 50% to 64% of ED skin and soft tissue infections (63,64,67). Two prospective studies have assessed the impact of routine ED ultrasound in correctly identifying infections in need of drainage. Squire et al. compared the accuracy of ultrasound to physical exam for diagnosing abscess in 107 cases (64). Ultrasound had a higher sensitivity, specificity, positive, and negative predic-tive value than physical exam, although differences were not statistically significant. Ultrasound was correct in 17 of 18 cases in which findings disagreed with the impression from physical exam. Tayal et al. found that ultrasound cor-rectly changed management in 39/82 cases (48%) in which drainage was thought not to be needed on the basis of physi-cal exam alone (63). Ultrasound also changed management in 32/44 casas (73%) in which providers thought drainage

chapter 22 / Soft Tissue and Musculoskeletal Procedures 343
to identify the incision site for exploration (71,72). The most commonly described technique is to use ultrasound in real time to guide placement of forceps or a hemostat adjacent to the foreign body (73–77). This technique is demonstrated with a linear foreign body in Figure 22.31. After making a skin incision over the most superficial portion of the foreign body, advance the forceps toward the foreign body while maintaining an image of both the forceps and the target for-eign body in longitudinal axis. If extraction is unsuccessful, try rotating the transducer 90 degrees, then image the mouth of the hemostat and tip of the foreign body transversely. Alligator forceps may be more maneuverable and cause less
would be needed, including eight cases in which the location or depth of the incision was changed.
While many cutaneous abscesses are obvious on physical exam, a case series by Blaivas et al. suggests that routine ultrasound examination of even seemingly obvious abscesses can provide unexpected and clinically important information (66). The report included cases of abscesses unexpectedly abutting vessels, as well as alternative diagnoses, such as a pseudoaneurysm, hernia sac, and tumor mass, that were mas-querading as abscesses.
Image AcquisitionAlmost all subcutaneous abscesses are best seen with a linear array transducer. A probe cover is recommended when scan-ning skin and soft tissue infections (67). How to differenti-ate an abscess from cellulitis on ultrasound is described in Chapter 20. Thoroughly interrogate the subcutaneous tissue below the inflamed skin, in both a transverse and longitudi-nal plane, taking care to identify multiple pus pockets that may be present.
ProcedureThe depth of the abscess cavity should be measured and nearby vessels and other sensitive structures should be iden-tified. For deep abscesses, consider using ultrasound guid-ance to accurately administer local anesthetic between the skin and the abscess and in a ring around the cavity. Follow-ing the drainage procedure, particularly if it seemed difficult to locate pus or when multiple pockets were identified, the area can be scanned again to confirm that all abscess cavities have been thoroughly evacuated ( VIDEO 22 .5).
Pitfalls and ComplicationsThe use of ultrasound minimizes the risk of puncture or damage to surrounding structures, as well as helping assure adequacy of drainage.
FOREIGN BODY REMOVALClinical ApplicationsRetained foreign bodies in skin and soft tissue may result in infection, chronic pain, and impairment of function. Missed foreign bodies are one of the most common causes of mal-practice claims against emergency physicians and the number one source of litigation related to wound management (68,69). History and physical exam alone is generally inadequate for detection of foreign bodies (70). Even after they are located with imaging, foreign bodies often remain difficult to remove.
Image AcquisitionForeign body detection, including image acquisition, ultra-sound anatomy, and pathology is discussed in Chapter 20. The following section covers ultrasound-guided techniques for foreign body removal.
ProcedureSeveral techniques for ultrasound-guided foreign body removal have been described. The simplest method is ultrasound-guided incision, in which the transducer is cen-tered over the foreign body and the skin is marked with a pen
FIGURE 22.31. Ultrasound-Guided Removal of a Subcutaneous Tooth-pick with Forceps in a Chicken Breast Model. A: Preoperative ultrasound revealing toothpick (open arrow) in long axis . B: Long axis view of toothpick with approaching forceps (solid arrow); note reverberation artifact . C: Short axis view of toothpick and forceps; toothpick is centered between mouth of open forceps (solid arrows) .
A
B
C

344 Section Vii / Soft Tissue and Musculoskeletal Conditions
tissue injury than standard hemostats or instruments found in suture kits (78).
A third, well-described technique, which may be espe-cially useful for deeper or irregularly shaped foreign bod-ies, is ultrasound-guided needle localization (71,74). This method may be less suitable in areas where sensitive struc-tures such as tendons, nerves, and bones can become in-terposed, such as in the hands and feet. Using ultrasound guidance, one or two sterile finder needles are inserted just under the foreign body. If two needles are used, it is recom-mended that they be placed at 90 degrees to one another (79). Lidocaine can be injected through one of the needles, pro-viding both anesthesia and hydrostatic dissection, improving the view of the foreign body (73). The needles are left in place to serve as landmarks during open retrieval. Incision and dissection down to the tip or intersection of the needles should lead to the foreign body. This technique is outlined in Figure 22.32.
Pitfalls and ComplicationsRetrieval of foreign bodies using ultrasound guidance is tech-nically challenging. Despite the use of a linear transducer with excellent resolution and a narrow footprint, some ana-tomical areas, particularly fingers, toes, and web spaces, can still be difficult to image (80). Use of a generous gel layer, a standoff pad, or even a water bath, may be required. It can be difficult to keep the foreign body, the instruments, and the ultrasound beam all in the same plane. With a water bath or generous gel layer, the probe does not make direct, stabiliz-ing contact with the patient, leading to probe movement. A second operator can be helpful. Care must be taken to avoid damaging delicate structures such as tendons, nerves, and vessels during the procedure, especially in hands and feet. Familiarity with the sonographic anatomy surrounding the foreign body and the retrieval path will minimize iatrogenic injury.
FIGURE 22.32. Ultrasound-Guided Localization of Glass Foreign Body in a Chicken Breast Model. Needle localization technique . A: Single-needle technique . B: Two needles at right angle technique . open arrow, glass; solid arrow, needle .
A1 B1
A2 B2

chapter 22 / Soft Tissue and Musculoskeletal Procedures 345
Finally, the time required to detect and then remove a for-eign body using ultrasound guidance should not be underes-timated. Studies have thus far been limited to the radiology literature. Detection of foreign bodies by radiologists aver-aged 10 minutes, but extended up to 30 minutes (80), and the time required for detection and removal ranged from 15 to 40 minutes (75,77).
LUMBAR PUNCTUREClinical ApplicationsLumbar puncture is a very common but often difficult ED procedure. Cerebral spinal fluid samples provide essen-tial diagnostic information on a variety of life-threatening conditions. Therefore, once lumbar puncture is considered indicated, it is rarely appropriate to give up on the procedure simply because it proves difficult or time consuming. In the traditional approach, visual and tactile landmarks are used to identify the interspinous spaces and guide needle insertion. However, a patient’s body habitus or underlying spinal anat-omy may impair traditional landmark identification.
Use of bedside ultrasound to aid in the performance of lumbar puncture has been described across multiple special-ties. Initially described in the anesthesia literature, more re-cent studies have highlighted its benefits in the emergency medicine setting (81–83). Ultrasound-guided lumbar punc-ture in the ED has been shown to significantly reduce the number of failed attempts in patients with all body types, as well as in obese patients (84). Ultrasound guidance can be used routinely as an aid to identify landmarks, selectively when a difficult procedure is anticipated, or as a rescue strat-egy after unsuccessful attempts by the traditional approach.
Image AcquisitionThe goal of ultrasound-guided lumbar puncture is to iden-tify the bony cortices of the lumbar vertebrae, particularly the tips of the spinous processes. Emergency physicians can rapidly and accurately identify multiple relevant spinal land-marks using bedside ultrasound (85). Transducer selection depends primarily on body habitus. In a thin adult or child, a 10-MHz linear transducer usually provides optimal resolu-tion, whereas an obese patient often requires a curvilinear transducer to identify the spine far below the skin surface. The cortex appears as a hyperechoic line with a correspond-ing acoustic shadow in the far field.
ProcedureThe scan can be done with the patient in the same position that will be used for the lumbar puncture, either sitting or lateral decubitus. Because the scan is done prior to the pro-cedure—not in real time—patient positioning is less impor-tant for lumbar puncture than with other ultrasound-guided procedures. A common problem in the landmark approach is failing to insert the needle at midline, and ultrasound guid-ance begins with establishing the exact midline. The probe should first be placed in the transverse orientation at the level of the iliac crests (Fig. 22.33). In this alignment, the spinous processes will cause a distinct acoustic shadow identifying the midline of the vertebrae. Note the depth of the spinous processes (Fig. 22.34). With the spinous process centered on
FIGURE 22.33. The Probe is in a Transverse Orientation to the Spine.
A
FIGURE 22.34. The spinous process is shown as a hyperechoic point approximately 1 cm deep with corresponding attenuation shadow using the linear (A) and curvilinear probe (B) .
B
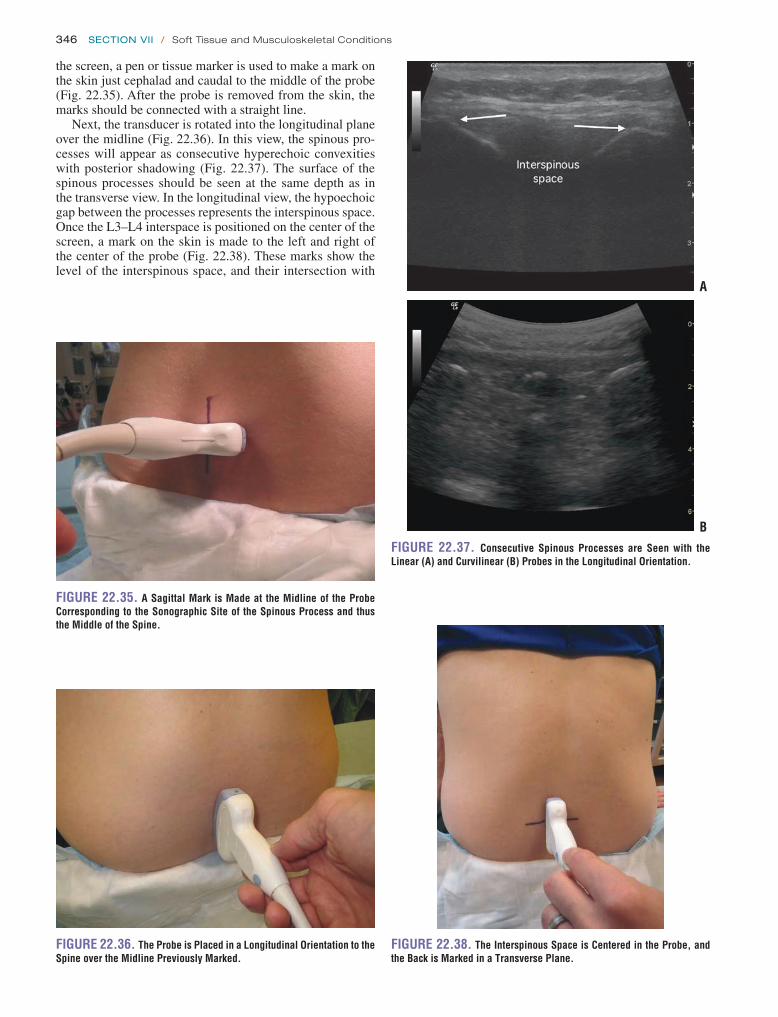
346 Section Vii / Soft Tissue and Musculoskeletal Conditions
FIGURE 22.37. Consecutive Spinous Processes are Seen with the Linear (A) and Curvilinear (B) Probes in the Longitudinal Orientation.
A
B
FIGURE 22.38. The Interspinous Space is Centered in the Probe, and the Back is Marked in a Transverse Plane.
FIGURE 22.35. A Sagittal Mark is Made at the Midline of the Probe Corresponding to the Sonographic Site of the Spinous Process and thus the Middle of the Spine.
FIGURE 22.36. The Probe is Placed in a Longitudinal Orientation to the Spine over the Midline Previously Marked.
the screen, a pen or tissue marker is used to make a mark on the skin just cephalad and caudal to the middle of the probe (Fig. 22.35). After the probe is removed from the skin, the marks should be connected with a straight line.
Next, the transducer is rotated into the longitudinal plane over the midline (Fig. 22.36). In this view, the spinous pro-cesses will appear as consecutive hyperechoic convexities with posterior shadowing (Fig. 22.37). The surface of the spinous processes should be seen at the same depth as in the transverse view. In the longitudinal view, the hypoechoic gap between the processes represents the interspinous space. Once the L3–L4 interspace is positioned on the center of the screen, a mark on the skin is made to the left and right of the center of the probe (Fig. 22.38). These marks show the level of the interspinous space, and their intersection with
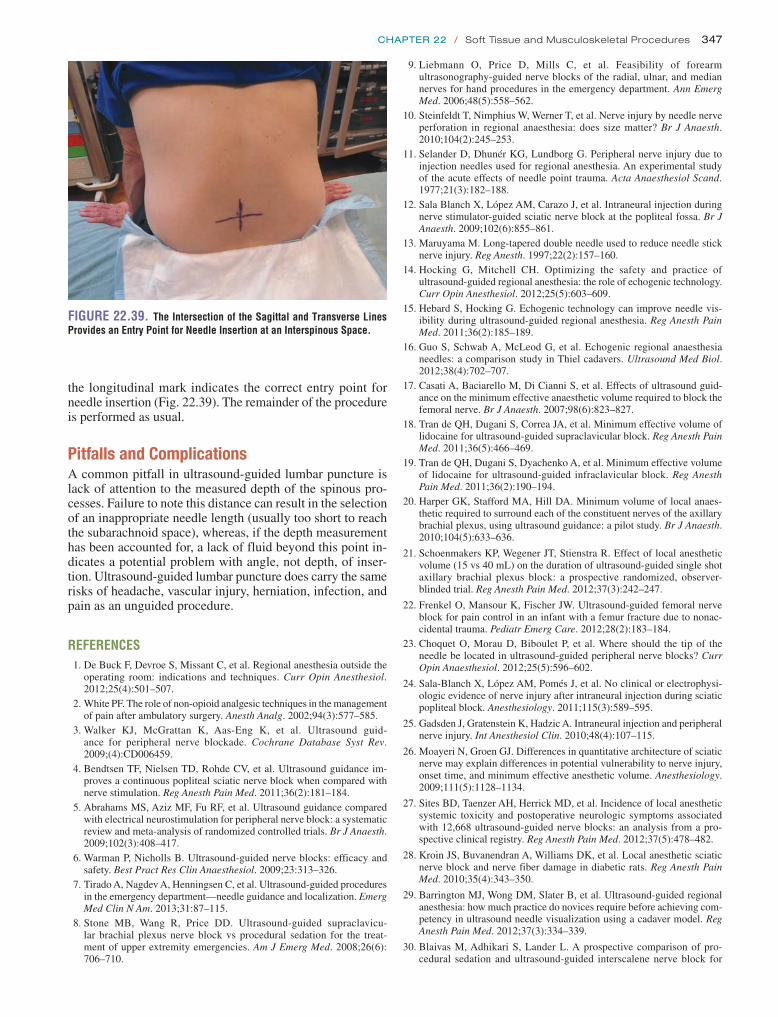
chapter 22 / Soft Tissue and Musculoskeletal Procedures 347
the longitudinal mark indicates the correct entry point for needle insertion (Fig. 22.39). The remainder of the procedure is performed as usual.
Pitfalls and ComplicationsA common pitfall in ultrasound-guided lumbar puncture is lack of attention to the measured depth of the spinous pro-cesses. Failure to note this distance can result in the selection of an inappropriate needle length (usually too short to reach the subarachnoid space), whereas, if the depth measurement has been accounted for, a lack of fluid beyond this point in-dicates a potential problem with angle, not depth, of inser-tion. Ultrasound-guided lumbar puncture does carry the same risks of headache, vascular injury, herniation, infection, and pain as an unguided procedure.
REFERENCES 1. De Buck F, Devroe S, Missant C, et al. Regional anesthesia outside the
operating room: indications and techniques. Curr Opin Anesthesiol. 2012;25(4):501–507.
2. White PF. The role of non-opioid analgesic techniques in the management of pain after ambulatory surgery. Anesth Analg. 2002;94(3):577–585.
3. Walker KJ, McGrattan K, Aas-Eng K, et al. Ultrasound guid-ance for peripheral nerve blockade. Cochrane Database Syst Rev. 2009;(4):CD006459.
4. Bendtsen TF, Nielsen TD, Rohde CV, et al. Ultrasound guidance im-proves a continuous popliteal sciatic nerve block when compared with nerve stimulation. Reg Anesth Pain Med. 2011;36(2):181–184.
5. Abrahams MS, Aziz MF, Fu RF, et al. Ultrasound guidance compared with electrical neurostimulation for peripheral nerve block: a systematic review and meta-analysis of randomized controlled trials. Br J Anaesth. 2009;102(3):408–417.
6. Warman P, Nicholls B. Ultrasound-guided nerve blocks: efficacy and safety. Best Pract Res Clin Anaesthesiol. 2009;23:313–326.
7. Tirado A, Nagdev A, Henningsen C, et al. Ultrasound-guided procedures in the emergency department—needle guidance and localization. Emerg Med Clin N Am. 2013;31:87–115.
8. Stone MB, Wang R, Price DD. Ultrasound-guided supraclavicu-lar brachial plexus nerve block vs procedural sedation for the treat-ment of upper extremity emergencies. Am J Emerg Med. 2008;26(6): 706–710.
9. Liebmann O, Price D, Mills C, et al. Feasibility of forearm ultrasonography-guided nerve blocks of the radial, ulnar, and median nerves for hand procedures in the emergency department. Ann Emerg Med. 2006;48(5):558–562.
10. Steinfeldt T, Nimphius W, Werner T, et al. Nerve injury by needle nerve perforation in regional anaesthesia: does size matter? Br J Anaesth. 2010;104(2):245–253.
11. Selander D, Dhunér KG, Lundborg G. Peripheral nerve injury due to injection needles used for regional anesthesia. An experimental study of the acute effects of needle point trauma. Acta Anaesthesiol Scand. 1977;21(3):182–188.
12. Sala Blanch X, López AM, Carazo J, et al. Intraneural injection during nerve stimulator-guided sciatic nerve block at the popliteal fossa. Br J Anaesth. 2009;102(6):855–861.
13. Maruyama M. Long-tapered double needle used to reduce needle stick nerve injury. Reg Anesth. 1997;22(2):157–160.
14. Hocking G, Mitchell CH. Optimizing the safety and practice of ultrasound-guided regional anesthesia: the role of echogenic technology. Curr Opin Anesthesiol. 2012;25(5):603–609.
15. Hebard S, Hocking G. Echogenic technology can improve needle vis-ibility during ultrasound-guided regional anesthesia. Reg Anesth Pain Med. 2011;36(2):185–189.
16. Guo S, Schwab A, McLeod G, et al. Echogenic regional anaesthesia needles: a comparison study in Thiel cadavers. Ultrasound Med Biol. 2012;38(4):702–707.
17. Casati A, Baciarello M, Di Cianni S, et al. Effects of ultrasound guid-ance on the minimum effective anaesthetic volume required to block the femoral nerve. Br J Anaesth. 2007;98(6):823–827.
18. Tran de QH, Dugani S, Correa JA, et al. Minimum effective volume of lidocaine for ultrasound-guided supraclavicular block. Reg Anesth Pain Med. 2011;36(5):466–469.
19. Tran de QH, Dugani S, Dyachenko A, et al. Minimum effective volume of lidocaine for ultrasound-guided infraclavicular block. Reg Anesth Pain Med. 2011;36(2):190–194.
20. Harper GK, Stafford MA, Hill DA. Minimum volume of local anaes-thetic required to surround each of the constituent nerves of the axillary brachial plexus, using ultrasound guidance: a pilot study. Br J Anaesth. 2010;104(5):633–636.
21. Schoenmakers KP, Wegener JT, Stienstra R. Effect of local anesthetic volume (15 vs 40 mL) on the duration of ultrasound-guided single shot axillary brachial plexus block: a prospective randomized, observer-blinded trial. Reg Anesth Pain Med. 2012;37(3):242–247.
22. Frenkel O, Mansour K, Fischer JW. Ultrasound-guided femoral nerve block for pain control in an infant with a femur fracture due to nonac-cidental trauma. Pediatr Emerg Care. 2012;28(2):183–184.
23. Choquet O, Morau D, Biboulet P, et al. Where should the tip of the needle be located in ultrasound-guided peripheral nerve blocks? Curr Opin Anaesthesiol. 2012;25(5):596–602.
24. Sala-Blanch X, López AM, Pomés J, et al. No clinical or electrophysi-ologic evidence of nerve injury after intraneural injection during sciatic popliteal block. Anesthesiology. 2011;115(3):589–595.
25. Gadsden J, Gratenstein K, Hadzic A. Intraneural injection and peripheral nerve injury. Int Anesthesiol Clin. 2010;48(4):107–115.
26. Moayeri N, Groen GJ. Differences in quantitative architecture of sciatic nerve may explain differences in potential vulnerability to nerve injury, onset time, and minimum effective anesthetic volume. Anesthesiology. 2009;111(5):1128–1134.
27. Sites BD, Taenzer AH, Herrick MD, et al. Incidence of local anesthetic systemic toxicity and postoperative neurologic symptoms associated with 12,668 ultrasound-guided nerve blocks: an analysis from a pro-spective clinical registry. Reg Anesth Pain Med. 2012;37(5):478–482.
28. Kroin JS, Buvanendran A, Williams DK, et al. Local anesthetic sciatic nerve block and nerve fiber damage in diabetic rats. Reg Anesth Pain Med. 2010;35(4):343–350.
29. Barrington MJ, Wong DM, Slater B, et al. Ultrasound-guided regional anesthesia: how much practice do novices require before achieving com-petency in ultrasound needle visualization using a cadaver model. Reg Anesth Pain Med. 2012;37(3):334–339.
30. Blaivas M, Adhikari S, Lander L. A prospective comparison of pro-cedural sedation and ultrasound-guided interscalene nerve block for
FIGURE 22.39. The Intersection of the Sagittal and Transverse Lines Provides an Entry Point for Needle Insertion at an Interspinous Space.

348 Section Vii / Soft Tissue and Musculoskeletal Conditions
shoulder reduction in the emergency department. Acad Emerg Med. 2011;18(9):922–927.
31. Gorlin A, Warren L. Ultrasound-guided interscalene blocks. J Ultra-sound Med. 2012;31(7):979–983.
32. Mantuani D, Nagdev A. Sonographic evaluation of a paralyzed hemi-diaphragm from ultrasound-guided interscalene brachial plexus nerve block. Am J Emerg Med. 2012;30(9):e5-2099–e7.
33. Sandhu NS, Capan LM. Ultrasound-guided infraclavicular brachial plexus block. Br J Anaesth. 2002;89(2):254–259.
34. Desgagnés MC, Lévesque S, Dion N, et al. A comparison of a single or triple injection technique for ultrasound-guided infraclavicu-lar block: a prospective randomized controlled study. Anesth Analg. 2009;109(2):668–672.
35. Beaudoin FL, Nagdev A, Merchant RC, et al. Ultrasound-guided femo-ral nerve blocks in elderly patients with hip fractures. Am J Emerg Med. 2010;28(1):76–81.
36. Abou-Setta AM, Beaupre LA, Rashiq S, et al. Comparative effectiveness of pain management interventions for hip fracture: a systematic review. Ann Intern Med. 2011;155(4):234–245.
37. Fletcher AK, Rigby AS, Heyes FL. Three-in-one femoral nerve block as analgesia for fractured neck of femur in the emergency depart-ment: a randomized, controlled trial. Ann Emerg Med. 2003;41(2): 227–233.
38. Christos SC, Chiampas G, Offman R, et al. Ultrasound-guided three-in-one nerve block for femur fractures. West J Emerg Med. 2010;11(4):310–313.
39. Tran de QH, Dugani S, Pham K, et al. A randomized compari-son between subepineural and conventional ultrasound-guided popliteal sciatic nerve block. Reg Anesth Pain Med. 2011;36(6): 548–552.
40. Redborg KE, Antonakakis JG, Beach ML, et al. Ultrasound improves the success rate of a tibial nerve block at the ankle. Reg Anesth Pain Med. 2009;34(3):256–260.
41. Redborg KE, Sites BD, Chinn CD, et al. Ultrasound improves the suc-cess rate of a sural nerve block at the ankle. Reg Anesth Pain Med. 2009;34(1):24–28.
42. Adhikari S, Blaivas M. Utility of bedside sonography to distinguish soft tissue abnormalities from joint effusions in the emergency department. J Ultrasound Med. 2010;29(4):519–526.
43. Fessell DP, Jacobson JA, Craig J, et al. Using sonography to reveal and aspirate joint effusions. AJR Am J Roentgenol. 2000;174(5): 1353–1362.
44. Wiler JL, Costantino TG, Filippone L, et al. Comparison of ultrasound-guided and standard landmark techniques for knee arthrocentesis. J Emerg Med. 2010;39(1):76–82.
45. Sibbitt WL Jr, Kettwich LG, Band PA, et al. Does ultrasound guidance improve the outcomes of arthrocentesis and corticosteroid injection of the knee? Scand J Rheumatol. 2012;41(1):66–72.
46. Freeman K, Dewitz A, Baker WE. Ultrasound-guided hip arthrocentesis in the ED. Am J Emerg Med. 2007;25(1):80–86.
47. Vieira RL, Levy JA. Bedside ultrasonography to identify hip effusions in pediatric patients. Ann Emerg Med. 2010;55(3):284–289.
48. Hirsch G, O’Neill T, Kitas G, et al. Distribution of effusion in knee arthritis as measured by high-resolution ultrasound. Clin Rheumatol. 2012;31(8):1243–1246.
49. Roy S, Dewitz A, Paul I. Ultrasound-assisted ankle arthrocentesis. Am J Emerg Med. 1999;17(3):300–301.
50. Costantino TG, Roemer B, Leber EH. Septic arthritis and bursitis: emergency ultrasound can facilitate diagnosis. J Emerg Med. 2007; 32(3):295–297.
51. Lim-Dunham JE, Ben-Ami TE, Yousefzadeh DK. Septic arthri-tis of the elbow in children: the role of sonography. Pediatr Radiol. 1995;25(7):556–559.
52. Cardone DA, Tallia AF. Diagnostic and therapeutic injection of the elbow region. Am Fam Physician. 2002;66(11):2097–2100.
53. McCaig LF, Burt CW. National hospital ambulatory medical care sur-vey: 2003 emergency department summary. Adv Data. 2005;(358):1–40.
54. Sinha TP, Bhoi S, Kumar S, et al. Diagnostic accuracy of bedside emer-gency ultrasound screening for fractures in pediatric trauma patients. J Emerg Trauma Shock. 2011;4(4):443–445.
55. Barata I, Spencer R, Suppiah A, et al. Emergency ultrasound in the detection of pediatric long-bone fractures. Pediatr Emerg Care. 2012;28(11):1154–1157.
56. Dulchavsky SA, Henry SE, Moed BR, et al. Advanced ultrasonic di-agnosis of extremity trauma: the FASTER examination. J Trauma. 2002;53(1):28–32.
57. Turk F, Kurt AB, Saglam S. Evaluation by ultrasound of traumatic rib fractures missed by radiography. Emerg Radiol. 2010;17(6);473–477.
58. Chien M, Bulloch B, Garcia-Filion P, et al. Bedside ultrasound in the diagnosis of pediatric clavicle fractures. Pediatr Emerg Care. 2011;27(11):1038–1041.
59. Chen L, Kim Y, Moore CL. Diagnosis and guided reduction of forearm fractures in children using bedside ultrasound. Pediatr Emerg Care. 2007;23(8):528–531.
60. Ang SH, Lee SW, Lam KY. Ultrasound-guided reduction of distal radius fractures. Am J Emerg Med. 2010;28(9):1002–1008.
61. Chinnock B, Khaletskiy A, Kuo K, et al. Ultrasound-guided reduction of distal radius fractures. J Emerg Med. 2011;40(3):308–312.
62. Kiely PD, O’Farrell D, Riordan J, et al. The use of ultrasound-guided hematoma blocks in wrist fractures. J Clin Anesth. 2009;21(7): 540–542.
63. Tayal VS, Hasan N, Norton HJ, et al. The effect of soft-tissue ultra-sound on the management of cellulitis in the emergency department. Acad Emerg Med. 2006;13(4):384–388.
64. Squire BT, Fox JC, Anderson C. ABSCESS: applied bedside sonogra-phy for convenient evaluation of superficial soft tissue infections. Acad Emerg Med. 2005;12(7):601–606.
65. Yusa H, Yoshida H, Ueno E, et al. Ultrasound-guided surgical drainage of face and neck abscesses. Int J Oral Maxillofac Surg. 2002;31(3):327–329.
66. Blaivas M, Adhikari S. Unexpected findings on point-of-care superficial ultrasound imaging before incision and drainage. J Ultrasound Med. 2011;30(10):1425–1430.
67. Frazee BW, Lynn J, Charlebois ED, et al. High prevalence of methicillin-resistant staphylococcus aureus in emergency department skin and soft tissue infections. Ann Emerg Med. 2005;45(3):311–320.
68. Trautlein JJ, Lambert RL, Miller J. Malpractice in the emergency department—review of 200 cases. Ann Emerg Med. 1984;13(9, pt 1): 709–711.
69. Henry GL. Specific high-risk medical-legal issues. In: Henry GL, Sullivan DJ, eds. Emergency Medicine Risk Management. Dallas, TX: American College of Emergency Physicians; 1997:475–494.
70. Anderson MA, Newmeyer WL III, Kilgore ES Jr. Diagnosis and treat-ment of retained foreign bodies in the hand. Am J Surg. 1982;144(1): 63–67.
71. Shiels WE II, Babcock DS, Wilson JL, et al. Localization and guided removal of soft-tissue foreign bodies with sonography. AJR Am J Roentgenol. 1990;155(6):1277–1281.
72. Sidharthan S, Mbako AN. Pitfalls in diagnosis and problems in extrac-tion of retained wooden foreign bodies in the foot. Foot Ankle Surg. 2010;16(2):e18–e20.
73. Young AS, Shiels WE II, Murakami JW, et al. Self-embedding behavior: radiologic management of self-inserted soft-tissue foreign bodies. Radi-ology. 2010;257(1):233–239.
74. Blankstein A, Cohen I, Heiman Z, et al. Ultrasonography as a di-agnostic modality and therapeutic adjuvant in the management of soft tissue foreign bodies in the lower extremities. Isr Med Assoc J. 2001;3(6):411–413.
75. Callegari L, Leonardi A, Bini A, et al. Ultrasound-guided removal of for-eign bodies: personal experience. Eur Radiol. 2009;19(5):1273–1279.
76. Blankstein A, Cohen I, Heiman Z, et al. Localization, detection, and guided removal of soft tissue in the hands using sonography. Arch Orthop Trauma Surg. 2000;120(9):514–517.

chapter 22 / Soft Tissue and Musculoskeletal Procedures 349
77. Bradley M. Image-guided soft-tissue foreign body extraction—success and pitfalls. Clin Radiol. 2012;67(6):531–534.
78. Jones RA. Ultrasound-guided procedures. Crit Decis Emerg Med. 2004;18:11–17.
79. Teisen HG, Torfing KF, Skjødt T. Ultrasound pinpointing of foreign bod-ies. An in vitro study [in German]. Ultraschall Med. 1988;9(3):135–137.
80. Gilbert FJ, Campbell RS, Bayliss AP. The role of ultrasound in the detec-tion of non-radiopaque foreign bodies. Clin Radiol. 1990;41(2):109–112.
81. Cork RC, Kryc JJ, Vaughan RW. Ultrasound localization of the lumbar epidural space. Anesthesiology. 1980;52(6):513–516.
82. Currie JM. Measurement of the depth to the extradural space using ultrasound. Br J Anaesth. 1984;56(4):345–347.
83. Cummings T, Jones JS. Towards evidence based emergency medicine: best BETs from the Manchester Royal Infirmary. Use of ultrasonogra-phy for lumbar puncture. Emerg Med J. 2007;24(7):492–493.
84. Nomura JT, Leech SJ, Shenbagamurthi S, et al. A randomized con-trolled trial of ultrasound-assisted lumbar puncture. J Ultrasound Med. 2007;26(10):1341–1348.
85. Ferre RM, Sweeney TW. Emergency physicians can easily obtain ultra-sound images of anatomical landmarks relevant to lumbar puncture. Am J Emerg Med. 2007;25(3):291–296.

350
prompt ophthalmology evaluation is necessary. While it is unrealistic to expect emergency physicians to recognize all potentially significant ocular diagnoses, ultrasound serves as an important diagnostic tool that should be correlated with the patient’s history and physical exam to yield an informed diagnosis and treatment strategy.
CLINICAL APPLICATIONSThe clinical indications for ocular ultrasound include the evaluation of acute vision changes, the evaluation of poten-tial ocular injuries following eye or facial trauma, and the indirect assessment of increased intracranial pressure for patients with headache or altered mental status.
There are a number of potential safety concerns with the use of ultrasound of the orbit. Ocular ultrasound has been used safely for decades in ophthalmology (2). While there is a theoretical risk with the use of Doppler imaging modes for prolonged periods, there has been no evidence to sup-port any significant danger to patients. Ultrasound should be performed carefully in patients with a potential occult globe rupture, as inadvertent pressure may result in the prolapse of intraocular contents. It is important for the examiner to brace their scanning hand on the patient’s nose, forehead, or cheek (Fig. 23.1) and to use a copious amount of gel to prevent pressure from being transmitted to the injured eye. This can be monitored by ensuring that an adequate gel layer is preserved at the top of the screen (Fig. 23.2).
INTRODUCTIONUltrasound is a quick, noninvasive modality that improves the evaluation of emergency department (ED) patients with acute vision changes, eye trauma, and headache or altered mental status when a standard history or physical examina-tion yields incomplete information or is impossible to per-form. An adequate fundoscopic exam in the nondilated eye is challenging, almost always providing limited information due to a narrow field of view. In addition, there are a number of conditions that impair visualization of the posterior globe with direct ophthalmoscopy alone—cataracts, hyphema, hy-popyon, miosis, and vitreous opacities. Facial trauma often results in substantial periorbital swelling or pain, making even a simple pupillary exam or extraocular muscle motil-ity assessment challenging. Additionally, a thorough ocular complaint history may be compromised by altered mental status, making an ocular evaluation even more significant.
The implementation of ocular ultrasound by emergency physicians is relatively new. Since 2000 there have been nu-merous emergency medicine publications describing its util-ity in evaluating various ocular complaints (1). As a result, it has quickly risen to become one of the most important new emergency ultrasound applications.
Emergency physicians should learn a systematic ap-proach to performing ocular ultrasound. A firm under-standing of normal ocular sonoanatomy and the classic sonographic appearance of ocular pathology that requires
Intraocular Foreign Body . . . . . . . . . . . . . . . . . . . . . . . 354Globe Rupture . . . . . . . . . . . . . . . . . . . . . . . . . . . . . . . 355Elevated Intracranial Pressure . . . . . . . . . . . . . . . . . . . 356
PITFALLS . . . . . . . . . . . . . . . . . . . . . . . . . . . . . . . . . . . . . . . 359USE OF THE IMAGE IN CLINICAL
DECISION MAKING . . . . . . . . . . . . . . . . . . . . . . . . . . . . . 360COMPARISON WITH OTHER IMAGING MODALITIES . . . . . . 361INCIDENTAL FINDINGS . . . . . . . . . . . . . . . . . . . . . . . . . . . . 361CLINICAL CASES . . . . . . . . . . . . . . . . . . . . . . . . . . . . . . . . . 363
Case 1 . . . . . . . . . . . . . . . . . . . . . . . . . . . . . . . . . . . . . 363Case 2 . . . . . . . . . . . . . . . . . . . . . . . . . . . . . . . . . . . . . 363
INTRODUCTION . . . . . . . . . . . . . . . . . . . . . . . . . . . . . . . . . . 350CLINICAL APPLICATIONS . . . . . . . . . . . . . . . . . . . . . . . . . . . 350IMAGE ACQUISITION . . . . . . . . . . . . . . . . . . . . . . . . . . . . . . 351
Equipment . . . . . . . . . . . . . . . . . . . . . . . . . . . . . . . . . . 351Imaging Technique . . . . . . . . . . . . . . . . . . . . . . . . . . . 351Dynamic Testing . . . . . . . . . . . . . . . . . . . . . . . . . . . . . 352
NORMAL ULTRASOUND ANATOMY . . . . . . . . . . . . . . . . . . . 352PATHOLOGY . . . . . . . . . . . . . . . . . . . . . . . . . . . . . . . . . . . . . 352
Lens Dislocation . . . . . . . . . . . . . . . . . . . . . . . . . . . . . 352Vitreous Hemorrhage . . . . . . . . . . . . . . . . . . . . . . . . . 352Posterior Segment Detachments . . . . . . . . . . . . . . . . . 353
Matthew Flannigan, Dietrich Jehle, and Juliana Wilson
Eye Emergencies23

Chapter 23 / Eye Emergencies 351
IMAGE ACQUISITIONEquipmentThe ultrasound evaluation of the eye provides remarkable an-atomic detail. It is fluid-filled, superficial, and has no inherent obstacles to impede ultrasound beam transmission. In contrast to ophthalmologists, who perform ocular sonography with a specialized transducer the size of a penlight on an anesthetized eye, emergency ocular ultrasonography is usually performed with a multi-purpose, high-frequency (7 to 15 MHz) linear array transducer on a closed eyelid (Fig. 23.3). Although un-necessary, a transparent dressing may be used as a barrier to prevent coupling gel from inducing mild eye irritation (3). Pa-tients are typically placed in a supine to semi-upright position. The emergency ocular ultrasound assessment usually requires only standard gray scale imaging.
Imaging TechniqueAs with other emergency ultrasound applications, the trans-ducer marker is directed toward the patient’s right and toward their head in the transverse and sagittal planes, respectively (Fig. 23.1). Objects closest to the transducer are represented at the top of the imaging screen (Fig. 23.2).
There are three basic ocular imaging planes: transverse, longitudinal, or axial. In both the transverse and the longitudi-nal planes, the eye is everted to scan through the sclera rather than directly through the lens (Fig. 23.4). Imaging through the lens results in increased signal attenuation, or weakening, before the ultrasound beam strikes structures in the posterior globe. In contrast, axial scanning allows for the direct visual-ization of the lens, macula, and optic nerve sheath.
The quality of an ultrasound image is angle dependent. Images are better defined when the incident beam is projected perpendicular to the object of interest, as a greater percentage
FIGURE 23.1. Scanning Technique. Transverse scanning plane (A) . The transducer indicator is pointed toward the patient’s right (arrow ) with the scanning hand braced on the patient’s face and nose . Sagittal scanning plane (B) . Transducer indicator is pointed cephalad (arrow ) . This view is most easily obtained with a 25-mm or smaller linear transducer . Larger transducers often result in significant contact artifact .
A
B
FIGURE 23.2. Transverse, Axial Plane of a Normal Eye. Arrow notes that an appropriate gel layer is maintained between the transducer and the eyelid .
FIGURE 23.3. Anatomical Cross-Section of a Normal Eye. This is a 2D representation of ocular anatomy that is encountered by the transmitted ultrasound beam . (From Tayal VS, Neulander M, Norton HJ, et al . Emergency department sonographic measurement of optic nerve sheath diameter to de-tect findings of increased intracranial pressure in adult head injury patients . Emerg Med J . 2008;25:766–767 .)

352 SeCtion Viii / Problems of the Head and Neck
FIGURE 23.4. Transverse Scanning Technique. (Illustration by Grady Eason .)
of sound signal is reflected back to the transducer. To facili-tate complete visualization of the globe, it is necessary to fan the transducer through the entire globe. Cooperative patients can assist this evaluation by diverting their gaze into each of the four quadrants of their visual field (Fig. 23.4). To view the optic nerve sheath at a perpendicular angle, the patient should be asked to deviate their eye nasally (Fig. 23.5).
Dynamic TestingAftermovement is a description of a posterior segment lesion’s mobility following cessation of rapid eye move-ment. This can assist with differentiating posterior seg-ment pathology. For example, both posterior vitreous detachments (PVDs) and retinal detachments (RDs) may appear v-shaped and may attach to the optic disc, but a de-tached retinal membrane will appear thicker and has less aftermovement compared to a detached posterior vitreous membrane (Fig. 23.6). In addition, blood from a vitreous hemorrhage appears to swirl while the membrane from a choroidal detachment is essentially motionless with after-movement (Table 23.1; VIDEO 23 .1).
FIGURE 23.5. Measurement of a Normal Optic Nerve Sheath Diameter (ONSD). Have the patient look toward their nose to optimize the view of the optic nerve sheath .
NORMAL ULTRASOUND ANATOMYIn the axial plane, the anterior chamber, iris, lens, and ciliary body can be easily identified in the near field (Figs. 23.2 and 23.3). The vitreous, in the young, healthy eye is anechoic. The retina, choroid, and sclera are indistinguishable as sepa-rate entities in the absence of pathology. The globe should have a round contour. The optic nerve sheath is identified as a hypoechoic stripe extending vertically from the posterior globe, surrounded by echogenic orbital fat (Figs. 23.5 and 23.7) (4). Extraocular muscle movement (cranial nerve) and pupillary function (Fig. 23.8) can also be assessed in real time when there is substantial periorbital soft-tissue swelling and the eyelid cannot be retracted (5).
PATHOLOGYLens DislocationLens displacement is frequently the result of trauma, but can occur spontaneously in patients with connective tissue disorders, where it is frequently bilateral. Blunt eye trauma may stretch or rupture the zonular fibers, resulting in a lens subluxation (partial) or complete dislocation in an anterior, posterior (most common), or lateral direction (Figs. 23.9 and 23.10; VIDEO 23 .2) (6). Visual changes in an alert patient vary with the degree of lens displacement and the presence of coexistent injuries (vitreous hemorrhage, pos-terior segment detachments, globe rupture). Identifying a lens dislocation with ultrasound is technically uncom-plicated, even for novices. Traumatic lens subluxation or dislocation requires an immediate ophthalmology consul-tation as coexistent ocular injuries are frequently present.
Vitreous HemorrhageVitreous hemorrhage occurs when retinal blood vessels are torn or leak blood into the normally avascular vitreous space. 8PEDIATRIC CONSIDERATIONS In childhood, trauma is
FIGURE 23.6. Retinal Detachment with Posterior Vitreous Detachment. The vitreous detachment (thin, curved) inserts directly on the retina (thicker, straight), causing a retinal detachment . (Jehle D, Bouvet S, Braden B, et al . Emergency Ultrasound of the Eye and Orbit . Buffalo, NY: Grover Cleveland Press; 2011 . Fig . 7-11, p 49 .)

Chapter 23 / Eye Emergencies 353
TABLE 23.1 Distinguishing Characteristics of Posterior Chamber Pathology
ChARACTERISTICS Vh PVD RD CD
Appearance Fine dots or linear opacities to dense clot
Thin, concave membrane, to v-shaped
Thick, concave membrane, v- or t-shaped funnel
Thick, convex membrane, dome-shaped, “kissing”
Mobility Moderate 2+ “swirling” Marked (3+) “jiggly” Restricted (1–2+) “shifting”
Motionless (0)
Optic disc attachment Not applicable Sometimes Almost always Never
VH, vitreal hemorrhage; PVD, posterior vitreal detachment, RD, retinal detachment; CD, choroidal detachment.
FIGURE 23.7. Normal Eye Anatomy. (Illustration by Grady Eason .)
the most common etiology; in infants, the diagnosis of shaken baby syndrome should be explored.7 In adults, vitreous hem-orrhage is most commonly associated with diabetic retinopa-thy, age-related macular degeneration, trauma, coagulopathy, retinal vein occlusion, or retinal tears (7).
Vision loss is frequently described as sudden and pain-less. Visual field disturbances are variable depending on the degree and location of the hemorrhage: from multiple float-ers or cobweb appearance (mild) to a dense smoky haze with light perception only (severe) (8). The sudden development of a vitreous hemorrhage is concerning for a retinal tear, which if left untreated, will progress to a RD.
The ultrasound appearance of a vitreous hemorrhage var-ies based on its age and severity. Fresh, mild hemorrhages appear as small dots or linear densities with low reflectiv-ity; while more severe, subacute hemorrhages result in clot formation and have increased echogenicity (Fig. 23.11) (8). With aftermovement, semi-clotted blood from a vitreous hemorrhage appears to swirl ( VIDEO 23 .3).
Blood from a chronic, severe hemorrhage has a tendency to settle on the dependent portion of the globe, forming a thick, echogenic layer or pseudomembrane. This can mimic the appearance of a RD (Fig. 23.12) (8).
Posterior Segment DetachmentsThe retina, choroid, and sclera are tightly adherent in the nor-mal eye and are indistinguishable as separate entities in the absence of pathology. A separation or detachment, however, between any two adjacent layers can occur for a variety of reasons (Fig. 23.7). The ability to differentiate which layer is detached requires an awareness of their classic, clinical
presentation, and the ultrasonic findings associated with each detachment (8).
Posterior Vitreous DetachmentPVD is the separation of the vitreous membrane from the underlying retina. Small PVDs are uncomplicated and oc-cur in nearly everyone, with a mean onset at age 55. Larger PVDs are often sudden in onset and are associated with vit-reous hemorrhage, trauma, or inflammatory processes (8). Approximately 10% to 15% of patients with symptomatic PVDs will develop retinal tears; if left untreated, these tears result in a RD (9).
On ultrasound, PVDs appear as thin, mobile membranes (Fig. 23.13). Acutely, PVDs demonstrate a “jiggly” motion with aftermovement assessment that differs from the more rigid “shifting” mobility of a RD ( VIDEOS 23 .4 and 23 .5) (8,10). Chronically, PVDs become more stiff and dense, resembling the characteristics of a RD. Both PVDs and RDs can appear to have similar sonographic characteristics (Fig. 23.14); therefore, additional ophthalmologic evalua-tion and testing is often necessary for a definitive diagnosis (Table 23.1).
Retinal DetachmentRD is the separation of the inner, sensory layer of the retina from its outer, pigmented layer (4). There are three mechanisms that result in a RD: exudative (subretinal fluid accumulation), tractional (vitreoretinal adhesions, most com-monly seen with diabetes mellitus), and rhegmatogenous, the most common type. In the rhegmatogenous RDs, the vitre-ous membrane is pulled away from the retina, producing a retinal tear. If left untreated, the retinal layers will continue
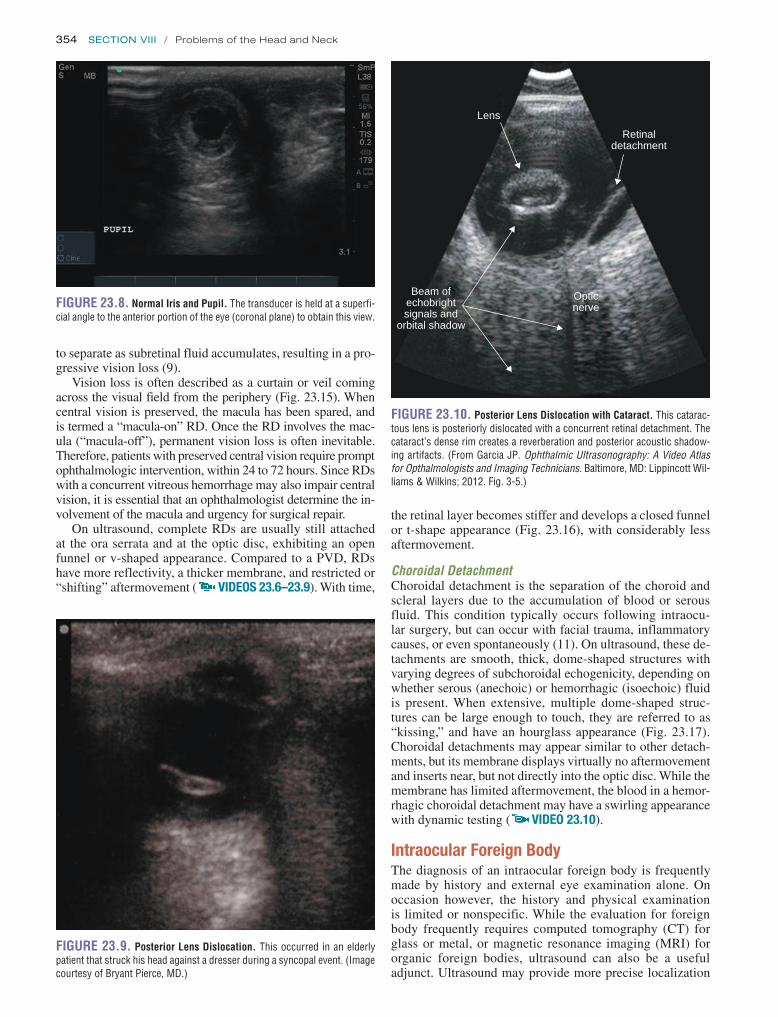
354 SeCtion Viii / Problems of the Head and Neck
the retinal layer becomes stiffer and develops a closed funnel or t-shape appearance (Fig. 23.16), with considerably less aftermovement.
Choroidal DetachmentChoroidal detachment is the separation of the choroid and scleral layers due to the accumulation of blood or serous fluid. This condition typically occurs following intraocu-lar surgery, but can occur with facial trauma, inflammatory causes, or even spontaneously (11). On ultrasound, these de-tachments are smooth, thick, dome-shaped structures with varying degrees of subchoroidal echogenicity, depending on whether serous (anechoic) or hemorrhagic (isoechoic) fluid is present. When extensive, multiple dome-shaped struc-tures can be large enough to touch, they are referred to as “kissing,” and have an hourglass appearance (Fig. 23.17). Choroidal detachments may appear similar to other detach-ments, but its membrane displays virtually no aftermovement and inserts near, but not directly into the optic disc. While the membrane has limited aftermovement, the blood in a hemor-rhagic choroidal detachment may have a swirling appearance with dynamic testing ( VIDEO 23 .10).
Intraocular Foreign BodyThe diagnosis of an intraocular foreign body is frequently made by history and external eye examination alone. On occasion however, the history and physical examination is limited or nonspecific. While the evaluation for foreign body frequently requires computed tomography (CT) for glass or metal, or magnetic resonance imaging (MRI) for organic foreign bodies, ultrasound can also be a useful adjunct. Ultrasound may provide more precise localization
FIGURE 23.8. Normal Iris and Pupil. The transducer is held at a superfi-cial angle to the anterior portion of the eye (coronal plane) to obtain this view .
FIGURE 23.9. Posterior Lens Dislocation. This occurred in an elderly patient that struck his head against a dresser during a syncopal event . (Image courtesy of Bryant Pierce, MD .)
FIGURE 23.10. Posterior Lens Dislocation with Cataract. This catarac-tous lens is posteriorly dislocated with a concurrent retinal detachment . The cataract’s dense rim creates a reverberation and posterior acoustic shadow-ing artifacts . (From Garcia JP . Ophthalmic Ultrasonography: A Video Atlas for Opthalmologists and Imaging Technicians . Baltimore, MD: Lippincott Wil-liams & Wilkins; 2012 . Fig . 3-5 .)
Beam ofechobrightsignals and
orbital shadow
Lens
Opticnerve
Retinaldetachment
to separate as subretinal fluid accumulates, resulting in a pro-gressive vision loss (9).
Vision loss is often described as a curtain or veil coming across the visual field from the periphery (Fig. 23.15). When central vision is preserved, the macula has been spared, and is termed a “macula-on” RD. Once the RD involves the mac-ula (“macula-off”), permanent vision loss is often inevitable. Therefore, patients with preserved central vision require prompt ophthalmologic intervention, within 24 to 72 hours. Since RDs with a concurrent vitreous hemorrhage may also impair central vision, it is essential that an ophthalmologist determine the in-volvement of the macula and urgency for surgical repair.
On ultrasound, complete RDs are usually still attached at the ora serrata and at the optic disc, exhibiting an open funnel or v-shaped appearance. Compared to a PVD, RDs have more reflectivity, a thicker membrane, and restricted or “shifting” aftermovement ( VIDEOS 23 .6–23 .9). With time,

Chapter 23 / Eye Emergencies 355
of glass, metallic, or organic foreign bodies, even when a more advanced imaging modality is used first (12).
Ultrasonic findings of foreign bodies are highly vari-able according to the object’s size, location, orientation, and composition. Metallic foreign bodies are highly echogenic and often display posterior shadowing. Spherical metals (metallic BBs) may display twinkle and comet-tail artifacts (Fig. 23.18) (13). Identification of glass shards can be quite challenging. The sound waves must strike the glass’s flat surface at a perpendicular angle to ensure an adequately reflected echo. Organic materials (wood) display varying degrees of echogenicity, and are usually most reflective in the immediate post-injury period. Intraocular air provides indirect evidence of globe penetration. Also, air artifact will change in position with eye movement (14).
Globe RuptureUltrasound is an important adjunctive tool to ophthalmol-ogists and emergency physicians when an occult globe
rupture is considered. As previously discussed, copious gel application and transducer stabilization will minimize additional pressure from being exerted onto the trauma-tized eye.
Although a thin-slice orbital CT scan is the gold standard imaging modality for facial and orbital trauma, its sensitiv-ity for occult globe rupture is just 56% to 68% (15). An ad-vantage of ultrasound is that it can be performed through a closed eyelid, where a comprehensive eye exam is otherwise limited (lid edema, hyphema, vitreous hemorrhage), may re-sult in excessive discomfort, or has the potential to worsen injuries during manual lid retraction.
While ultrasound may not detect the actual location of globe rupture, several sonographic clues can assist in mak-ing the diagnosis. Classic findings of globe rupture include loss of intraocular volume, loss of normal scleral contour or flat tire sign, complete vitreous hemorrhage, and the identification of intraocular air or foreign body (Fig. 23.19) (6,8,15,16). Visual prognosis is proportional to injury sever-ity and to the presenting visual acuity (16).
A B
FIGURE 23.11. Vitreous hemorrhage. A: There is a diffuse in-creased echogenicity of the vitreous secondary to hemorrhage . B, C: Vitreous hemorrhage with shallow retinal detachment . This com-monly occurs in the setting of diabetic neovascularization, which scars and contracts the vitreous over time, putting traction on the retina . Although the vitreous hemorrhage was apparent on direct ophthalmoscopy, the posterior retinal detachment was not due to vitreous opacification . In these situations, an ultrasound evaluation is often invaluable . (Parts A and B from Jehle D, Bouvet S, Braden B, et al . Emergency Ultrasound of the Eye and Orbit . Buffalo, NY: Grover Cleveland Press; 2011 . Figs . 7-1A, 7-3A, B .)C

356 SeCtion Viii / Problems of the Head and Neck
FIGURE 23.12. Vitreous hemorrhage with Thickened Vitreous Mem-brane. The vitreous appears echogenic, and the older detached vitreous mem-brane appears thicker . Over time the vitreous hemorrhage will become less echogenic . (From Jehle D, Bouvet S, Braden B, et al . Emergency Ultrasound of the Eye and Orbit . Buffalo, NY: Grover Cleveland Press; 2011 . Fig . 7-5, p 43 .)
FIGURE 23.13. Posterior Vitreous Detachment with Syneresis. The thin, smooth, mobile membrane represents a posterior vitreous detachment . Rapid movement of the eye from one side to the other (aftermovement), results in significant wavelike, “jiggly” motion of the vitreous membrane . Low reflective vitreous opacities (vitreous syneresis) are frequently seen in the normal aging eye when the ultrasound gain is increased . (From Jehle D, Bouvet S, Braden B, et al . Emergency Ultrasound of the Eye and Orbit . Buffalo, NY: Grover Cleveland Press; 2011 . Fig . 7-8, p 47 .)
pressure (ICP) for patients presenting with altered mental sta-tus or headache. Current methods of assessing for increased ICP have several disadvantages: incomplete visualization (fundoscopy), time-consuming (CT), and invasive (lumbar puncture and ventriculostomy). In addition, the development of papilledema can be delayed for hours after increased ICP has been present (Fig. 23.20A) (12).
FIGURE 23.14. A: Posterior vitreous detachment with mild vitreous hemor-rhage . This posterior vitreous detachment has a v-shaped appearance that must be differentiated from a v-shaped retinal detachment . This detachment’s “arms” are thinner and have considerably more aftermovement compared to a similarly shaped retinal detachment . (Courtesy of Dr . Edward Cheeseman .) B: Retinal detachment . This image demonstrates a classic open funnel retinal detachment that remains attached at the optic nerve sheath . If the macula is detached, the chance for vision recovery is small . The retinal attachment at the optic nerve sheath is very strong and is very rarely disrupted even in the setting of severe trauma . (From Jehle D, Bouvet S, Braden B, et al . Emergency Ultrasound of the Eye and Orbit . Buffalo, NY: Grover Cleveland Press; 2011 . Fig . 7-13, p 51 .)
A
B
Elevated Intracranial PressureA promising application of ocular ultrasound involves the measurement of the optic nerve sheath diameter (ONSD) as a quick, noninvasive indicator of elevated intracranial

Chapter 23 / Eye Emergencies 357
FIGURE 23.16. Retinal Detachments. A: This is an example of a serous retinal detachment that has a v-shaped or open funnel appearance . The retinal layer remains firmly attached at the ora serrata, an area of the sclera just posterior to the ciliary body, and to the optic nerve . (From Garcia JP . Ophthalmic Ultrasonography: A Video Atlas for Opthalmologists and Imaging Technicians . Baltimore, MD: Lippincott Williams & Wilkins; 2012 . Fig . 8-31 .) B: As untreated retinal detachments age, they take on a closed funnel or t-shaped appearance . (Courtesy of Dr . Edward Cheeseman .)
Opticnerve
Retinaldetachment
A B
FIGURE 23.15. A: Retinal detachment . This is a representation of the classic patient description of painless vision loss that occurs with a retinal detachment . B: Illustration of a rhegmatogenous reti-nal detachment . (Illustration by Grady Eason .)
A
B

358 SeCtion Viii / Problems of the Head and Neck
FIGURE 23.17. A: Hemorrhagic choroidal detachment . There are multiple hemorrhagic “kissing” choroidal detachments present in this image . These most commonly occur intra- or perioperatively . With aftermovement, one may visualize swirling of the echogenic blood components inside the choroidal detach-ment . There is only a small amount of dark, triangle-shaped normal vitreous remaining in this image . (From Jehle D, Bouvet S, Braden B, et al . Emergency Ultrasound of the Eye and Orbit . Buffalo, NY: Grover Cleveland Press; 2011 . Figs . 7-10, p 58 .) B: Serous choroidal detachment . These choroidal detachments have a classic dome-shaped appearance . The choroidal membrane is identified to be thicker than either PVDs or RDs and remains rigid with aftermovement testing . (From Garcia JP . Ophthalmic Ultrasonography: A Video Atlas for Opthalmologists and Imaging Technicians . Baltimore, MD: Lippincott Williams & Wilkins; 2012 . Fig . 9-11, p 198 .)
A
Choroidaldetachment
B
FIGURE 23.18. A: Posterior acoustic shadowing . This dense metallic foreign body in the orbit produces dark posterior acoustic shadowing . B: Metallic foreign body . This hollow BB pellet creates an echogenic line (top) with comet tail shadowing deep to this metal-soft tissue interface . (From Jehle D, Bouvet S, Braden B, et al . Emergency Ultrasound of the Eye and Orbit . Buffalo, NY: Grover Cleveland Press; 2011 . Fig . 3-3, p 18; Fig . 8-4, p 75 .)
A B
Elevated ICP is transmitted into the optic nerve sheath, via cerebrospinal fluid, causing it to widen. Several stud-ies have demonstrated that the ONSD measured at 3 mm posterior to the globe, which exceeds 5 mm in adults, has a high sensitivity (88% to 100%) for the determination of
increased ICP (Fig. 23.20B) (17–19).8PEDIATRIC CONSID-ERATIONS In children <1 year, the upper limit of normal is 4 mm; in children 1 to 14 years, 4.5 mm; and in 15 years and older, 5 mm (20,21).7 When ICP is severely increased, an echolucent circle or crescent sign can be observed due to

Chapter 23 / Eye Emergencies 359
FIGURE 23.20. Optic Nerve Sheath Diameter. A: This image illustrates an abnormal ONSD (0 .63 cm) in a patient being evaluated for idiopathic intracranial hypertension (pseudotumor cerebri) . The end of the optic nerve bulges into the vitreous and has a hyperechoic, dome-shaped appearance consistent with ultrasonic findings of papilledema . B: Normal optic nerve sheath diameter of 0 .36 cm .
1
1 22
A
A
A
B
B
B
FIGURE 23.19. A: Globe rupture . This trauma patient has a vitreous hemorrhage that fills the entire globe . Also, there is intraocular gas that can be identified by hyperechoic foci with dirty (lighter gray) posterior acoustic shadowing . B: A noncontrast head CT obtained from the same patient provides complementary information, regarding the absence of orbital fractures or intracranial injuries . This image confirms the presence of an otherwise clinically occult globe rupture .
A B
increased accumulation if cerebral spinal fluid separates the optic nerve from its sheath (11,19).
PITFALLS 1. Indeterminate pathology may be encountered. It is often
more important for emergency physicians to screen for pathology than it is to make a definitive diagnosis. When ocular pathology is detected, an ophthalmology consul-tation is almost always required to initiate treatment, ar-range for follow-up, or make a definitive diagnosis when
rare or indeterminate pathology is identified. The use of inexpensive gelatin, simulation models may assist emer-gency physicians to recognize ocular pathology during initial training sessions (22).
2. Inadequate gel results in increased contact artifact. As a consequence, additional pressure is often exerted on the globe. This pressure in patients with an occult globe rupture may be detrimental, and in an awake patient can be uncomfortable or even painful (Fig. 23.21) (12).
3. Inappropriate gain may conceal posterior segment pa-thology. Subtle echoes created by an acute vitreous hemorrhage will go unrecognized if the gain is set too

360 SeCtion Viii / Problems of the Head and Neck
FIGURE 23.21. Inadequate Gel. There is essentially no gel at the top of the screen on this axial transverse view of the eye . As a result, the lens, globe, and optic nerve sheath are poorly visualized .
FIGURE 23.22. Retrobulbar hemorrhage. A: Ultrasound image demonstrating subtle hypoechoic collections (blood) in the left eye’s retrobulbar space adjacent to the optic nerve . B: Computed tomographic scan from the same patient demonstrating a left intraconal retrobulbar hemorrhage (centered within the extraocular muscles) with a medial rectus entrapment . Of note, the patient was already legally blind in the right eye from a previous injury .
BA
low. Likewise, eye pathology, such as small RDs, PVDs, intraocular foreign bodies, and retrobulbar hemorrhage, may blend in with similarly echogenic structures (sclera, retro-orbital fat) if the gain is too high (Fig. 23.22). Since retrobulbar hemorrhages are often difficult to
distinguish from its adjacent retro-orbital structures, it has been recently reported that another way to identify a retrobulbar hemorrhage is when there is a dramatic increase in orbital pressure (80 mm Hg) that results in the deformation of the posterior globe, causing it to resemble a guitar pick (Fig. 23.22) (23). Therefore, it is essential to systematically evaluate the eye with two different gain settings to improve sensitivity for subtle findings. The patient’s contralateral (normal eye) is of-ten useful in selecting an initial gain setting.
USE OF THE IMAGE IN CLINICAL DECISION MAKINGEye trauma is one of the leading causes of monocular vision loss in the United States. Having a thorough knowledge of potential ocular injuries is imperative to ensure a rapid diag-nosis, to prevent further eye damage, and to preserve vision (7). Unfortunately, a comprehensive eye evaluation in the multisystem trauma patient is often limited due to severe eyelid edema, altered mental status, and other life-threaten-ing injuries that demand greater attention. The routine use of bedside ultrasound in the evaluation of the multi-system trauma patient with periorbital injuries may assist nonoph-thalmologists in expediting the diagnosis and treatment of vision-threatening injuries.
The evaluation of acute visual changes in a patient com-plaining of new monocular floaters or flashes should prompt consideration for a posterior segment detachment (PVD, RD, or choroidal detachment). Nonocular causes for these symp-toms include hypotension and migraines, but are usually

Chapter 23 / Eye Emergencies 361
C DFIGURE 23.22. (continued) C: Ultrasound image demonstrates a conical deformation of the left posterior ocular globe, mimicking the shape of a guitar pick . D: Repeat ultrasound obtained after lateral canthotomy showing normal globe contour . (C and D Courtesy of Dr . John Kendall, MD .)
bilateral and associated with lightheadedness or headache, while ocular causes are typically painless in the absence of trauma (24).
The ability to quickly and noninvasively assess for in-creased ICP is valuable for a number of situations in the ED. For example, in patients with recurrent headaches and a nor-mal ONSD, intracranial hypertension (pseudotumor cerebri) is a less likely diagnosis. At rural facilities, where trauma and neurosurgical specialists are unavailable, a multisystem trauma patient, with an increased ONSD, may be given ICP lowering medications without delaying transfer to perform a CT scan.
COMPARISON WITH OTHER IMAGING MODALITIESAlthough CT and MRI are invaluable in many orbital condi-tions, they are limited in their ability to visualize posterior seg-ment pathology. Similarly, CT and MRI are time- consuming, require specialized technicians, and are unable to perform real-time imaging (25).
Compared to CT, the ultrasound assessment for intraocu-lar foreign bodies is more operator-dependent and limited in its ability to rule out adjacent pathology, such as orbital fractures. Also, the detection of intraocular foreign bodies is more challenging when objects are located near similarly hyperechoic ocular structures (iris, sclera, or retro-orbital structures). In addition, ultrasound requires scanning in mul-tiple planes to detect the true size, placement, and number of intraocular foreign bodies (5).
INCIDENTAL FINDINGS 1. Syneresis is a benign finding in elderly patients, where
diffuse, lowly reflective echoes are identified in the nor-mally anechoic vitreous. These echoes typically go un-noticed unless the gain is increased above normal (11). Since it can be difficult to distinguish syneresis from
vitreous hemorrhage in the elderly, it is essential to cor-relate the clinical history and ultrasonic findings from the contralateral eye (Fig. 23.13).
2. Cataracts are a common reason for performing ocular ultrasound, due to an inability to perform a fundoscopic exam. Cataracts may also generate posterior reverbera-tion artifacts, resulting in a false positive interpretation (Fig. 23.23).
3. Retinoschisis is a condition that results in a separation of the inner, superficial retinal layer from its deeper, outer layer. Incidentally, this condition is often found on indi-rect ophthalmoscopy. It is an x-linked condition found in school-aged boys or as a nongenetic finding in the el-derly. On ultrasound, retinoschisis is thin, dome-shaped, and located bilaterally in the inferotemporal portions of the globe (Fig. 23.24) (26). Although retinoschisis may appear similar to a focal RD or choroidal detachment, clinical history and the absence of visual changes are helpful in differentiating this from other conditions. Re-gardless of the etiology, a follow-up evaluation by an ophthalmologist is recommended.
4. Intraocular tumors are uncommon and should not re-sult in acute vision loss. Retinoblastoma and ocular melanoma are the most common ocular malignancies in childhood and adulthood, respectively. While the clas-sic appearance of these malignancies is described here, the sonographic appearance and position of these ocular masses is highly variable. It is important to remember that an ophthalmologist should evaluate any unexplained ocular finding.a. Retinoblastoma is a neuroblastic tumor that results
from the mutation of the RB tumor suppressor gene (27). In the preverbal child, the most common pre-senting sign is leukocoria (60%), followed by stra-bismus (19%) (28). The average age at diagnosis is 12 months. A classic appearance of retinoblastoma is an irregularly shaped mass that grows into the vitre-ous, with dense calcifications identified up to 91% of the time on ultrasound (Fig. 23.25) (29). Although

362 SeCtion Viii / Problems of the Head and Neck
Retinoschisis
FIGURE 23.24. Retinoschisis. This dome-shaped elevation was an incidental finding on a patient with no visual complaints . This finding was discovered bilaterally in the inferotemporal portions of the eyes of a 10-year-old male who was being evaluated for chronic headaches . (From Garcia JP . Ophthalmic Ultrasonography: A Video Atlas for Opthalmologists and Imaging Technicians . Baltimore, MD: Lippincott Williams & Wilkins; 2012 . Fig . 8-72, p 181 .)
FIGURE 23.25. Retinoblastoma. This image demonstrates an irregular, intraocular mass with dense calcifications (hyperechoic foci) causing poste-rior acoustic shadowing in a 2-year-old that presented with leukocoria .
FIGURE 23.23. A: Cataract . The dense, hyperechoic cortex from a cataractous lens impedes ultrasound beam transmission . B: Cataract with posterior reverberation artifacts .
A B
the initial diagnosis is often made by indirect oph-thalmoscopy or ultrasound, further imaging with MRI or CT is necessary to assess for optic nerve or brain extension.
b. Ocular melanoma is typically unilateral and single. The most common age of diagnosis in adults is be-tween 40 and 60 years. It arises from the choroid (90%), ciliary body (7%), and iris (3%) (29,30). On ultrasound, choroidal melanoma growth results in the upward displacement of the retinal layer. With continued growth, it will eventually break through Bruch’s choroidal membrane into the sub-retinal space, taking on a “collar-button appearance” (Fig. 23.26).

Chapter 23 / Eye Emergencies 363
Retinaldetachment
Retinaldetachment
Vitreoushemorrhage
Subretinalhemorrhage
Opticnerve
Choroidalmelanoma
FIGURE 23.26. Choroidal Melanoma. This is a classic appearance of a “mushroom or collar-button-shaped” choroidal melanoma . This mass has pushed through Bruch’s membrane, resulting in a retinal detachment and both vitreous and subretinal hemorrhages . On ultrasound, ocular mela-nomas may also have a shimmering quality . (From Garcia JP . Ophthalmic Ultrasonography: A Video Atlas for Opthalmologists and Imaging Technicians . Baltimore, MD: Lippincott Williams & Wilkins; 2012 . Fig . 8-34, p 140 .)
FIGURE 23.27. Posterior Vitreous Detachment with Vitreous hemor-rhage. In the posterior segment of the eye, a thin membrane with “jiggly” movement is identified ( VIDEO 23 .6) . Additionally, fine vitreous opaci-ties are noted to be different from this elderly patient’s contralateral eye .
FIGURE 23.28. Case 2. A: Retinal detachment . The detachment is not vi-sualized on the initial imaging with the patient looking straight ahead . B, C: As the patient looks up and down, the detachment becomes obvious . This retinal detachment occurred in a near-sighted patient . Near-sightedness predisposes patients to rhegmatogenous retinal detachments . (Parts A and B from Jehle D, Bouvet S, Braden B, et al . Emergency Ultrasound of the Eye and Orbit . Buffalo, NY: Grover Cleveland Press; 2011 . Fig . 17A, B, p 53 .)
A
CLINICAL CASESCASE 1An 83-year-old male with hypertension and previous bilateral cataract surgery 2 years ago presents for an abrupt decrease in vision in the left eye. Two days prior to evaluation, the patient noticed the vision in his left eye became suddenly dark. He described that it was similar to “looking through fog.” He denies trauma, eye pain, photophobia, or anticoagu-lant use. He denies perceiving flashes or a “curtain” com-ing down over his visual field. On exam, the patient’s visual acuity is 20/40 (right) and 20/70 (left). Pupils are 3 to 2 mm bilaterally. He has no afferent pupillary defect. The intraocu-lar pressure is 16 bilaterally. His blood glucose is 86. An ul-trasound is shown in Figure 23.27 and VIDEO 23 .8. The patient was observed to have a PVD with significant “jiggly” aftermovement. In addition, there was a vitreous hemorrhage occupying 50% of the posterior segment. His findings were discussed with an ophthalmologist and a prompt follow-up appointment arranged ( VIDEO 23 .11).
CASE 2A 42-year-old male surgeon with severe myopia presents with an acute loss of peripheral vision in his right eye while operating. He denies trauma to the eye and has no past medi-cal history. On exam, his corrected visual acuity is 20/30 (right) and 20/40 (left). His pupils are 3 mm bilaterally and his extraocular muscles are intact. The initial ultrasound view
of the eye does not reveal any abnormality (Fig. 23.28A). However, after thoroughly examining each of the eye’s four quadrants a RD is found (Fig. 23.28B). The patient was subsequently referred to a retinal specialist and seen imme-diately. His retina was repaired and he resumed operating without any visual deficits.

364 SeCtion Viii / Problems of the Head and Neck
17. Kimberly HH, Shah S, Marill K, et al. Correlation of optic nerve sheath diameter with direct measurement of intracranial pressure. Acad Emerg Med. 2008;15:201–204.
18. Tayal VS, Neulander M, Norton HJ, et al. Emergency department sono-graphic measurement of optic nerve sheath diameter to detect findings of increased intracranial pressure in adult head injury patients. Ann Emerg Med. 2007;49:508–514.
19. Qayyum H, Ramlakhan S. Can ocular ultrasound predict intracranial hypertension? A pilot diagnostic accuracy evaluation in a UK emergency department. Eur J Emerg Med. 2013;20(2):91–97.
20. Blaivas M, Theodoro D, Sierzenski PR. A study of bedside ocular ultrasonography in the emergency department. Acad Emerg Med. 2002; 9:791–799.
21. Tsung JW, Blaivas M, Cooper A, et al. A rapid noninvasive method of detecting elevated intracranial pressure using bedside ocular ultrasound: application to 3 cases of head trauma in the pediatric emergency depart-ment. Pediatr Emerg Care. 2005;21:94–98.
22. Jafri F, Runde D, Saul T, et al. An inexpensive and easy simulation model of ocular ultrasound that mimics normal anatomy as well as abnormal ophthalmologic conditions. J Ultrasound Med. 2011;30:569–573.
23. Theoret J, Sanz GE, Matero D, et al. The “guitar pick” sign: a novel sign of retrobulbar hemorrhage. CJEM. 2011;13:162–164.
24. Hollands H, Johnson D, Brox AC, et al. Acute-onset floaters and flashes: is this patient at risk for retinal detachment? JAMA. 2009;302:2243–2249.
25. Fielding JA. The assessment of ocular injury by ultrasound. Clin Radiol. 2004;59:301–312.
26. Garcia JP. Dynamic Ophthalmic Ultrasonography: A Video Atlas for Opthalmologists and Imaging Technicians. Baltimore, MD: Lippincott Williams & Wilkins; 2012.
27. Melamud A, Palekar R, Singh A. Retinoblastoma. Am Fam Physician. 2006;73:1039–1044.
28. Kaufman PL, Teed GW. Overview of Retinoblastoma. http://www .uptodate.com. Accessed March 1, 2012.
29. Roth DB, Scott IU, Murray TG, et al. Echography of retinoblastoma: histopathologic correlation and serial evaluation after globe-conserving radio-therapy or chemotherapy. J Pediatr Ophthalmol Strabismus. 2001;38:136–143.
30. Mahajan A, Crum A, Johnson MH, et al. Ocular neoplastic disease. Semin Ultrasound CT MR. 2011;32:28–37.
REFERENCES 1. Blaivas M. Bedside emergency department ultrasonography in the evalu-
ation of ocular pathology. Acad Emerg Med. 2000;7(8):947-950. 2. Lizzi FL, Coleman DJ. History of ophthalmic ultrasound. J Ultrasound
Med. 2004;23:1255–1266. 3. Roth KR, Gafni-Pappas G. Unique method of ocular ultrasound using
transparent dressings. J Emerg Med. 2011;40:658–660. 4. Silva CT, Brockley CR, Crum A, et al. Pediatric ocular sonography.
Semin Ultrasound CT MR. 2011;32:14–27. 5. Harries A, Shah S, Teismann N, et al. Ultrasound assessment of
extraocular movements and pupillary light reflex in ocular trauma. Am J Emerg Med. 2010;28:956–959.
6. Kubal WS. Imaging of orbital trauma. Radiographics. 2008;28: 1729–1739.
7. Bord SP, Linden J. Trauma to the globe and orbit. Emerg Med Clin North Am. 2008;26:97–123.
8. Jehle D, Bouvet S, Braden B, et al. Emergency Ultrasound of the Eye and Orbit. Buffalo, NY: Grover Cleveland Press; 2011.
9. Gariano RF, Kim CH. Evaluation and management of suspected retinal detachment. Am Fam Physician. 2004;69:1691–1698.
10. Rubano EJ, Jackson KA, Stone MB. Kinetic echography in the evalua-tion of retinal detachment. Acad Emerg Med. 2010;17:e46–e47.
11. Waldron RG, Aaberg TM. B-Scan Ocular Ultrasound. http://www .emed icine.com. Accessed January 21, 2009.
12. Lyon M, Blaivas M. Ocular ultrasound. In: Ma OJ, Mateer J, Blaivas M, eds. Emergency Ultrasound. 2nd ed. New York, NY: McGraw Hill; 2007.
13. Shiver SA, Lyon M, Blaivas M. Detection of metallic ocular foreign bodies with handheld sonography in a porcine model. J Ultrasound Med. 2005;24:1341–1346.
14. McIlrath ST, Blaivas M, Lyon M. Diagnosis of periorbital gas on ocular ultrasound after facial trauma. Am J Emerg Med. 2005;23:517–520.
15. Arey ML, Mootha VV, Whittemore AR, et al. Computed tomography in the diagnosis of occult open-globe injuries. Ophthalmology. 2007; 114:1448–1452.
16. Joseph DP, Pieramici DJ, Beauchamp NJ Jr. Computed tomography in the diagnosis and prognosis of open-globe injuries. Ophthalmology. 2000;107:1899–1906.
CBFIGURE 23.28. ( Continued )

365
solid masses, benign from malignant lymphadenopathy, and intra- from extraglandular abnormalities of the salivary glands. The sensitivity and specificity for detecting some of these lesions have been found to be comparable to other imaging modalities such as computerized tomography (CT) and magnetic resonance imaging (MRI) (2). Ultrasound has a number of advantages in comparison with x-ray, CT, and MRI: It is readily available, noninvasive, repeatable, rapid, inexpensive, and nonionizing.
In recent years, the role of point-of-care head and neck ul-trasonography in the ED has expanded dramatically. Bedside ultrasound is being increasingly used in the evaluation of head and neck soft tissue masses, paranasal sinuses, and de-tection and treatment of peritonsillar abscesses (3). Head and neck ultrasound has moved from being an imaging modality confined to the radiology department to an active bedside diagnostic and therapeutic tool available to the clinicians at the point of patient care. Clinician-based ultrasound al-lows emergency physicians to evaluate patients with sus-pected head and neck infections in a rapid and cost-effective manner.
INTRODUCTIONHead and neck infections are common presentations to the emergency department (ED) and vary in their need for urgent treatment. Common conditions such as pharyngitis, tonsilli-tis, cellulitis, uncomplicated sialoadenitis, and lymphadenitis can be treated with outpatient oral antibiotics or symptomatic therapy. Other conditions such as peritonsillar abscesses, den-tal abscesses, suppurative sialoadenitis, and neck abscesses often require urgent treatment in the ED and may require imaging to diagnose and characterize them, and to determine involvement with surrounding structures. Physical examina-tion findings in patients with head and neck complaints are not always sufficient. Most of the structures and conditions in this region lie between 1 and 5 cm below the skin, making them well suited to evaluation by ultrasound (1). Ultrasound can detect abscesses not identified on clinical examination and is very reliable in identifying lymphadenitis, sialoadeni-tis, thyroid masses, and infected congenital cysts. Ultrasound can successfully differentiate between cellulitis, abscess, and adenitis, and is very accurate in distinguishing cystic from
Srikar Adhikari
Infections of the Head and Neck
24
INTRODUCTION . . . . . . . . . . . . . . . . . . . . . . . . . . . . . . . . . . 365THE PARANASAL SINUSES . . . . . . . . . . . . . . . . . . . . . . . . . 366
Clinical Applications . . . . . . . . . . . . . . . . . . . . . . . . . . 366Image Acquisition . . . . . . . . . . . . . . . . . . . . . . . . . . . . 366Normal Anatomy . . . . . . . . . . . . . . . . . . . . . . . . . . . . . 366Pathology . . . . . . . . . . . . . . . . . . . . . . . . . . . . . . . . . . 367Artifacts and Pitfalls . . . . . . . . . . . . . . . . . . . . . . . . . . 368Use of the Image in Clinical Decision Making . . . . . . . 368Correlation with Other Imaging Modalities . . . . . . . . . 368
PHARYNGITIS . . . . . . . . . . . . . . . . . . . . . . . . . . . . . . . . . . . 369Clinical Applications . . . . . . . . . . . . . . . . . . . . . . . . . . 369Image Acquisition . . . . . . . . . . . . . . . . . . . . . . . . . . . . 369Normal Anatomy . . . . . . . . . . . . . . . . . . . . . . . . . . . . . 370Pathology . . . . . . . . . . . . . . . . . . . . . . . . . . . . . . . . . . 370
Artifacts and Pitfalls . . . . . . . . . . . . . . . . . . . . . . . . . . 370Use of the Image in Clinical Decision Making . . . . . . . 370Correlation with Other Imaging Modalities . . . . . . . . . 372
HEAD AND NECK INFECTIONS . . . . . . . . . . . . . . . . . . . . . . . 372Clinical Applications . . . . . . . . . . . . . . . . . . . . . . . . . . 372Image Acquisition . . . . . . . . . . . . . . . . . . . . . . . . . . . . 372Normal Anatomy . . . . . . . . . . . . . . . . . . . . . . . . . . . . . 373Pathology . . . . . . . . . . . . . . . . . . . . . . . . . . . . . . . . . . 375Artifacts and Pitfalls . . . . . . . . . . . . . . . . . . . . . . . . . . 379Use of the Image in Clinical Decision Making . . . . . . . 380Correlation with Other Image Modalities . . . . . . . . . . . 380
CLINICAL CASES . . . . . . . . . . . . . . . . . . . . . . . . . . . . . . . . . 380Case 1 . . . . . . . . . . . . . . . . . . . . . . . . . . . . . . . . . . . . . 380Case 2 . . . . . . . . . . . . . . . . . . . . . . . . . . . . . . . . . . . . . 380

366 Section Viii / Problems of the Head and Neck
THE PARANASAL SINUSESClinical ApplicationsRhinosinusitis is a common disorder affecting more than 30 million adults in the United States every year (4). Antibi-otics are generally considered beneficial in the treatment of acute bacterial sinusitis; however, only 50% of patients pre-senting to the ED with sinus symptoms actually have acute bacterial sinusitis (5). Accurate diagnosis of acute sinusitis is challenging since signs and symptoms of bacterial sinus-itis are nonspecific and distinguishing between rhinitis and sinusitis is not always simple (6). Although imaging studies such as CT and MRI improve diagnostic accuracy, these are not routinely used for diagnosing uncomplicated sinusitis in ambulatory settings due to additional costs, time, and radia-tion risk.
Ultrasound has become a tool for diagnosing acute max-illary sinusitis during the last two decades. It is safe, quick, noninvasive, inexpensive, and repeatable. It is very sensitive in detecting fluid in sinus cavities. Accuracies exceeding 90% for diagnosing maxillary sinusitis have been reported in Otolaryngology (ENT) practices (6,7). Results from ENT practices may not be generalizable to other settings, due to differences in patient populations and severity of disease. When bedside ultrasound performed by emergency phy-sicians is compared to CT in ED patients with suspected maxillary sinusitis, the sensitivity and specificity are 81% and 89%, respectively (8). Ultrasound is an accessible imag-ing alternative to the more expensive or invasive diagnostic modalities.
Clinician-performed sinus ultrasound can be used to:
1. Evaluate patients with suspected maxillary sinusitis. 2. Distinguish rhinitis from acute maxillary sinusitis. 3. Detect nosocomial sinusitis as an occult cause of fever
in intubated patients in intensive care settings.
Image AcquisitionThe paranasal sinuses that are amenable for bedside scanning are maxillary and frontal sinuses. However, frontal sinuses are not well seen on ultrasound due to the thick anterior sur-face of frontal bone. A high frequency (7 to 13 MHz) linear array transducer is typically used to perform an ultrasound examination of the maxillary sinus. Alternatively, a phased array or a micro convex transducer can also be used. The examination is done with the patient in an upright position with the head bent slightly forward so that sinus fluid, if present, will layer in the floor of the sinus against the an-terior wall (Fig. 24.1). A large amount of ultrasound gel is applied to the maxillary area. The transducer is placed in a transverse plane, beneath the orbit and lateral to the nose. Without applying any pressure, the maxillary area is scanned both in sagittal and transverse planes between the nose and the zygoma to demonstrate the full extent of the sinuses. The scanning hand should be stabilized over the facial bones to prevent sliding. The scan is performed initially in a trans-verse plane, angling the probe from the orbital floor to the floor of the sinus. This is followed by rotating the transducer 90 degrees and scanning in a sagittal plane, from the medial to the lateral wall of the maxillary sinus. The depth setting should be appropriately adjusted so that the sinus fills ap-proximately three-quarters of the screen and the posterior wall of the sinus is visualized well. The contralateral side should be scanned routinely for comparison.
Normal AnatomyThe pyramidal-shaped maxillary sinus is located within the body of the maxilla bounded by the orbital floor superiorly, the hard palate inferiorly, the zygoma laterally, and the na-sal cavity medially. It is 2 to 4 cm deep anteroposteriorly. The normal maxillary sinus is filled with air that prevents the transmission of ultrasound. Normally, aerated sinuses
FIGURE 24.1. Transducer Position for Maxillary Sinus Ultrasound Examination . A: Transverse . B: Sagittal .
A B

chapter 24 / Infections of the Head and Neck 367
reflect most of the ultrasound signal, preventing visualiza-tion of structures deep to the air. The anterior wall of the maxillary sinus is seen as a bright echo, behind which rever-beration artifact is seen. Reverberation artifact generates a series of evenly spaced horizontal echogenic lines parallel to the anterior surface of the maxilla that diminish in intensity at increasing depth (Fig. 24.2). This gives a snowstorm ap-pearance to a normal air-filled sinus. The posterior wall of the sinus is not visualized in a normal nonopacified sinus (9).
PathologyAcute maxillary sinusitis is characterized by edema, mucosal thickening, and fluid collection within the sinus cavity. When the sinus cavity is filled with fluid, the ultrasound signal pen-etrates the anterior wall, travels through the fluid-filled sinus cavity, strikes the posterior and lateral walls, and returns to the transducer, resulting in an image of the entire sinus cavity. The fluid-filled maxillary sinus is seen as a triangular hypoechoic cavity with well-defined lateral, medial, and posterior walls. This creates an image referred to as a sinusogram. The total opacification of the completely fluid-filled maxillary sinus re-sults in a complete sinusogram where the posterior wall of the sinus is clearly seen and no reverberation artifacts are visu-alized (Fig. 24.3). However, if the sinus is only partially filled with fluid, partial visualization of the walls can occur due to the presence of an air-fluid level within the sinus cavity. This is called a partial sinusogram, where all walls are not well defined (Fig. 24.4). This appearance is also seen with mucosal thickening (10). Postural scanning maneuvers can help in dif-ferentiating acute sinusitis from mucosal thickening.
FIGURE 24.2. B-Mode Image of Normal Maxillary Sinus in Sagittal Plane . Hyperechoic skin and subcutaneous tissue are seen in the near field . The anterior wall is visualized as a bright echogenic line (arrow) . Reverbera-tion artifacts (arrow heads) are seen emanating from the anterior wall of sinus creating a snowstorm pattern in the nonopacified sinus . Note that the posterior wall of the sinus is not visualized . FIGURE 24.3. Complete Sinusogram (Sagittal Plane) of a Patient with
Acute Maxillary Sinusitis . The posterior wall of the sinus is seen as a bright echogenic line in the far field of the image (arrow) . The sinus cavity is filled with anechoic fluid .
FIGURE 24.4. Partial Sinusogram in Sagittal Plane . The posterior wall is partially visualized on the right side in the far field (arrow) . On the left side, acoustic shadowing from the anterior wall is seen (arrow heads) .

368 Section Viii / Problems of the Head and Neck
portion of the sinus cavity, and reverberation artifact is seen in the air-containing region of the sinus. In mucosal thickening there is no significant change in the appear-ance of the image in the upright position since there is no fluid in the sinus cavity.
4. Reverberation artifacts located deep in the sinus cavity can be confused for the posterior wall of the sinus.
5. Sonographic findings of sinusitis are not helpful in dif-ferentiating between a viral or bacterial etiology. Simi-lar abnormalities (partial or complete sinusogram) are noted with both conditions. Other conditions such as polyps, cysts, and mass or blood in the sinus masses can also produce the appearance of a sinusogram.
6. The sensitivity of ultrasound for maxillary sinusitis is approximately 85% (11). If clinical suspicion is high, other imaging modalities or consultation should be considered.
Use of the Image in Clinical Decision MakingIn daily clinical practice, the diagnosis of acute maxillary sinusitis is most often based on symptoms and clinical ex-amination findings, although these have been shown to be unreliable in differentiating acute sinusitis from upper re-spiratory infection. As a result, it is likely that a significant number of patients receive antibiotics for viral respiratory tract infections leading to the alarming global threat of in-creasing antimicrobial resistance. Conversely, undiagnosed sinusitis can lead to pain, return ED visits, and other com-plications such as pneumonia, meningitis, and intracerebral abscesses. Maxillary sinus ultrasound is a safe, rapid, pain-less, noninvasive bedside procedure to detect fluid in the maxillary sinus cavity. If sinusitis is diagnosed or excluded using bedside ultrasound, unnecessary antibiotic use could be potentially reduced. If a complete sinusogram is seen, further imaging studies can be avoided, and the patient can be treated with antibiotics for sinusitis. Appropriate consultation can be obtained for a drainage procedure if necessary.
Correlation with Other Imaging ModalitiesImaging modalities used for the diagnosis of maxillary sinus-itis include x-ray, CT, and MRI. Standard x-rays are rarely used in current clinical practice because of low sensitivity. CT is highly sensitive for sinusitis, and is generally consid-ered the imaging procedure of choice for the diagnosis of sinusitis. Common CT findings for sinusitis include air–fluid levels, mucosal edema, and air bubbles within the sinuses. Because of radiation exposure with this imaging technique, CT should be considered only in situations such as recurrent sinusitis, chronic sinusitis, and treatment failures. MRI is not routinely used in the evaluation of patients with suspected sinusitis. MRI provides better visualization of soft tissue than CT and is useful in the assessment of complications of acute sinusitis when extra sinus involvement is suspected. While CT is more sensitive than plain x-ray, and MRI is more sensitive than CT, the specificity of these studies is unclear. In both children and adults without symptoms of sinusitis, the prevalence of sinusitis on CT and MRI is 45% and 42%, respectively (12). In patients with no symptoms of sinusitis, 32% to 60% had mucosal thickening, opacifica-tion, fluid, or polyps in their sinuses (13). Hence, the use of CT and MRI is limited by false-positive findings seen in
Lichtenstein et al. prospectively investigated the signif-icance of sinusograms in critically ill patients who under-went maxillary sinus CTs. The maxillary sinus ultrasound was always positive (complete or partial sinusogram) when the CT revealed complete opacification of the sinus. The ultrasound was always negative when CT showed a normal sinus. The sensitivity of ultrasound was 67% and the specificity was 87% for the diagnosis of maxil-lary sinusitis (total opacification or air-fluid level within the maxillary cavity on CT). The specificity of complete sinusogram was 100% for the diagnosis of total opacifica-tion of the sinus (10).
Artifacts and Pitfalls 1. The thickness of the anterior wall of the sinus can limit
the ability of ultrasound to penetrate fluid-filled sinus cavities.
2. Air bubbles near the anterior wall of the sinus can degrade the ultrasound signal, resulting in the appear-ance of an incomplete or partial sinusogram.
3. A partial sinusogram cannot differentiate sinusitis with a partially fluid-filled sinus cavity from that with mucosal thickening. However, dynamic scanning maneuvers can help make this distinction. The patient’s position while scanning influences the appearance of the sinus fluid in a partial sinusogram. In the supine position, fluid can layer out away from the anterior wall and create an air-fluid interface. Ultrasound cannot penetrate the overly-ing air, resulting in either acoustic shadowing or a partial sinusogram. The partially aerated sinus may not allow visualization of the posterior wall when the patient is supine. In contrast, when the examination is performed in an upright position, the fluid will layer out inferiorly in the floor of the sinus and come into contact with the anterior wall. On ultrasound, this results in either a par-tial or complete sinusogram, depending on the amount of fluid present in the sinus cavity and the orientation of the transducer (Figs. 24.4 and 24.5) (9). In sinusitis, the posterior wall of the sinus is seen in the fluid-filled
FIGURE 24.5. Illustration Showing the Effect of Dynamic Scanning Maneuver from Supine to Upright Position . In supine position, fluid lay-ers away from the anterior wall, and ultrasound beams cannot penetrate the overlying air resulting in acoustic shadowing or reverberation artifacts . In the upright position, the fluid in the sinus cavity follows gravity, layers out inferiorly in the floor of the sinus, and comes into contact with the anterior wall of the sinus, resulting in either a partial or complete sinusogram .

chapter 24 / Infections of the Head and Neck 369
of physical examination to diagnose a peritonsillar abscess has been shown to be around 75% and 50% respectively (18). It is, however, important to distinguish between these two conditions since they require very different treatments. Peritonsillar cellulitis is generally treated with antibiotics, whereas a peritonsillar abscess usually requires aspiration or incision and drainage in combination with antibiotics. If not treated promptly, peritonsillar abscess can lead to complica-tions such as parapharyngeal abscess, retropharyngeal space and mediastinal extension, jugular vein thrombophlebitis, cavernous sinus thrombosis, brain abscess, meningitis, or pneumonia (19). Traditionally, emergency physicians have used anatomic landmark-based blind needle aspiration in pa-tients with clinically suspected peritonsillar abscess. Blind needle aspiration has a reported false-negative rate of 10% to 12%, (17) and has been associated with injuries to the carotid artery, jugular vein, and parotid gland. In the recent years, bedside ultrasound has emerged as an extremely valuable tool in the diagnosis and management of peritonsillar abscess in the ED. Lyon et al. used intraoral ultrasound to diagnose and treat bilateral peritonsillar abscesses (3). Blaivas et al. also reported the use of intraoral ultrasound by emergency physicians to diagnose and successfully aspirate peritonsillar abscess and found ultrasound to be 100% accurate in their series (20). In a recent prospective randomized controlled study involving 28 patients with suspected peritonsillar ab-scess, intraoral ultrasound established an accurate diagno-sis more often than a landmark approach, resulted in more successful aspiration of purulent material, and decreased the need for specialty consultation and CT scan (18).
Ultrasound is helpful in determining the presence, size, and anatomic location of a peritonsillar abscess, and in iden-tifying the relationship of the abscess to the carotid artery. The main clinical indications for the use of ultrasound in the evaluation of peritonsillar infections in the ED are:
1. To distinguish peritonsillar abscess from peritonsillar cellulitis.
2. To provide real-time guidance to aspirate peritonsillar abscess.
3. To evaluate other complications such as Lemierre syndrome.
Image AcquisitionSonographic evaluation of suspected peritonsillar abscess is usually performed with a high frequency (4 to 9 MHz) curved array intracavitary transducer, as is used for trans-vaginal sonography. A small amount of gel is applied to the transducer, followed by a protective sheath such as a con-dom. Gel may be placed on the outside of the probe sheath; however, moist oropharyngeal mucosa allows transmission of ultrasound without gel. A topical anesthetic should be sprayed in the posterior pharynx prior to the exam for patient comfort to reduce gagging. The scanning approach is shown in Figure 24.6. The tonsillar tissue should be scanned sys-tematically in two orthogonal planes to determine the size and presence or absence of a fluid collection. The soft palate is interrogated in both the sagittal and the transverse planes with the goal of identifying the superior and inferior extent of the abscess cavity, its depth, and its position relative to the carotid artery. Doppler should be used to identify the carotid artery if it is not readily apparent. The inferior por-tion of the pharynx should be scanned carefully because pus
healthy, asymptomatic individuals. Additionally, both imag-ing modalities are expensive and time-consuming. A posi-tive culture from fluid obtained on sinus puncture is the true gold standard for diagnosing bacterial sinusitis, but it is an invasive procedure not readily accepted by all patients and rarely utilized.
Ultrasonography is a rapid, inexpensive, and readily available tool for evaluation of maxillary sinuses, features that make it an optimal diagnostic method in the ED. In a comparative study done by Puhakka et al., ultrasound and plain x-rays of the paranasal sinuses were performed on 197 young adults within 48 hours of the onset of symptoms of the common cold (11). Forty randomly selected patients also received MRI. A diagnosis of acute maxillary sinusitis was made in 24% of the sinuses by plain x-rays, and in 28% by MRI. Compared with MRI, the sensitivity and specific-ity of ultrasound for detection of maxillary sinusitis were 64% and 95%, respectively. Based on these study findings, positive ultrasound findings can be regarded as evidence of maxillary sinusitis. In a systematic review conducted by Varonen et al., the efficacies of clinical examination, ultra-sound, and radiography as diagnostic measures for acute maxillary sinusitis were evaluated (7). Ultrasound findings were considered positive for sinusitis if scans showed the presence of a posterior echo ≥3.5 cm from the anterior echo. Seven studies compared ultrasonography to sinus puncture and revealed a sensitivity of 85% and specificity of 82% for ultrasound. In another study done by Varonen et al., the over-all sensitivity of ultrasound compared to x-rays was 92% and specificity was 95% when results were calculated per patient as unit of analysis (14).
Ultrasound is easy to perform, nonionizing, and provides an alternative to CT and MRI in the diagnosis of maxil-lary sinusitis. While ultrasound is less sensitive than CT and MRI in detecting mucosal changes and identification of fluid in sinus cavity, it is probably more specific in di-agnosing clinically significant disease since a significant amount of sinus fluid is required to produce sonographic abnormalities.
PHARYNGITISClinical ApplicationsAcute pharyngitis accounts for approximately 12 million ambulatory visits per year in the United States (15). The dif-ferential diagnosis for pharyngitis includes parapharyngeal space infection, peritonsillar abscess, submandibular space infection (Ludwig angina), Lemierre syndrome, and epiglot-titis. Peritonsillar abscess (abscess in the area between the palatine tonsil and its capsule) is the most common deep space infection of the head and neck, with an incidence esti-mated at 30 cases per 100,000 annually in the United States (16). Peritonsillar abscess is often described as part of a spectrum of disease beginning with tonsillitis, progressing to peritonsillar cellulitis, and culminating in peritonsillar ab-scess. The abscess develops as a complication of acute follic-ular tonsillitis with the infection spreading from the tonsillar crypts, penetrating the capsule, and localizing in the peri-tonsillar region (17). The diagnosis of peritonsillar abscess can be challenging. History and clinical examination alone cannot be used to reliably differentiate peritonsillar celluli-tis from peritonsillar abscess. The sensitivity and specificity

370 Section Viii / Problems of the Head and Neck
of the bony hard palate and styloid process of the tempo-ral bone, the medial pterygoid muscle, and various fascial planes. However, it is important to locate the internal carotid artery (anechoic tubular structure), which courses anterior to the jugular vein in the carotid sheath, and is usually located posterolateral to the tonsil within 5 to 25 mm of a periton-sillar abscess (23). Typically, the normal tonsil is seen as a small (10 to 20 mm), oval structure with homogeneous low-level echoes (Figs. 24.8 and 24.9).
PathologyPeritonsillar abscessOn ultrasound, peritonsillar cellulitis appears as an enlarged tonsil (>20 mm) with a homogeneous or striated echo texture (Fig. 24.10) (17). A peritonsillar abscess usually appears as a hypoechoic, heterogeneous mass, but like all abscesses, the appearance is variable depending on the composition of the purulent material. The abscess may be isoechoic com-pared with the surrounding tissue in one-third of cases; how-ever, posterior acoustic enhancement is a consistent finding (Figs. 24.11–24.13; VIDEO 24 .1) (24). If the necrosis is minimal, there is less acoustic transmission, resulting in a more isoechoic pattern. Sometimes, central hypoecho-genicity with an echogenic rim is seen. Any complex fluid collection inseparable from the tonsil with a mass effect regardless of the echo-pattern is more likely an abscess than cellulitis.
Artifacts and PitfallsThere are numerous potential difficulties inherent in the ul-trasound assessment of peritonsillar abscesses.
1. Patients may have trismus or have difficulty cooperating with the exam. Pretreatment with systemic and topical pain medication can optimize success.
2. Technical difficulties include a degraded image caused by air bubbles between the condom and transducer face, or by poor contact with the pharyngeal wall. Failure to adjust the depth to magnify the near field may cause superficial abscesses to be missed.
3. Abscesses located in the inferior pole of the tonsil can be missed by failure to scan in the sagittal plane.
4. Isoechoic abscesses can be missed if the sign of increased posterior acoustic enhancement is not recognized.
5. Because the anatomy includes numerous structures and tissue planes of varying acoustic impedance, failure to compare to the contralateral side can lead to either false-positive or false-negative results.
Use of the Image in Clinical Decision MakingIt is often difficult in clinical practice to distinguish peritonsillar cellulitis, which can be treated with antibiotics alone, from peritonsillar abscess, which requires drainage. The traditional approach to diagnosis has been blind needle aspiration of the peritonsillar swelling, but this subjects pa-tients with cellulitis to unnecessary discomfort and risk, and carries a 10% false-negative rate (17). Obtaining a CT for this problem is too time-consuming and expensive for rou-tine emergency medicine practice (21).
When the diagnosis of peritonsillar abscess is in ques-tion, ultrasound can be used as the first step in determining management. If no abscess cavity is visualized, antibiotics
FIGURE 24.6. Intra-Oral Approach. A sheathed endocavitary transducer is inserted orally to scan the peritonsillar region after application of topical anesthesia to the posterior pharynx .
FIGURE 24.7. Transcutaneous Approach . Linear transducer is placed inferior and adjacent to the angle of the mandible with lateral rotation of the head .
accumulates adjacent to the mid and lower pole of the tonsil in up to 40% of cases (which correlates with false-negative needle aspiration) (21). Comparison to the contralateral side may be helpful. If the patient tolerates it, gentle pressure should be applied to assess the motion of contents within the abscess cavity.
In patients with significant trismus, intraoral ultrasound with an endocavitary probe can be challenging. A transcuta-neous approach has been described using a high frequency (5 to 10 MHz) linear transducer to scan the pharynx. The transducer is placed inferior and adjacent to the angle of the mandible directing posteriorly and cranially (Fig. 24.7). This approach does not require an open mouth or direct probe contact with the tonsils (22).
Normal AnatomyThe anatomy of the peritonsillar area is somewhat complex, and it is unrealistic to expect to identify all the structures in this region. These include the palatine tonsil, the margin

chapter 24 / Infections of the Head and Neck 371
FIGURE 24.8. Anatomy of Peritonsillar Region. Shows the proximity to the internal jugular vein and carotid artery .
Superior constrictor muscle Peritonsillar abscess
Carotid sheath
Internal jugular vein
Internal carotid artery
Ramus of mandible
Vallecula
Glossoepigiottic fold
Lower lip
Buccinator muscle
Vestibule of mouth
Palatoglossus
Palatine tonsil
Tonsillar artery
Facial artery
External palatine vein
FIGURE 24.9. Image of a Normal Tonsil. An oval structure with homoge-neous low-level echoes (arrow heads) . Doppler flow identifies the carotid artery .
FIGURE 24.10. Peritonsillar Cellulitis . Diffusely enlarged tonsil with a striated appearance (arrow heads) . (Courtesy of John Kendall, MD .)
and close follow-up are prescribed. If an abscess is seen, the optimal site for aspiration can be identified, and real-time ultrasound guidance can be used for aspiration. When an abscess seems obvious on physical exam, blind aspiration
is often undertaken, but may fail to locate the pus pocket. Ultrasound can be invaluable in this setting, either by locat-ing the abscess and rescuing an initially failed aspiration at-tempt or by confirming that no abscess exists.
FIGURE 24.11. Peritonsillar Abscess. A: Anechoic purulent fluid collec-tion within the tonsil . B: Note the presence of central area of heterogeneous echogenicity representing the abscess cavity (arrow) .
A
B

372 Section Viii / Problems of the Head and Neck
as an excellent alternative because it is rapid, noninvasive, relatively inexpensive, and easily accessible. The sensitivity and specificity to diagnose a peritonsillar abscess are 89% to 95% and 79% to 100%, respectively (19). In patients with severe trismus who cannot tolerate intraoral approach, cervi-cal transcutaneous ultrasound should be considered. It has a lower sensitivity (80%) and specificity (around 90%) (25).
HEAD AND NECK INFECTIONSClinical ApplicationsUltrasound is useful to determine the etiology and facilitate treatment of head and neck swellings and suspected infections. It is a reliable diagnostic tool to detect abscesses and to deter-mine the extent of head and neck infections (1,26,27). The use of ultrasound has been described in the evaluation of cervical neck abscesses in the pediatric population (28) and the bedside evaluation of Ludwig angina (29). Ultrasound is an alternative to panorex x-rays and CT for evaluation of dental abscesses, and is an effective tool in identifying the spread of odonto-genic infections to the buccal, submandibular, and canine spaces (30–32). Additionally, real-time ultrasound guidance can be used to aspirate or drain an abscess, then confirm that adequate drainage has been performed. Ultrasound can dif-ferentiate cystic from solid masses and neck abscesses from cervical lymphadenitis, as well as accurately identify thyroid enlargement or masses, vascular abnormalities, salivary gland pathology, and congenital abnormalities (1).
Image AcquisitionMost of the structures of interest in the head and neck are superficially located and are easily imaged with a high- frequency (5 to 12 MHz) linear broadband transducer using a small parts or superficial preset. An acoustic standoff pad can be used to improve image resolution if the lesion is very superficial. A sector probe transducer may be useful to fit into tight anatomical spaces, for example, when looking at cervi-cal lymph nodes in the supraclavicular area. Low frequency transducers provide better resolution for deeper lymph nodes. Color Doppler and power Doppler can be used to identify vascular structures. When using power Doppler, the Doppler settings should be optimized for detecting small vessels.
To image most structures of the neck, the patient is placed in a supine or upright position and the head turned away from the side to be imaged. Hyperextension of the neck can help increase the scanning surface (Fig. 24.14). The area of inter-est is generally visualized in at least two orthogonal planes, typically the longitudinal and transverse planes. Oblique and coronal adjustments should be made to localize lesions and trace vessels. Gentle pressure should be applied to assess contents of the lesion, to determine whether the lesion is a solid mass or fluid-filled cyst. Fluid should be compressible and mobile. Adjacent structures such as vessels, nerves, and lymphatic tissue should be identified to minimize complica-tions should procedural intervention be required. The depth of the structures of interest should be noted to facilitate drainage, if required. It is extremely important to examine the contralateral side of the head or neck for comparison, par-ticularly since some pathologic conditions occur bilaterally.
The salivary glands should be examined in at least two perpendicular planes with the head turned away from the side being examined and tilted back. The long axis view of the
FIGURE 24.13. Peritonsillar Abscess. Demonstrates posterior acoustic enhancement .
Correlation with Other Imaging ModalitiesCT scan is considered the gold standard for imaging a peri-tonsillar abscess (sensitivity, 100%; specificity, 75%) (19). However, it is expensive, involves exposure to ionizing ra-diation, and does not provide real-time guidance to drain the abscess. MRI allows assessment of the carotid sheath and provides improved soft tissue detail. However, MRI is usu-ally more expensive than CT scan, takes longer, and is not as widely available. Bedside intraoral ultrasound has emerged
FIGURE 24.12. A: Peritonsillar abscess (transverse plane) . B: Color Doppler demonstrates the proximity of a peritonsillar abscess to the internal carotid artery .
Abscesscavity
A
Carotidartery
B

chapter 24 / Infections of the Head and Neck 373
parotid gland is obtained by scanning in a vertical plane in front of the lower ear. The transducer needs to be angulated appropriately to assess the portion of the gland that is below the ear at the angle of the jaw. A curved-array or sector trans-ducer may be necessary to evaluate the parotid gland at the angle of mandible. Transverse views of the parotid gland are obtained with the transducer positioned perpendicular at the level of the ear lobe (Fig. 24.15). The submandibular gland is scanned by placing the transducer in the submandibular posi-tion parallel and perpendicular to the mandible (Fig. 24.16). The gland’s size and echogenicity should be evaluated and compared with the opposite side for symmetry. The gland should be assessed for increased vascularity and ductal dilatation. Color Doppler can assist with differentiation of the salivary ducts from vessels. The surrounding structures including regional lymph nodes should be assessed for any abnormalities (33).
Normal AnatomyThe parotid gland is located in the retromandibular fossa anterior to the ear and sternocleidomastoid muscle, with a portion of the superficial lobe covering the ramus of the mandible and the posterior part of the masseter muscle. Sonographically, the normal parotid gland appears homo-geneous and of increased echogenicity relative to adjacent muscle due to the fatty glandular tissue composition of the gland (Fig. 24.17). The triangular parotid gland is divided into superficial and deep lobes by a plane in which the facial nerve is located. The facial nerve is not generally seen on the ultrasound. Its position can be inferred as it lies just lateral to the main intraparotid vessels. The retromandibular vein lies deep to the facial nerve and lateral to the external carotid artery. The retromandibular vein is used as a sonographic landmark separating the superficial and deep lobes of the parotid gland. The deep lobe of the gland is poorly visualized with ultrasound since it is obscured by the mandible. Normal
FIGURE 24.14. Probe and Patient Position while Scanning Soft Tissues of Neck.
intraparotid nodes are frequently found during ultrasound examination in the parenchyma of the parotid gland, most commonly in the upper and lower poles of the gland. These nodes appear oval in shape and appear hypoechoic with a hyperechoic, fatty, central hilum. The normal intraglandular ducts and the nondilated main duct (Stensen duct) are usually not seen on ultrasound; however, a dilated Stensen’s duct may be visualized, running superficially along the masseter muscle about 1 cm below the zygomatic arch (33,34).
The submandibular gland is triangular in shape and is located within the posterior part of the submandibular tri-angle created by the anterior and posterior bellies of the digastric muscle and the body of the mandible. The larger superficial lobe and smaller deep lobe connect around the posterior border of the mylohyoid muscle. A normal sub-mandibular salivary gland has homogeneous echotexture, which is slightly hyperechoic compared with the surrounding muscle (Fig. 24.18). It is slightly more hypoechoic than the normal parotid gland and thyroid gland. The intraglandular ducts may be seen as small linear hyperechoic stripes within
FIGURE 24.15. Transducer Position for Parotid Ultrasound Examina-tion . A: Transverse . B: Sagittal .
A
B

FIGURE 24.18. Long Axis Image of Normal Submandibular Gland. 1, Parenchyma of submandibular gland; 2, Anterior belly of digastric muscle; 3, Mylohyoid muscle .
the parenchyma of gland. Wharton duct is best seen when pathologically dilated, but is sometimes seen in normal slim individuals. It appears as tubular structure emerging from the hilum of the submandibular gland and passing medially around the posterior border of mylohyoid (33–35). Color Doppler can demonstrate the vascularity of the gland. The facial artery may be seen crossing the parenchyma of the submandibular gland and has a tortuous course.
A large number of lymph nodes lie within the anterior and posterior triangles of the neck. Most of these nodes are clus-tered into groups or chains, which follow anatomical struc-tures in the neck. The size of normal cervical lymph nodes varies with the age, sex, and location in the neck. Normal cervical nodes in younger individuals are smaller than those in older subjects (>40 years). This is due to the increase in intranodal fatty infiltration with age. Lymph nodes in the up-per neck tend to be larger than the lymph nodes in other loca-tions. On B-mode, normal lymph nodes appear hypoechoic compared to adjacent muscles, with an echogenic hilum (Fig. 24.19A). Normal lymph nodes are oval in shape (with
FIGURE 24.16. Transducer Position for Submandibular Gland Ultrasound Examination . A: Transverse . B: Sagittal .A
B
FIGURE 24.17. A: Ultrasound image (transverse plane) shows the normal anatomy of the left parotid gland . 1, Retromandibular vein; 2, External carotid artery; 3, Surface of the mandible; 4, Parotid gland; 5, Masseter muscle . B: Long axis image of the parotid gland . 1, Skin and subcutaneous tissues; 2, Parenchyma of parotid gland; 3, Small duct .
A B
374

chapter 24 / Infections of the Head and Neck 375
FIGURE 24.21. Complex Fluid Collection (F ) Along the Mandible. (Courtesy of Michael Blaivas, MD .)
FIGURE 24.20. A: Probe positioning while evaluating patient for dental abscess in maxillary region . B: Dental abscess (F-anechoic fluid) along the maxillary teeth .
A
B
necrotic debris, or tissue may be seen in the abscess cavity. Power Doppler may reveal hyperemia at the periphery of the pus collection, but no vascularity within the abscess cavity. Motion of the purulent material may be induced by pressure
length to AP ratio >2), whereas malignant nodes tend to be round. On color Doppler and power Doppler, normal cervi-cal nodes may show hilar vascularity with vessels branching radially from the hilum (Fig. 24.19B) or appear avascular, but none should show peripheral vascularity (36). An echo-genic hilum is a sonographic feature of most normal cervical lymph nodes, but is more often seen in larger nodes than in smaller nodes. The echogenicity of the hilum corresponds to the presence of lymphatic sinuses and fatty tissue within the node.
PathologyHead and neck abscessesFacial and neck abscesses can develop from a multitude of causes, including untreated cellulitis, infected sebaceous cyst, odontogenic abscess, infected congenital cyst, complicated sialoadenitis or lymphadenitis, or even suppurative thyroid-itis. These clinical entities are managed differently. Some require bedside incision and drainage, others consultation and surgical management. Ultrasound can help identify the underlying source and help determine optimal management.
Sonographically, the appearance of an abscess is highly variable depending on the location, maturity, and contents of the abscess cavity (Fig. 24.20). Typically, it appears as a spherical or elliptical hypoechoic mass with internal echoes, lobulated or interdigitated contour and posterior acoustic enhancement (Fig. 24.21). Echogenic gas, locules, septae,
FIGURE 24.19. A: B-mode image of an oval hypoechoic normal cervi-cal lymph node with echogenic central hilum . B: Doppler showing a normal cervical node with central hilar vascularity .
A
B

376 Section Viii / Problems of the Head and Neck
duct cyst, epidermoid cyst, lipoma, cystic hygroma, thyroid mass, and brachial cleft cyst. Bedside ultrasound can assist with making rapid diagnosis and direct appropriate treat-ment and consultation. Additionally, ultrasound is helpful in the reassessment of enlarged cervical lymph nodes after anti-inflammatory therapy or empiric antibiotic treatment. In these cases, the reduction in the size of the lymph nodes can be assessed more accurately than clinical examination alone.
Sonographically, the reactive lymph nodes (lymphad-enitis) are well defined, appear elongated, ovoid, margin-ated, homogeneously hypoechoic with a central or eccentric echogenic hilum. The longitudinal diameter of the enlarged lymph node can measure up to 20 mm, and the largest trans-verse diameter of reactive nodes is up to 10 mm in the upper jugular chain, usually <8 mm in other locations. Reactive lymph nodes usually possess smooth or sharp borders. On color Doppler imaging, the vascularity is still confined to hilum (Fig. 24.23; VIDEO 24 .2). Hilar hypervascularity and smooth branching of the intranodal vessels is noted. In-flammation generally causes vasodilatation, which increases blood flow velocity in reactive lymph nodes. It may explain the low vascular resistance in reactive lymph nodes given
or movement of the transducer. Variations include isoechoic or hyperechoic appearance of abscess cavity. In these cases, the ultrasound appearance of abscess can mimic cellulitis de-spite the presence of liquefaction (37).
The sonographic features of cellulitis also vary with the stage and severity of infection. Ultrasound findings range from diffuse thickening and hyperechogenicity of the skin and subcutaneous tissues to hypoechoic subcutaneous strands (fluid) traversing between the hyperechoic fat and the connective tissue. A characteristic cobblestone appear-ance may be visualized depending on the amount of fluid in fascial planes, the degree of edema, and the orientation of the hypoechoic interlobular fat strands (Fig. 24.22). Color or power Doppler can reveal hypervascularity within the subcu-taneous tissues, suggesting an inflammatory component (37).
If subcutaneous tissues and facial layers are markedly thickened and distorted along with anechoic fluid collec-tion measuring >4 mm in the deep fascial layers, necrotiz-ing fasciitis should be suspected. Detection of gas (acoustic shadowing and reverberation artifact) within the subcuta-neous tissues is considered pathognomonic of necrotizing infections (38).
Cervical lymphadenitisCervical lymphadenitis is a condition characterized by enlarged, inflamed, tender lymph nodes of the neck. There are several infectious and noninfectious causes of cervical lymphadenitis. Acute bilateral cervical lymphadenitis is most often caused by a benign, self-limited, viral upper respiratory infection. Acute unilateral cervical lymphadenitis occurs less frequently than acute bilateral cervical lymphadenitis and is usually caused by bacteria such as Staphylococcus aureus, and group A Streptococcus. Noninfectious causes of cervi-cal lymphadenopathy include malignancy, connective tissue disease, and drugs. The role of sonography in the assessment of cervical lymphadenopathy has been well established (36). Bedside ultrasound can be used as the first-line imaging tool in the bedside diagnostic evaluation of cervical lymphade-nopathy due to its ease, noninvasiveness, repeatability, and cost-effectiveness. One major indication for sonographic evaluation of cervical lymph node is to distinguish lymphad-enitis from an abscess since the treatment is very different. It is also useful in differentiating cervical lymphadenitis from other causes of swelling in the neck such as thyroglossal
FIGURE 24.22. Facial Cellulitis. 1, Hyperechogenicity; 2, Subcutaneous fluid collection; 3, Cobblestoning .
FIGURE 24.23. A: Grey scale image of an enlarged ovoid hypoechoic reactive lymph node and increased central hilar echogenicity . B: Doppler demonstrates hilar hypervascularity . (Courtesy of John Kendall, MD .)
A
B

chapter 24 / Infections of the Head and Neck 377
that high blood flow velocity is always associated with a lower vascular resistance (39).
Unlike a reactive lymph node, abscesses typically appear hypoechoic or anechoic on ultrasound. Abscesses can some-times appear echogenic. Echogenic debris may be seen inside the abscess cavity. Abscess cavity is compressible, and motion of purulent material can be elicited with com-pression. On color Doppler, no flow should be noted within the abscess cavity. Hyperemia may be seen surrounding the abscess cavity due to adjacent cellulitis (Fig. 24.24) (39).
Sonography is also very accurate in differentiating benign from malignant cervical lymph nodes. Sonographic features that help identify abnormal nodes include shape (round), heterogeneous echo texture, absent hilar structure, irregular borders, intranodal cystic necrosis, posterior enhancement, reticulation, calcification, matting, edema of soft tissue, irreg-ular Doppler flow, and peripheral vascularity (Fig. 24.25) (40).
Thyroglossal duct cystThyroglossal duct cyst (TDC) is the most common nonodon-togenic cyst in the neck, representing approximately 70% of the congenital neck abnormalities. The cyst is classically de-scribed as a lesion located on the anterior midline of the neck. However, it may be found lateral to the midline in 10% to 20% of cases. The cyst can fluctuate in size and is compressible.
Approximately 50% of patients present in the first decade of life with a painless midline mass or history of incision and drainage at the site for suspected abscess. TDC can oc-cur anywhere along the course of the duct remnant, from the
base of the tongue to the suprasternal region (1% to 2% are at the base of the tongue, 25% are suprahyoid, 60% are between the hyoid bone and the thyroid cartilage, and 13% to 14% are suprasternal). TDC can become infected, and definitive treatment of infected TDC includes both antibiotics, needle aspiration, and appropriate consultation. Bedside ultrasound can be extremely helpful in identifying an infected cyst and direct appropriate treatment (41,42).
Sonography is an ideal initial technique for differentiating TDC from other causes of a neck mass. The sonographic ap-pearance of TDC is variable. The typical sonographic appear-ance is an anechoic, well-circumscribed, unilocular cyst with thin walls and increased through transmission (Fig. 24.26;
VIDEO 24 .3). A thick wall and internal septa may sug-gest the presence of inflammation in the cyst. Repeated infec-tions or hemorrhage due to prior aspirations may lead to a heterogeneous appearance of the cyst (Fig. 24.27) (41,42). An echogenic pseudo-solid appearance is due to debris or protein-aceous content secreted by epithelial lining of the cyst. A het-erogeneous echo texture, along with intra-lesional vascularity, is suspicious for malignant transformation (39,41,42).
Cystic Hygroma 8PEDIATRIC CONSIDERATIONS Cystic hygroma is a congeni-tal lymphatic lesion usually present in the posterior triangle of the neck. In their native state they are soft nontender lesions. Although most often present at birth they can acutely increase in size secondary to infection or hemorrhage. Sonographically they appear as a cluster of hypoechoic cystic lesions with thick hyperechoic walls. Surgical treatment is curative.7
SialoadenitisAcute infection of the salivary glands can occur from viral or bacterial pathogens. The parotid gland is most frequently af-fected by acute suppurative sialoadenitis. The majority of sali-vary gland infections are viral in etiology (most often mumps). Bacterial infections usually occur as a result of retrograde passage of pathogens from salivary stasis from obstructing lesions such as stones, tumors, and strictures. The most com-mon bacteria causing sialoadenitis are Staphylococcus aureus
FIGURE 24.25. Lymph Node with Abnormal Shape and Heterogeneous Echotexture from Intranodal Necrosis. (Courtesy of Michael Blaivas, MD .)
FIGURE 24.24. A: Reactive lymph node with central hilar vascularity . B: Anechoic abscess with no central flow .
A
B

378 Section Viii / Problems of the Head and Neck
FIGURE 24.27. Infected Thyroglossal Duct Cyst. Note heterogeneous appearance with septae and debris within the cyst .
FIGURE 24.28. Enlarged Parotid Gland with Hypoechoic Parenchyma and Prominent Intraglandular Lymph Nodes. Appearance consistent with acute parotitis .
or Streptococcus viridans, but Streptococcus pneumoniae, Escherichia coli, and Hemophilus influenzae have also been isolated. Sialoadenitis in adults is associated with sialolithia-sis in approximately 50% of cases. The majority (80%) of salivary concretions occur in the submandibular gland or in Wharton duct, while 15% of cases occur in the parotid gland or in Stensen duct. The accuracy of sonography in the diag-nosis of sialolithiasis is approximately 90%. Abscess forma-tion can occur during acute sialoadenitis, which is difficult to detect on clinical examination. It usually presents as painful swelling of the salivary gland with erythema. The classic fluc-tuation sign may be absent in approximately 70% of cases. Bedside ultrasound can be extremely useful in detecting sialoadenitis and associated suppurative complications to pro-vide appropriate treatment. It can help identify sialolithiasis or ductal obstructions. Ultrasound guidance can also be used for needle aspiration or drainage of the abscess associated with bacterial parotitis (33,35).
Sonographically, the acutely inflamed salivary gland is usually diffusely enlarged and hypoechoic with increased blood flow (Figs. 24.28 and 24.29). Multiple small, oval,
hypoechoic areas may also be seen. The parenchyma may appear heterogeneous in echo texture due to micro abscesses, localized ductal dilatation, enlarged intraglandular lymph nodes, and retention cysts. Enlarged salivary ducts may be visualized. Increased vascularization of the gland is noted on Doppler. A hyperechoic calculus with posterior acoustic shadowing may also be seen. Pus and echogenic debris may be found at the Wharton duct ostium in the floor of the mouth. Salivary gland abscesses appear as hypoechoic or anechoic lesions with posterior acoustic enhancement and ill-defined borders. Central liquefaction may be identified as an avascu-lar area with intraglandular ducts passing through the lesion. Echogenic foci due to debris or microbubbles of gas may be seen within the abscess cavity. Adjacent enlarged cervical lymph nodes with increased central blood flow are noted. These may also liquefy to produce further abscesses (33,43).
FIGURE 24.26. A: Long axis image of well-circumscribed, anechoic, unilocular thyroglossal duct cyst . B: Short axis image of a well-defined, oval hypoechoic mass with through transmission in the suprahyoid neck midline . (Courtesy of Jim Tsung, MD .)
A B

chapter 24 / Infections of the Head and Neck 379
Lemierre syndromeLemierre syndrome is a rare but serious complication char-acterized by the spread of oropharyngeal infections into the lateral pharyngeal space followed by septic thrombophlebi-tis of the internal jugular vein, and metastatic infections to lungs, pleura, bone, joints, skin, and soft tissues from sep-tic emboli. If not diagnosed promptly and treated appropri-ately, patients may rapidly progress to a fatal outcome. CT of the neck is typically used for clinically suspected cases of Lemierre syndrome (44). A recent case report describes the use of bedside ultrasound in the rapid diagnosis of Lemierre syndrome in the ED (45). Sonographic findings suggestive of septic thrombophlebitis include noncompressible vein with an anechoic or echogenic thrombus in the lumen with sur-rounding inflammation or abscess (Fig. 24.30; VIDEO 24 .4A, B). Thickening of the vessel wall is also generally seen. Doppler imaging shows loss of venous response to re-spiratory maneuvers and absence of flow (45).
Artifacts and Pitfalls 1. A standoff pad or bag of saline may be useful to improve
image resolution when evaluating very superficial head and neck masses.
2. Use of probe covers can help reduce the risk of spread-ing infectious agents and is highly recommended if any discharge is noted from the swelling.
3. The contralateral side of the body should always be scanned for comparison to differentiate normal from abnormal tissue.
4. Neck anatomy can be better visualized by placing the patient in a supine position with the neck in mild hyperextension.
5. Abscesses can appear isoechoic to the surrounding tis-sues and be mistaken for cellulitis. Compressing the abscess cavity will induce movement of the isoechoic contents, confirming the presence of an abscess.
6. A necrotic lymph node should be considered in the dif-ferential diagnosis besides abscess if a hypoechoic area is seen on ultrasound.
FIGURE 24.30. B-Mode Image of Internal Jugular Vein. Shows concen-tric, echogenic material (thrombus) within the lumen of the vein as well as surrounding inflammation . (Courtesy of John Kendall, MD .)
7. Color or power Doppler sonography should be routinely used to detect vascularity within a swelling. This can help identify lymph nodes, which can be mistaken for fluid collections. Lymph nodes demonstrate strong color flow signals branching radially from the hilar region, while abscesses do not show any vascularity within the cavity. Additionally, compressing lymph nodes does not
FIGURE 24.29. A: B-mode image of an inflamed parenchyma of the submandibular gland, which appears hypoechoic and inhomogeneous . B: Hyperemia noted on Doppler .
A B

380 Section Viii / Problems of the Head and Neck
concomitant obstruction by sialolithiasis can also be evalu-ated by ultrasound. CT or MRI should be considered if sali-vary gland neoplasm is suspected, especially a deeply located tumor. These imaging modalities are superior to ultrasound in providing the details of tumor and adjacent tissue involvement.
CT and MRI are time consuming, expensive, and ex-pose the patient to ionizing radiation. Most of the time the information obtained from bedside ultrasound is adequate to properly manage the patient with suspected head and neck infections in the ED. Additionally, the accuracy of ultrasound is comparable to CT and MRI for several head and neck in-fections seen in the ED. In a study done by Bassiony et al. there was 100% agreement between ultrasound and MRI in the diagnosis of odontogenic superficial facial spaces infec-tions (31). Some studies have reported ultrasound being supe-rior to CT in the diagnosis of cutaneous abscess. Ultrasound in comparison to CT and MRI is relatively inexpensive and offers multiple other advantages. Ultrasound evaluations can frequently be made at the bedside in a rapid manner. There is no radiation exposure, no sedation risk, and no need for intravenous contrast. Images are obtained in real time that can be very helpful while performing procedures.
CLINICAL CASESCase 1A 15-year-old male presents to the ED with right-sided neck swelling. He noted the swelling approximately 1 week ago. It was initially painless; but it increased in size and became painful for 2 days prior to his presentation to the ED. He reports a low-grade fever, but denies sore throat or upper respiratory symptoms. There is no significant past medical history. Vital signs are within normal limits. On examination, there is a 3 × 2 cm tender erythematous swelling with some fluctuance in the anterior triangle of the neck. The remainder of the physical examination is normal. A subcutaneous abscess is suspected and incision and drainage planned. Bedside ultrasound is performed for procedural guidance. Ultrasound reveals an enlarged necrotic hypoechoic cer-vical lymph node. The shape of the lymph node is altered with loss of nodal architecture and absent echogenic hilum (Fig. 24.31A). Peripheral vascularity is noted (Fig. 24.31B). Three other smaller necrotic lymph nodes were found on both sides of the neck. Malignancy was suspected. The pa-tient is admitted for further evaluation. The patient is diag-nosed with lymphoma and chemotherapy planned.
Case 2An 18-year-old female presents to ED with sore throat of 3 days’ duration. She reports difficulty opening her mouth and pain during swallowing. She had similar symptoms in the past for which she was treated with antibiotics. She has no hoarseness or neck stiffness. She denies upper respiratory symptoms. She developed fever on the day she presented to ED. She also feels weak and dizzy. She reports no other sig-nificant past medical history. Her vital signs are significant for fever (101 degrees) and tachycardia (120/min). She is ill-appearing. HEENT examination revealed trismus, ery-thematous pharynx, and a swollen right tonsil with exudates. There is also mild anterior bulging of soft palate on the right side with no uvular shift. The rest of her physical examination does not reveal any significant abnormalities. Intravenous
result in the typical swirling motion of contents that is often seen with abscesses. Doppler will also help detect adjacent vascular structures prior to performing any pro-cedures (46,47).
8. Doppler can also help distinguish between salivary gland ducts and vasculature within the gland.
9. Doppler settings should be optimized for detecting small vessels in the head and neck swellings (high sensitiv-ity, low wall filter, pulsed repetition frequency (PRF) 700 Hz, medium persistence). The color Doppler gain should be initially increased to show color noise and then decreased to the level where the noise just disappears.
10. Attention should be paid to the tail of the parotid gland while obtaining long axis views since it may be obscured by the ramus of mandible.
11. A retained foreign body may be seen in the abscess cav-ity. The echogenicity is dependent on the composition of foreign body.
Use of the Image in Clinical Decision MakingIt is important to recognize the limitations of clinical examination in the assessment of patients with head and neck infections. Head and neck ultrasound can guide treatment and disposition decisions in the ED. If ultrasound findings are suggestive of cellulitis and the patient has no systemic symptoms, the patient can be discharged with antibiotics. If the patient appears systemically ill and a large amount of perifascial fluid is noted, further testing should be done to rule out necrotizing infections. If a localized subcutaneous abscess is detected on ultrasound, an incision and drainage should be performed in the ED. Ultrasound guidance can be used for incision and drainage and also to confirm that abscess cavity is completely evacuated. If a deep space neck infection is suspected based on ultrasound findings, other imaging modalities such as CT or MRI should be ordered. Immediate consultation should be obtained for complicated abscesses and other conditions such as suppurative sialodeni-tis or suppurative thyroiditis. Arrangements should be made for appropriate follow-up with consultants for patients with congenital abnormalities or suspicion for malignancy.
Correlation with Other Imaging ModalitiesOther potential head and neck imaging modalities used in the ED include conventional radiographs, CT, and MRI. Con-ventional radiographs are not routinely used to assess neck swelling to diagnose an abscess, salivary gland, or lymph node pathology. X-rays are useful in detecting subcutaneous gas, although ultrasound is more sensitive. CT and MRI are superior to ultrasound in the diagnosis of deep space infec-tions. Ultrasound also cannot assess retropharyngeal lymph nodes. CT and MRI can provide better detail of deeper and smaller cervical lymph nodes that may not be obvious on ultrasound. They are also superior to ultrasound in identify-ing intranodal necrosis (CT, 91%, MRI, 93%; Ultrasound, 77%) (48). Unlike CT and MRI, ultrasound cannot accu-rately identify local invasion of metastatic lymph nodes into adjacent neck structures including vessels, nerves, and bone. Once malignancy is suspected, a CT or MRI study should be considered.
In most clinical situations, ultrasound is considered the first-line imaging modality in the evaluation of the major salivary glands. In inflammation and infection,

chapter 24 / Infections of the Head and Neck 381
5. Piccirillo JF, Mager DE, Frisse ME, et al. Impact of first-line vs second-line antibiotics for the treatment of acute uncomplicated sinusitis. JAMA. 2001;286(15):1849–1856.
6. Laine K, Maatta T, Varonen H, et al. Diagnosing acute maxillary sinus-itis in primary care: a comparison of ultrasound, clinical examination and radiography. Rhinology. 1998;36(1):2–6.
7. Varonen H, Makela M, Savolainen S, et al. Comparison of ultra-sound, radiography, and clinical examination in the diagnosis of acute maxillary sinusitis: a systematic review. J Clin Epidemiol. 2000; 53(9):940–948.
8. Price D, Park R, Frazee B, et al. Emergency department ultra-sound for the diagnosis of maxillary sinus fluid. Acad Emerg Med. 2006;13(3):363–364.
9. Butcher C. Ultrasound evaluation of the neck and upper respiratory sys-tem. In: Levitov A, Mayo P, Slonim A, eds. Critical Care Sonography. 1st ed. China: McGraw-Hill; 2009.
10. Lichtenstein D, Biderman P, Meziere G, et al. The “sinusogram”, a real-time ultrasound sign of maxillary sinusitis. Intens Care Med. 1998;24(10):1057–1061.
11. Puhakka T, Heikkinen T, Makela MJ, et al. Validity of ultrasonography in diagnosis of acute maxillary sinusitis. Arch Otolaryngol Head Neck Surg. 2000;126(12):1482–1486.
12. Reider JM, Nashelsky J, Neher J. Clinical inquiries. Do imaging studies aid diagnosis of acute sinusitis? J Fam Pract. 2003;52(7):565–567.
13. Jones NS. CT of the paranasal sinuses: a review of the correlation with clinical, surgical and histopathological findings. Clin Otolaryngol Allied Sci. 2002;27(1):11–17.
14. Varonen H, Savolainen S, Kunnamo I, et al. Acute rhinosinusitis in pri-mary care: a comparison of symptoms, signs, ultrasound, and radiogra-phy. Rhinology. 2003;41(1):37–43.
15. Schappert SM, Rechtsteiner EA. Ambulatory medical care utilization estimates for 2006. Natl Health Stat Report. 2008;8:1–29.
16. Johnson RF, Stewart MG. The contemporary approach to diagnosis and management of peritonsillar abscess. Curr Opin Otolaryngol Head Neck Surg. 2005;13(3):157–160.
17. Buckley AR, Moss EH, Blokmanis A. Diagnosis of peritonsillar abscess: value of intraoral sonography. Am J Roentgenol. 1994;162(4):961–964.
18. Costantino TG, Satz WA, Dehnkamp W, et al. Randomized trial comparing intraoral ultrasound to landmark-based needle aspiration in patients with suspected peritonsillar abscess. Acad Emerg Med. 2012;19(6):626–631.
19. Powell J, Wilson JA. An evidence-based review of peritonsillar abscess. Clin Otolaryngol. 2012;37(2):136–145.
20. Blaivas M, Theodoro D, Duggal S. Ultrasound-guided drainage of peritonsillar abscess by the emergency physician. Am J Emerg Med. 2003;21:155–158.
21. Scott PM, Loftus WK, Kew J, et al. Diagnosis of peritonsillar infec-tions: a prospective study of ultrasound, computerized tomography and clinical diagnosis. J Laryngol Otol. 1999;113:229–232.
22. Araujo Filho BC, Sakae FA, Sennes LU, et al. Intraoral and trans-cutaneous cervical ultrasound in the differential diagnosis of peritonsillar cellulitis and abscesses. Braz J Otorhinolaryngol. 2006;72(3):377–381.
access is obtained. The patient is given analgesics, intrave-nous fluids, and antibiotics. Differential diagnosis includes tonsillitis, peritonsillar cellulitis, and peritonsillar abscess. Aspiration is recommended for possible peritonsillar ab-scess, but she is reluctant to undergo the procedure due to uncertainty in the diagnosis. A bedside intraoral ultrasound was performed, which revealed hypoechoic complex fluid collection within the tonsillar tissue, suggesting peritonsil-lar abscess (Fig. 24.32). The patient agrees to the procedure based on ultrasound findings. Aspiration of the peritonsil-lar abscess is performed. The patient’s symptoms improve significantly after the aspiration, and she is discharged with oral antibiotics.
REFERENCES 1. Mallorie CN, Jones SD, Drage NA, et al. The reliability of high resolu-
tion ultrasound in the identification of pus collections in head and neck swellings. Int J Oral Maxillofac Surg. 2012;41(2):252–255.
2. Adeyemo WL, Ogunlewe MO, Ladeinde AL. Ultrasound as a diagnostic aid in head and neck lesions. Niger Postgrad Med J. 2006;13(2):147–152.
3. Lyon M, Blaivas M. Intraoral ultrasound in the diagnosis and treatment of suspected peritonsillar abscess in the emergency department. Acad Emerg Med. 2005;12:85–88.
4. Rosenfeld RM, Andes D, Bhattacharyya N, et al. Clinical practice guide-line: adult sinusitis. Otolaryngol Head Neck Surg. 2007;137:365–377.
FIGURE 24.32. Peritonsillar Abscess . Complex hypoechoic fluid collec-tion within the tonsillar tissue . (Courtesy of Michael Blaivas, MD .)
FIGURE 24.31. A: Enlarged cervical lymph node with loss of nodal architecture and absent echogenic hilum . B: Doppler revealing peripheral vascularity .
AB

382 Section Viii / Problems of the Head and Neck
35. Alyas F, Lewis K, Williams M, et al. Diseases of the submandibular gland as demonstrated using high resolution ultrasound. Br J Radiol. 2005;78(928):362–369.
36. Ying M, Ahuja A. Sonography of neck lymph nodes. Part I: normal lymph nodes. Clin Radiol. 2003;58(5):351–358.
37. Loyer EM, DuBrow RA, et al. Imaging of superficial soft-tissue infections: sonographic findings in cases of cellulitis and abscess. Am J Roentgenol. 1996;166(1):149–152.
38. Yen ZS, Wang HP, Ma HM, et al. Ultrasonographic screening of clinically-suspected necrotizing fasciitis. Acad Emerg Med. 2002;9(12):1448–1451.
39. Gritzmann N, Hollerweger A, Macheiner P, et al. Sonography of soft tissue masses of the neck. J Clin Ultrasound. 2002;30(6):356–373.
40. Ahuja A, Ying M. Grey-scale sonography in assessment of cervical lymphadenopathy: review of sonographic appearances and features that may help a beginner. Br J Oral Maxillofac Surg. 2000;38(5):451–459.
41. Kutuya N, Kurosaki Y. Sonographic assessment of thyroglossal duct cysts in children. J Ultrasound Med. 2008;27(8):1211–1219.
42. Wadsworth DT, Siegel MJ. Thyroglossal duct cysts: variability of sono-graphic findings. Am J Roentgenol. 1994;163(6):1475–1477.
43. Katz P, Hartl DM, Guerre A. Clinical ultrasound of the salivary glands. Otolaryngol Clin North Am. 2009;42(6):973–1000.
44. Wright WF, Shiner CN, Ribes JA. Lemierre syndrome. South Med J. 2012;105(5):283–288.
45. Castro-Marín F, Kendall JL. Diagnosis of Lemierre syndrome by bedside emergency department ultrasound. J Emerg Med. 2010;39(4):436–439.
46. Ahuja AT, Ying M. Sonographic evaluation of cervical lymph nodes. Am J Roentgenol. 2005;184(5):1691–1699.
47. Chan JM, Shin LK, Jeffrey RB. Ultrasonography of abnormal neck lymph nodes. Ultrasound Q. 2007;23(1):47–54.
48. Richards PS, Peacock TE. The role of ultrasound in the detection of cer-vical lymph node metastases in clinically N0 squamous cell carcinoma of the head and neck. Cancer Imaging. 2007;7:167–178.
23. Haeggstrom A, Gustafsson O, Engquist S, et al. Intraoral ultrasonog-raphy in the diagnosis of peritonsillar abscess. Arch Otolaryngol Head Neck Surg. 1993;108:243–247.
24. O’Brien E, Valley VT, Summers RL. Intraoral sonography of peritonsil-lar abscesses: feasibility and sonographic appearance. Ann Emerg Med. 1999;34:S26.
25. Kew J, Ahuja A, Loftus WK, et al. Peritonsillar abscess appearance on intra-oral ultrasonography. Clin Radiol. 1998;53:143–146.
26. Baurmash HD. Ultrasonography in the diagnosis and treatment of facial abscesses. J Oral Maxillofac Surg. 1999;57(5):635–636.
27. Peleg M, Heyman Z, Ardekian L, et al. The use of ultrasonography as a diagnostic tool for superficial fascial space infections. J Oral Maxillofac Surg. 1998;56(10):1129–1131.
28. Quraishi MS, O’Halpin DR, Blayney AW. Ultrasonography in the evaluation of neck abscesses in children. Clin Otolaryngol Allied Sci. 1997;22(1):30–33.
29. Gaspari RJ. Bedside ultrasound of the soft tissue of the face: a case of early Ludwig’s angina. J Emerg Med. 2006;31(3):287–291.
30. Adhikari S, Blaivas M, Lander L. Comparison of bedside ultrasound and panorex radiography in the diagnosis of a dental abscess in the ED. Am J Emerg Med. 2011;29(7):790–795.
31. Bassiony M, Yang J, Abdel-Monem TM, et al. Exploration of ultra-sonography in assessment of fascial space spread of odontogenic infections. Oral Surg Oral Med Oral Pathol Oral Radiol Endod. 2009;107(6):861–869.
32. Srinivas K, Sumanth KN, Chopra SS. Ultrasonographic evalua-tion of inflammatory swellings of buccal space. Indian J Dent Res. 2009;20(4):458–462.
33. Bialek EJ, Jakubowski W, Zajkowski P, et al. US of the major salivary glands: anatomy and spatial relationships, pathologic conditions, and pitfalls. Radiographics. 2006;26(3):745–763.
34. Katz P, Hartl DM, Guerre A. Clinical ultrasound of the salivary glands. Otolaryngol Clin North Am. 2009;42(6):973–1000.

383
Srikar Adhikari
Head and Neck Procedures25
INTRODUCTION . . . . . . . . . . . . . . . . . . . . . . . . . . . . . . . . . . 383ASPIRATION OF PERITONSILLAR ABSCESSES . . . . . . . . . . 383
Clinical Indications . . . . . . . . . . . . . . . . . . . . . . . . . . . 383Procedure . . . . . . . . . . . . . . . . . . . . . . . . . . . . . . . . . . 383Pitfalls and Complications . . . . . . . . . . . . . . . . . . . . . . 385
INCISION AND DRAINAGE OF HEAD AND NECK ABSCESSES . . . . . . . . . . . . . . . . . . . . . . . . . 385Clinical Indications . . . . . . . . . . . . . . . . . . . . . . . . . . . 385Procedure . . . . . . . . . . . . . . . . . . . . . . . . . . . . . . . . . . 385Pitfalls and Complications . . . . . . . . . . . . . . . . . . . . . . 386
INTRODUCTIONHead and neck procedures are frequently performed in the emergency department (ED). Traditionally, surface anatomi-cal landmarks have been used by physicians to determine the accurate approach to performing these procedures. As a result, there was considerable variation in both success and complication rates. In recent years, ultrasound is increas-ingly being used at the bedside by clinicians. Ultrasound can be extremely useful in facilitating various head and neck procedures in the ED. The use of ultrasound guidance can potentially decrease complications and improve patient safety. A thorough understanding of the basic principles of ultrasound, sonographic anatomy, and hand– eye-coordination skills is crucial to use ultrasound for procedural guidance.
ASPIRATION OF PERITONSILLAR ABSCESSESClinical IndicationsSuccessful drainage of a suspected peritonsillar abscess can present a significant challenge. Unlike cutaneous abscesses, the anatomic location of a peritonsillar abscess is not as ac-cessible as the skin for aspiration. Additionally, the proxim-ity of vascular structures makes needle aspiration potentially more complicated. Complications with blind needle aspira-tion include injury to the carotid arteries, jugular veins, or parotid gland. Additionally, blind needle aspiration of the peritonsillar region has a reported false-negative rate of 10% to 12% (1). Bedside intraoral ultrasound has been shown to be useful to differentiate peritonsillar abscess from cellulitis, lo-calize the abscess, and perform an aspiration. Ultrasound thus avoids discomfort from a dry tap. The superiority of ultra-sound-guided aspiration over the landmark approach has been well documented in the literature (2–4). The ability of ultra-sound to define the margins of the tonsils, their relationship to
adjacent vascular structures, and provide real-time guidance to insert the needle makes the procedure very safe.
ProcedureThe technique used to perform the aspiration is similar to ultrasound-guided vascular procedures. The only difference is that a high-frequency (5–10 MHz) curved array endocavity probe is used to guide the aspiration of peritonsillar abscess because its shape allows placement in the posterior pharyn-geal space. The procedure is typically performed freehand, but a needle guide can be attached to the endocavity trans-ducer to perform the aspiration. However, it adds significant costs to the procedure and also limits the distance the needle can be inserted into the oropharynx. The manual dexterity needed to manipulate the endocavity probe while perform-ing aspiration requires some practice. Generally, the proce-dure is performed by one operator, holding the probe with one hand and performing the aspiration with the other hand, while making appropriate adjustments of the probe to visu-alize the needle. Prior studies have clearly demonstrated the ability of the emergency physicians to effectively use bedside ultrasound for both the diagnosis of peritonsillar abscess and real-time guidance for needle aspiration (3–5).
Adequate systemic analgesia should be given to the pa-tient prior to performing the procedure. Topical anesthetic should be sprayed into the posterior pharyngeal area to avoid gagging and overcome trismus. After placing gel over the tip of the endocavity probe, it should be covered with a sheath or condom. The endocavity probe is then inserted into the oral cavity and advanced into the pharyngeal region. The periton-sillar area is scanned systematically in both long and short axes. The presence of the peritonsillar abscess should be con-firmed, which can have variable appearances on ultrasound. Often, a peritonsillar abscess is visualized as a hypoechoic or complex cystic mass, typical of most abscesses (Fig. 25.1). The depth of the abscess cavity from the mucosal surface

384 Section Viii / Problems of the Head and Neck
FIGURE 25.1. B-Mode Image of a Peritonsillar Abscess Obtained with an Endocavity Probe . Note the abscess cavity with hypoechoic fluid collection (F ) in the near field and anechoic carotid artery (arrow) posterolateral to the abscess cavity in the far field . (Courtesy of Michael Blaivas, MD .)
FIGURE 25.2. Sheathed Endocavity Transducer Inserted Orally after Spraying Topical Anesthesia to the Posterior Pharynx . A syringe with an 18-gauge needle is inserted next to the transducer to perform ultrasound-guided aspiration of a peritonsillar abscess .
FIGURE 25.3. A Hyperechoic Needle (Arrows) Entering into the Abscess Cavity. (Courtesy of Michael Blaivas, MD .)
FIGURE 25.4. Reduction in the Size of the Abscess Cavity Seen After Aspi ration (Arrow ). (Courtesy of Michael Blaivas, MD .)
should be noted, and the length of the needle required to enter the abscess cavity should be determined prior to aspi-ration. The carotid artery and its relationship to the abscess cavity should be assessed. It is visualized as an anechoic tu-bular structure along the posterolateral aspect of the tonsil, generally within 5 to 25 mm of an abscess cavity (Fig. 25.1). Color Doppler can help identify the carotid artery. The rela-tionship of the tonsillar tissue, abscess cavity, and carotid ar-tery is best assessed in transverse axis. The transducer should be held horizontally, and the fluid collection should be lo-calized. Once the abscess is localized, an 18-gauge 2-inch needle attached to a 5- to 10-mL syringe is inserted lateral to the tip of the transducer (Fig. 25.2). Alternatively, a 14-gauge needle can be used if purulent material appears too thick. The needle should be placed in the middle of the tip of the trans-ducer, exactly in the same plane as the ultrasound signal. As with vascular access procedures, real-time guidance should be used. The same principles should be employed to track the entire course of the needle. The needle should be advanced slowly under direct visualization with ultrasound. If the needle tip is not seen at any point, no further advancement
FIGURE 25.5. Saline Injection into the Abscess Cavity Being Performed to Break Up Loculations (Arrow ). (Courtesy of Michael Blaivas, MD .)
should be made. Once the needle penetrates the abscess cav-ity, aspiration should be performed under real-time guidance (Fig. 25.3). Reduction in the size of the abscess cavity should be seen on ultrasound (Fig. 25.4). Occasionally, saline injec-tion into the abscess cavity might be necessary to break up the loculations and facilitate aspiration (Fig. 25.5).

chapter 25 / Head and Neck Procedures 385
ProcedureThe patient should be positioned appropriately to expose the area of interest. The head should be turned to the opposite side and the neck extended to provide better access for per-forming the procedure. A high-frequency linear array probe is typically used to confirm the presence of an abscess. The abscess cavity is scanned in at least two orthogonal planes, typically the sagittal and transverse planes. The contralateral side or adjacent area should be always scanned for compari-son. The anechoic fluid collection should be assessed for internal echoes, septations, and posterior acoustic enhance-ment (Fig. 25.6). The boundaries of the abscess cavity and associated surface landmarks should be noted. The depth from the skin surface to the abscess cavity should be noted. Gentle pressure should be applied to assess the compressibil-ity and visualize movement of the contents of abscess cavity. Attention should be paid to locate neurovascular structures. The facial nerve and facial artery should be avoided while draining facial abscesses adjacent to salivary glands. Power Doppler should be used to identify adjacent blood vessels. Lack of vascularity within the abscess cavity should be confirmed (Fig. 25.7). While draining neck abscesses, care should be taken to avoid the thyroid, trachea, and adjacent
Pitfalls and Complications 1. Failure to distinguish peritonsillar cellulitis from
peritonsillar abscess sonographically can result in a dry tap.
2. Failure to visualize the carotid artery prior to the pro-cedure is one of the major pitfalls. The relationship of the carotid artery to the abscess cavity must be noted prior to the procedure to avoid any injury while perform-ing aspiration. Color Doppler can be used to locate the carotid artery.
3. If the depth of the abscess cavity is not assessed prior to aspiration, the operator may fail to choose the needle with correct length.
4. An uncooperative patient can make this procedure very difficult. Adequate systemic analgesia should be provided in addition to the use of topical anesthetic spray.
5. The operator should be familiar with principles of nee-dle tracking with ultrasound. Losing track of the needle tip while advancing the needle can lead to inadvertent puncture of vessels and other adjacent structures. If the needle tip is not seen, the probe should be manipulated to locate it and redirect the needle toward the abscess cavity.
INCISION AND DRAINAGE OF HEAD AND NECK ABSCESSESClinical IndicationsPatients with head and neck swellings are frequently seen in the ED. The most common etiologies of head and neck swellings include cellulitis, abscesses, cysts, lymphadenitis, and salivary gland pathology. Clinical examination is unreli-able in differentiating these clinical entities. Prompt identi-fication of an abscess is necessary for efficient and timely procedural intervention. Ultrasound has been shown to be a valuable tool in the diagnosis of superficial facial and neck abscesses. The sensitivity and specificity of ultrasound for identifying fluid collections in head and neck swellings is very high (>90%) (6). The use of ultrasound as a diagnostic tool prevents unnecessary painful procedures in those who do not have drainable fluid collections. Additionally, blind incision and drainage of abscesses based on physical exami-nation may result in unnecessary extensive incisions, injury to adjacent neurovascular structures, excessive soft tissue injury, excessive pain, and failure to locate and evacuate the abscess cavity. Ultrasound can greatly assist in localizing the abscess cavity and defining its extent. Ultrasound can also provide real-time guidance to incision and drainage and reduce potential complications including injury to the ad-jacent neurovascular structures. Ultrasound use can ensure complete evacuation of abscess cavity and reduce repeat ED visits from inadequate drainage. The utility of ultrasound guidance to perform incision and drainage of facial and neck abscesses has been well documented in the literature (7–9). Al-Belasy demonstrated the use of ultrasound in draining submasseteric space abscesses (10). Abbasi et al. used ultra-sound guidance for simultaneous irrigation and drainage of facial abscesses (11). Sivarajasingam et al. used ultrasound guidance for needle aspiration of lateral masticator space abscess (12).
FIGURE 25.6. B-Mode Image of a Neck Abscess. Complex fluid collec-tion with internal echoes and posterior acoustic enhancement .
FIGURE 25.7. Doppler Showing Hypervascularity Surrounding the Abscess but No Flow within the Abscess Cavity.

386 Section Viii / Problems of the Head and Neck
vessels. Attention should be paid to not mistake lymphadeni-tis for abscess, which is generally oval in shape, has an echo-genic hilum, with vascularity extending from the hilar region and no change in the contents with compression (Fig. 25.8). To perform incision and drainage using a static approach, the area where the incision is planned should be marked, ideally at the most superficial portion of the fluid collection. The area should be disinfected and anesthetized prior to incision. An incision should be made with a scalpel at the marked site followed by blunt dissection of septations or locations. Purulent material should be expressed from the incision site. After evacuation of the abscess cavity, the ultrasound should be repeated to confirm complete drainage. To use real-time guidance for the procedure, the ultrasound probe should be placed on the abscess site and the scalpel introduced in line with and parallel to the transducer (ultrasound beam) (Fig. 25.9). The incision is made under ultrasound guidance, and septations can be dissected under direct visualization (Fig. 25.10). The area should be re-imaged to ensure com-plete drainage. Odontogenic abscesses are generally drained by making an intraoral incision. Transcutaneous ultrasound can still help to locate the intraoral abscess cavity and guide the incision (Fig. 25.11). Ultrasound can also assist with needle aspiration of abscesses, and help confirm when an adequate drainage has occurred. In the ultrasound-guided
FIGURE 25.8. B-Mode Image of an Oval Hypoechoic Lymph Node with Vasculature Extending from the Hilum.
FIGURE 25.9. Probe Positioning for Real-Time Ultrasound-Guided Inci-sion and Drainage.
FIGURE 25.10. Real-Time Ultrasound Guidance Used for Incision and Drainage. Hemostat jaws seen in the near field dissecting septations (arrow) .
FIGURE 25.11. Transcutaneous Image of a Dental Abscess Obtained by Placing the Probe in the Maxillary Region. Note anechoic fluid collection which required aspiration .
needle aspiration technique, the needle is typically inserted in the long-axis approach, where the needle is seen in en-tirety while performing the procedure. This technique is par-ticularly helpful in draining pediatric abscesses and dental abscesses.
Pitfalls and Complications 1. The most significant complication associated with this
procedure is injury to adjacent neurovascular structures. Doppler imaging should be used to identify vascular structures prior to performing the procedure. The inci-sion site should be selected away from the neurovascular structures.
2. Failure to identify isoechoic purulent material can result in misdiagnosis and delayed treatment.
3. Incomplete evacuation of an abscess cavity can lead to lack of improvement in the patient’s condition and re-turn visits to ED. Ultrasound should be repeated after incision and drainage to confirm complete drainage of the purulent material.
4. Care should be taken not to misinterpret a necrotic lymph node or lymphadenitis as an abscess and perform

chapter 25 / Head and Neck Procedures 387
5. Lyon M, Glisson P, Blaivas M. Bilateral peritonsillar abscess diagnosed on the basis of intraoral sonography. J Ultrasound Med. 2003;22(9):993–996.
6. Mallorie CN, Jones SD, Drage NA, et al. The reliability of high resolu-tion ultrasound in the identification of pus collections in head and neck swellings. Int J Oral Maxillofac Surg. 2012;41(2):252–255.
7. Yusa H, Yoshida H, Ueno E, et al. Ultrasound-guided surgical drainage of face and neck abscesses. Int J Oral Maxillofac Surg. 2002;31(3):327–329.
8. Baurmash HD. Ultrasonography in the diagnosis and treatment of facial abscesses. J Oral Maxillofac Surg. 1999;57(5):635–636.
9. Chang KP, Chen YL, Hao SP, et al. Ultrasound-guided closed drain-age for abscesses of the head and neck. Otolaryngol Head Neck Surg. 2005;132(1):119–124.
10. Al-Belasy FA. Ultrasound-guided drainage of submasseteric space abscesses. J Oral Maxillofac Surg. 2005;63(1):36–41.
11. Abbasi M, Bayat M, Beshkar M, et al. Ultrasound-guided simulta-neous irrigation and drainage of facial abscess. J Craniofac Surg. 2012;23(2):558–559.
12. Sivarajasingam V, Sharma V, Crean SJ, et al. Ultrasound-guided needle aspiration of lateral masticator space abscess. Oral Surg Oral Med Oral Pathol Oral Radiol Endod. 1999;88(5):616–619.
incision and drainage. Doppler can assist in differentiat-ing lymph node from an abscess.
5. Appropriate follow-up should be arranged after draining infected congenital cysts for definitive treatment.
REFERENCES 1. Kew J, Ahuja A, Loftus WK, et al. Peritonsillar abscess appearance on
intra-oral ultrasonography. Clin Radiol. 1998;53(2):143–146. 2. Costantino TG, Satz WA, Dehnkamp W, et al. Randomized trial
comparing intraoral ultrasound to landmark-based needle aspiration in patients with suspected peritonsillar abscess. Acad Emerg Med. 2012;19(6):626–631.
3. Blaivas M, Theodoro D, Duggal S. Ultrasound-guided drainage of peritonsillar abscess by the emergency physician. Am J Emerg Med. 2003;21:155–158.
4. Lyon M, Blaivas M. Intraoral ultrasound in the diagnosis and treatment of suspected peritonsillar abscess in the emergency department. Acad Emerg Med. 2005;12:85–88.

388
Russ Horowitz
General Pediatric Problems26
INTRODUCTION . . . . . . . . . . . . . . . . . . . . . . . . . . . . . . . . . . 388HYDRATION STATUS . . . . . . . . . . . . . . . . . . . . . . . . . . . . . . 389
Introduction . . . . . . . . . . . . . . . . . . . . . . . . . . . . . . . . 389Image Acquisition . . . . . . . . . . . . . . . . . . . . . . . . . . . . 389Use of the Image in Clinical Decision Making . . . . . . . 389
BLADDER . . . . . . . . . . . . . . . . . . . . . . . . . . . . . . . . . . . . . . . 389Introduction . . . . . . . . . . . . . . . . . . . . . . . . . . . . . . . . 389Image Acquisition . . . . . . . . . . . . . . . . . . . . . . . . . . . . 389Use of the Image in Clinical
Decision Making . . . . . . . . . . . . . . . . . . . . . . . . . . . 389LIMP . . . . . . . . . . . . . . . . . . . . . . . . . . . . . . . . . . . . . . . . . . 390
Introduction . . . . . . . . . . . . . . . . . . . . . . . . . . . . . . . . 390 Image Acquisition . . . . . . . . . . . . . . . . . . . . . . . . . . . . 390Pathology . . . . . . . . . . . . . . . . . . . . . . . . . . . . . . . . . . 390Use of the Image in Clinical Decision Making . . . . . . . 390
NONACCIDENTAL TRAUMA . . . . . . . . . . . . . . . . . . . . . . . . . 391Introduction . . . . . . . . . . . . . . . . . . . . . . . . . . . . . . . . 391Image Acquisition . . . . . . . . . . . . . . . . . . . . . . . . . . . . 391Pathology . . . . . . . . . . . . . . . . . . . . . . . . . . . . . . . . . . 391Use of the Image in Clinical Decision Making . . . . . . . 391
HEAD INJURY . . . . . . . . . . . . . . . . . . . . . . . . . . . . . . . . . . . 391Introduction . . . . . . . . . . . . . . . . . . . . . . . . . . . . . . . . 391Image Acquisition . . . . . . . . . . . . . . . . . . . . . . . . . . . . 391Pathology . . . . . . . . . . . . . . . . . . . . . . . . . . . . . . . . . . 391Use of the Image in Clinical Decision Making . . . . . . . 391
LUNG ULTRASOUND . . . . . . . . . . . . . . . . . . . . . . . . . . . . . . . 391Introduction . . . . . . . . . . . . . . . . . . . . . . . . . . . . . . . . 391Image Acquisition . . . . . . . . . . . . . . . . . . . . . . . . . . . . 392Pathology . . . . . . . . . . . . . . . . . . . . . . . . . . . . . . . . . . 392
LIMITATIONS AND PITFALLS . . . . . . . . . . . . . . . . . . . . . . . . 392
INTRODUCTIONUltrasound is an extremely useful tool in the emergency eval-uation and management of children. The preceding chapters in this book have addressed imaging principles, anatomy, and pathology for a general population. Although this con-tent is largely useful for children as well, sometimes rela-tively minor alterations in technique, variations in anatomy, and different applications are important to note for children; we have highlighted these differences throughout the text. Some pediatric content differs enough that it merits more discussion. The next three chapters focus on content specific to pediatrics. Chapter 26 reviews basic principles of imag-ing in children, and content particularly relevant to children, including assessment of hydration, estimation of bladder vol-ume, workup of limp in children (septic hip, transient syno-vitis), head injury, nonaccidental trauma, and bronchiolitis. Chapter 27 reviews abdominal applications for ultrasound in children, including appendicitis, pyloric stenosis, intus-susception, and malrotation. Lastly, Chapter 28 devotes a separate section on ultrasound guidance for procedures com-monly performed in a pediatric emergency department (ED).
There are a number of reasons why sonography is par-ticularly attractive in children, most notably its absence of ionizing radiation. Children have increased sensitivity to the
malignancy-related effects of ionizing radiation and long ex-pected life spans, which allows more time for the appearance of the detrimental effects (1,2). Utilization of ultrasound re-duces reliance on radiographs and computerized tomography (CT) scanning and their associated radiation risks. Children often are unable to remain perfectly still, are uncooperative, and are unable to suspend respiration. Ultrasound allows rapid bedside evaluation of pediatric patients. This reduces time in the stressful environment of the ED and permits ra-diographic evaluation without the need for sedation.
Children are uniquely suited for ultrasound imaging. Adi-pose tissue degrades sonographic images, and generally chil-dren have less subcutaneous and intra-abdominal body fat. In adults, one is often forced to choose between penetrance and resolution. However, with their relatively small size, excel-lent imaging can be accomplished in pediatric patients using higher frequency and high resolution transducers.
The use of point of care ultrasound in the evaluation of pediatric patients in the ED is a new and evolving practice. Assessment has been useful in identifying conditions, nar-rowing the differential diagnosis, and expediting care. This is true for both traditional applications as well as novel “ pediatric” ones including appendicitis, intussusception, pyloric stenosis, fractures unique to children, hip effusions, and nonaccidental trauma.

Chapter 26 / General Pediatric Problems 389
Although there are some subtle details that improve image acquisition in pediatrics, the general techniques are very similar. Differences however lie in the approach to the pedi-atric patient, the diagnostic questions that are asked, and the significance of findings.
The dynamic nature of sonography permits positioning of children to maximize their comfort and reduce anxiety. A creative approach to imaging children will go a long way toward increasing cooperation. A brief introduction to the machine will reduce their anxiety. Take advantage of their inquisitive nature and allow them to handle the probe (aka “camera on a string”) to prove it is not a needle and does not hurt. Position the screen (aka “TV”) or additional monitor if available so it is visible to the child and parent.
The examination can be performed with the child in the calming arms of the parents, improving cooperation. The use of distraction techniques (videos and music) and Child Life Specialists is useful to alleviate stress. Although these techniques may increase the time on the front end, they can reduce the overall scanning time and increase child coop-eration and both child and parent satisfaction. Gel heated in commercially available warmers reduces discomfort and pro-vides a warm, calming experience.
In adults, one must sacrifice improved resolution for in-creased depth, but that may not be the case in young children. Even intra-abdominal organs may be well visualized with a high-frequency probe. Because of unique pediatric anatomy, probe location must be adjusted for image optimization. A large curvilinear probe may simply not fit in the subxyphoid space of a toddler, so probe placement or selection must be adjusted.
The very same sonographic diagnosis in adults and children may have dramatically different implications. For example, cholelithiasis is a common and not unexpected finding in adults with right upper quadrant pain. In the ab-sence of cholecystitis, no extensive workup is necessary. However, in a child, even a small uncomplicated biliary stone is unusual and warrants an extensive search for under-lying diseases. A small amount of free fluid in the pelvis of a 25-year-old woman is physiologic, but that same amount in a 6-month-old with vomiting is never normal and necessitates an investigation for nonaccidental trauma.
Even in circumstances where traditional studies must be done by the radiology department, bedside studies will assist with prioritization of patients and mobilization of resources. For example, intussusception diagnosed with point of care sonography would expedite the reduction enema or, if not available at one facility, will expedite transfer to a facility with appropriate resources.
HYDRATION STATUSIntroductionDehydration is a common complaint in pediatric patients in the ED. Degree of dehydration is determined by assess-ment of clinical features, including change from baseline weight, heart rate, capillary refill time, and mucous mem-brane appearance. These features have technical limitations and are affected by fever, ambient temperature, and under-lying illness. Clinical assessment of dehydration using the constellation of signs and symptoms has low sensitivity and specificity (3,4). The decision to obtain vascular access for intravenous (IV) hydration should not be taken lightly
given the sometimes-challenging process in young chil-dren secondary to limited cooperation and small vessels. Ultrasound provides a rapid, noninvasive, and objective tool to assess hydration status in children. In adults, collapsibility of the inferior vena cava (IVC) can be used to guide initial fluid resuscitation. In children, the IVC/Aorta ratio is a more reliable measure (See Chapter 6). In euvolemic children the IVC/aorta ratio is approximately 1.0; lower values are seen in clinically dehydrated children (5,6).
Editor’s note: Some authors alternatively report the Aorta/IVC ratio.
Image AcquisitionPlace a mid-frequency curvilinear probe inferior to the xyphoid process in the transverse plane. Alternatively, a phased array or even high-frequency probe may be used to investigate the abdominal aorta and IVC. Transducer choice will be dictated by size and body habitus. Two anechoic circular structures will be visible anterior to the semicircular hyperechoic vertebral bodies. The circular structure on the patient’s right is the IVC, and the one on the left is the aorta. Color Doppler may be used for confirmation. Measure each in cross section. Use minimal pressure to avoid compressing the vessels.
Use of the Image in Clinical Decision MakingThis bedside test may be used as an initial tool to assess need for IV hydration and response to oral rehydration therapy in children with concerns for dehydration (7). Physicians may choose to institute IV hydration in those with low IVC/aorta ratios and in those whose values do not approach 1.0 after oral rehydration.
BLADDERIntroductionUrinalysis in young children is a common investigation and necessitates catheterization in neonates up to the age of toilet training. Unsuccessful catheterization occurs when insufficient urine is present in the bladder, requiring multiple attempts and repeated discomfort.
Image AcquisitionA mid-frequency transducer is the customary choice for blad-der imaging. The probe is first placed in the transverse plane just superior to the pubic symphysis and angled caudally into the pelvis. The probe is then rotated 90 degrees clockwise to view the bladder in the long plane. Most ultrasound machines will calculate bladder volume when dimensions are measured in the three planes (See Abdominal Procedures, Chapter 13).
Use of the Image in Clinical Decision MakingApproximately one in four urethral catheterizations of young children is unsuccessful and does not provide suf-ficient urine volume for analysis (5). Repeat catheteriza-tions subject the patient to additional trauma and increase parental angst. Bladder ultrasound eliminates the question of sufficient bladder volume. A transverse bladder dimen-sion of >2 cm yields sufficient urine from a catheterized specimen. Ultrasound significantly improves the success

390 SeCtion iX / Pediatric Ultrasound
rate of urine catheterization and avoids multiple interven-tions (8–10). In addition, suprapubic catheterization success is also improved by bedside ultrasound (See Pediatric Pro-cedures, Chapter 28) (11,12).
LIMPIntroductionThe differential diagnosis of a child with limp is broad and includes muscle strain, fracture, Legg-Calve-Perthes disease, slipped capital femoral epiphysis, toxic synovitis, and septic arthritis. The symptoms have significant overlap, and in chil-dren, given their poor ability to localize pain, the true diagno-sis is often elusive. A narrowly focused workup reduces time, resources, and child discomfort. Identification of an effusion helps to narrow the differential and improve care.
Transient synovitis (also called toxic synovitis) com-monly occurs in children 5 to 10 years of age. Patients pres-ent either with a specific complaint of hip pain or more vague complaints of pain with walking, refusal to bear weight, or with pain in the thigh or knee. Children may have a low-grade fever and appear in mild discomfort. Lab tests reveal a normal or slightly elevated white blood cell (WBC), erythro-cyte sedimentation rate (ESR), and C-reactive protein (CRP). The etiology is unknown, but inflammation secondary to a viral infection likely plays a role. Treatment is rest and non-steroidal white blood cell count medication. Complete reso-lution occurs within a few days with no long-term sequelae.
Septic arthritis develops from hematogenous spread to the affected joint, progression from osteomyelitis, or direct inoc-ulation secondary to penetrating trauma. Children often have high fever and are in significant discomfort. At rest they lie supine with the hip flexed, abducted, and externally rotated. The leukocyte count is significantly elevated with a neu-trophil predominance, and the ESR and CRP are elevated. The most common offending organism in infants and older children is S. aureus; in neonates, Group B Streptococcus is often responsible for the infection. Joint destruction occurs
secondary to increased pressure and the direct osteolytic ac-tion of the bacteria. Treatment is urgent arthrotomy, irriga-tion, and systemic antibiotic treatment.
Image AcquisitionThe child is positioned lying supine with the toes point-ing upward or in similar planes if pain causes hip adduc-tion of the affected limb. Imaging is done via the anterior approach with a high-frequency linear probe placed in the sagittal plane parallel to the femoral neck on the proximal thigh. Alternatively, a curvilinear mid-frequency probe may be selected when greater imaging depth is needed. The neck is identified with the overlying capsule; the iliopsoas muscle lies superficial to the capsule. The diaphysis of the femur ap-pears as a hyperechoic line ending proximally in the curved femoral head. The growth plate appears as an anechoic re-gion between the metaphysis and epiphysis. The capsule is measured from the anterior portion of the femoral neck to the anterior portion of the capsule.
PathologyAn abnormal capsule is greater than 5 mm or more than 2 mm wider than the contralateral (normal/asymptomatic) side (Fig. 26.1) (13). In addition, an effusion will change the capsule’s appearance from concave to convex. Side-by-side imaging is particularly useful to show the differences between the normal and the affected hips.
Use of the Image in Clinical Decision MakingIdentification of a hip effusion may necessitate aspiration of the effusion. Hip effusions can have variable appearances ranging from completely anechoic to mixed echogenicity, and sonography alone is not sufficient to distinguish be-tween toxic synovitis and septic arthritis. Aspiration can be accomplished under direct ultrasound guidance at the bedside by the emergency physician (Soft Tissue and Mus-culoskeletal Procedures, Chapter 22) (14–16).
FIGURE 26.1. Hip Effusion Compared to a Normal Hip . .

Chapter 26 / General Pediatric Problems 391
NONACCIDENTAL TRAUMAIntroductionA high index of suspicion for nonaccidental trauma must be maintained in pediatric patients with altered mental status and physical exam findings inconsistent with history or de-velopmental abilities. In combination with a careful, detailed history and physical exam, a number of bedside ultrasound tests may help focus the investigation. In addition, imaging will identify the extent of physical injury and provide addi-tional objective evidence in cases of abuse.
Fractures that are virtually pathognomonic of abuse in young children include those of the ribs, long bones in nonambulatory children and classic metaphyseal lesions (CML) (commonly referred to as bucket-handle fractures) (17,18). Unfortunately, rib fractures and CMLs are noto-riously difficult to visualize on standard x-rays (Muscu-loskeletal, Chapter 21). Given their significance, their presence carries dramatic importance in workup and dis-position of the patient.
Ocular examination may provide clues to nonaccidental trauma. Bilateral vitreous hemorrhage is virtually pathog-nomonic of shaken baby syndrome (see Eye Emergencies, Chapter 23) (19). Increased intracranial pressure is mani-fested on ultrasound with increased optic nerve sheath diam-eter (ONSD) (see Eye Emergencies, Chapter 23).
Image AcquisitionVisualization of ribs is best done along the long plane with a high-frequency (6–13 MHz) linear probe. The growth plate appears as an echoic space between the metaphysis and epiphysis. In contrast to fractures, these portions of the bone curve gently in toward the growth plate.
Ocular examination is done with a high-frequency (6–13 MHz) linear probe over closed lids. Use copious gel to avoid putting pressure on the orbits particularly when there is concern for globe injury. The ONSD is measured 3 mm behind the insertion of the optic nerve on the globe with the probe held in the transverse plane (Chapter 23, pages XXX).
PathologyAcute fractures appear as a discontinuity or break in the long plane of the rib (Fig. 21.10A). There may be an overly-ing hypoechoic hematoma, effusion, or soft tissue swelling. Callous formation has increased echogenicity that fills the fracture site, and over time the calcification of the callus pro-duces an acoustic shadow.
Use of the Image in Clinical Decision MakingUltrasound has proven more accurate than x-rays in diag-nosing rib fractures and is particularly effective in isolating those at costochondral junctions (20–22). In one case report, a 9-week-old boy was diagnosed with a rib fracture by ul-trasound that was not apparent on skeletal survey. The child was placed in protective custody. Follow-up skeletal survey 2 weeks after presentation revealed multiple bilateral rib fractures that were not initially apparent (23).
Infants may suffer significant intra-abdominal injury without the appearance of soft tissue bruising. Given their normally protuberant abdomens, hemoperitoneum can be present but not clinically appreciable. A focused assessment
with sonography for trauma (FAST) study in children with suspicion for abuse may reveal intraperitoneal bleeding and should be performed in these cases.
HEAD INJURYIntroductionNeuroimaging of children after a head injury remains a challenge for the emergency physician. A large study by Kupperman (24) derived and validated prediction rules for head injury. One criterion for clinical clearance involves the absence of a scalp hematoma. These have been associated with skull fractures and intracranial injury (25). A recent study showed the utility of ultrasound in identifying skull fractures in pediatric head injury patients with overlying ecchymoses (26).
Image AcquisitionUsing a high-frequency linear probe, the scalp is scanned in a methodical manner with particular attention to areas of ecchymoses, palpable step-offs, and boggy regions. Image in two orthogonal planes for optimal visualization. Be careful to use minimal pressure and copious gel to minimize child discomfort.
PathologyFractures will appear as irregular or jagged disruptions in the hyperechoic lines of the bony cortex and may have overly-ing hematomas. Knowledge of suture anatomy is essential in the evaluation of the pediatric skull. Sutures have smooth breaks in the bony cortex. Comparison to the contralateral side can be helpful in cases where an apparent suture under-lies a hematoma.
Use of the Image in Clinical Decision MakingUltrasound may streamline care by both ruling out skull fractures and eliminating the need for CT scan by rapidly identifying those children with skull fractures requiring ur-gent CT imaging. Point of care ultrasound through the open anterior fontanelle has been used to identify intracranial hemorrhage (27).
LUNG ULTRASOUNDIntroductionCertain anatomic characteristics of children, including a rela-tive paucity of subcutaneous fat and chest musculature, make ultrasound imaging easy and guarantee high-quality lung ultrasound images. Traditionally, pediatric lung conditions have been evaluated using standard radiographs. Ultrasound, however, can provide additional information on nature, lo-cation, and quality of lesions and help establish the diag-nosis. Small amounts of pleural fluid may be suspected on a standard chest x-ray, but additional radiographs might be necessary to identify and characterize the abnormality. Point of care ultrasound avoids ionizing radiation exposure and provides a real-time evaluation of the pleural effusion. In ad-dition, clinicians are challenged to distinguish between viral pneumonia, bacterial pneumonia, asthma, and bronchiolitis by clinical examination alone. They share common features

392 SeCtion iX / Pediatric Ultrasound
both clinically and radiographically. There is often the ques-tion of a coincidental pneumonia in the face of bronchiolitis and asthma when fever is present. Lung ultrasound is helpful when the question arises whether the hazy ill-defined opacity is atelectasis or an infiltrate.
Pneumothoraces can occur spontaneously in premature infants and children with underlying pulmonary conditions such as cystic fibrosis and in adolescents. Rapid identifica-tion by ultrasound will triage the patient to the appropriate level of care and intervention.
Image AcquisitionA high-frequency (6–13 MHz) transducer suffices for the evaluation of a pneumothorax and parenchymal lesions in infants and young children. Older and larger children may require mid-frequency transducers (4–8 MHz) for deeper im-aging. Curvilinear probes are useful for larger patients, and phased array or small-footprint probes are helpful to image between narrow rib spaces in small children. Most children can be comfortably imaged lying supine or sitting upright in their caregiver’s lap.
PathologyPleural effusionBegin with the traditional right upper quadrant and left upper quadrant views as described for the extended focused assess-ment with sonography for trauma (EFAST) examination. Briefly, the transducer is placed in the coronal plane in the midaxillary line on the right and posterior axillary line on the left in the sixth to eighth interspaces. Slide cephalad for proper visualization of the lower lungs. Additional views can be obtained by imaging on the child’s back in the sagittal and oblique planes to quantify the degree of pleural effusion by number of rib spaces. The character of effusion (simple vs. complex with loculations) will be readily identified with sonog-raphy. A simple effusion will be anechoic; a loculated effusion will change in size and character with respiration and may have septations (seen as hyperechoic lines within the effusion).
PneumothoraxImaging is the same as described in Chapter 5 with the probe held in the sagittal plane over the anterior chest in the third to fourth interspace. Because of the relatively decreased echo-genicity of pediatric ribs, pleural movement is well visual-ized both between and deep to the ribs.
Pneumonia and bronchiolitisA six-zone scanning protocol has been proposed with evalu-ation of the anterior, posterior, and lateral chest by Copetti et al. (28). The probe is placed in the anterior midclavicu-lar line, midaxillary line, and paraspinal line, respectively. A soft-tissue setting is selected on the ultrasound ma-chine. Pneumonia appears as a hypoechoic region with ir-regular, poorly defined borders. The overlying pleural is less echogenic than usual and as compared to neighboring healthy regions. In addition, lung sliding is reduced. Air bronchograms—tubular echogenic structures—are visible within the consolidated region.
In children with bronchiolitis, ultrasound imaging shows subpleural lung consolidation. Multiple vertical comet-tail artifacts are often seen in the regions adjacent to the consolidation.
LIMITATIONS AND PITFALLS 1. Overlying bowel gas may obscure views of the IVC and
aorta. Use a graded compression approach to displace the air.
2. A negative FAST does not rule out intra-abdominal injury and should not be used to rule out abuse. FAST simply identifies the presence of free intraperitoneal fluid. Positional changes may increase yield of the FAST exam. Place the patient in right lateral decubitus and reverse Trendelenburg to increase yield of Mori-son’s pouch and bladder view, respectively.
3. Cardiac pulsations complicate evaluation of the left chest for pneumothorax. Upward movement of the pleu-ral line caused by reverberations of the heart may be confused for lateral sliding of a normal lung. The rela-tive tachycardia of children allows little time to view the pleural line between heartbeats. This can be avoided by capturing a cine loop and replaying it at a slower speed. Utilize M-mode imaging for additional confirmation; the stratosphere sign is diagnostic of a pneumothorax.
REFERENCES 1. Brenner DJ, Hall EJ. Computed tomography—an increasing source of
radiation exposure. N Engl J Med. 2007;357(22):2277–2284. 2. Dorfman AL, Fazel R, Einstein AJ, et al. Use of medical imaging proce-
dures with ionizing radiation in children: a population-based study. Arch Pediatr Adolesc Med. 2011;165(5):458–464.
3. Gorelick MH, Shaw KN, Murphy KO. Validity and reliability of clinical signs in the diagnosis of dehydration in children. Pediatrics. 1997;99(5):E6.
4. Steiner MJ, DeWalt DA, Byerley JS. Is this child dehydrated? JAMA. 2004;291(22):2746–2754.
5. Chen L, Hsiao A, Langhan M, et al. Use of bedside ultrasound to assess degree of dehydration in children with gastroenteritis. Acad Emerg Med. 2010;17(10):1042–1047.
6. Levine AC, Shah SP, Umulisa I, et al. Ultrasound assessment of severe dehydration in children with diarrhea and vomiting. Acad Emerg Med. 2010;17(10):1035–1041.
7. Chen L, Kim Y, Santucci KA. Use of ultrasound measurement of the inferior vena cava diameter as an objective tool in the assessment of children with clinical dehydration. Acad Emerg Med. 2007;14(10): 841–845.
8. Chen L, Hsiao AL, Moore CL, et al. Utility of bedside bladder ultra-sound before urethral catheterization in young children. Pediatrics. 2005;115(1):108–111.
9. Milling TJ Jr, Van Amerongen R, Melville L, et al. Use of ultrasonogra-phy to identify infants for whom urinary catheterization will be unsuc-cessful because of insufficient urine volume: validation of the urinary bladder index. Ann Emerg Med. 2005;45(5):510–513.
10. Witt M, Baumann BM, McCans K. Bladder ultrasound increases catheterization success in pediatric patients. Acad Emerg Med. 2005;12(4):371–374.
11. Gochman RF, Karasic RB, Heller MB. Use of portable ultrasound to assist urine collection by suprapubic aspiration. Ann Emerg Med. 1991;20(6):631–635.
12. Munir V, Barnett P, South M. Does the use of volumetric bladder ul-trasound improve the success rate of suprapubic aspiration of urine? Pediatr Emerg Care. 2002;18(5):346–349.
13. Siegel MJ. Musculoskeletal system and vascular imaging. In: Siegel MJ, ed. Pediatric Sonography. 4th ed. Philadelphia, PA: Lippincott, Williams & Wilkins; 2011:624–626.
14. Shavit I, Eidelman M, Galbraith R. Sonography of the hip-joint by the emergency physician: its role in the evaluation of children presenting with acute limp. Pediatr Emerg Care. 2006;22(8):570–573.
15. Tsung JW, Blaivas M. Emergency department diagnosis of pediatric hip effusion and guided arthrocentesis using point-of-care ultrasound. J Emerg Med. 2008;35(4):393–399.
Chapter 26 / General Pediatric Problems 393
23. Kelloff J, Hulett R, Spivey M. Acute rib fracture diagnosis in an infant by US: a matter of child protection. Pediatr Radiol. 2009; 39(1):70–72.
24. Kuppermann N, Holmes JF, Dayan PS, et al. Identification of chil-dren at very low risk of clinically-important brain injuries after head trauma: a prospective cohort study. Lancet. 2009;374(9696): 1160–1170.
25. Greenes DS, Schutzman SA. Clinical indicators of intracranial injury in head-injured infants. Pediatrics. 1999;104(4, pt 1):861–867.
26. Ramirez-Schrempp D, Vinci RJ, Liteplo AS. Bedside ultrasound in the diagnosis of skull fractures in the pediatric emergency department. Pediatr Emerg Care. 2011;27(4):312–314.
27. Halm BM, Franke AA. Diagnosis of an intraventricular hemorrhage by a pediatric emergency medicine attending using point-of-care ultrasound: a case report. Pediatr Emerg Care. 2011;27(5):425–427.
28. Copetti R, Cattarossi L. Ultrasound diagnosis of pneumonia in children. Radiol Med. 2008;113(2):190–198.
16. Vieira RL, Levy JA. Bedside ultrasonography to identify hip effusions in pediatric patients. Ann Emerg Med. 2010;55(3):284–289.
17. Kleinman PK, Marks SC Jr, Richmond JM, et al. Inflicted skeletal injury: a postmortem radiologic-histopathologic study in 31 infants. AJR Am J Roentgenol. 1995;165(3):647–650.
18. Pandya NK, Baldwin K, Wolfgruber H, et al. Child abuse and orthopae-dic injury patterns: analysis at a level I pediatric trauma center. J Pediatr Orthop. 2009;29(6):618–625.
19. Spirn MJ, Lynn MJ, Hubbard GB III. Vitreous hemorrhage in children. Ophthalmology. 2006;113(5):848–852.
20. Hurley ME, Keye GD, Hamilton S. Is ultrasound really helpful in the detection of rib fractures? Injury. 2004;35(6):562–566.
21. Kara M, Dikmen E, Erdal HH, et al. Disclosure of unnoticed rib frac-tures with the use of ultrasonography in minor blunt chest trauma. Eur J Cardiothorac Surg. 2003;24(4):608–613.
22. Turk F, Kurt AB, Saglam S. Evaluation by ultrasound of traumatic rib fractures missed by radiography. Emerg Radiol. 2010;17(6):473–477.

394
IMAGE ACQUISITIONThe smaller size of children contributes to the extraordinary utility of ultrasound. Compared to adults, children have less subcutaneous and peritoneal fat, facilitating the sonographic assessment of abdominal organs. In most children, a high- frequency (5 to 15 MHz) linear probe can be used and provides high-resolution images. In cooperative and verbal children capa-ble of communicating the precise location of maximal abdominal pain or tenderness, relevant ultrasound images may be acquired rapidly at the bedside, expediting diagnosis and treatment.
Patient positioning is strategic for the rapid acquisition of images. If sonographic evaluation is not accomplished in a timely manner, many children will be unable to cooperate. Relaxation of the abdominal musculature allows the sonog-rapher to compress intra-abdominal organs with minimal applied pressure. This can be facilitated by placing a roll under the knees of the supine patient, serving to shorten and relax the rectus abdominus muscles. Similarly, positioning a caregiver opposite the sonographer to hold the child’s hands
INTRODUCTIONAbdominal complaints are encountered frequently in emer-gency pediatrics and often prompt lengthy and expensive eval-uations. The ability to rapidly narrow a diverse list of potential conditions is important for the timely treatment of affected children as well as the efficient use of emergency department (ED) resources. Bedside ultrasound may provide a shortcut through the maze of possible diagnoses (1). Although condi-tions affecting children overlap somewhat with those experi-enced by adults, several important abdominal emergencies are unique to or more prevalent in children.
CLINICAL APPLICATIONSUltrasound is useful in the evaluation of children with a variety of abdominal complaints, including pain, disten-tion, vomiting, hematochezia, or a palpable mass, and it can facilitate the workup of possible appendicitis, intussuscep-tion, pyloric stenosis, and volvulus.
Use of the Image in Clinical Decision Making . . . . . . . 401Correlation with Other Imaging Modalities . . . . . . . . . 401
PATHOLOGY: PYLORIC STENOSIS . . . . . . . . . . . . . . . . . . . . 401Ultrasound Findings of Pyloric Stenosis . . . . . . . . . . . 402Pitfalls . . . . . . . . . . . . . . . . . . . . . . . . . . . . . . . . . . . . . 402Use of the Image in Clinical Decision Making . . . . . . . 402Correlation with Other Imaging Modalities . . . . . . . . . 402
PATHOLOGY: MALROTATION AND VOLVULUS . . . . . . . . . . . 402Ultrasound Findings in Malrotation
and Volvulus . . . . . . . . . . . . . . . . . . . . . . . . . . . . . . 403Use of the Image in Clinical Decision Making . . . . . . . 403Pitfalls . . . . . . . . . . . . . . . . . . . . . . . . . . . . . . . . . . . . 403Correlation with Other Imaging Modalities . . . . . . . . . 405
INCIDENTAL fINDINGS . . . . . . . . . . . . . . . . . . . . . . . . . . . . 405CLINICAL CASE . . . . . . . . . . . . . . . . . . . . . . . . . . . . . . . . . . 405
INTRODUCTION . . . . . . . . . . . . . . . . . . . . . . . . . . . . . . . . . . 394CLINICAL APPLICATIONS . . . . . . . . . . . . . . . . . . . . . . . . . . . 394IMAGE ACQUISITION . . . . . . . . . . . . . . . . . . . . . . . . . . . . . . 394NORMAL ULTRASOUND ANATOMY . . . . . . . . . . . . . . . . . . . 395
Appendix . . . . . . . . . . . . . . . . . . . . . . . . . . . . . . . . . . . 395Small Bowel . . . . . . . . . . . . . . . . . . . . . . . . . . . . . . . . 395Cecum . . . . . . . . . . . . . . . . . . . . . . . . . . . . . . . . . . . . . 396Pylorus . . . . . . . . . . . . . . . . . . . . . . . . . . . . . . . . . . . . 396
PATHOLOGY: APPENDICITIS . . . . . . . . . . . . . . . . . . . . . . . . 396Ultrasound Findings in Appendicitis . . . . . . . . . . . . . . 396Use of the Image in Clinical Decision Making . . . . . . . 397Pitfalls . . . . . . . . . . . . . . . . . . . . . . . . . . . . . . . . . . . . . 397Correlation with Other Imaging Modalities . . . . . . . . . 399
PATHOLOGY: INTUSSUSCEPTION . . . . . . . . . . . . . . . . . . . . . 400Ultrasound Findings in Intussusception . . . . . . . . . . . 400Pitfalls . . . . . . . . . . . . . . . . . . . . . . . . . . . . . . . . . . . . . 401
Keith P. Cross, Matthew A. Monson, and David J. McLario
Pediatric Abdominal Emergencies
27

Chapter 27 / Pediatric Abdominal Emergencies 395
at waist level may also minimize patient stretching and tight-ening of the abdominal musculature.
In infants with suspected pyloric stenosis, the admin-istration of an oral fluid such as glucose water facilitates distention of the stomach and improves the ability to distin-guish tissue layers of different echogenicity. When admin-istering oral fluids, tilting the supine infant slightly to his or her right side fills the distal stomach and facilitates fluid passage through the pyloric channel.
Ultrasound assessments should utilize both transverse and longitudinal planes to optimize accuracy. For example, the appendix can be differentiated from surrounding bowel as a blind-ended loop. This feature is noted when sonographic assessment occurs along its long axis (Fig. 27.1). The diag-nosis of pyloric stenosis normally involves measurement of pyloric muscle width as well as channel length in short and long-axes views, respectively (Fig. 27.2).
Moderate doses of analgesic medication are often useful in abdominal conditions where patient feedback and/or compression of suspicious structures facilitate diagnostic efforts. Children may not be capable of cooperating without analgesia.
NORMAL ULTRASOUND ANATOMYAppendixThe appendix is a blind-ending structure that arises from the inferior cecum, approximately 2 cm caudad to the terminal ileum. It projects in various positions relative to the cecum and the pelvis. The appendix is tubular in shape, measuring 6 mm or less in diameter, and should be freely compress-ible. Due to its relatively small size, variable orientation, and obscuration by adjacent gas-filled bowel loops, the normal appendix is frequently difficult to visualize using ultrasound.
Small BowelNormal bowel is characterized by active peristalsis and compressibility (Fig. 27.3). Small bowel is considerably larger in diameter than the normal appendix and is oval in
transverse axis. Long-axis views often reveal considerable air with associated reverberation artifact (Fig. 27.4). Probe com-pression may be used to determine compressibility as well as displace intra-intestinal air to facilitate assessment of nearby structures of interest. It is critical, however, when conditions associated with intestinal perforation are suspected, that over zealous compression be avoided. The sonographic appearance of normal bowel wall reflects concentric, alternately echo-genic and hypoechoic layers reflecting interfaces of mucosa, muscularis, and serosa. The average thickness of the nor-mal bowel wall is 1 to 2 mm (Fig. 27.5) (2). A loop of small
FIGURE 27.1. Long-Axis View of the Appendix. Demonstrates its blind-loop configuration .
FIGURE 27.3. Compressible Normal Bowel.
FIGURE 27.2. Pyloric Stenosis. A: Short-axis view . B: Long-axis view . (Images courtesy of Dr . Russ Horowitz, MD .)
A
B

396 SeCtion ix / Pediatric Ultrasound
PylorusThe pyloric sphincter is a circular muscle located at the distal stomach that provides a degree of restriction to stomach out-flow, effecting the maceration and fragmentation of ingested food as it resists peristaltic contractions of the stomach. Its physical dimensions include normal wall thickness of ,3 mm and length of ,15 mm (Fig. 27.7) (3).
PATHOLOGY: APPENDICITISAppendicitis is the most common surgical emergency in children and occurs as a result of obstruction of the ap-pendiceal lumen. Causes of obstruction include inspissated fecal material (an appendicolith), hypertrophied lymph tissue, and foreign bodies. As intraluminal accumulation of fluid and mucus continues, appendiceal dilatation and rounding en-sues. Patients often provide a history of initial nonlocalized periumbilical aching characteristic of hollow viscous disten-tion. Increasing intraluminal distention eventually results in increased intramural pressure within the walls of the appen-dix. The resulting impairment in venous drainage initiates a cycle that further increases intramural pressure and eventually compromises arterial flow. When arterial flow to the appendix is compromised, ischemia occurs and results in inflammation that produces the localized peritoneal irritation responsible for the characteristic migration of pain to the right lower quadrant.
Ultrasound findings in AppendicitisUltrasound findings of appendicitis, are noted in Table 27.1, and include static and dynamic findings as well as direct and indirect signs. The presence of hyperechoic soft tis-sue in the vicinity of the suspected appendix predicts an
bowel may occasionally be mistaken for a dilated appendix, but compressibility, the presence of peristalsis, and lack of a blind end are characteristics helpful to avoid this mistake.
CecumThe cecum constitutes the first part of the large intestine. It is best identified as a large gas- and/or stool-filled pouch-like structure in the longitudinal plane when imaging the right lower quadrant. It may be distinguished sonographically from adjacent bowel by a characteristic “bumpy air” appearance (Fig. 27.6).
FIGURE 27.4. Long-Axis View of Normal Bowel. Demonstrates charac-teristic horizontal lines emanating from the near wall .
FIGURE 27.5. Normal Bowel Wall . Thickness is normally 1 to 2 mm .
FIGURE 27.6. Normal Cecum. Demonstrates characteristic “bumpy air” appearance .
FIGURE 27.7. Pyloric Sphincter. A: Short-axis view . B: Long-axis view . (Images courtesy of Dr . Russ Horowitz, MD .)
A
B

Chapter 27 / Pediatric Abdominal Emergencies 397
relative to suspicious ultrasound findings. In our experience, short-acting analgesia may be necessary to optimize the graded compression technique.
Use of the Image in Clinical Decision MakingAlthough the specificity of ultrasonography performed by experienced users for the evaluation of possible pe-diatric appendicitis is comparable to that of computed tomography (CT), sensitivity is compromised when detec-tion of a normal appendix is difficult (4). Appendiceal vi-sualization rates have varied widely in the literature, with one study reporting a rate of only 22%, while others have reported higher rates, particularly when adjunct maneuvers are used (5–8). However, the presence or absence of certain indirect, or so-called “secondary,” signs of appendicitis may be helpful. The finding of hyperemia in and around a suspi-cious loop of bowel suggests an inflammatory process (9). Conversely, the absence of hyperechoic soft tissue in the vi-cinity of abdominal tenderness contends against appendicitis when the appendix cannot be seen.
A possible strategy for the diagnosis of pediatric appen-dicitis may involve initial sonographic evaluation of children at low risk for perforation and alternative diagnoses. CT may then be reserved for those at increased risk for perforation or those whose ultrasound is indeterminate. For example, the ab-sence of signs of soft-tissue inflammation in an area of focal abdominal tenderness may, in concert with other indicators of low likelihood of appendicitis, allow clinicians to confidently utilize a period of observation as opposed to immediate CT.
Pitfalls 1. Failing to visualize the common iliac blood vessels, im-
portant landmarks for the appendix (Fig. 27.14). 2. Discarding the diagnosis of appendicitis due to inability
to visualize a retrocecal appendix. 3. Mistaking artifact from a normal loop of bowel for peri-
appendiceal inflammation (Fig. 27.15). 4. Inadequate period of observation to declare loop aperistaltic. 5. Finally, it behooves the clinician-sonographer to be will-
ing to accept at least occasional indeterminate readings to avoid false-positive sonographic evaluations.
inflammatory process and is considered a highly sensitive indicator for appendicitis in the appropriate clinical context (Fig. 27.8; eFig. 27.1). Unfortunately, hyperechoic soft tissue is a nonspecific finding that may be seen in mesenteric adeni-tis as well as various infectious gastroenteritides.
The classic static sonographic features of appendicitis include a round shape noted on transverse axis, a fluid-filled appearance, a diameter .6mm (Fig. 27.9; eFig. 27.2), and the presence of an appendicolith. Although a transverse view of the distended appendix provides the classic view of appendicitis, any abnormality should be viewed in two dimensions to confirm that the suspected appendix is a blind-loop structure and not an adjacent loop of bowel (Fig. 27.10). The presence of an appendicolith, accentuated by posterior shadowing, is a very specific finding for appendicitis, although not required for diagnosis (Fig. 27.11). Other find-ings include peri-appendiceal hyperemia (Fig. 27.12) and pelvic fluid (Fig. 27.13). “Dynamic” findings of appendici-tis include absence of peristalsis and lack of compressibility. Care should be taken to distinguish movement of bowel around the appendix from movement within the appendiceal lumen. Time is well spent gaining the trust and cooperation of the child to help determine the site of maximal tenderness
TABLE 27.1 Appendicitis
Direct Static Features
Round shape on transverse axis
Diameter . 6 mm
Appendicolith
Indirect Static FeaturesHyperechoic soft tissue in the vicinity of the suspected appendix
Right lower quadrant and/or pelvic free-fluid
Hyperemia adjacent to the suspected appendix
Direct Dynamic FeaturesMaximal compression tenderness at site of the suspected appendix
Relative noncompressibility of the suspected appendix
Absence of appendiceal peristalsis
FIGURE 27.8. Ultrasound Image of Appendicitis. Demonstrates hyper-echoic soft tissue in the vicinity of the diseased appendix .
FIGURE 27.9. Ultrasound Short-axis Image of Appendicitis . The lumen, measured inner wall to outer wall in transverse section, exceeds a diameter of 6 mm . The appendix has assumed a characteristic round shape as it distends with intraluminal fluid . (Image courtesy of Dr . Russ Horowitz, MD .)

FIGURE 27.10. Ultrasound Long-Axis Image of Appendicitis. Added confirmation of appendicitis results from the determination that the suspected structure is a blind-ending loop . (Image courtesy of Dr . Russ Horowitz, MD .)
A B
B
FIGURE 27.11. Appendicitis. Three cases (A, B, and C) where an appendicolith was visualized within an inflammed appendix .
A
C
398

Chapter 27 / Pediatric Abdominal Emergencies 399
Correlation with Other Imaging ModalitiesCT scanning for possible appendicitis continues to be popular as it is fast, accurate, and does not cause patient discomfort. It may identify various other possible diagnoses and should be utilized when perforation is anticipated as well as when there is significant possibility of an alternative diagnosis. Unfortu-nately, CT also exposes children to radiation, while the prepa-ration for certain CT examinations, such as those that involve patient consumption of oral contrast, may be time-consuming and uncomfortable. As the risk of appendiceal perforation cor-relates with the duration of symptoms, significant delays in di-agnosis may increase the risk of this unfortunate occurrence.
The inability of ultrasound to identify the appendix in some patients has caused it to be considered less accurate than CT scan in making a definitive diagnosis. However, the speci-ficity of ultrasound for the evaluation of appendicitis is actu-ally quite high in the hands of experienced operators; in some studies comparable to specificities attained by CT (6–8). The combination of clinical impression and ultrasound evaluation in the hands of emergency physicians may further enhance positive predictive value, thereby decreasing the number of CT scans needed (8). In addition, so-called sonographic indi-rect or “secondary” signs of appendicitis have been discussed as reliable positive and negative indicators, even when a nor-mal appendix itself is not appreciable (10).
FIGURE 27.13. Free Pelvic Fluid Adjacent to Appendix. (Image courtesy of Dr . Russ Horowitz, MD .) FF, free fluid
FIGURE 27.14. Appendix Localization Landmarks . The common iliac vessels are noted on color Doppler .
FIGURE 27.15. Acoustic Artifact Mimicking Peri-Appendiceal Hyper-echoic Inflammation.
FIGURE 27.12. Peri-Appendiceal Hyperemia. (Images courtesy of Dr . Russ Horowitz, MD .)
A
B

400 SeCtion ix / Pediatric Ultrasound
Ultrasound findings in IntussusceptionA high-frequency linear transducer is typically used to assess the abdomen, although a low-frequency abdominal probe may be needed in larger children. The examination starts at the cecum, or wherever a palpable mass is located, and proceeds through all quadrants of the abdomen. Trans-verse and sagittal images of each area should be reviewed. It should be stressed that although the right upper quadrant is where many intussusceptions are located, they may be found in any quadrant. The classic ultrasound finding is a large “target” or “donut” sign of the intussusception in cross section (Fig. 27.17; eFig. 27.3) (11). When seen in long
PATHOLOGY: INTUSSUSCEPTIONIntussusception is the most common cause of small bowel obstruction in children between the ages of 6 months and 4 years. Intussusception is the telescoping of one segment of bowel (the “intussusceptum”) into a distal adjacent section of bowel (the “intussuscipiens”), often resulting from the peri-staltic propulsion of a “mass”—frequently an enlarged intra-mural lymph node—that pulls the attached bowel wall with it. The invaginating intussusceptum then, in turn, drags its attached mesentery into the intussuscipiens. The mesentery, containing the blood supply to the invaginating intussuscep-tum, is compressed within the intussuscipiens (Fig. 27.16). In addition to effecting obstruction of the bowel, compres-sion of the intussusceptum begins to compromise venous outflow, resulting in edema and hematochezia, which is also responsible for the characteristic dark “currant-jelly” stools that often appear later in the course of intussusception.
Intestinal obstruction due to the crowding of the intus-susceptum within the intussuscipiens causes proximal dis-tention, and results in reflex hyperperistalsis and the abrupt paroxysms of intense visceral pain characteristic of intus-susception. The paroxysmal pain will often alternate with periods of apparent profound somnolence and lethargy as peristalsis temporarily abates. The site of obstruction, distal to the Ligament of Treitz, explains the bilious nature of vom-iting noted as the obstruction and emesis persist.
FIGURE 27.16. Anatomic Depiction of Intussusception . The intussus-ceptum is the segment of bowel that invaginates into the intussuscipiens . (From Mulholland MW, Maier RV, Lillemoe KD, et al . Greenfield’s Surgery Scientific Principles and Practice . 4th ed . Philadelphia, PA: Lippincott Williams & Wilkins; 2006, Fig . 50 .8 .)
FIGURE 27.17. Intussusception. Target sign . Transverse views of intus-susception demonstrate a classic concentric ring sign (A) and characteristic hyperechoic, heterogenous intussusceptum surrounded by edematous bowel wall of the containing intussuscipiens (B) .
A
B

Chapter 27 / Pediatric Abdominal Emergencies 401
axis, the image may appear layered and complex, sometimes even resembling a long-axis view of a kidney (Fig. 27.18) (12). Intestinal contents, particularly large stool masses, may be mistaken for the mass of an intussusception. Imag-ing along several axes to fully characterize the layering of bowel versus a solitary stool mass may differentiate these entities. Normal bowel, in contrast to an intussusception, has peristalsis and is compressible. One technique that assists the sonographer in differentiating stool mass from intussus-ception involves the application of Doppler flow for assess-ment of the suspicious mass. The appearance of pulsatile flow strongly suggests an intussusception (Fig. 27.19). Hard stool within the intestinal lumen will not demonstrate pulsa-tile flow. It should be mentioned, however, that if the intus-suscepted bowel has become completely ischemic, pulsatile arterial flow will not be noted.
Pitfalls 1. Overlying bowel, particularly when gas-filled, may
obscure an underlying intussusception. Gentle graded compression will help move superficial bowel loops aside so that underlying structures may be seen.
2. Deeper structures, like the psoas muscle, may be visible in thin children and may resemble the mass of an intus-susception. Comparisons with surrounding anatomy and views along multiple axes can help differentiate such deeper structures from true intussusception. Indetermi-nate cases are best reviewed with experienced surgical or radiology consultants.
3. Care should be taken not to attribute the vigorous peristalsis of infectious gastroenteritis to the peristal-sis often noted proximal and distal to the obstructing intussusception.
4. An additional pitfall is failure to insonate all four quad-rants, as the intussusception may occasionally extend to the distal colon.
Use of the Image in Clinical Decision MakingIn cases of high clinical suspicion and no clear alternate diagnosis, ultrasound is the imaging method of choice. Ultrasound for intussusception is highly accurate, with sensitivity and specificity approaching 100% (13). When present, positive findings are generally easy to identify, even for novice sonographers, which makes this application par-ticularly amenable to bedside use.
Correlation with Other Imaging ModalitiesVarious imaging modalities assist in the timely and accurate diagnosis of intussusception. Plain radiographs are sometimes helpful, such as when they show a mass in the right upper quadrant, when free air from a perforation is seen, or when an alternate diagnosis like constipation is apparent. However, the positive and negative predictive values and interobserver reliability of radiographs for intussusception are often criti-cized (14–16). The use of left lateral decubitus abdominal radiography may aid in diagnosis by demonstrating a mass-like opacification of the ascending colon by the intussuscep-tion. Gas within the distal colon may also outline the leading edge of the intussuscipiens. Conversely, a gas-filled right colon is a reassuring sign that ileocolic intussusception is un-likely. CT scan provides an accurate means for the determina-tion of intussusception, but is seldom necessary.
PATHOLOGY: PYLORIC STENOSISPyloric stenosis typically presents in infants 3 to 6 weeks of age. It occurs as a result of gastric outlet obstruction due to hypertrophy of the pyloric muscle located at the distal extent of the stomach, limiting passage of its contents (Fig. 27.20). The classic presentation is described by caregivers as progres-sive, voluminous, and forceful nonbilious projectile vomiting occurring during or shortly after feedings. Unfortunately,
FIGURE 27.18. Intussusception . Pseudo-kidney sign .FIGURE 27.19. Intussusception . Color Doppler demonstrates blood flow within the entrapped mesentery .

402 SeCtion ix / Pediatric Ultrasound
classic symptoms are not entirely dependable. Consequently, in many cases, definitive diagnosis relies on imaging.
Ultrasound findings of Pyloric StenosisUltrasound is the imaging modality of choice to confirm pyloric stenosis (17,18). Diagnostic criteria include mea-surements of the pyloric muscle and dynamic observation for fluid moving through the pyloric canal (Table 27.2; Fig. 27.21) (3, 17, 18). The most definitive normal ultra-sound finding is transpyloric flow; presence of flow excludes the diagnosis of pyloric stenosis.
Imaging is typically performed with a linear, high- frequency transducer. The patient is placed in a right oblique position—supine with left side a bit elevated—so that gastric contents distend the pyloric antrum, and gas within the stom-ach moves out of the field of view into the gastric fundus. The liver should be used as an echogenic window to gain a clear view of the pylorus.
Pitfalls 1. Failure to observe for a sufficient time to allow gastric
contents to move through the pylorus (15 minutes). 2. Failure to align the probe in the center of the pylorus,
causing tangential measurement of muscle width or channel length and overestimation of size; this may lead to false-positive evaluations. Sage advice suggests that although tangential measurement technique can make a normal pylorus appear abnormal, improper imaging tech-nique cannot make an abnormal study appear normal.
Use of the Image in Clinical Decision MakingUltrasound is the imaging modality of choice for the diag-nosis of pyloric stenosis. Ideally, physicians combine their
FIGURE 27.20. Anatomic Drawing of Pyloric Stenosis. (From Nettina SM . The Lippincott Manual of Nursing Practice . 7th ed . Lippincott Williams & Wilkins; 2001 .)
TABLE 27.2 Ultrasound Diagnostic Criteria for Hypertrophic Pyloric Stenosis
NORMAL EQUIVOCAL HYPERTROPHIC
Pyloric thickness (mm)
,3 3–4 .4
Pyloric length (mm)
,15 15–17 .17
Transpyloric flow Visible Not visible
pretest clinical suspicion with the best obtainable sono-graphic observations to confirm or exclude a diagnosis of pyloric stenosis. Equivocal cases should be discussed with surgical or radiology specialists and may require additional studies or observation. Repeat ultrasound in several days is often diagnostic in cases that are initially indeterminate.
Correlation with Other Imaging ModalitiesIn the past, pyloric stenosis was diagnosed using an upper gastrointestinal (UGI) contrast examination performed under fluoroscopy. Some investigators contend this remains a cost-effective study, as it may detect other diagnoses not noted on focused ultrasonography. Nevertheless, ultrasound has largely replaced the UGI series in this setting as it provides for direct visualization of pyloric muscle hypertrophy without radiation.
Formal pyloric ultrasound in the radiology department is quite accurate, with sensitivity and specificity approaching 100% (18–21). Additionally, it is radiation-free, noninva-sive, and painless. The UGI examination requires a relatively calm, still infant who will either cooperate in drinking con-trast or tolerate a nasogastric tube. It also consumes more time, particularly when the infant is not cooperative. For these reasons, ultrasound has emerged as the imaging mo-dality of choice to confirm a diagnosis of pyloric stenosis.
PATHOLOGY: MALROTATION AND VOLVULUSMalrotation is an anatomic abnormality of the small bowel in which mesenteric folding, rotation, and alignment is disturbed, resulting in a wide range of potential abnormal configurations of intestines and associated mesentery (22). At approximately the 10th week of gestation, the intestines normally rotate and become fixed in their normal position, with the small bowel centrally located in the abdomen and the large intestine draped around its top and sides. When normal embryologic intestinal rotation is incomplete and fixation does not occur, the resul-tant defect is known as intestinal malrotation.
Patients with malrotation are at increased risk for volvu-lus, in which a loop of intestine twists on itself. This can re-sult in intestinal obstruction, and since the site of obstruction is distal to the Ampulla of Vater, a characteristic pathologic feature is bilious emesis. In addition, since the intestine is not properly fixated and abnormally mobile, the twisting may obstruct its own blood supply, which is channeled through the narrow mesentery. When volvulus involves the entire small bowel, it is referred to as midgut volvulus and can result in infarction of most of the intestine.
Midgut volvulus classically presents in the neonatal period as an acute illness, with bilious vomiting and abdominal dis-tention. In some cases, patients will appear gravely ill, with obvious peritonitis and shock. As malrotation with midgut volvulus is a surgical emergency, prompt and accurate diag-nosis can be lifesaving (23). Occasional patients with intesti-nal malrotation do not experience neonatal midgut volvulus, and may present during school-age, adolescent, and even the adult years with intermittent and nonspecific symptoms such as abdominal pain, nonbilious vomiting, feeding difficulties, chronic diarrhea, malabsorption, and failure to thrive (24–27).
With intestinal malrotation, the large intestine is located to the left of the abdomen, while the small intestine is on the right of the abdomen. The cecum and the appendix, which are normally attached to the right lower abdominal wall, are

Chapter 27 / Pediatric Abdominal Emergencies 403
A B
unattached and located in the upper abdomen. In many cases, abnormal peritoneal (Ladd’s) bands attach the cecum to the duodenum and facilitate bowel obstruction (Fig. 27.22).
Ultrasound findings in Malrotation and VolvulusThe most useful ultrasound finding is the whirlpool sign (24,26,28–30). The whirlpool sign is the clockwise wrapping of mesentery and superior mesenteric vein (SMV) around the superior mesenteric artery (SMA), and may be notable in B-mode (Fig. 27.23A), while being best seen using color Doppler (Fig. 27.23B). The whirlpool sign can also be demonstrated on abdominal CT scan with intravenous contrast. Short of a clear whirlpool sign, simple inversion of the SMV and SMA on ultrasound may support the clinical suspicion of malrotation. Normal anatomy places the SMV to the right of the SMA. In-version is identified when color Doppler shows the SMV lying to the left of the SMA. However, it must be emphasized that this finding, or its absence, is suggestive, but not conclusive (30).
Use of the Image in Clinical Decision MakingUltrasound may contribute to the diagnosis of both acute and chronic presentations of malrotation and midgut volvulus (26,28). Ultrasound may be most useful at the bedside for
FIGURE 27.21. Pyloric Stenosis. Sagittal View of (A) elongated pylorus; (B) thickened pylorus . C: Thickened pylorus . D: Transverse view of thickened pylorus .
C D
clinically worrisome patients to predict malrotation pending the establishment of vascular access in preparation for defini-tive evaluation with UGI series or CT scan with intravenous contrast. While patient stabilization and study preparation is underway, a suspicious bedside ultrasound may expedite preparation for urgent surgical intervention.
In one pediatric series performed by radiologists, the whirlpool sign had a sensitivity of 92% and specificity of 100% for diagnosis malrotation (31). The inversion of the SMV/SMA has a reported sensitivity of 71% and specific-ity of 89% for malrotation (32). Confirmatory studies such as UGI contrast series or CT scan are normally indicated if permitted by time and condition of the patient.
Pitfalls 1. Sonographers should be wary of making a definitive
diagnosis of malrotation with volvulus with ultrasound. The characteristic inversion of SMA and vein posi-tion is not always noted in this potentially catastrophic condition.
2. Similarly, the absence of the characteristic clockwise whirlpool sign does not exclude the diagnosis. CT or oral contrast examination for definitive confirma-tion/exclusion of malrotation is advisable whenever possible.

A
B
C
FIGURE 27.22. Malrotation with Volvulus . A: Normal small bowel mesenteric attachment (as demonstrated by the arrow) . This prevents twisting of small bowel because of the broad fixation of the mesentery . B: Malrotation of colon with obstructing duodenal bands . C: Midgut volvulus around the SMA caused by the narrow base of the mesentery . (Redrawn from Fleisher GR, Ludwig S . Textbook of Pediatric Emergency Medicine . 6th ed . Philadelphia, PA: Lippincott Williams & Wilkins; 2010 .
FIGURE 27.23. B-Mode and Color Doppler of Whirlpool Sign. Demonstrates circumferential orientation of SMV around SMA in an infant with intestinal malrotation and midgut volvulus .
A B
404

Chapter 27 / Pediatric Abdominal Emergencies 405
blind end (Fig. 27.24B). A small area of shadowing deep to the structure was also noted, suggestive of an intraluminal fecalith. There was no intraluminal peristalsis noted during protracted observation of the suspicious loop. Aided by the previous administration of narcotic analgesia, the patient was able to tolerate attempted compression of the suspected diseased appendix. Only the suspicious loop was noncom-pressible, while the point of maximal abdominal tenderness was communicated to be in response to palpation directed precisely over the suspected diseased appendix. After consul-tation, the decision was made to proceed directly to surgery, where a nonperforated appendix was removed. The patient recovered uneventfully.
REFERENCES 1. Barr LL. Sonography in the infant with acute abdominal symptoms.
Semin Ultrasound CT MR. 1994;15(4):275–289. 2. Ledermann HP, Borner N, Strunk H, et al. Bowel wall thickening on trans-
abdominal sonography. AJR Am J Roentgenol. 2000;174(1):107–117. 3. Vasavada P. Ultrasound evaluation of acute abdominal emergencies in
infants and children. Radiol Clin North Am. 2004;42(2):445–456. 4. Cohen HL, Sivit CJ, eds. Fetal and Pediatric Ultrasound: A Casebook
Approach. New York, NY: McGraw-Hill; 2001.
Correlation with Other Imaging ModalitiesIntestinal malrotation with volvulus may be strongly sus-pected if there is dilation of bowel loops and/or marked distention of the stomach and duodenal bulb. However, plain film findings are variable and should not be relied upon to include or exclude the diagnosis. Ultrasound has not replaced the UGI contrast exam for evaluation of pos-sible malrotation with volvulus as neither the characteristic sonographic SMA/SMV inversion nor the whirlpool sign is sufficiently sensitive to serve as a definitive finding for this life- threatening condition.
INCIDENTAL fINDINGSUltrasound may incidentally identify cholelithiasis/cholecys-titis, renal stones, and ovarian cysts as unanticipated causes of abdominal pain. In the appropriate clinical context, when a large ovarian cyst is noted, concern for ovarian torsion may occur. In addition, when searching for appendicitis, the sonographer will occasionally instead find an intussus-ception. When examining for malrotation, other congenital abnormalities may become evident, such as heterotaxy, situs inversus, duodenal atresia, abdominal wall defects, and dia-phragmatic hernia.
CLINICAL CASECase 1A 4-year-old female presented to the pediatric ED following approximately 24 hours of illness. Her parents described an apparent constant and progressive discomfort that began in her periumbilical area, followed about 4 hours later by one episode of nonbilious emesis. A few hours prior to ED arrival, the pain migrated to her right lower quadrant. She also stated increased discomfort when the car in which she was riding hit bumps in the road en route to the ED. She stated that she did not feel hungry. Her parents communicated their con-cern regarding appendicitis and a hope that a CT could be avoided.
The patient was a generally well-appearing female who was lying very still on the examination table. Vital signs were as follows: blood pressure 108/80, pulse 122, respiratory rate 24, temperature 37.9°C (100.2°F). Auscultation revealed di-minished bowel sounds. External rotation of the right hip elicited discomfort. Palpation of the left lower quadrant caused pain in the right lower quadrant that was magnified when the examiner’s hands were abruptly withdrawn. Con-siderably greater tenderness was noted during right lower quadrant palpation. No mass was appreciable.
The attending physician performed a bedside ultrasound in the hope of identifying characteristic signs of appendicitis in order to avoid the time and radiation involved in CT eval-uation. A modest dose of intravenous narcotic medication was provided to facilitate patient tolerance of the examina-tion, while maintaining the patient’s ability to communicate. Using a curvilinear probe with frequency set at 5 MHz, the right lower quadrant was insonated at the point of maximal tenderness. A cross-sectional image of an 8-mm-diameter fluid-filled tubular structure was located within an area of hyperechoic soft tissue (Fig. 27.24A). The tubular structure was also noted in a long-axis view and appeared to have a
FIGURE 27.24. A: Enlarged appendix noted in transverse section . B: Blind-ended appendix noted in longitudinal axis view .
A
B

406 SeCtion ix / Pediatric Ultrasound
18. Hernanz-Schulman M. Pyloric stenosis: role of imaging. Pediatr Radiol. 2009;39(suppl 2):S134–S139.
19. Hernanz-Schulman M, Sells LL, Ambrosino MM, et al. Hypertrophic pyloric stenosis in the infant without a palpable olive: accuracy of sono-graphic diagnosis. Radiology. 1994;193(3):771–776.
20. Godbole P, Sprigg A, Dickson JA, et al. Ultrasound compared with clinical examination in infantile hypertrophic pyloric stenosis. Arch Dis Child. 1996;75(4):335–337.
21. Assefa G. Sonographic diagnosis of hypertrophic pyloric stenosis: pre-liminary experience. Ethiop Med J. 2002;40(2):149–154.
22. Shew SB. Surgical concerns in malrotation and midgut volvulus. Pediatr Radiol. 2009;39(suppl 2):S2167–S2171.
23. Millar AJ, Rode H, Cywes S. Malrotation and volvulus in infancy and childhood. Semin Pediatr Surg. 2003;12(4):229–236.
24. Taori K, Sanyal R, Attarde V, et al. Unusual presentations of midgut volvulus with the whirlpool sign. J Ultrasound Med. 2006;25(1): 99–103.
25. Kume Y, Fumino S, Shimotake T, et al. Intestinal malrotation with midgut volvulus in a 10-year-old girl. J Pediatr Surg. 2004;39(5): 783–784.
26. Patino MO, Munden MM. Utility of the sonographic whirlpool sign in diagnosing midgut volvulus in patients with atypical clinical presenta-tions. J Ultrasound Med. 2004;23(3):397–401.
27. Cubuk M, Arslan G, Ceken K, et al. Midgut volvulus in an adolescent patient. Eur Radiol. 2000;10(10):1685.
28. Zerin JM, DiPietro MA. Superior mesenteric vascular anatomy at US in patients with surgically proved malrotation of the midgut. Radiology. 1992;183(3):693–694.
29. Yeh WC, Wang HP, Chen C, et al. Preoperative sonographic diagnosis of midgut malrotation with volvulus in adults: the “whirlpool” sign. J Clin Ultrasound. 1999;27(5):279–283.
30. Pracros JP, Sann L, Genin G, et al. Ultrasound diagnosis of midgut volvulus: the “whirlpool” sign. Pediatr Radiol. 1992;22(1):18–20.
31. Shimanuki Y, Aihara T, Takano H, et al. Clockwise whirlpool sign at color Doppler US: an objective and definite sign of midgut volvulus. Radiology. 1996;199(1):261–264.
32. Orzech N, Navarro OM, Langer JC. Is ultrasonography a good screening test for intestinal malrotation? J Pediatr Surg. 2006;41(5):1005–1009.
5. Garcia Pena BM, Mandl KD, Kraus SJ, et al. Ultrasonography and lim-ited computed tomography in the diagnosis and management of appen-dicitis in children. JAMA. 1999;282(11):1041–1046.
6. Lee JH, Jeong YK, Park KB, et al. Operator-dependent techniques for graded compression sonography to detect the appendix and diagnose acute appendicitis. AJR Am J Roentgenol. 2005;184(1):91–97.
7. Kaiser S, Frenckner B, Jorulf HK. Suspected appendicitis in chil-dren: US and CT—a prospective randomized study. Radiology. 2002;223(3):633–638.
8. Schulte B, Beyer D, Kaiser C, et al. Ultrasonography in suspected acute appendicitis in childhood-report of 1285 cases. Eur J Ultrasound. 1998;8(3):177–182.
9. Fox JC, Solley M, Anderson CL, et al. Prospective evaluation of emer-gency physician performed bedside ultrasound to detect acute appendi-citis. Eur J Emerg Med. 2008;15(2):80–85.
10. Wiersma F, Toorenvliet BR, Bloem JL, et al. US examination of the ap-pendix in children with suspected appendicitis: the additional value of secondary signs. Eur Radiol. 2009;19(2):455–461.
11. Weissberg DL, Scheible W, Leopold GR. Ultrasonographic appearance of adult intussusception. Radiology. 1977;124(3):791–792.
12. Burke LF, Clark E. Ileocolic intussusception—a case report. J Clin Ultrasound. 1977;5(5):346–347.
13. Koumanidou C, Vakaki M, Pitsoulakis G, et al. Sonographic detection of lymph nodes in the intussusception of infants and young children: clinical evaluation and hydrostatic reduction. AJR Am J Roentgenol. 2002;178(2):445–450.
14. Sargent MA, Babyn P, Alton DJ. Plain abdominal radiogra-phy in suspected intussusception: a reassessment. Pediatr Radiol. 1994;24(1):17–20.
15. Eklof O, Hartelius H. Reliability of the abdominal plain film diagno-sis in pediatric patients with suspected intussusception. Pediatr Radiol. 1980;9(4):199–206.
16. Smith DS, Bonadio WA, Losek JD, et al. The role of abdominal x-rays in the diagnosis and management of intussusception. Pediatr Emerg Care. 1992;8(6):325–327.
17. Niedzielski J, Kobielski A, Sokal J, et al. Accuracy of sonographic crite-ria in the decision for surgical treatment in infantile hypertrophic pyloric stenosis. Arch Med Sci. 2011;7(3):508–511.

407
even in very young children and in medical, surgical, and trauma settings (1,8–11). Both internal jugular and femoral sites benefit from ultrasound guidance (12). Consensus data favor the use of ultrasound-guided central venous access in children, and some pediatric emergency departments (EDs) now mandate its use.
Clinical IndicationsIndications for central venous access in children are similar to those for adults, including:
1. Fluid resuscitation and delivery of medications, espe-cially for hypertonic fluids and vasopressors.
2. Central venous pressure monitoring. 3. Venous access for patients with difficult peripheral
access.
Image AcquisitionAs in adults, a high-frequency (7.5 to 10 MHz) probe should be selected and the appropriate vein, adjacent artery, and surrounding structures identified. Color flow and Doppler may be useful to confirm the anatomy. Given the superficial nature and pliability of pediatric vasculature, care must be taken to prevent compression of venous and arterial struc-tures. Light contact should be maintained between both the transducer and the overlying skin. The weight of the trans-ducer alone is enough to produce complete collapse of the vessel and interfere with visualization. Take care not to rest
INTRODUCTIONWhile there are many similarities in indications, techniques, and complications in ultrasound-guided procedures done in adults and children, there are also important differences. Some of these are simple yet subtle modifications in tech-nique. In some cases (e.g., suprapubic bladder aspiration), the technique is rarely performed in adults. The following chapter reviews differences between ultrasound-guided pro-cedures in children and adults, focusing on salient features that should be noted to optimize technique.
CENTRAL VENOUS ACCESSCentral venous access in children can be particularly chal-lenging. Difficulties in the pediatric population include smaller vein diameter, variation in vessel anatomy with age (1,2), uncooperative patients, and tissue laxity and com-pressibility (3). Adverse event rates for central venous access tend to be higher in children and include thrombosis, arterial/cardiac perforation, cardiac arrhythmias, air embolism, cath-eter fragment embolism, infection, pneumothorax, hemotho-rax, and nerve injury (3–5). Ultrasound assistance for central venous catheter placement has been found to increase success rate, decrease number of attempts, and decrease complica-tion rates in children (6,7). When compared to the external landmark-based approach, ultrasound-guided cannulation results in a reduced number of arterial punctures and a num-ber of sites attempted. These advantages have been shown
Amanda Greene Toney and Russ Horowitz
Pediatric Procedures28
INTRODUCTION . . . . . . . . . . . . . . . . . . . . . . . . . . . . . . . . . . 407CENTRAL VENOUS ACCESS . . . . . . . . . . . . . . . . . . . . . . . . . 407
Clinical Indications . . . . . . . . . . . . . . . . . . . . . . . . . . . 407Image Acquisition . . . . . . . . . . . . . . . . . . . . . . . . . . . . 407Anatomy and Landmarks . . . . . . . . . . . . . . . . . . . . . . 408Procedure . . . . . . . . . . . . . . . . . . . . . . . . . . . . . . . . . . 408Pitfalls and Complications . . . . . . . . . . . . . . . . . . . . . . 408
PERIPHERAL VENOUS ACCESS: COMPARISON BETWEEN CHILDREN AND ADULTS . . . . . . . . . . . . . . . . 409
SUPRAPUBIC BLADDER ASPIRATION . . . . . . . . . . . . . . . . . 409Clinical Indications . . . . . . . . . . . . . . . . . . . . . . . . . . . 409Anatomy and Landmarks . . . . . . . . . . . . . . . . . . . . . . 409
Image Acquisition and Procedure . . . . . . . . . . . . . . . . 409Pitfalls and Complications . . . . . . . . . . . . . . . . . . . . . . 410
INCISION AND DRAINAGE OF ABSCESSES . . . . . . . . . . . . . 410Image Acquisition and Procedure . . . . . . . . . . . . . . . . 410Comparison between Adult and Children . . . . . . . . . . 410
LUMBAR PUNCTURE: COMPARISON BETWEEN CHILDREN AND ADULTS . . . . . . . . . . . . . . . . . . . . . . . . . 410
FRACTURE REDUCTION: COMPARISON BETWEEN CHILDREN AND ADULTS . . . . . . . . . . . . . . . . . . . . . . . . . 411
NERVE BLOCKS: COMPARISON BETWEEN CHILDREN AND ADULTS . . . . . . . . . . . . . . . . . . . . . . . . . 411

408 Section iX / Pediatric Ultrasound
The child is placed in a supine 10 to 20 degree Trendelen-berg position with the head turned to the contralateral side similar to the internal jugular vein procedure (3). A towel roll may be placed between the scapulae to allow the shoulders to be in a dependent position from the mid-line of the chest. The ipsilateral arm is placed at the patient’s side.
ProcedureAlthough the anatomic landmarks and techniques are very similar in children and adults, additional special consider-ations must be made for children undergoing central venous catheter placement. These include patient preparation, anal-gesia, sedation, and equipment selection. Local anesthetics are necessary to reduce the pain of the initial needle insertion. Options include local injections or needleless transdermally delivered analgesia. In addition to a local anesthetic, anx-iolysis and/or sedation are often necessary for uncooperative children. Midazolam is an excellent choice as an anxiolytic as it can be given via the intranasal (0.2 to 0.3 mg/kg), oral (0.25 to 0.5 mg/kg), or intravenous (0.05 to 0.1 mg/kg) route. Numerous medication combinations are available for children undergoing sedation. The choice of particular agent(s) should be based on the clinical scenario and patient status. Custom-ary choices include a narcotic/benzodiazepine combination (e.g., fentanyl and midazolam) and ketamine. Both options provide sufficient analgesia, sedation, and amnesia. Age- and size- appropriate equipment is essential. Continuous cardio-respiratory monitoring must be in place. Although airway support is generally not required with these agents, pediatric specific supplies and physicians skilled in pediatric intubation must be present.
The technique for venipuncture is similar for adults and children, and is the same regardless of anatomical approach. A variety of techniques, including dynamic and static tech-niques, in-plane and out-of-plane approaches, and one- operator versus two-operator procedures are described in detail in Chapter 8. However, the angle of needle entry var-ies for different sites. For the femoral vein approach, the vessel is much more superficial in children, and therefore the needle should be inserted at a more shallow angle. This allows for better needle visualization. Pediatric vascular walls are very pliable, so a delicate approach with a sharp poke through the near field border of the vessel is needed. The internal jugular vein in children is superficial, and the needle needs to be inserted only 0.5 to 3.0 cm for venous access. Minimal pressure is applied with the ultrasound probe in the region to avoid fully compressing the vein. When using the infraclavicular approach for subclavian vein cannulation, the needle entry point is at or just lateral to the midclavicular line below the clavicle. The needle is inserted 2 to 4 cm below the surface of the clavicle in the direction of the sternal notch in parallel with the horizon-tal plane of the chest. Small inferior adjustments can be made in children if the first attempt is unsuccessful, but subclavian artery puncture and pneumothorax are potential complications to consider.
Pitfalls and ComplicationsA variety of technical factors can affect the ease and success of ultrasound-assisted venous access, including:
1. Inability of the child to cooperate with procedure. 2. Inexperience with ultrasound technique.
the gripping hand on the skin surface, as this will compress the target and neighboring vessels.
Anatomy and LandmarksUltrasound offers a valuable adjunct to central line placement. However, clinicians still need to be familiar with the anatomy of the vasculature and surrounding structures. The technological advantage of ultrasound does not replace the need for a solid understanding of the traditional landmarks described below.
Femoral vein approachThe femoral vein is the preferred site for central access in pediatric resuscitation and in children with difficult access. During resuscitation with ongoing CPR and airway manage-ment, it is often difficult to access the head, neck, and chest for central line placement. The femoral vein landmarks are readily identified and hemostasis easily achieved when pres-sure is applied. There is a lower complication rate with femo-ral vein line placement when compared with internal jugular and subclavian lines (3,13–15). Once thought to be at higher risk for central line infection, the infection risk with femoral central lines is similar to that of internal jugular and subcla-vian vein central lines (16–20).
With the patient lying in the supine position and the hip abducted and externally rotated, the femoral vein lies 1 to 2 cm inferior to the inguinal ligament about halfway between the anterior superior iliac spine and the pubic symphysis (3). The femoral vein is located just medial to the femoral artery pul-sation. A towel roll beneath the ipsilateral gluteal region may assist in landmark identification. Of note, Warkentine et al. reported that the location of the femoral vein relative to the fem-oral artery varies in children (2). In 12% of patients, the femo-ral vein was completely or partially overlapped by the femoral artery, giving further support for ultrasound-guided cannulation.
Internal jugular vein approachThe internal jugular vein is often the second choice in cen-tral venous access in children. The internal jugular vein is accessed by first placing the child in a supine 10 to 20 degrees Trendelenberg position to aid in venous distension (3). A towel roll may be placed between the child’s scapulae to assist in landmark recognition. Right-sided access is most commonly attempted given the lack of acute angles with the right internal jugular vein, and a preference to avoid the left sided thoracic duct and high riding pleural dome on the left. The internal jugular vein lies between the two heads of the sternocleidomastoid muscle; the carotid artery is located deep and medial to the vein.
Subclavian vein approachThe subclavian vein is the least common site for central ve-nous access in children in an acute medical situation due to difficulty in accessing the location, the higher associated complication rate, and the significant degree of skill neces-sary to place the catheter (3,21). In children <1 year old, the subclavian vein arches more superiorly as it travels toward the atrium, creating sharp angles, and the vessel diameter is smaller than that of the internal jugular vein, making can-nulation especially difficult. Landmarks are less identifiable given the small size and plasticity of the pediatric chest. The right side of the chest is preferred for reasons mentioned previously. The infraclavicular approach is usually preferred due to a lower complication rate.

chapter 28 / Pediatric Procedures 409
3. Excess pressure on the skin can collapse the vein. Some-times even minimal pressure will deform shallow veins. Compression of the vein may fool the operator into be-lieving the artery is the intended target.
PERIPHERAL VENOUS ACCESS: COMPARISON BETWEEN CHILDREN AND ADULTSPediatric studies support the use of ultrasound guidance for peripheral venous access. Doniger et al. found a shorter time to cannulation, fewer attempts, and a greater success rate with ultrasound-guided peripheral access compared to the traditional technique in the pediatric emergency depart-ment in young children (22). Specific recommendations in smaller children include using a 22-gauge catheter that is longer and wider, allowing for good visibility of the nee-dle on ultrasound and for cannulation of a slighter deeper vein (23). By nature, pediatric vessels are short. Prior to insertion, the length of the vein should be scanned to ensure that the site of insertion provides a long enough path to pass the catheter.
SUPRAPUBIC BLADDER ASPIRATIONClinical IndicationsSuprapubic bladder aspiration (SBA) is considered the gold standard in diagnosing a urinary tract infection in the infant and toddler. Bladder aspiration is associated with a lower contamination rate when compared to a “clean-catch” and urethral catheterization (3,24–27). It is also preferred to cath-eterization in cases of difficult urethral visualization, as with an uncircumcised male with tight foreskin or a female with labial adhesions. However, the success rate of SBA has been variable, approximately 23% to 90% (3,26,28–35).
Ultrasound has shown to significantly increase the suc-cess rate to 79% to 100%, both prior to the procedure (32,33,35–37) and with real-time guidance (35,38). Ultra-sound can confirm bladder location and the minimum urine volume in which to attempt the SBA. Blind attempts at SBA carry risk of hematuria, bowel perforation, and abdominal wall infection.
Normal Ultrasound Anatomy and LandmarksThe bladder is located in the abdominal cavity in infants and toddlers <2 years old. It is superior to the symphysis pubis in the midline with the anterior bladder wall just deep to the skin and rectus muscle. The bladder is easily identi-fied as an anechoic structure in the midline underlying the abdominal wall.
Image Acquisition and ProcedureBladder volume is first measured to ensure a minimum amount of urine in order to perform the SBA successfully. The patient is placed in the supine position with a techni-cian holding the patient’s legs in the frog-leg position. Gel is applied to the suprapubic region, and the ultrasound probe is applied with light pressure to the region (Fig. 28.1). A number of transducers may be used, including a curvilin-ear, phased array or even a linear probe based on body habitus and availability. The bladder appears as an anechoic structure
deep to the echoic anterior abdominal wall (Fig. 28.2). Blad-der volume is traditionally measured by obtaining the an-teroposterior and transverse diameter at maximum bladder size. The bladder volume is considered adequate for SBA if the diameter is 2 cm or more in both dimensions. Gochman et al. showed 79% success with SBA if these parameters were met (33). Garcia-Nieto et al. found that only the transverse bladder diameter of 4.4 cm predicted a successful SBA (36). The authors suggest attempting an SBA when the transverse diameter of the bladder is >3.5 cm. If the volume is insuf-ficient, feed the child, wait 30 minutes, and then reassess the bladder volume. In general, SBA success correlates with a larger bladder volume.
Once the volume is deemed adequate, the SBA can be performed. With the child in the same position, sterilize the skin. Place sterile ultrasound gel on the probe and cover with a sterile ultrasound sheath. Unroll the sheath over the ultra-sound cable, ensuring no bubbles are within the gel. Apply a second layer of sterile gel in the suprapubic region of the pa-tient. Locate the bladder as before with the ultrasound probe in the transverse plane at the bladder’s largest diameter. A 22-gauge needle attached to a 5-mL syringe is inserted at the location where the bladder wall is closest to the ultra-sound probe (Fig. 28.3). The needle can be seen entering the bladder wall under direct visualization. After an appropriate amount of fluid is extracted, the needle is removed. Apply pressure to the entry site for hemostasis.
FIGURE 28.1. Estimation of Bladder Volume by Ultrasound in an Infant. A linear array transducer is placed in the suprapubic area in transverse (A) and longitudinal (B) planes . (Image courtesy of Gregory Bell, MD .)
A
B

410 Section iX / Pediatric Ultrasound
sonography is superior to clinical judgment alone in distin-guishing between simple cellulitis and abscess. Studies have shown ultrasound changes management in pediatric soft t issue infections in 14% to 22% of cases (39,40).
Image Acquisition and ProcedureA high-frequency linear probe (7.5 to 10 MHz) is neces-sary for imaging of soft tissue infections. Transducers with a small footprint (6 vs. 9 cm) and hockey stick shape are uniquely suited for pediatric patients. A normal, unaffected, region should be imaged for comparison. The infected body part should be imaged in two orthogonal planes. Measure abscesses in the largest dimensions to investigate the extent of infection. Use color Doppler to assess for neighboring vascular structures. Minimal pressure should be applied in order to visualize overlying vessels. Provide delicate pres-sure on the abscess. Swirling of material within the ab-scess will be apparent with compression. True abscess will compress; this will help distinguish abscesses from lymph nodes, which are noncompressible. As in adults, a water bath may aid in visualization of the affected area in a distal extremity.
Comparison between Adult and ChildrenAbscess incision and drainage in pediatric patients often necessitates conscious sedation. Ultrasound helps to differ-entiate cellulitis from an abscess, potentially confirming or refuting not only the need for an invasive procedure but also conscious sedation. Chao et al. described the sonographic features of cellulitis and its transition to abscess formation in children (41). When the presence of pus was confirmed by ultrasound, children who underwent ultrasound-guided incision and drainage or surgical intervention had a shorter hospital length of stay and fever duration than those without procedural intervention.
LUMBAR PUNCTURE: COMPARISON BETWEEN CHILDREN AND ADULTSLumbar puncture is routinely performed in children in the ED to evaluate for infectious and neurological conditions. A true cerebrospinal fluid sample is essential in ruling out
FIGURE 28.3. Position and Direction of Needle Placement for Suprapubic Aspiration. (Image courtesy of Gregory Bell, MD .)
Pitfalls and ComplicationsStudies show that SBA tends to be unsuccessful with insuf-ficient bladder volume. To ensure proper positioning, enlist an assistant to appropriately hold the patient. A topical anes-thetic should be given to decrease pain and patient movement during the procedure.
INCISION AND DRAINAGE OF ABSCESSESClinically differentiating cellulitis from an abscess can be difficult. Ultrasound can assist in making the diagnosis of cellulitis versus abscess, determine the location and depth of an abscess, and identify important neighboring struc-tures such as blood vessels and nerves. Ultrasound should be performed in cases of soft tissue infection to determine the presence or absence of an occult abscess. Point-of-care
FIGURE 28.2. Ultrasound of Bladder in an Infant in Transverse (A) and Longitudinal (B) Orientation. Note the relatively high bladder position compared to a child or adult . (Image courtesy of Gregory Bell, MD .)
A B

chapter 28 / Pediatric Procedures 411
NERVE BLOCKS: COMPARISON BETWEEN CHILDREN AND ADULTSThe anesthesia literature notes that ultrasound guidance in pe-ripheral nerve block placement is widely accepted and rapidly becoming the gold standard for adult and pediatric regional anesthesia (50,51). Ultrasound guidance improves block char-acteristics in children, including shorter block performance time, higher success rates, shorter onset time, longer block duration, and less volume of local anesthetic agents (52).
Nerve blocks that may be facilitated by ultrasound guid-ance commonly done in the pediatric ED include the median, ulnar, and radial blocks of the upper extremity, and the fascia iliaca, sural, and posterior tibial nerve blocks of the lower extremity. Clinical conditions that are ideal candidates for nerve blocks include hand lacerations and foreign bodies, hand fractures, femur fractures, foot lacerations, and foreign bodies. Pediatric nerves are small and lie very superficially. For optimal visualization, fan the probe caudally and cepha-lad once the nerve of interest is identified. Pediatric-specific considerations when placing nerve blocks include adhering to a weight-based dosing maximum for anesthetics to avoid toxicity. Injection of an anesthetic under real-time ultrasound guidance allows for a decreased volume of local anesthetic (53–56) and potentially less toxicity. As with all procedures in pediatric patients, appropriate pain control, anxiolytics, and, possibly, sedation may be necessary.
REFERENCES 1. Alderson PJ, Burrows FA, Stemp LI, et al. Use of ultrasound to evaluate
internal jugular vein anatomy and to facilitate central venous cannula-tion in paediatric patients. Br J Anaesth. 1993;70(2):145–148.
2. Warkentine FH, Clyde Pierce M, Lorenz D, et al. The anatomic relation-ship of femoral vein to femoral artery in euvolemic pediatric patients by ultrasonography: implications for pediatric femoral central venous access. Acad Emerg Med. 2008;15(5):426–430.
3. King C, Henretig FM, eds. Textbook of Pediatric Emergency Procedures. 2nd ed. Philadelphia, PA: Lippincott Williams & Wilkins; 2008.
4. Bagwell CE, Salzberg AM, Sonnino RE, et al. Potentially lethal complications of central venous catheter placement. J Pediatr Surg. 2000;35(5):709–713.
5. Casado-Flores J, Barja J, Martino R, et al. Complications of central ve-nous catheterization in critically ill children. Pediatr Crit Care Med. 2001;2(1):57–62.
6. Randolph AG, Cook DJ, Gonzales CA, et al. Ultrasound guidance for placement of central venous catheters: a meta-analysis of the literature. Crit Care Med. 1996;24(12):2053–2058.
7. Hind D, Calvert N, McWilliams R, et al. Ultrasonic locating devices for central venous cannulation: meta-analysis. BMJ. 2003;327(7411):361.
8. Verghese ST, McGill WA, Patel RI, et al. Ultrasound-guided internal jugular venous cannulation in infants: a prospective comparison with the traditional palpation method. Anesthesiology. 1999;91(1):71–77.
9. Verghese ST, McGill WA, Patel RI, et al. Comparison of three tech-niques for internal jugular vein cannulation in infants. Paediatr Anaesth. 2000;10(5):505–511.
10. Sheridan RL, Petras L, Lydon M. Ultrasonic imaging as an adjunct to femoral venous catheterization in children. J Burn Care Rehabil. 1997;18(2):156–158.
11. Pirotte T, Veyckemans F. Ultrasound-guided subclavian vein can-nulation in infants and children: a novel approach. Br J Anaesth. 2007;98(4):509–514.
12. Iwashima S, Ishikawa T, Ohzeki T. Ultrasound-guided versus landmark-guided femoral vein access in pediatric cardiac catheterization. Pediatr Cardiol. 2008;29(2):339–342.
13. Venkataraman ST, Orr RA, Thompson AE. Percutaneous infraclavicu-lar subclavian vein catheterization in critically ill infants and children. J Pediatr. 1988;113(3):480–485.
meningitis in the workup of the irritable child and young infants with fever without a source. Although the site of needle insertion is consistent between adults and children, difficulty performing the procedure is due to different rea-sons. In contrast to adults in whom unsuccessful taps are often due to obesity and trouble palpating the spinous pro-cesses, children have a narrow interspinous space, making lumbar puncture challenging. In addition, prior unsuccessful, traumatic attempts produce an overlying hematoma, which may interfere with palpation of an already narrow interspace. Ultrasound has been successful in assisting lumbar puncture after failed traditional blind attempts (42). There is no stan-dard patient position, and this is left to the preference of the individual physician performing the procedure. Ultrasound studies have shown the widest interspinous distance in a seated position with hips flexed in both children (43) and infants (44,45). Neck flexion in either the seated or the lateral recumbent position does not appreciably widen the interspi-nous space (43).
Specific recommendations for ultrasound-guided lumbar puncture in children include using a high-frequency linear transducer to identify paraspinal structures in children and thin adolescents instead of a curvilinear probe, which is often used in larger, obese adults. Anxiolysis, analgesia with topi-cal or injected anesthetic, and/or sedation should be consid-ered in children when performing a lumbar puncture.
FRACTURE REDUCTION: COMPARISON BETWEEN CHILDREN AND ADULTSUltrasound has been shown to be effective in diagnosing long bone fractures in both children and adults (46–48). Optimal visualization involves imaging over the bone in the sagittal, coronal, and transverse planes to assess degree and direction of displacement. Swelling of the limb can make clinical evaluation of alignment difficult or impos-sible. Adequacy of reduction is routinely evaluated with fluoroscopy and/or standard radiographs. With x-rays, the fracture is often splinted and the patient re-imaged. In cases of inadequate alignment, the splint is removed and reduction re-attempted, resulting in prolonged seda-tion time and delay. Bedside sonography provides benefits over traditional imaging methods including a lack of ex-posure to ionizing radiation for the patient and caretakers, the ease given its portability, and the speed with resultant decreased sedation time.
Even dramatically angulated forearm fractures in chil-dren can often be managed nonoperatively with closed reduction under sedation in the ED. Sedation with agents such as ketamine will allow for patient cooperation and pain control during the reduction. Ultrasound provides real-time guidance for adequacy of fracture reduction. Identification of the need for reduction and the accuracy of reduction are comparable to radiographs (48,49). Pediatric consider-ations when using ultrasound guidance for fracture reduc-tion include attaining adequate experience to differentiate between a fracture line and the epiphysis. Some physicians may be accustomed to imaging fused epiphyses in adults and may incorrectly identify an epiphysis as a fracture. Adequate gel volume and pain management should help to ease anxiety in children and allow the practitioner to per-form the ultrasound.

412 Section iX / Pediatric Ultrasound
35. Ozkan B, Kaya O, Akdag R, et al. Suprapubic bladder aspira-tion with or without ultrasound guidance. Clin Pediatr (Phila). 2000;39(10):625–626.
36. García-Nieto V, Navarro JF, Sánchez-Almeida E, et al. Standards for ultrasound guidance of suprapubic bladder aspiration. Pediatr Nephrol. 1997;11(5):607–609.
37. Munir V, Barnett P, South M. Does the use of volumetric bladder ultrasound improve the success rate of suprapubic aspiration of urine? Pediatr Emerg Care. 2002;18(5):346–349.
38. Kiernan SC, Pinckert TL, Keszler M. Ultrasound guidance of suprapubic bladder aspiration in neonates. J Pediatr. 1993;123(5):789–791.
39. Iverson K, Haritos D, Thomas R, et al. The effect of bedside ultrasound on diagnosis and management of soft tissue infections in a pediatric ED. Am J Emerg Med. 2012;30(8):1347–1351.
40. Sivitz AB, Lam SH, Ramirez-Schrempp D, et al. Effect of bedside ultra-sound on management of pediatric soft-tissue infection. J Emerg Med. 2010;39(5):637–643.
41. Chao HC, Lin SJ, Huang YC, et al. Sonographic evaluation of cellulitis in children. J Ultrasound Med. 2000;19(11):743–749.
42. Coley BD, Shiels WE II, Hogan MJ. Diagnostic and interventional ultrasonography in neonatal and infant lumbar puncture. Pediatr Radiol. 2001;31(6):399–402.
43. Abo A, Chen L, Johnston P, et al. Positioning for lumbar punc-ture in children evaluated by bedside ultrasound. Pediatrics. 2010;125(5):e1149–e1153.
44. Cadigan BA, Cydulka RK, Werner SL, et al. Evaluating infant position-ing for lumbar puncture using sonographic measurements. Acad Emerg Med. 2011;18(2):215–218.
45. Oncel S, Günlemez A, Anik Y, et al. Positioning of infants in the neonatal intensive care unit for lumbar puncture as determined by bedside ultrasonography. Arch Dis Child Fetal Neonatal Ed. 2013;98(2):F133–F135.
46. Marshburn TH, Legome E, Sargsyan A, et al. Goal-directed ultrasound in the detection of long-bone fractures. J Trauma. 2004;57(2):329–332.
47. Williamson D, Watura R, Cobby M. Ultrasound imaging of fore-arm fractures in children: a viable alternative? J Accid Emerg Med. 2000;17(1):22–24.
48. Patel DD, Blumberg SM, Crain EF. The utility of bedside ultrasonogra-phy in identifying fractures and guiding fracture reduction in children. Pediatr Emerg Care. 2009;25(4):221–225.
49. Chen L, Kim Y, Moore CL. Diagnosis and guided reduction of fore-arm fractures in children using bedside ultrasound. Pediatr Emerg Care. 2007;23(8):528–531.
50. Griffin J, Nicholls B. Ultrasound in regional anaesthesia. Anaesthesia. 2010;65(suppl 1):1–12.
51. Lönnqvist PA. Is ultrasound guidance mandatory when perform-ing paediatric regional anaesthesia? Curr Opin Anaesthesiol. 2010;23(3):337–341.
52. Rubin K, Sullivan D, Sadhasivam S. Are peripheral and neuraxial blocks with ultrasound guidance more effective and safe in children? Paediatr Anaesth. 2009;19(2):92–96.
53. Oberndorfer U, Marhofer P, Bösenberg A, et al. Ultrasonographic guid-ance for sciatic and femoral nerve blocks in children. Br J Anaesth. 2007;98(6):797–801.
54. Casati A, Baciarello M, Di Cianni S, et al. Effects of ultrasound guid-ance on the minimum effective anaesthetic volume required to block the femoral nerve. Br J Anaesth. 2007;98(6):823–827.
55. Marhofer P, Schrögendorfer K, Wallner T, et al. Ultrasonographic guid-ance reduces the amount of local anesthetic for 3-in-1 blocks. Reg Anesth Pain Med. 1998;23(6):584–548.
56. Willschke H, Marhofer P, Bösenberg A, et al. Ultrasonography for ilioinguinal/iliohypogastric nerve blocks in children. Br J Anaesth. 2005;95(2):226–230.
14. Kanter RK, Zimmerman JJ, Strauss RH, et al. Central venous catheter insertion by femoral vein: safety and effectiveness for the pediatric pa-tient. Pediatrics. 1986;77(6):842–847.
15. Swanson RS, Uhlig PN, Gross PL, et al. Emergency intravenous access through the femoral vein. Ann Emerg Med. 1984;13(4):244–247.
16. Venkataraman ST, Thompson AE, Orr RA. Femoral vascular cath-eterization in critically ill infants and children. Clin Pediatr (Phila). 1997;36(6):311–319.
17. Stenzel JP, Green TP, Fuhrman BP, et al. Percutaneous femoral ve-nous catheterizations: a prospective study of complications. J Pediatr. 1989;114(3):411–415.
18. Stenzel JP, Green TP, Fuhrman BP, et al. Percutaneous central venous catheterization in a pediatric intensive care unit: a survival analysis of complications. Crit Care Med. 1989;17(10):984–988.
19. Goldstein AM, Weber JM, Sheridan RL. Femoral venous access is safe in burned children: an analysis of 224 catheters. J Pediatr. 1997;130(3):442–446.
20. O’Grady NP, Alexander M, Dellinger EP, et al. Guidelines for the prevention of intravascular catheter-related infections. Centers for Disease Control and Prevention. MMWR Recomm Rep. 2002; 51(RR-10):1–29.
21. Novak RA, Venus B. Clavicular approaches for central vein cannulation. Probl Crit Care. 1988;2:242–265.
22. Doniger SJ, Ishimine P, Fox JC, et al. Randomized controlled trial of ultrasound-guided peripheral intravenous catheter placement versus tra-ditional techniques in difficult-access pediatric patients. Pediatr Emerg Care. 2009;25(3):154–159.
23. Benkhadra M, Collignon M, Fournel I, et al. Ultrasound guidance allows faster peripheral IV cannulation in children under 3 years of age with difficult venous access: a prospective randomized study. Paediatr Anaesth. 2012;22(5):449–454.
24. Bonadio WA. Urine culturing technique in febrile infants. Pediatr Emerg Care. 1987;3(2):75–78.
25. Edelmann CM Jr, Ogwo JE, Fine BP, et al. The prevalence of bac-teriuria in full-term and premature newborn infants. J Pediatr. 1973;82(1):125–132.
26. Nelson JD, Peters PC. Suprapubic aspiration of urine in premature and term infants. Pediatrics. 1965;36:132–134.
27. Pryles CV. Percutaneous bladder aspiration and other methods of urine collection for bacteriologic study. Pediatrics. 1965;36(1):128–131.
28. Practice parameter: the diagnosis, treatment, and evaluation of the initial urinary tract infection in febrile infants and young children. American Academy of Pediatrics. Committee on Quality Improvement. Subcom-mittee on Urinary Tract Infection [published corrections appear in Pediatrics 1999;103(5, pt 1):1052, 1999;104(1, pt 1):118, 2000; 105(1, pt 1):141]. Pediatrics 1999;103(4, pt 1):843–852.
29. Aronson AS, Gustafson B, Svenningsen NW. Combined suprapubic aspiration and clean-voided urine examination in infants and children. Acta Paediatr Scand. 1973;62(4):396–400.
30. Pryles CV, Atkin MD, Morse TS, et al. Comparative bacteriologic study of urine obtained from children by percutaneous suprapubic aspiration of the bladder and by catheter. Pediatrics. 1959;24:983–991.
31. Saccharow L, Pryles CV. Further experience with the use of per-cutaneous suprapubic aspiration of the urinary bladder. Bacte-riologic studies in 654 infants and children. Pediatrics. 1969;43(6): 1018–1024.
32. O’Callaghan C, McDougall PN. Successful suprapubic aspiration of urine. Arch Dis Child. 1987;62(10):1072–1073.
33. Gochman RF, Karasic RB, Heller MB. Use of portable ultrasound to assist urine collection by suprapubic aspiration. Ann Emerg Med. 1991;20(6):631–635.
34. Chu RW, Wong YC, Luk SH, et al. Comparing suprapubic urine aspira-tion under real-time ultrasound guidance with conventional blind aspira-tion. Acta Paediatr. 2002;91(5):512–516.

413
leader is to explore the medical literature, to define the scope of the program, and to identify needed resources. In addition to developing documents and addressing program design and credentialing, the leader must also serve as a liaison with medical staff regarding emergency ultrasound. Probably the most important task of an ultrasound program leader is overseeing the quality of emergency ultrasounds. Successful programs have dedicated leadership that sustains the effort required to implement bedside ultrasound.
RELATIONS WITH OTHER SPECIALTIES AND DEPARTMENTSEmergency ultrasound has been welcomed by many members of the medical staff as the addition of a clinically useful tech-nology. The effort to create an emergency ultrasound program has been understood by those specialties that have similarly added clinician-performed ultrasound. Obstetricians routinely utilize ultrasound on the labor and delivery unit, as do many family practitioners. Critical care physicians and trauma sur-geons have progressively adopted diagnostic ultrasound as well as procedure guidance with ultrasound (5–9). Vascular surgeons, urologists, anesthesiologists, perinatologists, rheu-matologists, physiatrists, and retina surgeons, among others, have found advantage in adding ultrasound to their practices. These specialists are often supportive of the use of ultrasound
PROGRAM DEVELOPMENTStarting an ultrasound program is both a clinical and an administrative challenge. It begins with the determination that ultrasound will improve the care of your patients, that you have physician support within your group for a single standard of care that incorporates emergency ultrasound, and that add-ing clinician-performed ultrasound is achievable in the politi-cal environment of your hospital. The decision has become easier as emergency ultrasound has evolved from an investi-gational technique to an evidence-based best practice, and as ultrasound education and competency assessment has become a required element of emergency medicine training (1).
There are a number of tasks that must be addressed when starting an ultrasound program, such as identifying a program leader and entering into discussions with other departments and hospital administration. The staff must be trained in the clinical techniques and decision-making pro-cesses specific to the use of ultrasound. The group must also develop credentialing criteria, establish a quality assurance program, select equipment, and devise a compliant approach to reimbursement (2–4).
LEADERSHIPA consistent indicator for success in ultrasound implementa-tion is a dedicated ultrasound program leader. The role of this
EQUIPMENT SELECTION . . . . . . . . . . . . . . . . . . . . . . . . . . . 417REIMBURSEMENT . . . . . . . . . . . . . . . . . . . . . . . . . . . . . . . . 418
CPT Codes. . . . . . . . . . . . . . . . . . . . . . . . . . . . . . . . . . 418ICD-9 Codes and Medical Necessity . . . . . . . . . . . . . . 418Payer Policy . . . . . . . . . . . . . . . . . . . . . . . . . . . . . . . . 418
DOCUMENTATION . . . . . . . . . . . . . . . . . . . . . . . . . . . . . . . . 418ACCREDITATION . . . . . . . . . . . . . . . . . . . . . . . . . . . . . . . . . 418CONCLUSION . . . . . . . . . . . . . . . . . . . . . . . . . . . . . . . . . . . . 419
PROGRAM DEVELOPMENT . . . . . . . . . . . . . . . . . . . . . . . . . 413LEADERSHIP . . . . . . . . . . . . . . . . . . . . . . . . . . . . . . . . . . . . 413RELATIONS WITH OTHER SPECIALTIES
AND DEPARTMENTS . . . . . . . . . . . . . . . . . . . . . . . . . . . . 413RELATIONS WITH HOSPITAL ADMINISTRATION . . . . . . . . . 414PHYSICIAN TRAINING . . . . . . . . . . . . . . . . . . . . . . . . . . . . . 415CREDENTIALING . . . . . . . . . . . . . . . . . . . . . . . . . . . . . . . . . 415QUALITY ASSURANCE . . . . . . . . . . . . . . . . . . . . . . . . . . . . . 416
Bret P. Nelson and Stephen R. Hoffenberg
Implementing Ultrasound into the Community
Emergency Department
29

414 Section X / Implementing Ultrasound into the Clinical Setting
Relationships with the specialty of radiology have re-mained the most difficult for developing emergency ultra-sound programs. While at some institutions emergency ultrasound has been supported by radiologists interested in patient access to care or who recognize the role of focused applications, such situations remain the exception rather than the rule. Radiologists are the largest providers of consultative ultrasound services. They have developed the paradigm for consultative services and have a vested interest in the con-trol of ultrasound imaging. They have argued that the quality of studies, qualifications of providers, and the paradigm of emergency ultrasound do not meet standards established by their specialty. Often there is a lack of understanding as to what emergency ultrasound is and what is needed for the management of an emergency patient or an ED. Furthermore, radiologists routinely promote their right to provide services on an exclusive basis, but often restrict services to certain times of day, days of the week, or type of examination (25). Unlike cardiology, the value of focused studies has not been recognized by radiology leadership, and published standards address physician qualifications to interpret comprehensive consultative studies (10).
When implementing an emergency ultrasound program, the emergency physician should be direct and open with the department of radiology. Keep in mind that a consensus may never be reached with radiology and while open discussion is positive, endless discussion will not improve patient care. Your goal should be to educate the medical staff and hospi-tal administration as to the proven value of immediate ultra-sound that includes enhanced patient throughput, decreased medical risk, and improved outcomes. In an era of ED over-crowding, limited radiology resources, an adverse medical–legal environment, and concerns regarding patient safety, ultrasound is a technology offering advantages that cannot be ignored in deference to the interests of other specialties.
RELATIONS WITH HOSPITAL ADMINISTRATIONHospital administration has several goals surrounding emer-gency ultrasound. Its central goal is to offer the highest qual-ity of care to emergency patients. Additional goals include improving patient satisfaction, enhancing patient safety, and decreasing the costs of providing medical care. At the same time, administration wants to preserve needed revenues and maintain collegial relationships between departments. When proposing an emergency medicine ultrasound program, all of these issues should be discussed with hospital administration.
There are sound arguments for adding clinician-performed ultrasound to emergency medicine practice. Patient satis-faction has been correlated with ED throughput times, and increased throughput has been demonstrated to improve with the addition of emergency ultrasound (26,27). Patient safety has been enhanced (28,29), and the cost of providing emer-gency ultrasound is less than the cost of a consulting imaging service (30–33). Most savings are realized in decreased per-sonnel costs, particularly for sonographer “on-call” expenses during nights and weekends (31–33). Additional benefits may accrue in instances when sonographers are unavail-able or object to providing 24-hour coverage 7 days a week. The impact of emergency ultrasound on hospital revenues is complex and will vary based on the total number of studies
by emergency physicians. This is particularly true when the emergency department (ED) has communicated the current status of emergency ultrasound education and research, and has explained how ultrasound will be introduced, used, and monitored. So the landscape has shifted to the point where it may become the exception rather than the rule that radiol-ogy controls ultrasound imaging at a given institution. It is certainly becoming rare that emergency medicine is the only specialty interested in using the technology for patient care. Therefore when medical staff politics are an issue, it is advis-able to seek input and to develop support from those members of the medical staff and departments that are most likely to understand and endorse the addition of clinician-performed ultrasound.
Radiology and cardiology represent traditional providers of consultative ultrasound services. While individual radiologists or cardiologists may be supportive of emergency ultrasound, in the past both specialties have organized themselves to resist the credentialing of emergency practitioner ultrasound. Tradi-tionally, these specialties had adopted the position that stan-dards developed by their own specialty organizations should apply to all practitioners of ultrasound. These standards were applied to comprehensive examinations, rather than for fo-cused studies, and were designed for practitioners primarily engaged in referral imaging rather than for those who would use ultrasound in the direct care of their patients (10–12).
Cardiology adopted the use of ultrasound technology early and established the value of echocardiography, whereas radiologists have not traditionally performed this service. Cardiologists have pursued a consultative laboratory model for cardiac ultrasound, but, interestingly, the development of compact and highly portable ultrasound devices has changed the perspective of many cardiologists. It has become clear that portable echocardiography devices are more accu-rate than physical examination in the detection of pericardial effusion, valvular lesions, and depressed myocardial con-tractility (13–16). An increasing number of cardiologists are utilizing compact ultrasound devices, and some are adopting a new attitude toward the utility of bedside ultrasound. The training standards and policies originally published by the American College of Cardiology (ACC) and the American Society of Echocardiography (ASE) excluded emergency physicians from being eligible to independently perform or interpret emergency echocardiography (11,12).
Recently, the tide has turned in response to changes in portable technology and practice patterns, and a growing body of literature supporting the efficacy of focused car-diac ultrasound (FOCUS) in the hands of emergency physi-cians (17–23). In 2010, the ASE and the American College of Emergency Physicians (ACEP) cosponsored a consensus statement on the role of focused cardiac ultrasound, recog-nizing that “the training requirements for comprehensive echocardiography are not the same as those for FOCUS, and therefore each society is responsible for maintaining the integrity of their training protocols and for ensuring the re-sponsible practice and use of these imaging techniques” (24).
In practice, few emergency physicians have experienced resistance from staff cardiologists regarding the evaluation of patients by echocardiography for pericardial fluid, cardiac activity, or unexplained hypotension. When medical staff cardiologists are presented with the focused objectives of emergency echocardiography, the positive impact on patient care is often appreciated and supported.

chapter 29 / Implementing Ultrasound into the Community Emergency Department 415
meeting without staggering the education over months or years and at great expense.
Groups that have decided to pursue ultrasound as a prac-tice standard are often best served by bringing a course to their location. A number of commercial courses are avail-able and are taught by emergency physicians or by a com-bination of emergency physicians and sonographers. These courses should be specific to emergency medicine, cover the primary emergency indications, and meet the didactic and cognitive requirements for initial training as published in the Emergency Ultrasound Guidelines (2). They are gen-erally 2 days in length and provide 16 hours of category-I credit for continuing medical education. The advantage of these courses is that they travel to the practice location, are minimally disruptive to clinical scheduling, simulta-neously educate a maximum number of practitioners, and minimize costs to the practice. In some practice environ-ments it may be beneficial to partner with other specialties for courses with more focused content. For example, there exists significant overlap in emergency and critical care use of thoracic and cardiac ultrasound, as well as venous access. Many national ultrasound courses have a variety of specialties represented in the audience. There may be financial benefits to several departments sharing costs, but additionally building rapport and a shared clinical experi-ence can significantly improve interdepartmental relation-ships and build strong allies.
Many introductory ultrasound courses offer information on the administrative aspects of an ultrasound practice. This includes credentialing, quality control, documentation, pro-fessional relationships, and reimbursement. The ultrasound section of the ACEP is a reliable resource for current infor-mation on these administrative subjects (34). Finally, those with a special interest in emergency ultrasound such as re-search, specialized applications, the education of residents, or advanced program administration may explore one of the emergency ultrasound fellowships.
CREDENTIALINGPhysician credentialing and privileging are responsibilities of the hospital board and are undertaken with recommendations from the medical staff. “Credentialing” refers to application for medical staff membership, whereas “privileging” refers to the delineation of specific clinical procedures allowed by the practitioner. Physician privileges have historically been requested as a list of individual procedures and practitioners have documented the numbers of each procedure they have performed. More recently, core privilege sets have been re-quested and granted in blocks that include the skills basic to the physician’s specialty, and privileging has been accom-plished without the burden of cataloging numbers for each routine procedure. Specialized procedures may be separately privileged in addition to core privileges and are those felt to require added evidence of competency, such as advanced training or the tracking of activity levels.
Bedside ultrasound is now viewed as a core skill of emer-gency practice and may not require separate privileging if doc-uments such as the Core Content for Emergency Medicine (35) or The Model of the Clinical Practice of Emergency Medicine (36) are referenced as the basis for core privileges. However, because there are many emergency physicians trained prior to the teaching of this skill, emergency ultrasound will often
performed, the mix of complete versus limited studies billed by the hospital, and the ED patient financial mix. Another important factor in working with hospital administration is to find out when capital budget item requests should be sub-mitted, as securing funding for equipment in the middle of a budget year is often difficult for hospital administration. A well-prepared “white paper” outlining supporting docu-ments and including credentialing standards, quality improve-ment plans, equipment requirements, and a full explanation of the advantages of immediate ultrasound will be of great help to administration. To this end, the ACEP Emergency Ultra-sound section has collected a number of useful documents, presentation templates, and other integral resources for devel-oping an emergency ultrasound program (34).
PHYSICIAN TRAININGThe majority of emergency medicine residents are taught ultrasound and will meet emergency medicine training stan-dards by the completion of their training. Residency-trained physicians should be granted emergency ultrasound privi-leges when joining a medical staff that recognizes emergency ultrasound privileges (2). In many instances, these privileges will simply be a part of emergency medicine core privileges. In other instances, additional evidence of competency may be required, such as confirmation by the physician’s resi-dency director of a sufficient number of cases with demon-strated quality. Candidates for recruitment who have been trained in ultrasound often view the use of ultrasound by a practice as an indicator of quality.
Many practicing emergency physicians did not receive ultrasound training during residency. Others were in training when ultrasound was being introduced and have had expo-sure without sufficient structured education to meet emer-gency ultrasound training guidelines. This situation is not unusual, as physicians practicing in all specialties add new skills on an ongoing basis. Emergency physicians trained prior to the incorporation of ultrasound must acquire neces-sary training through continuing medical education in order to maintain a quality practice and meet evolving standards of care, and ACEP’s Ultrasound guidelines describe training and credentialing pathways for practicing physicians (2).
The best choice for training depends on the goals of the practitioner or the goals of the practice. Is this an individual wanting to explore the utility of ultrasound on behalf of his or her group, or is this a practitioner wanting to enhance spe-cific skills, such as ultrasound-guided procedures? Is this an individual wanting special expertise in order to administer an ultrasound program? Or, is this a practice that has made the decision to train the entire group for the incorporation of bedside ultrasound? Each of these educational goals requires a different approach.
For those exploring the utility of ultrasound on behalf of their practice, or for those seeking a specific skill, national or regional educational meetings are the best options. Such meetings are frequently sponsored by professional emer-gency medicine societies or academic emergency medicine programs. These meetings may incorporate ultrasound edu-cation within their curriculum, offer dedicated ultrasound educational programs, or present “add on” courses associ-ated with other educational forums. National meetings are less practical for group practices wanting to add ultrasound because it is difficult to send an entire group to a national

416 Section X / Implementing Ultrasound into the Clinical Setting
an evidence-based advance in patient care that has been ad-opted by multiple physician specialties in a variety of clini-cal settings. Second, the credentials committee will often be faced with discussion surrounding the conflicting policy statements of multiple specialty societies. You should be familiar with the relevant policies of ACEP, the Society for Academic Emergency Medicine (SAEM), the American Board of Emergency Medicine (ABEM) and the American Medical Association (AMA), as well as policies of the Amer-ican College of Radiology (ACR), the American College of Cardiology (ACC), the American Society of Echocardiog-raphy (ASE), and the American Institute of Ultrasound in Medicine (AIUM) (10–12,35–40). Be prepared to discuss these policies in the context of quality, risk management, patient safety, access to care, the paradigm of emergency ultrasound, and the current medical literature. It is advised that you recommend the ACEP and AMA principle that train-ing and education standards should be developed by each physician’s respective specialty and those standards should serve as the basis for hospital privileging.
Finally, the issue of exclusive contracts is often brought into credentialing discussions. Exclusive contracts are put into place when they improve patient care, assure access to care through needed physician coverage, and are approved by the hospital board. Exclusive contracts are most appro-priate in the context of managing consultative and referral services and are less appropriate when applied to medically indicated and immediate services provided by a treating phy-sician. Exclusive contracts should not be used as an argument that results in limiting patient access to needed services, hin-dering quality improvements within other specialties, or con-trolling necessary patient care services for economic gain.
QUALITY ASSURANCEImplementing an emergency ultrasound program is a major quality improvement effort and may be one of the more sig-nificant long-term contributions to patient care within the ED. A well-considered quality program will contribute to gaining the support of your medical staff and hospital admin-istration in addition to monitoring ultrasound quality. There are two aspects of an emergency ultrasound quality program. The first addresses the basic competencies surrounding ultra-sound techniques and involves initial education, performance of training studies, and documentation of examinations. This component is closely related to credentialing, the exercise of provisional privileges, and demonstrating quality for advancement to full ultrasound privileges (2). The second component addresses utilizing ultrasound competencies to achieve defined quality objectives in patient care or quality improvement.
In developing a quality program, you should begin by out-lining long-term quality objectives as well as identifying spe-cific opportunities to improve patient care. Several aspects of care that can be improved through the application of imme-diate ultrasound include the timeliness of care, the optimal diagnostic management of specific disease states, enhanced patient safety, and the appropriateness of therapeutic inter-ventions. Corresponding opportunities to improve on these aspects of care might include decreasing delays that accom-pany the diagnosis of ectopic pregnancy, the accurate and early diagnosing of aortic aneurysm, decreasing complication
be viewed as a privilege that is separately granted and one requiring additional documentation.
The process of establishing new clinical privileges begins with the organization and review of information relevant to the procedure within a department and compliance with any hospital policies addressing how new privileges are granted. Recommendations from the department are forwarded to the credentials committee. The credentials committee is gener-ally experienced in evaluating criteria for privileging and has often dealt with multiple specialties performing similar pro-cedures. Examples include family practitioners performing deliveries or cardiologists seeking privileges for angioplasty outside of the heart. Most meaningful debate will occur at this level; it frequently involves input from a broad range of practitioners, and should be a main focus of the ED’s orga-nizational efforts. The recommendations of the credentials committee are generally accepted by the medical executive committee and then forwarded to the hospital board where approval can be anticipated.
Currently accepted criteria for emergency ultrasound cre-dentialing are outlined in the Emergency Ultrasound Guide-lines (2) and they should be presented as standards developed and endorsed by the specialty of emergency medicine. The Emergency Ultrasound Guidelines describe two generally accepted pathways for credentialing. The first is by resi-dency training in emergency ultrasound with verification of satisfactory performance by the graduate’s residency direc-tor. The second path entails completion of an introductory course in emergency ultrasound that is compliant with the ACEP training guidelines followed by a provisional period of performing training examinations. During the provisional period, 100% of the studies should be reviewed. Training examinations continue until 25 to 50 studies of satisfactory quality are recorded for each of the primary indications, or until 150 total studies are completed. Up to one-half of the training examinations may occur in the midst of a training course, or they may be nonclinical examinations of volun-teers. At least half of these training examinations should be clinically indicated and include some percentage of abnor-mal findings. Confirmation of each study should be obtained whenever possible and may include direct supervision, an over-read of studies, confirmatory data such as a consultative ultrasound, computed tomography (CT), surgery, or clini-cal outcome. Following satisfactory completion of training examinations during the provisional period, full privileging should be granted.
Most examination results are not used for clinical deci-sion making during the provisional period. It should be noted that this approach is not always possible, and clearly normal or clearly abnormal findings in the context of the clinician’s judgment may drive patient-care decisions. For example, when used during penetrating cardiac trauma, the clear delineation of pericardial fluid in a hypotensive patient should prompt immediate surgical intervention rather than a confirmatory imaging study.
Keep several things in mind surrounding credentialing discussions. First, privileges for ultrasound are not granted by radiology or cardiology; rather they are granted by the hospital board and should be based upon the best interests of patient care. Furthermore, immediate ultrasound per-formed by the treating physician is not a poor substitute for consultative imaging as it may be portrayed. It represents

chapter 29 / Implementing Ultrasound into the Community Emergency Department 417
EQUIPMENT SELECTIONUltrasound devices continue to improve in capability and suitability for the bedside performance of ultrasound as well as in cost. There are no best devices; there are many choices and physician preferences vary. The essential features include portability, display and image quality, transducer selection, a rapid startup time, a recording device, durability, and a ser-vice contract. Given the rapid improvements in equipment, any specific recommendations would soon be out of date.
The first requirement for the bedside ultrasound device is portability. Some physicians prefer compact devices that can be carried by hand, and others prefer cart-based portable devices with larger displays. What is important is that the device can be easily moved and can negotiate ED hallways, as well as fit into the sometimes cramped spaces found in patient care rooms. Image and display quality are key ele-ments because emergency ultrasounds are interpreted as they are generated and displayed. When comparing devices, side- by-side performance gives the best assessment of display and image quality.
The full spectrum of emergency studies requires the pur-chase of three to four transducers. If limited examination types are contemplated (such as trauma scans only), one may need only a single transducer. Multifrequency transducers are desirable and are supported by most ultrasound devices. A basic set of transducers includes a curvilinear probe, gen-erally 3.5 to 5.0 MHz, for abdominal scanning and subxi-phoid cardiac views. A smaller footprint curvilinear 3.5 MHz or multifrequency probe is optimal if separate cardiac and abdominal probes are not purchased. An endovaginal trans-ducer is essential if first-trimester pelvic examinations are contemplated. A high-frequency linear transducer should be purchased for central line placement under ultrasound guid-ance. Finally, a dedicated cardiac transducer completes the selection of transducers.
Devices with a rapid boot-up time are desirable. Unlike ultrasound units in a radiology department that are often powered up and stationary throughout the day, ED devices are moved from room to room, often many times an hour. Some ultrasound machines may take 3 to 4 minutes to start up before you can scan, and an equal amount of time to shut down. When sequentially scanning multiple patients in different rooms, such as in the case of a multivictim mo-tor vehicle collision, long boot-up times are tremendously problematic. Choose a device that is quick to bootup or one with a noninterruptible power supply that can be unplugged, moved, and plugged in again without a shutdown and startup.
A method for recording images and video clips is es-sential. Emergency ultrasound performance requires one or more representative images available for study documenta-tion, quality review, and reimbursement purposes. Increas-ingly, emergency ultrasound studies are managed in PACS systems (picture archiving and communication systems), and DICOM interface capabilities (specialized digital imag-ing and communications in medicine) are becoming more important. Thermal imaging and disc drive storage remain common, but in the era of electronic medical records and “paperless” documentation, it is becoming commonplace to use electronic imaging and storage of ultrasound stud-ies. Separate or add-on video recording devices are often employed for teaching purposes or for cardiac imaging.
rates of central venous access, and limiting unnecessary peri-cardiocentesis performed during cardiac resuscitation. Each of these goals is relevant to your practice and represents an opportunity to evaluate the effectiveness of your ultrasound program. To evaluate basic ultrasound skills, each practice should develop indicators of performance that include pa-rameters such as adherence to predefined indications for ul-trasound studies, documentation of studies in the chart or in a quality log, accuracy of interpretation based on comparative data, and the technical quality of the study. Often a scoring system is used that assigns each indicator a range of points. When scores are placed into a database, performance can be analyzed by individual indicators or in aggregate by the type of study, practitioner, or physician group. Data can be used to guide education or for credentialing purposes, and trends can easily be demonstrated with this type of quantifiable data.
During program start-up, quality review for both individu-als and the group should be conducted on 100% of studies. Once the quality committee determines that appropriate quality has been achieved, the review process may shift from a 100% review phase to an ongoing quality assurance phase. The ongoing phase should be similar to most other quality assessment processes in the ED and may include periodic focused reviews, a sampling methodology, and the review of adverse outcomes.
One of the practical problems facing a start-up program is determining who should review training studies. Most pro-grams develop a subcommittee of the department’s quality committee to oversee the implementation process and review ultrasound studies. In a facility with one or more emergency physicians credentialed or experienced in ultrasound, these physicians should lead review of these studies. When no ex-perienced emergency physicians are available, then outside assistance should be sought from an experienced emergency physician in the region who can be recruited for review pur-poses. If that physician is not on your medical staff, their assistance will require an invitation as an outside reviewer and a confidentiality agreement to maintain peer review protection.
Alternatively, if relationships are good with other phy-sicians on your medical staff credentialed to perform ul-trasound, such as obstetrics-gynecology, surgery, family medicine, critical care, or radiology, then invite one or more of these physicians to join your subcommittee for review purposes. It is not advisable, however, to turn the responsi-bility for quality assurance over to another department. This should remain under the leadership of your own department, as would any other emergency medicine quality effort. In addition, any assisting physician from outside of your depart-ment must understand the paradigm of emergency ultrasound evaluations and criteria appropriate for clinician-performed emergency studies, and you must be assured there is no con-flict of interest for reviewers who provide consultative imag-ing services.
Finally, the term “quality assurance” has a second mean-ing associated with ultrasound that relates to device function and maintenance. Equipment quality assurance includes pe-riodic checks of electrical and mechanical safety, calibration, and image quality as well as tracking device cleaning and adherence to infection control policies. Assistance in device quality assurance should be secured from the equipment manufacturer and hospital biomedical engineering.

418 Section X / Implementing Ultrasound into the Clinical Setting
is a clinical approach combining limited echocardiography with a limited abdominal study. Interestingly, the CPT codes for diagnostic ultrasound reimburse the physician for the in-terpretation of the study, but not for performance of the study. Performance of an ultrasound is currently reimbursed to the hospital as part of the technical component of the CPT code.
ICD-9 Codes and Medical NecessityICD-9 codes generally describe diagnoses, signs, symptoms, or abnormal diagnostic tests. These codes are less familiar to physicians than are CPT codes and are usually applied by professional coders either at the hospital or professional billing office rather than by physician providers. Third-party payers use ICD-9 codes to determine if an ultrasound was medically necessary, and accuracy in ICD-9 coding is impor-tant because payers frequently compare the ultrasound CPT code to a list of preauthorized ICD-9 codes in an effort to edit out, or deny, services that they believe are unnecessary.
Payer PolicyPayers have their own rule sets regarding which services are covered, what constitutes a medically necessary service, and what coding combinations are permissible. When physi-cians agree to contract with a payer, they are agreeing to the payer’s payment policies. Medicare’s payer policy can vary by region, and private payers may have dramatically differ-ent approaches for reimbursement. Even when a service is well described by CPT, a payer may put into place special rules that exclude emergency ultrasounds simply by creating a policy that denies payment for ultrasound services provided by emergency physicians. These issues may become more important as emergency ultrasound use grows and payers fear an increase in claims from physicians who have histori-cally not conducted these procedures or utilized these codes.
DOCUMENTATIONUltrasound documentation refers to the ultrasound inter-pretation, or report, in the medical record as well as to the archiving of images. Proper documentation of ultrasound in-terpretations requires a written report signed by the physician and included in the medical record. The report may be a tem-plated note, a handwritten note, or it may be dictated. A report may be included in the patient encounter note with a proper heading, or it may be separately recorded. Documentation should indicate the medical necessity of the study, identify the structures or organs studied, and supply an interpretation of the findings. Image documentation, or archiving, is neces-sary for all diagnostic studies as well as for vascular access; however, images are not a requirement for the other proce-dural guidance ultrasounds. Standards directing how images are stored, on what recording media they are captured, where they are kept, the number of images per study, or other spe-cific requirements are not addressed by CPT and are usually regulated by departmental or hospital policy.
ACCREDITATIONThe American College of Radiology (ACR) established the first voluntary practice accreditation program in diagnostic radiology in 1966 (42). In 1990, the ACR’s first imaging
Most modern portable ultrasound machines now incorporate digital video recording as a standard feature. Wireless image transfer from machines to a server or dedicated computer is another common and desirable feature.
Incorporation of point-of-care images into the patient’s medical record is an important goal. This has quality assur-ance, billing, and compliance benefits, but also improves communication between specialties and allows comparisons between studies performed at different times. There are a number of software packages, which allow archiving, and retrieval of images. Some departments use a stand-alone solution; others store images with radiology or cardiology on their established PACS systems. This option requires caution, as another specialty has the potential to control emergency imaging, archiving, and potentially even reporting and bill-ing! Some electronic medical records are designed to directly incorporate medical images such as electrocardiograms, pa-per scans, and ultrasound images. Improvements in technol-ogy have greatly facilitated the ability to document imaging and interpretation, and information technology staff should facilitate finding the best option for each institution.
Finally, durability and equipment service are essential. Few environments are rougher on equipment than the ED. The constant movement of the unit, the potential for damage to transducers, and body fluids on exposed controls can all lead to device failure. Find out how you can obtain service, what is the anticipated downtime for required service, and include a service contract with any device purchase contract.
REIMBURSEMENTThe focused ultrasound procedures performed by emergency physicians represent physician work that is separate and dis-tinct from the work included in the evaluation and manage-ment codes (E&M codes). When medically indicated and properly documented, these ultrasound studies meet Cur-rent Procedural Terminology (CPT) service descriptions and should be reimbursed (4,37,41). Compliant reimbursement is complex, changes frequently, and is impacted by specific payer policies and by negotiated contractual relationships. Ultrasound reimbursement requires an understanding of the basic concepts of CPT coding, ICD-9 coding (International Classification of Diseases, 9th revision), and medical neces-sity in addition to medical record and image documentation. Emergency billing companies and emergency practice man-agers may not be familiar with the codes or requirements for billing these services and should be referred to the informa-tional paper, Emergency Ultrasound Coding and Reimburse-ment, available on the ACEP website (4).
CPT CodesCPT codes describe the service performed, and CPT code modifiers provide added information about the service pro-vided. For example, a limited ultrasound of the abdomen is coded as 76705. This is normally modified with a −26 modifier indicating that only the professional component and not the complete code, which includes the facility component, is being used. There are CPT codes that accurately describe each of the primary ultrasound studies. The one exception is the focused assessment with sonography in trauma (FAST) ex-amination, which is not described by a unique code. Rather, it

chapter 29 / Implementing Ultrasound into the Community Emergency Department 419
9. Mayo PH, Goltz HR, Tafreshi M, et al. Safety of ultrasound-guided thoracentesis in patients receiving mechanical ventilation. Chest. 2004;125:1059–1062.
10. American College of Radiology. ACR practice guideline for perform-ing and interpreting diagnostic ultrasound examinations. Revised 2011. http://www.acr.org/~/media/ACR/Documents/PGTS/guidelines/US_Performing_Interpreting.pdf. Accessed July 1, 2012.
11. Quinones MA, Douglas PS, Foster E, et al. ACC/AHA clinical compe-tence statement on echocardiography: a report of the American College of Cardiology/American Heart Association/American College of Phy-sicians-American Society of Internal Medicine Task Force on Clinical Competence. J Am Coll Cardiol. 2003;41:687–708.
12. Stewart WJ, Douglas PS, Sagar K, et al. Echocardiography in emer-gency medicine: a policy statement by the American Society of Echo-cardiography and the American College of Cardiology. Task force on echocardiography in emergency medicine of the American Society of Echocardiography and the Echocardiography and Technology and Prac-tice Executive Committees of the American College of Cardiology. J Am Coll Cardiol. 1999;33:586–588.
13. Kimura BJ, Pezeshki B, Frack SA, et al. Feasibility of “limited” echo imaging: characterization of incidental findings. J Am Soc Echocardiogr. 1998;11:746–750.
14. Galasko GI, Lahiri A, Senior R. Portable echocardiography: an innova-tive tool in screening for cardiac abnormalities in the community. Eur J Echocardiogr. 2003;4:119–127.
15. DeCara JM, Lang RM, Spencer KT. The hand-carried echocardio-graphic device as an aid to the physical examination. Echocardiography. 2003;20:477–485.
16. Kirkpatrick JN, Davis A, Decara JM, et al. Hand-carried cardiac ultrasound as a tool to screen for important cardiovascular disease in an underserved minority health care clinic. J Am Soc Echocardiogr. 2004;17:399–403.
17. Plummer D, Brunette D, Asinger R, et al. Emergency department echo-cardiography improves outcome in penetrating cardiac injury. Ann Emerg Med. 1992;21:709–712.
18. Tayal VS, Beatty MA, Marx JA, et al. FAST (focused assessment with sonography in trauma) accurate for cardiac and intraperitoneal injury in penetrating anterior chest trauma. J Ultrasound Med. 2004;23: 467–472.
19. Mandavia DP, Hoffner RJ, Mahaney K, et al. Bedside echocardiography by emergency physicians. Ann Emerg Med. 2001;38:377–382.
20. Tayal VS, Kline JA. Emergency echocardiography to detect pericar-dial effusion in patients in PEA and near-PEA states. Resuscitation. 2003;59:315–318.
21. Blaivas M, Fox J. Outcome in cardiac arrest patients found to have car-diac standstill on the bedside emergency department echocardiogram. Acad Emerg Med. 2001;8:616–621.
22. Salen P, O’Connor R, Sierzenski P, et al. Can cardiac sonography and capnography be used independently and in combination to predict resus-citation outcomes? Acad Emerg Med. 2001;8:610–615.
23. Moore CL, Rose GA, Tayal VS, et al. Determination of left ventricu-lar function by emergency physician echocardiography of hypotensive patients. Acad Emerg Med. 2002;9:186–193.
24. Labovitz AJ, Noble VE, Bierig M, et al. Focused cardiac ultrasound in the emergent setting: a consensus statement of the American Society of Echocardiography and American College of Emergency Physicians. J Am Soc Echocardiogr. 2010;23(12):1225–1230.
25. American College of Radiology. ACR practice guideline for radiolo-gist coverage of imaging performed in hospital emergency departments. American College of Radiology Web site. 2003. http://www.acr.org/~/media/16844DC5B39C45F986623D4BB8826744.pdf. Accessed July 1, 2012.
26. Shih CH. Effect of emergency physician-performed pelvic sonogra-phy on length of stay in the emergency department. Ann Emerg Med. 1997;29:348–351.
27. Blaivas M, Harwood RA, Lambert MJ. Decreasing length of stay with emergency ultrasound examination of the gallbladder. Acad Emerg Med. 1999;6:1020–1023.
28. Agency for Healthcare Research and Quality. Ultrasound guidance of central vein catheterization. In: Making Health Care Safer: A Critical Analysis of Patient Safety Practices. Chapter 21. http://www.ahrq.gov/clinic/ptsafety/. Accessed July 1, 2012.
standards were published, and they are periodically revised and updated (43). The ACR established the first sonogra-phy accreditation program in 1995 using these standards. Although this pathway was established for traditional imag-ing providers (radiologists), the AIUM has also established multi-specialty practice accreditation guidelines (44). In re-sponse to an increasing trend toward practice accreditation even for nontraditional imaging providers, other organiza-tions such as ACEP have begun investigating their potential role in providing accreditation. Given the political, financial, and quality of service ramifications, this will likely be a con-troversial and evolving topic for years to come.
CONCLUSIONThe addition of ultrasound to the practice of emergency medicine has presented multiple challenges for the emer-gency physician. These have included the clinical challenges of adapting ultrasound technology to the unique environment of the ED, of accumulating evidence supporting a variety of emergency applications, and of implementing effective train-ing for physician practitioners. Emergency physicians have addressed administrative challenges surrounding ultrasound program design, as well as the development of hospital credentialing criteria and quality assurance programs. In addition, emergency physicians have confronted politi-cal challenges that have centered on often difficult profes-sional relationships with providers of consulting ultrasound services, efforts to regulate the practice of emergency ultra-sound, and the demands of communicating the unfamiliar paradigm of emergency ultrasound.
Despite these challenges, ultrasound has been integrated into the training of emergency physicians and into the practice of emergency medicine. Emergency patients and emergency physicians have been rewarded with tangible benefits that include enhanced efficiency of emergency care, increased accuracy of diagnosis, and improved emergency patient outcomes.
REFERENCES 1. The Accreditation Council for Graduate Medical Education (ACGME).
Model of the Clinical Practice of Emergency Medicine. 2007. http://www.acgme.org/acWebsite/RRC_110/110_clinModel.pdf. Accessed July 1, 2012.
2. American College of Emergency Physicians Policy Statement. Emer-gency ultrasound guidelines. Approved 2008. http://www.acep.org/WorkArea/linkit.aspx?LinkIdentifier=id&ItemID=32878. Accessed July 1, 2012.
3. Tandy TK III, Hoffenberg S. Emergency department ultrasound services by emergency physicians: model for gaining hospital approval. Ann Emerg Med. 1997;29:367–374.
4. Hoffenberg SR, Tayal V, Dean A, et al. Emergency ultrasound coding and reimbursement. Ultrasound Section, ACEP. http://www.acep.org/workarea/downloadasset.aspx?id=33280. Accessed July 1, 2012.
5. Mayo PH, Beaulieu Y, Doelken P, et al. American College of Chest Physi-cians/La Societe de Reanimation de Langue Francaise statement on com-petence in critical care ultrasonography. Chest. 2009;135:1050–1060.
6. Fry WR, Clagett GC, O’Rourke PT. Ultrasound-guided central venous access. Arch Surg. 1999;134:738–740; discussion 741.
7. Rozycki GS, Pennington SD, Feliciano DV. Surgeon-performed ultra-sound in the critical care setting: its use as an extension of the physical examination to detect pleural effusion. J Trauma. 2001;50:636–642.
8. Osranek M, Bursi F, O’Leary PW, et al. Hand-carried ultrasound-guided pericardiocentesis and thoracentesis. J Am Soc Echocardiogr. 2003;16:480–484.

420 Section X / Implementing Ultrasound into the Clinical Setting
37. American College of Emergency Physicians. Use of ultrasound imaging by emergency physicians [policy #40121]. Ann Emerg Med. 2001;38: 469–470.
38. Society of Academic Emergency Medicine. Ultrasound position state-ment. SAEM Newsletter. Summer 1991.
39. American Medical Association. Privileging for Ultrasound Imaging. Chicago, IL: American Medical Association. House of Delegates policy H-230.960 (802.99.2001).
40. American Institute of Ultrasound in Medicine. Training guidelines for physicians who evaluate and interpret diagnostic ultrasound examinations. 2000. American Institute of Ultrasound Medicine website. http://www.aium.org/publications/viewStatement.aspx?id=14. Accessed July 1, 2012.
41. American College of Emergency Physicians. Interpretation of diagnostic studies. Policy #400109. Ann Emerg Med. 1997;29:572–573.
42. Amis ES. Noninterpretive skills for radiology residents: American College of Radiology Standards, Accreditation Programs, and Appro-priateness Criteria. AJR. 2000;174:307–310.
43. American College of Radiology. ACR–SPR–SRU practice guideline for performing and interpreting diagnostic ultrasound examinations Res. 7—2011. http://www.acr.org/~/media/ACR/Documents/PGTS/guide-lines/US_Performing_Interpreting.pdf. Accessed July 1, 2012.
44. American Institute of Ultrasound in Medicine. AIUM Standards and Guidelines for the Accreditation of Ultrasound Practices 2011. Avail-able at http://aium.org/resources/viewStatement.aspx?id=26. Accessed July 1, 2012.
29. Hind D, Calvert N, McWilliams R, et al. Ultrasonic locating devices for central venous cannulation: meta-analysis. BMJ. 2003:327:361.
30. Branney SW, Moore EE, Cantrill SV, et al. Ultrasound based key clinical pathway reduces the use of hospital resources for the evaluation of blunt abdominal trauma. J Trauma. 1997;42:1086–1090.
31. Frezza EE, Ferone T, Martin M. Surgical residents and ultrasound tech-nician accuracy and cost-effectiveness of ultrasound in trauma. Am Surg. 1999;65:289–291.
32. Durston WE, Carl ML, Guerra W, et al. Ultrasound availability in the evaluation of ectopic pregnancy in the ED: comparison of quality and cost-effectiveness with different approaches. Am J Emerg Med. 2000;18:408–417.
33. Durston W, Carl ML, Guerra W, et al. Comparison of quality and cost-effectiveness in the evaluation of symptomatic cholelithiasis with differ-ent approaches to ultrasound availability in the ED. Am J Emerg Med. 2001;19:260–269.
34. American College of Emergency Physicians Emergency Ultrasound Section, “Running a Program.” http://www.acep.org/_Ultrasound-Section-Microsite/Running-a-Program/?ACEPCN=v5rqr045byymr3adnmt13245A441739. Accessed July 1, 2012.
35. Allison EJ Jr, Aghababian RV, Barsan WG, et al. Core content for emer-gency medicine. Task Force on the Core Content for Emergency Medi-cine Revision. Ann Emerg Med. 1997;29:792–811.
36. Hockberger RS, Binder LS, Graber MA, et al. The model of the clinical practice of emergency medicine. Ann Emerg Med. 2001;37:745–770.

421
use for clinical applications, as well as assess the efficacy, cost effectiveness, and impact of point-of-care ultrasound on patient outcomes. Ultimately, academic centers need to train new leaders who can teach, write, and contribute to the future of the specialty.
This chapter will describe the qualities of an academic emergency ultrasound program, discuss how an aca-demic ultrasound program can further a department’s aca-demic mission, and detail the challenges facing an academic program.
CURRENT STATE OF EDUCATION IN EMERGENCY ULTRASOUNDThe first curriculum for emergency ultrasound was published in 1994 (1). Since that time, there has been a rapid growth in use, number and variety of applications, and improvement in point-of-care equipment. In 2001, ultrasound training became a required component of ACGME accredited emer-gency medicine training (2).There has been consistent orga-nizational support for the advancement of ultrasound training from professional societies, including the American College of Emergency Physicians (ACEP), the Society for Academic
INTRODUCTIONDuring the early evolutionary years of emergency ultra-sound, there was little distinction made between the pro-cesses needed to establish and build ultrasound programs in the community and academic environments. The two settings share some common challenges: obtaining ac-ceptance of point-of-care ultrasound as a standard of care, training and credentialing physicians, assuring quality, and maintaining equipment. However, there are important dif-ferences in the two practice settings, their mission, and the scope of activities they pursue. Academic programs have a greater range of trainees each with their own needs, in-cluding medical students, residents, fellows, and faculty staff. Leaders of academic programs have an expanded and critical role in defining content and developing cur-riculums appropriate for different levels of training. They should also lead the way in developing effective methods of teaching, using newer innovative methods such as asyn-chronous methods and simulation. Ultimately, they bear the responsibility of setting standards for assessing competency of trainees with a rigor that has seen increasing scrutiny in all areas of medical education. Academic centers also need to establish priorities for research to justify expanded
RESEARCH AND SCHOLARSHIP . . . . . . . . . . . . . . . . . . . . . 424PROGRAM ADMINISTRATION . . . . . . . . . . . . . . . . . . . . . . . 424RELATIONS WITH OTHER ACADEMIC DEPARTMENTS . . . . . 425ACADEMIC PROMOTION . . . . . . . . . . . . . . . . . . . . . . . . . . . 425
Clinical Activity . . . . . . . . . . . . . . . . . . . . . . . . . . . . . . 425Teaching Activity . . . . . . . . . . . . . . . . . . . . . . . . . . . . . 426Research and Scholarly Activity . . . . . . . . . . . . . . . . . 426Service Activity . . . . . . . . . . . . . . . . . . . . . . . . . . . . . . 426
FUTURE CHALLENGES . . . . . . . . . . . . . . . . . . . . . . . . . . . . . 426
INTRODUCTION . . . . . . . . . . . . . . . . . . . . . . . . . . . . . . . . . . 421CURRENT STATE OF EDUCATION IN EMERGENCY
ULTRASOUND . . . . . . . . . . . . . . . . . . . . . . . . . . . . . . . . . 421LEADERSHIP . . . . . . . . . . . . . . . . . . . . . . . . . . . . . . . . . . . . 422SCOPE OF CLINICAL PRACTICE . . . . . . . . . . . . . . . . . . . . . . 422EDUCATION AND CURRICULUM DEVELOPMENT . . . . . . . . . 422
Faculty . . . . . . . . . . . . . . . . . . . . . . . . . . . . . . . . . . . . . 422Residents . . . . . . . . . . . . . . . . . . . . . . . . . . . . . . . . . . 423Ultrasound Fellows . . . . . . . . . . . . . . . . . . . . . . . . . . . 423Medical Students . . . . . . . . . . . . . . . . . . . . . . . . . . . . . 424Other Specialties . . . . . . . . . . . . . . . . . . . . . . . . . . . . . 424
David P. Bahner, Eric J. Adkins, and John L. Kendall
Implementing Ultrasound into the Academic
Emergency Department
30

422 Section x / Implementing Ultrasound into the Clinical Setting
Emergency Medicine (SAEM), and the American Board of Emergency Medicine (ABEM); these organizations provide valuable resources for training programs and professional development. In 2008, consensus recommendations from the Council of Residency Directors (CORD) were released in an effort to set minimum training guidelines for residency training (3). Current training programs have assorted training methods and guidelines. A 2010 survey of training programs in emergency medicine reported that 79% of programs had structured ultrasound curriculums; some programs rely on self-directed learning largely dependent upon resident inter-est and effort (4). However, in the same year, a survey found that most (98%) graduates of emergency medicine programs make use of ultrasound in their day-to-day clinical prac-tice (5). As interest has grown, ultrasound fellowships have evolved out of the desire for advanced training and to meet the need for experts to lead academic departments. There are currently 84 ultrasound fellowships available in the United States. While there has been much growth and expansion in the use of ultrasound, there remains considerable variation between programs.
LEADERSHIPHistorically, the individual with the role of Ultrasound Direc-tor may have been a faculty member who simply had an in-terest in ultrasound, but who ultimately may not have viewed the position as a potential area of academic focus or career development. As emergency ultrasound has grown, the po-tential for an academic career focused on ultrasound and the vision of academic centers have changed. Advanced and spe-cialized training in point-of-care ultrasound is now widely available, including ultrasound fellowships; this training pro-vides an opportunity to develop not only advanced, expanded sonography skills, but also skills in program administration, teaching, and research. The talent and skills required to fill the role of Ultrasound Director have become increasingly more defined and demanding.
Leaders of ultrasound programs should be recognized as expert emergency sonographers. Their ultrasound expertise should be more advanced than a graduate from an emergency medicine residency program. Furthermore, their knowledge of advanced applications should be the basis for leading the department to implement new and cutting edge applications for bedside ultrasound.
Ultrasound faculty should also be renowned for their educational skill set, since it requires special talent to con-vey technology that includes motion, while at the same time doing it in such diverse settings as large and small groups, simulation centers, and at the bedside. Besides, ultrasound educators must be able to teach the skills to perform an exam, make diagnostic decisions, and guide procedures using ultrasound. As a result, the tool kit of ultrasound education involves much more than the ability to give a lecture.
The ultrasound leader needs to possess skill and profi-ciency in scholarly activities and research. The expertise of a superior Ultrasound Director can advance the research agenda that drives the search for new applications, ap-proaches, or utilization of bedside ultrasound. When success-ful, an academic ultrasound leader places his/her department at the forefront of advances in ultrasound. Second, he/she
contributes to the academic mission of the department and, when completed, serves to advance faculty toward academic promotion. Lastly, he/she mentors residents in scholarly ac-tivity early in their career.
Finally, ultrasound faculty need to be able administrators to organize and maintain ongoing image review, quality as-surance, competency assessment, and machine maintenance for both faculty and residents, sometimes practicing at mul-tiple sites.
Academic departments who lead the way in ultrasound teaching and research may find that the job of Ultrasound Director is bigger than any one individual. Large programs with diverse programmatic, administrative, and teaching needs or major ultrasound research efforts may require the resources of several faculty. Consequently, it may be advis-able to combine the faculty’s talents in a Section or Division of Emergency Ultrasound. Specific guidelines for develop-ing a Section or Division within an academic department are typically defined by rules within the School of Medicine and will vary from institution to institution.
SCOPE OF CLINICAL PRACTICEA number of factors unique to an academic setting will drive the scope of clinical practice and the most relevant ultrasound applications. Most notably, educational needs of trainees should govern applications incorporated into clinical practice. Priority should be given to applications utilized dur-ing the resident’s clinical rotations, those they will be tested on for specialty certification, and skills they will need to en-ter the work force and stay up to date with current and future practice standards.
This approach to developing a scope of practice incor-porates current recommendations, while also maintaining a vision for applications that will shape clinical practice after residents have completed their training. For example, current ACEP ultrasound guidelines should be considered the foun-dation for developing a scope of practice (6) (Table 1.1). True to the explorative nature of an academic setting, the ACEP-defined applications should not be considered exhaustive, but instead a starting point for defining clinical practice. Certain centers will have specific research, procedural, and population needs that will further define the scope of clinical practice.
EDUCATION AND CURRICULUM DEVELOPMENTOnce the scope of clinical practice has been defined, atten-tion can be directed toward the department’s educational needs. In an academic ultrasound program, training can in-volve widely different audiences, educational backgrounds, preferred methods of delivery, and learning objectives. Not uncommonly, education is needed for faculty, residents, ultrasound fellows, medical students, and in some cases, physicians from other academic specialties or other medical providers. Each group merits special mention since they are varied in their educational challenges and needs.
FacultyThe education of emergency medicine faculty is a unique challenge since they represent diverse backgrounds, interests,

chapter 30 / Implementing Ultrasound into the Academic Emergency Department 423
scanning technique, image acquisition, and interpretation. Lastly, a portion of the studies performed by the resident should be captured in either still image or video format for subsequent review by an ultrasound faculty. This is not only an opportunity for quality assurance, but also for timely feed-back to the resident.
In addition to introductory education, an ultrasound ro-tation, and the ability to incorporate ultrasound into daily practice, it is important to develop a longitudinal ultrasound curriculum. This can be incorporated into the core curric-ulum and is recommended to include at least 20 hours of didactics specifically related to ultrasound over the course of a 3- or 4-year emergency medicine training program.
Ideally, after completing an ultrasound curriculum over the course of Emergency Medicine training, the resident will have met the standards for education and number of studies as outlined in the ACEP Guidelines (6).
Ultrasound FellowsEmergency ultrasound fellow education requires a signifi-cant time commitment and goes well beyond resident or fac-ulty ultrasound education in terms of scope and depth. In addition to advanced sonography skills, ultrasound fellow-ship training should have significant time devoted to program administration, teaching methods, and research. The basic requirements for an ultrasound fellowship are outlined in the ACEP Ultrasound Fellowship Guidelines (8).
The emergency ultrasound fellowship administrative cur-riculum should prepare fellows to be future leaders in an aca-demic or community program. As such, it should provide the tools to effectively communicate and develop relationships with individuals or groups necessary for the formation, de-velopment, and administration of a program. This includes, but is not limited to, hospital and medical personnel associ-ated with the ultrasound program, department physician and nonphysician providers, departmental nurses and technicians, and a variety of hospital representatives such as materials management, biomedical engineering, purchasing, infection control, the institutional review board, and medical staff ser-vices. In addition, the ultrasound fellow should have a solid grasp of requirements for program maintenance, workflow solution, quality improvement and risk management, coding and billing, and hospital and healthcare system interfaces.
Ultrasound fellows should learn a variety of educational techniques and approaches. At the end of their training, the fellows should have a mastery of content knowledge and the ability to convey this knowledge to others. As future lead-ers in the field of emergency ultrasound at departmental, national, and international levels, the ability to teach and disseminate information is crucial. Aspects of teaching that ultrasound fellowships promote include, but are not limited to, educational content development, presentation of educa-tional content (lecture and oral presentation skills as well as technical knowhow in developing presentations with video support), bedside hands-on instruction, and development and use of competency assessment tools.
The research component of the emergency ultrasound fel-lowship curriculum must involve education in standard medi-cal research methodologies to help them critically evaluate the literature, and successfully plan and publish quality research.
To date, an accreditation process of ultrasound programs or a certification process of ultrasound fellows has not been
and abilities to assimilate new information. Their education is essential to the success of an ultrasound program; without their skills, the ability to incorporate point-of-care ultrasound into bedside decision making will inevitably be undermined for residents in training. Some departments offer time off for faculty to attend an ultrasound course; orchestrating a group of faculty to train together may be difficult. Consequently, the educational approach should prioritize flexibility. One method involves creation of didactic educational content that can be distributed electronically. This approach allows users to access the material at a convenient time and place and at their own pace. An alternative to developing de novo material is to use existing educational websites or electronic media. Regardless of how the didactic content is acquired, it is ex-tremely important that it is robust enough to adequately train faculty to the scope of applications expected at their site of clinical practice.
Equally necessary, but also difficult to arrange, is the hands-on portion of the education. One approach is to sched-ule sessions where faculty can do their scanning in a group. Another method is to schedule ultrasound scanning “office hours.” This entails assigning ultrasound faculty to a specific period of time in the clinical area where faculty members can scan with them one-on-one. These sessions can be devoted to specific applications or as an opportunity for faculty to hone their skills in areas of need.
Following successful completion of ultrasound educa-tion, faculty should obtain privileges for bedside ultrasound as outlined in Chapter 29.
ResidentsEducation of emergency medicine residents needs to be planned as a part of their formal didactic and experiential curriculum. Studies show significant variability in ultrasound training of residents (4). Fortunately, a number of alterna-tives exist for ensuring adequate resident ultrasound training. One method involves devoting a portion of the orientation schedule to ultrasound training. For example, a one-day course employing didactic and hands-on instruction can be used to introduce ultrasound early in training.
Following the introductory education, residents should be exposed, at a minimum, to 2 weeks of dedicated ultrasound instruction in the form of an ultrasound rotation, which has been shown to improve resident’s ultrasound knowledge and interpretation accuracy (7). It is the responsibility of an academic ultrasound program to ensure that the ultrasound rotation curriculum is robust and consistent from resident to resident over the course of an academic year. This is ex-tremely important as one study found that 21% of programs had a resident “self-directed” curriculum, and only 64% of programs adhered to the ACEP Ultrasound Guidelines (4). Consequently, minimum requirements of a rotation should include predetermined didactic offerings, hands-on scanning, and video or image review. The didactics should cover ba-sic and advanced applications and can be supplemented with reading assignments or access to multimedia educational modules. Hands-on sessions should occur in the form of scanning shifts, where residents have blocks of time without other patient care responsibilities to hone their sonography and ultrasound-guided procedural skills. A significant por-tion of the scanning shifts should be planned to occur with an ultrasound faculty member who can provide feedback on

424 Section x / Implementing Ultrasound into the Clinical Setting
to the breadth of applications emergency physicians utilize in their daily clinical practice, there are many specialties that may seek to perform similar exams but who do not have the necessary training. Unfortunately, many of these specialties have yet to develop educational content or curriculums, so the creation of courses should be done in conjunction with the individual specialist in order to meet their training goals.
RESEARCH AND SCHOLARSHIPThe identity of an academic program is largely defined by its research agenda. While each program will likely have unique areas of focus and interest, the end result of research endeav-ors should be the same, which is to demonstrate the utility of bedside ultrasound. Specific areas of clinical research may include those that: (1) prove the impact of ultrasound on pa-tient care in terms of time to diagnosis, and improved out-comes and efficiency in diagnosis; (2) quantify the impact of ultrasound on patient safety and quality such as optimizing early diagnosis, improving time to treatment, or minimizing unnecessary procedures including ionizing radiation; and (3) demonstrate the impact of bedside ultrasound on efficiency, flow, and throughput. Ultrasound education remains an area with many unanswered questions requiring investigation such as defining the content for different stages of training, determining optimal teaching methods, and establishing ap-propriate methods for determining competency. Ultimately, the role of an academic program in research and scholar-ship is to clarify many of these issues in a way that advances ultrasound locally, nationally, and internationally.
The approach to developing a research program and agenda will be largely determined by departmental needs, re-sources, and the overall mission. These factors will not only affect the type of research performed, but also how it is con-ducted. For example, certain departments may have research networks and resources already established that are easily accessible by ultrasound faculty. Alternatively, if a depart-mental research program is not present, ultrasound faculty may need to solicit help from an outside source. Many medi-cal centers will have clinical epidemiology graduate students who can help with study design and analysis, while another option is coordinating research with another academic de-partment that has a research program.
PROGRAM ADMINISTRATIONThere is little distinction between academic and community programs in terms of program administration. Each has re-sponsibility for quality assurance, credentialing, equipment selection and maintenance, and image archival, which are discussed in Chapter 29. The primary difference lies in the number of physicians included in the program’s administra-tion needs and their varying locations of clinical practice. For example, it is common that both residents and faculty are involved at varying sites of clinical practice, which adds a layer of complexity to program administration.
A key aspect to program administration across many pro-viders and sites of practice is an effort to maintain consistency throughout. While equipment may vary from hospital to hos-pital, there should be a uniform approach to image archival, quality assurance, credentialing, and competency assessment. This entails a level of coordination that is not commonly seen
developed. While efforts are underway to formalize this pro-cess, at the time of this writing, the details of both are still under consideration.
Medical StudentsUltrasound education in an academic setting may also involve integration into undergraduate medical education. While there is no standard approach for implementation, the decision to move forward should be made with caution, given that it can become a significant educational, administrative, and mon-etary endeavor. Before embarking on a medical student ultra-sound curriculum, a number of issues should be considered.
First, the scope of the effort should be determined. The most likely group to consider initially is senior medical stu-dents, in particular, those going into emergency medicine. Education can occur through a number of offerings, including specific evening events that include scanning to a dedicated course in bedside ultrasound offered through the School of Medicine. If the latter is pursued, the curriculum should in-clude a combination of didactic and scanning sessions in order to prepare students for their ultrasound needs during residency training. Competency at the end of the rotation can be assessed through a written and/or practical test, direct observation, im-age or video review, or a combination of methods.
Another approach is integrating ultrasound earlier in the medical student curriculum, even before clinical ro-tations. This has been done successfully at a number of schools by either offering a separate diagnostic ultrasound curriculum (9,10) or linking ultrasound with other aspects of the curriculum such as anatomy or the physical exam (11–13). If the second approach is taken, ultrasound is used to demon-strate or complement anatomy or physical exam teaching. To date, the preferred approach has not been defined, although in our opinion, using ultrasound to supplement an existing curriculum is far easier to institute as opposed to developing a stand-alone diagnostic ultrasound curriculum.
A second consideration is recruitment of faculty, espe-cially if the scope of the education involves an entire class of medical students. While Emergency Medicine faculty and residents are likely sources to recruit faculty, other specialties can and should be involved as well. For instance, an echo ses-sion may involve recruitment of cardiology-trained faculty or fellows; abdomen could be taught by Radiology and their res-idents; and nerves or vascular access can be led by anesthe-siology personnel. Another source of faculty is to use senior medical students as peer faculty. This has been found to be an effective method for obtaining additional faculty (14–16).
Whatever the source of the faculty, it is important to maintain faculty-to-student ratios that optimize the student’s learning opportunities. Learning is likely to be compro-mised if the ratio is greater than 5 or 6:1. In addition to the number of recruited faculty, factors to be considered that affect the student-to-faculty ratio are the number of avail-able ultrasound units and the classroom space to perform the scanning sessions. Each of these factors should be consid-ered in the planning and budget of an undergraduate medical student ultrasound curriculum.
Other SpecialtiesLastly, an academic ultrasound program may be solicited to provide education to physicians from other specialties. Due

chapter 30 / Implementing Ultrasound into the Academic Emergency Department 425
on anatomy, the physical exam, or is devoted to teaching diagnostic ultrasound, there are frequently scanning oppor-tunities involving echocardiography, vascular, abdominal, or musculoskeletal imaging.
Academic centers also provide many opportunities for re-search that can be coordinated with other specialties. Ultra-sound may be integrated within other research studies within the institution, or may be the main focus of new research. Whenever ultrasound is implemented in new diagnostic and treatment pathways, the potential for collaboration exists within a network of providers, including intensivists, hospi-talists, and surgeons.
Consideration must be given to potential downsides in coordinating ultrasound efforts with other specialties. For example, emergency physician participation in ultrasound-related activities in an academic setting may be viewed as a threat to traditional imaging specialties. One approach to combating this tension is to refer to joint ultrasound policies that have been developed between emergency medicine and other specialties (17,18). Another approach is to include the traditional imaging providers in efforts such as protocol cre-ation, research, or undergraduate medical education.
Another downside to emergency ultrasound faculty ex-panding their reach beyond the emergency department (ED) is that it can be a significant time commitment. Assuming that departmental responsibilities take priority over other specialty efforts, it is difficult to imagine anything significant being accomplished without additional academic relief. Ini-tially, it is prudent to approach the Chair to balance potential benefits of engagement with other specialties. If there is a perceived benefit to the department, the Chair may distribute administrative relief. Another alternative, especially if edu-cation is provided to another department, is to negotiate for payment to come back to the department of emergency medi-cine, which can be translated into shift or academic relief. A third option, which would arise in circumstances where education is provided at the level of the School of Medicine, is to approach the Dean for administrative relief to cover time devoted to undergraduate education. Creativity, innovation, and problem solving are desired traits in academic medical centers focused on a competitive edge. Introduction of ultra-sound into undergraduate medical education is one way to promote and demonstrate a state-of-the-art and even futuris-tic academic vision.
ACADEMIC PROMOTIONTo a certain degree, the merit of an academic ultrasound program will be evaluated through the prism of academic promotion. From a departmental perspective, the ultrasound program will be expected to fulfill a mission that involves clinical, teaching, scholarly, and service activity. On an indi-vidual level, faculty will be expected to demonstrate activity in these areas in order to advance their academic career. Since ultrasound offers certain unique opportunities, it is important to consider each of the four academic pillars from the perspective of an ultrasound faculty.
Clinical ActivityAttaining excellence in clinical activity should be relatively easy for ultrasound faculty, though it is vital that evidence is provided to illustrate the utility of ultrasound in clinical
in a community setting. For instance, image archival can be a significant administrative hurdle to overcome. Previous methods of collecting and storing thermal images are not feasible in the current digital age, and tracking and reviewing images are even more difficult when multiple sites are in-volved. While some centers have migrated to storing studies on Picture Archival and Communication System (PACS), this can meet with resistance from Radiology, as well as being a cumbersome interface and an increased expense. As a result, third-party companies have developed systems that interface with the ultrasound machine and an image archival system, but no standards have been developed for this process.
Credentialing and quality assurance can also present unique administrative challenges in an academic center, primarily because of the need to assess trainees as well as faculty. In most centers, faculty can be handled similarly to any other hospital setting where they apply for ultrasound privileges, are credentialed, and then have quality assurance done on subsequent studies. Trainees are unique, not only because they are working under their supervising attend-ing’s license and privileges and therefore are not creden-tialed themselves, but also because they need to document their studies and have them reviewed to illustrate ultrasound proficiency. This necessitates trainees having a method for recording and storing their studies, regardless of their site of practice, and that 100% of these studies are reviewed for quality. Since there is no certificate for bedside ultrasound and residents cannot be credentialed, the Program Director or Ultrasound Director should provide verification of ultra-sound proficiency upon the resident’s graduation. This is usually done in the form of a letter that can be provided to a respective hospital’s Credentialing Department as part of the initial privilege application. Examples of letters can be found on the ACEP ultrasound section website.
RELATIONS WITH OTHER ACADEMIC DEPARTMENTSEmergency medicine is in a unique position in many academic centers with regard to clinician-performed ul-trasound. While it may seem to some that emergency ultra-sound is a new phenomenon, in fact, the clinical, political, educational, and organization efforts are far more advanced than those found in many other nontraditional imaging spe-cialties. This position within the academic environment may lead to both positive and negative interactions with other specialties.
Among the positives, emergency ultrasound faculty may be asked to provide education for faculty or residents from other specialties. While this scenario may seem far-fetched, in reality, emergency physicians may be uniquely equipped to provide hands-on education due to their daily integration of ultrasound into clinical practice. Examples of specialties that may seek ultrasound education include critical care, in-ternal medicine, surgery, pediatrics, or rheumatology. This list is likely to grow as more specialties adopt point-of-care ultrasound into their clinical practice.
Emergency sonographers can also seek to coordinate with other academic specialties to provide ultrasound education. One example is medical student education, since many un-dergraduate curriculums incorporating ultrasound span mul-tiple imaging specialties. Whether the curriculum is based

426 Section x / Implementing Ultrasound into the Clinical Setting
It is therefore important for ultrasound faculty to become extremely familiar with their own institution’s criteria and utilize that information to guide plans for promotion.
FUTURE CHALLENGESThe rapid growth of academic emergency ultrasound has been dramatic, but challenges remain. Certainly, the idea of an academic ultrasound program, in itself, might constitute a “challenge” to many outside of the academic ultrasound community. While many programs are in the early stages of development, it is fairly clear that the future will include sig-nificant growth in academic ultrasound programs. The future challenge then lies in developing a plan for implementation and harnessing support and resources to move forward. It is also important to consider the perspective of a Chair, who may be familiar with Divisions or Sections from other departments that justify their existence by extensive grant support. Since self-sustaining resources and grant support are unlikely to be widespread across academic ultrasound programs in the near future, it is important to outline other justifications for establishing the program.
A future challenge that all academic ultrasound programs will face is the development of a standardized curriculum. Across the specialty there is an unsettling discontent. Pub-lished curriculums tend to list applications with little direc-tion for how to teach them. Effective methods for delivering content, teaching skills, and measuring competency need to be developed. In addition, there are unresolved issues regard-ing priorities in education, ideal training models, and optimal ways to validate training methods. All academic programs should be involved in education on some level, whether it is at the medical student, resident, or ultrasound fellow level. As knowledge, skills, and technology all evolve, there is a growing interest in using point-of-care ultrasound across many medical specialties. There is a move toward more edu-cation in ultrasound across the continuum of medical educa-tion. Some have taken the lead to integrate ultrasound into general medical school courses; emergency physicians have taken the lead in teaching and developing training for medi-cal students. In addition, other specialties within the medi-cal center may look to emergency medicine to coordinate training for their use, including intensivists, hospitalists, and surgeons. To what extent any single department engages this interaction may depend upon the resources of each depart-ment and the vision of an individual champion.
A major challenge to academic ultrasound programs is development of criteria to determine competency. Histori-cally, competency of medical practice has been assessed by a number of different methods including years of postgraduate training, volume of cases seen, and number of procedures performed. Despite these efforts, none have been found to be either adequate or reliably applied to a number of different procedural competencies. Historically, the number of studies performed by the sonographer has determined competency of bedside ultrasound. This approach does not account for learn-ers with prior experience, greater technical ability, or more training. Other methods have included objective structured clinical exams (OSCEs), web-based assessment (19, 20), or simulation (21). These methods are extremely labor inten-sive, require expensive equipment, have not been validated
practice. For instance, global measures such as length of stay, patient satisfaction, or utilization of resources can be at-tributed to ultrasound implementation. Additional measures may involve the impact of ultrasound on specific clinical situations or through inclusion in protocols. Examples may include central venous access, cardiac arrest and resuscita-tion, or management of patients with undifferentiated hypo-tension. Additional avenues for demonstrating the effect of ultrasound on clinical practice are to measure the effect on an individual level such as tracking the number of studies performed or billing indices for each faculty.
Teaching ActivityThe education portion of an academic ultrasound faculty’s dossier should be one of the strongest areas, primarily due to all of the opportunities to demonstrate excellence in teach-ing. Obvious examples include teaching provided for faculty, fellows, residents, students, and clinicians from other special-ties. Education provided outside the academic medical cen-ter such as regional, national, and international conferences should be clearly documented in the dossier. Whenever pos-sible, the addition of evaluation scales or any teaching awards provides supporting evidence of teaching expertise. Addition-ally, creation of syllabi, courses, educational content, web-sites, or other electronic media are common areas of teaching for ultrasound faculty. Lastly, demonstrating a mentee–men-tor relationship is a means to illustrate teaching excellence. While listing the names of the mentees has value, it is ad-ditionally important to quantify the impact of the mentorship through listing publications or academic achievement attained by the mentee as a result of the relationship with the mentor.
Research and Scholarly ActivityWhile research excellence can be demonstrated by peer- reviewed publications, grants, and patents, there are ample opportunities for emergency ultrasound faculty to demon-strate scholarly excellence in the absence of a strong research dossier. One example is the area of teaching scholarship where excellence can be illustrated by developing a new course or curriculum. While peer-reviewed publications are also a marker of scholarship, other publications such as book chapters, reviews, or abstracts can also add to a scholarship dossier. Another area of scholarship that frequently involves ultrasound is demonstrating the impact on outcomes or im-provements in delivery of care. Even though ultrasound fac-ulty frequently undertakes efforts such as these, commonly the effect on outcomes or the intervention is undocumented, which lends little evidence that excellence was attained.
Service ActivityDemonstrating service excellence is not necessary for aca-demic promotion, but since many ultrasound faculty are extensively involved in committees, organizations, and work-ing groups, it is important to outline that involvement in the dossier. Additionally, other areas of academic involvement such as editorial board positions, elected positions, or awards from local, national, or international service organizations are also considered service.
The preceding discussion should be qualified by the fact that each School of Medicine has unique promotion criteria.

chapter 30 / Implementing Ultrasound into the Academic Emergency Department 427
9. Hoppmann RA, Rao VV, Poston MB, et al. An integrated ultrasound curriculum (iUSC) for medical students: 4-year experience. Crit Ultra-sound J. 2011;3(1):1–12.
10. Rao S, van Holsbeeck L, Musial JL, et al. A pilot study of comprehensive ultrasound education at the Wayne State University School of Medicine: a pioneer year review. J Ultrasound Med. 2008;27(5):745–749.
11. Sweetman GM, Crawford G, Hird K, et al. The benefits and limitations of using ultrasonography to supplement anatomical understanding. Anat Sci Educ. 2013;6(3):141–148.
12. Swamy M, Searle RF. Anatomy teaching with portable ultrasound to medical students. BMC Med Educ. 2012;12:99.
13. Fodor D, Badea R, Poanta L, et al. The use of ultrasonography in learn-ing clinical examination—a pilot study involving third year medical students. Med Ultrason. 2012;14(3):177–181.
14. Jeppesen KM, Bahner DP. Teaching bedside sonography using peer mentoring: a prospective randomized trial. J Ultrasound Med. 2012;31(3):455–459.
15. Celebi N, Zwirner K, Lischner U, et al. Student tutors are able to teach basic sonographic anatomy effectively—a prospective randomized con-trolled trial. Ultraschall Med. 2012;33(2):141–145.
16. Knobe M, Munker R, Sellei RM, et al. Peer teaching: a randomised con-trolled trial using student-teachers to teach musculoskeletal ultrasound. Med Educ. 2010;44(2):148–155.
17. Bahner D, Blaivas M, Cohen HL, et al. AIUM practice guideline for the performance of the focused assessment with sonography for trauma (FAST) examination. J Ultrasound Med. 2008;27(2):313–318.
18. Labovitz AJ, Noble VE, Bierig M, et al. Focused cardiac ultrasound in the emergent setting: a consensus statement of the American Society of Echocardiography and American College of Emergency Physicians. J Am Soc Echocardiogr. 2010;23(12):1225–1230.
19. Tabriz DM, Street M, Pilgram TK, et al. Objective assessment of op-erator performance during ultrasound-guided procedures. Int J Comput Assist Radiol Surg. 2011;6(5):641–652.
20. Markowitz JE, Hwang JQ, Moore CL. Development and valida-tion of a web-based assessment tool for the extended focused assess-ment with sonography in trauma examination. J Ultrasound Med. 2011;30(3):371–375.
21. Sidhu HS, Olubaniyi BO, Bhatnagar G, et al. Role of simulation-based education in ultrasound practice training. J Ultrasound Med. 2012;31(5):785–791.
over a number of different applications or sonographers, and are difficult to extrapolate to a large number of providers.
The number of applications for point-of-care ultrasound seems almost endless, and the potential range of clinicians who can benefit from ultrasound is rapidly expanding. It may be wise to pause for reflection. Each academic department may need to decide the number and type of applications they wish to teach, study the best ways to train and certify their trainees, and also decide whom they wish to train. As expertise grows, it is wise to carefully consider how best to incorporate ultrasound to optimize the care of patients.
REFERENCES 1. Mateer J, Plummer D, Heller M, et al. Model curriculum for phy-
sician training in emergency ultrasonography. Ann Emerg Med. 1994;23(1):95–102.
2. Hockberger RS, Binder LS, Graber MA, et al. The model of the clinical practice of emergency medicine. Ann Emerg Med. 2001;37(6):745–770.
3. Akhtar S, Theodoro D, Gaspari R, et al. Resident training in emer-gency ultrasound: consensus recommendations from the 2008 Council of Emergency Medicine Residency Directors conference. Acad Emerg Med. 2009;16(suppl 2):S32–S36.
4. Ahern M, Mallin MP, Weitzel S, et al. Variability in ultrasound edu-cation among emergency medicine residencies. West J Emerg Med. 2010;11(4):314–318.
5. Dean AJ, Breyer MJ, Ku BS, et al. Emergency ultrasound usage among recent emergency medicine residency graduates of a convenience sam-ple of 14 residencies. J Emerg Med. 2010;38(2):214–220, quiz 20–21.
6. American College of Emergency Physicians. Emergency ultrasound guidelines. Ann Emerg Med. 2009;53(4):550–570.
7. Mahler SA, Swoboda TK, Wang H, et al. Dedicated emergency depart-ment ultrasound rotation improves residents’ ultrasound knowledge and interpretation skills. J Emerg Med. 2012;43(1):129–133.
8. American College of Emergency Physicians. Emergency ultrasound fellowship guidelines. An information paper. A consensus document developed by the ACEP emergency ultrasound section. http://www.acep .org/clinical---practice-management/emergency-ultrasound-fellowship-guidelines. Accessed March 4, 2013.

428
EXISTING LITERATUREMultiple Casualty IncidentsUnique characteristics of the multiple casualty incident (MCI) setting highlight the versatility of ultrasound for disaster re-sponse. Several descriptive reports of earthquake, tsunami, tropical storm, and mudslide disaster response describe an important role for ultrasound in relief efforts (1–6). Hospital diagnostic imaging capabilities, if available, are uniformly overwhelmed by patient volume during an MCI, and ultra-sound becomes the preferred imaging modality based on its efficiency, accessibility, and portability (5). The benefit of ultrasound portability is magnified when access to imaging equipment is limited due to destruction or concerns of struc-tural damage to hospital facilities hampering access to diag-nostic imaging (1). In such settings, sonographic evaluation is frequently performed outside or in makeshift care areas (1). MCIs frequently occur in developing countries or remote areas where ultrasound may be the only diagnostic imaging modality locally available (7). Local ultrasound machines and provider skills may be a vital resource during the immediate response phase, which relies solely on local resources (7).
Several applications have been described during the im-mediate response phase of an MCI. Ultrasound is primarily utilized to triage for surgery or evacuation, differentiate he-modynamically unstable patients, evaluate acute injury, and guide immediate interventions and procedures (1,5).
Ultrasound is potentially of greatest use when large numbers of casualties create high demand for rapid assessment and tri-age. Ultrasound was used during initial response by earthquake response teams in China, Armenia, Haiti, and Turkey as well
INTRODUCTIONRapid growth of new ultrasound applications is underway outside the traditional hospital setting. Disaster relief work-ers, medical personnel in austere settings, military personnel, prehospital providers, and patient transport teams are utiliz-ing ultrasound with increasing frequency because it provides rapid and accurate patient assessment so paramount to timely and effective patient care. Regardless of the clinical setting, real-time diagnostic information provided by ultrasound can aid decision making. This is perhaps most true in the initial care of the undifferentiated patient frequently encountered in the prehospital setting, allowing early-care decisions and interventions to be made with increased certainty. Space re-strictions, extreme environmental conditions, equipment limi-tations, or occasionally an overwhelming number of patients in need of care create extraordinary challenges. Ultrasound offers a highly versatile point-of-care resource ideal for these challenging settings.
Different out-of-hospital environments present unique technological challenges. For example, a military medic in the middle of a desert firefight using handheld ultrasound to diagnose and treat a pneumothorax may have different equipment requirements than a helicopter transport team monitoring a patient with a high-risk pregnancy. Recent developments in ultrasound technology have improved machine portability, performance under extreme environ-mental conditions, image quality, and software functioning. Research and development is meeting the challenges of the out-of-hospital setting, adapting to the unique demands of the prehospital environment and expanding the realm of ultrasound use.
Leadership and Infrastructure . . . . . . . . . . . . . . . . . . . 432Equipment and Power Supply
Management . . . . . . . . . . . . . . . . . . . . . . . . . . . . . . 432Training . . . . . . . . . . . . . . . . . . . . . . . . . . . . . . . . . . . . 433Quality Assurance . . . . . . . . . . . . . . . . . . . . . . . . . . . . 433
CONCLUSIONS AND FUTURE DIRECTIONS . . . . . . . . . . . . . 433
INTRODUCTION . . . . . . . . . . . . . . . . . . . . . . . . . . . . . . . . . . 428EXISTING LITERATURE . . . . . . . . . . . . . . . . . . . . . . . . . . . . 428
Multiple Casualty Incidents . . . . . . . . . . . . . . . . . . . . . 428Military . . . . . . . . . . . . . . . . . . . . . . . . . . . . . . . . . . . . 429Emergency Medical Services . . . . . . . . . . . . . . . . . . . . 431
PROGRAM IMPLEMENTATION . . . . . . . . . . . . . . . . . . . . . . . 432
Nicole Danielle Hurst
Implementing Ultrasound in the Prehospital Setting
31

Chapter 31 / Implementing Ultrasound in the Prehospital Setting 429
as during an MCI in the Second Lebanon Wa (1,4–8). After the Wenchuan earthquake in China, the Focused Assessment with Sonography for Trauma exam (FAST) was the primary imag-ing tool for trauma during the first 72 hours of the incident, and was used to evaluate 1386 of 3307 patients presenting to one response team (1). During the early response phase of the 1988 Armenian earthquake, 400 out of 750 injured patients were evaluated using ultrasound, deteing traumatic injuries of the abdomen in 12.8% of patients (5). Response teams for these two major earthquakes used ultrasound to triage patients for surgery by prioritizing sonographic evaluation of patients with unstable hemodynamics, limb or trunk injury with suspected visceral injury, and altered mental status (1,5). Major sono-graphic findings reported after earthquakes in the acute phase included hemoperitoneum, hemothorax, solid organ injury, renal injury, and musculoskeletal injury (1,5,6). In many cases, decisions for surgical intervention were based solely on physi-cal exam and sonographic findings (5). In an MCI during the Second Lebanon War, 849 civilian and military casualties pre-sented simultaneously to a level 1 trauma referral center for evaluation (8). Over 100 patients with suspected abdominal injury were initially triaged with a FAST exam to determine who required immediate surgery, further study with computed tomography (CT), or observation alone (8).
The best way to incorporate ultrasound into triage proto-cols is still being developed (9,10). Protocols that integrate ultrasound as a secondary triage tool have been suggested, in-cluding the CAVEAT protocol, which proposes comprehen-sive sonographic examination in the evaluation of the chest, abdomen, vena cava, and extremities in acute triage (11). Although the benefit of the CAVEAT protocol is yet to be tested in an MCI, there is extensive literature in support of its component parts (11).
In the acute response phase, sonographic evaluation can also be used at local receiving hospitals to evaluate crush injuries, assess shock states, and guide resuscitation (6). An-esthesiologists have described using ultrasound preopera-tively for evaluation of systolic function and volume status (6). Inferior vena cava (IVC) and cardiac evaluation may be used to guide resuscitative efforts and volume replacement. Ultrasound can also be used to guide invasive resuscitative procedures such as central line placement.
Ultrasound is also useful for evaluating subacute com-plications that present remote to disaster incidents, either in location or by time (.72 hours) (2,3). For example, a problem-specific application of ultrasound has been used in the setting of decreased urine output to differentiate renal failure from rhabdomyolysis, dehydration, or renal paren-chymal injury (5). One team applied a protocol that evalu-ated for urinary retention, disruption in kidney architecture, perinephric hematomas, free fluid in the abdomen, and determination of bladder size to estimate the likelihood of bladder rupture (5). Another team used Doppler to detect elevated renal resistive index to recognize and guide treat-ment of renal vasoconstriction found in acute crush-related renal injury (12). Ultrasound may also be useful for detecting (and sometimes treating) other commonly described delayed complications such as intra-abdominal abscess, deep venous thrombosis, cellulitis, abscess, and ileus (1,5,6).
Weeks after an MCI, indications for ultrasound become more routine, as patients utilize medical response units to replace nonfunctional local clinics or capitalize on the presence of medical care not usually available (2). When a hurricane
caused a devastating mudslide in Guatemala in 2005, loss of potable water, food, sanitation, clothing, shelter, and lack of routine healthcare contributed to the bulk of medical cases that presented to a disaster relief team arriving 2 weeks after the mudslide (2). While ultrasound was used to evaluate a small number of thoracic trauma cases, it was primarily used for pregnancy-related conditions that were not directly caused by the mudslide (2). In this setting, cardiac and IVC measure-ments to estimate volume depletion from gastroenteritis may help direct rehydration therapy in areas with compromised sanitation and outbreaks of infectious gastroenteritis.
Depending on the type of MCI, unique injury patterns emerge that can be evaluated with ultrasound. The South Asia tsunami relief effort in 2004 described unique patterns of injuries suitable for ultrasound evaluation (3). Tidal waves caused high impact injuries with a predominance of mus-culoskeletal findings, including embedded foreign bodies, fractures, and dislocations. Victims were likely to sustain penetrating injuries from organic debris and material that was not visualized well by routine radiographic evaluation. Small or medium-sized openings in the skin frequently re-vealed surprisingly large amounts of foreign bodies such as sand, soil, and wood splinters. Contamination of wounds with seawater increased the rate of infection and abscess for-mation, which were also evaluated and treated using ultra-sound. Lastly, seawater aspiration and near drowning were prevalent, resulting in noncardiac pulmonary edema, pleural effusion, pulmonary contusion, pneumothorax, aspiration pneumonia, acute respiratory distress syndrome (ARDS), and tsunami sinusitis. Thoracic ultrasound was additionally utilized to evaluate many of these pulmonary injuries. Lastly, limited X-ray resources can be rationed by using ultrasound for long-bone fracture detection and confirmation of align-ment after reduction (13).
In addition to using ultrasound for diagnosis, ultrasound can be of benefit in improving the quality of care. Pain control in disaster settings is notoriously poor. A survey of 848 victims who survived the Wenchuan earthquake revealed that only 1.6% received pain control at rescue, 3.9% during transport to the hospital, 19% in the emergency department (ED), and 29% during debridement of wounds (14). Anesthesiologists report good outcomes for ultrasound-guided regional anesthe-sia both for pre- and post-operative pain control during MCI relief efforts (6). Ultrasound guidance is especially helpful for nerve blocks when a language barrier is present, because providers cannot rely on verbal communication regarding paresthesias to guide placement of anesthetic (6). Motor stim-ulation guidance for nerve blocks in traumatized patients can produce severe pain, but ultrasound guidance provides a good alternative for guidance (6). Additionally, ultrasound aids in precise delivery of anesthetic placement when normal ana-tomic landmarks are obscured by trauma. A review of epide-miology of injury patterns from recent disasters suggests that response personnel trained in four nerve blocks could provide relief for most extremity injuries: (a) femoral, (b) popliteal, (c) forearm, and (d) interscalene (15).
MilitaryAlthough the austerity of the battlefield environment limits the availability of many diagnostic and therapeutic modali-ties, ultrasound is currently being used at all levels of care. In fact, it is commonly the most advanced radiologic diagnostic

430 SeCtion x / Implementing Ultrasound into the Clinical Setting
chest radiographs of 978 combat casualties as part of the Vietnam Wound Data and Munitions Effectiveness Team study found that tension pneumothorax was the cause of death in 3% to 4% of fatalities (25). Extreme noise levels may prevent battlefield detection of pneumothorax by aus-cultation alone. Handheld ultrasound may be used by medics on the battlefield to detect pneumothorax and initiate life-saving intervention with needle thoracostomy.
Air expansion can worsen pneumothorax during medical evacuation flight. Historically, chest tubes were empirically inserted prior to air evacuation in any patient suspected of having a pneumothorax to prevent deterioration in flight. A recent case report by Do describes the use of ultrasound in a patient with a shrapnel injury from a mortar attack to prevent the unnecessary placement of a chest tube prior to flight (26). The patient sustained penetrating injuries to the left flank, thorax, and upper back. There was no sono-graphic evidence of pneumothorax or hemothorax, and vital signs were stable. The patient was successfully transported without chest tube placement, saving him from the potential complications inherent in chest tube placement.
Head wounds accounted for approximately 8% of combat wounds in Operation Iraqi Freedom and Operation Enduring Freedom (27,28). Improvised explosive device (IED) explo-sions are unfortunately commonplace in today’s battlefield environment and can lead to the simultaneous presentation of multiple head injured patients. Increased risk during night operations and inclement weather can prevent or delay air transport due to safety concerns, making triage for evacu-ation priority a necessity. In this situation, measurement of optic nerve sheath diameter (ONSD) to determine intracra-nial pressure (ICP) could theoretically assist in triage deci-sions. ONSD measurement .5 mm has 100% sensitivity and 63% specificity for elevated ICP (29). In the battlefield setting, head injured patients with ONSD ,5 mm are very unlikely to have elevated ICP. Those with ONSD .5 mm are at increased risk of having elevated ICP. For this reason, ONSD .5 mm could be used to triage multiple head injured patients to a higher priority for evacuation. While waiting for transport to arrive, those with ONSD .5 mm may also be candidates for more frequent neurologic monitoring to more quickly detect deterioration and trigger intervention.
Many of the benefits of ultrasound-guided regional an-esthesia in combat settings parallel those in MCI situations (Fig. 31.3). Regional anesthesia has proven benefit in combat
equipment available. A medic might carry a handheld ultra-sound unit in his pack to help him diagnose, treat, and tri-age acute battlefield injuries. Medical air evacuation teams can reliably operate an ultrasound within a noisy helicopter without interfering with flight avionics (16). Highly mobile surgical teams that directly support combatant units are is-sued portable ultrasound machines as part of their routine equipment inventory. Combat support hospitals and regional hospitals use ultrasound in addition to more permanent ra-diologic equipment that is found in standard hospitals.
Perhaps the most beneficial use of ultrasound in the acute combat setting is the extended FAST (EFAST) exam (17). Battlefield environments do not appear to alter the diagnos-tic ability of ultrasound; sensitivity, specificity, and accuracy in diagnosis of hemoperitoneum under battlefield conditions parallel statistics reported in civilian environments (18). In the realm of triage, highly mobile surgical teams that directly support combat units use ultrasound to triage injuries for evacuation. EFAST is also used to determine the need for damage control surgery prior to medical evacuation. Triage of young, healthy patients can be difficult given their impres-sive physiologic reserve that can mask signs of shock (17). Even if vital signs are stable, most patients with a positive FAST exam undergo laparotomy to perform damage control surgery prior to transport to a higher level of care, because rapid deterioration and death can ensue while en route in patients with compensated shock (Figs. 31.1 and 31.2).
If intubation is required in the remote field setting, end-tidal CO2 monitoring and chest radiography may not be avail-able, and auscultation of lung sounds may be impossible, at which point resuscitative and transport teams can employ ul-trasound for confirmation of intubation. Ultrasound can also be used in this setting to directly visualize neck structures to confirm endotracheal tube location (19–23). Additionally, confirmation of bilateral sliding lung rules out mainstem or esophageal intubation (24).
Tension pneumothorax is recognized as a significant con-tributor to preventable battlefield deaths. A review of the
FIGURE 31.1. EFAST Exam Used as a Triage Tool during Military Operations.
FIGURE 31.2. EFAST Exam Performed to Determine the Need for Dam-age Control Surgery Prior to Medical Evacuation during Military Operations. FIGURE 31.3. Ultrasound-Guided Saphenous Nerve Block.

Chapter 31 / Implementing Ultrasound in the Prehospital Setting 431
during patient transport with helicopters and fixed-wing aircraft (Fig. 31.5). Several studies report that performance of ultrasound during transport does not interfere with avi-onics or ultrasound machine functioning (16,37–39). Short transport time, space restrictions, ambient lighting, patient securing straps, and battery failure rarely affect in-flight ultrasound examination (16,37,38).
There are a number of potential uses for ultrasound in the EMS prehospital setting (40). Many uses overlap with MCI and military uses already described, but there are also indica-tions that are specifically encountered in the EMS environ-ment. For example, a FAST exam could be coupled with an exam of the aorta for the evaluation of a potential ruptured abdominal aortic aneurysm. Alternatively, a FAST exam can be used to evaluate a young female of child-bearing age with nontraumatic sudden onset of abdominal pain when a rup-tured ectopic is being considered. If entities such as these are discovered, it could change selection of the receiving hospi-tal or guide resuscitative fluid management.
Prehospital sonographic evaluation of pulseless electri-cal activity (PEA) can identify potentially treatable causes of sudden cardiac arrest or peri-arrest such as pericardial tamponade, hypovolemia, or pneumothorax. Several stud-ies conclude that cardiac standstill in the setting of PEA predicts a dismal prognosis, whereas some cardiac move-ment indicates some chance of survival (41–43). In certain clinical settings, cardiac standstill might be an indication to cease resuscitative efforts, especially if resources are scarce. Prehospital cardiac ultrasound can also distinguish fine ven-tricular fibrillation from asystole, clarifying the need for defibrillation.
Distinguishing between acute decompensated congestive heart failure (CHF) and chronic obstructive pulmonary dis-ease (COPD) can be a challenge even with a full complement of diagnostic resources available. Correct early differentia-tion between these disease states is important, as administra-tion of incorrect therapy can have adverse effects. Ultrasound has proven benefit in the evaluation of the dyspneic patient (44–46). B-lines can be used to discern between acute de-compensated CHF and COPD. Identification of B-lines has 100% sensitivity, 95% specificity, 100% NPV, 96% PPV in the diagnosis of heart failure in the prehospital setting, a
settings to provide effective pain control without altering mental status (30–32). An anesthetist who was deployed to Iraq with the 47th Combat Support Hospital performed 44 nerve blocks during a 3-month period and found it to be so useful that he recommended routine training for emergency personnel prior to deployment (32).
The hazardous work environment inherent in military operations makes musculoskeletal injuries such as minor fractures, muscle sprains, and joint dislocations common-place. Ultrasound is highly sensitive and specific for rul-ing out long-bone fractures (Chapter 21). Given a low or moderate pretest probability of a long-bone fracture, the absence of sonographic findings of fracture might prevent unnecessary resource utilization for medical evacuation to a higher level of care that has X-ray capability. Instead, splinting with subsequent re-evaluation is a viable option currently used to eliminate the risk and cost involved with transport. Portable ultrasound has been successfully used to diagnose fractures in the austere combat environment. In one military study, 44 subjects with suspected fractures were imaged by ultrasound; 10 of 10 true fractures were successfully identified. Of the 32 patients who had a nega-tive initial scan, 4 were re-evaluated after 3 days due to continued pain. None of these patients had fracture demon-strated on radiograph (13).
Emergency Medical ServicesAlthough the majority of prehospital Emergency Medical Services (EMS) guidelines do not include the use of ultra-sound, many EMS systems recognize the value of ultra-sound and have incorporated handheld or portable devices into air and ground units (33–35) (Fig. 31.4). One large-scale, multicenter prospective cohort study showed that prehospital ultrasound improves management of abdominal trauma (36). Ultrasound can be safely and effectively used
FIGURE 31.4. EFAST Being Performed in Ground EMS Unit. (Courtesy of Sonosite .)
FIGURE 31.5. EFAST Being Performed during Air Transport. (Courtesy of Sonosite .)

432 SeCtion x / Implementing Ultrasound into the Clinical Setting
thought, consideration, and planning, the ability to overcome them will be nearly impossible, even for the most ardent of advocates. The following are issues specific to out-of- hospital ultrasound implementation.
Leadership and InfrastructureEmergency physicians are positioned to be leaders in intro-ducing ultrasound to the prehospital environment, and their involvement will be important for successful implementa-tion. Prior work in the ED setting has identified appropri-ate point-of-care applications, incorporated ultrasound into decision-making algorithms, established training require-ments, and created effective documentation and safety guide-lines. Emergency physicians understand the problem-based clinical approach to ultrasound application that will be useful when implementing ultrasound into prehospital algorithms. Many of the challenges that lie ahead in prehospital ultra-sound program development mirror those already addressed in the ED setting.
Emergency providers and prehospital care providers en-joy a close working relationship, which highlights the need for a common understanding of ultrasound use and applica-tion in the prehospital setting. The first link from prehospital EMS care to the hospital is usually through the ED, and this point-of-entry requires a common language to effectively communicate ultrasound findings from prehospital provid-ers to ED personnel. Emergency physicians are already established leaders in disaster response and EMS program operation. This close working relationship will facilitate the implementation of safe and effective change as ultrasound is introduced.
Establishment of an on-scene ultrasound coordinator within the prehospital unit is important. Responsibilities would include machine maintenance and care, training coor-dination, quality assurance, and championing the incorpora-tion of prehospital ultrasound.
Equipment and Power Supply ManagementWeight and space restrictions are common to many prehos-pital settings, and ultrasound manufacturers are working to meet this demand by developing handheld ultrasound units that maintain adequate image quality. The creation of hard-ened devices that can endure electromagnetic insult, extreme temperatures and altitudes, and physically abusive environ-ments are a priority in some prehospital settings. Light restriction can be important in combat or aviation environ-ments and may lead to the development of specialized view-ing screens that minimize light output without compromising image interpretation. MCI, military, EMS, and austere use of ultrasound is frequently limited by power supply, so battery life is important.
Real-time wireless transmission of ultrasound images using wireless and satellite technology has been shown to reliably produce images without a decline in quality or interpretability (54–56). With this technology, it might be possible for triage units equipped with portable ultrasound equipment to obtain sonographic images for transmission to an expert for review. Expert interpretation could then be considered for triage, treatment, and evacuation decisions. Used in this fashion, ultrasound could improve triage ac-curacy, direct limited medical resources to patients who stand to benefit the most, and improve utilization of scarce
finding significantly superior to physical exam (85% sensi-tivity and 86% specificity) (44).
One emerging use of prehospital ultrasound is the diag-nosis of stroke using Transcranial Pulsed Wave Doppler (TCD) (47–49). The technique involves visualization of the middle cerebral artery (MCA) with flow measurements. One study of prehospital evaluation of 25 patients demonstrated successful visualization of intracranial arteries in 20/25 patients in ,2 minutes (48). In another study of 113 pa-tients with suspected stroke, MCA occlusion was diagnosed in 10/113 patients. One MCA occlusion was missed, and 1 atypical hemorrhage was misdiagnosed, resulting in a sensi-tivity of 90%, specificity of 98%, PPV of 90%, and NPV of 98% (49). Although more research is certainly needed, early detection of ischemic stroke could be especially useful in re-mote settings when prolonged transport time could preclude administration of thrombolytics.
Many studies validate the ability of paramedics, trans-port critical care nurses, and prehospital physicians to obtain quality sonographic images and correctly interpret the results. Paramedics can accurately obtain and inter-pret prehospital FAST and aorta ultrasound images in the field (50). Critical care paramedics and nurses with signifi-cant critical care experience could accurately distinguish normal lung from pneumothorax using a cadaver model (51). United Kingdom paramedics demonstrated the abil-ity to obtain and correctly interpret lung ultrasound images to determine the presence or absence of pneumothorax in a simulation model (52). The learning curve for prehospital providers is steep; after a 1-day course in the FAST exami-nation, prehospital physicians and paramedics were able to perform ultrasound at the scene of an accident with a high level of accuracy (53).
Probably the most impressive report of prehospital ultra-sound use comes from Germany, where it has been shown to dramatically impact outcomes (36). After a 1-day training course, prehospital physicians and paramedics at six centers used ultrasound to evaluate 202 patients with suspected ab-dominal trauma. Sonographic evaluation was performed at the scene, in the ambulance, or in the helicopter prior to pa-tient transfer, and 93% of the examinations were acceptable for interpretation. Average scan time was 2.4 minutes, and sonographic evaluation occurred an average of 35 minutes prior to sonographic evaluation in the ED. The evaluation did not delay care in 95% of cases; in the 5% that had de-lay, the longest delay was 4 minutes, and was reported to be due to trying to complete the study protocol at the scene. In this study, prehospital FAST exam had sensitivity of 93%, specificity of 99%, and accuracy of 99%. Just as important, 21% of patients had change of care at the trauma scene, 30% of patients had a change in prehospital management while en route, and in 22% of patients, the receiving hospital was changed to the nearest trauma receiving center. Lastly, re-ceiving hospitals reported a change in preparation, such as early notification of operating room staff and preparation of the operating suite.
PROGRAM IMPLEMENTATIONDemonstrating clinical benefit is only the first step in the deployment of ultrasound in out-of-hospital settings. Barri-ers exist that are unique and formidable. Without significant

Chapter 31 / Implementing Ultrasound in the Prehospital Setting 433
A review of the literature supports ultrasound use in a va-riety of settings and for a variety of indications to influence treatment, transport, and triage decisions. Ongoing research is underway to further characterize the most effective uses of ultrasound in the prehospital setting and to delineate the best methods for educating those who will be performing sono-graphic exams. Future investigation should include outcomes and safety research, to ensure that implementation is cost effective and has real benefit to patients.
REFERENCES 1. Dan D, Mingsong L, Jie T, et al. Ultrasonographic applications after
mass casualty incident caused by Wenchuan earthquake. J Trauma. 2010;68(6):1417–1420.
2. Dean AJ, Ku BS, Zeserson EM. The utility of handheld ultrasound in an austere medical setting in Guatemala after a natural disaster. Am J Disaster Med. 2007;2(5):249–256.
3. Kaewlai R, Srisuwan T, Prasitvoranant W, et al. Radiologic findings in tsunami trauma: experience with 225 patients injured in the 2004 tsu-nami. Emerg Radiol. 2007;14(6):395–402.
4. Raja FS. Portable sonography in Haiti after the earthquake. Can Assoc Radiol J. 2011;62(3):222.
5. Sarkisian AE, Khondkarian RA, Amirbekian NM, et al. Sonographic screening of mass casualties for abdominal and renal injuries following the 1988 Armenian earthquake. J Trauma. 1991;31(2):247–250.
6. Shah S, Dalal A, Smith RM, et al. Impact of portable ultrasound in trauma care after the Haitian earthquake of 2010. Am J Emerg Med. 2010;28(8):970–971.
7. Schultz CH, Koenig KL, Noji EK. A medical disaster response to reduce immediate mortality after an earthquake. N Engl J Med. 1996;334(7):438–444.
8. Beck-Razi N, Fischer D, Michaelson M, et al. The utility of focused assessment with sonography for trauma as a triage tool in multiple-casualty incidents during the second Lebanon war. J Ultrasound Med. 2007;26(9):1149–1156.
9. Sztajnkrycer MD, Baez AA, Luke A. FAST ultrasound as an adjunct to triage using the START mass casualty triage system: a preliminary descriptive system. Prehosp Emerg Care. 2006;10(1):96–102.
10. Manka M, Moscati R, Raghavendran K, et al. Sonographic scoring for operating room triage in trauma. West J Emerg Med. 2010;11(2): 138–143.
11. Stawicki SP, Howard JM, Pryor JP, et al. Portable ultrasonography in mass casualty incidents: the CAVEAT examination. World J Orthop. 2010;1(1):10–19.
12. Keven K, Ates K, Yagmurlu B, et al. Renal Doppler ultrasonographic findings in earthquake victims with crush injury. J Ultrasound Med. 2001;20(6):675–679.
13. McNeil CR, McManus J, Mehta S. The accuracy of portable ultrasonog-raphy to diagnose fractures in an austere environment. Prehosp Emerg Care. 2009;13(1):50–52.
14. Chen G, Lai W, Liu F, et al. The dragon strikes: lessons from the Wen-chuan earthquake. Anesth Analg. 2010;110(3):908–915.
15. Lippert SC, Nagdev A, Stone MB, et al. Pain control in disaster settings: a role for ultrasound-guided nerve blocks. Ann Emerg Med [published online ahead of print May 9, 2012]. http://www.annemergmed.com/article/S0196-0644(12)00356-3/abstract.
16. Price DD, Wilson SR, Murphy TG. Trauma ultrasound feasibility during helicopter transport. Air Med J. 2000;19(4):144–146.
17. Stinger H, Rush R. The Army forward surgical team: update and lessons learned, 1997–2004. Mil Med. 2006;171(4):269–272.
18. Miletic D, Fuckar Z, Mraovic B, et al. Ultrasonography in the evalu-ation of hemoperitoneum in war casualties. Mil Med. 1999;164(8): 600–602.
19. Chou HC, Tseng WP, Wang CH, et al. Tracheal rapid ultrasound exam (T.R.U.E.) for confirming endotracheal tube placement during emer-gency intubation. Resuscitation. 2011;82(10):1279–1284.
20. Chun R, Kirkpatrick AW, Sirois M, et al. Where’s the tube? Evaluation of hand-held ultrasound in confirming endotracheal tube placement. Prehosp Disaster Med. 2004;19(4):366–369.
equipment, personnel, and transport resources (38). The direct transfer of images may improve patient outcomes in much the same way that electrocardiogram communication has decreased mortality in the setting of ST-elevation myo-cardial infarction.
TrainingUltrasound educational programs should consider several factors when developing training courses. What is the edu-cational level of the provider? What conditions does the provider have training to understand, evaluate, and treat? What is his/her prior ultrasound experience? What injuries are likely to be encountered? Responses to these questions may influence lesson content and time required for training. Ultrasound requires hand–eye coordination to obtain desired images, so maximizing hands-on time with the ultrasound machine is important. Currently, there is no credentialing body specifically geared toward prehospital providers.
Military efforts at ultrasound education for deploying per-sonnel provide an example of how to meet these challenges when developing training plans. Forward deployed medical units usually consist of personnel with a wide variety of skill sets and highly varied experience with ultrasound. Medics may be trained to extend ultrasound capabilities to the side of injured soldiers. Formalized ultrasound training is being incorporated into predeployment training for many medical units, but remains an area ripe for further development. A specific curriculum has been developed for nonphysicians working in special operations, referred to as Special Opera-tor Level Clinical Ultrasound (SOLCUS) (57).
Quality AssuranceCompetence-based assessment is crucial to ensure that so-nographic studies are performed for appropriate indications, adequate images are obtained, and interpretation is accu-rate. Several computer programs are available to organize quality assurance efforts and provide useful feedback to the clinician. Usually, quality review in the initial period after training is more intense, with a high percentage of studies reviewed for quality assurance purposes. After initial com-petence is established, review of only a percentage of studies may be adequate to ensure ongoing quality. Quality assur-ance systems are likely to be similar in both ED and EMS groups, so sharing resources between ED and EMS systems can reduce cost and increase efficiency in program develop-ment and maintenance.
CONCLUSIONS AND FUTURE DIRECTIONSThe initial care of the undifferentiated patient frequently encountered in the prehospital setting can be challenging, especially given the limited number of diagnostic modalities available. Extreme environmental conditions, mass casualty situations, and remote locations can further complicate pa-tient care.
The past decade has witnessed the migration of ultrasound use from the hospital to the prehospital setting because so-nography can aid decision making in any clinical setting by providing real-time diagnostic information. It allows early-care decisions and interventions to be made with increased certainty. All levels of providers demonstrate a steep learning curve for image acquisition and interpretation.

434 SeCtion x / Implementing Ultrasound into the Clinical Setting
41. Aichinger G, Zechner PM, Prause G, et al. Cardiac movement identi-fied on prehospital echocardiography predicts outcome in cardiac arrest patients. Prehosp Emerg Care. 2012;16(2):251–255.
42. Schuster KM, Lofthouse R, Moore C, et al. Pulseless electrical activity, focused abdominal sonography for trauma, and cardiac con-tractile activity as predictors of survival after trauma. J Trauma. 2009;67(6):1154–1157.
43. Tarmey NT, Park CL, Bartels OJ, et al. Outcomes following military traumatic cardiorespiratory arrest: a prospective observational study. Resuscitation. 2011;82(9):1194–1197.
44. Prosen G, Klemen P, Štrnad M, et al. Combination of lung ultrasound (a comet-tail sign) and N-terminal pro-brain natriuretic peptide in differ-entiating acute heart failure from chronic obstructive pulmonary disease and asthma as cause of acute dyspnea in prehospital emergency setting. Crit Care. 2011;15(2):R114.
45. Rempell JS, Noble VE. Using lung ultrasound to differentiate patients in acute dyspnea in the prehospital emergency setting. Crit Care. 2011;15(3):161.
46. Zechner PM, Aichinger G, Rigaud M, et al. Prehospital lung ultra-sound in the distinction between pulmonary edema and exacerbation of chronic obstructive pulmonary disease. Am J Emerg Med. 2010;28(3): 389.e1–389.e2.
47. Wilson MH, Levett DZ, Dhillon S, et al. Stroke at high altitude diag-nosed in the field using portable ultrasound. Wilderness Environ Med. 2011;22(1):54–57.
48. Holscher T, Schlachetzki F, Zimmermann M, et al. Transcranial ultra-sound from diagnosis to early stroke treatment. 1. Feasibility of pre-hospital cerebrovascular assessment. Cerebrovasc Dis. 2008;26(6): 659–663.
49. Schlachetzki F, Herzberg M, Hölscher T, et al. Transcranial ultrasound from diagnosis to early stroke treatment: part 2: prehospital neurosonog-raphy in patients with acute stroke: the Regensburg stroke mobile proj-ect. Cerebrovasc Dis. 2012;33(3):262–271.
50. Heegaard W, Hildebrandt D, Spear D, et al. Prehospital ultrasound by paramedics: results of field trial. Acad Emerg Med. 2010;17(6): 624–630.
51. Lyon M, Walton P, Bhalla V, et al. Ultrasound detection of the slid-ing lung sign by prehospital critical care providers. Am J Emerg Med. 2012;30(3):485–488.
52. Brooke M, Walton J, Scutt D, et al. Acquisition and interpretation of focused diagnostic ultrasound images by ultrasound-naive advanced paramedics: trialling a PHUS education programme. Emerg Med J. 2012;29(4):322–326.
53. Walcher F, Kirschning T, Müller MP, et al. Accuracy of prehospital fo-cused abdominal sonography for trauma after a 1-day hands-on training course. Emerg Med J. 2010;27(5):345–349.
54. McBeth PB, Crawford I, Blaivas M, et al. Simple, almost anywhere, with almost anyone: remote low-cost telementored resuscitative lung ultrasound. J Trauma. 2011;71(6):1528–1535.
55. McBeth PB, Hamilton T, Kirkpatrick AW. Cost-effective remote iphone-teathered telementored trauma telesonography. J Trauma. 2010;69(6):1597–1599.
56. Strode CA, Rubal BJ, Gerhardt RT, et al. Wireless and satellite transmis-sion of prehospital focused abdominal sonography for trauma. Prehosp Emerg Care. 2003;7(3):375–379.
57. Morgan AR, Vasios WN, Hubler DM, Benson PJ. Special operator level clinical ultrasound: an experience in application and training. J Spec Oper Med. 2010;10(2):16–21.
21. Ma G, Davis DP, Schmitt J, et al. The sensitivity and specificity of tran-scricothyroid ultrasonography to confirm endotracheal tube placement in a cadaver model. J Emerg Med. 2007;32(4):405–407.
22. Muslu B, Sert H, Kaya A, et al. Use of sonography for rapid identifica-tion of esophageal and tracheal intubations in adult patients. J Ultra-sound Med. 2011;30(5):671–676.
23. Werner SL, Smith CE, Goldstein JR, et al. Pilot study to evaluate the accuracy of ultrasonography in confirming endotracheal tube placement. Ann Emerg Med. 2007;49(1):75–80.
24. Weaver B, Lyon M, Blaivas M. Confirmation of endotracheal tube place-ment after intubation using the ultrasound sliding lung sign. Acad Emerg Med. 2006;13(3):239–244.
25. McPherson JJ, Feigin DS, Bellamy RF. Prevalence of tension pneumothorax in fatally wounded combat casualties. J Trauma. 2006;60(3):573–578.
26. Do JR, McManus J, Harrison B. Use of ultrasonography to avoid an unnecessary procedure in the prehospital combat environment: a case report. Prehosp Emerg Care. 2006;10(4):502–506.
27. Belmont PJ, Schoenfeld AJ, Goodman G. Epidemiology of combat wounds in operation Iraqi Freedom and Operation Enduring Freedom: orthopaedic burden of disease. J Surg Orthop Adv. 2010;19(1):2–7.
28. Owens BD, Kragh JF Jr, Wenke JC, et al. Combat wounds in operation Iraqi Freedom and operation Enduring Freedom. J Trauma. 2008;64(2):295–299.
29. Tayal VS, Neulander M, Norton HJ, et al. Emergency department sono-graphic measurement of optic nerve sheath diameter to detect findings of increased intracranial pressure in adult head injury patients. Ann Emerg Med. 2007;49(4):508–514.
30. Buckenmaier CC, McKnight GM, Winkley JV, et al. Continuous periph-eral nerve block for battlefield anesthesia and evacuation. Reg Anesth Pain Med. 2005;30(2):202–205.
31. Buckenmaier CC III, Rupprecht C, McKnight G, et al. Pain following battlefield injury and evacuation: a survey of 110 casualties from the wars in Iraq and Afghanistan. Pain Med. 2009;10(8):1487–1496.
32. Malchow RJ. Ultrasonography for advanced regional anesthesia and acute pain management in a combat environment. US Army Med Dep J. 2009:64–66.
33. Bowman J. Visible improvement. Ultrasound provides diagnostic im-ages in prehospital medicine. JEMS. 2010;35(9):36–38, 40, 42, passim.
34. Hoyer HX, Vogl S, Schiemann U, et al. Prehospital ultrasound in emergency medicine: incidence, feasibility, indications and diagnoses. Eur J Emerg Med. 2010;17(5):254–259.
35. Smith CA. Ultra assessment tool. EMS crews begin using portable ultra-sound units in the field. JEMS. 2003;28(7):46–54.
36. Walcher F, Weinlich M, Conrad G, et al. Prehospital ultrasound imaging improves management of abdominal trauma. Br J Surg. 2006;93(2):238–242.
37. Heegaard W, Plummer D, Dries D, et al. Ultrasound for the air medical clinician. Air Med J. 2004;23(2):20–23.
38. Melanson SW, McCarthy J, Stromski CJ, et al. Aeromedical trauma sonography by flight crews with a miniature ultrasound unit. Prehosp Emerg Care. 2001;5(4):399–402.
39. Polk JD, Fallon WF Jr. The use of focused assessment with sonography for trauma (FAST) by a prehospital air medical team in the trauma arrest patient. Prehosp Emerg Care. 2000;4(1):82–84.
40. Brooke M, Walton J, Scutt D. Paramedic application of ultrasound in the management of patients in the prehospital setting: a review of the literature. Emerg Med J. 2010;27(9):702–707.

435
Sachita Shah
Implementing Ultrasound in Developing Countries
32
INTRODUCTION . . . . . . . . . . . . . . . . . . . . . . . . . . . . . . . . . . 435EXISTING LITERATURE . . . . . . . . . . . . . . . . . . . . . . . . . . . . 435PROGRAM IMPLEMENTATION . . . . . . . . . . . . . . . . . . . . . . . 436
Leadership and Infrastructure . . . . . . . . . . . . . . . . . . . 436Equipment and Power Supply
Management . . . . . . . . . . . . . . . . . . . . . . . . . . . . . . 436Coupling Agents . . . . . . . . . . . . . . . . . . . . . . . . . . . . . 437Needs Assessment . . . . . . . . . . . . . . . . . . . . . . . . . . . 437Training Course Model . . . . . . . . . . . . . . . . . . . . . . . . 437
Safety and Machine Maintenance . . . . . . . . . . . . . . . . 437Quality Assurance . . . . . . . . . . . . . . . . . . . . . . . . . . . . 438
CASES FROM THE FIELD . . . . . . . . . . . . . . . . . . . . . . . . . . . 438Obstetrics . . . . . . . . . . . . . . . . . . . . . . . . . . . . . . . . . . 438Echocardiography . . . . . . . . . . . . . . . . . . . . . . . . . . . . 438Pulmonary . . . . . . . . . . . . . . . . . . . . . . . . . . . . . . . . . . 438Hepatic . . . . . . . . . . . . . . . . . . . . . . . . . . . . . . . . . . . . 438Musculoskeletal, Skin, and Soft Tissue Disease . . . . . 439
CONCLUSIONS AND FUTURE DIRECTIONS . . . . . . . . . . . . . 440
INTRODUCTIONWith improvements in portability, durability, and affordabil-ity, clinician-performed ultrasound has reached the bedside of the world’s most vulnerable populations in the developing world. An ever-expanding body of literature has grown to sup-port the use of bedside, point-of-care ultrasound performed by nonradiologist physicians, nurses, and clinical officers in developing nations in clinical patient care (1). Given the worldwide lack of radiology services, and increased recogni-tion of downside risks to imaging-related radiation, it is argu-ably more important than ever before to increase access to ultrasound services in the developing world through improved delivery of appropriate ultrasound equipment and training programs. This chapter will review existing evidence to sup-port ultrasound use in low-resource settings, suggest strate-gies and models for implementing an ultrasound program in a developing world setting, and review ultrasound findings of commonly observed disease processes in these settings.
Emergency physicians are poised to be leaders in the field of bedside ultrasound in low-resource settings for many rea-sons. As an integral part of emergency medicine residency training, point-of-care ultrasound is a skill that our specialty has recognized as easily imparted through appropriate train-ing and easily incorporated into routine care of a diverse patient population (2). Because emergency physicians are comfortable with a variety of patient types and disease pro-cesses, they are potentially better able to help generalist health care providers in the developing world integrate their
ultrasound skills into the day-to-day care of their patients. Goal-directed, focused bedside ultrasound exams are ideal for providing immediate information to guide clinical care in both a bustling American emergency department (ED) and a busy practice in an underserved international setting for similar reasons.
EXISTING LITERATUREIncreased recognition of the importance of ultrasound in the developing world is seen through a growing body of lit-erature, including clinical handbooks and in-field research (3–5). Descriptive experiences of the value of bedside ul-trasound in both developing nations and disaster settings are plentiful, but a handful of studies examine the impact of ultrasound on clinical management and outcomes. Small studies from Rwanda (6), Liberia (7), and the Amazon jungle (8) show that clinician-performed ultrasound changed the differential diagnosis and changed the management plans or disposition in 28% to 72% of patients. These results are echoed in larger studies such as the review by Steinmetz et al. examining data from 1119 ultrasound scans performed in western Cameroon, in which ultrasound not only provided the diagnosis in 31.6% of patients and changed the differ-ential diagnosis in 36.2% of patients, but also expanded the differential diagnosis appropriately to include the true dis-ease process, which had not been previously considered in a large number of patients (9). These studies also suggest that

436 Section X / Implementing Ultrasound into the Clinical Setting
ultrasound findings in the developing world are most often abnormal, suggesting that a high rate of pathology is visual-ized by bedside ultrasound.
Specific research from developing world settings on use of ultrasound in obstetrics and gynecology suggests a very high impact can be made in this specific patient population (10–13), specifically with regard to conditions that may lead to preterm or complicated birth, and postpartum hemor-rhage. Studies from several African countries suggest that ultrasound by trained practitioners can aid in diagnosis of abnormal fetal presentation, intrauterine growth retarda-tion, multiple gestation, placental issues, fetal heart rate, and estimation of gestational age. Other research suggests that nonphysicians can be trained to perform basic obstetrical ul-trasound, including determination of gestational age, with a high degree of accuracy and inter-rater reliability compared with trained sonographers (14,15). While estimation of ges-tational age in the second and third trimester using fetal biometry is not frequently performed by emergency physi-cians, it is an easily learned skill that can then be transferred in a training program for low-resource settings (16).
Uses of portable ultrasound for echocardiography in resource-poor settings have also been explored with interesting results. Studies suggest handheld echocardiography in the developing world can aid in diagnosis and workup of patients presenting with murmurs, severe hypertension, edema, pain, and dyspnea, including diagnoses such as ventricular systolic dysfunction, left ventricular hypertrophy, congenital abnormalities, significant rheumatic valvular disease, and pericardial effusion (17,18).
A small number of descriptive studies and a single text demonstrate the use of ultrasound in patients with infectious diseases prevalent in the developing world, including HIV and tuberculosis (TB) (19). Specifically, HIV-infected pa-tients appear to suffer from cardiomyopathy, nephropathy, hepatomegaly, splenomegaly, retroperitoneal and mesen-teric lymphadenopathy, ascites, and biliary abnormalities at a higher rate than their non–HIV-infected matched controls (20). Abdominal TB with ascites is a commonly encountered diagnostic query that is difficult to distinguish from cirrho-sis with ascites by physical exam alone. A study of Indian patients with suspected abdominal tuberculosis revealed findings that included lymphadenopathy, organomegaly, peritoneal nodules, bowel wall thickening, mesenteric thick-ening, and ascites (21). Further research is required to deter-mine whether ultrasound changes management of patients with ascites and helps to improve early diagnosis of abdomi-nal TB and HIV-related complications.
Emergent ultrasound of trauma patients has been studied extensively in the United States, and additional research from South Africa supports the use of the FAST (focused assess-ment with sonography in trauma) exam on both blunt and pen-etrating trauma victims in resource-poor settings. In one study from a large trauma center in South Africa, sensitivity (72%) and specificity (100%) of FAST in this setting was similar to studies in western settings (22). This research suggests the FAST exam can be useful in determining which patients re-quire emergent therapy for hemoperitoneum, and is especially important in settings with limited capacity for computed to-mography (CT) to guide appropriate transfer for operative care.8PEDIATRIC CONSIDERATIONS Ultrasound is emerging as
a useful tool to assess degree of dehydration in children us-ing measurements of the inferior vena cava (IVC) both in the United States and in sub-Saharan Africa (23,24). Death due to
diarrhea-related volume depletion is a leading cause of death in children under 5 years of age worldwide (25), and a commonly encountered epidemic in human disasters. Accurate assessment of which children are significantly dehydrated and require hospi-talization can aid in efficient resource utilization and guide rapid resuscitation. Bedside ultrasound of the Aorta:IVC ratio in chil-dren presenting with diarrhea in a Rwandan pilot study suggests that an Aorta:IVC ratio of >1.22 has a sensitivity of 93% (95% CI = 81% to 100%) to detect significant dehydration. This ultra-sound assessment outperformed commonly used clinical scales for detection of dehydration, and requires further study.7
Editor’s note: The reader is cautioned that some studies report Aorta:IVC ratios; others report IVC:Aorta ratio. See also Chapter 26 (General Pediatric Problems) and Chapter 6 (IVC).
New uses for bedside ultrasound continue to emerge, and future research should focus on the utility of ultrasound for specific disease conditions, ideal training models for vary-ing levels of proficiency, cost-effectiveness and long-term sustainability of ultrasound equipment and programs, and remote quality assurance and image management solutions. In addition, there is a need to create a uniform, standardized curriculum and international process of certification to en-sure safe and high-quality ultrasound services worldwide.
PROGRAM IMPLEMENTATIONCreating a sustainable ultrasound program in a low-resource set-ting requires much more than ultrasound equipment and good will. Many of the same components for success that are required to start an ultrasound program in a western ED are necessary in low-resource settings, with a few unique issues to ponder.
Leadership and InfrastructureA successful and sustainable ultrasound program in a develop-ing world district hospital or health center setting requires a local ultrasound champion to maintain services over time. The role of this local ultrasound leader is to maintain the ultrasound equipment and accoutrements, act as a liaison with hospital and ministry of health leadership on all issues related to the ultrasound program, and most importantly, to create and main-tain a method for quality assurance and record keeping. The presence of a dedicated ultrasound leader is integral to main-taining an ultrasound service after the initial implementation.
Equipment and Power Supply ManagementSelection of environment-appropriate ultrasound equipment for the challenges of practice in the developing world can be difficult, and there is no perfect machine. Much of the equipment that is currently donated or available to charitable organizations working in the developing world are larger, nonmobile ultrasound machines with inferior image quality. These are not generally useful and often end up as medical equipment waste in settings with no ability to recycle or re-pair nonportable machines.
Ideal qualities of ultrasound equipment for resource-poor settings are similar to the types of machines used in a busy ED, with a few caveats. Portability is paramount, for use and ease of offsite repair, and because many district hospitals and health centers do not have smooth flooring, hand-carried ma-chines are preferred over cart-based equipment. Ability to

chapter 32 / Implementing Ultrasound in Developing Countries 437
Needs AssessmentEach developing world site will have a different pathology and require a unique, tailored curriculum to be most effec-tive. Before arranging a training program, it is important to perform a needs assessment to determine the best uses of ultrasound in a particular setting. This can be informal and is best done through discussion with hospital admin-istration and nursing staff to determine their expectations and any prior experience, followed by a thorough review of hospital logs for admission and discharge diagnoses, outpatient clinic and emergency visit logs, and review of causes of morbidity and mortality in the region. From this information, a specialized program can be created to teach ultrasound exams that may be useful on a day-to-day basis based on the types of patient complaints and disease entities encountered.
Training Course ModelSince 1998, the World Health Organization (WHO) has rec-ommended the creation of an accepted international curricu-lum for diagnostic ultrasound (28); however, no standardized program currently exists. While the ideal training model has yet to be determined, there are several potential options. In the few existing descriptive studies, trainers have varied from emergency medicine attendants to residents, radiologists, and cardiologists, and trainees include a wide range, from clinical officers to nurses and physicians.
In general, the literature suggests that an initial training period of a few days to a few weeks can prepare local health care providers to perform basic ultrasound exams, and is most successful when it includes lecture, hands-on practi-cal experience, and guidance on how to integrate ultrasound into the clinical care of patients. Many programs also stress the importance of follow-up refresher trainings and ongoing quality assurance after an initial training (29,30).
Safety and Machine MaintenanceUltrasound is generally regarded as one of the safest imag-ing modalities; however, a few areas of concern do exist and should be addressed in any ultrasound program in the devel-oping world. The ALARA (as little as reasonably achiev-able) principle should be taught as part of any introduction to ultrasound, and one should emphasize the importance of minimizing scan times and using appropriate probes and scan modes whenever possible. Cultural considerations to consider include addressing any fear on the part of patients or practitioners about the use of technology and any potential harm. Another consideration with regard to patient safety is that in many parts of the world, sex-selective abortion is a major problem, and in these areas it is not recommended to teach gender identification as part of an ultrasound training course.
Probe sterilization is a major issue, especially in settings where medical liquid waste is dumped locally and solid waste is burned, as occurs in much of the developing world. At the least, probe covers for endocavitary probes along with disinfectant wipes are a must, but further research is required to determine whether a nontoxic sterilizing solution that does not require a ventilation hood is available.
Because it is expected that equipment will break and de-teriorate, possibly more quickly in the harsh environments
use the machine with occasionally unstable voltage or fre-quent switches between grid and generator power, along with long battery life, is an ideal feature of any ultrasound equip-ment. Consider the use of a voltage stabilizer or other de-vice to stabilize power input to the machine and avoid direct fluctuations in current that frequently damage power cords. Durability, including a service contract with the ability to repair machines locally or regionally, wherever possible, is also of interest. Image quality is important, especially when training novice users and without ability for further radiol-ogy imaging as backup for questionable studies, and should not be sacrificed for lower cost.
Generally an ideal machine should include standard two-dimensional imaging, with ability for M-mode, Doppler and color scanning, and software for cardiac and obstetric calcu-lations included. Transducers that have proven useful include a curvilinear abdominal probe, phased array cardiac probe, pediatric specific probe with small footprint, high-frequency linear probe, and an endocavitary probe.
Finally, the ability to easily store and send images for quality assurance and over-reads is important and creates a safety net for local practitioners, who otherwise may feel isolated with difficult-to-interpret images and sick patients. Consideration should be given to ease of image upload to the web or a cloud-based system for review and archiving.
Coupling AgentsCommercially available gel can usually be locally sourced in most major cities of the world, but can be expensive and difficult to transport to rural, underserved areas. Current re-search is ongoing to validate gel substitutes, and one cutting edge group has created a cornstarch–water mixture, which performs as well as actual gel in an initial pilot study (26). The cornstarch gel substitute is prepared in this ongoing study using 1 part corn starch:10 parts water, and the mixture is heated over a stove, stirring 3 to 5 minutes until thickening occurs, and then cooled before use. Prior research shows olive oil may be an acceptable substitute for gel without loss of im-age quality; however, it is unclear whether oil may adversely impact probe surfaces (27). Lutz and Gharbi reproduce a recipe for gel in their text (19), originally reported in 1995 in the WHO Manual of Diagnostic Ultrasound, and described here in Table 32.1. However, it is possible that these ingre-dients may not be readily available in low-resource settings.
TABLE 32.1 Common Recipe for Ultrasound Coupling Agent (Gel)
INGREDIENT AMOUNT
Propylene glycol 75 g
Trolamine 12 .5 g
Carbomer 10 g
Demineralized water Up to 500 mL
EDTA 0 .25 g
Preparation: Mix the EDTA with 400 mL water, and once dissolved, add the pro-pylene glycol . Then add the carbomer and stir carefully to avoid bubbles . Add rest of water to make up to 500 mL of gel .

438 Section X / Implementing Ultrasound into the Clinical Setting
EchocardiographyCardiac ultrasound is emerging as a useful tool for the evalu-ation of patients with dyspnea, pain, edema, and abnormal cardiac exam findings in the developing world. Specific findings to be familiar with include appearance of rheumatic mitral valve disease and TB-related pericardial effusion (Figs. 32.2 and 32.3).
PulmonaryLack of lung sliding is a common finding in patients with scarring/pleural disease related to TB and does not neces-sarily require intervention. Similarly, presence of B-lines in Western populations is generally thought to represent pulmo-nary edema, but can be seen in any alveolar process, includ-ing military TB or pulmonary contusion in trauma.
HepaticA great variety of unusual hepatic ultrasound findings are frequently encountered in the developing world, and this cre-ates a special challenge for sonographers and clinicians in
to which it will be exposed in the developing world, ma-chine maintenance programs and plans should be nego-tiated up front when considering machine purchase or acceptance of a donation for use in a low-resource, remote setting. Consider requesting loaner ultrasound machines if long delays are expected during transport and repair of ul-trasound equipment.
Quality AssuranceTo ensure the safety and success of any global health inter-vention, including ultrasound, quality assurance and moni-toring is essential. This can be achieved by remote image review by an ultrasound expert, with most images undergo-ing quality reviews initially, and then over time when high quality is the norm, selected images may be sent for review. Prompt and easily accessible feedback on how to integrate ultrasound into the clinical patient care plan or difficult-to-interpret images allows local providers using ultrasound to have a greater impact on patient outcomes. Scheduled ultra-sound refresher trainings are very useful, especially if there is staff turnover.
CASES FROM THE FIELDWhile an exhaustive review of each indication for bedside ultrasound in low-resource settings would fill an entire text-book on its own, we review here some key conditions and their ultrasound findings that are common in developing countries but uncommon in other areas and are not covered elsewhere in the text. The top disease-related mortality in the developing world is commonly known to be related to infec-tious diseases, maternal mortality, and dehydration/malnutri-tion for children <5 years old. Ultrasound can be useful in diagnosis and to guide treatment of these conditions as well as many others.
ObstetricsPerhaps the highest impact of ultrasound in the developing world is its use to guide effective surgical care, including obstetrics. Ultrasound can guide providers toward effective use of cesarean section to improve both maternal and fetal mortality, and can help determine which mothers should be transferred to a center with potential operative care and blood transfusion services, before an emergency occurs.
While this is not an exhaustive list, specific pelvic and obstetric ultrasound exams that are frequently useful in low-resource settings include:
• First trimester ultrasound for assessment of ectopic pregnancy, which may be a more common life-threat-ening issue in the developing world due to higher rates of pelvic inflammatory disease in areas with decreased access to early gynecologic care for infections and bar-rier protective methods.
• Assessment of retained products of conception, which may be a more commonly encountered issue in areas with high rates of home birth without skilled labor attendants.
• Early identification of placenta previa, abnormal fetal presentation, or multiple gestations can guide early plan-ning for in-hospital birth or planned cesarean section (Fig. 32.1).
FIGURE 32.1. Placenta Previa.
FIGURE 32.2. Rheumatic Mitral Valve Disease Causes a Mixed Picture of Regurgitation and Stenosis Especially of the Posterior Leaflet. Note the calcified thickened appearance of the mitral valve, classic for rheumatic disease . These valves are at risk of developing endocarditis, and can cause heart failure .

chapter 32 / Implementing Ultrasound in Developing Countries 439
Musculoskeletal, Skin, and Soft Tissue DiseaseWith limited access to radiography, ultrasound is gaining popularity as a useful tool for fracture identification and for guiding both fracture and dislocation reductions in the developing world. In addition, it is a useful tool for diagnosis of deep abscess, which is especially important when the downside risk of unnecessary incision and drain-age includes a high rate of postprocedure superinfection. Pyomyositis, a unique disease commonly encountered in tropical regions of the world, is easily diagnosed using bedside ultrasound. Pyomyositis is a purulent infection of muscle tissue caused by hematogenous spread of bactere-mia that presents with pain and fever, but often without overlying skin change; it requires long courses of antibiot-ics as well as incision and drainage to prevent sepsis and chronic osteomyelitis (Fig. 32.7).
these settings. There are a few common conditions to con-sider in the differential diagnosis, though imaging is most often helpful when interpreted in the specific clinical context due to overlapping appearances of many common diseases (Figs. 32.4–32.6).
FIGURE 32.3. Tuberculosis Pericardial Effusion. Similar to other chronic effusions, TB-related effusions can become quite large before they are symp-tomatic . Similar to ascites from TB, pericardial effusions often contain fine, freely mobile septa composed of fibrin/protein or are completely anechoic .
FIGURE 32.4. Liver Echinococcal Cyst. Cysts can appear simple, with septations such as these, or calcified and heterogeneous .
FIGURE 32.5. Amoebic Abscess. A heterogeneous, well-circumscribed lesion within the liver parenchyma .
FIGURE 32.6. Cirrhosis. The liver appears shrunken and hyperechogenic . There is loss of intrahepatic vasculature, and the borders appear irregular .
FIGURE 32.7. Pyomyositis. Note the disruption of normal muscle architecture with heterogeneous, speckled fluid adjacent to the bone (fibula) . Dynamic pressure applied to this region will show movement of the liquid, purulent area, called pustalsis.

440 Section X / Implementing Ultrasound into the Clinical Setting
13. van den Broek N, Ntonya C, Kayira E, et al. Preterm birth in rural Malawi: high incidence in ultrasound-dated population. Hum Reprod. 2005;20(11):3235–3237.
14. Rijken MJ, Lee SJ, Boel ME, et al. Obstetric ultrasound scanning by local health workers in a refugee camp on the Thai-Burmese border. Ultrasound Obstet Gynecol. 2009;34(4):395–403.
15. Neufeld LM, Wagatsuma Y, Hussain R, et al. Measurement error for ultrasound fetal biometry performed by paramedics in rural Bangladesh. Ultrasound Obstet Gynecol. 2009;34(4):387–394.
16. Shah S, Teismann N, Zaia B, et al. Accuracy of emergency physicians using ultrasound to determine gestational age in pregnant women. Am J Emerg Med. 2010;28(7):834–838.
17. Kobal SL, Lee SS, Willner R, et al. Hand-carried cardiac ultrasound enhances healthcare delivery in developing countries. Am J Cardiol. 2004;94(4):539–541.
18. Kobal SL, Czer LS, Czer PC, et al. Making an impossible mission pos-sible. Chest. 2004;125(1):293–296.
19. Lutz HT, Gharbi HA, eds. Manual of Diagnostic Ultrasound in Infec-tious Tropical Diseases. World Federation for Ultrasound in Medicine and Biology. Berlin, Germany: Springer-Verlag; 2006.
20. Tshibwabwa ET, Mwaba P, Bogle-Taylor J, et al. Four-year study of abdominal ultrasound in 900 Central African adults with AIDS referred for diagnostic imaging. Abdom Imaging. 2000;25(3):290–296.
21. Agarwal D, Narayan S, Chakravarty J, et al. Ultrasonography for diag-nosis of abdominal tuberculosis in HIV infected people. Indian J Med Res. 2010;132:77–80.
22. Smith ZA, Postma N, Wood D. FAST scanning in the developing world emergency department. S Afr Med J. 2010;100(2):105–108.
23. Chen L, Hsiao A, Langhan M, et al. Use of bedside ultrasound to assess degree of dehydration in children with gastroenteritis. Acad Emerg Med. 2010;17(10):1042–1047.
24. Levine AC, Shah SP, Umulisa I, et al. Ultrasound assessment of severe dehydration in children with diarrhea and vomiting. Acad Emerg Med. 2010;17(10):1035–1041.
25. Boschi-Pinto C, Velebit L, Shibuya K. Estimating child mortality due to diarrhoea in developing countries. Bull World Health Organ. 2008;86(9):710–717.
26. Binkowski A, Riguzzi C, Fahimi J, Price D. A cornstarch-based ultrasonography gel alternative for low-resource settings. Ann Emerg Med. 2012;60(4):S16.
27. Luewan S, Srisupundit K, Tongsong T. A comparison of sonographic image quality between the examinations using gel and olive oil, as sound media. J Med Assoc Thai. 2007;90(4):624–627.
28. Training in diagnostic ultrasound: essentials, principles and standards. Report of a WHO Study Group. World Health Organ Tech Rep Ser. 1998;875:i-46; back cover.
29. Adler D, Mgalula K, Price D, et al. Introduction of a portable ultrasound unit into the health services of the Lugufu refugee camp, Kigoma Dis-trict, Tanzania. Int J Emerg Med. 2008;1(4):261–266.
30. Shah S, Noble VE, Umulisa I, et al. Development of an ultrasound train-ing curriculum in a limited resource international setting: successes and challenges of ultrasound training in rural Rwanda. Int J Emerg Med. 2008;1(3):193–196.
31. Home page for World Federation for Ultrasound in Medicine and Biol-ogy (WFUMB). http://www.wfumb.org/. Accessed September 16, 2012.
32. Home page for International Society of Ultrasound in Obstetrics and Gynecology (ISUOG). http://www.isuog.org/. Accessed September 16, 2012.
33. Home page for WINFOCUS. http://www.winfocus.org/. Accessed Sep-tember 16, 2012.
34. Home page for American Institute of Ultrasound Medicine (AIUM). www.aium.org. Accessed September 16, 2012.
35. Home page for AIUM Ultrasound in Global Health. http://www.aium-communities.org/group/ultrasoundinglobalhealth. Accessed September 16, 2012.
36. Home page for the ACEP Emergency Ultrasound Section. http://www .acep.org/ultrasound/. Accessed September 16, 2012.
CONCLUSIONS AND FUTURE DIRECTIONSBedside, clinician-performed ultrasound is a useful diagnos-tic modality in underresourced settings within the develop-ing world. Ongoing efforts to further characterize the impact of ultrasound in these arenas have created a body of litera-ture and evidence to support the introduction of ultrasound worldwide. Future directions for research and policy should include assessments of long-term sustainability, standard-ization of a training approach to point-of-care ultrasound in resource-poor settings, and development of a certification process for use in international settings.
Over the past several years, the ultrasound community has grown to be multidisciplinary, and previous barriers to use of ultrasound in developing settings have been overcome. Many interest groups exist to bring together those interested in ul-trasound in global health, including the World Federation of Ultrasound in Medicine and Biology (31), the International Society of Ultrasound in Obstetrics and Gynecology (32), the World Interactive Network Focused on Critical Ultrasound (WINFOCUS) (33), and subsections within the American Institute of Ultrasound in Medicine (AIUM) (34, 35) as well as an international subsection of the ultrasound section of the American College of Emergency Physicians (ACEP) (36).
REFERENCES 1. Sippel S, Muruganandan K, Levine A, et al. Review article: Use of ul-
trasound in the developing world. Int J of Emerg Med [serial online]. 2011;4:72. http://www.intjem.com/content/pdf/1865-1380-4-72.pdf. Accessed September 16, 2012.
2. The Accreditation Council for Graduate Medical Education (ACGME); Emergency Medicine Residency Review Committee; Program Require-ments; Guidelines; Procedures and Resuscitations; Bedside ultrasound. 2002. http://www.acgme.org.
3. Shah S. Procedures: ultrasound in trauma and ruptured ectopic. In: World Health Organization. IMAI Second Level Clinical Manual. 2010. In press.
4. Muruganandan KM, Shah S. Ultrasound in disaster medicine. In: Partridge RA, Proano L, Marcozzi D, eds. Oxford American Handbook of Disaster Medicine. New York, NY: Oxford University Press; 2012.
5. Shah S, Price D, Bukhman G, et al., eds. The Partners in Health: Manual of Ultrasound in Resource Poor Settings. October 2010. www.pih.org/publications/c/manual.
6. Shah SP, Epino H, Bukhman G, et al. Impact of the introduction of ul-trasound services in a limited resource setting: rural Rwanda 2008. BMC Int Health Hum Rights. 2009;9:4. http://www.biomedcentral.com/1472-698X/9/4. Accessed September 16, 2012.
7. Kotlyar S, Moore CL. Assessing the utility of ultrasound in Liberia. J Emerg Trauma Shock. 2008;1(1):10–14.
8. Blaivas M, Kuhn W, Reynolds B, et al. Change in differential diagnosis and patient management with the use of portable ultrasound in a remote setting. Wilderness Environ Med. 2005;16(1):38–41.
9. Steinmetz JP, Berger JP. Ultrasonography as an aid to diagnosis and treatment in a rural African hospital: a prospective study of 1,119 cases. Am J Trop Med Hyg. 1999;60(1):119–123.
10. Mahran M, Omran M. The impact of diagnostic ultrasound on the pre-diction of intrauterine growth retardation in developing countries. Int J Gynaecol Obstet. 1988;26(3):375–378.
11. Stein W, Katunda I, Butoto C. A two-level ultrasonographic service in a maternity care unit of a rural district hospital in Tanzania. Trop Doct. 2008;38(2):125–126.
12. Kimberly HH, Murray A, Mennicke M, et al. Focused maternal ultrasound by midwives in rural Zambia. Ultrasound Med Biol. 2010;36(8):1267–1272.

441
Acute traumatic fracture, 306–308Acute unilateral cervical lymphadenitis, 376Adnexal mass, 234
complex, 224, 225fright
coronal view of, 225ftransvaginal sagittal view, 223f
Adult respiratory distress syndrome (ARDS), 85Advanced Trauma Life Support (ATLS) teaching,
2, 21Aftermovement, 352, 354Agency for Healthcare Research and Quality
(AHRQ), 7, 109Agitated saline, 128Air bronchograms, 80, 81f, 392Air–mucosa interface, 126fAirway management, resuscitative ultrasound in, 105ALARA (as little as reasonably achievable)
principle, 437Algorithm
for blunt abdominal trauma evaluation, 45fresuscitative ultrasound, 97f, 100testicular ultrasound, 280for traumatic pericardial effusion evaluation, 46f
Alligator forceps, 343–344American Board of Emergency Medicine
(ABEM), 5, 416American College of Cardiology (ACC), 414American College of Emergency Physicians
(ACEP), 2, 5t, 414, 440Emergency Ultrasound Guidelines, 5endorsement by, 5and history of emergency ultrasound, 2
American College of Radiology (ACR), 6–7, 416, 418–419
American Institute of Ultrasound in Medicine (AIUM), 6, 416, 440
American Medical Association (AMA), 6, 416American Society of Echocardiography (ASE),
6, 414Amniotic fluid assessment (AFA), 244–245
1 cm rule, 244maximum vertical pocket technique, 244single deepest pocket technique, 244, 245f
Amoebic abscess, 439fAmpulla of Vater, 147, 153, 402Anechoic fluid, 295Anembryonic gestation, 227Anesthetics, 321Aneurysm. See Abdominal aortic
aneurysm (AAA)Anisotropy, 305Ankle, arthrocentesis of, 336fAnteflexion, 205, 206fAnterior thorax (pneumothorax), 25
rib shadow, appearance of, 30ftransducer placement, 27f
AA-lines, 78, 78f, 82f, 99A-predominance. See A-linesAbdomen, penetrating trauma, 46Abdominal aorta, 160, 161f
aortic dissection involving, 167fexamination, 99–100proximal, transverse view of, 162fsmall aortic aneurysm in, 167f
Abdominal aortic aneurysm (AAA), 99, 105, 156, 264, 265
arteriography, 170CT scan for, 169, 169–170ffusiform, 163, 164fheavily thrombosed, 168–169flarge, in transverse orientation, 163f, 164fin longitudinal scan of proximal aorta, 163fMRI for, 170pathogenesis of, 163–164pathology, 161–162rupture of, various sizes, 156twith thrombus, 164f
in long and short axis, 165foccluded, 166f
Abdominal circumference (AC), 222, 240–241, 241f
Abdominal mass, 99Abdominal pain. See Right upper quadrant (RUQ)
ultrasoundAbdominal procedures
bladder volume, determination ofanatomy and landmarks, 199–200clinical indications, 199image acquisition, 199pitfalls and complications, 201procedure, 200, 200f
hernia reductionanatomy and landmarks, 198clinical indications, 198pitfalls and complications, 199procedure, 198–199, 199f
paracentesisanatomy and landmarks, 196clinical indications, 195image acquisition, 195–196, 195fpitfalls and complications, 198procedure, 196–198, 197f
Abdominal tuberculosis, 436Abdominal wall, 187
hernia, 198, 199fAbnormal fetal presentation, 436, 438Abnormal organ size, 50Abscess, 296
amoebic, 439fcavity
hyperechoic needle, 384fsaline injection, 384f
cutaneous, 383deltoid muscle, 342fhead and neck, 375–376incision and drainage
adult vs. children, 410clinical applications, 342–343head and neck, 385–386image acquisition, 343, 410pitfalls and complications, 343procedure, 343
isoechoic, 370odontogenic, 386peritonsillar, 369, 370, 381f
aspiration of, 383–384skin and soft tissue, 342subcutaneous, 342f, 343
Absorption, 11Academic emergency ultrasound program
academic promotionclinical activity, 425–426research activity, 426scholarly activity, 426service activity, 426teaching activity, 426
and curriculum developmentfaculty, 422–423medical students, 424other specialties, 424residents, 423ultrasound fellows, 423–424
education, 421–422future challenges, 426–427leadership, 422program administration, 424–425relations with other, 425research and scholarship, 424scope of clinical practice, 422
Accreditation, 418–419Achilles tendon rupture, 310fAcoustic enhancement, posterior, 14, 278,
286, 286fAcoustic shadowing artifact, 12, 118, 119f, 287,
314–315Acoustic standoff pad, 372Acoustic window, 12, 13f, 20, 27fAcute anuresis, 199Acute arterial occlusion, 264Acute bilateral cervical lymphadenitis, 376Acute cholecystitis, 99Acute fractures, 340, 391Acute maxillary sinusitis, 367Acute myositis, 312Acute renal failure, 172Acute respiratory distress syndrome (ARDS), 80,
80f, 429Acute/subacute stress fracture, 309Acute tendinitis, 312
Index
Note: Page numbers followed by f refer to figures; those followed by t refer to tables.

442 Index
BladderScan, BVI 300, 200Blighted ovum, 227BLUE protocol, 81Blunt abdominal trauma, 45–46, 45fBlunt eye trauma, 352Blunt trauma, 45–46. See also Trauma ultrasoundBone, 13, 285, 292
acute traumatic fracture, 306–308acute/subacute stress fracture, 309pitfalls, 315plain radiography, 316
Bowelanatomy, 28–29bedside sonography of, 186
bowel obstruction, 186–190hernias, 190–194
dilation, 188gas, 12f, 141, 144f, 151
ring down image artifact, 14, 15floop, 151, 152fobstruction, 196
artifacts, 190clinical applications, 186–187image acquisition, 187image in clinical decision making, 190imaging modalities, correlation with, 190large bowel obstruction (LBO), 188normal ultrasound anatomy, 187pathology, 187–190pitfalls, 190small bowel obstruction (SBO), 186, 187–188,
188–189f, 190peristalsis, 189strangulation, 188, 198wall thickening, 189
Brachial artery, short-axis views of, 120–121fBrachial plexus bock
infraclavicular approach to, 325finterscalene approach to, 324f
Brachial veins, 121fcomplete collapse of, 122fshort-axis views of, 120f
Bradycardia, 48, 101Branchial cleft cyst, 297, 376Breech presentation, 242fBronchiolitis, 392Bullous disease, 104Bupivacaine, 321tBursa, 306, 308f, 313–314
and joint, 316pitfalls, 315
Bursitis, 303, 313–314
CCalcified gallbladders, 141Calf vein DVTs, 260Calipers, 19Camper fascia, 192Capnography, 125Carcinoma, 297Cardiac anatomy, 56fCardiac arrest, resuscitative ultrasound in, 101Cardiac chambers, 30, 30fCardiac injury, 47Cardiac output, 101Cardiac standstill, 431Cardiac tamponade, 35, 37f
pericardial effusion, 46Cardiac ultrasound, 438Carotid artery
anatomy of, 114f, 115fshort-axis view of, 114f
Cataracts, 361, 362fCaval index, 85, 88CAVEAT protocol, 429Cecum, 396Celiac trunk, 139f, 160Cellulitis, 285f, 286, 286f, 370, 376Central line placement, use of ultrasound to, 2, 7,
112, 118, 408Central renal sinus, 29
Artifactsacoustic shadowing, 118, 119fbeam width, 15comet tail, 14edge artifact, 14, 276f, 278–279enhancement, 13–14lateral cystic shadowing, 278–279mirror image, 14refraction, 278–279reverberation, 14ring down, 14, 110, 112f, 118, 119fshadowing, 13, 151–152, 279side lobe artifact, 15, 151vs. stones, 144f
Ascites, 40, 150, 150f, 195, 196, 197f, 436Ascitic fluid, 196Aspiration pneumonia, 429Asystole, 70Atherosclerotic aorta, 161Atherosclerotic cardiovascular disease
(ASCVD), 163Attenuation, 11–12, 11fAugmentation, 256Axial resolution, 12, 12fAxillary artery, short-axis view of, 115f, 116fAxillary vein
anatomy of, 115fcomplete collapse of, 116fshort-axis view of, 115, 115f, 116f
BB-lines, 78, 79, 79f, 99, 104, 104f, 431, 438B-mode (brightness mode scanning) image, 19, 19fB-predominance. See B-linesBackscatter, 12“Bag of worms,” 277Baker’s cyst, 260Barcode sign, 78, 79f, 99, 100fBasilic vein, 121, 121f
complete collapse of, 122fcontour buckling, 123fshort-axis views of, 120f, 123f
Bat sign, 77Battlefield environment, ultrasound in, 430Beach sign, 100fBeam width artifact, 12, 15Beck’s triad, 129Bell-clapper deformity, 271Betadine, 321ß-hCG, 209, 230
quantitative, use of, 232–233Biceps brachii muscle, 121Biceps tendon rupture, 310fBicornuate uterus, 214, 214fBifurcation, of aorta, 159f, 160, 166fBilateral hydronephrosis, 181, 184, 184fBilateral vitreous hemorrhage, 391Bile duct, 138
dilated, 149fstellate pattern, 149f
Biliary colic, 141, 144. See also CholecystitisBiliary obstruction, 148, 149–150fBiliary tract disease, gallbladder and, 144–145, 152Biliary tree. See Right upper quadrant (RUQ)
ultrasoundBiparietal diameter (BPD), 222, 222f, 239–240,
240fBladder, 389–390. See also Suprapubic bladder
aspirationanatomy, 29aspiration, 409displacing uterus, 230ffree fluid in, 33f, 34flong and short axis view, 177fpitfalls, 250–251suprapubic aspiration, 199in transverse orientation, 30fwith ureteral jet, 180fvolume, 199–200
measurement, 409pitfalls and complications, 201
Aortaabdominal, 161fartifacts and pitfalls, 166–167assessment of, 105bifurcation of, 159fclinical applications, 156–157, 157tclinical case, 170image acquisition, 157–160, 158fimage in clinical decision making, 167–169imaging modalities, comparison with other,
169–170and inferior vena cava (IVC), 161, 163f, 163t
long-axis/banana peel view of, 91fratio, 436short-axis view of, 87f, 91f
measuring methods, 159–160, 160fpathology, 161–166ultrasound anatomy and landmarks, 158f,
160–161Aortic aneurysm. See Abdominal aortic
aneurysm (AAA)Aortic dilatation, 68fAortic disease, 67–68Aortic dissection, 68, 105, 105f, 267, 268Aortic occlusion, 265, 267, 269Apical four-chamber view, 61, 67fApical view, of heart, 127, 128fAppendicitis, 396, 397f, 398f
clinical decision making, use of image in, 397
imaging modalities, correlation with, 399long-axis image of, 398fpitfalls, 397ultrasound findings in, 396–397
Appendicolith, 396Appendix, 395Arcuate artery, 178fArcuate vein, 178fArcuate vessels, 251, 251fArm, subcutaneous structures of, 285Arrays transducers, 17Arterial insufficiency, 265Arterial occlusion, 267Arterial vascular emergency
clinical applications, 264–265clinical case, 269–270clinical decision making, use of image in, 269image acquisition
peripheral arteries, 265renal dialysis access, 265–266thoracic aorta, 265
imaging modalities, comparison with, 269incidental findings, 269normal ultrasound anatomy
arteries, 266renal dialysis access, 266–267
pathologyaortic dissection, 267arterial occlusion, 267pseudoaneurysm, 267renal dialysis access thrombosis, 268traumatic arteriovenous fistula, 267–268
pitfallsaortic dissection, evaluation of, 268renal dialysis access, evaluation of, 269
Arteries, 266, 266fArteriography, in abdominal aortic aneurysm
(AAA), 170Arteriovenous anastomosis, 268Arteriovenous fistulas (AVF), 267–268Arteriovenous graft, 269Arthrocentesis
anatomy and procedure, 332, 333–339fankle, 336fclinical applications, 332elbow, 338f, 339fhip, 333fimage acquisition, 332knee, 334f, 335fpitfalls, 332shoulder, 337f

Index 443
functional, 209Gartner’s duct, 215, 215fnabothian, 215, 215fovarian, 43, 43f, 209–211perihilar, 182, 183frenal, 41
complex, 183, 183fsimple, 182, 182f
sonographic features of, 138
DD-ring sign, 102fDebris within endometrial cavity, failed
pregnancy with, 229fDecidua basalis, 247fDecidua vera, 220Decidual capsularis, 220Deep veins, of lower extremity, 258Deep venous thrombosis (DVT), 100, 103. See also
Lower extremity venouschronic, 261
Deferential artery, 275fDehydration, 90–91
in children, 436in pediatric patients, 89–90, 389
Deltoid muscle abscess, 342fDental abscesses, 365, 372Depth control, 18Dermoid cysts, 210, 211fDescending aorta, 34, 60, 69, 71fDeveloping countries, ultrasound in, 435–440Diagnostic peritoneal lavage (DPL), 2
in blunt abdominal trauma, 49and trauma ultrasound, 21, 31
Dialysis access, renal, 265–267, 267f, 269Dialysis artriovenous graft, 266f
Diarrhea, 90, 436Dichorionic twins, 234DICOM interface capabilities, 417Didelphic uteri, 214–215Diffuse reflectors, 12Dilated bile ducts, 149fDilated bowel, 188, 188–189f, 190fDirty shadow, 13Disaster relief, 429Discriminatory zone, 230, 232Distal arterial occlusion, 267Distensibility index, 89, 93Documentation, 418Documents
ACR-SPC-SRU Practice Guidelines for Perform-ing and Interpreting Diagnostic Ultrasound Examinations (2011), 6
Emergency Ultrasound Guidelines (ACEP 2001, 2008), 5
Focused Cardiac Ultrasound in the Emergent Set-ting: A Consensus Statement of the American Society of Echocardiography and the American College of Emergency Physicians, 6
Model Curriculum for Physician Training in Emergency Ultrasonography (SAEM, 2009), 2
Practice Guidelines for the Performance of the Focused Assessment with Sonography for Trauma Examination (AIUM), 6
Use of Ultrasound Imaging by Emergency Physicians (ACEP), 3
Doppler, 19, 274–275color, 274, 274f. See also Color Doppler imagingeffect, 19high resistive pattern, 273low resistive pattern, 274phasic pattern, 274power, 78, 273, 274resistive index, 276shift, 274spectral, 273, 274
Dorsal finger abscess, 289fDouble barrel shotgun, 148, 148fDouble decidual sign, 219f, 220Dynamic air bronchogram, 81Dynamic assessment, 315–316
Common iliac vein, 161fCommunity emergency department, ultrasound
implementation inaccreditation, 418–419credentialing, 415–416documentation, 418equipment selection, 417–418leadership, 413physician training, 415program development, 413quality assurance, 416–417reimbursement, 418relationships with, 413–415
Complete placenta previa, 247Complete sinusogram, of patient with acute
maxillary sinusitis, 367, 367fComplex adnexal mass, 224, 225fComplex cysts, 209–210, 210f, 216f, 295Complex effusions, 313Complex renal cysts, 183, 183fComplex synovitis, 313, 315fCompressibility, 188, 255, 257f, 261Compression sonography, 261Computed tomography (CT) scan
for abdominal aortic aneurysm, 169, 169–170ffor abdominal pain, 153appendicitis, 399bowel obstruction, 190deep venous thrombosis, 261head and neck infection, 380hernias, 193intraocular foreign body, 354joint and bursa, 316maxillary sinusitis, 368–369pelvic masses, 214peritonsillar abscess, 372reconstruction of aorta showing saccular
aneurysm, 165frenal stones, 182skin and soft tissue infections, 288–290trauma ultrasound and, 47, 49
Concealed hemorrhage, 246Conception, retained products of, 250, 250fCongenital cysts, 365Congestive heart failure (CHF), 65, 66f, 71, 75, 82,
85, 90, 145f, 431Consultative ultrasound imaging, 3Consulting imaging service, 3–4Core Content for Emergency Medicine, 5–6, 415Cornstarch gel, 437Cornual ectopic pregnancy, 225Corpus luteum, 208, 234Cortex, kidney, 29, 177, 179Cortical bone, 304–305, 305fCortical rim of humerus, 120–121, 120fCortical substance, 178fCoupling agent, 437, 437tCredentialing, 415–416
American College of Emergency Physicians (ACEP), 2, 5
American Institute of Ultrasound Medicine, 6American Medical Association (AMA), 6program administration, 424–425
Crescent sign, 358–359Crown–rump length (CRL), 222, 222fCrystal arthropathies, 313, 315fCul-de-sac, 29, 29f
fluid in, 226–227, 226fCuldocentesis, 2Current Procedural Terminology (CPT)
codes, 418Curvilinear array transducer, 17, 17f, 126, 174,
175, 175fCurvilinear transducer, 196, 199Cutaneous abscesses, 383Cylinder tangential effect, 87, 91, 98, 166, 167fCystic duct, 139fCystic hygroma, 376, 377Cysts, 50, 295
congenital, 365dermoid, 210, 211f
Central venous access, 84anatomy and landmarks, 112–117
femoral vein approach, 116–117, 117f, 118finternal jugular vein approach, 112, 114fsubclavian vein approach, 112–116, 115f, 117f
clinical indications, 108–109, 407decision making, use in, 119femoral vein approach, 408image acquisition, 407–408
dynamic ultrasound (real-time), 110general approach, 110–112in-plane (long-axis) technique, 110, 111fout-of-plane (short-axis) technique, 110, 112fpreparation and, 109–112static ultrasound (landmarking), 110, 111f
internal jugular vein approach, 408pitfalls and complications, 118–119, 408–409procedure, 117–118, 408subclavian vein approach, 408
Central venous catheter (CVC), 108–109, 7. See also Central venous access
Central venous pressure (CVP), 71, 84, 85f, 103Cephalic vein, 121Cerebral spinal fluid, 345Cerebrospinal fluid, 410–411Cervical assessment, 242–244Cervical ectopic pregnancy, 225Cervical length, 242–243
sagittal transabdominal measurement of, 244fCervical lymph node, 381fCervical lymphadenitis, 376–377Cervical lymphadenopathy, 376Cervix, 29f, 252
pitfalls, 250Chest pain, 71Child abuse, 391Chlamydia trachomatis, 272Chlorhexidine alcohol, 128, 321Chocolate cysts, 210, 211f, 212fCholangitis, 147, 148Cholecystitis, 141, 144–147
acalculous, 147acute, 144, 146–147, 147f, 148fchronic, 144, 146f
Cholelithiasis, 141, 153Cholescintigraphy, 153Chorionic villi, 227Choroid, 353Choroidal detachment, 354Chronic deep venous thrombosis, 261Chronic distal ischemia, 264–265Chronic obstructive pulmonary disease (COPD),
82, 103, 104, 431Chronic tendinitis, 312Circulatory shock, 70Circumferential effusion, 34–35Cirrhosis, 439fCirrhotic livers, 196Classic metaphyseal lesions (CML), 391Clavicle, 112, 114f, 115, 115fClean shadowing, 13Clot
echogenic hemorrhage and, 34echogenicity, 260
Cluster of grapes, molar pregnancy, 228, 229fCobblestone appearance, 286, 286f, 376Color Doppler imaging (CDI), 19, 20f, 115, 116f.
See also Dopplerenlarged ureter, 180fflash artifact, 278flow, 249flow of urine, detection of, 180–181, 181fhematoma, flow adjacent of, 184f
Color duplex ultrasound, 280Comet tail artifact, 14, 14f, 31, 78, 126, 291, 392Common bile duct (CBD), 137, 138, 138f, 139f.
See also Gallbladder; Right upper quadrant (RUQ) ultrasound
dilated, 148fdouble barrel shotgun of, 148f, 149f
Common iliac artery, 161f

444 Index
equipment, 351, 351fimaging technique, 351–352
imaging modalities, comparison with, 361incidental findings, 361–362normal ultrasound anatomy, 352pathology
choroidal detachment, 354elevated intracranial pressure, 356–359globe rupture, 355intraocular foreign body, 354–355lens dislocation, 352posterior segment detachments, 353–354posterior vitreous detachment, 353retinal detachment, 353–354vitreous hemorrhage, 352–353
pitfalls, 359–360
FFar field acoustic enhancement, 287, 287fFascia, 191, 285Fascicular trauma, 321FAST. See Focused Abdominal
Sonography for Trauma“Feather-like” appearance, 285Femoral artery, 117fFemoral hernias, 191Femoral nerve block, 329fFemoral vein, 116–117, 117f, 118f
approach, 408Femur length (FL), 222, 240, 240fFetal abnormalities, pitfalls, 251Fetal biometry, 436Fetal cardiac activity, 241Fetal demise, 227, 228fFetal heart rate, 220, 221f, 222f, 436
M-mode measurement of, 241fFetal lie, 241, 242fFetal measurements
abdominal circumference (AC), 222biparietal diameter (BPD), 222, 222fcrown–rump length (CRL), 222, 222ffemur length (FL), 222gestational sac size (GSS), 222mean sac diameter (MSD), 222
Fetal pole, 220, 221fFetal viability, 237, 245
determining, 220–221Fetus, first trimester, 221fFibroadenoma, 297Fibroids. See Leiomyomas (fibroids)Fingertip felon, 289fFlank pain, 181, 182, 183Flat tire sign, 355Flexion, 205Fluid in cul-de-sac, 226–227, 226fFluid responsiveness, hypotension and, 90Fluoro-2-deoxy-D-glucose—positron emission
tomography (FDG-PET), 298–299Focus control, 18Focused Abdominal Sonography for Trauma
(FAST), 2, 6, 21, 22, 134, 215, 391, 436blunt abdominal trauma, 45detecting intra-abdominal hemorrhage, 104double line sign, 41emergency medical services (EMS), 431gallbladder, 28liver, 28multiple casualty incidents (MCI), 429penetrating trauma, 46peritoneal space, 28, 28f
Focused cardiac ultrasound (FOCUS), 414Footprints, 17, 17f, 18fForeign body (wood, glass, metal, gravel, plastic,
radiolucent, organic, inert, asymptomatic, thorns, cactus spines, infected), 291, 396. See also Soft tissue foreign body
Foreign body, removal ofclinical applications, 343image acquisition, 343pitfalls and complications, 344–345procedure, 343–344
model curriculum for physician training, 6paradigm of, 3–4SAEM policy statements, 5specialty endorsement by, 3standard of care, 7utility, in first trimester pregnancy patient, 233
Emergency Ultrasound Coding and Reimbursement, 418
Emergency Ultrasound Guidelines (ACEP), 2, 5, 416
Endocavitary probe, 17Endocavitary transducer, 115, 116fEndoleak, 166Endometrial cancer, 208Endometrial echo complex, 205, 207fEndometrial stripe, 205Endometriosis, 210Endotracheal tube (ETT), 104, 105
confirmationanatomy and landmarks, 125–126clinical indications, 125image acquisition, 125pitfalls and complications, 126procedure, 126, 126fuse in decision making, 126
esophageal intubation, 430mainstem intubation, 430
Endovaginal probe, 214Endovascular aortic repair (EVAR), 166Endovascular graft, 166fEnhancement artifact, 13–14Epicardial fat pad, 44, 62, 68, 102Epididymal cyst (EC), 281f, 376Epididymis
body of, 275ftail of, 275f
Epididymitis, 272, 275–276, 276fEquipment
B-mode, 19, 19fcalipers, 19depth, 18exam presets, 17focus, 18freeze, 19gain controls, 17–18, 18fM-mode, 19, 19fand power supply management, 432–433,
436–437tissue harmonics, 19transducers, 16–17
Esophageal intubation, 126fEvaluation and management codes (E&M
codes), 418Exam presets, 17Extended Focused Assessment with Sonography in
Trauma (EFAST), 21, 22, 22f, 392during air transport, 431fbasic exam, 22–23in ground emergency medical services unit,
431, 431fduring military operations, 430, 430forder, 27–28paracolic gutters, 25pelvis, 24pericardial, 24–25perihepatic view, 23perisplenic view, 23–24thoracic, 25–27timing and speed, 22
External hemorrhage, 246External iliac artery, 161fExternal iliac vein, 161fExtraocular muscles, 352Exudative mechanisms, 353Eye emergencies, 350
clinical applications, 350, 351fclinical cases, 363clinical decision making, use of image in,
360–361image acquisition
dynamic testing, 352
Dynamic technique, 197Dynamic ultrasound, 110Dyspnea, 71, 81, 431
acute, resuscitative ultrasound in, 101–105evaluation of, 85
EE point septal separation (EPSS), 65, 66f, 98Echinococcal cyst, 439fEcho-free space, 14, 44, 123, 141Echocardiography, 438
artifacts, 68clinical applications, 55clinical case, 72–73clinical decision making, use of image in
chest pain, 71circulatory shock, 70hypotension, 70–71incidental findings, 71–72, 71f, 72fshortness of breath, 71
handheld, 436image acquisition, 55–58normal ultrasound anatomy and primary cardiac
windows, 58–59alternate views, 61–62apical four-chamber view, 61parasternal long axis (PSLA) view, 60–61subxyphoid window, 59–60
pathologyaortic disease, 67–68left ventricular systolic function, 65pericardial effusion, 63right ventricular strain, 65–67tamponade, 64
pitfalls, 68–70two-dimensional, 126
Echogenic debris, 377Echogenic effusions, 35Echogenic foci, 378Echogenic hemorrhage and clot, 34Echogenic intraluminal thrombus, 269Echogenic material in uterus, 227, 229Ectopic pregnancy, 218, 223–226, 223–226f, 230,
231, 438ectopic thymus, 297
Edge artifact, 14, 15f, 276f, 278–279Education of emergency medicine
faculty, 422–423residents, 423
EFAST. See Extended Focused Assessment with Sonography in Trauma
Efferent ductules, 275fEffusion. See Pericardial effusion; Pleural effusionEhlers-Danlos syndrome, 163Ejection fraction (EF), 65, 66fElbow, arthrocentesis of
longitudinal approach, 338ftransverse approach, 339f
Electrocardiogram (EKG), 72, 270, 279, 418Elevated intracranial pressure, 356–359Emergency echo, 55, 70–71Emergency Medical Services (EMS), 431–432Emergency ultrasound
American College of Emergency Physicians (ACEP) policy statements, 5
American College of Radiology (ACR), 6–7American Institute of Ultrasound Medicine
(AIUM), 6American Medical Association (AMA)
approach to, 6American Society of Echocardiography (ASE), 6characteristics of, 4–5core content/clinical practice, for emergency
medicine, 5–6growth of
imaging availability, 2–3improving technology, 3timely access to imaging, 2ultrasound’s value, recognition of, 2
history of, 1–2introduction, 1

Index 445
strangulated, 190, 198ultrasound evaluation of, 192fventral, 191, 199f
Hernia sac, 191, 198necrotic fat in, 192ventral hernia defect, 199f
Heterogenicity, 281Heterotopic ectopic pregnancy, 225, 226Hilar hypervascularity, 376Hilum, 176, 177, 178fHip
arthrocentesis of, 333feffusions, 390, 390fevaluation, 333f
HIV-infected patients, 436Hollow viscus injuries, 40Hydration status, 389Hydrocele, 277Hydrometrocolpus, 214fHydronephrosis, 99, 172, 178–180
bilateral, 181, 184, 184fgrading of, 179fmild, 178, 179fmoderate, 178f, 179, 179fsevere, 179, 180funilateral, 180, 181
Hydrosalpinx, 212–213, 213fHyperechoic
appearance, 297calculus, 378convexity, 346, 346f
Hyperemia, 377, 397Hyperperistalsis, 189Hypertensive congestive heart failure, 90Hypertrophic pyloric stenosis, 402tHypertrophied lymph tissue, 396Hypoechoic lymph node, 386fHypotension, 70–71
and acute dyspnea, 101–105and fluid responsiveness, 90undifferentiated, 84–85
Hypovolemia, 47, 70, 101
IICD-9 codes and medical necessity, 418Impedance, 10, 11, 11fImprovised explosive device (IED), 430In-plane technique, 110, 111f, 112, 197Incarcerated external hernias, 190Indelible ink, 110Indeterminate interpretation, in blunt
trauma, 46Indeterminate ultrasound, 231–232Infarction, 276Inferior epigastric artery, 196, 197fInferior mesenteric artery, 160Inferior phrenic artery, 161fInferior vena cava (IVC), 71, 139f, 256
and aorta, 87f, 161, 163t, 163faorta ratio, 89, 91, 389basic exam, 96–100and cardiac evaluation, 429and central venous pressure (CVP), correlation
between, 85fclinical applications, 84–85
dyspnea, evaluation of, 85undifferentiated hypotension, 84–85volume resuscitation, 85
clinical case, 92–94collapse, 84, 85, 90distended, with M-mode measurement, 99femptying into right atrium, 130fentering right atrium, 86festimation of preload and volume status, 103and hepatic veins, 136f, 137fimage acquisition, 85–87image in clinical decision making, 90–91
dehydration, 90–91hypotension and fluid responsiveness, 90shortness of breath, 91
imaging modalities, correlation with, 92
Graded compression, 187Guitar pick sign, 360, 361f
HHamartoma, 297Handheld echocardiography, 436Head and neck
abscesses, 375–376infections of, 365
artifacts and pitfalls, 379–380clinical applications, 372clinical cases, 380–381clinical decision making, use of image in, 380image acquisition, 372–373imaging modalities, correlation with, 380normal anatomy of, 373–375paranasal sinuses, 366–369pathology of, 375–379pharyngitis, 369–372
proceduresincision and drainage of, 385–387peritonsillar abscesses, aspiration of, 383–385
Head circumference (HC), 222, 240, 240fHead injury, 391Heart
assessment of, 101contractility, 101–102hypodynamic, 101left ventricular function, 101–102pericardial effusion, 102right heart strain, 102–103tamponade, 102
subcostal view of, 86fHemangioma, 297Hemarthroses, 312Hematocele, 277Hematoma, 183, 183f, 184f, 272, 297, 309, 315Hematometra, 215Hemithorax, 124Hemodynamic instability, pregnant patient
with, 230Hemopericardium, 102
clotted, 37fHemoperitoneum, 2, 4, 40f, 45, 436Hemopneumothorax, 45, 49Hemorrhage, 34, 102, 104Hemorrhagic (isoechoic) fluid, 354Hemothorax, detection of, 47Hepatic artery, 138, 139fHepatic segment, 87, 87fHepatic ultrasound, 438–439Hepatic veins, 135–137, 161f
bunny ears, appearance of, 136fcross-section, at confluence of, 87finferior vena cava and, 136f, 137finlet, 86and portal venous system, 136f
Hepatization, of lung, 80Hernia
abdominal wall, 198, 199fartifacts and pitfalls, 192clinical applications, 191clinical case, 193–194femoral, 191image acquisition, 191image in clinical decision making, 192–193imaging modalities, correlation with, 193incarcerated, 190incidental findings, 193inguinal, 191, 198manual reduction of, 198normal ultrasound anatomy, 191obstruction due to, 198pathology, 191–192reduction
anatomy and landmarks, 198clinical indications, 198pitfalls and complications, 199procedure, 198–199, 199f
scrotal, 277–278spigelian, 191
Fracture, 390, 391, 439acute traumatic, 306–308acute/subacute stress, 309reduction, 341f, 411
clinical applications, 340image acquisition, 340normal ultrasound anatomy, 340pitfalls and complications, 340, 342procedure, 340
rib, 308, 309fSalter-Harris Type-I, 308, 340scaphoid, 308, 316stress, 309
Frank-Starling curve, 88, 88fFree fluid, 215
cul-de-sac, 226, 226fectopic pregnancy, 224
Free peritoneal fluid, 31–34blunt trauma, 45–46echogenic hemorrhage/clot, 34flow patterns, 31–32minimum detectable, 31in Morison’s pouch, 31, 32fparacolic gutter, 34pelvic, 33, 34f, 35fperihepatic, 31f, 32perisplenic, 32–33, 33fsubdiaphragmatic space, 32f, 33f
Freeze button, 19Frequency, definition of, 10Functional cysts, 209Fusiform acute abdominal aortic
aneurysm, 163, 164f
GGain control, 17–18, 18fGallbladder, 139f
anatomy, 28distended, 144, 145fedge artifact, 14emptying into cystic duct, 140ffossa, 141, 143fgangrenous, 147fperihepatic view, 41–42, 42fpolyps, 141and portal triad, 139fright upper quadrant (RUQ) ultrasound,
134–135, 135f, 138–140septums and unsuspecting twists, 140fsonographic appearance of, 28fstones and sludge, 143fthick lithogenic bile, 143fwall, 144
edema, 144–145, 146thick wall, 146f
Gallstones, 141, 141f, 142fimpacted, 142fincreased through transmission, 14and sludge, 143fand thickened gallbladder, 146f. See also
GallbladderGartner’s cysts, 215, 215fGas
soft tissue, 288subcutaneous, 287
Gastric artery, 161fGastric cancer, liver mass, 151fGastroduodenal artery, 138, 139fGerm cell tumors, 281Gerota’s fascia, 29, 177Gestational age, 221–222, 222f, 436Gestational dating
abdominal circumference, 240–241
biparietal diameter, 239–240femur length, 240head circumference, 240
Gestational sac, 219–220, 219–220fGestational sac size (GSS), 222Globe rupture, 355, 359fGonadal artery, 161f

446 Index
sonographic appearance of, 135fLocal anesthetic systemic toxicity (LAST), 323Localized intraperitoneal free fluid, 189Long-axis technique, 110, 111f, 197Longitudinal orientation, 16Low-lying placenta, 247Lower extremity anesthesia, femoral nerve
block, 329fLower extremity venous, 254–255
artifacts, 260–261clinical applications, 255clinical case, 262clinical decision making, use of image in, 261correlation with other imaging modalities, 261–262image acquisition
consultative technique, 256–258primary component, 255–256secondary component, 256
incidental findings, 262normal ultrasound anatomy, 258pathology, 258–260pitfalls, 260–261
Ludwig’s angina, 369, 372Lumbar puncture, 410–411
clinical applications, 345image acquisition, 345pitfalls and complications, 347procedure, 345–347, 345–347f
Lumen, 138, 141Lung. See also Thoracic ultrasound
consolidation, 80–81and interstitial fluid, 77, 77f
point, 38, 38f, 78–79, 79f, 100fpulse, 44, 79, 80f, 82f, 126reverberation, 14sliding, 78, 99, 126, 438ultrasound, 76, 391–392
Lymph nodes, 262, 374–375, 375fLymphadenopathy, 376
MM-mode image, 19, 19f
of E point separation, 98fend point separation, in low ejection fraction
patient, 101ffetal heart rate, 220, 221f, 222fof inferior vena cava (IVC) diameter, 88flung sliding, 78pneumothorax, 76
Machine maintenance, safety and, 437–438Macula off/on, 354Magnetic resonance imaging (MRI)
for abdominal aortic aneurysm (AAA), 170for deep venous thrombosis (DVT), 261for head and neck infection, 380for intraocular foreign body, 354for joint and bursa, 316for maxillary sinusitis, 368–369for ovarian vein thrombosis (OVT), 214
Main lobar fissure (MLF), 134–135, 138, 139fMainstem intubation, 104Major calyces, 178fMakeshift standoff pads, 292Making Health Care Safer–A Critical Analysis of
Patient Safety Practices, 7Malrotation, 402
image in clinical decision making, 403imaging modalities, correlation with, 405pitfalls, 403ultrasound findings in, 403
Marfan syndrome, 163Masses, 50
abdominal, 99adnexal, 234complex adnexal, 224, 225fintratesticular, 281, 281fneck, 297, 297fpelvic, 180renal, 182scrotal, 271, 272soft tissue, evaluation of, 295–299
JJaundice, 147–150
painless, 153–154fJoint effusion, 313, 314f
complex, 317crystalline, 317CT for, 316hemarthroses, 312MRI for, 316pitfalls, 315septic, 317simple, 317traumatic, 317
Joints space, 306, 307f, 308tcomplex synovitis, 313simple synovitis, 313, 314f
KKidney. See also Renal ultrasound
anatomy, 29image acquisition, 173, 173f, 177f
imaging technique, 174–176patient preparation, 173–174
inferior pole of, 23f, 24fleft, 176, 177pediatric malignancies in, 182right, 176, 177
longitudinal image, 175fmild hydronephrosis in, 179fmoderate hydronephrosis in, 178f, 179fshort axis image, 176f
superior pole of, peritoneal fluid, 32fand surrounding structures, 174fultrasound anatomy and landmarks, 177–178,
177f, 178fultrasound machine screen, image on, 176fvisualization, through intercostal spaces, 175f
Knee, arthrocentesis oflongitudinal approach, 334ftransverse approach, 335f
LLandmarking technique, 110, 111f, 124Large bowel obstruction (LBO)
vs. small bowel obstruction, 188Large bowel, ultrasonic appearance of, 196Last drip phenomenon, 102Lateral cystic shadowing, 278–279Lateral resolution, 12, 12fLawnmowering, 187, 187–188fLeadership and infrastructure, 432, 436Left ventricular
contractility, 102function, 101–102hypertrophy, 71, 72fsize, 102systolic function, 65
Leg pain/swelling. See Lower extremity venousLegg-Calve-Perthes disease, 390Leiomyomas (fibroids), 208, 208–209f, 251, 251fLemierre syndrome, 379Lens dislocation, 352, 354fLeriche syndrome, 267Lidocaine, 321t, 344Ligament of Treitz, 400Ligaments, 308f
tears, 306, 316Limp, 390Linear array transducer, 109, 120, 125Lipoma, 297, 376Liver
as acoustic window, 27fanatomy, 28echinococcal cyst, 439fedge artifact, 14injury, 39f. See also Solid organ, injurylarge cyst in, 151flesion in, 50fmass, 151fperitoneal fluid, 32fright upper quadrant (RUQ) ultrasound, 134, 135
Inferior vena cava (IVC) (continued )long-axis image of, 86f, 87f
dilated and noncollapsible, 90fin mechanically ventilated patient, 89fin volume depleted patient, 89f
normal anatomy, 87–88pathology, 88–90
congestive heart failure, 90dehydration in pediatric patients, 89–90volume responsiveness, 88–89
pitfalls, 91–92small collapsed, in volume depleted
patient, 103fInfraclavicular approach, 325f, 408
for subclavian vein, 113, 115, 115fInfrarenal aorta, 156, 159Inguinal hernias, 191, 198Inguinal ligament, 117fInner medulla, 178Interlobar arteries, 178, 178fInterlobar vein, 178fInterlobular artery, 178fInterlobular vein, 178fInternal carotid artery, 370Internal iliac vein, 161fInternal jugular (IJ) vein, 99, 103, 112, 115f
anatomy of, 114fapproach, 408B-mode image of, 379fcompressed and noncompressed, 109flong-axis view of, 110fshort-axis view of, 114ftransducer in
longitudinal orientation, 110ftransverse orientation, 109f, 114f
International Society of Ultrasound in Obstetrics and Gynecology, 440
Interscalene approach, 324fInterstitial ectopic pregnancy, 225, 226fInterstitial edema, 104Interstitial fluid, 77f
and lung consolidation, 77thoracic exam, 104
Interstitial syndrome, 75, 79Intestinal malrotation, 405Intra-abdominal abscess, 99Intra-abdominal fluid, 104Intracranial pressure, elevated, 356–359Intradecidual sign, 219Intrafasicular nerve block, 322Intraglandular ducts, 373–374Intraluminal accumulation, 396Intramuscular abscess, 288f, 342Intraneural nerve block, 322Intraocular foreign body, 354–355Intraocular tumors, 361Intraperitoneal hemorrhage, 42, 42fIntratesticular mass, 281, 281fIntrauterine devices (IUDs), 208–209Intrauterine fetal demise (IUFD), 227, 228f,
245–246Intrauterine growth retardation, 436Intrauterine pregnancy (IUP)
abnormal/nonviable, 227, 228tdefinitive findings of, 220detected, 231. See also Pregnancy,
first trimesterearly, 219
Intravenous pyelography (IVP), 182Intussusception
anatomic depiction of, 400fimage in clinical decision making, 401imaging modalities, correlation with, 401pitfalls, 401ultrasound findings in, 400–401
Intussusceptum, 400fIntussuscipiens, 400fIschemia, 276Iso-hyperechoic abscess cavity, 287fIsoechoic, 297
abscesses, 370. See also Skin and soft tissue

Index 447
Out-of-plane technique, 110, 112f, 197, 321Ovarian cysts, 43, 43f, 234
chocolate, 210, 211fcomplex, 209–210, 210f, 216fdermoid, 210, 211fpolycystic, 210–211, 212fsimple, 209, 210f
Ovarian hyperstimulation syndrome (OHS), 211, 212f
Ovarian torsion, 213, 213fOvarian vein thrombosis (OVT), 214Ovaries
anatomy, 206–208, 207–208fpathology, 209–213
chocolate cysts, 210, 211f, 212fcomplex cysts, 209–210, 210fdermoid cysts, 210, 211fhydrosalpinx, 212–213, 213fovarian hyperstimulation syndrome (OHS),
211, 212fovarian torsion, 213, 213fpolycystic ovarian syndrome (PCOS),
210–211, 212fsimple cysts, 209, 210ftubo-ovarian abscess (TOA), 212–213
PPacemaker, 55, 101, 130–131Pacer capture, 55Palatine tonsil, 370Pampiniform plexus, 275fPapillae, 178fParacentesis
anatomy and landmarks, 196clinical indications, 195image acquisition, 195–196, 195fpitfalls and complications, 198procedure, 196–198, 197f
Paracolic gutter, 25, 26ffree fluid, 34f, 35finferior pole of, 23f, 24f
Paramedics, 432Paranasal sinuses
artifacts, 368clinical applications, 366clinical decision making, use of image in, 368image acquisition, 366imaging modalities, correlation with, 368–369normal anatomy of, 366–367pathology of, 367–368pitfalls, 368
Parapharyngeal space infection, 369Parasternal long axis (PSLA) view, 44, 60–61
aortic root, measurement of, 68fof heart, 36f, 127, 127fright ventricle
collapse, 37f, 64fdilatation, 67f
systolic function, 65fParasternal orientation, 34Parasternal short axis, 62, 63f, 72f, 102, 102fParietal pleura, 77Parotid gland, 373, 377, 378fParoxysmal pain, 400Partial placenta previa, 247Partial sinusogram, 367–368, 367fPatellar tendon tear, 310fPayer policy, 418Pediatric abdominal emergencies
appendicitis, 396, 398fimage in clinical decision making, 397imaging modalities, correlation with, 399pitfalls, 397ultrasound findings in, 396–397
clinical applications, 394clinical case, 405image acquisition, 394–395incidental findings, 405intussusception
image in clinical decision making, 401imaging modalities, correlation with, 401
joint, 315muscle, 315tendon, 315
Myometrium, 225
NNabothian cyst, 215, 215f, 252, 252fNeck abscess, 375–376Neck flexion, 411Neck mass, 297, 298fNeck phlegmon, 297, 297fNecrotic fat, in hernia sac, 192Necrotizing fasciitis, 287, 289f, 376Necrotizing soft tissue infection (NSTI), 288, 291Needle aspiration technique, 386Needle at shallow angle, in-plane (long-axis)
technique, 112fNeeds assessment, 437Neisseria gonorrhoeae, 272Neoplastic gestational disease, 227Nephrolithiasis, 180–181Nephron, 178fNerve blocks
brachial plexus (supraclavicular, infraclavicular, interscalene), 324–325f
femoral nerve, 329fmedian nerve, 326fperipheral, 411, 429
anatomy and landmarks, 320clinical applications, 319general approach to, 320–323image acquisition, 320pitfalls and complications, 323
posterior tibial nerve, 331fradial nerve, 327fsciatic nerve, 330fulnar nerve, 328f
Nerve stimulation techniques, 431Neuroblastoma, 182Nonaccidental trauma, 246, 391Noncardiac pulmonary edema, 429Noncompression, of vessel, 258, 259fNuchal cord, 248–249, 249fNutcracker syndrome, 277
OObesity hypoventilation syndrome, 103Obstetrics, 48, 438Occult abdominal wall abscess, 300fOcular melanoma, 361, 362Ocular ultrasound, 350, 356Odontogenic abscess, 375, 386Oligohydramnios, 244Olive oil, 4371 cm rule, 244One-operator technique for ultrasound-guided
peripheral venous catheter insertion, 122fOpen physis, 304, 315Open tibial physis, 342fOptic nerve sheath diameter (ONSD), 352f, 356,
359, 359f, 391, 430Orchitis, 272
epididymitis and, 275–276Organizations
Agency for Healthcare Research and Quality (AHRQ), 7
American Board of Emergency Medicine (ABEM), 5
American College of Emergency Physicians (ACEP), 5
American College of Radiology (ACR), 6–7American Institute of Ultrasound Medicine
(AIUM), 6American Medical Association (AMA), 6American Society of Echocardiography (ASE), 6Council of Emergency Medicine Residency
Directors (CORD), 7Residency Review Committee (RRC), 7Society of Academic Emergency Medicine
(SAEM), 5, 6Out-of-hospital ultrasound implementation, 432–433
testicular, 281thyroid, 376
Mature cystic teratomas, 210Maximum vertical pocket (MVP), 244McConnell’s sign, 102Mean sac diameter (MSD), 222Mechanical waves, properties of, 10–11Mechanically ventilated patient, inferior vena
cava, 89, 91Median nerve blocks, 326fMediastinum testis, 273, 273fMedicare, 418Medullary substance, 178fMepivacaine, 321tMercedes Benz sign, 63fMesenteric vessels, compressed, 400fMesentery, 195f, 196Metallic foreign bodies, 293f, 355Methotrexate, 232, 233Mickey mouse face, 148, 148fMicrolithiasis, 281, 281fMidazolam, 408Middle cerebral artery (MCA), 432Midgut volvulus, 403Military, 429–431Milk of bile reflux, 153Minor calyces, 178fMirror image artifact, 14, 15f, 68, 78fMitral valve, 97Model Curriculum for Physician Training in
Emergency Ultrasonography (SAEM), 2, 6The Model of the Clinical Practice of Emergency
Medicine, 415Molar pregnancy, 227, 229f, 246Monochorionic twins, 234Morison’s pouch, 23, 23f, 252. See also
Perihepatic viewfree fluid in, 31, 32f, 227fperihepatic fluid, 32right upper quadrant (RUQ) ultrasound, 140, 140f
Mucosal sloughing, 146Multiple Casualty Incident (MCI), 428–429Multiple gestation, 234, 436Muscle, 311–312
acute myositis, 312extraocular, 352fibers, 285pitfalls, 315skeletal, 306, 307fstrain, 390ultrasound, 316
Muscular trauma, 316Musculoskeletal disease, 439Musculoskeletal problems
artifacts, 314–315clinical applications, 303clinical case, 316–317image acquisition, 303–304imaging modalities, comparison with
bone, 316bursa, 316joint, 316ligament, 316muscle, 316tendon, 316
normal ultrasound anatomybursa, 306, 308fcortical bone, 304–305joints, 306, 307f, 308tligaments, 306skeletal muscle, 306tendon, 305–306, 306f
pathologybone, 306, 308–309inflammatory/infectious, 312–314joint, 312muscle, 311–312tendon, 309–311
pitfallsbone, 315bursa, 315

448 Index
Placental location, 242Placental migration, 247Plain film radiography, 190, 193Playboy bunny sign, 135, 136fPleural abnormalities, 36–38
pleural fluid, 36pneumothorax, 37–38
Pleural based injury, 81Pleural cavity, 30Pleural effusion, 123, 124f, 125f, 392, 429
thoracic ultrasound, 75–76image acquisition, 77–78, 77fpathology, 80, 80f
Pleural fluid, 36, 47Pleural interface
sonographic evaluation of, 25transducer position for FAST exam, 27f
Pleural space, 30, 77Pneumonia, 80, 392Pneumothorax, 25, 47, 99, 392, 429, 430
with lung point, 100fpleural abnormalities, 37thoracic exam, 103–104thoracic ultrasound, 75
image acquisition, 76pathology, 78–79
transducer placement for evaluation of, 27fPoint-of-care ultrasound (POCUS), 22, 435
in second/third trimester pregnancy, 237tPoint of maximal impulse (PMI), 127Policy statements. See DocumentsPolycystic kidney disease, 182, 183fPolycystic ovarian syndrome (PCOS),
210–211, 212fPolycystic ovaries, 211Polyhydramnios, 244Popliteal nerve blocks, 330fPortability, 417, 428, 436Portal triad, 134, 139f
and gallbladder, 139fPortal veins, 137–138, 137–138f, 139fPosterior acoustic enhancement, 14, 278, 286, 286fPosterior acoustic shadowing, 315–316, 358fPosterior segment detachments, 353–354Posterior vitreous detachment (PVD), 353
retinal detachment with, 352fwith syneresis, 356fwith vitreous hemorrhage, 363f
Posterior wall enhancement, 138, 279f, 295Postpartum hemorrhage, 436Postvoid residual, 172, 200Pouch of Douglas, 31. See also Pelvic viewPower Doppler, 19, 20f, 31, 78, 146, 268Power slide
sign, 37technique, 31
Power supply management, equipment and, 436–437Pregnancy. See also specific pregnancy
ectopic, 218, 223–226, 223–226f, 230, 231, 438first trimester
artifacts, 229clinical applications, 218–219clinical case, 234clinical decision making, use of image in, 230–233comparison with other imaging modalities,
233–234image acquisition, 219incidental findings, 234normal anatomy, 219–222, 219tpathology, 223–229pitfalls, of image acquisition, 229–230with vaginal bleeding or pelvic pain, 230f
heterotopic, 226, 226fintrauterine
abnormal/nonviable, 227, 228tdefinitive findings of, 220detected, 231early, 219
second and third trimesterartifacts, 250–251clinical applications, 237
blunt abdominal trauma, 46cardiac tamponade, 35–36circumferential effusion, 34–35echogenic effusions, 35heart, assessment of, 102in parasternal long axis view, 127fin subxiphoid orientation, 129f
Pericardial tamponade, 91Pericardial view, 24
artifacts/pitfalls, 43–44Pericardiocentesis, 2, 55
anatomy and landmarksapical approach, 127, 128fparasternal approach, 127, 127fsubxiphoid approach, 127, 129f
clinical indications, 126image acquisition, 126pitfalls and complications, 129procedure, 127–129, 128fuse in decision making, 129–130
Pericardium, 29–30Pericholecystic fluid, 146
in acute cholecystitis, 147fPerihepatic view, 23
artifacts/pitfalls, 41–42with clotted blood, 35f
Perihilar cysts, 182, 183fPerinephric fat, 41, 41fPerineural ulnar nerve block, 322, 323fPeripheral arteries, 265Peripheral line, 121Peripheral venous access, 409
anatomy and landmarks, 120–121clinical indications, 120image acquisition, 120pitfalls and complications, 122procedure, 121–122use in decision making, 122–123
Peripherally inserted central venous catheters (PICCs), 120
Perisplenic free fluid, 32–33, 33fPerisplenic view, 23–24, 23f
artifacts/pitfalls, 42, 42fPeristalsis, 187, 189Peritoneal cavity, dependent areas of, 24fPeritoneal fluid. See Free fluidPeritoneal space, 28, 28fPeritonsillar abscess, 369, 370, 371f, 372f, 381f
aspiration ofclinical indications, 383pitfalls and complications, 385procedure, 383–384
Peritonsillar cellulitis, 371f, 385Perpendicular scanning, 11fPharyngitis, 370f
artifacts, 370clinical applications, 369clinical decision making, use of image in,
370–371image acquisition, 369–370imaging modalities, correlation with, 372normal anatomy of, 370pathology of, 370pitfalls, 370
Phased array transducer, 17, 18f, 22, 175, 175f, 196Phasic variation, 256Phlegmon, neck, 297, 297fPhrenic vein, 161fPhrenicocolic ligament, 32, 42Phrygian cap, 152fPhyses, 315Picture Archival and Communication System
(PACS), 417, 425Piezoelectric crystals, 11Piezoelectric effect, 11fPiezoelectric elements, 11Placenta, 242, 247, 248f, 250Placenta previa, 247–248, 438, 438fPlacental abnormalities, fetal and, 251Placental abruption, 246–247, 251Placental lakes, 247
Pediatric abdominal emergencies (continued )pitfalls, 401ultrasound findings in, 400–401, 400–401f
malrotationimage in clinical decision making, 403imaging modalities, correlation with, 405pitfalls, 403ultrasound findings in, 403with volvulus, 404f
normal ultrasound anatomyappendix, 395cecum, 396pylorus, 396small bowel, 395–396
pyloric stenosis, 401image in clinical decision making, 402imaging modalities, correlation with, 402pitfalls, 402ultrasound findings of, 402, 403f
volvulusimage in clinical decision making, 403imaging modalities, correlation with, 405malrotation with, 404fpitfalls, 403ultrasound findings in, 403
Pediatric problems, 388–389bladder, 389–390head injury, 391hydration status, 389limitations and pitfalls, 392limp, 390lung ultrasound, 391–392nonaccidental trauma, 391
Pediatric proceduresabscesses, incision and drainage of
adult vs. children, 410image acquisition and procedure, 410
central venous accessclinical indications, 407femoral vein approach, 408image acquisition, 407–408internal jugular vein approach, 408pitfalls and complications, 408–409procedure, 408subclavian vein approach, 408
fracture reduction, 411lumbar puncture, 410–411nerve blocks, 411peripheral venous access, 409suprapubic bladder aspiration
clinical indications, 409image acquisition and procedure, 409, 410fnormal ultrasound anatomy and landmarks, 409pitfalls and complications, 410
Pediatric vascular walls, 408Pelvic abscess, 99Pelvic fracture, 48Pelvic free fluid, 33, 34f, 35f, 43fPelvic inflammatory disease (PID), 209, 438Pelvic masses, 180Pelvic ultrasound, in nongravid patient
artifacts, 213–214clinical applications, 202clinical case, 215–216image acquisition, 202–205image in clinical decision making, 214incidental findings, 214–215ovaries
anatomy, 206–208, 207–208fpathology, 209–213
pitfalls, 213–214uterus
anatomy, 205, 205–206fpathology, 208–209
Pelvic view, 42–43Pelvis, 24, 25f, 31Penetrating trauma, 46–47Peri-appendiceal hyperemia, 399fPericardial effusion, 34–36, 37f, 63, 126, 438, 439f
algorithm for, 46fin apical view, 128f

Index 449
Retroplacental clear space, 247Retrovesicular exam. See Pelvic viewReverberation artifact, 14, 14f, 99, 287, 291,
367, 368Rh status, 231Rhegmatogenous mechanisms, 353Rheumatic mitral valve disease, 438fRhinosinusitis, 366Rhogam, 231Rib shadows, 30f, 76fRight heart collapse, 102Right heart strain, 102–103Right portal vein, 137Right upper quadrant (RUQ) ultrasound
artifacts and pitfallsshadowing, 151–152side lobe artifact, 151
bowel sonography in, 192fclinical applications, 133–134clinical case, 153–154image acquisition, 134–135image in clinical decision making, 152–153imaging modalities, correlation with, 153incidental findings, 153normal anatomy, 135–141
bile ducts, 138gallbladder, 138–140, 139fhepatic artery, 138hepatic veins, 135–137, 136f, 137fliver, 135, 135fMorison’s pouch, 140, 140fportal veins, 137–138, 137–138f
pathology, 141–151ascites, 150, 150fcholecystitis, 144–147, 146f, 147f, 148fcholelithiasis, 141jaundice, 147–150other pathology, 150
standard views of, 140–141Right ventricle
collapse of, 37fscalloping of, 102f
Right ventricular hypertrophy, 67, 67fchronic, subxiphoid view of, 103f
Right ventricular strain, 65–67Ring-down artifact, 14, 15f, 110, 112f, 118, 119fRing of fire, 223f, 226fRotator cuff evaluation, 311Ruptured abdominal aortic aneurysm,
156t, 169f
SSaber profile, 87Saccular aneurysm, 164, 164f, 165f
CT reconstruction of aorta, 165flarge, 165f
Sacral artery, 161fSacral vein, 161fSafety, machine maintenance and, 437–438Saline infusion model, 31Salivary glands
abscesses, 378acute infection of, 377
Salter Harris Type I fractures, 308, 340Sarcoma, 296Scalloped gestational sac, 227, 228fScalp hematoma, 391Scattering, 12Schwannoma, 297Sciatic nerve block, 330fSclera, 353Scrotal emergencies
artifacts and pitfalls, 278–279clinical applications, 271
epididymitis and orchitis, 272scrotal masses, 272scrotal trauma, 272testicular torsion, 271–272
clinical cases, 282clinical decision making, use of image in,
279–280
RRadial nerve block, 327fRadiocephalic fistula, 266Radiology, 414Rapid Ultrasound in Shock (RUSH), 47Reactive hydrocele, 276Real-time ultrasound, 1, 7, 109Reflection, 11Reflector
diffuse, 12specular, 11strong, 12
Refraction, 12, 278–279Regional anesthesia, 430–431Reimbursement, 418Relative jet frequency (RJF), 181Renal arteries, 160, 177, 178
transverse scan of aorta, 162–163fRenal artery, 161f, 178fRenal calculi, 180Renal cancer, 151fRenal capsule, 178fRenal cell carcinoma, 183Renal colic, 173, 181, 184Renal column of Bertin, 178fRenal cysts, 41
complex, 183, 183fon FAST exam, 50fsimple, 182, 182f
Renal dialysis access, 265–267, 267fevaluation of, 269thrombosis, 268
Renal masses, 182Renal parenchyma, 29f
injury, 42fRenal pelvis, 178fRenal pyramid, 178fRenal sinus, 177, 178fRenal ultrasound
artifacts, 181clinical applications, 172clinical case, 184image acquisition, 173, 173f, 174f, 177f
imaging technique, 174–176patient preparation, 173–174
image in clinical decision making, 181–182imaging modalities, correlation with, 182pathology, 178–181
hydronephrosis, 178–180, 178–180fnephrolithiasis, 180–181, 180f
pitfalls, 181renal masses, 182–184, 182–183f
Renal vein, 161f, 177, 178fResidency Review Committee for Emergency
Medicine, 7Resolution, 12
axial, 12, 12flateral, 12, 12f
Resuscitative ultrasound (RUS)in acute dyspnea, 101–105in airway management and crashing post
intubation patient, 105algorithm, 97f, 100basic exam, 97–100in cardiac arrest, 101clinical case, 105–106decision making with, 100–101question-based approach, 98fin undifferentiated hypotension, 101–105
Retained products of conception, 229, 230, 250, 250f, 438
Rete testis, 275fRetina, 352, 353Retinal detachment, 353–354, 357f, 363f
with posterior vitreous detachment, 352fRetinoblastoma, 361, 362fRetinoschisis, 361, 362fRetrobulbar hemorrhage, 360, 360fRetroflexion, 205, 207fRetromandibular vein, 373Retroperitoneal hemorrhage, 42, 42f
clinical case, 252clinical decision making, use of image in, 251image acquisition, 237–239incidental findings, 251–252normal ultrasound anatomy, 239–245pathology, 245–250pitfalls, 250–251
Pregnancy of unknown location (PUL), 233Prehospital ultrasound
existing literatureemergency medical services (EMS), 431–432military, 429–431multiple casualty incidents (MCI), 428–429
out-of-hospital setting, ultrasound program implementation in, 432–433
equipment and power supply management, 432–433
leadership and infrastructure, 432quality assurance, 433training, 433
Presets, 17Preterm rupture of membranes (PPROM), 245Privileging, 415, 416Privileging for Ultrasound Imaging, 6Probe sterilization, 437Procedural guidance
central line placement, 2, 4central venous access, 2, 7
Procedure assistanceabscess drainage, 410arthrocentesis, 332, 333–339fbladder volume determination, 200, 200fcentral venous access, 117–118endotracheal intubation, 126foreign body localization, 344fforeign body removal, 343–344fracture reduction, 340hernia reduction, 198–199, 199flumbar puncture, 345–347, 345–347fnerve blocks, 320–323, 324–331fpacemaker placement, 131paracentesis, 196–198, 197fpericardiocentesis, 127–129, 128fperipheral venous access, 121–122suprapubic aspiration, 199thoracentesis, 124
Proliferative phase, 205, 207fPropagation velocity, definition of, 10Proper hepatic artery, 138Prostate, 43, 43fProstatic hypertrophy, 199Proximal ascending aorta, 67, 265Proximal draining veins, 268Pseudoaneurysm, 267, 299Pseudogestational sac, 220, 220fPseudotumor cerebri, 359f, 361Pulmonary contusion, 429Pulmonary edema, 90, 438Pulmonary embolism, 47, 71, 100, 102–103Pulmonary embolus (PE), 81, 85, 91, 254Pulmonary fibrosis, 79, 103Pulsed repetition frequency (PRF), 274–275Pulseless electrical activity (PEA), 70, 101,
157, 431Pulsus paradoxus, 64Purulent infections, 342Pustalsis, 439fPyloric sphincter, 396, 396fPyloric stenosis, 401
image in clinical decision making, 402imaging modalities, correlation with, 402pitfalls, 402ultrasound findings of, 402, 403f
Pylorus, 396elongated and thickened, 402–403f
Pyocele, 277, 278fPyomyositis, 439, 439fPyosalpinx, 213
QQuality assurance, 2, 416–417, 433, 438

450 Index
image acquisition, 295imaging modalities, comparison with, 298–299pathology, 295–297, 298fpitfalls, 298ultrasound anatomy, 295
Solid organs, 12, 12finjury, 38–40, 47
Sonographic hole sign, 146, 148fSonographic meniscus, 103Sonographic Murphy’s sign, 144, 152Spatial pulse length (SPL), 11Special Operator Level Clinical Ultrasound
(SOLCUS), 433Spectral Doppler, 19, 19f, 274Specular reflectors, 11Spermatic cord, 273, 274f, 275fSpermatoceles, 281Spigelian hernias, 191Spine sign, 80, 80fSpleen, 196
anatomy, 28injuries, 27, 39, 39–40fparenchymal injury, sonographic patterns of, 39and stomach, 42f
Splenic artery, 161fSplenic parenchyma, 29fSplenic vein, 137, 137fSpontaneity, 256Spontaneous abortion, 227Standoff pads, 291, 304, 305fStaphylococcus aureus, 376, 377, 390Starling’s law, 88“Starry night,” 281, 285Static air bronchogram, 81Static assessment, 316–317Static imaging, 40Static technique, 197, 408Static ultrasound technique, 110Stein-Leventhal syndrome, 210Stensen’s duct, 373Sterile barrier, 321Sterile technique, 291Sterile ultrasound transducer, 109Sternum, 115fStomach
perisplenic view, 42spleen and, 42f
Stones, in proximal ureter, 180, 180fStraight linear transducers, 17, 17fStratosphere sign, 38, 38f, 78Stress fracture, acute/subacute, 309Stroke, diagnosis of, 432Strong reflectors, 12Subchorionic hemorrhage, 229, 229f, 246Subclavian vein, 112–113
anatomy of, 115fapproach, 408infraclavicular technique for, 113, 115, 115fsupraclavicular technique for, 115–116, 117f
Subcutaneous abscesses, 343on thigh, 341f
Subcutaneous emphysema, 40, 44Subcutaneous fat, 284, 285Subcutaneous structures, of arm, 285Subdiaphragmatic space
left, fluid image in, 33fright, fluid image in, 32fsonographic anatomy, 24fultrasound anatomy of, 23f
Submandibular gland, 373, 374fSubmandibular space infection, 369, 372, 373Subxiphoid approach, of heart, 127, 129fSubxyphoid view, 24
of chronic right ventricular hypertrophy, 103ffluid in pericardial space, 36forientation of heart, 30ftransducer position for FAST exam, 26f
Subxyphoid window, 59–60Superficial femoral vein, 258, 259fSuperior mesenteric artery (SMA), 160, 161f
transverse view of aorta, 162f
Simple renal cysts, 182, 182fSimple synovitis, 313, 314fSingle deepest pocket (SDP), 244Sinusogram, 367
complete, 367, 367f, 368partial, 367, 367f
Skeletal muscle, 306, 307fSkin and soft tissue
artifacts, 287–288clinical applications, 284clinical case, 300clinical decision making, 290image acquisition, 284imaging modalities, comparison with, 288–290normal ultrasound anatomy, 284–285pathology, 286–287pitfalls, 287–288soft tissue foreign body. See Soft tissue
foreign bodysoft tissue masses, evaluation of. See Soft tissue
masses, evaluation ofSkin disease, 439Sliding sign, 30f, 31Slipped capital femoral epiphysis, 390Sludge, 141, 143fSmall bowel, 196, 395–396, 395f, 396fSmall bowel obstructions (SBOs), 186, 190
pathology, 187–188vs. large bowel obstruction, 188
Snowstorm pattern, 246, 313, 315f, 367Society for Academic Emergency Medicine
(SAEM), 416Core Content for Emergency Medicine, 5–6policy statements, 5
Soft tissue and musculoskeletal proceduresabscess incision and drainage
clinical applications, 342–343image acquisition, 343pitfalls and complications, 343procedure, 343
arthrocentesisanatomy and procedure, 332clinical applications, 332image acquisition, 332pitfalls, 332
foreign body removalclinical applications, 343image acquisition, 343pitfalls and complications, 344–345procedure, 343–344
fracture reductionclinical applications, 340image acquisition, 340normal ultrasound anatomy, 340pitfalls and complications, 340, 342procedure, 340
lumbar punctureclinical applications, 345image acquisition, 345pitfalls and complications, 347procedure, 345–347
peripheral nerve blocksanatomy and landmarks, 320clinical applications, 319general approach to, 320–323image acquisition, 320pitfalls and complications, 332
Soft tissue disease, 439Soft tissue foreign body
artifacts, 292clinical applications, 290–291clinical decision making, 294–295image acquisition, 291imaging modalities, comparison with, 292–294pathology, 291–292pitfalls, 292ultrasound anatomy, 291
Soft tissue masses, evaluation ofartifacts, 298clinical applications, 295clinical decision making, 299
Scrotal emergencies (continued )image acquisition
Doppler, 274–275scanning protocol, 273, 274fultrasound technique, 272
imaging modalities, correlation with, 280–281incidental findings
microlithiasis, 281testicular mass, 281
normal ultrasound anatomy, 275pathology
epididymitis and orchitis, 275–276hematocele, 277hydrocele, 277infarction, 276ischemia, 276pyocele, 277scrotal hernia, 277–278testicular torsion, 276testicular trauma, 276–277
Scrotal hernia, 277–278Scrotal masses, 271, 272Scrotal trauma, 272Scrotum, 272, 275Seagull sign, 160Seashore sign, 37–38, 38f, 78, 79f, 99Sebaceous cyst, 375Second Lebanon War, multiple casualty
incidents in, 429Secretory phase, 205, 207fSector phased transducers, 17Sector probe transducer, 372Semi-sterile barrier, 321fSeminiferous tubules, 275fSeptic arthritis, 313, 315, 390Septulum of tunica albuginea, 275fSerial sonographic examinations, 22Seroma, 297Serous (anechoic) fluid, 354Severity factor, in pregnancy, 251Shadowing, 13, 151, 279Shaken baby syndrome, 353Shivering myocardium, 70Shock, 70
different categories of, 85tShort-axis technique, 110, 112f, 197Short cervix, 242–243Shortness of breath, 71, 91Shoulder
arthrocentesis of, 337fpresentation, 242f
Sialoadenitis, 377–379Side lobe artifact, 15, 15f, 68, 151Signs
barcode, 78, 79f, 99, 100fbat, 77beach, 100fcrescent, 358–359D-ring, 102fdouble decidual, 219f, 220FAST double line, 41guitar pick, 360, 361fintradecidual, 219lung pulse, 126lung sliding, 126McConnell’s, 102Mercedes Benz, 63fplayboy bunny, 135, 136fpower slide, 37seagull, 160seashore, 37–38, 38f, 78, 79f, 99sliding, 30f, 31sonographic hole, 146, 148fsonographic Murphy’s, 144, 152spine, 80, 80fstratosphere, 38, 38f, 78to-and-fro, 267whirlpool, 403wine bottle, 103yin–yang, 297, 297f
Simple cysts, 209, 210f, 214

Index 451
Transvenous pacemaker placement and captureclinical indications, 130image acquisition and anatomy, 130, 130fpitfalls and complications, 131procedure, 131use in decision making, 131
Transverse orientation, 16Trauma ultrasound, 21–22
artifacts/pitfalls, 40–44examination quality, 40–41fluid, types of, 40pelvic view, 42–43pericardial view, 43–44perihepatic view, 41–42perisplenic view, 42thoracic views, 44
clinical applications, 22clinical cases, 50–51diagnostic modalities, comparison of, 48–50image acquisition, 22–28
basic exam, 22–23equipment, 22order, 27–28paracolic gutters, 25pelvis, 24pericardial, 24–25perihepatic view, 23perisplenic view, 23–24thoracic, 25–27timing and speed, 22
incidental findings, 50abnormal organ size/chambers, 50cysts, 50masses, 50
in medical decision makingblunt trauma, 45–46critical care, 47–48multiple patients, 48obstetric patients, 48pediatric patients, 48pelvic fracture, 48penetrating trauma, 46–47thoracic trauma, 47
normal ultrasound anatomybladder, 29bowel, 28–29gallbladder, 28kidneys, 29liver, 28peritoneal space, 28spleen, 28thorax, 29–31uterus, 29
pathologyfree peritoneal fluid, 31–34pericardial effusion, 34–36pleural abnormalities, 36–38solid organ injury, 38–40
Traumatic arteriovenous fistula, 267–268Traumatic lens subluxation, 352Tsunami sinusitis, 429Tubal ring, extrauterine gestational sac, 224, 224fTuberculosis pericardial effusion, 439Tubo-ovarian abscess (TOA), 212–213, 213fTunica albuginea, 275, 275fTunica vaginalis, 275fTwin ectopic pregnancy of advanced
gestation, 224fTwo-dimensional (2-D) echocardiography, 126Two-dimensional ultrasound imaging, 15–16, 15f, 16f
UUltrasonography, maxillary sinusitis, 369Ultrasound-guided incision, 343, 343f, 386fUltrasound-guided needle localization, 344Undifferentiated hypotension, 84–85
patient protocol, 71resuscitative ultrasound in, 101–105
aorta, assessment of, 105detecting venous thromboembolism, 105FAST exam, 104
Thyroid nodule, 297, 298f, 299Thyroiditis, suppurative, 375, 380Time gain compensation (TGC), 18, 19fTiming factor, in pregnancy, 251Tissue, interaction of ultrasound with, 12–13Tissue harmonics, 19To-and-fro sign pattern, 267Tonsil, B-mode image of, 371fTonsillitis, 369, 381Tortuous aorta, 166, 168fTrachea, transducer position in, 125fTractional mechanisms, 353Training
course model, 437guidelines, 416ultrasound, 433
Transabdominal imageof lower uterine segment, 248fof normal pregnancy, 237
Transabdominal sonography (TAS), 202–203, 203f, 241
anteflexion, 206fchocolate cyst, 212fcomplex ovarian cysts, 210fdermoid cysts, 211fGartner’s cyst, 215fhydrometrocolpus, 214fretroflexion, 207fsagittal view, 204ftransverse view, 204f
Transabdominal ultrasound, heterotopic pregnancy, 226f
Transcranial Pulsed Wave Doppler, 432Transcutaneous approach, 370, 370fTransducers, 10, 16–17
array, 17curvilinear array, 17, 17fendocavitary, 115, 116fphased array, 17, 18fpreparation of, 113–114fsector phased, 17selection, 345straight linear, 17, 17f
Transient synovitis, 390Translabial scanning, 248Translabial ultrasound, 242Transmission, increased through, 13Transperineal approach, 250Transperineal scanning, 248Transperineal (translabial) imaging, of normal
pregnancy, 238–239Transvaginal sonography (TVS), 202–203, 205f
bicornuate uterus, 214fof chocolate cyst, 211f, 212fcomplex adnexal mass, 225fcomplex ovarian cysts, 210f, 216fof coronal orientation, 206fdermoid cysts, 211fearly fetal pole, 221fectopic pregnancy, 223–226fendometrial echo complex, 207ffree fluid in cul-de-sac, 227fgestational sac, 220fhydrosalpinx, 213fintrauterine device (IUD), 209fof intrauterine pregnancy (IP), 220–221fof left ovary, 207f, 208fleiomyomas (fibroids), 208–209fnabothian cysts, 215fof normal pregnancy, 237–238ovarian hyperstimulation syndrome (OHS), 212fpitfalls, 251polycystic ovarian syndrome (PCOS), 212fproliferative endometrium, 207fright adnexal mass, coronal view of, 225fright ovary, 208fsagittal orientation, 205fsecretory endometrium, 207fsimple ovarian cysts, 210ftubo-ovarian abscess (TOA), 213fvaginal and cervical findings, 215
Supra-umbilical region, bowel sonography in, 193fSupraclavicular technique, for subclavian vein,
115–116, 117fSuprapubic bladder aspiration (SBA)
clinical indications, 409image acquisition and procedure, 409, 410fnormal ultrasound anatomy and landmarks, 409,
409f, 410fpitfalls and complications, 410
Suprarenal artery, 161fSuprarenal vein, 161fSuprasternal notch, 62, 63fSwelling, 266, 286
scrotal, 277Syneresis, 361
posterior vitreous detachment with, 356f
TTamoxifen, 208Tamponade, 64, 101, 102Tendinitis, 312Tendon, 291, 305–306, 306f
MRI for, 316rotator cuff evaluation, 311tear, partial/complete, 309–310tendinitis, 312tenosynovitis, 312
Tenosynovitis, 312Tension pneumothorax, 85, 91, 101, 430Testicle
artery, 275fracture, 277hematoma, 272mass, 281torsion, 271–272, 276trauma, 276–277
Testicular artery, 275fThoracentesis
anatomy and landmarks, 124clinical indications, 123image acquisition, 123pitfalls and complications, 125procedure
dynamic (real-time) ultrasound guidance, 124lateral decubitus position, 124, 124fpatient sitting upright, 124, 124fsupine position, 124, 125f
use in decision making, 125Thoracic aorta, 67
root, 67, 68fsuprasternal view, 265
Thoracic exam, 99interstitial fluid, detection of, 104pneumothorax, detection of, 103–104
Thoracic trauma, 47Thoracic ultrasound
artifacts and pitfalls, 81clinical applications, 75–76clinical case, 82clinical decision making, use of image in, 81comparison with other diagnostic modalities,
81–82image acquisition, 76–77
interstitial fluid/lung consolidation, 77, 77fpleural effusion, 77–78, 77fpneumothorax, 76
normal anatomy, 77–78pathology
interstitial fluid, 79–80lung consolidation, 80–81pleural effusion, 80, 80fpneumothorax, 78–79
Thoracic view, 25–27artifacts/pitfalls, 44
Thorax anatomy, 29–31Thrombosis pulmonary, 101Thrombus, acute abdominal aortic aneurysm,
164, 164fThyroglossal duct cyst (TDC), 297, 376, 377, 378fThyroid gland, visualization of, 125fThyroid mass, 376

452 Index
Volume responsive patient, 88Volume resuscitation, 85Volvulus
image in clinical decision making, 403
imaging modalities, correlation with, 405
pitfalls, 403ultrasound findings in, 403
WWall-Echo-Shadow (WES),
141, 143fWater bath immersion, 304, 305fWater-bath technique, 291Wavelength, definition of, 10Wells explicit assessment, 261tWharton duct, 374, 378Whirlpool sign, 403Wilm’s tumor, 182Wine bottle sign, 103Wood foreign bodies, 292fWorld Federation of Ultrasound
in Medicine and Biology, 440World Health Organization
(WHO), 437World Interactive Network Focused on Critical
Ultrasound (WINFOCUS), 440
XX-rays, 294
head and neck infection, 380maxillary sinusitis, 368–369
YYing-yang pattern, 267, 268fYin–yang sign, 297, 297fYolk sac, 220, 220–221f
Varicocele, 277Vas deferens, 275fVasa previa, 247Vein contour, buckling of, 118, 119fVeins
axillary vein, 115, 115f, 116fbasilic vein, 120f, 121, 122f, 123fbrachial vein, 120f, 122ffemoral vein, 116–117, 117f, 118finternal jugular vein, 109f, 110f,
112, 114fsubclavian vein, 112–116
“Veins on a leaf,” 285Venipuncture, 118f, 408Venous access
central, 108–120femoral vein, 116–117internal jugular vein, 112peripheral, 120–123subclavian vein, 112–116technique
dynamic, real-time technique, 110, 124in-plane technique, 110, 111f, 112one-operator, 117, 122, 122fout-of-plane technique, 110, 112fstatic technique, 110, 111ftwo operator, 117, 122
Venous exam, 256–257, 256fVenous ultrasound, 261–262Ventral hernias, 191, 199fVentricular fibrillation, 70, 101Version, 205Vertex presentation, 242fViral hepatitis, 147–148Visceral pleural, 77Vision loss, 353, 354Vitreous hemorrhage, 352–353,
355f, 356f, 391
Undifferentiated hypotension (continued )heart, assessment of, 101–103IVC, assessment of, 103thoracic exam, 103–104
Undifferentiated shock, 97f, 100Unicornuate uteri, 214–215Unilateral hydronephrosis, 180, 181Upper extremity anesthesia, brachial plexus
interscalene approach to, 324fUpper gastrointestinal (UGI) examination, 402Ureteral jet
assessment of, 172bladder with, 180–181, 180f
Ureteropelvic junction (UPJ) obstruction, 180Urinary bladder, 199–200
rounded wall of, 196fUrinary catheter obstruction, 181Urinary retention, 181Urosepsis, 99Uterine perforation, 249, 250f, 252fUterine rupture, 249–250Uterus, 251
anatomy, 29, 205, 205–206fanomalies, 214–215bicornuate, 214, 214fdidelphic, 214echogenic material in, 227, 229pathology, 208–209
endometrial cancer, 208intrauterine devices, 208–209leiomyomas (fibroids), 208, 208–209f
septated, 214unicornuate, 214–215
VVaginal bleeding
interstitial pregnancy with, 226fand pelvic pain, in first trimester pregnancy, 230f