Ultrasound velocity and attenuation of porcine soft tissues with respect to structure and...
8
Ultrasound velocity and attenuation of porcine soft tissues with respect to structure and composition: II. Skin and backfat Tim Koch a,1 , Sannachi Lakshmanan b,1 , Sebastian Brand c , Michael Wicke a , Kay Raum b,d , Daniel Mörlein a, ⁎ a Department of Animal Sciences, University of Goettingen, Germany b Julius Wolff Institute and Berlin-Brandenburg School for Regenerative Therapies, Charité-Universitätsmedizin, Berlin, Germany c Fraunhofer Institute of Material Mechanics, Halle, Germany d Department of Orthopedics, Martin Luther University of Halle-Wittenberg, Halle, Germany abstract article info Article history: Received 11 December 2009 Received in revised form 15 November 2010 Accepted 2 December 2010 Available online 9 December 2010 Keywords: Ultrasound Attenuation Sound velocity Longissimus Pig Backfat Skin Fatty acid composition Ultrasound is regarded as a promising method to determine the intramuscular fat content of pork loin. At intact carcasses, the signal passes the backfat whose ultrasound parameters (sound velocity and attenuation) have not been fully investigated. This study intended to collect a dataset of ultrasound parameters for individual backfat layers and to elucidate relationships with structural and compositional characteristics. In-vitro measurements at 10 MHz were conducted on backfat samples of pork carcasses representative for German populations. The average sound velocity ranged from 1436 ± 9 to 1470 ± 37 ms −1 for the fat layers, and 1682 ± 23 ms −1 for skin. Velocity of the compound backfat decreased with overall thickness. Attenuation was not affected by thickness ranging between 1.6 ± 0.7 and 2.7 ± 1.5 dB MHz −1 cm −1 for all layers. Sound velocity was negatively correlated with fat content and dry matter. The obtained results are anticipated to improve signal correction prior to spectral analysis of ultrasound measurements at intact carcasses. © 2010 The American Meat Science Association. Published by Elsevier Ltd. All rights reserved. 1. Introduction The intramuscular fat content (IMF) is widely regarded as an important parameter influencing the sensory characteristics of pork loin (Fernandez, Monin, Talmant, Mourot, & Lebret, 1999). Therefore, many investigations targeted at non-invasive estimation of the fat content inside the muscle at intact pig carcasses. Several of these methods, including the use of ultrasound and spectral analysis, have been described in more detail in part I of this study (Koch et al., 2011). Although a previous study reported an average prediction error of 0.36% IMF using spectral analysis of unprocessed backscatter signals (Mörlein, Rosner, Brand, Jenderka, & Wicke, 2005), this is not yet satisfying for use in an industrial slaughterhouse. Our current work is focused on the improvement of the precision of ultrasound based estimations of IMF. Towards this goal, precise estimations and corrections for variations of sound velocity and attenuation for all involved tissues on the sound propagation path between the ultrasound transducer and the evaluated muscle tissue are necessary. Ultrasound velocity and/or attenuation of porcine fat and skin have been reported earlier (Chivers & Parry, 1978; Greenleaf, 1986). However, none of the investigations provided a dataset applicable for in-vivo conditions (45 min p.m.), e.g. with respect to temperature that is known to largely affect the results (Ninoles, Clemente, Ventanas, & Benedito, 2007) and that takes the compositional variation into account. Backfat structure and composition that also impacts on its mechanical and chemical quality (e.g. solidity and oxidative stability), were reported to be remarkably affected by sex, breed type and diet (Brooks, 1971; Daza, Ruiz-Carrascal, Olivares, Menoyo, & López-Bote, 2007; Wood et al., 2004, 2008). In addition to inter-individual variations, the fatty acid profile, i.e. the amount of saturated and unsaturated fatty acids, also varies within animals between the outer (subcutaneous), intermediate, and inner (muscle side) porcine backfat layers (Daza et al., 2007). Moisture and fat content have been stated to differ between individual layers and with respect to backfat thickness (Moody & Zobrisky, 1966). In this study, acoustic attenuation and sound velocity reference data of porcine backfat including skin were collected in-vitro in a set of pig carcasses resembling a variation of carcass properties typically found in German slaughter facilities. Variations of the acoustic properties were analysed with respect to structural and compositional variations. Temperature and direction of the incident sound waves were adjusted to close-to in-vivo conditions. To avoid any influence of Meat Science 88 (2011) 67–74 ⁎ Corresponding author. Tel.: +49 551 395611; fax: +49 551 395587. E-mail address: [email protected] (D. Mörlein). 1 Both authors equally contributed to the study. 0309-1740/$ – see front matter © 2010 The American Meat Science Association. Published by Elsevier Ltd. All rights reserved. doi:10.1016/j.meatsci.2010.12.004 Contents lists available at ScienceDirect Meat Science journal homepage: www.elsevier.com/locate/meatsci
-
Upload
charite-de -
Category
Documents
-
view
0 -
download
0
Transcript of Ultrasound velocity and attenuation of porcine soft tissues with respect to structure and...

Meat Science 88 (2011) 67–74
Contents lists available at ScienceDirect
Meat Science
j ourna l homepage: www.e lsev ie r.com/ locate /meatsc i
Ultrasound velocity and attenuation of porcine soft tissues with respect to structureand composition: II. Skin and backfat
Tim Koch a,1, Sannachi Lakshmanan b,1, Sebastian Brand c, Michael Wicke a, Kay Raum b,d, Daniel Mörlein a,⁎a Department of Animal Sciences, University of Goettingen, Germanyb Julius Wolff Institute and Berlin-Brandenburg School for Regenerative Therapies, Charité-Universitätsmedizin, Berlin, Germanyc Fraunhofer Institute of Material Mechanics, Halle, Germanyd Department of Orthopedics, Martin Luther University of Halle-Wittenberg, Halle, Germany
⁎ Corresponding author. Tel.: +49 551 395611; fax: +E-mail address: [email protected]
1 Both authors equally contributed to the study.
0309-1740/$ – see front matter © 2010 The Americandoi:10.1016/j.meatsci.2010.12.004
a b s t r a c t
a r t i c l e i n f oArticle history:Received 11 December 2009Received in revised form 15 November 2010Accepted 2 December 2010Available online 9 December 2010
Keywords:UltrasoundAttenuationSound velocityLongissimusPigBackfatSkinFatty acid composition
Ultrasound is regarded as a promising method to determine the intramuscular fat content of pork loin. At intactcarcasses, the signal passes the backfat whose ultrasound parameters (sound velocity and attenuation) have notbeen fully investigated. This study intended to collect a dataset of ultrasound parameters for individual backfatlayers and to elucidate relationships with structural and compositional characteristics. In-vitromeasurements at10 MHz were conducted on backfat samples of pork carcasses representative for German populations. Theaverage sound velocity ranged from 1436±9 to 1470±37ms−1 for the fat layers, and 1682±23 ms−1 for skin.Velocity of the compound backfat decreased with overall thickness. Attenuation was not affected by thicknessranging between 1.6±0.7 and 2.7±1.5 dB MHz−1 cm−1 for all layers. Sound velocity was negatively correlatedwith fat content anddrymatter. The obtained results are anticipated to improve signal correction prior to spectralanalysis of ultrasound measurements at intact carcasses.
© 2010 The American Meat Science Association. Published by Elsevier Ltd. All rights reserved.
1. Introduction
The intramuscular fat content (IMF) is widely regarded as animportant parameter influencing the sensory characteristics of porkloin (Fernandez, Monin, Talmant, Mourot, & Lebret, 1999). Therefore,many investigations targeted at non-invasive estimation of the fatcontent inside the muscle at intact pig carcasses. Several of thesemethods, including the use of ultrasound and spectral analysis, havebeen described in more detail in part I of this study (Koch et al., 2011).Although a previous study reported an average prediction error of0.36% IMF using spectral analysis of unprocessed backscatter signals(Mörlein, Rosner, Brand, Jenderka, & Wicke, 2005), this is not yetsatisfying for use in an industrial slaughterhouse.
Our current work is focused on the improvement of the precisionof ultrasound based estimations of IMF. Towards this goal, preciseestimations and corrections for variations of sound velocity andattenuation for all involved tissues on the sound propagation pathbetween the ultrasound transducer and the evaluated muscle tissueare necessary.
49 551 395587..de (D. Mörlein).
Meat Science Association. Published
Ultrasound velocity and/or attenuation of porcine fat and skinhave been reported earlier (Chivers & Parry, 1978; Greenleaf, 1986).However, none of the investigations provided a dataset applicable forin-vivo conditions (45 min p.m.), e.g. with respect to temperature thatis known to largely affect the results (Ninoles, Clemente, Ventanas, &Benedito, 2007) and that takes the compositional variation intoaccount.
Backfat structure and composition that also impacts on itsmechanical and chemical quality (e.g. solidity and oxidative stability),were reported to be remarkably affected by sex, breed type and diet(Brooks, 1971; Daza, Ruiz-Carrascal, Olivares, Menoyo, & López-Bote,2007;Woodet al., 2004, 2008). Inaddition to inter-individual variations,the fatty acid profile, i.e. the amount of saturated and unsaturated fattyacids, also varies within animals between the outer (subcutaneous),intermediate, and inner (muscle side) porcinebackfat layers (Dazaet al.,2007). Moisture and fat content have been stated to differ betweenindividual layers and with respect to backfat thickness (Moody &Zobrisky, 1966).
In this study, acoustic attenuation and sound velocity referencedata of porcine backfat including skinwere collected in-vitro in a set ofpig carcasses resembling a variation of carcass properties typicallyfound in German slaughter facilities. Variations of the acousticproperties were analysedwith respect to structural and compositionalvariations. Temperature and direction of the incident sound waveswere adjusted to close-to in-vivo conditions. To avoid any influence of
by Elsevier Ltd. All rights reserved.
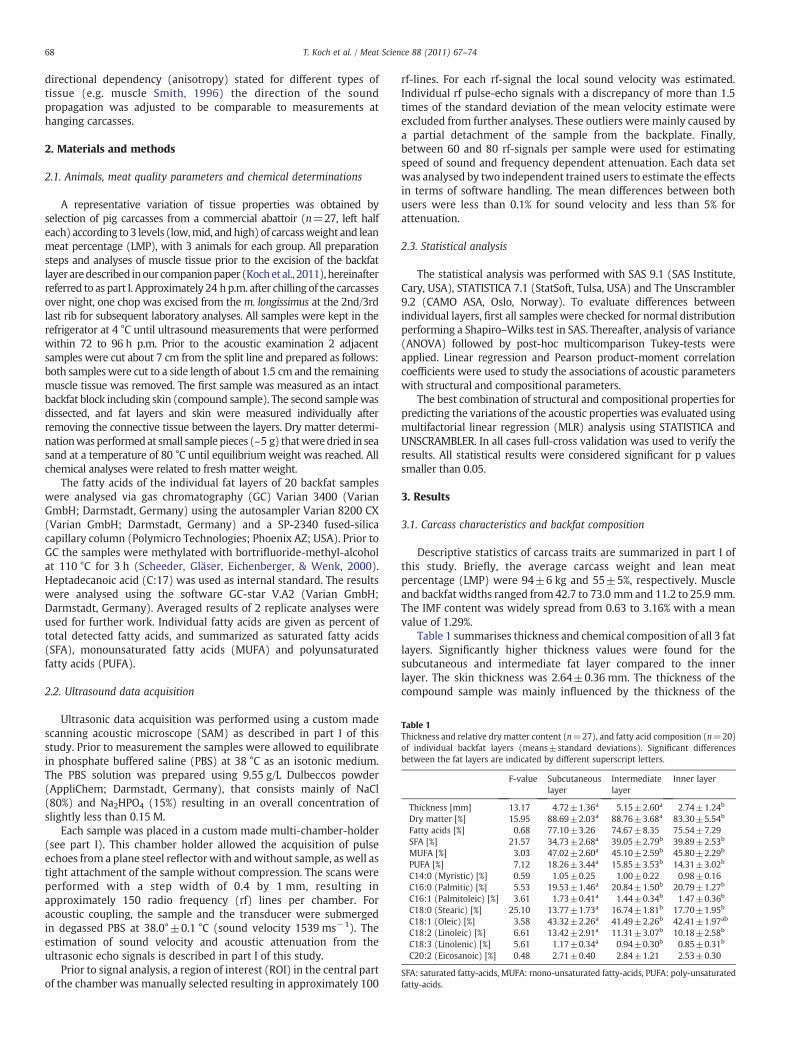
Table 1Thickness and relative dry matter content (n=27), and fatty acid composition (n=20)of individual backfat layers (means±standard deviations). Significant differencesbetween the fat layers are indicated by different superscript letters.
F-value Subcutaneouslayer
Intermediatelayer
Inner layer
Thickness [mm] 13.17 4.72±1.36a 5.15±2.60a 2.74±1.24b
Dry matter [%] 15.95 88.69±2.03a 88.76±3.68a 83.30±5.54b
Fatty acids [%] 0.68 77.10±3.26 74.67±8.35 75.54±7.29SFA [%] 21.57 34.73±2.68a 39.05±2.79b 39.89±2.53b
MUFA [%] 3.03 47.02±2.60a 45.10±2.59b 45.80±2.29b
PUFA [%] 7.12 18.26±3.44a 15.85±3.53b 14.31±3.02b
C14:0 (Myristic) [%] 0.59 1.05±0.25 1.00±0.22 0.98±0.16C16:0 (Palmitic) [%] 5.53 19.53±1.46a 20.84±1.50b 20.79±1.27b
C16:1 (Palmitoleic) [%] 3.61 1.73±0.41a 1.44±0.34b 1.47±0.36b
C18:0 (Stearic) [%] 25.10 13.77±1.73a 16.74±1.81b 17.70±1.95b
C18:1 (Oleic) [%] 3.58 43.32±2.26a 41.49±2.26b 42.41±1.97ab
C18:2 (Linoleic) [%] 6.61 13.42±2.91a 11.31±3.07b 10.18±2.58b
C18:3 (Linolenic) [%] 5.61 1.17±0.34a 0.94±0.30b 0.85±0.31b
C20:2 (Eicosanoic) [%] 0.48 2.71±0.40 2.84±1.21 2.53±0.30
SFA: saturated fatty-acids, MUFA: mono-unsaturated fatty-acids, PUFA: poly-unsaturatedfatty-acids.
68 T. Koch et al. / Meat Science 88 (2011) 67–74
directional dependency (anisotropy) stated for different types oftissue (e.g. muscle Smith, 1996) the direction of the soundpropagation was adjusted to be comparable to measurements athanging carcasses.
2. Materials and methods
2.1. Animals, meat quality parameters and chemical determinations
A representative variation of tissue properties was obtained byselection of pig carcasses from a commercial abattoir (n=27, left halfeach) according to 3 levels (low,mid, andhigh) of carcassweight and leanmeat percentage (LMP), with 3 animals for each group. All preparationsteps and analyses of muscle tissue prior to the excision of the backfatlayer aredescribed inour companionpaper (Kochet al., 2011), hereinafterreferred to as part I. Approximately 24 hp.m. after chilling of the carcassesover night, one chop was excised from the m. longissimus at the 2nd/3rdlast rib for subsequent laboratory analyses. All samples were kept in therefrigerator at 4 °C until ultrasound measurements that were performedwithin 72 to 96 h p.m. Prior to the acoustic examination 2 adjacentsamples were cut about 7 cm from the split line and prepared as follows:both sampleswere cut to a side length of about 1.5 cm and the remainingmuscle tissue was removed. The first sample was measured as an intactbackfat block including skin (compound sample). The second samplewasdissected, and fat layers and skin were measured individually afterremoving the connective tissue between the layers. Dry matter determi-nationwas performedat small sample pieces (~5 g) thatweredried in seasand at a temperature of 80 °C until equilibrium weight was reached. Allchemical analyses were related to fresh matter weight.
The fatty acids of the individual fat layers of 20 backfat sampleswere analysed via gas chromatography (GC) Varian 3400 (VarianGmbH; Darmstadt, Germany) using the autosampler Varian 8200 CX(Varian GmbH; Darmstadt, Germany) and a SP-2340 fused-silicacapillary column (Polymicro Technologies; Phoenix AZ; USA). Prior toGC the samples were methylated with bortrifluoride-methyl-alcoholat 110 °C for 3 h (Scheeder, Gläser, Eichenberger, & Wenk, 2000).Heptadecanoic acid (C:17) was used as internal standard. The resultswere analysed using the software GC-star V.A2 (Varian GmbH;Darmstadt, Germany). Averaged results of 2 replicate analyses wereused for further work. Individual fatty acids are given as percent oftotal detected fatty acids, and summarized as saturated fatty acids(SFA), monounsaturated fatty acids (MUFA) and polyunsaturatedfatty acids (PUFA).
2.2. Ultrasound data acquisition
Ultrasonic data acquisition was performed using a custom madescanning acoustic microscope (SAM) as described in part I of thisstudy. Prior to measurement the samples were allowed to equilibratein phosphate buffered saline (PBS) at 38 °C as an isotonic medium.The PBS solution was prepared using 9.55 g/L Dulbeccos powder(AppliChem; Darmstadt, Germany), that consists mainly of NaCl(80%) and Na2HPO4 (15%) resulting in an overall concentration ofslightly less than 0.15 M.
Each sample was placed in a custom made multi-chamber-holder(see part I). This chamber holder allowed the acquisition of pulseechoes from a plane steel reflector with andwithout sample, as well astight attachment of the sample without compression. The scans wereperformed with a step width of 0.4 by 1 mm, resulting inapproximately 150 radio frequency (rf) lines per chamber. Foracoustic coupling, the sample and the transducer were submergedin degassed PBS at 38.0°±0.1 °C (sound velocity 1539 ms−1). Theestimation of sound velocity and acoustic attenuation from theultrasonic echo signals is described in part I of this study.
Prior to signal analysis, a region of interest (ROI) in the central partof the chamber was manually selected resulting in approximately 100
rf-lines. For each rf-signal the local sound velocity was estimated.Individual rf pulse-echo signals with a discrepancy of more than 1.5times of the standard deviation of the mean velocity estimate wereexcluded from further analyses. These outliers were mainly caused bya partial detachment of the sample from the backplate. Finally,between 60 and 80 rf-signals per sample were used for estimatingspeed of sound and frequency dependent attenuation. Each data setwas analysed by two independent trained users to estimate the effectsin terms of software handling. The mean differences between bothusers were less than 0.1% for sound velocity and less than 5% forattenuation.
2.3. Statistical analysis
The statistical analysis was performed with SAS 9.1 (SAS Institute,Cary, USA), STATISTICA 7.1 (StatSoft, Tulsa, USA) and The Unscrambler9.2 (CAMO ASA, Oslo, Norway). To evaluate differences betweenindividual layers, first all samples were checked for normal distributionperforming a Shapiro–Wilks test in SAS. Thereafter, analysis of variance(ANOVA) followed by post-hoc multicomparison Tukey-tests wereapplied. Linear regression and Pearson product-moment correlationcoefficients were used to study the associations of acoustic parameterswith structural and compositional parameters.
The best combination of structural and compositional properties forpredicting the variations of the acoustic properties was evaluated usingmultifactorial linear regression (MLR) analysis using STATISTICA andUNSCRAMBLER. In all cases full-cross validation was used to verify theresults. All statistical results were considered significant for p valuessmaller than 0.05.
3. Results
3.1. Carcass characteristics and backfat composition
Descriptive statistics of carcass traits are summarized in part I ofthis study. Briefly, the average carcass weight and lean meatpercentage (LMP) were 94±6 kg and 55±5%, respectively. Muscleand backfat widths ranged from 42.7 to 73.0 mm and 11.2 to 25.9 mm.The IMF content was widely spread from 0.63 to 3.16% with a meanvalue of 1.29%.
Table 1 summarises thickness and chemical composition of all 3 fatlayers. Significantly higher thickness values were found for thesubcutaneous and intermediate fat layer compared to the innerlayer. The skin thickness was 2.64±0.36 mm. The thickness of thecompound sample was mainly influenced by the thickness of the

Fig. 1. Variation of sound velocity of backfat samples determined by 10-MHzultrasound. a,b,c,d,e: different letters indicate significant differences between layers(F=612.47) Compound=all backfat layers and skin (n=26); skin (n=21);subcutaneous fat layer (n=27); intermediate fat layer (n=23); inner fat layer(n=17). The marked outliers contain extreme amounts of fatty acids and dry matter.
69T. Koch et al. / Meat Science 88 (2011) 67–74
subcutaneous and intermediate layers. Predicting the compoundthickness via MLR resulted in an R2 value of 0.89 and a RMSE of1.36 mm using only the thickness of those two layers (not shown). Incontrast to this, variations of skin and inner layer thicknesses were notassociated with variations of the compound thickness. Dry matterpercentage was lower in the inner layer than in the other layers. Nodifferences were observed for the total amounts of fatty acids. Thesubcutaneous fat layer exhibited a lower relative amount of SFA andhigher amounts of MUFA and PUFA than the other layers.
Correlations between carcass traits and the chemical composition ofall 3 fat layers are summarized in Table 2. An increase in backfat widthwas accompanied by a significant increase of fatty acids (up to r=0.85)and drymatter (up to r=0.72) in all fat layers with highest correlationsfor the intermediate fat layer. Negative relationships were observedbetween the lean meat percentage and the total amount of fatty acids(up to r=−0.73) and dry matter (up to r=−0.66) for individuallayers. The IMFwasmoderately correlatedwith the total amount of fattyacids of the inner backfat layer (r=0.59). A negative relation betweenthe IMF and the amount of PUFA was observed in the subcutaneous fatlayer (r=−0.49).
3.2. Ultrasound parameters
Ultrasound velocity and attenuation values (median, upper andlower quartile) for the compound sample (all three layers and skin),skin and the 3 individual fat layers are given in Figs. 1 and 2. ANOVArevealed significant differences of the sound velocity between allevaluated groups (F=612). The velocity in skin (1682±23 ms−1)was considerably higher than in the individual fat layers. In fact, thevelocity increased from the subcutaneous to the inner fat layer. Thevelocity values of the compound samples were between the valuesobserved for fat and skin.
The differences of attenuation between the groups were lesspronounced compared to those of the sound velocity (F=8.1). Slightlyreduced values were observed in the subcutaneous and intermediatelayers compared the inner fat layer, skin, and the compound samples. Itshould be noted that variations within the groups were also muchhigher than those found for the sound velocity.
Table 2Pearson product moment correlations between carcass characteristics and chemicalcomposition of the individual backfat layers.
Weight LMP BW MW IMF Thickness
Subcutaneous fat layer (n=20)Fatty acids 0.21 −0.62⁎⁎ 0.62⁎⁎ −0.19 0.42 0.57⁎⁎
Dry matter 0.23 −0.40⁎ 0.43⁎ 0.02 0.21 0.31SFA 0.07 −0.39 0.34 −0.01 0.34 0.18MUFA 0.10 −0.12 0.14 −0.08 0.30 0.15PUFA −0.13 0.39 −0.36 0.07 −0.49⁎ −0.25
Intermediate fat layer (n=20)Fatty acids 0.37 −0.72⁎⁎⁎ 0.85⁎⁎⁎ −0.08 0.34 0.81⁎⁎⁎
Dry matter 0.36 −0.66⁎⁎⁎ 0.72⁎⁎⁎ −0.11 0.22 0.82⁎⁎⁎
SFA 0.15 −0.37 0.37 0.03 0.24 0.37MUFA −0.07 −0.12 0.11 −0.12 0.17 0.04PUFA −0.07 0.37 −0.37 0.07 −0.32 −0.33
Inner fat layer (n=20)Fatty acids 0.37 −0.73⁎⁎⁎ 0.73⁎⁎⁎ −0.28 0.59⁎⁎ 0.70⁎⁎⁎
Dry matter 0.43⁎ −0.39 0.45⁎ 0.19 0.16 0.47⁎
SFA 0.21 −0.46⁎ 0.48⁎ 0.03 0.14 0.48⁎
MUFA −0.12 −0.09 0.01 −0.20 0.24 −0.08PUFA −0.08 0.45⁎ −0.42 0.13 −0.31 −0.34
SFA: saturated fatty-acids, MUFA: mono-unsaturated fatty-acids, PUFA: poly-unsaturatedfatty-acids; weight: hot carcass weight, LMP: lean meat percentage, BW: backfat width,MW: muscle width, IMF: intramuscular fat, thickness: thickness of the individual layersdetermined with image analysis.
⁎⁎ pb0.01.⁎ pb0.05.
⁎⁎⁎ pb0.001.
3.3. Relationships of ultrasound parameters with carcass and backfatcharacteristics
Relationships between carcass traits and ultrasound parameters arepresented inTable3. A strongdecrease in soundvelocity of the compoundsample was found with increasing backfat width (r=−0.80). Theanalysis within the individual layers revealed that the negativeassociation of sound velocity and layer thickness only occurred in theintermediate and inner fat layers. In the intermediate layer, the thicknesswas also inversely related to the acoustic attenuation.
Table 4 summarises the relationships between ultrasound para-meters and chemical composition of the fat layers. The sound velocitydecreasedwith increasing amount of fatty acids (up to r=−0.53) anddry matter (up to r=−0.65). These moderate effects within theindividual layers were confirmed after pooling the data for all groups.Moreover, sound velocity exhibited moderate correlations with theamount of SFA (r=0.29). Using MLR to predict sound velocity of theindividual fat layers (Eqs. (1) and (2)) revealed that DMwas the mostimportant compositional parameter for both, the subcutaneous(R2=0.08; RMSE: 9.08 ms−1) and the intermediate fat layer (R2=0.30;RMSE:18.38 ms−1). Comparable resultswere found for thepooleddataofall backfat layers (Eq. (3)) with DM again being the only includedcompositional parameter (R2=0.09; RMSE: 23.09 ms−1). Correlations
Fig. 2. Variation of attenuation of backfat samples determined by 10-MHz ultrasound. a,b:different letters indicate significantdifferencesbetween layers (F=8.09). Compound=allbackfat layers and skin (n=26); skin (n=21); subcutaneous fat layer (n=27);intermediate fat layer (n=23); inner fat layer (n=17). The outliers exhibit extremeamounts of fatty acids and dry matter.
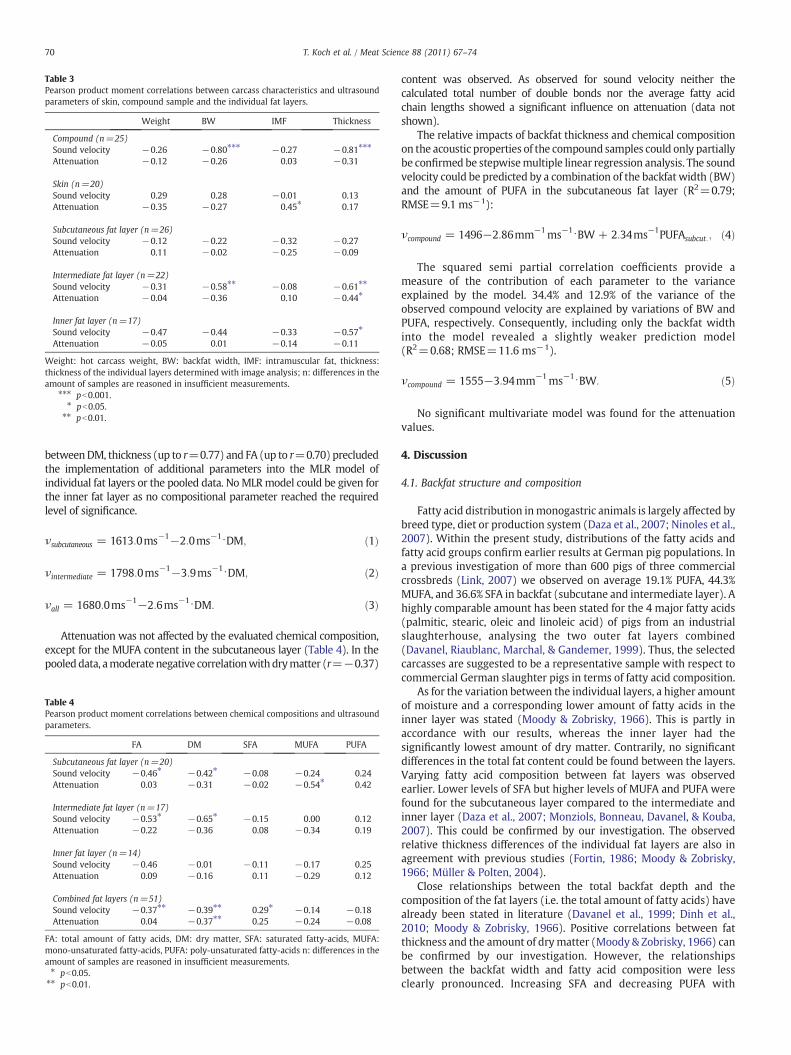
Table 3Pearson product moment correlations between carcass characteristics and ultrasoundparameters of skin, compound sample and the individual fat layers.
Weight BW IMF Thickness
Compound (n=25)Sound velocity −0.26 −0.80⁎⁎⁎ −0.27 −0.81⁎⁎⁎
Attenuation −0.12 −0.26 0.03 −0.31
Skin (n=20)Sound velocity 0.29 0.28 −0.01 0.13Attenuation −0.35 −0.27 0.45⁎ 0.17
Subcutaneous fat layer (n=26)Sound velocity −0.12 −0.22 −0.32 −0.27Attenuation 0.11 −0.02 −0.25 −0.09
Intermediate fat layer (n=22)Sound velocity −0.31 −0.58⁎⁎ −0.08 −0.61⁎⁎
Attenuation −0.04 −0.36 0.10 −0.44⁎
Inner fat layer (n=17)Sound velocity −0.47 −0.44 −0.33 −0.57⁎
Attenuation −0.05 0.01 −0.14 −0.11
Weight: hot carcass weight, BW: backfat width, IMF: intramuscular fat, thickness:thickness of the individual layers determined with image analysis; n: differences in theamount of samples are reasoned in insufficient measurements.
⁎⁎⁎ pb0.001.⁎ pb0.05.
⁎⁎ pb0.01.
70 T. Koch et al. / Meat Science 88 (2011) 67–74
betweenDM, thickness (up to r=0.77) and FA (up to r=0.70) precludedthe implementation of additional parameters into the MLR model ofindividual fat layers or the pooled data. NoMLRmodel could be given forthe inner fat layer as no compositional parameter reached the requiredlevel of significance.
νsubcutaneous = 1613:0ms−1−2:0ms−1⋅DM; ð1Þ
νintermediate = 1798:0ms−1−3:9ms−1⋅DM; ð2Þ
νall = 1680:0ms−1−2:6ms−1⋅DM: ð3Þ
Attenuation was not affected by the evaluated chemical composition,except for the MUFA content in the subcutaneous layer (Table 4). In thepooleddata, amoderate negative correlationwithdrymatter (r=−0.37)
Table 4Pearson product moment correlations between chemical compositions and ultrasoundparameters.
FA DM SFA MUFA PUFA
Subcutaneous fat layer (n=20)Sound velocity −0.46⁎ −0.42⁎ −0.08 −0.24 0.24Attenuation 0.03 −0.31 −0.02 −0.54⁎ 0.42
Intermediate fat layer (n=17)Sound velocity −0.53⁎ −0.65⁎ −0.15 0.00 0.12Attenuation −0.22 −0.36 0.08 −0.34 0.19
Inner fat layer (n=14)Sound velocity −0.46 −0.01 −0.11 −0.17 0.25Attenuation 0.09 −0.16 0.11 −0.29 0.12
Combined fat layers (n=51)Sound velocity −0.37⁎⁎ −0.39⁎⁎ 0.29⁎ −0.14 −0.18Attenuation 0.04 −0.37⁎⁎ 0.25 −0.24 −0.08
FA: total amount of fatty acids, DM: dry matter, SFA: saturated fatty-acids, MUFA:mono-unsaturated fatty-acids, PUFA: poly-unsaturated fatty-acids n: differences in theamount of samples are reasoned in insufficient measurements.⁎ pb0.05.⁎⁎ pb0.01.
content was observed. As observed for sound velocity neither thecalculated total number of double bonds nor the average fatty acidchain lengths showed a significant influence on attenuation (data notshown).
The relative impacts of backfat thickness and chemical compositionon the acoustic properties of the compound samples could only partiallybe confirmed be stepwisemultiple linear regression analysis. The soundvelocity could be predicted by a combination of the backfat width (BW)and the amount of PUFA in the subcutaneous fat layer (R2=0.79;RMSE=9.1 ms−1):
νcompound = 1496−2:86mm−1ms−1⋅BW + 2:34ms−1PUFAsubcut:; ð4Þ
The squared semi partial correlation coefficients provide ameasure of the contribution of each parameter to the varianceexplained by the model. 34.4% and 12.9% of the variance of theobserved compound velocity are explained by variations of BW andPUFA, respectively. Consequently, including only the backfat widthinto the model revealed a slightly weaker prediction model(R2=0.68; RMSE=11.6 ms−1).
νcompound = 1555−3:94mm−1ms−1⋅BW: ð5Þ
No significant multivariate model was found for the attenuationvalues.
4. Discussion
4.1. Backfat structure and composition
Fatty acid distribution inmonogastric animals is largely affected bybreed type, diet or production system (Daza et al., 2007; Ninoles et al.,2007). Within the present study, distributions of the fatty acids andfatty acid groups confirm earlier results at German pig populations. Ina previous investigation of more than 600 pigs of three commercialcrossbreds (Link, 2007) we observed on average 19.1% PUFA, 44.3%MUFA, and 36.6% SFA in backfat (subcutane and intermediate layer). Ahighly comparable amount has been stated for the 4 major fatty acids(palmitic, stearic, oleic and linoleic acid) of pigs from an industrialslaughterhouse, analysing the two outer fat layers combined(Davanel, Riaublanc, Marchal, & Gandemer, 1999). Thus, the selectedcarcasses are suggested to be a representative sample with respect tocommercial German slaughter pigs in terms of fatty acid composition.
As for the variation between the individual layers, a higher amountof moisture and a corresponding lower amount of fatty acids in theinner layer was stated (Moody & Zobrisky, 1966). This is partly inaccordance with our results, whereas the inner layer had thesignificantly lowest amount of dry matter. Contrarily, no significantdifferences in the total fat content could be found between the layers.Varying fatty acid composition between fat layers was observedearlier. Lower levels of SFA but higher levels of MUFA and PUFA werefound for the subcutaneous layer compared to the intermediate andinner layer (Daza et al., 2007; Monziols, Bonneau, Davanel, & Kouba,2007). This could be confirmed by our investigation. The observedrelative thickness differences of the individual fat layers are also inagreement with previous studies (Fortin, 1986; Moody & Zobrisky,1966; Müller & Polten, 2004).
Close relationships between the total backfat depth and thecomposition of the fat layers (i.e. the total amount of fatty acids) havealready been stated in literature (Davanel et al., 1999; Dinh et al.,2010; Moody & Zobrisky, 1966). Positive correlations between fatthickness and the amount of drymatter (Moody & Zobrisky, 1966) canbe confirmed by our investigation. However, the relationshipsbetween the backfat width and fatty acid composition were lessclearly pronounced. Increasing SFA and decreasing PUFA with

71T. Koch et al. / Meat Science 88 (2011) 67–74
increasing fat depth were published for backfat (Lo Fiego, Santoro,Macchioni, & De Leonibus, 2005; Villegas, Hedrick, Veum, McFate, &Bailey, 1973; Wood, 1973). Contrarily, recent investigations stated nosignificant relationships between backfat width and fatty acidcomposition in porcine adipose tissue (Furman, Malovrh, Levart, &Kovac, 2010). Our results can be considered to be in accordance withthe earlier results, as minor significant positive relationships betweenBW and SFA were found for the inner layer. Furthermore, significantpositive correlations were found between BW and the weightedamounts of SFA of all 3 fat layers (r=0.51), while the amount of PUFAshowed negative relationships (r=−0.46) (data not shown).
4.2. Ultrasound parameters
Even if a wide variety of porcine tissues was investigated withultrasound through the last decades (Chivers & Parry, 1978; Greenleaf,1986; Ninoles et al., 2007), none of the investigations provided a datasetcomparable to conditions used during this investigation. In earlierinvestigations one or more important factors (e.g. temperature,measurement position and frequency) were either different fromthose of our study or not provided at all, and thus rendering a directcomparison impossible.
Within the present study the mean and standard deviation of soundvelocity estimates in fat was 1450 ms−1±27ms−1 considering allindividual fat layers. Earlier, a velocity of about 1530 ms−1 for freeze-thawed porcine backfat samples measured without skin at 20 °C wasstated by Ninoles et al. (2007). The difference can be explained by anegative temperature coefficient of ultrasonic velocity of solid and liquidfats (Benedito, Carcel, Rossello, &Mulet, 2001;Ninoles, Sanjuan, Ventanas,& Benedito, 2008) resulting in a non-linear decrease of sound velocity ofabout 6 to 7 ms−1 °C−1 at 20 °C (Ninoles et al., 2007). Furthermore, thereduction of the solid-to-liquid ratio due to themelting of fatty acidswithincreasing temperature also reduces sound velocity (McClements &Povey, 1992; Ninoles et al., 2007). Taking this into account, a velocity ofabout 1450 ms−1 at 38 °C is feasible.
The highest sound velocity obtained for the inner fat layer isprobably caused by the higher water content compared to the otherlayers. The sound velocity in water increases with temperature, whilethe sound velocity in fat decreases (Del Grosso & Mader, 1972;McClements & Povey, 1992). At temperatures above approximately24 °C the sound velocity of fat is lower compared to water (Miles &Fursey, 1977). Thus, sound velocity of fat tissue samples with higherwater content (inner fat layer) is suggested to be higher whenmeasured at temperatures above 24 °C. This is supported by thenegative relationship between dry matter and sound velocity foundfor the fat layers in this investigation. Compared to the total amount ofdry matter and fatty acids, the corresponding fatty acid compositionseems to be less significant in terms of sound velocity. Ninoles et al.(2007) however stated influences of both the amount of MUFA andPUFA on sound velocity. Those differences to our results may becaused by different temperatures used in both studies. Several fattyacids, including oleic acid accounting for about 40% in our investiga-tion, have been stated to melt at about 5 to 15 °C (Cedeno, Prieto,Espina, & García, 2001). Therefore, an influence on sound velocity dueto a change of the solid-to-liquid ratio observed in the temperaturerange between 0 and 20 °C may be negligible at 38 °C, when most ofthe fatty acids exist in liquid form. Furthermore, the differences infatty acid composition between the samples were comparably low.
The obtained sound velocity values of skin (1682±23.36 ms−1)wereslightly lower than previous findings. Values of 1710 ms−1±60 ms−1
have been measured in porcine skin 3 days p.m. (Cantrell, Goans, &Roswell, 1978). However, these measurements were performed at lowertemperatures (25 °C). Only 2 animals were investigated while the exactanatomical origin of the samples was not reported. Differences in theamount and cross-linking of the skin collagen between different breeds
and body regions have been reported (Meyer, Neurand, & Radke, 1982)and thus could explain the differences to our data.
To our knowledge, no investigation targeting the attenuation ofthe individual fat layers has been published. Gammel et al. (1979)stated attenuation values of about 2.0 to 2.5 dB MHz−1 cm−1 forcompound fresh porcine backfat samples obtained from one singleanimal at 37 °C. This is in the range of the present results, whereattenuation values from 1.59 to 2.72 dB MHz−1 cm−1 were obtained.
The higher attenuation value measured for the inner fat layer issuggested to be a confounded effect of both the lower dry matter andthe higher PUFA content compared to the other layers. Ultrasonicproperties of fats and oils were shown to be affected by structuralparameters such as fatty acid chain length, degree of saturation,melting point, and correspondingly the solid fat content (Hustad,Richardson, Winder, & Dean, 1970; Maleky, Campos, & Marangoni,2007; McClements & Povey, 1992). Varying amounts of SFA and PUFA,and correspondingly the amount of double bonds, are anticipated toaffect the attenuation of edible fats and oils.
For porcine skin, attenuation values of about 0.7 dB MHz−1 cm−1
have been estimated in a frequency range from 7 to 13 MHz at 25 °C(Cantrell et al., 1978). However, only 2 animals were used in thatinvestigation. Our study has covered a broader range of tissueproperties, whereas the samples with the smallest attenuation values(0.8 dB MHz−1 cm−1) were comparable to those reported by Cantrellet al. (1978). Furthermore, relationships between the attenuation andthe amount of collagen (up to r=0.56) and water (up to r=−0.73)have been stated for dog skin (Olerud et al., 1987). Large differencesbetween fibre arrangement and the amount of collagen were foundwith respect to anatomic origin and pig breed type (Meyer et al.,1982). Therefore, differences in body region, breed and age have to beconsidered for a direct comparison.
4.3. Correlations of ultrasound parameters with carcass and backfatcharacteristics
The relative proportion of the skin thickness versus compoundthickness (12.6–35.5%) is the most important factor determining thevelocity of the compound backfat (r=0.89). This is explained by thesignificantly higher sound velocity of skin tissue compared to those ofthe backfat layers (1682 ms−1 versus 1450 ms−1). The thickness ofthe skin revealed only slight differences between samples while therewas no relationship to the thickness or velocity of the compoundsample. Therefore, the total backfat thickness can be assumed to beindependent on variations of the thickness of the skin, while therelative proportion of skin compared to the total backfat thicknessincreases with decreasing backfat depth. Contrarily, the individual fatlayers show a comparably wide range of thickness variation (Fig. 3),mainly affecting the thickness of the backfat compound. As shown byMLR (Eqs. (4) and (5)) the compound thickness and with it thethickness of the individual fat layers is mainly accounting for thesound velocity of the compound sample. Out of the 3 fat layers thethickness of the intermediate one seems to be most importantfollowed by the subcutaneous one. MLR revealed an R2 value of 0.89for predicting the compound thickness using only the thickness valuesof the subcutaneous and the intermediate layers. On the other hand,neither the thickness of the inner layer nor that of skin was associatedwith variations of the compound thickness. This can be explained bythe development of the individual layers. The subcutaneous layer isdeveloped first followed by the intermediate layer, while the innerlayer is developed rather late and may therefore not be fullydeveloped. Furthermore, the intermediate layer increases to a higherextend compared to the subcutaneous one and does therefore showhigher differences between the animals (Moody & Zobrisky, 1966),which was confirmed by the higher standard deviation in our study.
In addition to the backfat thickness, the amount of PUFA in thesubcutaneous layer was shown to significantly influence the sound

Fig. 3. Linear regression analysis of the cumulative thickness values of the individuallayers (skin+fat layers 1 to 3) versus compound thickness determined by opticalimage analysis (n=26).
Fig. 4. Linear regression analysis of the sound velocity versus compound thickness(fat layers+skin) determined by image analysis (n=26).
72 T. Koch et al. / Meat Science 88 (2011) 67–74
velocity of the compound sample. This is in accordance to earlierinvestigations, were the fatty acid distribution has been suggested toinfluence sound propagation properties in fats and oils (McClements& Povey, 1992; Ninoles et al., 2007). Ninoles et al. (2007) mentionedan increased sound velocity for backfat samples with higher amountsof MUFA and PUFA, which is accordance with our results. In terms ofimplementation of the amount of PUFA into the MLR model, both thePUFA of the subcutaneous and the intermediate fat layers reached therequired level of significance. However, due to auto-correlations ofthe PUFA content in both layers (r=0.93), only one layer wasimplemented in the model.
Even when PUFA as a compositional parameter is implemented inthe model, the proportion of skin compared to total backfat thicknessis the by far most important variable. Considering Eq. (4), the soundvelocity of the compound sample can be expected to differ by lessthan 25 ms−1 between samples with low and high amounts of PUFA(i.e. from 12.6% to 25.4%). In contrast to alterations due to the fattyacid composition (e.g. PUFA), the observed differences in thecompound thicknesses would cause variations of the sound velocityof more than 45 ms−1. As additional factors, the amounts of DM andFA have been shown to significantly increase the sound velocitywithin the individual fat layers. Both parameters however were notimplemented in the MLR model. This again is explained by highcorrelations of both parameters with the backfat width (up tor=0.85). While both parameters can be considered to influence thecompound sound velocity, this is already covered by the effect of theincreasing backfat thickness.
As shown in Fig. 4, the sound velocity can be predicted withreasonable accuracy (R2=0.66; RMSE=12 ms−1) using only thecompound backfat thickness. This is an important finding as thebackfat thickness is being determined at slaughter facilities and canhence be implemented easily into ultrasound correction algorithms.
Furthermore, these findings are of economical interest, as thecommonly used assumption of constant sound velocity for the skin-fattissue compound will necessarily lead to an uncertainty in the backfatthickness estimation. Therefore, the incorporation of a thicknessdependent sound velocity in ultrasound based grading systems isanticipated to significantly improve the estimation of backfat andmuscle thickness and the subsequent lean meat yield calculation.Ideally, such systems need to detect not only the fat-muscle boundary,but also the skin-fat boundary. By this approach the lack of accuracy ofultrasound equipment for backfat thickness estimation, particularlywith very lean carcasses (Müller & Polten, 2004) can be overcome.
The decreasing sound velocity with increasing thickness of theindividual fat layers is mainly a consequence of the increasing amountof fatty acids and dry matter with increasing thickness. Both, the totalamount of fatty acids and dry matter have been shown to have
negative relationships to the sound velocity (up to r=−0.65). Highercorrelations of sound velocity with fatty acids and dry matter in theintermediate and inner layers are presumably caused by a highervariation of both variables in these layers (Fortin, 1986; Moody &Zobrisky, 1966). Earlier investigations also stated an influence of fattyacid composition on sound propagation properties in fats and oils(McClements & Povey, 1992; Ninoles et al., 2007). No comparablefindings can be mentioned for our investigation besides a minorpositive correlation between SFA and the sound velocity of the pooledfat layers. As mentioned before, the lack of relationships can beexplained by procedural differences, mainly the temperature. Ninoleset al. (2007) performed his measurements at a range from 0 to 20 °Ccompared to our investigations at about 38 °C, which most likely hasaffected the solid-to-liquid ratio of the fatty acids. Ninoles (2007)reported a decrease of sound velocity from 0 °C to 20 °C due to themelting of the fatty acids as referred to by differential scanningcalorimetry (DSC). The melting point of individual fatty acids isdefined by the amount of carbon atoms and double bonds. The higherthe number of carbon atoms and double bonds in fat, the lower themelting point and therefore also sound velocity (Ninoles et al., 2007).Lower solid-to-liquid ratios in oils and fats resulted in lower soundvelocity values (McClements & Povey, 1988; McClements & Povey,1992). This could not be confirmed by our study as we did not observesignificant relationships between the number of double bonds orcarbon atoms and sound velocity (results not shown). Besides theinfluence of temperature, this is probably due to the higher variationof water content between layers compared to the variation of fattyacid types. However, we did not use DSC to determine the solid fatcontent. Accordingly, only very few differences between the soundvelocities of vegetable oils differing in fatty acid compositionmeasured at about 20 °C were found (Javanaud & Rahalkar, 1988).Therefore, the small differences in the amount of double bonds andcarbon atoms of backfat samples in our study may be negligiblecompared to the total amount of fatty acids and dry matter in terms ofultrasound velocity.
In contrast to sound velocity, no influence of the relative proportion ofthe skin couldbe stated for attenuationof compoundbackfat samples. Thedifferences in attenuation between the skin (2.71 dBMHz−1 cm−1) andthe fat layers (1.62 to 2.72 dBMHz−1 cm−1) are rather small andtherefore have a much lower effect on the attenuation of the compoundsample. Furthermore, no significant influence for anyof the compositionalparameters could be found. This lack of relationships may partially beexplained by influences due to the used method. Firstly, dividing thelayersmayhave slightly altered structure and state of compression,whichmay have an influence on the measurements. Furthermore, frequencydependent attenuation of the compound samples is highly affected bytissue boundaries. When the compound backfat sample is analysed, thesoundwavehas to traverse not only skin and the individual backfat layers,but also their interfaces thatmainly consist of connective tissue. This effect
73T. Koch et al. / Meat Science 88 (2011) 67–74
is excludedwhen individual layers areanalysed.Ananalysis of theamountof connective tissue has not been conducted, as the variance can beexpected to be rather small compared to that of the other evaluatedparameters (Wood, Enser, Whittington, Moncrieff, & Kempster, 1989).However, the sound transmission losses at the individual interfaces maybe highly dependent on subtle variations of composition, structure andthickness of the connective tissue interfaces. As attenuation of both,compoundsampleand individual fat layers canbeconsidered tobemostlyunaffectedby the investigated structural and compositional parameters ofthe fat tissue, the estimation of the backfat compound attenuation value,as proposed for sound velocity, could not be achieved. For this, thetransmission losses at the individual tissue interfaces would need to bequantified. This however, seems to be impossiblewith current ultrasounddevices used at slaughter facilities, as these layers are located very close tothe transducer surface and within the near field of the common soundgeometries used for this purpose.
5. Conclusions and implications
For the first time, a comprehensive survey of sound velocity andattenuation values for all 3 individual porcine backfat layers and skinwas conducted with a representative sample of commercial pigs. Theacoustic parameters were related to structural and compositional traits.Since the data are going to be used for ultrasoundmeasurements at hotcarcasses in commercial slaughterhouses the measurements wereperformed at 38 °C.
According to the results, the sound velocity of the compound sampleis mainly influenced by the relative proportion of the skin compared tototal backfat thickness. This is suggested to be mainly caused by theconsiderably higher soundvelocity of skin compared to that of fat tissue.Thus, sound velocity is decreasing with increasing total backfatthickness. Additional parameters, e.g. the amount of fatty acids or drymatter significantly influence the sound velocity values of the fat layers.However, this influence is rather small compared to the proportion ofthe skin on total compound thickness. Furthermore, both parametersshowmediumtohigh correlationswith thebackfat thickness. Therefore,statisticalmodels including the backfat thicknesswill inherently includethe effects of both compositional parameters. Thus, in terms ofultrasound measurements a correction of sound velocity within thebackfat compound seems to be feasible using only the backfat thickness.The remaining unexplained variance of the sound velocity (~32%) canpartially be described by the fatty acid distribution (e.g. PUFA) reachingabout 11% explained variance. No comparable statement could be givenfor the attenuation as i) the skin shows rather similar attenuation valuescompared to fat tissue and ii) the attenuation losses in the backfatcompoundappear to bepredominantly affected by the connective tissueinterfaces between the fat layers.
Compositional differences between the fat layers were found. Theinner layer contains the lowest amount of dry matter while thesubcutaneous layer contains more PUFA and correspondingly loweramounts of SFA. All 3 fat layers showed only slightly different soundvelocity values while the attenuation was about doubled for the innerfat layer.
The sound velocity of the individual fat layers was negativelyrelated to the amount of fatty acids and dry matter while nocorrelations to any of the fatty acid main groups could be found. Incontrast, the amount of PUFA was the only compositional parameterincluded in the MLR model to predict the sound velocity of thecompound sample.
The obtained information will be used to optimize an ultrasoundbased pig carcass grading device under development to estimate theintramuscular fat content of loin. The investigated relationships areanticipated to improve the signal correction procedures needed forultrasound measurements at hot carcasses. The remarkably differentsound velocities of skin and fat layers may be used for more precise
backfat thickness estimations as long as the skin-fat-boundary isdetectable with that specific ultrasound device.
Acknowledgements
This work was financially supported by the German ResearchCouncil (DFG; grants Mo 1746/1 and Ra 1380/3), PRO INNO (grantKF0380401LF6) and Carometec A/S.
References
Benedito, J., Carcel, J. A., Rossello, C., & Mulet, A. (2001). Composition assessment of rawmeat mixtures using ultrasonics. Meat Science, 57, 365−370.
Brooks, C. C. (1971). Fatty acid composition of pork lipids as affected by basal diet, fatsource and fat level. Journal of Animal Science, 33, 1224−1231.
Cantrell, J. H., Jr., Goans, R. E., & Roswell, R. L. (1978). Acoustic impedance variations atburn-nonburn interfaces in porcine skin. The Journal of the Acoustical Society ofAmerica, 64, 731−735.
Cedeno, F. O., Prieto, M. M., Espina, A., & García, J. R. (2001). Measurements oftemperature andmelting heat of some pure fatty acids and their binary and ternarymixtures by differential scanning calorimetry. Thermochemica Acta, 369, 39−50.
Chivers, R. C., & Parry, R. J. (1978). Ultrasonic velocity and attenuation in mammaliantissues. The Journal of the Acoustical Society of America, 63, 940−953.
Davanel, A., Riaublanc, A., Marchal, P., & Gandemer, G. (1999). Quality of pig adiposetissue: Relationship between solid fat content and lipid composition. Meat Science,51, 73−79.
Daza, A., Ruiz-Carrascal, J., Olivares, A., Menoyo, D., & López-Bote, C. J. (2007). Fatty acidsprofile of the subcutaneous backfat layers from Iberian pigs raised under free-rangeconditions. Food Science and Technology International, 13, 135−140.
Del Grosso, V. A., & Mader, C. W. (1972). Speed of sound in pure water. The Journal of theAcoustical Society of America, 52, 1442−1446.
Dinh, T. T. N., Blanton Jr, J. R., Riley, D. G., Chase Jr, C. C., Coleman, S. W., Phillips, W. A.,et al. (2010). Intramuscular fat and fatty acid composition of longissimus musclefrom divergent pure breeds of cattle. Journal of Animal Science, 88, 756−766.
Fernandez, X., Monin, G., Talmant, A., Mourot, J., & Lebret, B. (1999). Influence ofintramuscular fat content on the quality of pig meat— 2. Consumer acceptability ofM. longissimus lumborum. Meat Science, 53, 67−72.
Fortin, A. (1986). Development of backfat and individual fat layers in the pig and itsrelationship with carcass lean. Meat Science, 18, 255−270.
Furman, M., Malovrh, S., Levart, A., & Kovac, M. (2010). Fatty acid composition of meatand adipose tissue from Krskopolje pigsand commercial fatteners in Slovenia.Archiv Tierzucht, 53, 73−84.
Gammel, P. M., Croissette, D. H. L., & Heyser, R. C. (1979). Temperature and frequencydependence of ultrasonic attenuation in selected tissues. Ultras. Med. & Biol., 5,269−277.
Greenleaf, J. F. (1986). Tissue characterization with ultrasound (Volume I). Florida: CRCPress, Inc.
Hustad, G. O., Richardson, T., Winder, W. C., & Dean, M. P. (1970). Factors affectingsound velocity (triggering frequency) in fats and oils. Journal of Dairy Science, 53,1525−1531.
Javanaud, C., & Rahalkar, R. R. (1988). Velocity of sound in vegetable oils. Fat ScienceTechnology, 90, 73−75.
Koch, T., Brand, S., Lakshmanan, S., Raum, K., Wicke, M., & Mörlein, D. (2011).Ultrasound velocity and attenuation of porcine soft tissues with respect to structureand composition: I. Muscle. Meat Science, 88, 51−58.
Link, G. (2007). Beziehungen zwischen objektiv und subjektiv ermittelten Fleischqua-litätsparametern unter besonderer Berücksichtigung der Muskelstrukturmerkmaleim Musculus longissimus von Schweinen. In: Ph.D. Thesis, Department of animalscience, Georg-August-University Göttingen.
Lo Fiego,D. P., Santoro, P.,Macchioni, P., &De Leonibus, E. (2005). Influence of genetic type,liveweight at slaughter and carcass fatness on fatty acid composition of subcutaneousadipose tissue of raw ham in the heavy pig.Meat Science, 69, 107−114.
Maleky, F., Campos, R., & Marangoni, A. G. (2007). Structural and mechanical propertiesof fats quantified by ultrasonics. Journal of the American Oil Chemists' Society, 84,331−338.
McClements, D. J., & Povey, M. J. W. (1988). Investigation of phase transitions inglycerine/paraffin oil mixtures using ultrasound velocity measurements. Journal ofthe American Oil Chemists' Society, 65, 1791−1795.
McClements, D. J., & Povey, M. J. W. (1992). Ultrasonic analysis of edible fats and oils.Ultrasonics, 30, 383−388.
Meyer, W., Neurand, K., & Radke, B. (1982). Collagen fibre arrangement in the skin ofthe pig. Journal of Anatomy, 134, 139−148.
Miles, C. A., & Fursey, G. A. (1977). Measurement of the fat content of meat usingultrasonic waves. Food Chemistry, 2, 107−118.
Monziols, M., Bonneau, M., Davanel, A., & Kouba, M. (2007). Comparison of the lipidcontent and fatty acid composition of intramuscular and subcutaneous adiposetissues in pig carcasses. Meat Science, 76, 54−60.
Moody,W. G., & Zobrisky, S. E. (1966). Study of backfat layers of swine. Journal of AnimalScience, 25, 809−813.
Mörlein, D., Rosner, F., Brand, S., Jenderka, K. V., & Wicke, M. (2005). Non-destructiveestimation of the intramsucular fat content of the longissimus muscle of pigs bymeans of spectral analysis of ultrasound echo signals. Meat Science, 69, 187−199.

74 T. Koch et al. / Meat Science 88 (2011) 67–74
Müller, S., & Polten, S. (2004). Vergleichsuntersuchung zur Ultraschall-Speckdick-enmessung beim Schwein im Rahmen der Eigenleistungprüfung. Archiv fürTierzucht Dummersdorf, 47, 249−263.
Ninoles, L., Clemente, G., Ventanas, S., & Benedito, J. (2007). Quality assessment of Iberianpigs through backfat ultrasound characterization and fatty acid composition. MeatScience, 76, 102−111.
Ninoles, L., Sanjuan, N., Ventanas, S., & Benedito, J. (2008). Ultrasonic and sensorycharacterization of dry-cured ham fat from Iberian pigs with different genetics andfeeding backgrounds. Meat Science, 80, 869−902.
Olerud, J. E., O' Brien, W., Riederer-Henderson, M. A., Steiger, D., Forster, F. K., Daly, C.,et al. (1987). Ultrasonic assessment of skin and wounds with the scanning laseracoustic microscope. Journal of Investigative Dermatology, 88, 615−623.
Scheeder, M. R. L., Gläser, K. R., Eichenberger, B., & Wenk, C. (2000). Influence ofdifferent fats in pig feed on fatty acid composition of phospholipids and physicalmeat quality characteristics. European Journal of Lipid Science and Technology, 102,391−401.
Smith, N. B. (1996). Effect of myofibril length and tissue constituents on acousticpropagation properties of muscle. Ph.D.Thesis, University of Illinois.
Villegas, F. J., Hedrick, H. B., Veum, T. L., McFate, K. L., & Bailey, M. E. (1973). Effect of dietand breed on fatty acid composition of porcine adipose tissue. Journal of AnimalScience, 36, 663−668.
Wood, J. D. (1973). The fatty acid composition of backfat from Pietrain and large whitepigs. Animal Production, 17, 281−285.
Wood, J. D., Enser, M., Fisher, A. V., Nute, G. R., Sheard, P. R., Richardson, R. I., et al.(2008). Fat deposition, fatty acid composition and meat quality: A review. MeatScience, 78, 343−358.
Wood, J. D., Enser, M., Whittington, F. M., Moncrieff, C. B., & Kempster, A. J. (1989).Backfat composition in pigs: Differences between fat thickness groups and sexes.Livestock Production Science, 22, 351−362.
Wood, J. D., Nute, G. R., Richardson, R. I., Whittington, F. M., Southwood, O., Plastow, G.,et al. (2004). Effects of breed, diet and muscle on fat deposition and eating qualityin pigs. Meat Science, 67, 651−667.