ACTIVATED CARBONS OBTAINED FROM SEWAGE ...
32
1 2 3 4 5 6 7 8 9 10 11 12 13 14 15 16 17 18 19 20 21 22 23 24 25 26 27 28 29 30 31 32 33 34 35 36 37 38 39 40 41 42 43 44 45 46 47 48 49 50 51 52 53 54 55 56 57 58 59 60 61 62 63 64 65 1 ACTIVATED CARBONS OBTAINED FROM SEWAGE SLUDGE BY CHEMICAL ACTIVATION: GAS-PHASE ENVIRONMENTAL APPLICATIONS T. Boualem 1, 2* , A. Debab 2 , A. Martínez de Yuso 3 , M.T. Izquierdo 4 1 Department of Science and Technology. Faculty of Science and Technology. University of Mascara. Algeria. 2 Department of Chemistry. Faculty of Science. University of Science and Technology Mohammed Boudiaf. Oran. Algeria. 3 Universidad San Jorge. Autovía A23 Zaragoza-Huesca km 510. 50830 Villanueva de Gállego, Zaragoza. Spain. 4 Instituto de Carboquímica, ICB-CSIC. c/Miguel Luesma Castán, 4. 50018 Zaragoza. Spain. *corresponding author: [email protected]
-
Upload
khangminh22 -
Category
Documents
-
view
1 -
download
0
Transcript of ACTIVATED CARBONS OBTAINED FROM SEWAGE ...

1 2 3 4 5 6 7 8 9 10 11 12 13 14 15 16 17 18 19 20 21 22 23 24 25 26 27 28 29 30 31 32 33 34 35 36 37 38 39 40 41 42 43 44 45 46 47 48 49 50 51 52 53 54 55 56 57 58 59 60 61 62 63 64 65
1
ACTIVATED CARBONS OBTAINED FROM SEWAGE SLUDGE BY
CHEMICAL ACTIVATION: GAS-PHASE ENVIRONMENTAL
APPLICATIONS
T. Boualem1, 2*, A. Debab2, A. Martínez de Yuso3, M.T. Izquierdo4
1Department of Science and Technology. Faculty of Science and Technology. University of
Mascara. Algeria.
2Department of Chemistry. Faculty of Science. University of Science and Technology Mohammed
Boudiaf. Oran. Algeria.
3Universidad San Jorge. Autovía A23 Zaragoza-Huesca km 510. 50830 Villanueva de Gállego,
Zaragoza. Spain.
4Instituto de Carboquímica, ICB-CSIC. c/Miguel Luesma Castán, 4. 50018 Zaragoza. Spain.
*corresponding author: [email protected]
*ManuscriptClick here to download Manuscript: Manuscript_v2_rev.docx Click here to view linked References
Administrador
Texto escrito a máquina
Submitted, accepted and published by J.Environ. Manag. 140:145-151, 2014 © 2021. This manuscript version is made available under the CC-BY-NC-ND 4.0 license https://creativecommons.org/licenses/by-nc-nd/4.0/ DOI: 10.1016/j.jenvman.2014.03.016

1 2 3 4 5 6 7 8 9 10 11 12 13 14 15 16 17 18 19 20 21 22 23 24 25 26 27 28 29 30 31 32 33 34 35 36 37 38 39 40 41 42 43 44 45 46 47 48 49 50 51 52 53 54 55 56 57 58 59 60 61 62 63 64 65
2
ABSTRACT
The objective of this study was to evaluate the adsorption capacity for toluene and SO2 of low cost
activated carbons prepared from sewage sludge by chemical activation at different impregnation
ratios. Samples were characterized by proximate and ultimate analyses, thermogravimetry, infrared
spectroscopy and N2 adsorption. Because of the low carbon content of the raw material, the
development of porosity in the activated carbons was mainly of a mesoporous nature, with surface
areas lower than 300 m2/g. The study of gas-phase applications for activated carbons from sewage
sludge was carried out using both an organic and an inorganic compound in order to screen for
possible applications. Toluene adsorption capacity at saturation was around 280 mg/g, which is a
good level of performance given the high ash content of the activated carbons. However, dynamic
experiments at low toluene concentration presented diffusion problems resulting from low porosity
development. SO2 adsorption capacity is associated with average micropore size, which can be
controlled by the impregnation ratio used to prepare the activated carbons.
Keywords: sewage sludge; activated carbon; gas-phase application; SO2 adsorption; toluene
adsorption

1 2 3 4 5 6 7 8 9 10 11 12 13 14 15 16 17 18 19 20 21 22 23 24 25 26 27 28 29 30 31 32 33 34 35 36 37 38 39 40 41 42 43 44 45 46 47 48 49 50 51 52 53 54 55 56 57 58 59 60 61 62 63 64 65
3
1. INTRODUCTION
Sewage sludge is the major byproduct of wastewater treatment plants worldwide. Its disposal is
becoming a growing problem given that it is a potential source of heavy metals and of pathogens,
which are contained in the wastes. It is estimated that the need for wastewater treatment will
increase and, accordingly, the amount of wastes produced in water treatment plants will also
increase (Cao et al., 2013; Fonts et al., 2012).
Usual disposal processes are agricultural applications, landfill and incineration. However, because
of limits set by stringent environmental regulations, there is a need to seek other environmental
friendly applications. Turning sewage sludge into an activated carbon has received considerable
attention (Rozada et al., 2005) owing to its environmental sustainability and its potentially low cost
(Stüber et al., 2011). According to the review by Smith et al. (2009) different methodologies have
been developed for the production of sewage sludge-based activated carbon, and research is
continuing into applications for the removal of pollutants such as dyes, metals and phenols.
However, little effort has been devoted to their gas-phase application, such as in toluene and
sulphur dioxide adsorption.
The rapid development of chemical, pharmaceutical and other processing industries, and the ever-
increasing number of motor vehicles on the world’s roads, together with emissions from the
combustion of fossil fuels in power plants and similar industrial processes, are resulting in the
release of large amounts of hazardous gases and vapours into the atmosphere, which in turn is
placing considerable pressure on the availability of clean air. These effluents contain small amounts
of a large number of volatile organic compounds (VOCs). These flue gases also contain small
amounts of sulphur and nitrogen oxides, the most important of these being SO2 and NO. These
gases combine with VOCs to produce smog and sometimes also produce acid or smog clouds.
These occurrences have led to more stringent regulations for pollution control (Bansal and Goyal,
2005).

1 2 3 4 5 6 7 8 9 10 11 12 13 14 15 16 17 18 19 20 21 22 23 24 25 26 27 28 29 30 31 32 33 34 35 36 37 38 39 40 41 42 43 44 45 46 47 48 49 50 51 52 53 54 55 56 57 58 59 60 61 62 63 64 65
4
Numerous studies have established that sewage sludge-based activated carbon shows great promise
as feedstock for the production of adsorbents (Smith et al., 2009). However, the properties of the
final product and its response to different pollutants are different, depending on the nature of the
sewage sludge (Gasco et al., 2005), the nature of the activating agent and the conditions of
carbonization and activation processes. Most research has been focused on aqueous adsorption (Gu
et al., 2013), such as dye removal (Rozada et al., 2003; Li et al., 2011), metal ion uptake (Otero et
al., 2009), copper adsorption (Wang et al., 2011), mercury removal from water (Zhang et al., 2005),
adsorption of benzene and toluene from aqueous solutions (Wibowo et al., 2007) and adsorption of
4-chlorophenol (Mansalvo et al., 2011). Some authors (Wen et al., 2011) have studied the
adsorption of gaseous formaldehyde, while others have studied the removal of odorous VOCs
(Anfruns et al., 2011). However, no further studies were accomplished concerning gaseous
adsorption on sewage sludge-based activated carbon.
In this context, this work focuses on the performance of low cost activated carbon prepared from
sewage sludge by chemical activation at different impregnation ratios in gas phase applications,
through the study of SO2 and toluene adsorption at low concentration.
2. MATERIALS AND METHODS
2.1. Activated carbon preparation
Sewage sludge (SS) used was collected from drying beds of an urban treatment plant in Mascara,
Algeria, where wastewater undergoes biological treatment by means of an activated sludge process.
The SS was first dried at 105°C, then crushed and sieved to a uniform size. The fraction with a
particle size of 0.5-1 mm was chosen to prepare the activated carbons. Chemical activation with
(ortho)-phosphoric acid was carried out using the impregnation method followed by one-step
carbonization-activation in N2 atmosphere. A portion of SS was mixed with a certain amount of

1 2 3 4 5 6 7 8 9 10 11 12 13 14 15 16 17 18 19 20 21 22 23 24 25 26 27 28 29 30 31 32 33 34 35 36 37 38 39 40 41 42 43 44 45 46 47 48 49 50 51 52 53 54 55 56 57 58 59 60 61 62 63 64 65
5
H3PO4 (85%wt concentration) and stirred for 2 hours at room temperature. Five impregnation ratios
were chosen R1:0.75, R1:1, R1:1.25, R1:1.5 and R1:2 (dry sewage sludge: H3PO4, wt/wt). H3PO4
was chosen owing to the ease of the post activation extraction process and its relatively low
activation temperature (Wang et al., 2011). On completion of the impregnation step, the mixture
became a brown adhesive-like solid.
The impregnated samples were pyrolysed in a quartz reactor under a nitrogen atmosphere, with a
heating rate of 10°C/min up to 600°C. This temperature was maintained for 1 hour. The materials
were then cooled down to room temperature.
The activated carbons obtained were washed using a Soxhlet apparatus for a period of 48 hours
until the pH was around 6-7. The products were subsequently dried in a vacuum furnace at 105°C
for 4 hours.
The activated carbons obtained were labelled as SSPT600R0.75 (R1:0.75), SSPT600R1 (R1:1),
SSPT600R1.25 (R1:1.25), SSPT600R1.5 (R1:1.5) and SSPT600R2 (R1:2).
2.2. Characterization
Samples were characterized by proximate analysis, ultimate analysis, thermogravimetry (TGA),
infrared spectroscopy (FTIR) and N2 adsorption.
Proximate analysis of samples was carried out according to standards ISO-589-1981 for moisture
content, ISO-1171-1976 for ash content and ISO-562-1974 for volatile content. Ultimate analysis
was carried out in a Termo Flash 1112 microanalysis apparatus to determine C, H, N and S
contents. Oxygen content was obtained by difference.
Thermogravimetric analysis of the mixture SS + H3PO4 (1:1, after mixing for 2 hours at room
temperature) was performed in a thermobalance from TA Instruments. Approximately 20 mg of the
mixture was placed in a Pt crucible and heated by 20°C/min up to 850°C under inert atmosphere.

1 2 3 4 5 6 7 8 9 10 11 12 13 14 15 16 17 18 19 20 21 22 23 24 25 26 27 28 29 30 31 32 33 34 35 36 37 38 39 40 41 42 43 44 45 46 47 48 49 50 51 52 53 54 55 56 57 58 59 60 61 62 63 64 65
6
Infrared spectra of the activated carbons were obtained in a Bruker Tensor 27 apparatus. A small
amount of finely ground sample was placed directly on the equipment. The spectra were normalized
and the baseline was corrected with the software provided with the apparatus.
Textural characterization was performed by N2 adsorption-desorption at -196ºC. Isotherms were
obtained in an ASAP 2020 apparatus from Micromeritics. Prior to the analysis, samples were
outgassed at 200ºC up to a vacuum of 10-5 mm Hg. The volume of adsorbed nitrogen was measured
from a relative pressure of 10-7 up to 0.995. Surface area was determined by BET method (Brunauer
et al., 1938) applied to the adsorption branch of the isotherm. Pore volume corresponding to
micropores was calculated using the Dubinin-Radushkevich (DR) equation applied to the
adsorption branch of the N2 isotherm (Dubinin., 1989). Pore volume corresponding to mesopores
was calculated with the Barret-Joyner-Halenda (BJH) equation applied to the desorption branch of
the N2 isotherm (Barret et al., 1951). The total pore volume was taken from the measure of adsorbed
nitrogen at a relative pressure of 0.95. The average micropore diameter was obtained using the
Horwath-Kawazoe (HK) method (Horvath and Kawazoe., 1983).
2.3. Adsorption experiments
(Insert figure.1 here)
The toluene adsorption isotherms were obtained using a gravimetric analyser from VTI Corporation
(Miami, USA). This apparatus is fully computer controlled and measures adsorption and desorption
on a gravimetric microbalance. The sample temperature (25ºC) was constantly monitored
throughout the duration of the experiments and the variation was found to be 0.5ºC. A pressure
transducer in the range of 0-100 mm Hg (accurate to ±0.12%) was used to monitor the vapour
pressure in the system. Approximately 100 mg of an activated carbon sample was placed in a
stainless steel mesh bucket and was outgassed in situ at 150ºC under vacuum up to constant weight.
Pressure steps in the range of p/p0 values 0-0.95 were used to obtain the isotherms. After

1 2 3 4 5 6 7 8 9 10 11 12 13 14 15 16 17 18 19 20 21 22 23 24 25 26 27 28 29 30 31 32 33 34 35 36 37 38 39 40 41 42 43 44 45 46 47 48 49 50 51 52 53 54 55 56 57 58 59 60 61 62 63 64 65
7
equilibrium was reached, the organic vapour pressure was increased to the next set pressure value,
and the subsequent uptake was measured until equilibrium was re-established.
The breakthrough curves for toluene and sulphur dioxide were obtained in a homemade
experimental system used for dynamic mode. A diagram of the experimental installation is given in
Figure 1. It consisted of a fixed-bed adsorber with an internal diameter of 1 cm coupled to a mass
spectrometer (MS) from Pffeifer. Toluene and sulphur dioxide vapours were obtained from
cylinders containing either toluene/Ar or sulphur dioxide/Ar to obtain a concentration of 500 ppmv
in the gas. The flow rate was 30 ml/min and the adsorption temperature was 25ºC. Samples were
used without previous degasification. Before starting an experiment, the gas stream bypassed the
adsorber bed in order to allow either the toluene or sulphur dioxide concentration to be measured.
3. RESULTS AND DISCUSSION
(Insert table.1 here)
Table 1 shows the elemental and proximate analysis results corresponding to the SS and activated
carbons. The SS contained about 50 % ash and presented a carbon content of about 25%. However,
after activation, the ultimate analysis showed that the obtained activated carbons contained more
carbon, and showed a decrease in other elements (N, H and S) comparing with the dried SS,
however their percent weight values differ from one to another activated carbon. SSPT600R1.5
presents the lowest N, H wt % values. While SSPT600R1.25 presents the lowest S wt % value with
SSPT600R1.5. Furthermore the amount of oxygen decreases with 1-2% wt when the activation
ratio increases; however the SSPT600R2 presents the lowest value 58.86% oxygen. The average
amount value of oxygen without SSPT600R2 is 65.4%. This high oxygen percentage was mainly
due to the high organic part of the precursor. In addition, the phosphoric acid impregnated the
carbon with oxygen, on the one hand, but oxygen was also released with volatile matter, on the
other. This combined oxygen has often been found to be the source of the property by which a
carbon becomes useful and effective for some applications (Bansal and Goyal., 2005).

1 2 3 4 5 6 7 8 9 10 11 12 13 14 15 16 17 18 19 20 21 22 23 24 25 26 27 28 29 30 31 32 33 34 35 36 37 38 39 40 41 42 43 44 45 46 47 48 49 50 51 52 53 54 55 56 57 58 59 60 61 62 63 64 65
8
(Insert figure.2 here)
Thermogravimetric analysis provides a prior knowledge of initial and final temperatures of thermal
degradation of SS (Cao et al., 2013). As shown in Figure 2, pyrolysis of SS consisted of four stages.
The first loss phase on the DTG curve corresponded to moisture release. A double peak could be
observed in the second stage: the first shoulder could be identified with biodegradable materials,
undigested organics and dead bacteria, together with the emissions of semivolatile compounds; the
second shoulder could be associated with the evolution of organic polymers, which need higher
temperatures to devolatilize. The third stage could be assigned to cellulosic material reaction (Calvo
et al., 2004). Last peak could be attributed to the decomposition of inorganic materials. The residue
percentage was about 57%. Although the ash content of dried SS was about 51%, it may be
concluded that the amount of final residue depends on the organic materials in sludge as well as the
amount of inorganic materials. The final temperature for pyrolysis was selected as 600ºC based on
the profiles obtained from thermogravimetric analysis.
The chemical characteristics of activated carbon are largely determined by surface chemical
heterogeneity, which is related to the presence of heteroatoms in the structure of the activated
carbons. Oxygen, nitrogen, hydrogen, sulphur and phosphorus, and the delocalized electrons of the
carbon structure determine the acidic or basic character of the activated carbon surface. FTIR
spectroscopy is one of the most versatile and powerful analytical methods used as a qualitative
technique for the evaluation of the chemical structure of carbon materials (Shafeeyan et al., 2010).
(Insert figure.3 here)
The FTIR spectra of the raw SS and the activated carbon samples SST600R1, SST600R1.5 and
SST600R2 are shown in Figure 3. The spectrum for the SS exhibited C-O stretching absorption at
around 1000 cm-1 present in ethers (Grube et al., 2006; Shen et al., 2008) and in polysaccharide or
polysaccharide-like substances (Mahapatra et al., 2012). Another band was observed at 1412 cm-1
assigned to carbonates or carboxyl-carbonates (Shen et al., 2008). Aromatic -C-C stretching could
be noticed at around 1600 cm-1, with this band also being assigned to quinones (Mahapatra et al.,

1 2 3 4 5 6 7 8 9 10 11 12 13 14 15 16 17 18 19 20 21 22 23 24 25 26 27 28 29 30 31 32 33 34 35 36 37 38 39 40 41 42 43 44 45 46 47 48 49 50 51 52 53 54 55 56 57 58 59 60 61 62 63 64 65
9
2012). The band observed at 2921 cm-1 attributed to –C-H stretching may have been due to the
presence of aldehydes (Mahapatra et al., 2012). A wide band at about 3300 cm-1 could be assigned
to the –O-H of alcohols (Shen et al., 2008), or could also be assigned to the N-H stretching due to
the presence of proteins responsible for the presence of nitrogen (Cao et al., 2013). The FTIR
spectra of SSPT600R1, SSPT600R1.5 exhibited similar profiles, whereas, low bands intensity was
noticed in the case of SSPT600R2 profile. Comparing their FTIR spectra with that of the raw SS,
there was seen to be a clear change in the intensity of the bands, as noticed at around 1600 cm-1,
when other band had just disappeared, confirming the decomposition of organic components.
Moreover, the activated carbons samples showed a new band at around 1057 cm-1 assigned to the
O-H of alcohol. Furthermore, it seems that the increase in the impregnation ratio did not affect the
type of surface groups on the activated carbons prepared. The activated carbons presented an acidic
surface owing to the presence of carboxylic groups that rendered the carbon surface hydrophilic and
polar in character, which in turn was able to improve the adsorption properties toward polar gases.
(Insert figure.4 here)
Figure 4 shows the N2 adsorption isotherms of the activated carbons and Table 2 summarizes the
porosity characterization of the samples.
All the N2 adsorption/desorption isotherms of the activated carbons (Figure 4) were type IV,
according to BBDT classification, with a rounded knee at low pressure corresponding to multilayer
physical adsorption, and with type H1 hysteresis loops according to IUPAC classification (Sing et
al., 1985), typical of mesoporous materials. However, all the samples showed a steep nitrogen
uptake at very low relative pressures, which corresponded to the presence of some microporosity.
It would seem from the nitrogen adsorption results that all the samples were largely mesoporous,
with some micropores. An increase in the amount of H3PO4 (increasing of impregnation ratio over
1:1.5) led to a decrease in surface area and microporsity, while mesoporosity increased, as can be
seen in Table 2. This could be attributed to the pore-widening that occurred with the increase in the
impregnation ratio (Guo et al., 2007; Passe-Coutrin, 2008).
1 2 3 4 5 6 7 8 9 10 11 12 13 14 15 16 17 18 19 20 21 22 23 24 25 26 27 28 29 30 31 32 33 34 35 36 37 38 39 40 41 42 43 44 45 46 47 48 49 50 51 52 53 54 55 56 57 58 59 60 61 62 63 64 65
10
On the other hand, the similar sharp increase for the N2 uptake (P/P0=0.9-1) for the samples and the
appearance of the hysteresis loop at (P/P0=0.4-1) indicated capillary condensation taking place on
mesoporous surfaces (Lithoxoos et al., 2010). This could be indicative of a particle clearance hole
on the sample which might have affected the gas adsorption-desorption process.
(Insert table.2 here)
From Table 2, it can be seen that sample SSPT600R1.5 developed the maximum BET surface area
of 296 m2/g. However, an increase in the impregnation ratio over 1.5 gave rise to a decrease in
microporosity, indicating the collapse of the pore wall due to an excess of carbon material loss.
(Insert figure.5 here)
Figure 5 shows the toluene adsorption isotherms for activated carbons. As can be deduced, medium
adsorption capacities of around 25 wt% could be obtained with some carbons. Toluene isotherms
are type I according to the BDDT classification. In general, carbons obtained at higher impregnation
ratios exhibit higher toluene adsorption capacities than those obtained at lower impregnation ratios.
By applying the Langmuir model to the toluene isotherms, the limiting value for vapour adsorption
(Wm) and constant value K could be obtained. These values are shown in Table 3, as well as the
regression coefficient R2. Good correlation was obtained despite the presence of mesoporosity,
which limited the validity of Langmuir model. However, the fit on the low pressure region was
limited when there was continuous adsorption at high relative pressures. K values could be
associated with the increased microporosity in a series of carbons, and this development of the
microporosity could be related to the degree of activated carbon burn-off.
(Insert table.3 here)
As can be seen from Table 3, values as high as 284 mg toluene/g sample were obtained. However, a
low concentration of toluene in gas stream is typical in real gas-phase applications, so, the
adsorption at low relative pressures is of great importance.
(Insert figure.6 here)

1 2 3 4 5 6 7 8 9 10 11 12 13 14 15 16 17 18 19 20 21 22 23 24 25 26 27 28 29 30 31 32 33 34 35 36 37 38 39 40 41 42 43 44 45 46 47 48 49 50 51 52 53 54 55 56 57 58 59 60 61 62 63 64 65
11
Figure 6 shows toluene breakthrough curves for the activated carbons. None of them were steep
enough to rule out some diffusional problems; this could have been due to poor microporosity
development. The integration of the breakthrough curves gave the amount of toluene adsorbed.
(Insert table.4 here)
Table 4 reports the corresponding breakthrough time, saturation time and the amount of toluene
adsorbed at saturation. It should be noted that a longer breakthrough time indicates better dynamic
adsorption capacity (Zhang et al., 2012), which is corroborated by the maximum adsorption
capacity for toluene adsorbed by SSPT600R1.5 (15.6 mg/g). Moreover, as seen in Figure 6, the
breakthrough curve of SSPT600R1.5 was noticeably different after breakthrough time compared
with breakthrough curves obtained for the other samples, with a big gap as the adsorption moved
into saturation. In this range, the breakthrough curve increased, while the slope decreased slightly
50 minutes after the breakthrough time. The slope then increased again for a short time and finally
decreased until saturation point, with an s-shape curve. Axial diffusion resistance and axial
dispersion were responsible for decreasing the breakthrough curve. Axial diffusion may have been
accelerated with smaller particles and axial dispersion may have been slowed with the more
compact bed.
Microporosity seems to have been responsible for the difference in the breakthrough time as well as
for the amount of toluene adsorbed by the activated carbons. These results are in agreement with
previous results found in the literature that conclude that the volume of micropores is an important
parameter for VOC adsorption (Zhang et al., 2012). Furthermore, at low pressure the adsorption for
VOCs was fairly good in micropores compared with mesopores because of the interaction between
the attractive forces of the pore walls and the adsorbents; that could be the reason for the
breakthrough time being much longer for the sample with a high proportion of micropores (Zhang
et al., 2012).
However, the rest of the samples adsorbed a lower amount of toluene as a result of lower activation,
whereas SSPT600R2 showed low adsorption capacity for toluene in dynamic mode because of its

1 2 3 4 5 6 7 8 9 10 11 12 13 14 15 16 17 18 19 20 21 22 23 24 25 26 27 28 29 30 31 32 33 34 35 36 37 38 39 40 41 42 43 44 45 46 47 48 49 50 51 52 53 54 55 56 57 58 59 60 61 62 63 64 65
12
low microporosity. During the preparation of this sample, a very sticky mixture was obtained when
it was mixed with H3PO4, which made mixing difficult; so a poor contact between the sewage
sludge and the acid was expected. This problem could also have caused difficulties to the flow of
inert gas during the pyrolysis step. Moreover, the micropores could have been blocked as a
consequence of this (Zhang et al., 2012) or of pore wall collapse (Izquierdo et al., 2011), which
would have had negative effects on toluene adsorption.
(Insert table.5 here)
Furthermore, and in order to compare adsorption of toluene in both static and dynamic mode, the
uptake for toluene in static mode was calculated by means of the Langmuir model at a relative
pressure corresponding to 500 ppmv (P/P0=1.3×10−2) which was the initial concentration in
dynamic adsorption. The amounts adsorbed in both cases are presented in Table 5, which reveals
that the adsorbed amounts values were quite different. For SSPT600R1.5, for example, the retained
amount was 43.4 mg/g at 500 ppmv in static adsorption and about 16 mg/g in dynamic adsorption.
Equilibrium was difficult to reach in dynamic mode (De Yuso et al., 2013). The mesoporous nature
of these obtained activated carbons may also have played an important role in the large difference
between static adsorption uptake and dynamic adsorption uptake values.
(Insert figure.7 here)
(Insert table.6 here)
Figure 7 gives the SO2 breakthrough curves for samples SSPT600R1, SSPT600R1.5 and
SSPT600R2. Samples SSPT600R1 and SSPT600R1.5 showed higher breakthrough times than
sample SSPT600R2, which exhibited a less steep breakthrough curve. The amount of SO2 adsorbed
was calculated from the integration of the breakthrough curves and these values are given in Table
6. In the case of SO2 adsorption, experimental evidence exists of the need for a pore size
distribution centred at 0.7 nm (Raymundo et al., 2000). According to these researchers, SO2 uptake
is analysed considering the SO2 oxidation to SO3 as a new variable that is strongly affected by pore
size distribution. An optimum pore size exists (i.e. pore size of about 0.7 nm) in which the oxidation

1 2 3 4 5 6 7 8 9 10 11 12 13 14 15 16 17 18 19 20 21 22 23 24 25 26 27 28 29 30 31 32 33 34 35 36 37 38 39 40 41 42 43 44 45 46 47 48 49 50 51 52 53 54 55 56 57 58 59 60 61 62 63 64 65
13
of SO2 to SO3 is favoured. Pore width enlargement decreases the conversion of SO2 to SO3 and,
thus, the total amount of SO2 retained by the carbon sample. In the present case, the average
micropore size obtained by the HK method was higher than that optimum value. However, sample
SSPT600R1.5 had the nearest average pore size to this optimum value and adsorbed around 19.76
mg/g, higher than the amount of SO2 adsorbed by the other samples.
4. CONCLUSIONS
Activated carbons were obtained from sewage sludge by chemical activation with phosphoric acid.
The surface area of the activated carbons was under 300 m2/g. The activated carbons obtained were
mainly mesoporous. The impregnation ratio influenced not only the surface area but also the
porosity developed, increasing mesoporosity as the impregnation ratio increased up to pore
collapse, causing a decrease in micropores. The surface chemistry was similar for all samples
studied.
The study of gas-phase applications of activated carbons from sewage sludge was carried out using
an organic and an inorganic compound in order to screen for possible applications. Toluene
adsorption capacity was around 280 mg/g, which is a good level of performance, taking into
account the high ash content of the activated carbons. However, dynamic experiments at low
toluene concentration showed diffusional problems owing to low porosity development. SO2
adsorption capacity was associated with average micropore size, which could be controlled by the
impregnation ratio used to prepare the activated carbons.
These results show that activated carbons from sewage sludge are promising low cost adsorbents for
gas-phase application. More research should be done in order to optimize preparation, which will
improve adsorption characteristics for a specific use.

1 2 3 4 5 6 7 8 9 10 11 12 13 14 15 16 17 18 19 20 21 22 23 24 25 26 27 28 29 30 31 32 33 34 35 36 37 38 39 40 41 42 43 44 45 46 47 48 49 50 51 52 53 54 55 56 57 58 59 60 61 62 63 64 65
14
Acknowledgements
This work was carried out at Instituto de Carboquimica, Consejo Superior de Investigaciones
Científicas (ICB-CSIC), Zaragoza, Spain.
References
Anfruns, A., Martin, M.J., Montes-Moran, M.A., 2011. Removal of odourous VOCs using sludge-
based adsorbents. Chem. Eng. J. 166, 1022-1031.
Bansal, R .C., Goyal, M., 2005. Activated Carbon Adsorption. Taylor & Francis Group, New York.
Barret, E.P., Joyner, L.G., Halenda, P.P., 1951. The Determination of Pore Volume and Area
Distributions in Porous Substances. I. Computations from Nitrogen Isotherms. J. Am. Chem. Soc.
73, 373-380.
Brunauer, S., Emmet, P.H.,Teller, E., 1938. Adsorption of gases in multimolecular layers. J. Am.
Chem. Soc. 60, 309-319.
Calvo, L.F., Otero, M., Jenkins, B.M., Garcia, A.I, Moran, A., 2004. Heating process characteristics
and kinetics of sewage sludge in different atmospheres. Thermochimica Acta. 409, 127-135.
Cao, J-P., Li, L-Y., Morishita, K., Xiao, X-B., Zhao, X-Y., Wei, X-Y., Takarada, T., 2013.
Nitrogen transformations during fast pyrolysis of sewage sludge. Fuel. 104, 1-6.

1 2 3 4 5 6 7 8 9 10 11 12 13 14 15 16 17 18 19 20 21 22 23 24 25 26 27 28 29 30 31 32 33 34 35 36 37 38 39 40 41 42 43 44 45 46 47 48 49 50 51 52 53 54 55 56 57 58 59 60 61 62 63 64 65
15
De Yuso, A.M., Izquierdo, M.T., Valenciano, R., Rubio, B., 2013. Toluene and n-hexane
adsorption and recovery behavior on activated carbons derived from almond shell wastes. Fuel
Proc. Technol. 110, 1-7.
Dubinin, M.M., 1989. Fundamentals of the theory of adsorption in micropores of carbon adsorbents
– Characteristics of their adsorption properties and microporous structures, Carbon 27, 457-467.
Fonts, I., Gea, G., Azuara, M., Ábrego, J., Arauzo, J., 2012. Sewage sludge pyrolysis for liquid
production: A review. Renew. Sust. En. Rev.16, 2781-2805.
Gasco, G., Blanco, C.G., Guerrero, F., Mendez Lazaro, A.M., 2005. The influence of organic matter
on sewage sludge pyrolysis. J. Anal. Appl. Pyrol. 74, 413-420.
Grube, M., Lin, J.G., Lee, P.H., Kokorevicha, S., 2006. Evaluation of sewage sludge-based compost
by FT-IR spectroscopy. Geoderma. 130, 324– 333.
Gu, L., Zhu, N., Guo, H., Huang, S., Lou, Z., Yuan, H., 2013. Adsorption and Fenton-like
degradation of naphthalene dye intermediate on sewage sludge derived porous carbon. J. Hazar.
Mat. 246-247, 145-153.
Guo, Y., Rockstraw, D.A., 2007. Physicochemical properties of carbons prepared from pecan shell
by phosphoric acid activation. Biores. Technol. 98, 1513-1521.
Horvath, G., Kawazoe, K., 1983, Method for calculation of effective pore size distribution in
molecular sieve carbon. J. Chem. Eng. Japan. 16, 470-475.

1 2 3 4 5 6 7 8 9 10 11 12 13 14 15 16 17 18 19 20 21 22 23 24 25 26 27 28 29 30 31 32 33 34 35 36 37 38 39 40 41 42 43 44 45 46 47 48 49 50 51 52 53 54 55 56 57 58 59 60 61 62 63 64 65
16
Izquierdo, M.T., Rubio, B., De Yuso, A.M., Ballestero, D., 2011. Enhancement of nitric oxide
removal by ammonia on a low-rank coal based carbon by sulphuric acid treatment. Fuel Proc.
Technol. 92, 1362-1367.
Li, W.H., Yue, Q.Y., Gao, B.Y., Ma, Z.H., Li, Y.J., Zhao, H.X., 2011. Preparation and utilization of
sludge-based activated carbon for the adsorption of dyes from aqueous solutions. Chem. Eng. J.
171, 320-327.
Lithoxoos, G.P., Labropoulos, A., Peristeras, L.D., Kanellopoulos, N., Samios, J., Economou, I.G.,
2010. Adsorption of N2, CH4, CO and CO2 gases in single walled carbon nanotubes: A combined
experimental and Monte Carlo molecular simulation study. J. of Supercrit. Fluids. 55, 510–523.
Mahapatra, K., Ramteke, D.S., Paliwal, L.J., 2012. Production of activated carbon from sludge of
food processing industry under controlled pyrolysis and its application for methylene blue removal.
J. Anal. Appl. Pyrol. 95, 79-86.
Mansalvo, V.M., Mohedano, A.F., Rodriguez, J.J., 2011. Activated carbons from sewage sludge
Application to aqueous-phase adsorption of 4-chlorophenol. Desalination. 277, 377-382.
Otero, M., Rozada, F., Moran, A., Calvo, L.F., Garcia, A.I., 2009. Removal of heavy metals from
aqueous solution by sewage sludge based sorbents: competitive effects. Desalination. 239, 46–57.
Passe-Coutrin, N., Altenor, S., Cossement, D., Jean-Marius, C., Gaspard, S., 2008. Comparison of
parameters calculated from the BET and Freundlich isotherms obtained by nitrogen adsorption on
activated carbons: A new method for calculating the specific surface area. Microp. Mesop. Mat.
111, 517-522.

1 2 3 4 5 6 7 8 9 10 11 12 13 14 15 16 17 18 19 20 21 22 23 24 25 26 27 28 29 30 31 32 33 34 35 36 37 38 39 40 41 42 43 44 45 46 47 48 49 50 51 52 53 54 55 56 57 58 59 60 61 62 63 64 65
17
Raymundo-Pinero, E., Cazorla-Amoros, D., De Lecea, C.S.M., Linares-Solano, A., 2000. Factors
controlling the SO2 removal by porous carbons: relevance of the SO2 oxidation step. Carbon 38.
335-344.
Rozada, F., Calvo, L.F., Garcia, A.I., Martin-Villacorta, J., Otero, M., 2003. Dye adsorption by
sewage sludge-based activated carbons in batch and fixed-bed systems. Biores. Technol. 87, 221-
230.
Rozada, F., Otero, M., Moran, A., Garcia, A.I., 2005. Activated carbons from sewage sludge and
discarded tyres: production and optimization. J. Hazar. Mat. B124, 181-191.
Shafeeyan, M.S., Wan Daud, W.M.A., Houshmand, A., Shamiri, A., 2010. A review on surface
modification of activated carbon for carbon dioxide adsorption. J. Anal. Appl. Pyrol. 89 ,143-151.
Shen, W., Li, Z., Liu, Y., 2008. Surface chemical functional groups modification of porous carbon.
Recent Pat. Chem. Eng. 1, 27-40.
Sing, K., Everh, D., Haul R., Moscou, L., Pierotti, R., Rouquérol, J., Siemieniewska, T., 1985.
Reporting physisorption data for gas/ solid systems. Pure Appl Chem. 5714, 603-19.
Smith, K.M., Fowler, G.D., Pullket, S., Graham, N.J.D., 2009. Sewage sludge based adsorbents: A
review of their production, properties and use in water treatment applications. Water Res. 43, 2569-
2594.

1 2 3 4 5 6 7 8 9 10 11 12 13 14 15 16 17 18 19 20 21 22 23 24 25 26 27 28 29 30 31 32 33 34 35 36 37 38 39 40 41 42 43 44 45 46 47 48 49 50 51 52 53 54 55 56 57 58 59 60 61 62 63 64 65
18
Stuber, F., Smith, K.M., Baricot Mendoza, M., Marques, R.R.N., Fabregat, A., Bengoa, C., Font, J.,
Fortuny, A., Pullket, S., Fowler, G.D., Graham, N.J.D., 2011. Sewage sludge based carbons for
catalytic wet air oxidation of phenolic compounds in batch and trickle bed reactors. Appl. Catal.B:
Environ. 110, 81-89.
Wang, X., Liang, X., Wang, Y., Wang, X., Liu, M., Yin, D., Xia, S., Zhao, J., Zhang, Y., 2011.
Adsorption of Copper (II) onto activated carbons from sewage sludge by microwave-induced
phosphoric acid and zinc chloride activation. Desalination. 278, 231-237.
Wen, Q., Li, C., Cai, Z., Zhang, W., Cao, H., Chen, L., Zeng, G., Shu, X., Zhao, Y., 2011. Study on
activated carbon derived from sewage sludge for adsorption of gaseous formaldehyde. Biores.
Technol. 102, 942-947.
Wibowo, N., Setyadhi, L., Wibowo, D., Setiawan, J., Ismadji, S., 2007. Adsorption of benzene and
toluene from aqueous solutions onto activated carbon and its acid and heat treated forms: influence
of surface chemistry on adsorption. J. Hazar. Mat. 146, 237-242.
Zhang, F.S., Nriagu, J.O., Itoh, H., 2005. Mercury removal from water using activated carbons
derived from organic sewage sludge. Water Res. 39, 389–395.
Zhang, W., Qu, Z., Li, X., Wang, Y., Ma, D., Wu, J., 2012. Comparison of dynamic
adsorption/desorption characteristics of toluene on different porous materials. J. Environ. Sci.
24(3), 520–528.
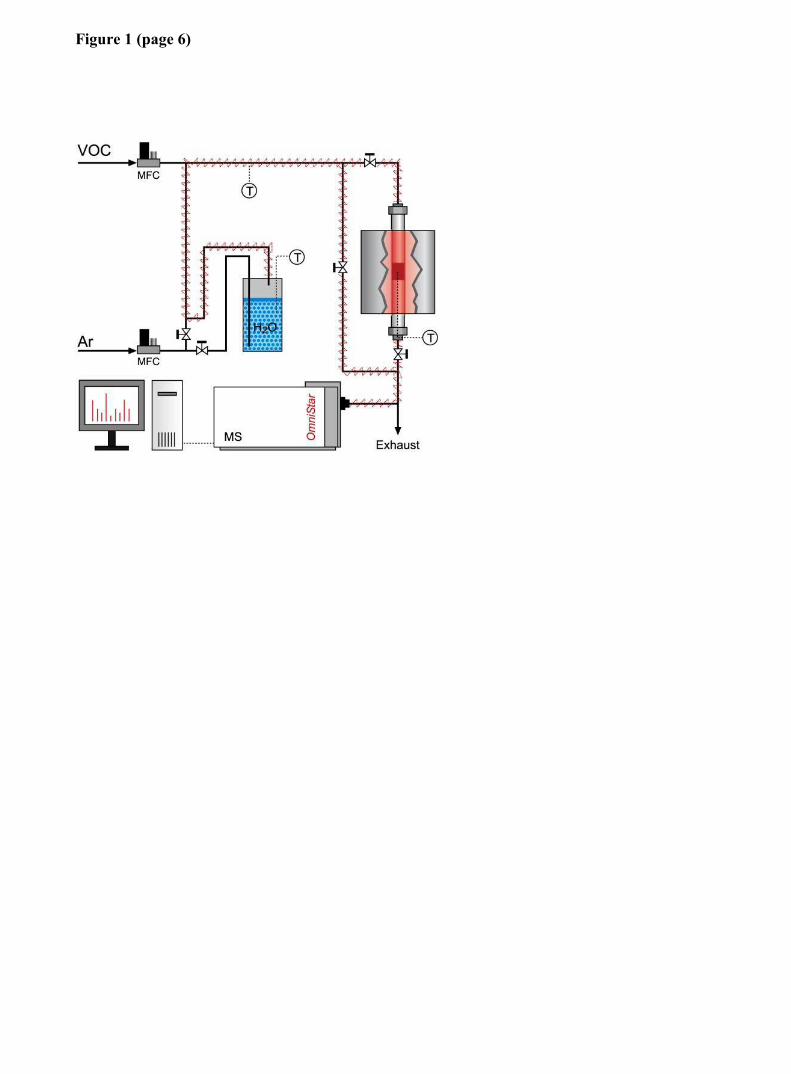
Figure 1 (page 6)
Experimental installationClick here to download Figure: Figure 1.docx

Figure 2 (page 8)
01002003004005006007008009001000
0
0.5
1
1.5
2
2.5
3
0 10 20 30 40 50
Tem
pera
ture
( °C
)
DTG
(%/m
in)
Time (min)
dm/dt
T
DTG of sewage sludgeClick here to download Figure: Figure 2.docx

Figure 3 (page 8)
0
0.1
0.2
0.3
0.4
0.5
0.6
0.7
0.8
0.9
1
0 500 1000 1500 2000 2500 3000 3500 4000 4500
Abs
orba
nce
Wave number (cm-1)
2
3
4
1- SSPT600R12-SSRAW3-SSPT600R24-SSPT600R1.5
1
FTIR spectra of sewage sludge and activated carbon samplesClick here to download Figure: Figure 3.docx

Figure 4 (page 9)
0
50
100
150
200
250
300
350
400
0 0.2 0.4 0.6 0.8 1
Qua
ntit
y A
dsor
bed
(cm
3 /g)
P/P0
SSPT600R1 -AdsorptionSSPT600R1 -Desorption
0
50
100
150
200
250
300
350
400
0 0.2 0.4 0.6 0.8 1
Qua
ntit
y A
dsro
bed
(cm
3 /g)
P/P0
SSPT600R1.25 -AdsorptionSSPT600R1.25 -Desorption
050
100150200250300350400450
0 0.2 0.4 0.6 0.8 1
Qua
ntit
y A
dsor
bed
(cm
3 /g)
P/P0
SSPT600R1.5 -AdsorptionSSPT600R1.5 -Desorption
0
100
200
300
400
500
0 0.2 0.4 0.6 0.8 1
Qua
ntit
y A
dsor
bed
(cm
3 /g)
P/P0
SSPT600R2 -AdsorptionSSPT600R2-Desorption
0
50
100
150
200
250
300
350
400
0 0.2 0.4 0.6 0.8 1
Qua
ntit
y A
dsro
bed
(cm
3 /g)
P/P0
SSPT600R0.75 -Adsorption
SSPT600R0.75 -Desorption
N2 adsorption - desorption isotherms of activated carbonsClick here to download Figure: Figure 4.docx

Figure 5 (page 10)
0
5
10
15
20
25
30
0.0 0.2 0.4 0.6 0.8 1.0
wei
ght,
% (
amou
nt a
dsor
bed
of
tolu
ene/
activ
ated
carb
on (g
/100
g)
p/p0
R0.75R1R1.25R1.5R2
Toluene adsorption isotherms of activated carbonsClick here to download Figure: Figure 5.docx

Figure 6 (page 10)
0
0,2
0,4
0,6
0,8
1
0 20 40 60 80 100
Time (min)
Dim
ensi
onle
ss c
once
ntra
tion
C/C
0
1- SSPT600R22- SSPT600R0.753- SSPT600R14- SSPT600R1.255- SSPT600R1.5
1
2
3
4
5
Toluene breakthrough curves for activated carbons Click here to download Figure: Figure 6.docx

1
Figure 7 (page 12)
0
0.2
0.4
0.6
0.8
1
0 50 100 150 200 250 300 350
Dim
ensi
onle
ss c
once
ntra
tion
C/C
0
Time (min)
1
2
1-SSPT600R22-SSPT600R13-SSPT600R1.5
3
Breakthrough curves for SO2 adsorption on samples of activated cClick here to download Figure: Figure 7.docx

FIGURE CAPTIONS
Fig.1. Experimental installation. (Page 6)
Fig.2. DTG of sewage sludge. (Page 8)
Fig.3. FTIR spectra of sewage sludge and activated carbon samples. (Page 8)
Fig.4. N2 adsorption - desorption isotherms of activated carbons. (Page 9)
Fig. 5. Toluene adsorption isotherms of activated carbons. (Page 10)
Fig.6. Toluene breakthrough curves for activated carbons (operation conditions: temperature 25ºC;
initial toluene concentration 500 ppm; total flow 30 ml/min). (Page 10)
Fig.7. Breakthrough curves for SO2 adsorption on samples of activated carbons. (Page 12)
FigureClick here to download Figure: Figures captions.docx

Table 1. Characterization of the starting sewage sludge and activated carbons. (page 7)
Proximate Analysis
wt %
Ultimate Analysis
wt %
Samples Humidity Ash Volatile Fixed C C H N S Oa
SS as received 6.98 47.51 42.66 2.85 24.45 3.33 3.25 0.53 68.44
Dried SS 0.00 51.08 45.86 3.06 26.28 2.74 3.49 0.57 66.92
SSPT600R0.75 28.11 1.85 2.03 0.33 67.86
SSPT600R1 29.03 1.45 2.36 0.28 66.88
SSPT600R1.25 32.16 1.42 2.12 0.15 64.15
SSPT600R1.5 34.04 1.02 2.02 0.18 62.74
SSPT600R2 36.64 1.96 2.24 0.30 58.86
% H includes the H of water (humidity). a Oxygen content obtained by difference.
Characterization of the starting sewage sludge and activated carClick here to download Table: Table 1.docx

Table 2. Textural properties of the activated carbons. (page 10)
SamplesSBET
a
m2/g
Vmicrob
cm3/g
VPc
cm3/g
Vmesod
cm3/g
dpe
nm
SSPT600R0.75 240 0.089 0.585 0.577 0.95
SSPT600R1 259 0.097 0.633 0.585 0.95
SSPT600R1.25 278 0.116 0.613 0.565 0.91
SSPT600R1.5 296 0.113 0.951 0.575 0.88
SSPT600R2 230 0.077 0.812 0.857 1.12
a BET surface area
b volume of micropores, DR method
c volume of pores at p/p0=0.95
d volume of mesopores, BJH method
e average pore diameter, HK method
Textural properties of the activated carbonsClick here to download Table: Table 2.docx

Table 3. Langmuir isotherm parameters for toluene on obtained activated carbons. (page 10)
SamplesWm
mmol/g
Wm
mg/g
K
cm3/gR2
SSPT600R0.75 2.43 224 0.44 0.98
SSPT600R1 2.44 226 0.47 0.98
SSPT600R1.25 2.71 250 0.51 0.99
SSPT600R1.5 2.94 271 0.50 0.99
SSPT600R2 3.08 284 0.50 0.98
Langmuir isotherm parameters for toluene on obtained activated cClick here to download Table: Table 3.docx

Table 4. Amount of toluene adsorbed and breakthrough time in dynamic experiments for activated
carbons. (page 11)
SamplesBreakthrough time
min
Saturation time
at
C/C0=0.9
min
Qdyn
mg/g
SSPT600R0.75 26 60.65 10.72
SSPT600R1 24 84.44 12.21
SSPT600R1.25 30 72.85 11.96
SSPT600R1.5 33 96.78 15.58
SSPT600R2 25 59.23 10.24
Amount of toluene adsorbed and breakthrough time in dynamic expeClick here to download Table: Table 4.docx

Table 5. Comparison between static and dynamic adsorption of toluene. (page 12)
Samples
Static (P/P0= 0.9)
Wm
mg/g
Static (P/P0= 1.3×10⁻²)
W
mg/g
Dynamic (C0=500 ppm)
Qdyn
mg/g
SSPT600R0.75 223.92 32.15 10.72
SSPT600R1 224.84 34.53 12.21
SSPT600R1.25 249.72 41.01 11.96
SSPT6001.5 270.92 43.44 15.58
SSPT600R2 283.82 46.06 10.24
Comparison between static and dynamic adsorption of tolueneClick here to download Table: Table 5.docx

Table 6. SO2 adsorbed amount by activated carbons. (page 12)
SamplesBreakthrough time
min
Qdyn
mg/g
SSPT600R1 65 11.89
SSPT600R1.5 83 19.76
SSPT600R2 16 9.58
SO2 adsorbed amount by activated carbonsClick here to download Table: Table 6.docx