SEWAGE TREATMENT PLANT
129
1 1. Introduction CHAPTER-I 1.1 General Water, food and energy securities are emerging as increasingly important and vital issues for India and the world. Most of the river basins in India and elsewhere are closing or closed and experiencing moderate to severe water shortages, brought on by the simultaneous effects of agricultural growth, industrialization and urbanization. Current and future fresh water demand could be met by enhancing water use efficiency and demand management. Thus, wastewater/low quality water is emerging as potential source for demand management after essential treatment. An estimated 38354 million liters per day (MLD) sewage is generated in major cities of India, but the sewage treatment capacity is only of 11786 MLD. Similarly, only 60% of industrial waste water, mostly large scale industries, is treated. Performance of state owned sewage treatment plants, for treating municipal waste water, and common effluent treatment plants, for treating effluent from small scale industries, is also not complying with prescribed standards. Thus, effluent from the treatment plants, often, not suitable for household purpose and reuse of the waste water is mostly restricted to agricultural and industrial purposes. Wastewater- irrigated fields generate great employment opportunity for female and male agricultural laborers to cultivate crops, vegetables, flowers, fodders that can be sold in nearby markets or for use by their livestock. However, there are higher risk associated to human health and the environment on use of wastewater especially in developing countries, where rarely the wastewater is treated and large volumes of untreated wastewater are being used in agriculture. Sewage is a major point source of pollution. The target of “NirmalDhara” i.e. unpolluted flow can be achieved if discharge of pollutants in the river channel is completely stopped. Also, sewage can be viewed as a source of water that can be used for various beneficial uses including ground water recharge through surface storage of treated water and/or rain/flood water in an unlined reservoir. This may also help achieving “AviralDhara”. In order to reduce substantial expenditure on long distance conveyance of sewage as well as treated water for recycling, decentralized treatment of sewage is advisable. As a good practice, many small sewage treatment plants (STP) should be built rather than a few of very large capacity. All new developments must build in water recycling and zero liquid discharge systems. Fresh water intake should be restricted only to direct human‐contact beneficial uses of water. For all other uses properly treated sewage/wastewater should be used wherever sufficient quantity of sewage is
-
Upload
independent -
Category
Documents
-
view
1 -
download
0
Transcript of SEWAGE TREATMENT PLANT

1
1. Introduction CHAPTER-I
1.1 General
Water, food and energy securities are emerging as increasingly important and vital
issues for India and the world. Most of the river basins in India and elsewhere are
closing or closed and experiencing moderate to severe water shortages, brought on
by the simultaneous effects of agricultural growth, industrialization and
urbanization. Current and future fresh water demand could be met by enhancing
water use efficiency and demand management. Thus, wastewater/low quality water
is emerging as potential source for demand management after essential treatment.
An estimated 38354 million liters per day (MLD) sewage is generated in major cities
of India, but the sewage treatment capacity is only of 11786 MLD. Similarly, only
60% of industrial waste water, mostly large scale industries, is treated. Performance
of state owned sewage treatment plants, for treating municipal waste water, and
common effluent treatment plants, for treating effluent from small scale industries, is
also not complying with prescribed standards. Thus, effluent from the treatment
plants, often, not suitable for household purpose and reuse of the waste water is
mostly restricted to agricultural and industrial purposes. Wastewater- irrigated
fields generate great employment opportunity for female and male agricultural
laborers to cultivate crops, vegetables, flowers, fodders that can be sold in nearby
markets or for use by their livestock. However, there are higher risk associated to
human health and the environment on use of wastewater especially in developing
countries, where rarely the wastewater is treated and large volumes of untreated
wastewater are being used in agriculture. Sewage is a major point source of
pollution. The target of “NirmalDhara” i.e. unpolluted flow can be achieved if
discharge of pollutants in the river channel is completely stopped. Also, sewage can
be viewed as a source of water that can be used for various beneficial uses including
ground water recharge through surface storage of treated water and/or rain/flood
water in an unlined reservoir. This may also help achieving “AviralDhara”. In order to
reduce substantial expenditure on long distance conveyance of sewage as well as
treated water for recycling, decentralized treatment of sewage is advisable. As a good
practice, many small sewage treatment plants (STP) should be built rather than a few
of very large capacity. All new developments must build in water recycling and zero
liquid discharge systems. Fresh water intake should be restricted only to direct
human‐contact beneficial uses of water. For all other uses properly treated
sewage/wastewater should be used wherever sufficient quantity of sewage is

2
available as source water for such purposes. All new community sanitation systems
must adopt recycling of treated water for flushing and completely isolate fecal matter
until it is converted into safe and usable organic manure. The concept of
decentralized treatment systems and water/wastewater management will be
covered in detail in subsequent reports.
1.2 Purpose of Selection of this project
Bharuch is one of the historical towns in Gujarat state and is as district head quarter.
This very old town was mentioned in historical records nearly 2000 years ago. The
industrial activity in the town dates back to the 17th century when the English and
Dutch established factories here. In fact Bharuch is one of the oldest cities in India
and was a flourishing port in earlier times. Bharuch was also very important to the
sultans and other Muslim rulers who ruled Gujarat. It is an important place of
pilgrimage. Later on with construction of Dutch colony at Bharuch it has grown
significantly over decades.
With the expansion of Bharuch city there is rapid expansion of population too.
Previously there was less population so there was no need of waste water treatment
plant, but looking to the present scenario it became very important for govt. body to think
about it. As per 2011 census data the population was 15, 51,019 and it is growing every
year at the rate of 2.5% - 3.0% annually. at present, average daily water supply is 20
MLD in Bharuch municipality out of this 6 MLD from ground water and 16 bulk
purchase of raw water, out of this total water supply Bharuch supply 1.5 MLD to
outgrowth areas having river Narmada right at the edge of this city can benefit to its
people a lot if the river water use is effectively and economically. When we talk about
utilizing the river water the first question comes out of a sudden blink is that, how
about the water that we used?? Well, for that we at 7th sem. project work decided to
take upon the topic of “Planning & Designing of waste water treatment plant for
Bharuch City regulated by Bharuch Nagarpalika” With the implementation of this
project we can reuse & recycle the water consumption effectively and efficiently also
keeping the environment in mind.

3
1.3 Necessity of treating Waste Water
There is tremendous increase in the population of Bharuch city since last 10 years.
There has been a considerable increase in population due to migration, urbanization
and industrialization. With the increase in the volume of population there has also
been increase in land use also. Along with it, there rose the need for water supply too.
It is good that the population of Bharuch city has some natural resource right as its
neighbor, so that the ever ending resource can be met easily whenever & however.
Every day we consume water supplied to us by Municipal authorities to us. We utilize
it, but very few think about the succeeding step or next step. One easily walks out of
bathroom after finishing bath or washing utensils.
In the same way the clean palatable & potable water is also supplied to hospitals,
Industries big refractory. They utilize it and then dispose the water directly to the
river without thinking for even once.
All this cause a great damage and creates a negative impact on environment. There is
life ab0ve water and another below to it. We humans try to keep one side intact by
damaging other. We all in our unawareness fall in the same ecological cycle, which
shows us that we have to be dependent on each other to sustain. River Narmada can
unpollute all the wastes that have been discharged into it. But it will take decades to
go. So, it became important rather necessity to establish or construct waste water
treatment plant for the conservation and preservation of natural resource.

4
2. Literature Review
Jillies and Kushwaha (1990) reported that liquid digested sludge can be used as
soil amendment to provide low cost fertilizer and improve tilth. Dried digested
sewage sludge was mixed with soil in test plot near Saskatoon, Canada at application
rate of 75 tones sludge/hectare. The plots were irrigated with decent water from the
sludge drying bed.
Tripathi and Dwivedi (1990) reported that the effect of irrigation with raw urban
sewage effluents mixes with industrial effluents, treated sewage effluents and tube
well water potato yield plant and soil heavy metal content was studied in a field
experiment at Banaras Hindu university, Varanasi. Very low concentrations of heavy
metals were observed in rubbers from the raw sewage irrigation treatment, although
Cu, Zn, Fe in soil increased.
Korentajer (1990) reported the application of sewage sludge on agricultural land
may provide an economical way to dispose of the increasing amount of sludge
application may be limited by its potential health.
Hundal and Sandhu (1992) reported that soil sample at varying distance along the
sewage from three tiers of field sewage waste water irrigated and tube well irrigated
were collected and analyzed for total and DTPA extractable toxic metal content.
Maiti et al. (1992) reported that the sewage effluent and sludge of Calcutta city was
made to assess their manorial values. Sewage were natural to slightly alkaline in
reaction and contained high level basic tons, particularly in winter, bicarbonate and
chloride Ions were at toxic levels. Although sewage effluents and slugged were rich in
nutrient the toxicity levels.
Welch et al. (1992) reported the zinc movement in sludge treated soils as
influenced by soil properties water quality and soil moisture level.
Hundal et al (1993) reported that the surface soil samples were collected from field
along a sewage drains which were irrigated with sewage effluents sewage effluents
plus tube well water or tube well water and their chemical properties were
investigated. Zinc and copper contents increased 3 and 8 times respectively in the
sewage effluents treated soils reaching toxic levels to plants.

5
Azad (1995) reported that the fate of Fe in sewage wastewater irrigated soil was
investigated in Punjab India. Total Fe content of normally irrigated soil ranges from
1.4-3.2% in the 0-15 cm layer with mean value of 2.03% in soils receiving sewage
wastewater total Fe ranges from 2.2-4.1% with an average value 2.78% which was
36.9% higher than in normal soils.
Mathan (1995) reported that the study conducted in a sewage farm of the Madurai
Corporation in India to compare the effect of sewage effluent properties. The soil was
sandy loam and had been irrigated for 10-15 years. Soil irrigated by canal fed well
water had the highest bulk density.
Kuba et al. (1997) examined the role of denitrifying phosphorus removing bacteria
(DPB) in wastewater treatment plants using batch tests with activated sludge from
two plants in the Netherlands. DPBs appeared to be of little importance in one plant,
but contributed substantially to P removal in the other
Singh and Varloo (1997) studied the accumulation and bioavailability of metals in
semi arid soil irrigated with the sewage effluent, the sewage had slightly lower pH
but higher organic carbon as compared to those receiving irrigation with tube well
water.
Antil et al. (1998) reported that the raw sewer water sample was collected from
various Sewer disposal sites in Haryana India where these waste water are directly
used for irrigating the crops. The chemical composition of sewer water varied from
site to site. The physicochemical properties DTPA extractable and total macro and
micronutrients and toxic the composition metals icons (CD,Ni) varies according to
composition of the sewer water.
Wiger and Hamedi (1999) reported that accumulation and mobility heavy metals
in soils irrigated with sewage effluent in Haryana India.
Bednared and Tkaczy (1999) reported that the influence of treated municipal on
occurrence of soluble form of phosphorous potassium and magnesium in peat muck
soil. Municipal sewage did not change in reaction and value of hydrolytic acidity.
Treated municipal sewage caused contents of soluble potassium in upper layer (0-
20) of soil.
Joshi and Pathak (2000) reported that the effect of sewage assessing the effect if
sewage application on sewage application on soil properties identified the problem.

6
Song et al. (2002) using thermodynamics, modeled the effects of P and Ca
concentration, pH, temperature, and ionic strength on theoretical removal.
Tchobanoglous et al (2003) Chemical precipitation has long been used for P removal. The chemicals most often employed are compounds of calcium, aluminum, and iron. Bradford et al. (2003) In the villages near Hubli-Dharwad in Karnataka, the main
wastewater irrigated agro forestry land uses are orchards and agrosilviculture which
consists of spatially mixed tree–crop combinations.
Zeng et al. (2004) High phosphate removal (> 95% in 10 min, batch system) was
obtained from a 33 mg/L P solution, but direct applicability to wastewater treatment
(lower concentrations, possible interferences) was not investigated. The gas
concrete’s removal efficiency can be regenerated at low pH, with the resulting
concentrated phosphate solution potentially a source of recycled phosphate.
Similarly, iron oxide tailings were found to be effective for phosphorus removal from
both pure solutions and liquid hog manure
Chattopadhyay (2004) The East Calcutta sewage fisheries are the largest single
wastewater use system in aquaculture in the world. The wetland ecosystem of
Kolkata supports 100,000 direct stakeholders and 5,100 ha of cultivation. Annually, it
provides direct employment for about 70,000 people, produces 128,000 quintals of
paddy, 69,000 quintals of fish and 7.3 quintals of vegetables.
Neethling et al. (2005) examined the factors that influence the reliability of EBPR in
full- scale plants. They concluded that P “concentrations <0.1 mg/L can be achieved
for extended periods (more than a month), 0.03 mg/L for a week, and even below
0.02 mg/L for several sequential days. Excursions above these levels are common.” A
sufficient BOD/P ratio (>25:1) is one requirement for reliable high removal
efficiencies. This might be achieved by BOD augmentation through fermentation or
addition of a fermentable substrate. Control of recycle streams is also necessary, so
that they do not bring too much P back to the EBPR process. They also concluded that
while GAOs can be problematic, their presence does not preclude good P removal.
Mekala (2006) In Hyderabad, along the Musi River about 10,000 ha of land is
irrigated with wastewater to cultivate Para grass, a kind of fodder grass.
Randall (2006) discussed the use of carbon augmentation in EBPR. Short chain
volatile fatty acids (VFAs), particularly acetic and propionic acids, are most desirable.

7
Some carbon sources, such as some sugars and alcohols, may lead to production of
GAOs, bulking, or excessive exocellular polymer production. VFAs may be generated
in the sewer system, arise from industrial discharges, be added directly, or be
generated on-site. For many plants, on-site generation in the anaerobic zone may be
sufficient. Alternatively, fermentation of the primary sludge, primary effluent, or
some of the activated sludge might be practiced. In the PhoStrip process,
fermentation also occurs in the stripping tank.
Reardon (2006) reported on several plants achieving <0.1 mg/L TP in their effluent,
and suggested the current reliable limits of technology are 0.04 mg/L for MBRs and
tertiary membrane filtration, and 0.008 mg/L for RO.
Reardon, (2006) in plants with EBPR the P content is even higher. Thus sand
filtration or other method of TSS removal (e.g., membrane, chemical precipitation) is
likely necessary for plants with low effluent TP permits.
Strom, (2006) Assuming that 2-3% of organic solids is P, then an effluent total
suspended solids (TSS) of 20 mg/L represents 0.4-0.6 mg/L of effluent P
Neethling and Gu, (2006) Chemical addition points include prior to primary
settling, during secondary treatment, or as part of a tertiary treatment process.
Neethling and Gu, (2006) the process is more complex than predicted by laboratory
pure chemical experiments, and that formation of and sorption to carbonates or
hydroxides are important factors. In fact, full-scale systems may perform better than
the 0.05 mg/L limit predicted.
Strom, (2006) Use of alum after secondary treatment can be predicted to produce
much less sludge, but the increase could still be problematic.
Moller (2006) reported on an iron reactive filtration system achieving <0.01 mg/L
TP at a 1.2 MGD (average flow) plant. Woodard (2006) described a magnetically
enhanced coagulation process that may achieve <0.03 mg/L TP based on long term
pilot tests.
James Barnard (2008) developer of the Bardenpho process, recently moderated a
session on the capabilities and constraints of EBPR, and discussed the requirements
for achieving effluent P concentrations <0.1 mg/L. He emphasized the need for
production of volatile fatty acids by fermentation in order to assure their availability
for the PAOs. Some of the factors contributing to the difficulty of achieving very low

8
levels of both N and P simultaneously were pointed out, including secondary release
of P in anoxic zones. The need to select for PAOs over the competing glycogen
accumulating organisms (GAOs) was also discussed, with the following factors
favoring GAOs: high sludge age, high temperature, longer un-aerated detention times,
stronger wastes with low organic N, polysaccharides fed to the anaerobic zone, and
low pH.
Narayanan (2009) There is some concern about the effects of solids management
processes and returns side streams on the ability to remove P to low levels.
Processes that destroy organic material (such as digestion) have the potential to
release the particulate organic-P present as soluble organic or inorganic P. In
particular, anaerobic conditions are likely to release soluble P from EBPR sludge and
iron precipitates (ferrous phosphate is much more soluble than ferric phosphate).
Any released P may then be returned to the main wastewater treatment process in
high concentrations through recycle side streams, thus requiring removal a second
time. Non-continuous processes may also lead to variable loadings from side
streams.

9
3. Patent Search Analysis Report
3.1 Bio-augmentation composition and use thereof for improving efficiency of effluent treatment in hydrocarbon processing plant
Their study stated that a bio-augmentation composition for improving the
hydrocarbon degradation efficiency of effluent treatment plant for hydrocarbon
degradation in wastewater generated from hydrocarbon processing industry and a
method thereof. The composition comprises a synergistic combination of selective
microorganisms to develop a consortium enabling effective degradation of
hydrocarbons present in wastewater and converting thereof into harmless and
environment friendly substances. The invention also provides for the said
microorganisms and their isolations
3.2 A water clarifier
According to their invention, it comprises a chamber (C) accommodating a plurality
of spaced plates (P), placed one against the other, each plate having an aperture (A)
at the center, the plates (P) fully spanning the chamber (C); a grill (G) fixed, at an

10
inclination, to each piate (P), over the aperture (A), for enabling the water, required
to be clarified, to pass there through and cause the solids in the water to be
separated, while the space (S) between the plates (P) creates a turbulence in the
water as it passes from one grill (G) to another, the turbulence simultaneously
flocculating the water in the said space (S); an inlet for the entry of the water to be
clarified into the chamber (C), and an outlet for the exit of the clarified water from
the chamber (C).
3.3 An apparatus for removing solid particles from a liquid
An apparatus for removing solid particles from a liquid, comprising: a round shell
having an inlet located within said shell and an outlet located within said shell, said
outlet being elevated from said inlet, said shell deforming a particle extraction area;
an outlet fume extending from said outlet and having a floor overhanging at least a
portion of the particle extraction area; and a particle collection area located centrally
of said particle extraction area; wherein said inlet comprises a vertical inner wall
that extends upwardly a distance within said shell so as to direct liquid tangentially
into said shell and preclude communication between the liquid in the inlet and the
liquid in the particle extraction area.

11
3.4 Scraper Raising system
This invention relates to the scrapper raising system of settling tanks. The scrapper
- raising system for a settling tank comprising a vertical suspension having an
upper member and lower member wherein said upper member is rigidly fixed to a
rotating bridge of the settling tank and said lower member is pivotally adapted to
the upper member, a scrapper connected to the lower member, and a lifting means
attached at or near the lower end of the lower member for raising and lowering the
scrapper wherein said lifting means raises the scrapper in a direction substantially
orthogonal to thrust developed by the scrapping force of the scrapper.
3.5 Self-sustained bio-digester for onboard degradation of human waste
This invention relates to the field of human waste handling, treatment and disposal in mobile public carriers. In particular the invention is directed to a self- sustained bio- digester for onboard degradation of human waste. Said bio-digester comprising

12
at least three components; biological treatment component, chemical treatment component; and non-biodegradable materials elimination component
3.6 A biogas digester cover with brackets
A biogas digester cover with brackets, includes: a cover body with a gas nozzle,
wherein: at least two brackets for fixing the cover body inside the opening of the
digester are provided on the lower edge of the cover body. The biogas digester
cover with brackets of the present invention is scientific in design, reasonable in
structure, and convenient in application. By making use of the brackets that are
installed around the opening of the cover body, the gas cover can be handily fixed
inside the opening of the digester with pins. Not only does the present invention
have the functions of the removable gas covers in prior art and satisfy the
requirements of normal use, but also overcomes the defects of the removable gas
covers in the prior art, such as overall strict requirements of material, high
production cost and short life-span. The present invention is a removable gas cover
that better satisfies the application requirements.

13
4. Bharuch Town Profile
4.1 Town Profile
Bharuch town is the headquarters of Bharuch district and one of the historical towns
in Gujarat state and is as District Head Quarter. This very old town was mentioned in
historical records nearly 2000 years ago. The industrial activity in the town dates
back to the 17th century when the English and Dutch established factories here. In
fact Bharuch is one of the oldest cities in India and was a flourishing port in earlier
times. The oldest dockyard in the country was developed in this town for import and
export of precious stones available in the region.
Bharuch was once but a small village on the banks of the Narmada River but that
rivers inland access to central and northern India and with a location in the sheltered
Gulf of Khambat in the era of coastal sea travel grew and prospered as a trading
transshipment centre and ship building port. Until very modern times the only
effective way to move goods was by water transport, and Bharuch had sheltered
waters in a era without weather forecasting, compasses, and when shipping was
necessarily limited to coastal navigation, and the general East-West course of the
Narmada gave access to the rich in land empires at the upper reaches of the
Narmada, including easy caravan access to the Ganges valley and Delhi plain,
4.2 Geography
Topographic Map of India, clearly showing the rare West to East access given to the
North and Central river line valleys by the Narmada River from Bharuch. The
Narmada River outlets into the Gulf of Khambat through its lands and that shipping
artery gave inland access to the kingdoms and empires located in the central and
northern parts of the subcontinent of India. Level of difference of the city is from 33
m to 5 m in city.
4.3 History and Culture of Bharuch
This Bharuch is one of the historical towns in Gujarat state and is as District Head
Quarter. This very old town was mentioned in historical records nearly 2000 years
ago. The industrial activity in the town dates back to the 17th Century when the
English and Dutch established factories here. In fact Bharuch is one of the oldest
cities in India and was a flourishing port in earlier times. The oldest dockyard in the
country was developed in this town for import and export of precious stones
available in the region. Bharuch was also very important to the sultans and other
Muslim rulers who ruled Gujarat. There is an ancient mosque called Masjid-U-Jani in

14
Bharuch. It is an important monument to study Islamic Architecture in Gujarat.
Shukaltirth and Kabirvadare two important picnic spots which are located at a
distance of 16 and 18 Kms. respectively from Bharuch. On Janmastami, huge fairs are
organized here. At present, there is a temple of Lord Shiva located near the Sardar
Bridge built on river Narmada near Jhadeshwar on the eastern part of Bharuch. It is
an important place of pilgrimage. Devotees flock this place during the month of
Shravan. The Golden bridge constructed by British ruler, is famous engineering
structure of Bharuch. The first British colony was established in Bharuch in 1616 and
then in 1617, the Dutch colony was established. Thereafter, Aurangzeb built a strong
protective wall around the city and gave it the name Shukabad. In 1772, it came
under the British Rule.
Bharuch has been situated at Narmada river so it has nos. of religious place within it
including temples, churches, mosques, Jain shrines &Parsi Agiyari. Temples like
Kotilingeshwar Mahadev, Kapileshwar mahadev, Mota Baliyadev, these temples are
not very old. In Dandia bazaar Swaminarayan temple was built in V.S. 1891 (A.D.
1835), it was built up in memory of Sahjanand Swami. In the middle of the town
there is a temple of Bhrugu Bhargeshwar which is known as Nava Dera, houses
Vaishnav Haveli of Narayan Dev. In Ali area, famous temple of Sindhavai Mata is
situated. Behind Sewashram there is an ancient temple of Nilkanth Mahadev and it is
believed that it was constructed in 19th century. Near Pakhali Ovara area, a famous
temple of Kamnath Mahadev and here nine planets‟ statues are there, so it is also
famous as a “Nine planets temple”
Besides above places mention, the other heritage monuments which exist in Bharuch
city are:
a) Grave of Sufi –Saint “Dada Rehan”
b) Ancient Farsi stone with inscriptions of Umad-Ui-Mulk
c) Fort of King Siddhraj Jay Sinhji – constructed during the Solanki period (1094 to
1143)
d) 400 year old LalluChowk’s Haveli famous for its wooden carvings.
The temple of 4 Veds (oldest sacred books of the Hindus) – Ruguvved, Atharvved,
Yajurvved, Samved and the only temple having the statues of four Veds with
iconography In Bharuch city the Jain shrines of Kavi, Gandhar and Zagia are situated.
Bharuch city Jama Masjid which was founded in 1326 AD is still in existence and near
civil hospital there is mosque founded by Murtazkhan in the year 1609 AD is also in
existing with good wooden columns and the windows having wooden carvings. In

15
Bharuch city, Parsi people have noticeable population and for their prayer and
worship purpose there are seven Agiyaris in the town. Among all seven Agiyaris,
Pestanji‟sagiyari is the oldest.
In the year 1814, Roman Catholic Church scent was founded, called “Our lady of
Health”, this was destroyed in the year 1860 and the same Church was reconstructed
in the year 1887. In the year 1856, Protestant people had founded their church.
4.4 City Map
Fig.1 Bharuch City Map

16
5. Present Scenario Of Bharuch city
It is absolutely necessary to go for establishing Sewage Treatment Plant to upgrade
the status of sanitation of the municipality area from the consideration of health
ground. As in Bharuch town, there is no underground drainage system in city and the
system of septic tanks and soak pits for latrines in the household is being used for the
disposal of sludge at the household level. For slum areas, the toilets having low cost
sanitation are being provided by constructing the soak pits and septic tanks and the
subsidy provided by the municipality.
The amount of sewage generated in Bharuch is about 37.91 MLD i.e. approximately
80% of the daily water supply of 47.41 MLD. At present Bharuch city has no
sewerage system and most of the houses have their own septic tanks and soak pits.
Most of which are located below the road levels in gametal areas. The existing
sewerage system in Bharuch city is open and unhygienic within the city and having
high population density. Due to presence of black cotton soil, the permeability is low
hence over flow from the septic tanks and soak pits is common problem. The flow
from these soak pits is discharged into the nearby natural nalla (ravine) and finally
the untreated wastewater is directly flowing into the river Narmada. The undulating
topography of gametal area, the sewage water and sludge is not effectively drained
off. The natural drains passing through the city get filled up during the development
process and together with storm water; and also the drainage problem turns out to
be a major issue during the rainy season. During rainy seasons the water overflows
on the roads, which are already uneven, the traffic movement is greatly affected and
damages to the properties also occur in gametal area. Due to the unhygienic disposal
of sewage, mosquito / flies nuisance is prevailing in most of the areas. The Bharuch
municipality is constructing the open drain system for disposal of sewage water in
gametal area. The rubbish of the city and human excreta are disposed off outside the
city through night soil tankers. There are 327 public latrines in different areas of the
city.
17
6. Waste water Treatment
The principal objective of wastewater treatment is generally to allow human and
industrial effluents to be disposed of without danger to human health or
unacceptable damage to the natural environment. However, some degree of
treatment must normally be provided to raw municipal wastewater before it can be
used for agricultural or landscape irrigation or for aquaculture. The quality of treated
effluent used in agriculture has a great influence on the operation and performance
of the wastewater-soil-plant or aquaculture system. In the case of irrigation, the
required quality of effluent will depend on the crop or crops to be irrigated, the soil
conditions and the system of effluent distribution adopted. Through crop restriction
and selection of irrigation systems which minimize health risk, the degree of pre-
application wastewater treatment can be reduced.
6.1 Composition of waste water and its effect Domestic Wastewater (from homes, offices, hotels, institutions) comprises sewage
(human waste) and grey-water from bathrooms, kitchens, laundries.
Industrial Wastewater is the liquid discharge from manufacturing processes; for
example soft drink and beer companies; sugar processing; metal processing; photo
finishing.
Waste water is a mixture of wastes from industrial, domestic, pharmaceutical, hotels
and commercial areas.
The Composition of sewage refers to the actual amount of various constituents of
waste water. The composition of waste water largely depends on the source from
which it is obtained. Those compositions of domestic sewage which comprises spent
water from kitchen, bathroom, laboratory, etc. will be different from that of
industrial sewage which in turn will depend on the type of industry. Moreover,
depending on the concentration of various constituents, the domestic sewage maybe
classified as strong, medium an weak. Table 4.1 shows typical composition of
untreated domestic sewage. Both the constituents and the concentration vary with
the hour of the day, the day of the week, the month of the year and other local
conditions. Therefore their data in table below, is only to serve only as a guide and
not as a basis for a design.

18
Table 1: Typical Composition of Untreated Domestic Sewage
They are composed of Biological, Chemical & Physical wastes constituting various
toxic substances and harmful chemicals.
Constituent Concentration
Strong Medium Weak
1. Solids, total: (mg/l)
Dissolved , total (mg/l)
Fixed (mg/l)
Volatile (mg/l)
Suspended, total (mg/l)
Fixed (mg/l)
Volatile (mg/l)
1200
850
525
325
350
75
275
720
500
300
200
220
55
165
350
250
145
105
100
20
80
2. Settleable solids (mg/l) 20 10 5
3. Biochemical oxygen demand,
5-day, 20.c, (BOD520.c)
(mg/l)
400
220
110
4. Total organic carbon (TOC) (mg/l) 290 160 80
5. Chemical oxygen demand (COD) (mg/l) 1000 500 250
6. Nitrogen, total as N: (mg/l)
Organic (mg/l)
Free ammonia (mg/l)
Nitrites (mg/l)
Nitrates (mg/l)
85
35
50
0
0
40
15
25
0
0
20
8
12
0
0
7. Phosphorus, total as P: (mg/l)
Organic (mg/l)
Inorganic (mg/l)
15
5
10
8
3
5
4
1
3
8. Chlorides (mg/l) 100 50 30
9. Alkalinity (as CaCO3) (mg/l) 200 100 50
10. Grease 150 100 50

19
6.2 Characteristics of waste water
Table 2: Physical, Chemical and Biological Characteristics of Sewage and their
Sources
Characteristic Sources
1. Physical properties:
Colour
Odour
Solids
Temperature
Domestic and industrial wastes, natural decay of organic
materials
Decomposing wastewater, industrial waste
Domestic water supply, domestic and industrial wastes, soil
erosion, inflow-infiltration
Domestic and industrial wastes
2. Chemical constituents:
(a) Organic
Carbohydrates
Fats, oils and
grease
Pesticides
Phenols
Proteins
Surfactants
Others
(b) Inorganic
Alkalinity
Chlorides
Heavy metals
Nitrogen
Ph
Phosphorus
Sulphur
Toxic compounds
(c) Gages:
Hydrogen sulphide
Domestic, commercial and industrial wastes
Domestic, commercial and industrial wastes
Agricultural wastes
Industrials wastes
Domestic and commercial wastes
Domestic and industrial wastes
Natural decay of organic materials
Domestic wastes, domestic water supply, groundwater
infiltration
Domestic wastes, domestic water supply, groundwater
infiltration
Industrial wastes
Domestic and agricultural wastes
Industrial wastes
Domestic and industrial wastes, natural runoff
Domestic wastes, domestic water supply, industrial wastes
Industrial wastes
Decomposition of domestic wastes

20
Methane
Oxygen
Decomposition of domestic wastes
Domestic water supply, surface water infiltration
3. Biological constituents:
Animals
Plants
Protista
Viruses
Open watercourses and treatment plants
Open watercourses and treatment plants
Domestic wastes, treatment plants
Domestic wastes
Table 3: Components of waste water characteristics
Main components of waste water characteristics
Physical-Chemical Parameters Importance
Temperature ̊C Affects chemical reactions and reaction rates. Low temperature affects bacterial growth.
Turbidity pH Affects chemical biochemical reactions as biological activities
pH
Turbidity Due to presence of colloidal matter. When high SS concentration present in WW, it could be resistant to removal when treating under anaerobic conditions..
Suspended Solids
Hydrolysis of suspended solids may be the rate limiting step under anaerobic conditions especially at low temperatures. They also cause disintegration of granular sludge and results in lower methanogenic activity.
Particle Size Distribution Affects conversion kinetics of the suspended solids
Polymeric Constituents (COD)
They consist mainly of carbohydrates, constituents’ proteins and lipids and should be removed with treatment. They constitute. The main part of the COD of wastewater.

21
Refractory organics
These compounds tend to resist conventional wastewater treatment. Typical examples are surfactants, phenols and agricultural pesticides. The presence of surfactants also affects stabilization of colloids and the surface properties of particles.
Priority Pollutants
Organic and inorganic compounds selected on the basis of their known or suspected carcinogenic, high acute toxicity. Many of these compounds are found in wastewater.
Sulphate High concentration causes inhibition of methanogenesis.
Chloride It may have an impact on the final use of treated wastewater.
Heavy Metals Toxic to bacterial impact on environment.
Nutrients Macro (N,P,K) and micronutrients
Important for biological treatment processes.
Biological parameters Includes pathogenic microorganisms, and all other organisms participating in biological conversions.
6.3 Ill effects of waste water on human & Environment and related FAQ’s
Why Every Community Needs Wastewater Treatment?
Even if controlling gases and odors from sewage weren't reason enough, every community needs to treat its wastewater because of the serious health problems it can cause. Although this may seem obvious, untreated wastewater is still the root cause of much environmental damage and human illness, misery, and death around the world. Sometimes it is useful to reexamine basic ideas like why wastewater treatment is important, especially today when so many communities need to save money and reprioritize their needs and funding for public projects.
What is in wastewater?
Sources of wastewater from small communities include homes, farms, hospitals, and businesses. Some communities have combined sewers that collect both wastewater and storm water runoff from streets, lawns, farms, and other land areas. So wastewater can include any debris from streets and waste oils, pesticides, fertilizers, and wastes from humans and animals. Wastewater from a typical household might

22
include toilet wastes; used water from sinks, baths, showers, washing machines, and dishwashers; and anything else that can be put down the drain or flushed down the toilet.
What makes wastewater so dangerous?
Feces and urine from both humans and animals carry many disease-causing organisms. Wastewater also may contain harmful chemicals and heavy metals known to cause a variety of environmental and health problems. Disease-causing organisms (pathogens) from humans can enter a community's wastewater from patients at hospitals, or from anyone who is sick or a carrier of disease. Carriers may not have symptoms or even know they have a disease. Animal wastes often enter from farms, meat packing and processing facilities, and from rats and other animals found in or around sewage or sewers.
Much of our wastewater, treated or untreated, eventually ends up in our rivers, streams, lakes, and oceans-sometimes via groundwater, the underground water source we tap for well water. We often assume that groundwater is pure-and it usually is-but unfortunately, well water contaminated by sewage is a common cause of outbreaks of wastewater-related diseases.
When untreated wastewater reaches water used as a drinking water source for the community, there can be significant health risks. The effectiveness of drinking water treatment can be reduced when water is heavily contaminated with waste. To ensure safe drinking water, communities need both effective water and wastewater treatment. In addition, communities need to make sure that untreated wastes are not disposed of improperly on land where people can come in direct contact with it or where it can attract disease-carrying insects or animals.
How are Diseases Spread from Wastewater?
Humans "catch" diseases from wastewater in a variety of ways. Pathogens in wastewater may be transmitted by direct contact with sewage, by eating food or drinking water contaminated with sewage, or through contact with human, animal, or insect carriers.
For example, direct contact might accidentally occur as a result of walking in fields fertilized with untreated wastes, playing or walking in a yard with a failed septic system, touching raw sewage disposed of in open areas, swimming or bathing in contaminated water, or working with or coming into contact with animals or wastewater and not following proper hygiene.
Houseflies can be used to illustrate the dangers posed by disease carriers. Flies, which have tastebuds on their feet, always land directly on the food they eat-and on any given day, that could mean raw sewage (a fly favorite) followed by picnic food. The hairs on a housefly's body can carry millions of pathogens, which then brush off on anything the fly touches. By making sure that wastewater is treated and disposed of properly, communities can control the spread of disease by flies and other disease

23
carriers, such as rats, lice, cockroaches, and mosquitoes. By controlling the population of these animals and insects, communities also help to control the other, non-wastewater related diseases they may carry. But by far the most common way that people contract diseases from wastewater is through the fecal-oral route, or in other words, by eating food or drinking water contaminated by sewage or by not washing hands after contact with sewage.
In communities where wastewater treatment is inadequate or nonexistent, the opportunities for people to become infected seem endless. For example, people have become ill by doing the following:
Drinking contaminated water, juices made with water, or other beverages made with contaminated water or ice
Eating food improperly handled by infected people or carriers (often workers in restaurants or food processing facilities)
Eating vegetables and fruits contaminated by irrigation with polluted water or fertilized with untreated sewage or sewage sludge
Eating meat or drinking milk from animals that grazed on contaminated pasture or drank contaminated water
Eating fish or shellfish grown, caught, or harvested in contaminated water Eating food exposed to flies or vermin that feed on or come into contact with
sewage
Diseases contracted by drinking contaminated water or eating contaminated food are often referred to as waterborne and food borne diseases.
What Diseases Are Commonly Caused By Wastewater?
Bacteria, viruses, and parasites (including worms and protozoan’s), are the types of
pathogens in wastewater that are hazardous to humans. Fungi that can cause skin,
eye, and respiratory infections also grow in sewage and sewage sludge. Scientists
believe there may be hundreds of disease-causing organisms present in sewage and
wastewater that have yet to be identified.
Diseases Caused by Bacteria
Bacteria are microscopic organisms that are responsible for several wastewater
related diseases, including typhoid, paratyphoid, bacillary dysentery, gastroenteritis,
and cholera. Many of these illnesses have similar symptoms, which vary in severity.
Most infect the stomach and intestinal tract and can cause symptoms like headache,
diarrhea (sometimes with blood), abdominal cramps, fever, nausea, and vomiting.
Depending on the bacteria involved, symptoms can begin hours to several days after
ingestion. Often, infected people will experience only mild symptoms or no
symptoms at all. However, anyone experiencing frequent diarrhea and vomiting

24
should seek medical attention immediately. Severe dehydration and death can result
with serious cases, sometimes within a day.
Typhoid
Early in this century, typhoid fever was a major cause of death from outbreaks of
waterborne disease in this country. Today, water and wastewater treatment has
almost eliminated this highly infectious disease in developed countries, but it
continues to be a problem in many areas of the world. Typhoid symptoms often
include fever, constipation, loss of appetite, nausea, diarrhea, vomiting, and
abdominal rash. An outbreak of typhoid fever was reported in Ain Taya, Algeria, with
910 suspected cases. The cause was traced to sewage contaminating the water
reservoirs after a sewage pipe had been damaged during construction work.
Cholera
Cholera is another waterborne bacterial disease that used to be responsible for
recurring outbreaks in the U.S. It is again a threat in much of the world. Cholera
spreads quickly, especially in areas where people live in crowded conditions without
toilets or clean water. Outbreaks also result from people eating contaminated
seafood.
Since 1961, there has been a devastating global epidemic of cholera, which spread to
this part of the world in 1991. A Chinese freighter that dumped its wastewater into
the harbor at Lima, Peru, is suspected of having brought the disease to Latin America
for the first time in more than 100 years. The epidemic quickly spread to Ecuador,
Colombia, Chile, and north to Mexico. At least 10,000 deaths and 1 million cases have
been reported to the Pan American Health Organization from Latin America alone.
Because cholera can be controlled with water treatment and boil-water advisories, a
massive outbreak is unlikely in the U.S. However, smaller, isolated outbreaks have
occurred. Oyster beds contaminated with cholera bacteria were found in Mobile,
Alabama, in 1991 and were closed by health officials. Other small outbreaks in the
U.S. originated from travelers eating contaminated seafood or seafood brought home
in suitcases.

25
Diseases Caused By Viruses
Viruses are microscopic parasitic organisms. They are smaller than bacteria and can
be seen only with an electron microscope. Some can infect people through
wastewater. Viruses can't multiply outside their hosts, and wastewater is a hostile
environment for them. But enough viruses can survive in water to make people sick.
Hepatitis A, polio, and viral gastroenteritis are a few of the diseases that can be
contracted from viruses in wastewater. Viral gastroenteritis is thought to be one of
the leading causes of illness in the U.S.
There may be as many as 100 different virus types present in raw sewage, but they
are difficult to identify. Much is still not known about the viruses and other
pathogens in wastewater or their exact behavior and effect on humans. According to
the U.S. Environmental Protection Agency, tests using DNA to help detect and identify
viruses are being developed.
Parasites in Wastewater
Until recently, most Americans haven't been concerned about parasites in their
drinking water. But in the past few years, well-publicized outbreaks of giardiasis
(caused by the protozoan Giardia lambia), and cryptosporidiosis (caused by the
protozoan Cryptosporidium) have brought attention to these organisms.
The types of parasites found in wastewater include protozoan’s and helminthes
(parasitic worms). When people drink water contaminated with protozoan’s, they
can multiply inside the body and cause mild to severe diarrhea. Another protozoan,
Endamebahistolytic a, is the cause of amebiosis, also known as amebic dysentery.
Amebiosis used to be a major cause of illness in the U.S. before the days of
widespread water and wastewater treatment. Bloody diarrhea is a major symptom.
Infected people become carriers of protozoans and shed them in feces. The
protozoan’s can form a protective covering (called cysts) and become inactive when
in hostile environments, like water and wastewater. In this stage, they are often
resistant to disinfection and water treatment methods. While outbreaks can be
controlled by boiling water, the best strategy is to prevent pollution by limiting the
amount of untreated wastes released to water sources.

26
Parasitic worms can also dwell in untreated sewage. Tapeworms and roundworms
are the most common types found in the U.S. Their eggs are found in untreated
wastewater and can be ingested. Hookworms are still present in the southeastern
U.S. They usually enter through the skin or bare feet. Symptoms from parasitic
worms vary, but can include abdominal pain, weight loss, anemia, and fatigue.
Who is most at risk?
Whether or not someone will get sick after being exposed to untreated wastewater is
hard to predict. There are enough disease causing organisms in wastewater,
however, to make contact with it always very risky.
Many people who are infected with pathogens or pollutants in water never even
develop symptoms. How healthy you are to begin with, whether or not you have built
up a resistance to a specific disease, how the organism or substance enters your
body, how potent or toxic it is, and the size of the dose all contribute to how severely
you will be affected.
People who have suppressed immune systems because of HIV/Aids, chronic disease,
chemotherapy, or other conditions are especially at risk from wastewater-related
diseases. Children, the elderly, and the urban and rural poor are also significantly
more at risk than the general population.
Other Wastewater-related Health Concerns
Because of inadequate wastewater treatment, excessive amounts of the nutrients
nitrogen and phosphorus sometimes invade water sources causing algae blooms.
Algae blooms are dangerous to fish because they use a lot of the oxygen in the water.
They can also have a strong, objectionable smell and can affect the taste of water.
Too much nitrogen in water can also be dangerous for humans. It is the cause of
methemoglobinemia, or blue baby syndrome-a condition that prevents the normal
uptake of oxygen in the blood of young babies. It is also suspected of causing
miscarriages. Excess nutrients in coastal waters may also be related to certain "red
tides," which kill fish and other aquatic life and can cause shellfish poisonings and
certain respiratory illnesses in humans.
Metals, such as cadmium, copper, lead, nickel, and zinc, can also be found in
wastewater. Some of these metals are needed in trace amounts by our bodies, but

27
can be harmful in larger doses. Acute poisoning from heavy metals in water is rare in
the U.S., but whether ingesting small amounts over an extended period of time has
any accumulative effects is unknown. Other potentially toxic substances can enter
wastewater from various sources, such as local business, industry, or storm water
runoff. These substances can include pesticides and chemicals like chlorinated
hydrocarbons, phenol, PCBs (polychlorinated biphenyls), and benzene.
Preventing potentially harmful substances from polluting water in the first place is
always the best strategy for protecting health and the environment and preserving
valuable water resources for community use and recreation. Communities can help
through programs that ensure local businesses and industries properly pretreated
and dispose of the wastewater they generate. Communities can also educate and
encourage homeowners to properly dispose of hazardous household chemicals, such
as paints, varnishes, photographic solutions, pesticides, and motor oil. Some
communities set up special dates and locations for collecting these substances.
How Wastewater Treatment Helps Prevent Disease
Wastewater treatment consists of a combination of processes used in steps to
remove, kill, or "inactivate" a large portion of the pollutants and disease-causing
organisms in wastewater.
Most treatment methods include a preliminary step in which the solid materials are
filtered out or allowed to settle and separate from the rest of the wastewater. Helpful
bacteria grow naturally in the solids or "sludge," which provide some initial
treatment for the sludge and the wastewater that comes in contact with it.
The wastewater receives further treatment often through a combination of filtration
and biological and chemical processes. Liquids are often stored for a period of time to
allow further settling and bacterial treatment. The sludge is then treated further by
applying lime or chemicals, air drying, heat drying, or composting. For final disposal,
it is burned, buried in landfills, used as commercial fertilizer, spread on forested land,
or disposed of in the ocean.
Soil can also be used to help treat wastewater. If conditions are right, liquid wastes
can be applied to soil, and most of the pollutants are either removed, inactivated by
bacteria, adhere to certain materials in the soil, or filtered out before reaching the

28
groundwater. Sand or other media can sometimes be used in place of soil in areas
where the natural soil or geographical conditions are not suited for this purpose.
Disinfection is normally the final treatment step for wastewater being discharged
from municipal treatment facilities near or directly into surface water or for
groundwater recharge. Chlorine, ozone, ultraviolet light, or other chemical agents
inactivate many pathogens that manage to survive previous treatment processes.
(Wastewater discharge to Indiana waters from individual residential on-site disposal
systems is not permitted.)
However, while wastewater treatment is essential for protecting water quality, it is
only one barrier against disease. Additional treatment is usually needed to ensure
that water is safe to drink.
Community Awareness Is Needed
The potential for outbreaks of wastewater related illnesses in many small
communities across the U.S. is significant, and to protect public health, water and
wastewater treatment projects need to be given priority and community leaders and
residents need to be aware of potential problems.
Rural homeowners need to learn about what is good and bad for their onsite
systems, what maintenance is needed, and how to identify possible problems.
Homeowners with wells need to be informed about well water testing and
preventing contamination.
Communities also need to regularly monitor local water quality. Sometimes illegally
dumped wastes can threaten water and groundwater resources. Strategies are
needed for identifying and solving local pollution problems, and residents,
businesses, and industry need to be educated about the health dangers associated
with untreated wastewater.
Table 4: Variation in Rate of Water Supply and Rate of Sewage Produced with Population Population Rate of Water Supply
(litres/capita/day) Rate of Sewage Produced
(litres/capita/day) Upto 20000 110 90 20000 to 50000 110 to 150 90 to 120 50000 to 200000 150 to 180 120 to 150 200000 to 500000 180 to 210 150 to 170 500000 to 1000000 210 to 240 170 to 190 Above 1000000 240 to 270 190 to 200

29
7. Stages of Waste water treatment plant
7.1 Receiving Chamber
Fig.2 Receiving Chamber
7.1.1 Function
Receiving chamber is a chamber which receives wastewater that is generated from
house hold, industries and commercial buildings and after that it further goes to
various units operating of wastewater like screening, grit chamber, etc.
7.1.2 How It Works
Receiving chamber is the structure to receive the raw sewage collected through Under Ground Sewage System. It is a rectangular shape tank constructed at the entrance of the sewage treatment plant. The main sewer pipe is directly connected with this tank.
7.1.3 Operation and Maintenance Considerations
Receiving chamber is the structure to receive the raw sewage collected through Under Ground Sewage System. The main sewer pipe is directly connected with this tank, so we have to avoid the clogging of the main pipe by daily cleaning of receiving chamber.

30
7.1.4 Design Criteria For the design of receiving chamber of the primary sewage treatment plant the influent
volume has been estimated as 4.864 cumec with an assumed detention period of 60 sec
and 4.8m depth .The planned cross-section of the designed chamber. The detention period
for receiving chamber was calculated 60 seconds. The volume of sewage water required at
receiving chamber was estimated 311.81 m3. The ratio of depth and width is taken as 2:1.
The design dimensions of receiving chamber to carry the required volume was calculated
width of the chamber is 5.8 m, length of the chamber 11.20 m and the depth was 4.80 m
with total cross-section area of 60.80 m2 . A free board of 0.5 m was provided for the
safety purpose to avoid the overflow.
7.2 Coarse Bar Screen
7.2.1 Coarse Bar Screen (manual)
Fig.3 Manual Coarse Bar Screen
7.2.1.1. Function
Manual Bar screens were more widely used in the past at the headwork’s of most
wastewater treatment plants. Today you will usually see manual bar screens at older,
smaller (< 4000 m3/day) wastewater treatment plants, pump stations and
mechanically cleaned bar screens at larger WWTP's. Manual bar screens have been
replaced with more robust mechanical bar screens. The shift away from the manual
bar screens can be attributed to the inefficiencies and manual labor requirements.

31
7.2.1.2 How It Works
Manual bar screens have little or no motorized cleaning equipment therefore must
be periodically cleaned manually by hand. Not only is maintaining the manual bar
screen lab intensive, but when removal of screenings from the bar screen is
infrequent, flooding and overflow occurs due to clogging. If the bar screen does
become clogged, the head accumulated from hair pinning and solids matting on the
bar screen between cleanings, creates a massive surge when the screenings are
removed.
The high velocity flow produced from the backed up head may compromise solids
capture effectiveness of downstream equipment. When excessive head loss is
anticipated, a bypass channel with a trash rack (bar spacing between 3 to 4 inches)
may be utilized. Sometimes cleaning the bar screen may produce some undesirable
results, as minor as it may be you should be aware. When bar screens are cleaned,
whether manual or mechanical, positively engaging the screen will cause some
screenings to shear, resulting in breakthrough.
7.2.1.3 Operation and Maintenance Considerations
As previously stated, some manual bar screens are major "work horses" at smaller
plants. The manual bar screens that are still being utilized commonly have bar
spacing between 25 mm to 50 mm (or 1 to 2 inches) schedule cleaning as often as
necessary (each situation may be different) to ensure unobstructed flow of the waste
stream. Screenings removed manually from the bar screen are conveyed to a
perforated plate to drain excess water before being disposed of. This may be very
important depending on the method of disposal as it may reduce transportation cost.
For these bar screens, it is important that the bar length not exceed a distance that
can be manually cleaned conveniently, use 3 m (or 10 feet) as a "rule of thumb".
7.2.1.4 Design Criteria
1. Approach velocity of the waste water in the screening channel shall not fall below a
self cleaning velocity of 37.5 cm/sec, or rise to a magnitude at a magnitude in which
screenings will be dislodged from the bars.The suggested approach velocity in the
screening channel is 60 cm/sec to 75 cm/sec, for all the grit bearing waste water. The

32
slope of the floor of the channel may be adjusted to maintain the velocity.The
suggested maximum velocity through the screen is 30 cm/sec at average rate of the
flow for hand cleaned bars screens.
2. Head losses resulting from the screening operation must be controlled so that back
water will not cause the entrant sewer to operate under pressure. Head loss can be
calculated from the following empirical relationship give by Kirschmer:
h= β(w/b)4/3 hυ sinθ
In which,
h=head loss, in m,
β=bar shape factor,
w=width of the bars facing the flow.
b=clear spacing between the bars,
hv=velocity head of flow approaching the rack, in m,
& θ=angle of the rack with the horizontal.
In the above equation β may be taken as 2.42 for sharp edged rectangular bars, 1.83
for rectangular bars with semi-circular upstream face, and 1.79 for circular rods.
Normally head losses in excess of about 8 cm for clogged screens are not tolerated.
3. The slope of the hand cleaned screens should be in between 30° and 45° with the
horizontal
4. The submerged area of the surface of the screen, including bars and opening should
be 200% of the cross-sectional area of the entrant sewer for separate sewers, and
300% for combined sewers. The net submerged area of the opening of the screen
should be about 500 cm2 per MLD of flow for separate sewerage and 750 cm2 for
MLD of flow for combined sewerage system.
7.2.2 Coarse Bar Screen (mechanical)
Fig. 4 Mechanical Coarse Bar Screen
33
7.2.2.1 Function
Mechanical bar screens (or mechanical screens) have been used at the headworks of
most medium to large wastewater treatment plants for the past 50+ years.
More recently, mechanical bar screens are appearing in pump stations and combined
sewer systems. In WWTP applications such as these, it is very common to provide
two bar screens. At smaller treatment facilities where is mechanical bar screens are
used, they are usually the duty bar screen while manual bar screens are used as
standby units.
7.2.2.2 How It Works
The standby bar screen will be brought online when the mechanical bar screen is
inoperable or down for routine maintenance. At larger treatment facilities there may
be more than two mechanical bar screens, having two or more duty as well as
standby units. Stop logs should be installed to allow each channel to be isolated, so
that the channel can be dewatered and the bar screens maintained.The clear bar
spacing for mechanically cleaned bar screens is usually between 6 mm to 38 mm (or
1/2 to 1 1/2 inches ). The amount of debris removed from the bar screen can be
directly linked to the bar space opening. The bar screen should be positioned at a 45
to 90 degree angle from the horizontal, with 60 degree being the most common
configuration. This will increase the screening surface area, which in turn will
expedite cleaning and eliminate clogging. This configuration will augment screening
surface area up to 100%, it will also facilitate cleaning and eliminate escalating head
from matting on the bar screen.
7.2.2.3 Operation and Maintenance Considerations
The mechanical device that cleans the bar screen is activated by a manual start-stop
Switch, a timer, a overload switch, a actuator which sense pressure differential
between points upstream and downstream of the bar screen, and a float that turns on
when head across the bar screen is greater than some predetermined elevation. In
wastewater treatment process combustible gases such as methane are emitted. To
avoid catastrophic failure, all motors and controls are to be explosion proof.
Mechanical bar screens offer several advantages over the trash rack or manual bar
Screen. With mechanical bar screens labor cost from maintenance are usually allot

34
Lowers, screening capture is more efficient, and larger debris are removed with less
hastle. These are a few ways mechanical bar screens show improvement over manual
bar screens. More recent bar screens are using more robust materials such as
Stainless steel to stand up against resist corrosion.
7.2.2.4 Design Criteria
1. Approach velocity of the waste water in the screening channel shall not fall below a self
cleaning velocity of 37.5 cm/sec, or rise to a magnitude at a magnitude in which
screenings will be dislodged from the bars.
2. The suggested maximum velocity through the screen is 75 cm/sec at normal maximum
flow for mechanically cleaned screens.
3. The mechanically cleaned screen, the head loss is specified by the manufacturers.
4. The slope of the mechanically cleaned screens may have a slope between 45° and 80°.
5. Clear spacing of bars may be from 25 to 50 mm for hand cleaned bar screens. This may
range from 15 mm to 75 mm in case of mechanically cleaned bar screens. The width of
the bars facing the flow may be from 8 mm to 15 mm, and the depth may vary from 25
mm to 75 mm; but the sizes less than 15mm × 50 mm are normally not used. They are
welded together at rear face.
Table 5: Usual Bar Sizes and Openings
Dimension of the Bar facing flow, mm
Clear spacing between bars, mm
Area f the opening/ gross surface area of the screens, %
6 18 75 6 24 80 6 30 83.3 6 36 85.6 9 18 66.7 9 24 72.8 9 30 77 9 36 80 12 18 60 12 24 66.7 12 30 71.5 12 36 75

35
7.3 Raw Sewage Lift Pumps
Fig. 5 Raw Sewage Pump
7.3.1 Function
Pumping stations in sewage collection systems, also called lift stations, are normally
designed to handle raw sewage that is fed from underground gravity pipelines (pipes
that are laid at an angle so that a liquid can flow in one direction under gravity).
Sewage is fed into and stored in an underground pit, commonly known as a wet well.
The well is equipped with electrical instrumentation to detect the level of sewage
present. When the sewage level rises to a predetermined point, a pump will be
started to lift the sewage upward through a pressurized pipe system called a sewer
force main or rising main from where the sewage is discharged into a gravity
manhole. From here the cycle starts all over again until the sewage reaches its point
of destination – usually a treatment plant. By this method, pumping stations are used
to move waste to higher elevations. In the case of high sewage flows into the well (for
example during peak flow periods and wet weather) additional pumps will be used.
If this is insufficient, or in the case of failure of the pumping station, a backup in the
sewer system can occur, leading to a sanitary sewer overflow – the discharge of raw
sewage into the environment.
7.3.2 How It Works
Sewage pumping stations are typically designed so that one pump or one set of
pumps will handle normal peak flow conditions. Redundancy is built into the system
so that in the event that any one pump is out of service, the remaining pump or

36
pumps will handle the designed flow. The storage volume of the wet well between
the 'pump on' and 'pump off' settings is designed to minimize pump starts and stops,
but is not so long a retention time as to allow the sewage in the wet well to go septic.
Sewage pumps are almost always end-suction centrifugal pumps with open impellers
and are specially designed with a large open passage so as to avoid clogging with
debris or winding stringy debris onto the impeller. A four pole or six pole AC
induction motor normally drives the pump.
The interior of a sewage pump station is a very dangerous place. Poisonous gases
such as methane and hydrogen sulfide can accumulate in the wet well; an ill-
equipped person entering the well would be overcome by fumes very quickly. Any
entry into the wet well requires the correct confined space entry method for a
hazardous environment. To minimize the need for entry, the facility is normally
designed to allow pumps and other equipment to be removed from outside the wet
well.
7.3.3 Operation and Maintenance Considerations
The system is mostly computer- or electronically monitored. Sensors check the
sewage level of the wet wells and start/stop the pumps. The pumps and its
monitoring unit should be maintained periodically by the supplier.
7.3.4 Design Criteria
There are certain locations where it is possible to convey sewage by gravity to a central
treatment facility or storm water is conveyed up to disposal point entirely by gravity.
Whereas, in case of large area being served with flat ground, localities at lower elevation
or widely undulating topography it may be essential to employ pumping station for
conveyance of sewage to central treatment plant. Sewage and storm water is required to be
lifted up from a lower level to a higher level at various places in a sewerages system.
Pumping of sewage is also generally required at the sewage treatment plant.
Pumping of sewage is different than water pumping due to polluted nature of the
wastewater containing suspended solids and floating solids, which may clog the pumps.
The dissolved organic and inorganic matter present in the sewage may chemically react
with the pump and pipe material and can cause corrosion. The disease causing bacteria
present in the sewage may pose health hazard to the workers. Sedimentation of organic

37
matter in the sump well may lead to decomposition and spreading of foul odour in the
pumping station, requiring proper design to avoid deposition. Also, variation of sewage
flow with time makes it a challenging task.
Pumping stations are often required for pumping of (1) untreated domestic wastewater, (2)
stormwater runoff, (3) combined domestic wastewater and stormwater runoff, (4) sludge
at a wastewater treatment plant, (5) treated domestic wastewater, and (6) recycling treated
water or mixed liquor at treatment plants. Each pumping application requires specific
design and pump selection considerations. At sewage treatment plant pumping is also
required for removal of grit from grit chamber and pumping may be required for
conveying separated grease and floating solids to disposal facility.
Generally pumping station should contain at least three pumping units of such capacity to
handle the maximum sewage flow if the largest unit is out of service. The pumps should
be selected to provide as uniform a flow as possible to the treatment plant. All pumping
stations should have an alarm system to signal power or pump failure and every effort
should be made to prevent or minimize overflow. Flow measuring device such as
venturimeter shall be provided at the pumping station. In all cases raw-sewage pumps
should be protected by screens or racks unless special devices such as self cutting grinder
pumps are provided. Housing for electric motors should be made above ground and in dry
wells electric motors should be provided protection against flooding. Good ventilation in
dry well should be provided, preferably of forced air type, and accessibility for repairs and
replacements should be ensured.
The site selection for the pumping station is important and the area selected should never
get flooded. The station should be easily accessible in all weathers. The stormwater
pumping station should be so located that the water may be impounded without causing
damage to the properties. Location of the pumping station should be finalize considering
the future expansion and expected increase in the sewage flow. There need to be enough
space in the pumping station to replace low capacity pump with higher capacities as per
the need in future. The capacity of the pumping station is based on the present and future
sewage flow. Generally design period up to 15 years is considered for pumps. The civil
structure and the pipelines shall be adequate to serve for the design period of 30 years.
Types of Pumps Following types of pumps are used in the sewerage system for pumping
of sewage, sewage sludge, grit matter, etc. as per the suitability: a. Radial-flow centrifugal
pumps b. Axial-flow and mixed-flow centrifugal pumps c. Reciprocating pistons or
plunger pumps d. Diaphragm pumps e. Rotary screw pumps f. Pneumatic ejectors g. Air-
lift pumps Other pumps and pumping devices are available, but their use in environmental
engineering is infrequent.

38
Radial-Flow Centrifugal pumps: These pumps consist of two parts: (1) the casing and (2)
the impeller. The impeller of the pump rotates at high speed inside the casing. Sewage is
drawn from the suction pipe into the pump and curved rotating vanes throw it up through
outlet pipe because of centrifugal force. Radial-flow pumps throw the liquid entering the
center of the impeller out into a spiral volute or casing. The impellers of all centrifugal
pumps can be closed, semi open, or open depending on the application.
Open impeller type pumps are more suitable because suspended solids and floating matter
present in the sewage can be easily pumped without clogging. These pumps can have a
horizontal or vertical design. These pumps are commonly used for any capacity and head.
These pumps have low specific speed up to 4200.
Axial- flow Centrifugal pumps: Axial-flow designs can handle large capacities but only
with reduced discharge heads. They are constructed vertically. The vertical pumps have
positive submergence of the impeller. These are used for pumping large sewage flow,
more than 2000 m3/h and head up to 9.0 m. These pumps have relatively high specific
speed of 8000 – 16000. The water enters in this pump axially and the head is developed by
the propelling action of the impeller vanes.
Mixed flow pumps: These pumps develop heads by combination of centrifugal action and
the lift of the impeller vane on the liquid. They are having single impeller. The flow
enters the pump axially and discharges in an axial and radial direction into volute type
casing. The specific speed of the pump varies from 4200 to 9000. These are used for
medium heads ranging from 8-15 m.
Most water and wastewater can be pumped with centrifugal pumps. They should not be
used for the following: 1) Pumping viscous industrial liquids or sludges, where the
efficiencies of centrifugal pumps are very low, and therefore positive displacement pumps
are used for such applications. 2) Low flows against high heads. Except for deep-well
applications, the large number of impellers needed is a disadvantage for the centrifugal
design.
The rotational speed of impeller affects the capacity, efficiency, and extent of cavitation.
Even if the suction lift is within permissible limits, cavitations can be a problem and
should be checked. Centrifugal pumps are classified on the basis of their specific speed
(Ns) at the point of maximum efficiency. The specific speed of the pump is defined as
speed of the impeller in revolution per minute such that it would deliver discharge of 1
m3/min against 1.0 m of head.
The pumps with low specific speed are suitable for more suction lift than the pumps with
high specific speed. The axial flow pumps with high specific speed will not work with
any suction lift; rather these pumps require positive suction head and some minimum

39
submergence for trouble free operation. It is advisable to avoid suction lift for the
centrifugal pumps. Hence pumps are generally installed either to work submerged in the
wet well or installed in the dry well at such a level that the impeller will be below the level
of the liquid in the wet well.
Positive displacement pumps: These pumps include reciprocating piston, plunger, and
diaphragm pumps. Almost all reciprocating pumps used in environmental engineering are
metering or power pumps. A piston or plunger is used in a cylinder, which is driven
forward and backward by a crankshaft connected to an outside driving unit. Adjusting
metering pump flow involves merely changing the length and number of piston strokes. A
diaphragm pump is similar to a reciprocating piston or plunger, but instead of a piston, it
contains a flexible diaphragm that oscillates as the crankshaft rotates. Plunger and
diaphragm pumps feed metered amounts of chemicals (acids or caustics for pH
adjustment) to a water or wastewater stream. These are not suitable for sewage pumping
because solids and rugs present in the sewage may clog them. These pumps have high
initial cost and very low efficiency.
Rotary Screw Pumps: In this type, a motor rotates a vane screw or rubber stator on a shaft
to lift or feed sludge or solid waste material to a higher level or the inlet of another pump.
These are used in the square grit chamber for removal of grit.
Air Pumps: These pumps include pneumatic ejectors and airlifts. In pneumatic ejector
wastewater flows into a receiver pot and an air pressure system then blows the liquid to a
treatment process at a higher elevation. The air system can use plant air (or steam), a
pneumatic pressure tank, or an air compressor. This pumping system has no moving parts
in contact with the waste; thus, no clogging of impeller is involved. Ejectors are normally
maintenance free and operate for longer time. Airlift pumps consist of an updraft tube, an
air line, and an air compressor or blower. Airlifts blow air at the bottom of a submerged
updraft tube. As the air bubbles travel upward, they expand reducing density and pressure
within the tube. Higher flows can be lifted for short distances in this way. Airlifts are used
in wastewater treatment to transfer mixed liquors or slurries from one process to another.
These pumps have very low efficiency and can lift the sewage up to small head.
Efficiencies of Pumps range from 85% for large capacity centrifugals (radial-flow
centrifugals and axial-flow and mixed-flow centrifugals) to below 50% for many smaller
units. For reciprocating pistons or plunger pumps efficiency varies from 30% onward
depending on horsepower and number of cylinders. For diaphragm pumps, efficiency is
about 30%, and for rotary screw type, pneumatic ejectors type and air-lift pumps it is
below 25%.
Materials for Construction of Pumps For pumping of water using radial-flow centrifugals
and axial-flow and mixed-flow centrifugal type pumps normally bronze impellers, bronze

40
or steel bearings, stainless or carbon steel shafts, and cast iron housing is used. For
domestic wastewater pumping using radial-flow centrifugals and axial-flow and mixed-
flow centrifugal type pumps similar material is used except that they are often made from
cast iron or stainless steel impellers. For industrial wastewater and chemical feeders using
radial-flow centrifugal or reciprocating piston or plunger type pumps, a variety of
materials depending on corrosiveness are used. In diaphragm pumps the diaphragm is
usually made of rubber. Rotary screw type, pneumatic ejectors type and air-lift pumps
normally have steel components.
7.4 Stilling Chamber
Fig.6 Stilling Chamber
7.4.1 Function
Sewage is oxygenated and clarified in a tank having an open-bottomed stilling
chamber located above an open-topped chamber. Oxygenated sewage is discharged
into the stilling chamber where its velocity is reduced, with sewage passing from the
stilling chamber into the open-topped chamber being precluded from flowing
horizontally along the tank bottom, and upwardly into the clarified sewage.
7.4.2 How it works
A typical sewage treatment process includes the stage in which the sewage is aerated
and contacted with "activated sludge" containing the necessary aerobic micro-

41
organisms and a subsequent stage in which the treated sewage is allowed to settle
into two layers, one being of clear, treated water, the other containing the activated
sludge. Pure water is run-off from the upper layer. Typically, in the treatment of
municipal sewage, there is also a preliminary settling stage in which coarse solids are
removed before the activated sludge treatment is carried out. Since the sewage is
agitated to help dissolve air therein, the activated sludge and settling stages are
conventionally performed in separate vessels.
7.4.3 Operation and Maintenance Considerations
If properly designed, engineered and constructed, clarifiers call for very little
attention in terms of operation and maintenance. Indeed, the un-mechanized
(hopper-bottom) settling tanks may be said to be zero- maintenance units. Some
parts of the mechanical rake (such as the motor, gearbox etc.) call for only routine
maintenance. The sacrificial rubber squeegees sweeping the floor of the clarifier
need to be checked and replaced, possibly once in two years.
7.4.4 Design Criteria
1. The primary sedimentation tanks are designed using the average dry weather flow.
2. The number of tanks is determined mainly by the limitations of tanks size. Normally
all the treatment plants should have at least two tanks in parallel.
3. The depth of mechanically cleaned tanks should be as shallow as practicable, but with
a minimum of 2.15 m. In addition to this theoretical depth or liquid depth, it should
have a space of about 0.25 m for sludge zone, and 0.3 to 0.45 m as free board.
4. The diameter of the circular tanks may range from3.7 m to 60 m, but the usual range is
from 12 m to 30 m. The diameters of the mechanically cleaned tanks are dictated by
the structural requirements of the trusses which support the scrapers.
5. The rectangular tanks may have a length of 92 m, but usually a length more than 30 m
is not provided. This length includes 1.3 m each for inlet and outlet zones, in addition
to the calculated theoretical length. The width of mechanically cleaned tanks is
dictated partly by the available size of the scrapers; the width may be around 6 m.
6. The floor of the tank should have gentle slopes. It should be around 1% and
8%respectively for circular and rectangular tanks.
7. In rectangular tanks, the minimum slope of side walls of the sludge hoppers shall be
1.7 vertical to 1 horizontal; the hopper floors shall have a maximum dimension of 0.6
m.

42
8. Inlets for both rectangular and circular tanks are to be designed to distribute the flow
equally across the cross-section, or, in all directions. There are several alternatives.
9. The scum removal arrangement also is to be made ahead of the effluent weir on all
primary settling tanks.
7.5 Fine Bar screen
7.5.1 Fine Bar screen (manual)
Fig.7 Manual Fine Bar Screen
7.5.1.1 Function
Screening is carried to out by a manually cleaned bar screen (large in size, in order to
reduce the frequency of screenings collection operations) or, preferably, by an
automatically cleaned bar screen (essential in cases of high flow rates of for water
with a high solids content).
7.5.1.2 How It Works
Where coarse screens use bars or rods to remove solids, fine screens employ wire
cloth, wedge wire elements or perforated plates. Fine screens are used to remove
particles that may cause maintenance issues for process equipment and/or
operational problems to the treatment process. Typically in smaller treatment
facilities, fine screens can be used in place of primary clarification.
Fine screen openings typically range from 0.06 to 0.25 inches. The smaller size
openings allow the fine screens to remove 20 to 35 percent of suspended solid and
BOD. Depending on your specific situation, static wedge wire, rotary drum, or step

43
fine screens may be used. Static wedge wire screens are typically used in industrial
wastewater treatment facilities and small municipal plants.
7.5.1.3 Operation and Maintenance Considerations
Screening is the first treatment station, both for surface and wastewater. Its purpose
to:
Protect the structure downstream against large objects which could create
obstructions in some of the facility's units,
Easily separate and remove large matter carried along by the raw water,
which might negatively affect the efficiency of later treatment procedures or
make their implementation more difficult.
The efficiency of the screening operation depends of the spacing between screen
bars:
Fine screening, for a spacing under 10 mm
Medium screening, for spacing of 10 to 40 mm
Coarse screening, for spacing of over 40 mm
Usually the fine screening is preceded by a preliminary screening operation for
purposes of protection.
Manually cleaned screens require frequent raking to prevent clogging. Cleaning
frequency depends on the characteristics of the wastewater entering a plant. Some
plants have incorporated screening devices, such as basket-type trash racks, that are
manually hoisted and cleaned.
7.5.1.4 Design Criteria
A bar screen is composed of vertical or inclined bars spaced at equal intervals across the
channel through which sewage flows. It is usual to provide a bar screen with relatively
large openings of 75 to 150 mm ahead of pumps for raw sewage while those proceeding
the primary sedimentation tanks have smaller opening of 50 mm. Hand cleaned racks are
set usually at an angle of 45° to the horizontal ot increase the effective cleaning surface
and also to facilitate the racking operations.

44
Table 6: Design Information For Bar Racks Items Hand Cleaned Mechanically cleaned
Bar size: Width (mm) Depth (mm)
5-15
27-75
5-15
25-75 Clean spacing between
bars (mm) 25-50 15-30
Slope from vertical (deg.) 30-45 0-30 Approach velocity (m/s) 0.3-0.6 0.6-1.0
Allowable head loss (mm) 150 150
7.5.2 Fine Bar screen (mechanical)
Fig.8 Mechanical Fine Bar Screen
7.5.2.1 Function
The automatic bar screen is usually protected by a sturdy preliminary bar screen,
which should also be provided with an automatic cleaning systems in large facilities
and in case of raw water containing a high volume of coarse matter.
To reduce manual operations as much as possible, screening procedures have
become increasingly automated, even in small facilities. Automation is essential in
situations where large amounts of plant matter are carried by the water and arrive
all at once at the bar screen, tending to mat the bars and completely clogging the
screen in a few minutes. Fine screens must be automated.

45
7.5.2.2 How It Works
Mechanical cleaning of bar screen is accomplished with the help of mechanically
operated rakes. The mechanically operated rakes may be (a) revolving type (for
curved screening) (b) reciprocating type (for straight vertical or inclined screen )
which move up and down (c) endless revolving type (for straight vertical or inclined
screens) and in each case rake arm teeth are so formed as to mesh with screen. the
rake speed is less than 3m/min. The inclination of the mechanically cleaned bar
screens is between 60-90 degree with the horizontal.
7.5.2.3 Operation and Maintenance Considerations
Mechanically cleaned screens usually require less labor for operation than manually
cleaned screens because screenings are raked with a mechanical device rather than
by facility personnel. However, the rake teeth on mechanically cleaned screens must
be routinely inspected because of their susceptibility to breakage and bending. Drive
mechanisms must also be frequently inspected to prevent fouling due to grit and
rags. Grit removed from screens must be disposed of regularly.
7.5.2.4 Design Criteria
Mechanically cleaned coarse screens should precede some type of fine screens.
Newer designs of internally fed rotary screens that use wedge wire instead of screen
fabric are structurally more rugged. These designs can handle coarse solids that are
transported through wastewater pumps; thus upstream protective device may not
require.
An installation should have a minimum of two screens, each with the capacity of
handling peak flow rates. Flushing water should be provided nearby so that the
building of grease and other solids on the screen can be removed periodically. In
colder climates hot water or steam is more effective for grease removal.
The calculation of head loss through fine screen differs from that of coarse screen.
The clear water head loss through fine screen may be obtained from manufactures
rating tables or calculated using below eq.
h = ( ) 2
Where, h = headloss, m

46
C = coefficient of discharge for the screen (a typical value for a clean
screen is 0.06)
g = acceleration due to gravity, 9.81 m/s2
Q = discharge through screen, m3
A = effective open area of submerged screen, m2
Values of C and A depend on screen factors, such as the size and milling of slots, the
wire diameter and weave, and particularly the percent of open area, and must be
obtained from the screen manufacture or determine experimentally. The important
determination is the head-loss during operation; head-loss depends on the size and
amount of solids in the wastewater, the size of the aperture and the method and
frequency of cleaning.
7.6 Grit Chamber
Fig.9 Grit Chamber
7.6.1 Function
Wastewater usually contains a relatively large amount of inorganic solids such as
sand, cinders and gravel which are collectively called grit. The amount present in a
particular wastewater depends primarily on whether the collecting sewer system is
of the sanitary or combined type. Grit will damage pumps by abrasion and cause
serious operation difficulties in sedimentation tanks and sludge digesters by
accumulation around and plugging of outlets and pump suctions. Consequently, it is
common practice to remove this material by grit chambers. Grit chambers are
usually located ahead of pumps or comminuting devices, and if mechanically cleaned,
should be preceded by coarse bar rack screens.

47
7.6.2 How it works
Grit chambers are generally designed as long channels. In these channels the velocity
is reduced sufficiently to deposit heavy inorganic solids but to retain organic material
in suspension. Channel type chambers should be designed to provide controlled
velocities as close as possible to 1.0 foot per second. Velocities substantially greater
than 1.0 foot per second cause excessive organic materials to settle out with the grit.
The detention period is usually between 20 seconds to 1.0 minute. This is attained
by providing several chambers to accommodate variation in flow or by proportional
weirs at the end of the chamber or other flow control devices which permit
regulation of flow velocity.
7.6.3 Operation and Maintenance Considerations
Manually cleaned grit chambers for combined wastewater should be cleaned after
every large storm. Under ordinary conditions these grit chambers should be cleaned
when the deposited grit has filled 50 to 60 percent of the grit storage space. This
should be checked at least every ten days during dry weather.
When mechanically cleaned grit chambers are used, they must be cleaned at regular
intervals to prevent undue load on the cleaning mechanism. Recommendations of
the manufacturer should be rigidly observed. This plus experience, will determine
the cleaning schedule.
A grit in which marked odors develop indicates that excessive organic matter is being
removed in the grit chamber. Alternately, if sludge from a settling tank is excessively
high in grit, or if there is excessive wear in pumps, comminutors, sludge collectors or
other mechanical equipment, the reason is likely to be inefficient functioning of the
grit removing process. In either case, a study of this unit should be made.
7.6.4 Design Criteria
The design of the horizontal-flow grit chambers should be such that under the most
adverse conditions, all the grit particles of size 0.2 mm or more in diameter will reach the
bed of the channel prior to their reaching the outlet end.
The length of the channel will be gravened by the depth required which is again governed
by the settling velocity. A minimum allowance of approximately twice the maximum

48
depth should be given for inlet and outlet zones. An allowance of 20% - 50% of the
theoretical length of the channel may also be given.
A value within between 1 m and 1.5 m may be assumed. The depth of flow is normally
kept shallow. For total depth of the channel, a free board of about 0.3 m and grit space of
about 0.25 m should be provided.
For larger plants two or more number of grit chambers in parallel may be provided.
Detention time 30 to 60 seconds are recommended in the grit chamber.
7.7 Sequencing Batch Reactor (SBR) Basins
Fig.10 SBR Basin
7.7.1 Function
SBR facilities commonly consist of two or more basins that operate in parallel but
single- basin configurations under continuous-flow conditions. In this modified
version of the SBR, flow enters each basin on a continuous basis.
7.7.2 How it works
The influent flows into the influent chamber, which has inlets to the react basin at the
bottom of the tank to control the entrance speed so as not to agitate the settled
solids. Continuous-flow systems are not true batch reactions because influent is
constantly entering the basin. The design configurations of SBR and continuous-flow
systems are otherwise very similar. Plants operating under continuous flow should
operate this way as a standard mode of operation. Ideally, a true batch-reaction SBR
should operate under continuous flow only under emergency situations. Plants that
have been designed as continuous-inflow systems have been shown to have poor
operational conditions during peak flows. Some of the major problems of continuous-

49
inflow systems have been overflows, washouts, poor effluent, and permit violations.
7.7.3 Operation and Maintenance Considerations
Communities that have combined collection systems or that are subject to sanitary-
sewer overflows during wet weather should consider developing wet-weather
operating plans or standard operating procedures (SOPs). A wet-weather operating
plan or SOP also benefits facilities subject to process upset during wet-weather
periods. This plan provides operators with a guide to minimize the discharge of
pollutants during wet weather and protect their facility from upset.
7.7.4 Design Criteria
a.
(1) The design of a sequencing batch reactor (SBR) involves the same factors
commonly used for the flow-through activated sludge system. The aspects of a
municipally treated waste which require de-ntrification as well as nitrification plus
biological phosphorous removal need additional design considerations. Pretreatment
of the wastewater before influent in the SBR reactor system is also required.
(2) The following example should be considered an outline to identify reactor
volume elements, a diffused aeration system, the basis for signing effluent decanter
units, and waste sludge systems for a system receiving 378,500 L/d (100,000 gal/d)
of wastewater.
(3) Food-to-mass (F/M) ratio typically ranges from 0.05 to 0.30 with domestic waste
F/M ratios typically ranging from 0.10 to 0.15. At the end of the decant phase, the
MLSS concentration may vary between 2,000 and 5,000 mg/L. A typical value for a
municipal waste would be 3500 mg/L. The MLSS concentration changes
continuously throughout an SBR operating cycle from a maximum at the beginning of
a fill phase to a minimum at the end of the react phase.
b. Reactor volume
Calculate the reactor volume based on the desired BOD removal, the F/M ratio, and
the MLSS.

50
c. Decant volume
Calculate the decant volume as the difference between the reactor volume and the
low water volume, as shown in Table E-10. Each operating cycle is normally
composed of mixed fill, react fill, settle, decant, sludge waste, and idle. The number of
cycles dictates the number of decants per day or the volume of liquid to be decanted
for each cycle. The volume per decant per cycle must be selected based on the
maximum sustained daily flow.
d. Detention time
Calculate the maximum detention time based on the reactor volume. Calculate the
minimum detention time based on the decant volume, as shown in Table E-10.
e. SBR dimensions
Estimate the required unit process dimensions, as shown in Table E-10. The basin
length can be estimated based on a recommended minimum depth. The minimum
depth after decant is determined as the depth of a clarifier in a flow-through system,
i.e., quiescent settling and a large settling area. A minimum depth of 2.75 m (9 ft) is
typically recommended by designers.
7.8 Chlorination Tank
Fig.11 Chlorination Tank

51
7.8.1 Function
Chlorination of wastewater is the application of chlorine to a wastewater to
accomplish some definite purpose. The purpose of chlorination may not always be
disinfection and may, in fact, involve odor control or some other objective which will
be noted. Chlorine may be applied in two general ways, gaseous and liquid. In
general, the effective chemical form of chlorine that either destroys the microbe or
acts against odor, etc., is the same. Gaseous forms of chlorine are generally first
dissolved in water prior to addition to the wastewater stream, while liquid forms of
chlorine (called hypochlorite) are sold in the form of water soluble salts. Because
chlorine gas generally costs less than hypochlorite’s, it is normally used in treatment
plants except in rare instances where only a relatively small amount of chlorine is
needed or where the possible danger from gaseous chlorine overrides economic
considerations. The application of chlorine is usually controlled by special devices
which are known as chlorinators, chlorinizers or by similar names.
7.8.2 How It Works
Disinfection of urban waste water is the destruction of disease bearing micro-
organisms or pathogens. It is distinct from sterilization which involves the complete
destruction of all organisms in the liquid being treated. Disinfection has not been
extensively practiced in Europe to date; in the USA a large proportion of discharges
are disinfected using chlorine. However, in order to comply with EU directives such
as:
• The shellfish directive (79/923/EEC), as implemented by S.I. 200 of 1994, and
• The bathing water directive (76/160/EEC), as implemented by S.I. 155 of
1992 and S.I. 230 of 1996,
Sanitary authorities may in future have to consider the use of disinfection. Activated
sludge and biofilm systems will disinfect the waste water to some degree but few
achieve greater than 90% -removal of pathogenic micro-organisms. For complete
disinfection, further treatment is necessary. The pathogenic micro-organisms to be
removed include faecal coliforms and streptococci, salmonella and enteric viruses.

52
The main techniques for the disinfection of urban waste water fall into three main
categories:
Chemical;
Physical; and
Irradiation.
Chemical disinfectants include chlorine, ozone and hydrogen peroxide. The factors
influencing the performance of chemical disinfectants are the contact time, the
efficiency of mixing, the type and concentration of chemicals used, the residual
remaining, the pH and the concentration of interfering substances which may reduce
the effectiveness of the disinfectant.
The principal physical methods rely on enhanced removal of solids and membrane
technologies. Ultra-violet (UV) light is the principal method of irradiation used.
7.8.3 Operation and Maintenance Considerations
Chlorine is widely used in drinking water treatment for the disinfection of surface
and groundwater. It is a strong oxidizing agent and reacts with any organic matter
present in the water. As a result of the large concentrations of organic matter in
waste waters, higher doses are required (than in drinking water treatment) in order
to achieve similar levels of disinfection. Chlorine may be applied in a number of
forms such as chlorine gas, sodium hypochlorite or chlorine dioxide. On contact with
water, elemental chlorine is hydrolyzed and ionizes to hypochlorite acid (HOCI) and
the hypochlorite ion (OCI). HOCI is by far the more potent disinfectant, therefore the
lower the pH, the more effective is the process. Chlorine will also react rapidly with
ammonia in the waste water to produce a series of chloramines in solution as
follows:
NH3 + HOd - NH2CI+H2O
(monochloramine) NH2C1 + HOC1 - NHC12 + H2O
(dichioramine) NHCI2 + HOC1 - Nd3 + H20 (nitrogen trichloride)
Monochloramine and dichloramine are the dominant species and are less potent
disinfectants than hypochlorous acid. Gray (1989) quotes dosing rates ranging from
2 to 15 mg C12/1, depending on how much treatment the waste water has received
(that is, on how much organic matter is remaining), and contact times of 20-30
minutes.
Chlorination of treated urban waste water can result in the production of toxic
compounds including trichloromethanes and chloramines that can have long term

53
adverse effects on the beneficial uses of the waters to which they are discharged.
Dechlorination of discharges is possible but cost comparisons will be required due to
additional process equipment and their associated costs.
7.8.4 Design Criteria
1. Rapid initial mixing of the chlorine solution and waste water should be accomplished
within three seconds and prior to entering the contact chamber.
2 .The hydraulic jumps are considered the best method of obtaining rapid mixing in an
open channel.
3. Mechanical mixers are considered second best in accomplishing rapid mixing. The
mixer should be located at or immediately downstream from the point of chlorine injection
and the mixing chamber should be as small as possible.
4. Injecting the chlorine solution into a full flowing pipe is probably the least efficient.
When this method is used, the inner surface of the pipe shall be irregular so as to create a
sufficient turbulence to accomplished complete mixing within a distance of 10 pipe
diameters. This method will not be acceptable for pipe diameters of 76.2 cm (30 inches)
and larger.
7.9 Sludge Sump
Fig.12 Sludge Sump
7.9.1 Function
Stirring and scraping mechanisms are installed in sludge thickener tanks to reduce
the water content of sledges’ and to continuously remove the still fluid and pumpable
sludge to the central sludge sump.

54
7.9.2 How It Works
The raw, mixed or digested sludge is fed through a central influent cylinder mounted
to the thickener mechanism into the thickener tank.
The thickening process is intensified with the application of vertically mounted
stirring members. By means of an echelon type scraper blade assembly the thickened
sludge on the tank bottom is removed to a center hopper from where it is drawn off
by hydrostatic pressure or pumped off to further treatment facilities
7.9.3 Operation and Maintenance Considerations
Daily discharges made from property into a sludge tank will affect the efficiency of
system. Discharges of disinfectants and storage chemicals will kill bacteria in the
tank and hence prevent the decomposition of the solids. It is therefore necessaries to
consider certain points.
(a) Discharges of rain water to the sludge are not recommended because it causes
considerable dilution of the bacterial matter thereby reducing the efficiency of
tank.
Periodically the sludge will build-up to such and extend that it need removing.
Frequency of sludge removable is dependent on the use, size and type of sludge tank.
As general guide older bricks or concrete structure will require emptying
approximately once every two years, will fiber glass tanks will need emptying at least
every 12 months. Traditional sludge tank contains no mechanical parts and should
not required any other regular maintenance unless problems occur.
7.9.4 Design Criteria
The rate of return sludge flow, Qr depends on the volatile suspended solids concentration
in the secondary settling tank underflow, Xr, and the mixed liquor volatile suspended
solids (MLVSS), X, and is given by the following equation:
(Q + Qr ) X = Qr x Xr
The oxygen requirement of the system can be estimated using the equation:
O2 requirement/day =Ultimate BOD removed/day – 1.42 (Excess sludge wasted per day)
Wt. of O2 required per day = (ultimate BOD consumed/day) - 1.42 (production of
VSS/day)

55
The actual quantity of air to be supplied is estimated considering the fraction of oxygen in
air, and the oxygen transer efficiency of the aerators.
(wt. ofoxygenrequired)(sp. wt. ofairatstandardtemp. )X(fractionofoxygeninair, bywt. )
The specific weight of air, at Mean Sea Level, is 1.2 kg/m3 at 20°c, 1.16 kg/m3 at 30°c.
The fraction of oxygen in air is 23.2%.
Now, the volume of actual air requiremen
(theoreticalrequirement)(oxygentransferef iciency)
For porous tube diffusers, used in conventional activated sludge units, oxygen transfer
efficiency may be assumed as 8%. The oxygen transfer efficiency for coarse bubble
diffusers is around 6%.
General requirements
1. More than one tank is to be provided, if total tank volume exceeds 150 m3.
2. Normally liquid depth should be between 3 m and 4.3 m; a free board of 0.3-0.6 m is
also to be provided.
3. Width to depth ratio may vary from to 1 to 1 to 2.2
4. Length may go upto 150 m. In diffused air aeration conventional system the length is
dictated by the air flow requirement to some extent.
5. A minimum air flow of approximately 0.3 m3/min/metre length of tank is required for
adequate mixing velocities and to avoid deposition of solids. (porous diffuser tubes
can deliver a volume of air of 0.114-0.425m3/min/unit).
6. Air supplied should not be less than 62.50 m3/kg of BOD removed.

56
Table 7: Design Specifications for Activated Sludge Process Systems
Parameters Conventional ASP Complete Mix ASP Y,
0.5-0.67 0.5-0.67
kd,day-1 0.056-0.01 0.055-0.07
Θc, days 5-15 5-15
U,
perday
0.2-0.4 0.2-0.6
Volumetric loading, kg BOD5 /1000m3
320-640 800-1925
MLSS,mg/l (MlVSS=80% of MLSS)
1500-3000 3000
Hydraulic retention time, t, hr
4-8(higher value for lower rate of flow)
3-5
Recirculation ration 0.25-0.5 0.25-1

57
8. Calculations and Results
8.1 Introduction
This project include designing of waste water treatment plant for residential community with a population of (185,545 person), and with a design periods of (30 years).
Geometrical Increase Method
Pn=P0(ퟏ + 풓ퟏퟎퟎ
) n Pn= population in year 2044 P0 = present population is 1, 85,545 (design area population year 2014) r = 30% assume (year 2014 to 2044) n = number of decades (3) Pn=185545(ퟏ + ퟑퟎ
ퟏퟎퟎ)3
Therefore according to mathematical calculation
Pn= 451906 person
Table 8 : Different location and their sewage collected
Sr. No. Location of Tank
Area for water supply Covered Population 2014 (person)
Population 2044 (person)
1 Maktampur filter plant
PritamSociet, Dipali Society, Avadhat Nagar, Gayatrinangr Kask, rachana Nagar etc.
47048 103364
2 Station Tank
Dhokikooi, Dandia Bazar, falshrutinagar,gheekudi, station Road, chingaspura andsoci, etc
14543 31950
3 Soneri Mahal Tank
Hajikha Bazar, Bahadur Buras, ChaklaSoneriMahal, Adus Road, Vhorvad, panchBatti, Ali etc.
19199 42180
4 Towar Tank PhataTalav, dabhoiVad, OcudaFaliya,Peerkanthi, Furja, Bazar etc.
44334 97401
5 Vejalpur Tank
VejalpurNayanachowak, Alisjin Kali,Talawadi etc.
23635 51926
6 Gujarat housing Board Tank
Ssiddhnath Nagar, Gita park, Anank Nagar, Narayan Nagar, Yogeshwar Nagar, G.H.B is all schemes
36786 80818
7 Dungri 20149 44267
Bharuch 185545 451906
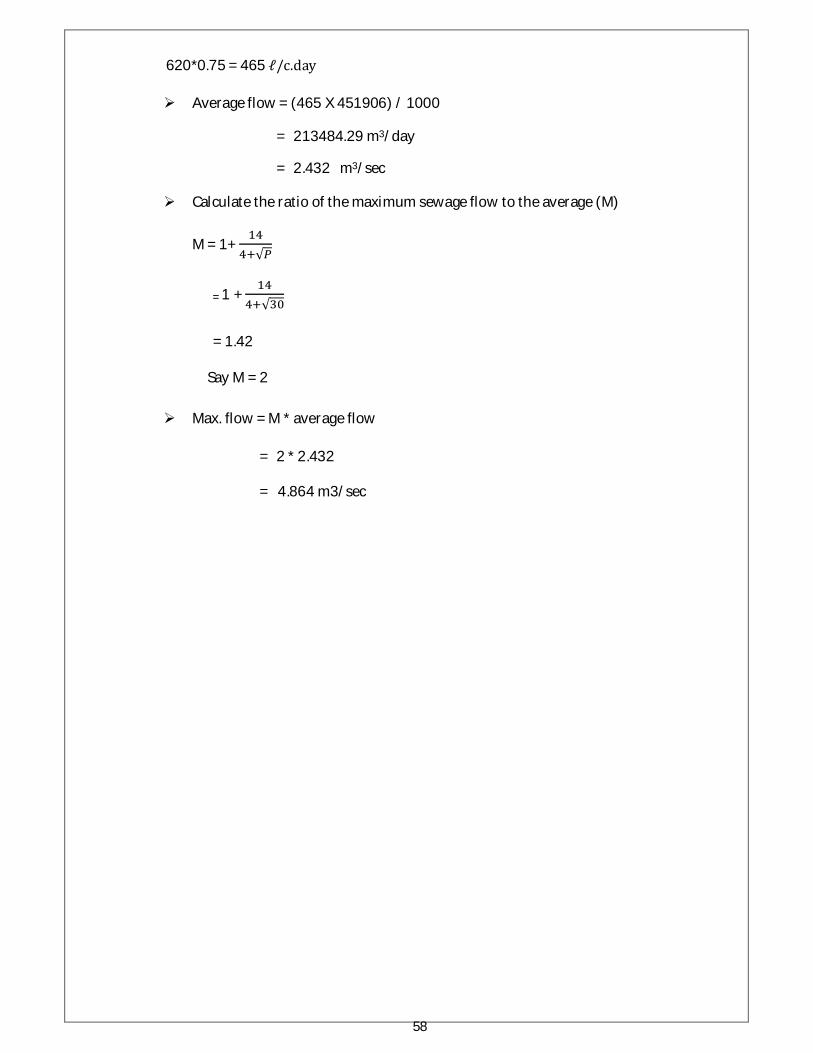
58
620*0.75 = 465 ℓ/c.day Average flow = (465 X 451906) / 1000
= 213484.29 m3/day
= 2.432 m3/sec
Calculate the ratio of the maximum sewage flow to the average (M)
M = 1+
√
= 1 +
√
= 1.42
Say M = 2 Max. flow = M * average flow
= 2 * 2.432
= 4.864 m3/sec

59
8.2 Design Calculation of Receiving Chamber
DESIGN:
• Design flow = 4.864 cumec
• Detention time = 60 sec
• Volume required = flow X detention time
• = 4.864 x 60
• Vrqd = 291.84 m3
• Provide, depth = 4.8 m
• Area = 60.80 m2 because( . .
)
• Length: Breadth = 2:1
• L x B = 2B x B =2B2 = 60.80
• B = 5.51 m ≅ 5.80 m
• L = 11.03 m ≅ 11.20 m
Provide: 11.20 m X 5.80 m X 4.80 m = 311.81 m3
Check
Volume designed = 11.20 m X 5.80 m X 4.80 m Vdes= 311.81 m3 Vrqd= 291.84 m3 Vdes > Vrqd
Receiving chamber is designed for the size of 11.20 m X 5.80 m X 4.80 m + 0.5 (FB)

60
8.3 Design Calculation of Coarse bar Screen
8.3.1 Coarse Bar Screen (Manual)
Design Criteria Used
a. Velocity through rack at max flow = 0.6m/sec b. Bar spacing (clear) = 3.0 cm c. Provide two identical barracks, each capable of handling max flow Conditions
and each equipped with mechanical cleaning device, θ = 50˚ d. One screen champers could be taken out of service for routine maintenance
without interrupting the normal planet operation. e. Max. flow = 4.864 m3/sec
Average flow = 2.432 m3/sec
Design of Rack (Screen) Chamber
a. Assume that the depth of the flow in Rack Chamber = 1.00 mt b. Clear area through the Rack = Qave / velocity through rack chamber
=
..
= 3.90 mt
c. Clear width of the opening = Area / Depth of flow
= ..
= 3.90mt
d. Assume the width of each Bar = 0.5 cm And the Clear space = 3.0 cm
e. No. of spacing =
= 130 space
f. Provide bars with 5 mm width
g. Width of chamber = 3.90 +
= 4.55 mt
h. Calculate the efficiency =
= 0.86

61
Head Loss Calculation
The head loss through the bar rack is calculated from equation (1) and (2).
Equation (1) is used to calculate head loss through clean screen only, while
equation (2) is used to calculate head loss through clean or partly clogged bars.
hL = β ( ) / X hr Sin Ɵ ....(1)
hL = (1/0.7) . ... (2)
Where: hL = Head loss through the rack , m
Vv = Velocity through the rack and in the channel upstream of the rack, m /s ( = 0.4 m/sec )
g = Acceleration due to gravity, 9.81 m/s2 w = Maximum width of the bar= 5 mm b = Minimum clear spacing of bars = 30 mm h r = Velocity head of the flow approaching the bars
=
θ = Angle of bars with horizontal. β = Bar shape factor = 1.79
a. Case 1 : When the screen is clean:
hL = β ( ) / X hr Sin Ɵ
hL = 1.79 ( ) / X 0.008 Sin50̊
hL = 0.0031 mt
b. Case 2 : When the screen is partly or completely clogged bars:
hL= X .
hL= . .( . ) X .

62
hL= 0.05mt
8.3.2 Coarse Bar Screen (Mechanical)
Design Criteria Used
a. Velocity through rack at max flow = 0.9m/sec b. Bar spacing (clear) = 2.5cm c. Provide two identical barracks, each capable of handling max flow Conditions
and each equipped with mechanical cleaning device, θ = 75˚ d. One screen champers could be taken out of service for routine maintenance
without interrupting the normal planet operation. e. Max. flow = 4.864 m3/sec
Average flow = 2.432 m3/sec
Design of Rack (Screen) Chamber
a. Assume that the depth of the flow in Rack Chamber = 1.18 mt b. Clear area through the Rack = Qave / velocity through rack chamber
=
..
= 2.70 mt c. Clear width of the opening = Area / Depth of flow
= .
.
= 2.29 mt
d. Assume the width of each Bar = 1 cm
And the Clear space = 2.5 cm
e. No. of spacing =
= 92 space
f. Provide bars with 10 mm width
g. Width of chamber = 2.29 +
= 3.21 mt
h. Calculate the efficiency = = 0.72

63
Head Loss Calculation
The head loss through the bar rack is calculated from equation (1) and (2). Equation (1) is used to calculate head loss through clean screen only, while equation (2) is used to calculate head loss through clean or partly clogged bars.
hL = β ( ) / X hr Sin Ɵ ....(1)
hL = (1/0.7) . ...(2)
Where: hL = Head loss through the rack , m
Vv = Velocity through the rack and in the channel upstream of the rack , m /s ( = 0.5 m/sec )
h = Acceleration due to gravity, 9.81 m/s2 x = Maximum width of the bar= 10 mm c = Minimum clear spacing of bars = 100 mm i r = Velocity head of the flow approaching the bars
=
θ = Angle of bars with horizontal. β = Bar shape factor = 2.42
c. Case 1 : When the screen is clean:
hL = β ( ) / X hr Sin Ɵ
hL = 2.42 ( ) / X 0.025 Sin75̊
hL = 0.0027 mt
d. Case 2 : When the screen is partly or completely clogged bars:
hL= X .
hL= . .( . ) X .
hL= 0.05mt

64
8.4 Raw Sewage Lift Pump Calculation
Estimation of sewage flow considering sewage generation equal to 80% of the water
supply
Average sewage flow = 0.54 m3/s
Peak sewage flow, considering peak factor of 3 = 3 X 0.54 m3s/s = 1.62 cumec
Considering velocity of 1 m/s in rising main, diameter required
D= . = 1.436 m ≅ 1.44 m 퐷
Provide diameter of 1.44m, hence actual velocity = 0.991 m/s ≅ 1 m/s
Design of sump well
Design the sump for minimum time of 15 min for any pump to run continuously.
Quantity of sewage = 1.62 * 60 * 15 = 145.8 m3
Quantity of sewage in rising main = (πD2)*L/4 = .
= 162.86 m3/s
Net storage capacity of the sump = 145.8 + 162.86 = 308.66 m3
Provide 3 sump units, two for storage of sewage and one as standby, with effective water
Depth of 3.0 m. Hence the surface area of each sump = 308.66/(2 * 3) = 51.43 m2
Provide circular or rectangular shaped three sump wells each having surface area of
51.43 m2 and depth of 3.0 m.
Design of Pump
Capacity of each pump = 51.43 / (15 x 60) = 0.057 cumecs.
Frictional loss of Head in the rising main = = .
. . = 0.14 m
Assuming the loss in bends = 0.3
0.3 + 0.14 = 0.44
Total lift against the pump has to work
0.44 + 15 = 15.44 m
H.P of pump
= = . . = 11.73 ≅ 12 H.P.
Assuming the pump efficiency to be 60%, Brake Horse power of Motor required
= 12/0.6 = 20
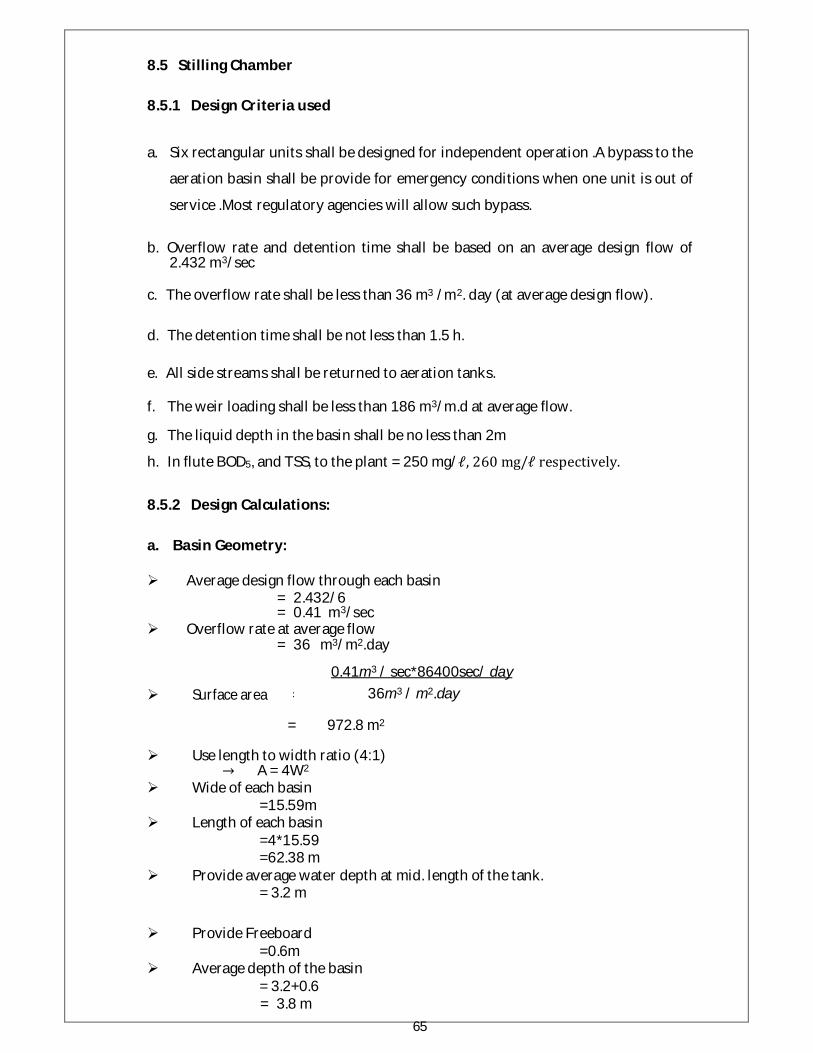
65
8.5 Stilling Chamber
8.5.1 Design Criteria used
a. Six rectangular units shall be designed for independent operation .A bypass to the
aeration basin shall be provide for emergency conditions when one unit is out of
service .Most regulatory agencies will allow such bypass.
b. Overflow rate and detention time shall be based on an average design flow of
2.432 m3/sec
c. The overflow rate shall be less than 36 m3 /m2. day (at average design flow). d. The detention time shall be not less than 1.5 h. e. All side streams shall be returned to aeration tanks.
f. The weir loading shall be less than 186 m3/m.d at average flow. g. The liquid depth in the basin shall be no less than 2m
h. In flute BOD5, and TSS, to the plant = 250 mg/ℓ, 260 mg/ℓ respectively. 8.5.2 Design Calculations: a. Basin Geometry:
Average design flow through each basin
= 2.432/6 = 0.41 m3/sec
Overflow rate at average flow = 36 m3/m2.day
Surface area = 0.41m3 / sec*86400sec/ day
36m3 / m2.day
= 972.8 m2
Use length to width ratio (4:1) → A = 4W2
Wide of each basin =15.59m
Length of each basin =4*15.59 =62.38 m
Provide average water depth at mid. length of the tank. = 3.2 m
Provide Freeboard
=0.6m Average depth of the basin
= 3.2+0.6 = 3.8 m

66
b. Check Overflow Rate
0.41m3 / s *86400sec/ day
Overflow rate at = 15.59*62.38
Average design flow = 36.42 m3/m2.d

67
Overage rate at max. design flow = 0.536m3 / sec*86400sec/ day 15.59 X 62.38 = 47.62 m3/m2d
c. Detention Time
Average volume of the basin
= 3.2* 15.59*62.38 = 3112m3
Detention time of = 3112m2
0.41m3 / sec*3600s / h Average design flow
= 2.10 hr
Detention time at =
3112m3 0.536m3 / sec*3600s / h
max design flow = 1.61 hr

68
8.6 Fine Bar Screen 8.6.1 Fine Bar Screen (Manual) A bar screen is composed of vertical or inclined bars spaced at equal intervals across
the channel through which sewage flows. It is usual to provide a bar screen with
relatively large openings of 75 to 150 mm ahead of pumps for raw sewage while those
proceeding the primary sedimentation tanks have smaller opening of 50 mm. Hand
cleaned racks are set usually at an angle of 45° to the horizontal ot increase the effective
cleaning surface and also to facilitate the racking operations.
8.6.2 Fine bar Screen (Mechanical) Mechanically cleaned coarse screens should precede some type of fine screens. Newer
designs of internally fed rotary screens that use wedge wire instead of screen fabric are
structurally more rugged. These designs can handle coarse solids that are transported
through wastewater pumps; thus upstream protective device may not require.
The calculation of head loss through fine screen differs from that of coarse screen. The
clear water head loss through fine screen may be obtained from manufactures rating
tables or calculated using below eq.
ℎ = ( ) 2
Where,
h = headloss, m
C = coefficient of discharge for the screen (a typical value for a clean screen 0.60)
g = acceleration due to gravity, 9.81 m/s2
Q = discharge through screen, m3 (drum screen)
A = effective open area of submerged screen, m2
Now,
ℎ = ( ) 2
ℎ = . ( . . .
)2 = 0.05 m

69
8.7 Grit Chamber 8.7.1 Geometry Provide three identical grit chambers for independent operation. Maximum design flow through each chamber
= (4.864m3/sec)/3 = 1.62 m3/sec
Volume of each chamber for 4-min detention period
= 1.62 m3/s * 4 min * 60 sec/min = 389 m3
Provide average water depth at mid width
= 3.8 m
provide freeboard = 0.8 m
Total depth of grit chamber
= 3.8+0.8=4.6 m
Surface area of chamber = 389 m3 /3.8m = 103 m2
provide length to width ratio
= 4:1 ⇒ area = 4w2 Width of the chamber
= 5.1 m Length of the chamber
= 20.4 m
8.7.2 Select Diffuser Arrangement: Locate diffusers along the length of the chamber on one side and place them 0.6 m
above the bottom. The upward draft of the air will create a spiral roll action of the liquid
in the chamber. The chamber bottom is sloped toward a collection channel located on
the same side as the air diffusers. A screw conveyor is provided to move the girt along
the channel length to a hopper at the downstream end. 8.7.3 Design the Air Supply System: Provide air supply at a rate of 7.8 ℓ/s per meter length of the chamber. Theoretical air required per chamber.
= 7.8 ℓ /s.m X 20.4 m = 159.12 ℓ/s
Provide 150 percent capacity for peaking purpose. Total capacity of the diffusers
= 1.5 X 159.12 = 238.68 ℓ/s per chamber

70
8.8 Sequencing Batch Reactor (SBR) The design of a Sequencing Batch Reactor (SBR) involves the same factors commonly
used for the flow through activated sludge system. The aspects of a Municipality treated
waste which requires denitrification as well as nitrification plus biological phosphorus
removal need additional design considerations. Pre treatment of the waste water before
influent in the SBR reactor system is also.
Design Calculations a. Reactor Volume
BOD5 removed (kg/d)= [(BODinfluent – BODeffluent ) (mg/L)] x Flow(l/d) 10-6 (kg/mg) (Considering flow (l/d) =140 l/d) BOD5 removed = (250-25) x 140 x 10-3 =31.5 kg/day Required aerobim mass(kg) = ( / )
( )
Assume F/M ratio = 0.13 Required arobic mass = 31.5/0.13 =242.30 kg MLSS Rector volume(low water level) (m3)= ( )
( / ) x ( / )
( )
(Assume concentration 3500 mg/l)

71
= (242.30/ 3500) x 103 = 69.22 Since the decant volume represents 60% of the total volume, Total rector volume = 69.22/ (1-0.6) = 173.07 m3
b. Decant volume Total decant volume = Total rector volume (m3)- Rector volume (low water level) (m3) = 173.07 – 69.22 = 103.85 m3
c. Detention time
Maximum detention time (hr) = ( ) ( / ) ( / )
x 24(hr /d ) = (173.07 x 24)/((140 x 103 ) x 10-3 ) = 29.66 hr Minimum detention time = = ( )
( / ) ( / ) x 24(hr /d )
= (103.85 x 24) / ((140 x 103) x 10-3) = 17.80 hr
d. SBR dimension Basin area (m2) = ( )
( )
( Assume minimum depth = 2.75 m ) = 69.22/ 2.75 = 21.17 m2 Basin length = √21.17 = 5.01 m Basin depth = ( )
( )
= 173.07/ (5.01)2 = 6.922 m
e. Aeration power ( data assume by assumption table ) Nitrogenous O2 demand (kg. O2 / d) – NH3 - Noxidzed (kg/d) x Kg O2/ kg BOD5 NH3 - Noxidzed (kg/d) – TKN removed (kg/d) – synthesis N (kg/d) TKN removed = (40-5) x 140 x 10-3 = 4.9 kg/d Synthesis N = 5% waste activated sludge of total daily sludge production Sludge production (kg/d) = net sludge yield (kgMLSS / kg BOD5 ) x BOD5 removed ( kg/d ) (Assume net sludge yield = 0.76)
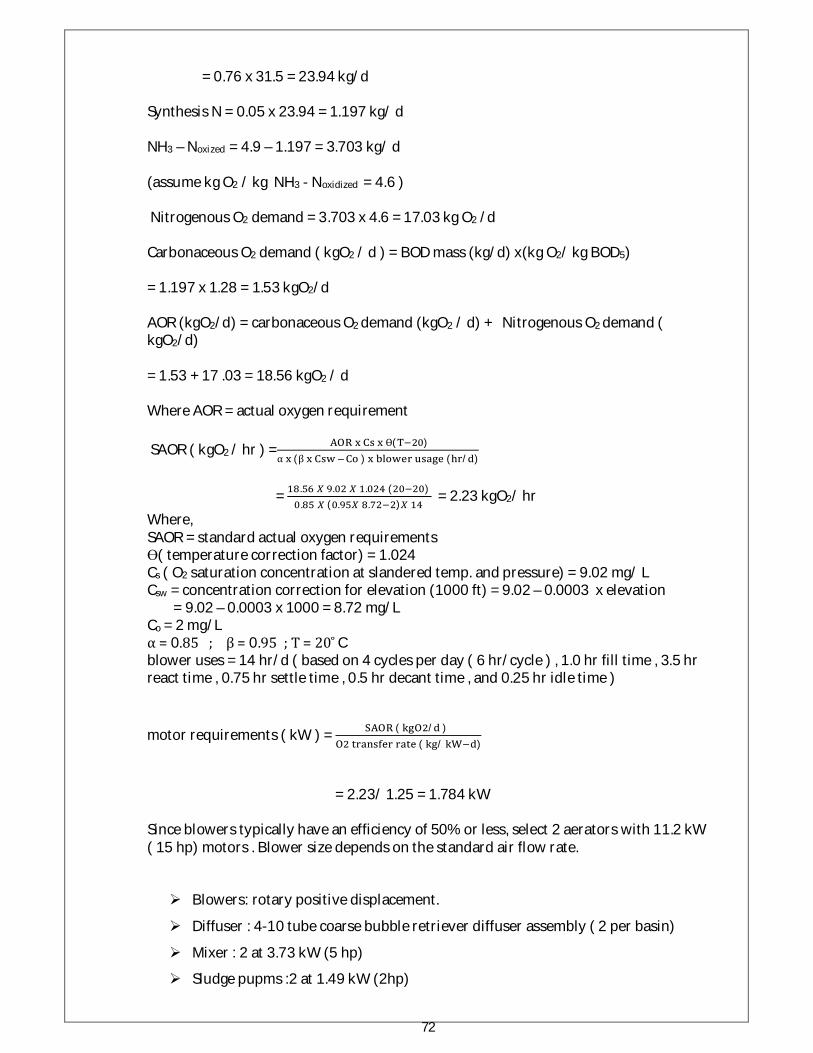
72
= 0.76 x 31.5 = 23.94 kg/d
Synthesis N = 0.05 x 23.94 = 1.197 kg/ d NH3 – Noxized = 4.9 – 1.197 = 3.703 kg/ d (assume kg O2 / kg NH3 - Noxidized = 4.6 ) Nitrogenous O2 demand = 3.703 x 4.6 = 17.03 kg O2 /d Carbonaceous O2 demand ( kgO2 / d ) = BOD mass (kg/d) x(kg O2/ kg BOD5) = 1.197 x 1.28 = 1.53 kgO2/d AOR (kgO2/d) = carbonaceous O2 demand (kgO2 / d) + Nitrogenous O2 demand ( kgO2/d) = 1.53 + 17 .03 = 18.56 kgO2 / d Where AOR = actual oxygen requirement SAOR ( kgO2 / hr ) = Ɵ( )
α (β – ) ( / )
= . . . ( )
. ( . . ) = 2.23 kgO2/ hr
Where, SAOR = standard actual oxygen requirements Ɵ( temperature correction factor) = 1.024 Cs ( O2 saturation concentration at slandered temp. and pressure) = 9.02 mg/ L Csw = concentration correction for elevation (1000 ft) = 9.02 – 0.0003 x elevation = 9.02 – 0.0003 x 1000 = 8.72 mg/L Co = 2 mg/L α = 0.85 ; β = 0.95 ; T = 20 ̊ C blower uses = 14 hr/d ( based on 4 cycles per day ( 6 hr/cycle ) , 1.0 hr fill time , 3.5 hr react time , 0.75 hr settle time , 0.5 hr decant time , and 0.25 hr idle time ) motor requirements ( kW ) = ( / )
( / )
= 2.23/ 1.25 = 1.784 kW Since blowers typically have an efficiency of 50% or less, select 2 aerators with 11.2 kW ( 15 hp) motors . Blower size depends on the standard air flow rate. Blowers: rotary positive displacement.
Diffuser : 4-10 tube coarse bubble retriever diffuser assembly ( 2 per basin)
Mixer : 2 at 3.73 kW (5 hp)
Sludge pupms :2 at 1.49 kW (2hp)
73
Decanter sizing : cycle per day = 4
Volume per decant = 70.5 m3
Decant time = 30 min .
Decant flow rate = 2.35 m3 / min
Influent valves: 2,each 150 mm dia.
Air blower valves: 2,each 150 mm dia.
74
8.9 Chlorination Tank 8.9.1 General Chlorine is used in various ways for odor control. Dechlorination of chlorinated effluent
should be provided when water quality requirements dictate the need. Capability to
add dechlorination systems should be considered in all new treatment plants that will
use chlorine for disinfection. The design of all disinfection facilities utilizing chlorine as
the disinfectant agent should ensure that the dechlorination requirements are met.
Two problems are associated with chlorination as disinfection: effluent toxicity
(chlorine residual) and safety. A dechlorination facility would address the toxicity issue
and containment and scrubbing facility would address the safety issue. The
dechlorination and containment and scrubbing facilities increase the cost of chlorine-
based disinfection.
8.9.1.1 Forms of Chlorine Dry chlorine is defined as elemental chlorine existing in the liquid or gaseous phase,
containing less than 150 mg/L water. Unless otherwise stated, the word “chlorine”
wherever used in this section refers to dry chlorine.
8.9.1.2 Chlorine Feed Equipment Chlorinators are used to convert the gaseous chlorine from a positive pressure to a
vacuum and to regulate or meter the flow rate of the gas. The principal components of a
conventional chlorinator are as follows:
• Inlet chlorine pressure-reducing valve.
• Indicating meter such as a rotameter.
• Chlorine metering orifice, changeable for various ranges of flow.
• Manual feed rate adjuster.
• Vacuum differential-regulating valve.
A few other variations also exist, such as sonic flow and remote vacuum chlorinators.
Conventional vacuum-type chlorinators are most commonly utilized for dry chlorine.
Liquid chlorine evaporators should be considered where manifolding multiple one-ton
containers would otherwise be required to evaporate sufficient chlorine.
8.9.1.3 Chlorine Supply

75
Cylinders should be considered where the average daily chlorine use is 150 pounds or
less. Cylinders are available in 100- or 150-pound sizes. One-ton containers of chlorine
should be considered where the average daily chlorine consumption is more than 150
pounds. Large-volume shipments of chlorine should be considered where the average
daily chlorine consumption is more than two tons. Large volumes of chlorine can be
secured by tank truck, rail car, or barge.
8.9.2.1 General Chlorination system design should consider the following design factors:
• Contact time.
• Level of disinfection required.
• Volume of wastewater being treated.
• Concentration and type of residual.
• Mixing with the effluent.
• pH.
• Suspended solids.
• Industrial wastes.
• Temperature.
• Concentration of organisms.
• Type and age of organisms.
• Ammonia and nitrogen compounds concentration.
Design of facilities for effluent disinfection must consider the above factors such that
reliable disinfection is achieved at all times. Modifications to disinfection system
designs and criteria may be considered by ecology on a case-by-case basis.
8.9.2.2 Capacity
Required chlorinator capacity will vary depending on the use and point of application of
the chlorine. Chlorine dosage should be established for each Disinfection
8.9.3 Type of Treatment Dosage range, mg/L Pre-chlorination for odor control 1.5 to 10
Primary effluent 5 to 10
Trickling filter effluent 3 to 10
Activated sludge effluent 2 to 8
Sand filter effluent 1 to 5

76
The design should provide adequate flexibility in the chlorination equipment and
control system to allow controlled chlorination doses at both minimum and peak
demands. The system should be easily expandable to increase capacity over the entire
life of the treatment plant. Special consideration should be given to the operation to
ensure the chlorination system is readily operable at minimum flows and low chlorine
demand without over-chlorination of the effluent. Several sizes of rotameters must be
supplied if necessary to ensure proper dosage throughout the life of the plant. Other
inplant uses of chlorine such as odor control, spray water disinfection, sludge bulking
control, and scum disinfection should be added to the chlorine use and demand
calculations if they are also served by the system.
TYPE OF TREATMENT DOSAGE RANGE (mg/L)
Pre-chlorination for odor control 1.5 to 10 Primary effluent 05 to 10
Trickling filter effluent 3 to 10 Activated sludge effluent 2 to 8
Sand filter effluent 1 to 5
8.9.4 Reliability For reliability it is necessary to have redundant chlorine feed equipment (such as a
minimum of two chlorinators and two evaporators). Generally the chlorine demands
should be divided into disinfection and non-disinfection uses, and separate equipment
provided for each group. Appropriate piping and controls shall be provided so that the
equipment used for non-disinfection purposes may also serve as backup for the
disinfection equipment.
Five criteria must be met to ensure reliable chlorine supply at all times:
(1) Adequate reserve supply to meet demands and delays in delivery.
(2) Scales to accurately weigh chlorine inventory and monitor use rate.
(3) Manifolded system to handle high demands and to utilize backup equipment.
(4) Automatic switchover from empty containers to full ones.
(5) Alarms to alert operators of an imminent loss of supply.
8.9.5 Mixing All chlorination systems shall include a way to thoroughly mix the chlorine solution
with the effluent water stream. Mixing will significantly influence coliform destruction

77
and achieve viral and pathogen kills. Mixing will also help minimize chlorine use. The
mixing may be accomplished in almost any type of hydraulic vessel (such as open
channel, closed pipe, tank, or baffled chamber). The mixing of chlorine (in water
solution) and wastewater effluent can be accomplished by hydraulic or mechanical
mixing. Hydraulic mixing should be done according to the following criteria:
a. Pipe Flow
• A Reynolds number of greater than or equal to 1.9 x 10⁴ is required. Hydraulic jumps
for baffles may be used to create turbulence.
• A diffuser with orifice velocities of 15 ft/sec (minimum) to 26 ft/sec at peak flows
must be used.
• The diffuser must be set as deep as possible and at least two feet below minimum
wastewater level at low flows.
• Turbulent flow after mixing must be prevented in order to avoid chlorine
volatilization.
b. Open Channel Flow
A hydraulic jump with a minimum Froude number of 4.5 is necessary to provide
adequate hydraulic mixing. The point of chlorine injection should be just upstream of
the hydraulic jump because the location of the jump itself will change with variations in
flow rate. A Parshall flume is not a satisfactory location for hydraulic chlorine mixing.
c. Mechanical Mixing Mechanical mixing should be done according to the following criteria:
• A mixer-reactor tank is necessary that provides 0.1 to 0.3 minutes contact time.
• Inject chlorine just upstream from the mixer with a diffuser.
• Mixer speed should be a minimum speed of 50 revolutions per minute (rpm).
• The diffuser should be set at least 2 feet below the minimum water flow level at low
flow rate.
• Turbulent flow after complete chlorine mixing must be prevented in order to avoid
chlorine stripping.
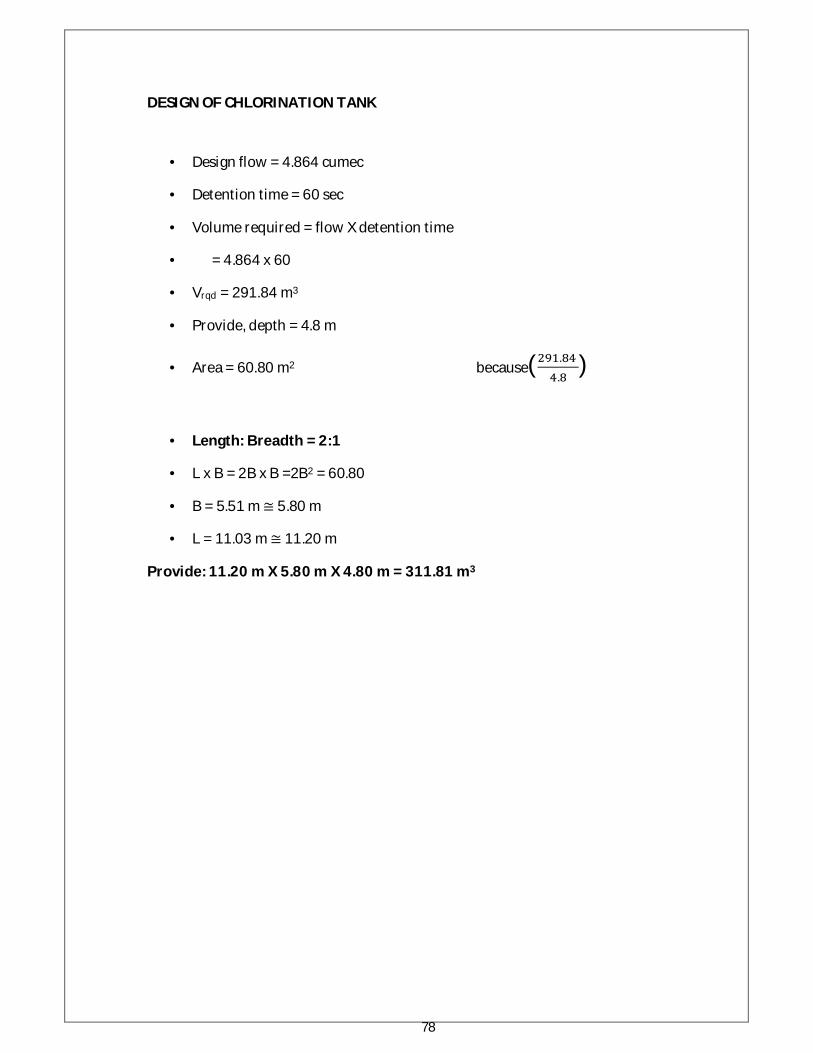
78
DESIGN OF CHLORINATION TANK
• Design flow = 4.864 cumec
• Detention time = 60 sec
• Volume required = flow X detention time
• = 4.864 x 60
• Vrqd = 291.84 m3
• Provide, depth = 4.8 m
• Area = 60.80 m2 because( . .
)
• Length: Breadth = 2:1
• L x B = 2B x B =2B2 = 60.80
• B = 5.51 m ≅ 5.80 m
• L = 11.03 m ≅ 11.20 m
Provide: 11.20 m X 5.80 m X 4.80 m = 311.81 m3

79
8.10 Sludge Tank 8.10.1 Biological kinetic Equations Used V= Q2 Q Y (S-S0) .... (1) X (1 + kdQc)
∆= ....(2)
Qr .Xr = (Q+Qr)x ....(3) Q2 demand = 1.47 (So – S) Q - 1.4 X r (Q w) .... (4) Where, V = Volume of aeration basin, m3 Qc = Mean cell residence time based on solids in the aeration basin , day Q = Influent wastewater flow rate, m3/d Y = Yield coefficient over finite period of log growth, g/g So = Influent soluble BOD5 concentration mg/ℓ S = Effluent soluble BOD5 concentration mg/ℓ X = Concentration of MLVSS maintained in the aeration basin mg/ℓ (g/m3) Kd = Endogenous decay coefficient, d-1
∆∆
= Growth of biological sludge over time period
∆t, mg/ℓ (g/m3)
Q r = Waste sludge flow rate from the sludge return line, m3/d Xr = Concentration of sludge in the return sludge line, mg/ℓ (g/m3) Qw =Waste sludge flow rate from aeration tank, m3/d

80
8.10.2 Design Criteria used 1. Provide complete mix activated sludge process using diffused aeration system. 2. The effluent shall have BOD5 and TSS of 20 mg/ℓ or less. 3. Provide eight aeration basins with common wall. Each unit may be removed from
operation for repairs and maintenance while other units shall continue to operate under normal operating procedures.
4. The biological kinetic coefficients and operational parameters for the design purpose
shall be determined from carefully controlled laboratory Studies. The following kinetic
coefficients and design parameters shall be used.
Qc = 10 d
Y = 0.5 mg/mg X = MLVSS = 3000 mg/ℓ
Kd = 0.06 d-1
Ratio of MLVSS/MLSS = 0.8 Return sludge concentration (Xr) = 15000 mg/ℓ (TSS) BOD5 for the effluent (SS) = 0.63 Influent BOD5 and TSS = 200 and 150 (mg/ℓ) respectively. Average flow = 2.432 m3/s = 210124.8 m3/day. 8.10.3 Design Calculations for the Aeration Basins: Dimensions of aeration basin and sludge growth.
1. The concentration of soluble BOD5 in the effluent BOD5 exerted by the = 20 mg/ℓ * 0.63 Solids in the effluent = 12.6 mg/ℓ Soluble portion of = 20 mg/ℓ - 12.6 mg/ℓ = 7.4 mg/ℓ the BOD5 in the effluent
2. Treatment efficiency of biological treatment
eff. = ((200 mg/ℓ - 7.4 mg/ℓ) /200 mg/ℓ) * 100 eff. = 96% (percent)

81
3. Calculate the reactor volume
V= Q Qc Y (SO − S) X (1+ kdQc )
V = 210124.8m3/ d *10d * 0.5(200 −7.4)g / m3
3000g / m3 * (1+ 0.06d −1 *10d)
V= 202350144 = 42156.28 m3
4800

82
4. Dimensions of aeration basin: Provide eight rectangular aeration basins with common walls.
Water depth = 5 m
Volume for each basin = 42156.28 8
= 5269.58 m3
Surface area for each basin = 5269.58
5
= 1053.29
Provide length to width ratio = 2:1 ∴ A = 2W 2
Provide width for each basin =22.95 m
Provide length for each basin = 2 x 22.95
= 45.91 m Provide freeboard = 0.8 m
Total depth for each basin = 5+0.8
= 5.8 m

83
Calculations for the detention time:
Detention time = volume /Q
= 44126.20 X 24 = 5.04 hr 210124.8 Calculations of Qw and Qr : Calculate the growth of biological sludge over time period:
∆x/∆t = = ( ℓ ∗ . ∗ ℓ )
( ∗ / )
=12646.88 kg/day Assume (SS) contain 80 percent volatile matter
= . .
=15808.6kg / day
Qw = (15808.6*10 mg/day) / (15000 mg/ℓ *10 ℓ/m3) Qw = 1053.9m3/day (for all basins)
Qw = for each basin = 1053.9
8 = 131.73 m3 day.
Qr will be calculated from eq. (3) Qr . Xr = (Q + Qr) x
Qr = X .Q
=3000 *210124.8
(Xr − X ) (15000 −3000)
Qr = 52531.2 m3/day (for all basins) Qr for each basin = 52531.2 8
= 6566.4 m3/day

84
= ..
=0.25⇒OK d. Calculations of Oxygen Requirements
Average flow for each basin = 210124.8 8
= 26265.6 m3 /d
Qw for each basin = 1053.9
= 131.73m3 / d O2 demand
= 1.47 (So - S) Q - 1.14 Xr ( Qw ) O2 demand = 1.47 ( 200 -7.4) * 26265.6 * 1000 - 114 * 15000*131.73* 1000 = 5.18*109 mg/d
= 5183.7kg/d (for each basin).
Compute the volume of air required :
Assuming that air weights 1.2kg/m3 and contains 23.2 percent oxygen weight.
Theoretical air Required under = .
0.232푔푄2/푎푖푟∗1.2푘푔/푚3 Filed
condition = 18619.6 m3/d
Assume that the Efficiency of air Diffusers = 7 percent

85
Theoretical air = 1861.9 cu. Mt. / 0.07 = 265994.45 m3/d = 184.71 m3/min per basin Provide design air at 150 percent of the theoretical air Total design air = 265994.45*1.5 = 398991.67m3 /d =277.07m3/min per basin.

86
9. Canvas Presentation

87

88
10. Progress made in 8th semester
There are around 66,780 houses in Bharuch City, out of which 65% houses have soak pit and 35% discharge in open. There are around 327 public latrines located all around Bharuch city.
The amount of water which is being supplied to Bharuch city is 47.41 MLD, and the amount of wastewater generated is 80% of water being supplied or water demand (i.e. 37.91 MLD).
The per capita water supply is 140 LPCD and per capita sewage contribution is 112 LPCD (i.e. 80%) and there is also some unaccounted flow of water which makes 155.25 LPCD overall.
The year – 2014 is taken as Base year
Intermediate stage - 2029
Ultimate stage - 2044
The Total water supply for design area is 17.25 MLD, so according to calculation
Total sewage generated for design area would be 16.20 MLD (i.e. 80% of water supply)
Table. 9 Different location and their sewage collected
Sr. No. Location of Tank Area for water supply Covered
Total
(MLD) Sewage Generation
(MLD)
1 Maktampur Filter Plant
PritamSociet, Dipali Society, Avadhat Nagar, Gayatrinangr Kask, rachana Nagar etc.
7.62 6.096
2
Station Tank Dhokikooi, Dandia Bazar, falshrutinagar, gheekudi, station Road, chingaspura and soci, etc
1.13 0.904
3
Sonerimahal Tank Hajikha Bazar, Bahadur Buras,
ChaklaSoneriMahal, Adus Road, Vhorvad, panchBatti, Ali etc.
1.25 1
4 Tower tank PhataTalav, dabhoiVad,
OcudaFaliya, Peerkanthi, Furja, Bazar etc.
2.8 2.24
5 Vejalpur Tank VejalpurNayanachowak, Alisjin Kali,
Talawadi etc. 1.45 1.16

89
6
Gujarat housing board Tank
Ssiddhnath Nagar, Gita park, Anank Nagar, Narayan Nagar, Yogeshwar Nagar, G.H.B in all schemes
3 2.4
7 Dungri 3 2.4
Total Bharuch 17.25 16.2
Population forecasting: When the design period is fixed the next step is to
determine the population in various periods, because the population of the
towns generally goes on increasing. The population is increased by births,
decreased by deaths, increased by migration, and increased by excession. These
are four factors which effect the change in population. The correct, present and
past population can be obtained from census office.The future development if
the town mostly depends on trade expansion, development of industries and
surrounding country, discoveries of mines, construction of railway station, etc.
These elements may produce rises, sow growths, stationary condition or even
decrease the population. For the prediction of population, it is better to study
the development 0f other similar towns which have developed under the same
circumstances because the development of the predicted town will be more or
less on the same lines.
The following are the standard methods for which forecasting of population are done are:
1) Arithmetical increase method
2) Geometrical increase method
3) Incremental increase method
4) Decreasing rate method
5) Simple Graphical method
6) Comparative graphical method
7) Master plan method
8) The logistic curve method
9) The apportionment method

90
We have chosen the Geometric increase method from the above method and will simultaneously verify it with other methods to the check the consistency of results and its variation.
Year 2001 - 167117 person (Bharuch city)
(30 years) 1971 to 2001 year- 20.20% to 25.27% growth rate
(1) Geometrical Increase Method Pn=P0(ퟏ + 풓
ퟏퟎퟎ) n
Pn= population in year 2044 P0 = present population is 1,85,545 (design area population year 2014) r = 30% assume (year 2014 to 2044) n = number of decades (3) Pn=185545(ퟏ + ퟑퟎ
ퟏퟎퟎ)3
Therefore according to mathematical calculation
Pn= 451906 person
Table.10 Different location and their sewage collected Sr No. Location of
Tank Area for water supply Covered Population
2014 (person)
Population 2044 (person)
1 Maktampur filter plant
PritamSociet, Dipali Society, Avadhat Nagar, Gayatrinangr Kask, rachana Nagar etc.
47048 103364
2 Station Tank
Dhokikooi, Dandia Bazar, falshrutinagar,gheekudi, station Road, chingaspura andsoci, etc
14543 31950
3 Soneri Mahal Tank
Hajikha Bazar, Bahadur Buras, ChaklaSoneriMahal, Adus Road, Vhorvad, panchBatti, Ali etc.
19199 42180
4 Towar Tank PhataTalav, dabhoiVad, OcudaFaliya, Peerkanthi, Furja, Bazar etc.
44334 97401
5 Vejalpur Tank
VejalpurNayanachowak, Alisjin Kali, Talawadi etc.
23635 51926
6 Gujarat housing Board Tank
Ssiddhnath Nagar, Gita park, Anank Nagar, Narayan Nagar, Yogeshwar Nagar, G.H.B is all schemes
36786 80818
7 Dungri 20149 44267
Bharuch 185545 451906

91
The various data that are needed is collected in this semester by visiting various Government bodies and Literature review of various dignitaries are studied and analysed to project out with a best solution that would be beneficial for the Bharuch city.
All the datas have veen collected and calculations are done as per the design criteria.The waste water treatment plant designed is for the ultimate year 2044.It can be said that this treatment plant will work effectively till 2044 with no need of expansion of any unit.
The initial cost of this project maybe high,but in long run its economic.This treatment plant can be applied to any land area where thr river flows nearby has high Tubidity and BOD5.

92
11. Expected Outcome
Water is a renewable resource because it gets purified through evaporation
and rain; however, only about 3 percent of the earth's water is potable.
Although nature slowly cleans wastewater over time, the main benefit of
wastewater treatment is maintaining clean water for reuse. So,
implementation of our proposal would be a helping hand to nature in
maintaining the ecology of our environment. and on the other hand looking to
the future expansion of Bharuch city from population as well as pollution
point of view ,the establishment of waste water treatment plant is very
essential to sustain human life which is dependent on river Narmada, as this
is a precious resource and after all “water is life”.
In this present semester we have done
Identification of the problem
Solution generation
Solution analysis
Evaluation and choice,
Recommending the plan
Implementation work can be carried out thereafter.
Various data such as household and population data has been procured from
Government bodies. We also had a good interaction with many of Bharuch
Nagarpalika’s executive and city engineers and discussed the various ill-effects
of wastewater disposal.
At present the waste water of this city is directly being discharged in to the
river Narmada which significantly damaging the natural source. As it is a
natural source and also the and also a reason for human lives existing in this
planet, it becomes utmost important to preserve it.
The outcome of this project will be that the life span of this city will be
increased, unhygienic conditions will be diminished, better environment for
the people to survive, Healthier city.

93
We at this stage designing the wastewater treat plant to cleanup this city from
all unhygienic conditions and to present this population an infrastructure that
will offer them a better way to discharge the water efficiently.
For this we, approached to Bharuch Nagarpalika with the intention to gather
some information to availability of Government land. There are many barren
lands available, but the most efficient one was selected for our project. Our
tentative location is Ghelani Kuva vistaar which is at outskirt to this city and
also nearby to river Narmada, So that disposal of river becomes easy and
economic.
By implementation of this project we would be able to serve the population of
Bharuch city with safe and hygienic disposal of Waste water in to the Natural
stream. This will also add to the safe and pleasant living conditions of people of
this city.

1. District Profile CHAPTER - II
1.1. District Profile
The Bharuch district is part of South Gujarat, it is bounded by Vadodara district
and Kheda district in the North, Narmada district in the East, the Gulf of
Khambat in the West and Surat in the South. City is situated on the banks of
river Narmada. Bharuch is situated 182 km from Ahmedabad and 210 km away
from state capital of Gandhinagar. Bharuch is located at 21.7° N 72.97° E. It has
an average elevation of 15 meters (49 feet). It is Class-I town as per census 2001
with a total size of population 167117. Bharuch city has high potential for
growth and development as revels made available by the census 2001. Bharuch
city has shown moderate growth of population from 1971 till the year 2001
with growth rate operation wearing from 20.20% to 25.27%. Bharuch city has
all 100% urban population with no rural population. The population density of
district has grown from 176 persons/ km2 in 1991 to 210 persons/ km2 in 2001.
The decadal growth rate of the district was 19.37 for 1991-2001, which is below
the decadal population growth rate of the Gujarat state (22.48). The urban
population of the district accounts for 25.74% of the total population of the
district. The urban population is spread over 10 towns whereas the rural
population is spread over 1178 villages. Owing to its prime location between
Ahmedabad and Surat districts and the location of the industrial township of
Ankleshwar,
Bharuch has
immense potential
for economic
development.
Bharuch Town

95
Fig: 1 BASE MAP OF BHARUCH CITY

96
2. Bharuch Town Profile
2.1 Town profile
Bharuch town is the headquarters of Bharuch district and one of the historical
towns in Gujarat state and is as District Head Quarter. This very old town was
mentioned in historical records nearly 2000 years ago. The industrial activity in
the town dates back to the 17th century when the English and Dutch established
factories here. In fact Bharuch is one of the oldest cities in India and was a
flourishing port in earlier times. The oldest dockyard in the country was
developed in this town for import and export of precious stones available in the
region.
Bharuch was once but a small village on the banks of the Narmada River but that
rivers inland access to central and northern India and with a location in the
sheltered Gulf of Khambat in the era of coastal sea travel grew and prospered as
a trading transshipment centre and ship building port. Until very modern times
the only effective way to move goods was by water transport, and Bharuch had
sheltered waters in a era without weather forecasting, compasses, and when
shipping was necessarily limited to coastal navigation, and the general East-West
course of the Narmada gave access to the rich in land empires at the upper
reaches of the Narmada, including easy caravan access to the Ganges valley and
Delhi plain.
2.2 Demographics
Bharuch city has population of 167117 as per the census 2001 having an area of
17.35 km2. Highest decadal growth rate was recorded in 1961-1971 to be
25.27% and next highest growth rate 23.55% has been shown during 1981-
1991. Presently the city is facing a decreasing growth rate and the growth rate
has decreased from 23.55% to 20.20% which is less than that of State as 22.66%
Sex ratio which on average is 932 as compared to state level average which is
919. Literacy rate of Bharuch is 78.01%. The concentration of population was
approximately 175 persons/ha. The female literacy rate in the city of Bharuch is
83%.

97
2.3 Geography
Topographic Map of India, clearly showing the rare West to East access given to
the North and Central river line valleys by the Narmada River from Bharuch. The
Narmada River outlets into the Gulf of Khambat through its lands and that
shipping artery gave inland access to the kingdoms and empires located in the
central and northern parts of the subcontinent of India. Level of difference of the
city is from 33 m to 5 m in city.
2.4 Rainfall
The district has a history of highly erratic rainfall although it receives a fairly
good quantity of rains annually. The rainfall data for the district as recorded at
Bharuch center is summarized below:
(Table 1: Rainfall data)
RAINFALL DATA FOR BHARUCH DISTRICT
DISTRICT CENTRE NORMAL
RAINFALL 2004 2005 2006 2007 2008 2009 2010
BHARUCH BHARUCH 891 523 536 885 1023 889 890 1478
2.5 Connectivity/Linkage
Bharuch is located on 21.40 northern latitude and 72.55 eastern longitudes. It is
situated on the right bank of river Narmada. It is at a distance of 28.80 km from
the sea and at a height of 17.92 mt from the sea level. The Dahej port is located at
a distance of 30 km. In the peripheral areas, mineral rich talukas like
Ankleshwer, Vagara, Amod are located within the city. Bharuch is connected with
Mumbai and Ahmedabad by broad-gage railway line, National Highway as well
as state transport service. It is connected with Jambusar Kavi village by narrow-
gauge railway line. Bharuch is a Junction station located on a Broad-gauge
railway line. It is connected with important cities of the state by rail and road as
motioned below.

98
(Table 2: Distances by rail & road)
NAME OF THE CITY DISTANCE FROM BHARUCH
BY RAILWAYS (k.m.) DISTANCE FROM BHARUCH
BY ROAD (k.m.)
MUMBAI 321 351
SURAT 60 67
VADODRA 70 75
AHMEDABAD 168 193
GANDHINAGAR nil 225
Bharuch has good network of roads including state and national highways that
connect the city with other parts of the state and the country. The state highway
passes through the city and provides high degree of connectivity of the city with
surrounding settlements. Another major road, from Mojampur to Dhorikui
Market and Palej-Nandeva road, also carries lot of importance in terms of
connectivity of the town with other areas. The under pass constructed near
railway station (which was in a very bad condition earlier has now been repaired
with the help of ONGC / GNFC organizations) has improved the movement of
goods traffic movements within and outside the city.
2.6 History and Culture of Bharuch
This Bharuch is one of the historical towns in Gujarat state and is as District
Head Quarter. This very old town was mentioned in historical records nearly
2000 years ago. The industrial activity in the town dates back to the 17th
Century when the English and Dutch established factories here. In fact Bharuch
is one of the oldest cities in India and was a flourishing port in earlier times. The
oldest dockyard in the country was developed in this town for import and export
of precious stones available in the region. Bharuch was also very important to
the sultans and other Muslim rulers who ruled Gujarat. There is an ancient
mosque called Masjid-U-Jani in Bharuch. It is an important monument to study
Islamic Architecture in Gujarat. Shukaltirth and Kabirvad are two important
picnic spots which are located at a distance of 16 and 18 Kms. respectively from

99
Bharuch. On Janmastami, huge fairs are organized here. At present, there is a
temple of Lord Shiva located near the Sardar Bridge built on river Narmada near
Jhadeshwar on the eastern part of Bharuch. It is an important place of
pilgrimage. Devotees flock this place during the month of Shravan. The Golden
bridge constructed by British ruler, is famous engineering structure of Bharuch.
The first British colony was established in Bharuch in 1616 and then in 1617, the
Dutch colony was established. Thereafter, Aurangzeb built a strong protective
wall around the city and gave it the name Shukabad. In 1772, it came under the
British Rule.
Bharuch has been situated at Narmada river so it has nos. of religious place
within it including temples, churches, mosques, Jain shrines &ParsiAgiyari.
Temples like KotilingeshwarMahadev, Kapileshwarmahadev, MotaBaliyadev,
these temples are not very old. In Dandia bazaar Swaminarayan temple was built
in V.S. 1891 (A.D. 1835), it was built up in memory of Sahjanand Swami. In the
middle of the town there is a temple of BhruguBhargeshwar which is known as
Nava Dera, houses Vaishnav Haveli of Narayan Dev. In Ali area, famous temple of
Sindhavai Mata is situated. Behind Sewashram there is an ancient temple of
NilkanthMahadev and it is believed that it was constructed in 19th century. Near
PakhaliOvara area, a famous temple of KamnathMahadev and here nine planets‟
statues are there, so it is also famous as a “Nine planets temple”
Besides above places mention, the other heritage monuments which exist in
Bharuch city are:
a) Grave of Sufi –Saint “Dada Rehan”
b) Ancient Farsi stone with inscriptions of Umad-Ui-Mulk
c) Fort of King Siddhraj Jay Sinhji – constructed during the Solanki period (1094
to 1143)
d) 400 year old LalluChowk’s Haveli famous for its wooden carvings.
The temple of 4 Veds (oldest sacred books of the Hindus) – Ruguvved,
Atharvved, Yajurvved, Samved and the only temple having the statues of four
Veds with iconography
In Bharuch city the Jain shrines of Kavi, Gandhar and Zagia are situated. Bharuch
city Jama Masjid which was founded in 1326 AD is still in existence and near civil
hospital there is mosque founded by Murtazkhan in the year 1609 AD is also in
existing with good wooden columns and the windows having wooden carvings.

100
In Bharuch city, Parsi people have noticeable population and for their prayer and
worship purpose there are seven Agiyaris in the town. Among all seven Agiyaris,
Pestanji‟sagiyari is the oldest.
In the year 1814, Roman Catholic Church scent was founded, called “Our lady of
Health”, this was destroyed in the year 1860 and the same Church was
reconstructed in the year 1887. In the year 1856, Protestant people had founded
their church.
Fig 2: Corridor and Boundary map

101
2.7 City map
Fig 3: Base map of Bharuch City
2.8 Existing water supply arrangement of Bharuch town
At present average daily water supply is 20 MLD in Bharuch municipality out of
this 6 MLD from ground water and 16 Bulk purchase of raw water, Out of this
total water supply Bharuch supply 1.5 MLD to Outgrowth areas.
(Table 3: Existing situation in water supply in Bharuch)
S.NO WATER SUPPLY UNIT VALUE
Access and Coverage Bharuch
1 Total connections no 23607
2 Coverage of water supply connections % 45.7
3 Total water supply MLD 20.0
4 Total storage capacity MLD 17.25

102
SrNo. Location of Tank Area for water supply Covered
CapacityGLSR (MLD)
Capacity ESR (MLD) Total(MLD)
CoveredPop.
1Maktampurfilter plant
Pritam Society, Dipali Society,A vadhat Nagar, Gayatri nagar,Kask, Rachana Nagar etc. 6.27 1.35 7.62 47,048
2 Station tank
Dhokikooi, Dandia Bazar, Falshruti nagar,Gheekudi, Station Road, Chingas pura & Soci, etc 0.23 0.9 1.13 14,543
3 Soneri Mahal Tank
Hajikha Bazar, Bahadur Buras,Chakla Soneri Mahal, Adus Road,Vhorvad, Panch Batti, Ali etc. 0.35 0.9 1.25 19,199
4 Towar TankPhata Talav, Dabhoi Vad, Ocuda Faliya,Peerkanthi, Furja, Bazar etc. 2.8 2.8 44,334
5 Vejalpur TankVejalpur Nayana chowak, Alisjin Kali,Talawadi etc. 0.45 1 1.45 23,635
6Gujarat Housing BoardTank
Ssiddhnath Nagar, Gita park, Anank Nagar, Narayan Nagar,Yogeshwar Nagar, G.H.B is all schemes 2 1 3 36,786
7 Dungri 2 1 3 20149Bharuch 12.1 5.15 17.25 185545
BH
AR
UC
H
Service levels and Quality
5 Per capita supply of water Lpcd 56.0
6 Continuity of water supply hours 4.0
Source: Municipality
Drinking water is being supplied by Gujarat Narmada Fertilizer Corporation (GNFC),
since 1983. GNFC supplies water tapped from Narmada river canal at Zanor near
Ankleshwar village for Bharuch city which is having undulating terrain with steep slopes
area and city is having small stretches of plain areas. This poses a unique challenge for
the water distribution system and network system as many households have to undergo
either with non-availability of water or at very low pressures despite of the fact that
they have the properties have water connections.
Existing water supply arrangement is based on local tube wells drilled in the vicinity of
the town. Details of tube wells, pumping machinery, connecting ESR is as under.
(Table 4: Location of OH water tank and their capacity)
Quality of Water
Narmada river water is tapped by GNFC at Zanor near Ankleshwar village at 21
km from Bharuch through 3.5 mt. dia. RCC intake well. The water is treated by 2
nos. of rapid gravity filtration plant with clariflocculators. The 2 treatment plants
are of capacities 9 MLD and 13.5 MLD. Water is stored in 2.27 ML RCC clear
water sump at Maktampur. The water supplied from 10 nos. of bore wells also
have the chlorination facilities for the treatment of water before it is being
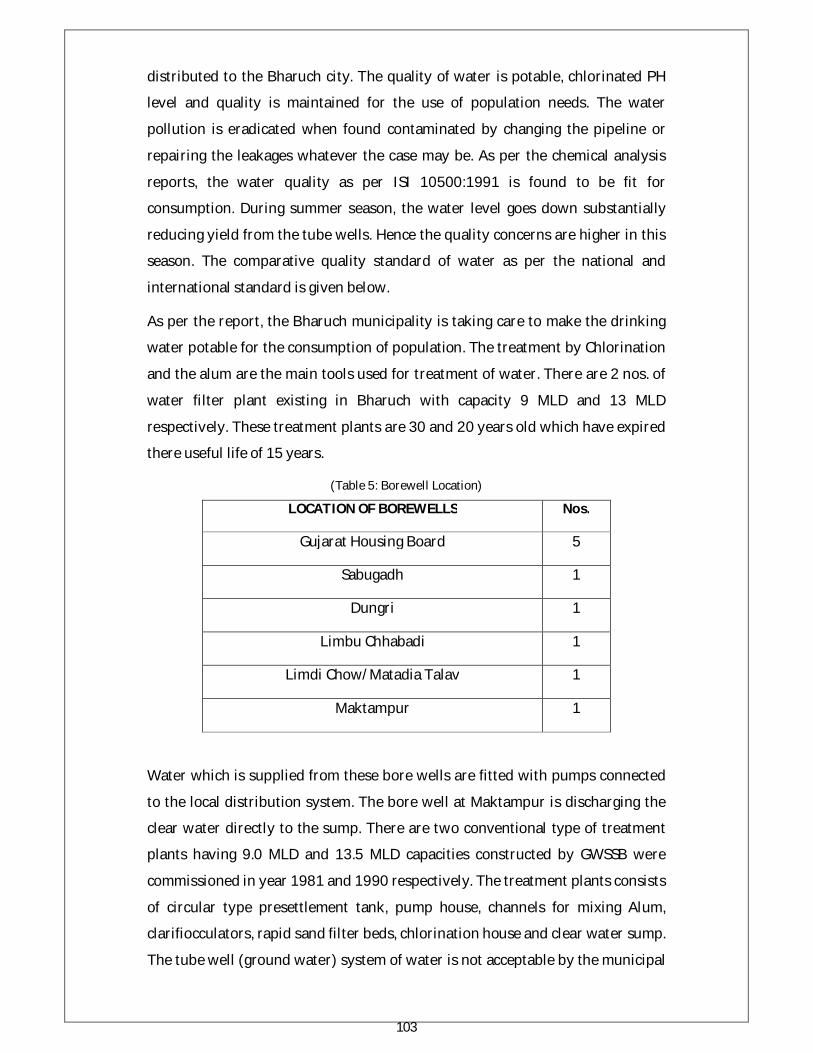
103
distributed to the Bharuch city. The quality of water is potable, chlorinated PH
level and quality is maintained for the use of population needs. The water
pollution is eradicated when found contaminated by changing the pipeline or
repairing the leakages whatever the case may be. As per the chemical analysis
reports, the water quality as per ISI 10500:1991 is found to be fit for
consumption. During summer season, the water level goes down substantially
reducing yield from the tube wells. Hence the quality concerns are higher in this
season. The comparative quality standard of water as per the national and
international standard is given below.
As per the report, the Bharuch municipality is taking care to make the drinking
water potable for the consumption of population. The treatment by Chlorination
and the alum are the main tools used for treatment of water. There are 2 nos. of
water filter plant existing in Bharuch with capacity 9 MLD and 13 MLD
respectively. These treatment plants are 30 and 20 years old which have expired
there useful life of 15 years.
(Table 5: Borewell Location)
LOCATION OF BOREWELLS Nos.
Gujarat Housing Board 5
Sabugadh 1
Dungri 1
Limbu Chhabadi 1
Limdi Chow/Matadia Talav 1
Maktampur 1
Water which is supplied from these bore wells are fitted with pumps connected
to the local distribution system. The bore well at Maktampur is discharging the
clear water directly to the sump. There are two conventional type of treatment
plants having 9.0 MLD and 13.5 MLD capacities constructed by GWSSB were
commissioned in year 1981 and 1990 respectively. The treatment plants consists
of circular type presettlement tank, pump house, channels for mixing Alum,
clarifiocculators, rapid sand filter beds, chlorination house and clear water sump.
The tube well (ground water) system of water is not acceptable by the municipal

104
authority as the quality of water is not potable and hence these tube wells are
not in use presently. Also the pumps are very old and poorly maintain which has
affected their efficiency.
Water storage
The water storage available for the distribution system at GSR (Ground storage
reservoirs) and ESRs (Elevated storage reservoirs) are given below. The storage
facility of new reservoirs at GHB (Gujarat Housing Board) and Dungari are
nearing completion and hence are considered as existing. The work is going on
and connecting mains are being laid at present. Considering the existing total
available storage and total demand of 34 MLD, the storage capacity appears to
around 60% of the total need which is fairly good. But this distribution of supply
for the city is not meeting the total requirements, hence there is need to create
more storage system which may be provided at Jadeshwar area with new
reservoir.
Distribution system
The distribution system is mainly through the reservoirs at five locations with
75.0 km length of pipeline. The distribution pipes were laid in the year 1963 and
extended as and when funds were made available, along with the improvements
schemes taken up from time to time. The materials for pipes used for
distribution are AC, PVC and Cast iron. However, the length of distribution
system is substantially less compared to the number of household connection
and in connection to road length; the actual length available is on the higher side.
The details of the age, pipeline material and length of pipes are given as under:
(Table 5: Pipe Network and material made of)
Sr. No Network Pipe Material Length of pipe (k.m.) Age
1 Main Flow (from source to city) Cast Iron 16 50 yrs
2 Feeder (main) flow (transition)
main from source to storage place Hume steel 5 40 yrs
3 Distribution Network (from storage to customer/standpost)
Cast Iron 27 40 yrs
Source: Municipality

105
Frequency of water supply
As per the information made available by the municipality, the frequency of
water supply is normally 2 to 11 hours a day, out of which 2 to 6 hours are in the
morning and 2 to 5 hours in the evening time. However, most of the consumers
get water for less numbers of hours due to their location at tail end or at higher
levels. Inequitable distribution is a common problem particularly faced by the
residents in old town due to steep slopes and ineffective valves operations.
(Table 6: Details of water distribution from existing source)
Water tank/ Tube Well Morning Time
Evening Time Service areas
Station Tank 7:00 - 11:30 6:30 - 11:30
Dholikui area,Narmada society,Pushpakunj ,Baranpura,Railway
sump & 24 Hours supply to S.T.depot and fire brigade Tanks
Soneri Mahal 3:00 - 9:30 4:00 - 9:00 Swaminarayn Slope to vhorwad area,Paanch Batti Fatatalavo areas
Tower Tank 3:00 - 7:00 5:00 - 7:00 Entire tower areas of PriKanthi
Vejalpur tank 4:00 - 6:30 5:00 - 7:00 Machinate,Kumbhariya dholav,Suthar faliya & Vejalpur area
GHB Tube well No. 1 5:00 - 11:00 3:00 - 8:00 Krishnanagar,rangavarsha,Valshruti,Sindh
unagar,Gandhigram,gayatri nagar,Mukti Nagar
GHB TW2 5:00 - 11:30 2:00 - 1:30 Siddhnath Nagar,maruti nagar,Neelkanth nagar,Green park, Narain nagar
GHB TW3 6:00 - 10:00 4:00 - 8:00 Ayodhya nagar area Part- I
GHB TW4 6:00 - 11:00 4:00 - 8:00 Mukti nagar, Bahumali upto Anand mangal
society GHB TW5 5:00 - 11:30 3:00 - 8:30 Matariya talav surrounding area
Sabugadh Tubewell 8:00 - 11:00 3:00 - 6:00 Mundafaliya,khatkivad,Dabhoiyavad,Ali
patel faliya,garijanavad
Dungri Tubewell 5:00 - 7:30 3:00 - 5:30 Nanidungri,MotiDungri areas
Limbu Chhapri Tubewell 5:00 - 7:30 Due less yield frfom this well water is supplied during morning hours only
Limdi Chowk 7:00 - 9:00 3:00 - 5:00 Limdi chowk,Vejalpiur tank area

2.9 Existing Sewerage system
As Bharuch city has undulating terrain, storm water drainage is special problem
for disposal. Presently the city has uncovered open drains resulting in overflow
and choking. These open drains are not cleaned regularly. Also due to the
proximity of sea, the city also has tides coming into the city areas. This adds to
the problem of drainage and storm water disposal. During the heavy rains and at
the times of high tides, the water remains for a longer period, particularly in the
low lying areas. The Station-Jambusar road is situated on the rain-water flow of
surrounding villages which is always full of problems. The 4 Nallas located in this
area are not cleaned up regularly and this also causes inundation. Bharuch city
receives rainwater flow from 20-25 villages which causes the flooding to the city
areas. Even 4 to 5 inches of rains during the rainy season causes heavy floods in
the city areas.
(Fig:4 Present drainage problem)
2.10 Design Criteria
Table 7: Calculation
Project Area Bharuch town
Base year 2014
Intermediate stage 2029

107
Ultimate stage 2044
Per capita sewage contribution 112 lpcd i.e. 80% of Water demand
Ground water infiltrates -
Peak factor 3.00, depending upon contributory population
Co-efficient of Roughness: Salt glazed stone ware, Good / Fair – 0.012/0.015, for
coller joint n=0.011
Sewer Net work Minimum velocity 0.80 m/s
Maximum velocity 2.40 m/s
Man hole spacing @ 30 m along straight length
@ deviations @ Branch @ tail end
Depth of flow 0.80 full @ ultimate peak
Invert drops: For sewer less then 400mm 1: 100 to 1:1500
Man hole Type A Type (150 to 600 dia.) Up to 1.50 m.
B Type (150 to 600 dia.) 1.51 to 4.00 m.
C Type (150 to 1500 dia.) 4.01 to 6.00m.
Scraper MH (150 to 1500 dia) 2.50 to 9.00m
S Type sewer Above 950 mm 100 to 300 m. spacing
Self Cleaing velocity 0.6 meter/second
Maximum permitted depth of
flow up to 400 mm dia
0.80 d
Spacing of manholes 30 mt or junctions
Software Manual Hydraulics Design

108
Pumping machinery non clog Sewer Submersible pump
Rising Main DI pipes
Treatment SBR TYPE STP
2.11 Need for Project
It is absolutely necessary to go for establishing underground piped sewerage
system to upgrade the status of sanitation of the municipality area from the
consideration of health ground. As in Bharuch town is no underground drainage
system in city and the system of septic tanks and soak pits for latrines in the
household is being used for the disposal of sludge at the household level. For
slum areas, the toilets having low cost sanitation are being provided by
constructing the soak pits and septic tanks and the subsidy provided by the
municipality.
The amount of sewage generated in Bharuch is about 37.91 MLD i.e.
approximately 80% of the daily water supply of 47.41 MLD. At present Bharuch
city has no sewerage system and most of the houses have their own septic tanks
and soak pits. Most of which are located below the road levels in gamtal areas.
The existing sewerage system in Bharuch city is open and unhygienic within the
city and having high population density. Due to presence of black cotton soil, the
permeability is low hence over flow from the septic tanks and soak pits is
common problem. The flow from these soak pits is discharged into the nearby
natural nalla (ravine) and finally the untreated wastewater is directly flowing
into the river Narmada. The undulating topography of gamtal area, the sewage
water and sludge is not effectively drained off. The natural drains passing
through the city get filled up during the development process and together with
storm water; the drainage problem gets aggravated during the rainy season.
During rainy seasons the water overflows on the roads, which are already
uneven, the traffic movement is greatly affected and damages to the properties
also occur in gamtal area. Due to the unhygienic disposal of sewage, mosquito /
flies nuisance is prevailing in most of the areas. The Bharuch municipality is
constructing the open drain system for disposal of sewage water in gamtal area.

109
The rubbish of the city and human excreta are disposed off outside the city
through night soil tankers. There are 327 public latrines in different areas of the
city.
The following in general inference, which established the need of project:
The sewage is disposed off into River Narmada or nearby natural streams
without treatment. So to stop the pollution of natural water bodies, a need
is there to provide a treatment plant for Bharuch town.
Sewage treatment is absolutely necessary to bring the sewage to desired
standards before its disposal into the river.
Where the water supply status will be improved, there will be improvement
in the adequate availability of water in the municipal area releasing
increase wastewater flow. If no downstream facilities like underground
drainage facilities are provided, unsanitary conditions will definitely
increase by way of overflowing drains, flow of wastewater on roads,
ultimately inducing health hazard.
At present, the wastewater is released in the river and natural streams
without any treatment. Large cesspools are formed, which putrefy and give
foul smell. These are places where mosquitoes breed. The wastewater also
pollutes the ground water. Large numbers of well and tube-wells provided
are also affected by this way due to pollution.
Around 66780 houses are in Bharuch.
Around 65% houses are having soak pits and 35% defecate in open.
In Bharuch town, existing open drains carry sullage causes bridging of
mosquitoes and unhygienic atmosphere.
In view of above, Bharuch Nagarpalika, Bharuch has taken up the project for the better environment of the town people.

110
3. Bharuch Sewerage system Augmentation
3.1 Waste water quantity for Bharuch
Per Capity Water Supply 140 lpcd
UN Accounted Flow of Water (UPF) 15%
Total 155.25 lpcd
80% of 140 lpcd is considered as daily dry weather flow i.e. 112 lpcd
3.2 Proposed Augmentation
(Table 8: Design Criteria)
Project area Bharuch town
Base year 2014
Intermediate stage 2029
Ultimate stage 2044
Per capita sewage contribution 112 lpcd i.e. 80% of Water demand
Peak factor 3.00, depending upon contributory population
Co-efficient of Roughness: Salt glazed stone ware, Good / Fair –
0.012/0.015,RCC pipes for coller joint n=0.011
Sewer Net work Minimum velocity 0.80 m/s
Maximum velocity 2.40 m/s
Man hole spacing @ 30 m along straight
length
@ deviations @ Branch @

111
tail end
Depth of flow 0.80 full @ ultimate
peak
Invert drops: For sewer less then 400mm 1: 100 to 1:1500
Man hole Type A Type (150 to 600 dia.) Up to 1.50 m.
B Type (150 to 600 dia.) 1.51 to 4.00 m.
C Type (150 to 1500 dia.) 4.01 to 6.00m.
Scraper MH (150 to 1500 dia) 2.50 to 9.00m
S Type sewer Above 950 mm 100 to 300 m.
spacing
Self Cleaing velocity 0.6 meter/second
Maximum permitted depth of flow up to
400 mm dia
0.80 d
Spacing of manholes 30 mt or junctions
Software Manual Hydraulics Design
Pumping machinery non clog Sewer Submersible pump
Rising Main DI pipes
Treatment STP
Collection and Conveyance System
The collection and conveyance of sewage system is explained in detail.
I) Sewer Network
Design of sewer network will be divided as under:

112
1 Hydraulic Design
2 Structural Design
3 Selection of Pipe Material
3.2.1 Hydraulic Design
3.2.1.1 Adopted Design Criteria –
The design of Bharuch sewerage system has based on the design criteria given in
the manual on Sewerage and Sewage Treatment (Second Edition) 1993
published by CPHEEO, Urban Development Department, and Govt. of India and
prevailing standard engineering design practices.
3.2.1.2 Design Period
The planning for sewerage network of Bharuch is done considering 2044 as the
ultimate year.
3.2.1.3 Design Population
The network has been designed for the projected population of year 2044.
3.2.1.4 Flow Assumption
As intended by city planners, it is assumed that the NagarPalika will find ways
and means to supply water to the city at a uniform rate of 112 LPCD in all
command areas. This includes extraction of water from private bore-wells. The
rate of sewage generation is taken as 80 % of the water supply. The estimated
peak flow adopted for hydraulic design depends upon contributory population.
3.2.1.5 Peak Factors
Based on the recommended value of peak factor as per CPHEEO’S manual on
Sewerage and Sewage Treatment the peak factors adopted for contributory
populations of drainage area. Depending upon the contributory population, the
peak factor changes, it being higher for less population and lower for high
population.

113
(Table 9 presents CPHEEO’s criteria for peak factors)
Contributory
Population
Peak Factor as per
CPHEEO
Recommended Peak
Factor
Upto 20,000 3.0 3.0
20,000 – 50,000 2.5 2.5
50,000 – 7,50,000 2.25 2.25
Above 7,50,000 2.0 2.0
3.2.1.6 Flow Friction Formulae
For design purpose, the flow of sewage in pipes is presumed to be a steady and
uniform flow. The most popular equation for calculation of velocity and head loss
for flow conditions like gravity sewers is the Manning’s formula and Darcy-
Weisbach formula respectively. The Manning’s equation has most widespread
application.
Recommended Equation
Manning’s formula given below is commonly used for design of sewers.
V = 1/n (3.968 x 10⁻³) D2/3 S1/2
Q = 1/n (3.118 x 10⁻⁶) D8/3 S1/2
Where,
Q = Quantity of flow in lps.
S = Slope of hydraulic gradient line.
D = Internal diameter of pipeline in mm.
V = Velocity in m/s.
n = 0.015 for pipes upto 600 mm diameter

114
= 0.013 for pipes above 600 mm diameter will be adopted for design.
(Table 10 Coefficient of Roughness used In Manning’s Formula)
Type of Pipe Material Condition n
Salt glazed stone ware
pipes
(a) Good
(b) Fair
0.012
0.015
Cement concrete pipes
(with collar joint)
(a) Good
(b) Fair
0.013
0.015
Asbestos cement 0.011
Plastic (smooth) 0.011
3.2.1.7 Depth of Flow
It is necessary to size the sewer to have adequate capacity for the peak flow to be
achieved at the end of design period, so as to avoid steeper gradients and deeper
excavation. For the ultimate design period, the sewers are designed flowing 80%
full (d/D = 0.8).
3.2.1.8 Velocity of Flow
The flow in sewers varies widely from hour to hour and also seasonally, but for
purpose of hydraulic design peak flow is adopted. However, it is to be ensured
that a minimum velocity is maintained in the sewers even during minimum flow
conditions. At the same time the velocity should not be excessive to cause
erosion.
Velocity of Minimum flow
It is necessary to size the sewer to have adequate capacity for the peak flow to be
achieved at the end of design periods, so as to avoid steeper gradient and deeper
excavations. For design of sewers, minimum velocity should be 0.60 mps. To
avoid erosion in the sewer network, velocity more than 3.0 m/sec is not allowed

115
in the present design. As per CPHEEO manual minimum velocity and slope
recommended are presented in Table 9 for peak flows up to 30 LPS.
(Table 11 Recommended Slopes for Minimum Velocity)
Present Peak flow in lps Slope per 1,000
2 6.0
3 4.0
5 3.1
10 2.0
15 1.3
20 1.2
30 1.0
The minimum diameter of 200 mm is used for public sewers.
Erosion and Maximum Velocity
Maximum velocity in sewer is not to exceed 3.0 mps. However, in the initial
sections where very less population is served by sewer the minimum velocity of
0.6 mps is not available. For cleaning of such sewers/sections the flushing is
required. The provision for flushing the sewer is made in the project equipment.
Depth of flow and velocity of collecting pipeline should be checked for its
minimum and maximum values as per the CPHEEO Manual.
3.2.1.9 Sizing of Pipes and Slopes
The size of pipes and slope is calculated for contributory population based on the
population density of the respective administrative wards forecasted for the
design year 2044. The pipe diameter is selected by considering pipe flowing 80
% full for the ultimate flow. The corresponding flattest slope is provided so as to
achieve the minimum required self-cleaning velocity with an aim to minimize
sewer depth thus ensuring reduced cost.

116
Minimum Pipe Size:
The sewerage system for Vapi has been designed considering the minimum size
of sewer as 200 mm.
3.2.1.10 Minimum Depth of Cover
The starting manhole depth of the proposed sewers ranges from 1m to 2.5m
depending upon the topography and detail of road planning network available.
The minimum depth of cover depends on the depth of the starting manhole and
subsequent ground level of the road along the sewer.
3.2.1.11 Sewer System Layout Planning
City is divided in to 5 zones for convenience of sewer system Planning. Sewer
System is planned according to falling of contour and ground levels.
Software Used
Sewer CAD software is used for designing of pipe line, partially.

117
4. Manholes
Man holes form one of the essential structures in any sewerage system. They are
generally provided at every change of alignment of sewer at every junction of
two or more sewers at head of all sewers or branches, wherever there is a
change in size of sewer and at regular intervals in the sewers and other
maintenance operations.
Spacing of manholes (CPHEEO Manual Page 74) sewer which are to be cleaned
manually, which can not be entered for cleaning or inspection, the maximum
distance between manholes should be 30 m.The spacing of manholes on large
sewers above 900 mm diameter is governed by the following for the sewers to
be cleaned manually.
(a) The distance up to which silt or other obstruction may have to be
conveyed along the sewer to the nearest manhole for removal.
(b) The distance up to which material for reports may be conveyed through
the sewer and
(c) Ventilation requirements for men working in the sewer. CPHEEO Manual
recommends further as under spacing on straight run may be allowed as
under:
(i) 900 mm to 1500 mm dia - 90 to 150 m.
(ii) 1.5 m. to 2.0 m. dia - 150 to 200m.
(iii) Over 2.0m. dia - 300m.
However, manhole spacing is adopted as under for this sewerage system.
(a) For sewers upto 450 mm dia -30 m. c/c
(b) For sewers 500 to 900 mm dia -40 m.c/c
(c) For sewers 1000 to 1600 mm dia - 50 m. c/c
(d) For sewers 1800 mm dia & above – 60 m c/c
4.1 Type of Manholes
The CPHEEO Manual on sewerage and sewerage treatment (Second Edition)
provides consideration of following type manholes.
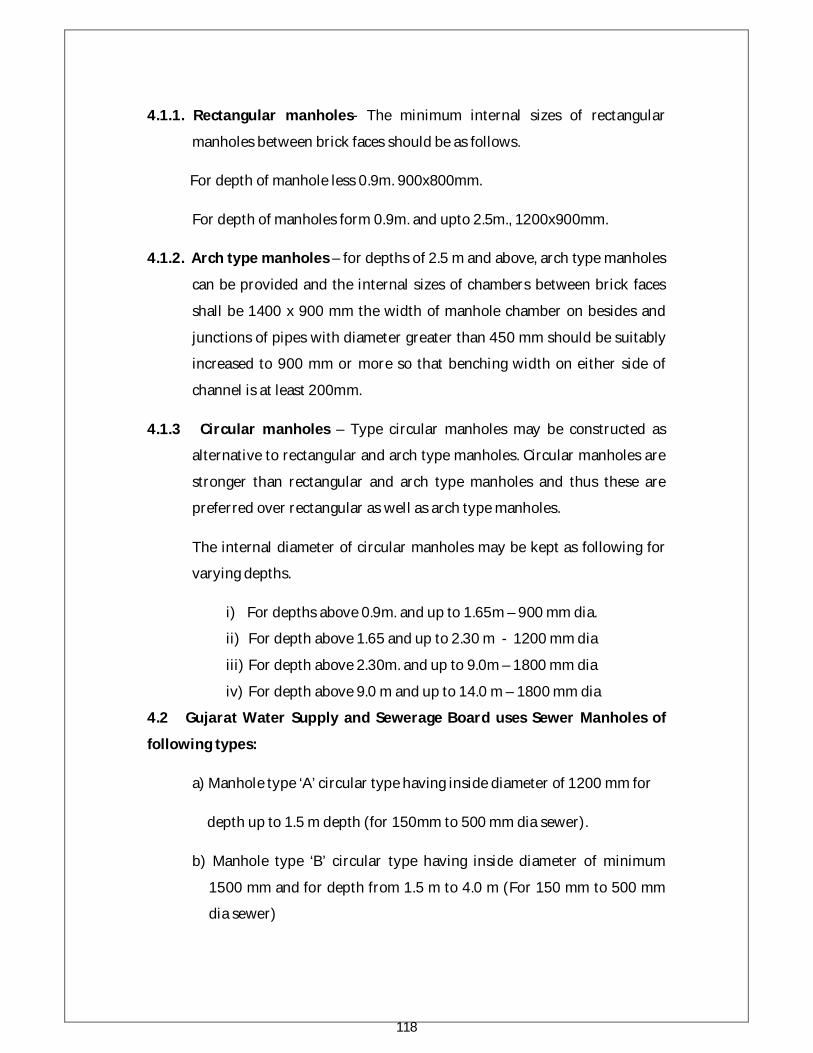
118
4.1.1. Rectangular manholes- The minimum internal sizes of rectangular
manholes between brick faces should be as follows.
For depth of manhole less 0.9m. 900x800mm.
For depth of manholes form 0.9m. and upto 2.5m., 1200x900mm.
4.1.2. Arch type manholes – for depths of 2.5 m and above, arch type manholes
can be provided and the internal sizes of chambers between brick faces
shall be 1400 x 900 mm the width of manhole chamber on besides and
junctions of pipes with diameter greater than 450 mm should be suitably
increased to 900 mm or more so that benching width on either side of
channel is at least 200mm.
4.1.3 Circular manholes – Type circular manholes may be constructed as
alternative to rectangular and arch type manholes. Circular manholes are
stronger than rectangular and arch type manholes and thus these are
preferred over rectangular as well as arch type manholes.
The internal diameter of circular manholes may be kept as following for
varying depths.
i) For depths above 0.9m. and up to 1.65m – 900 mm dia.
ii) For depth above 1.65 and up to 2.30 m - 1200 mm dia
iii) For depth above 2.30m. and up to 9.0m – 1800 mm dia
iv) For depth above 9.0 m and up to 14.0 m – 1800 mm dia
4.2 Gujarat Water Supply and Sewerage Board uses Sewer Manholes of
following types:
a) Manhole type ‘A’ circular type having inside diameter of 1200 mm for
depth up to 1.5 m depth (for 150mm to 500 mm dia sewer).
b) Manhole type ‘B’ circular type having inside diameter of minimum
1500 mm and for depth from 1.5 m to 4.0 m (For 150 mm to 500 mm
dia sewer)

119
c) Manhole type ‘C’ circular type having inside diameter of 1500 mm and
for depth beyond 4.0 m to 6.0 m (For 150 m to 500 mm dia sewer)
d) Manhole type ‘D’ circular type having inside diameter of minimum
1500 mm and for depth beyond 6 m to 10 m.
4.3 Vent shafts
In well designed sewerage system, there is no need to provide ventilation. The
ventilating columns are not necessary where intercepting traps are not provided.
However, nominal provisions for vent shafts are suggested for the escape of air
to take care of the exigencies of full flow.
4.4 House Connection and Chamber
Necessary provision for house connection with chambers and 100 mm dia stone
ware pipe is in the project. The one chamber will be provided between two
houses. At present in Vapi city residential building and non residential building
40,000. Considering fast development of city the approximate no of building will
be 64000 in intermediate stage. Thus, considering 10% approx. for poor people
above 57600 building will require house connection against which existing
house connected are 40000. Thus, approximately 17600 building will have to be
provided with sewer facility. For immediate stage 32,000 additional buildings
will be provided with facility of house connections. Considering one connection
between two houses the 16,000 additional house connections are proposed in
the project. Provision for resurfacing the roads damaged during the excavation
of pipelines is made in the estimate of sewer collecting system.

120
5. Sewage Pumping Station
5.1 Civil Works
5.1.1 General
The area in which the pumping station is situated is fixed generally by the duty it
has to perform, but the precise site varies so as to take into account the following
considerations:
a) As pumping station are frequently low-lying areas, consideration should
be given to the possibility of flooding and information should be obtained
as to the highest recorded flood levels in the area.
b) The pumping station site should be above the highest recorded flood
level, but when construction on ground liable to flood is unavoidable, it
should be so designed that motors are well above the highest recorded
flood level and above the coping of the wet well or suction chamber.
c) The site should be selected if possible so that in the event of power failure
any overflow which occurs may be diverted or will find its way into
watercourse without causing flooding or serious damage to property;
however, this should not pollute any water course used for drinking
water purpose.
5.1.2 Nuisance
A pumping station should be located at a distant as possible from the residential
properties on account of possibility of complaints for noise or smell.
5.1.3 Capacity of pumping stations
The capacity of the pumping station is designed considering present and future
sewage flows for a design period of 15 years as per CPHEEO manual. The civil
structure & pipeline of wet well is designed for a flow of 30 years. Therefore, the
pumping station is designed based on needs of future expansion especially in
respect of provision of additional space for pumping units.

121
5.1.4 Type of pumping stations
Generally, pumping station has two wells – the wet well receiving the incoming
sewage, having alongside a dry well housing the pumps. Uses of wet pit pumps
need not the dry well. However, in designing the pumping station, either both
wells or only wet well are required is decided based on the design period of the
project space available and the types of the pumps selected.
There are four types of the pumping arrangements as mentioned in the CPHEEO
manual:
A) Pumping station with Vertical Pumps in Dry Well:
In this option, Centrifugal pumps with bottom suction are installed in dry
well. The motor are installed on the floor which are separately casted
below the loading – unloading platform. In this way we are avoiding the
losses due to the shaft extension up to loading-unloading platform and
also unnecessary cost of the shaft length. The maintenance of the
pumping machinery is very easy and hence the life of the pumping
machinery is long. In flooded condition, the motor are not damaged as
motor are installed on the higher level. However, in this option
periodically maintenance of the extended shaft is very difficult. The cost
of civil construction of the dry well is recovered as the operational and
maintenance cost of the pumping machinery is less with respect to other
type of pumping arrangement.
B) Pumping station with Vertical Pumps in Wet Well
In this option Vertical turbine pumps are installed in wet well. The motor
are installed on the floor above the ceiling of the wet well. As the pumps
are installed in the wet well, the dry well is not necessary.
C) Pumping Station with Submersible Sewage Pumps in Wet Well
In this option, pump-motor sets are installed in wet well. As the pump-
motor sets are installed in the wet well, the dry well is not necessary.
D) Pumping Station with Horizontal Pumps in Dry Well:

122
In this option, Horizontal non clog Centrifugal pumps with side suction
are installed in dry well. The motor are installed on the same foundation
on the pumps are installed. Hence, in this option, during flooded condition
there is possibility of the damage of the motor. Also, the width of the
pumping station is also more as compare to above two options. So this
option is not feasible.
5.1.5 Design considerations for wet well
5.1.5.1 Wet Well
The size of the wet well is influenced by the storage capacity to be provided. The
storage capacity is required to be designed, especially for all sewage pumping
stations, where automatic controls and variable speed drives are not provided to
match pumping rates exactly with inflow rates to the station. The selection of the
proper storage capacity is critical because it affects:
a) The time for which the liquid will be retained in the pumping station, and
b) The frequency of operation of the pumping equipment.
The shape of the wet well and the detention time provided shall be such that
deposition of solids is avoided and sewage does not turn septic. The capacity of
the wet will is also concerned with the difference between the highest level of
the liquid in the wet well and the minimum level after the depletion by pumping.
This should be such that the pump of minimum duty also would run for at least 5
minutes. The capacity of the well is to be so kept that with any combination of
inflow and pumping, the cycle of operation for each pump will not be less that 5
minutes and the maximum detention time in the wet well will not exceed 30
minutes of average flow. This is as per CPHEEO Manual.
Considering the above requirements of CPHEEO Manual, the wet well for 30
minutes of average flow is provided. Whenever possible, grit removal
ahead of pumping should be adopted to increase the life of the pumps. Coarse
screen before the wet well will be provided having a clear opening of 25 mm
between the bars for the manually cleaned type. The screening units will be

123
provided in duplicate. The screens will conform to IS 6280. The coarse screen
with opening of 25 mm between the bars will be provided for manually cleaned
screen. The detail design of screen is appended vide Annexure-3(a), 3 (b), 3(c)
The details of pumping stations provided are presented in Table.15
The plinth level of pumping station and sub-pumping stations are kept
considering highest flood level in monsoon for protecting pumping main and
electrical equipments. Considering site situation, by pass arrangement is
provided to divert the sewage flow in nearby drain in emergency for main
pumping station.
5.2 Plant machinery
5.2.1 Pumps
5.2.1.1 Requirement of sewage pumps
As per CPHEEO manual, the capacity of a pump is usually stated in terms of dry
weather flow (DWF) estimated for the pumping station. The general practice is
to provide 3 pumps for a small capacity pumping station comprising 1 pump of 2
DWF, 2 of 2 DWF for large capacity pumping stations. 4 pumps are usually
provided, compromising 2 of 1 D.W.F. and 2 of 2 D.W.F. capacities. Overall
capacity of pumping machinery is proposed as per manual.
For protection against clogging the suction and delivery openings of the pumps is
not be less than 100 mm and the pumps to be capable of passing a ball of at least
100 mm dia.
5.2.1.2 Pumping Station
Generally, the pump capacity is decide on the basis of the following factors:
Average and Peak Flow
Capacity of the wet well available.
Carrying capacity of the receiving sewer.
The capacity of the pumps shall be adequate to meet the peak rate of flow with
50% standby. To obtain the least operating cost the pumping equipment shall be
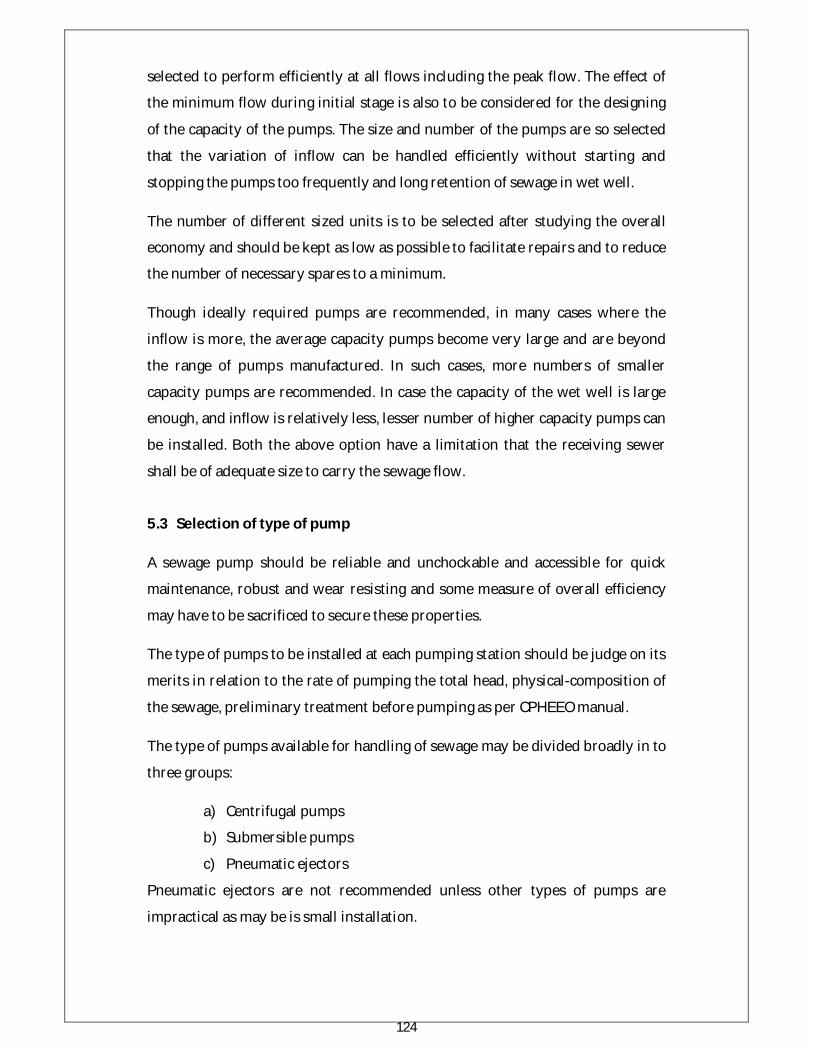
124
selected to perform efficiently at all flows including the peak flow. The effect of
the minimum flow during initial stage is also to be considered for the designing
of the capacity of the pumps. The size and number of the pumps are so selected
that the variation of inflow can be handled efficiently without starting and
stopping the pumps too frequently and long retention of sewage in wet well.
The number of different sized units is to be selected after studying the overall
economy and should be kept as low as possible to facilitate repairs and to reduce
the number of necessary spares to a minimum.
Though ideally required pumps are recommended, in many cases where the
inflow is more, the average capacity pumps become very large and are beyond
the range of pumps manufactured. In such cases, more numbers of smaller
capacity pumps are recommended. In case the capacity of the wet well is large
enough, and inflow is relatively less, lesser number of higher capacity pumps can
be installed. Both the above option have a limitation that the receiving sewer
shall be of adequate size to carry the sewage flow.
5.3 Selection of type of pump
A sewage pump should be reliable and unchockable and accessible for quick
maintenance, robust and wear resisting and some measure of overall efficiency
may have to be sacrificed to secure these properties.
The type of pumps to be installed at each pumping station should be judge on its
merits in relation to the rate of pumping the total head, physical-composition of
the sewage, preliminary treatment before pumping as per CPHEEO manual.
The type of pumps available for handling of sewage may be divided broadly in to
three groups:
a) Centrifugal pumps
b) Submersible pumps
c) Pneumatic ejectors
Pneumatic ejectors are not recommended unless other types of pumps are
impractical as may be is small installation.

125
Initially Submersible pumps are economic as for the installation of submersible
pumps single well is to be constructed. But the operational cost of the
submersible pumps is high as compare to vertical non-clog pumps. In
submersible pump-motor sets, the removal of heat due to electric losses from
submersible motor is achieved by natural & forced convection through the water
flowing over the motor case. Hence, greater the motor case surface area, more
heat is removed but the rotor diameter is increased which will lead to greater
friction – loss and hence power. Therefore for larger capacity, the overall
efficiency of the submersible pump-motor sets is less as compared to vertical dry
well mounted pumps.
For vertical non-clog dry well mounted, the initial cost is high due to dry well is
to be constructed. However, the operational and maintenance cost per annum is
low as compare to submersible cost, therefore the initial investment is to be
recovered within the life of pumping machinery.
It is proposed to provide submersible pumps for the three pumping station consisting of wet well only. Pumps will be provided SETC submersible type.

126
6. Sewage Pumping main
6.1 Requirement for Pumping the Sewage
A sewerage system is designed for collection, treatment and disposal. The design
of the system to be used depends on both technical and financial considerations.
Gravity lines, as the proceeds towards downstream end, the depth of sewer line
increases to maintain the required gradient. Sometimes the gravity sewer line
depth becomes too large to maintain required gradient. In such situation, apart
from the difficulty faced during installation, the cost of lying becomes prohibitive
due to high excavation/maintenance cost. In such cases a pumping main at
nominal depth reduces excavation/maintenance cost.
The flow in sewers is not constant & generally varies considerably at different
hours of the day. It also varies seasonally. Also during the early life of the
pumping stations the flow in the sewers may be substantially below the design
flow. For this type of irregular flow, the discharge from the pumping stations
provides a beneficial flushing effect in the sewers.
Following benefits are there by providing the pumping of the sewage.
Avoidance of excessive depths of sewer
The drainage of low lying parts of an area
A flushing effects for the irregular flow i.e. below the design flow
The development of areas not capable of gravitational discharge to a
sewage treatment works.
Avoiding an inverted siphon
The centralization of sewage treatment
6.2 Design of Economic size of pumping main
The cost of pipe material & its durability for design life are the two major
governing factors in the selection of pipe material. The pipeline may have very
long life but may also be relatively expensive in terms of capital & recurring costs

127
& therefore, it very much necessary to carry out a detailed economic analysis
before selecting a pipe material.
To determine the most economical choice, the principles of economics must be
applied through long term cost benefit analysis known as ‘Life Cycle Cost
Analysis’. In this analysis a time value is placed on money, future expenditures
are discounted and brought back to the present period. A direct comparison of
the total present values or present work, reveals which alternate is lower in cost.
The economical size of pumping main will be based on for the following analysis
factor.
1) The pipe size will be consider such that during average flow 0.6 m/s
velocity may achieve and during peak flow velocity may be more than 0.8
m/s and not exceeded than 3 m/s will be considered.
2) Design horizon of 30 year (as stipulated by CPHEEO) divided in two
phases.
1st Phase – 1st 15 years
2nd Phase – 2nd 15 years
And the volume of sewage to be conveyed during two phases.
3) Different pipe sizes are considered to calculate the least cost in design
life.
4) The capacity & installed cost of the pump set required against the
corresponding sizes the pipeline under consideration.
5) The energy cost at Rs. 5 per KW will be considered. The interest rate will
be considered at 8% as per prevailing bank rate.
6) The capitalized cost will be worked out for the capital cost and energy
cost.
From the above the most suitable pipe material and size form techno economic
point of view will be considered as a pumping main.

128

~ 129 ~