The impact of a sewage treatment plant's effluent on sediment ...
11
Lakes & Reservoirs: Research and Management 2004 9: 53–63 The impact of a sewage treatment plant’s effluent on sediment quality in a small bay in Lake Geneva (Switzerland–France). Part 2: Temporal evolution of heavy metals Jean-Luc Loizeau, 1,2 * Michel Pardos, 1 Fabrice Monna, 1,3 Christophe Peytremann, 1 Laurence Haller 1 and Janusz Dominik 1,2 1 F.-A. Forel Institute, University of Geneva, Versoix, Switzerland, and 2 Centre d’Etudes en Sciences Naturelles de l’Environnement, University of Geneva, Versoix, Switzerland Abstract The Bay of Vidy is the most contaminated area of Lake Geneva, Switzerland, as a result of the release of treated and untreated waste water from the municipal sewage treatment plant of the city of Lausanne and its surroundings. The reconstruction of the historical deposition of heavy metals in the sediment of the bay has been performed by the analysis of several dated (radio- caesium) sediment cores. The presence of sewage-derived contaminants in the Bay of Vidy since the beginning of the sewage treatment plant’s operations in 1964 is clearly observed, when a sharp increase in heavy metal contents is recorded, with maximum concentrations of cadmium, copper, zinc and lead occurring between the late 1960s and early 1970s. Despite considerable improvement in recent times, the present concentrations of the investigated heavy metals in sediments of the Bay of Vidy are still higher than concentrations measured at the centre of the lake, the latter close to Lake Geneva’s natural background values. It is concluded that the quantity of heavy metals deposited in the bay is considerable and, because of sediment instability, will constitute a potential hazard for biota. Key words heavy metals, Lake Geneva, pollution, sediment, sediment dating, sewage treatment plant. INTRODUCTION Many contaminants introduced into aquatic ecosystems via industrial and domestic sewage discharge, surface run-off and atmospheric fallout are adsorbed onto, and transported by, suspended sediments. After cycles of deposition, resus- pension, transport, and biological and chemical inter- actions, contaminants associated with particles can be buried in bottom sediments, which become the ultimate pollutant sink (Burton 1992; Luoma & Ho 1993). Studies assessing environmental contamination are complicated by a number of factors that contribute to pollutant carrier transport and distribution. Despite the possibility of remobilization, however, sediments can record states of environmental stress dating far back into the past. In that sense, lake sediment cores provide an invaluable record of the past variations occurring both in a lake and its watershed (e.g. Dominik et al. 1984, 1991; Wessels et al. 1995; Loizeau et al. 1997; Von Gunten et al. 1997; Mecray et al. 2001). It is difficult, however, to quantify the severity and extent of sediment contamination when, in many countries, criteria for distinguishing ‘clean’ from ‘contaminated’ sediments are either non-existent or are still being developed (Smith et al. 1996). Among different approaches, the degree of anthropogenic sediment con- tamination is evaluated by comparison of heavy metal concentrations in recent sediments to the natural back- ground concentrations (Förstner & Wittmann 1979; Håkanson & Jansson 1983). The companion study, which focused on the assessment of the quality of surface sediments collected in the Bay of *Corresponding author. E-mail: [email protected] Accepted for publication 15 March 2004. 3 Present address: GéoSol, CST, UMR-INRA, University of Bourgogne, Dijon, France
-
Upload
khangminh22 -
Category
Documents
-
view
0 -
download
0
Transcript of The impact of a sewage treatment plant's effluent on sediment ...
Lakes & Reservoirs: Research and Management
2004
9
: 53–63
The impact of a sewage treatment plant’s effluent on sediment quality in a small bay in Lake Geneva (Switzerland–France). Part 2: Temporal evolution
of heavy metals
Jean-Luc Loizeau,
1,2
* Michel Pardos,
1
Fabrice Monna,
1,3
Christophe Peytremann,
1
Laurence Haller
1
and Janusz Dominik
1,2
1
F.-A. Forel Institute, University of Geneva, Versoix, Switzerland, and
2
Centre d’Etudes en Sciences Naturelles de l’Environnement, University of Geneva, Versoix, Switzerland
Abstract
The Bay of Vidy is the most contaminated area of Lake Geneva, Switzerland, as a result of the release of treated and untreatedwaste water from the municipal sewage treatment plant of the city of Lausanne and its surroundings. The reconstruction ofthe historical deposition of heavy metals in the sediment of the bay has been performed by the analysis of several dated (radio-caesium) sediment cores. The presence of sewage-derived contaminants in the Bay of Vidy since the beginning of the sewagetreatment plant’s operations in 1964 is clearly observed, when a sharp increase in heavy metal contents is recorded, withmaximum concentrations of cadmium, copper, zinc and lead occurring between the late 1960s and early 1970s. Despiteconsiderable improvement in recent times, the present concentrations of the investigated heavy metals in sediments of theBay of Vidy are still higher than concentrations measured at the centre of the lake, the latter close to Lake Geneva’s naturalbackground values. It is concluded that the quantity of heavy metals deposited in the bay is considerable and, because ofsediment instability, will constitute a potential hazard for biota.
Key words
heavy metals, Lake Geneva, pollution, sediment, sediment dating, sewage treatment plant.
INTRODUCTION
Many contaminants introduced into aquatic ecosystems viaindustrial and domestic sewage discharge, surface run-offand atmospheric fallout are adsorbed onto, and transportedby, suspended sediments. After cycles of deposition, resus-pension, transport, and biological and chemical inter-actions, contaminants associated with particles can beburied in bottom sediments, which become the ultimatepollutant sink (Burton 1992; Luoma & Ho 1993).
Studies assessing environmental contamination arecomplicated by a number of factors that contribute topollutant carrier transport and distribution. Despite the
possibility of remobilization, however, sediments canrecord states of environmental stress dating far back intothe past. In that sense, lake sediment cores provide aninvaluable record of the past variations occurring both in alake and its watershed (e.g. Dominik
et al
. 1984, 1991;Wessels
et al
. 1995; Loizeau
et al
. 1997; Von Gunten
et al
.1997; Mecray
et al
. 2001). It is difficult, however, to quantifythe severity and extent of sediment contamination when, inmany countries, criteria for distinguishing ‘clean’ from‘contaminated’
sediments
are
either
non-existent
or
arestill being developed (Smith
et al
. 1996). Among differentapproaches, the degree of anthropogenic sediment con-tamination is evaluated by comparison of heavy metalconcentrations in recent sediments to the natural back-ground concentrations (Förstner & Wittmann 1979;Håkanson & Jansson 1983).
The companion study, which focused on the assessmentof the quality of surface sediments collected in the Bay of
*Corresponding author.
E-mail: [email protected]
Accepted for publication 15 March 2004.
3
Present address: GéoSol, CST, UMR-INRA, University of
Bourgogne, Dijon, France
54 J.-L. Loizeau
et al.
Vidy shows that the sewage treatment plant’s (STP)effluent is the main source of local sediment contamination(Pardos
et al
. 2004). The extent and spatial distribution ofselected sediment contaminants was clearly established.Among the pollutants were heavy metals, such as copper(Cu), zinc (Zn), cadmium (Cd) and lead (Pb). These areubiquitous in the environment. Heavy metals play animportant role because they are hazardous at high concen-trations. Within the framework of preparing a plan forproper remediation, heavy metal data obtained fromsediment cores of Lake Geneva (Bay of Vidy and areference site in the central part of the lake) are presentedin this report. The historical sediment deposition in the bayis related to the STP’s operation and to geochemical back-ground concentrations.
SETTINGS
Lausanne is the biggest city discharging treated domesticand industrial waste water into Lake Geneva. The STP islocated at Vidy, on the northern shore of the lake, andreleases treated waters into the Bay of Vidy via an under-water pipe. The Flon River (Fig. 1) drained the untreatedsewage of Lausanne and its surroundings until 1964 andpresently receives storm overflows. The Vidy STP(
�
412 000-equivalent inhabitants at the present time) wasbuilt in 1964–1965 (220 000-equivalent inhabitants) withbiological treatment. It was equipped in 1971 with achemical stage, consisting of adding ferric chloride whichprecipitates as iron hydroxide, thereby removing phos-phate. In 1976, the STP was expanded and the efficiency of
wastewater treatment improved. In 1986, drilling opera-tions were undertaken in the lake to anchor the STPunderwater pipe.
MATERIALS AND METHODSSampling
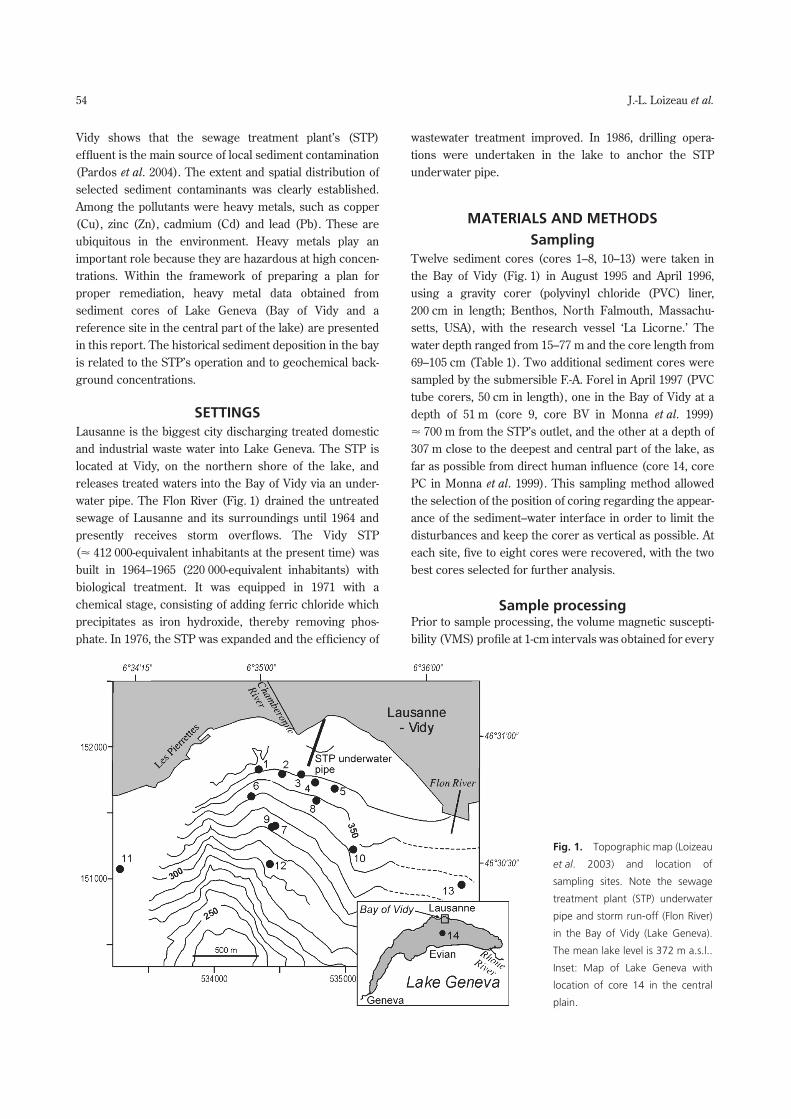
Twelve sediment cores (cores 1–8, 10–13) were taken inthe Bay of Vidy (Fig. 1) in August 1995 and April 1996,using a gravity corer (polyvinyl chloride (PVC) liner,200 cm in length; Benthos, North Falmouth, Massachu-setts, USA), with the research vessel ‘La Licorne.’ Thewater depth ranged from 15–77 m and the core length from69–105 cm (Table 1). Two additional sediment cores weresampled by the submersible F.-A. Forel in April 1997 (PVCtube corers, 50 cm in length), one in the Bay of Vidy at adepth of 51 m (core 9, core BV in Monna
et al
. 1999)
�
700 m from the STP’s outlet, and the other at a depth of307 m close to the deepest and central part of the lake, asfar as possible from direct human influence (core 14, corePC in Monna
et al
. 1999). This sampling method allowedthe selection of the position of coring regarding the appear-ance of the sediment–water interface in order to limit thedisturbances and keep the corer as vertical as possible. Ateach site, five to eight cores were recovered, with the twobest cores selected for further analysis.
Sample processing
Prior to sample processing, the volume magnetic suscepti-bility (VMS) profile at 1-cm intervals was obtained for every
Fig. 1. Topographic map (Loizeau
et al. 2003) and location of
sampling sites. Note the sewage
treatment plant (STP) underwater
pipe and storm run-off (Flon River)
in the Bay of Vidy (Lake Geneva).
The mean lake level is 372 m a.s.l..
Inset: Map of Lake Geneva with
location of core 14 in the central
plain.
Temporal evolution of heavy metals 55
core, using a MS2C susceptibility meter (BartingtonInstruments, Oxford, England). Cores 1–8 and 10–13 wereopened longitudinally, whereas cores 9 and 14 wereextruded with a piston and sliced. All the cores wereimmediately photographed and described. The subsamp-ling of core 14 (44 cm long) was made with an interval of0.5 cm for the upper 20 cm and 1 cm for the remainder ofthe core, whereas a constant interval of 1 cm was used forthe full length of core 9 (41 cm long). Considering theprevious studies undertaken in the same area (Luzzi 1989),this subsampling should provide yearly temporal resolutionof one year or less. For the other cores, constant intervalsof 1 or 2 cm were used in the uppermost, organic rich,contaminated
core
section,
whereas
larger
intervals(5–10 cm) were used for the remainder of the core.
The samples were air-dried at 60
�
C for two days and thewater content and porosity calculated following the pro-cedure of Sugai
et al
. (1994). They were then carefullybroken up in a acid-cleaned agate mortar. The depth scaleis expressed in terms of mass-depth (g cm
–2
), representingthe cumulative mass of sediment, and is calculated from theporosity and density, corrected for organic matter content.
Analyses
Sediments were dated by using three time markers:radiocaesium-137 (
137
Cs) atmospheric nuclear testsmaximum activity (1963/1964),
137
Cs maximum activityfrom the Chernobyl reactor accident fallout (1986), and theappearance of a sharp increase in the VMS signal corres-ponding to the year 1971 in the Bay of Vidy (Loizeau
et al
.2003). The VMS signal results from the presence of very
fine-grained magnetite crystals (Gibbs-Eggar
et al
. 1999) inthe sediment, most likely originating from the activity ofdissimilatory iron-reducing bacteria (Snoeyenbos-West
et al
., unpubl. data 2002). The activity of
137
Cs was directlymeasured on dry sediment by gamma spectroscopy, usinga germanium well-detector (Dominik
et al
. 1987). For LakeGeneva, there was no evidence of diffusion or otherdisplacement of this radionuclide within a complete sedi-mentary column, which could alter the dating (Dominik
et al
. 1991).Chemical preparation for trace metals analysis, except
mercury (Hg), consisted of the partial digestion of 0.5–1.0 g of sediment with 10 mL of super-pure nitric acid(HNO
3
) in closed and pressurized Teflon bombs (Tech-niVerre, Villiers le Bel, France) heated to 150
�
C overnight(cores 1–12), or in a class 100–1000 clean room underEthos microwave assistance (Milestone, Sorisole, Italy)and magnetic stirring (cores 9 and 14). The microwavesettings were: 5 min at 400 W, 2 min at 100 W, 10 min at600 W and 10 min at 700 W (stirring 100%). The residualsolutions were evaporated to dryness and dissolved inHNO
3.
For both procedures, no systematic differenceswere observed, with blanks always found to be negligible.The elemental concentrations were measured by quad-rupole-based Poems 1 Inductivity Coupled Plasma MassSpectrometry (ICP-MS)/Emission Spectrometry (ThermoJarrell Ash, Offenbach, Germany) using internal calib-ration by a Rh/Re solution. Although the true analyticalprecision of concentration measurements by ICP-MS inprecise mode is typically < 3% for all studied elements,numerous replicates have clearly demonstrated an overall
Table 1.
List of sediment cores recovered in the Bay of Vidy (cores 1–13) and in the central part of Lake Geneva (core 14)
Core number Date of recovery Depth (m) Core length (cm)
n
Position
1 17/08/1995 15 103 8–15 46
�
30
�
52
�
N 6
�
34
�
59
�
E
2 15/08/1995 18 77 16–34 46
�
30
�
51
�
N 6
�
35
�
07
�
E
3 15/08/1995 19 69 12–34 46
�
30
�
51
�
N 6
�
35
�
14
�
E
4 15/08/1995 17 80 12–35 46
�
30
�
49
�
N 6
�
35
�
20
�
E
5 16/08/1995 15 95 13–33 46
�
30
�
48
�
N 6
�
35
�
27
�
E
6 23/08/1995 37 102 5–7 46
�
30
�
46
�
N 6
�
34
�
56
�
E
7 24/08/1995 47 94 11–27 46
�
30
�
39
�
N 6
�
35
�
04
�
E
8 17/08/1995 30 102 5–14 46
�
30
�
44
�
N 6
�
35
�
20
�
E
9 30/04/1997 51 41 12–41 46
�
30
�
38
�
N 6
�
35
�
04
�
E
10 23/08/1995 31 101 3–7 46
�
30
�
32
�
N 6
�
35
�
34
�
E
11 30/04/1996 27 80 5–12 46
�
30
�
27
�
N 6
�
34�08�E
12 24/08/1995 77 101 7–35 46�30�29�N 6�35�03�E
13 24/08/1995 58 105 6–12 46�30�24�N 6�36�14�E
14 24/04/1997 307 44 28–56 46�28�38�N 6�38�35�E
n, number of samples (depending on analysis).
56 J.-L. Loizeau et al.
precision of � 10%, probably because of the variability ofthe partial digestion step. Such precision is comparable towhat was preliminarily observed for a large set of inter-national standards. The Hg levels were determined by coldvapour Atomic Absorption Spectroscopy (Hach & Ott1968), after digestion of the sediment at 95�C withconcentrated nitric acid and hydrochloric acid, with areproducibility of 15%.
Grain size distribution was determined by laser diffrac-tion, using a LS-100 particle size analyser (BeckmanCoulter, Fullerton, CA, USA), following ultrasonic dispersalin deionized water (Loizeau et al. 1994). The loss onignition (LOI), a surrogate for organic matter content, wasmeasured by calcination after 4 h at 550�C (Dean 1974),and carbonate by titrimetry, following acidification of thesample with hydrochloric acid.
RESULTSDating and sediment accumulation rate
determinationSediment accumulation rates (SARs) were calculatedbetween the sediment layers having the maximum 137Csactivities corresponding to the years 1964, 1986 and thesurface (date of recovery 1995–1997), as well as betweenthe horizon corresponding to the appearance of a sharpincrease of VMS (1971) and the surface, when 137Cs dating
was not available (Table 2). A total of four out of 11 datedcores exhibited two distinct, sharp peaks of 137Cs activity,allowing an absolute dating of both 1963–1964 and 1986horizons. For these cores, two SARs were estimated. Threecores were characterized by only one distinct peak of137Cs activity. Based on these results, it was possible tocalculate average SARs for 11 cores that varied between0.95 g cm–2 year–1 close to the effluent mouth, and� 0.07 g cm–2 year–1. Moreover, SARs appeared to begenerally higher after 1986 than between 1964 and 1986(Table 2, cores 7 and 9). As lateral variations are importantin the proximity of an effluent discharge, individual SARsare valid only for the coring location. Thus, extrapolation tolarger areas or undated cores was not attempted. Moreover,as sedimentation pattern and amplitude probably have beenmodified by sediment loads from the STP, it was notpossible to obtain data to estimate SARs for the periodbefore the STP’s construction in 1964.
Grain size, loss on ignition and heavy metals
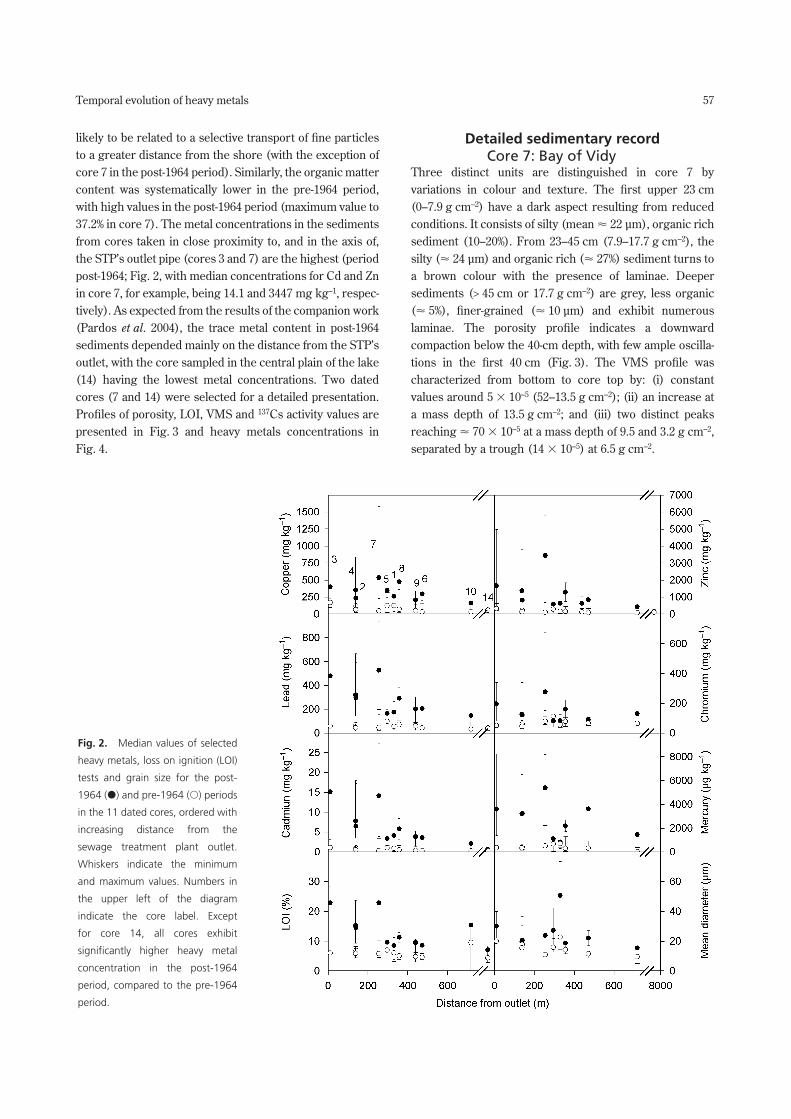
Median values of selected heavy metals, LOI and meangrain size in dated cores are summarized in Fig. 2 for post-1964 and pre-1964 periods. Sediments in all cores consistedof a majority of silts, with lower grain size mean values inthe pre-1964 period. Mean grain size in both periods tendedto decrease with the distance from the outlet, which is
Table 2. Mass depth (g cm–2) of the three time markers used in this study to calculate sediment accumulation rates (SARs)
Core number
137Cs-1986
(g cm–2)
137Cs-1964
(g cm–2)
VMS-1971
(g cm–2)
SAR 1
(g cm–2 year–1)
SAR 2
(g cm–2 year–1)
SAR 3
(g cm–2 year–1)
1 AP0 AP0 8.72 – – 0.35
2 7.04 28.16 23.08 0.76 0.95 –
3 AP0 24.14 19.99 – 0.76 –
4 AP0 25.50 20.72 – 0.77 –
5 1.69 AP0 2.75 0.12 – –
6 AP0 AP0 2.67 – – 0.11
7 6.13 15.92 12.85 0.66 0.44 –
8 AP0 AP0 1.61 – – 0.07
9 3.73 8.11 4.94 0.61 0.16 –
10 AP0 AP0 2.46 – – 0.10
14 1.48 3.53 AP 0.13 0.09 –
Sediment accumulation rates are estimated using volume magnetic susceptibility (VMS) signal only, in cores where 137Cs is not available.
Cores 11, 12 and 13 have not been dated because of the absence of VMS peak and interpretable 137Cs.
SAR 1 is calculated between Cs-1986 and the sediment surface; SAR 2 is calculated between Cs-1964 and Cs-1986, except for cores 3 and
4, calculated between Cs-1964 and the sediment surface; SAR 3 is calculated between the VMS-1971 horizon and the sediment surface, for
cores without 137Cs dating.
AP, absence of peak.
Temporal evolution of heavy metals 57
likely to be related to a selective transport of fine particlesto a greater distance from the shore (with the exception ofcore 7 in the post-1964 period). Similarly, the organic mattercontent was systematically lower in the pre-1964 period,with high values in the post-1964 period (maximum value to37.2% in core 7). The metal concentrations in the sedimentsfrom cores taken in close proximity to, and in the axis of,the STP’s outlet pipe (cores 3 and 7) are the highest (periodpost-1964; Fig. 2, with median concentrations for Cd and Znin core 7, for example, being 14.1 and 3447 mg kg–1, respec-tively). As expected from the results of the companion work(Pardos et al. 2004), the trace metal content in post-1964sediments depended mainly on the distance from the STP’soutlet, with the core sampled in the central plain of the lake(14) having the lowest metal concentrations. Two datedcores (7 and 14) were selected for a detailed presentation.Profiles of porosity, LOI, VMS and 137Cs activity values arepresented in Fig. 3 and heavy metals concentrations inFig. 4.
Detailed sedimentary recordCore 7: Bay of Vidy
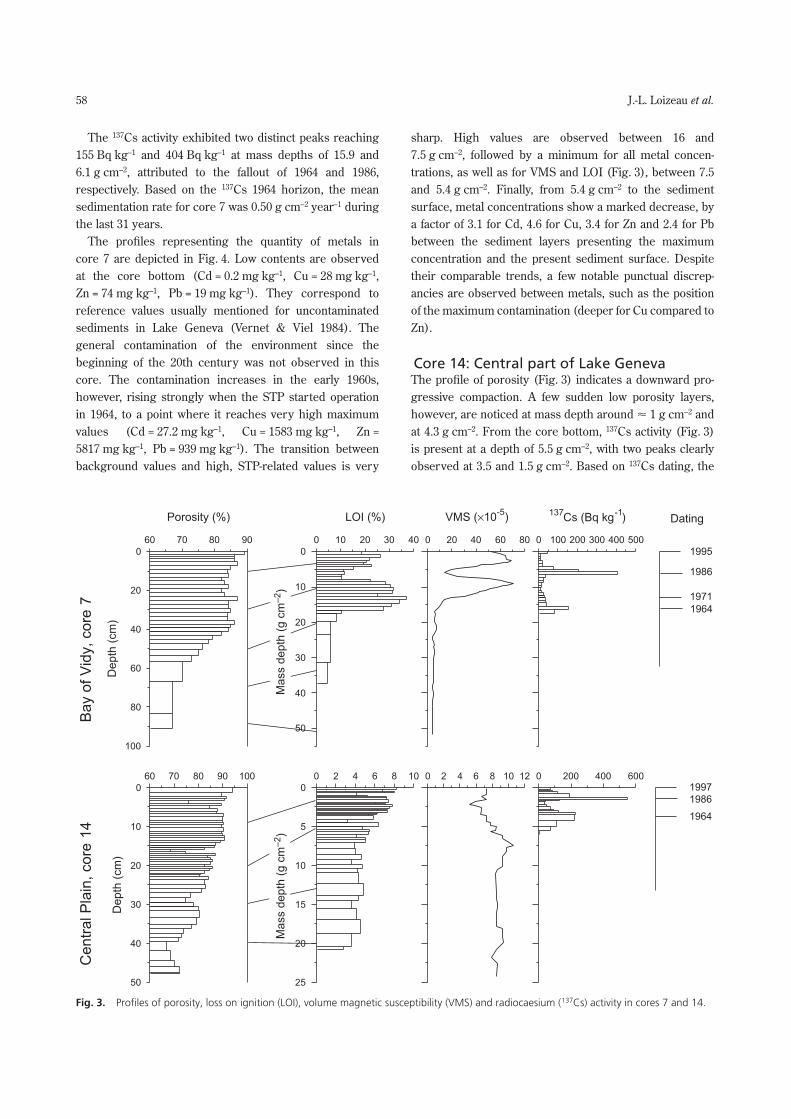
Three distinct units are distinguished in core 7 byvariations in colour and texture. The first upper 23 cm(0–7.9 g cm–2) have a dark aspect resulting from reducedconditions. It consists of silty (mean � 22 µm), organic richsediment (10–20%). From 23–45 cm (7.9–17.7 g cm–2), thesilty (� 24 µm) and organic rich (� 27%) sediment turns toa brown colour with the presence of laminae. Deepersediments (> 45 cm or 17.7 g cm–2) are grey, less organic(� 5%), finer-grained (� 10 µm) and exhibit numerouslaminae. The porosity profile indicates a downwardcompaction below the 40-cm depth, with few ample oscilla-tions in the first 40 cm (Fig. 3). The VMS profile wascharacterized from bottom to core top by: (i) constantvalues around 5 � 10–5 (52–13.5 g cm–2); (ii) an increase ata mass depth of 13.5 g cm–2; and (iii) two distinct peaksreaching � 70 � 10–5 at a mass depth of 9.5 and 3.2 g cm–2,separated by a trough (14 � 10–5) at 6.5 g cm–2.
Fig. 2. Median values of selected
heavy metals, loss on ignition (LOI)
tests and grain size for the post-
1964 (�) and pre-1964 (�) periods
in the 11 dated cores, ordered with
increasing distance from the
sewage treatment plant outlet.
Whiskers indicate the minimum
and maximum values. Numbers in
the upper left of the diagram
indicate the core label. Except
for core 14, all cores exhibit
significantly higher heavy metal
concentration in the post-1964
period, compared to the pre-1964
period.
58 J.-L. Loizeau et al.
The 137Cs activity exhibited two distinct peaks reaching155 Bq kg–1 and 404 Bq kg–1 at mass depths of 15.9 and6.1 g cm–2, attributed to the fallout of 1964 and 1986,respectively. Based on the 137Cs 1964 horizon, the meansedimentation rate for core 7 was 0.50 g cm–2 year–1 duringthe last 31 years.
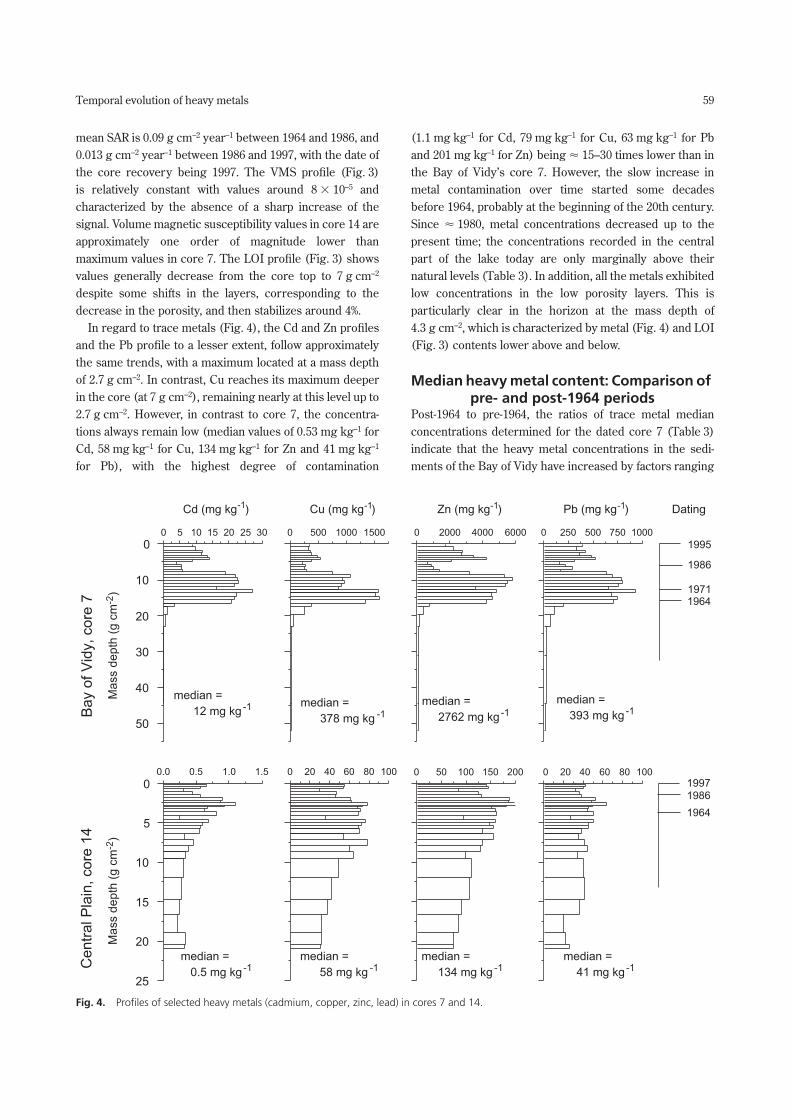
The profiles representing the quantity of metals incore 7 are depicted in Fig. 4. Low contents are observedat the core bottom (Cd = 0.2 mg kg–1, Cu = 28 mg kg–1,Zn = 74 mg kg–1, Pb = 19 mg kg–1). They correspond toreference values usually mentioned for uncontaminatedsediments in Lake Geneva (Vernet & Viel 1984). Thegeneral contamination of the environment since thebeginning of the 20th century was not observed in thiscore. The contamination increases in the early 1960s,however, rising strongly when the STP started operationin 1964, to a point where it reaches very high maximumvalues (Cd = 27.2 mg kg–1, Cu = 1583 mg kg–1, Zn =5817 mg kg–1, Pb = 939 mg kg–1). The transition betweenbackground values and high, STP-related values is very
sharp. High values are observed between 16 and7.5 g cm–2, followed by a minimum for all metal concen-trations, as well as for VMS and LOI (Fig. 3), between 7.5and 5.4 g cm–2. Finally, from 5.4 g cm–2 to the sedimentsurface, metal concentrations show a marked decrease, bya factor of 3.1 for Cd, 4.6 for Cu, 3.4 for Zn and 2.4 for Pbbetween the sediment layers presenting the maximumconcentration and the present sediment surface. Despitetheir comparable trends, a few notable punctual discrep-ancies are observed between metals, such as the positionof the maximum contamination (deeper for Cu compared toZn).
Core 14: Central part of Lake GenevaThe profile of porosity (Fig. 3) indicates a downward pro-gressive compaction. A few sudden low porosity layers,however, are noticed at mass depth around � 1 g cm–2 andat 4.3 g cm–2. From the core bottom, 137Cs activity (Fig. 3)is present at a depth of 5.5 g cm–2, with two peaks clearlyobserved at 3.5 and 1.5 g cm–2. Based on 137Cs dating, the
Fig. 3. Profiles of porosity, loss on ignition (LOI), volume magnetic susceptibility (VMS) and radiocaesium (137Cs) activity in cores 7 and 14.
Temporal evolution of heavy metals 59
mean SAR is 0.09 g cm–2 year–1 between 1964 and 1986, and0.013 g cm–2 year–1 between 1986 and 1997, with the date ofthe core recovery being 1997. The VMS profile (Fig. 3)is relatively constant with values around 8 � 10–5 andcharacterized by the absence of a sharp increase of thesignal. Volume magnetic susceptibility values in core 14 areapproximately one order of magnitude lower thanmaximum values in core 7. The LOI profile (Fig. 3) showsvalues generally decrease from the core top to 7 g cm–2
despite some shifts in the layers, corresponding to thedecrease in the porosity, and then stabilizes around 4%.
In regard to trace metals (Fig. 4), the Cd and Zn profilesand the Pb profile to a lesser extent, follow approximatelythe same trends, with a maximum located at a mass depthof 2.7 g cm–2. In contrast, Cu reaches its maximum deeperin the core (at 7 g cm–2), remaining nearly at this level up to2.7 g cm–2. However, in contrast to core 7, the concentra-tions always remain low (median values of 0.53 mg kg–1 forCd, 58 mg kg–1 for Cu, 134 mg kg–1 for Zn and 41 mg kg–1
for Pb), with the highest degree of contamination
(1.1 mg kg–1 for Cd, 79 mg kg–1 for Cu, 63 mg kg–1 for Pband 201 mg kg–1 for Zn) being � 15–30 times lower than inthe Bay of Vidy’s core 7. However, the slow increase inmetal contamination over time started some decadesbefore 1964, probably at the beginning of the 20th century.Since � 1980, metal concentrations decreased up to thepresent time; the concentrations recorded in the centralpart of the lake today are only marginally above theirnatural levels (Table 3). In addition, all the metals exhibitedlow concentrations in the low porosity layers. This isparticularly clear in the horizon at the mass depth of4.3 g cm–2, which is characterized by metal (Fig. 4) and LOI(Fig. 3) contents lower above and below.
Median heavy metal content: Comparison of pre- and post-1964 periods
Post-1964 to pre-1964, the ratios of trace metal medianconcentrations determined for the dated core 7 (Table 3)indicate that the heavy metal concentrations in the sedi-ments of the Bay of Vidy have increased by factors ranging
Fig. 4. Profiles of selected heavy metals (cadmium, copper, zinc, lead) in cores 7 and 14.
60 J.-L. Loizeau et al.
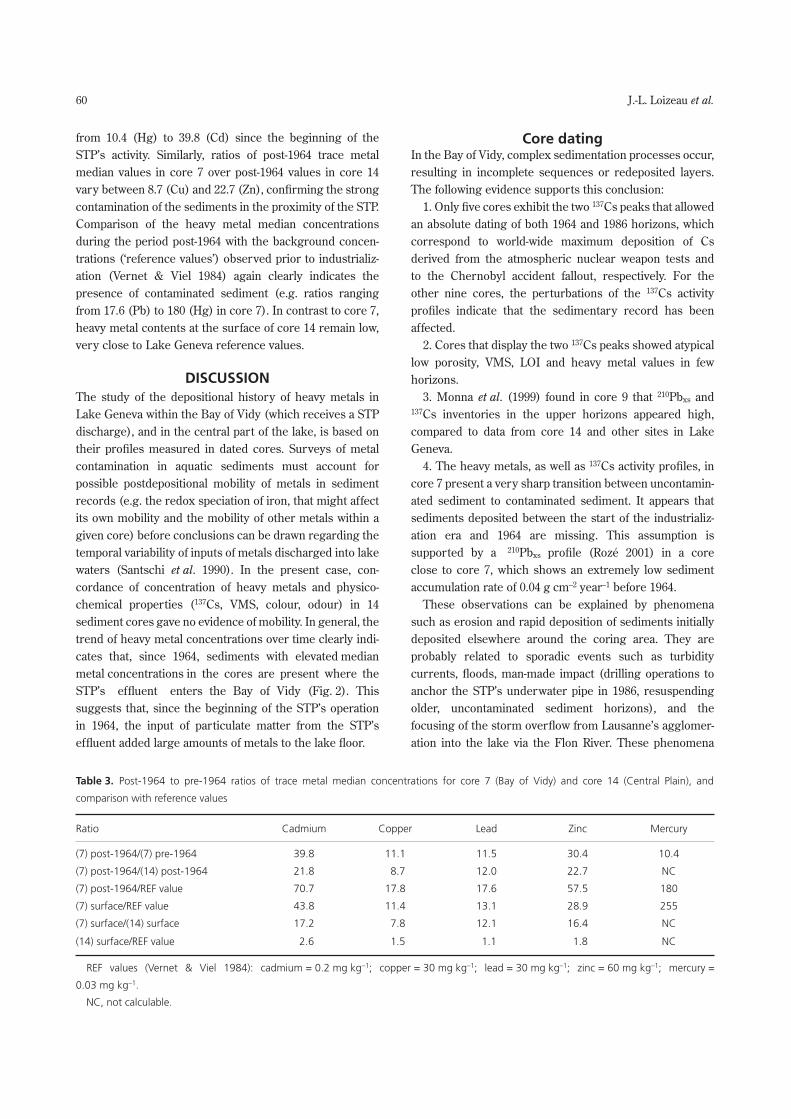
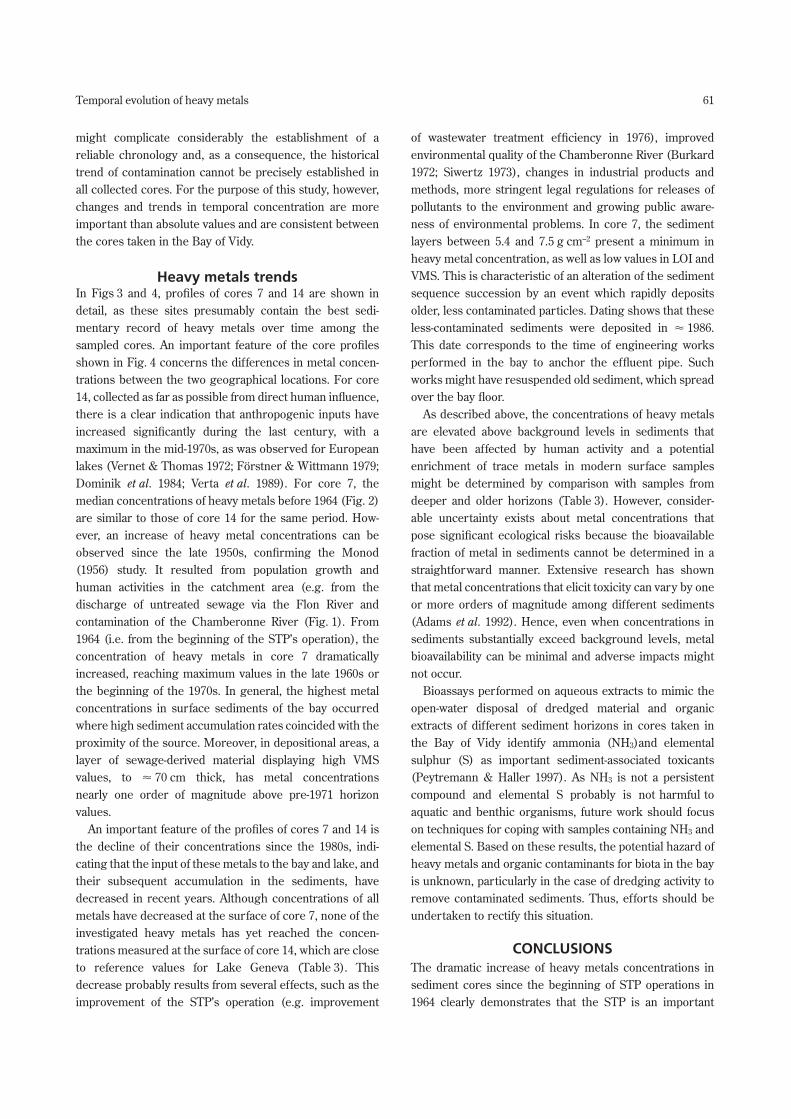
from 10.4 (Hg) to 39.8 (Cd) since the beginning of theSTP’s activity. Similarly, ratios of post-1964 trace metalmedian values in core 7 over post-1964 values in core 14vary between 8.7 (Cu) and 22.7 (Zn), confirming the strongcontamination of the sediments in the proximity of the STP.Comparison of the heavy metal median concentrationsduring the period post-1964 with the background concen-trations (‘reference values’) observed prior to industrializ-ation (Vernet & Viel 1984) again clearly indicates thepresence of contaminated sediment (e.g. ratios rangingfrom 17.6 (Pb) to 180 (Hg) in core 7). In contrast to core 7,heavy metal contents at the surface of core 14 remain low,very close to Lake Geneva reference values.
DISCUSSIONThe study of the depositional history of heavy metals inLake Geneva within the Bay of Vidy (which receives a STPdischarge), and in the central part of the lake, is based ontheir profiles measured in dated cores. Surveys of metalcontamination in aquatic sediments must account forpossible postdepositional mobility of metals in sedimentrecords (e.g. the redox speciation of iron, that might affectits own mobility and the mobility of other metals within agiven core) before conclusions can be drawn regarding thetemporal variability of inputs of metals discharged into lakewaters (Santschi et al. 1990). In the present case, con-cordance of concentration of heavy metals and physico-chemical properties (137Cs, VMS, colour, odour) in 14sediment cores gave no evidence of mobility. In general, thetrend of heavy metal concentrations over time clearly indi-cates that, since 1964, sediments with elevated medianmetal concentrations in the cores are present where theSTP’s effluent enters the Bay of Vidy (Fig. 2). Thissuggests that, since the beginning of the STP’s operationin 1964, the input of particulate matter from the STP’seffluent added large amounts of metals to the lake floor.
Core datingIn the Bay of Vidy, complex sedimentation processes occur,resulting in incomplete sequences or redeposited layers.The following evidence supports this conclusion:
1. Only five cores exhibit the two 137Cs peaks that allowedan absolute dating of both 1964 and 1986 horizons, whichcorrespond to world-wide maximum deposition of Csderived from the atmospheric nuclear weapon tests andto the Chernobyl accident fallout, respectively. For theother nine cores, the perturbations of the 137Cs activityprofiles indicate that the sedimentary record has beenaffected.
2. Cores that display the two 137Cs peaks showed atypicallow porosity, VMS, LOI and heavy metal values in fewhorizons.
3. Monna et al. (1999) found in core 9 that 210Pbxs and137Cs inventories in the upper horizons appeared high,compared to data from core 14 and other sites in LakeGeneva.
4. The heavy metals, as well as 137Cs activity profiles, incore 7 present a very sharp transition between uncontamin-ated sediment to contaminated sediment. It appears thatsediments deposited between the start of the industrializ-ation era and 1964 are missing. This assumption issupported by a 210Pbxs profile (Rozé 2001) in a coreclose to core 7, which shows an extremely low sedimentaccumulation rate of 0.04 g cm–2 year–1 before 1964.
These observations can be explained by phenomenasuch as erosion and rapid deposition of sediments initiallydeposited elsewhere around the coring area. They areprobably related to sporadic events such as turbiditycurrents, floods, man-made impact (drilling operations toanchor the STP’s underwater pipe in 1986, resuspendingolder, uncontaminated sediment horizons), and thefocusing of the storm overflow from Lausanne’s agglomer-ation into the lake via the Flon River. These phenomena
Table 3. Post-1964 to pre-1964 ratios of trace metal median concentrations for core 7 (Bay of Vidy) and core 14 (Central Plain), and
comparison with reference values
Ratio Cadmium Copper Lead Zinc Mercury
(7) post-1964/(7) pre-1964 39.8 11.1 11.5 30.4 10.4
(7) post-1964/(14) post-1964 21.8 8.7 12.0 22.7 NC
(7) post-1964/REF value 70.7 17.8 17.6 57.5 180
(7) surface/REF value 43.8 11.4 13.1 28.9 255
(7) surface/(14) surface 17.2 7.8 12.1 16.4 NC
(14) surface/REF value 2.6 1.5 1.1 1.8 NC
REF values (Vernet & Viel 1984): cadmium = 0.2 mg kg–1; copper = 30 mg kg–1; lead = 30 mg kg–1; zinc = 60 mg kg–1; mercury =
0.03 mg kg–1.
NC, not calculable.
Temporal evolution of heavy metals 61
might complicate considerably the establishment of areliable chronology and, as a consequence, the historicaltrend of contamination cannot be precisely established inall collected cores. For the purpose of this study, however,changes and trends in temporal concentration are moreimportant than absolute values and are consistent betweenthe cores taken in the Bay of Vidy.
Heavy metals trendsIn Figs 3 and 4, profiles of cores 7 and 14 are shown indetail, as these sites presumably contain the best sedi-mentary record of heavy metals over time among thesampled cores. An important feature of the core profilesshown in Fig. 4 concerns the differences in metal concen-trations between the two geographical locations. For core14, collected as far as possible from direct human influence,there is a clear indication that anthropogenic inputs haveincreased significantly during the last century, with amaximum in the mid-1970s, as was observed for Europeanlakes (Vernet & Thomas 1972; Förstner & Wittmann 1979;Dominik et al. 1984; Verta et al. 1989). For core 7, themedian concentrations of heavy metals before 1964 (Fig. 2)are similar to those of core 14 for the same period. How-ever, an increase of heavy metal concentrations can beobserved since the late 1950s, confirming the Monod(1956) study. It resulted from population growth andhuman activities in the catchment area (e.g. from thedischarge of untreated sewage via the Flon River andcontamination of the Chamberonne River (Fig. 1). From1964 (i.e. from the beginning of the STP’s operation), theconcentration of heavy metals in core 7 dramaticallyincreased, reaching maximum values in the late 1960s orthe beginning of the 1970s. In general, the highest metalconcentrations in surface sediments of the bay occurredwhere high sediment accumulation rates coincided with theproximity of the source. Moreover, in depositional areas, alayer of sewage-derived material displaying high VMSvalues, to � 70 cm thick, has metal concentrationsnearly one order of magnitude above pre-1971 horizonvalues.
An important feature of the profiles of cores 7 and 14 isthe decline of their concentrations since the 1980s, indi-cating that the input of these metals to the bay and lake, andtheir subsequent accumulation in the sediments, havedecreased in recent years. Although concentrations of allmetals have decreased at the surface of core 7, none of theinvestigated heavy metals has yet reached the concen-trations measured at the surface of core 14, which are closeto reference values for Lake Geneva (Table 3). Thisdecrease probably results from several effects, such as theimprovement of the STP’s operation (e.g. improvement
of wastewater treatment efficiency in 1976), improvedenvironmental quality of the Chamberonne River (Burkard1972; Siwertz 1973), changes in industrial products andmethods, more stringent legal regulations for releases ofpollutants to the environment and growing public aware-ness of environmental problems. In core 7, the sedimentlayers between 5.4 and 7.5 g cm–2 present a minimum inheavy metal concentration, as well as low values in LOI andVMS. This is characteristic of an alteration of the sedimentsequence succession by an event which rapidly depositsolder, less contaminated particles. Dating shows that theseless-contaminated sediments were deposited in � 1986.This date corresponds to the time of engineering worksperformed in the bay to anchor the effluent pipe. Suchworks might have resuspended old sediment, which spreadover the bay floor.
As described above, the concentrations of heavy metalsare elevated above background levels in sediments thathave been affected by human activity and a potentialenrichment of trace metals in modern surface samplesmight be determined by comparison with samples fromdeeper and older horizons (Table 3). However, consider-able uncertainty exists about metal concentrations thatpose significant ecological risks because the bioavailablefraction of metal in sediments cannot be determined in astraightforward manner. Extensive research has shownthat metal concentrations that elicit toxicity can vary by oneor more orders of magnitude among different sediments(Adams et al. 1992). Hence, even when concentrations insediments substantially exceed background levels, metalbioavailability can be minimal and adverse impacts mightnot occur.
Bioassays performed on aqueous extracts to mimic theopen-water disposal of dredged material and organicextracts of different sediment horizons in cores taken inthe Bay of Vidy identify ammonia (NH3)and elementalsulphur (S) as important sediment-associated toxicants(Peytremann & Haller 1997). As NH3 is not a persistentcompound and elemental S probably is not harmful toaquatic and benthic organisms, future work should focuson techniques for coping with samples containing NH3 andelemental S. Based on these results, the potential hazard ofheavy metals and organic contaminants for biota in the bayis unknown, particularly in the case of dredging activity toremove contaminated sediments. Thus, efforts should beundertaken to rectify this situation.
CONCLUSIONSThe dramatic increase of heavy metals concentrations insediment cores since the beginning of STP operations in1964 clearly demonstrates that the STP is an important

62 J.-L. Loizeau et al.
source of contaminants for the Bay of Vidy. Maximumcontamination factors vary from 18 (Pb) to 180 (Hg),relative to the natural background levels. Highly con-taminated sediment from the late 1960s and beginning ofthe 1970s are now covered by less contaminated layers,although heavy metal concentrations are still elevated andwell above background levels. Furthermore, the transportof sediment (slumps), with associated pollutants, is occur-ring in the Bay of Vidy with an unknown impact on LakeGeneva.
This study established heavy metal trends over time,providing a framework for future scientific research, andcan serve as a basis for investigations of the efficiency ofenvironmental remediation efforts in the Bay of Vidy.Future work should focus on: (i) identifying the relativeimportance of various transport and remobilizationprocesses for contaminants’ fate; and (ii) determiningtheir bioavailability to provide a basis for chemical andbiological guidelines for sediment pollution.
As chemical contamination of sediments might be theresult of either past and/or present disposal practices, andbecause eliminating the source or improving water qualitydoes not always solve the problem, dealing with sedimentcontamination is not an easy task. In order to prepare a planfor proper remedial action, extensive survey, monitoringand research activities are required to assess the con-taminant levels and sediment volumes in the areas to bedredged or remedied.
ACKNOWLEDGEMENTSWe wish to express special thanks to J. Piccard and his crewfor his precious help during sampling with the F.-A. Forelsubmersible. We thank the staff of the F.-A. Forel Institute,as well as J. Buffle and M. Martin for their assistance invarious phases of the study.
REFERENCESAdams W. J., Kimerle R. A. & Barnett J. W. Jr (1992)
Sediment quality and aquatic life assessment. Environ.Sci. Technol. 26, 1865–75.
Burkard P. (1972) Etude des affluents du lac Léman et duRhône entre Genève et Chancy. Annual report. Com-mission Internationale pour la Protection des Eaux duLéman contre la Pollution, Lausanne.
Burton G. A. Jr (1992) Assessing contaminated aquaticsediments. Environ. Sci. Technol. 26, 1862–3.
Dean W. E. (1974) Determination of carbonate and organicmatter in calcareous sediments and sedimentary rocksby loss on ignition: comparison with other methods.J. Sediment. Petrol. 44, 242–8.
Dominik J., Burrus D. & Vernet J.-P. (1987) Transport ofthe environmental radionuclides in an alpine watershed.Earth Planet. Sci. Let. 84, 165–80.
Dominik J., Loizeau J.-L., Favarger P.-Y., Vernet J.-P. &Thomas R. L. (1991) History of mercury contaminationreconstructed from high-resolution radioisotopic datingof sediment cores in Lake Geneva. In: Heavy Metals inthe Environment (ed. J.-P. Vernet) pp. 273–96. Elsevier,Amsterdam.
Dominik J., Mangini A. & Prosi F. (1984) Sedimentationrate variations and anthropogenic metal fluxes into LakeConstance sediments. Environ. Geol. 5, 151–7.
Förstner U. & Wittmann G. T. W. (1979) Metal Pollution inthe Aquatic Environment. Springer-Verlag, Berlin.
Gibbs-Eggar Z., Jude B., Dominik J., Loizeau J.-L. &Oldfield F. (1999) Possible evidence for dissimilatorybacterial magnetite dominating the magnetic propertiesof recent lake sediments. Earth Planet. Sci. Let. 168,1–6.
Hach W. R. & Ott W. L. (1968) Determination of sub-microgram quantities of mercury by atomic absorptionspectroscopy. Anal. Chem. 40, 2085–7.
Håkanson L. & Jansson M. (1983) Principles of Lake Sedi-mentology. Springer-Verlag, Berlin.
Loizeau J.-L., Arbouille D., Santiago S. & Vernet J.-P.(1994) Evaluation of a wide range laser diffraction grainsize analyser for use with sediments. Sedimentology 41,353–61.
Loizeau J.-L., Dominik J., Luzzi T. & Vernet J.-P. (1997)Sediment core correlation and mapping of sedimentaccumulation rates in Lake Geneva (Switzerland,France) using volume magnetic susceptibility. J. GreatLakes Res. 23, 391–402.
Loizeau J.-L., Rozé S., Peytremann C., Monna F. &Dominik J. (2003) Mapping sediment accumulation rateby using volume magnetic susceptibility core correl-ation in a contaminated bay (Lake Geneva, Switzer-land). Eclo. Geol. Helv. 96, S73–9.
Luoma S. N. & Ho K. T. (1993) Appropriate uses of marineand estuarine sediment bioassays. In: Handbook ofEcotoxicology. (ed. P. Calow) pp. 193–226. BlackwellScientific Publications, Oxford.
Luzzi T. (1989) Origine et applications de la susceptibilitémagnétique dans les sédiments du delta du Rhône,Léman (Suisse–France). Unpublished thesis. Universityof Geneva, Switzerland.
Mecray E. L., King J. W., Appleby P. G. & Hunt A. S.(2001) Historical trace metal accumulation in thesediments of an urbanized region of the LakeChamplain watershed, Burlington, Vermont. Water, Air,Soil Poll. 125, 201–30.
Temporal evolution of heavy metals 63
Monna F., Dominik J., Loizeau J.-L., Pardos M. &Arpagaus P. (1999) Origin and evolution of Pb insediments of Lake Geneva (Switzerland – France).Establishing a stable Pb record. Environ. Sci. Technol.33, 2850–7.
Monod R. (1956) Contribution à l’étude des variations de lacomposition chimique des eaux du lac Léman,phénomènes de pollution et d’autoépuration àl’embouchure du Flon à Vidy. Ann. Stat. Cent.Hydrobiol. App. 6, 233–345.
Pardos M., Benninghoff C., de Alencastro L. F. & Wildi W.(2004) The impact of a sewage treatment plant’s effluenton sediment quality in a small bay in Lake Geneva(Switzerland–France). Part 1: Spatial distribution ofcontaminants and the potential for biological impacts.Lakes Reserv.: Res. Manage. 9, 41–52.
Peytremann C. & Haller L. (1997) Etude sédimen-tologique, géochimique et écotoxicologique des sédi-ments de la baie de Vidy. Unpublished thesis.University of Geneva and Lausanne, Switzerland.
Rozé S. (2001) Evaluation des processus sédimentaires etdu transport des sédiments contaminés dans la baiede Vidy. Unpublished thesis. University of Geneva andLausanne, Switzerland.
Santschi P. H., Höhener P., Benoit G. & BucholtztenBrink M. (1990) Chemical processes at the sediment–water interface. Mar. Chem. 30, 269–315.
Siwertz E. (1973) Etude des affluents au lac Léman et duRhône entre Genève et Chancy. Annual report. Com-
mission Internationale pour la Protection des Eaux duLéman contre la Pollution, Lausanne. No. 1973.
Smith S. L., MacDonald D. D., Keenleyside K. A., IngersollC. G. & Field L. J. (1996) A preliminary evaluation ofsediment quality assessment values for freshwaterecosystems. J. Great Lakes Res. 22, 624–38.
Sugai S. F., Alperin M. J. & Reeburgh W. S. (1994)Episodic deposition and 137Cs immobility in Skan Baysediments: a ten-year 210Pb and 137Cs time series. Mar.Chem. 116, 351–72.
Vernet J.-P. & Thomas R. L. (1972) Levels of mercury inthe sediments of some Swiss lakes including LakeGeneva and the Rhone River. Eclo. Geol. Helv. 65,293–306.
Vernet J.-P. & Viel M. (1984) Métaux lourds dans lessédiments lacustres. Annual report. Synthesis 1957–82.Commission Internationale pour la Protection des Eauxdu Léman contre la Pollution, Lausanne.
Verta M., Tolonen K. & Simola H. (1989) History of heavymetal pollution in Finland as recorded by lake sedi-ments. Sci. Total Environ. 87/88, 1–18.
Von Gunten H. R., Sturm M. & Moser R. N. (1997) 200-year record of metals in lake sediments and naturalbackground concentrations. Environ. Sci. Technol. 31,2193–7.
Wessels M., Lenhard A., Giovanoli F. & Bollhofer A.(1995) High resolution time series of lead and zincin sediments of Lake Constance. Aquat. Sci. 57,291–304.