
Treatment studies on a xenobiotic containing industrial effluent
372
TREATMENT STUDIES ON A XENOBIOTIC CONTAINING INDUSTRIAL EFFLUENT by IAN PAUL CLARK A thesis submitted to the Faculty of Engineering of the University of Birmingham for the Degree of Doctor of Philosophy (Engineering) Biochemical Engineering Section School of Chemical Engineering University of Birmingham P.O. Box 363 Birmingham B15 2TT England April 1990
-
Upload
khangminh22 -
Category
Documents
-
view
4 -
download
0
Transcript of Treatment studies on a xenobiotic containing industrial effluent

TREATMENT STUDIES ON A XENOBIOTIC CONTAINING INDUSTRIAL EFFLUENT
by
IAN PAUL CLARK
A thesis submitted to the Faculty of Engineering
of the University of Birmingham
for the Degree of Doctor of Philosophy (Engineering)
Biochemical Engineering SectionSchool of Chemical EngineeringUniversity of BirminghamP.O. Box 363BirminghamB15 2TTEngland
April 1990

University of Birmingham Research Archive
e-theses repository This unpublished thesis/dissertation is copyright of the author and/or third parties. The intellectual property rights of the author or third parties in respect of this work are as defined by The Copyright Designs and Patents Act 1988 or as modified by any successor legislation. Any use made of information contained in this thesis/dissertation must be in accordance with that legislation and must be properly acknowledged. Further distribution or reproduction in any format is prohibited without the permission of the copyright holder.


SYNOPSIS
The aim of this project was to assess treatment processes
for an effluent generated from the manufacture of a mixture of
dinitroethylbenzene and trinitroethylbenzene, known as K10.
No directly related literature was available, although
there were many references to the closely related TNT
manufacture and effluent treatment. Hence this was used to
obtain possible solutions to difficulties arising in treatment of such an effluent.
Mixed microbial cultures were adapted, within laboratory scale activated sludge plants, to treat either a mixed phenolic waste or K10 wash water effluent supplemented with mixed phenolic waste (as a carbon supplement). Plant performance was assessed using standard wastewater treatment
techniques such as COD, TOC and phenol analyses together with
high performance liquid chromatography. These tests demonstrated that some of the K10 wash water effluent
components were biodegraded or transformed, although the
coloured components were poorly biodegraded (comparable with
results obtained for TNT wastewater treatment).
Studies on the rate of oxygen uptake by activated sludge in response to exposure to various concentrations of K10 wash water effluent showed, surprisingly, that unadapted organisms
had a higher uptake rate than adapted organisms. It was
suggested that the K10 wash water effluent was active in
"uncoupling" oxidative phosphorylation, a suggestion further
supported by. the demonstration that K10 waste dissipated
electrochemical membrane potential. As a point of interest,
the analogous TNT red water was also found to dissipate electrochemical membrane potential.
The use of activated carbon to adsorb the wastewater
components was successful. However, since the carbon would not
be regenerated but instead discarded, as with the analogous
TNT red water treatment, this process would be environmentally
as well as economically unsound. It was thus not recommended
for treatment of K10 wash water effluent.

Ozone gas was found to react quite readily with the K10
wash water effluent components. The orange coloration of the
wastewater was removed completely as was the absorbance in the
UV range of 240 to 300nm thus suggesting that the effluent was
no longer aromatic. Over 95% of the COD value and over 60% of
the carbon content of the wastewater could be removed by
ozonolysis. The COD and TOC values correlated with absorbance
at 250nm and thus absorbance measurements could be used to
estimate these values during the treatment process. The
compounds remaining after treatment were considered to be
organic acids which were readily metabolised by
microorganisms. Ozonolysis of the analogous TNT red water was
not as successful since the ozone contactor design did not
allow sufficient ozone contact time for this effluent. The
reaction rate of TNT red water components with the ozone gas
was much slower resulting in large quantities of ozone in the
contactor off-gas. The COD and absorbance values decreased
linearly with ozone utilised (as with K10 wash water
effluent).
To conclude: K10 wash water effluent is a highly potent
metabolic inhibitor: however, at low concentrations the
non-coloured components can be treated by adapted biological
systems. Of the treatment processes investigated, only ozone
or activated carbon treatments were successful in removing the
coloured components. Ozonolysis is environmentally sounder
since it destroys the aromaticity of the wastewater and the
remaining compounds can be successfully metabolised by
microorganisms.

DEDICATION
To my Mother

ACKNOWLEDGMENTS
The author wishes to express many thanks to those people
who have been very helpful during the course of this work. In
particular to Dr. D. A. J. Wase from Birmingham University for
his guidance, supervision and enthusiasm, and also to
Dr. M. Phillips from the Royal Ordnance Explosives Division at
Waltham Abbey for his supervision, useful ideas and financial
support.
Thanks are also extended to the following:
The technical staff - Joe Farmer, Hazel Jennings, Elaine
Mitchell and Graham Titmus for their guidance and assistance.
Gill Wheeler for the production of photographs in this
thesis.
The glass blowers - Stan Clabon and Vince Merral for
their ever-ready and efficient service.
The departmental workshop and electronics staff for
construction of apparatus and maintainance of equipment.
Finally, to my fellow workers for helpful suggestions and
ideas.

CONTENTS
Page
1 INTRODUCTION 1
1.1 The Task 1
1.2 Why Treat a Waste? 3
1.3 DNEB and TNEB (K10) Wash Water Effluent 5
1.3.1 Why are DNEB and TNEB Manufactured? 5
1.3.2 The Chemistry of K10 Manufacture 5
1.3.2.1 Reaction 1. Production of Mononitro- 6
ethylbenzene (MNEB)
1.3.2.2 Reaction 2. Production of Dinitro- 6
ethylbenzene (DNEB)
1.3.2.3 Reaction 3. Production of DNEB/TNEB 7
Mixture
1.3.3 General Chemical Properties of K10 and Wash 7
Water Effluent
1.3.4 General Physical Properties of K10 and Wash 8
Water Effluent
1.3.5 Analysis of K10 9
1.4 Possible Treatment Processes for Chemical Wastes 10
1.4.1 Activated Carbon 11
1.4.2 Resin Adsorption 15
1.4.3 Freeze-crystallisation 16
1.4.4 Liquid-liquid Extraction 17
1.4.5 Oxidation 17
1.4.6 Ozonolysis 19
1.4.6.1 Properties and Toxicity 19
1.4.6.2 Production of Ozone 20
1.4.6.3 Mechanisms of Ozone Attack 22
1.4.6.4 Ozone Contactors 25

1.4.6.5 Ozonation Analysis Considerations 27
1.4.6.6 Colour Reduction using Ozone 27
1.4.6.7 Ozone and Pesticides 29
1.4.6.8 Ozone with Nitroaromatics 30
1.4.6.9 Cost of Ozone Systems 34
1.4.6.10 Summary and Conclusions 34
1.4.7 Reduction - Catalytic 35
1.4.7.1 Catalytic Hydrogenation 36
1.4.8 Aerobic Activated Sludge 39
1.4.9 Aerated Lagoons 41
1.4.10 Percolating Filters 41
1.4.11 Anaerobic Digestion 42
1.4.12 Enzyme Treatment 44
1.5 Biological and Chemical Methods Compared 45
1.6 Biodegradation 48
1.6.1 Partial Degradation 48
1.6.2 Recalcitrance 49
1.6.3 Co-metabolism 50
1.6.4 General Metabolism of Aromatic Compounds 51
1.6.5 Anaerobic Metabolism of Aromatic Compounds 53
1.6.6 Compounds of Immediate Interest 54
1.6.6.1 Nitrobenzenes 54
1.6.6.2 Aminobenzenes 57
1.6.7 Effect of Chemical Structure on Biodegrad- 59
ability
1.7 Conclusions 60

2 MATERIALS METHODS AND EQUIPMENT 61
2.1 Aromatic Wastes 61
2.1.1 K10 Wash Water Effluent 61
2.1.2 Mixed Phenolic Waste 61
2.2 Growth Media 62
2.2.1 Simple Salt Medium 62
2.2.2 Mixed Phenolic Medium 62
2.2.3 Synthetic Phenolic Medium 63
2.2.4 K10 Medium (12.5%) 63
2.2.4.1 1% K10 and Mixed Phenolic Medium 63
2.2.4.2 2.5% K10 and Mixed Phenolic Medium 63
2.2.4.3 5% K10 and Mixed Phenolic Medium 64
2.2.5 Synthetic K10 Media 64
2.2.5.1 Static Phenol Media 64
2.2.5.2 Decreasing Phenol Media 64
2.3 Inocula 65
2.4 Analytical Methods for Assessment of Treatment 66
Plant Performance
2.4.1 Biological Oxygen Demand 66
2.4.2 Chemical Oxygen Demand (COD) 66
2.4.3 Total Organic Carbon (TOC) 68
2.4.4 Total Suspended Solids 69
2.4.5 Phenol Analysis 69
2.4.6 Microscopic Examination 70
2.5 UV Wavelength Scans 71
2.6 Gas Liquid Chromatography 72
2.7 High Performance Liquid Chromatography (HPLC) 73
2.8 Measurement of Oxygen Uptake by Activated Sludge 74
2.9 Detection of Oxidative Phosphorylation Uncoupling 76
2.10 Activated Carbon 78

2.11 Ozonolysis 79
2.11.1 Ozone Generator Operating Principle 79
2.11.2 Ozone Contactor 80
2.11.3 Ozone Assay 81
2.11.3.1 Potassium Iodide Solution 82
2.11.3.2 Ozone Assay Procedure 82
2.11.3.3 Calculation of Ozone Concentration 83
2.11.4 Ozone Safety 83
2.12 Sterilisation 85
2.13 Growth Measurements 86
2.14 Ancillary Instruments 87
2.15 Chemicals Used 88
3 RESULTS 89
3.1 Shake Flask Studies - Preliminary Work 89
3.2 Aerobic Activated Sludge Process 91
3.3 Activated Sludge Plant Start Up 93
3.4 Experimental Strategy 94
3.5 Results 97
3.5.1 Phenol Analysis 97
3.5.2 COD Analysis 100
3.5.3 TOC Analysis 101
3.5.4 Control and Experimental Plants - General 102
Comments
3.6 Pilot Reactor Results (2L) 103
3.7 Final Biological Assessment 105
3.7.1 COD Analysis 105
3.7.2 Phenol Analysis 107
3.7.3 TOC Analysis 108
3.7.4 Final Biological Assessment - General Comments 109

4 FURTHER INVESTIGATIONS AND ANALYSES 110
4.1 Microscopic Sludge Examination 110
4.2 Ultra-violet Scans 114
4.3 High Performance Liquid Chromatography (HPLC) 116
4.3.1 The System Utilised and Results Obtained 116
4.3.2 HPLC Analysis of K10 Degradation 117
4.3.3 Stationary and Mobile Phase Selection 118
5 OXYGEN UPTAKE STUDIES 123
5.1 Oxygen Uptake by Sludge in response to K10 Exposure 123
5.2 Further Confirmation of Uncoupling Activity 125
5.3 Rejection of Hypotheses 127
5.4 Discussion 128
5.5 TNT - Membrane Potential Dissipation 129
6 CARBON AND OZONE TREATMENT RESULTS 130
6.1 Activated Carbon 130
6.1.1 Costing of Carbon Treatment 131
6.2 Ozonolysis 133
6.2.1 Ozonolysis Costing 137
6.2.2 Summary 139
6.3 Ozonolysis of TNT Red Water 140
6.4 Biological Treatment of Post-ozonolysis K10 Effluent 143
6.5 Summary of Ozonolysis 146
7 FINAL DISCUSSION AND RECOMMENDATIONS 148
7.1 Discussion and Conclusions 148
7.2 Recommendations 155

8 REFERENCES 156
ABBREVIATIONS
APPENDICES
Appendix 1
Appendix 2
Appendix 3
Appendix 4
Appendix 5
Appendix 6
Chapter 1
Chapter 2 Results
Chapter 3 Results
Chapter 5 Results
Chapter 6 Results
Additional References

- 1 -
CHAPTER 1
INTRODUCTION
1.1 THE TASK
A pilot plant based at Waltham Abbey in Essex used to
manufacture a mixture of dinitro- and trinitro-ethylbenzene
(DNEB and TNEB, Figure 1), on a batch-wise basis, but has now
been decommissioned. A new plant is under construction at
Bridgwater in Somerset which will also operate on a batch-wise
basis. The aim of this project is to assess the treatability
of the effluent generated, preferably by biological methods,
so as to render it harmless to the environment. Because of its
unique pollutant content, the treatment of such an effluent
requires new techniques or modification of old ones (Smith et
a_l., 1982).
Essentially there is no relevant information pertaining
to the disposal of DNEB/TNEB manufacturing effluent in the
literature. Thus it was necessary to look at an analogous
system such as the waste generated from the manufacture of
trinitrotoluene (TNT). The chemical structure of TNT (Figure
2) , a solid, is very similar to that of DNEB/TNEB (Figure 1),
a liquid. However, although they are related, there is no
direct evidence that effluents from their manufacture will
have similar properties. In contrast to the dearth of
information for DNEB/TNEB, the literature related to TNT waste
is voluminous, and therefore only a selection of papers will

NO
NO
DNEB
]VIo. 1 o ou. 1 s.^- Foa^mu. 1 <=*.
o-->isr
NO
1 star Foarmuila.
Figure 1. Structure of Dinitroethylbenzene (DNEB) and Trinitroethylbenzene (TNEB)

OH:
INTO
INTO
IVEc> 1 o:t~mu.
Figure 2. Structure of Trinitrotoluene (TNT)

- 2 -
be chosen to help illustrate, clarify and emphasise
problems involved in treating such an effluent.

- 3 -
1.2 WHY TREAT A WASTE?
The removal of organic material from wastewater is one of
the most important tasks of the waste engineer. There are many
authors such as Callely et al. (1977); Eckenfelder (1980);
Forster (1985); Koziorowski and Kucharski (1972) and Nemerow
(1971) who all stress the problems, basic as they are, of
discharging organic compounds into receiving waters.
Problems arise because organic compounds are usually
oxidised rapidly by microorganisms in the receiving streams,
resulting in reduced dissolved oxygen levels and the
accompanying ill effects of deoxygenated water. In severe
cases this can mean a stinking, lifeless body of water. Other
problems can accompany certain wastes such as direct toxicity
to environmental life forms. Discharge of these toxic wastes
to domestic sewers may cause difficulties in the watercourse
receiving the treated effluent, and in extreme cases can even
kill the bacteria present at the local sewage treatment plant.
Mere discharge of such an effluent stream, untreated, to a
watercourse is obviously potentially highly damaging to the
environment, although there is always the problem of precisely
estimating the effect on environmental life forms, since waste
streams are often mixed and invariably complex. Therefore
treatment of such wastes must be of paramount importance if a
pollution-free environment is to be maintained. Micro
organisms are sensitive to environmental conditions such as
temperature; pH (acidity and alkalinity); oxygen tension;

- 4 -
degree of mixing; the presence of toxic substances and also
the character and quality of their foodstuffs in general.
Therefore due care must always be taken to avoid such extremes
as far as is possible (e.g. by dilution, pH adjustment, etc.)
in order to permit the inhabitants of the sewage works to
continue to operate efficiently, even in the presence of the
toxic material to be treated.

- 5 -
1.3 DNEB AND TNEB (K10) WASH WATER EFFLUENT
1.3.1 Why are DNEB and TNEB Manufactured?
DNEB/TNEB as a mixture, known as K10, is manufactured for
use as a plasticiser, not an explosive. It does nevertheless
possess explosive properties and was therefore considered for
inclusion in the hazard classification UN Class 1.1, (an
explosive (pyrotechnic) substance). However, many of the tests
and criteria used for the classification of explosive
materials indicated that K10 was too insensitive for inclusion
in this category. K10 was also found very difficult to ignite
and had a high flashpoint temperature. As K10 could not be
classified as a flammable liquid it was finally classified in
UN Class 6.1, (a poisonous (toxic) substance). However, this
refers to K10 which is a mixture of both DNEB and TNEB. Pure
DNEB would be expected to behave in the same way as the whole
K10 liquid and also as dinitrotoluene and dinitrobenzene which
are also classified in UN Class 6.1. TNEB is, of course, not
normally separated from K10, and it is therefore not entirely
clear how it would be classified. However, it is reasonable to
expect it to behave as TNT and thus be classified in UN Class
1.1.
1.3.2 The Chemistry of K10 Manufacture
K10 is produced by the treatment of ethylbenzene with
sulphuric and nitric acids in three separate stages. This
process is discussed below and the reaction process is shown
in Figure 3.

CH2 CH3 CH2 CH3 CH2 CH3
CH2 CH3
Reaction 1 Reaction 3
Figure 3. Manufacture of Dinitjoethylbenzene and Trinitroethylbenzene

- 6 -
1.3.2.1 Reaction 1. Production of Mononitroethylbenzene (MNEB)
Ethylbenzene is stirred with concentrated sulphuric acid
and about 50% nitric acid at a temperature not exceeding
30°C for two hours. The MNEB is then separated from the
reaction mixture. The substitution position is either ortho
or para at a ratio of 2:1 respectively whilst little or no
meta substitution occurs. It should be noted that all
substitution positions mentioned here are relative to the
ethyl group position.
1.3.2.2 Reaction 2. Production of Dinitroethylbenzene (DNEB)
The MNEB mixture is stirred with both concentrated
sulphuric and concentrated nitric acids at 70°C for two
hours. The DNEB is separated from the reaction mixture and
then washed in distilled water, followed by sodium carbonate
solution and finally urea solution. After this treatment all
of the para-MNEB is substituted in the ortho position thus
forming ortho,para-DNEB. The ortho-MNEB is substituted
either at the ortho or at the para position with equal
frequencies thus forming ortho.ortho-DNEB and
ortho.para-DNEB at a ratio of 1:1. Thus ortho,para-DNEB
predominates over ortho,ortho-DNEB by a ratio of 2:1
respectively.

- 7 -
1.3.2.3 Reaction 3. Production of DNEB/TNEB mixture
The DNEB mixture is stirred with both concentrated
sulphuric and concentrated nitric acids at 85°C for four
hours. The DNEB/TNEB is separated from the reaction mixture
and then washed in distilled water, followed by sodium
carbonate solution and finally urea solution.
The ortho.para-DNEB is not very reactive and does not
take part in this reaction to any great extent. However the
ortho,ortho-DNEB is very reactive and is readily substituted
in the para position forming TNEB. Thus the final reaction
mixture contains 2,4 DNEB and 2,4,6 TNEB at a ratio of 2:1
respectively. This reaction mixture is known as K10.
1.3.3 General Chemical Properties of K10 and Wash Water
Effluent.
This manufacturing process generates two types of waste,
the first being spent acids which are currently dumped and the
other the wash water effluent. The possibility of cleaning and
detoxifying this wash water effluent is the basis of this
project. The wash water effluent can be expected to contain
urea and sodium carbonate, both at concentrations of less than
1%, and an assortment of aromatic compounds. No relevant
published information is available as to the nature of this
effluent. Consequently environmental toxicity and chemical
behaviour can be estimated only from comparisons with similar

- 8 -
effluents, allied to some deduction and guess-work. Thus, it
was expected to contain Meisenheimer complexes (Figure 4)
which are responsible for an absorbance peak at about 350nm
due to their orange colouration. The waste also absorbed light
strongly in the short ultra-violet region (190 to 260nm) and
its components can be absorbed onto activated charcoal, the
loading of which, with TNT wastewater, is pH dependent (Nay
et al.. 1972). During the course of this work, the effluent
was found to have a total organic carbon content of around
4000mg/L and a chemical oxygen demand of 8000mg/L and must
therefore be considered as a fairly strong effluent.
1.3.4 General Physical Properties of K10 and Wash Water
Effluent.
For most investigations, the physical properties of the
materials under investigation are known. Although, in this
case, they had to be determined by preliminary
experimentation, it seems appropriate to list them at this
point.
K10 is a yellow liquid with a flash point of 86°C and an
ignition temperature of 244 C, whereas wash water effluent has
an orange colouration and no reported ignition or flash point
temperatures. The density of K10 and that of three separate
batches of wash water effluent were measured using a 50cm3
specific gravity (or density) bottle. The K10 sample received
had a density of 1.367g/cm (Royal Ordnance density value =
3l.34g/cm ) whilst that of the effluent ranged from 1.013g/cm3

(D
(0 j (D 00 UTJ
HO•rlH
sou
mS•H(DC (D (0
•pHrd wM a)e•H
Q)0)(fl-H(UQ) £
•P«W OQ)
-P
OW
•
•^
Q)CP •H
(D!0 11 (D 00U

- 9 -
to 1.015g/cm3 .
Solubilities of K10 and the wash water effluent, the
latter of which is mainly water, were observed for a range of
solvents as shown in Table 1. Equal volumes of solvent and
sample were added and shaken vigorously for five minutes. It
should be noted that if solvent and sample were not miscible
then, as a rule, colour was not visibly detectable in the
solvent layer. Ethyl acetate proved the only exception to this
rule when in contact with the wash water effluent.
1.3.5 Analysis of K10
The composition of K10 can be determined by High
Performance Liquid Chromatography (HPLC). Good separation is
achieved using a C n 0 reverse phase column with a mobile phase-Lo
comprising methanol, water and tetrahydrofuran at a ratio of
2:2:1 respectively. Figure 5 shows a typical separation of
K10 (Supplied by Royal Ordnance, Waltham Abbey, Essex and
reproduced by the author). The peak areas for DNEB and TNEB
7 7 were 2.60 x 10 and 1.25 x 10 respectively and indicate a 2:1
ratio assuming that both compounds absorbed light equally at
260nm. The largest contamination peak, at 260nm, had an area
of 7.25 x 10⁵ which is less than 3% of the DNEB peak at this
wavelength. This analysis confirms that DNEB and TNEB are
clearly the predominant components of K10.

Solvent Solvent Polarity K10 K10 Effluent
Index
Water 9.0 - +
Methanol 6.6 + +
Acetonitrile 6.2 + +
Acetone 5.4 + +
Chloroform 4.4 + -
Ethyl acetate 4.3 + - *
Tetrahydrofuran 4.2 + +
Propan-2-ol 4.2 - +
1,2 Dichloroethane 3.5 +
Dichloromethane 3.4 +
Diethylether 2.8 +
Heptane 0.1
Hexane 0.1
2,2,4 Trimethyl- -0.4
pentane
Key: + = Solvent and sample readily miscible
- = Solvent and sample immiscible
* = Solvent and sample immiscible, however
the solvent layer aquired an orange hue
Table 1. Solubilities of K10 and the K10 wash water effluent
in a range of solvents.

fflH
H) W
Q H100-
CQ-P•r-l
cD
50-
0-
0 10 15 Time (min)
20 25 30
Conditions of Analysis
Run Time: Injection Volume: Sample Rate: Sample Concentration: Solvent Flow Rate: Solvent Composition: Detector Wavelength: Stationary Phase:
30 minutes20JJ12 per second33.4mg in 50ml solventIml/minWater : MeOH : THF at 2:2:1260nm. 0.1 AU FSDZorbax ODS (C 18 ), 250mm x 4.6mm ID
Figure 5. HPLC Analysis of K10

- 10 -
1.4 POSSIBLE TREATMENT PROCESSES FOR CHEMICAL WASTES.
Treatment processes for chemical wastes can be divided
into two main categories, namely chemical or biological
treatments. A list of established treatments which may be
applicable to an aqueous, possibly hazardous waste stream,
such as K10 wash water effluent, which contains a moderate
concentration of organic compounds is given below:
Physical-Chemical Treatments:
Carbon Adsorption
Resin Adsorption
Freeze-crystallisation
Liquid-liquid Extraction
Oxidation
Ozonolysis (with or without UV light)
Reduction (catalytic)
Biological Treatments:
Aerobic Activated Sludge
Aerated Lagoons
Percolating Filters
Anaerobic Digestion
Enzyme Treatment

-li
lt may be possible to obtain complete treatment of a
waste using only one of these processes but it is often the
case that a combination of several processes is required.
These treatments will be discussed individually: whilst costs
of such treatment processes are not exhaustively covered, it
be remembered that costs, both capital and operating, must be
considered when choosing a waste treatment process.
1.4.1 Activated Carbon
Adsorption has been used for many years in the reduction
of tastes, odours and colours in the treatment of water and
wastewater. Adsorption is a process by which molecules in
solution, the adsorbate, attach to a solid surface, the
adsorbent, through van der Waals forces. This adsorption
continues until equilibrium is attained. Carbon adsorption is
a well established technique for the removal of organic
compounds and has a great potential for removing either
non-biodegradable or toxic organics from wastewaters
(Besselierre and Schwartz, 1976; Burns and Shell, 1974;
Calleley et al., 1977; Cooper and Hager, 1966;
Eckenfelder, 1980; Holiday and Hardin, 1981; Kul'skii and
Shabolina, 1967; Saleh et al., 1982).

- 12 -
Several factors must be established before an adsorption
process is employed, namely:
i) Selection of adsorbent type
ii) Adsorbent regeneration
iii) Operating conditions (flow rate, contact time, bed
depth and grain size).
Selection of the correct adsorbent is very important and
adsorbents can be classified into active and less active
forms, but classification depends on the molecules to be
adsorbed. For example, a carbon with very fine pores and a
high activity is not suitable for large molecules, whilst a
carbon with larger pores and a lower activity might prove to
be a more effective adsorbent. Mistakes of this nature are
often made in industry where wastes can be very varied. The
best policy in selecting an adsorbent is by trial and error
using a wide range of adsorbents with the waste to be treated.
Adsorbent regeneration is the second consideration, and
in particular whether regeneration is economically viable.
Regeneration of the carbon can be achieved using a variety of
techniques including steam stripping, solvent extraction and
heat treatment. However, steam treatment is not commonly used
as the adsorbate must have a boiling point well below that of
the steam and its concentration in the condensate must be much
higher than in the wastewater. Organic solvent extraction is
sometimes employed although the solvent must readily dissolve
the adsorbed phase and also be miscible with water. Heat

- 13 -
treatment is the most commonly used process, especially when
recovery of the adsorbed phase is of no importance. This
process involves drying the carbon and heating (650 to
1000°C) with limited amounts of water, flue gas and oxygen.
Much of the current interest in activated carbon is centred
about the problems involved in the economically efficient use
and reuse of activated carbon (Hemphill et al.. 1977). For
instance thermal regeneration results in carbon losses of
between five to ten percent and is often coupled with a
reduction in the carbon loading capacity. The latter is
usually due to a pore size increase and also by blocking due
to deposition of residual materials. Moreover thermal
regeneration is expensive and if the carbon is not regenerated
it presents a further disposal problem.
The final considerations are those of the operating
conditions. Activated carbon is said to be able to adsorb up
to thirty percent of its weight in mixed organic materials
with an efficiency exceeding seventy percent and with a
contact time of less than forty minutes. However, it must be
remembered that many factors will affect the efficiency of
such a process. These were discussed by Eckenfelder (1980) and
summarised as follows:
Rate of adsorption is a function of:
i) Diffusion of the adsorbate to the adsorbent surface
through a liquid film resistance

- 14 -
ii) Diffusion of the adsorbate into the pores of the
adsorbent and adsorption at the interior surface
sites
In most applications, these first two mechanisms are
controlling, but the rate of adsorption also increases with:
i) An increase in adsorbate concentration
ii) A decrease in adsorbent particle size
iii) A smaller adsorbate molecule and an increase in
surface area of adsorbent.
Adsorption is proportional to the time of contact, and
for granular carbon the adsorbate must penetrate the channels
in the carbon which requires a longer time period before
equilibrium is attained.
Adsorption capacity may increase with:
i) An increase in adsorbate concentration
ii) An increase in surface area of the adsorbent
iii) An increase in molecular weight of the adsorbate
iv) A decrease in pH of the solution that changes the
organic molecules into a less soluble form.
Molecular structure of the molecule to be adsorbed is
also an important factor and is shown in Table 2. It can be
seen that nitro groups often enhance adsorbability and that
increased molecule size can result in more solute carbon
chemical bonds and hence better adsorption.

1) Increased solubility of the solute in the liquid carrier
decreases its adsorbability.
2) Branched chain molecules are usually more adsorbable than
straight chains.
3) Substituent groups affect adsorbabiliy
Substituent Group Nature of Influence
Hydroxyl -Generally reduces adsorbability;
extent of which depends on structure
of host molecule.
Amino -Effect similar to hydroxyl but
somewhat greater.
Carbonyl -Effect varies with host molecule
Double Bonds -As carbonyl
Halogens -As carbonyl
Sulphonic -Usually decreases adsorbability
Nitro -Often increases adsorbability
4) Undissociated molecules (weakly ionised) are in general
preferentially adsorbed.
5) Unless screening of carbon pores intervene, large molecules
are more sorbable than small molecules of similar chemical
nature.
6) Molecules with low polarity are more sorbable than highly
polar molecules.
Table 2. Influence of Molecular Structure and other Factors
on Adsorption (Eckenfelder, 1980)

- 15 -
Some work has been carried out on both nitroaromatic
solutions and effluents. Eckenfelder (1980) discusses the
removal of 96% of nitrobenzene (lg/1) from solution with a
doseage of powdered carbon (5g/l). In light of this, one might
expect activated carbon to be a suitable process for treatment
of nitroaromatic effluents. Indeed, many researchers have
investigated the use of activated carbon for treatment of
munitions manufacturing wastes (including TNT wastes). Whilst
such treatment is technically feasible the experimental data
obtained for carbon suitability are not promising (Schulte et
al., 1973). Whilst nitroaromatics and colour can be adsorbed
by carbon (a process which is more efficient if the waste is
acidic) there is a serious deficiency in the activated carbon
system. This is the inability to successfully regenerate the
exhausted carbon either by thermal or chemical methods
(Fochtman and Huff, 1975 and Patterson et al.. 1976). As a
consequence the carbon must be disposed of, by incineration,
after a single use.
1.4.2 Resin Adsorption
Resin adsorption, like carbon adsorption, is a useful
process for the extraction of organic solutes from aqueous
waste streams. However, carbons can be thermally regenerated
resulting in adsorbate molecule destruction whereas resins are
always chemically regenerated. This regeneration is with an
organic solvent, or a caustic one, with the reuse of organic
solvents after distillation.

- 16 -
Resin adsorption is thus similar to carbon although the
former is preferred if the adsorbate molecule is to be
recovered. Unfortunately these synthetic resins are much more
expensive than carbon, and thermal regeneration operating
costs are higher than solvent regeneration. The last
consideration is that resin adsorption serves only to
concentrate the waste and does not destroy it, unlike thermal
treatment. As a result further consideration needs to be given
to disposal.
Patterson et al. (1976) discuss problems of polymeric
resins used in the military explosives industry. They state
that whilst resins are easily regenerated, the loading
capacity is not as high as for carbon adsorption. TNT itself
is reported to adsorb, elute and be suitable for reprocessing
but the coloured bodies are poorly adsorbed. Thus polymeric
resins are essentially unsuitable for treatment of TNT red
water effluent.
1.4.3 Freeze-crystallisation
This process involves the formation of "pure" ice
crystals from a solution, and concentration of dissolved
solutes in the residual solution. These crystals are then
separated from the concentrated solution which must then
either be treated further or disposed of.

- 17 -
Thus freeze crystallisation is another process which is
concerned with effluent concentration and, due to the fairly
high energy requirement, is not generally used on a commercial
basis for wastewater treatment.
1.4.4 Liquid-liquid Extraction
Liquid-liquid extraction involves the removal of
wastewater constituents from the aqueous phase to an organic
phase. This process is dependent on several factors. Firstly,
the components of the waste must be readily soluble in the
extracting solvent, whilst the extracting solvent must have as
low a solubility in water as is possible. The final
consideration must be in the separation of the extracting
solvent and solute. The difference in their boiling points is
most often used for their separation. This process, as with
freeze-crystallisation, serves only to concentrate the waste
components and thus does not solve the waste disposal problem.
1.4.5 Oxidation
Chemical oxidation may be employed to oxidise pollutants.
Common oxidants are chlorine, air, potassium permanganate and
ozone (discussed separately, Section 1.4.6).
Chlorine is generally used to oxidise cyanides to
cyanates which can be oxidised further to carbon dioxide and
nitrogen gases. Chemical oxidation has also been applied to

- 18 -
dilute aqueous waste streams containing phenols and also for
odour reduction of wastes in the papermaking industries.
Unfortunately, some of these processes introduce new
components into the waste stream which might themselves need
further treatment. Further problems arise when hazardous
materials, often from industrial wastes, are only partially
removed due to inefficient or incomplete oxidation. Thus it
must be stressed that chemical oxidation requires careful
evaluation due to the addition of chemicals into the waste
stream which might increase the pollutant load and require
stringent safety measures for their use. Although these
processes can, and often do, solve the waste problem, high
operating costs, a factor dependent on the waste stream
itself, often restrict their use on industrial waste streams.

- 19 -
1.4.6 Ozone
1.4.6.1 Properties and Toxicity
Ozone is a highly reactive allotrope of ordinary
atmospheric oxygen in which the molecule is composed of three,
rather than two atoms (Figure 6). Ozone gas is about one and a
half times heavier than air; it boils at -112°C (1 atm); is
thirteen times more soluble than oxygen in water (over
temperature range 0 to 30°C) and has a distinctly blue
colouration. This blue colouration is not however, apparent in
"ozonised air" which is produced when part of the air's oxygen
is converted to ozone, producing ozonised air, a colourless
gas (Anon, 1983 and Rice et al., 1981).
Only a few substances are resistant to the very strong
oxidising effect of ozone. They include glass, stainless
steel, PTFE and viton and hyphalon rubbers. Since ozone is
such a strong oxidising agent it is also a very toxic gas and
the breathing of ozone has serious implications which include:
structural changes in lung tissue
enzymatic changes in blood
reduced resistance to respiratory bacterial infection
reduced pulmonary function
disruption of cellular biochemistry
fragilisation of cell membranes
increased oxidation of unsaturated fatty acids

•o:•• -I-o
i i )
+ * *o• •
i i iv v
Oa
• •o• •
+
Figure 6. The four Canonical Forms of the Ozone Resonance Hybrid (Bailey, 1978)

- 20 -
However there is no evidence of carcinogenic or mutagenic
effects or effects on reproduction (Leh, 1973 and Rice et
al. , 1981). Fortunately the risk of exposure to harmful or
toxic levels is relatively small, since ozone has a
characteristic penetrating odour which is readily detectable
at concentrations as low as 0.01 to 0.05 ppm (Rice et al.,
1981) and the recommended limit for ozone exposure is 0.1 ppm3 (0.2mg/m ) calculated as an 8-hour time weighted average
concentration (Anon, 1983).
1.4.6.2. Production of Ozone
Due to the reactive nature of ozone and its relatively
short half-life (12 hours in dry air, as measured by the US
Environmental Pollution Agency) it cannot be shipped or stored
and is thus generated on site immediately prior to use. Even
so, it can be piped considerable distances from the generator
to the contactor with no fear of significant decomposition to
diatomic oxygen.
Ozone is produced when high-voltage electricity is
imposed across a discharge gap in the presence of a dry,
oxygen containing gas. Ozone has been used in France for water
disinfection since 1906. This plant could generate ozone using
73kWh/kgO_. Today, ozone generation at an Indianapolis plant
requires only 6.31kWh/kgO3 when utilising pure oxygen or 12.6
kWh/kgO3 when using air (Rice et al., 1981). This is
clearly a marked improvement in efficiency, in terms of energy

- 21 -
costs, compared with the 1906 figure. Even so the potential
for improvement remains high, since the basic method of
production is grossly inefficient. Currently the situation is
that only about 10% of the energy supplied is used to make
ozone. The remainder is lost as light, sound and primarily
heat. Unless this heat is removed the ozone yield will suffer
due to the sensitivity of ozone decomposition to temperature.
Yield is also a function of the oxygen and water content
of the feed gas; moreover, a given ozone generator can produce
over twice the quantity of ozone and consume less than half
the power when fed with 100% oxygen as opposed to air
(Hardisty and Rosen, 1977). In oxygen feed ozone production
systems the effluent gas stream from the ozone contactor,
which now should contain only the residual oxygen is often
recycled. However, in this case problems may arise in
processes which involve the complete oxidation of organics as
carbon dioxide is invariably produced. This will dilute the
high purity oxygen and so reduce the ozonator efficiency.
Once-use air systems are obviously unaffected by gaseous
reaction products such as carbon dioxide and are thus
favourable for processes involving complete oxidation, such as
the one under consideration in this thesis.

- 22 -
1.4.6.3 Mechanisms of Ozone Attack
The oxidation potential of ozone in alkaline solution is
very considerable. Indeed it is ranked second only to
fluorine, among the readily available water treatment
chemicals, and is capable of oxidising a great many organic
and inorganic compounds. However, it is not selective in this
function.
Ozone can react in two ways. The first is directly as
molecular ozone in which the ozone molecule attacks a chemical
bond which is specifically reactive to ozone, such as a double
bonded carbon atom. The other method of ozone attack is for
the molecule to decompose to radicals before reacting in this
form. These two distinctly different methods of ozone attack
need careful consideration since the partial oxidation
products will be quite different for the same substrate. This
would also be reflected in the amount of organic carbon
removal. These two methods of attack are discussed further:-
The first method discussed involves a direct attack.
There are two general methods by which ozone could directly
attack an unsaturated bond. The first mechanism involves a
one-step simultaneous attack of both reactive centres of the
ozone molecule on both reactive centres of the unsaturated
molecule. The other possibility is a two-step attack of the
reactive centres of the ozone molecule on the unsaturated
system. However many additional questions remain. If, for

- 23 -
example, the first method were to operate, would it involve
the terminal oxygen atoms or adjacent atoms? Or if the second
method were to apply, would the first step for this method
imply an electrophilic or nucleophilic attack? Would the first
step involve a central or terminal atom? If the attack
involved a terminal atom would the attack then be completed in
the second step by the middle or the other terminal atom?
It is generally considered that the reaction which occurs
is a two step process in which a terminal oxygen atom makes
the initial electrophilic attack, after which either the
central or other terminal atom could complete the attack
(Figure 7). Reaction (i) was favoured by some workers during
the 1950's since this molecule should be relatively stable.
However, this was the best argument against it, as it was
never isolated. The structure formed in Reaction (ii) should
be very unstable and would be expected to break down very
rapidly (Bailey et al., 1959). The oxidation of phenol is
through a direct attack mechanism and has been shown to
produce over fifteen different intermediate compounds (Figure
8) . It is also worth noting that complete oxidation of phenol
to carbon dioxide and water would not necessarily be required
in a large scale process since many of the intermediate
compounds are readily utilised by microorganisms.

"—o4
x \ IL 3.
O
o o o—o—o
0 — 0 O
)c-c<
—o—o
Figure 7. The attack of an Unsaturated Bond by Ozone (Bailey et al., 1959)

Phenol
OH
H
OH
0
o-Quinone
03—»
H20
OH
Catechol
0
C-OH
C-OHII0
C02
H20
Maleic Fumaric and Oxalic Acids
Figure 8. A Simple Mechanism for the Ozonolysis of Phenol (Bailey, 1982)

- 24 -
The second method to be discussed could involve hydroxyl
radical attack. Ozone can decompose in water to form hydroxyl
radicals. These radicals are one of the most powerful and
effective oxidants that occur in aqueous solution. The auto-
decomposition of ozone to radicals is catalysed by the
hydroxide ion (OH~) and thus a high pH, about 9, is required
for radical formation. However 'scavengers' such as— 2 —
bicarbonate ions (HCO ), carbonate ions (CO ) and aliphatic
alcohols are well known for their abilities to quench
formation of radicals (Sierka, 1985).
In this connection it is of incidental interest that
several workers have shown radical attack to be important in
the ozonation of chlorinated nitrobenzenes. Thus Duguet et
al. (1988) removed o-chloronitrobenzene from ground-water
by combining ozone treatment with addition of hydrogen
peroxide. This was claimed to increase radical production and
they managed to reduce o-chloronitrobenzene from 1.8mg/l to
0.02mg/l with an ozone dose of 8mg/l and a hydrogen peroxide
addition of 3mg/l. Furthermore, Guittonneau et al. (1988)
investigated the use of ozone coupled with ultra-violet light
over a range of pH values and demonstrated that the
predominant mechanism for the oxidation of
E-chloronitrobenzene to be the free radical mechanism.
Decisive proof that this was the case was obtained by the
addition of the radical-quenching reagent 0.1 mol/1
bicarbonate, which effectively quenched the reaction.

- 25 -
1.4.6.4 Ozone Contactors
Adsorption of ozone in contaminated water is a gas-liquid
process comprising ozone mass transfer, generally accompanied
by irreversible chemical reactions. There are a number of
problems in evaluating the capacities and heights of process
equipment from laboratory trials, and these appear not always
to have been appreciated even by those who have undertaken the
tests. For instance, many compounds, such as phenol, present a
great reactivity towards ozone and this makes calculations of
parameters such as kinetic rate constants and mass transfer
coefficients difficult to calculate (Sotelo, 1988). On the
other hand, not all compounds react rapidly, and many
researchers have simply used small, bubble contactors which
were unable to utilise 100% of the applied ozone to oxidise
their more refractory materials (Caprio et al.. 1984;
Fochtman and Huff, 1975; Kuo and Sierka, 1983; Shelby et
al.. 1984 and Sierka, 1985)
Large bubble contactors (over 5m in height) would have
overcome this problem if the ozone reaction rate had been
high. However, really refractory compounds tend to react
relatively slowly and are 'reaction rate limited'. Such a
system would then require a longer ozone contact period in
order to utilise significant quantities of the applied ozone.
Thus the type of ozone application determines the requirements
placed on the ozone contactor.

- 26 -
An alternative to the bubble contactors mentioned earlier
is the spinning disc contactor (Anderson et al.. 1984 and
Saw et al., 1985). Barberis and Howarth (1988) give mass
transfer coefficients for both bubble columns and rotating
contactors as follows:-
KT xl04 (ms~ 1 ) j_i
Bubble Contactor 6.2mm Bubble Diameter 1.4
2.6mm Bubble Diameter 2.1
Spinning Disc Flat 4.1
(0.38m) Perforated 6.0-11.5
Saw et al. (1985) suggest that the enhanced mass transfer
of thin films lies in the fact that the internal resistance to
mass transfer is minimised by the presence of a wave motion
characteristic of these films and that thin films present a
very large surface area per unit volume of throughput. Thus,
spinning disc reactors should be conducive to promotion of
'direct reaction' of molecular ozone, or 'free radical' type
reactions (Anderson et al.. 1984). It seems obvious to the
author that spinning disc contactors are only of use when the
ozonation of wastewater is limited by mass transfer of ozone.
If the mass transfer of ozone is 'reaction-rate' limited then
increased mass transfer potential will be of little value.

- 27 -
1.4.6.5 Ozonation Analysis Considerations
The use of ozone as a water treatment process generally
results in the following effects: a reduction in TOC due to
the oxidation of carbon compounds to carbon dioxide; a
reduction in colour due to the disruption of conjugated double
bonds; and also to a reduction in the COD value. These tests
are often utilised for the monitoring of ozonolysis treatment.
1.4.6.6 Colour reduction using Ozone
Coloured organic compounds, by nature, should be
particularly amenable to oxidation by ozone. The reason is
that organic colour is generally caused by the excess
electrons present at unsaturated bonds and at resonant bonds
in cyclic compounds. Cleaving such double bonds with ozone
often leads to the production of ketones, aldehydes or acids
in the case of carbon-carbon bonds. However, the products
formed also depend on the other substituent groups.
The disappearance of colour does not necessarily mean
that all of the colour-causing compound has been converted to
carbon dioxide and water, but simply that the conjugated
unsaturated groups have been destroyed (Nebel et al. ,
1973) . As a practical example of the problems in the field,
Eckenfelder (1980) discusses the use of ozone to remove colour
from dye production wastewater (Figure 9). Whilst there was a
decrease in the total organic carbon (TOC) value due to

0)•i-t• — icuOu
O, — iO
tn c •1-1
S0)
O CJ-
1-
0.01- I \
0n1003 Utilised
100 (mg/1)
1000
Figure 9. Colour Removal from a Secondary Dye Waste Effluent by Ozonolysis (Eckenfelder, 1980)

- 28 -
production of carbon dioxide, there was an increase in the
biological oxygen demand (BOD).
This effect compares well with the results of Anderson
et al. (1984), who also found that during the ozonation of
coloured effluents the BOD increased. This is because the
ozone oxidised some of the non-biodegradable material leaving
it in a more biologically amenable form. Continued ozonation
would oxidise these compounds further, and a decrease in BOD
would occur. Thus the effect of ozonation on BOD is not
readily predictable. In this connection Metzer and Miyamoto
(1975) have reported the same phenomenon in the COD test,
attributed to ozone making compounds more accessible to
oxidation by the dichromate used in this test.
The use of ozone for high level COD reduction is not
always economically practical and De Renzo (1978) recommends
that ozone is only used for complete oxidation of wastes
containing up to one percent oxidisable material, or as a
preliminary treatment for more concentrated wastes which are
not amenable to other techniques.

- 29 -
1.4.6.7 Ozone and Pesticides
Ozone is often integrated into groundwater purification
processes. Ozone is known to reduce taste and colour, and also
to 'remove' (oxidise) phenols, detergents and pesticides.
However, pesticides differ widely in their reactivity towards
ozone. Phosalone, for example, is reported to be oxidised to
destruction with only small amounts of ozone/. On the other
hand, lindane, DDT and PCB's are only slightly reactive with
ozone under normal conditions. Ozonation of malathion and
parathion (Figure 10) presents a different problem. During
ozonation intermediate compounds are produced (their
corresponding oxons) which are more toxic than the starting
thions. Thus sufficient ozone must be applied to ensure
complete oxidation of these intermediates. The ozonation of
heptachlor is yet another example of a problem pesticide. This
reacts with ozone to form heptachlorepoxide (Figure 11). This
product is also toxic and in addition to this it is stable to
further ozonation. It is thus incumbent to identify the
specific pesticides within a treatment system and ascertain
the most effective method of removal.
In the same way, in general, it is important to have as
much information as possible about the waste to be oxidised in
order that the most effective treatment regime can be devised.

i on
\»F»— S — CH—
o
Me*. 1
O
-f
^ Products
. IsTO
O
Decompos/ion Products
Figure 10. Ozonation of Malathion and Parathion(Rice et al., 1981)

Tn.
C! 1
0 1--0 1
Figure 11. Ozonation of Heptachlor (Rice et al., 1981)

- 30 -
1.4.6.8 Ozone with Nitroaromatics
During the manufacture of TNT a primary waste, termed
'red water' originates when trinitrated oil is washed with aSOollUorv Swlfhite.
solution of / . This absorbs the unsymmetrical isomers of
TNT and the resulting solution is very difficult to dispose of
in an economical or environmentally sound manner. Further
wastewater called 'pink water' is generated in shell loading
plants when work surfaces and loaded munitions are washed down
with water to remove TNT. This water is not as highly coloured
as red water but it contains explosive material which could
precipitate and settle out in the receiving waters.
Much research has been carried out on these wastewaters
including ozonation. Brabets and Marks (1974) claimed to have
successfully oxidised the TNT found in their synthetic pink
water. However, whilst coloured compounds were readily
destroyed they found that part of the colour reappeared if the
pH was raised. Anderson et al. (1984) discuss this further
and claim that a higher dose of ozone brings about complete
destruction of these colour forming compounds and so prevents
reversion of colour. Brabets and Marks also found carbon
dioxide in the exit gas from their treatment system thus
indicating that the benzene ring was being attacked and
completely destroyed. An increase in biodegradability was
noted.
The major drawback in this process was poor utilisation

- 31 -
of ozone. UV light was investigated for ozone oxidation
enhancement. For UV light to be useful it must be absorbed by
the ozone. Figure 12 shows the absorbance spectrum of ozone.
This peaks at about 254nm and thus a low pressure UV lamp is
required. When ozone is exposed to UV light it becomes
'excited' and decomposes to an oxygen atom and diatomic oxygen
which, along with intact ozone, attack the organic species. UV
energy can also activate some organic species, thus rendering
them more susceptible to oxidation.
Fochtman and Huff (1975) found that the effect of UV
light dramatically increased the rate of TOC and colour
removal during the ozonation of pink water. However mass
transfer in the system was poor due to the small contactor
size (4 litres) and the high air/ozone flow rate (over 1.5
1/min) . When they reduced the air/ozone flow rate the
utilisation of ozone improved by over four fold. This is a
good example of an unsuitable size of test reactor, and
inadequate test design, as mentioned in section 1.4.6.4.
Nevertheless, UV light does appear to assist systems by
promoting formation of hydroxyl radicals.
Sierka (1985) looked at the effect of both temperature
and pH on an ozone and ozone/ultrasound treatment process for
a synthetic wastewater comprising TNT and RDX
(cyclotrimethylene-trinitramine)(Figure 13) in the weight
ratio of 70%:30% respectively. The rate of both TOC and
explosive removal from the sample was found to increase with

300-,
c0)
•e-l
u
0)o
c o
Ocn ft
150-
0200 250 300
Wavelength (nm)
Figure 12. Absorption of Ultraviolet Light by Ozone(Fochtman and Huff, 1975)

isro IsTO
isro
Figure 13. Chemical Structure of RDX(Cyclotrimethylene-trinitramine)

- 32 -
increasing pH and with increasing temperature. The use of
ultrasound in ozone oxidation was based on the argument that
both ozone mass transfer and oxidation reaction rate would be
enhanced by its presence in the reactor. The optimum frequency
for this effect was unknown so a range of frequencies was
examined at a fixed power rating. The results showed maximum
destruction of explosives and TOC removal at a frequency of
about 850 kHz and also that at that frequency, increasing
power rates increased the removal further, although it was
possible to attribute this to the increase in temperature
during insonation. It was also noted that a combination of
high pH and temperature was not beneficial, perhaps because
radical formation was extinguished. In conclusion, the
ozone/ultrasound process does not seem viable.
Whilst many authors have concentrated on promoting
effects for ozonation, little attention has been given to the
chemical development of the reaction process. Only simple
determinations such as COD, TOC, BOD, colour and odour have
been applied. However, Caprio et al. (1984) have investigated
the effect of ozonation on aqueous nitrobenzene: care has been
taken with the recognition and quantitative estimation of the
process intermediates, with the aim of providing to a proper
chemical description. These estimations were of nitrobenzene,
nitric acid, glyoxal, glyoxylic acid, oxalic acid, formic acid
and carbon dioxide (in the gas leaving the reactor). The
initial ozone reactions were found to involve the oxidation of
the nitro-substituent group with the elimination of nitric

- 33 -
acid and the formation of maleic acid and maleinaldehyde as
unsaturated intermediates (Figure 14). This first oxidation
stage merges into the appearance of concentration maxima for
those species which are still reactive towards ozone. These
intermediates are oxidised to form carbon dioxide, oxalic
acid, glyoxylic acid, formic acid and glyoxal as the final
reaction products. All of these remaining organic species
appear to be integrated directly into the Glyoxylate Cycle (or
TCA Cycle) and thus could be oxidised by microorganisms, with
the exception of glyoxal. No evidence could be found for the
metabolism of glyoxal by the author of this thesis. However,
on further ozonolysis glyoxal will yield equimolar amounts of
glyoxylic and formic acids (Caprio et al., 1984) and could
then enter the glyoxylate cycle.
Unfortunately, it is a little difficult to draw parallels
between nitrobenzene and the present system. The nearest work
is that of Rice et al. (1981) who also suggest that organic
nitriles, nitrites, nitroso compounds, hydroxylamines and the
like will be oxidised, first to the corresponding nitro
groups. These will decompose upon continued ozonation
liberating nitrate ions (NO~) and then on to smaller
carbonaceous compounds. However, the amount of detail
available within this report was regrettably very small
compared with the detailed work of Caprio et al. (1984).

50%
INTO
50%
H > COOHCOOH >X C| + || 4- HN03CHO C
H' COOH
COOH
COOH
H COOH C
HN03
H CHO
I
COOH
CHOHCOOH -|- C02
CHO , ^ -f- HCOOH -h C02CHO
CHO |COOH
2HCOOH
Figure 14. Proposed Mechanisms of Nitrobenzene Ozonation(Caprio et al.. 1984)

- 34 -
1.4.6.9 Cost of Ozone Systems
The capital cost of an ozone system is very high. For
example, a small laboratory scale generator with compressor
and ozone ambient monitor is £20,000. Such a system can only
generate I8g of ozone per hour which for wastewater treatment
purposes is not very high. Figure 15 shows the relationship of
capital cost per gram of ozone production potential verses the
generating capacity of the plant. It is quite clear from this
graph that the relative cost of a larger system is much lower
in terms of capital cost per unit of generating capacity.
Moreover, these larger generators can utilise low pressure air
drying systems which are more energy efficient. For example, a
3Kg/h low pressure ozone stream would only require 60kW
compared to 105kW for the high pressure one (Appendix 1).
1.4.6.10 Summary and Conclusions
Ozone generation and application is becoming a fairly
established technology with numerous applications. The key
advantage offered by ozone is its strong oxidising capability
and its clean 'add nothing' feature. With the future prospects
of water re-use and the effectiveness of ozone at removing
refractive materials that are toxic, carcinogenic, or colour-,
taste- and odour-producing to innocuous products means that
industry and water treatment companies will have to take the
capital investment seriously and will undoubtedly be swayed in
favour of the ozone process.

•Pc<D-P o
cuc o•l-l
-P(0-H0)cCD
CD
CD C O NO
•4-i
O
S(0 ^ tn
I100CM
750-J
500H
CQ O 25CM
(0-P•H
ard
0 -1 ———— -0 1000
12000
m —— - ———————— 9
\
3000
Generating Capacity (g03/h)
Figure 15. Relationship of Generating Potential with Capital Cost of Ozone Generating Equipment

- 35 -
1.4.7 Reduction - Catalytic
This process involves reducing the components of the
waste, as opposed to oxidising them, and is to be considered
only as a pre-treatment to other treatment processes.
For example this process may be useful where biological
systems are to be utilised. Biological attack on the aromatic
nucleus is electrophilic in character (Mason, 1957) ; thus,
substitution in an aromatic molecule with electron repulsing
constituents, such as methyl groups, would be expected to
increase its biodegradability. Conversely, electron
with-drawing groups, such as halogens or nitro groups, would
increase the resistance of the nucleus to attack.
K10 wash water effluent is expected to contain many nitro
aromatic compounds, and would therefore be expected to be
highly resistant to microbial degradation. On this basis, a
reductive pre-treatment might replace these nitro groups with
amino groups which are, in general, slightly electron
repulsive and might increase the susceptibility of the
aromatic nucleus to attack.
Bacteria themselves are capable of reducing nitro groups
to the corresponding amine but intermediate compounds, such as
nitroso substituted aromatics, can produce azoxy compounds
(McCormick et al., 1976; Kaplan and Kaplan, 1982a) which
themselves are not susceptible to biological attack. A

- 36 -
chemical pre-treatment, such as reduction, is far more
controllable and production of azoxy compounds (Figure 16,
Reaction vi) can be avoided. March (1985) proposes many
mechanisms and reagents for transformation of organic
compounds (Figure 16, Reactions i,ii,iii,v and vi) and
Spanggord et al. (1982) describe the diazotisation and
decomposition of 4-amino-3,5,dinitrotoluene to 3,5,dinitro-
toluene (Figure 16, Reaction iv).
Unfortunately, the most convenient method of
hydrogenation involves the use of zinc (or tin) with
hydrochloric acid, for the reduction of nitro groups to amines
(Figure 16, Reaction i) and this, per se, introduces new
components into the waste which may themselves need to be
removed or treated. It is this factor which makes catalytic
hydrogenation a more favourable process.
1.4.7.1 Catalytic Hydrogenation
The aromatic nitrogen group is easily reduced to the
corresponding amine by catalytic hydrogenation with high
efficiency. Trinitrotoluene has been reduced easily to
triaminotoluene at normal temperature and pressure (Figure 17,
Reaction A) using palladium on barium sulphate as a catalyst.
Phenol has been reduced in the presence of sodium (as sodium
carbonate) at moderate temperature and pressure to
cyclohexanone, a non-aromatic ketone (Figure 17, Reaction B).
These reactions are discussed by Rylander (1967).

Zinc/HCl
or Catalytic Hydrogenation
i i )HONO
i i i )H3P02
Diazotisation
INTO
Zinc/Water
Neutral pHNitroso Compound
Weak Reducing Agent
(Including Glucose)
—nsr=3srI.o
Azoxy Compound
Figure 16. Some Reactions of Aromatic Nitro Groups

CPI
IsTO
Palladium-on-Barium Sulphate Normal Temp, and Pressure
isro 2 ISTH:
Trinitrotoluene Triaminotoluene
Palladium-on-Carbon Elevated Temp, and Pressure
Phenol Cyclohexanol
Figure 17 Catalytic Hydrogenation of trinitrotoluene and Phenol

- 37 -
When using catalytic hydrogenation several factors need
consideration. These are:
i) Type of catalyst metal
ii) If supported, the type of catalyst support
iii) Catalyst stability
iv) Catalyst poisoning
v) Catalyst reuse
The first of these considerations is to decide on a
catalyst metal. All six of the elements in the platinum metals
group (ruthenium, rhodium, palladium, osmium, iridium and
platinum) make excellent hydrogenation catalysts. Palladium
and platinum are probably the most widely used and both can be
utilised either unsupported as a finely divided metal or
supported on other substances such as carbon, alumina, zinc
and asbestos to name but a few.
Supported catalysts are more efficient but their
performance is dependent on the support material. This is due
to the physical properties of the support, such as the surface
area, the average pore size and the pore size distribution.
The products of hydrogenation can also vary with the type of
support (Augustine, 1963). Another factor influencing the
choice of support is catalyst poisoning as illustrated with
the hydrogenation of nitrobenzene using palladium-on-alumina
in cyclohexane. For this situation, the rate of hydrogenation
was dramatically reduced when the reaction was only 30%

- 38 -
complete, this reduction being ascribed to catalyst
poisoning/inhibition. However, with palladium-on-carbon the
reaction proceeded unabated, almost until completion
(Rylander, (1967).
When catalysts are not in use they do not generally lose
catalytic activity if contained in an air tight vessel, but in
use the catalysts do lose activity. There is no way of
predicting the rate at which catalytic activity will decrease
and careful monitoring of reactions for many repeated
hydrogenations is required to assess this. Although
regeneration of the catalyst is possible, it is not uncommon
for the catalytic nature to be changed and different compounds
to be formed during hydrogenation (Farmer and Galley, 1933).
A report by Fitter (1985) confirmed that electron
repulsing groups in general increase the susceptibility of the
benzene nucleus to biological attack. However, when Fitter
examined a range of aminotoluenes, aminophenols and amino
sulphonic and benzoic acids for biological susceptibility, he
discovered that the amino constituent increased resistance to
biological attack, and thus was an exception to the rule. This
indicates that hydrogenation of the K10 wash water effluent
will not improve susceptibility of the aromatic nucleus to
biological degradation.

- 39 -
1.4.8 Aerobic Activated Sludge
The activated sludge process is a biological system in
which microorganisms oxidise the organic components of the
wastewater. The process is, in effect, an artificial
intensification of the process of self-purification which
occurs in streams.
Activated sludge plants are fed continuously (as opposed
to batch-wise) with the wastewater, which is then mixed with
flocculated biological growths, mainly bacteria and protozoa,
and aerated. Bacteria, usually Gram negative, comprise carbon
oxidisers and nitrogen oxidisers; aerobes and facultative
anaerobes; floe-formers and non floe-formers (Forster, 1985)
and are responsible for the oxidation of organic components of
the wastewater. The protozoa, such as cilliates, are also very
important since they feed on free-swimming bacteria which, if
left unchecked, would otherwise cause a turbid final effluent.
Wastewater which has continuously entered the plant is
thus contacted with microorganisms for a suitable time (the
retention time) during which waste components are adsorbed
into the floes and oxidised. This mixture of microorganisms
and wastewater then passes into a clarifier where the floes
settle out as a sludge leaving a clarified final effluent. The
majority of this sludge is returned to the aeration vessel and
mixed with the fresh incoming wastewater and the remainder is
removed (wasted) and disposed of by such processes as

- 40 -
anaerobic digestion, incineration or return to land.
The wastes fed to treatment plants vary from those of
purely domestic origin through to effluents from the
manufacture of complex and (sometimes) unpleasant chemicals,
and the case with which these are treated differs accordingly.
The efficiency of a treatment plant in terms of
Biochemical Oxygen Demand removal (Section 2.4.1) can often be
very high, particularly if the principal component of the
waste is domestic effluent. However, this is not necessarily
the case for all organic compounds in solution. The Chemical
Oxygen Demand estimation (Section 2.4.2) is capable of
oxidising compounds which the microorganisms find difficult,
if not impossible, to metabolise. To get high chemical oxygen
demand removal efficiency the organisms must be capable of
oxidising most of the components of the wastewater. This
requires specialised communities of microorganisms and the
adaptation of these microorganisms is the limiting factor of
such biological treatment process. Without these
microorganisms, biological treatment processes are not a
viable proposition for treatment of many of those
less-pleasant wastewaters.

- 41 -
1.4.9 Aerated Lagoons
Lagooning in oxidation ponds is a common method for the
oxidation of organic material. The process can be considered
as a design extension of the stabilisation pond. The main
difference is that aerated lagoons are mechanically aerated
tanks and thus are not dependent merely on algae and natural
diffusion for the supply of oxygen. The use of aerators leads
to the formation of flocculated biological growths as found in
activated sludge plants and hence the process is much the same
but without a sludge recycle. The absence of this recycle
means that organisms are not able to acclimatise to the same
extent as in activated sludge plants. Moreover, the removal
efficiencies are generally not as high, and the process is
less stable under varied influent loading (De Renzo, 1978).
Thus, overall, the aerated lagoon is not as attractive a
proposition as the activated sludge process for industrial
wastewater treatment.
1.4.10 Percolating Filters
A percolating filter is a packed bed, usually of stone or
plastic but sometimes wood. Wastewater is distributed over the
top surface of the bed by spray, or static, or moving
distributors. The wastewater then percolates down the bed
against an upward flow of air. A slimy film which consists of
microorganisms embedded in extracellular polymer, develops on
the surfaces of the packing material, and the organisms

- 42 -
oxidise the organic components of the wastewater. Although
this is the basis of all such filters, this system can often
also be subject to various problems. For instance, excessive
accumulation of solids on the surface can block the voids
between the packing and the filter system can "pond". This
occurs during winter months when grazing organisms, such as
nematode worms, are suppressed, due to the cold, resulting in
increased film growth. However, this film is removed during
warmer weather and results in the "spring sloughing" problem
whereby the humus generated overloads removal tanks giving
rise to a low quality final effluent.
In general a percolating filter system is less efficient
than an activated sludge system; mainly due to the short
contact period of the wastewater with the microorganisms. The
process does, however, allow the long term adaptation of
organisms, but so, of course, does the activated sludge
system. However as this process is essentially plug flow, it
is not generally suitable for industrial wastewaters even
though energy requirements are much lower than for the
activated sludge process (De Renzo, 1978).
1.4.11 Anaerobic Digestion
Anaerobic digestion is a biological treatment process for
the degradation of organic compounds in an oxygen free
environment. The organisms present in such a system can be
classified into two interdependent groups: the hydrolytic

- 43 -
species, which degrade large molecules into their component
monomers, and the post-hydrolytic species which degrade these
monomers and other compounds present in the waste to methane
and hydrogen sulphide (Forster, 1985). The main problem, in
operating such a system, is the maintenance of these organisms
so that they operate in a balanced and controlled way.
There are two predominant types of anaerobic digester.
The first operates rather like the activated sludge process
(Section 1.4.8) except that it is dealing with slurries rather
than dilute liquids. The other type is much more like a
percolating filter (Section 1.4.10). Generally these devices
operate with an upward flow of wastewater (Eckenfelder, 1980)
which passes through a packed or fluidised bed or a blanket
(which is really a bed in which the organisms are self
supporting). Both processes are not, of course, aerated.
Anaerobic digestion is less effective at removing complex
organics, such as those expected in K10 wash water effluent,
than aerobic processes; indeed, biodegradation of many
xenobiotics is almost impossible except by means of aerobic
attack. Nitro-aromatics are within this group of compounds,
and consequently Kobayashi and Rittmann (1982) suggest the use
of aerobic organisms for the degradation of such materials.

- 44 -
1.4.12 Enzyme Treatment
Enzymes are highly selective chemical catalysts produced
by living organisms and act on specific substrate molecules.
For example, urease is an enzyme which catalyses the
degradation of urea to carbon dioxide and ammonia.
However, enzymes are generally unstable protein molecules
and expensive to produce. Thus enzyme treatment of complex
industrial wastes is not a practical proposition since enzyme
action cannot be accommodated to match the varying
compositions and toxicities of waste streams. It is thus not
surprising that there are no full scale applications of enzyme
treatment processes for wastewater treatment known to the
author.

- 45 -
1.5 BIOLOGICAL AND CHEMICAL METHODS COMPARED
Various processes have been discussed (Section 1.4) which
could well be suitable as a treatment, or combination of
treatments, for K10 wash water effluent. Considerations both
of the efficiency and of the costs of these techniques are
necessary to permit rational selection of a preferred option.
In general, biological treatments are the most
cost-effective processes for the treatment of aqueous waste
streams containing organics, providing suitable organisms are
available. In this connection, Gale (1947) proposed his
microbial infallibility principle in which he stated that
"microorganisms capable of oxidising any compound that can be
theoretically oxidised will exist wherever the compounds are
found". However, it must be remembered that these theoretical
organisms must first be found, selected, adapted and produced
in quantity. If this is not readily feasible, then a
biological system is not an appropriate device, and
physical-chemical methods should be adopted. Of these,
activated carbon or ozone are probably the most promising as
single treatment processes for K10 wash water effluent,
although adsorbent regeneration can be costly in the case of
carbon treatment. A chemical pre-treatment such as
hydrogenation, or limited ozonolysis, may render the waste
more amenable to biological systems.

- 46 -
In general biological systems have over-riding advantages
for treatment of wastes containing low organic pollutant
concentrations due to the high affinity of microorganisms for
substrate molecules. These compounds are then, in general,
mineralised to innocuous compounds such as water and carbon
dioxide. Some molecules are exceptions to this general rule,
and are not mineralised but merely transformed into new
compounds which might possess more serious pollutant
properties than the parent molecule. This occurs with both
nitrobenzenes (Section 1.6.6.1) and aminobenzenes (Section
1.6.6.2), and this is of particular relevance to the present
study, which involves nitrobenzenes.
Tabak et al. (1981) have described as "priority"
pollutants those compounds which fall into the following
classes of organic compounds: phenols, phthalate esters,
naphthalenes, monocyclic aromatics, polycyclic aromatics,
polychlorinated biphenyls, halogenated ethers, nitrogenous
organics, halogenated aliphatics and organochlorine
insecticides. Again, nitrogenous organics feature in Tabak's
priority listing. However, his research group have shown that
appropriate microbial metabolism is an important factor for
the treatment of some of these "priority" pollutants (Tabak
et al., 1981). Clearly, then, wastes of the types under
consideration in this work are considered particularly
polluting, and it has been suggested that appropriate
biological treatment might be a useful option. However,
industrial wastes consist of complex mixtures of pollutants,

- 47 -
rather than a solution of one defined material, and this
confuses the issue. Since no specific treatment can be applied
to all situations each industrial waste needs to be reviewed
individually, often by trial and error, although the more
promising treatments can be quickly identified if the
approximate composition of the waste is known.
In the case of K10 manufacture a biological system would
be the most convenient for the wash water effluent. Of the
available biological systems, the aerated activated sludge
system is the most attractive since it is the most compact,
and the recirculation of sludge allows for the development of
acclimatised microorganisms. The factors affecting the
adaptation of microorganisms and the metabolism of aromatic
compounds are very complex and it seems appropriate to discuss
these further.

- 48 -
1.6 BIODEGRADATION
Biodegradation has been defined as the microbial
transformation of chemical organic compounds to, ultimately,
inorganic compounds. The biodegradation of aromatic compounds
has received particular attention (Alexander, 1981; Alexander,
1985; Bull, 1980; Painter, 1974; Slater and Bull, 1982; Spain
and Van Veld, 1983). The varying fates of these chemical
compounds when exposed to biological systems fall into three
major categories.
i) The compound will remain totally unchanged
(recalcitrant)
ii) The compound will be transformed or partially
degraded
iii) The compound will be completely mineralised to
carbon dioxide, water, sulphate, etc.
1.6.1 Partial Degradation
Whilst the latter of the possibilities listed in the
previous section is the ultimate aim of any wastewater
engineer proposing to use biological systems, problems are
posed by partially degraded compounds. Thus difficulties often
arise due to the nature of the new compounds which are formed.
For instance, this occurs with the transformation of
3-chlorocatechol which forms acyl halide, a highly toxic
compound, whilst 4-chlorocatechol is transformed to a
recalcitrant molecule (Figure 18, Slater and Bull, 1982).

c: 1
OH
OH
OH
4-ChlorocatecholC 1
3-Chlorocatechol
2.3-dioxygenase
OH
COOH Inhibition
OH
COOH
C 1
Cycloisomerase
OH
COOH
acyl halide (Lethal Metabolite)
\No Metabolism by Hydroxylase (Recalcitrant)
Figure 18. Metabolism of two Chlorocatechols(Slater and Bull, 1982)

- 49 -
Similar problems have also been reported regarding the
metabolism of nitro and amino benzenes with the production of
nitroso compounds (Liu et al.. 1984; McCormick et al., 1976;
McCormick et al., 1978).
1.6.2 Recalcitrance
Through the process of evolution, virtually all naturally
occurring organic compounds can be completely mineralised,
usually by microorganisms, without ill-effects to the
environment and so continuing the cycle of elements. However,
man has been synthesising large quantities of new compounds
over a time period which is short in evolutionary terms. The
introduction of these compounds, often referred to as
xenobiotics, into the environment has not always resulted in
complete mineralisation. Such compounds are termed
recalcitrant meaning that they are not readily biodegradable.
This idea was suggested by Alexander (1965) with reference to
the fate of pesticides, who emphasised the need for systematic
research into their biological degradation.
A combination of microbiology, biochemistry and
bioengineering over the last decade has shown many compounds,
initially thought recalcitrant, to be biologically degradable.
This was demonstrated by Knackmuss (1981) whereby organisms
assimilating naphthalene as a carbon source were given small
amounts of naphthalyl-2-sulphonic acid, a recalcitrant
compound which is related to naphthalene. The naphthalene was

- 50 -
gradually replaced with naphthalyl-2-sulphonic acid, thus
applying a selective pressure on the organisms to utilise this
new substrate. Once organisms were considered to have adapted
to the naphthalyl-2-sulphonic acid, its concentration was
increased further and the naphthalene removed forming a new
strain of the organism. Findings such as this help to confirm
the hypothesis that all organic compounds can be biodegraded
if the correct organism can be isolated, the right enzymes
induced and if favourable environmental conditions prevail.
However, a selection of recalcitrant compounds, even if
related one to another, will not necessarily behave similarly
since many factors are involved. These factors have been
reviewed extensively by Faber (1979) and are summarised in
Table 3 (Sayler et al., 1984).
1.6.3 Co-metabolism
Organisms usually metabolise organic compounds in order
to derive energy and carbon for growth. However, in some
instances, the oxidation of a non-metabolisable compound
occurs when organisms are assimilating some other compound.
The oxidised form of this recalcitrant molecule might then be
oxidised further by some other organism and result in
mineralisation of the compound. This is termed co-metabolism,
or co-oxidation, and has been reviewed by Horvath (1972) . As
an example, co-metabolism occurs with metabolism of
cyclohexane where one microbial species in a consortium,
metabolising paraffin, oxidises the cyclohexane to

Structural Properties Consequences
1) Molecular Weight or Size2) Polymeric Nature3) Aromaticity4) Halogen Substitution5) Solubility6) Toxicity7) Xenobiotic Origin
•Limited Active Transport•Extracellular Metabolism Required•O9 requiring enzymes
£t
•Lack of dehalogenating Enzymes•Competative Partitioning•Enzyme inhibition, cell damage•Evolution of new degradative pathways
Environmental Factors
1) Dissolved Oxygen
2) Temperature3) PH4) Dissolved Carbon
5) Particulates, Surfaces6) Light7) Nutrient and Trace
Elements
-O sensitive and O requiringenzymes-Mesophilic temperature optimum-Narrow pH optimum-Organic/pollutant complexes Concentration dependent growth-Competition for substrate-Photochemical enhancement-Limitation on growth and enzyme synthesis
Biological Factors
1) Enzyme Ubiquity
2) Enzyme specificity
3) Plasmid Encoded Enzymes
4) Enzyme Regulation
5) Competition
6) Habitat Selection
7) Population Regulation
-Low frequency of degradative species
-Analogous substrates not metabolised-Re-acclimation-Low frequency of degradative species-Instability-Repression of catabolic enzyme synthesis
-Required acclimation or induction-Extinction or low density populations-Lack of establishment of degradative populations-Low population density of degradative organisms
Table 3. Factors Influencing Biodegradability of Organic Pollutants (Sayler et al. . 1984)
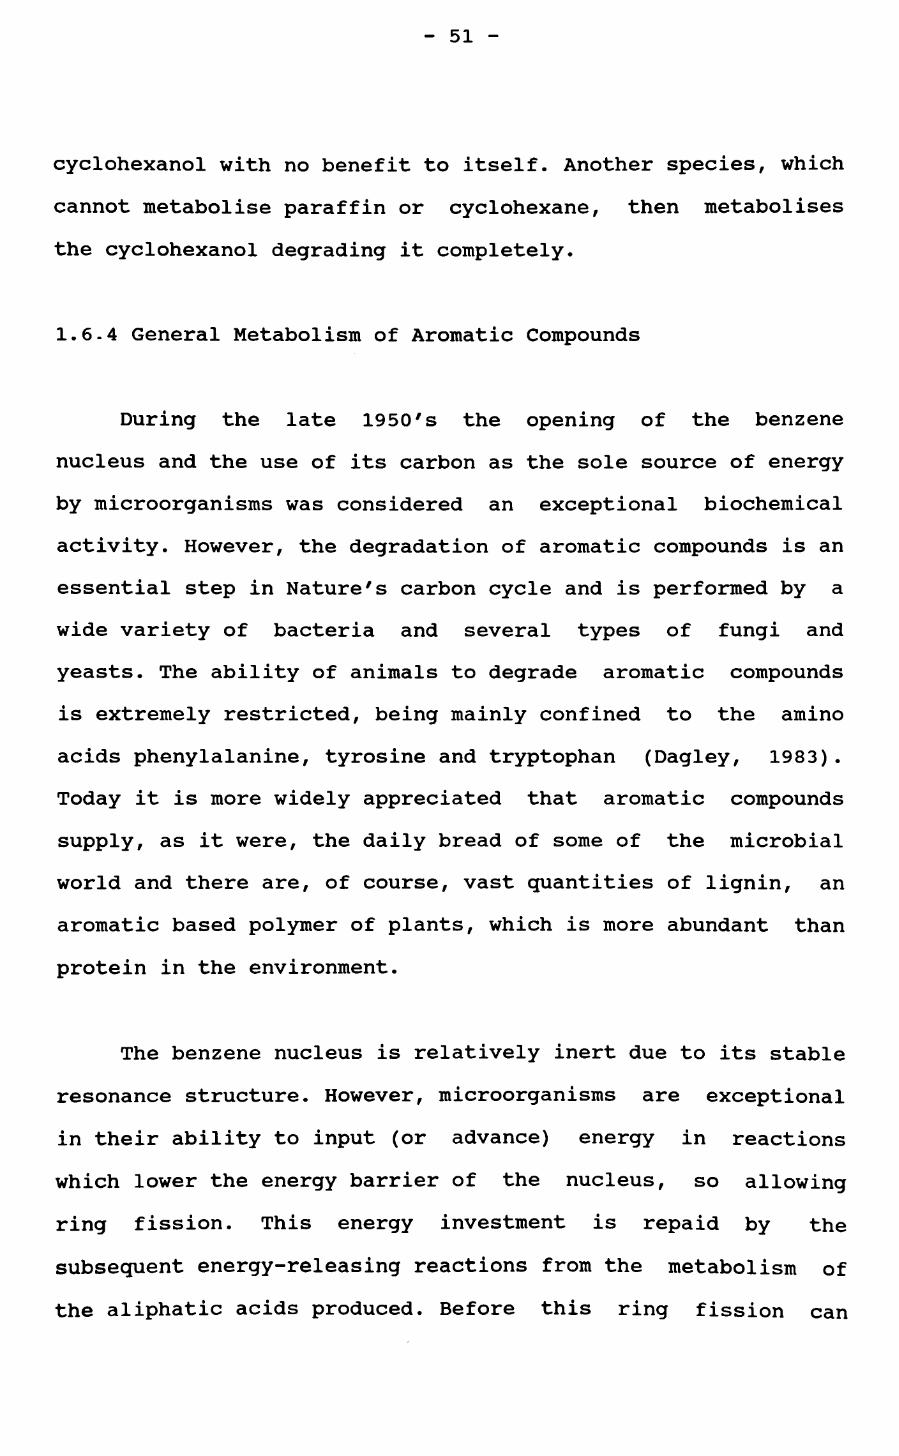
- 51 -
cyclohexanol with no benefit to itself. Another species, which
cannot metabolise paraffin or cyclohexane, then metabolises
the cyclohexanol degrading it completely.
1.6-4 General Metabolism of Aromatic Compounds
During the late 1950's the opening of the benzene
nucleus and the use of its carbon as the sole source of energy
by microorganisms was considered an exceptional biochemical
activity. However, the degradation of aromatic compounds is an
essential step in Nature's carbon cycle and is performed by a
wide variety of bacteria and several types of fungi and
yeasts. The ability of animals to degrade aromatic compounds
is extremely restricted, being mainly confined to the amino
acids phenylalanine, tyrosine and tryptophan (Dagley, 1983).
Today it is more widely appreciated that aromatic compounds
supply, as it were, the daily bread of some of the microbial
world and there are, of course, vast quantities of lignin, an
aromatic based polymer of plants, which is more abundant than
protein in the environment.
The benzene nucleus is relatively inert due to its stable
resonance structure. However, microorganisms are exceptional
in their ability to input (or advance) energy in reactions
which lower the energy barrier of the nucleus, so allowing
ring fission. This energy investment is repaid by the
subsequent energy-releasing reactions from the metabolism of
the aliphatic acids produced. Before this ring fission can

- 52 -
occur the benzene nucleus must carry two hydroxyl groups
situated either on adjacent carbons, as in catechol, or placed
across the ring as in gentisic acid. The enzymes which carry
out this fission of the nucleus are called oxygenases and they
utilise oxygen gas (dioxygen) (Evans, 1963). Fission can be
realised either via the ortho-cleavage pathway
(intradiol-cleavage) or via the meta-cleavage pathway
(extradiol-cleavage) (Figure 19), although the ortho pathway
is used almost exclusively for the metabolism of catechol
itself and the meta pathways are more tolerant of
substituted catechols. These particular degradative pathways
are discussed in detail by Sayler (1984).
When an aromatic compound carries only one hydroxyl group
a second must be introduced by a hydroxylase. If it carries
none at all, then two must be added. This process is directed
by cytochrome P-450 in mammals, but in bacteria the enzymes
involved are flavoproteins. These monooxygenases utilise
oxygen and NADPH to achieve this hydroxylation (Figures 20 and
21) and they exhibit narrow substrate specificity. The use of
NADH that could otherwise be used to generate ATP must be
regarded as an energy investment. In contrast, the
hydroxylation, or ring-fission, reactions themselves neither
consume or generate energy. These reactions and those that
follow simply involve breaking up the original carbon chain to
form, eventually, metabolites for the tricarboxylic acid (TCA)
cycle. Figure 22 shows the main pathways for the degradation
of some dihydric compounds, the products of which can enter
the TCA cycle and repay the energy investment.

OH
OHE
or tho-C leavacre cis.cis-Muconic Acid
OH OH:
COOHCHO
meta-Cleavage 2-Hydroxymucon i c semi aldehyde
Figure 19. Ortho and Meta Cleavage Positions of Catechol(Faber, 1979)

COOH COOH
H °2 + NADPH ——*—*- NADP+ +
OH
OH
OH
p-Hydroxybenzoic Acid 2,3-Hydroxybenzoic Acid
COOH
NADH NAD C0 2 4- H2 0
Salicylic Acid Catechol
COOH COOH
NADP "1"
Anthranilic Acid Protocatechuic Acid
Figure 20. Examples of some Energy requiring Hydroxylations by Flavoproteins (Dagley, 1983)

H H
-OC-
0H/\H» -C —— C-
H2 0
Ring Fission
H OH
-C—C-
OH H
L- NAD
OH OH
-C=C-
(Evans, 1963)
+ NADH
Benzene
OH
+ NAD+
OH
Dihydrodiol Intermediate
Catechol (Dagley. 1983)
Figure 21. Hydroxylation of Benzene

Acetyl-CoA Succiny1-CoA
\HOOC 1
COOH
COOH
•OHCHO
COOH
OH
Catechol
CD
.C CD•d
-p <u u
COOH
COOHHOOC
OH>CHO
OH HOOC
Protocatechuic Acid
HOOC- HOOC-CH2
Homoprotochatechuate
COOH
OH
\PYRUVATE
/COOH
(D
OH
0•M C•M u
CD £ 0
HOOC-CH 2
HOOC
OH
Homogentisate
COOH
HOOC f
OH
Acetoacetate
FUMARATE
Pyruvate
Figure 22. Degradation of Dihydric Phenols (Dagley, 1983)

- 53 -
1.6.5 Anaerobic Metabolism of Aromatic Compounds
Under anaerobic conditions bacteria have been found to
metabolise aromatic compounds. Degradation can be divided into
three distinct categories: photometabolism, nitrate reduction
and methanogenic fermentation, as reviewed by Evans (1977).
Cleavage of the aromatic nucleus is preceded by reduction of
the ring (Dutton and Evans, 1968) after which inorganic
electron-acceptors, such as nitrate, sulphate and carbon
dioxide which are reduced to ammonia, sulphide and methane
respectively, are used for further metabolism.
In comparison with aerobic degradation of aromatics, the
literature concerning anaerobic degradation is sparse,
although this process is clearly ecologically significant. The
majority of authors describe the degradation of nitro-aromatic
compounds only by aerobic means. Kobayashi and Rittmann (1982)
give examples of aerobic microorganisms that can attack a
variety of aromatic compounds including benzene, toluene,
nitrotoluenes, cresol and phenol. Some of these anthropogenic
compounds may have similarities with those expected to be
present in K10 wash water effluent. It is evident from the
literature that anaerobic degradation of such compounds is
strictly limited by the restricted range of compounds
attacked, and the general difficulty of the anaerobic systems
involved; in fairness, there are a few odd compounds incapable
of aerobic dissimilation which can be broken down under
anaerobic conditions (Hallas and Alexander, 1983; Kobayashi

- 54 -
and Rittmann, 1982). Overall, however, on this basis, aerobic
metabolism, as opposed to anaerobic metabolism, was considered
a more viable treatment process for this effluent.
1.6.6 Compounds of Immediate Interest
Extensive studies have been carried out on the biological
degradation of aromatic compounds although no literature
pertaining to K10 manufacture or effluent treatment has been
located by the author. However, since the chemical structure
of TNEB is very similar to TNT, it would seem a reasonable
proposition to study the treatment of TNT wastewater. Due to
the voluminous nature of this literature only a general
overview of metabolism and transformations will be given.
1.6.6.1 Nitrobenzenes
Environmental contamination from the manufacture of
pesticides, dyes and explosives is of great concern since many
of these compounds are toxic and mutagenic. For example, in
large scale TNT manufacturing and handling operations, workers
were reported to have liver damage and anaemia before the
hazards had been fully evaluated (Sax, 1983). TNT has since
been found to be mutagenic in the Ames test and constitutes a
serious environmental hazard. TNT and related compounds have
been isolated in soil and waterways after leaching from
disposal sites (Pereira et al.. 1979) and the degradation of
TNT has been widely investigated (Carpenter et al.,1978;

- 55 -
Channon et al., 1944; Hallas and Alexander, 1983; Kaplan and
Kaplan, 1982a, 1982b, 1984; Liu et al., 1984; McCormick et
al., 1978; Mitchell and Dennis, 1982; Nay et al., 1974;
Spanggord et al., 1982; Won et al., 1974, 1976; Wyman et
al., 1979).
The general consensus is that TNT and related compounds
are difficult, if not impossible, to mineralise completely and
that functional groups undergo biological transformations
(Carpenter et al.. 1978; Hallas and Alexander, 1983;
McCormick et al., 1978). These transformations are thought
to occur under both aerobic and anaerobic conditions although
Liu et al. (1984) reported that 2,4-dinitrotoluene will be
transformed only under anaerobic conditions. However,
McCormick et al. (1976) have shown the nitro group of TNT to
be reduced under both aerobic and anaerobic conditions
according to the following equations under mesophilic
conditions:-
H2 Ar-N02 ^ Ar-NO + H2O
Nitro Nitroso
H2 Ar-NO ^ Ar-NHOH
Nitroso Hydroxylamino
H2 Ar-NHOH » Ar-NH2 + H20
Hydroxylamino Amino

- 56 -
The pathways for the reduction of the nitro groups of TNT to
amino groups or transformation products are shown in Figures
23 and 24 for mesophilic (McCormick et al.. 1976) and
thermophilic (Kaplan and Kaplan, 1982a) transformations
respectively. The transformations of TNT by thermophiles are
basically identical to mesophilic processes, and so the two
systems were considered indifferent in terms of enzymatic
action (Kaplan and Kaplan, 1982a). Partial reduction of the
nitro groups to the hydroxylamino intermediate may lead to the
non-enzymatic (chemical) formation of the corresponding azoxy
compounds. Certain amino surfactants at alkaline pH's are
reported to precipitate TNT as water insoluble complexes
(Kaplan and Kaplan, 1982b) which were more mutagenic than TNT
(itself a frame shift mutagen (Won et al., 1976)). However,
Won reports the metabolites of TNT to be non-toxic and
non-mutagenic.
The problems associated with TNT wastewater include all
of the mutagenic/toxic problems of the parent TNT, whilst in
addition, it is environmentally obvious and damaging because
of its persistent bright red colour. The problems of
biological treatment have therefore incited intense
investigation into other possible waste treatments such as
carbon adsorption. This is reported to have a loading capacity
which is dependent not only on pH but also the amount of
colour development of the waste (Nay et al. f 1972). Nay also
reports that photochemical, as well as pH dependent, colour
development occurs with TNT waste and that an increased colour

CH
02N/
3
0N02
2.2 Azoxy Compound
Enzymatic N02
2 ammo 4.6 dinitrotoluene
CH3
02N N02
NHOH
INon
Enzymatic
4.4 Azoxy Compound
CH3
4 amino 2.6 dinitrotoluene
NH2
2 nitro 4,6 diaminotoluene
Triaminotoluene
Figure 23. Proposed Mesophilic Pathway for the Transformation of TNT (McCormick et al., 1976)

CH3 TNT
CH3 H3C
N=N
0
CH3
02NNO 2
N02
N02 CH3
NHOH
N02
2.2 Azoxy Compound i2,4 Azoxy
Compound
02N,
H3C
NHOH
•N02
CH3
02N
2 amino 4.6 dinitrotoluene
r NH2
N02
I02N rN02
NH2
1CH3
4 nitro 2.6 diaminotolueneH2 N-
N02
CH3
02N
4,4 Azoxy Compound
4 amino 2.6 dinitrotoluene
2 nitro 4,6 diaminotoluene
Figure 24. Proposed Thermophilic Pathway for theTransformation of TNT (Kaplan and Kaplan, 1982a)

- 57 -
increases the relative recalcitrance of the waste.
Other treatments such as chemical methods and amino
surfactant precipitation (Kaplan and Kaplan, 1982b) have
proved to be relatively unsuccessful and so the problem of TNT
waste disposal still remains. Further work is required on the
use of mixed microbial systems and there is a need to identify
intermediates and end products in the environment with the
subsequent problems of mutagenicity and toxicity of these
compounds.
1.6.6.2 Aminobenzenes
Amino aromatic compounds are produced in large quantities
by chemical industries which manufacture substances such as
pesticides, dyes and pharmaceuticals. Many of these compounds
can cause severe environmental problems if they are not
mineralised but biologically transformed instead (Fewson,
1981). Such transformations include acylation (Kaufman et
al.. 1973), nitro product formation and polymerisation to
persistent macromolecules (Bartha and Pramer, 1970). However,
the oxidation of aromatic amines does not occur under anoxic
conditions (Braun and Gibson, 1984). Transformations can be
complicated further by autoxidation, photooxidation and
chemical binding reactions. If conventional sewage treatment
plants are exposed to high levels of aminobenzenes the
effluent does not clarify and exhibits a brown/black
colouration due to high levels of polymerised products. This

- 58 -
results in a high carbon content.
The degradation of nitrogen-containing compounds was
studied in detail by Symons et al. (1961) using activated
sludge and a comparison of substituted sodium benzoates was
made (Table 4). The amino substituted compounds were
metabolised more readily than the nitro substituted compounds.
However, 3,5-dinitro sodium benzoate and 2,4,6-trinitro sodium
benzoate were not biodegraded by activated sludge and,
unfortunately, the corresponding amino compounds were not
included in this study. Since then many microbial cultures
have been found which oxidise a wide range of aminobenzenes
including anilines and chloroanilines (Bartha and Pramer,
1970; Brown and Laboureur, 1983; Fewson, 1981; Kaufman et
al., 1973; Latorre et al., 1984; Lyons et al.,
1984) . Aniline and chloroanilines are subject to attack by
dioxygenases which results in deamination to the corresponding
catechols (Figure 25). Figure 26 shows the possible fate of
aniline in the environment including the metabolic pathway for
complete mineralisation.
It is clear that the continual advances in the
elucidation of metabolic pathways and improved mixed
biological strains, from better adaption and selection
techniques, are increasing the importance of biological
degradation for the treatment of many xenobiotic compounds.
Modern knowledge of the biodegradative aromatic plasmids and
transformation have ensured that maximum value is obtained

Compound Time to be Degraded
(Days)
ortho amino sodium benzoate 2.8
para amino sodium benzoate 5.2
meta amino sodium benzoate 16.5
ortho nitro sodium benzoate 5.2
para nitro sodium benzoate 5.5
meta nitro sodium benzoate 46.0
Table 4. Relative Rates of Degradation of Two Substituted
Sodium Benzoates (Symons et al., 1961).

Ani 1ine
Catechol
2-,3-,4-chloroaniline
Figure 25. Initial Reactions of Aniline and Chloroaniline Degradation (Latorre et al.. 1984)

Evaporation
Binding
H 0 \ II
3
Acetani1ide
]VEI
tAutoxidation
r \o,
Condensation Products
NHOH NOo,
Oxidation
Nitrosobenzeneoi\r
OH
Catechol
cis. cis-Muconic Acid
O;
Jbeta-Ketoadipic Acid
OH
COOH
COOH
COOH
COOH
CO-
tHOOC-CH2 CH2 COOH
Succinic Acid
t,CH3
0.
COOH
Levulinic Acid
Figure 26. Suggested Mechanisms of Aniline Pond Water by Sewage Sludge

- 59 -
from these findings. Sadly, there is still a very considerable
way to go before satisfactory biological disposal of TNT
wastewater becomes a reality.
1.6.7 Effect of Chemical Structure on Biodegradability
During the 1950s, it was discovered that newly introduced
pesticides and detergents were accumulating in soil and food
chains. These compounds at best lock up carbon and perhaps
nitrogen and sulphur so that they are no longer available for
elemental recycle. At worst, if toxic, they can accumulate
until they reach harmful levels. This incited much attention
to the concept of biodegradability and the effects of chemical
structure. Such influencing factors include molecular size,
insolubility and the nature, position and number of
substituent groups (Painter, 1974).
The position and nature of substituents on the benzene
nucleus is very important in terms of effect on
biodegradability. Ortho and para substituted compounds
have been reported as generally more amenable to biological
attack than their meta substituted counterpart (Symons et
al., 1961) (Table 4, Section 1.6.5.2). Fitter (1985)
attributed biodegradability to the electronic effects of
substituents and has indicated that the initial attack on the
aromatic nucleus is of electrophilic character.

- 60 -
By collating the data from several sources (Campbell,
1966; Kobayashi and Rittmann, 1982; Painter, 1974; Fitter,
1985; Symons et al. , 1961) a general view of the
correlation of chemical structure with biodegradability can
be drawn.
i) The type of substituent
COO > OH, CH3 > Cl, SO > NH2 ,
ii) The position of the substituent - this is dependent
to some extent on the substituent group.
Ortho > para >» meta
iii) The number of substituents
Phenol > nitrophenol > dinitrophenol > trinitrophenol
1.7 CONCLUSIONS
In conclusion, K10 wash water effluent is likely to be a
complex mixture of both organic and inorganic compounds and be
toxic and/or inhibitory to biological systems as raw,
undiluted effluent. It is envisaged that a continuous, mixed,
aerobic microbial system might be most suitable as a treatment
process. A supplementary physical-chemical process may also be
required, such as activated charcoal, for the removal of
biologically refractory and dead-end products which might be
formed. However, if biological systems are unsuccessful, a
waste pre-treatment may be necessary to enhance
biodegradability. If this too is unsuccessful then a treatment
process based on physical-chemical processes alone may be
required for the treatment of the wash water effluent.

- 61 -
CHAPTER 2
MATERIALS, METHODS AND EQUIPMENT
2.1 AROMATIC WASTES
2.1.1 K10 Wash Water Effluent
This was derived from the manufacture of DNEB and TNEB
and was expected to contain a large number of nitroaromatic
compounds, urea and possibly sodium carbonate as previously
discussed (Section 1.3.3). The waste was found to have a
mean chemical oxygen demand (COD) value of 8000mg/L and a mean
total organic carbon (TOC) value of 4000mg/L.
2.1.2 Mixed Phenolic Waste
This waste was obtained from a large industrial site
(Synthetic Chemicals Ltd., Four Ashes, Wolverhampton) and
contained a large number of mixed phenolic compounds ranging
from simple phenols to catechols, resorcinols, cresols and
more highly polymerised derivatives. This waste was supplied
in a concentrated form (26000mg/L phenol) and had a mean COD
value of 70000mg/L and a mean TOC value of 21000mg/L.

- 62 -
2.2 GROWTH MEDIA
2.2.1 Simple Salt Medium
This was used for preliminary shake flask experiments and
comprised:
In 1 litre of distilled water:
Potassium dihydrogen orthophosphate 1.36 g
Ammonium sulphate 0.20 g
Magnesium sulphate 0.02 g
Ferric chloride 0.0002 g
Carbon source (varied) 2.00 g
pH adjusted to 7 using potassium hydroxide
Carbon sources used: fructose
galactose
glucose
maltose
starch
sucrose
K10 wash water effluent (replaced appropriate volume of
distilled water) at concentrations of 0.1, 1.0 and 10% (v/v).
2.2.2 Mixed Phenolic Medium
Mixed phenolic waste was diluted to 2% (v/v) with tap
water. At a later stage of the experimental work this was
supplemented with 44mg/L of tri-ammonium orthophosphate for
each lOOOmg/L of COD present. This gave a ratio 1000:14:10 of
COD:N:P.

- 63 -
2.2.3 Synthetic Phenolic Medium
In 1 litre of tap water:
Potassium dihydrogen orthophosphate 0-04 g
Dipotassium hydrogen orthophosphate 0.16 g
Ammonium sulphate 0.20 g
Magnesium sulphate 0.02 g
Ferric chloride 0.0002 g
Phenol 0.5 g
COD of medium 1250 mg/1
2.2.4 K10 Medium (12.5%)
1 litre of K10 wash water effluent (the COD of which is
8000mg/l) was diluted with seven parts of water giving a final
COD of lOOOmg/L and relative concentration of 12.5% (v/v). At
a later stage in the experimental work this stock medium was
supplemented with tri-ammonium orthophosphate as for medium
2.2.2, i.e. 44mg/l since the COD is now 1000mg/l.
2.2.4.1 1% K10 and Mixed Phenolic Medium
Medium 2.2.2 was supplemented with 1% (v/v) of K10 wash
water effluent.
2.2.4.2 2.5% K10 and Mixed Phenolic Medium
One part of medium 2.2.4 was added to four parts of
medium 2.2.2.

- 64 -
2.2.4.3 5% K10 and Mixed Phenolic Medium
Two parts of medium 2.2.4 were added to three parts of
medium 2.2.2.
2.2.5 Synthetic K10 Media
These media were essentially the same as for media
2.2.4.1 to 2.2.4.3 except that mixed phenolic medium (Section
2.2.2) was replaced with synthetic phenolic medium (Section
2.2.3) .
2.2.5.1 Static Phenol Media
Medium 2.2.3 was supplemented with either 2.5, 5.0, 7.5
or 10% v/v of K10 wash water effluent, replacing the
equivalent volume of water. Since the phenol concentration
remains unchanged, the COD value (Section 2.4.2) of these
media increased with increasing concentration of K10 wash
water effluent.
2.2.5.2 Decreasing Phenol Media
Medium 2.2.3 was supplemented with either 2.5, 5.0, 7.5
or 10% v/v of K10 wash water effluent, replacing the
equivalent volume of water. The concentration of phenol was
reduced with increasing K10 wash water effluent concentration
so as to maintain a static COD value for the range of media.

- 65 -
The concentrations of phenol used were 500, 415, 330 and 250
for the respective K10 wash water effluent concentrations. It
should be noted that the concentrations of nutritional
supplements were not reduced.
2.3 INOCULA
Several mixed microbial cultures were used as sources of
inoculum. Two were domestic sewage obtained from separate
local sewage treatment works and another was activated sludge
obtained from a phenolic waste treatment plant.

- 66 -
2.4 ANALYTICAL METHODS FOR ASSESSMENT OF TREATMENT PLANT
PERFORMANCE
2.4.1 Biochemical Oxygen Demand
This test is a biological procedure which attempts to
simulate the natural process of oxidation of organic matter in
rivers and streams (Wheatstone, 1977). However, difficulties
arise with the test since microorganisms are required which
can readily oxidise the sample components and as many wastes
are inhibitory and/or toxic the test is not always reliable.
Montgomery (1967) goes as far to say "The 5-day dilution BOD
test is not ideally suited for any of the purposes for which
it is used". Moreover, the test is labour intensive,
unreliable, inconsistent and the results possess no
theoretical significance. It was therefore not used for
analysis in this project. Instead the more reliable Chemical
Oxygen Demand (COD) and Total Organic Carbon (TOC) analyses
were used.
2.4.2 Chemical Oxygen Demand (COD)
COD is used as a measure of the oxygen equivalent of the
organic matter content of a sample that is susceptible to
oxidation by a strong chemical oxidant. The dichromate open
reflux method with titrimetric determination was adopted for
this assay as described in detail in "Chemical Oxygen Demand"
(Anon, 1977 and 1986). This method is preferred over
procedures using other oxidants because of the strong

- 67 -
oxidising ability of the dichromate and its applicability to a
wide range of substrates. Oxidation is quoted at 95 to 100% of
the theoretical value (Anon, 1985). However the presence of
other oxidising or reducing agents can give unreliable values
and chloride ions have to be precipitated, usually by mercuric
sulphate, otherwise the silver salt catalyst used is
precipitated as silver chloride. *
An aluminium, temperature controlled, dry block digester
which could hold sixteen individual sample tubes and
condensers was constructed within the Departmental Workshop
(Plate 1). Several assays were run using standard solutions
of known strength in order to check the accuracy of the
equipment.
This assay does not differentiate between organic
compounds that are not biodegradable and those which are
susceptible to attack, and for this reason it probably gives
an over-estimate of the amount of material that can be readily
oxidised by biological means.
* The analysis method used in this project is described
in the 1977 edition of the "Chemical Oxygen Demand" (Anon,
1977). Although, consideration was given to the method
described in the 1986 revised edition (in which mercury
sulphate is replaced by a combination of silver nitrate and
chromium III potassium sulphate which is more environmentally
friendly) it did not prove possible to make this change.

dOO "I

- 68 -
2.4.3 Total Organic Carbon (TOC)
A Beckman (Model 915) total organic carbon analyser was
used for this assay. The apparatus consisted of two separate
catalyst lined combustion tubes into which the samples were
injected. One tube was used for the estimation of inorganic
carbon at 150°C whilst the other was used for the estimation
of total carbon at a higher temperature of 900°C in which all
of the carbon in the injected sample (30ul) was oxidised to
carbon dioxide. This was measured using a non-dispersive infra
red analyser and the results recorded on a Beckman chart
recorder. The difference between the total carbon estimation
and that for inorganic carbon indicated the organic carbon
content of the sample.
Calibration curves were prepared for the inorganic and
the total carbon values using the following stock solutions.
Inorganic carbon (lOOOmg/L)
In 1 litre of distilled water:
Anhydrous sodium carbonate 4.404 g
Anhydrous sodium bicarbonate 3.497 g
Total Carbon (4000mg/L)
In 1 litre distilled water:
Potassium hydrogen phthalate 8.505 g
The calibration curves (Figures 27 and 28) were checked
each time an assay was performed, using the same sample volume
and an instrument gain setting of 5.5.

200-
c o
u <DM-i d> Q
100-
0-
0 50 100 150 200
Inorganic Carbon fmg/1)
Figure 27. Calibration Curve for Inorganic Carbon

200-
c o100-
u0)I—I 4-1 <D P
0-
0I
50 100 150 200 250
Total Carbon (mg/1)
Figure 28. Calibration Curve for Total Carbon

- 69 -
Studies to compare organic carbon values with the
corresponding BOD or COD showed that TOC compared much better
with COD values (Jones and Jennelle, 1972). It is important to
note that TOC concentrations are expressed as carbon, whereas
the oxygen demand tests are expressed in terms of oxygen
consumed during oxidation.
2.4.4 Total Suspended Solids
Total suspended solids were determined by filtering3 50cm of sample through a 9.0cm pre-weighed and dried glass
fibre paper (Whatman GF/C). The paper and solids were then
dried in an oven at 110°C and cooled in a desiccator. The
weight gain gave the amount of total suspended solids present
(Anon, 1985).
2.4.5 Phenol Analysis
Phenols were estimated quantitatively by the 4-aminophenazone
method (Anon, 1985 and Shaw, 1951). This method depends on the
reaction of phenolic compounds with 4-aminophenazone at pH 7.9
in the presence of potassium ferricyanide to form a coloured
antipyrine dye. The dye was kept in aqueous solution and the
absorbance measured at SOOnm. This method can be used for the
determination of most phenols including ortho- and
meta-substituted and some para-substituted phenols. A
standard calibration curve was prepared using known
concentrations of phenol (Figure 29).

1.5-
1.0-
cu o c
Om
0.5-
0
Phenol (mg/1)
Figure 29. Calibration Curve for Phenol

- 70 -
2.4.6 Microscopic Examination
Microscopic examinations were carried out in order to
check the quality of the sludge. Photographs were occasionally
taken using an Olympus microscope model CH-2 fitted with a
Nikon F3 camera, in order to assist comparisons of the sludge
and provide a record of the mixed population.

- 71 -
2.5 UV WAVELENGTH SCANS
The feed and effluent to the activated sludge plants were
regularly examined using ultra violet wavelength scans. This
was done using a Cecil CE588 microcomputer scanning
spectrophotometer (Cecil Instruments Ltd., Cambridge) which
was linked to a CE580 chart recorder. The samples were diluted
with an equal volume of water so that they gave an absorbance
value between 0 to 2 units. They were placed in a quartz
cuvette and scanned from 230 to 320nm with a full scale
absorbance of 2.0 units and from 320 to 550nm with a full
scale absorbance of 1.0 units.

- 72 -
2.6 GAS LIQUID CHROMATOGRAPHY
Although a Pye Series gas chromatography system was made
available it was not used. This is because high temperatures
are used in such analyses and K10 wash water effluent was
observed to change from a translucent orange to a black opaque
liquid when under reflux. A chemical change had occurred, and
therefore gas chromatography did not seem a viable proposition
since it operates at temperatures well in excess of boiling
water.

- 73 -
2.7 HIGH PERFORMANCE LIQUID CHROMATOGRAPHY (HPLC)
A Cecil CE2010 system with a CE588 LC microcomputer
scanning monitor and a CE1220 variable wavelength monitor,
connected in series, were used. The output from the monitors
was initially fed to potentiometric chart recorders but at a
later stage a two channel CI3000 computing integrator
(LDC/Milton Roy, Stone, England) was installed. Plate 2 shows
the initial system utilised for HPLC analysis.
Columns were obtained from various sources and were
generally 25cm long, 4.6mm internal diameter. A variety of
packing materials were utilised, each protected by a suitable
guard column and pre-column solvent filter. Combinations of
solvents including methanol, water, tetrahydrofuran and
acetonitrile were degassed immediately prior to use.
At the end of this research project a new HPLC pumping
and integration system was made available. This gradient
elution system comprised two Gilson 302 pumps with 5ml heads,
a Gilson 803C manometric module and a Gilson 811B dynamic
mixer. The system was controlled using an IBM PS/2 computer
with Gilson 712 HPLC controller software.

CN

- 74 -
2.8 MEASUREMENT OF OXYGEN UPTAKE BY ACTIVATED SLUDGE
A respirometer was constructed (Figure 30). This
consisted of a 120cm closed cell containing a thermometer and
a lead/silver type (Galvanic) oxygen probe (constructed by the
departmental workshop) which was used to measure the decrease
in oxygen concentration as a function of time. Since the
equipment operated at room temperature (21°C) and a large
sample volume was used, there was no requirement for a
temperature controlled water jacket for the respiration
chamber. Temperatures never varied by more than 0.25°C within
an assay or by more than 0.5 C between assays.
The system was calibrated by first aerating one litre of
tap water for about an hour by which time it was assumed to
be fully saturated with oxygen (taken as 100% which at 21°C
is 8.27mgO0/L). The water was then deaerated using oxygen-free4b
nitrogen to give the 0% oxygen reading.
The sludge used in this assay was washed five times
with BOD water (Anon, 1985) and then sparged with air for 15
hours prior to use so as to reach the endogenous respiration
rate. Respiration rates were measured by filling the
respiration vessel with 125ml of solution containing a known
quantity of sludge (in terms of MLSS) and test solution. The
rubber bung was pressed into position and the excess liquid
extruded up the vent tube which was subsequently sealed in
order to produce a totally air free environment.

0r
A.
mm
\
1 .
t
.^M
[ ——
-^
*
\
•
\
Dissolved Oxygen —— RecorderMeter
————— Vent
1 ————— Bung
-^ —— Respirometer Vesi
Dissolved Oxygen Probe
————— Thermometer
Figure 30. Respirometer used for Oxygen Uptake Studies

- 75 -
Since all assays used an equivalent amount of sludge in
terms of MLSS, there was no requirement for incorporation of
this value in calculations. Thus oxygen uptake rate was
expressed as mgO2/L/unit time. The use of equal quantities of
sludge is an important point to note since the toxicity of a
waste and its effect is dependent on the amount of sludge
present. Thus if more sludge is incorporated in the
respirometer, then the net amount of toxin encountered by an
individual organism will be reduced. As a result comparisons
between assays will be difficult, if not impossible.

- 76 -
2.9 DETECTION OF OXIDATIVE PHOSPHORYLATION UNCOUPLING
In order for a microorganism to produce adenosine
triphosphate (ATP) an electrochemical membrane potential is
required. If this potential is short circuited then the
organism will most certainly die since ATP is an essential
energy carrier of living organisms.
Strain N22 of Rhodobacter capsulatus, a photosynthetic
bacterium, possesses an unusual pigment which exhibits an
absorbance wavelength shift, towards the red, in response to a
membrane potential. Chromatophore membrane vesicles of this
strain were prepared by the Biochemistry Department,
University of Birmingham. The preparation involved
French-pressing a culture of organisms which was followed by
differential centrifugation in order to concentrate the
vesicles. These vesicles are essentially inside out, i.e. the
inner cell membrane is now on the outside of the vesicle
(Figure 31).
A flash of light will now cause the transport of
electrons across the membrane. However, ATP synthase will
immediately consume this potential and must be inactivated by
addition of venturicidin. The cytochrome complex be also
allows this reverse transport of electrons (Figure 32) but is
inactivated using myxothiazol. The only part of the system
remaining operative is that which transports electrons across
the membrane from the inside of the cell to the outside (which

Cell Wall
Cytoplasrnic Membrane
RhodoJbacter capsulatus (Strain N22)
French Press
Outside
Split
Inside
Figure 31. Formation of Vesicles

Cell Outside
LightQ
Cell Inside
Cell Outside
QLight
e via Q
I
complex
Ce 11 Inside f c j
c Q
cytochrome- quinone- cytochrome- cytochrome
Figure 32. Membrane Structure - Photosynthetic Electron Transport (Cyclic)

- 77 -
is now the inside of the vesicle). A flash of light now causes
a membrane potential to be generated which takes a couple of
minutes to dissipate completely. Any compound which can
dissipate this membrane potential more rapidly, by increasing
the membrane conductance, will obviously uncouple ATP
production. Carbonyl cyanide-jD-trifluromethoxyphenol
hydrazone is a very potent uncoupling agent (Figure 33) even
at very low concentrations.
The sample was placed into a modified spectrophotometer
and a line diagram (Figure 34) shows the equipment used. The
sampling duration was 2 seconds with the flash of light
occurring about 0.2 seconds into the the sampling period. The
results were plotted on a chart recorder with a scale of
O.ls/cm and a full scale deflection of 0.02 absorbance units
(5% transmittance).

FCCPFCCP
FCCP- FCCp-
H'
Ce11 Membrane
FCCP - Carbonyl cyanide-p-trifluromethoxyphenol hydrazone
F^C — O
Figure 33. Dissipation of Membrane Potential by an Uncoupling Agent (Nicholls, 1982)

Light Flash Source
Tuna <s t pnLicrhtSource
Mono-chromator ^ P.M. /All It-1 1 J. J_ _L ^ 1
D icri't'i^iPY*
TransientRecorder
C.R.O.
Sample Chart Recorder
P.M. - Photon Multiplier Tube C.R.O. - Cathode Ray Osci11iscope
Figure 34. Schematic Diagram of the Apparatus used to Detect Uncoupling Activity

- 78 -
2.10 ACTIVATED CARBON
A carbon contacting column was constructed from pyrex
glass and is shown in Figure 35. The column was packed with
20g of powdered activated carbon (BDH Decolourizing Powder)
and the Quickfit joint sealed with sealastic silicone sealant
(Dow Corning). The column was connected to a Cecil CE2010 HPLC
pump which was used to apply K10 wash water effluent to the
column at a constant flow rate and pressure. The treated
effluent then passed through two wavelength monitors set at
260 and 350nm. The first detected unsaturated bonds whilst the
second monitored orange colouration. The use of wavelength
monitors was described by Schulte (1973) for following the
progress of TNT-activated carbon processes. The breakthrough
of colour from the column was stated almost always to precede
the breakthrough of nitro aromatic compounds (however Schulte
does not identify these coloured compounds). Nevertheless,
colour determinations are a simple and effective method for
monitoring coloured aromatic effluents from either analytical
or plant-scale carbon filters and are more simple than wet
chemical methods for nitro aromatic compounds.

K10 Wash Water Effluent
T
20cm
25mm
Pump
Sintered Disc (Porosity 3)
Carbon
4——Sintered Disc (Porosity 3)
Wavelength Monitor 260nm
Wave length Monitor 350nm
Waste
Figure 35. Activated Carbon Contacting System

- 79 -
2.11 OZONOLYSIS
Ozone was generated from the part of oxygen in air using
a Labo ozone generator which was on loan from Ozotech Ltd.,
115 Station Road, Burgess Hill, Sussex.
2.11.1 Ozone Generator Operating Principle
Figure 36 is a schematic diagram of the ozone generating
equipment used.
Air was drawn from the atmosphere by an oil-free
tank-mounted air compressor to a pressure of approximately
lOOpsig. and then fed to the ozone generator. The air was
dried to a dew point better than -50°C by an air dryer unit.
This consisted of two dryer cells mounted in parallel. These
were filled with finely granulated activated alumina which
removed moisture from the air. Since the drying process was
continuous each cell was alternately used whilst the other
reactivated. The cycle time for this was two minutes, i.e.
each cell dried the air for one minute and was then
reactivated for one minute.
After drying, the air was expanded such that it could
overcome all the pressure losses in the ozone production cell
and the application system (0.75bar gauge for this
application). The air then passed through the annular space
between the high tension dielectric tube and the earthed

Pressure Gauge
Air
ryer
9N. /Pressure X Regulator
oCO COCDJHa S o uS o
-pCD
tn•M
CO
o o
Flowmeter Control Valve
Sampling Valve
Flow Meter
High Tension Connect ion
J
Ozone Generator
Cell
<H CD -P
c c
O O O
i
CD -I-1 rd
CDtn <-• C -P
OQO
CD -P—i CDa —'£ -Prd 3
CO O
1 I
CD •—i CO -P
•rH pc o o
Figure 36. Ozone Generator Equipment: System Flow Scheme

- 80 -
stainless steel jacket where it was subjected to a high
voltage silent electric discharge. A proportion of the oxygen
molecules in the air were converted to ozone. The ozonised air
then passed through a flow rate meter with a combined flow
regulating valve which controlled the amount of ozonised air
going to the contactor vessel.
An important point to note is that high tension silent
electric discharge causes molecular agitation and thus
heating. Since ozone undergoes a self-destruction process at
elevated temperatures a water cooling jacket surrounded the
discharge chamber.
The amount of oxygen converted to ozone in this system
was influenced by two parameters: the amount of air flow and
the amount of electrical power applied to the electric
discharge chamber. Figure 37 shows the relationship between
these two parameters.
2.11.2 Ozone Contactor
A contactor was required that would give good utilisation
of the ozone gas applied. To achieve this, a contactor was
constructed which was five metres tall with a volume of 36
litres. The materials used needed to be resistant to the
strong oxidising effect of ozone. Thus glass was used for the
contactor vessel and stainless steel for the reactor base
plate. Viton rubber gaskets were used at all glass-glass and

800
c
100
Prod
uctio
n
0-5
bar g
auge
.
15°C
.
20°C
.
0-8
0-9
1-0
7-7.
Electrical Current
(Amp)
1-21-3
7-4
7-5
Figure 37.
Effe
ct of Power
and
Air
Flow Rate on Oz
one
Yield

- 81 -
glass-stainless steel interfaces whilst PTFE tubing (1/4 inch
O-D) was used to transport the ozonised air from the generator
to the contactor. This equipment is shown in Plate 3 and
schematically in Figure 38.
The ozonised air entered the column through a stainless
steel base plate and was dispersed into small bubbles (<5mm)
using a three inch diameter stainless steel sintered disc. The
rising bubbles circulated the effluent in the contactor
(basically an elongated air lift fermenter) which had a liquid
circulation time of less than sixty seconds. The reacted
ozonised air left the reactor via the air detrainer and was
then washed, to remove traces of effluent, by two water filled
aspirators before entering the ozone destructor (an
electrically heated chamber).
2.11.3 Ozone Assay
An ozone assay was used to determine the production of
ozone from the ozone generator and to determine the ozone in
the contactor exit gas stream.
This assay is based on an iodimetric chemical titration.
The reaction of ozone with potassium iodide takes place in a
neutral buffered aqueous solution according to the equation:-
O + 2KI + H2O ——*- I 2 + 2KOH -I-

LIMff (W
Plate 3.
Ozone contactor

\
6" ID
\ t
2" ID • 3" ID 5.3m
/ \
JV
iffffj t<•
\
(_:/
r
Y
A B C D E
PTFE Ozonised Air Inlet Pipe F Drain Valve G Sintered Stainless Steel Disc H Pyrex Glass Contactor Vessel I Sample Port
Gas Detrainer Off Gas Sample Port Gas Scrubber Bottles To Ozone Destructor
Figure 38. Schematic Diagram of the Ozone Contactor

- 82 -
After acidification, the liberated iodine was titrated with
sodium thiosulphate according to:-
. 00 _S,O. -I- 2NaI 223 246
An iodine indicator was used to determine the 'end point'.
2.11.3.1 Potassium Iodide Solution
In 1 litre of distilled water:
Potassium iodide 20.0 g
Disodium hydrogen orthophosphate 7.3 g
Potassium dihydrogen orthophosphate 3.5 g
2.11.3.2 Ozone Assay Procedure
A one litre wash bottle was completely filled (1.2L) with
potassium iodide solution, sealed and inverted. The ozonised
air sample (approximately 800ml) was then introduced into the
top of the bottle and the potassium iodide solution displaced
into a graduated measuring cylinder.
The bottle was then sealed, the volume of potassium
iodide solution displaced noted, and the bottle shaken
vigorously for two minutes. The solution, now straw coloured,
was placed into a white enamel dish (400ml) to which 2ml of
25% sulphuric acid was added. The solution was then titrated
against 0.1N sodium thiosulphate solution until a pale yellow
colour was obtained. A small amount of BDH iodine indicator
was then added and the titration was continued until complete

- 83 -
decolouration had occurred, when the final level in the
burette would be read.
2.11.3.3 Calculation of Ozone Concentration
Ozone concentration was determined from the following
formula:-
= 24 x S x N x (T + 273) x 1013
V x 273 x P g°3/mn
where O is ozone concentration under normal conditions c(i.e. S.T.P. with pressure of 1013mbar at O°C)
S is the consumption of thiosulphate (ml)
N is the strength of the thiosulphate (0.1N)
T is the ozonised air temperature ( C)
V is the measured volume of gas collected (L)
P is the pressure at which V is measured (mbar)
2.11.4 Ozone Safety
Since ozone is such a toxic gas (Section 1.4.6.1) it is
imperative that adequate safety measures are taken. For this
reason an Otrameter was utilised. This device continuously
samples the ambient air and measures the ozone concentration.
If the concentration of ozone exceeds O.lppm. (lOOnbar partial
pressure) then an alarm sounds thus warning of a potential
health hazard. In addition to this, all pipe fittings were
tested for ozone leakage by compressing a piece of moist

- 84 -
tissue, impregnated with starch and potassium iodide, around
the joint for several seconds. On exposure to ozone a
blue/black colouration develops. Leakage of ozone, no matter
how slight, was not permissable and remedial work was carried
out.

- 85 -
2.12 STERILISATION
Liquid media, agar, old cultures and polypropylene
pipette tips were all sterilised for 15 minutes at 121°C,
15psig.
The media used for the activated sludge plants were not
sterilised since the K10 wash water effluent components
appeared intolerant to elevated temperatures and also because
of the risk of toxic vapour generation.

- 86 -
2.13 GROWTH MEASUREMENTS
Viable counts are often used for estimation of viable
cells present in a culture. However, this technique is
dependent on a mono-disperse solution of cells, otherwise the
number of cells will be underestimated. Since activated sludge
organisms have a tendency to flocculate, it is hard, if not
impossible, to obtain a mono-disperse solution without
damaging viable cells. For this reason, growth was monitored
by optical density, although this method includes measurement
of both viable and non-viable cells. A Cecil CE505
spectrophotometer using 1cm path length cuvettes was used at a
wavelength of 650nm with distilled water as the reference.

- 87 -
2.14 ANCILLARY INSTRUMENTS
Autoclave- Boxer 360 Minor (Boxer Laboratory Equipment
Ltd., Ware, Hertfordshire).
Incubator- Gallenkamp Cooled Orbital Incubator
(A. Gallenkamp and Co. Ltd., London) which was used for shake
flask experiments.
pH Control- Gallenkamp Modular Fermenter Controllers were
used for pH control of the activated sludge plants.
Balance- Mettler PE 160 (Mettler Instruments Ltd., High
Wycombe) was used for the weighing of chemicals and for dry
weight determinations.
Stirrer- Corning PC 351 Hot Plate Stirrer (Corning Glass
Works, Corning, N.Y.) which was used for agar preparation and
the stirring in the oxygen respirometer vessel.
Pipettes- Gilson (supplied by Anachem Ltd., Luton). The
sizes 0-20, 0-200, 0-1000 and 0-5000ul were used with
disposable polypropylene tips.

- 88 -
2.15 CHEMICALS USED
All chemicals used for analyses were of analytical grade,
and at least of general purpose grade for use in growth media
or as nutrient supplements. The chemicals were obtained from a
variety of sources, including:-
B.D.H. (British Drug House Ltd.), Poole, Dorset.
Fisons Reagents Ltd., Loughborough, Leicestershire.
Oxoid Ltd., Basingstoke, Hampshire.
Aldrich Chemical Company Ltd., Gillingham, Dorset

- 89 -
CHAPTER 3
RESULTS
3.1 SHAKE FLASK STUDIES - PRELIMINARY WORK
Experience has shown that TNT red water is toxic to
microbial systems, and it was therefore advisable to find if
K10 wash water effluent behaves similarly. Shake flask
experiments were therefore devised using the simple salt
medium described in Section 2.2.1, supplemented with one of
six carbon sources and dosed with either 0.1, 1.0 or 10% (v/v)
of K10 wash water effluent. Three control flasks (which had
had the carbon supplement omitted) were also prepared. The
flasks were inoculated with organisms obtained both from
domestic sewage and from activated sludge from a phenolic
waste treatment plant (Section 2.3), incubated in an orbital
shaker at 20°C and 100 rpm, and examined daily by
microscopy, by spectrophotometry (using absorbance
measurements at 650nm) and, finally, for general physical
appearance of the contents.
After 24 hours incubation the carbon-supplemented flasks
were observed to contain healthy cultures even at 10% K10 wash
water effluent concentration. This rapid growth was unexpected
since it was anticipated that the waste would be toxic to
microbial systems. The flasks were examined daily for a
further four weeks and it was noted that the diversity of
organisms was some what reduced when compared with the
spectrum of organisms in the initial inoculum. At the 0.1%

- 90 -
dilution of K10 wash water effluent, bacteria, fungi, ciliates
and ameobae were observed; the latter were found only at this
dilution. Bacteria, fungi and a greatly reduced number of
ciliates were observed at the 1.0% dilution of K10 wash water
effluent, whereas at 10% only bacteria were found. Clearly,
then, as K10 wash water effluent will permit microorganisms
to grow, it is not a total bacteriocide or bacteriostat at
these concentrations as had been feared. Nevertheless, there
is considerable toxicity towards the ameobae and some toxicity
towards the ciliate inocula from the activated sludge.
Moreover, no growth was observed in any of the three control
flasks, suggesting that the carbon present in the K10 wash
water effluent was unavailable to the microbes.
Thus attention was turned to the possibility of setting
up a system which would allow the adaptation and enrichment of
suitable microbial cultures. The aerated activated sludge
process was chosen for reasons previously discussed (Section
1.5).

- 91 -
3.2 AEROBIC ACTIVATED SLUDGE PROCESS
The a<:htf<xhe.ci sludge process was developed by Arden and
Lockett (1914) and is essentially a continuous fermentation
with recycle of flocculating microorganisms. The effluent is
mixed and aerated with the organisms which oxidise the waste
matter. The primary degrading organisms in such a system are
bacteria, as already discussed (Section 1.4.8), which derive
nourishment directly from the raw waste in order to synthesise
proteins and to satisfy energy requirements. Although one
organism may be able to degrade a variety of compounds the
necessary enzymes may not be expressed continuously but need
to be induced i.e. produced only when the particular compound
is present. Thus a period of acclimatisation may be required
for the induction of and subsequent manufacture of the
required enzymes. Further to this, it is unlikely that all
organisms within the inoculum would possess the necessary
genetic information to produce such enzymes and thus
enrichment of the degrading organisms would be necessary. Such
enrichment is enhanced by recycling of organisms within a
waste treatment process, as occurs in activated sludge
processes.
Other organisms which also contribute to this process
include ciliates and other protozoa which feed on
free-swimming bacteria and so assist in producing a more
clarified final effluent. In general, the number and types of
protozoa have been used to indicate the condition of activated

- 92 -
sludge processes (Curds, 1975), however, in the particular
case of K10 wash water treatment, such a procedure is likely
to be of little value for two reasons. Firstly the waste was
clearly toxic towards protozoa during the shake flask
experiments, killing all ameobae and reducing the number of
ciliates. Secondly, whilst in some cases, protocidal compounds
might be diluted and metabolised in a continuous activated
sludge plant later experiments indicated clearly that there
was very little degradation of these compounds in such
situations.
There are several types of activated sludge process which
have been discussed in detail by Forster (1977). The extended
aeration process was chosen for the treatment of K10
wash water.

- 93 -
3.3 ACTIVATED SLUDGE PLANT START UP
Two identical laboratory scale activated sludge plants
were constructed as shown in Figure 39 and Plate 4. Each
plant comprised a five litre rectangular aeration tank and a
one litre sedimentation tank. The aeration tank lid was fitted
with ports for a pH electrode and stirrer motor shaft, and
entry points for acid/alkali and feed.
The contents of the reactor were constantly aerated by
sparging air at one litre per minute and stirred using a
paddle stirrer at forty rpm. The overflow from the reactor was
collected in the settling tank where the organisms readily
formed floes. The settling tank was constructed with a 45°
conical base to encourage settling and a slow rotating rubber
paddle stirrer which scraped the sludge from the side walls
causing the floes to fall. The settled sludge was continuously
recycled using a Watson-Marlow peristaltic pump and the
clarified effluent passed over the weir (final effluent). The
pH of the aeration tank was maintained between 6.8 and 7.2 by
an automatic pH controller fitted with a Russel pH electrode.
2.OM sodium hydroxide solution was initially used to maintain
the pH but was changed to a potassium hydroxide solution since
potassium ions are less detrimental to microbes (Wase, 1987)
Temperature control was not practicable; temperature therefore
fluctuated with room temperature (temperature is, in any case,
not controlled in full scale activated sludge plants as it is
economically prohibitive).

T
fiU
J
\
A Influent ReservoirB Collected EffluentC Peristaltic PumpD 5 litre ReactorE Sparger
F StirrerG SettlerH Sludge RecycleI pH Controller
Figure 39. Laboratory Scale Activated Sludge Plant

Plate 4. Laboratory scale activated sludge plant

- 94 -
3.4 EXPERIMENTAL STRATEGY: A GENERAL OVERVIEW
For the initial start-up, both activated sludge plants
were fed on mixed phenolic medium (Section 2.2.2) with a
retention time of two days. Several types of monitoring were
employed to assess plant performance. These included frequent
(3-5 day intervals) analyses for chemical oxygen demand
(Section 2.4.2), total organic carbon (Section 2.4.3) and
phenol (Section 2.4.5). Mixed liquor suspended solids were
also monitored but less frequently, and usually with a
microscopic examination, and this was supplemented with
occasional photographic records.
Colonisation of a reactor was observed to follow a
general pattern; after inoculation bacteria would proliferate
rapidly: this would be followed by the appearance of protozoa,
including ameobae, ciliates and flagellates, nematodes,
rotifers and fungi.
The next stage was to introduce K10 wash water effluent
to one of the reactors, which was designated the experimental
reactor, at a concentration of 1% (v/v) (Section 2.2.4.1) on
day 128. On day 196 this was increased to 2.5% (Section
2.2.4.2). Many of the protozoa disappeared with the
introduction of K10 wash water as was observed in the shake
flask experiments.
A third, smaller reactor (2 litre) was later commissioned

- 95 -
in order to assess the effect of increasing the K10 wash water
effluent concentration still further without risk to the
stability of the experimental plant. The reactor was seeded
with sludge from the experimental reactor and fed with 2.5%
K10 medium until considered stable. The effect of phenol as a
carbon source in replacement of mixed phenolic waste was
investigated and so was the effect of increasing the K10 wash
water effluent concentration to 12.5% K10 medium in which the
K10 wash water effluent was the sole source of carbon. The
latter was not successful and the reactor was sterilised and
re-seeded with sludge from the experimental reactor and fed on
2.5% K10 medium.
The experimental reactor had been operating on 2.5% K10
medium for over 12 months without sign of detriment due to
feed concentration or accumulation of toxic/inhibitory
materials. As a result it was decided to re-inoculate the
control reactor with sludge from the experimental reactor and
switch the feed to 2.5% K10 medium.
The degradation of individual components of the K10 wash
water effluent was assessed by HPLC analysis (Section 4.3.2).
Although K10 wash water effluent 2.5% K10 waste did not appear
toxic at low concentrations, neither was it significantly
degraded. In the final biological treatment assessment it was
considered best to use the small reactor as a reserve source
of inoculum and to use both larger reactors for further
experimentation.

- 96 -
The aim of this experiment was to increase the selective
pressure placed on the sludge microorganisms to metabolise K10
wash water effluent components by increasing the concentration
of the waste in the feed of both reactors. However, the
concentration of carbon supplement (phenol) fed to the two
reactors (now Reactor 1 and Reactor 2) differed. In reactor 1
the phenol concentration was maintained constant whilst the
concentration of K10 wash water effluent was increased, thus
the COD value of the medium also increased (Static Phenol
Medium, section 2.2.5.1). The other reactor also had
increasing K10 wash water effluent concentration but the
phenol content of the feed was reduced with increasing K10
wash water effluent concentration in order to maintain a
fairly constant COD value (Decreasing Phenol Medium, Section
2.2.5.2)

- 97 -
3.5 RESULTS
3.5.1 Phenol analysis
The control plant was fed on mixed phenolic medium whilst
the experimental plant was fed on a combination of mixed
phenolic medium and K10 wash water effluent. Samples were not
taken until the sixth day after inoculation. This was
designated day 1. Figures 40a to 40f display the feed,
effluent and removal efficiencies of phenol for the control
reactor. The experimental reactor was treated similarly except
that on day 128 K10 medium was introduced at 1% (v/v) and on
day 196 this was replaced with 2.5% (v/v) K10 medium. Figures
4la to 4If display the results for this reactor.
Several deductions can be made from examination of the
results. These are:
i) For the majority of the operational period, the phenol
removal efficiencies were above 90% with a final effluent
containing less than 10mg/l phenol and occasionally as
low as 0.2mg/l, the limit of detection for the sample
volume and type of assay utilised (Section 2.4.5).
ii) The introduction of K10 wash water effluent to the
experimental plant had to be deferred from the
anticipated day 30. This was due to the possibility of
interruptions in electrical power supply and also a
laboratory relocation involving dismantling and

H-
vQ C
i-{
(D S3*
CD
Phe
nol
(mg/
1)
0 r
DO Ul
01 oO
O
3 0> CO
H-
H
M. 3 o>
ft & (D o o 3 ft n o (D
0)
Q
ft
O
o
& •< Cfl
01
o
tr o o o O
xj ui
O01 o
0)(D
O
i-
P-
< c
fit
(D—
P
Perc
enta
ge Re
mova
l

Phe
nol
(mg/
1)
ui
oo
o
H-
(D O cr (T) 3 o 3
0) 01 H- cn o M)
ft tr o o 3 rt n o \-> » (D
0>
O rt O
3 0) CO
Ul o
CD 3 o
I I
W
Tli-h
CD
^
CD
(D
D
rt
o
o
Per
centa
ge
Rem
oval

Phe
nol
(mg/
1)
ui
oo
o
cn
o
H- (D O
O (D 3
Ov]
O
l
(0 H-
(0 ft 13*
(D O
O 3
ft (D
0)
O
ft
O
H M' 3 CD O & ^ Cfl
t\J O o CO
DO CJ1
+ m
i i
i£d
W
'TJ
(D
"-h
(D3
t-h
CD
O
•-
P-
<
CQ>
CD
H-
P
Percentage Re
mova
l

900
tn S
o c0)
JCex
450
0
100
0
oS
o; tn(04-1C <L> O
DH
225 250 275 300
Time (Days)
Figure 40d. Phenol Analysis of the Control Reactor
* -Feed• -Effluent+ -Removal

Phe
nol
(mg/
1)
(D o (D CD
3
O
01 oO o
GO
O
O OJ
N)
01
CO H-
(0 ft CD O
O ft O M (D rt o
3 CD tfl
OJ
Ul o
I 33
CD
3 o <
I I
W
""d»-h
(D
HI
CD
CD
OJ
\I
01O
l O
o
o
Perc
enta
ge Re
mova
l

Phe
nol
(mg/
1)
H-
vQ c: (D (D
3
O 3
D) in H-
(A O H)
ft tr (D o o 3
rt
n
O (D
D)
O
ft
O
(Jl
OO O
OJ
x)
Ul
H M- 3 O
0)
^ Ul
o
o CO Ul
II
Ijd
w0>
H)
(D
3 h"*>
fl>
o •- P
'QJ
(D
i—' 3
ft"
ui
oU
l oo
o
Percentage Removal

900 100
o c
a,
450
00
Laboratory Relocation
Power Fluctuations50
025 50 75
Time (Days)
oa0)
0)tn
<D U }H (D
Figure 4la. Phenol Analysis of the Experimental ReactorA -Feed• -Effluent+ -Removal
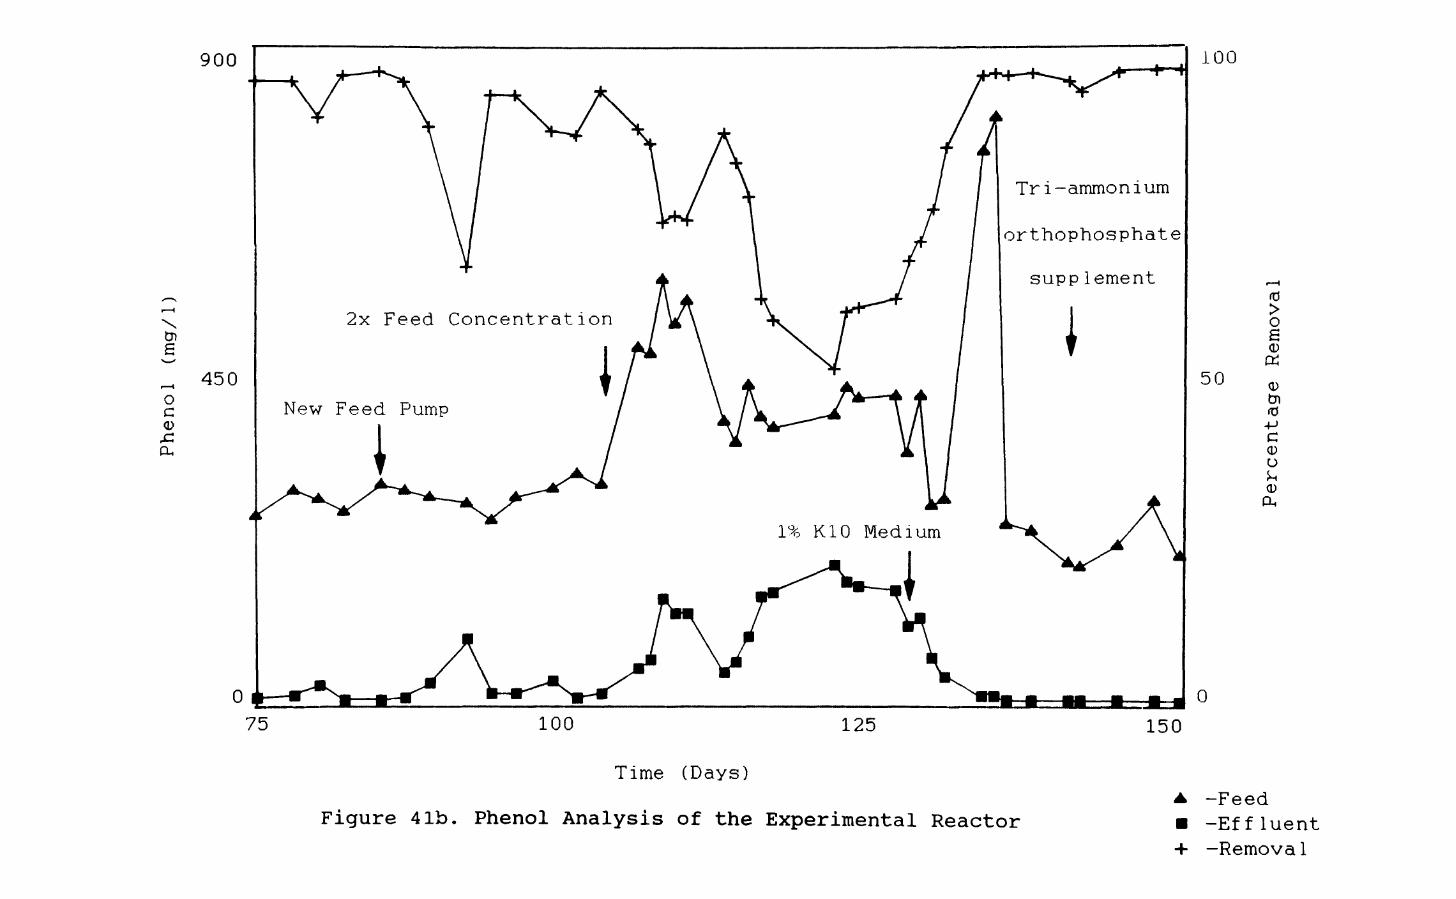
900
tn £
o c(D JCPH
450
Tri-ammonium
orthophosphate
SUPPlament
2x Feed Concentration
New Feed Pump
K10 Medium
100
50
(0>o S
0)tn irf •P C0)oJH0)PH
0100 125 150
Time (Days)
Figure 41b. Phenol Analysis of the Experimental ReactorA -Feed• -Effluent+ -Removal

900
tn
450o c 0.c Pu
0
150
2.5% K10 Medium
JNew Batch of MPW
175 200
Time (Days)
Figure 41c. Phenol Analysis of the Experimental Reactor
100
to >o &<D
50
c<D U ^, (D O,
0
225
A -Feed• -Effluent-I- -Removal

900 100
450
Oc0)
0 0
oa
0tnrd -P C 0)o
D-,
225 250 275 300
Time (Days)
Figure 4Id. Phenol Analysis of the Experimental ReactorA -Feed• -Effluent+ -Removal

900 100
tn £
oc450 50
03 >Oa
0)tn rd -M C <D uSH 1)a,
0300 325 350
0375
Time (Days)
Figure 41e. Phenol Analysis of the Experimental ReactorA -Feed• -Effluent4- -Removal

900 100
0 0
375 400 425 450
id >OS
450 50oc<D,Ccu
0) tn
C <U O
Time (Days)
Figure 4If. Phenol Analysis of the Experimental Reactor
A -Feed• -Effluent+ -Remova1

- 98 -
reconstruction of the entire experimental apparatus.
Compressed air supplies were used when possible but
reactors most certainly became anoxic when the air supply
failed for periods of six hours or more. The onset of
these disruptions had a marked effect on the phenol
removal efficiency, however, the reactors were quick to
recover to original levels within a week after the final
disruption.
On day 164, the air pump (which fed air to the
control reactor) was found to have failed. This may have
lasted several days, and it is interesting to note that
the reactor took two weeks to recover, the length of time
required for a plant to establish itself after seeding.
A further, more minor, disruption was the
installation of a new and more accurate feed pump. Both
feed and sludge recycle were disturbed for short periods
and this is the only explanation available for the
decrease in performance occurring a few days later.
iii) Raw mixed phenolic waste, used to make media, was
deficient in essential nutrients (nitrogen and
phosphorus) which accounts for the drop in phenol removal
efficiency noticeable by day 131 which affected both
reactors. This sudden decrease in performance may have
been aggravated by the doubling of the feed rate on day
103. A further problem concerned a fault in the pH
controller to the control reactor which resulted in
excess sodium hydroxide addition, the pH reaching 9.5 on

- 99 -
day 110. The supplementation of the feed with
tri-ammonium orthophosphate rapidly reversed the nitrogen
and phosphorus starvation.
iv) The introduction of 1% K10 wash water effluent (day
128) as a supplement to mixed phenolic waste medium did
not appear to have any detrimental effect to the
experimental reactor. On the contrary, its effects were
largely beneficial and were attributed to the nitrogen
content of K10 wash water effluent. The later use of 2.5%
K10 medium as a feed to the experimental reactor (day
196) did not significantly affect the reactor phenol
removal efficiency. It is worth mentioning that the K10
wash water effluent does not contain phenols or interfere
with their assay: thus the phenol analysis provides a
good technique for monitoring general carbon metabolism
since it excludes the K10 wash water effluent components,
unlike the TOC and COD assays which measure both mixed
phenolic waste and K10 wash water effluent components.
v) A new batch of mixed phenolic waste (used for media
preparation) was introduced to the control plant on day
214. A week was considered adequate as a check to ensure
that no detrimental effects had arisen. Nothing untoward
had happened during this week and consequently on day 221
the new mixed phenolic waste batch was introduced into
the feed of the experimental plant. However, three weeks
after the introduction of the new mixed phenolic waste to

- 100 -
the control reactor its phenol removal efficiency dropped
dramatically and required more than forty days to
recover. Microscopic examination of the sludge during
this period did not reveal anything untoward regarding
the health of the sludge. The effect of the new waste
might have been due to the presence of a new component
which required a period of selection and enrichment of
the bacterial population. The effect on the experimental
reactor was far less marked, perhaps due to the
expression of different organisms within the population.
vi) For the final period (days 300 to 450) both plant
performances were stable and had equal removal
efficiencies and no inhibition appeared to occur.
3.5.2 COD analysis
COD analysis was not utilised during the early part of
the experimentation. This was because a COD apparatus was
unavailable for general use and so a set of apparatus was
constructed within the departmental workshop to the Author's
design.
Figures 42a to 42d illustrate the COD input, output and
removal efficiencies for the control plant and Figures 43a to
43d are those for the experimental reactor.
The results were similar to those of the phenol analysis
with certain exceptions. These are as follows:

Chemical Ox
ygen
Demand (mg/1)
o
oX
] Ul
H- n>
CD
O
O
O o Do
o
H-
W
H M- 3 (D
H
ft y (D o o D ft n o M »
(D
P
O
ft
O
D
(U
•<
CO
to U1
O
I I
IX)
w ^
dCD
>-
h <D
Sj
t-h
CDO
—
P
-<
P
QJ
CDP
erce
nta
ge
Rem
oval
O D
M. 3

Chemical Oxygen Demand (mg/1)
(D
3
O
<
(D o o D in H-
to o H)
ft tr
n> o o 3 rt
n O (D
D)
O
rt
O n
I "Tl
(D
oo
o
H M. 3 0) o
fu *< CQ
Ul
O
Per
centa
ge
Rem
oval
00 o o O
O
CD

Chemical Oxygen De
mand
(mg/1)
(D CO O o o D CO
H- w o H)
ft tr n> o o 3 ft (D
Q)
Q
ft
O n
oo o
OD
O
O
to M
U1 NJ <_n
o
H (-"• 3 CD PJ ^ tfl
CJ1 O) o
o
I I
Ipd
W "
rCD
»-
h CD
3 "
O
•-<
C
QJ
CD
oCJ
1 o
CD
Per
centa
ge
Rem
oval

(D ^. to
Chemical Ox
ygen
Demand (mg/1)
O O
00 o
o(jj
o o
o o oGO
fO
Ul
W H- w3 (D
ft tr (D o o 3 ft (D
P> O
ft
O
pj •< CO
GJ
Ul
O
I I
I£d
M *
TJCD
i-h
CD3
»-h
CDO
H- p.
< C
PJ
CD
OJ
x]
Ul
OUl o
o
o
Perc
enta
ge Re
mova
l

Chemical Ox
ygen
Demand (mg/1)
0)
o
o00 o
o
U) 0)
U1
o o aO
O
W H-
CO O i-h ft y (D w X (D
^
H- 3 (T)
3
ft (D
P
O
ft
O
3 (D
tsJ
CJ1
(Jl
O
o CD c 3
H
*! M. I P) 0
D
M.
I O T n- D1 0 T) 3* 0 W T) 3* D) n- CD C
T!
13
i — i
CD
CD
l I
lCD
f-h
E3 i™h
o >-
< c
0J
CD
CD
CDPercentage Removal
O
O

1800
a(U Q
Xo
u•M
a<D
900
0
2.5% K10 Medium New Batch of MPW
100
50
0
oa
tn fd -p C<D O ^ (DO.
150 175 200 225
Time (Days)
Figure 43b. COD Analysis of the Experimental ReactorA -Feed• -Effluent+ -Removal

1800
tn S
£(D Q
C CD tn ixX O
O•l-l
s0),c
900
0
100
50
0
OS
tn (04-> C 0)u ^,<D(X
225 250 275 300
Time (Days)
Figure 43c. COD Analysis of the Experimental Reactor-Feed-Effluent-Removal

-d c<D£(D Q
C<D
X O
U'M
s1)
1800
900
0
100
50
0
300 325 350 375
id >oa0)
<D tn rd -P C <l>uJH (D
PH
Time (Days)
Figure 43d. COD Analysis of the Experimental ReactorA -Feed• -Effluent+ -Remova1

- 101 -
The removal efficiencies were not generally as high. In
the case of the control reactor, which was fed only with
phenolic waste, removal efficiency was generally 85 to
95% when the reactor was considered to be in a stable
condition. The efficiency for the experimental reactor,
fed on phenolic waste, plus 2.5% K10 medium, was lower,
ranging from 75 to 85%. This was attributed to K10 wash
water effluent components which were not mineralised,
since the phenol removal efficiencies of the two reactors
were equal. However the increase in the COD of the
effluent from the experimental reactor (compared with
that of the control) was not equal to the contribution to
the COD of the K10 wash water effluent components of the
experimental reactor feed (200mg/l at 2.5% K10 waste). In
many instances the observed increase was as low as
100mg/l. Thus it seems likely that some of the K10 wash
water effluent components were mineralised. However, the
K10 wash water effluent did contain urea and sodium
carbonate and the overall contribution of this component
to the COD of the waste was unknown.
3.5.3 TOC analysis
Figures 44a to 44e show the TOC content of the feed and
effluent together with the percentage removal for the control
reactor. Figures 45a to 45e show these for the experimental
reactor.

Total
Organic
Carb
on (mg/1)
ui
oO
O
H-
^Q C n (D o o 3 CD CO H- o H) rt
(D O
O rt
O M (D O rt
O
(D
i-h3
Hi
O
i-<
cCD
(t)
H M-
0> O
CO
+ m
i i
i CD
(D
o 1SJ (Jl
o U1CJ
l O
Percentage Re
mova
l
r
& tr
o o CD i — >
0 o O o
o

Tota
l Or
gani
c Ca
rbon
(mg/1)
ui
oo
o
(D o o w H- en o H)
ft
U
(D O
O
3
ft n> o> n rt
o
X] CJ1 O
O
3 (D CO
to LJ1
+ m
I I
I33
W
T
CD
i-h
CD3
"o
-<
c&
CD
CJ1
O
oCJ
I Q
0)P
erce
ntag
e R
emov
al
DO
X CD
•D O O 3 O 0) 3 r+ O P H O p M. c 3 o O
T)
P1
O tn t) p' QJ r+
CD 0) CD 3
CD
P
O
O
rt-

Tota
l Or
gani
c Ca
rbon
(m
g/1)
H- (D Q O O 3
0) H- ft tr (D o o 3 ft (D
&J
O
ft
O
B (D
(D
3 O <
I w o>
OUl
I-1 O o
Perc
enta
ge Removal

Total
Orga
nic
Carb
on (mg/1)
<J\ O
O O
o o D) CO H- o M>
ft cr (D O
O 3 rt
i-{
O (D
P
O
ft
O
XI W
hrjCD
i"~h
CD3
*~h
CDO
*—•
QJ<
C0)
CD
K) M ai CO ai
o
3 CD U)
to
xl
U1 GJ O O
cn
oo o
Percentage Removal

Total
Organic
Carb
on (mg/1)
CD 3 o
(D (D o o (0 H-
CO ft tr
n> o
o 3
ft o> QJ n rt
o
en
o
•o
o
oO
) o o Ob
i
K) en
3 (D
U) cn
o GO
x]
CJ1
OI
IM Tl
t-h
CDt-h
CD
CJ o
Percentage Removal
QJ
CD

900
c o
rd
u•i-H
crd tn
fd -p o H
450
00
Laboratory Relocation
Power Fluctuations
100
\
25 50
Time (Days)
Figure 45a. TOC Analysis of the Experimental Reactor
50
0
rd >OS0) OS
0)tn fd -p
oJH (D d,
75
A -Feed• -Effluent+ -Removal

To
tal
Org
anic
C
arbo
n (m
g/1)
ui
oo
o
01
(D 01 tr 1-3 o oo o
(0 H- cn ft
tf
(D W X tJ (D 1^ H- 3 (D
CD CO
to
01
(D fW O
ft
O
(J1
O
I I
I?0
W
*T
](D
H
i (D
3
H>
CDO
•-
d
<
Ca
0)
Ul o
Per
centa
ge
Rem
oval
o
o

900 100
2.5% K10 Medium New Batch of MPW
tn £
c o
CJ
O•i-iC <0 01<M
O
450 50
0
fO>o60)
bi 10
0) U ^ <Dcx
150 175 200 225
Time (Days)
Figure 45c. TOC Analysis of the Experimental ReactorA -Feed• -Effluent+ -Removal

900
C Q
rj•i— i C
O
-P OH
450
0
100
0
rd>o £0) PC!
0)
c<D O SH 0) P-,
225 250 275 300
Time (Days)
Figure 45d. TOC Analysis of the Experimental ReactorA -Feed• -Effluent+ -Removal

(D Ul
(D (D (D
0>
O
ft
O
Total
Orga
nic
Carb
on (m
g/1)
GJ
O
O
O1
OO O
1-3
O oGJ
CO cn
01 H-
CO3 CD
ft tr (D w
o
& ••< to
(D 3 ft DJ
GJ
cn
o
I I
I
(D oCD 3
rt
-
CD
CD
P.
GJ cno
(Jl
oo
o
Percentage Re
mova
l

- 102 -
The overall patterns of the TOC results are identical
with those of the COD analyses (Section 3.5.2), however, the
removal efficiencies were generally lower; 65 to 75% for the
control and 55 to 65% for the experimental reactor.
3.5.4 Control and Experimental Plants - General Comments
Whilst, in general, the plants both worked well on the
feed provided, there were one or two points which deserve
comment and emphasis. As previously mentioned, for optimum
performance, mineral supplements and a continuous air supply
are necessary: this type of waste (phenolic/aromatic) appears
particularly susceptible to shortages of dissolved oxygen,
hardly surprising as the first steps in degrading many of
these compounds involve direct incorporation of oxygen by
means of oxidase enzymes (Section 1.6.4). Comparisons between
the control and experimental reactors indicate, as already
pointed out, a discrepancy between the COD and TOC removal
efficiencies; since the phenol removal is around 100% in both
reactors, not all the K10 wash water effluent could have been
degraded, although, equally, a proportion was removed. Thus in
over a year's operation, biological acclimatisation to all the
available carbon still had not been achieved. Clearly it was
desirable to examine the situation more closely.

- 103 -
3.6 PILOT REACTOR RESULTS (2L)
This reactor was initially constructed for preliminary
investigations so as to reduce the possibility of
inadvertantly killing off the population of the experimental
reactor. If the pilot reactor population was killed off it
could be re-seeded with a large inoculum from the experimental
reactor.
Figures 46a, 46b and 47a, 47b show the COD and phenol
analysis results respectively. It can be seen that this
reactor required only a short period of time to become
established since a large inoculum was used from the
experimental reactor which was utilising the same type of
feed.
The first phase of experimentation was to observe the
effect of utilising phenol as a sole carbon source, replacing
the mixed phenolic waste. However this medium was supplemented
with additional nutrients (Section 2.2.3) and it was envisaged
that these might also contribute to any change in plant
performance. In order to avoid this, the nutrients were added
to the mixed phenolic waste K10 medium from day 17 onwards and
they had no observable effect. When, on day 32, the synthetic
phenolic K10 medium was introduced any observed effects were
due solely to the carbon source change. It was found that
there was an increase in COD removal efficiency with no change
in the phenol removal efficiency. It would seem that not even

Chemical Oxygen De
mand
(mg/1)
O
O
00
O Oo
H-
(D o o Dto U
l
CO H- in o M)
ft tr n> to tr1 O
ft (D
D>
O
ft
O
H
M. 3 (D (D
01
O Ul
oui o
0)
n^
(D3
>-h
0>O ^ Q,
< C
Q
O
Percentage Re
mova
l

H- (D o o D
Chemical Oxygen De
mand
(m
g/1)
O
O
cn o
o00 a?
00
O
O
CO H-
CO3 0)
0) 3 o
rt
pr (D to
o CD •< w
H-
I-1
O ftCO
U1
(D
D)
O
ft
O
I I
I£0
t*J
^"j(D
i-h
CD3
"-h
CDO
•—'
P-<
cCD
CD
(Jl
oo
LJ1 o
Percentage Removal
O o

900
tn S
O c
a,
2.5% KIO/ Medium
450
0
Additional Nutrients
Phenol + KIO Medium
100
50
0
(C>o 60)
bi it(-P c<D U ^a>
DH
0 25 50 75
Time (Days)
Figure 47a. Phenol Analysis of the 2L Pilot Reactor
A -Feed• -Effluent+ —Removal

Phe
nol
(mg/
1)
(D (D
3 o 3
0) w H-
O H)
ft
S3*
(D o ft (D
P
O
ft
O
4- •
>
I I
X)
MCD
»-h
3
'-hO
H
-<
C
0)
CD
(I)
CD
3 CD
Ul
OO
O
Ul o o ISJ
Ol
ISJ
CJ1
o\°
O S CD
CD P-
i-1' §
Ul
O
01
oo
c
Percentage Removal

- 104 -
all of the mixed phenolic waste components were mineralised
completely: these may or may not have been phenolic.
On day 77 the feed was changed to 5% K10 medium (Section
2.2.4.3) with phenol remaining as the additional carbon
source. This was maintained for one week during which the
phenol removal efficiency was unchanged. The COD removal
efficiency decreased by 10%, although the contribution of the
additional 2.5% K10 waste COD to that of the effluent, if
completely recalcitrant, would have been nearer 20%. These
results confirmed the point that some of the K10 wash water
effluent components are partially degraded or mineralised by
the activated sludge organisms.
The next phase was to increase the concentration of the
K10 wash water effluent to 12.5% and remove the phenol carbon
supplement although the additional nutrients were maintained.
This had drastic effect. The COD removal efficiency dropped
rapidly and within two weeks there was no COD removal.
Microscopic examination during this period revealed only
bacteria which rapidly depleted in number. By day 101 few
bacteria could be seen and the negative COD value was probably
due to bacterial debris in the reactor effluent. The cause of
this devastation could have been due to the toxicity of the
waste at this concentration or possibly that the organisms
were unable to utilise K10 wash water effluent as a sole
carbon source.

- 105 -
3.7 FINAL BIOLOGICAL ASSESSMENT
The reader will recall that reactor 1 was fed on static
phenol medium (Section 2.2.5.1) while reactor 2 was fed on
decreasing phenol medium (Section 2.2.5.2). The concentration
of K10 wash water effluent in the feed of the reactors was
2.5%. At this K10 wash water effluent concentration the two
media have equal phenol concentrations and thus the reactors
had identical feed composition from day 0 to day 8. During the
course of the experiment the concentration of K10 wash water
effluent in the feed was increased to 5.0%, then 7.5% and
finally to 10%. The concentration of phenol was maintained or
adjusted in accordance with the respective medium.
3.7.1 COD Analysis
The COD value results are shown in Figures 48a and 48b
for reactor 1 and 49a and 49b for reactor 2. COD removal
efficiencies dropped with the addition of 5% K10 wash water
effluent and continued to do so when 7.5% K10 wash water
effluent was introduced with the feed. A feeding error on day
39, involving a three fold increase in feed rate, caused a
sudden drop in the efficiency of both reactors. However,
recovery occurred within two days. The COD removal appeared
stable from day 84 to 109 and the mean efficiencies were 59.0
and 44.7% for reactors 1 and 2 respectively. The greater
efficiency of reactor 1 can be attributed to the composition
of the feed to this reactor since it contains higher

2.5% K10 5 . 0% K10 7.5% K10 Shock Load
-act!
£0)
X
a^x:
1800
900
0
100
0
o £
1)trt
c0)uSM (Ucu
Time (Days)
Figure 48a. COD Analysis of Reactor 1. Static Phenol Media
A -Feed• -Effluent+ -Remova1

Chemical Oxygen Demand (mg/1)
0) 00 tr o o o 3
P) in H- w (D
0>
O
ft
O n CO rt v ft H-
O (D 3
O 3 (D
P.
H-
o
o00 o
oO1 O
O
H 3 CD O
0) •< CO
c-o
en CJ1 o
(D o
I W C
CD
a.o
o
Perc
enta
ge Re
mova
l

Chemical Oxygen Demand (mg/1)
(D VD O o O 3
0) W H- o H) (D Q) O
ft
O to o (D o (D H-
3 (T)
3
O s (D a H-
CD
Hi
3
i-hO
H
-<
C0)
CD
CO
CJ1
H M' 3 (D 0) *< CQ
cn
o Ul
ui
o
(D
<D
Ul
* X H*
O
Ul o Nl
Ul CD
J 0 o X r o
o o
Percentage Re
mova
l

Chemical Oxygen Demand (mg/1)
H-
& c VD tr o o a cn H- cn o H) (D
0)
O
ft
O to O (D O i-< (D QJ W H-
3 (D 3 O S
(D a> 3 o <
o o00 o
ox] U
l
O
O
3 (D O CU CQ
t-0
•L51
'Jl
O
I I
I "~dU
l O
CDPe
rcen
tage
Re
mova
l

- 106 -
concentrations of phenol which is normally metabolised readily
by these sludge microorganisms. Examination of the mean COD
values of the treated effluent over the same period gave cause
for concern. The mean value for reactor 1 was 657mg/l whilst
for reactor 2 it was 624mg/l. Although the difference is
slight it may indicate that not all of the phenol carbon
source was being metabolised to completion.
The introduction of 10% K10 waste, on day 116, to the
feed of the reactors gave rise to a further increase in the
COD value of the treated effluent leaving the reactors. The
mean values from day 121 to 147 were 961mg/l and 789mg/l for
reactors 1 and 2 respectively. This was an increase of 304mg/l
for reactor 1 whilst the increase for reactor 2 was only
165mg/l. This is quite a large difference and adds further
evidence to the suggestion that the phenol may not be
completely metabolised by the sludge microorganisms under
these conditions.

- 107 -
3.7.2 Phenol Analysis
The phenol analysis results are shown in Figures 50a and
50b for reactor 1 and 51a and 51b for reactor 2. Phenol
removal efficiencies did not alter as significantly with the
addition of increasing K10 wash water effluent concentrations
as did the COD efficiencies. The mean phenol removal
efficiencies were 95.5% for reactor 1 and 93.3% for reactor 2
from day 84 to 109 (7.5% K10). The mean phenol concentrations
in the treated effluent over the same period were 20-2mg/l and
19.4mg/l for reactors 1 and 2 respectively. Clearly, then,
most of the phenol was at least partially metabolised during
this period to a degree that it would no longer react in the
phenol assay (Section 2.4.5). The introduction of 10% K10
waste caused a further increase in phenol concentrations in
the treated effluent with means of 27.4mg/l and 27.0mg/l for
reactors 1 and 2 respectively from day 121 to 147. This small
increase is not nearly as large as that which occurred with
the COD analysis.
Phenol levels in the treated effluent only reached high
levels after the shock load on day 39 where the concentration
rose to 228mg/l (56.7% efficiency) in reactor 1 and 150mg/l
(59.1% efficiency) in reactor 2.

Phe
nol
(mg/
1
H-
vQ C n (D Ul o n> 3 o cn H-
W O M> (D
0>
O
ft
O CO ft 0) ft H-
O (D 3
O S (D a H-
0)
to
H
i-j' 3 (D a
a> •< CD
Ul
O
+ m
i i
(JlU
l o
3
»-ho
H-<
ca<
CDPe
rcen
tage
Removal

10% K10
900 t+ + +
450O C 0•C CL
0
100
50
0
75 100 150
rd >OS0)
(0-PC<u uJH CDPH
Time (Days)
Figure 50b. Phenol Analysis of Reactor 1. Static Phenol Media
-Feed-Effluent-Removal

Phe
nol
(mg/
1)
H-
^ C n (D n> 3 o cn H-
(D
0)
O
ft
O O
(D O n (D H-
3 Tl
3*
(D
3
O S
(D a H-
H M. 3 0) O
Q) ^ CO
CD 3 o <
I I
W
'Tl
^
CD>-h
CD
•- a
c CDPe
rcen
tage
Removal

Phe
nol
(mg/
1
•n
H- (D Ul
H tr • ^ 3- (D 3
O 3
0) H- to o M)
(D
0)
O
ft
O to O
(0
O n (D (U W H- 3 (D 3 (D
& H-
un
oo
o
CD 3 o
w CD
3
x]
Ol
O o
H M CD O
&> •<
Ui
DO cn CJl o
Ul
Oi—
' O
CD
Per
centa
ge
Rem
oval

- 108 -
3.7.3 TOC Analysis
The TOC analysis results are shown in Figures 52a and 52b
for reactor 1 and 53a and 53b for reactor 2. TOC removal
efficiencies dropped rapidly in both reactors with the
addition of 5% K10 waste and further still with 7.5% K10 waste
concentrations. The shock load on day 39 did not cause as
dramatic change in efficiency as for the COD and phenol
determinations since the TOC removal was already less than 25%
efficient for both reactors.
The mean TOC values of the treated effluent from day 84
to 109 (7.5% K10 waste concentration) were 301mg/l (29.9%
efficiency) and 288mg/l (20.8% efficiency) for reactors 1 and
2 respectively. The addition of 10% K10 waste in the feed of
these reactors resulted in a further decrease in efficiency.
The mean TOC values of the treated effluent from day 121 to
147 were 535mg/l (10.2% efficiency) and 413mg/l (7.8%
efficiency) for reactors 1 and 2 respectively. Over the same
period the mean feed TOC values were 596mg/l for reactor 1 and
448mg/l for reactor 2. Thus the difference between reactor
feed and effluent was 61mg/l for reactor 1 and 35mg/l for
reactor 2. This very low removal, much less than the
contribution to the TOC value made by the phenol component in
the reactor feed, further supports, in fact confirms, the
incomplete metabolism of phenol which is caused by elevated
K10 wash water effluent concentrations.

Tota
l Organic Carbon (mg/1)
T) H-
^Q C n (D
Ul t-3 o o 3 01 w H-
01 (D
CU
Q
ft
O en rt 0) rt H-
O CD 3 o I-1
(D a H-
H
CD 3 in
<b
i-h
(D•3
H-, o
>o
i—• Q
a- CD
N)
Ul
Ul o o\° Ul d? LTl y 0 o X r o
Perc
enta
ge Re
mova
l

Total
Orga
nic
Carbon (mg/1)
ui
o
T)
H-
(D UI
to tr 1-3 o o (0
H- o H) (D p) O
ft
O ft CD ft H-
O (D O I-1
(D H-
(D
3
O
<
Ol o
o
H
M. 3 (D D
to CJ1
O
O
o\c
Ul
O0)
CD
O o
CDPe
rcen
tage
Re
mova
l

Tota
l Organic Carbon (mg/1)
(D CO O
O in H- en o M> (D P O ft O to (D
O CO H- 53*
(D 3
O 3
(D a H-
to CJ1
H
M. 3 CD O
Q>
*<
Ul
ai
o U1
l l
IX)
w ^
dCD
>-h
CD
3
i-h
CDO
H
- d
<
CQJ
CD
U1 o
NJ Ul
o\° CJ1 o Ul
o\° o o X r o 0» o.
o
o
Perc
enta
ge Removal

To
tal
Org
anic
- C
arbo
n (m
g/1)
LD
O
VD
O
O
Ul
CJ tr o O (0 H-
(0 (D P O ft O to a (D o (D V w H- tr (D S
(D
CD
i-h
»-j
,_.
O ^
Q)
CD rt-
x]
Ul
I-1 O
H
M. 3 (D CQ
to C7I
cn
oI CD CD
P.
U1
OO o
Percentage Re
mova
l

- 109 -
3.7.4 Final Biological Assessment - General Comments
The reactors were maintained for several months on 10%
K10 wash water effluent feed after day 147. Occasional
sampling during this period did not reveal any change in the
status of the reactors. It was thus concluded that whilst 10%
K10 waste was not totally bactericidal it was most certainly
inhibitory causing incomplete metabolism of a carbon substrate
(phenol) which would ordinarily have been readily metabolised
to completion.
During the course of this experiment microscopic
examinations with photographic records of the sludge were
made. Changes were observed and these are discussed in Section
4.1.

- 110 -
CHAPTER 4
FURTHER INVESTIGATIONS AND ANALYSES
The results of analyses for phenol, COD and TOG on feed
and effluent, discussed previously, are those which would
normally be monitored in most sewage treatment laboratories.
However, they provide no further detailed information as to
the toxic nature of the waste, nor do they indicate which, if
any, of the K10 wash water effluent components are mineralised
or partially degraded. Consequently, more detailed work was
carried out to investigate these matters further
photo-microscopy, HPLC, ultra-violet wavelength scans and
oxygen uptake studies (Chapter 5).
4.1 MICROSCOPIC SLUDGE EXAMINATION
Plates 5 to 7 show typical samples taken from the
activated sludge plants before introduction of K10 wash water
effluent. There was a wide selection of protozoa including
ciliates, rotifers, nematode worms and higher organisms such
as arachnids. The bacterial floes did not contain filamentous
fungi or large quantities of cysts which are often associated
wi +-h slnrirro in r»nnr* h#aa"l'Hi-with sludge in poor health.
The introduction of 2.5% K10 wash water effluent caused
the disappearance of many vorticella and flagellates and all
ameobae. This was also accompanied by a slight increase in the
number of cysts within the sludge floes. Plate 8a shows a

- Ill -
Vorticella sp. which is obviously under stress since adverse
conditions cause certain species to break free from the stalk
and swim away to settle elsewhere. During this process the
mouth region closes and a ring of aboral cilia form in the
region of the stalk. The organism then breaks free, swims off,
and settles in an environment which has more suitable
conditions. In the free swimming stage (the teletroch stage)
it is not possible to identify the organism since the nature
of the stalk is used in identification, Plate 8b shows the
teletroch stage of a Vorticella sp.
5.0% and 7.5% K10 wash water effluent concentrations
caused further decreases in the relative number of protozoal
organisms essentially leaving only a very sparce sprinkling of
protozoa, together with some nematode worms and a much reduced
number of higher organisms.
10% K10 wash water effluent introduction resulted in the
complete disappearance of all the remaining protozoa.
Nematode worms still remained, however. Plates 9 and 10 show a
very obvious increase in the relative numbers of nematode
worms and also stages of egg development. These changes were
also accompanied by dramatic changes in sludge floe
composition - an increase in filamentous organisms (Plate 11)
and also large numbers of cysts as in Plates 9 (with the
nematode worms) and also Plate 12. The reason for the
proliferation of nematodes might have been due to the absence
of competition, or the warmer weather (Dosanjh, 1985) although

- 112 -
Chaudhuri et al. (1965) found that nematode population
densities increased with decreasing temperatures and
population maxima occurred, in aerobic treatment plants,
between 17-18°C. The operating temperatures of the activated
sludge plants used in this experimentation, during the summer
months, ranged from 23-29°C when the population explosion
occurred. However, the absence of higher organisms at the 10%
K10 wash water effluent concentration is another possible
factor influencing the nematode population increase since many
of the arachnids are the only important predators of worms
within percolating filters, the more common habitat of the
arachnids. Plate 13 shows the mouth-parts of an arachnid
alongside an almost fully developed nematode worm egg. It is
not hard to visualise such an organism eating this egg or
newly hatched worms. However, Baker (1975) states that
arachnids are not found in activated sludge plants although
Evans and Hyatt (1960) found Platvseius italicus (an
arachnid) at Minworth Sewage Works, Birmingham. This is an
interesting point since part of the domestic sewage sludge
used initially to seed the sludge reactors was obtained from
this source.
It was quite obvious that K10 wash water effluent caused
dramatic changes within the population of an established
activated sludge plant. However, after four months continual
exposure of sludge to 10% K10 wash water effluent (post
Section 3.7 experimentation) a return to 2.5% K10 wash water
effluent concentration resulted in the return of almost all

- 113 -
the flora and fauna previously observed at the start of the
work. However, there were just a few exceptions such as
ameobae, which did not return, and have not been observed
since, in over two years of operation. Rotifers, too, only
seemed to survive with very low concentrations of K10 wash
water effluent in the feed.
The presence of large numbers of cysts, the appearance of
filamentous fungi, and the loss of most protozoa (either
permanently or temporarily) may perhaps indicate the somewhat
toxic nature of K10 wash water effluent.

Plate 5. Examples of Vorticella sp. found in activated sludge
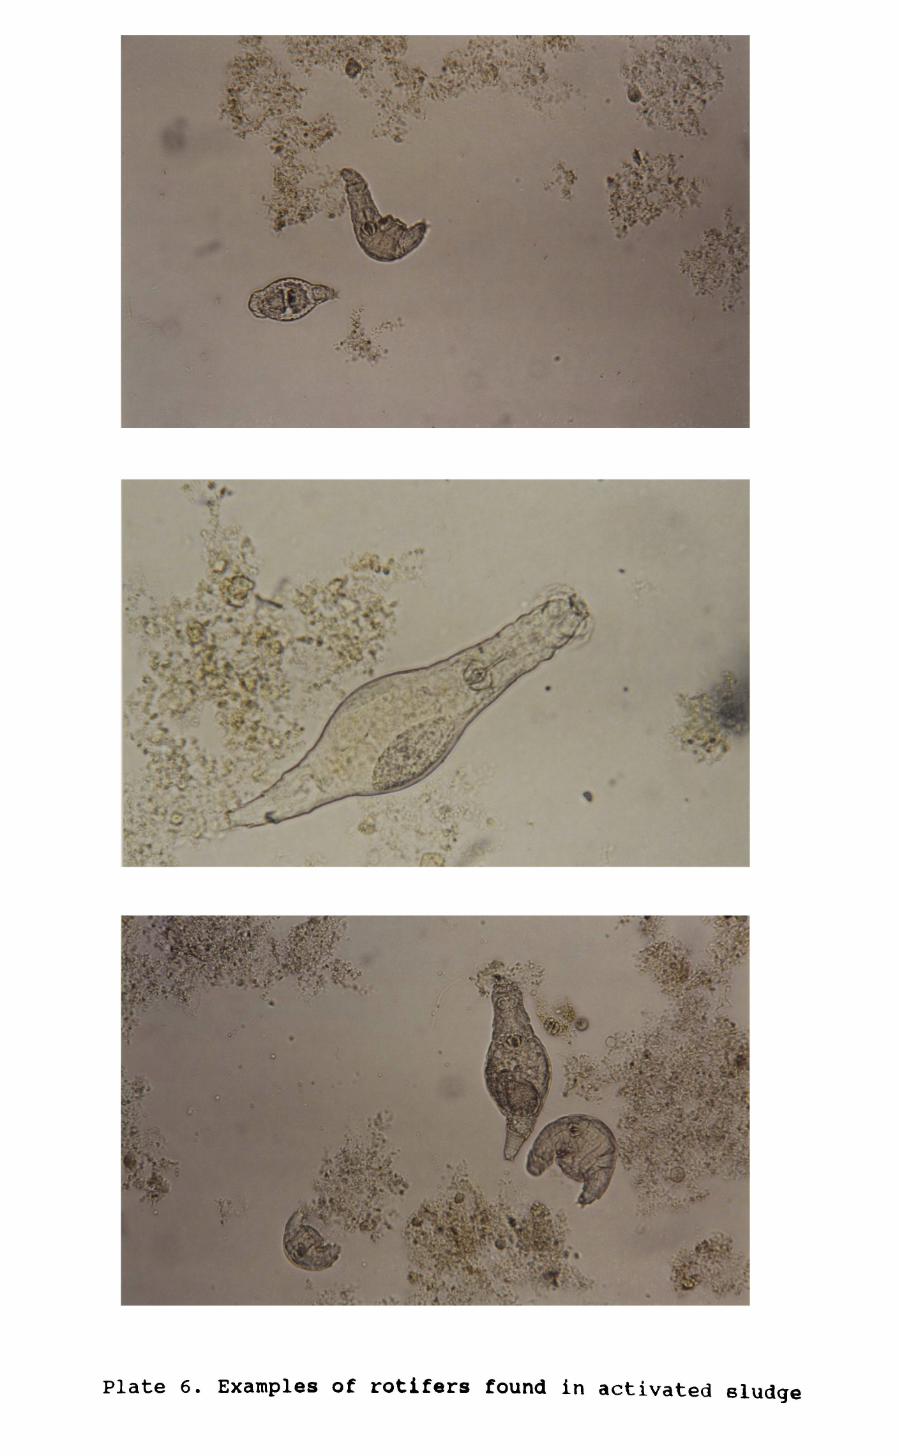
Plate 6. Examples of rotifers found in activated sludge

Plate 7. Examples of higher organisms found in activated sludge

A - Vorticella g£. forming a ring of aboral cilia
B - Vorticella sp. in teletroch stage
Plate 8. Vorticella sp. found in sludge exposed to 2.5% K10 wash water effluent

Plate 9. Dramatic increase in numbers of nematode worms in activated sludge exposed to 10% K10 wash water effluent

Plate 10. Nematode worm eggs found in activated sludge exposed to 10% K10 wash water effluent

Plate 11. Filamentous organisms found in activated sludge exposed to 10% K10 wash water effluent

Plate 12. Examples of cysts found in activated sludqe exooaed to 10% K10 wash water effluent

Plate 13. An arachnid beside a nematode worm egg in activated sludge exposed to 7.5% K10 wash water effluent

- 114 -
4.2 ULTRA-VIOLET SCANS
Ultra-violet wavelength scans were useful for rapid
assessment of plant performance although the data were not
used quantitatively. Wavelength scans of the feed and effluent
of the control reactor are given in Figure 54b for day 146
(reactor efficiency low, phenol removal 52%) and in Figure 54a
for day 196 (efficiency high, phenol removal 98%). A clear
difference can be seen. In Figure 54b there is an absorbance
peak at 270nm which was not present in the reactor effluent on
day 196. The absorbance peak at this wavelength is
characteristic of mixed phenolic waste and not found in scans
of K10 wash water effluent as can be seen from Figure 55.
Clearly, the reactor is operating satisfactorily, all the
material in the phenolic waste which absorbs at 270nm is being
degraded. There was no absorbance peak at 270nm for K10 wash
water effluent whilst there was a peak at 350nm arising from
the orange colouration of the waste. This colouration was pH
dependent and also subject to both photochemical and
temperature enhancement. This coloured peak also exhibited
small and not always reversible wavelength shifts (depending
on physical factors such as heat, light and pH) and was not
removed by the experimental reactor as can be seen from Figure
56.
Wavelength scans were also used to determine the most
suitable wavelength for HPLC analysis which is subject to two
considerations. The first, most obvious, is that the compounds

o
tfl
2.0- "> Day 196 2.0-
1.5-
Before Treatment
o cit! 43SH O CO43
1.0-
After Treatment 0.5-
B Day 142
Before Treatment
After Treatment
200 250 300 350 Wavelength (nm)
400 200 250I i
300 350 Wavelength (nm)
400
Scan 230-400nm Scan Speed 2.5nm/sec Scale Expansion 20nm/cm Time Constant 2sec
Figure 54. Use of Wavelength Scans for Rapid Assessment of
Plant Performance

2.0-
1.5-
<D UC
O 01
1 .0-
0.5-
0-
After Treatment
Before Treatment
200r250
I I300 350
Wavelength (nm)400 450
Scan 230-450nm Scan Speed 2.5nm/sec Scale Expansion 20nm/cm Time Constant 2sec Dilution 1% (v/v) K10 waste
Figure 55. Wavelength Scan of K10 Effluent

2.0 —
Before Treatment
1.5-
u c ItJ
O 03
rQ
1.0-
0.5-
After Treatment
200 250 300 350 Wavelength (nm)
400 450
Scan 200-450nm Scan Speed 2.5nm/sec Scale Expansion 20nm/cm Time Constant 2sec
Figure 56. Wavelength Scan of 1% K10 Medium

- 115 -
to be detected must absorb light at the wavelength used,
which, as is clear from Figure 55, is as short a wavelength as
possible. The minimum wavelength that the equipment would
reliably detect was 190nm, but at wavelengths shorter than
230nm the K10 wash water effluent adsorbed radiation too
strongly. Thus this consideration was satisfied choosing 230nm
for the main UV absorbance and 350nm for the coloured peak.
However, the second consideration was that the HPLC solvents
used must not absorb light too intensely at the selected
wavelength otherwise they will mask the absorbance of the
compound to be detected. The solvents used for HPLC analysis
absorbed light (transmitted poorly) at 230nm (Table 5).
However, at 260nm the solvent absorbance was greatly reduced
whilst the K10 wash water effluent still absorbed quite
strongly and so this wavelength was taken as a compromise.

Solvent Percentage Transmission
(vs Water)
230nm 260nm
Acetonitrile (Far UV) 95 98
Methanol 80 98
Tetrahydro furan 20 90
Table 5. Transmission Properties of some Solvents used for
HPLC Analysis (1cm Path Length).

- 116 -
4.3 HIGH PERFORMANCE LIQUID CHROMATOGRAPHY (HPLC)
4.3.1 The system utilised and results obtained
The equipment utilised is described in section 2.7. A
reverse phase column was recommended by Kelly (1987) with
methanol, water and tetrahydrofuran, at a ratio of 2:2:1
respectively, as an isocratic mobile phase. A C. Q guard_Lo
column was utilised which was replaced every twenty-five
injections and a pre-injection solvent filter, packed with
preparatory grade silica, was used to saturate the mobile
phase with silica so protecting the main analytical column
from dissolving. Sample injection was via a Rheodyne valve
fitted with a 20ul sample loop which was always used fully
filled with sample.
An HPLC analysis of K10 wash water effluent is shown in
Figure 57. The separation of the colourless compounds is
satisfactory, but the coloured components of the waste are not
retained, or separated, particularly well under the conditions
used. These coloured components are eluted from the column
within a few minutes, almost certainly just behind, or with,
the solvent front. The remaining four component peaks are
retained and separated quite well. However, the heights of
these peaks are much smaller (less than 10%) than the orange
component peaks, although this does not necessarily have any
bearing on the proportions of these compounds in the waste.

100 -i
Q
'-M
O o\°
0) Oc
Ocn
50 -
0
7
Sample Concentration 8% (v/v)Sample Volume 20ulColumn Size 250mm x 4.6 IDPacking ODSParticle Diameter SumMobile Phase Water/THF/MeOH 2/1/2Flow Rate Iml/minTemperature ambientDetector 260 and 350nmSensitivity 1.0 and O.lnmChart Speed 0.5cm/min
260nm 350nm
8
0 10 20 30 40
Time (min)
Figure 57. HPLC Analysis of K10 Waste

- 117 -
4.3.2 HPLC Analysis of K10 Degradation
Many analyses using Clg as the stationary phase were
performed on K10 wash water effluent both before and after
incubation with activated sludge organisms. A typical
situation is as follows. Figure 58 shows the analysis of K10
after incubation and accompanies Figure 57, a comparable
analysis of a K10 wash water effluent sample before
incubation* A comparison of these reveals several differences
and similarities. These are:
i) Peaks 1,2 and 4 which absorb at 350nm, being coloured,
have not been degraded by the microbes.
ii) Peak 3, which also absorbs at 350nm (indicated by the
shoulder on peak 2), has been partially degraded during
incubation.
iii) The remaining peaks, numbers 5,6,7 and 8, do not absorb
at 350nm and have all been significantly degraded during
incubation with the complete disappearance of peak 6.
iv) Two new peaks have emerged, 5a and 8a. These could be
recalcitrant transformation products or secondary metabolites.
Due to the lack of retention and hence poor separation
of peaks 1,2 and 3 they might be combinations of fairly large
peaks or be masking smaller ones. It is also worth mentioning
that peak height is not a good method for quantitative
analysis of an individual compound. Peak area measurements are
far more reliable since they consider both the height and

100 -i
Qen
'4-t
o d?
<D OcrO
50-
0
Sample Concentration Q% (v/v)Sample Volume 20ulColumn Size 250mm x 4.6 IDPacking CDSParticle Diameter SumMobile Phase Water/THF/MeOH 2/1/2Flow Rate Iml/minTemperature ambientDetector 260 and 350nmSensitivity 1.0 and O.lnmChart Speed 0.5cm/min
——— 260nm- - - 350nm
Figure 58. HPLC Analysis of K10 Waste After Treatment

- 118 -
breadth of the peak.
The results of HPLC analysis show that some of the
organic components of K10 wash water effluent are metabolised
by activated sludge. However, it is likely that these
compounds are only a minority of the total waste since they
have very small absorbance peaks at 260nm. The fact that
coloured waste components are not significantly removed ties
in with work by Nay et al. (1972) who found that the
coloured components of the analogous TNT red water effluent
were very refractory and also toxic.
4.3.3 Stationary and Mobile Phase Selection
Many analyses were carried out on the K10 wash water
effluent with varying types and combinations of mobile phase
solvents on a range of stationary phases. The aim was to
retain (strong enough in that 20 bed volumes of solvent
washing do not elute the isolate) and then elute (no more than
5 bed volumes of solvent required) the K10 wash water effluent
components. A thorough investigation was directed towards HPLC
stationary phase properties. These can be separated into four
categories: polar, non-polar, anionic and cationic
interactions.
Non-polar interactions (reverse phase) are those which
occur between the carbon-hydrogen bonds of the sorbent
functional groups and the carbon-hydrogen bonds of the isolate

- 119 -
molecules ("van der Waals forces"). Since most organic
molecules have some non-polar structure, non-polar
interactions are very effective for isolation of groups of
compounds dissimilar in structure. Retention on these
stationary phases is facilitated by polar solvents and elution
by non-polar solvents since these disrupt the non-polar
isolate/sorbent interactions.
As previously discussed (Section 4.3.1) K10 wash water
effluent separation was initially achieved using a cocktail of
relatively polar solvents (water, tetrahydrofuran and
methanol) in conjunction with a C._ reverse phase column.-Lo
This stationary phase is considered as the least selective of
the non-polar interacting matrices since it retains almost
anything as well as being the most non-polar sorbent
available.
An attempt to use water as the mobile phase with a C. 0J.O
column for the retention of K10 wash water effluent components
ought to be successful since water is obviously highly polar,
and polar solvents facilitate retention on reverse phase
columns. However, the use of water was unsuccessful in
retaining the coloured K10 wash water effluent components
whilst the non-coloured components were retained too strongly
so that they were not eluted. It was thus concluded that the
coloured components must be highly polar in character.
Since the use of non-polar stationary phases was

- 120 -
unrewarding, the next step was to examine polar interactions.
These might well be more suitable for the retention of the
coloured components since the retention principle is opposite
to that of reverse phase. Polar interactions include hydrogen
bonding and pi-pi bonding. Groups that are retained by these
sorbents include hydroxyls, amines, carbonyls, aromatic rings,
double bonds and groups containing atoms such as oxygen,
nitrogen, sulphur and phosphorus. Retention on these
stationary phases is facilitated by non-polar solvents and
elution by polar solvents.
However, K10 wash water effluent is a water based
effluent and the addition of highly polar solvents into normal
phase columns is not recommended. Furthermore the waste
contains salts (sodium carbonate and urea) which are insoluble
in non-polar solvents and thus precipitate within the
non-polar solvent system causing column or frit blockage. Thus
the waste would need to be de-salted. To do this C.__Lo
cartridges are generally used to bind the organics to the
column which is then flushed with water to remove the salts,
which are not retained. The isolates are eluted with a
non-polar solvent. This eliminates the problem of injecting
water, since the isolate is now in a less polar organic
solvent, and also the problem of injecting salts, into a
normal phase system. The flaw in this strategy obviously lies
in the desalting. Coloured K10 wash water effluent components
are not retained by C._ and are lost in the flushing water.J_o

- 121 -
The last possible consideration was that of ionic
interactions. These can be cationic (positively charged) or
anionic (negatively charged). However, these groups can appear
as either cationic or anionic (rather than simply one or the
other) since most potentially ionic groups can be charged or
not depending on the pH of the solvent used. In order to
obtain effective retention of isolates on a sorbent two
conditions must be met. The first is that the solvent is at a
pH where both isolate and sorbent are charged and the other
that the solvent does not contain high concentrations of a
strongly competing ionic species. Thus water or low strength
ionic buffers (<0.1M) can be used for retention at a suitable
pH. In the case of anion exchange a solvent pH is required
which is below the pKa of the sorbent but above the pKa of the
anionic isolates, thus they are both charged. The converse
regarding pH applies for cation exchange.
Elution can be achieved by several methods or
combinations of them. Buffers containing high strength anions
(>0.1M) or those containing high selectivity anions (in the
case of anion exchange) will facilitate elution since these
will compete with the anionic isolate for the sorbent.
Alternately, a buffer with a pH 2 units higher than the pKa of
the sorbent will cause elution since it will neutralise the
charge on the anionic sorbent or a pH 2 units lower than the
pKa of the isolate since it will neutralise the charge of the
isolate. The converse applies to cation exchange systems.

- 122 -
Attempts to utilise ion exchange systems for the analysis
of K10 wash water effluent components were unsuccessful. In
several cases the coloured components were so strongly bound
that they proved to be impossible to remove. An example of
this was the use of an SAX (trimethylaminopropyl (chloride
form)) sorbent which is primarily an anion exchange sorbent
but also has polar and non-polar secondary interactions. The
sample was applied in water and the coloured components were
seen to bind to the top of the column. Various elution
solvents were applied to the column at a range of pH values
from pH2 to 11. Organic solvents, singularly and in
combination with each other, and including water were
utilised, as were high strength counter ions including citrate
and iodide ions which are two of the strongest counter ions.
These were also mixed with organic solvents and at various pH
values. All were unsuccessful in eluting the coloured
components. The column was discarded.
Fortunately, Fox (1989) recommended that 0-05% TFA
(trifluroacetic acid) in water should be tried with the CnoJ.O
column. This was very successful and elution was achieved
using a gradient to acetonitrile with 0.05% TFA. The Author
is, of course, aware of the danger of dissolving the
stationary phase with this reagent. However this was the only
solvent and stationary phase combination that actually worked.
Since a system capable of producing a reliable gradient was
not made available until the end of this project (the Gilson
system (Section 2.7)) this analysis technique could only be
applied to the ozonolysis experimentation (Chapter 6).

- 123 -
CHAPTER 5
OXYGEN UPTAKE STUDIES
Information about waste treatability can often be
obtained rapidly by oxygen utilisation tests. There are many
different versions of this test but all are fundamentally
similar - measuring the rate of oxygen utilisation by
microorganisms in response to the waste to be treated.
However, accurate evaluation of a waste requires extensive
laboratory analysis and two questions raise concern. The first
is the ability of microorganisms to degrade the waste
components and the other the possible deleterious effects of
the waste on biological systems.
5.1 OXYGEN UPTAKE BY SLUDGE IN RESPONSE TO K10 EXPOSURE
The equipment used and the sludge preparation for this
assay are described in section 2.8. The MLSS value for the
sludge within the respiration chamber was 1120mg/l and Figure
59 shows a typical oxygen uptake response. After the initial
lag period there was an increase in the respiration rate which
quickly became stable and it is this stable respiration period
which is used to assess the effect of the waste component on
the organisms.
In use, the gradient of the recorder trace is defined as
the percentage oxygen (expressed as a percentage saturation of
the liquor) consumed in unit time. Since, at 21 C, there are

•d o
O,Stable Uptake
Oxygen Period
100-
c0)tr. >. X O•o
OenCO
50-
0 100
(v/v) K10 Waste with adapted organisms
Figure 59. Typical Oxygen Uptake Response

- 124 -
8.272 milligrams of dissolved oxygen per litre in air
saturated water and since the liquor in the vessel is not
going to cause a large deviation in the value, the percentage
dissolved oxygen value can be easily converted to milligrams
of dissolved oxygen per litre.
Figure 60 shows the oxygen uptake rate for sludge from
the experimental reactor (fed on 2.5% K10 medium) with varying
concentrations of K10 wash water effluent. From this analysis
one might conclude that 10% K10 wash water effluent is the
highest exposure concentration for the microorganisms, above
which it becomes toxic or inhibitory, since the uptake rate
peaks at 10% concentration and falls off after this value. It
would also appear that K10 wash water effluent was readily
metabolised by microorganisms. However, exposure of organisms
from the control reactor to K10 wash water effluent (Figure
61) gave results which were contradictory to that which might
have been expected when comparing carbon source utilisation
between adapted and unadapted organisms. The unadapted
organisms had a much higher oxygen uptake rate throughout,
which was maximal at 0.45% K10 wash water effluent
concentration. This was tentatively attributed to uncoupling
of oxidative phosphorylation by some of the aromatic compounds
contained within the K10 wash water effluent. This process
entails the breakdown of electrochemical membrane potential
and prevents the phosphorylation of ADP to ATP. This, in turn,
provokes an increase in the rate of oxygen uptake. Many such
uncoupling agents have been described; most are lipid soluble,

10-
O fi \CM Otna
(0
0)
aDC (D tn >i X O
5-
0-
0 10 20 30 K10 Concentration (% by Volume)
140
Figure 60. Affect of K10 Wash Water Effluent on the Oxygen Uptake Rate of Activated Sludge from the Experimental Reactor

15-
otn S
-P rd
CD* fO-PaDC <u tn >i X O
10-
5-
0-
0I I 1
10 20 30K10 Concentration (% by Volume)
40
Figure 61. Affect of K10 Wash Water Effluent on the Oxygen Uptake Rate of Activated Sludge from the Control Reactor
- 125 -
have an acidic group and an aromatic ring. Dinitrophenol is a
classical uncoupling agent (Lehninger, 1977) and has obvious
similarities with K10 wash water effluent components.
Clearly the adapted organisms must have developed a
mechanism, possibly involving modifications to the
cell-wall/cell-membrane system, which enabled them to tolerate
uncoupling agents of this nature, and thus survive and
proliferate. It might be useful at this stage to define an
uncoupling agent. It is a compound that can cause an
accelerated dissipation of proton motive forces by
transporting, or allowing movement, of protons across a
membrane.
5.2 FURTHER CONFIRMATION OF UNCOUPLING ACTIVITY
The technique used for detection of uncoupling activity
is described in Section 2.9 and the resultant chart recorder
traces are shown in Figures 62a and 62b. In general, the
absorbance decrease after the pulse of light follows a half
life curve (Jackson, 1988). Thus a plot of log absorbance
versus time should yield a straight line. This was true for
the control sample and for the carbonyl cyanide-^-
-trifluoromethoxyphenyl-hydrazone (FCCP) uncoupler analyses.
However K10 wash water effluent results (Figure 63) did not
follow such a half life curve. Instead it appeared more as a
gate effect, in that the majority of the membrane potential
was dissipated within the first tenth of a second (for the 2.0
and 5.0% K10 concentration). As the test progressed further,

0.005-
oc
Ocn
0-
0 0.5 1.0Time (sec)
Blank (no uncoupler)
1.5 2.0
0. DOS-
OC
Ocn
0-
0 0.5 1.0Time (sec)
FCCP (O.OSpM)
1.5 2.0
0.005-
0)uC (t5
Oen
0 0.5 1.0Time (sec)
0. 1% K10 (v/v)
1.5 2.0
0.005-
0)u c
O CO
0-
0
0.5% K10 (v/v)
0.5 1.0Time (sec)
1.5 2.0
Figure 62a. Affect of K10 Wash Water Effluent on AbsorbanceDecay Rate in Membrane Vesicles from Rhodobacter capsulatus due to Dissipation of Membrane Potential

0.005-
U C
Ow
0-
0
K10 (v/v)
I I0.5 1.0
Time (sec)1.5 2.0
0.005-
Oc
0-
2% K10 (v/v)
0 0.5 1.0Time (sec)
1.5 2.0
0.005-
<D U C 5% K10 (v/v)
0 0.5 1.0Time (sec)
1.5 2.0
Figure 62b. Affect of K10 Wash Water Effluent on AbsorbanceDecay Rate in Membrane Vesicles from Rhodobacter capsulatus due to Dissipation of Membrane Potential

-2.4 -
-2.7 -
0 o c
0cn
tr. 0
-3.0 -
-3.3
0
Control
0. \% K10
K10
2.0% K10
K10
FCCP
0.5
Time (sec)
1.0
Figure 63. Log Absorbance vs Time for Several K10 Wash Water Effluent Concentrations

- 126 -
the membrane potential dissipation rate then roughly matched
that of the control; so this system did not behave in the same
way as FCCP.
This experiment therefore showed that membrane potential
was dissipated by K10 wash water effluent but did not throw
light on the mechanisms involved. It would seem probable that
K10 was a true uncoupling agent since it also increased oxygen
uptake rates. The abnormal uncoupling response was considered
to occur in one of two ways, the explanation of either being
highly speculative. The first possibility is that the
uncoupling agent might be inactivated by its own uncoupling
activity. However, repeated light pulse exposure to the same
sample yielded similar results each time although this could
be attributed to the diffusion of new active uncoupler into
the membrane in the period (several minutes) between light
pulses. Another possibility is that the protonated form of the
carrier molecule might move quickly through the membrane, thus
transporting a proton, whilst the ionic form travels more
slowly across the membrane and thus cannot repeat the process
within the short duration of the experimental period (<2
seconds). Both mechanisms would give a rapid initial response
followed by a slower decrease in membrane potential.

- 127 -
5.3 REJECTION OF HYPOTHESES
An experiment was devised which would either support or
totally reject the hypotheses proposed in the previous
section. However a new batch of K10 wash water effluent was
now being utilised for experimentation and so the initial
electro-chemical membrane potential dissipation experiments
were repeated using this new batch of waste. The results were
identical and this confirmed that the observed uncoupling
effect was not an anomaly associated with one single
manufacturing batch.
This experiment involved the adaptation of the
experimental equipment (Section 2.9) to allow a second light
flash. The reader will recall that the first light flash was
at time = 0. The second one came between 0.7 and 0.8 seconds
after the first. The overall duration of the test was 2
seconds as before. K10 wash water effluent (5.0%) was used in
this experiment and the results shown in Figure 64. The rapid
dissipation of membrane potential after both light flashes, at
equivalent rates, means that both hypotheses explaining this
process must be rejected. Other theories as to the mode of
action of this previously unencountered form (Jackson, 1988)
of uncoupling effect have been elusive.

0.006 -
- Control
5% K10 Double Flash
- 5% K10
0.004 J
Q) U C (0 £ !H 0 03
0.002 -
00.5 1 .0 1 .5
Time (sec)
Figure 64. Affect of Double Light Flash on Absorbance Decay Rate in Membrane Vesicles from Rhodobacter capsulatus due to Dissipation of Membrane Potential

- 128 -
5.4 DISCUSSION
ATP has probably been with us since the primordial broth,
and as proton motive forces are required in all living
organisms including anaerobes, the treatment of K10 wash water
effluent by biological means obviously has some serious
implications. It is unlikely that a new organism will suddenly
evolve that does not require membrane potentials and so
adaptation of existing organisms is necessary. This might,
quite simply, involve selective exclusion of the molecule from
the cell, via the cell wall. Alternatively, it could involve
the secretion of an enzyme which inactivates or degrades the
uncoupling agent.
Organisms may currently exist within the environment
which are capable of mineralising K10 wash water effluent
components. Likely places include the open soil-lined effluent
ditches (rhines) located in Bridgwater, Somerset, which carry
the analogous TNT red water. However soil samples were
obtained from this site and introduced to the activated sludge
plants without any improvement in plant performance (though
this does not imply that organisms do not exist at this site,
merely that active cultures were not isolated).
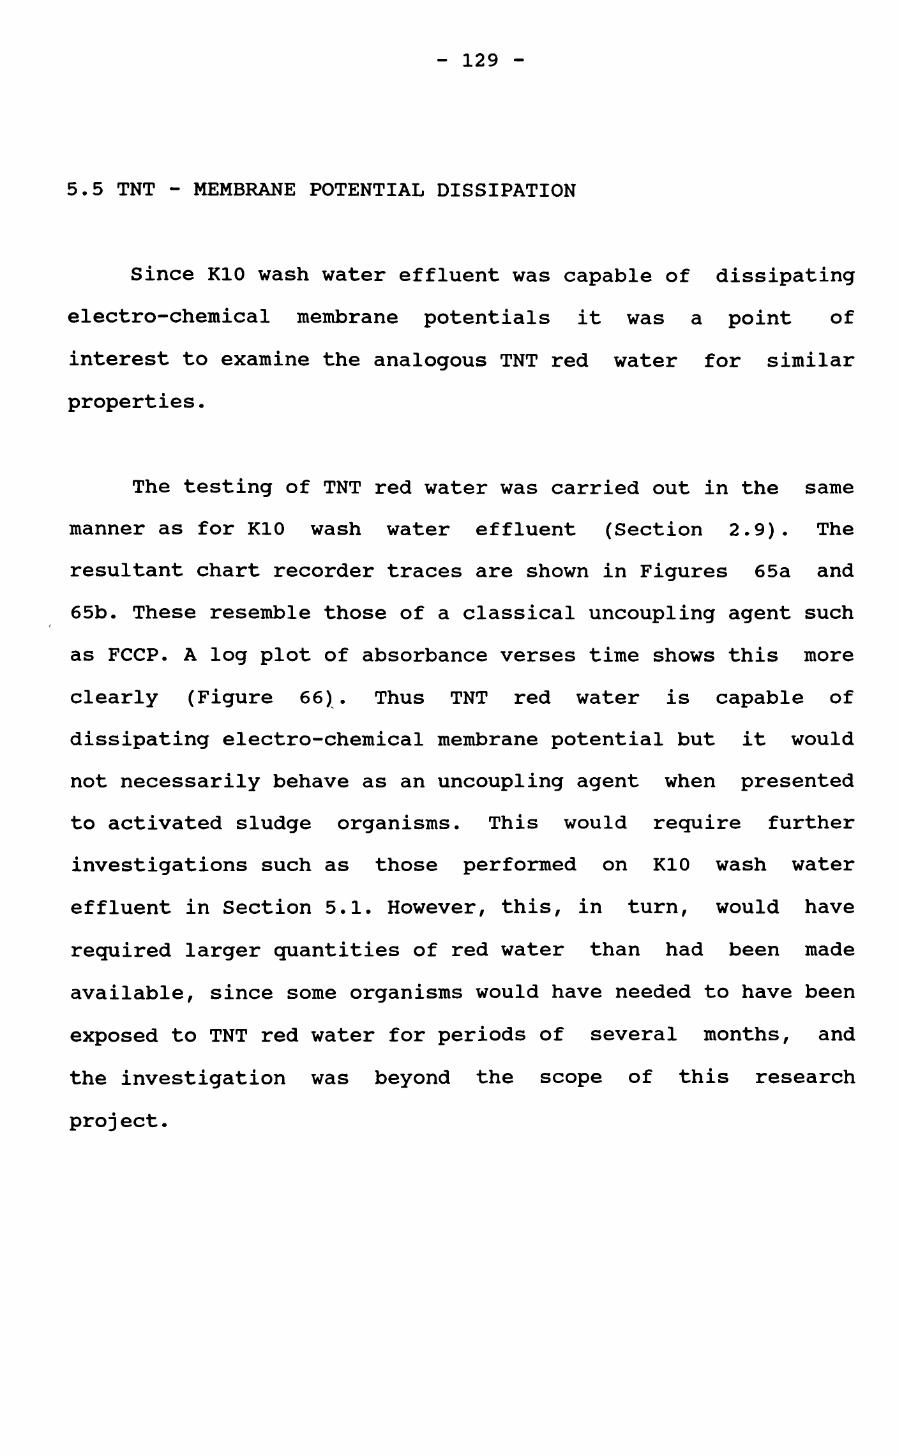
- 129 -
5.5 TNT - MEMBRANE POTENTIAL DISSIPATION
Since K10 wash water effluent was capable of dissipating
electro-chemical membrane potentials it was a point of
interest to examine the analogous TNT red water for similar
properties.
The testing of TNT red water was carried out in the same
manner as for K10 wash water effluent (Section 2.9). The
resultant chart recorder traces are shown in Figures 65a and
65b. These resemble those of a classical uncoupling agent such
as FCCP. A log plot of absorbance verses time shows this more
clearly (Figure 66). Thus TNT red water is capable of
dissipating electro-chemical membrane potential but it would
not necessarily behave as an uncoupling agent when presented
to activated sludge organisms. This would require further
investigations such as those performed on K10 wash water
effluent in Section 5.1. However, this, in turn, would have
required larger quantities of red water than had been made
available, since some organisms would have needed to have been
exposed to TNT red water for periods of several months, and
the investigation was beyond the scope of this research
project.

0.005-
oc
Ocn
0-
0
0.005-
CD U C 10
O
0-
0
0.5 1.0Time (sec)
0.5 1.0Time (sec
Blank (no uncoupler)
1.5 2.0
0.2% TNT (v/v)
1.5 2.0
0.005-
<Du C rd .Q !M O CO
0-
0I I
0.5 1.0Time (sec)
0.5% TNT (v/v)
1 .5 2.0
0.005-
CD U C
Ocn
0-
01 I
0.5 1.0Time (sec)
1 .5
TNT (v/v)
2.0
Figure 65a Affect of TNT Red Water Effluent on Absorbance Decay Rate in Membrane Vesicles from Rhodobacter capsulatus due to Dissipation of Membrane Potential

0.005-1
0>uc(0
0 0.5 1.0Time (sec)
2% TNT (v/v)
1.5 2.0
0.005-
0)o c
Ocn
o-0
I I0.5 1.0
Time (sec)
5% TNT (v/v)
1.5 2.0
0.005-
U C rO -Q ^ O CO
0-
0 0.5 1.0Time (sec)
1.5
TNT (v/v)
2.0
Figure 65b. Affect of TNT Red Water Effluent on Absorbance Decay Rate in Membrane Vesicles from Rhodobacter capsulatus due to Dissipation of Membrane Potential

-2.4 H
-2.7 H
o c
!H 0cn
tn o
-3.0
-3.3
0
Contro1
0. 2% TNT
0.5% TNT
1.0% TNT
2.0% TNT
5.0% TNT
1.0
Figure 66. Log Absorbance vs Time for Several TNT Red Water Effluent Concentrations

- 130 -
CHAPTER 6
CARBON AND OZONE TREATMENT RESULTS
6.1 ACTIVATED CARBON
The equipment used to assess the feasibility of activated
carbon treatment is described in Section 2.10. The carbon
column packing had a dead volume of 36.5ml and K10 wash water
effluent was applied to the column at a rate of 0.93ml/min
with a retention time of 39.3min. Schulte (1973) described
22.2 minutes as a long retention period in his experimentation
during the treatment of a TNT manufacturing waste stream while
using granular carbon. The reader will recall from Section
1.4.1 that powdered carbon will have a higher rate, and
possibly capacity, for adsorption of this coloured material
over that of granular carbon. Thus powdered carbon was chosen
for the work on K10 wash water effluent: a much extended
contact time was used in order that considerable adsorption
could occur. The results of this experiment are shown in
Figure 67 and the basic trend is similar to the results of
Schulte (1973). However, the absorbances at both 260nm and
350nm increase simultaneously, suggesting that the coloured
compounds contain unsaturated bonds. In this connection,
Schulte (1973) has already mentioned that in his opinion,
coloured compounds from TNT wastewater are eluted before
nitroaromatics. He does not however indicate the nature of
such compounds, and, indeed, the present Author finds
difficulty in giving them a structure if it is not
nitroaromatic. There is thus a situation of considerable

Q) OC (0
O W
1.5 -
1.0 -
0.5 H
1o inCO
Io
0 100 200
K10 Wash Water Effluent Applied (ml)
Figure 67. Monitoring of Activated Carbon Treatment of K10 Wash Water Effluent by Continuous Absorbance Measurement

- 131 -
confusion. The analogous K10 situation seems to be equally
clouded: if some of the coloured compounds are not
nitroaromatic (originally suggested to be Meisenheimer
complexes (Section 1.3.3)), then this Author has no idea at
all as to their identity.
6.1.1 Costing of Carbon Treatment
The carbon appeared saturated (retention capacity lost)
after about 140ml of K10 wash water effluent was applied.
However, the column was originally filled with water, and so a
dead volume of 36.5ml must also be taken into account. 20g of
carbon can therefore treat approximately 100ml of raw K10 wash
water effluent, and thus 200kg carbon is required per cubic
metre of K10 wash water effluent.
Based on a production figure of two tonnes of K10 per
annum, an estimate of the treatment cost for the wash water
effluent can be made using activated carbon. Since K10 has a
density of 1.34Kg/l, two tonnes of K10 has a volume ofo
1.49m . During manufacture approximately six volumes of wash3 water are produced per volume of K10 and so 8.96m of
wastewater will be produced per annum. Thus, from the results
of our experimentation, 1.79It of activated carbon would be
required for successful treatment of K10 wash water effluent
generated in one year at a cost of £5400 (FSA Laboratory
Supplies at £3/Kg).

- 132 -
The next obvious step is carbon regeneration. However for
the analogous TNT red water adsorption process, regeneration
is not a feasible option (Section 1.4.1) and the spent carbon
has to be discarded. This may also be the case for K10 wash
water effluent and thus the purchase of carbon would be a
recurrent expenditure. Moreover, further costs will be
incurred in the disposal of the spent carbon.

- 133 -
6.2 OZONOLYSIS
Many ozone treatment assessments were carried out on K10
wash water effluent. Preliminary investigations involved the
use of a 5L vessel with K10 wash water effluent at 10%(v/v) in
distilled water. Sample analysis was of COD, TOC and colour
with no measurement of the ozone entering or leaving the
contactor and thus it was not possible to estimate the
quantity of ozone required for treatment. However, these
experiments demonstrated the potential of ozone for the
oxidation of K10 wash water effluent since the relative
reduction of all parameters monitored was high.
Secondary investigations were carried out at Ozotech
Limited, Burgess Hill, Sussex. 5%(v/v) K10 wash water effluent
in distilled water was ozonised in a column over 3m tall with
a capacity of 6.5L. In these investigations the parameters
monitored included COD, TOC, full wavelength scans (200-500nm)
and also the measurement of ozone entering and leaving the
contactor. Hence the amount of ozone required to oxidise K10
wash water effluent could be calculated. However, the
reductions of COD and TOC were not as consistent with the
amount of ozone applied as was hoped and this was attributed
to the carry over of differing amounts of the previous sample
through the sample port.
Finally a 36L capacity contactor, over five metres in
height, was constructed as described in Section 2.11* The

- 134 -
sample port was filled with air between sample periods and
then flushed thoroughly before sampling. Ozonolysis in this
contactor was performed at 5%, 10%, 25% and 40%(v/v) K10 wash
water effluent in distilled water. The pattern of results was
similar at all concentrations and only the 40% K10 wash water
effluent treatment assessment will be discussed further since
analysis at this concentration included high performance
liquid chromatography (Section 4.3.3) as well as analysis of
COD, TOC, full wavelength scans (200-500nm) and also the
measurement of ozone entering and leaving the contactor.
The ozone generator was operated at a power of 1.2A and
the air ozonised at a pressure of 0.75bar gauge. The ozonised
air was supplied to the contactor at a rate of 8.5 1/min (STP)
giving an ozone doseage rate of 9.75gO_/h. The efficiency of
ozone utilisation during ozonolysis of 40% K10 wash water
effluent was greater than 99% during the first 20 hours of
ozonolysis and after 38 hours 80% of the ozone was being
utilised. The amount of ozone utilised was assessed every hour
during ozonolysis and the results of COD, TOC and wavelength
scans (Figures 68 and 69) are plotted against ozone utilised
rather than time. The COD value decreased rapidly with a slope
of -468.88 thus Ig of ozone removed 468.88mg of COD. However,
once 90% of the COD had been removed the the rate of COD
removal dropped to reach a value of 29.81mg of COD removed per
gramme of ozone applied. If both lines are extrapolated they
intersect at 165mg/l and this point could be taken as the COD
value at which ozonolysis was no longer efficient at removing

(0
00•
(D
H- Q(T) rta H-
o3
oHi
n oD
3a
o o
CD
(D OT
(D
oN O3(D
u oEH
Q O 0
3000 -
2000 -
1000 -
0
Regression Analysis
- TOCr 0.9951 Slope -165.0 Intersect 2405.8 Observations 38
- CODr 0.9989 Slope -468.9 Intersect 3274.0 Observations 23
- CODr 0.9910 Slope -29.8 Intersect 362.8 Observations 8
TOC
COD
Ozone Applied (mg/1 effluent)

1.0 -,
H- vQe n
(D
<y> vo
P
trCOo
3 O (T)
en
oN O3n>
COin r>•dc
o in<N
(1) O C
0.5 -
H- (D
0
Regression Analysis
250nmr 0.9959 Slope -0.134 Intersect 0.862 Observations 12
r 2.0
- 1.0
e co o eg0) Oc
Oina
D 200
O 250
A 358
o0
Ozone Applied (mg/1 effluent)

- 135 -
COD. However, ozone was still being utilised, and even at the
end of this ozonolysis assessment, 80% of the ozone applied
did not leave the contactor. Examination of the TOC analysis
results shows a continuous removal of carbon throughout the
ozonolysis period at a rate of 164.95g carbon removed per
gramme of ozone applied, probably as carbon dioxide. Since the
TOC removal rate did not decrease as dramatically as the COD
analysis, it would imply that the ozone continued to oxidise
compounds which were not available to the COD analysis
procedure.
Figure 70 shows the relative reduction in COD, TOC and
absorbance at 250nm against the amount of ozone utilised. The
calculation of the sample correlation coefficients (r) show
virtually linear relationships of these parameters with ozone
applied (the minimum value of r is equal to 0.9951 for the TOC
analysis (very significant indeed)). Since the correlations
between the values of TOC, COD and absorbance at 250nm and the
ozone applied decrease linearly it would therefore follow that
they also have a linear relationship one with an other. For
instance the relationship between relative change in
absorbance at 250nm and COD has a sample correlation
coefficient of 0.9979 (Figure 71). This therefore enables one
to monitor closely the way in which COD and TOC change during
ozonolysis merely by simple absorbance measurements.
The removal of colour was very rapid (Plate 14), as would
be expected, since colour is due to resonance of unsaturated

u oEH
Q O O
Oin(N
»- oo
- vo ^-P C 0)
a)
en
0)•H
a-Q)c oNo
x/x
Figure 70. The Reduction of COD, TOC and Absorbance, versus Ozone Applied, relative to the Initial Value prior to Ozonolysis

1.0 -
H- (D
^J
o o
N O
O 3
3 V
O
D)
H n
^< H-
CO
CO
H- O O H) O o D en o 3 O (D (D cn H-
3
I O in CM C o
in CN
0.5
-
0
Regression An
alys
is
r 0.9979
Slop
e 1.1056
Intersect
-0.0876
Observations
12
00.
5
COD/COD
1.0

Pla^
te
14.
Col
our
reduct
ion d
uorln
g th
e cw
zrou
ioly
sis
of 4
0% K
10 w
aste
wat
^r e
fflu
ent.

- 136 -
bonds which ozone preferentially attacks. The decrease in
absorbance at 250nm was somewhat slower since this reflected
the total number of unsaturated bonds which still remained
after the colour-forming resonating bonds had been disrupted.
In contrast, the absorbance at 200nm increased during
ozonolysis, probably due to the production of organic acids
which form when aromatics are broken down by ozone (Sections
1.4.6.3 and 1.4.6.8).
The increase in compounds which absorbed light at 215nm
was observed using HPLC analysis (the shortest wavelength
possible for reliable analysis under the mobile phase
conditions) whilst at 260 (unsaturated bonds) and 350nm
(orange colouration) almost all peaks were reduced
substantially in terms of height and area during ozonolysis.
Figures 72a to 74b and 75 to 77 show the HPLC results for the
start, middle and end of the ozonolysis of 40% K10 wash water
effluent at 260 and 215nm respectively (all results Appendix
5). Peaks which absorbed light at 350nm (and therefore orange
coloured) are shown in Figure 78.
The peaks which eluted rapidly are considered to be
organic acids which increase in concentration during
ozonolysis. They absorb light at 215nm more strongly than at
260nm and have a retention time of less than two minutes. This
further confirms their identity since under the conditions
utilised (Section 4.3.3) these compounds would need to be
highly polar to elute rapidly, and organic acids are highly
polar compounds.

n>
to
O fo s:ID >W 3ET Q)
ft H- (D W
W (D M> W
C rt (D W3ft M)
^I O
Ul fto yD (D
oNo
H-w
9-OO
e oo
Column Mobile Phase
Wavelength Ozone Applied
C n 0 Reverse Phase_Lo
Water to Acetonitrile (0.05% TFA)250nmO.Og/1 effluent
oo
C O •H
4-> O 0)
O Q
o o -—
3 OO
too
3 OO
2 OO I I I I I I I I I ' I I I
Time (min)

papuedxa)
uiuo
sz
- jo STsAiouozo
OTM
uioaj
Deflection (mV)
N 0 0
N N 0
N 0) 0
N (D 0
i i
i i
i
(I) 0 0
(p N 0
_L_L
I i
I i
i I
I I
ui * 0
u -
a> -
»-3
H- 3 (D
u) .
N _!
N _
0) .
N _
(I .
N _
N _
(D .
Of
ll-l
(D

Q) -P
W
-H<d
c43
OQ)0)
U ^
W
<
<
0) O
EH>
-P
0) oV»
p^ ^ in o o
•PcQ)(1)CO Oin
CO 4-» •
O
CMH
(d o
inUC6
Q)in0)•H
O
Oo
s
CM COTJ0)•H
£
<3 0)rH
Q
)Q)
C>
O
<d N
!5 O
i
0) (D<n
r t»NnN
I- A N
fTi i i •
!
Q 00)
00CD
0 0 N
n 6 tou r
n 0
n1-1(I)
0)e•H
- n
(AUI)
Figure 73a.
HPLC Analysis
Results from
the Ozonolysis
of 40%
K10 Wash
Water Effluent
- 250nm

papuedxa)
muos
z -
jo STsAiouozo
OTM
DldH *q
ez.
Defl
ecti
on (mV)
o 0
N N 0
N * 0ro G
0) 0 0
0) N c
u) -
3 (D
H
i I
II
1 I
I I
I !
1
N _
f N 1
ii* N :
Cl N _
N _
(I) _
(0 -!
« -I 4 -i
u) J
N J
0) ^
' '
I I'
I U
O
S3N
P>
O
<3
fl>
(D
M (D>
3
H-
(D
3
OO
Ocr
MH-
cH
3
(D 3
(A
(D
to —
3
oU
l O
0)
to
oUi
3
o
300 (D M
) M
) (D 3 rt
rt o
o o
(DcN
> (D
rt
<H
O
(0>
>
w^
O
(I) (D rt
hj
O H
- rt (D
0)
(fl
0)

OO
H-
C
(D
0)•
* ao tr1
o0) >W 33* £U
(u enft H-(D en
w n> M» wi-h CM Mc rt a> cn3 ft H>
I O 3
(J1 fto cr33
(D
O N O 3 O
WH- M
Oi-h
e oo
Column Mobile Phase
Wavelength Ozone Applied
OO
c o•H•P 0 0)
a)Q
6 OO
3 • O O ——
-* OCi
3 OO
C_ 0 Reverse Phaselo
Water to Acetonitrile (0.05% TFA)250nm8.4047g/l effluent
2 OO
Time (min)

papuedxa
) uiuosz
- jo
STsAjouozo
aoueqaosqv
OTH
sqin
san
Deflection (mV)
N 0 0
N N 0
N 0! 0(D o
(C 0 0
0) N 0
(I) * 0
I I
I I
I I
ILu_
(0 -
(0 -
(D
N H N tl' N U N _
N (D u) _
u)
O
3N
0)
O
<
3
(DCD
I-
1CD
H-
CD a oo
to Ul
^
o
O
3
CD C CD 3
3
OO
O
cr H
H-
cH
3
CD 3
tr 0)
CO 0
— 3
O
O O
J H
• rt
oo
O C
D<*»
rt
O
~ O CD rt
O 3 H
-ft H
- M
CD
CD
CD n to
CD CA
CD

i -»• 0 o
fD
^J Ul•
* aH T3o F
O
1200 ——
Column Mobile Phase
Wavelength Ozone Applied
C._ Reverse Phase_Lo
Water to Acetonitrile (0.05% TFA)215nmO.Og/1 effluent
1 O 00
o> enft H-(D W
whh H)
(D3 ft
I O3
H ft (J\ 3* 3 (D3
ON O3 O
Ot-h
O o\°
o-H-P O 0)
Q)Q
• O O
6 OO
OO
Z.- 00 |'''I'''I'''T
1 3 S T
T"
e
"T1"
i i 1 3 1 S
1 I ' ' ' I ' ' ' I ' ' ' I '
21 23 2S 2?"
1 I ' ' 'I
2 S 3 3S 3i 7* 3
Time (min)
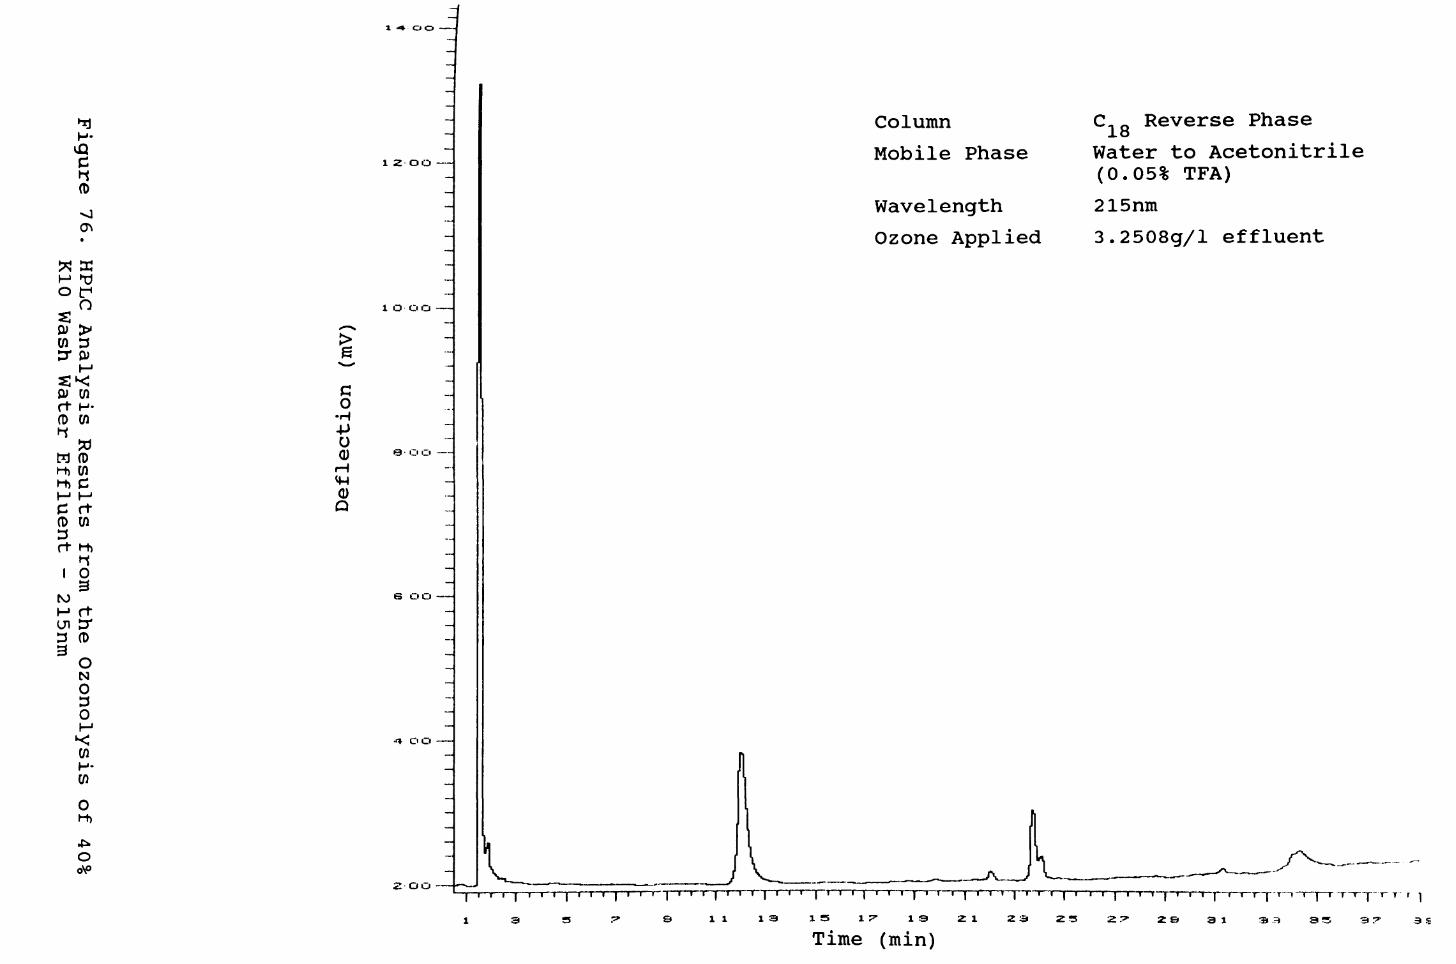
V.*
T)
0) W
ti
0)rH•H4->•Hc o
r^
a)0)
O
0)Q)
"n i i i M
il p
^
Q) O
EH>
-P
G) <^>
tf M inQ) 0
CO 4-) •
H
(0 OO
!2 ^
Q)U5P-i
C
Q)6
rH
S
-H
rH
,Qo
oo
s
r-j 1
X^
\&
*CO
| o
C in
in f>i
HCN r>73
-=dC
IQ)
^|•H
j
4-» ft
<0^
ftc
<c0H
Q) \
0) C
>
0(ti
N5
0
\
= _
__
_ J
i 1
I 1
1 1
1 1
00N
I 1
! I
! 1
! 1
j i
1 !
! 1
I •
! t
j i
1 !
! 1
! !
I I
j 1
! !
I 1
1 i
! I
J I
I I
I 1
1 1
i
W
•• iD
~
N
•
k~
N.•
10~
N-
'?)
~
N
•
rt
~ N
• ®
c*H
-H6.
s-'
: H a-
n -H
- I
EH
• (i)
~
rtH
"" H
- 0)
- 1)
- (I)
- "
0 0
0 0
00
0 0
0 0
6 d>
(o *
N
(AUI)
Figure 76.
HPLC Analysis
Results from
the Ozonolysis
of 40%
K10 Wash
Water Effluent
- 215nm

1 -»• OO
(D
1 2 OO
Column Mobile Phase
Wavelength Ozone Applied
C. 0 Reverse PhaseJ.O
Water to Acetonitrile (0.05% TFA)215nm9.3000g/l effluent
O fo 3JD >W 3 S3- 0)
ft H- (D W
W (DM» cnM» C M MC ftCD cn3 ft M)n i o
3N)
i o ao
o•H•P O 0)
0) Q
e oo -—
s oo
ON O
cnH-
zoo i—r ' ' | — — r T -T-| — | -J-- T--
11 13 17" I & 2 1 26 3 1 3 L-
Time (min)

0)
Q) -P
W
-Hto
c 43
OQ)0)
U ^
U) <3 <3
Q) O
EH
(I)
-P C
0)0)
>H in g
\
Q) O
C
U>CO 4->
• O
O
H rd o
in
O
!2 >-* r>
o
(0to43
C
0)g
rH
3
-HH
43
O
OCJ
S
4JCn0)rH
(1)
730)•H(1)C
O
<0
Ns
o
I !
I I
I I
I I
I M
I I
i I
I II
I I
I I
! I
I I
I I
I I
I I
I !
I I
I I
I I
I I
I I
I I
I i
I I
I I
I I
I !
I '
NNI)N(0 N0)-He
o oo o(i)
nn00N
U•ft
Q) g•H
(i)
(Am)
Figure 78.
HPLC Analysis
Results from
the Ozonolysis
of 40%
K10 Wash
Water Effluent
- 350nm

- 137 -
6.2.1 Ozonolysis Costing
The costs in terms of capital investment are discussed in
Section 1.4.6.9. From this cost assessment, one of the smaller
ozone generators capable of producing 72gO /h, would supply
sufficient ozone to treat the volume of K10 wash water
effluent which is anticipated to be produced per annum. This
unit would cost approximately £25,000 which includes an
ambient ozone monitor but not an ozone contactor. However,
once the capital costs of this treatment process have been met
then the only further expenditure is that of operating costs
for which electricity and maintainance are the main
considerations.
In Section 6.1.1 the volume of K10 wash water effluent2 was calculated to be 8.96m per annum. If ozone is applied to
a 40% K10 wash water effluent concentration until the COD
value is reduced to 165mg/l (the intersect of the lines from
the fast and slow COD removal rates (Figure 68)), then 6.6g of
ozone would have been utilised. This is equivalent to 16.5g of
ozone per litre of undiluted K10 wash water effluent. However,
if the COD was to have been reduced to less than 75mg/l then
9.7g of ozone would have been utilised, equivalent to 24.4g
per litre of undiluted K10 wash water effluent.
The size and type of ozone generator utilised has a very
significant bearing on the cost of ozone gas production. Large
generators can produce 50g of ozone, from air, using one kWh

- 138 -
of electricity (Appendix 1) while Rice et al. (1981) claim
an ozone generating plant in Indianapolis to be capable of
producing almost 80g of ozone from air using only one kWh of
electricity. With smaller generators this output value may be
less than lOg. However, Anderson (1989) stated that 33g of
ozone per kWh can be used as a reasonable value for ozone
production in terms of energy requirements. Using this value
the electricity requirement to treat K10 wash water effluent
calculated from experiments at 40% concentration and
extrapolated to undiluted waste would be from 0.5 to 0.74kWh
per litre of waste depending on the degree of treatment.
Since, from Section 6.1.1, the volume of K10 wash water3 effluent is expected to be 8.96m per annum, then, between
4480 and 6630kWh of electricity would be used, depending on
the degree of treatment. The cost of electricity at the Royal
Ordnance site is 4.46p per kWh. Thus the cost of electricity
for ozonolysis of K10 wash water effluent ranges from £199.80
per annum for lower level treatment to £295.70 for a higher
degree of treatment.

- 139 -
6.2.2 Summary
Ozonolysis is a very effective and efficient treatment
process for K10 wash water effluent. The COD value can be
reduced by over 95% and the orange colouration of the waste
can be removed completely. In fact, no colour was visible to
the naked eye after 24 hours of ozonolysis of 40% K10 waste at
which stage over 350mg/l COD still remained. It is therefore
particularly effective in colour reduction since it disrupts
unsaturated bonds which are often the causative agent of
colour.
The use of absorbance measurements at 250nm for
monitoring of the ozonolysis treatment process would allow
for rapid estimation of the COD and TOC values.

- 140 -
6.3 OZONOLYSIS OF TNT RED WATER
From the literature, the ozonolysis of TNT red water and
associated effluents would not seem a plausible process
(Section 1.4.6.8). However, the amenability of K10 wash water
effluent to treatment by ozonolysis prompted an assessment of
TNT red water ozonolysis utilising the same conditions as for
the ozonolysis of 40% K10 wash water effluent.
The TNT red water sample was obtained from Royal
Ordnance, Bridgwater and had a COD of 3042mg/l. 36L of this
effluent was applied to the contactor and ozonised air was
applied at a rate of 8.5 1/min. The generator power setting
was 1.2A at an air pressure of 0.75 bar gauge. This gave a
mean ozone application rate of 9.35gO_/h.
The parameters monitored were those of absorbance at 200,
250 and 327nm, and the COD value. The ozone applied to and
leaving the contactor was also measured at one hour intervals
while TOC and HPLC analyses were not carried out. This was due
to the labour intensive nature of these analyses since the
ozonolysis of TNT red water is not directly relevant to this
research project.
The results are shown in Figures 79 (COD) and 80 (200,
250 and 327nm). The efficiency of the contacting process was
not as high as for ozonolysis of K10 wash water effluent.
Figure 81, a comparison of contactor efficiency between K10

3000 -H-
vQ C ^ (D
(D
o ftH- O 3
O OO
(D ^ COc enoN O
CPfiQ Ou
2000 -
1000 -
H- fD
Regression Analysis
CODr 0.9966 Slope -549.1 Intersect 3099.5 Observations 23
Ozone Applied (mg/1 effluent)

1.0 n
H-<S C n (D00o
H-3
W O
O (D
(D
w oNo3 (D
H-(D
e cCO
TJC rd
oinfNJ
Q) U C cd
0.5-
r 2.0 Regression Analysis
- 250r 0.9986 Slope -0.164 Intersect 0.777 Observations 12
D 200
O 250
A 327
-1.0
o oCN
(1) OC<a
o(Aa
Ozone Applied (mg/1 effluent)

w •^
O5
O
£ -P
Ow c<d a)
oH
0
O <H
H <H
O«
W
Q
0ooo
o0oo0
o0oooo0ooooooo0
D0
Q
o n
0
D0
DnanToo
^o-p<d!2TJQ)PHEHaEHnnnnnnn
nnn
nD
nn
n
1
0
_ o
«To0)g•H
EH
OH
- O
0
0in
auozo
Figure 81.
Contacting Efficiency
during the
Ozonolysis of
both K10
Wash Water
Effluent (40%)
and TNT
Red Water

- 141 -
wash water effluent and TNT red water treatments, shows that
after 22 hours of continuous operation the efficiency of the
contacting process was such that 75% of the ozone applied to
the TNT red water was not utilised and thus was present in the
contactor off gas. At this point the generator was shut down
since a fault had developed in the ambient ozone monitor and
the Author was not confident about the carrying of high levels
of ozone in the PVC contactor-to-ozone destructor pipe since
PVC can be attacked by ozone.
The inefficiency of the contactor for TNT red water
treatment is clearly due to the very low reaction rate between
ozone and TNT red water components. The contactor, however,
operated quite adequately for K10 wash water effluent under
the same conditions.
The low contactor efficiency did not cause deviation from
the predicted results of ozonolysis of TNT red water. The
reduction in COD versus the ozone applied was clearly linear
(correlation coefficient (r) of 0.9966 and that of absorbance
at 250nm was 0.9986). Absorbance measurements are thus
suitable for estimation of the residual COD during ozonolysis
as was found for the K10 waste treatment. Figure 82 shows the
relationship between absorbance decrease with the decrease in
COD value. The sample correlation coefficient was 0.9963 and
the slope 1.16. Thus the absorbance decreased at a faster rate
than COD (as was found with K10 wash water effluent where the
slope was 1.11).

H- vQCn(D 00NJ
1.0 n
O
O ON OO 33 'C O P
co en H-O w 3o oi-h M>
^ O25 O^ 0
o in(N\o If)CN
0.5 -
Regression Analysis
r 0.9963 Slope 1.1558 Intersect -0.1887 Observations 12
(D 3a22 >o> Erft CO (D O
3o(D
(0 CO
00 0.5
COD/COD
1.0

- 142 -
Suprisingly, it was found that the amount of COD removal
per gramme of ozone applied was higher for TNT red water than
for K10 wash water effluent. One gramme of ozone removed 549mg
of COD as compared to 469mg for K10 wash water effluent. The
extent to which COD can be removed from TNT red water by ozone
cannot be derived from this experiment since insufficient
ozone was applied. The use of lower ozonised air flow rates to
the contactor would probably improve the ozone utilisation
since this would increase the contact time and thus assist the
reaction rate limitation problem. It is clear that the
possibility of using ozone to treat Royal Ordnance TNT red
water should not be completely discounted.
The relative rate of colour removal was, as with K10
wash water effluent, much more rapid than for the other
parameters monitored and absorbance at 200nm increased,
probably due to organic acid production.
Further investigation of TNT red water ozonolysis was not
possible since only a small quantity of red water was obtained
and, in any case, this assessment was only of incidental
interest and is not directly part of this research project.
However, the ozonolysis of TNT red water may well be a
feasible process and further investigation is recommended.

- 143 -
6.4 BIOLOGICAL TREATMENT OF POST-OZONOLYSIS K10 EFFLUENT
As the reader will recall, the destruction of K10 wash
water effluent components using ozone was expected to yield
organic acids. Such compounds should be readily assimilated by
microorganisms via the glyoxylate shunt pathway. Organisms
which are metabolising phenol as a carbon source will have an
operative glyoxylate shunt mechanism.
After adding mineral salts to the post-ozonolysis K10
wash water effluent it was fed to an activated sludge plant
which had previously been metabolising phenol. Unfortunately,
due to the high efficiency of the ozonolysis treatment, the
waste did not contain sufficient oxidisable material for
successful treatment (COD value <75mg/l). This resulted in the
loss of the sludge from the reactor.
Shake flask experiments were thus devised in which
the samples taken towards the end of the ozonolsis
experimentation (30 to 38 hours) were mixed together. The COD
of this mixture was 105mg/l. This was then concentrated
further by rotary evaporation to a COD value of 226mg/l.
Absorbance scans were also carried out on the samples before
and after evaporation. The flasks were to be inoculated with
phenol degrading activated sludge which had been freeze-dried.
However, reactivation of this sludge using 400mg/l phenol
solution supplemented with mineral salts as for medium 2.2.3
was unsuccessful. This was suprising since previously the

- 144 -
sludge had been reactivated successfully although it had now
been stored, in a freezer, for a period of two and a half
years and the last reactivation of a sample of this sludge had
been after one year of storage. Thus another source of
organisms had to be found. It was decided to inoculate using
activated sludge which was not adapted to the metabolism of
phenol to which a phenol degrading Pseusomonas sp. had been
added. This pseudomonad had been isolated by Dosanjh (1985)
and stored since this time (over 5 years) on a nutrient agar
slope at 5 C and was successfully reactivated in a phenol
based medium.
After inoculation of the flasks, absorbance at 203nm
decreased by over 10% within 24 hours and continued to
decrease by various amounts until it reached a value of only
44% of the original absorbance. Although inorganic salts added
to the medium did not cause an increase in absorbance, as
found from the control flask (sludge plus mineral salts), the
post-ozonolysis waste did contain over 3g/l of residue after
evaporation of the water. These salts may have contributed to
the absorbance value at 203nm, but this was not investigated
further.
Microorganisms clearly grew in this concentrated
post-ozonolysis effluent since absorbance at 650nm increased
from a starting value of 0.345 to a final value of 1.05. At
the same time, the COD value decreased from the starting value
of 226mg/l to 82mg/l (the limit of the COD analysis range).

- 145 -
Thus metabolism of post-ozonolysis effluent is clearly a
viable proposition and the discharge of the post-ozonolysis
effluent to receiving waters would not have any lasting
detrimental effect. The components of the waste would be
readily metabolised by activated sludge organisms at a sewage
treatment works since the glyoxylate shunt mechanism is
utilised in the metabolism of a wide range of compounds and so
no further treatment of this effluent would be necessary.
Overall, this treatment is effective, producing an
effluent from ozonolysis which is readily biodegradable, and
could be dealt with in a standard treatment plant. As there is
no doubt that K10 wash water effluent is treatable, the
process can now be run without fear of environmental damage
from this cause.

- 146 -
6.5 SUMMARY OF OZONOLYSIS
Ozone readily attacks both K10 wash water effluent and
TNT red water although more slowly for the latter. In both
cases the absorbance (250nm) correlates with the COD and also
for TOG in the case of K10 wash water effluent treatment (no
TOC was measured in TNT red water treatment). These
correlations allow rapid estimation of the COD and TOC
parameters which are labour intensive from simple absorbance
measurements.
The ozone oxidises unsaturated bonds at a rate almost
equal to the relative rate of COD removal for both wastes and
in the case of K10, the carbon level continued to decrease at
a constant rate even when the COD and absorbance at 250nm had
been entirely removed.
The "add nothing" feature of the ozonolysis process in
combination with the strong oxidising ability of ozone forms
an attractive combination for wastewater treatment. In the
case of K10 wash water effluent the post-ozonolysis liquor is
clearly metabolised by microorganisms and thus can be
discharged to local sewage treatment works where complete
metabolism should occur.
Clearly ozonolysis has been very successful in the
treatment of K10 wash water effluent. Literature reports are
less encouraging for TNT effluent, but the red water in this

- 147 -
study was degraded by ozone, and the ratio between ozone
applied and COD reduction was comparable with K10 wash water
effluent. These results would suggest that the limited success
of work reported in the literature is due to the
inefficiencies in contactor design and operation. This process
evidently merits reinvestigation.

- 148 -
CHAPTER 7
DISCUSSION, CONCLUSIONS AND RECOMMENDATIONS
7.1 DISCUSSION AND CONCLUSIONS
An initial assessment of the toxicity of K10 wash water
effluent showed that in shake flask experiments the waste was
toxic to many of the microorganisms present in activated
sludge. However, this was somewhat reduced in the activated
sludge plants. Many wastes can be treated successfully in
continuous stirred reactor systems (Smith et al., 1982 and
Nay et al., 1974) due to the dilution factor inherent in
this equipment, since organisms continually metabolise
compounds within the reactor. Thus, provided there is some
degree of mixing, the concentration of these compounds is
lower within the reactor than in the incoming effluent. This
of course does not occur in shake flasks and also if the
compounds in question cannot be metabolised by the
microorganisms within the continuous stirred reactor system.
The latter was the case for K10 wash water effluent treatment
as HPLC analysis revealed no detectable change in the
concentration of coloured components after biological
treatment although there was a reduction in the compounds
which were not colour forming.
A further reason for the tolerance of the activated
sludge microorganisms is possibly the nature of continuous
stirred reactor systems which have a sludge recycle. Sludge

- 149 -
recycle per se allows for the selection and adaptation of
microorganisms and therefore the few higher organisms present
which were relatively more resistant to the action of the K10
wash water effluent would be able to survive and proliferate:
they would not, of course, be able to do this in the shake
flasks.
The failure of biological systems to degrade the coloured
components of K10 wash water effluent coupled with its
toxicity at elevated concentrations has shown that treatment
of this waste using a biological process is likely to be
unsuccessful. That is not to say that biological treatment of
this waste is impossible, rather that suitable degrading
organisms were not isolated or adapted to the treatment of
this waste after prolonged experimentation. Suitable organisms
which might be capable of metabolising such compounds may
currently exist within the environment; the problem is finding
them.
The lack of success of biological treatment ties in with
treatment studies on the analogous TNT red water which has
been widely investigated (Carpenter et al., 1978; Hallas
and Alexander, 1983; Kaplan and Kaplan, 1982b and Won et
al., 1974 and 1976). The general opinion is that TNT red
water is difficult, if not impossible, to degrade completely
by biological means. Correlation of chemical structure with
microbial degradation rate (Fitter, 1985) further confirms
that TNT red water, and therefore , by analogy, also K10 wash

- 150 -
water effluent, should be difficult to degrade since the
enzymatic attack of the aromatic nucleus is electrophilic in
character and electron withdrawing substituent groups of the
type known to be present in these effluents will make the
nucleus more resistant to enzyme attack. Electron withdrawing
groups such as nitro and chloro, and also amino, are often
found in the explosives industry and make treatment of such
effluents difficult or impossible.
The rate of oxygen utilisation by activated sludge
organisms either previously exposed or unexposed to K10 wash
water effluent in response to various concentrations of K10
wash water effluent prompted further investigation. This was
because organisms which had never been exposed to K10 wash
water effluent had a higher oxygen uptake rate when mixed with
the waste than organisms which had been exposed to K10 wash
water effluent for a period of several months and which were
similarly treated. This is contrary to what would have been
expected. Further examination of this situation revealed that
K10 wash water effluent was able to dissipate electro-chemical
membrane potential and thus was an oxidative phosphorylation
uncoupling agent. The uncoupling action was also unusual since
it was biphasic in that most of the uncoupling effect occurred
within one tenth of a second after a membrane potential had
been created, after which the dissipation rate assumed a value
equivalent to the control sample. Hypotheses for this effect
were postulated but were rejected after further
experimentation and further theories to explain this unusual

- 151 -
action have been elusive.
Electro-chemical membrane dissipation experiments were
also carried out on the analogous red water which also
demonstrated the ability dissipate membrane potential. In this
instance the behaviour was similar to a classical uncoupling
agent such as dinitrophenol (Lehninger, 1977) or FCCP
(Nicholls, 1982) in that the membrane potential was dissipated
at a rate which gave a straight line on a log plot, the
gradient of which was dependent on the concentration of the
waste. However, this experiment does not show whether TNT can
uncouple oxidative phosphorylation, by dissipation of membrane
potential, when presented to microorganisms. In order to
uncouple, the component or components of the TNT red water
responsible would need to be able to access the cell membrane.
Studies between adapted and unadapted organisms were not
possible since insufficient TNT red water had been obtained.
The use of activated carbon as a single treatment for K10
wash water effluent is most certainly a feasible process.
However, the carbon loading capacity was not very high and
200g of carbon is necessary per litre of waste. In the
analogous TNT red water treatment, spent carbon is discarded
and this would also be likely to be the case for K10 wash
water effluent treatment. Thus carbon would be a recurrent
expenditure costing in excess of £5000 per annum and
additional costs will be incurred for the disposal of the
spent carbon.

- 152 -
The use of ozone for the treatment of K10 wash water
effluent was also successful. Ozone removed all of the orange
coloration from the waste and also oxidised unsaturated bonds
since absorbance at 250nm was also removed; thus the waste was
no longer aromatic. The COD value of the waste was also
significantly removed (over 95%) and so was carbon (over 60%).
The carbon was probably converted to carbon dioxide since the
only means by which carbon could leave the reactor was as a
gas. In contrast the absorbance at 215nm increased during
ozonolysis and this absorbing material eluted very rapidly
during HPLC analysis either with or just behind the solvent
front. Under the analysis conditions such compounds would have
to be extremely polar in character and are most likely to be
organic acids such oxalic, formic and glyoxylic acids. These
were identified by Caprio et al. (1984) after the
ozonolysis of nitrobenzene. Organic acids are readily
metabolised by microorganisms but attempts to treat these
using a conventional activated sludge plant was unsuccessful
since the loss of organisms from the reactor was greater than
the rate at which they could grow on this substrate. This was
attributed to the very low amount of oxidisable material
remaining after treatment since the COD value was only 74mg/l.
However, after concentration of post-ozonolysis K10 wash water
effluent, biological treatment using shake flasks, inoculated
with activated sludge containing a phenol degrading
Pseudomonas sp. f was very successful. Thus discharge of
post-ozonolysis K10 wash water effluent to receiving waters

- 153 -
would not have any detrimental effect since the waste is no
longer toxic and it does not contain sufficient oxidisable
material to cause serious anoxic effects.
Since the absorbance, COD and TOC values all decreased
with a virtually linear relationship with ozone applied, it
follows that they will have a linear relationship with one
another. Thus absorbance measurements could be used as a rapid
estimate of COD and TOC values during treatment, therefore
eliminating the need to perform difficult and time consuming
analyses.
Ozonolysis is environmentally far sounder than the
activated carbon process and treatment costs in terms of
electricity to drive the ozone generator are less than £300
per annum; much lower than for activated carbon treatment
although capital expenditure will be much higher.
Nevertheless, this is clearly the most suitable treatment
process for K10 wash water effluent.
Ozonolysis was also carried out on the analogous TNT red
water. The COD value decreased at a rate higher than that in
the K10 wash water effluent assessment with the amount of
ozone applied. However, the reaction rate between ozone and
TNT red water components was lower than for K10 wash water
effluent, and ozone was present in the contactor off gas. For
safety reasons, the assessment had to be terminated when 75%
of the ozone applied was no longer utilised. Thus assessment

- 154 -
of TNT red water was incomplete and sufficient red water was
not available to reassess this treatment process. Essentially
a change in conditions to longer contact times would have
improved the results. Nevertheless, the colour of the waste
was substantially reduced as was the absorbance at 250nm and
also the COD value. Once again the absorbance and the COD
value had a virtually linear relationship with ozone applied
and thus with one another meaning that absorbance measurements
can be used to estimate the remaining COD during treatment.
It is the author's opinion that the ozone contacting
devices used in work reported in the literature on TNT
effluent were not particularly efficient. In particular they
were often far too small for adequate contacting to occur (see
Section 1.4.6). The actual ozone utilisation efficiency in
terms of ozone applied with COD removal for the TNT effluent
treatment was comparable with that of K10 wash water effluent
under similar conditions. It is clear, therefore, that
treatment of TNT red water by ozonolysis could well also be a
viable proposition.

- 155 -
7.2 RECOMMENDATIONS
Ozonolysis should be used for the treatment of K10 wash
water effluent. The degree of ozonolysis required will depend
on the levels of COD, BOD and TOC that can be discharged and
is dependent on the local water authority regulations. No
post-ozonolysis biological treatment is necessary on site,by
since the compounds can be readily metabolised /bacteria
present in activated sludge.
However, if biological treatment of the post-ozonolysis
waste is to be carried out then a suitable phenol degrading
Pseudomonas sp. could be stored for many years on nutrient
agar slopes and reactivated using a phenolic based medium.
These organisms could then be added to activated sludge and
thus reduce the period required for organisms to be adapted
and selected for this treatment process.
Further work on ozonation of the analogous TNT red water
is required with particular attention to the contacting
process such that an extended contact time is utilised. The
treatment of such an effluent after ozonolysis is likely to be
similar to that for the K10 wash water effluent situation.
Finally, it would be of interest, now that suitable HPLC
analysis conditions have been devised, to isolate the
component or components responsible for the uncoupling of
oxidative phosphorylation. Such a substance may, due to its
novel mode of action, have potential uses within the field of
biochemistry and thus be of marketable value.

- 156 -
CHAPTER 8
REFERENCES
Alexander, M.Biodegradation: Problems of Molecular Recalcitrance and MicrobialFallibilityAdv. Appl. Microbiol. (1965) 7, 35-80
Alexander, M.Biodegradation of Chemicals of Environmental ConcernScience (1981) 211, 132-138
Alexander, M.Biodegradation of Organic ChemicalsEnviron. Sci. Technol. (1985) 19, No.2, 106-111
Anderson, G. K., Saw, C. B. and Howarth, C. R. Ozonolysis of Wastewaters using a Spinning Disc Reactor 39th Industrial Waste Conference (1984) 163-172 Purdue University, USA.
Anderson, R.Personal Communication (1989)Ozotech Ltd., 116 Station Road, Burgess Hill, Sussex
Anon."Chemical Oxygen Demand (Dichromate Value)" (1977)Her Majesty's Stationary Office (HMSO), London
Anon.Ozone: Health Hazards and Precautionary Methods.HMSO., Environmental Hygiene Series EH38 (1983) July
Anon.In "Standard Methods for Examination of Water and Wastewater" (1985) 16th Ed., American Public Health Association (APHA); American Water Works Association (AWWA); Water Pollution Control Federation (WPCF)
Anon."Chemical Oxygen Demand" (1986) 2nd Ed.Her Majesty's Stationary Office (HMSO), Oxford
Arden, E. and Lockett, W. T.Experiments on the Oxidation of Sewage without the aid of FiltersJ. Soc. Chem. Ind. London (1914) 33, 523-539
Augustine, R. L.Catalytic Hydrogenation of alpha and beta unsaturated Ketones. TheEffect of Quantity and Type of Catalyst.J. Org. Chem. (1963) 28, 152-155
Bailey, P. S."Ozonation in Organic Chemistry" (1978) Volume 1Academic Press, N.Y., USA.

- 157 -
Bailey, P. S."Ozonation in Organic Chemistry" (1982) Volume 2Academic Press, N.Y., USA.
Bailey, P. S., Bath, S. S. and Ashton, J. B.Initial Attack of Ozone on an Unsaturated SystemOzone Chemistry and Technology: Advances in Chemistry Series No. 21(1959) 143-148
Baker, R. A.In "Ecological Aspects of Used Water Treatment" (1975) 375-392Ed. Curds, C. R. and Hawkes, H. A.Academic Press, London
Barberis, K. and Howarth, C. R.The Ozonolysis of Low, Moderate and Highly Reactive Pollutants usinga Perforated Spinning DiscInternational Ozone Association, London Conference (1988)
Bartha, R. and Pramer, D.Metabolism of Acyclanilide HerbicidesAdv. Appl. Microbiol. (1970) 13, 317-341
Besselierre, E. B. and Schwartz, M.In "The Treatment of Industrial Wastes" (1976) 2nd EditionMcGraw-Hill Book Company, USA.
Brabets, R. I. and Marks, G. E. Ozonolysis of Pink Water IITRI Report No. C6275 (1974)
Braun, K. and Gibson, D. T.Anaerobic Degradation of 2-Aminobenzoate (Anthranilic Acid) byDenitrifying BacteriaAppl. Environ. Microbiol. (1984) 48, No.l, 102-107
Brown, D. and Laboureur, P.The Aerobic Biodegradability of Primary Aromatic AminesChemosphere (1983) 12, No.3, 405-414
Bull, A. T.Biodegradation: Some Attitudes and Strategies of Microorganisms andMicrobiologistsIn "Contemporary Microbiology" (1980) 107-136Ed. Ellwood, Hedger, Latham, Lynch and Slater
Burns, D. E. and Shell, G. L.Carbon Treatment of a Municipal WastewaterJournal WPCF (1974) 46, No 1, 148-164
Callely, A. G., Forster, C. F. and Stafford, D. A. (Editors) In "Treatment of Industrial Effluents" (1977) Hodder and Stoughton, London

- 158 -
Campbell, R.In "Basic Microbiology" (1966) Vol. 5Ed. Wilkinson, J. F.John Wiley and Sons, N.Y., USA.
Caprio, V., Insola, A. and Volpicelli, G. Ozonation of Aqueous Solutions of Nitrobenzene Ozone: Science and Engineering (1984) 6, 115-121 Pergamon Press Ltd., USA.
Carpenter, D. F., McCormick, N. G., Cornell, J. H. and Kaplan, A. M. Microbial Transformation of 14C Labelled 2,4,6-Trinitrotoluene in an Activated Sludge System Appl. Environ. Microbiol. (1978) 35, No.5, 949-954
Channon, H. J., Mills, G. T. and Williams, R. T. The Metabolism of 2,4,6-Trinitrotoluene (TNT) Biochem. Journ. (1944) 38, 70-85
Chaudhuri, N., Englebrecht, R. S. and Austin, J. H. J. Am. Wat. Wks. Ass. (1965) 57, 1561
Cooper, J. C. and Hager, D. G.Water reclamation with activated carbonChem. Eng. Progr. (1966) 62, 85-90
Curds, C. R.In "Ecological Aspects of Used Water Treatment" (1975)Vol. 1, 203-268Ed. Curds and HawkesAcademic Press, London
Dagley, S.Microbial Degradation of Aromatic CompoundsDev. Indust. Microbiol. (1983) 25, 53-68
De Renzo, D. J.Unit Operations for the Treatment of Hazardous Industrial Wastes(1978)Pollution and Technology Review, No.47, Noyes Data Corp., N.Y.
Dosanjh, M. K.Ph.D. Thesis (1985)Chemical Engineering, University of Birmingham
Duguet, J. P., Anselme, C., Mazounie, P. and Mallevialle, J. Application of Combined Ozone/Hydrogen Peroxide for the Removal of Aromatic Compounds from a Groundwater International Ozone Association, London Conference (1988)
Dutton, P. L. and Evans, W. C.The Photometabolism of Benzoic Acid by Rhodopseudomonas palustris:A New Pathway of Aromatic Ring MetabolismBiochem. J. (1968) 109, 5P

- 159 -
Eckenfelder, W. W.Principles of Water Quality Management (1980)CBI Publishing Company, USA.
Evans, G. O. and Hyatt, K. H*Bull. Br. Mus. nat. Hist, zool (1960) 6 (2), 27-101
Evans, W. C.The Microbial Degradation of Aromatic CompoundsJ. Gen. Microbiol. (1963) 32, 177-184
Evans, W. C.Biochemistry of the Bacterial Catabolism of Aromatic Compounds inAnaerobic EnvironmentsNature (1977) 270, 17-22
Faber, M. D.Microbial Degradation of Recalcitrant Compounds and SyntheticAromatic PolymersEnzyme Microb. Technol. (1979) 1, No.10, 226-232
Farmer, E. H. and Galley, R. A. E.Catalytic Hydrogenation of Olefinic CompoundsNature (1933) 131, 60
Fewson, C. A.In "Microbial Degradation of Xenobiotics and Recalcitrant Compounds"(1981) 141-179Ed. Leisinger, Cook, Hutter and NueschAcademic Press, London
Fochtman, E. G- and Huff, J. E.Ozone-Ultraviolet Light Treatment of TNT WastewatersProc. Sec. Intl. Symp. on Ozone Technology (1975) 211-223Montreal
Forster, C. F."Biotechnology and Wastewater Treatment" (1985)Cambridge University Press, London
Forster, C. F.In "Treatment of Industrial Effluents" (1977) 65-83Ed. Callely, Forster and StaffordHodder and Stoughton, London
Fox, J. (1989)Personal CommunicationBiochemistry, University of Birmingham
Gale, E. F.In "The Chemical Activities of Bacteria" (1947)Academic Press, N.Y.

- 160 -
Guittonneau, S., De Latt, J., Duguet, J. P., Bonnel, C. and Dore, M. Oxidation of Parachloronitrobenzene in Diluted Aqueous Solution by Ozone and UV and by Hydrogen Peroxide and UV: A Comparative Study International Ozone Association, London Conference (1988)
Hallas, A. E. and Alexander, M.Microbial Transformation of Nitroaromatic Compounds in SewageEffluentAppl. Environ. Microbiol. (1983) 45, No.4, 1234-1241
Hardisty, D. M. and Rosen, H. M.Industrial Wastewater Ozonation32nd Industrial Waste Conference (1977) 294-302Purdue University, USA.
Hemphill, L., Ramaiah, V. and Valentine, M. Thermal Regeneration of Activated Carbon 32nd Industrial Waste Conference (1977) 127-140 Purdue University, USA.
Holiday, A. D. and Hardin, D. P.Activated Carbon removes Pesticides from WastewaterChem. Eng. (1981), 88 (6), 88-89
Horvath, R. S.Microbial Co-Metabolism and the Degradation of Organic Compounds inNatureBact. Rev. (1972) 36, No.2, 146-155
Jackson, J. B.Personal Communication (1988)Biochemistry, University of Birmingham
Jones, M. K. and Jennelle, E. M. Water Resources Bulletin (1972) 8, 312
Kaplan, D. L. and Kaplan A. M.Composting Industrial Wastes - Biochemical ConsiderationBiocycle (1982a) May/June, 42-44
Kaplan, D. L. and Kaplan, A. M.2,4,6-Trinitrotoluene - Surfactant Complexes: Decomposition,Mutagenicity and Soil Leaching StudiesEnviron. Sci. Technol. (1982b) 16, No.9, 566-571
Kaplan, D. L. and Kaplan, A. M.US. Govt. Reps. (1984) AD-A135, 512/2
Kaufman, D. D., Plimmer, J. R. and Klingebiel, U. I.Journal of Agricultural and Food Chemistry (1973) 21, 127-132
Knackmuss, H-J.In "Microbial Degradation of Xenobiotics and Recalcitrant Compounds"(1981) 190-213FEMS Symposium No. 12

- 161 -
Kobayashi, H. and Rittmann, B. E.Microbial Removal of Hazardous Organic CompoundsEnviron. Sci. Technol. (1982) 16, No.3, 170A-183A
Koziorowski, B. and Kucharski, J.In "Industrial Waste Disposal" (1972)Pergamon Press, Oxford
Kul'skii, L. A. and Shabolina, A. G.Adsorption of DOT from colloidal solutions on the Iodine KADactivated carbonChem. Abstr. (1967) 67, No. 14686y
Kuo, C-J. and Sierka, R. A.Catalytic Oxidation of Munitions Wastewater 38th Industrial Waste Conference (1983) 377-385 Purdue University, USA.
Latorre, J., Reineke, W. and Knackmuss, H-J.Microbial Metabolism of Chloroanilines: Enhanced Evolution byGenetic ExchangeArch. Microbiol. (1984) 140, 159-165
Leh, F.Ozone. Properties, Toxicity and ApplicationsJournal of Chemical Education (1973) 50, 404-405
Lehninger, A. L."Biochemistry" (1977) 2nd EditionWorth Publishers, Inc., N.Y., USA.
Liu, D., Thomson, K. and Anderson, A. C.Identification of Nitroso Compounds from Biotransformation of2,4-DinitrotolueneAppl. Environ. Microbiol. (1984) 47, No.6, 1295-1298
Lyons, C. D. , Katz, S. and Bartha, R.Mechanisms and Pathways of Aniline Elimination from AquaticEnvironmentsAppl. Environ. Microbiol. (1984) 48, No.3, 491-496
March, J.In "Advanced Organic Chemistry" (1985) 3rd EditionA Wiley-Interscience Publication
Mason, H. S.Adv. Enzymol. (1957) 19, 79-223
McCormick, N. G-, Cornell, J. H. and Kaplan, A. M.Identification of Biotransformation Products from 2,4-DinitrotolueneAppl. Environ. Microbiol. (1978) 35, No.5, 945-948
McCormick, N. G., Feeherry, F. E. and Levinson, H. S.Microbial Transformation of 2,4,6-Trinitrotoluene and OtherNitroaromatic CompoundsAppl. Environ. Microbiol. (1976) 31, No.6, 949-958

- 162 -
Metzer, A. and Miyamoto, H. K.The Biotreatability of Industrial Dye Wastes Before and AfterOzonation and Hypochlorination - Dechlorination30th Industrial Waste Conference (1975) 804-815Purdue University, USA.
Mitchell, W. R. and Dennis, W. H.Biodegradation of 1,3-DinitrobenzeneJ. Environ. Sci. Health (1982) A17, 837-853
Montgomery, H. A. C.The Determination of Biochemical Oxygen Demand by RespirometricMethodsWater Research (1967) 1, 631-662
Nay, M. W., Randall, C. W. and King, P. H.Factors Affecting Colour Development during the Treatment of TNTWaste27th Industrial Waste Conference (1972) 983-993Purdue University, USA.
Nay, M. W., Randall, C. W. and King, P. H.Biological Treatability of Trinitrotoluene WastewaterJournal W.P.C.F. (1974) 46, No.3, 485-497
Nebel, C., Gottsching, R. D. and O'Neill, H. J."Ozone Decolourization of Pulp and Paper Mill Secondary EffluentsProc. First Intl. Sypm. of the Intl. Ozone InstitutionWashington D.C. December 2-5, 1973
Nemerow, N. L.In "Liquid Waste of Industry" (1971)Addison-Wesley Publishing Company, USA.
Nicholls, D. G. "Bioenergetics" (1982) Academic Press, London
Painter, H. A.BiodegradabilityProc. Royal Soc. London Series B (1974) 185, 149-158
Patterson, J. W., Shapira, N. I. and Brown, J. Pollution Abatement in the Military Explosives Industry 31st Industrial Wastewater Conference (1976) 385-395 Purdue University, USA.
Pereira, W. E., Short, D. C., Manigold, D. B. and Roscio, R. K. Bull. Environ. Contam. Toxicol. (1979) 21, 554-652
Pitter, P.Correlation of Microbial Degradation Rate with Chemical StructureActa Hydrochim. Hydrobiol. (1985) 13, No 4, 453-460

- 163 -
Rice, R. G., Robson, C. M., Miller, G. W. and Hill, A. G. Uses of Ozone in Drinking Water Treatment Journal A.W.W.A. (1981) 73, No.l, 44-57
Rylander, P. N.In "Catalytic Hydrogenation over Platinum Metals" (1967)Academic Press, N.Y., USA.
Saleh, F. Y., Lee, G. F. and Wolf, H. W.Selected Organic Pesticides; Behavior and Removal from DomesticWastewater by Chemical and Physical ProcessesWater Res. (1982) 16, 479-488
Saw, C. B., Anderson, G. K., Howarth, C. R. and Porter, J. E. Application of the Spinning Disc Reactor as an Ozone Contactor 40th Industrial Waste Conference (1985) 813-823 Purdue University, USA.
Sax, N. I.In "Dangerous Properties of Industrial Materials" (1963)Ed. Rheingold, N.Y., USA.
Sayler, G. S., Breen, A., Blackburn, J. W. and Yagi, O.Predictive Assessment of Priority Pollutant Bio-oxidation Kineticsin Activated SludgeEnviron. Progress (1984) 3, No.3, 153-163
Schulte, G. R., Hoehn, R. C. and Randall, C. W.The Treatability of a Munitions-Manufacturing Waste with ActivatedCarbon28th Industrial Waste Conference (1973) 150-162Purdue University, USA.
Shaw, J. A.Determination of Phenols in Aqueous Wastes from Coke PlantsAnalytical Chemistry (1951) 23, No.12, 1788-1792
Shelby, S. E., Lankford, P. W. and McCollum, R. W.A Case Study for the Treatment of an Explosives Wastewater from anArmy Ammunitions Plant39th Industrial Waste Conference (1984) 821-836Purdue University, USA.
Sierka, R. A.The High Temperature Treatment of Trinitrotoluene (TNT) andCyclotriraethylene-triamine (RDX) with Ozone and UltrasoundOzone: Science and Engineering (1985) 6, 275-290Pergamon Press Ltd., USA.
Slater, J. H. and Bull, A. T.Environmental Microbiology: BiodegradationPhil. Trans. Royal Soc. London B (1982) 297, 575-597

- 164 -
Smith, L. L., Carazza, J. and Wong, K.Biological Treatment for Waste Streams from Propellants andExplosives ManufacturingJ. Haz. Materials (1982) 5, 227-296
Sotelo, J. L.Application of Gas-Absorption Theories to 0-Cresol Ozonation inWaterInternational Ozone Associaion, London Conference (1988)
Spain, J. C. and Van Veld, P. A.Adaption of Natural Microbial Communities to Degradation ofXenobiotic Compounds: Effects of Concentration, Exposure Time,Inoculum and Chemical StructureAppl. Environ. Microbiol. (1983) 45, No.2, 428-435
Spanggord, R. J., Gibson, B. W., Keck, R. G., Thomas, D. W. andBarkley, J. J.Effluent Analysis of Wastewater Generated in the Manufacture of2,4,6-Trinitrotoluene. 1. Characterization StudyEnviron. Sci. Technol. (1982) 16, No.4, 229-232
Symons, J. M., McKinney, R.E., Smith, R. M. and Donovan, E. J.Degradation of Nitrogen-Containing Organic Compounds by ActivatedSludgeInt. J. Air and Water Poll. (1961) 4, 115-138
Tabak, H. H., Quave, S. A., Mashni, C. I. and Barth, E. F. Biodegradability studies with Organic Priority Pollutant Compounds Journal W.P.C.F. (1981) 53, No.10, 1503-1517
Wase, D. A. J.Personal Communication (1987)Chemical Engineering, University of Birmingham
Wheatstone, K. C.In "Treatment of Industrial Effluents" (1977) 30-65Ed. Callely, Forster and StaffordHodder and Stoughton, London
Won, W. D., DiSalvo, L. H. and NG, J.Toxicity and Mutagenicity of 2,4,6-Trinitrotoluene and its MicrobialMetabolitesAppl. Environ. Microbiol. (1976) 31, No.4, 576-580
Won, W. D., Heckley, R. J., Glover, D. J. and Hoffsommer, J. C. Metabolic Disposition of 2,4,6-Trinitrotoluene Appl. Microbiol. (1974) 27, No.3, 513-516
Wyman, J. F., Guard, H. E., Won, W. D. and Quay, J. H.Conversion of 2,4,6-Trinitrophenol to a Mutagen by PseudomonasaeruainosaAppl. Environ. Microbiol. (1979) 37, No.2, 222-226

ABBREVIATIONS
MNEB - Mononitoethylbenzene
DNEB - Dinitroethylbenzene
TNEB - Trinitroethylbenzene
K10 - A mixture of DNEB and TNEB
TNT - Trinitrotoluene
COD - Chemical Oxygen Demand
TOC - Total Organic Carbon
HPLC - High Performance Liquid Chromatography
FCCP - Carbonyl cyanide-E-trifluromethoxyphenol hydrazone

APPENDICES

APPENDIX 1

ZOTECHEngineers and suppliers
for ozone systemsOZOTECH LTD.116 STATION ROAD BURGESS HILL SUSSEX RH159EN ENGLAND
Telephone: (0444) 235411 Telex: 877919 Fax (0444)242187
Mr. I. Clarke,The University of Birmingham,School of Chemical Engineering,P.O. Box 363,BIRMINGHAM. B15 2TT
30th November, 1989
Ref. RA/CAW/1278
Dear lan,
RE. NITROBENZENE EFFLUENT
Following our telephone conversation of yesterday regarding costs, I trust the following will be useful.
The Bridgewater plant will only produce approximately 6m3 effluent per year.
I have assumed 4 batches x 1.5m3 that would be treated batchwise over several weeks, using an 18g/h ozoniser.
I would propose a packagesd plant consisting of:-
* Holding/Recirculation tank* Recirculation pump* Stainless steel contact columns
Compressor/Ozoniser Instrumentation
* All as a skid mounted package
Budget price £45,000 - £50,000
General Costs
It is very difficult to generalise on costs of ozonation of effluents because each will have a different ozone demand and flow rate. These two factors determine the capital cost of the ozone plant itself; however civil costs again will vary for each effluent according to contact time, flow variations etc.
Reg Office 116 Station Road Burgess Hill. Sussex RH15 9EN Reg in EngLun! 1 ,"

OZOTECH LTD.
University of Birmingham Page 2
1278/30. 1 1.89
The following are budget prices for packaged ozonisers with compressor and ozone ambient monitor, but excluding contacting etc.
g 0 3 /h £ kW Max
18 20,000 2.136 23,000 2.572 25,000 3.2160 35,000 8320 40,000 12450 45,000 16.4700 50,000 241080 75,000 38.61500 85,000 572000 95,000 682500 105,000 843000 115,000 105
Large scale plants would use low pressure drying systems which are far more energy efficient. For example a 3kg/h low pressure ozone stream would only require 60kW compared to 105kW for the high pressure one.
Best regards,
R. ANDERSON

APPENDIX 2
CHAPTER 2 RESULTS

Calibration curve for Total Organic Carbon (TOO
Total Carbon (mg/1) Deflection
5
10
15
25
50
75
100
150
200
250
8
9.5
13
20
38
58
73
104
133
155

Calibration curve for Total Organic Carbon (TOO
Inorganic Carbon (mg/1) Deflection
5 8
10
15
25
50
75
100
150
200
12
16
24
45
68
91
130
161

Calibration curve for Phenol
Phenol (mg/1) Absorbance (500nm)
12
3
4
5
6
7
8
9
10
0.14
0.27
0-40
0.54
0.67
0.80
0.94
1.07
1.20
1.33

APPENDIX 3
CHAPTER 3 RESULTS

Phenol Analysis (Section 3.5.1)
Date Day Experimental Reactor Control Reactor Feed Eff %Rem Feed Eff %Rem
Comments
09.02.8710.02.8711.02.8713.02.8716.02.8717.02.8718.02.8719.02.8720.02.8702.03.8703.03.8704.03.8705.03.8706.03.8709.03.8710.03.8713.03.8716.03.8718.03.8720.03.8723.03.8725.03.8727.03.8730.03.8701.04.8703.04.8706.04.8708.04.8710.04.8713.04.8714.04.8715.04.8716.04.8717.04.8720.04.8722.04.8724.04.8727.04.8729.04.8701.05.8704.05.8706.05.8708.05.8711.05.8713.05.8715.05.8718.05.8720.05.8722.05.8725.05.8726.05.8727.05.8728.05.8729.05.8701.06.8702.06.8703.06.8704.06.8705.06.87
1235891011122223242526293033363840434547505254575961646566676871737578808285878992949699101103106107108109110113114115116117
386417404375370368379381363392385392412317295356308314295365356404377366426398407307388351355371326299344287268304291273311302294286261294307328312507498602540573401373453409393
566573393632313416
4.04.25.95.26.08.64.31417211612
5.33.44.81.78.06.15.8117813012148442114
6.77.623
3.32.56.928901113305.9114959147126127415692149156
85.684.382.089.590.391.291.791.095.799.098.998.598.798.197.198.895.494.592.795.696.698.799.198.799.698.098.598.197.177.963.367.485.485.293.995.097.597.592.198.899.297.790.668.795.695.790.189.296.490.388.175.676.677.989.785.079.663.560.4
386417404375370368379381363392385392412317295356308314295365356404377366426398407307388351355371326299344287268304291273311302294286261294307328312507498602540573401373453409393
919881483217
9.1211423211420
7.64.78.91112
5.311
6.75.33.00.45.18.45.37.76.6828888395534362418
4.92.51.24.82497182927423073104118164237197189215219231
76.376.479.987.191.395.597.694.596.294.194.596.395.197.698.497.596.496.298.297.098.198.799.299.998.897.998.797.598.376.775.276.387.981.590.287.691.094.298.399.199.698.491.766.293.090.291.387.290.376.279.180.469.758.651.749.352.646.541.2
Power Fluctuations
Power Fluctuations Laboratory Move
New Feed Pump
2x Feed Conc'n
Con React pH 9

Phenol Analysis (Section 3.5.1)
Date Day Experimental Reactor Control Reactor Feed Eff %Rem Feed Eff %Rem
Comments
10.06.8711.06.8712.06.8715.06.8716.06.8717.06.8718.06.8719.06.8722.06.8723.06.8724.06.8726.06.8729.06.8730.06.8703.07.8706.07.8708.07.8710.07.8717.07.8722.07.8728.07.8704.08.8709.08.8716.08.8723.08.8731.08.8707.09.8708.09.8709.09.8710.09.8711.09.8716.09.8725.09.8705.10.8714.10.8726.10.8705.11.8711.11.8720.11.8730.11.8703.12.8717.12.8718.12.8722.12.8728.12.8704.01.8808.01.8815.01.8819.01.8825.01.8830.01.8805.02.8810.02.8826.02.8804.03.8811.03.88
122123124127128129130131134135136138141142145148150152159164170177182189196204211212213214215220229239248260270276285295298312313317323330335342346352357363368384391398
411450435438358437283292783831254246201194224289209179289357371329314293300300293264257257279386430453437442447416393431447393431308454424447462311455348407333429422496
194172164159109119633710
7.53.22.54.34.02.51.71.22.01.71.11.11.01.40.50.50.73.02.01.40.51.41.11.31.12.33.02371021.41.21.20.60.81.00.80.84.75.35.15.14.44.33.93.94.14.3
52.761.862.363.769.672.877.787.398.799.198.799.097.897.998.999.499.498.999.499.799.799.799.599.899.999.899.099.399.499.899.599.799.799.899.599.347.075.599.799.799.799.999.899.799.899.898.998.998.498.898.799.098.899.199.099.1
411450435438383457379454896897269284209224216289231299261379393321329314207279300300279257386442439438446442454454447477485370408308447424424477311432414400296437422551
2522812542532212062362362342301471421021072.71.01.22.27.97018616113623
4.54.84.33.83.23.23.40.71.0251733003432542410.61.51.00.40.20.60.24.24.04.54.23.33.93.75.04.45.2
38.737.641.642.242.354.937.748.073.974.445.550.251.252.398.799.799.599.396.981.652.749.958.992.697.898.398.698.898.898.899.199.899.894.261.232.124.644.146.199.999.799.799.999.999.910099.099.298.599.099.299.098.998.998.998.9
1% K10 to Exp React
Nitrogen Limitation?
Tri-ammon ortho phos
Air Pump Failure to Con React
2.5% K10 to Exp React
New MPW to Con React
New MPW to Exp React

Chemical Oxygen Demand Analysis (Section 3.5.2)
Date Day Experimental Reactor Control Reactor Feed Eff %Rem Feed Eff %Rem
Comments
13.02.8710.06.8711.06.8712.06.8715.06.8716.06.8717.06.8718.06.8719.06.8722.06.8723.06.8724.06.8726.06.8729.06.8730.06.8703.07.8706.07.8708.07.8710.07.8717.07.8722.07.8728.07.8704.08.8709.08.8716.08.8723.08.8731.08.8707.09.8708.09.8709.09.8710.09.8711.09.8716.09.8725.09.8705.10.8714.10.8726.10.8705.11.8711.11.8720.11.8730.11.8703.12.8717.12.8722.12.8728.12.8704.01.8808.01.8815.01.8819.01.8825.01.8830.01.8805.02.8710.02.88
5122123124127128129130131134135136138141142145148150152159164170177182189196204211212213214215220229239248260270276285295298312317323331335342346352357363368
389863844852805102110781059108310631083105499510931029989920103010301049128912891250121011611171130411761206104911471127137512711108125510201500142214471507150714721505141813701387150410371470129914401150
65404383344397416370317291228181194265186191207187196173196227250324251243255206213241239231251266300208294400996584299267315318278285223364266236260325320427
83.153.254.659.650.759.365.770.173.178.683.381.673.482.381.479.179.781.083.281.382.480.674.179.379.178.284.281.880.077.279.877.780.776.481.276.660.833.658.979.482.379.178.481.579.983.773.882.377.282.375.077.862.8
3898638448528057161059104010831063112210341054103410389609408959539921221127011231122112211021136149210281010912120613551236129113881353133313141608134713871317124212791240119113889321207125012601000
735275555315065615845995755915754844764454151631401571571573717036296073142152694272652002081961621773325259969884821959113115111013711512915110283594550
81.138.934.337.637.121.544.942.446.944.448.853.254.857.060.083.085.182.583.584.269.644.644.045.972.080.476.371.474.280.277.283.788.085.774.362.226.425.963.387.993.390.688.591.189.390.789.188.789.093.295.396.495.0
1% K10 to Exp React
Nitrogen Limitation?
Tri-ammon ortho phos
Air Pump Failure to Con React
2.5% K10 to Exp React
New MPU to Con React
New MPU to Exp React

Total Organic Carbon Analysis (Section 3.5.3)
Date Day Experimental Reactor Control Reactor Feed Eff %Rem Feed Eff %Rem
Comments
09.02.87 13.02.87 16.02.87 20.02.87 23.02.87 24.02.87 25.02.8726.02.8727.02.8702.03.8703.03.8704.03.8705.03.8706.03.8709.03.8716.03.8723.03.8730.03.8706.04.8713.04.8714.04.8715.04.8716.04.8717.04.8720.04.8727.04.8704.05.8711.05.8718.05.8725.05.8726.05.8727.05.8728.05.8729.05.8701.06.8702.06.8703.06.8704.06.8705.06.8710.06.8711.06.8712.06.8715.06.8716.06.8717.06.8718.06.8719.06.8722.06.8723.06.8724.06.8726.06.8729.06.8730.06.87
1 5 8 12 15 16 1718192223242526293643505764656667687178859299106107108109110113114115116117122123124127128129130131134135136138141142
259 264 283 298 274 293 281312338306316327340338301290287344361314336299304321337315341376334576597553581540529497510536519540483525499583539515577533571549592575677
151 140 62 91 106 88 9811910647525358717593758710715417315412395817410611898202207218207161171144154142154235225206219201183170140117131122132126123
41.6 47.1 78.2 69.4 61.3 70.1 65.062.068.684.683.583.782.979.075.268.173.774.770.451.048.548.459.470.375.976.569.068.670.765.065.460.664.370.167.771.069.873.570.456.553.460.856.165.566.067.075.778.177.177.877.778.181.8
259 264 283 298 274 293 281312338306316327340338301290287344361314336299304321337315341376334576597553581540529497510536519540483525499583549555535530539539499507642
160 139 46 64 64 84 66726364594185735762655466125156141999274749710982191209222231245288245303326303327313331291281275273275253250249245215215
38.3 46.9 83.7 78.4 76.5 71.4 76.376.981.479.081.287.475.178.381.078.677.584.381.860.253.752.967.471.378.176.471.571.075.366.865.059.860.354.745.650.840.539.141.739.435.237.041.751.849.950.848.652.353.653.850.957.666.5
Power Fluctuations
Power Fluctuations Laboratory Move
New Feed Pump
2x Feed Conc'n
Con React pH 9
1% K10 to Exp React
Nirogen Limitation?
Tri-ammon ortho phos

Total Organic Carbon Analysis (Section 3.5.3)
Date Day Experimental Reactor Control Reactor Feed Eff %Rem Feed Eff %Rem
Comments
03.07.8706.07.8708.07.8710.07.8717.07.8722.07.8728.07.8704.08.8709.08.8716.08.8723.08.8731.08.8707.09.8708.09.8709.09.8710.09.8711.09.8716.09.8725.09.8705.10.8714.10.8726.10.8705.11.8711.11.8720.11.8730.11.8703.12.8717.12.8722.12.8728.12.8704.01.8808.01.8815.01.8819.01.8825.01.8830.01.8805.02.8810.02.88
145148150152159164170177182189196204211212213214215220229239248260270276285295298312317323331335342346352357363368
556545577537571725371383367343396390337381384375365417426412429448457431427436469489408431395399412387430401423415
1131228993117106163190196169153131160149161153143182176197183234368250163168167184164166154161163151149160184162
79.777.684.682.779.585.456.150.446.650.761.466.452.560.958.159.260.856.458.752.257.347.819.542.061.861.564.462.459.861.561.059.660.461.065.360.156.561.0
592535561561555711383353379378382363350319317299402409392415401429404378387362391371362378340367351404391395372359
857572
103871892092282271591381691721431311361331431361671943203271991541231041181051159211710710597135124113
85.686.087.281.284.373.445.435.440.157.963.953.450.955.258.754.566.965.065.359.851.625.419.147.460.266.073.468.271.069.672.968.169.574.075.265.866.768.5
Air Pump Failure to Con React
2.5% K10 to Exp React
New MPW to Con React
New MPW to Exp React

2L Pilot Reactor Analysis (Section 3.6)
Date Day Phenol AssayFeed Eff %Rem
COD Analysis Feed Eff %Rem
Comments
21.12.8722.12.8728.12.8704.01.8808.01.8815.01.8818.01.8819.01.8820.01.8821.01.8824.01.8825.01.8830.01.8805.02.8810.02.8826.02.8803.03.8804.03.8807.03.8811.03.8815.03.8818.03.8821.03.8824.03.8828.03.88
3410172128313233343738434954707677808488919497101
477477501493470470409523515515530508469466266403455355371385...............
2893083.94.85.95.96.36.44.03.24.04.73.02.62.42.43.03.54.14.4...............
39.535.599.299.098.798.798.598.899.299.499.399.199.499.499.199.499.399.098.998.8...............
1544156416131593158316281458144514971510148414591374145313821407148313641341134410321064103610471057
7595754494654614735475124143133363924073563523283463414634554387588939781087
50.963.372.270.170.971.062.564.672.379.377.473.170.475.574.576.776.775.065.566.257.628.813.86.6-2.8
2.5% K10 Medium
Additional Nutrients
Phenol + 2.5% K10
5% K10
12.5% K10
NEGATIVE EFFICIENCY!
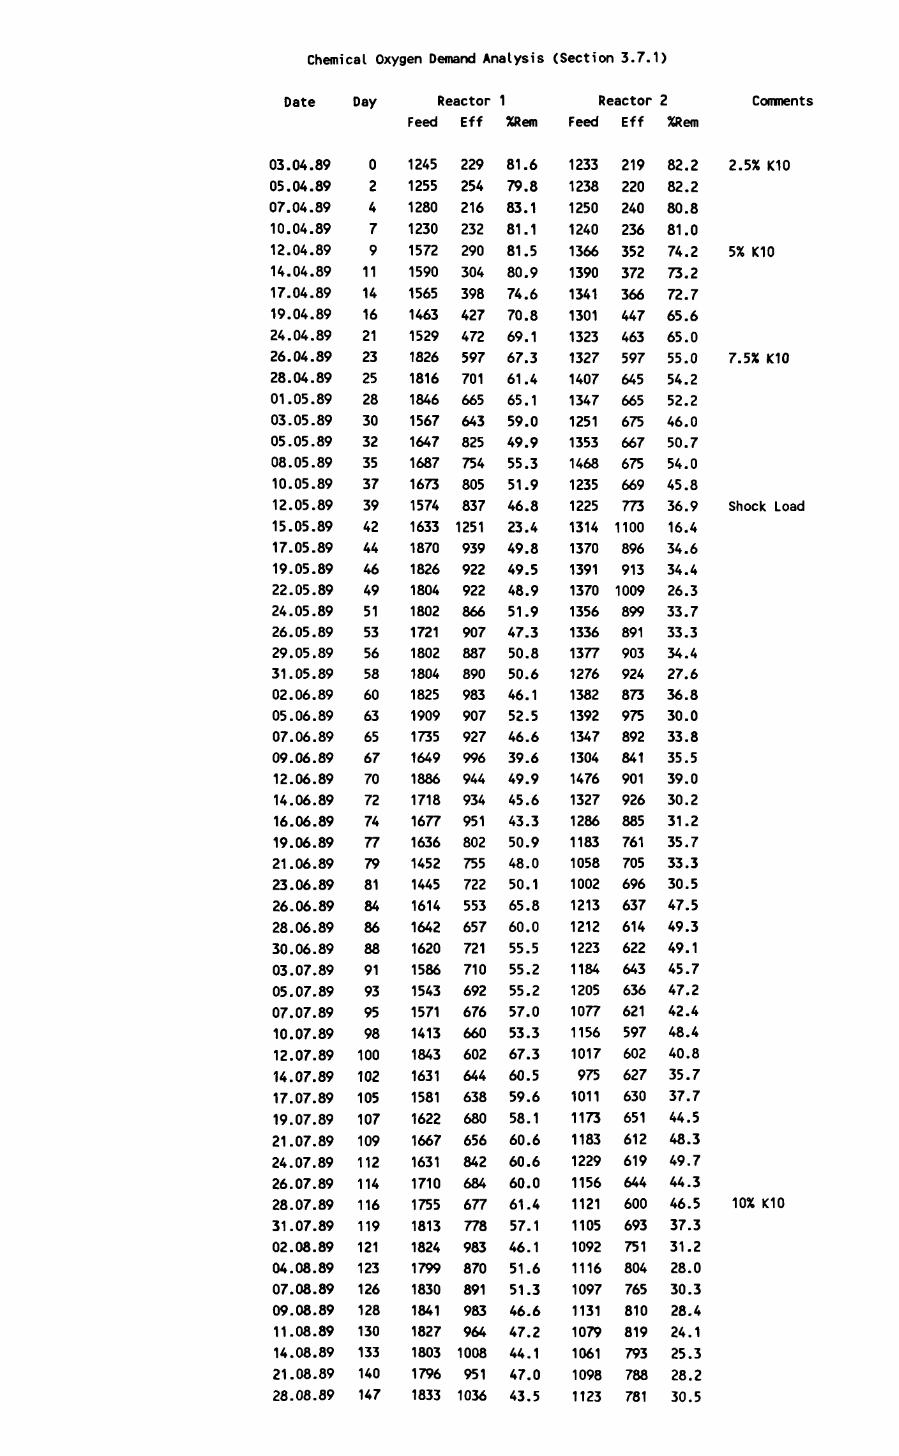
Chemical Oxygen Demand Analysis (Section 3.7.1)
Date Day Reactor 1 Reactor 2Feed Eff %Rem Feed Eff %Rem
Comments
03.04.8905.04.8907.04.8910.04.8912.04.8914.04.8917.04.8919.04.8924.04.8926.04.8928.04.8901.05.8903.05.8905.05.8908.05.8910.05.8912.05.8915.05.8917.05.8919.05.8922.05.8924.05.8926.05.8929.05.8931.05.8902.06.8905.06.8907.06.8909.06.8912.06.8914.06.8916.06.8919.06.8921.06.8923.06.8926.06.8928.06.8930.06.8903.07.8905.07.8907.07.8910.07.8912.07.8914.07.8917.07.8919.07.8921.07.8924.07.8926.07.8928.07.8931.07.8902.08.8904.08.8907.08.8909.08.8911.08.8914.08.8921.08.8928.08.89
02479
11141621232528303235373942444649515356586063656770727477798184868891939598100102105107109112114116119121123126128130133140147
12451255128012301572159015651463152918261816184615671647168716731574163318701826180418021721180218041825190917351649188617181677163614521445161416421620158615431571141318431631158116221667163117101755181318241799183018411827180317961833
229254216232290304398427472597701665643825754805837125193992292286690788789098390792799694493495180275572255365772171069267666060264463868065684268467777898387089198396410089511036
81.679.883.181.181.580.974.670.869.167.361.465.159.049.955.351.946.823.449.849.548.951.947.350.850.646.152.546.639.649.945.643.350.948.050.165.860.055.555.255.257.053.367.360.559.658.160.660.660.061.457.146.151.651.346.647.244.147.043.5
1233123812501240136613901341130113231327140713471251135314681235122513141370139113701356133613771276138213921347130414761327128611831058100212131212122311841205107711561017975101111731183122911561121110510921116109711311079106110981123
21922024023635237236644746359764566567566767566977311008969131009899891903924873975892841901926885761705696637614622643636621597602627630651612619644600693751804765810819793788781
82.282.280.881.074.273.272.765.665.055.054.252.246.050.754.045.836.916.434.634.426.333.733.334.427.636.830.033.835.539.030.231.235.733.330.547.549.349.145.747.242.448.440.835.737.744.548.349.744.346.537.331.228.030.328.424.125.328.230.5
2.5% K10
5% K10
7.5% K10
Shock Load
10% K10

Phenol Analysis (Section 3.7.2)
Date Day Reactor 1 Reactor 2Feed Eff %Rem Feed Eff %Rem
Conroents
03.04.8905.04.8907.04.8910.04.8912.04.8914.04.8917.04.8919.04.8924.04.8926.04.8928.04.8901.05.8903.05.8905.05.8908.05.8910.05.8912.05.8915.05.8917.05.8919.05.8922.05.8924.05.8926.05.8929.05.8931.05.8902.06.8905.06.8907.06.8909.06.8912.06.8914.06.8916.06.8919.06.8921.06.8923.06.8926.06.8928.06.8930.06.8903.07.8905.07.8907.07.8910.07.8912.07.8914.07.8917.07.8919.07.8921.07.8924.07.8926.07.8928.07.8931.07.8902.08.8904.08.8907.08.8909.08.8911.08.8914.08.8921.08.8928.08.89
02479
11141621232528303235373942444649515356586063656770727477798184868891939598100102105107109112114116119121123126128130133140147
447433442435438442427446431435450409386425394449441528520391438445434430428422453461463439462409386466428424489485462439394470451438462427437461450455462451469474453455471460477
0000000
0.10.30.20.34.56.76.55.91017
2282116202223242225272627262428232121141921212019202220252021232020252426272426332732
10010010010010010010010099.910099.998.998.398.598.497.796.156.795.995.995.495.194.694.594.894.094.194.494.294.194.793.294.195.595.196.696.295.795.495.395.195.895.196.194.695.395.295.095.695.694.694.794.594.394.794.393.094.193.3
441436427431370375367363371245292315287315299362354366347258266285227242313287309313314303273284288258273280268282303254296307311299295304317296330234219223236231235221214217231
00000
0.10.1
00
0.10.14.35.16.75.97.915
1502020232124212522262122232323212019161618181718182123242420231921232726272423222123
10010010010010010010010010010010098.698.297.998.097.895.859.194.392.391.592.689.291.292.192.491.593.192.992.491.791.992.692.193.194.294.193.894.193.193.994.293.292.391.392.193.792.294.291.089.587.989.088.389.889.689.790.390.0
2.5% K10
5% K10
7.5% K10
Shock Load
10% K10

Total Organic Carbon Analysis (Section 3.7.3)
Date Day Reactor 1 Reactor 2Feed Eff %Rem Feed Eff %Rem
Comments
03.04.8905.04.8907.04.8910.04.8912.04.8914.04.8917.04.8919.04.8924.04.8926.04.8928.04.8901.05.8903.05.8905.05.8908.05.8910.05.8912.05.8915.05.8917.05.8919.05.8922.05.8924.05.8926.05.8929.05.8931.05.8902.06.8905.06.8907.06.8909.06.8912.06.8914.06.8916.06.8919.06.8921.06.8923.06.8926.06.8928.06.8930.06.8903.07.8905.07.8907.07.8910.07.8912.07.8914.07.8917.07.8919.07.8921.07.8924.07.8926.07.8928.07.8931.07.8902.08.8904.08.8907.08.8909.08.8911.08.8914.08.8921.08.8928.08.89
02479
11141621232528303235373942444649515356586063656770727477798184868891939598100102105107109112114116119121123126128130133140147
369381389360491486484489586491497539543528532534525524506432526522519505490448469462453436394451473422406403433436407418412431430439445461432440467561540588579595613583606612593
109115116106159129173208233281306309272364339346421458443421382389348375381412382351393375391441425384399232310330281275301336317308312291314381321341436512551532547519532547541
70.569.870.270.667.673.564.357.560.242.838.442.749.931.136.335.219.812.512.52.5
27.325.532.925.722.28.018.524.013.214.00.82.2
10.19.01.7
42.428.424.331.034.226.622.026.329.829.936.927.313.431.339.219.312.94.810.610.811.012.210.68.8
341327329311402385428426459419389430424479448441512440525540384403420401396394396389391401379439424340321381330325364377351372363391375361380391377448439456451457436441437451455
11710510897153164195190237243289285297287289304392429421428367401386382388368394349343356375423384326310291261279294316301306267289267293291280263294317381413427418412421406425
65.767.967.268.861.957.454.455.448.442.025.733.730.040.135.531.123.42.519.820.74.40.58.14.72.06.60.510.312.311.21.13.69.44.13.423.620.914.219.216.114.217.726.426.128.818.823.428.430.234.427.816.48.46.64.16.63.710.06.6
2.5% K10
5% K10
7.5% K10
Shock Load
10% K10

APPENDIX 4
CHAPTER 5 RESULTS

Comparison of Respiration Rates of K10 Adapted and UnadaptedActivated Sludcre inWash Water Effluent
Concentration of K10 Wash Water Effluent (% K10 (v/v)
0
0.1
0.189
0.45
1
2.5
7
10
17.5
25
33
Response to Varyina Concentrations of K10
Specific Respiration Rate (mgO./h)
Adapted Sludge Unadapted Sludge
1.59
———
———
———
4.31
4.66
6.72
7.30
5.38
4.40
4.14
2.97
6.80
11.11
14.34
14.04
12.90
13.15
11.11
10.42
8.73
8.63
MLSS for Assay = 1120mg/l

si/insan 9S XIQN3ddV

Ozonolysis of 40% K10 Wash Water Effluent (Section 6.2)
I ME
01234567891011121314151617181920212223242526272829303132333435363738
V1
00.27090.54180.81271.08361.35451.62541.89632.16722.43812.70902.97993.25083.52173.79264.06354.33444.60534.87625.14715.41805.68895.95716.22536.49356.76177.02037.26157.49457.72477.95368.17858.40478.62688.85179.07389.30009.52229.7389
COD
33603195302929052780265624902365224120951950180517011587146313591219109410018877946595324383542582041831581471391181161049989877874
COD/COD
1.00.950.900.860.830.790.740.700.670.620.580.540.510.470.440.400.360.330.300.260.240.200.160.130.110.080.060.050.050.040.040.040.030.030.030.030.030.020.02
TOC
237123712350234022992224214721222090200719861889184617851732170016611626157615521505144313961373133512521212114911281066107110411010992987956937924928
TOC/TOC
1.01.00.990.990.970.940.920.890.880.850.840.800.780.750.730.720.700.690.660.650.630.610.590.580.560.530.510.480.480.450.450.440.430.420.420.400.400.390.39
2
1
1
1
1
1
1
1
1
1
1
1
1
1
1
2
1
1
1
1
1
1
1
1
1
1
1
1
1
1
2
.35
.54
.63
.72
.80
.84
.89
.91
.94
.94
.95
.96
.98
.99
.00
1
1
1
1
1
1
1
1
1
1
1
1
1
1
1
.0
.14
.21
.27
.33
.36
.40
.41
.44
.44
.44
.45
.47
.47
.48
0.87
0
0
0
0
0
0
0
0
0
0
0
0
0
0
.82
.73
.65
.56
.47
.40
.33
.26
.21
.15
.11
.08
.06
.05
1
0
0
0
0
0
.0
.94
.84
.75
.64
.54
0.46
0
0
0
0
0
0
0
0
.38
.30
.24
.17
.13
.09
.07
.06
0.
0.
44
41
0.33
0.
0.
0.
0.
0.
0.
25
175
110
070
040
033
0.028
0.
0.
0.
0.
0.
025
021
019
017
015
1.
0.
0.
0
92
75
0.56
0.
0.
0.
0.
0.
0.
0.
0.
0.
0.
40
25
16
09
08
06
06
05
04
04
0.03

1 -»• OO
rt F 0) O
C W (T> H-3 m ft »
(D WC
o3
1200-Column Mobile Phase
Wavelength Ozone Applied
C. 0 Reverse PhaseJ.O
Water to Acetonitrile (0.05% TFA)215nmO.Og/1 effluent
1 O OO
Co•H-p uQ)
Q) Q
•3 • O O
ON O 3 O
cnH- Cfl
6 OO
OO
2 OO
3 "5
Time (min)

Q)rH
-H
Q) 4->
W
-H(tf
C
OH i) 0)
Q) U
^
W
< <
0) O
EH >
-P*-i in a) o
Q)vo r> oo
co•
in o
H
(0 O
H
•
U
J2 ^—
CM H
0) (0
cgo o
o s
73
-p a
&> &
c <
0)rH
Q)
0) £
>
O(0
N
y HU
210-
N
Q)n -1-1
h
- EH
(5
Vi
i in
i n II
i ri
i i
i i
i i
PI n
i i
i i if T i T
1 i
1 i
1 1
I I
1
-
ID
o oaoN
000
Q 0(£
00o0til
(AUI)
HPLC Analysis
Results from
the Ozonolysis
of 40%
K10 Wash
Water Effluent

TT
<1)0) W
-Hc o -p 0) o
0)0)
u
<*> H
M in0) O
00 4-> •
rH
(Tj O
0) W
(0
C
0)e
rH
^
-Hr-H
^3
O O
O
2
Ca)0)
COe
oC
m
in CM
HCM COTJ0)•H
c0) rH 0)
(1)c oNo
t-h!- t-
wrcn (I)0) NNn NN 0)
- 0)
- I)
- (D
I I
I00
! !
I I
00N
0n
•TTn 0<b
I I
!
o000
00N
«»«onoly.i.
of
40%
K10
Wash

• OO
s: a0) >d rt F(D O
W 3 H> &> H> I-
(D H- 3 W ft
» (DWct— 'ftw
O 3
oN O3 O
W H-
w
1 2 OO
c o•H-P O Q)
0) Q
1 O OO
e oo
s- o o ——
oo
Column Mobile Phase
Wavelength Ozone Applied
C n Q Reverse PhaseJ.O
Water to Acetonitrile (0.05% TFA)215nm5.4180g/l effluent
I ' ' ' I ' • ' I ' ' ' I1 3 S ?*
-pr
i i
1 I ' '
1 55
1 I ' ' ' I '
21 23 23
1 I ' ' « I '
2S 31
1 I ' '
33
rj T
SS
r-|
3S
Time (min)

Q)rH
-H
Q) .p
£
W
-H
Q)flJ
C 3
42 O
rH
C^ i^
(LJ Q)
<W Q)
U -^
Q)
W
rtj rfj
<D O EH
\0)
ov> in
pr4 ^ ID
G
^
Q) O
C
O>00 4J
• ID
^t
H
(0 O
HU
£
^
CM tx
CIrHO
U
oW0)rH
•HO
TJ 0)
•H
•p a
tT> Q
iC
<
0)a)
c >
ofO
N
^
O
K0
~
(Dn
hrt
- O)a>IDN("I N
- 0)
! i
I !
! I
I 1
1 1
1 !
' i
! 1
1 I
I I
1 I
1 I
I I
1
00t
00N
000
00<D
00(bo o
n6N
(AUI)
HPLC Analysis Results
from the
Ozonolysis of
40% K10
Wash
Water Effluent

0) -
(i -
N -
OTM
jo
s-ps
Aio
uozo
aq
q ui
oaj
OTd
H
Defl
ecti
on (mV)
0 0
i 0 0
ill C 0
1 I I
I i I
M
H
0
N
0 0
0 0
I I
i I
I I
I I
I i
I I
I I
I I
0 0
o N
O 3
(D
< (D
M
(D
S
OO
O
cr H
H-
eM
3fl)
3
v rt
H-
(0 aen n>
UD
NJ
l->U
) LH
O
3
o 3
o (D
M> c (D
3
rt
^ S
3 O
O 0
) H
• rt
en
o n
>U
l 1"^
^
<^
(Drt
<
•^ O
fl)
O fl)en fl>
o cr
3
Q>H
- W
H-
M
(D

Q)O0)
d)-P•Hc o .p0)u
-p c oa)O
EH>
-pQ)
oY> rH
«
>H 10 g \
Q) O
C
CTCO -P
• O
O
H
(d O
If) •
U
12 -^
CM O
(1)gC
0)
O
Ou
s
0) •H
0) rH
Q)Q)
C>
o(0
N
TT
II I I
I I I
I I
TT
TT
0Go0to
0000CD
00n
o o00
o oN
(Am)
HPLC Analysis
Results from
the Ozonolysis
of 40%
K10 Wash
w^-her Effluent

OTH
jo STsAiouozo
UIOJ
EJ
sqin
san
OTd
H
Deflection (m
V)
o o0 0
01 0 0
Hi 0 00 0
I I
I I
I I
I I
! I
I I
! I
I I
I I
1 I
I I
I I
I I
I I
I I
I I
I
<D 0 0
0) 0 0
(I) -
(I -
N -
<D -
H (D
3
H-
3
N _
N (D N (I N N N (D (fi _
•-» u) _
(i) .
8) _
(I .
(I) _
(0
J
O N
O
3
CD tJ H-
CD a
CD CD
3 ft
3
s o
o o
cr
HH
- C
CD
3
tr P (A
CD
H
N> ^
S3
O
• cn
o
fu
Mo
o
•
rt o
ooo
3
o C
DCJ cr> CD M
> CD
3
rt
01rt
O
CD CD>
(0
O
CD
CD ft
^§
ffH
-0)
(0
rt
n>
CD

OTX
jo sTsAiouozo
mojj
Def
lect
ion
(mV)
N (1)
A (1
00
00
00
00
'1
1 1
1 1
1 1
1 1
1 1
1 1
1 1
i 1
I 1
1 1
1 i
1 1
1 1
1 1
1
(D 0 0
1 1
1 1
1 1
1 1
1 1
i
M 0 0
1 I
1 1
1 1
1 1
1 i
1
<D
(fl o
0 0
o0
0 o
1 1 1 i
1 1 1 1
1 1 1 1
1 1 1
i 1
M
1 M
II
I
0) -
U -
N -
(I)
H3 ;
HH
- U
H- 3
N
_
(D N _
(I N _
N _
(D
.
(i) _
0)
_
4)
.
ft) _
N 0
J
O N O
(D H-
(D
(D (D
3
3
OO
O
tr M
(D (A
(D
3 3
N)
N)
-^ S
J O
Ul
O 0
) H
H
o
• rt
oo
o>
3 o
fl>
(O (D
H> c (D
rt
O
(D
(D CO
(DO n> ft
'•rt
O 3*
3
fa (fl (DH rt (D

OIH
jo
ST
sAio
uozo
uioj
jO
TdH
Def
lect
ion
(mV)
it) 0 0
A 0 0
(I 0 0
JJL
J_L
Ui 0 0
I i
I I
i I
I I
M 0 0
CD 0 0
(fi 6 0
Cl .
(I) _
O
S3N
0)
O
<3
(D(D
M (D
>
3
H-
(D u>
toto
o
<ji
3o
3
00 (D H) C 3 ft
s o
o o
tr M
H-
£H
3
(D
3
s 0)
(A
(D S3
O
O (
D U1
^ ft
H O
00
(D (D (A
0)^
- O
(D ft
*rt
O
3-
3
0)
H
- W
ft
(D
H-
M
(D

0)H
-H
a)-P
W
-H<o
q d
odi
-p 0)
<Ul/lO
-x
0)
Q)O
-P
t; M inQ)
O
00 -PO
If)
O
£ —
' (N
0)in
C
0)g
rH
J3 -H
rH
,QO
O
O
S
•pcQ)0)
*3 H
C n
O
COQ)•H
£! rH
-p a
en a
Q)rHa) >
Q)c o N o
VI(I)
fn naNnN(i) N
Q)
0 0 0)
0 0 CD
TT
00Q 0 03
00r>
o oo0
(AUI)
HPLC Analysis
Results from
the Ozonolysis
of 40%
K10 Wash
Water Effluent

OTX
jo
ST
sAio
uozo
sq-[
ns3H
^^dH
Def
lect
ion
(mV)
N
id A
(1
0)
M0
00
00
0
000000
j |
| |
| |
| i
| |
! |
1 |
| i
| [
| |
! 1
I i
i I
I 1
1 1
! 1
M
i 1
1 i
1 1
I 1
1 i
I 1
1 1
! I
1 LI
LI
1 1
1 1
M
—
0)
~
u -
N -
(D -
>* _
>» H
_
6) .
^ !
-H
- 3 (D
M
_
^ .
? :
H-
H _
£, »
-
N _
H N
_(I)
.
N J
U .
N J
N .
N _
D .
(I) J
M (D J
U> .
<D -
(X - •
U w
—N
.
(i) I
' 1 .'
O N O 3
LN
^ . > ^ •0 M M-
fl> a «ji • £t
H 00I
° I-1
L &
7 ^
/ •-
1C (D 3 ft
i
op 0 0 1 1 1
i 1 1 1
S3
30)
O
< tr
(D
H-
M
M(0
(D
y ^Q
^ft
3*3*
D) in (D
NJ
-^
5J<J1
O
0)
O
• ft
3
0 (
!)3
(Ji
i-<
<W>ft
•-3 0
k_
j ^d
> >
^ o (D
ft
O 3 H-
ft n H-
M (D
<? c
o c
o c
! I
1 !
1 1
1 !
i 1
1 1
IJ
O 0 H C 3 3 O»-> 00
» (D < (D u n en (D 5 a> en (D

0)rH
•H
}q
Q) -P
W
-H
<d c
&
°ft
-PQ)Q)
O ^
w < 4
Ll
FT
.^
h*H
Q) O
tn>
-P
<1) <N>
tt ^ in0) 0
CO -P
•
H
(0 00
£
—
0w(0£ftC
0)
e H
3
-HH
43
O
O0
S
[II ! 1 1 1 II I [ ! I
I 1 !
II
3 0
3 0
3 d)
H
\
•PC03
,^
J<H
<
<W
10)
rH10
fi n
C
(^ 0
-^inCN
VOTJ 0)
•H4
5
rH
>•p
a X
en a
c <c
Q) J
rH
Q)
I0)
C>
o(d
N&
0
11
J
J
- m
»" c.
- 011/nw
• ro
- ffliH
- (15
• a)
- N
• K
~
N
• n
- N
' (D
-
Nrl
- N
^^»-
0) C
~
H -H
: 5
• N
: H oe•
n >H -
I H
• (O
"~
H
H
~
T<
~
(I)
-
K
- ID
- «
—
H
i i i i i i i i i i i i j i i i i i i i M } i i i i i n i i | i i i i i i i i i | i i i i i n » »| i i i M i i i i
g S
2 §
Sd)
N «»
n v
w N
HPLC Analysis
Results from
the Ozonolysis
of 40%
K10 Wash
Water Effluent

Q)w(0 43 to0)enQ) >Q)
Q)•H•H
5-1
4->•H
C
O
4-> 0) OO
EH 4->^
inQ) O
CO .p
•H
(0 O
U
Q)in(0£C Q)
3
iH§
-H
•H
.QO
O
u s
gco
in
-Pc0)Q)CP in
-p tnc0) iH
Q) >
Tl Q)•H0)C
O
N
O
J
w (I)n0)ffl(9<D NrN0) N
-HeQ)
TT
TT
009)
I I
I !
I I
! I
I I
I I
j
0
00
0d>
tv
I I
00(D
Q 0ID
0000(i)
00N
(AUI)
HPLC Analysis
Results from
the Ozonolysis
of 40%
K10 Wash
Water Effluent

OIM
jo STsAiouozo
UIQJJ
Deflection (mV)
N 0 0
i i
i i
(d 0 0
i i
i i ll
1
A 0 0
1 1
1 1 I
1 1
1 i
(1 b 0
........
1 L_
<J> 0 D
l l
1 1
M
1 1
I II
1
1
M 0 0
1 1 1 1
1 1 1 1
CD 0 0
1 I
1 1
1 1
! i
!
(j> 6 0
i i i
i i
i i i
i i i
c c c1 1
1 1 II J
to H
N (D N (I N M N (D a) (i) (D (I (D J
(I) J
O
3
N
ty
O
<3
(D
(D
M (D
V H-
(0
ft
3*
S
OO
O
cr M
H-
CM
3
(D 3
w (D
oo
to
^-s
S3
O(J
l O
P
H
•^
O
• ft
00
O
3
O
fl>^
3
01 ^
»
^J
cX>
(D^Q
ft
<
\
»-3 O
(D
effluentAcetonitr
A)
se Phase

rt F (D O
W 3M) D>i-h H1
C CO (D H- 3 W rt
» ~ (Dw cn X C
•O MV rt 3 Wa(D M)a n
w rto cr n a> cr a> o3 No o(D 3
Oo
H-cn
cn3-
3--*O
320
300
c o•H•Pu0)
0) Q
2 eo
2 60
220
2 OO
Column Mobile Phase
Wavelength Ozone Applied
CL 0 Reverse PhaseJLo
Water to Acetonitrile (0.05% TFA)250nm
O.Og/1 effluent
I3
Ts
T5»
i i i i i11 i 2S
ry-r
3 1
T I ^
asTime (min)

OIH
aoup
qaos
qv
papu
edxa
) jo
ST
sA-[
ouoz
oOT
LdH
Deflection (m
V)
I I I
I I I
I I I I
I I I I
I I I I
I I
N N 0
N 0
I i
I I
I
N 0) 0
N ® 0
0) 0 0
0) N 0
(I) i o'
' i i
i i
i i
i i
i i i
(D -
(I -
(I)
(D
N (I) N (I N _
N (P 0) _
0) ID (D tf (0 J

0)W(0 £0)W0)>Q)PH00Hu
•Hr-l4-)•HC•PQ)O<O-Pr-l
0)•P(0J2
^-s
<EH<^>ID0•
0-1— '
gaoLOCM
•Pca)3i-H <4-l<MQ)
rHCNJt^
voH•CM
a)fi0)
O
Ou
s
V.1
(I)<B NI) N(D N0)
a)g•H
0t n
M
I I
I I I M
I I
I I I
I M H M
I ! I
I I
I I
I I I
I I
1 I
I 1 M
I
o No o(i)
0 <DN
0 *00N
HPLC Analysis
Results from
the Ozonolysis
of 40%
K10 Wash
Water Effluent
(Expanded Absorbance
Scale)

OIM
aoue
qaos
qv
papu
cdxg
) quanuja
jo
si
sAio
uo
zo
aqq
uioa
j sq
-[ns
en
ST
sAi^
uv
Old
H
Def
lect
ion
(mV)
N 0
N 0) 0
N <S 0
_LL
0) 0 0
ill.
0) N 0
J_L
(I) * 0
(D -
H (D
H-
N _
N iu N (I N -
0) (I) 9 (i) (i) J
O
3N
0)
O
<3
(D0)
M (D
>
3
H-
(0
S
OO
O
tr H
fl> en (D
3 3 o•
Ol
O 0
> H
W
O
• ft
00
01
3
O (
Do
g 01
^
$00 (D H
) H
) (D 3 rt
(Dft
<
O
(D
^ O
(D
ft
O
3
H-
ft (D
cn (D 01 cn n>

OTH
aoueqaosqv papuedxa)
jo STsAiouozo am uiojj
s^insan
STsAieuv
Def
lect
ion
(mV)
N 0
I I
I I
I I
N <J) 00 0
(I) N 0
(I) 0
I I I
I I I
ft) -
(I -
(D -
(D
H N
H-
K J
N H (I) N (A N M N 0) (I) (I) a 0> _
(I) til
O
N O 3
(D H-
fl) U) to (D H)
H) (D 3
rt
5!
SO
0>
O
O<
tr H
to H-
e
M
M
3(D
(D
3
0
to ^ S
3 O
(J1
O
0>
Ho
• rt
03
3
O (
D3
ui H
{ JO
<*P
(Drt
<
^ O
(D
*^d
^t>
I>
co^ o
n>
(D rt
'rjo
tr3
Q)!±
w
rt
(D
(D

OIM
aoue
qjos
qv pepuedxa)
jo sT
sAio
uozo
at
jq.
UIQJJ
Deflection (m
V)
(D -
(D -
ft) .
(D H- H
_
N _
N _
N (I N _,
N (D (D -
4) .
a) ci ft) _
(D r.
(D

3 a DJ *aft f (D O^
>W 3 i-h D»H> H- M^< C (0n> H-3 w rt
»^ (D M W X C
T3 M DJ ft 3 Wa(D hh CL h<
O > 3crw rt O Un n> crDi O3 Nn o(D 3
oCO Mn ^< o> enH1 I— (D W
Ot-h
o
DJ
3
3-2O
300
c o•H 4-> 0 0)
a) a
z. eo
260
2 2O
200
Column Mobile Phase
Wavelength Ozone Applied
C._ Reverse Phase-Lo
Water to Acetonitrile (0.05% TFA)250nm
6.4935g/l effluent
i i i i i3 3
i » »9
i '11
i '13
i '1S5
i 'IS
1 I ' ' ' I '21 2 :&
n-T-T-T-pr-
31 33
r-j-r-
33
Time (min)

OTM
aoue
qaos
qv p
apue
dxa)
jo
S
TsA
iouo
zo
aitt
ui
oaj
sq.-[
nsaH
Def
lect
ion
(mV)
N N 0
N * 0
N 0) 0
1 1
i1
11
1
N <D 0 I
If) 0 0
(v N 0
1 1
(I -
H- 3 n> H-
M 3
CD N _
N (0 N U N M N ID u) _
(I) (I) (D _
(i) J
O
S3N
Q>
O
<
3
CD(D
M (D
H-
CD a VO
(Jl (D H)
H)
M c (D
3
rt
to 01 o 3 3
S
OO
O
tr H
H-
c:M
3
CD
3
[/)
CD
O•
rt o
oo
CD
01 n
*
rt
O O
CD
rt
O
3 H-
rt H-
M
CD
CD
CD (0
CD 0)
VI
CD

OTH
aoueqaosqv papuedxa)
q.uanuja
jo sTsAiouozo at-l^
uiojj
sq.-
[nsa
n
Def
lect
ion
(mV)
w H
N 0) 0
! I
I I
1
CD 0
0) 0 0
(u N 0
(0
* 0
[ I I
I I
1 I
1 I
1 1
1 I I
I 1
I 1
I I o N O
3
(D(D
M
(D
13
03
13
ft
H
U
H-
(D a
3
Oo
ocr
HH
- C
M
3(D
3
in (D
00(Jl
o
3 3
oo
ju »-»
• ft
00
O (
D ft O
(D M>
M)
(D 3
ft
(D (D
l-{ in (DO
(D ft
>d
O
3-
3
0)
H
- in
ft
(Dn H
- M
(D

tjsi?
M
OTM
jo
sTsA
iouo
zo
et[q
. ui
oaj
Def
lect
ion
(mV)
H-
3
(D 3
H-
H U 0L
1
1 1
1 1
1 1
N 0 01
1 1 |
_l 1
I 1
N U 01
i 1
1 1
1 II
1 1
I I
1
(J)
(!)
*o
u b
00
0
1 1 I
1 1 1
1 1 I
1 1 i
1 1
! I
I 1
1 1
1 1
I I
1 1
A tt 01 1
1 1 i
1 1
(I) -
N _
N (I) N _
N J
(I) _
(0 (D (D U (I) M (0 .
O
S3N
P)
O
< (D
(D(D 3
H-
3
OO
O
tr M
en (D
o w
^ 5
;•
(Jl
O 0
» |->
o
o
» d-
oo
Q 3
o (D
(D H)
C
(D
3
ft
(D
ft
<O
(D
1^
W
O
(D(D ft
1JO 3 H
-ft (D
DJ
W
(D

0)
0) -P
W
-H(0
C.C
O
cOJ
0) <W
Q) O
^
Q) (/)
rtj rtj^
PM rH
0) O
H
\>
-P
G>
Q) <^o
VD(^
>-i in g
nQ) O
C
CO
00 4-» •
O
OH
to o
inU
!2 -^
r> H
(1) u fd§C
0)
I
-H3
-HH
^
O
Oo
a
T3Q)•H
A
H
4-» ft
^
ftc
<(1)•H
Q) Q)
C
>
Ocd
N &
o
r I-
I I
I I
1 I
I I
! I
I !
I I
I I
I !
I I
I I
I I
I 1
1 I
I I
I I
I I
! T I I
I I
I I
I
K(Dn m0)0)NI)NID Nr»N
0 I)00m
0no o
o 10
* C
- -H
•* Q) g
in -H
H
H
uoTq.oaijaa
HPLC Analysis
Results from
the Ozonolysis
of 40%
K10 Wash
Water Effluent

Ozonolvsis of TNT Red Water (Section 6.3)
TIME 0 /L COD COD/COO 200 200/200 250 250/250 327 327/327
012345678910111213141516171819202122
00.26000.51990.77731.02431.25821.46621.66381.84332.00192.15002.27482.38652.49312.59202.68292.77332.85442.93513.01303.09113.16643.2366
30423021289626872479231222402240211519901927186517951753169116701520149914941468137113551345
1.00.990.950.880.810.760.740.740.700.650.630.610.590.580.560.550.500.490.490.480.450.450.44
1.47
1.52
1.53
1.56
1.57
1.59
1.65
1.66
1.68
1.68
1.73
1.73
1.0
1.03
1.04
1.06
1.07
1.08
1.12
1.13
1.14
1.14
1.18
1.18
0.79
0.70
0.60
0.53
0.47
0.41
0.38
0.35
0.32
0.30
0.28
0.26
1.0
0.89
0.76
0.67
0.59
0.52
0.48
0.44
0.41
0.38
0.35
0.33
0.30
0.20
0.15
0.115
0.090
0.075
0.065
0.060
0.052
0.050
0.046
0.043
1.0
0.67
0.50
0.38
0.30
0.25
0.22
0.20
0.17
0.17
0.15
0.14

APPENDIX 6
ADDITIONAL REFERENCES

ADDITIONAL REFERENCES
Although these references were not cited in this thesis,
they may be of interest to the reader.
Albert, R. C. , Hoehn, R. C. and Randall, C. W.Treatment of a Munitions Manufacturing Waste by the Fixed ActivatedSludge Process27th Engineering Extension Series (1972) 458-472(Proc. Int. Waste Water Conf.)
Andren, R. K. , Nystron, J. M., McDonnell, R. P. and Stevens, B. W.Explosives Removal from Munitions Wastewater30th Industrial Wastewater Conference (1975) 816-825Purdue University, USA.
Bollag, J-M. and Loll, M. J.Incorporation of Xenobiotics into Soil HumusExperientia (1983) 39, 1221-1331
Boyd, S. A., Shelton, D. R., Berry, D. and Tiedje, J. M. Anaerobic Biodegradation of Phenolic Compounds in Digested Sludge Applied and Environmental Microbiology (1983) 46, No. 1, 50-54
Chambers, C. W., Tabak, H. H. and Kabler, P. W.Degradation of Aromatic Compounds by Phenol Adapted BacteriaJournal W.P.C.F. (1963) 35, No.12, 1517-1528
Cook, A. M., Grossenbacher, H. and Hutter, R.Isolation and Cultivation of Microbes with Biodegradative PotentialExperientia (1983) 39, 1191-1197
Cooper, R. L. and Wheatstone, K. C.The Determination of Phenols in Aqueous EffluentsWater Research (1973) 7, 1375-1384
Cullivan, B. M.Industrial Toxics Oxidation: an Ozone-Chlorine Comparison33rd Industrial Waste Conference (1978) 903-910Purdue University, USA.
Curry, N. A.Guidelines for Landfill of Toxic Industrial Sludges 28th Industrial Waste Conference (1973) 329-339 Purdue University, USA.
Czekalowski, J. W. and Skarzynski, B.The Breakdown of Phenols and Related Compounds by BacteriaJ. Gen. Microbiol. (1948) 2, 231-238
Dagley, S.Microbial Catabolism and the Carbon Cycle Biochemical Society Transactions (1976) 4, 455-466 562nd Meeting Bangor

Eisenhauer, H. R.The Ozonation of Phenolic WastesJournal W.P.C.F. (1968) 40, No.11, 1887-1899
Evans, R. A., Parr, W. H. and Evans, W. C. The Bacterial Oxidation of Aromatic Compounds Biochem. J. (1949) 44, viii
Evans, W. C. , Smith, B. S. W., Linstead, R. P. and Elvidge, J. A. Chemistry of the Oxidative Metabolism of Certain Aromatic Compounds by Microorganisms Nature (1951) 168, 772-775
Finn, R. K.Use of Specialised Microbial Strains in the Treatment of IndustrialWaste and in Soil DecontaminationExperientia (1983) 39, 1231-1236
Forsten, I.Pollution Abatement in a Munitions PlantEnviron. Sci. Technol. (1973) 7, No.9, 806-810
Fox, R. D. and Himmelstein, K. J.Recovery or Destruction - New Developments for Industrial Wastes29th Industrial Waste Conference (1974) 445-455
Freeman, D. J.Continuous Fixation and Removal of Explosive Wastes from Pink Waterusing Surfactant Technology40th Industrial Waste Conference (1985) 659-676Purdue University, USA.
Ghisalba, O.Microbial Degradation of Chemical Waste, an Alternative to PhysicalMethods of Waste DisposalExperientia (1983) 39, 1247-1257
Guy, S.Effect of Cross Treatment on the Subsequent Breakdown of 2,4-D, MCPAand 2,4,5-T in SoilChemosphere (1983) 12, No. 7/8, 1101-1106
Happold, F. C.The Oxidation of Aromatic Rings by Microorganisms in MetabolismBiochem. Soc. Symposia (Brit) (1950) 5, 85-96
Harder, W.Enrichment and Characterization of Degrading OrganismsIn "Microbial Degradation of Xenobiotics and Recalcitrant Compounds"(1980) 77-96FEMS Symposium No. 12
Irvine, R. L. and Busch, A. W.Factors Responsible for Non-Biodegradability of Industrial Wastes24th Industrial Waste Conference (1969) 903-913Purdue University, USA.

Jennett, j. c. and Dennis, D. D.Anaerobic Filter Treatment of Pharmaceutical WasteJournal W.P.C.F. (1975) 47, No.l, 104-121
Kearney, p. c., Plimmer, J. R., Wheeler, W. B. and Konston, A. Persistence and Metabolism of Dinitroaniline Herbicides in Soil Pesticide Biochemistry and Physiology (1976) 6, 229-238
Kiff, R. J.Water Pollution Control in the Fertilizer Manufacturing IndustryIn "Surveys in Industrial Wastewater Treatment"3. Manufacturing and Chemical IndustriesEd. Barnes, D. , Forster, C. F. and Longman Scientific and Technical
Kincannon, D. F., Weinert, A., Padorr, R. and Stover, E. L. Predicting Treatability of Multiple Organic Priority Pollutant Wastewaters from Single-Pollutant Treatability Studies 37th Industrial Waste Conference (1982) 641-650 Purdue University, USA.
Klausmeier, R. E., Osmon, J. L. and Walls, D. R. The Effect of Trinitrotoluene on Microorganisms Dev. Ind. Microbiol. (1973) 15, 309-317
Lal, R., Lal, S. and Shivaji, S.Use of Microbes for Detoxification of PesticidesCRC Critical Reviews in Biotechnology (1986) 3, 1-16
Lamb, J. C. , Westgarth, W. C., Rogers, J. L. and Vernimmen, A. P.A Technique for Evaluating the Biological Treatability of IndustrialWastes13th SMIWC (1964) 62-75
Leisinger, T.Microorganisms and Xenobiotic CompoundsExperientia (1983) 39, 1183-1191
Mallik, M. A. B. and Tesfai, K.Transformation of Nitrosamines in Soil and in Vitro by SoilMicroorganismsEnvironmental Contamination and Toxicology (1981) 27, 115-121
Marion, C. V. and Malaney, G. W.Ability of Activated Sludge Microorganisms to Oxidise AromaticOrganic Compounds18th Industrial Waste Conference (1963) 297-308Purdue University, USA.
Miller, R. A., Johnson, J. D., Helsel, R. W. and Pitts, D. M. Destruction of Toxic Compounds by Catalysed Wet Oxidation 35th Industrial Waste Conference (1980) 425-429 Purdue University, USA.
Mulbarger, M. C.Nitrification and Denitrification in Activated Sludge SystemsJournal W.P.C.F. (1971) 43, No.10, 2059-2070

Ochs, L. D., Keller, P. J., Weatherspoon, J. V., Blick, C. andCole, c. A.Hydrogen Peroxide as a Supplemental Oxygen Source in IndustrialWaste Treatment28th Industrial Waste Conference (1973) 447-453Purdue University, USA.
Okamoto, Y. and Wang, J. Y.Micelliar Effects on the Reaction of 2,4,6-Trinitrotoluene with AminesJ. Org. Chem. (1977) 42, No.7, 1261-1262
Osmon, J. L. and Klausmeier, R. E.The Microbial Degradation of ExplosivesDev. Ind. Microbiol. (1972) 14, 247-252
Parrish, F. W.Fungal Transformation of 2,4-Dinitrotoluene and 2,4,6-Trinitro toluene Applied and Environmental Microbiology (1977) 34, No. 2, 232-233
Patterson, J. W. and Minear, R. A. Pollution Control in the Explosives Industry 29th Industrial Waste Conference (1974) 808-831 Purdue University, USA.
Pillis, L. J. and Davis, L. T.Process for Treating Wastewater Containing Phenolics andMicroorganisms Capable of Degrading PhenolicsU.S. Patent 4,352,886Oct. 5, 1982
Rogonska, T. I.The Effect of Trinitrotoluene on the Microorganisms and BiochemicalProcesses of Self Purification in WaterMicrobiologiya (1951) 20, 265-272Translated by Dr. Alexandr Urvakin, Polytecnic Institute, Kursk
Ruchhoft, C. C., LeBosquet, M. and Meckler, W. G.TNT Wastes from Shell-Loading PlantsIndustrial and Engineering Chemistry (1945) 37, No.10, 937-943
Schmidt, E., Hellwig, M. and Knackmuss, H-J.Degradation of Chlorophenols by a Defined Mixed Microbial CommunityAppl. Environ. Microbiol. (1983) 46, No.5, 1038-1044
Schott, S., Ruchhoft, C. C. and Megregian, S.TNT WastesIndustrial and Engineering Chemistry (1943) 35, No.10, 1122-1127
Semmens, M. J., Barnes, D. and O'Hara, M. Treatment of an RDX-TNT Waste from a Munitions Factory 39th Industrial Waste Conference (1984) 837-842 Purdue University, USA.

Shelton, D. R. and Tiedje, J. M.General Method for Determining Anaerobic Biodegradation PotentialApplied and Environmental Microbiology (1984) 47, No. 4, 850-857
Simpson, j. R. and Evans, W. C.The Metabolism of Nitrophenols by Certain BacteriaBiochem. J. (1953) 55, xxiv
Slater, J. H. and Godwin, D.Microbial Adaption and SelectionIn "Contemporary Microbiology" (1980) 137-151Ed. Ellwood, Hedger, Latham, Lynch and Slater
Slater, J. H. and Somerville, H. J.Microbial Aspects of Waste Treatment with Particular Attention tothe Degradation of Organic Compounds29th Symposium of the Society of General Microbiology, Cambridge(1979)Ed. Bull and Ellwood
Smith, L. L. and Zeigler, E.Biological Treatment of a Munitions Manufacturing FacilityWastewater33rd Industrial Waste Conference (1978) 432-439Purdue University, USA.
Smith, L. L.Evaluation of an Anaerobic Rotating Surface System for Treatment ofa Munition Wastewater containing Organic and Inorganic Nitrates34th Industrial Waste Conference (1979) 628-634Purdue University, USA.
Stoneburner, D. L.Biological Studies in Military-Industrial Waste Surveys28th Industrial Waste Conference (1973) 841-848
Stover, E. L. and McCartney, D. E. BOD Results that are Believable Water/Engineering Management (1984) April, 37-66
Strier, M. P. and Gallup, J. D.Removal Pathways and Fate of Organic Priority Pollutants inTreatment Systems: Chemical Considerations37th Industrial Waste Conference (1982) 813-824Purdue University, USA.
Vaidya, M. V.Effluent Treatment of Phenolic Waste - Our ExperienceIndian Chemical Manufacturer (1979) 17, No. 8/9, 45-49
Wilhelmi, A. R. and Ely, R. B.The Treatment of Toxic Industrial Wastewaters by a Two Step Process30th Industrial Waste Conference (1975) 288-295Purdue University, USA.

Wolff, j. B .Industrial Waste Disposal via Municipal Sewers7th Annual Symposium on Industrial Waste Control (1966) 21-28John Hopkins University, Baltimore
Wood, D. K. and Tchobanoglous, G.Trace Elements in Biological Waste Treatment with Specific Referenceto the Activated Sludge Process29th Industrial Waste Conference (1974) 648-661Purdue University, USA.
Yasuda, S. K.Identification of 1,3,5-Triamino-2,4,6-Trinitrobenzene Impurities byTwo Dimensional Thin-Layer ChromatographyJournal of Chromatography (1972) 71, 481-486