Effects of wastewater treatment plant pollution on in-stream ...
14
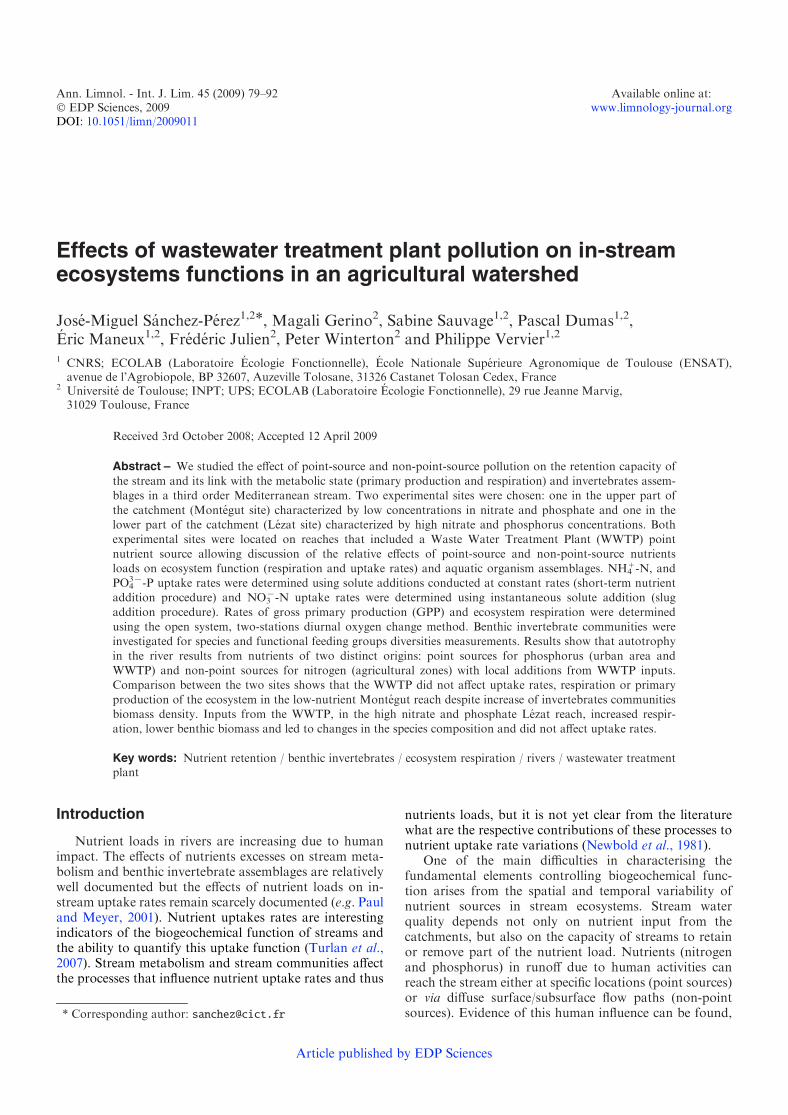
Effects of wastewater treatment plant pollution on in-stream ecosystems functions in an agricultural watershed Jose´-Miguel Sa´ nchez-Pe´rez 1,2 * , Magali Gerino 2 , Sabine Sauvage 1,2 , Pascal Dumas 1,2 , E ´ ric Maneux 1,2 , Fre´de´ric Julien 2 , Peter Winterton 2 and Philippe Vervier 1,2 1 CNRS; ECOLAB (Laboratoire E ´ cologie Fonctionnelle), E ´ cole Nationale Supe´rieure Agronomique de Toulouse (ENSAT), avenue de l’Agrobiopole, BP 32607, Auzeville Tolosane, 31326 Castanet Tolosan Cedex, France 2 Universite´ de Toulouse; INPT; UPS; ECOLAB (Laboratoire E ´ cologie Fonctionnelle), 29 rue Jeanne Marvig, 31029 Toulouse, France Received 3rd October 2008; Accepted 12 April 2009 Abstract – We studied the effect of point-source and non-point-source pollution on the retention capacity of the stream and its link with the metabolic state (primary production and respiration) and invertebrates assem- blages in a third order Mediterranean stream. Two experimental sites were chosen: one in the upper part of the catchment (Monte´gut site) characterized by low concentrations in nitrate and phosphate and one in the lower part of the catchment (Le´zat site) characterized by high nitrate and phosphorus concentrations. Both experimental sites were located on reaches that included a Waste Water Treatment Plant (WWTP) point nutrient source allowing discussion of the relative effects of point-source and non-point-source nutrients loads on ecosystem function (respiration and uptake rates) and aquatic organism assemblages. NH 4 + -N, and PO 4 3x -P uptake rates were determined using solute additions conducted at constant rates (short-term nutrient addition procedure) and NO 3 x -N uptake rates were determined using instantaneous solute addition (slug addition procedure). Rates of gross primary production (GPP) and ecosystem respiration were determined using the open system, two-stations diurnal oxygen change method. Benthic invertebrate communities were investigated for species and functional feeding groups diversities measurements. Results show that autotrophy in the river results from nutrients of two distinct origins: point sources for phosphorus (urban area and WWTP) and non-point sources for nitrogen (agricultural zones) with local additions from WWTP inputs. Comparison between the two sites shows that the WWTP did not affect uptake rates, respiration or primary production of the ecosystem in the low-nutrient Monte´gut reach despite increase of invertebrates communities biomass density. Inputs from the WWTP, in the high nitrate and phosphate Le´zat reach, increased respir- ation, lower benthic biomass and led to changes in the species composition and did not affect uptake rates. Key words: Nutrient retention / benthic invertebrates / ecosystem respiration / rivers / wastewater treatment plant Introduction Nutrient loads in rivers are increasing due to human impact. The effects of nutrients excesses on stream meta- bolism and benthic invertebrate assemblages are relatively well documented but the effects of nutrient loads on in- stream uptake rates remain scarcely documented (e.g. Paul and Meyer, 2001). Nutrient uptakes rates are interesting indicators of the biogeochemical function of streams and the ability to quantify this uptake function (Turlan et al., 2007). Stream metabolism and stream communities affect the processes that influence nutrient uptake rates and thus nutrients loads, but it is not yet clear from the literature what are the respective contributions of these processes to nutrient uptake rate variations (Newbold et al., 1981). One of the main difficulties in characterising the fundamental elements controlling biogeochemical func- tion arises from the spatial and temporal variability of nutrient sources in stream ecosystems. Stream water quality depends not only on nutrient input from the catchments, but also on the capacity of streams to retain or remove part of the nutrient load. Nutrients (nitrogen and phosphorus) in runoff due to human activities can reach the stream either at specific locations (point sources) or via diffuse surface/subsurface flow paths (non-point sources). Evidence of this human influence can be found, * Corresponding author: [email protected] Article published by EDP Sciences Ann. Limnol. - Int. J. Lim. 45 (2009) 79–92 Available online at: Ó EDP Sciences, 2009 www.limnology-journal.org DOI: 10.1051/limn/2009011
-
Upload
khangminh22 -
Category
Documents
-
view
3 -
download
0
Transcript of Effects of wastewater treatment plant pollution on in-stream ...
Effects of wastewater treatment plant pollution on in-streamecosystems functions in an agricultural watershed
Jose-Miguel Sanchez-Perez1,2*, Magali Gerino2, Sabine Sauvage1,2, Pascal Dumas1,2,Eric Maneux1,2, Frederic Julien2, Peter Winterton2 and Philippe Vervier1,2
1 CNRS; ECOLAB (Laboratoire Ecologie Fonctionnelle), Ecole Nationale Superieure Agronomique de Toulouse (ENSAT),avenue de l’Agrobiopole, BP 32607, Auzeville Tolosane, 31326 Castanet Tolosan Cedex, France
2 Universite de Toulouse; INPT; UPS; ECOLAB (Laboratoire Ecologie Fonctionnelle), 29 rue Jeanne Marvig,31029 Toulouse, France
Received 3rd October 2008; Accepted 12 April 2009
Abstract – We studied the effect of point-source and non-point-source pollution on the retention capacity ofthe stream and its link with the metabolic state (primary production and respiration) and invertebrates assem-blages in a third order Mediterranean stream. Two experimental sites were chosen: one in the upper part of
the catchment (Montegut site) characterized by low concentrations in nitrate and phosphate and one in thelower part of the catchment (Lezat site) characterized by high nitrate and phosphorus concentrations. Bothexperimental sites were located on reaches that included a Waste Water Treatment Plant (WWTP) point
nutrient source allowing discussion of the relative effects of point-source and non-point-source nutrientsloads on ecosystem function (respiration and uptake rates) and aquatic organism assemblages. NH4
+-N, andPO4
3x-P uptake rates were determined using solute additions conducted at constant rates (short-term nutrientaddition procedure) and NO3
x-N uptake rates were determined using instantaneous solute addition (slug
addition procedure). Rates of gross primary production (GPP) and ecosystem respiration were determinedusing the open system, two-stations diurnal oxygen change method. Benthic invertebrate communities wereinvestigated for species and functional feeding groups diversities measurements. Results show that autotrophy
in the river results from nutrients of two distinct origins: point sources for phosphorus (urban area andWWTP) and non-point sources for nitrogen (agricultural zones) with local additions from WWTP inputs.Comparison between the two sites shows that the WWTP did not affect uptake rates, respiration or primary
production of the ecosystem in the low-nutrient Montegut reach despite increase of invertebrates communitiesbiomass density. Inputs from the WWTP, in the high nitrate and phosphate Lezat reach, increased respir-ation, lower benthic biomass and led to changes in the species composition and did not affect uptake rates.
Key words: Nutrient retention / benthic invertebrates / ecosystem respiration / rivers / wastewater treatmentplant
Introduction
Nutrient loads in rivers are increasing due to humanimpact. The effects of nutrients excesses on stream meta-bolism and benthic invertebrate assemblages are relativelywell documented but the effects of nutrient loads on in-stream uptake rates remain scarcely documented (e.g. Pauland Meyer, 2001). Nutrient uptakes rates are interestingindicators of the biogeochemical function of streams andthe ability to quantify this uptake function (Turlan et al.,2007). Stream metabolism and stream communities affectthe processes that influence nutrient uptake rates and thus
nutrients loads, but it is not yet clear from the literaturewhat are the respective contributions of these processes tonutrient uptake rate variations (Newbold et al., 1981).
One of the main difficulties in characterising thefundamental elements controlling biogeochemical func-tion arises from the spatial and temporal variability ofnutrient sources in stream ecosystems. Stream waterquality depends not only on nutrient input from thecatchments, but also on the capacity of streams to retainor remove part of the nutrient load. Nutrients (nitrogenand phosphorus) in runoff due to human activities canreach the stream either at specific locations (point sources)or via diffuse surface/subsurface flow paths (non-pointsources). Evidence of this human influence can be found,* Corresponding author: [email protected]
Article published by EDP Sciences
Ann. Limnol. - Int. J. Lim. 45 (2009) 79–92 Available online at:� EDP Sciences, 2009 www.limnology-journal.orgDOI: 10.1051/limn/2009011
for instance, in world-wide increases in stream nutrientloads, especially nitrogen (Vitousek et al., 1997).
In industrial countries, wastewater treatment plants(WWTP) modify punctually water quality through nitro-gen, phosphor and organic matter input (Merseburgeret al., 2005). Changes in the availability of organic matteraffect stream metabolism (Crenshaw et al., 2002) andthe abundance and composition of stream communities(Prenda and Gallardo-Mayenco, 1996).
Nutrient retention is a functional property of streamecosystems that may contribute to counteract streamwater quality problems. Stream nutrient retention dependson water residence time (i.e., hydrologic retention), as wellas on biological and chemical processes affecting nutrienttransport (Billen and Garnier, 1999; House et al., 2001)and also on the interaction of several physical (morpho-logy and hydrology), chemical, and biological mechanisms(Lefebvre et al., 2006). At the reach scale, streambedpermeability favors water exchanges between surface andhyporheic porous media, causing a physical delay innutrient transport. This physical delay, coupled with bio-logical activity within the sediment, suggests that thestream surface-subsurface hydrological linkage may be animportant factor in enhancing stream nutrient retention,at least in non-polluted streams (Valett et al., 1997; Fisheret al., 1998).
In order to assess modifications of biogeochemicaltransformation efficiencies in streams altered by humanactivity, a multidisciplinary study was carried out in theLeze watershed (SW France). Hydro-morphology, chem-ical water quality, nutrient uptakes rates, respiration,growth primary production and benthic invertebratecommunity structure were simultaneously measured. Theexperimental sites, located in two distinct parts of thewatershed were selected to represent two contrastingnutrient source conditions: in the upper part of the catch-ment, the Montegut site with mainly nutrient pointsources and in the downstream part of the catchment, theLezat site with mainly non-point-source nutrients. Bothexperimental sites were located on reaches including aWWTP nutrient source, enabling a study of the relativeeffects of point-source and non-point-source nutrientloads on the biogeochemical function. For each reach,two sub-reaches with the same geomorphological char-acteristics were studied: one upstream of the WWTP andthe second downstream of the effluent discharge. Point-source effects on uptake rates may be demonstrated bycomparing processes and biological features (uptake rates,chemistry, metabolism, invertebrates, biofilm) of the twosub-reach. Non-point-source nutrient load effects may bedetermined by comparing the uptake rates and associatedprocesses at a site between the upper and the lowercatchment.
Some previous papers show that increased nutrientloads increase areal nutrient uptake but decrease nutrientuptake efficiencies (longer uptake lengths) (see Paul andMeyer, 2001; Haggard et al., 2005; Gucker et al., 2006). Inthe Leze catchment, we hypothesizes that river nutrientpollution controls biological metabolism and invertebrate
assemblage structure but that these chemical modificationsdo not influence nutrient retention comparing two sub-reaches with the same geomorphological characteristics.
Materials and methods
Study site
The Leze river (10x 24' E, 43x 28' N) is a third-orderstream 70 km long, tributary of the Ariege river, located20 km south-west of Toulouse in southern France. Themean riverbed is approximately 5 m with a slope less than1‰. The watershed is 350 km2, with a total length of 48 kmand a width of around 8 km. This river takes its sourceat the Mondely dam (590 m alt.). From its source tothe confluent with the Ariege river, it drains 135 tribu-taries and crosses two substratum types. The basin topo-graphy can be divided into two parts: the upper part of thebasin in a region of low mountains on calcareous rockand the lower part in an alluvial floodplain with a clay,silt and silica substratum. The density of drainage is1.63 km.kmx2 for the whole watershed, but differs betweenthe upper (2.42 km.kmx2) and lower (1.47 km.kmx2) parts.
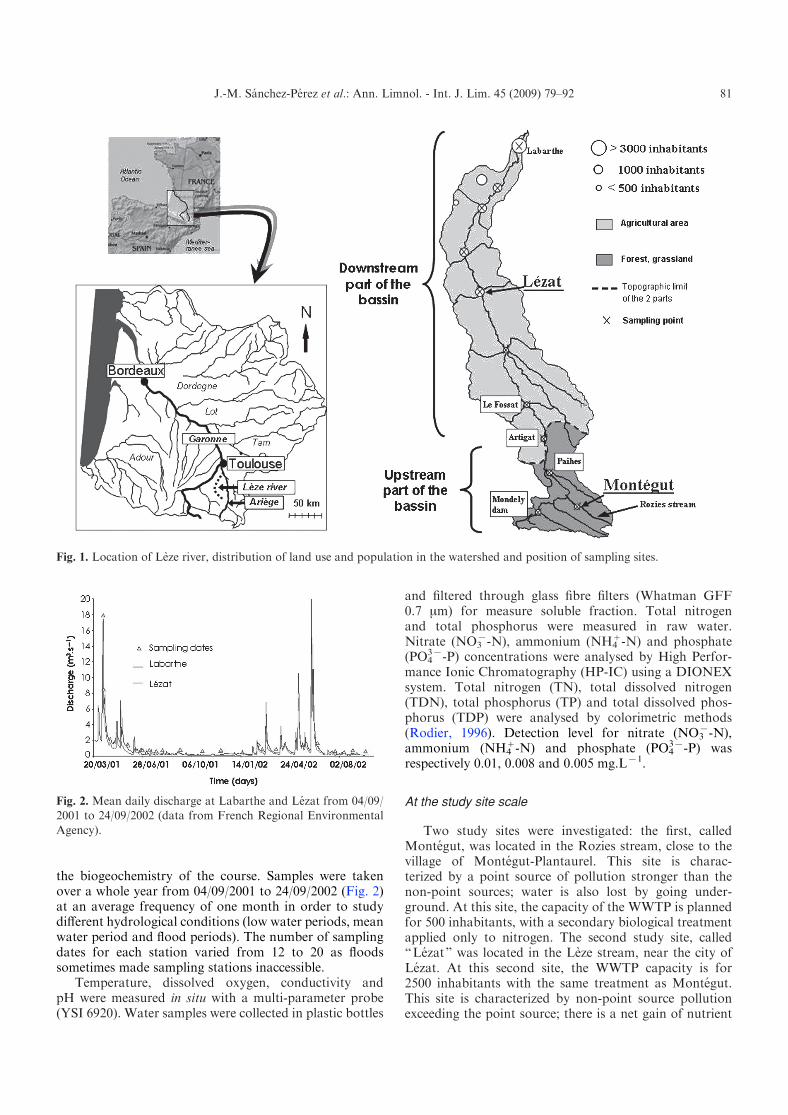
Land use (Fig. 1) indicates the various types of naturaland anthropological areas within the watershed. Morethan 80% of total area of the watershed is agricultural,with mainly cereal crops. Natural areas (woodland, forestand natural grassland) are much more frequent in theupper part of the basin. The population (basin total of24 959 habitants) is mainly in the lower part of the basin ina dozen towns and villages.
Average annual precipitation was 710 mm for 1985–1995 and is generally uniform for the whole basin (Meteo-France data). The annual average temperature is around14 xC with an annual amplitude of 10.5 xC. The hydro-logical regime of the Leze River is pluvial with periods ofrapid floods in springs and a very pronounced low waterperiod which can occurs from the beginning of the summer(June) until winter even until the beginning of the nextspring (March). The Regional Environmental Agencycontinuously measures discharge at two hydrologicalstations (Lezat and Labarthe-sur-Leze). At the Labarthestation, the annual average discharge is 2.06 m3.sx1,with an average discharge during the low-water period of0.14 m3.sx1 and a maximal daily discharge of 110 m3.sx1.The flow is partially controlled during the summer by theMondely dam.
Data collection
Along the whole river
In order to study the biogeochemistry of the river tenstations were selected along the whole length of the LezeRiver (Fig. 1). Three stations are located in the upstreampart of the basin and seven downstream. The Mondelydam station is particular as dam releases could alter
J.-M. Sanchez-Perez et al.: Ann. Limnol. - Int. J. Lim. 45 (2009) 79–9280
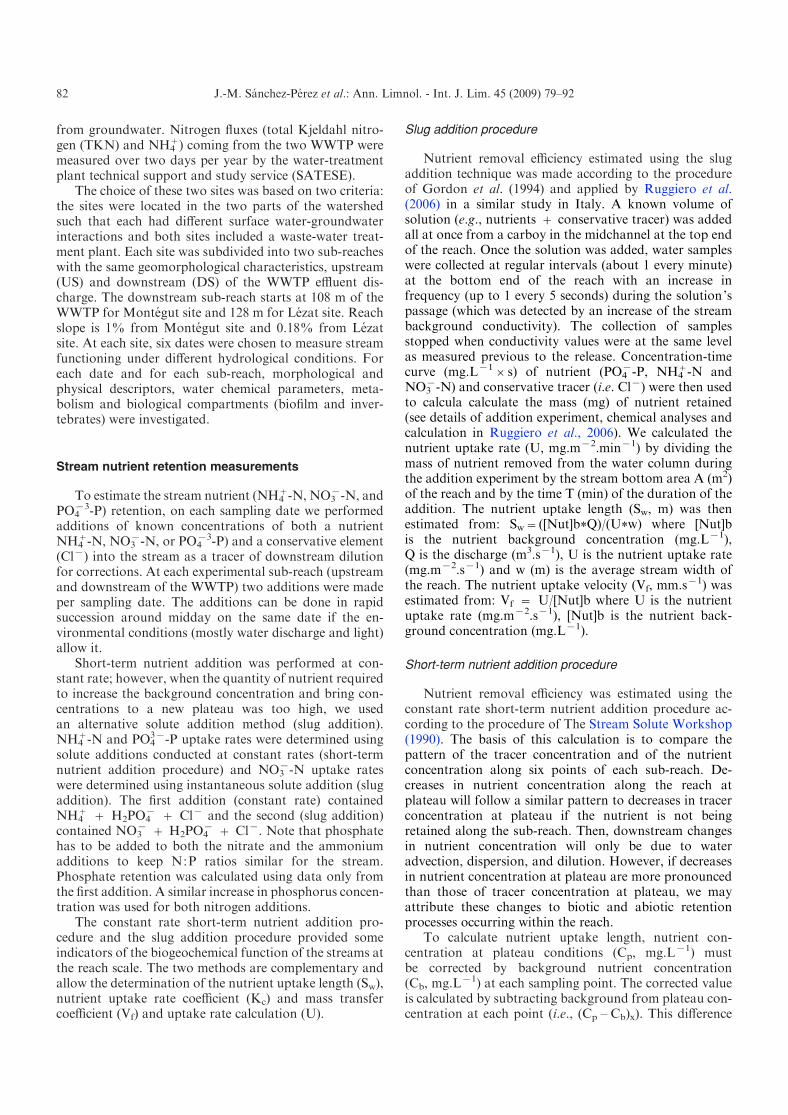
the biogeochemistry of the course. Samples were takenover a whole year from 04/09/2001 to 24/09/2002 (Fig. 2)at an average frequency of one month in order to studydifferent hydrological conditions (low water periods, meanwater period and flood periods). The number of samplingdates for each station varied from 12 to 20 as floodssometimes made sampling stations inaccessible.
Temperature, dissolved oxygen, conductivity andpH were measured in situ with a multi-parameter probe(YSI 6920). Water samples were collected in plastic bottles
and filtered through glass fibre filters (Whatman GFF0.7 mm) for measure soluble fraction. Total nitrogenand total phosphorus were measured in raw water.Nitrate (NO3
x-N), ammonium (NH4+-N) and phosphate
(PO43x-P) concentrations were analysed by High Perfor-
mance Ionic Chromatography (HP-IC) using a DIONEXsystem. Total nitrogen (TN), total dissolved nitrogen(TDN), total phosphorus (TP) and total dissolved phos-phorus (TDP) were analysed by colorimetric methods(Rodier, 1996). Detection level for nitrate (NO3
x-N),ammonium (NH4
+-N) and phosphate (PO43x-P) was
respectively 0.01, 0.008 and 0.005 mg.Lx1.
At the study site scale
Two study sites were investigated: the first, calledMontegut, was located in the Rozies stream, close to thevillage of Montegut-Plantaurel. This site is charac-terized by a point source of pollution stronger than thenon-point sources; water is also lost by going under-ground. At this site, the capacity of the WWTP is plannedfor 500 inhabitants, with a secondary biological treatmentapplied only to nitrogen. The second study site, called“Lezat” was located in the Leze stream, near the city ofLezat. At this second site, the WWTP capacity is for2500 inhabitants with the same treatment as Montegut.This site is characterized by non-point source pollutionexceeding the point source; there is a net gain of nutrient
Fig. 1. Location of Leze river, distribution of land use and population in the watershed and position of sampling sites.
Fig. 2. Mean daily discharge at Labarthe and Lezat from 04/09/2001 to 24/09/2002 (data from French Regional Environmental
Agency).
J.-M. Sanchez-Perez et al.: Ann. Limnol. - Int. J. Lim. 45 (2009) 79–92 81
from groundwater. Nitrogen fluxes (total Kjeldahl nitro-gen (TKN) and NH4
+) coming from the two WWTP weremeasured over two days per year by the water-treatmentplant technical support and study service (SATESE).
The choice of these two sites was based on two criteria:the sites were located in the two parts of the watershedsuch that each had different surface water-groundwaterinteractions and both sites included a waste-water treat-ment plant. Each site was subdivided into two sub-reacheswith the same geomorphological characteristics, upstream(US) and downstream (DS) of the WWTP effluent dis-charge. The downstream sub-reach starts at 108 m of theWWTP for Montegut site and 128 m for Lezat site. Reachslope is 1% from Montegut site and 0.18% from Lezatsite. At each site, six dates were chosen to measure streamfunctioning under different hydrological conditions. Foreach date and for each sub-reach, morphological andphysical descriptors, water chemical parameters, meta-bolism and biological compartments (biofilm and inver-tebrates) were investigated.
Stream nutrient retention measurements
To estimate the stream nutrient (NH4+-N, NO3
x-N, andPO4
x3-P) retention, on each sampling date we performedadditions of known concentrations of both a nutrientNH4
+-N, NO3x-N, or PO4
x3-P) and a conservative element(Clx) into the stream as a tracer of downstream dilutionfor corrections. At each experimental sub-reach (upstreamand downstream of the WWTP) two additions were madeper sampling date. The additions can be done in rapidsuccession around midday on the same date if the en-vironmental conditions (mostly water discharge and light)allow it.
Short-term nutrient addition was performed at con-stant rate; however, when the quantity of nutrient requiredto increase the background concentration and bring con-centrations to a new plateau was too high, we usedan alternative solute addition method (slug addition).NH4
+-N and PO43x-P uptake rates were determined using
solute additions conducted at constant rates (short-termnutrient addition procedure) and NO3
x-N uptake rateswere determined using instantaneous solute addition (slugaddition). The first addition (constant rate) containedNH4
+ + H2PO4x + Clx and the second (slug addition)
contained NO3x + H2PO4
x + Clx. Note that phosphatehas to be added to both the nitrate and the ammoniumadditions to keep N:P ratios similar for the stream.Phosphate retention was calculated using data only fromthe first addition. A similar increase in phosphorus concen-tration was used for both nitrogen additions.
The constant rate short-term nutrient addition pro-cedure and the slug addition procedure provided someindicators of the biogeochemical function of the streams atthe reach scale. The two methods are complementary andallow the determination of the nutrient uptake length (Sw),nutrient uptake rate coefficient (Kc) and mass transfercoefficient (Vf) and uptake rate calculation (U).
Slug addition procedure
Nutrient removal efficiency estimated using the slugaddition technique was made according to the procedureof Gordon et al. (1994) and applied by Ruggiero et al.(2006) in a similar study in Italy. A known volume ofsolution (e.g., nutrients + conservative tracer) was addedall at once from a carboy in the midchannel at the top endof the reach. Once the solution was added, water sampleswere collected at regular intervals (about 1 every minute)at the bottom end of the reach with an increase infrequency (up to 1 every 5 seconds) during the solution’spassage (which was detected by an increase of the streambackground conductivity). The collection of samplesstopped when conductivity values were at the same levelas measured previous to the release. Concentration-timecurve (mg.Lx1rs) of nutrient (PO4
x-P, NH4+-N and
NO3x-N) and conservative tracer (i.e. Clx) were then used
to calcula calculate the mass (mg) of nutrient retained(see details of addition experiment, chemical analyses andcalculation in Ruggiero et al., 2006). We calculated thenutrient uptake rate (U, mg.mx2.minx1) by dividing themass of nutrient removed from the water column duringthe addition experiment by the stream bottom area A (m2)of the reach and by the time T (min) of the duration of theaddition. The nutrient uptake length (Sw, m) was thenestimated from: Sw= ([Nut]b*Q)/(U*w) where [Nut]bis the nutrient background concentration (mg.Lx1),Q is the discharge (m3.sx1), U is the nutrient uptake rate(mg.mx2.sx1) and w (m) is the average stream width ofthe reach. The nutrient uptake velocity (Vf, mm.sx1) wasestimated from: Vf = U/[Nut]b where U is the nutrientuptake rate (mg.mx2.sx1), [Nut]b is the nutrient back-ground concentration (mg.Lx1).
Short-term nutrient addition procedure
Nutrient removal efficiency was estimated using theconstant rate short-term nutrient addition procedure ac-cording to the procedure of The Stream Solute Workshop(1990). The basis of this calculation is to compare thepattern of the tracer concentration and of the nutrientconcentration along six points of each sub-reach. De-creases in nutrient concentration along the reach atplateau will follow a similar pattern to decreases in tracerconcentration at plateau if the nutrient is not beingretained along the sub-reach. Then, downstream changesin nutrient concentration will only be due to wateradvection, dispersion, and dilution. However, if decreasesin nutrient concentration at plateau are more pronouncedthan those of tracer concentration at plateau, we mayattribute these changes to biotic and abiotic retentionprocesses occurring within the reach.
To calculate nutrient uptake length, nutrient con-centration at plateau conditions (Cp, mg.Lx1) mustbe corrected by background nutrient concentration(Cb, mg.Lx1) at each sampling point. The corrected valueis calculated by subtracting background from plateau con-centration at each point (i.e., (Cp – Cb)x). This difference
J.-M. Sanchez-Perez et al.: Ann. Limnol. - Int. J. Lim. 45 (2009) 79–9282
will gradually decrease along the reach if there is some‘loss ’ of nutrient. The tracer concentration also mustbe corrected by subtracting background concentration(Tb, mg.Lx1) from plateau concentration (Tp, mg.Lx1)at each sampling point. If the reach does not have anylateral or vertical water inputs, corrected chloride con-centration (i.e., (Tp – Tb)x) must be similar at all samplingpoints:
LnCpxCb
TpxTb
� �x
¼ xKx:
Once concentrations have been corrected, we calculate theratio of the corrected nutrient over the corrected tracer ateach point. If the nutrient is being biotically or abioticallyremoved, this ratio will follow a negative exponentialcurve along the reach. Assuming a constant uptake ratealong the reach, the following equation describes thechange along the reach of the natural logarithm of thisratio: where K (the slope of this function) is the down-stream nutrient change coefficient (mx1) and x is thedistance of each sampling point from the addition site (m).The negative inverse of K (x1/K) is an estimate of thereach nutrient retention efficiency, expressed in unitsof length. This parameter is the nutrient uptake length(Sw, m). Shorter distances suggest greater nutrient reten-tion efficiency than longer distances.
Variations in water velocity and discharge can influ-ence nutrient uptake length (see Butturini and Sabater,1998). Correcting the value for these hydrologic para-meters is useful to compare this parameter among differentstream ecosystems, or between different dates in a singlestream. Nutrient uptake rate coefficient (Kc, 1/s) describesuptake on a volumetric basis instead of as a flux to thestream bottom. This parameter is related to the nutrientuptake length as follows:
Kc ¼v
Sw
where Sw is the nutrient uptake length (m) and v is theaverage water velocity (m.sx1).
The mass transfer coefficient (Vf, m.sx1) is the verticalvelocity at which a solute migrates through the sediment-water interface. This parameter is related to the uptakerate coefficient (Kc, 1/s) through average water depth(d, m) as follows:
Vf ¼ d �Kc ¼ ðd � vÞ=Sw:
Once we have calculated nutrient uptake length (m),nutrient uptake rate at ambient levels per unit area ofstream bottom can be calculated using the followingequation:
U ¼ Cb �QSw � w � 60
where U is the nutrient uptake rate (mg.mx2.minx1), Cb isthe background nutrient concentration (mg.Lx1), Q isstream discharge (L.sx1), Sw is the nutrient uptake length(m), w is the average stream width in the reach (m), and 60is a constant for converting seconds to minutes.
An alternative formula to calculate nutrient uptakerate at ambient levels based on the nutrient uptake lengthis (Stream Solute Workshop, 1990):
U ¼ Cb � h � vSw
� 60
where U is the nutrient uptake rate (mg.mx2.minx1), Cb isthe background nutrient concentration (mg.mx3), h is thewater average depth (m), v is the average stream watervelocity (m.sx1), Sw is the nutrient uptake length (m), w isthe average stream width in the reach (m), and 60 is aconstant for converting seconds to minutes.
Metabolism measurements
For stream metabolism estimations, three types ofmeasurement were performed: environmental parameters(water temperature, light and discharge), re-aeration ratesand dissolved oxygen concentrations in the upstream anddownstream parts of each sub-reach. Water temperaturewas recorded at 15 minute intervals with a YSI probe.Global sunlight irradiation (mol.mx2.dx1) were measuredat the Muret station by Meteo France (the national met-eorological office) i.e. 10 km from Lezat site. Dischargedata were provided by the French Regional Environ-mental Agency for the Lezat and Labarthe sites.
Re-aeration rates were determined experimentally atthe Montegut site using butane injections (Marzolf et al.,1994). The re-aeration rates obtained were compared toempirical estimations (O’Connor andDobbins, 1958; Owenset al., 1964; Isaacs and Gaudy, 1968) using water velocityand depth, to determine the most suitable method for in situKoxy measurement. According to Marzolf et al. (1994), Koxy
(minx1) from butane injection is calculated as follows:
Koxy ¼ S � V � 60 � FS (mx1) is the slope of the plot of Ln (butane/chloride)versus the distance from the injection point, V (m.sx1) isthe average water velocity, and F is the factor used toconvert butane diffusion rates into oxygen diffusion rates(F=1.82, Rathbun et al., 1978). Since Koxy rates obtainedwith Owens et al. (1964) empirical method best fitted ourmeasured values and as this method is recommended whenwater velocity is between 0.3 and 0.5 m.sx1 and depthbetween 0.2 and 0.3 m (Chapra et al., 1997), we used itto estimate the re-aeration rates for the other dates. Atthe Lezat site, the lack of butane injection results did notenable us to validate a specific method for re-aeration rateestimation and, considering the stream’s prevailing hy-draulic conditions, the method of Thyssen et al. (1987) wasapplied. Koxy were corrected as a function of water tem-perature (T') using:
KoxyðT'Þ ¼ KoxyðTÞ � ð1þ ððT'� TÞ � 0:0241ÞÞ:Gross primary production rate (GPP), net primary pro-duction NPP (GPP – R) and ecosystem respiration (R)were estimated using the upstream-downstream diurnaldissolved oxygen change technique (Marzolf et al., 1994;Young and Huryn, 1998; Mulholland et al., 2001).
J.-M. Sanchez-Perez et al.: Ann. Limnol. - Int. J. Lim. 45 (2009) 79–92 83
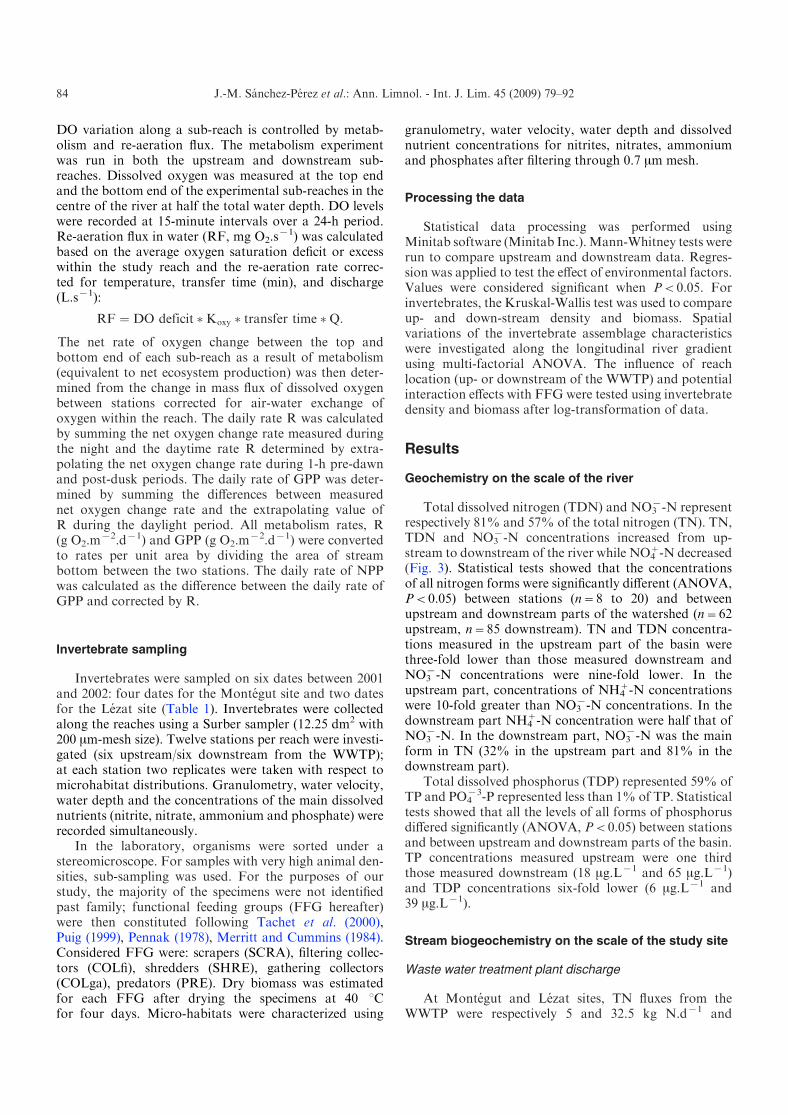
DO variation along a sub-reach is controlled by metab-olism and re-aeration flux. The metabolism experimentwas run in both the upstream and downstream sub-reaches. Dissolved oxygen was measured at the top endand the bottom end of the experimental sub-reaches in thecentre of the river at half the total water depth. DO levelswere recorded at 15-minute intervals over a 24-h period.Re-aeration flux in water (RF, mg O2.s
x1) was calculatedbased on the average oxygen saturation deficit or excesswithin the study reach and the re-aeration rate correc-ted for temperature, transfer time (min), and discharge(L.sx1):
RF ¼ DO deficit �Koxy � transfer time �Q:
The net rate of oxygen change between the top andbottom end of each sub-reach as a result of metabolism(equivalent to net ecosystem production) was then deter-mined from the change in mass flux of dissolved oxygenbetween stations corrected for air-water exchange ofoxygen within the reach. The daily rate R was calculatedby summing the net oxygen change rate measured duringthe night and the daytime rate R determined by extra-polating the net oxygen change rate during 1-h pre-dawnand post-dusk periods. The daily rate of GPP was deter-mined by summing the differences between measurednet oxygen change rate and the extrapolating value ofR during the daylight period. All metabolism rates, R(g O2.m
x2.dx1) and GPP (g O2.mx2.dx1) were converted
to rates per unit area by dividing the area of streambottom between the two stations. The daily rate of NPPwas calculated as the difference between the daily rate ofGPP and corrected by R.
Invertebrate sampling
Invertebrates were sampled on six dates between 2001and 2002: four dates for the Montegut site and two datesfor the Lezat site (Table 1). Invertebrates were collectedalong the reaches using a Surber sampler (12.25 dm2 with200 mm-mesh size). Twelve stations per reach were investi-gated (six upstream/six downstream from the WWTP);at each station two replicates were taken with respect tomicrohabitat distributions. Granulometry, water velocity,water depth and the concentrations of the main dissolvednutrients (nitrite, nitrate, ammonium and phosphate) wererecorded simultaneously.
In the laboratory, organisms were sorted under astereomicroscope. For samples with very high animal den-sities, sub-sampling was used. For the purposes of ourstudy, the majority of the specimens were not identifiedpast family; functional feeding groups (FFG hereafter)were then constituted following Tachet et al. (2000),Puig (1999), Pennak (1978), Merritt and Cummins (1984).Considered FFG were: scrapers (SCRA), filtering collec-tors (COLfi), shredders (SHRE), gathering collectors(COLga), predators (PRE). Dry biomass was estimatedfor each FFG after drying the specimens at 40 xCfor four days. Micro-habitats were characterized using
granulometry, water velocity, water depth and dissolvednutrient concentrations for nitrites, nitrates, ammoniumand phosphates after filtering through 0.7 mm mesh.
Processing the data
Statistical data processing was performed usingMinitab software (Minitab Inc.).Mann-Whitney tests wererun to compare upstream and downstream data. Regres-sion was applied to test the effect of environmental factors.Values were considered significant when P<0.05. Forinvertebrates, the Kruskal-Wallis test was used to compareup- and down-stream density and biomass. Spatialvariations of the invertebrate assemblage characteristicswere investigated along the longitudinal river gradientusing multi-factorial ANOVA. The influence of reachlocation (up- or downstream of the WWTP) and potentialinteraction effects with FFG were tested using invertebratedensity and biomass after log-transformation of data.
Results
Geochemistry on the scale of the river
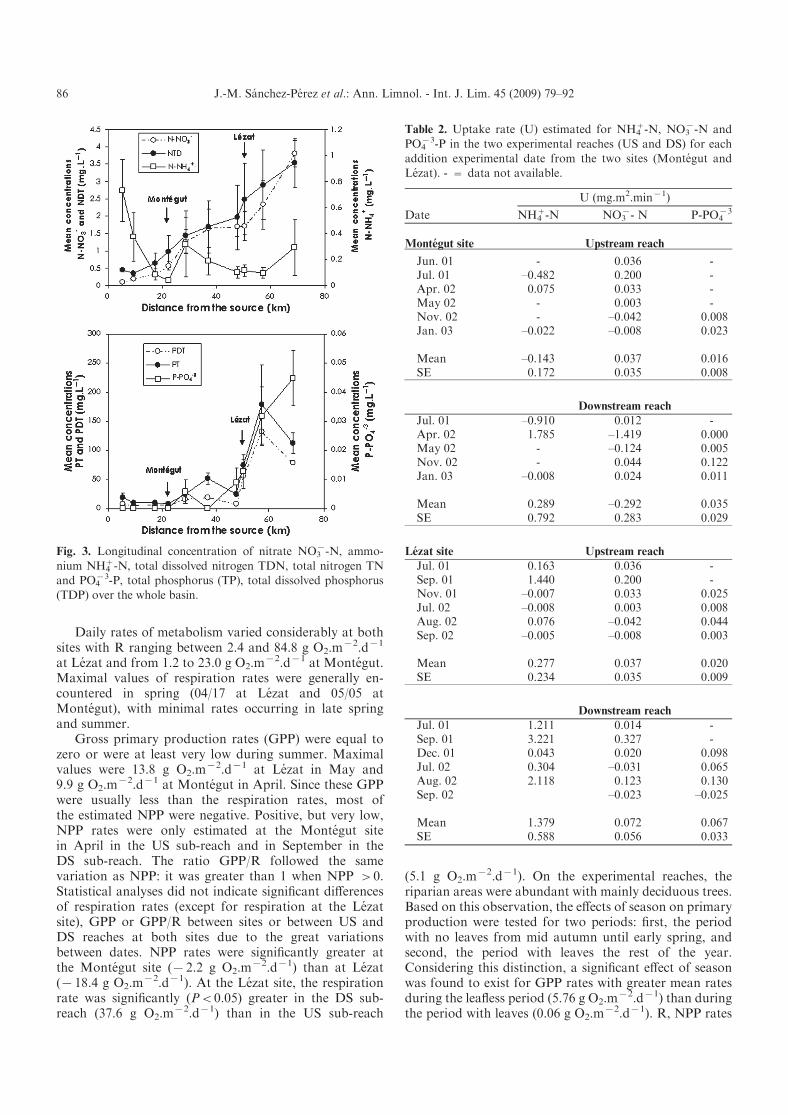
Total dissolved nitrogen (TDN) and NO3x-N represent
respectively 81% and 57% of the total nitrogen (TN). TN,TDN and NO3
x-N concentrations increased from up-stream to downstream of the river while NO4
+-N decreased(Fig. 3). Statistical tests showed that the concentrationsof all nitrogen forms were significantly different (ANOVA,P<0.05) between stations (n=8 to 20) and betweenupstream and downstream parts of the watershed (n=62upstream, n=85 downstream). TN and TDN concentra-tions measured in the upstream part of the basin werethree-fold lower than those measured downstream andNO3
x-N concentrations were nine-fold lower. In theupstream part, concentrations of NH4
+-N concentrationswere 10-fold greater than NO3
x-N concentrations. In thedownstream part NH4
+-N concentration were half that ofNO3
x-N. In the downstream part, NO3x-N was the main
form in TN (32% in the upstream part and 81% in thedownstream part).
Total dissolved phosphorus (TDP) represented 59% ofTP and PO4
x3-P represented less than 1% of TP. Statisticaltests showed that all the levels of all forms of phosphorusdiffered significantly (ANOVA, P<0.05) between stationsand between upstream and downstream parts of the basin.TP concentrations measured upstream were one thirdthose measured downstream (18 mg.Lx1 and 65 mg.Lx1)and TDP concentrations six-fold lower (6 mg.Lx1 and39 mg.Lx1).
Stream biogeochemistry on the scale of the study site
Waste water treatment plant discharge
At Montegut and Lezat sites, TN fluxes from theWWTP were respectively 5 and 32.5 kg N.dx1 and
J.-M. Sanchez-Perez et al.: Ann. Limnol. - Int. J. Lim. 45 (2009) 79–9284
NH4+-N fluxes, 5 and 25 kg N.dx1. So, the results showed
that N-org fluxes, obtained by the difference between TNand NH4
+-N fluxes, were near 0 kg N.dx1 from MontegutWWTP and around 7.5 kg N.dx1 at Lezat. At Montegutand Lezat sites, with mean discharges during experimentsof 0.07 L.sx1 and 0.12 L.sx1 respectively, mean fluxescirculating in the river were respectively 0.6 kg N.dx1 and4.1 kg N.dx1 for NH4
+ and 1.2 and 2.0 kg N.dx1 forN-org.
Stream nutrient retention
Uptake rate ranged from –1.419 mg.mx2.minx1
(NO3x-N, DS reach, April) to 1.785 (NH4
+-N, DS reach,April) at the Montegut site and from –0.025 (PO4
x3-P,DS reach, September) to 3.221 (NH4
+-N, DS reach,September) at the Lezat site (Table 2). On average, uptakerate was higher in downstream sub-reaches than in up-stream sub-reaches for NH4
+-N and PO4x3-P at both sites
and for NO3x-N at Lezat, but this difference was not
statistically significant (ANOVA, P >0.05). Uptake ratesdid not differ between sites for any nutrients (ANOVA,P>0.05).
Metabolism
Rates of respiration (R, g O2.mx2.dx1) and net pri-
mary production (NPP, g O2.mx2.dx1) estimated for both
experimental sites are reported in Table 3. During thestudy periods, discharge ranged between 86 and 414 L.sx1
at Lezat site and between 15 and 116 L.sx1 at Montegutsite. The experimental distance between the top andbottom ends of the sub-reaches ranged from 168 m to236 m at Lezat and 106 to 159 m at Montegut dependingon the water velocity. Water travel time was between9.2 and 18 min at Lezat and between 3.8 and 88 min atMontegut. Daily solar radiation for the experimental datesvaried from 9.9 to 42.7 mol.mx2.dx1.
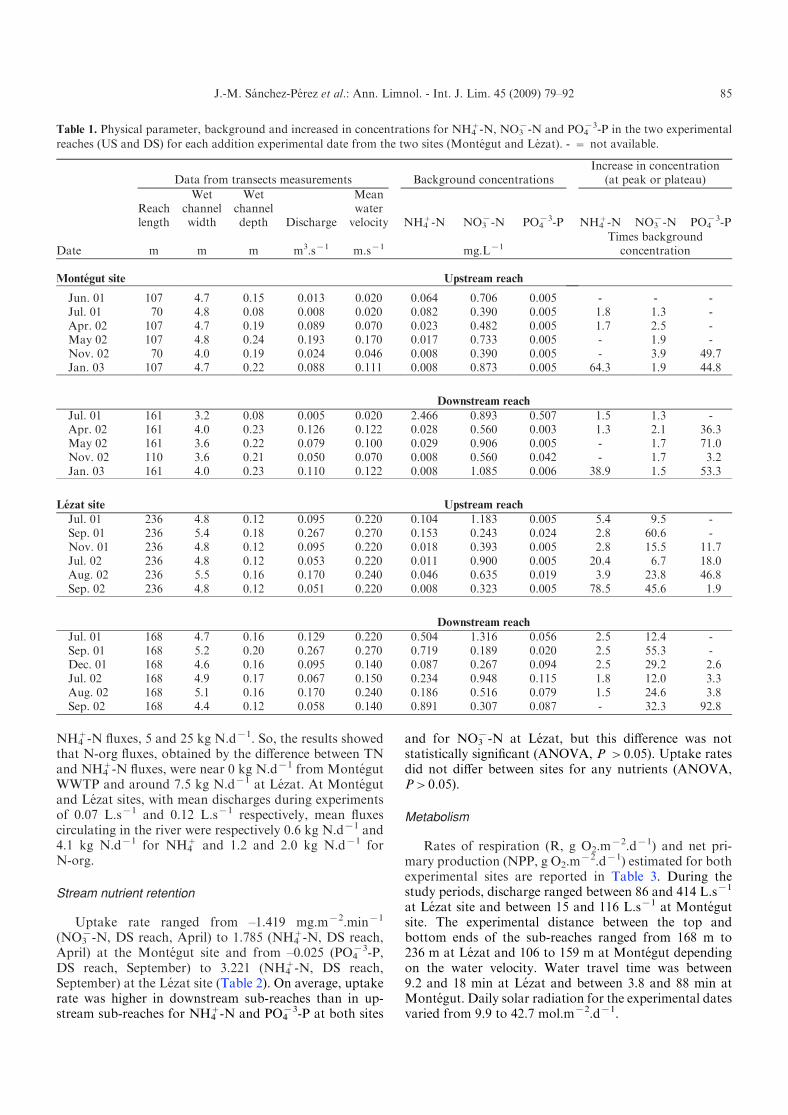
Table 1. Physical parameter, background and increased in concentrations for NH4+-N, NO3
x-N and PO4x3-P in the two experimental
reaches (US and DS) for each addition experimental date from the two sites (Montegut and Lezat). - = not available.
Date
Data from transects measurements Background concentrationsIncrease in concentration
(at peak or plateau)
Reachlength
Wetchannelwidth
Wetchanneldepth Discharge
Meanwatervelocity NH4
+-N NO3x-N PO4
x3-P NH4+-N NO3
x-N PO4x3-P
m m m m3.sx1 m.sx1 mg.Lx1Times background
concentration
Montegut site Upstream reach
Jun. 01 107 4.7 0.15 0.013 0.020 0.064 0.706 0.005 - - -Jul. 01 70 4.8 0.08 0.008 0.020 0.082 0.390 0.005 1.8 1.3 -Apr. 02 107 4.7 0.19 0.089 0.070 0.023 0.482 0.005 1.7 2.5 -May 02 107 4.8 0.24 0.193 0.170 0.017 0.733 0.005 - 1.9 -Nov. 02 70 4.0 0.19 0.024 0.046 0.008 0.390 0.005 - 3.9 49.7Jan. 03 107 4.7 0.22 0.088 0.111 0.008 0.873 0.005 64.3 1.9 44.8
Downstream reach
Jul. 01 161 3.2 0.08 0.005 0.020 2.466 0.893 0.507 1.5 1.3 -Apr. 02 161 4.0 0.23 0.126 0.122 0.028 0.560 0.003 1.3 2.1 36.3May 02 161 3.6 0.22 0.079 0.100 0.029 0.906 0.005 - 1.7 71.0Nov. 02 110 3.6 0.21 0.050 0.070 0.008 0.560 0.042 - 1.7 3.2Jan. 03 161 4.0 0.23 0.110 0.122 0.008 1.085 0.006 38.9 1.5 53.3
Lezat site Upstream reach
Jul. 01 236 4.8 0.12 0.095 0.220 0.104 1.183 0.005 5.4 9.5 -Sep. 01 236 5.4 0.18 0.267 0.270 0.153 0.243 0.024 2.8 60.6 -Nov. 01 236 4.8 0.12 0.095 0.220 0.018 0.393 0.005 2.8 15.5 11.7Jul. 02 236 4.8 0.12 0.053 0.220 0.011 0.900 0.005 20.4 6.7 18.0Aug. 02 236 5.5 0.16 0.170 0.240 0.046 0.635 0.019 3.9 23.8 46.8Sep. 02 236 4.8 0.12 0.051 0.220 0.008 0.323 0.005 78.5 45.6 1.9
Downstream reach
Jul. 01 168 4.7 0.16 0.129 0.220 0.504 1.316 0.056 2.5 12.4 -Sep. 01 168 5.2 0.20 0.267 0.270 0.719 0.189 0.020 2.5 55.3 -Dec. 01 168 4.6 0.16 0.095 0.140 0.087 0.267 0.094 2.5 29.2 2.6Jul. 02 168 4.9 0.17 0.067 0.150 0.234 0.948 0.115 1.8 12.0 3.3Aug. 02 168 5.1 0.16 0.170 0.240 0.186 0.516 0.079 1.5 24.6 3.8Sep. 02 168 4.4 0.12 0.058 0.140 0.891 0.307 0.087 - 32.3 92.8
J.-M. Sanchez-Perez et al.: Ann. Limnol. - Int. J. Lim. 45 (2009) 79–92 85
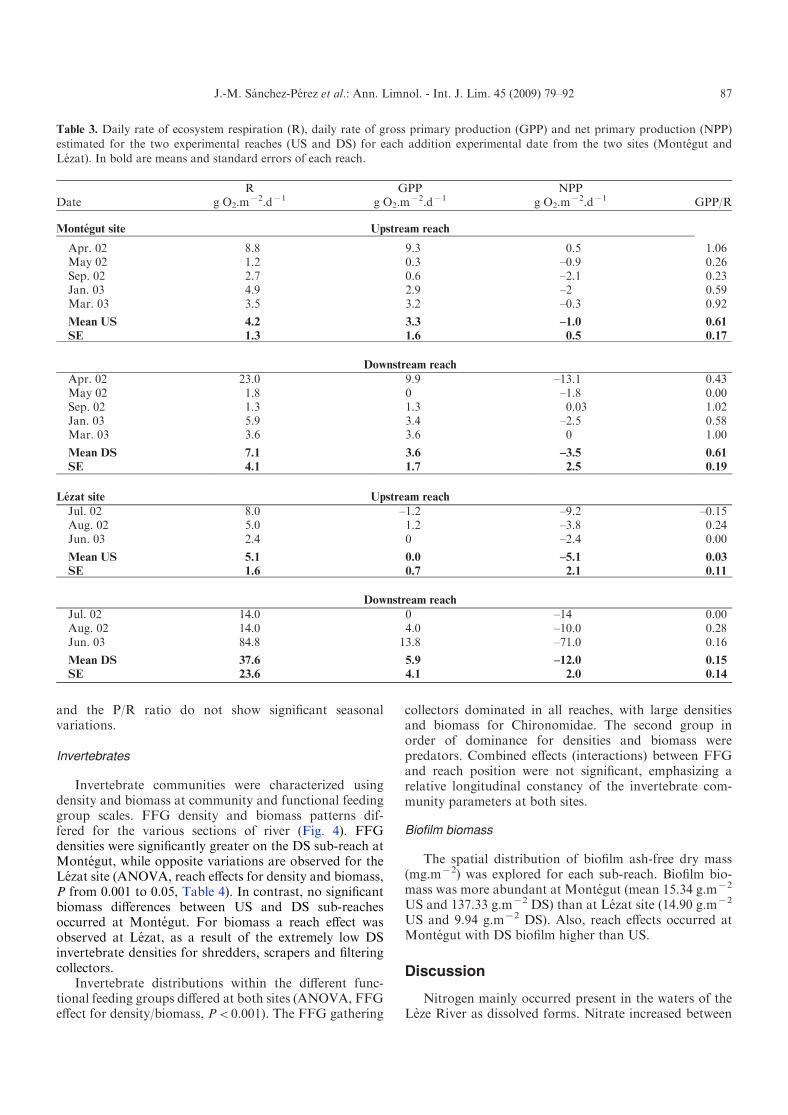
Daily rates of metabolism varied considerably at bothsites with R ranging between 2.4 and 84.8 g O2.m
x2.dx1
at Lezat and from 1.2 to 23.0 g O2.mx2.dx1 at Montegut.
Maximal values of respiration rates were generally en-countered in spring (04/17 at Lezat and 05/05 atMontegut), with minimal rates occurring in late springand summer.
Gross primary production rates (GPP) were equal tozero or were at least very low during summer. Maximalvalues were 13.8 g O2.m
x2.dx1 at Lezat in May and9.9 g O2.m
x2.dx1 at Montegut in April. Since these GPPwere usually less than the respiration rates, most ofthe estimated NPP were negative. Positive, but very low,NPP rates were only estimated at the Montegut sitein April in the US sub-reach and in September in theDS sub-reach. The ratio GPP/R followed the samevariation as NPP: it was greater than 1 when NPP >0.Statistical analyses did not indicate significant differencesof respiration rates (except for respiration at the Lezatsite), GPP or GPP/R between sites or between US andDS reaches at both sites due to the great variationsbetween dates. NPP rates were significantly greater atthe Montegut site (x2.2 g O2.m
x2.dx1) than at Lezat(x18.4 g O2.m
x2.dx1). At the Lezat site, the respirationrate was significantly (P<0.05) greater in the DS sub-reach (37.6 g O2.m
x2.dx1) than in the US sub-reach
(5.1 g O2.mx2.dx1). On the experimental reaches, the
riparian areas were abundant with mainly deciduous trees.Based on this observation, the effects of season on primaryproduction were tested for two periods: first, the periodwith no leaves from mid autumn until early spring, andsecond, the period with leaves the rest of the year.Considering this distinction, a significant effect of seasonwas found to exist for GPP rates with greater mean ratesduring the leafless period (5.76 g O2.m
x2.dx1) than duringthe period with leaves (0.06 g O2.m
x2.dx1). R, NPP rates
Table 2. Uptake rate (U) estimated for NH4+-N, NO3
x-N and
PO4x3-P in the two experimental reaches (US and DS) for each
addition experimental date from the two sites (Montegut andLezat). - = data not available.
Date
U (mg.m2.minx1)
NH4+-N NO3
x- N P-PO4x3
Montegut site Upstream reach
Jun. 01 - 0.036 -Jul. 01 –0.482 0.200 -Apr. 02 0.075 0.033 -May 02 - 0.003 -Nov. 02 - –0.042 0.008Jan. 03 –0.022 –0.008 0.023
Mean –0.143 0.037 0.016SE 0.172 0.035 0.008
Downstream reach
Jul. 01 –0.910 0.012 -Apr. 02 1.785 –1.419 0.000May 02 - –0.124 0.005Nov. 02 - 0.044 0.122Jan. 03 –0.008 0.024 0.011
Mean 0.289 –0.292 0.035SE 0.792 0.283 0.029
Lezat site Upstream reach
Jul. 01 0.163 0.036 -Sep. 01 1.440 0.200 -Nov. 01 –0.007 0.033 0.025Jul. 02 –0.008 0.003 0.008Aug. 02 0.076 –0.042 0.044Sep. 02 –0.005 –0.008 0.003
Mean 0.277 0.037 0.020SE 0.234 0.035 0.009
Downstream reach
Jul. 01 1.211 0.014 -Sep. 01 3.221 0.327 -Dec. 01 0.043 0.020 0.098Jul. 02 0.304 –0.031 0.065Aug. 02 2.118 0.123 0.130Sep. 02 –0.023 –0.025
Mean 1.379 0.072 0.067SE 0.588 0.056 0.033
Fig. 3. Longitudinal concentration of nitrate NO3x-N, ammo-
nium NH4+-N, total dissolved nitrogen TDN, total nitrogen TN
and PO4x3-P, total phosphorus (TP), total dissolved phosphorus
(TDP) over the whole basin.
J.-M. Sanchez-Perez et al.: Ann. Limnol. - Int. J. Lim. 45 (2009) 79–9286
and the P/R ratio do not show significant seasonalvariations.
Invertebrates
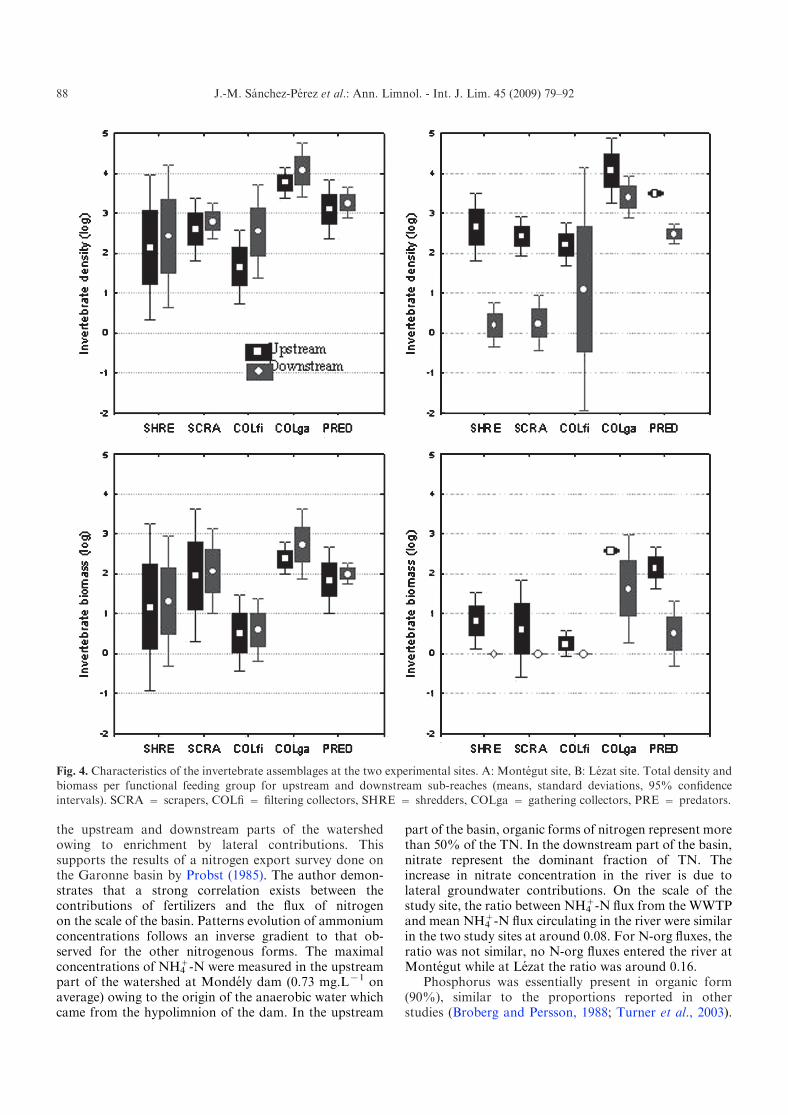
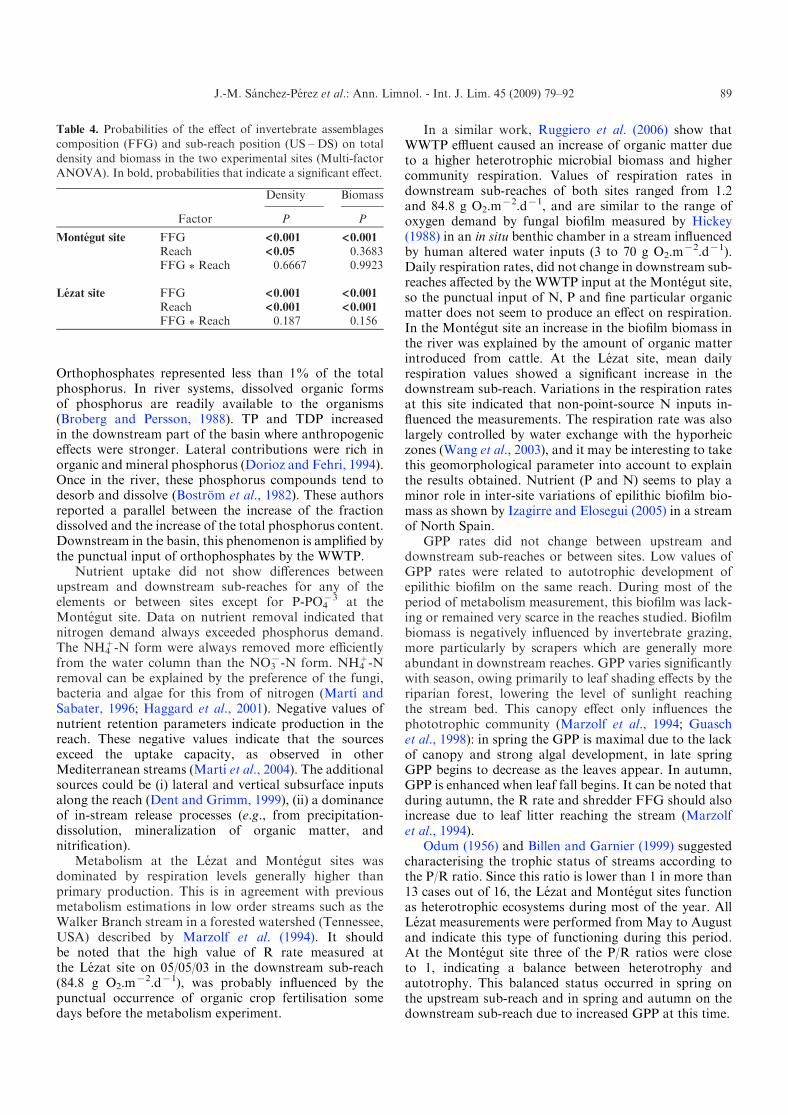
Invertebrate communities were characterized usingdensity and biomass at community and functional feedinggroup scales. FFG density and biomass patterns dif-fered for the various sections of river (Fig. 4). FFGdensities were significantly greater on the DS sub-reach atMontegut, while opposite variations are observed for theLezat site (ANOVA, reach effects for density and biomass,P from 0.001 to 0.05, Table 4). In contrast, no significantbiomass differences between US and DS sub-reachesoccurred at Montegut. For biomass a reach effect wasobserved at Lezat, as a result of the extremely low DSinvertebrate densities for shredders, scrapers and filteringcollectors.
Invertebrate distributions within the different func-tional feeding groups differed at both sites (ANOVA, FFGeffect for density/biomass, P<0.001). The FFG gathering
collectors dominated in all reaches, with large densitiesand biomass for Chironomidae. The second group inorder of dominance for densities and biomass werepredators. Combined effects (interactions) between FFGand reach position were not significant, emphasizing arelative longitudinal constancy of the invertebrate com-munity parameters at both sites.
Biofilm biomass
The spatial distribution of biofilm ash-free dry mass(mg.mx2) was explored for each sub-reach. Biofilm bio-mass was more abundant at Montegut (mean 15.34 g.mx2
US and 137.33 g.mx2 DS) than at Lezat site (14.90 g.mx2
US and 9.94 g.mx2 DS). Also, reach effects occurred atMontegut with DS biofilm higher than US.
Discussion
Nitrogen mainly occurred present in the waters of theLeze River as dissolved forms. Nitrate increased between
Table 3. Daily rate of ecosystem respiration (R), daily rate of gross primary production (GPP) and net primary production (NPP)
estimated for the two experimental reaches (US and DS) for each addition experimental date from the two sites (Montegut andLezat). In bold are means and standard errors of each reach.
DateR
g O2.mx2.dx1
GPPg O2.m
x2.dx1NPP
g O2.mx2.dx1 GPP/R
Montegut site Upstream reach
Apr. 02 8.8 9.3 0.5 1.06May 02 1.2 0.3 –0.9 0.26Sep. 02 2.7 0.6 –2.1 0.23Jan. 03 4.9 2.9 –2 0.59Mar. 03 3.5 3.2 –0.3 0.92
Mean US 4.2 3.3 –1.0 0.61
SE 1.3 1.6 0.5 0.17
Downstream reach
Apr. 02 23.0 9.9 –13.1 0.43May 02 1.8 0 –1.8 0.00Sep. 02 1.3 1.3 0.03 1.02Jan. 03 5.9 3.4 –2.5 0.58Mar. 03 3.6 3.6 0 1.00
Mean DS 7.1 3.6 –3.5 0.61
SE 4.1 1.7 2.5 0.19
Lezat site Upstream reach
Jul. 02 8.0 –1.2 –9.2 –0.15Aug. 02 5.0 1.2 –3.8 0.24Jun. 03 2.4 0 –2.4 0.00
Mean US 5.1 0.0 –5.1 0.03
SE 1.6 0.7 2.1 0.11
Downstream reach
Jul. 02 14.0 0 –14 0.00Aug. 02 14.0 4.0 –10.0 0.28Jun. 03 84.8 13.8 –71.0 0.16
Mean DS 37.6 5.9 –12.0 0.15
SE 23.6 4.1 2.0 0.14
J.-M. Sanchez-Perez et al.: Ann. Limnol. - Int. J. Lim. 45 (2009) 79–92 87
the upstream and downstream parts of the watershedowing to enrichment by lateral contributions. Thissupports the results of a nitrogen export survey done onthe Garonne basin by Probst (1985). The author demon-strates that a strong correlation exists between thecontributions of fertilizers and the flux of nitrogenon the scale of the basin. Patterns evolution of ammoniumconcentrations follows an inverse gradient to that ob-served for the other nitrogenous forms. The maximalconcentrations of NH4
+-N were measured in the upstreampart of the watershed at Mondely dam (0.73 mg.Lx1 onaverage) owing to the origin of the anaerobic water whichcame from the hypolimnion of the dam. In the upstream
part of the basin, organic forms of nitrogen represent morethan 50% of the TN. In the downstream part of the basin,nitrate represent the dominant fraction of TN. Theincrease in nitrate concentration in the river is due tolateral groundwater contributions. On the scale of thestudy site, the ratio between NH4
+-N flux from the WWTPand mean NH4
+-N flux circulating in the river were similarin the two study sites at around 0.08. For N-org fluxes, theratio was not similar, no N-org fluxes entered the river atMontegut while at Lezat the ratio was around 0.16.
Phosphorus was essentially present in organic form(90%), similar to the proportions reported in otherstudies (Broberg and Persson, 1988; Turner et al., 2003).
Fig. 4. Characteristics of the invertebrate assemblages at the two experimental sites. A: Montegut site, B: Lezat site. Total density andbiomass per functional feeding group for upstream and downstream sub-reaches (means, standard deviations, 95% confidenceintervals). SCRA = scrapers, COLfi = filtering collectors, SHRE = shredders, COLga = gathering collectors, PRE = predators.
J.-M. Sanchez-Perez et al.: Ann. Limnol. - Int. J. Lim. 45 (2009) 79–9288
Orthophosphates represented less than 1% of the totalphosphorus. In river systems, dissolved organic formsof phosphorus are readily available to the organisms(Broberg and Persson, 1988). TP and TDP increasedin the downstream part of the basin where anthropogeniceffects were stronger. Lateral contributions were rich inorganic and mineral phosphorus (Dorioz and Fehri, 1994).Once in the river, these phosphorus compounds tend todesorb and dissolve (Bostrom et al., 1982). These authorsreported a parallel between the increase of the fractiondissolved and the increase of the total phosphorus content.Downstream in the basin, this phenomenon is amplified bythe punctual input of orthophosphates by the WWTP.
Nutrient uptake did not show differences betweenupstream and downstream sub-reaches for any of theelements or between sites except for P-PO4
x3 at theMontegut site. Data on nutrient removal indicated thatnitrogen demand always exceeded phosphorus demand.The NH4
+-N form were always removed more efficientlyfrom the water column than the NO3
x-N form. NH4+-N
removal can be explained by the preference of the fungi,bacteria and algae for this from of nitrogen (Martı andSabater, 1996; Haggard et al., 2001). Negative values ofnutrient retention parameters indicate production in thereach. These negative values indicate that the sourcesexceed the uptake capacity, as observed in otherMediterranean streams (Martı et al., 2004). The additionalsources could be (i) lateral and vertical subsurface inputsalong the reach (Dent and Grimm, 1999), (ii) a dominanceof in-stream release processes (e.g., from precipitation-dissolution, mineralization of organic matter, andnitrification).
Metabolism at the Lezat and Montegut sites wasdominated by respiration levels generally higher thanprimary production. This is in agreement with previousmetabolism estimations in low order streams such as theWalker Branch stream in a forested watershed (Tennessee,USA) described by Marzolf et al. (1994). It shouldbe noted that the high value of R rate measured atthe Lezat site on 05/05/03 in the downstream sub-reach(84.8 g O2.m
x2.dx1), was probably influenced by thepunctual occurrence of organic crop fertilisation somedays before the metabolism experiment.
In a similar work, Ruggiero et al. (2006) show thatWWTP effluent caused an increase of organic matter dueto a higher heterotrophic microbial biomass and highercommunity respiration. Values of respiration rates indownstream sub-reaches of both sites ranged from 1.2and 84.8 g O2.m
x2.dx1, and are similar to the range ofoxygen demand by fungal biofilm measured by Hickey(1988) in an in situ benthic chamber in a stream influencedby human altered water inputs (3 to 70 g O2.m
x2.dx1).Daily respiration rates, did not change in downstream sub-reaches affected by the WWTP input at the Montegut site,so the punctual input of N, P and fine particular organicmatter does not seem to produce an effect on respiration.In the Montegut site an increase in the biofilm biomass inthe river was explained by the amount of organic matterintroduced from cattle. At the Lezat site, mean dailyrespiration values showed a significant increase in thedownstream sub-reach. Variations in the respiration ratesat this site indicated that non-point-source N inputs in-fluenced the measurements. The respiration rate was alsolargely controlled by water exchange with the hyporheiczones (Wang et al., 2003), and it may be interesting to takethis geomorphological parameter into account to explainthe results obtained. Nutrient (P and N) seems to play aminor role in inter-site variations of epilithic biofilm bio-mass as shown by Izagirre and Elosegui (2005) in a streamof North Spain.
GPP rates did not change between upstream anddownstream sub-reaches or between sites. Low values ofGPP rates were related to autotrophic development ofepilithic biofilm on the same reach. During most of theperiod of metabolism measurement, this biofilm was lack-ing or remained very scarce in the reaches studied. Biofilmbiomass is negatively influenced by invertebrate grazing,more particularly by scrapers which are generally moreabundant in downstream reaches. GPP varies significantlywith season, owing primarily to leaf shading effects by theriparian forest, lowering the level of sunlight reachingthe stream bed. This canopy effect only influences thephototrophic community (Marzolf et al., 1994; Guaschet al., 1998): in spring the GPP is maximal due to the lackof canopy and strong algal development, in late springGPP begins to decrease as the leaves appear. In autumn,GPP is enhanced when leaf fall begins. It can be noted thatduring autumn, the R rate and shredder FFG should alsoincrease due to leaf litter reaching the stream (Marzolfet al., 1994).
Odum (1956) and Billen and Garnier (1999) suggestedcharacterising the trophic status of streams according tothe P/R ratio. Since this ratio is lower than 1 in more than13 cases out of 16, the Lezat and Montegut sites functionas heterotrophic ecosystems during most of the year. AllLezat measurements were performed from May to Augustand indicate this type of functioning during this period.At the Montegut site three of the P/R ratios were closeto 1, indicating a balance between heterotrophy andautotrophy. This balanced status occurred in spring onthe upstream sub-reach and in spring and autumn on thedownstream sub-reach due to increased GPP at this time.
Table 4. Probabilities of the effect of invertebrate assemblages
composition (FFG) and sub-reach position (US – DS) on totaldensity and biomass in the two experimental sites (Multi-factorANOVA). In bold, probabilities that indicate a significant effect.
Density Biomass
Factor P P
Montegut site FFG <0.001 <0.001Reach <0.05 0.3683FFG * Reach 0.6667 0.9923
Lezat site FFG <0.001 <0.001Reach <0.001 <0.001FFG * Reach 0.187 0.156
J.-M. Sanchez-Perez et al.: Ann. Limnol. - Int. J. Lim. 45 (2009) 79–92 89
Exploration of the functional characteristics of theexperimental sites reveals that, on a local scale, WWTPinputs had no effect on respiration or primary produc-tion. Non-local pollution sources added to local nutrientsources appeared more efficient at increasing respiration.Primary production is explained by a seasonal variationof GPP that overlapped the effect of sites location andof WWTP. WWTP and site location influenced biofilmbiomass. P/R<<1 everywhere indicates heterotrophy atboth sites and Lezat, located lower in the watershed, ismore heterotrophic than Montegut.
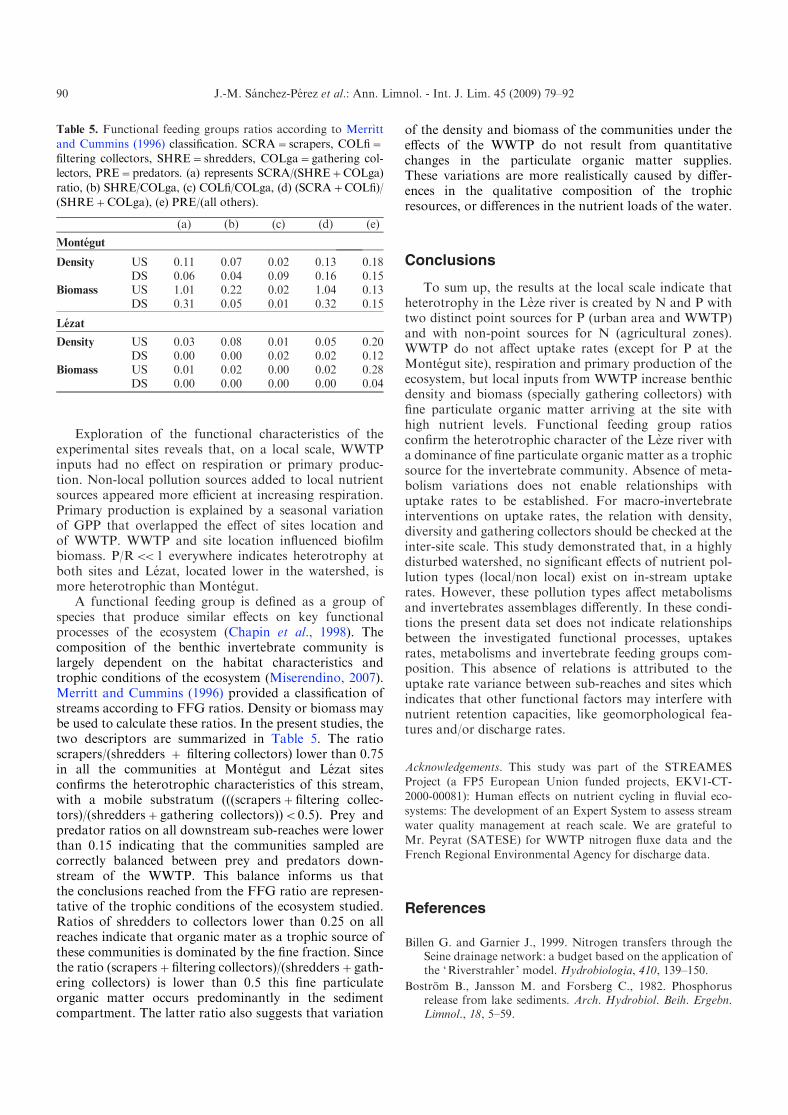
A functional feeding group is defined as a group ofspecies that produce similar effects on key functionalprocesses of the ecosystem (Chapin et al., 1998). Thecomposition of the benthic invertebrate community islargely dependent on the habitat characteristics andtrophic conditions of the ecosystem (Miserendino, 2007).Merritt and Cummins (1996) provided a classification ofstreams according to FFG ratios. Density or biomass maybe used to calculate these ratios. In the present studies, thetwo descriptors are summarized in Table 5. The ratioscrapers/(shredders + filtering collectors) lower than 0.75in all the communities at Montegut and Lezat sitesconfirms the heterotrophic characteristics of this stream,with a mobile substratum (((scrapers+filtering collec-tors)/(shredders+gathering collectors))<0.5). Prey andpredator ratios on all downstream sub-reaches were lowerthan 0.15 indicating that the communities sampled arecorrectly balanced between prey and predators down-stream of the WWTP. This balance informs us thatthe conclusions reached from the FFG ratio are represen-tative of the trophic conditions of the ecosystem studied.Ratios of shredders to collectors lower than 0.25 on allreaches indicate that organic mater as a trophic source ofthese communities is dominated by the fine fraction. Sincethe ratio (scrapers+filtering collectors)/(shredders+gath-ering collectors) is lower than 0.5 this fine particulateorganic matter occurs predominantly in the sedimentcompartment. The latter ratio also suggests that variation
of the density and biomass of the communities under theeffects of the WWTP do not result from quantitativechanges in the particulate organic matter supplies.These variations are more realistically caused by differ-ences in the qualitative composition of the trophicresources, or differences in the nutrient loads of the water.
Conclusions
To sum up, the results at the local scale indicate thatheterotrophy in the Leze river is created by N and P withtwo distinct point sources for P (urban area and WWTP)and with non-point sources for N (agricultural zones).WWTP do not affect uptake rates (except for P at theMontegut site), respiration and primary production of theecosystem, but local inputs from WWTP increase benthicdensity and biomass (specially gathering collectors) withfine particulate organic matter arriving at the site withhigh nutrient levels. Functional feeding group ratiosconfirm the heterotrophic character of the Leze river witha dominance of fine particulate organic matter as a trophicsource for the invertebrate community. Absence of meta-bolism variations does not enable relationships withuptake rates to be established. For macro-invertebrateinterventions on uptake rates, the relation with density,diversity and gathering collectors should be checked at theinter-site scale. This study demonstrated that, in a highlydisturbed watershed, no significant effects of nutrient pol-lution types (local/non local) exist on in-stream uptakerates. However, these pollution types affect metabolismsand invertebrates assemblages differently. In these condi-tions the present data set does not indicate relationshipsbetween the investigated functional processes, uptakesrates, metabolisms and invertebrate feeding groups com-position. This absence of relations is attributed to theuptake rate variance between sub-reaches and sites whichindicates that other functional factors may interfere withnutrient retention capacities, like geomorphological fea-tures and/or discharge rates.
Acknowledgements. This study was part of the STREAMESProject (a FP5 European Union funded projects, EKV1-CT-2000-00081): Human effects on nutrient cycling in fluvial eco-systems: The development of an Expert System to assess stream
water quality management at reach scale. We are grateful toMr. Peyrat (SATESE) for WWTP nitrogen fluxe data and theFrench Regional Environmental Agency for discharge data.
References
Billen G. and Garnier J., 1999. Nitrogen transfers through theSeine drainage network: a budget based on the application ofthe ‘Riverstrahler ’ model. Hydrobiologia, 410, 139–150.
Bostrom B., Jansson M. and Forsberg C., 1982. Phosphorusrelease from lake sediments. Arch. Hydrobiol. Beih. Ergebn.Limnol., 18, 5–59.
Table 5. Functional feeding groups ratios according to Merritt
and Cummins (1996) classification. SCRA=scrapers, COLfi=filtering collectors, SHRE=shredders, COLga=gathering col-lectors, PRE=predators. (a) represents SCRA/(SHRE+COLga)
ratio, (b) SHRE/COLga, (c) COLfi/COLga, (d) (SCRA+COLfi)/(SHRE+COLga), (e) PRE/(all others).
(a) (b) (c) (d) (e)
Montegut
Density US 0.11 0.07 0.02 0.13 0.18DS 0.06 0.04 0.09 0.16 0.15
Biomass US 1.01 0.22 0.02 1.04 0.13DS 0.31 0.05 0.01 0.32 0.15
Lezat
Density US 0.03 0.08 0.01 0.05 0.20DS 0.00 0.00 0.02 0.02 0.12
Biomass US 0.01 0.02 0.00 0.02 0.28DS 0.00 0.00 0.00 0.00 0.04
J.-M. Sanchez-Perez et al.: Ann. Limnol. - Int. J. Lim. 45 (2009) 79–9290
Broberg O. and Persson G., 1988. Particulate and dissolvedphosphorus forms in freshwater: composition and analysis.Hydrobiologia, 170, 61–90.
Butturini A. and Sabater F., 1998. Ammonium and phosphateretention in a Mediterranean stream: hydrologicalversus temperature control. Can. J. Fish. Aquat. Sci., 55,1938–1945.
Chapin F.S., Sala O.E., Burke I.C., Grime J.P., Hooper D.U.,Lauenroth W.K., Lombard A., Mooney H.A., Mosier A.R.,Naeem S., Pacala S.W., Roy J., Steffen W.L. and Tilman D.,1998. Ecosystem consequences of changing biodiversity:experimental evidence and a research agenda for the future.Bioscience, 48, 45–52.
Chapra S.C., Canale R.P. and Amy G.L., 1997. Empiricalmodels for disinfection by-products in lakes and reservoirs.J. Environ. Engineering-ASCE, 123, 714–715.
Crenshaw C.L., Valett H.M. and Webster J.R., 2002. Effectsof augmentation of coarse particulate organic matter onmetabolism and nutrient retention in hyporheic sediments.Freshwat. Biol., 47, 1820–1831.
Dent C.L. and Grimm N.B., 1999. Spatial heterogeneity ofstream water nutrient concentrations over successional time.Ecology, 80, 2283–2298.
Dorioz J.M. and Ferhi A., 1994. Non-point pollution andmanagement of agricultural areas: phosphorus and nitrogentransfer in an agricultural watershed.Wat. Res., 28, 395–410.
Fisher S.G., Grimm N.B., Marti E., Holmes R.M. and JonesJ.B., 1998. Material spiraling in stream corridors: A tele-scoping ecosystem model. Ecosystems, 1, 19–34.
Gordon N.D., McMahon T.A. and Finlayson B.L., 1994. Streamhydrology, John Wiley & Sons, West Sussex, England, 526 p.
Guasch H., Armengol J., Martı E. and Sabater S., 1998. Diurnalvariation in dissolved oxygen and carbon dioxide in two low-order streams. Wat. Res., 32, 1067–1074.
Gucker B. and Pusch M.T., 2006. Regulation of nutrient uptakein eutrophic lowland streams. Limnol. Oceanogr., 51, 1443–1453.
Haggard B.E., Storm D.E. and Stanley E.H., 2001. Effects ofa point source input on stream nutrient retention. J. Am.Water Resour. Assoc., 37, 1291–1299.
Haggard B.E., Stanley E.H. and Storm D.E., 2005. Nutrientretention in a point-source-enriched stream. J. N. Am.Benthol. Soc., 24, 29–47.
Hickey C.W., 1988. River oxygen uptake and respiratory decayof sewage fungus biofilms. Wat. Res., 22, 1375–1380.
House W.A., Leach D.V. and Armitage P.D., 2001. Study ofdissolved silicon and nitrate dynamics in a freshwater stream.Wat. Res., 35, 2749–2757.
Isaacs W.P. and Gaudy A.F., Jr., 1968. Atmospheric oxygena-tion in a simulated stream. J. Sanit. Eng. Div., Proc. ASCE,94, 319–344.
Izagirre O. and Elosegui A., 2005. Environmental controlof seasonal and inter-annual variations of periphytic biomassin a North Iberian stream. Ann. Limnol. - Int. J. Lim., 41,35–46.
Lefebvre S., Marmonier P. and Peiry J.L., 2006. Nitrogendynamics in rural streams: differences between geomorpho-logic units. Ann. Limnol. - Int. J. Lim., 42, 43–53.
Martı E. and Sabater F., 1996. High variability in temporal andspatial nutrient retention in Mediterranean streams. Ecology,77, 854–869.
Martı E., Aumatell J., Gode L., Poch M. and Sabater F., 2004.Nutrient retention efficiency in streams receiving inputsfrom wastewater treatment plants. J. Environ. Qual., 33,285–293.
Marzolf E.R., Mulholland P.J. and Steiman A.D., 1994. Improve-ments to diurnal upstream-downstream dissolved oxygenchange technique for determining whole stream metabolismin small streams. Can. J. Fish. Aquat. Sci., 51, 1591–1599.
Merrit R.W. and Cummins K.W., 1984. An introduction to theaquatic insects of North America, 722 p.
Merrit R.W. and Cummins K.W., 1996. Methods in streamecology, Academic Press, London.
Merseburger G.C., Martı E. and Sabater F., 2005. Net changes innutrient concentrations below a point source input in twostreams draining catchments with contrasting land uses. Sci.Total Environ., 347, 217–229.
Miserendino M.L., 2007. Macroinvertebrate functional organ-ization and water quality in a large arid river from Patagonia(Argentina). Ann. Limnol. - Int. J. Lim., 43, 133–145.
Mulholland P.J., Fellows C.S., Tank J.L., Grimm N.B., WebsterJ.R., Hamilton S.K., Martı E., Ashkenas L., Bowden W.B.,Dodds W.K., McDowell W.H., Paul M.J. and Peterson B.J.,2001. Inter-biome comparison of factors controlling streammetabolism. Freshwat. Biol., 46, 1503–1517.
Newbold J.D., Elwood J.W., O’Neill R.V. and Van Winkle W.,1981. Measuring nutrient spiralling in streams. Can. J. Fish.Aquat. Sci., 38, 860–863.
O’Connor D.J. and Dobbins W.E., 1958. Mechanism ofreaeration in natural streams. Trans. Amer. Soc. Chem.Eng., 123, 641–684.
Odum H.T., 1956. Primary production in flowing water. Limnol.Oceanogr., 1, 102–117.
Owens M., Edwards R.W. and Gibbs J.W., 1964. Some re-aeration studies in stream. Int. J. Air. Wat. Poll., 8, 469–486.
Paul M.J. and Meyer J.L., 2001. Streams in the urban landscape.Ann. Rev. Ecol. Syst., 32, 333–365.
Pennak R.W., 1978. Fresh-water invertebrates of the UnitedStates, Wiley-Interscience, 788 p.
Prenda J. and Gallardo-Mayenco A., 1996. Self-purification,temporal variability and the macroinvertebrate communityin small lowland Mediterranean streams receiving crudedomestic sewage effluents. Arch. Hydrobiol., 136, 159–170.
Probst J.L., 1985. Nitrogen and phosphorus exportation in theGaronne Basin (France). J. Hydrol., 76, 281–305.
Puig M.A., 1999. Els macroinvertebrats dels rius Catalans, Guiaillustrada, 245 p.
Rathbun R.E., Stephens D.W., Schultz D.J. and Tai D.Y., 1978.Laboratory studies of gas tracer for reaeration. Proc. ASCE,104, 215–219.
Rodier J., 1996. L’analyse de l’eau : eaux naturelles, eauxresiduaires, eau de mer, Dunod, Paris, 1383 p.
Ruggiero A., Solimini A.G. and Carchini G., 2006. Effects of awaste water treatment plant on organic matter dynamicsand ecosystem functioning in a Mediterranean stream. Ann.Limnol. - Int. J. Lim., 42, 97–107.
Stream Solute Workshop, 1990. Concepts and methods forassessing solute dynamics in stream ecosystems. J. N. Amer.Benthol. Soc., 9, 95–119.
Tachet H., Richoux P., Bournaud M. and Usseglio-Polatera P.,2000. Invertebres d ’eau douce : systematique, biologie, eco-logie, CNRS Editions, 587 p.
J.-M. Sanchez-Perez et al.: Ann. Limnol. - Int. J. Lim. 45 (2009) 79–92 91

Thyssen N., Erlandsen M. and Jeppensen E., 1987. Reaerationoxygen in shallow macrophyte-rich streams. Int. Rev. Ges.Hydrobiol., 72, 405–429.
Turlan T., Birgand F. and Marmonier P., 2007. Comparativeuse of field and laboratory mesocosms for in-stream nitrateuptake measurement. Ann. Limnol. - Int. J. Lim., 43, 41–51.
Turner B.L., Baxter R. and Whitton B.A., 2003. Nitrogenand phosphorus in soil solution and drainage streams inUpper Teesdale, northern England: implication of organiccompounds for biological nutrient limitation. Sci. Tot.Environ., 314–316, 153–170.
Valett H.M., Dahm C.N., Campana M.E., Morrice J.A.,Baker M.A. and Fellows C.S., 1997. Hydrologic influenceson groundwater – surface water ecotones: Heterogeneity in
nutrient composition and retention. J. N. Amer. Benthol.Soc., 16, 239–247.
Vitousek P.M., Aber J.D., Howarth R.W., Likens G.E., MatsonP.A., Schindler D.W., Schlesinger W.H. and Tilman D.G.,1997. Human alteration of the global nitrogen cycle: Sourcesand consequences. Ecol. Appl., 7, 737–750.
Wang H., Hondzo M., Xu C., Poole V. and Spacie A.,2003. Dissolved oxygen dynamics of streams draining anurbanized and agricultural catchment. Ecol. Model., 160,145–161.
Young R.G. and Huryn A.D., 1998. Comment: Improvementsto diurnal upstream-downstream dissolved oxygen changetechnique for determining whole stream metabolism in smallstreams. Can. J. Fish. Aquat. Sci., 55, 1784–1785.
J.-M. Sanchez-Perez et al.: Ann. Limnol. - Int. J. Lim. 45 (2009) 79–9292