Managing Urban Rivers and Water Quality in Malaysia for Sustainable Water Resources
Upload
khangminh22Category
view
2download
0

Winrock International India 1 Navjeevan Vihar, New Delhi 110 017 Tel: 011 2669 3868; Fax: 011 2669 3881 Email: [email protected] Web: www.winrockindia.org Institute for Studies and Transformations 1, Raj-Laxmi Bhavan, Near New Gayatri Temple, Juna Wadaj, Ahmedabad 380 013 Tel: 079-2755 9060; Fax: C/o 079-2756 0457 Department of Economics Jadavpur University, Kolkata 700 032 E-mail: [email protected] EcoFriends 25-A(5), Tari Khana, Om Purwa, Lal Bangla, Kanpur-208007 Tel: 0512 2402986, 2405229; Fax: 91 512 2405229 Spatial Decisions Planning, Engineering & Information Solutions B-30, Kailash Colony, New Delhi 110 048 Tel: 011-26432195, 26484914; Fax: 011-26217246 Email: [email protected] Web: http://www.spatialdecisions.com YUVA –Youth for Unity & Voluntary Action 52/3 Narepark School, Opp Narepark Ground, Parel, Mumbai 400 012. Web: http://www.yuvaindia.org/texte.html

Acknowledgements This report is based on contributions from many individuals and institutions. The authors
would like to thank the partner organisations - Spatial Decisions (Delhi), Eco friends
(Kanpur), Institute for Studies and Transformations (Ahmedabad) and Jadavpur
University (Kolkata) for conducting case studies and YUVA–Youth for Unity &
Voluntary Action (Mumbai) for the national assessment. The authors would particularly
like to thank the laboratories, Consumer Education Research Centre (Ahmedabad), Delhi
Test House (Delhi) and Scientific Research Laboratory (Kolkata) for testing samples of
water, soil, agriculture produce and fish. It is to be noted that most of this scientific data
on wastewater in Kanpur case study was sourced from reports of Industrial Toxicology
Research Centre (ITRC), Lucknow and National Botanical Research Institute (NBRI),
Lucknow. The authors are grateful to many individuals and institutions who participated
in Consultative and Action Group meetings held in the above cities for feedback on
methodology and findings of the study. The report has benefited from participants at the
January 2006 Delhi national workshop through their suggestions and valuable comments
on the findings. Thanks are due to the external reviewers for. In addition, we would like
to thank the Outreach Unit in WII for editorial and formatting support. Last but not the
least, the project team members from WII for providing guidance for case studies and the
national assessment.
WII would like to thank the CA for the grant that made this study possible.
The Comprehensive Assessment (www.iwmi.cgiar.org/assessment) is organized through the CGIAR’s Systemwide Initiative on Water Management (SWIM), which is convened by the International Water Management Institute. The Assessment is carried out with inputs from over 100 national and international development and research organizations—including CGIAR Centers and FAO. Financial support for the Assessment comes from a range of donors, including core support from the Governments of the Netherlands, Switzerland and the World Bank in support of Systemwide Programs. Project-specific support comes from the Governments of Austria, Japan, Sweden (through the Swedish Water House) and Taiwan; Challenge Program on Water and Food (CPWF); CGIAR Gender and Diversity Program; EU support to the ISIIMM Project; FAO; the OPEC Fund and the Rockefeller Foundation; and Oxfam Novib. Cosponsors of the Assessment are the: Consultative Group on International Agricultural Research (CGIAR), Convention on Biological Diversity (CBD), Food and Agriculture Organization (FAO) and the Ramsar Convention. Funding support for this specific project was received from the governments of Switzerland and the Netherlands.

i
Content LIST OF ACRONYMS .................................................................................................. IV 1.0 INTRODUCTION......................................................................................7 1.1 OBJECTIVES OF THE STUDY ....................................................................................................7 1.2 CASE STUDY SELECTION, SAMPLING AND METHODOLOGY ....................................................7 1.2.1 Selection of Case studies ....................................................................................................... 8 1.2.2 The case studies ..................................................................................................................... 9 1.2.3 National assessment ............................................................................................................ 12 2.0 HISTORY OF WASTEWATER USE ...................................................13 3.0 DIVERSE USES OF WASTEWATER..................................................17 3.1. AGRICULTURAL IRRIGATION................................................................................................17 3.2 AQUACULTURE.....................................................................................................................21 3.3 FLORICULTURE/HORTICULTURE ..........................................................................................22 3.4 INDUSTRIAL USE: COOLING AND PROCESS WATER.............................................................23 4.0 KEY ISSUES RELATED TO USE OF WASTEWATER ...................26 5.0. WASTEWATER USAGE – A COMPARATIVE REGIONAL
ANALYSIS ...............................................................................................34 5.1 LEVEL OF URBANIZATION IN THE STUDY AREA ..................................................................36 5.2 WATER ISSUES IN CASE STUDY AREAS – A PROFILE ..........................................................38 5.2.1 Kanpur ................................................................................................................................. 38 5.2.2 Delhi..................................................................................................................................... 41 5.2.3 Ahmedabad .......................................................................................................................... 43 5.2.4 Kolkata................................................................................................................................. 46 6.0. IMPACT ASSESSMENT........................................................................50 6.1 ENVIRONMENTAL IMPACTS..................................................................................................50 6.1.1. Impact on Soil Quality......................................................................................................... 50 6.1.2. Impact on Ground Water Quality ....................................................................................... 54 6.1.3. Impact on Surface Water Quality........................................................................................ 58 6.1.4 Other Impacts ...................................................................................................................... 61 6.1.5 Health Impacts..................................................................................................................... 62 6.2. IMPACT ON LIVELIHOODS.....................................................................................................71 6.3 A SYNOPSIS OF LIVELIHOOD IMPACTS IN CASE STUDY AREAS...........................................75 6.3.1 Ahmedabad .......................................................................................................................... 75 6.3.2 Delhi..................................................................................................................................... 77 6.3.3 Kanpur ................................................................................................................................. 81 6.3.3 Kanpur ................................................................................................................................. 81 6.3.4 Kolkata................................................................................................................................. 82 7.0 CHAIN OF ECONOMIC BENEFICIARIES .......................................89 8.0 LEGISLATIVE AND POLICY FRAMEWORK.................................95 8.1 BOTTLENECKS AND REQUIRED POLICY CHANGES.............................................................103 8.1.1 Lack of central planning....................................................................................................103 8.1.2 Lack of public awareness ..................................................................................................103 9.0 SIGNIFICANCE AND EXTENT OF WASTEWATER USE IN INDIA 104 9.1 WASTEWATER GENERATION, AND TREATMENT STATUS IN INDIAN CITIES ........................104 9.2 NATIONWIDE ESTIMATION OF WASTEWATER USE IN AGRICULTURE AND AQUACULTURE108 9.2.1 Typology for National Assessment of wastewater use in agriculture in India.................108 9.2.2 Aquaculture........................................................................................................................115 9.3 ECONOMIC IMPORTANCE OF SEWAGE /URBAN WASTEWATER IN CLASS I CITIES.............117 10.0 OPTIONS FOR MITIGATING NEGATIVE IMPACTS OF
WASTEWATER USE ...........................................................................119 10.1 RESTRICTIONS ON THE TYPE OF CROPS GROWN, OR MODIFICATIONS AND CONTROL OF
IRRIGATION PRACTICES ......................................................................................................119 10.2 PROTECTION OF OCCUPATIONAL HEALTH.........................................................................119 10.3 WASTEWATER TREATMENT TO ELIMINATE AND REDUCE THE CONCENTRATION OF
PATHOGENS AND POLLUTANTS TO ACCEPTABLE LEVELS.................................................120

ii
10.4 NEED TO EXPLORE OTHER INCOME GENERATING REUSE OPTIONS ..................................120 10.5 RIGHTS AWARENESS ..........................................................................................................120 11.0 CONCLUSIONS ....................................................................................121 11.1 TRADEOFFS.........................................................................................................................121 11.2 DATA ISSUES ......................................................................................................................122 11.3 GUIDELINES FOR HEALTH AND ENVIRONMENTAL QUALITY...............................................123 11.4 SIGNIFICANCE OF WASTEWATER ECONOMICS...................................................................123 11.5 BENEFICIARIES OF WASTEWATER USE ..............................................................................123 11.6 ENGAGING POLICY MAKERS..............................................................................................124 11.7 OPTIONS TO MITIGATE IMPACTS........................................................................................124 11.8 NATIONAL ASSESSMENT ....................................................................................................125 REFERENCES.......................................................................................126 LIST OF TABLES Table 1: Selected examples of wastewater reuse in agriculture...............................20 Table 2: Trends in wastewater use in study areas ...................................................24 Table 3: Key Issues Related to Use of Urban Wastewater ......................................28 Table 4: A snapshot of wastewater usage in the study areas ...................................35 Table 5: Impact on Soil Quality in Case Study Areas .............................................52 Table 6: Type of contamination and extent of contamination of
groundwater in four areas of Kanpur .........................................................55 Table 7: Impact on wastewater reuse on groundwater and quality in case study
areas ...........................................................................................................56 Table 8: Impact on Wastewater Use on Groundwater Quality in
Case Study Areas .......................................................................................59 Table 9: Possible sources of health risk using wastewater for
irrigation purposes .....................................................................................63 Table 10: Health Impacts due to wastewater use and consumption of
produce grown ...........................................................................................64 Table 11: Patterns of wastewater use in agriculture in the case study areas..............73 Table 12: Crop Productivity in Vautha (Ahmedabad Case Study village) ................76 Table 13: Wastewater economy in study areas, Delhi ...............................................80 Table 14: Correlation between Productivity of Fish and Wastewater based
Aquaculture................................................................................................85 Table 15: Value Addition per Hectare per Year using Wastewater...........................86 Table 16: Wastewater Data Disparity ........................................................................99 Table 17: Estimate of wastewater use in agriculture in India ..................................109 Table 18: Direct and Indirect use of wastewater for agriculture in select cities ......110 Table 19: Details of Sewage Farming in Class-I Cities ...........................................114 Table 20: Status of Wastewater Generation in Class-I Cities in Different States &
Union Territories......................................................................................115 LIST OF FIGURES Figure 1: Levels of urbanization in the four study areas ...........................................37 Figure 2: Growth in population in the last three decades in the selected areas.........37 Figure 3: Map of industrial and agricultural areas in Kanpur ...................................39 Figure 4: Map showing administrative divisions of Delhi ........................................42 Figure 5: City Map –Ahmedabad ..............................................................................44

iii
Figure 6: Map of the East Calcutta Wetlands showing Dry weather Flow (DWF) Network...........................................................48
LIST OF ANNEXURES Annexure 1: Comparative Study of Income Generation Using Ground Water
vis-à-vis Wastewater of Income Generation Using Ground Water vis-à-vis Wastewater .............................................132
Annexure 2: Milk Production in Kanpur: Comparison of freshwater and wastewater irrigated areas........................................................................134
Annexure 3: Sabarmati River Water/Soil/Grain Analysis: Heavy Metals (ppm).........135 Annexure 4: Mean values for selected quality parameters of untreated wastewater
during 1996, Kanpur ................................................................................136 Annexure 5: Quality of Wastewater in selected Indian cities.......................................137 Annexure 6: Mean of the metal levels in different environmental media near
wastewater irrigated areas in Kanpur.......................................................138 Annexure 7: Water Quality of River Yamuna in Delhi Stretch....................................139 Annexure 8: Characteristics of soil in the wastewater irrigated area in Kanpur. .........140 Annexure 9: Presence of Sodium and Chromium in water and soil in study areas-
Kanpur......................................................................................................142 Annexure 10: Ground water Quality in Study areas in Delhi.........................................143 Annexure 11: Organochlorine Pesticide residue (ppb) in water, fruits and
vegetables from the agricultural field, Jajmau, Kanpur...........................144 Annexure 12: Biological Analysis of Fish grown in Fresh water and Wastewater........145 Annexure 13: Comparison table of drinking water quality standards with
ground water quality in study areas in Delhi ...........................................146 Annexure 14: Test results of ground water meant for drinking at
Wajidpur, Sheikhpur villages at Jajmau ..................................................147 Annexure 15: Livelihood Impact Matrix of Case Study Areas: Ahmedabad.................149 Annexure 16: Ownership Patterns of Sewage-fed Fisheries ..........................................152 Annexure 17: WHO Recommended Microbiological Quality Guidelines for
Wastewater use in Agriculture.................................................................153 Annexure 18: EPA Guidelines for Wastewater Quality for Reuse Options ...................154 Annexure 19: Departments related to Water Supply in India.........................................155 Annexure 20: Plan Outlays on Urban Water Supply and Sanitation in India
(current price in Rs Billion) .....................................................................156 Annexure 21: Status of Wastewater Generation, Collection and Treatment in
Class-I Cities in Different States & Union Terrirorites ...........................157 Annexure 22: Details of Sewage Farming in Class-I Cities ...........................................159 Annexure 22: Details of Sewage Farming in Class-I Cities ...........................................159 Annexure 23: Comparative returns from agriculture in freshwater and wastewater
irrigated areas in Kanpur..........................................................................160

iv
List of Acronyms AMC Ahmedabad Municipal Corporation AUDA Ahmedabad Urban Development Authority AUWSP Accelerated urban water Supply Programme BCM Billion Cubic Metres BOD Biological Oxygen Demand CBD Central Business District Cd Cadmium CETP Common Effluent Treatment Plant CPCB Central Pollution Control Board CPHEEO Central Public Health & Environment Engineering Organisation Cr Chromium CWC Central Water Commission DBM diamondback moth DDA Delhi Development Auhority DDT Dichlorodiphenyltrichloroethane DWF Dry weather Flow ECW East Calcutta Wetlands EPA Environmental Protection Agency FAO Food & Agriculture Organization GAP Ganga Action Plan GoI Government of India GT Grand Trunk Ha hectares HCH Hexachlorocyclohexane HDI Human Development Index HUDCO Housing & Urban Development Corporation ITRC Industrial Toxicology Research Centre, Lucknow IWMI International Water Management Institute KMC Kanpur Municipal Corporation LIC Life Insurance Corporation Lpcd Litres per capita per day MG Million Gallons mg/l milligrams per litres MGD Million Gallons per day mha million hectare MLD Million Litres per day MoEF Ministry of Environment and Forest MoWR Ministry of Water Resources MPN Most Probable Number MSL Mean Sea Level MTD Million Tonnes per Day NA Not Available NBRI National Botanical Research Institute,Lucknow NCT National Capital Territory NEERI National Environmental Engineering Research Institute NRCD National River Conservation Directorate NSS National Sample Survey

v
NWP National Water Policy NWP National Water Policy PH potential of hydrogen SAR Sodium Absorption Ratio SCs Schedule Castes STP sewage treatment plants TB Tuberculosis TDS Total Dissolved Solids UASB Upflow Anaerobic Sludge Blanket USD United States Dollars WHO World Health Organization YUVA Youth for Unity & Voluntary Action

vi
Abstract
Wastewater use in agriculture leads to tradeoffs in terms of generation of livelihoods for
producers on one hand, while offsetting the same by creating health and environmental
risks at various levels on the other. There is a lack of systematic information on the topic,
particularly on current best practices, costs/benefits of wastewater use in agriculture vis-à-
vis social, economic, health and environmental parameters. In addition, there is no
assessment of extent and significance of wastewater use at the national level for India.
This study is a synthesis of in-depth case studies conducted in four cities—Ahmedabad,
Kanpur, Delhi and Kolkata, using participatory techniques— focus group discussions,
household interviews, semi-structured interviews of key informants, and laboratory
testing of samples of water, soil and crop produce. Extent of wastewater use at the
national level was assessed through the findings from these in-depth case studies
combined with a review of literature on wastewater use in other cities in India. For this a
typology was developed, categorizing wastewater into direct and indirect uses.
The results indicate that benefits from wastewater-agriculture are higher (as compared to
freshwater-agriculture) for cities where industrial wastewater does not mix with urban
sewage. At the same time, adverse health and environmental impacts are lower in such
cities. There exist large numbers of beneficiaries in the production and marketing chains
of agriculture/fishing produce from wastewater. However, it is also characterized by an
inherent inequity in benefit distribution. It is estimated that wastewater contributes to
irrigating 600,000 hectares in India. Though this is an insignificant proportion of the total
irrigated agriculture in the country, wastewater-agriculture, nonetheless, requires
adequate attention from policy makers due to the significant dependence of many
marginalised producers and the scale of health risk it poses both to producers and
consumers. Urban wastewater being three-fourths of total urban water supplied is
potentially a considerable and more reliable water resource, which is likely to grow
exponentially with the projected rapid urbanization of India. Given the urban demand and
supply scenario of water in the foreseeable future, wastewater use emerges as a
sustainable solution to urban wastewater management in a developing country like India.
Key Words: urban wastewater, agriculture, livelihoods, environment, health, national
assessment.

7
1.0 Introduction
Since the late 20th century, management of urban wastewater has posed a serious
challenge to planners in less developed countries on account of rapid urbanization. The
large quantities of water that flow out as waste from any urban settlement, pose further
challenges in the context of the onset of a global water shortage. In addition, cities in the
developing world, also exhibit a novel phenomenon whereby a large population ekes out
a livelihood from urban wastewater. This generates the much-needed employment and
economic empowerment. As a side effect, however, such livelihood generation, in close
proximity to untreated or partially treated sewage, gives rise to additional problems of
health and adversely impacts the local environment.
1.1 Objectives of the study
The specific objectives of the study include:
i) To investigate through case studies: the current practices, costs and benefits of
wastewater use in agriculture vis-à-vis social, economic, health and environmental
parameters; identify best practices for mitigation of negative impacts; assess the
replicability of potential cost-effective technologies in different agro-climatic and
socio-cultural set-ups;
ii) To develop the methodology for and carry out a nationwide assessment based on
secondary data and case studies on the extent and significance of wastewater use
in relation to volumes of wastewater generated, volumes used, areas irrigated,
families benefited, crops grown, and its impact on the national or local economy.
1.2 Case study selection, sampling and methodology
The approach included research at various levels-- macro (national), meso (city) and
micro (sub-city) levels. Review of literature at the macro level helped select case study
cities for meso/city level assessments. The city level assessment was carried out through
review of secondary literature and semi-structured interviews of key informants. It helped
select areas (sub-city) for micro level assessments through a primary survey.

8
1.2.1 Selection of Case studies
On the basis of data available on the quantities of wastewater generated, its treatment and
mode of disposal in key urban centres and major river basins, and evidence of
communities/farmers using wastewater for agriculture, four sites – Delhi, Ahmedabad,
Kanpur and Kolkata- have been selected. One of the case studies (Kolkata) specifically
focuses on documenting an innovative cost-effective approach to minimize the negative
impacts of wastewater use through aquaculture. Specifically, by selecting these cities, an
attempt has been made to capture the entire gamut of issues relating to wastewater use in
agriculture in India. Further, an assessment of wastewater use has been contextualized
through institutional, economic, and policy analyses of wastewater issues.
Specific advantages of selecting these four sites have been elaborated below:
Delhi and Ahmedabad: The two most polluted rivers of the country are the Yamuna and
the Sabarmati with Delhi and Ahmedabad being the accountable cities. Delhi generates
more than 3000 MLD (approximately) of wastewater. With sewage treatment plants’
functioning erratically, wastewater enters the Yamuna partially/ untreated with a high
BOD of 35 to 40 mg/l. Delhi alone generates 2,250 MLD of sewage. Some 3.5 lakh
people live in the 62,000 jhuggies (in slums) on the Yamuna riverbed and its
embankments. A large number of these practice farming on the riverbed. The city of
Ahmedabad pours sewage and industrial effluents into the Sabarmati River, which has a
BOD of 15 to 20 mg/l.
Kanpur: The city of Kanpur is on the banks of the river Ganga which is home to 47% of
the total irrigated area in the country. The river is highly polluted and it passes alongside
29 Class-I cities; 23 Class-II cities and 48 towns of upto 50,000 people. It has been
estimated that about 1.4 × 10⁶ m3 of domestic wastewater and 0.26 × 10⁶ m3 of industrial
sewage flow into the river every day. The CPCB reports that three-fourths of the pollution
of the river comes from the discharge of untreated municipal sewage, of which 88% is
created in Class-I cities. Pollution is also caused by industrial wastewater, including
effluents from tanneries, especially in Kanpur and from agricultural run-off containing
residues of harmful pesticides and fertilisers.

9
Kolkata: Through this case, cost-effective intervention of treating wastewater through
East Calcutta wetlands (natural wetlands) has been documented. Kolkata uses sewage
water productively, by diverting a large part of the city sewage to the wetlands that forms
the basis of extensive fish rearing. Kolkata handles approximately 3 m3/s of wastewater
in 3,200 hectares of ponds to produce 2.4 T/ha/yr of fish. Three projects in the peri-urban
areas of Kolkata have been taken up with the participation of local people, fishermen and
the village council/ municipal government. The Kolkata Wetlands, consisting of some 30
km2 of fishponds are the world’s largest sewage-fed fish production sites. The effluence
from the wastewater-fed fishponds is further used to grow non-monsoon paddy, a recent
innovation compared to garbage vegetable gardens and wastewater-fed fishponds.
However, there has been evidence that industrial pollutants such as chromium and
cadmium find their way into the wetlands, which are causing adverse health impacts that
are yet to be measured.
These four case studies contribute to the existing knowledge on urban wastewater use for
agriculture in India by: (i) undertaking primary research on current practices, cost/benefits
of wastewater use in agriculture vis-à-vis social, economic, health and environmental
parameters, through in-depth case studies in four locations; (ii) identifying best practices
for mitigation of negative impacts; and (iii) assessing replicability of potential cost-
effective technologies.
1.2.2 The case studies
In-depth case studies were conducted in the above four locations in collaboration with
local partners focussing on (a) quantifying and documenting the impacts and current
dynamics of wastewater use; and (b) documenting cost-effective interventions for
wastewater use in agriculture. For each, the current agricultural practices, poverty
reduction and livelihood impacts, health risks, environmental impacts, and mitigation
strategies were studied.
At the onset, review of secondary literature to understand the meso level (city level)
physical (including environmental), social and institutional context of wastewater is used
in agriculture/aquaculture. It helped in identifying, geographical areas (including urban/
peri-urban settlements and villages) and key informants for semi-structured interviews. In

10
addition, it provided a general understanding of the diversity and extent of various
impacts (livelihood, environmental and health) in these geographical areas. FGDs were
also used to analyse the chain of economic beneficiaries along crop and fish marketing
chains (in Delhi, Kanpur and Kolkata) to gain an understanding of actors and qualitative
figures of the benefits at various nodes of the chain. The geographical areas in the four
cities, thus covered, included areas along the riverbanks and/or along effluent channels
from treatment plants. The areas covered in case study sites are as below:
Sample size and selection of respondents
In each of the case study sites, households were selected covering different castes,
landholding status (leased or owned), and gender categories. The sample size in four case
studies is as below:
Ahmedabad: The survey included village Gyaspur falling within city limits where 289
households were surveyed1.
Kanpur: The Jajmau area within the city limits where wastewater is directly used for
agriculture from the sewage channel. Three villages were selected in this area--Pyondi,
Sheikhpur and Motipur located at 200m, 1500m and 2500m from the off take point of the
sewage channel. In all 193 households were interviewed.
Delhi: Areas around Keshopur STP (Keshopur Village, Nilauthi, Ranhaula, Mundka,
Bakkarwala) and Okhla STP (Madanpur Khadar and Jaitpur) using wastewater directly
from sewage channels from these STPs carrying treated effluents. Here the wastewater is
used for agriculture and aquaculture. Interviews of 80 farmers, 12 medical practitioners
(health impacts), income-differential (comparative study of two fields dependant solely
on groundwater and wastewater from the areas) were conducted.
1 In addition, villages lying on the banks of the most severely polluted stretch of river falling in Ahmedabad and Kheda
districts were surveyed to study the pattern of impact across the longitudinal section of the river. They are Asamli,
Bakrol, Chitrasar, Fatehpura, Navapura, Rinza, Saorda and Vautha. Beyond Vautha, the Sabramati river gets diluted by
the Watrak tributary.

11
Kolkata: Area in and around East Calcutta Wetlands (ECW) using wastewater directly.
Villages surveyed include Bantala, Chowbaga, Panchannagram, Boinchitala, Durgapur,
Krolberia, Bamonhata. In all, 432 households were interviewed from these villages
practicing fishing and agriculture. These are villages along the Dry Weather Flow canal.
Methodology for case studies
Field data collection
Data was collected through various participatory techniques including PRA, FGDs (using
a check list with different community groups) and household questionnaires. PRAs and
FGDs helped understand the history of wastewater use and differential impacts across
caste/class and gender, and also triangulate data collected through household interviews.
Separate FGDs were organised for agricultural producers, vegetable growers, and fisher
folk. The FGDs were also useful to select stratified households to administer the
household questionnaire.
The household questionnaire included parameters such as family size, literacy level, land
holding, cropping pattern, crop productivity, and irrigation practices, cattle holding,
health problems and the perception on environmental degradation.
A comparative economic analysis of agriculture and fish rearing (cost of inputs and
income from sale of production) was carried out for wastewater and freshwater irrigated
areas in all the four sites for major crops.
In addition, tests with the help of accredited laboratories were carried out for a limited
number of water samples (surface water and groundwater), soil samples from agricultural
land, agriculture and vegetable produce, and fish. It provided anecdotal evidence on the
levels of contamination.
Consultations with local policy makers/planning authorities
In each case study area, key informants/ institutions (government, non government, and
academia) were identified in urban wastewater, to obtain information from and to share

12
the research findings with the view to engage them in the project processes and uptake of
results.
1.2.3 National assessment
The National assessment includes the current situation on the extent and significance of
wastewater use for agriculture in India. Results of this assessment are based on secondary
data on quantities of urban wastewater generated, nature of treatment, extent and
significance of use in select urban centres in India, and primary data generated through
the four case studies.

13
2.0 History of Wastewater Use
Wastewater (raw, diluted or treated) is a resource of global importance, particularly in an
industrialized urban context. In many developing countries, especially those affected with
water shortage or scarcity, access to fresh water for irrigation is limited and therefore both
treated and untreated wastewater is used.
Wastewater use was a common practice much before the urbanized world emerged. Night
soil has been used to fertilize crops and replenish depleted soil nutrients since the ancient
times in China and in other areas of Asia. The earliest sewage farms documented were
those of Bunzlau in Germany, which were in operation in 15312 and of Edinburgh in
Scotland active around 16503.
With industrialization and subsequent water carriage sewerage system, interest and effort
in wastewater utilization through farming and land application grew. The First Royal
Commission on Sewage Disposal in England gave its official approval to the practice. In
its report of 1865, the Commission stated, “The right way to dispose off town sewage is
to apply it continuously to the land and it is by such application that the pollution of rivers
can be avoided.”4
However, sewage farming waned in the early twentieth century, and even completely
abandoned in most areas of the highly urbanized industrial countries of the western world.
All this changed after World War II when a new thrust of scientific and engineering
interest in wastewater reuse developed in both industrialized and developing countries.
Subsequently, sewage farming was adopted in many of the rapidly developing countries
faced with water shortages and insufficient waterways to dilute and dispose off municipal
wastewater. A number of governments even officially approved wastewater land
application or wastewater reuse as part of their water pollution control policy and water
resources management program. For example, the Five-year Plan of the Government of
2 Gerhard, Wm. Paul, The disposal of household wastes: a discussion of the best methods of treatment of the sewage of farm-houses, houses in villages and of larger institutions, D. Van Nostrand Company, New York :1890 (available at http://hearth.library.cornell.edu/cgi/t/text/text-idx?c=hearth;idno=4800136) 3 Stanbridge, H. H., 1976. The History of Sewage Treatment in Britain. The Institute of Water Pollution Control, Maidstone, Kent, England. 4 ibid

14
India also emphasized on conservation, augmentation and recycling of urban water. It
advocated reuse of treated sewage in view of the fact that water is going to become
scarcer. Such policy support now stands to establish, to a certain extent, the issue of
wastewater use within the overall water policy in India.
With such developments, wastewater reuse is becoming widely accepted once again.
India is the seventh largest country in the world with a landmass of 3.29 million square
kilometers and a population of over a billion. Contrary to popular concepts of a
predominantly rural India, an increasingly larger percentage of the Indian population is
now residing in urban areas. Over the last 50 years, while the country’s population has
grown by two-and-a-half times, in the urban areas it has grown by five times. By the turn
of the millennium, an estimated 305 million Indians shall be living in nearly 3,700 towns
and cities spread across the length and breadth of the country.5 With rapidly increasing
urbanization, the magnitude of problems such as groundwater depletion, water logging,
water pollution and increasing salinity levels will and is, multiplying, affecting the overall
quality of life in urban areas.
Sewage generation from urban centres in India has grown from about 5 billion litres a day
(bld) in 1947 to around 30 bld in 1997. Untreated wastewater carrying chemicals is held
primarily responsible for the deterioration in water quality and contamination of lakes,
rivers and groundwater aquifers. According to the Central Pollution Control Board
(CPCB), 16 bld of wastewater is generated from Class-1 cities (population >100,000),
and 1.6 bld from Class-2 cities (population 50,000-100,000). Of the 45,000 km length of
Indian rivers, 6,000 km have a bio-oxygen demand above 3 mg/l, making the water unfit
for drinking (CPCB 1998).
Options for managing urban wastewater pose a serious challenge to planners in the
context of a growing urban population in the developing world. In the context of the onset
of a global water shortage, the problem becomes even more serious. There is also the
challenge of safe disposal of this huge quantity of urban sewage. In addition, an Indian
city, beset with problems of abject poverty, has a large urban population eking out
livelihoods from urban wastewater. 5 National Assessment of Wastewater Generation and Utilization, A Case of India (July 2005) YUVA, Mumbai

15
Owing to severe infrastructure deficits in urban India, the quality of life for the average
urban and consequently the peri-urban citizen is on the decline. It is necessary, therefore,
to look at alternative and more sustainable ways of providing services within the given
constraints in urban India.
Literature review and assessment of current initiatives
Wastewater use in agriculture is age old, but the legal and regulatory efforts to develop
mechanisms to control its negative impacts are relatively recent. WHOs international
guidelines on wastewater reuse in agriculture and aqua-culture and recommendations of
wastewater treatment and crop restrictions, the World Health Organization (WHO)
formulated international guidelines on wastewater reuse in agriculture and aqua-culture in
1989. The WHO's recommendations of wastewater treatment and crop restrictions are
considered by many governments as the legal framework, though they are not intended
for absolute and direct application in every country. While focusing on treatment and crop
restrictions, the WHO guidelines pay inadequate attention to the problems of high cost
involved in construction and operation of treatment plants. Authorities are therefore faced
with two difficult options: either treat rapidly growing volumes of wastewater and bring it
within safe limits for agricultural use, or try to stop wastewater use among the users
which would deprive many households of their livelihood. The result of this situation is
often that wastewater use and users are ignored and the practice of untreated wastewater
use is denied.
A survey of relevant literature on India indicates that some research on wastewater use in
agriculture has taken place including on development of low-cost, appropriate, and
decentralized treatment technologies for treatment of wastewater in the country.
Decentralized, small-scale, community operated systems and stabilization tanks have
been built for successful use for fisheries (Kolkata). A similar experiment has been
carried out in Pune, where after pre-treatment through anaerobic ponds, lotus and water
lily are grown in a maturation pond, which renders the water colourless and odourless and
the treated water re-circulated to create a waterfall. Other countries have experimented
with a few techniques like up flow filter and vermin-filter. Duckweed production in
excreta or sewage-fed ponds has found increasing attention recently. Other experimental
options include source reduction, reduction in degree of faecal contamination of water

16
through use of environmental sanitation technologies (Peru and Mexico) and domestic
filtering of soapy water for gardens. For addressing industrial pollution of surface water
bodies, possible solutions that emerge include sound regulation, proper zoning,
registration and monitoring of industries and financial and technical incentives for waste
minimization.
Other lessons from past or on-going work include IWMI action research with farmers
(Mexico, Pakistan, Vietnam and Ghana) showing that most urban/peri-urban farmers, in
spite of the risks involved, view the presence of domestic sewage in their water source as
a benefit providing plant nutrients. In general, the common point of view of researchers,
decision-makers, and service providers has been holds that the use of untreated
wastewater in agriculture is unacceptable and that only appropriately treated water yields
important benefits. Though it cannot be denied that treatment is extremely desirable, the
approach seems to have has resulted in a marginalization of poor wastewater farmers
unlikely to benefit from treatment of the wastewater that they use or from alternative
water sources any time in the near future. This to a great extent, can be attributed to (and
therefore calls for further research) lack of systematically collected information,
particularly on issues such as farmer’s needs and preferences, health and environmental
risks, and economics of using wastewater for irrigation.

17
3.0 Diverse Uses of Wastewater
3.1 Agricultural Irrigation
Farmers have used wastewater for irrigation to compensate for scarce or costly freshwater
resources. Roughly 10 % of the world’s wastewater is currently being used for irrigation.
In developing countries, especially China and India, an estimated 80% of wastewater may
be used for irrigation (Cooper, 1991). It is estimated farmers irrigate an estimated 20
million hectares using partially diluted or undiluted wastewater, a practice that sustains
the livelihoods of millions of poor people in Asia, Latin America, the Middle East and
parts of Africa. In fact, in many countries there are more hectares under informal
irrigation with polluted urban stream/drain water than in formal irrigation schemes.
Nutrient cycling and a reliable water supply to farmers have been the predominant
objectives of wastewater irrigation for centuries.
Increasing volumes of domestic, hospital and industrial wastewater are being produced in
cities around the world. Cities in developing countries lack resources to treat wastewater
before disposal. Institutional support and legislation for pollution control is weak. Even
where expensive wastewater treatment plants are installed, only a small percentage of the
total wastewater volume is treated before discharge (only 4000MLD out of 17,600 MLD
wastewater generated in India is treated) resulting in rivers, lakes and aquifers becoming
severely contaminated. Approximately 30,000 MLD of pollutants enter India’s rivers,
10,000 million litres from industrial units alone (CPCB).
According to the Central Pollution Control Board (CPCB), 16,000 MLD of wastewater is
generated from class 1 cities (population > 100,000), and 1600 MLD from class 2 cities
(population 50,000 - 100,000). Of the 45,000 km length of Indian rivers, 6,000 km have a
bio-oxygen demand (BOD) above 3mg/l (milligrams per litres), making the water unfit
for drinking.
There is growing concern about the quality of water available for irrigation due to the
increased implication of wastewater use for the hydrology of many river basins. Rapidly
increasing urban populations and industries lead to increased wastewater production with
its contamination becoming more complex. It includes industrial wastes, such as heavy

18
metals, acids and derivatives of plastics, and organic components characteristic of human
wastes.
Worldwide, wastewater constitutes a significant portion of the irrigation water. Hussain et
al (2001) report that at least 20 million hectare (mha) in 50 countries are irrigated with
raw or partially treated wastewater. It is estimated that estimated that one-tenth or more of
the world’s population consumes foods produced on land irrigated with wastewater6.
Wastewater can be used to substitute other better-quality water sources, especially in
agriculture – the single largest user of freshwater.
Wastewater is being used increasingly for irrigation in urban and peri-urban agriculture,
and even in distant rural areas downstream of the very large cities. It drives significant
economic activity, supports countless livelihoods, particularly those of poor farmers, and
very substantially changes the hydrology and water quality of natural water bodies.
In both developing and developed countries, the most prevalent practice is the application
of municipal wastewater (both treated and untreated) on land. In developed countries
where environmental standards are enforced, most of the wastewater is treated before it is
used for irrigation of fodder, fibre and seed crops. In developing countries, lack of control
and monitoring mechanisms lead to either mixing of untreated and treated water or use of
industrial wastewater. Other important uses of wastewater include recharging
groundwater, landscaping, industry, construction, dust control, wildlife habitat
improvement and aquaculture. Wastewater use has the advantage of limiting the pollution
of rivers and other surface bodies that would otherwise be used as disposal outlets.
The market for adoption of advanced technologies for the wastewater use arising from
industries and municipal corporations' accounts for largest percentage of total
environmental market in India. As per a survey by the US Trade department, the total
market potential for water and wastewater treatment including the requirements of
Municipal and Industrial sectors is estimated at US $ 900 million and is expected to grow
6 Smit, J, Ratta A and Nassr J. (1996) ‘Urban Agriculture – Food, Jobs and Sustainable Cities’. Publication Series for Habitat II Vol. I New York: United Nations Development Programme

19
at approximately 14% each year in the mid-term7. Industrial wastewater treatment is
arguably; the largest segment, accounting for nearly half of the total market sizes. The
water and wastewater treatment sector also accounts for the highest environmental
spending within both the public and private sectors8. With the functioning and operating
of Wastewater treatment plants, being a costly affair, the local bodies need to look at
alternate ways of disposing off or recycling wastewater generated by the growing
populations.
7 Swiss Business Hub India & Heinz Habegger, Baleco AG, Thun, Market Report: Opportunities for Environmental Technology in India. Focus on Water, Air and Hazardous Waste, Swiss Business Hub India, 2004 8 ibid

20
Table 1: Selected examples of wastewater reuse in agriculture America Asia
Mexico Cereals, vegetables, fodder, parks
Kuwait Cereals, fruit trees, fodder
Peru Vegetables, fodder, cotton Jordan (indirect)
Vegetables, crops consumed processed
Chile Vegetables, grapes Israel Cotton Argentina Vegetables, fodder Saudi Arabia Cereals, fodder USA (California) Vegetables, cereals, fodder India Cereals, vegetables
North Africa Tunisia Citrus, fodder Morocco Vegetables, fodder
Source: Strauss, Martin. Reuse of urban wastewater and human excreta,
EAWAG/SANDEC, Switzerland available at www.ruaf.org/files/Reuse_wastewater_in_UA_0.pdf accessed on 25.12.2006

21
Some of the advantages of wastewater reuse in agriculture are given below:
• Conserves water (by recycling and groundwater recharge)
• It is a low-cost method of sanitary disposal of municipal wastewater
• Reduces pollution of rivers and other surface water
• Conserves nutrients, thereby reducing the need for artificial fertilizer, increases
crop yields, crop density and provides a reliable water supply to farmers even in
the lean season
Wastewater has been widely used in agriculture in various parts of the world. Generally,
both treated and untreated sewage is used in irrigation but treated sewage is used more
often, and primarily in vegetable cultivation. Certain countries restrict the type of crops
that can be grown using wastewater. For instance, the Tunisian Water Law prohibits use
of wastewater for growing crops that are consumed raw (Pescod, 1992). In Mexico,
regulations state that no vegetables or fruits can be irrigated with untreated wastewater.
Hence, wastewater is used to irrigate only low-value grains (maize, sorghum and wheat)
and fodder (alfalfa).9
3.2 Aquaculture
The potential of wastewater in enhancing the yield of fish and aquaculture crops is well
established (Hickling 1971; Jhingram and Ghosh 1988; Hauck 1978). Allen and Hepher
(1979), in a review of wastewater aquaculture, indicated that wastewater-fed ponds
produce high fish yields because of increase in the natural food organisms through
fertilization by inorganic matter. A wide range of yields has been reported from waste-fed
aquaculture systems, for example 2-6 tons per hectare per year in Indonesia; 2.7-9.3 tons
per hectare per year in China; and 3.5-7.8 tons per hectare per year in Taiwan.
Management of fishponds can have a significant effect on fish yields but the maximum
attainable yield in practice is 10-12 tons per hectare per year.
The East Calcutta sewage fisheries are the largest single wastewater use system in
aquaculture in the world (Pescod, 1992). Farmers here developed a technique of using
domestic sewage for fish culture almost a century ago. Nutrients, mainly nitrogen and
phosphorus, are absorbed by large aquatic plants such as duckweed cultivated for animal 9 Urban Wastewater: Livelihood, Health and Environmental Impacts in India (December 2004), Spatial Decisions, New Delhi

22
feed, and aquatic vegetables such as water spinach for human consumption. Thus, some
degree of natural treatment is provided to wastewater. Currently, the area under the
sewage-fed culture system is reportedly around 4,000 ha and generates around 50 percent
of the high priced fish.10 About 93 percent of the sewage-fed ponds are privately owned,
employing nearly 4,000 families as fishermen. There are also several fishermen
cooperatives. In the Kolkata case study, it was observed that an increase in sewage would
increase production of fish.11 On the other hand, when wastewater was treated and used in
aquaculture, fish production declined.12
3.3 Floriculture/Horticulture
Wastewater quality for floriculture or horticulture varies with the type of
flower/ornamental crop. For example, flowers produced for the cosmetic/ pharmaceutical
industry must be irrigated with adequately treated wastewater to minimize the presence of
toxics in the crop. On the other hand, flowers/plants produced for purely
ornamental/decorative purposes may be grown on raw wastewater or primary treated
wastewater.
Both floriculture and horticulture have tremendous potential to augment livelihoods of
farmers owing to the higher selling value of the crops. Both practices pose minimal health
impacts owing to low chances of direct consumption.
In some areas in Delhi, such as Mehrauli, Nilauthi and parts of the Yamuna riverbed,
floriculture/horticulture is practiced, but farmers use mostly groundwater. They contend
that most flower crops and decorative plants are sensitive to fluctuating levels of toxicants
in wastewater. However, if properly treated wastewater is supplied to farmers in these
areas, better incomes can be predicted.
In cities like Chennai and Hyderabad, though, farmers use wastewater on a large scale for
floriculture. In areas near the Sabarmati River, horticulture was profuse till the quality of
wastewater started deteriorating. Hence, stability in supply of treated wastewater can
10 National Assessment of Wastewater Generation and Utilization, A Case of India (July 2005) YUVA, Mumbai 11 Urban Wastewater: Livelihoods, Health and Environmental Impacts in India; The Case of the East Calcutta Wetlands; Dr. Gupta, G; Jadavpur University, pp 40 12 Ibid

23
open up new livelihood opportunities in other urban and peri-urban areas across the
country.
3.4 Industrial Use: Cooling and Process Water
Based on location and availability, treated wastewater can be used for various industrial
purposes such as cooling and in boilers. Boilers generally require high quality water, but
wastewater, after secondary level treatment can be safely used in cooling towers of
industries. Chennai is a pioneer in such wastewater reuse in the country.13
(See Table 2 for trends in wastewater use in study areas)
13 National Assessment of Wastewater Generation and Utilization, A Case of India (July 2005) YUVA, Mumbai

24
Table 2: Trends in wastewater use in study areas Area of Study Past Use Present Use Significance Ahmedabad Situated on the banks of the Sabarmati
river, the water has always been used for irrigation. In some villages horticulture used to be the main income generating activity. This indicates that at some time water used for irrigation was beneficial to the community
Wastewater remains the chief source of irrigation water in the villages along the banks of the river. Presently 90% of the land area is irrigated with wastewater. At present, the onus is more on paddy and wheat than horticulture. However, over the years there has been a decline in yield.
The farmers claim that with the water getting polluted, the fruit-bearing capability of the orchards has reduced considerably over the years. The pollution has taken a toll on the agricultural crop pattern, as well as soil fertility in this village
Delhi Till sometime ago, wastewater generated in Delhi was used mostly for agricultural irrigation and aquaculture
At present, diverse uses of wastewater are being largely experimented with and considered but the reuse pattern remains the same, which is mostly agriculture, aquaculture and industrial cooling
In a growing scarcity-demand scenario, there will be push factors that would enable newer and more innovative use of wastewater. As of now the wastewater is augmenting local livelihoods.
Kanpur The sewage farm scheme was launched by the Central Government in 1951 to check pollution of River Ganga and increase agricultural production in the area. Villages in the downstream of the Ganga at Kanpur have been receiving city wastewater for irrigation since the early 1950s.. Respondents agreed that initially this had led to good harvests and increase in production
At present farmers, mostly marginal, are irrigating 1,253 acres of land to harvest both Ravi and Kharif crops. However, they unanimously agreed that for the past many years now the quality of the wastewater has deteriorated, adversely affecting crop production. The usage pattern has not changed since agriculture clearly remains the biggest consumptive activity related to wastewater.
Change in the quality of wastewater has led to an adverse impact on the livelihoods of the people. Both crop and milk production has decreased. Consequently, conflicts have arisen as farmers have refused to pay the money charged for sewage irrigation water since 2000 because the water contained alarming levels of heavy metals and other toxicants. Yet the use of wastewater and subsequent sale of crops and vegetables occupy 70% of the economy.

25
Area of Study Past Use Present Use Significance Kolkata Farmers around Kolkata developed a
technique of using domestic sewage for fish culture almost a century ago. The large-scale use of sewage for fish culture began in the 1930s. The area around the wastewater fed wetland became a viable area for growing vegetables, provided stimulus for large-scale expansion of sewage-fed fish culture system. During the 1960s, 2,400 ha of fisheries were converted to paddy cultivation by the landowners, which marked the beginning of paddy cultivation in the area as well.
Paddy cultivators have decreased in number over the last 10 years. Most of them have sold off their land for reclamation for developing the city. In the East Calcutta Wetlands (ECW), the major source of income remains aquaculture using urban wastewater. Garbage farming takes place in areas where the city waste is dumped officially. Paddy cultivation in small fields is carried out in the interior regions of the ECW. Floriculture using wastewater is a recent activity which is gaining popularity.
Wastewater has become an effective tool to enhance livelihoods in the area. Health problems are yet to be a major cause of concern. The main change in the scenario is the encroachment of common lands either by the state or by private parties

26
4.0 Key Issues Related to Use of Wastewater
Wastewater has high potential for reuse in agriculture; an opportunity for increasing food
and environmental security, avoiding direct pollution of rivers, canals and surface water;
conserving water and nutrients, thereby reducing the need for chemical fertilizer; and
disposing of municipal wastewater in a low-cost, sanitary way. However, wastewater use
poses a number of health and environmental risks for users and communities in prolonged
contact with wastewater; for consumers of such produce and for neighbouring
populations due to contamination of groundwater and creation of habitats for mosquitoes
and other disease vectors. Important health risks include the transmission of intestinal
infections to agricultural workers in wastewater-irrigated fields and to consumers of
waste-water irrigated produce due to worms and the transmission of faecal bacterial
diseases, like diarrhea, dysentery, typhoid and cholera.
The key issues pertaining to the treatment, use, application and impact of wastewater are
dovetailed with livelihoods, health, environment and policy concerns. What is important
is to look at mitigating the negative impacts on the beneficiaries of wastewater use and
link up such use with sustainable livelihoods outcome.
The project reveals that in all four study areas, the dependence of the marginalized on
wastewater as a resource is high. However, such dependence also results in prolonged
contacts that may or may not affect their health and well-being. Being at the bottom of the
socio-economic ladder, such communities do not have the necessary fall back
mechanisms to mitigate the risks involved in the use of wastewater. Within such
communities, there are further marginalised subgroups, namely women, children and the
aged. In certain activities, especially growing vegetables and selling them, women acquire
a lead role. Hence, their scope for economic empowerment is coupled with health risks
due to exposure to contaminated water. In Kanpur, children, unaware of the dangers from
such water, have got affected and ended up with acute skin and gastric disorders. In
Kolkata, however, negative health impacts are yet to be seen, as the community seems to
be well aware of the potential health risks and have taken precautions using indigenous
knowledge. For example, even after working in wastewater for long hours throughout the
year, they do not suffer from skin diseases as after work they clean themselves with soaps

27
in freshwater. Moreover, they often apply oil made of local herbs. This prevents the
pollutants to stick to their body while they are working in the sewage-fed fisheries.
The use of wastewater is linked to issues of land since the larger application remains
rooted to agriculture. In Kolkata, most of the common land has been acquired by private
players who manage the wetlands for commercial purposes. Most land in Ahmedabad,
near the Sabarmati, is private agricultural fields, though quite a good percentage is left out
as commons on which agriculture also is practised. In Kanpur, however, the municipal
and urban development authorities lease out land in the drainage area of sewers to the
farmers and even supply wastewater for irrigation for a certain cost. Conflicts, too, have
evolved regarding payments ever since the farmers protested about the quality of
wastewater supplied, which was untreated and affecting agricultural productivity while
increasing health problems.
Talking about markets, while the fish and vegetables bred and grown in untreated sewage
in Kolkata are valued in the markets, those from Kanpur, especially from areas affected
by pollution, are not. See Table 3 for some major issues related to wastewater use.

28
Table 3: Key Issues Related to Use of Urban Wastewater PERCEIVED ADVANTAGES DISADVANTAGES REFERENCE
Wastewater and its nutrient content can be used extensively for irrigation. Its reuse can deliver positive benefits to the farming community. This has been noticed in Delhi especially with vegetable farming14.
Some farmers reported that the soil fertility had declined over the years leading to decreased crop productivity. The farmers attributed it to bad quality of wastewater15.
Final Report: Urban Wastewater: Livelihood, Health and Environmental Impacts in India (December 2004), ch 5, pp 2 Spatial Decisions, New Delhi.
Due to the presence of nutrients in wastewater, the need to apply external fertilizers is reduced. Most farmers in Delhi also reported the soil quality of their land to be enhanced in the past few years with the application of treated wastewater.
Uses of wastewater and consequent impact on livestock health have also resulted in a drop in milk production in Kanpur. This has lowered the income levels especially of those communities which earn their livelihoods by selling milk in nearby markets since their cost of producing milk per unit has gone up. (see Annexure 2). The same concern in repeated in Hyderabad16 in a study conducted by IWMI.
Final Report: Urban Wastewater: Livelihood, Health and Environmental Impacts in India (December 2004), ch 4, pp 2 Spatial Decisions, New Delhi. & Impact of Wastewater on Livelihoods, Health and Environment, Kanpur Case Study (April 2005), ECOFRIENDS, Kanpur, pp 83
LIV
EL
IHO
OD
S
According to the farmers of Delhi and Ahmedabad, wastewater provides a reliable water supply to farmers even in the lean season.
Loss of soil fertility was reported in almost all researched villages in Ahmedabad where farmers complain soil becoming more compact and losing its
Final Report: Urban Wastewater: Livelihood, Health and Environmental Impacts in India (December 2004), ch 4, pp 2 Spatial Decisions, New Delhi,
14 See Annexure 1: Comparative Study of Income Generation Using Ground Water vis-à-vis Wastewater of Income Generation Using Ground Water vis-à-vis Wastewater 15 Qualitative information gathered from survey of researched farmers 16 Buechler, Stephanie & Gayathri Devi Mekala, Innovations among Groundwater Users in Wastewater Irrigated Areas near Hyderabad, India, prepublication paper prepared for the IWMI-Tata Annual Partners’ Meet, 2004 (draft).

29
PERCEIVED ADVANTAGES DISADVANTAGES REFERENCE It has been observed that wetland ecosystem of Calcutta supports 1 lakh direct stakeholders and 5.1 thousands hectares of cultivation. It provides annually direct employment for about 70,000 people, produces 1.28 lakh quintals of paddy, 69,000 quintals of fish and 7.3 quintals of vegetables. It also generates revenue of Rs.266 million and net returns of Rs.80 million17.
moisture retention capacity. Yields are decreasing and loss of standing crops suddenly dry up due to no rational explanation. This may be attributed to excessive presence of heavy metals in the soil. (see Annexure 3) Similarly, in Kanpur study of comparative returns from agriculture in freshwater and wastewater shows negative impact on productivity due to wastewater agriculture (see Annexure 23)
chapter 4, pp 2 & Impact of Wastewater on Livelihoods, Health and Environment: Ahmedabad Case Study, 2005, ch 3, pp 16
HE
AL
TH
Health problems occur due to the presence of mosquitoes in and around the fields irrigated with wastewater. During the field surveys conducted in Delhi, it was observed that vector related troubles were more severe in fields which were over irrigated and had problems of standing water18. In such areas, medical practitioners reported the frequent occurrence of Malaria, Fevers etc. which could be associated to the presence of disease causing mosquitoes19.
Final Report: Urban Wastewater: Livelihood, Health and Environmental Impacts in India (December 2004), ch 6, pp 4, Spatial Decisions, New Delhi.
17 Chattopadhyay, Kunal (2004) ‘Jalabhumir Kolkata’ – a fact-finding observation of East Calcutta Wetlands. Kolkata, (publisher unknown). 18 Farmers response to researchers 19 Response by local medical practitioners to researchers

30
PERCEIVED ADVANTAGES DISADVANTAGES REFERENCE Results from test village in Jajmau in
Kanpur show that the Faecal coliform count far exceeded the WHO & FAO standards for raw sewage that is most often supplied as irrigation water in Jajmau villages. Hence there is a possible health risk for the irrigators and communities who are in prolonged contact with untreated wastewater (eg, in Kanpur) and the consumers of vegetables irrigated with wastewater. (see Annexure 4)
Impact of Wastewater on Livelihoods, Health and Environment, Kanpur Case Study (April 2005), ECOFRIENDS, Kanpur, pp 54
In Ahmedabad, most people interviewed complained of gastric disorders (digestion, constipation, stomach distension and acidity) & Skin disorders (included itching, dark patches appearing on the skin, lesions and sores.)20
Impact of Wastewater on Livelihoods, Health and Environment: Ahmedabad Case Study, 2005
In absence of secondary treatment plant in Ahmedabad the level of pollutants are very high in wastewater in terms of TDS and BOD levels. (see Annexure 5)
National Assessment of Wastewater Generation & Utilisation: A Case Study of India, Final Report YUVA, Mumbai, 2005
20 This statement was based on responses by villagers to the researchers.

31
PERCEIVED ADVANTAGES DISADVANTAGES REFERENCE If utilized to the maximum possible levels, the reuse of wastewater can be treated as a measure to reduce stress on limited ground and surface water resources. With the increase in demand for potable water, this reduction in stress over ground water resources is critical. At present, approximately 57 MG per Year of wastewater is being utilized for agricultural purposes. With the available 42,000 hectares of agricultural land in Delhi, there is a potential for diverting approximately 1400 MG per Year of wastewater for agriculture saving a corresponding figure of surface & ground water.
In survey areas in Kanpur, the wastewater was found to be contaminated with high levels of the toxicants. It was laced with deadly chemicals used by leather and other factories of Kanpur. This wastewater is being used as irrigation water for the last 15 years that has led to contamination of the surface and ground water, soils, crops, other vegetations and food. (see Annexure 6 for details of tests)
Final Report: Urban Wastewater: Livelihood, Health and Environmental Impacts in India (December 2004), ch 7, pp 1-2, Spatial Decisions, New Delhi.
EN
VIR
ON
ME
NT
As per the views of the farmers surveyed in Delhi, soil quality in almost all areas irrigated with this water was good. The productivity of the soil was reported to increase with application of treated effluent.
In surveyed villages in Ahmedabad soil fertility loss was reported by farmers. It is becoming more compact and losing its moisture retention capacity.
Final Report: Urban Wastewater: Livelihood, Health and Environmental Impacts in India (December 2004), ch 7, pp 1-2, Spatial Decisions, New Delhi. & Impact of Wastewater on Livelihoods, Health and Environment: Ahmedabad Case Study, 2005,ch 3 pp 13

32
PERCEIVED ADVANTAGES DISADVANTAGES REFERENCE Analysis of soil, vegetable and fish samples grown on wastewater in and around the East Calcutta Wetlands do not show any threat from heavy metals as all under permissible level. Sewage effluent in ECW is very rich in nutrients and organic matter and facilitates growth of fish populations.
Gupta, Gautam Dr., Urban Wastewater: Livelihoods, Health and Environmental Impacts in India: The Case of the East Calcutta Wetlands, Department of Economics, Jadavpur University, pp 50-55
Wastewater use has the advantage of limiting the pollution of rivers and other surface bodies that would otherwise be used as disposal outlets. Usually treated/untreated/polluted wastewater is discharged in the end into river bodies. For example, in Kanpur, a raw sewage drain, which also contains contaminated discharge from a TB hospital, empties its polluted contents right at the water intake point.
Underground water is also a major source of clean drinking water accessed by the peri-urban rural poor. Its subsequent pollution will lead to negative health impacts on the populace.
WA
TE
R Q
UA
LIT
Y IS
SUE
S
The possibilities of using treated wastewater to recharge groundwater reserves have also been explored (eg, South Mexico), and has led to benefits.
The pollution of underground aquifers through seepage is a major source of health and livelihood concern. In many areas across the country, irrigation is done through bore wells. Its pollution would have adverse effects on harvests and cropping patterns in such areas.
Final Report: Urban Wastewater: Livelihood, Health and Environmental Impacts in India (December 2004), ch 1, pp 15, Spatial Decisions, New Delhi. & Impact of Wastewater on Livelihoods, Health and Environment, Kanpur Case Study (April 2005), pp 34-37 ECOFRIENDS, Kanpur

33
PERCEIVED ADVANTAGES DISADVANTAGES REFERENCE Since in South Asia the major application of wastewater is in agriculture, it has been a blessing for those water-starved areas which can now grow a second crop because of a continuous supply of water.
However, the pros and cons of such use is apparent here; in many cases, untreated or polluted wastewater leads to adverse impacts such as sudden drying up of crops before harvest or lowered shelf life of vegetables as witnessed in Ahmedabad.
Impact of Wastewater on Livelihoods, Health and Environment: Ahmedabad Case Study, 2005
Studies indicate that there is an increase in crop yield with wastewater irrigation. One such study (Minhas) provides results of nearly 36% increase in crop yield using wastewater over tubewell water irrigation21.
Use of wastewater has also led to increased pest attacks, which have prompted extensive use of pesticides. This has led to higher input costs for the farmers22.
AG
RIC
UL
TU
RA
L P
RO
DU
C T
IVIT
Y
Studies have also reported that crop density increases with wastewater irrigation. It is being observed that crop density has shown nearly 11% increase with wastewater irrigation23.
Increase in physiological weight loss and decay loss- These losses occur in crops grown in fresh-water. However, it is observed that wastewater use increases physiological weight loss in plants by 19% over tubewell water while decay losses when kept for 10-day period, are seen to increase by 145% over freshwater irrigation24
21 Minhas P.S. Use of Sewage in Agriculture: Some Experiences. Central Soil Salinity Institute, Karnal 22 Bradford. A, Brook. R, Hunshal. C (2000) Risk Reduction in Hubli-Dharwad, India in Sewage Irrigated Farming System, UA Magazine 23 Minhas P.S. Use of Sewage in Agriculture: Some Experiences. Central Soil Salinity Institute, Karnal 24 ibid

34
5.0 Wastewater Usage – A Comparative Regional Analysis
The various uses of wastewater across the four specific regions offer levels of data; there
exists no simple correlation between urbanization and issues of wastewater use as each
urban centre throws up its own contexts. See Table 4.

35
Table 4: A snapshot of wastewater usage in the study areas 25 Area of Study Total population
(in million) Census 2001, GoI
Per capita Consumption of Water (lpcd)
Total Amount of Water Supplied MLD26
% of Population not Connected by Sewage Treatment
Volume of Wastewater Generated (MLD)
% of Wastewater Collected
Ahmedabad 5.81 135. 396.8 5 326 80 Delhi 13.78 239.627 2767 5528 3167 47 Kanpur Nagar 4.14 250 588.5 76 408 20 Kolkata City 4.58 202. 1209.6 4 1,383 85
25 Source: Urban Water Authorities in India, (indicated otherwise) 26 water supplied to the city by the municipality or the pvt utilities etc 27 Economic Survey 2000-2001 28 DUEIIP Status Report for Delhi, January 2001, MoEF

36
Delhi and Kolkata generate more wastewater due to population size and subsequent
demand and use of water. This also depends on the levels of urbanization in the study
area. Cities with higher degree of urbanisation also develop technology and infrastructure
to deal with high volumes of waste29 which includes wastewater. But this goes the other
way, as city managers in an effort to cash in on real estate boom ignore parallel
infrastructure development30. This may explain while Delhi, being the capital of India still
has 55% of the population not connected with sewage treatment. Also, lower levels of
urbanization, may signify inadequacy to deal with waste due to low infrastructure
development. One interesting fact that comes to light is that while in most cities the
demand and subsequent consumption for water is on the rise, the per capita consumption
has actually decreased in Ahmedabad.
5.1 Level of Urbanization in the Study Area
The level of urbanization is an index of economic development. The two processes bear a
high positive correlation. Urbanization is related to the level of economic development
measured, for want of a superior indicator, by per capita income.31 However, the
relationship is not linear. When per capita income increases, urbanization also increases
though not as much.32 However, there is additional pressure on urban centers to develop
infrastructure along with growing populations and often a gap emerges which may lead to
environmental degradation. See Figure 1 for levels of urbanization in the study areas.
29 Dr Léautier, Frannie (ed), Cities in a Globalizing World, Governance, Performance and Sustainability, World Bank Institute, 2006 30 ibid 31 http://planningcommission.nic.in/plans/stateplan/sdr_maha/ch-13-14-02-05.pdf 32 ibid

37
Figure 1: Levels of urbanization in the four study areas
Level of urbanisation across decades
0
20
40
60
80
100
KanpurNagar
Ahmedabad Kolkatta New DelhiCities
Leve
l of u
rban
isat
ion
in p
erce
ntag
e
1991
2001
Source: Census 2001
See Figure 2 for growth in population in the last three decades in the selected areas.
Figure 2: Growth in population in the last three decades in the selected areas
Population in last three decades
3.69
6.22
4.12
2.65
4.58
9.42
4.40
3.25
5.81
13.7
8
4.58
4.14
0
2
4
6
8
10
12
14
16
Ahmedabad Delhi Kolkata KanpurNagar
City
Popu
latio
n in
mill
ions
198119912001
Source: Census 2001

38
From figures 1 & 2, one can see that in smaller cities with a lesser degree of urbanization
(Ahmedabad and Kanpur), population increase has been greater. Looking back at the case
studies, it becomes apparent that in smaller cities, the pressure of population on existing
urban infrastructure is high. Hence, the impacts, perhaps more negative than positive, will
be pronounced. On the other hand, larger populations, without proper urban sanitation
and water supply networks stand to be more at risk. At the same time, two different future
scenarios emerge. The two big cities, namely Delhi and Kolkata, which has almost
reached a level of saturation in terms of provision of urban amenities, may find it difficult
to expand their services to include growing population. Hence, a gap emerges between
existing facilities and excess population and their civic needs. A similar kind of
“infrastructure gap” appears in smaller cities. The smaller cities are growing faster in
population compared to the degree of urbanization. Further, infrastructure development
cannot keep pace with the population growth, leading to a gap that leads to inadequate
urban management and planning. Hence, while approaching the findings from each
specific area we need to refer to this analysis not only to understand the present scenario
but also the emerging trends.
5.2 Water Issues in Case Study Areas – A Profile
5.2.1 Kanpur
Kanpur is the eighth largest metropolis in India and the largest and most important
industrial town of Uttar Pradesh between latitude 26o 29’ 35’’ N and longitude 80o 18’-
80o 25’ E. Kanpur as one of India’s earliest industrial towns, is an important centre of
ordnance equipments, engineering and leather tanning, etc. (See Figure 3 for agricultural
and industrial areas in the city). Kanpur is situated on the right bank of river Ganga at a
height of about 125.6 m above MSL (Mean Sea Level) and located in the south-central of
the state.

39
Figure 3: Map of industrial and agricultural areas in Kanpur
Map not to scale

40
River Ganga enters the town from the west and flows out in the east. River Pandu enters
the city from the west and joins River Ganga at about 25 km downstream of Kanpur. The
town is sandwiched between River Ganga in the north and River Pandu in the south.
Kanpur has a linear development along River Ganga in the east-west direction. The
expansion of the city is restricted in the south by River Pandu. The land-use pattern of the
city is marked with a heavily built Central Business District (CBD) area near the railway
station hosting the wholesale market and cantonment area in the east. The development of
public, semi-public, residential and other mixed land-uses have come up in the west and
are mixed with the industrial growth in that direction.
The Grand Trunk (GT) Road has divided the town in to two parts: one slope away from
GT towards river Ganga in the North; the other slopes towards River Pandu in the South.
The topography is more or less flat. The peri-urban area lies in the alluvial belt of the
Gangetic plains. Sediment deposits formed in successive stages form the under-bed. A
bed of clay fine sand, mixed with kankar and stone bajri, in layers form the top.
Kanpur Nagar witnessed significant population growth between 1981 (2.65 million) and
1991 (3.25 m), with decadal growth rate of 22.6 percent. The population recorded in 2001
census was 4.41 million, with decadal growth rate increasing to 27.2 percent.
The main source of raw water for municipal piped water supply is River Ganga, the
Lower Ganga canal and deep tube wells. Both the River Ganga and Ganga canal are
heavily polluted in Kanpur. The water is treated before it is supplied, but sometimes
excessive chlorination becomes necessary to bring the water to safe levels. Also, potable
water gets contaminated during supply as the water supply lines run parallel to sewer
lines and both the pipelines are old and broken at places.
The prevailing power situation in the city is marked with frequent power failures for
prolonged periods. This aggravates the problem as vital components like raw water
pumping, equipments in treatment works, clear water pumping, and tube well pumps in
the water supply system are dependent exclusively on power supply for operation.

41
5.2.2 Delhi
With a total area of 1,484 sq km, Delhi is situated at a height of 220 m above the sea
level. It is 77o13’16.08’’ E longitude and 28o 37’58.55’’ N latitude. The state of
Haryana borders Delhi from three sides – north, south and west – while the state of Uttar
Pradesh surrounds it in the east. Figure 4 shows the administrative divisions of the city.
River Yamuna flows through Delhi from the north towards the south. A hard rocky ridge
runs from the southern border of the National Capital Territory (NCT) in the southwest in
a north-easterly direction unto the western banks of River Yamuna near Wazirabad
barrage. The natural drainage of the areas located east of the ridge is towards Yamuna and
for the area west of the ridge is towards the Najafgarh drain.
The major surface water body in Delhi is River Yamuna that serves the source of most of
Delhi‘s water supply and the sink for all of the wastewater. In Delhi, water is extracted
upstream of Wazirabad barrage near Palla where it is treated and supplied for drinking
purpose.
Delhi is divided into five main sewerage zones viz Rithala, Coronation Pillar, Keshopur,
Trans Yamuna, and Okhla. The total wastewater generation from these zones is estimated
as 3,167 MLD (CPCB 2003). Municipal sewage constitutes roughly 93-94 percent of the
total discharge while 6-7 percent is industrial discharge (MoEF 2001) from 28 industrial
areas.
All the wastewater in the city, treated or untreated, finds its way into River Yamuna
between Wazirabad barrage and Okhla barrage through the 22 major drains originating in
Delhi. Additionally, three drains originating in Ghaziabad and Noida discharge into the
Yamuna within this stretch33. Results of the water quality from River Yamuna, when
compared with drinking water standards (IS: 10500:1991) listed in Annexure 7, indicates
that river water cannot be used for drinking purpose directly.
33 Trivedi, R.C. , Makhijani, S.D. , Bhardwaj, R.M., Status of Water Quality in River Yamuna - NCT of Delhi, Central Pollution Control Board

42
Figure 4: Map showing administrative divisions of Delhi
Source: Government of Delhi

43
Wastewater in Delhi undergoes centralized treatment at various locations. There are 30
sewage treatment plants (STPs) at 17 locations in the city, most based on activated sludge
process. The monitoring results with limited parameters show that the STPs are
functioning effectively to treat the sewage load reaching them, with little adverse effect
on the water quality of the Yamuna. The untreated wastewater makes its way into the
different drains across the city and mixes with the treated effluent, negating the advantage
achieved by the operative STPs. Consequently, the treated effluent only dilutes, lowering
the pollutant levels marginally in the untreated wastewater. The poor water quality of the
discharge from the drains flowing into the Yamuna is reflective of this problem of mixing
untreated wastewater, collectively causing deterioration in the water quality of the river
within the Wazirabad-Okhla stretch.
Out of 3,167 MLDof wastewater generated in Delhi, only 2,330 MLD can be treated with
the existing capacity, out of which only 1,478 MLD actually reaches sewage treatment
plants; which means, only 47 percent of the total wastewater generated is being treated. In
other words, about 53 percent of the untreated wastewater flows into River Yamuna. Lack
of a proper conveyance system for municipal sewage is cited as the prime reason behind
this. Only about 45 percent of the population in Delhi have proper sewerage systems
(MoEF, 2001). The rest 55 percent generate wastewater that flow untreated into the nalas
(drains) and then to the river.
Government agencies involved in the management of water quality and standards
associated for the discharge of wastewater in Delhi include Ministry of Environment and
Forests (MoEF), National River Conservation Directorate (NRCD), Central Pollution
Control Board (CPCB), Delhi Pollution Control Committee, Delhi Jal Board, and
Department of Environment.
5.2.3 Ahmedabad
The city lies in the region of North Gujarat, which is dry and sandy. Except for the small
hills of Thaltej-Jodhpur Tekra, the entire surroundings of the city is a plain. There are no
woods or forests nearby. The sea is 80.65 km far, at the Gulf of Cambay. Sabarmati, one
of the longest rivers of Gujarat, bifurcates the city into eastern and western parts,
connected by bridges, some of which were constructed after independence. Though the
river is perennial, it practically dries up in the summer, leaving very little water.

44
Figure 5: City Map –Ahmedabad
Source: www.mapsofindia.com
Map not to scale

45
Having grown by leaps and bounds, Ahmedabad is the largest city of Gujarat state and the
seventh largest city in India, with a population of 5.81 million (Census, 2001).
Major expansion in the textile industry boosted its development – once known as the
“Manchester of India”. Although it no longer holds that privilege, Ahmedabad is a well-
established centre of commerce and industry with modern technologies in textiles,
chemicals, dyes, pharmaceuticals, and intermediaries.
The three industrial zones, Vatva, Odhav and Naroda, are situated to the east of the city,
housing 3,365 miscellaneous industries. The city limits have expanded from 5.70 km in
1872 to 186.78 km in 1991. In 2001, it was 190.84 km.34
Development of infrastructure, however, could not keep pace with the increase in
population and industrial growth. The major strain was on water supply. There are a
number of commercial establishments and private residences/societies with their own
bore wells. Public water is supplied by the Ahmedabad Municipal Corporation (AMC)
and the Ahmedabad Urban Development Authority (AUDA). AUDA supplies only to
those areas that fall within its town planning scheme. Although the supply of water has
increased from 20.24 MGD in 1951 to 104.83 MGD in 2001,35 the per capita
consumption has decreased.
It is estimated that almost 80 percent of the water supplied for domestic use passes out as
wastewater. According to the AMC, almost 66 percent of the city's population is
connected to an underground sewerage system. Currently, there are four STPs with a
capacity to treat 633 MLD, but the entire volume released is not treated. The reason being
ineffective maintenance as cost of maintaining these plants are high.
Besides the domestic wastewater, a huge quantity of industrial wastewater is generated
too. However, each zone has a CEPTs (Common Effluent Treatment Plant) (list given
below), and they are all operating below capacity. Although most of the wastewater
34 www.indiaurbaninfo.com 35 Chokkakula Srinivas, Shah Manali, “Issues in Urban Domestic Water Supply: Situational Analysis of Ahmedabad City.” Prepared for IWMI-TATA Program, Anand

46
generated by the industries is diverted into the Khari River, a number of industries also
drain their wastewater directly into the Sabarmati River.
Sr.No. Name of C.E.T.P. In Operation.
Nos. of Members
Capacity In M3 / Day
1. ODHAV GREEN ENVIRO PROJECT ASSOCIATION, PLOT. No. 394,G.I.D.C. ESTSTE, ODHAV, AHMEDABAD
03 1000
2. G.V.M.S.A.V. LIMITED, PLOT. No. 181, G.V.M.M. INDUSTRIAL - ESTSTE, ODHAV, AHMEDABAD
357 1000
3. THE GREEN ENVIRONMENT SERVICES CO-OPERATIVE SOCIETY LTD. PLOT NO. 244 TO 251, PHASE-II , G.I.D.C. ESTATE, VATVA, AHMEDABAD
518 16000
4. NARODA ENVIRO PROJECTS LIMITED,PLOT. No. 512 to 515, PHASE-I, G.I.D.C. ESTSTE, NARODA, AHMEDABAD
242 3000
5. ODHAV ENVIRO PROJECTS LIMITED,PLOT. No. 25, G.I.D.C. ESTSTE, ODHAV, AHMEDABAD
60 1200
Source: http://gpcb.gov.in 5.2.4 Kolkata
The city’s history spans over three centuries. Kolkata, the capital of West Bengal, was the
capital of British India from 1773 to 1911. Over the years, Kolkata has grown manifold to
become one of the biggest cities in the world.
The city limits expanded after the Kolkata Municipal Corporation Act, 1983, was passed.
It included the municipalities of South Suburban, Garden Reach and Jadavpur within the
Kolkata Municipal Corporation’s jurisdiction, which now spreads over 18,733 hectares,
consisting 141 wards.36
36 http://www.rainwaterharvesting.org

47
River Hooghly flows past the western part of Kolkata. The South 24 Parganas district
forms the southern and south-eastern boundary. The North 24 Parganas forms the eastern
and northern limits of the city.
The civic infrastructure of the metropolitan area is inadequate for the growing population.
The demographic density during 1981 was 22,260 people per sq km; during 1991, this
rose to 23,670 persons per sq km in Kolkata.37
The residents get their water supply from three main sources:38
• The KMC, supplying treated water through an underground pipeline network
• Roadside public bore wells dug by KMC
• Innumerable private bore wells dug by residents
The municipal corporation supplies about 750-800 MLD from its surface water sources
and 136 MLD from groundwater sources.39 Additionally, it also supplies 300 MLD of
unfiltered but chlorinated water.
37 ibid 38 ibid 39 ibid

48
Figure 6: Map of the East Calcutta Wetlands showing Dry weather Flow (DWF) Network
Source: PAN Network, Kolkata
Map not to scale

49
Though Kolkata has a fairly abundant source of surface water close by, the community
water supply system suffers from problems of poor maintenance, inequitable distribution,
and poor quality management.
Chattopadhyay (2004) has estimated the economic benefits of East Calcutta Wetlands in
‘Jalabhumir Kolkata’ – a fact-finding observation of East Calcutta Wetlands. The wetland
ecosystem of Kolkata supports 100,000 direct stakeholders and 5,100 hectares of
cultivation. It provides annually direct employment for about 70,000 people, produces
128,000 quintals of paddy, 69,000 quintals of fish and 7.3 quintals of vegetables. It also
generates revenue of Rs 266 million and net returns of Rs 80 million. The All India
Institute of Hygiene and Public Health (1997) showed in a research work that Kolkata
Municipal Corporation generated solid wastes of 3,100 metric tons daily – 56 percent of
these wastes is biodegradable. At present, a private organization in Dhapa uses these
wastes to produce fertilizers. Paddy, wheat, mustard, and corn along with pulses,
vegetables are grown using wastewater. Along the DWF (Dry Weather Flow) canal,
floriculture was started recently. Hence, the study of East Calcutta Wetlands (ECW) in
relation to urban wastewater recycling and management is vital to this study.

50
6.0. Impact Assessment
The alarming statistics on water shortage for urban uses in Indian cities has compelled
urban dwellers to refocus on ways to recycle wastewater – through the reuse of urban
wastewater, for irrigation and other purposes. Disposal of wastewater is a problem faced
by urban local bodies especially in large metropolitan cities, with limited space for land-
based treatment and disposal.
Wastewater can be utilized for productive uses in agriculture. Other important uses of
wastewater include recharge of groundwater and in landscaping, industry, construction,
dust control, wildlife habitat improvement, and aquaculture.40 Using wastewater or low
quality water for irrigation is a good way to reduce the demand for freshwater.
Wastewater use has the advantage of limiting the pollution of rivers and other surface
bodies that would otherwise be used as disposal outlets.
Wastewater is a resource as well as a problem. Wastewater with its nutrient content can
be used extensively for irrigation and other ecosystems. Its reuse can deliver positive
benefits to the farming community, society, and municipalities. However, wastewater use
also exacts negative externality effects on humans and ecological systems, which need to
be identified and assessed.
6.1 Environmental Impacts
6.1.1 Impact on Soil Quality
Presence of a high nutrient content (Nitrogen and Phosphorus) in wastewater leads to
conservation of such nutrients, thereby reducing the need for artificial fertilizers41.
• Wastewater irrigation may lead to transport of heavy metals to soils and may
cause crop contamination affecting soil flora and fauna. Some of these heavy
metals may bio-accumulate in the soil while others, for example, Cd and Cu, may
be redistributed by soil fauna such as earthworms (Kruse and Barrett 1985).
40 Hussain Intizar et al. 2002. Wastewater Use in Agriculture: Review of Impacts and methodological issues in valuing impacts. (With an extended list of bibliographical references) Working Paper 37. Colombo, Sri Lanka: International Water Management Institute. 41 Minhas P.S. Use of Sewage in Agriculture: Some Experiences. Central Soil Salinity Institute, Karnal

51
Evidences from Hubli, show that unregulated and continuous irrigation with
wastewater also leads to environmental problems such as salination, phytotoxicity
(plant poisoning) and soil structure deterioration (soil clogging), which in India is
commonly referred to as “sewage sickness”42
• High salt content in wastewater leads to salt accumulation in crop root zone to a
concentration that results in loss of yield. This happens because of lesser uptake of
water by plant roots. Salinity needs to be removed by pumping out excess salt
from the soil structure43
• If the used wastewater contains elevated levels of persistent-type toxicants such as
metals and, to some extent, pesticides then its consistent use may lead to build-up
of higher concentrations in soils from accumulation. The higher metal levels may
cause negative impacts on crops, inhibiting their growth44
(For a detailed account of impact on soil quality in case study areas, see Table 5
below)
42 Bradford, Andrew, et al Wastewater Irrigation: Hubli Dharwad, India, International Symposium on Water, Poverty and Productive uses of Water at the Household Level, January 2003, Muldersdrift, South Africa 43 Minhas P.S. Use of Sewage in Agriculture: Some Experiences. Central Soil Salinity Institute, Karnal 44 Final Report: Urban Wastewater: Livelihood, Health and Environmental Impacts in India (December 2004), ch 7, pp 56 EcoFriends, Kanpur

52
Table 5: Impact on Soil Quality in Case Study Areas
Soil Quality City Positive Impacts Negative Impacts
Delhi - Most of the farmers reported that soil quality in wastewater irrigated areas is good.
- Productivity of soil was also reported to increase with application of treated effluent.
- The farmers had no complaints related to decline in the fertility of soil due to any reason.
- A small section of the farmers reported land infertility over time, which could be attributed to bad quality of wastewater with high doses of industrial loading.
Ahmedabad
- In the villages located near River Sabarmati, farmers reported decline in yields. They attributed this decline to deterioration in soil quality.
- Though no scientific testing of the soil was done, the community perceived that prolonged irrigation with water from Sabarmati river has resulted in compaction and degradation of the top soil.
- In Bakrol village the community believed that use of Sabarmati river for irrigation has led to change in soil texture. The topsoil has turned to hard crusts affecting fertility. In most other villages also, reduced yields have been connected to loss of soil fertility by the community, for example, in the village of Vautha, the topsoil has become compact and hard.
Kanpur
- In Jajmau area of Kanpur, the partially treated sewage irrigation water supplied to the farmland has led to widespread contamination and deterioration of soil quality and lower returns in agriculture.
- Metal and pesticide levels in soil from wastewater disposal areas are very high. ITRC reports (1996) & NBRI report 2000 and questionnaire based individual farmers’ survey show that crops’ yield has been impacted adversely. Almost all the farmers reported that crops yield has declined by 40-50 % over

53
Soil Quality City Positive Impacts Negative Impacts
the past few years due to wastewater irrigation. (See Annexure 8 for details of ITRC tests)
- The problem is of high sodium toxicity in both topsoil and subsoil. Excessive sodium salts are used during leather processing, which is drained into the tannery waste stream. Sodium crystallization in the subsoil impedes efficient water permeability in the soil. This causes serious injury to the crops at the initial stage. The mean level of Cd and Cr are above their critical levels in agricultural soils of the wastewater irrigated areas. (Annexure 9)
- The farmers in the selected area perceive that several hectares of land are degrading due to unscientific use of treated/untreated and heavily contaminated wastewater. Excessive deposition of heavy metals from sewage is causing irreparable damage to the soil.
Kolkata - Both the soil and vegetable quality analysis shows non-detectable levels of mercury and arsenic in soil and food grown with wastewater. This indicates that foods grown on wastes or by using wastewater are comparatively safe for consumption. (See Annexure 1)

54
6.1.2 Impact on Ground Water Quality
Common wastewater handling and reuse practices in developing nations (which are
frequently unplanned and uncontrolled) generate high rates of infiltration to underlying
aquifers in the more arid climates. Although the infiltration improves wastewater quality
and stores it for future uses, it can also pollute aquifers for potable water supply.
Wastewater infiltration to groundwater occurs directly from effluent handling facilities
and indirectly from excess agricultural irrigation in downstream areas.
Positive
Conserves water (by recycling and groundwater recharge)
Negative
Wastewater has the potential to affect the quality of groundwater resources in the long run
through excess nutrients and salts content leaching below the plant root zone. For
example, in Kanpur, CPCB has found groundwater in four areas to be heavily
contaminated. (See table 6) It was highly alkaline, hard and contaminated with very high
concentrations of metals, pesticides and fluoride. (See table 6) In some areas,
groundwater was found with high Sodium Absorption Ratio (SAR), rendering it
undesirable even for irrigation. (See table 6) Wastewater irrigation has the potential to
translocate pathogenic bacteria and viruses to groundwater (NRC report 1996)
Nitrate pollution of groundwater from application of wastewater effluent and sludge is
reported but can be rectified through traditional nutrient management technique adopted
in agriculture45
45 US EPA Case Studies, www.epa.gov
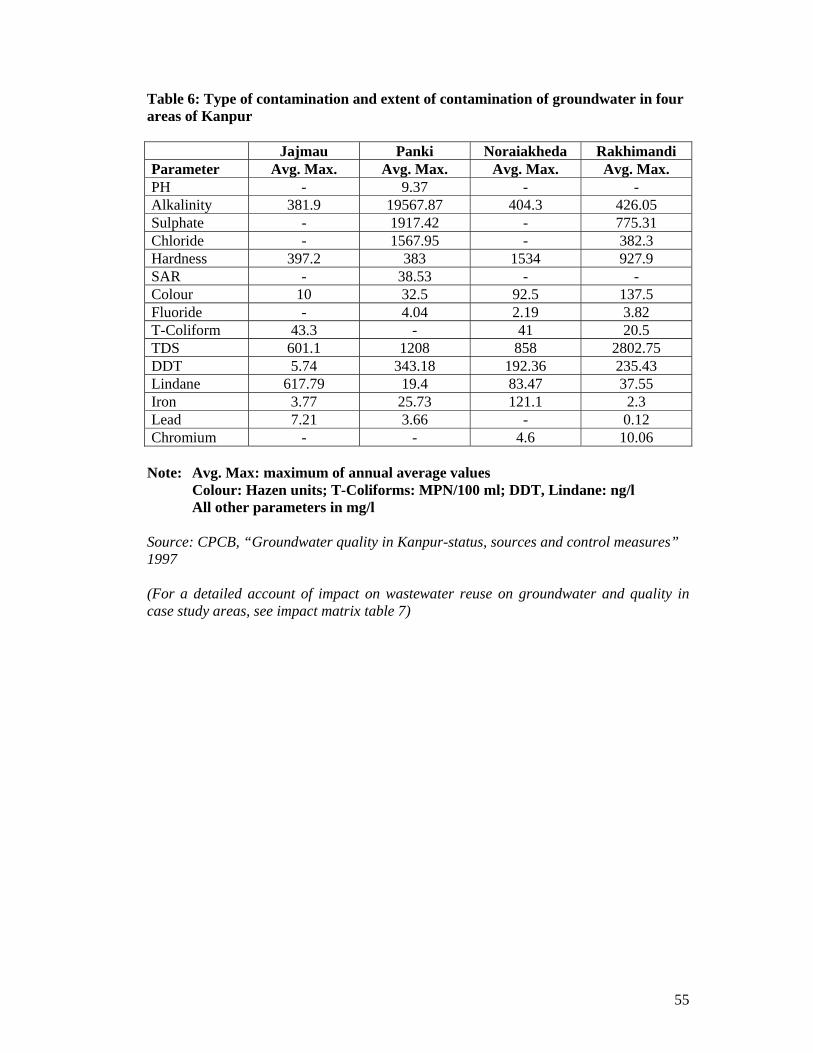
55
Table 6: Type of contamination and extent of contamination of groundwater in four areas of Kanpur
Jajmau Panki Noraiakheda Rakhimandi Parameter Avg. Max. Avg. Max. Avg. Max. Avg. Max. PH - 9.37 - - Alkalinity 381.9 19567.87 404.3 426.05 Sulphate - 1917.42 - 775.31 Chloride - 1567.95 - 382.3 Hardness 397.2 383 1534 927.9 SAR - 38.53 - - Colour 10 32.5 92.5 137.5 Fluoride - 4.04 2.19 3.82 T-Coliform 43.3 - 41 20.5 TDS 601.1 1208 858 2802.75 DDT 5.74 343.18 192.36 235.43 Lindane 617.79 19.4 83.47 37.55 Iron 3.77 25.73 121.1 2.3 Lead 7.21 3.66 - 0.12 Chromium - - 4.6 10.06
Note: Avg. Max: maximum of annual average values Colour: Hazen units; T-Coliforms: MPN/100 ml; DDT, Lindane: ng/l
All other parameters in mg/l Source: CPCB, “Groundwater quality in Kanpur-status, sources and control measures” 1997 (For a detailed account of impact on wastewater reuse on groundwater and quality in case study areas, see impact matrix table 7)

56
Table 7: Impact on wastewater reuse on groundwater and quality in case study areas
Impacts Ahmedabad46 Delhi Kanpur Kolkata
Ground Water Quality
Estimates state approximately 80% of the water supplied for domestic use passes out as wastewater in Ahmedabad. This untreated water either gets discharged in the natural streams or finds its way in the groundwater. Most of the villages studied report discoloration of water drawn from bore wells (reddish hue). In Fatehpura village, newly dug bore wells at 200 ft throw out reddish colored water, confirming pollution of groundwater in the area. Complaints about contamination of groundwater are verified by looking at the color of groundwater in areas
The groundwater quality of the observed areas is mostly within the recommended limits when considered in light of its usage for consumption and irrigation. However, certain parameters such as total hardness and iron content exceed. This could be attributed to peak industrial discharges at certain periods and insufficient treatment of wastewater that lead to large concentrations of metals. (see Annexure 10 for details) The Groundwater Board has not reported monitoring of toxic metals such as arsenic, aluminum, nickel, and beryllium. Any serious health problems such as
In the Jajamau area, the groundwater in wastewater-irrigated areas has become highly contaminated from heavy metals, pesticides and bacteria. Groundwater is the only drinking water source for the people inhabiting these areas. People get groundwater through hand pumps from a depth of 50-120 ft. This drinking water has turned yellowish in color and smells foul. It is clearly visible that the use of heavy metal-bearing wastewater has almost doubled the concentration of chromium in the soil. Concentration of nickel is also high. CPCB found groundwater in four areas of Kanpur heavily contaminated: Jajmau area shows high concentration of alkalinity, hardness, dissolved solid, iron and excessively high concentration of Lindane; Panki shows high concentration of pH, alkalinity, sulphate and fluoride; Nauraiyakheda shows high concentration of chromium, iron, hardness, alkalinity, fluoride, coliform and dissolved
Tanneries situated in the eastern part of Kolkata are a cause for concern as industrial effluents from these units pollute the Bheris (fishponds) , wetlands and agricultural fields. Toxic trace elements like chromium and cobalt are found in the shallow aquifer in the area, which is not suitable for drinking purposes. However, an analysis of water samples from deeper aquifer (80-200 m depth) shows that concentration of chromium, cobalt and other heavy metals is below permissible limits.
46 Most of the examples cited were obtained from farmers and other community members during surveys

57
Impacts Ahmedabad46 Delhi Kanpur Kolkata surrounding Gyaspur. Industries are considered major culprits for groundwater contamination.
cancer, food poisoning, etc, resulting from excessive concentration of trace metals, has not been reported in the field surveys. However, some farmers reported groundwater quality to be bad in terms of colour and taste. Although the monitoring results from the Groundwater Board do not report problems with the water quality in these areas, it is important to re-evaluate it in light of the complaints by the farmers.
solids; Rakhimandi shows the same. In some areas, groundwater was found with High Sodium Absorption Ratio (SAR), rendering it undesirable even for irrigation. This indicates that the soil is getting degraded by the use of wastewater and will ultimately become useless to farmers. Worse still, there is a complete absence of government medical facilities in the area, thus hitting the villagers doubly hard (refer to table 6 for details)

58
6.1.3 Impact on Surface Water Quality
Positive
Reduces pollution of rivers and other surface water by reducing the load entering them
Most of the heavy metals and other chemical agents attach themselves to the soil and the
final quantity of water released in the rivers has lower amounts of such substances
Negative
Large quantities of treated/untreated/polluted wastewater are finally discharged into the
rivers. This seriously affects the aquatic life in such areas
Build-up of harmful chemical substances in the aquatic food chain ultimately affects
consumers
May lead to change in water use patterns of people downstream who look for alternate
sources since the river water becomes unusable for consumption
(For details of the impact of wastewater on quality of surface water see table 8 below)

59
Table 8: Impact on Wastewater Use on Groundwater Quality in Case Study Areas
Impacts Ahmedabad Delhi Kanpur Kolkata Surface Water Quality
Prior to 1968, sewage was discharged after primary treatment to sewage farms from where the yield of grass was sold to farmers as fodder for cattle and livestock. The first phase of the Vasna sewage treatment plant was commissioned in 1969, and the Pirana plant in 1974. In 1986 too, Vasna handled a sewage flow of 100 MGD that was well in excess of its capacity and, thus, a large quantity of untreated sewage was allowed to be passed into the river untreated. The 1997 statistics show that city generated 740 MLD of sewage against the treatment capacity available with the municipality for only 630 MLD. The rest of the wastewater along with
The increasing trend of wastewater generation has proved deadly to the receiving surface water body, River Yamuna. The river is recognized for being a source of drinking water supply at its upstreams and for disposal of wastewater of the city. In other words, about 53% of wastewater generated in Delhi goes untreated into the Yamuna. Use of wastewater for various purposes leaves the river with almost no flow during the lean season, which is the most serious concern in various government bodies. However, letting untreated wastewater flow into the Yamuna is no solution. Over the years, not only has the public started viewing the river as a drain but its biological diversity has also been severely affected. The quality of the water of the Yamuna has been evaluated with reference to the National River Water Quality Monitoring Standard, set by the Ministry of Environment and Forests (MoEF). According to these standards, the water being withdrawn for treatment for drinking water
The wastewater supplied for irrigation is not used all days of the year. The surplus water ultimately flows into the Ganga river through countless small drains, thus polluting it. The hazardous solid wastes of different industries are stored at the industry site for a brief period before treatment or disposal. The surface runoff during the monsoons carries the hazardous components with it and contaminates the surface water body. Households that are not connected to sewers, discharge sullage (wastewater from kitchen/bathroom and grey water from septic tanks) directly to street drains that ultimately flow into the rivers.
The fear of water-borne disease striking the people is the greatest during the monsoons. Floods increase the chances of surface water getting contaminated by sewage and garbage. The contaminated water then enters the distribution system through breaches in the distribution network. Untreated wastewater is pumped into canals specifically built to carry the water into the East Calcutta Wetlands. The rest flows out into the Bay of Bengal. During the monsoon months, this last outflow is heavy.

60
Impacts Ahmedabad Delhi Kanpur Kolkata treated wastewater found its way into the Sabarmati
should have a total coliform count of 5000 or less. However, monitoring results exceed the desired values.
61
6.1.4 Other Impacts
• In Indore, Jaipur, Nagpur and Bangalore, as compared to freshwater irrigation, there is
increase in yield to the tune of 30-40 % due to wastewater irrigation for principal
crops. Reduction in fertilizer consumption is also one of the important features seen in
these cities 47
• Research results related to health impacts in the six major Indian cities (Indore,
Ahmedabad, Nagpur, Jaipur, Chennai, and Banglore) show wastewater irrigation
leads to high incidence of pest attack, high growth of weeds, and loss of fertility of
soil due to high chemical content of wastewater. Presence of chemical and organic
pollutants increases incidence of pest and weed attacks, thereby increasing pesticides
consumption as compared to freshwater irrigation48.
• Increase in weeds and pests: Raw sewage use for irrigation is reported to increase
incidence of pests and weeds. Planting of monoculture blocks of vegetable crops
increases their susceptibility to pests. In addition, with wastewater application,
continuous growth of crops during dry season increases pest population when they
would have normally encountered a seasonal decline. Plutella xylostella
(diamondback moth, DBM) and Helicoverpa armigera are two such pests that thrive
on sewage-irrigated crops. DBM affects aubergine and most Brassica species while
Helicoverpa armigera infests most vegetable crops such as okra, chilli, onion, tomato,
etc (Bradford et al).
• Increase in physiological weight loss and decay loss: These losses occur in crops
grown in fresh-water. However, it is observed that wastewater use increases
physiological weight loss in plants by 19 percent over fresh water while decay losses
when kept for a 10-day period, are seen to increase by 145 percent over freshwater
irrigation49
47 Londhe ,Archana , Talati, Jayesh Lokesh Kumar Singh, et al Urban – Hinterland Water Transactions: A Scoping Study Of Six Class I Indian Cities* IWMI-Tata Water Policy ProgramAnnual Partners’ Meet 2004 (draft) 48 ibid 49 Minhas P.S. Use of Sewage in Agriculture: Some Experiences. Central Soil Salinity Institute, Karnal

62
6.1.5 Health Impacts
Wastewater use can pose a threat to not only those who are in proximity and prolonged
contact with it but also to those who end up as consumers of products grown by applying
wastewater (See table 9).
In India, most of the sewage used for irrigation is untreated and there is no attempt to
remove pathogenic microorganisms before use. Sewage farm workers and farmers
practicing wastewater irrigation often carry a significant excess of hookworm infections
compared with farmers using freshwater for irrigation.50 A high proportion of sewage
farm workers were in the country was reported to be anemic and exhibited
gastrointestinal symptoms.51
While wastewater use for irrigation alleviates poverty for many urban and peri-urban
farmers, it simultaneously places them, the consumers of their products, and the
environment at risk. The farmers have repeated and close contact with untreated
wastewater, which is a major source of pathogens, and the high levels of anemia found
amongst them can be attributed to water-borne parasitic diseases and worm infestation.
The wastewater also contains potentially injurious bio-medical waste (including
disposable needles and syringes), that, after tilling operations, become half buried in the
soil thus creating hazardous conditions for farmers.52
(For a detailed account of health impacts due to wastewater usage in case study areas,
see table 10)
50 Final Report: National Assessment of Wastewater Generation and Utilization, A Case of India (July 2005) YUVA, Mumbai 51 ibid 52 ibid

63
Table 9: Possible sources of health risk using wastewater for irrigation purposes
Exposure Route
Receptor Population Group
Medium of Exposure
Possible Source of Risk
Dermal Farm workers Irrigation water Pathogens Ingestion Farm workers and
population in surrounding areas End consumers including farm workers Cattle Consumers of animal and animal products Babies
Groundwater Fruit, vegetable and cereal crops Water for drinking purpose Contaminated meat and eggs Mother’s milk
Heavy metals, organic chemicals, pathogens Heavy metals, organic chemicals, pathogens Pathogens, heavy metals, organic chemicals Pathogens, heavy metals, organic chemicals Heavy metals, organic chemicals
Inhalation Surrounding population downstream, farm workers
Inhaled air Virus

64
Table 10: Health Impacts due to wastewater use and consumption of produce grown Ahmedabad Delhi Kanpur Kolkata
Direct Contact
• The farming community remains most affected as there are complaints of intestinal problems, skin irritations and joint pains (leg joints mostly)
• The affected farmers got exposed to the hazardous effluent (mixture of wastewater with industrial and tannery effluents) while irrigating their fields with wastewater
• Majority of the farmers had no health related problems with wastewater
• Few farmers reported skin rashes
• Irrigation water supplied to the area is a mix of tannery effluents and sewage water from Kanpur. The tannery effluent is high in chromium and to a lesser degree, other heavy metals53
• Men, women and children have been seen working knee deep in this irrigation water while planting paddies. Numerous types of skin diseases were shown to the study team, including advanced leprosy and large skin ulcerations and discolorations
• The household survey indicated that every family in all surveyed towns has at least one person suffering from skin problems, including black fingernails, open ulcers, itching and rash
• The community did not report incidents of any skin diseases even after working in wastewater for long hours throughout the year
• After work they clean themselves with soaps in freshwater, this is how they justify the absence of any skin diseases
• They often apply oil made of local herbs. This prevents the pollutants to stick to their body while they are working in the sewage-fed fisheries
53 See Annexure 9 for details of ECOFRIENDS-IIT Test, September 2002, Profile of pollutants in sewage irrigation water and sludge generated from treatment plants.

65
Ahmedabad Delhi Kanpur Kolkata • Defecation in the fields
without proper hygiene might be adding to this infection rate
• The reported skin ulcerations, itching and rash are said to be from chromium exposure, either through direct contact or inhalation of smoke from burning contaminated cattle dung.
Consumption of produce
• Peri-urban farmers often complain of bad health of their siblings and frequent sickness from consuming vegetables grown from wastewater
• The colour of the water in the areas around Gyaspur village is red. The food cooked with the polluted water often turns red.
• Though the village community was unaware and did not associate the prevalent diseases to the consumption of produce generated on wastewater, certain cases of dysentery, diarrhoea, presence of worms in intestinal tract, vomiting, etc, were observed in such areas
• Various health centers and practicing doctors in these areas reported stomach and intestine
• Urine and blood samples were collected from the populations representing wastewater irrigated and analysed by the ITRC, Lucknow.
• The results indicated a higher presence of the metals and pollutants compared to samples collected from areas not receiving the wastewater in Kanpur. Further, residue levels of metals and pesticides in human blood as well as in urine
• Though the fishermen working for long hours rarely develop any disease related to wastewater, their household members do complain of diaohrrea, dysentery and other waterborne diseases. Moreover, scientific testing of fish grown in wastewater and in fresh water shows the former to be safe for consumption55. Except for the fish bone which
54 See Annexure 11 for details of test results 55 See Annexure 12 for details of test results

66
Ahmedabad Delhi Kanpur Kolkata related problems as the most common. A few farmers consuming vegetables produced on these farms reportedly had intestine related diseases in the past 6 months.
samples of the exposed and unexposed population groups in Kanpur were higher (Singh et al, 2004).
• Pesticide residue levels are present in water and vegetables, but β-HCH in guava is alarming54.
has higher concentration of copper.
Vector Related Problems
• No direct evidence of vector related diseases was discovered in any of the study villages.
• Health problems also occur due to the presence of mosquitoes in and around the fields irrigated with wastewater.
• During the field surveys, it was observed that vector related problems were more severe in fields which were over irrigated or suffered standing water.
• In such areas, health centers reported frequent occurrence of malaria, fevers, etc, this could be associated to the presence of disease-causing mosquitoes.
• Though there is no conclusive evidence regarding rise in vector related diseases, the respondents to health surveys state does state that the use of wastewater has allowed breeding grounds for vectors.
• No reported cases of vector related diseases, but there was concern regarding the collection of large amounts of wastewater in the wetlands that would become ideal breeding grounds.

67
Ahmedabad Delhi Kanpur Kolkata Consumption of Groundwater
• In studied villages, drinking water drawn from bore wells is discoloured and complaints of gastrointestinal disorders are on the rise.
• As revealed by field observations in Navagam village, a number of people suffer due to consumption of contaminated water.
• Most of the farmers admitted that the groundwater was also unfit for consumption, but in absence of any other alternative source, they had to depend on it for domestic needs.
• In most of the villages, gastric disorders and digestion related problems came second only to skin related diseases, which were common.
• As is apparent in the case study of Delhi, only a few parameters such as total hardness and iron content exceeded in the groundwater samples analyzed in the study areas56.
• Most of the areas surveyed had small farms where landless labourers worked on daily wages. These communities do not necessarily reside at the same location. They usually have their residences at an average distance of 1 km from their agricultural patches.
• However, the common sources of drinking water in these areas were either tap water (through surface water systems) or groundwater. Most of the farmers surveyed for the quality of groundwater did not report it to be
• Complaints of gastric, abdominal pain, gas, diarrhea, dysentery and infections from tape and roundworms were reported in every family.
• Ground water is the only drinking water source for the people inhabiting these areas. The drinking water from the hand pumps has become yellowish in colour and emits a foul smell. People often complain of losing their appetite on drinking the hand pump water. Infants vomit after consuming the water with some villagers reporting ‘vomiting of worms57.
• According to ITRC, Lucknow, report of 1996, the groundwater samples show high Cr content than the recommended permissible limit in
• Most households use bore wells as their source of drinking water.
• Most of the diseases in the area were reportedly water-borne. So water from tube wells was considered safer.
• No direct correlation was discovered between percolation of wastewater and deteriorating quality of groundwater.
56 See Annexure 13 for details on analysis of groundwater samples in Delhi 57 See Annexure 14 for details of groundwater tests conducted in Jajmau in Kanpur

68
Ahmedabad Delhi Kanpur Kolkata unfit for drinking.
• However, the health centers surveyed in these areas did report rare occurrence of cases of jaundice, which is usually water-borne.
drinking water.

69
Picture showing cattle wading through sewage water in an affected village in Kanpur
Picture of a child with skin disorder from affected village in Kanpur
While comparing the results from the different case studies, we can make the following
inferences:
Prolonged contact with wastewater can expose
farmers and their families to health risks. Skin
irritation and pain in the joints are common.
Symptoms of exposure to heavy metals and
pesticides are only recognized when they
achieve chronic and clinical levels. Since the
pesticides and heavy metals are both proven
neurotoxin, exposure may cause
neurobehavioral disorders such as fatigue,
insomnia, decreased concentration, depression, irritability, gastric symptoms, sensory
symptoms and motor symptoms. For example, in a survey of wastewater irrigators around
Keshopur and Okhla STP in Delhi, farmers reported skin problems due to regular contact
with wastewater. The reasons could be fluctuating pH values in treated effluent or higher
consumption of certain trace metals (e.g. arsenic).58 In areas such as Kanpur, where
farming communities using wastewater for irrigation live in the adjoining areas, the
contact period and hence negative effects will be more while in Delhi, where most of the
labour stays away from the irrigated areas and only works during the day, the potential of
negative health impact will be low.
There is also a risk to
consumers if vegetables are
irrigated with wastewater.
The effects from
consuming such vegetable
produce arise from the
presence of toxic metals or
pathogens as reported in
research outputs around the
globe. Effects of metals on
58 Refer Annexure 14 for details of groundwater tests conducted in Jajmau in Kanpur

70
human health can be classified as acute or chronic. Effects also depend on the type or
route of exposure to the pollutant. Exposure to a high dose can lead to severe symptoms
of poisoning – even death. Exposure to low doses over a prolonged contact also leads to
mild symptoms and effects that become severe over a period of time as high levels of
pollutants build up in the body. This is because other chemicals can be broken down and
excreted through the detoxification processes in the body but metals cannot be since all
metals are potentially toxic. Metals tend to accumulate in the body even through low but
continuous exposure. In Kanpur, for example, the Pollution Control Board has put
restrictions on growing vegetables that are eaten raw.
Animals are also affected when they come in contact with wastewater. The symptoms are
weakness, loose motions, less milk output, and lower fertility. It is seen that animals do
not reproduce as often when they drink the wastewater, get diarrhea, become weak at a
younger age, and have to be slaughtered.
“For example, research in Hyderabad shows that after consuming the fodder grass
irrigated with wastewater, the health of animals was affected – buffaloes that consumed
the wastewater suffered fever and bloating.”59 It is mentioned in the Kanpur study that in
the village of Jaana, almost all animals are suffering from some kinds of diseases. Most of
them are loosing their nails and have respiratory problems. Many of them die just because
of neck problems (while twisting). Half the female cattle have aborted abnormally owing
to various stomach ailments.
Most cases of stomach and intestinal problems are due to the presence of Faecal Coliform
in wastewater. Although pathogens are not absorbed by plants, they get attached to the
leaves and other parts. Further, these pathogens get into human systems if the vegetables
are not properly washed or if they are eaten uncooked. Hence, it is understood that if the
treated effluent quality being provided for irrigation is within these standards, it is safe to
produce crops for human consumption. If the water quality does not meet irrigation water
standards, various health effects as discussed above can happen as a result of
consumption of vegetables being produced using this water. In Delhi, no monitoring has
been performed to detect the presence of Faecal Coliform in treated effluent. Concerned 59 Final Report: National Assessment of Wastewater Generation and Utilization, A Case of India (July 2005) YUVA, Mumbai

71
authorities quote non-requirement for monitoring in drains due to the settling nature of
metals. This usually makes them unavailable and non-detectable at the surface flows.
However, according to documents available, the prevalent diseases in these areas are
mostly associated with the presence of Faecal Coliform and high toxic metal content. The
absence of monitoring results is therefore a serious data gap.
6.2 Impact on Livelihoods Urban wastewater contains nutrients, which, if not optimally reused, may cause
eutrophication in receiving water bodies, thus causing their premature ageing. An
alternative use of urban wastewater is for irrigation/fodder cultivation. In India,
government and individual farmers use the treated or untreated sewage for fodder
cultivation around many urban centers. Owing to its potential for increasing crop yield
because of the presence of nutrients, urban wastewater can increase farmers’ income. In
India, wastewater use for irrigation is practised in 200 places, totaling 73,000 ha.60 The
wastewater is not always used as a last resort but sometimes preferred over cleaner water,
because of high nutrient content. It reduces the need for artificial fertilizers and, hence,
considered as a cost-saving agricultural practice.61 In addition, there are activities that are
dependent on wastewater such as livestock rearing and aquaculture. New livelihood
options such as floriculture have also grown.
Nutrient availability and a reliable water supply to farmers have been the predominant
objectives of wastewater irrigation. A study conducted in India under the IWMI-TATA
Water Policy Program titled “Urban–Hinterland Water Transactions: A Scoping Study of
Six Class-1 Cities” has detailed the wastewater generation status and utilization in
metropolitan cities of Indore, Nagpur, Jaipur, Ahmedabad, Bangalore and Chennai. It
reveals that overall the farming community in these cities has benefited immensely
especially by changing cropping patterns to attune with the quality of wastewater
available.
60 Londhe Archana, Talati Jayesh, Singh Lokesh Kumar, Vilayasseril Mathew, Dhaunta Sanjay, Rawlley Bhavna, Ganapathy K.K, Mathew Robin P, IWMI-Tata Water Policy Program,Annual Partners’ Meet 2004,Urban – Hinterland Water Transactions: A Scoping Study Of Six Class I Indian Cities 61 ibid

72
Studies have also reported that crop density increases with wastewater irrigation. Crop
density has shown nearly 11 percent increase with wastewater irrigation.62
Farmers follow innovated cropping patterns, to suit wastewater availability. In Indore,
farmers prefer to grow vegetables with wastewater. They believe such vegetables are
larger and get ready early for harvesting.
Reduction in fertilizer use is on of the major advantage attributed to wastewater irrigation.
Indore, Nagpur, Jaipur and Bangalore record a 50-100 percent lower fertilizer use, as
compared to freshwater irrigated areas.63
In Nagpur farmers have stopped growing green pepper and oranges in areas where they
use wastewater. Wastewater use is assumed to have increased pest attack on pepper and
reduced life span of orange trees from 20 to 14 years.64
In Ahmedabad, along the Sabarmati river, the cultivation of watermelon, potato, tobacco,
sugarcane and chilly has been replaced by fodder, vegetables, castor and marigold flower.
In the Fatehwadi canal region in Ahmedabad, farmers have changed the variety of rice in
response to wastewater use. Continuous water availability has also enabled farmers to
take a Rabi (winter) crop. Both cotton and mustard, which were the main crops of the
region, are not cultivated any longer due to increased availability of water.65
In Hyderabad, cultivation of Jasmine through wastewater has generated employment.
Jasmine plants flower for eight to nine months in a year, and a farmer can earn
approximately Rs 15,000-20,000 per hectare (Buechler and Devi 2002).66
(See Table 11 for patterns of wastewater use in agriculture in the case study areas.)
62 Final Report: Urban Wastewater: Livelihood, Health and Environmental Impacts in India (December 2004), ch 1, pp 10-12 Spatial Decisions, New Delhi, 63 Londhe Archana, Talati Jayesh, Singh Lokesh Kumar, Vilayasseril Mathew, Dhaunta Sanjay, Rawlley Bhavna, Ganapathy K.K, Mathew Robin P, IWMI-Tata Water Policy Program,Annual Partners’ Meet 2004,Urban – Hinterland Water Transactions Scoping Study Of Six Class I Indian Cities 64 ibid 65 ibid 66 Buechler, Stephanie and Gayathri Devi. 2004. “Innovations among Groundwater Users in Wastewater Irrigated Areas near Hyderabad, India”. Paper prepared for IWMI-TATA Annual Partners Meet 2004.

73
Table 11: Patterns of wastewater use in agriculture in the case study areas
Study Area
Total Land Under Formal
Wastewater Irrigation (In
Hectares)
Number Of Farmers
Using Wastewater (Formally)
Quality Of Wastewater Used (Treated/Untreated,
Diluted/Polluted River Water)
Type Of Use (Formal/Informal)
Type Of Crops Harvested
Ahmedabad 33,600 NA
Both, though treated wastewater is used on a larger scale
Both Vegetables, rice, other cereals, fodder/grasses, cotton, fruit trees, ornamentals, pastures
Delhi 1,700 (approx)
12,000 (includes
contractors as well as landless
labourers)
Treated wastewater is used in areas around Keshopur STP and Okhla STP. Polluted river water is used along the river bed and downstream outside the border of the city in states of Uttar Pradesh and Haryana through the Agra Canal
Formal. Wastewater is treated in the STPs and supplied to nearby agricultural areas through irrigation channels
Cucurbits, egg plant, okra, and coriander in summers. Spinach, mustard, cauliflower, and cabbage in winters
Kanpur 2,500 2,447
Treated, untreated and polluted river water are used for irrigation in Kanpur. Wastewater is discharged in rivers and this water is used downstream. Untreated wastewater from the sewers/drains is directed to the field or pumped. Authorities sell wastewater to farmers. It may be treated or untreated
Both. In Kanpur, some areas receive the sewage mixed with tannery wastewater as irrigation water. This water may or may not be treated. This irrigation water is supplied to the farmland through a channel. Kanpur Municipal Corporation charges for this water but the farmers have stopped paying the
Wheat, rice, vegetables, mustard and flowers

74
Study Area
Total Land Under Formal
Wastewater Irrigation (In
Hectares)
Number Of Farmers
Using Wastewater (Formally)
Quality Of Wastewater Used (Treated/Untreated,
Diluted/Polluted River Water)
Type Of Use (Formal/Informal)
Type Of Crops Harvested
irrigation cess since 2000. Some farmers use the polluted waters of the Ganga and Pandu rivers for riverbed farming. They do not pay any cess
Kolkata 4,887 2,500 households
Mostly untreated wastewater. Untreated wastewater is pumped into canals specifically built to carry the water into the East Calcutta Wetlands. Some of it is diverted to the fishery feeder canals and used as fish feed in the fisheries. The rest flows along a natural canal and is drawn when necessary for vegetable farming and rice cultivation
Formal. Untreated wastewater is pumped into canals specifically built to carry the water into the East Calcutta Wetlands. Some of it is diverted to the fishery feeder canals and used as fish feed in the fisheries. The rest flows along a natural canal and is drawn as necessary for vegetable farming and rice cultivation
Mostly used for growing paddy and vegetables but most of the wastewater is used for breeding fish

75
6.3 A Synopsis of Livelihood Impacts in Case Study Areas
6.3.1 Ahmedabad
The livelihood profiles of the study villages (see Annexure 15 for details of livelihoods
impact surveyed villages) show that the community is mostly agrarian and a majority
belong to the backward castes. However, wastewater, which was once a vital resource for
this water-starved region, has apparently done more harm than good. The quality of
wastewater having deteriorated has negatively affected the local agrarian system. The
following are the salient points that emerged from the case study:
It would be interesting to mention that in some of the study villages, the community
perception was strongly aligned to the fact that as long as treated wastewater was being
provided for irrigation, the impact on crop productivity and income generation was
positive. Only when the treated water started getting mixed with industrial effluents and
untreated wastewater, the negative impacts started becoming visible.
Keeping in mind the region’s geo-hydrological context, the availability of year-long water
has been a blessing, which perhaps explains why even with the water getting polluted,
farmers in the village of Vautha reportedly has managed to increase the total land under
paddy cultivation67 as the table 12 validates:
However, on the whole, the livelihoods of the people using wastewater for cultivation
have been affected adversely. Decline in yield has meant income loss in almost all
villages.
Apart from one or two villages, the rest have a high composition of SCs and Baxi Panch
who are socially and economically marginalized. The percentage of landless labourers is
also high and, being more economically vulnerable, they run the risk of prolonged contact
with polluted water without proper social and economic access to medicinal facilities.
67 This information was obtained from the Sarpanch, Talati as well as farmers of the village

76
Table 12: Crop Productivity in Vautha (Ahmedabad Case Study village)
2001 2002 2003 (good rainfall) Crops Cultivated Hectares Tonnes Hectares Tonnes Hectares Tonnes Paddy 150 150 200 240 200 300 Cotton 200 288 125 320 175 238

77
The change in the cropping pattern becomes evident in certain villages as previously
profitable horticultural activities have been replaced by paddy and wheat. Such a switch
happened because polluted water was no longer supporting such crops. This automatically
implies a lowering of income for households engaged in such activities.
A third crop, such as cumin, which is quite profitable to the tiller, has drastically
decreased in the last few years. Again, this has economic ramifications for the farming
community.
The case studies manage to provide in great detail the nature of wastewater impacts on
local livelihood systems. The findings, therefore, can be dovetailed to future intervention
strategies and policy recommendations to get a more contextualised approach towards
wastewater management.
6.3.2 Delhi
Most farmers hold small pieces of land, which are either taken on lease from government
agencies such as the DDA, Land and Estate Department, etc, or are owned by individuals
who further give land on contract. Most of their earnings from the sale of crops produced
go into paying off the lease charges and buying costly fertilizers and diesel for pumping
motors to pull groundwater.
A change from use of freshwater to use of properly treated wastewater will provide
environmental benefits such as saving groundwater and reduction in pollution load on the
Yamuna. It will also serve as a source of higher income generation for the communities
involved.
Treated wastewater irrigation in Delhi is being practised in areas around Keshopur and
Okhla STPs. Both these areas are receiving treated effluent from the STPs through a
separate channel provided by the STPs.
A comparative analysis of the field surveys from village where groundwater and
wastewater irrigation was practised on different land pieces was done to calculate the
difference in crop yield. This revealed that the income from land irrigated with treated
wastewater was higher. (see Annexure 1 for details)
78
The results depicted that a unit piece of land generates a higher profit margin with the use
of wastewater for irrigation as compared to groundwater use.
Cultivators occasionally have alternate livelihood options such as small transport
business, dairy, etc, though agriculture forms the most important part of their livelihoods.
However, all the labourers surveyed worked fulltime on these farms and agriculture is the
only source of their livelihoods.
Of 84,000 cultivators, 3,400 work on land irrigated through wastewater. Thus, there are a
big number (80,000) of cultivators for whom a higher income generation opportunity
could be present if supply of treated wastewater is made available in all the agricultural
patches of Delhi.
The scenario for landless labourers though is more critical. These groups are employed
full-time in agriculture. Often these groups are the poorest of the poor who are not skilled
in other work sectors, and they run their family with income from agriculture only. It was
also found that many a times their jobs and daily wages, which ranged from Rs 50 to Rs
70, was directly proportional to the work. Since wastewater provides increased yield
capacity per unit of land, a certain degree of security in terms of income is offered to
these masses. Also, since the agriculture produce fulfills the food requirement of the
people working on the land, they are able to save some of their earning for education of
their children, for instance.
With the increase in income of the cultivator (responsible for paying daily wages to the
laborers), increased wages for the laborers can be envisaged. If the whole agricultural
land is subjected to wastewater irrigation, net total annual income is estimated to be about
Rs 14,700 million. But if the same area gets freshwater irrigation, the net total annual
income comes down to an estimated Rs 7,000 million, resulting in a loss of about Rs
7,700 million per annum.
Improperly treated wastewater results in destruction of crops. Farmers surveyed reported
that at certain times (which could be peak industrial discharge periods), highly toxic

79
wastewater was passed on by the STPs for irrigation, which destroyed the crops resulting
in loss of income.
Relatively higher decay losses, which have direct or indirect effect on the income
generation factor, is another issue of concern. When the vegetables grown on wastewater
is moved to the market it gets mixed with vegetables brought from other sources, saving
losses to sellers, there is a loss to the buyer in particular, as the same cannot be for long.
Further, most farmers in the agricultural zones of Delhi have small land pieces and
harvest their produce on an every-day basis and sell them in nearby markets. As the
amount is small the farmer may not feel the loss due to decay. However, this factor could
be of serious concern for large-scale production farms where agricultural produce might
need a few days of storage before being sold off.
Table 13 provided below encapsulates the wastewater – agriculture economy that
operates in the study areas in Delhi
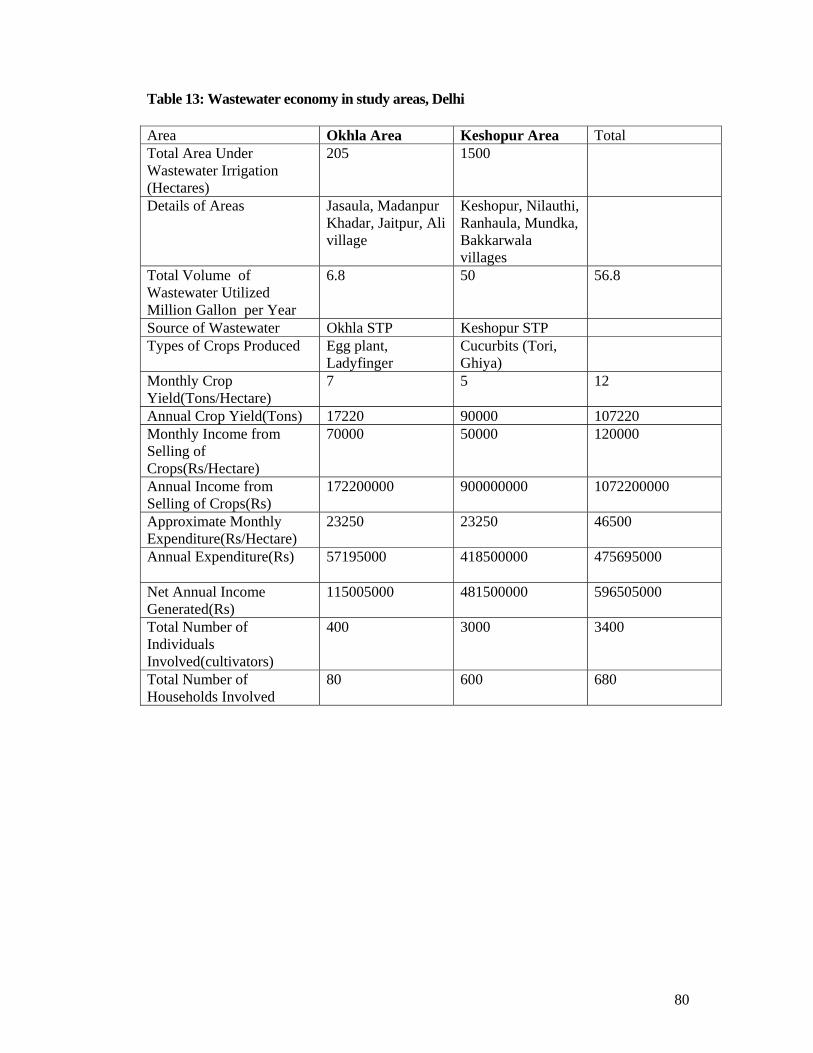
80
Table 13: Wastewater economy in study areas, Delhi Area Okhla Area Keshopur Area Total Total Area Under Wastewater Irrigation (Hectares)
205
1500
Details of Areas Jasaula, Madanpur Khadar, Jaitpur, Ali village
Keshopur, Nilauthi, Ranhaula, Mundka, Bakkarwala villages
Total Volume of Wastewater Utilized Million Gallon per Year
6.8 50 56.8
Source of Wastewater Okhla STP Keshopur STP Types of Crops Produced Egg plant,
Ladyfinger Cucurbits (Tori, Ghiya)
Monthly Crop Yield(Tons/Hectare)
7 5 12
Annual Crop Yield(Tons) 17220 90000 107220 Monthly Income from Selling of Crops(Rs/Hectare)
70000 50000
120000
Annual Income from Selling of Crops(Rs)
172200000
900000000
1072200000
Approximate Monthly Expenditure(Rs/Hectare)
23250
23250
46500
Annual Expenditure(Rs) 57195000
418500000
475695000
Net Annual Income Generated(Rs)
115005000
481500000 596505000
Total Number of Individuals Involved(cultivators)
400
3000
3400
Total Number of Households Involved
80
600
680
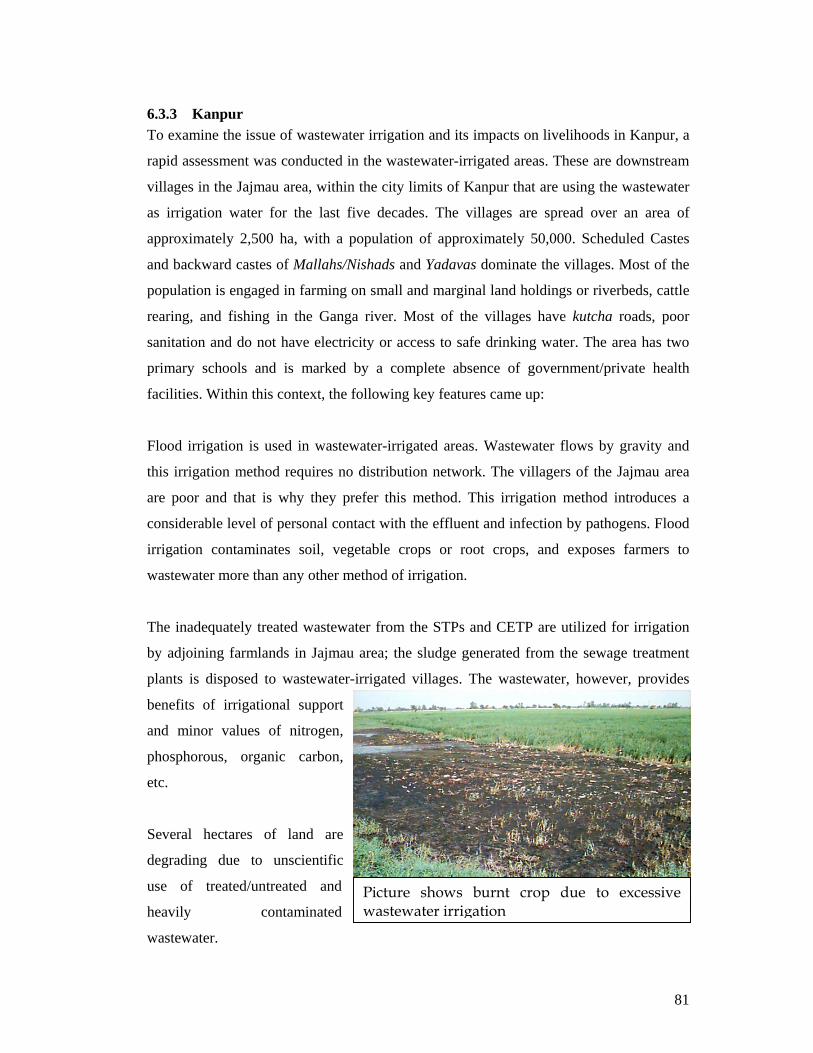
81
Picture shows burnt crop due to excessive wastewater irrigation
6.3.3 Kanpur To examine the issue of wastewater irrigation and its impacts on livelihoods in Kanpur, a
rapid assessment was conducted in the wastewater-irrigated areas. These are downstream
villages in the Jajmau area, within the city limits of Kanpur that are using the wastewater
as irrigation water for the last five decades. The villages are spread over an area of
approximately 2,500 ha, with a population of approximately 50,000. Scheduled Castes
and backward castes of Mallahs/Nishads and Yadavas dominate the villages. Most of the
population is engaged in farming on small and marginal land holdings or riverbeds, cattle
rearing, and fishing in the Ganga river. Most of the villages have kutcha roads, poor
sanitation and do not have electricity or access to safe drinking water. The area has two
primary schools and is marked by a complete absence of government/private health
facilities. Within this context, the following key features came up:
Flood irrigation is used in wastewater-irrigated areas. Wastewater flows by gravity and
this irrigation method requires no distribution network. The villagers of the Jajmau area
are poor and that is why they prefer this method. This irrigation method introduces a
considerable level of personal contact with the effluent and infection by pathogens. Flood
irrigation contaminates soil, vegetable crops or root crops, and exposes farmers to
wastewater more than any other method of irrigation.
The inadequately treated wastewater from the STPs and CETP are utilized for irrigation
by adjoining farmlands in Jajmau area; the sludge generated from the sewage treatment
plants is disposed to wastewater-irrigated villages. The wastewater, however, provides
benefits of irrigational support
and minor values of nitrogen,
phosphorous, organic carbon,
etc.
Several hectares of land are
degrading due to unscientific
use of treated/untreated and
heavily contaminated
wastewater.

82
Aquaculture practice in the East Calcutta Wetlands
The critical levels of the heavy metals in soils displaying negative impacts on agricultural
crops are high. However, the NBRI report 2000 and Eco Friends questionnaire based on
individual farmers’ survey show that crop yield has been impacted adversely. Almost all
the farmers reported that crop yield has declined by 40-50 percent over the past few years
due to wastewater irrigation. (see annexure 6)
A survey of household by Eco Friends in May-August 2004, could not confirm the actual
number of cattle loss, but most cattle owners reported spontaneous abortion in 10-40
percent of their cattle. Lower milk production by five to six liters a day per buffalo was
also reported68.
The survey had more detailed information regarding agricultural production. Since the
current irrigation practice began in the early 1990s, wheat production has decreased by
30-35 percent and rice by 40-45 percent. Many respondents said that they have stopped
planting rice altogether69.
Because of low yields of maize, pulses, barley and vegetables, all farmers who previously
planted these crops, have stopped. The Similarly rose production has been replaced by
marigolds or other less soil-particular flowers.
6.3.4 Kolkata
The East Calcutta
Wetlands, lying to
the east and south of
Kolkata, receives
most of the urban
sewage of the city.
A part of the
wetland is also used
as a landfill. A
68 As reported by cattle owners 69 As reported by respondents

83
sizeable peri-urban population is engaged in fishing, agriculture, vegetable farming and
garbage recycling activities. The total area under East Calcutta Wetlands is 13,113 ha.
Sewage-fed fisheries comprise 4,779 ha of the wetland; paddy is cultivated using
wastewater on 4,888ha; vegetables on 467 ha in Dhapa. There seems to be an ambiguity
regarding the ownership of the land (see Annexure 16 for details of ownership pattern).
Initially, most of the land belonged to the zamindars (landlords in the colonial era). Some
were vested under the Land Ceiling Act; some were abandoned by zamindars and
forcibly occupied by settlers from Bangladesh (erstwhile East Pakistan). Later, the State
Government issued a notification that the land would be taken over for development
purpose, thereby preventing further sale. Around these areas people mostly work as
agricultural labourers, very few own land. Many have pieces of land unviable for
agriculture, and as a result they are forced to work as agricultural labourers.
Broadly, three main livelihood options using wastewater were identified: earnings from
fisheries, paddy cultivation, and garbage farming.
In the East Calcutta Wetlands, the major source of income is aquaculture using urban
wastewater. There are a number of large and small bheris (ponds for breeding fish) and
ponds where fishing activities are carried out. Thus, in these areas, the majority of the
households earn their primary income from fisheries. About 53 percent is engaged in
fisheries, including catching fish to carrying them to the market, to working as night
guards and maintenance workers, auctioneers, fish sellers, boat makers, net makers, and
such others. The average monthly productivity of fish is 104.10 kg per acre.
Eggs of the fish are bought from freshwater fisheries in Burdwan, Bankura, Bandel and
other districts outside Kolkata. Payments for these eggs are made according to containers
called bati. Initially, it was thought that all fish in this region are sewage-fed. During the
survey it was learnt that small fishes are reared in freshwater before fishermen working in
the fisheries as daily wage labor release them into the sewage water. Hence, the
livelihood options generated do not remain confined to the local area but trickle outside
even to the suburbs and remote districts.
There is a positive correlation between wastewater use and fish productivity, indicating
that an increase in sewage leads to increased fish production (see table 14). On the other

84
hand, when wastewater is purified and used for aquaculture, there is a decline in fish
production.
Paddy cultivators have decreased in number over the last 10 years. Most of them have
sold off their land for reclamation for developing the city. Paddy cultivation is done twice
a year. Both Aman (monsoon paddy) and Boro (winter paddy) crops are grown (Sanyal
2004). Rest of the year is utilized for cultivating vegetables. Most of the farmers use the
wastewater for irrigation and also depend on the rain. Usually they use 100 percent
untreated wastewater for irrigation purposes. Table 15 shows the value addition per
hectare per year using wastewater
Urban wastewater use in wetland for agriculture and aquaculture provides significant
income for sustaining livelihoods of the poor residing in the wetlands. It contributes 60-
100 percent of their total household incomes. The livelihood pattern crosses over and
employs people from remoter places. Hence, in reality, aquaculture and agriculture
practised through wastewater has resulted in the creation of a livelihoods network, and
well-connected to the market, it is economically viable. Interestingly, Kolkata remains the
only case study where aquaculture is the dominant mode of livelihood and diversification
of occupation takes place within the gamut of one major activity. Wastewater economy
has ensured livelihoods for a vast majority of people in the area and since negative
impacts are really minimal, Kolkata stands out as a successful example of wastewater
reuse and management. (See Box 1, ECW- Mapping People’s Perceptions)
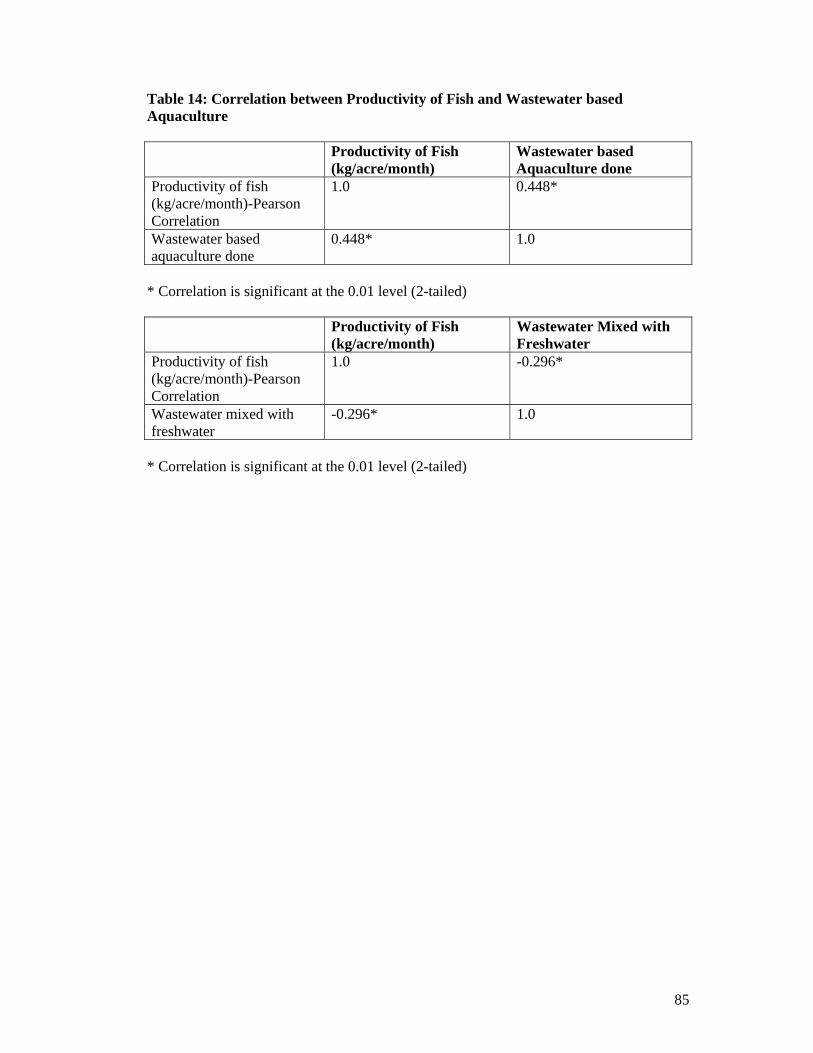
85
Table 14: Correlation between Productivity of Fish and Wastewater based Aquaculture Productivity of Fish
(kg/acre/month) Wastewater based Aquaculture done
Productivity of fish (kg/acre/month)-Pearson Correlation
1.0 0.448*
Wastewater based aquaculture done
0.448* 1.0
* Correlation is significant at the 0.01 level (2-tailed)
Productivity of Fish
(kg/acre/month) Wastewater Mixed with Freshwater
Productivity of fish (kg/acre/month)-Pearson Correlation
1.0 -0.296*
Wastewater mixed with freshwater
-0.296* 1.0
* Correlation is significant at the 0.01 level (2-tailed)

86
Table 15: Value Addition per Hectare per Year using Wastewater
Produce Value addition/hectare/month
(Rs)
Value Addition/Hectare/Year
(Rs) Fish 2754.486 33,053.832 Paddy 24791.443 1,48,748.658 Vegetables 7046.97 84,563.64
Note: Annual value of the wetland, roughly, stands around Rs 924.53 million per year for 10,1342.2 ha of land, where 4779.21 hectares is used for aquaculture, 4887.89 hectares for paddy cultivation and another 467.1 hectares for vegetable cultivation.

87
BOX 1: EAST CALCUTTA WETLANDS - MAPPING PEOPLE’S PERCEPTIONS
The East Calcutta Wetlands (ECW) being a hotspot for sewage water use in fish
cultivation is one of the most unique examples of social engineering tools in action. The
profitability of aquaculture operations in the ECW is evident from what a respondent of
the Nalban Fisheries had to say:
“The fishery employs 120 fishermen as permanent employees and labours are also hired
on contract basis when additional work is done in the fisheries or when they are cleaned.
Apart from the fishermen, maintenance workers like night guards and weed cleaners are
also employed on a permanent basis. There are separate fish carriers who take the catch
to the auction market and they are private individuals who are not employees of the
fishery. They earn Rs 30–40 daily for three to four hours of work. Office work involves a
few people who are permanent employees under the state government, as the Nalban
fisheries belong to the state fisheries department. Wage payment alone involves Rs 4,
00,000 in Nalban fisheries.”
Private players also eke out their livelihood from wastewater based aquaculture. An
auctioneer in the Chingrighata Auction Market says that fish is sold at the auction market
at prices ranging between Rs 20-30 per kg, depending on the availability.
However, a traditional occupation, such as paddy cultivation no longer being as profitable
as aquaculture, is losing space, in more ways than one. A paddy field owner in Krolberia
says that most of the other owners sold off the paddy fields nearer to the city when urban
expansion was taking place. This has caused a reduction in the number of paddy fields.
Many paddy field owners also engage in fishing activities in their own bheris (ponds for
breeding fish) or in bheris owned by other individuals. Paddy is cultivated twice a year
generally. During the rest of the year vegetables like corn, cauliflower, cabbage, and
spinach are grown. Earnings from the paddy cultivation are no longer sufficient.
Further down the line, an agricultural labourer gets Rs 30 per day and two kilos of rice
for his labour. His only other livelihood source is the bheri that is if jobs are available.
He is indebted to his employer and every month a portion of his pay goes into repayment
which, at times, he needs to supplement by working at the employer’s house. He is

88
unable to educate his children and had to pull his only daughter out of school, so that she
could work at home since both parents were out looking for work.

89
7.0 Chain of Economic beneficiaries
The case studies provide interesting insights into the chain of economic beneficiaries in
the agriculture and fish produce marketing chains. With the exception of wastewater users
in Delhi, it brings to the fore the hardship faced by wastewater users in selling their
produce and traces the middlemen perceived to corner a large share of the profits from the
sale of produce. It was difficult to estimate the magnitude of profits earned by middlemen
as the chain became too diffused to trace ahead. The data collected was through FGDs
with community groups from wastewater irrigated areas. The chain of economic
beneficiaries is described for select case studies from Kanpur, Delhi and Kolkatta:
Kanpur
There are 2770 farmers involved in wastewater agriculture with a total landholding of
2500 ha of which 333 (112 lessees + 211 encroachers) practice agriculture on 414.6 ha of
land owned by Kanpur Nagar Nigam (KNN). KNN owns 511.58 ha of land in wastewater
irrigated areas. Hence, the average landholding for lessees and land owning farmers are
1.25 ha and 0.81 ha, respectively.
The Lessees are tenants practicing wastewater agriculture on KNN land for decades. Most
of them live in the town and are engaged in government or private service or business.
According to the lessees, the Jajmau land was barren land acquired by the municipality
for development into a sewage farm. People were invited and allotted land for agriculture.
Originally, 250 ha of land were delineated and the land was divided into 2 ha plots. Each
plot was connected to a road so that the farm produce could be conveniently transported.
The sewage supply was assured throughout the year at the rate of 5,000 gallons per acre
per day (1.7 m irrigation depth over a year). The land was prepared for agriculture and
then handed over to the lessees.
The plots were leased out for the first time in 1951 for a period of 7 years. Lessees were
required to pay @ Rs. 120/- per acre (USD 6.70 per ha) per annum which has now been
increased to Rs. 625/- per acre (USD 35 per ha). This included the rental and irrigation
charges. Transfer of the lease or subletting was not allowed. The Development Board
(now KNN) leased the land on the condition that the lessee would not overuse the

90
sewage, making it sewage sick. If observed, the Board could exercise the right of
terminating the lease. The Board also put restrictions on the cultivation of vegetables that
were consumed raw.
An agricultural expert was also appointed by the Board as the Farm Manager to provide
technical assistance and suggest crops and cropping patterns to the lessees. An
experimental model farm was also started under the Farm Manager.
There is however a conflict between KNN and KDA (Kanpur Development Authority) on
the ownership of the sewage farm, with KNN wanting to sell the land presently being
used for wastewater farming. However, a change in the land ownership will reduce the
land area for wastewater disposal considerably. KNN is also presently considering an
increase in the land rental and irrigation charges from the present Rs. 625/- to 970/- per
acre per annum.
The lessees have been growing two crops every year namely, paddy and wheat (fodder).
From a production figure of 45-50 quintals/ha of paddy and wheat they now obtain only
30-35 quintals/ha. This decrease in productivity was noticed since the early nineties when
the Ganga water was replaced by the tannery effluent under the new dispensation of the
Ganga Action Plan. Very few farmers now grow wheat (fodder) due to the reduction in its
productivity by half and also because the crop produce gets damaged due to excessive
irrigation.
The selected villages are close to the sewage channel and have assured irrigation 365 days
a year. Also the land in these villages is suitable for the cultivation of vegetables and
flowers. Majority of the farmers own livestock and they sell the milk. For example, in
Motipur, a village dominated by the Yadavas whose traditional occupation is livestock,
almost all the families own buffaloes and derive a significant part of their household
income by selling milk.
The marginal farmers, owning less than three bighas70, are hardly left with any surplus
grain to sell in the market. Most of surplus production, if any, is sold in the village itself.
70 1 bigha = 2327 Sq.m.

91
There are traders in the villages who purchase the produce. Some farmers take their
produce to Lal Bangla market located at a distance of 5 km from the nearest village and
10 km from the remotest village to sell the paddy and wheat to whole sellers. The whole
sellers, in turn, sell the paddy to rice mills and the wheat to retailers. Very few farmers
have storage facilities and are therefore forced to sell their produce when the rates are the
lowest during the season. Those who store their produce, earn more by selling their
produce during the off-season. Farmers prefer to sell their paddy and wheat to local
traders in the village instead of transporting the same to the market. The crop residue of
paddy and wheat is mainly used as fodder and very little is sold. Farmers who have
surplus fodder sell it to traders and those with fodder-cutting machines in the market.
They either sell the standing crop to the trader or take it to market. The fodder cutting
traders further sell it to dairies in Kanpur.
Farmers in Pyondi, Sheikhpur, and Jaana grow vegetables on small pieces of land (less
than 0.2 hectare). They grow a variety of vegetables like pumpkin, cucurbits, bottle
gourd, cabbage, cauliflower, ladyfinger etc. and carry their produce to the market on
bicycles. Vegetables are a good supplement to their income and are sold to whole sellers
in the market early in the morning. The whole sellers sell the vegetables to vendors who
sell the same to consumers. The market places in Lal Bangla, Defence Colony, and Rama
Devi are at the distance of 5-10 km from these villages.
Farmers in the above mentioned villages also grow flowers on small pieces of land (less
than 0.2 hectare). Earlier the area was known for its roses but now very few farmers grow
them. The farmers sell the flowers at Shiwala, Bara Chauraha (informal market places) or
temples and take their produce to the markets on their bicycles. The market places are at a
distance of 15-20 km. They get a good return during festivals when the demand for
flowers is high. However when there is no demand, they even have to throw their
produce. The flowers are further sold to malis in the wholesale market. The Malis either
sell it at temples or supply it to fixed customers at their houses.
In Madarpur, Kishanpur and Jaana, there are some fishermen/ boatmen (mallah or nishad)
who are involved in fishing. They fish in the river Ganga and catch a variety of fish like
the padna, pyora, khabdi, china, sour, chamerguch, chilva, balm, padahin, rohu etc. They
sell their catch to vendors in markets like Sheetla bazaar, Purani chungi, Nai chungi,

92
Rama devi, old subji mandi and Lal bangla which are at distances of 5-10 km. The
vendors further sell it to consumers.
Kolkata
It was initially felt that all fish in this region are sewage-fed. However during the survey
it was learnt that small fish are first reared in freshwater before the fishermen working in
the fisheries as daily wage labour, release them into the sewage water. Fish are caught by
them continuously for four hours and are simultaneously weighed. These fishermen are
able to earn upto Rs 2,500 per month from the fisheries. In fisheries owned by private
individuals, their employment is not permanent. Fish sellers gather there and the fish is
auctioned. The manager of the fishery is usually the auctioneer. The fish is given to the
highest bidder which he sells in the market. Most of the sellers receive some amount of
fish. These fish sellers often sell it in the auction market or in the retail market. Working
within each fishery, apart from the fishermen, are night guards, maintenance workers, net
maker, boat makers, accountants and others. They earn upto Rs 2500 per month.
Problems faced by the fisheries are the availability of adequate amounts of sewage water
and labour problems. Another serious problem is theft. Fish are stolen from the fisheries
during the night by slum dwellers and anti-social elements living around the fishery.
Sometimes the workers themselves indulge in theft.
However, one striking characteristic of these fishermen is that desipite remaining in
sewage-water for four continuous hours, they rarely fall ill. They do not develop any skin
infection or water-borne disease. They apply a homemade ointment, usually made out of
locally available herbs, all over themselves while in the water and seem to have
developed natural immunity. This may be also be because of solar rays, which destroys
the harmful microbial activities up to 4-5 ft below water. Though physical filth is
observed, microbes that cause infections and other water-borne disease are not common
to these people. Their food comprises mainly of rice, fish and vegetables. They do not
take much of pulses. Communication to the city from these areas is difficult.
Paddy cultivators have decreased in number over the last 10 years. Most of them have
sold their land for reclamation of the city. There however seems to be an ambiguity
regarding the ownership of the land. Initially, most of the land belonged to the Zamindars
of Sealdah and Shyambazar. Some were vested under the Land Ceiling Act while some

93
were abandoned by zamindars and forcibly occupied by settlers from Bangladesh
(erstwhile East Pakistan). Later the State Government issued a notification that the land
would be taken over for the purpose of development, thereby preventing further sale.
However, large paddy fields still exist in Panchannagram, Krolberia, Bamonhata,
Durgapur and Saintola. Around these areas people mostly work as agricultural labourers.
Very few of them have their own land. Many have unviable pieces of land and as a result
they are also forced to work as agricultural labourers. They live in mud huts with tiled
roofs. Farmers were quite hospitable and were not as hostile as the bheri workers. Paddy
cultivation takes place twice a year. Both Aman and Boro crops are grown. The rest of the
year is utilized for vegetable cultivation. Most of the farmers use the wastewater for
irrigational purposes and also depend on rain. They usually use 100% wastewater for
irrigational purposes. There are a few government irrigational schemes that are not
available to all farmers. Freshwater is also mixed with wastewater for irrigational
purposes in areas where the wastewater is too poisonous.
Family members usually carry out the vegetable cultivation themselves in and around
Dhapa. They usually do not hire labourers, as the areas of the fields they own are too
small. They grow mainly corn, cauliflower, cabbage, brinjals and other green vegetables.
Women carry the produce to the markets in large baskets.
Most of the fish caught in the wetland area is sold at the fish auction market at
Chingrihata close to the Eastern Metropolitan Bypass. The fish sellers go to this market
with the catch bought from the bheris and sell their catch there. Local fish sellers bid for
the fish here. The fish is sold to the highest bidder after which it reaches the consumer at
the local market. The whole procedure is completed by 8’o clock in the morning. There
is a considerable amount of product tie-in with wholesalers advancing money to bheri
owners against a promise of fish delivery, especially during the dry season, when the fish
catch is low.
Delhi
The farmer group in Delhi is mainly divided into contractors (who take the land on rent)
and labourers (who work on daily wages). It was observed that most of the labourers are a
part of the floating population who come from nearby states to work. They are hence not
counted under the census surveys.

94
The scenario for landless labourers is more critical. These groups are employed full time
in agricultural activity. Often these groups are the poorest of the poor who are not skilled
in other work sectors. Their agricultural income alone runs their family expenditures. It
was also observed that often their jobs and daily wages which range from Rs 50-70 are
also susceptible to their work, i.e. the total amount they are able to generate out of the
land on which they work. Since wastewater provides increased yield per unit of land, a
certain degree of security in terms of income is offered to these masses. Also since the
agriculture produce fulfils the food requirement of the people working on the land, they
are able to save most of their earnings or divert it for other purposes like the education of
their children.

95
8.0 Legislative and Policy Framework
Wastewater use in agriculture is age old, but efforts to develop mechanisms to control its
negative impacts are relatively recent. One major initiative was the World Health
Organization’s (WHO’s) international guidelines on wastewater reuse in agriculture and
aquaculture and recommendations for wastewater treatment and crop restrictions.
(See Annexure 17 for WHO recommended microbiological quality guidelines for
wastewater use in agriculture)
Similarly, growing public awareness and concern for controlling water pollution in the
USA led to the enactment of the Federal Water Pollution Control Act Amendments of
1972. As amended in 1977, this law became commonly known as the Clean Water Act.
The Act established the basic structure for regulating discharges of pollutants into the
waters of the United States. It gave EPA the authority to implement pollution control
programs such as setting wastewater standards for industry. The Clean Water Act also
continued requirements to set water quality standards for all contaminants in surface
waters. The Act made it unlawful for any person to discharge any pollutant from a point
source into navigable waters, unless a permit was obtained under its provisions. It also
funded the construction of sewage treatment plants under the construction grants
program.71 (See Annexure 18 for EPA Guidelines for Wastewater Quality for Reuse
Options)
However, these broad international policy frameworks are considered by many
governments as a legal framework, though they are not intended for absolute and direct
application in every country. While focusing on treatment and crop restrictions, the WHO
guidelines pay inadequate attention to the problems of high cost involved in construction
and operation of treatment plants. Authorities are therefore faced with two difficult
options: either treat rapidly growing volumes of wastewater and bring them within safe
limits for agricultural use, or try to stop wastewater use among the users, which would
deprive many households of their livelihood. The result is often that wastewater use and
users are ignored and the practice of untreated wastewater use is denied.
71 http://www.epa.gov/region5/water/cwa.htm

96
The management of India’s water resources falls under the jurisdiction of a number of
government agencies (See Annexure 19 for details), although the primary responsibility
for the development of water belongs to the individual states. The Central Government
oversees the implementation of the national policy on resource development and
exploitation as well as manages inter-state and international rivers and river valleys. It
also provides technical advice to individual states on development, flood control,
navigation, coastal erosion, dam safety, navigation and hydropower if required. The
Ministry of Water Resources (MoWR) is the principal agency responsible for water in
India and, as such, oversees the planning and development of the resource from policy
formulation to infrastructure support.
The National Water Policy (NWP) is the primary document stating the position of the
Government of India (GOI) on water resource issues ranging from drought and flood
management to drinking water provision. The NWP, 2002 calls for intensifying research
through recycling and re-use of water. It calls for better water management practices and
improvements in operational technologies. The policy also calls for adopting participatory
approach to water resources management. Specifically it calls for involving not only the
various governmental agencies but also the users and other stakeholders, in an effective
and decisive manner, in various aspects of planning, design, development and
management of the water resources schemes.
While the state governments, and more specifically the local bodies in urban areas carry
the prime responsibility for providing drinking water and sanitation facilities, the Centre
allocates funds and ensures that funds are provided in State budgets and Five-year Plans.
The 10th Five-year Plan of the GOI emphasizes conservation and reuse of urban
wastewater. The document specifically mentions that “practice of focusing on water
supply to the exclusion of sanitation and wastewater treatment, should be given up in the
Tenth Plan. The document aims to broad base the Centrally- Sponsored Accelerated
urban water Supply Programme (AUWSP) and recommends for enlarging the scope of
the scheme to include sanitation, especially basic sanitation such as wastewater. This plan
establishes the need for further research and development on technologies for the
treatment of sewage and the health effects of sewage water used in agriculture and
horticulture.

97
Draft National Environment Policy, 2004 recognizes strong environment-poverty linkage
and lays emphasis on community participation, access to safe water and sanitation
services and improving health of communities. Specifically it calls for enhancing reuse of
treated sewage and industrial wastewater before final discharge to water bodies. The
Policy document calls for a mechanism for cooperation in Research and Development for
clean technologies as well as promoting the dissemination of the new technologies.
Despite the growing attention to water supply and sanitation sectors in Five- year Plans
(See Annexure 20 for details), the resource crunch related to providing infrastructure
services continues to top the discussions at most platforms. Urban infrastructure in India
is financed broadly through three sources:
a) Budgetary allocations of Central, State and local governments
b) Grants and loans from multilateral and bilateral agencies
c) Institutional lending
Monitoring and implementation of guidelines and rules usually lies on both Central and
state bodies. However, field analyses throw up multiple issues regarding proper
implementation of such guidelines. Lack of clarity regarding areas of operation often
leads to overlapping of different departments. Most importantly, management issues are
not being scrutinized carefully; a backlog of work pertaining to maintenance and
management of wastewater treatment and infrastructure remains. Since wastewater use in
agriculture shows benefits in the form of livelihoods and income generated, there is a
need to define a legislative framework for large-scale implementation of the same. A
coherent national policy for wastewater use in agriculture and various other sectors is
essential. With respect to the same, sufficient attention must be given to the
bottlenecks/key issues in institutional handling of wastewater.

98
The following points sum up the various issues related to policy and their impacts:
• Ambiguity in information regarding water quality
For example, in Delhi, the CPCB selection criteria for monitoring locations of the
Yamuna are unclear. CPCB monitors the water of River Yamuna at five locations
– Palla, Agra Canal (Madanpur Khadar), Agra Canal (Okhla), meeting point of
Shahadra drain, and Nizamuddin. The selected sites are: (a) intake points from the
river (intake for agriculture, drinking water, etc); (b) interstate borders; and (c)
joining point of tributaries.
• Wastewater generation and treatment values given in different publications
of the CPCB do not match
The CPCB publication for November-December 2003 (Performance Evaluation of
Sewage Treatment Plants in Delhi), when compared to another CPCB publication
of June 2002 (Status of Water Quality in River Yamuna-NCT of Delhi), show
contradicting results. (See Table 16)

99
Table 16: Wastewater Data Disparity
Parameter June 2002 Report November-December 2003 Report
Estimated sewage generated 3,600 MLD 3,167 MLD
Total treatment capacity (Combined for all STPs)
2,009 MLD 2,330 MLD
Actual treatment 1,723 MLD 1,478 MLD
Observations: A decrease in sewage generated when the city population is growing. Increase in treatment capacity yet a decrease in the actual treatment given.

100
• Unavailability of data
The data for monitoring the effects of metal content for River Yamuna is not
available. The document “Yamuna Water Quality Status for Year 2000” has data
only up to the year 1999. Data was refused on the argument that it was not
available for public. Similarly, data for monitoring metals in drains and treated
effluent, especially in the context of health impacts of the same, is not available.
Also, data for monitoring Faecal Coliform in treated effluent from STPs is
unavailable.
• Development of action-oriented plans
In Kanpur, the Ganga Action Plan was launched in 1985 to reduce the load of
pollution on River Ganga. Before GAP, about 240 MLD of sewage and 5-6 MLD
of tannery wastewater was generated in Kanpur. Wastewater from the city as well
as effluent from the tannery was flowing into the Ganga without being treated.
Therefore, interception, diversion and treatment of wastewater were accorded top
priority under GAP. Through this plan, a large number of treatment plants were
set up to deal with the sewage and effluents entering the Ganga. (See Box 2 for
details on the Ganga Action Plan)
Similarly, to deal with sewage specifically, the sewage farm scheme was launched
by the Central Government in 1951 to check pollution of the Ganga waters and
increase agricultural production in the area. The scheme was named as Sewage
Utilization Scheme under which infertile lands were acquired along river Ganga in
the east of Jajmau area. The acquired lands were allotted for agriculture at rate of
Rs. 120 per acre per annum (US$ 6.7 / ha/ year). This cost was inclusive of land as
well as sewage irrigation costs. At present, 522.25 ha of land is owned by Kanpur
Municipal Corporation out of which 424.31 ha is being used for agriculture by
lessees. Exact information is not available about the total wastewater irrigated
land area owned by farmers. In 1962, approximately 1700 ha of land used to be
irrigated with wastewater, and 1250 ha was irrigated in 1992 while the irrigation
capacity then was 4583 ha of land, told the Secretary, Sewage Farm Holders
Association.

101
• Contradictory information provided by the authorities
The exact area under wastewater irrigation is not known in the sewage-irrigated
areas which also include highly polluting leather factories. Different government
departments provide different data regarding the land area irrigated with
wastewater in their respective reports.
• Lack of clarity on monitoring procedures
CPCB should publish both monitoring results and the monitoring procedures
followed to arrive at the results together.

102
Box 2 - Ganga Action Plan
Department of Environment, in December 1984, prepared an action plan for
immediate reduction of pollution load on the river Ganga. The GAP (Ganga Action
Plan) was approved in 1985 as a 100 per cent centrally sponsored scheme. The GAP-I
envisaged to intercept, divert and treat 882 mld (Million litres per day) out of 1340
mld of wastewater, generated in 25 class-I towns (including Kanpur) . GAP-I was
scheduled for completion by March 1990, but was extended progressively up to
March 2000. While the GAP-I was still in progress, it was decided in February 1991
to take up the GAP-II, covering the pollution abatement works (a) On the tributaries
of river Ganga, viz. Yamuna, Damodar and Gomati.(b) In 25 class-I towns left out in
Phase-I and (c) In the other polluting towns along the river. The GAP, launched in
1985, with the objective of bringing water quality of river Ganga and its tributaries to
bathing levels, was not able to achieve its objectives, despite a total expenditure of Rs
901.71 crore over a period of 15 years.
Under GAP-I completed following schemes were completed in Kanpur:
• Cleaning of trunk and main sewers
• Interception of 16 drains
• Construction of 160 mld main sewage pumping station at Jajmau
• Construction of 130 mld domestic wastewater treatment plant (activated
sludge process)
• Construction of 5 mld UASB pilot treatment plant under Indo-Dutch
assistance
• Construction of 36 mld UASB treatment plant for combined tannery and
domestic wastewater under Indo-Dutch assistance
• Construction of a separate open drain collection system and taping of 4
nalas in the tannery district under Indo-Dutch assistance

103
8.1 Bottlenecks and Required Policy Changes
Listed below are the bottlenecks and the required policy changes in the Indian scenario:
8.1.1 Lack of central planning
• The division of responsibilities among the ministries involved and authorities is
not well established
• Absence of a law governing decentralized wastewater treatment and reuse of
treated effluent
• Lack of well-defined standards for wastewater reuse in various sectors. Also, the
irrigation standards defined under the Environment (Protection) Rules, 1986, are
not comprehensive enough. For e.g. Rule 3 Schedule I – IV stipulates emission
standards for various industrial pollutants but remains silent on the parameters that
would help allow monitoring of wastewater quality. Serious efforts from the
government are required.
• Existing command and control policies in almost all sectors must be substituted by
other market-based instruments such as tax charges, etc. A blend of both could be
a more feasible option
8.1.2 Lack of public awareness
• Awareness among the farmers regarding best and safe practices of using
wastewater in agriculture is lacking. This forms the prime reason for the farmer
population being the target for various health risks
• Awareness regarding safety measures such as wearing boots and gloves while on
the field, washing of hands after field work, washing of vegetable produce from
the field before selling or self consumption, types of crops to be grown (crops to
be eaten after cooking, crops based on type of wastewater), best irrigation
practices must be given to farmers in these areas
• The consumers of these vegetables are generally not aware of their source and,
hence, often do not take precautionary measures such as washing of vegetables.
Since the vegetables produced in these areas get distributed in various markets of
Delhi and, hence for an untraceable part of the food chain, the public in general
must be made aware of the same.

104
9.0 Significance and extent of wastewater use in India
A National assessment was carried out to assess the current national level situation on the
extent and quality of wastewater used for agriculture in India. The results from this
national assessment are based on secondary data on quantities of urban wastewater
generated, nature of treatment, extent and significance of use in select urban centres in
India, and primary data generated through surveys conducted as part of four case
studies—Kanpur, Kolkata, Ahmedabad and Delhi.
9.1 Wastewater generation, and treatment status in Indian cities
Overview: The report entitled "Status of Water Supply & Wastewater Generation,
Collection, Treatment and Disposal in Class I cities, published by the Central Pollution
Control Board (Feb 2000) states that surface water is the major source for organised water
supply in Indian cities. The data covers 88% of the total municipal population of class I
cities under organised water supply. Out of 299 class I cities, 77 cities are with 100%
water supply coverage. In 158 cities there is 75% coverage and above, and in 43 cities
50% coverage and above. In 10 cities the water supply is below 50%. The national
average per capita water supply for class I cities is 183 lpcd. This figure has increased
from 147 lpcd in 1988 to 183 in 1995.
Studies indicate that the total wastewater generated in 299 class I cities was around
16,662 million liters a day (MLD). However for the total sample surveyed, 44% of the
cities could not furnish the wastewater generation data and hence for such cities,
wastewater generated has been estimated at 80% of the volume of water supply, which is
based on “The manual on sewerage and sewage treatment of CPHEEO". The details of
Wastewater, generated, collected and percentage sewerage coverage in class I cities is
given in Annexure 21.
The statistics related to the treatment facility available shows that wastewater treatment
capacity is around 4,037 MLD that is about 24.2 % of total wastewater generated. Out of
the total wastewater generated about 59% is generated by 23 metropolitan cities.
Maharashtra alone contributes about 23%, while the Ganga river basin contributes about

105
31% of the total wastewater generated in class I cities. Out of 299 class I cities, 160 have
a sewerage system for more than 75 % of the population, while 92 cities have more than
50% of population coverage. On the whole 70% of the total population of class I cities is
provided with sewerage facilities. Among the metropolitan cities, Delhi remain the
highest generator of wastewater (3167 MLD), followed by Mumbai at 2456 MLD and
Kolkata at 1432 MLD. In terms of percentage, sewerage coverage is lowest for Nashik
around 25%, followed by Delhi at 45%. The highest coverage is for Mumbai at 90%.
Treatment & Disposal: Out of 16662 MLD of wastewater generated, only 24% is treated
before being released, the remaining 66% is disposed off untreated. 27 cities have only
primary treatment facilities, and 49 have primary and secondary treatment facilities.
Treated or untreated wastewater is disposed off into natural drains joining rivers, lakes or
seas or used on land for irrigation/fodder cultivation or a combination of these by the
municipalities. Some municipal corporations have sewage farms organized by
private/farmers and controlled by private/municipality/irrigation departments. The details
of Sewage farming in class I cities are given in Annexure 22.
The central Pollution control Board has been producing these statistics periodically every
decade to review the situation with regards to urban wastewater. The wastewater
generated in class I cities has increased from 7,006 MLD in 78-79 to 12,145 MLD in 89-
90 to 16,662 MLD in 1994-95. While there was a drop in the statistics of wastewater
collected from 78 to 89, there has been a sharp increase in wastewater collected in 94-95
ie: 72% of the total wastewater generated. The situation varies from city to city
drastically. Analysis of the Indian scenario reveals that some of cities, inspite of having
the required treatment facilities are not able to utilize the sewage treatment plants fully.
The total wastewater generated in Delhi is estimated to be 3167 MLD. The installed
treatment capacity in Delhi is 2330 MLD, out of which only 1478 MLD reaches the
sewage treatment plants and gets actually treated. The main reason for the low utilization
of the sewage treatment facility is the lack of a proper conveyance system for municipal
sewage. About 55% of Delhi's population does not have a proper sewerage system and
hence the waste generated from these areas goes untreated into the river or natural
streams.
106
Kanpur, the largest and most important industrial city of Uttar Pradesh, on the banks of
the river Ganga has 75% sewage coverage. Although the water supply to the city has been
increased as per the demand, little attention has been paid to the augmentation of the
sewerage system or technical remodelling to cope with the increased flow of wastewater,
thereby making the system function beyond its optimum capacity. The total wastewater
generated in Kanpur is 390 MLD, out of which only 160 MLD of sewage and 9 MLD of
tannery wastewater is collected and treated under the Ganga Action Plan. The rest is
disposed off in the rivers, Ganga and Pandu.
Ahmedabad (as per 1994-95 statistics) generated a total of 556.0 mld (domestic and
industrial) of wastewater, out of which only 445 mld (80%) was collected and subjected
to primary and secondary treatment. Statistics of 1997 showed that the city generated 740
MLD of sewage as against a treatment capacity available with the municipality of only
630 MLD. The remaining wastewater along with the treated wastewater found its way
directly into the Sabarmati river. Sewage waste in the city flows through a vast network
of sewers and pumping stations to be transported for treatment to the treatment plant at
Vasna which is located in south eastern part of the city. The sewage from the entire
Ahmedabad Municipal Corporation area is transported with the help of 12 pumping
stations to this site for treatment. As Ahmedabad has a flat terrain, the sewage network is
supported by 20 drainage pumping stations that help transport the sewage from all parts
of the city. However, over the years, due to the considerable increase in population, the
energy expenditure incurred to pump the high quantities of waste has also considerably
increased.
The Water supply and sewerage division of the Mumbai Municipal Corporation manages
the sewerage for Mumbai. The city generates 2671 MLD of sewage and 6256 MTD of
solid waste. Water pollution in Mumbai also goes unchecked as the treatment capacities
are limited and untreated water is discharged in rivers and creeks than eventually merged
with the sea, making it polluted and unfit for bathing, water sports and commercial
fishing.
In Hyderabad, the Musi River, which carries most of the city's sewage, is in bad shape.
The river runs about 20 kms within the city limits and passes downstream through a
length of about 150 kms before joining the River Krishna. In Hyderabad, only 62% of the
107
city is covered by the sewerage network. Due to the limited sewerage treatment facilities,
the rest of the waste is discharged untreated into the river.
On account of the increase in the industrial need for water, wastewater from Industries is
also going up continuously. Discharge of effluents from industries to water bodies
pollutes enormously larger quantity of unpolluted water. As per the Central Statistical
Organization (CSO), there are about 32 lakh industries in India as of 1998-99 of which
1,35,551 are registered manufacturing industries. The total wastewater generated from all
major industrial sources in the country is 82,446 MLD, which includes thermal power
plants (24%), pulp and paper (14%), engineering (32%), textile (13%), steel (8%) and
others (9%).
External reports estimate that presently only 10% of the wastewater generated in the
country is treated; subsequently, severe water pollution coupled with the depletion of
ground water reserves remains a serious problem and immediate challenge in India. The
problem gets all the more severe when industrial effluent, being more contaminated and
polluted, gets mixed with domestic waste through its discharge in to the same sewer
network and nalas that serve the city. The market for adoption of advanced technologies
for wastewater use arising from industries and municipal corporations' accounts for the
largest percentage of the total environmental market in India. As per a survey by the US
Trade Department, the total market potential for water and wastewater treatment,
including the requirements of Municipal and Industrial sectors, is estimated at US $ 900
million and is expected to grow at approximately 14% each year in the mid-term.
Industrial wastewater treatment is arguably; the largest segment, accounting for nearly
half of the total market sizes. The water and wastewater treatment sector also accounts for
the highest environmental spending within both the public and private sectors.72 With the
functioning and operating of Wastewater treatment plants being a costly affair, local
bodies need to look at alternate ways of disposing off or recycling wastewater generated
by the growing population.
72 Market Report: Opportunities for Environmental Technology in India. Focus on Water, Air and Hazardous Waste
108
9.2 Nationwide estimation of wastewater use in Agriculture and Aquaculture
Scattered evidence is available that shows the predominant use of urban wastewater for
agriculture and aquaculture practices in the Indian context. All four cities covered by the
primary survey, show the use of wastewater for agriculture/ aquaculture. Apart from this,
the secondary literature review also shows extensive wastewater reuse for irrigation in
Hyderabad, Indore, Nagpur, Chennai, Kanpur, Mumbai and Vadodara. In the following
paras we present a typology for assessing the extent of wastewater use in India.
9.2.1 Typology for National Assessment of wastewater use in agriculture in India For assessing wastewater use a modified typology presented by Wim van der Hoek73 is
applied. The author classified wastewater use into three types: direct use of untreated
wastewater, direct use of treated wastewater and indirect use of wastewater. The
modification pertains to combining the two types of direct uses into a single type referred
to as direct use. This is essentially due to the fact that treated wastewater in some of our
case study areas is noted to contain contaminants that produce adverse health impacts to
users. Typology of indirect use is used as defined by van der Hoek to carry out national
assessments. Owing to limitations in data availability the assessment is restricted to Class
I cities. Based on this typology and data obtained for select cities from secondary and
primary sources, a ratio is worked out for the area irrigated by wastewater to unit volume
of wastewater for each of the two types—direct use and indirect use. Table 18 shows that
the ratios for direct use and indirect use in India are 6 and 39, respectively. The ratio for
indirect use is high, perhaps, due to the fact that wastewater gets mixed with natural
stream/river flows before it is drawn through pumping or irrigation projects through a
network of canal distribution. For assessing the extent of wastewater use at the national
level, these ratios are multiplied by the volume of wastewater supplied to sewage farms
(Table 19), obtained from secondary data, for direct use and by the volume of wastewater
generated also obtained from secondary sources (Table 20). The computations are shown
in Table 17. It shows that the estimate of total area irrigated using wastewater directly and
indirectly in India is 6.5 lakh ha.
73 Hoek, Wim van der : “A Framework for a Global Assessment of the Extent of Wastewater Irrigation: The Need for a Common Wastewater Typology”, Chapter 2, Wastewater Use in Irrigated Agriculture, Scoot C.A, et al (ed) 2004, IWMI, IDRC, CRDI, CABI, U.K.

109
Table 17: Estimate of wastewater use in agriculture in India Type of use Ratio (area/ volume of
wastewater)
(ha/MLD)
Volume of wastewater
(MLD)
Estimate of area
irrigated by
wastewater (ha)
Direct use 6 1492 8952
Indirect use 39 16452 641628
Total 650580

110
Table 18: Direct and Indirect use of wastewater for agriculture in select cities Cities Total Area
under
wastewater
irrigation
(ha)
% of
populatio
n covered
by sewer
system
Volume of
wastewater
(MLD)74
Type of use
(direct/
indirect) 75
Wastewater
treatment/ use
Reference
Case of twelve sewage farms
from Ahmedabad, Amritsar,
Bikaner, Bhilai, Delhi,
Gwalior, Hyderabad,
Jamshedpur, Kanpur, Chennai,
Madurai and Trivandrum
6473
(command
area of sewage
farms)
795 Direct use
(Sewage
channels)
Only four farms
show some level of
primary/secondary
treatment while rests
do not undertake any
treatment at all
Shende (1988)
Delhi 1,700 963 Direct use
[Sewage
channels]
Treated (industrial
water mixed with
sewage)
Final Report: Urban Wastewater:
Livelihood, Health and Environmental
Impacts in India (December 2004)
Kanpur 2,500 130 Direct use Partially treated
(industrial
wastewater mixed
with sewage)
Ecofriends (2005): Case Study report
Kolkatta 4,887 71676 Direct use Untreated Gupta, Gautam (2005): Case study report
74 For direct use design capacity of sewage channel or sewage treatment plant (as available) providing irrigation is considered. For indirect use the figure refers to wastewater generated by the city. 75 Direct use is the application to land of wastewater directly from a sewerage collection system or sewage treatment plant in which control exists over the conveyance of the wastewater from the point of discharge from a treatment works to a controlled area where it is used for irrigation. Indirect use is the wastewater application to land from a water body receiving wastewater. 76 assuming 50% of total 1432 used in Kolkatta as area under aquaculture and agriculture are almost same.

111
Cities Total Area
under
wastewater
irrigation
(ha)
% of
populatio
n covered
by sewer
system
Volume of
wastewater
(MLD)74
Type of use
(direct/
indirect) 75
Wastewater
treatment/ use
Reference
TOTAL 15560 2604 Ratio = 6
Hyderabad 40,600 (area in
and around the
city)
62 600 Indirect use
[natural
drainage course
(river) through
the city and
from several
points
downstream]
Almost the entire
area indirectly uses
mixed treated and
untreated wastewater
Buechler, Stephanie and Gayathri Devi.
2004
Six class I cities, Indore,
Nagpur, Jaipur, Ahmedabad,
Banglore and Chennai (with
Chennai as an exception where
wastewater is not used for
irrigation but for industrial
purpose)
35970
excluding
Ahmedabad
1922
excluding
Ahmedabad
Indirect Use
[Natural
drainage
courses (rivers
and nalas)]
Mix of Primary,
Secondary, and
Primary and
Secondary treatment
Londhe, Archana et. al (2004)
Vadodara 20247 (across
100 villages in
and around
city from
200 Indirect use
[sewage use
along stretch of
three rivers and
Bhamoriya, Vaibhav. 2002

112
Cities Total Area
under
wastewater
irrigation
(ha)
% of
populatio
n covered
by sewer
system
Volume of
wastewater
(MLD)74
Type of use
(direct/
indirect) 75
Wastewater
treatment/ use
Reference
sewage (14567
ha) and
industrial
wastewater
5680 ha)
along an
effluent channel
for industrial
wastewater]
Hubli-Dharwad Indirect Use
[Natural
drainage
courses (nalas
and river)]
Untreated Bradford, Andrew, et al
Ahmedabad 33,600 633 Both--Indirect
use [along river
banks till
Watrak
tributary
confluences
with it] and
direct use
[irrigation
command area
of the reservoir
Both treated and
untreated (industrial
wastewater mixed
with sewage).
Final report: Impact of Wastewater on
Livelihoods, Health and Environment:
Ahmedabad Case Study, 2005

113
Cities Total Area
under
wastewater
irrigation
(ha)
% of
populatio
n covered
by sewer
system
Volume of
wastewater
(MLD)74
Type of use
(direct/
indirect) 75
Wastewater
treatment/ use
Reference
which receives
wastewater]
TOTAL 130417 3355 Ratio = 39
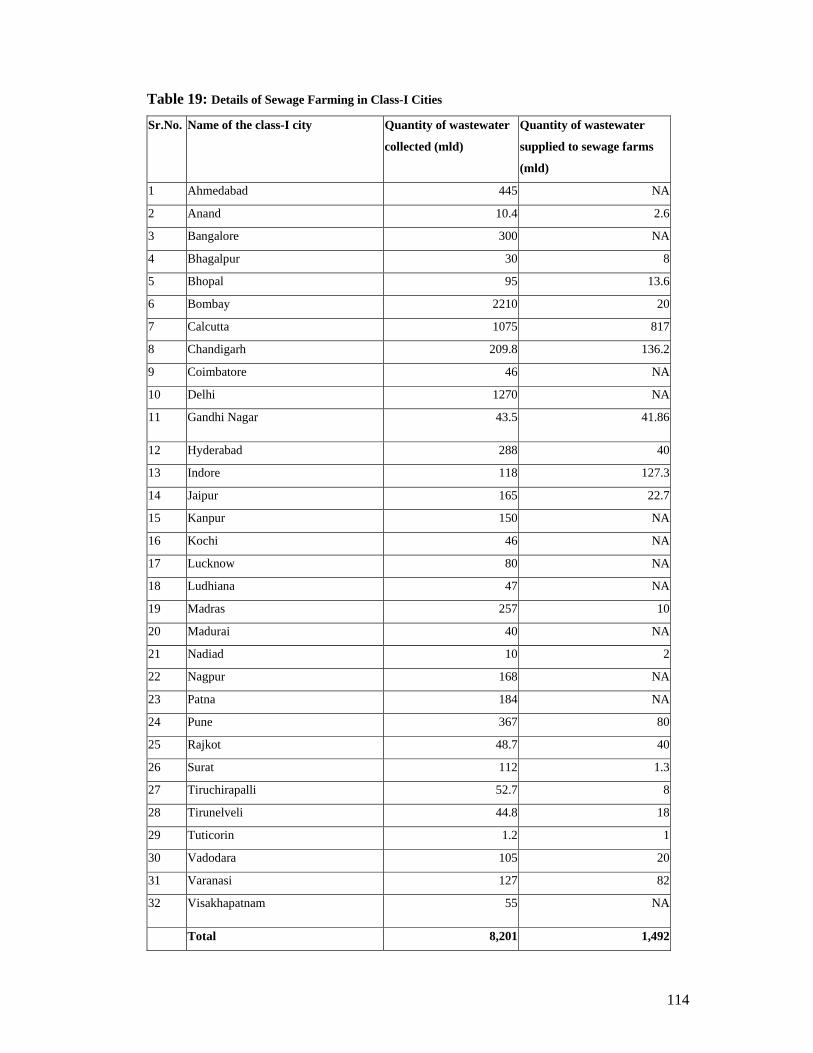
114
Table 19: Details of Sewage Farming in Class-I Cities
Sr.No. Name of the class-I city Quantity of wastewater
collected (mld)
Quantity of wastewater
supplied to sewage farms
(mld)
1 Ahmedabad 445 NA
2 Anand 10.4 2.6
3 Bangalore 300 NA
4 Bhagalpur 30 8
5 Bhopal 95 13.6
6 Bombay 2210 20
7 Calcutta 1075 817
8 Chandigarh 209.8 136.2
9 Coimbatore 46 NA
10 Delhi 1270 NA
11 Gandhi Nagar 43.5 41.86
12 Hyderabad 288 40
13 Indore 118 127.3
14 Jaipur 165 22.7
15 Kanpur 150 NA
16 Kochi 46 NA
17 Lucknow 80 NA
18 Ludhiana 47 NA
19 Madras 257 10
20 Madurai 40 NA
21 Nadiad 10 2
22 Nagpur 168 NA
23 Patna 184 NA
24 Pune 367 80
25 Rajkot 48.7 40
26 Surat 112 1.3
27 Tiruchirapalli 52.7 8
28 Tirunelveli 44.8 18
29 Tuticorin 1.2 1
30 Vadodara 105 20
31 Varanasi 127 82
32 Visakhapatnam 55 NA
Total 8,201 1,492

115
Table 20: Status of Wastewater Generation in Class-I Cities in Different States &
Union Territories
Domestic
(mld)
Industrial
(mld)
Total
(mld)
Sr.No. Name of the
state/union
territory77
No. of
class-I
cities
Population
Volume of wastewater generated
(mld)
1 Andhra Pradesh 32 10845907 896.8 25 921.8
2 Bihar 17 5278361 938.5 NA 938.5
3 Gujarat 21 8443962 1110.4 65.4 1175.8
4 Haryana 12 2254353 220.4 NA 220.4
5 Himachal
Pradesh
1 82050 10 NA 10
6 Karnataka 21 8283498 744.5 25 769.5
7 Kerala 14 3107358 296.8 0 296.8
8 Madhya Pradesh 23 7225833 784 NA 784
9 Maharashtra 27 22731865 3365.5 227.9 3593.4
10 Orissa 7 1766021 263.2 NA 263.2
11 Punjab 10 3206603 360.5 NA 360.5
12 Rajsthan 14 4979301 763.2 NA 763.2
13 Tamilnadu 25 10745773 771.9 NA 771.9
14 Uttar Pradesh 41 14480479 1557.7 NA 1557.7
15 West Bengal 23 13943445 1574.7 48.4 1623.1
16 Chandigarh 1 504094 217.9 NA 217.9
17 Pondichery 1 203069 24 NA 24
18 Delhi 1 8419084 2160 NA 2160
Total 291 126501056 16060 392 16452
Source: Status of Water and Wastewater Generation, Collection, Treatment and Disposal in Class I cities,
Central Pollution Control Board, 2000, New Delhi
9.2.2 Aquaculture The potential of wastewater in enhancing the yields of fish and agricultural crops is well
established (Hickling 1971; Jhingram and Ghosh 1988; Hauck 1978). Allen and Hepher
(1979), in a review of wastewater aquaculture indicated that wastewater fed ponds 77 It is assumed that wastewater irrigation is not prevalent in north-east states as it was not found in literature, hence these states are not included.

116
produce high fish yields because of the increase in the natural food organisms through
fertilization by inorganic manner. The single major factor that differentiates the
environment of sewage fed culture and conventionally fertilized one is the presence of
large amount of organic matter in the former, which controls most of the chemical and
biological properties of that system. Sewage effluents in the fish pond act in the same
manner as inorganic fertilizers and liberate nitrogen, phosphorous and trace elements
which stimulate the production of fish food organisms in the culture system. (Hepher
1962). Apart from releasing nutrients to stimulate the growth of fish food organisms, the
organic content of the effluents exhibits other ways of enhancing the productivity levels.
Mann (1972) reported that smallest particles of organic waste provide a direct source of
food.
Commenting on public health aspects of wastewater fed aquaculture, Apurba Ghosh in
his paper titled “Environmental and Sanitary Aspects of Wastewater Recycling for
Productive Use” concluded that possibility of bio accumulation of some metals in toxic
amounts in food materials is a matter of concern to the scientists dealing with waste
recycling process.
• One of the major areas of sewage fed fish culture is in Calcutta, popularly known as
the Bidhayari Spill area, with an annual total production of about 7,071 t of fish.
Some temple ponds and rock pools in South India are hypereutrophic; partly because
of sewage inputs Vellore fort moat is heavily polluted by sewage and develops a
permanent bloom of algae. It is used for aquaculture and yields an average of 6940
kg/ha/yr, mostly tilapia. Calcutta is the only place where raw sewage is used for
aquaculture.78
• Effluents from well-drained sewage farms may also be collected and used for
aquaculture eg. the Madurai Sewage farm. In Madhya Pradesh, treated or untreated
wastewater is used for agriculture and aquaculture. Most of the tanks and ponds in
and around those towns where the disposal of domestic waste is through open drains
and natural channels are sewage fed. Sewage is introduced either purposefully to
fertilize the ponds; or incidentally due to location in low lying areas. Although fish
production from these ponds is much higher than from unfertilized ponds, health
78 Krishnamoorthi, K.P. 1990. Present status of sewage fed fish culture in India, with special reference to experimental studies in Maharashtra State, Proceedings of International Seminar on Wastewater Reclamation and Reuse for Aquaculture, Calcutta, India.

117
hazards cannot be ruled out as most of the tanks are community ponds used for
bathing, washing and to a limited extend even for drinking water. In some extreme
cases uncontrolled flow of sewage and accumulation of sludge over a number of years
have resulted in excessive growth of aquatic vegetation and algae rendering the ponds
shallow and ultimately converting them in to swamps. Sewage fish culture exists in
number of cities in Madhya Pradesh like Bhopal, Bilaspur, Durg, Jabalpur, Jagdalpur,
Raipur, Rewa, Satna and Seoni.
• Survey conducted in Delhi indicates some practices of treated and raw wastewater.
The types of fish produced are Mangur and Catfish. Total number of 60 owners
produce 460 tons of fish annually priced at Rs 12,000,000 (Rs 25/kg). The use of
wastewater for Aquaculture has not only increased the yield but calls for low
requirement of fish food since nutrients present in wastewater suffice for the same.
The above examples reveal that wastewater irrigation is practiced in many Indian cities
either formally or informally. In most of the cases, it is a regulated practice of selling
wastewater/ sewage through the STP, but a larger part of peri urban areas, which tend to
be away from STP plants also use wastewater for irrigation.
9.3 Economic Importance of Sewage /Urban Wastewater in Class I cities
Municipal wastewater contains nutrients, which if not optimally reused may cause
eutrophication in receiving water bodies, thus causing their premature ageing. Alternative
use of this urban wastewater is its use for irrigation/fodder cultivation. In India around
many urban centers, government and individual farmers use the treated or untreated
sewage for fodder cultivation. The economic value of wastewater can be accessed based
on its nutrient value and also water value.
• Central pollution control board has done analysis of concentration of nutrients in
tonnes/day for the states in India. Based on this the value of nutrient in sewage
assuming at the rate of Rs. 4220/- per tonne of nutrient (1996) works out to be 4.39
million/day. The total annual economic value of sewage generated from class I cities
(2000) assuming there is no loss of nutrients after treatment, works out to be Rs.
1595.05 million.
• In Hyderabad, the farmers cultivating Jasmine through wastewater generates a lot of
employment. The jasmine plantation gives flowers for 8-9 months per year and a

118
farmer can earn approximately Rs. 15,000 to Rs. 20,000 per ha for an 8-9 month
flowering season. (Buechler and Devi, 2002).
• As per IWMI study, the total land under wastewater cultivation in five cities of
Indore, Nagpur, Jaipur, Ahmedabad and Banglore is 53770 ha generating economy of
Rs. 491.679 crores.
• A recent IWMI – TATA study (Bhamoriya, Vaibhav 2002) estimated the size of
wastewater economy in the peri urban area of Vadodara. The idea of estimation was
to analyze the cost of efficient wastewater discharge and reuse in agriculture vis a vis
the benefits. It followed the thought that use of wastewater in agriculture was
sustaining a large economy enough to justify the establishment of wastewater use as a
variable in the decision making for establishing and design of water supply systems in
urban context.
• The study calculates the total command area irrigated with industrial wastewater as
well as domestic sewage and the corresponding sales worth of the crops produced
through it. The results of agricultural economy sustained on wastewater flows
concludes that wastewater flowing through the city of Vadodara sustains an
agricultural economy worth Rs 825 million annually over 100 villages and 130 kms of
linear distance.
• Treated wastewater irrigation is practiced in Delhi in areas around Keshopur STP and
Okhla STP. Both the areas receive treated effluent from the STPs through a separate
channel being provided by the STPs. An interview session of 80 farmers in the area
revealed generation of net income of 15,700 per month from use of wastewater
irrigation as compared to 7,200 per month from use of freshwater for irrigation per
acre of land. Both Okhla and Keshopur have 205 and 1500 hectares of area under
wastewater irrigation and generate a net annual income of 115005000 and 481500000
Rs. respectively. The Okhla area provides employment to 80 households and
Keshopur around 600 households.
• In Kanpur wastewater is used both formally and informally for cultivating both Rabi
and Kharif on 1253 acres of land. Wastewater discharged in rivers is used just
downstream, untreated wastewater is also used from sewers/drains and directed to the
field or pumped areas.

119
10.0 Options for Mitigating Negative Impacts of Wastewater
Use
Wastewater use in agriculture benefits livelihoods and increases income generated, there
is a felt need to define a legislative framework for large-scale implementation of
wastewater use. It is very important to assess all possible policy and technical options that
can reduce or eliminate the negative health effects and economic burden resulting from
unregulated agricultural irrigation with wastewater. The type of remedial measures that
should be evaluated includes the following:
10.1 Restrictions on the type of crops grown, or modifications and control of
irrigation practices
The transmission of communicable diseases to the general public from irrigation with raw
or settled wastewater can be reduced by a number of techniques. Some of this is to restrict
the types of crops grown and others through modification and/or control of irrigation
techniques, and by preventing or limiting the exposure of health sensitive crops to
pathogens in the wastewater. Flood and sprinkler irrigation of salad and vegetable crops
usually involves direct contact between the crops grown and the wastewater used for
irrigation, and thus introduces a high level of contamination. Well-controlled ridge and
furrow irrigation usually involves less direct contact and contamination, while drip
irrigation has been shown to cause little contamination of vegetables growing above the
surface. Another possible control measure is to discontinue irrigation with wastewater at a
specified period before harvesting the crop. This is difficult from an agronomic point of
view, since vegetable harvesting is difficult to control.
10.2 Protection of Occupational Health
The main diseases affecting farmers irrigating with wastewater could theoretically be
overcome if farmers wore boots or shoes to protect their feet from the penetration of
hookworms, and if they paid close attention to personal hygiene, particularly by washing
their hands before eating. Among farmers with higher levels of education and improved
socio-economic conditions, an educational program aimed at achieving such goals may
yield results. Such programs could be especially effective on centrally organized sewage
farms, where the management could provide boots, and a washing facility could be

120
installed adjacent to special clean areas for resting and eating. Health education among
the farmers could also be started. However, in the case of hundreds of small, one-family
marginal wastewater farms or plots, common in Kanpur, such a program of improved
occupational health would be difficult to implement.
10.3 Wastewater Treatment to Eliminate and Reduce the Concentration of
Pathogens and Pollutants to Acceptable Levels
If wastewater can be treated effectively before it is used in agricultural irrigation, the
negative health effects to both sewage farm workers and the public consuming crops can
be reduced. Of the identifiable health effects associated with the use of wastewater, those
of greatest concern for most developing countries are caused by the hookworm,
beefworm, etc. These pathogens can, over long periods, damage the health of both the
general public consuming the crops irrigated with wastewater and sewage worker and
their families. An optimal wastewater treatment system should, therefore, be able to
remove almost all helminthes while a somewhat lower degree of removal of bacteria and
viruses might be tolerated.
10.4 Need to Explore Other Income Generating Reuse Options
With the aim of reusing wastewater at maximum possible levels and reaping maximum
economic benefits in terms of livelihood generation, various other options like
aquaculture, floriculture, community-based gardens, etc, should also be considered and
adopted. Various wetland flowers and grasses could be cultivated and harvested for
fodder purposes. In Delhi, aquaculture practices are common in slum settlements like the
Yamuna Pushta where residents collect their wastewater and grow fish, which is a
important source of livelihood. The benefits of these practices are immense in terms of
livelihood. The income generation factor is higher than that of agriculture.
10.5 Rights Awareness
Both farmers and the public must be made aware of their rights as citizens. The Right to
Information Act, 2005, enables an individual to get general information from various
government bodies. The farmers/public can use it to get basic information like the quality
of irrigation water, the quality of vegetable produce, etc.

121
11.0 Conclusions The study has looked into livelihood, environmental and health impacts of use of urban
wastewater in agriculture in four cities through field assessments. Of these four cities two
(Ahmedabad and Kanpur) represent the case of cities severely polluted by industrial
wastewater with one (Ahmedabad) in dry semi-arid region of western India and the other
(Kanpur) in the largest river basin (Gangetic basin) in India. The case of Delhi represents
lower levels of industrial pollution while Kolkata covers a typical case of wastewater
used in large-scale aquaculture systems for disposal/treatment. In these cases the key
issues presented include: perceptions of wastewater users regarding health, livelihood and
environmental impacts; state of the environment—land and water resources through
anecdotal evidences generated through laboratory results; and economic chain of
beneficiaries of wastewater use.
A National assessment on the significance and extent of wastewater use in India was
carried out based on results obtained from these four field assessments and secondary
literature on wastewater use in and around cities in India. For this, a modified typology of
wastewater use appropriate to the Indian context was developed and applied which
categorises wastewater use into direct and indirect uses.
The field assessments and national assessment offer interesting and practical insights for
developing policy and legislative frameworks for wastewater use in India.
11.1 Tradeoffs
The field assessments show that urban wastewater irrigation has a significant positive
impact on livelihoods, especially in cities having low or no industrial development or
where urban sewage is not mixed with industrial effluents. While in cities where
industrial effluents are mixed with urban sewage the comparative returns from
wastewater-irrigated agriculture are lower than that from freshwater agriculture.
However, wastewater irrigation poses risks to human health and the environment, the
degree being more in case of cities with higher industrial development. In such cities,
another key factor that shapes the degree of impact, especially on environment, is the
duration of wastewater irrigation practice. In areas where it has been practiced for 3-4

122
decades, the land and groundwater quality have degraded greatly requiring large-scale
investments in reclaiming the natural resource base. The health impact in these areas is
also severe. An analysis of pros and cons of wastewater use would help assess the
tradeoffs in sustaining the livelihoods of wastewater users: do the benefits compensate the
negative impacts of wastewater irrigation, and what should be the time frame. As the field
assessments in India indicate, the benefits do outweigh the negative impacts, at least
during initial periods, until industrial wastewater and urban sewage began mixed.
Irrespective of scale of benefits the policy makers have the responsibility to protect wider
public interest. There is need for developing guidelines for specific crop types irrigated
with untreated and treated wastewater in India. Guidelines could be effective only if they
take into account diverse wastewater use practices that determine the exposure route of
risk to public health. The field assessments show various types of crops such as
vegetables and foodgrains being irrigated using treated and untreated wastewater, which
are eaten raw and/or cooked, having implications on permissible levels of contaminants in
wastewater use for irrigation. In addition, the wastewater users are exposed to health risks
depending upon type of irrigation practice—whether it is furrow or flood irrigation.
Sustainability of agriculture using urban wastewater is also dependent on land use
policies. The tradeoff can be between using land for urban agriculture and urban
development. Although policies in land management in India do provide for protecting
productive agriculture land, urban agriculture will face challenging pressures from
changing land use patterns for urban development. For instance, field assessments in
Kolkata show that paddy cultivators have decreased in numbers over the last 10 years as
most of them have sold off their land for the reclamation for developing the city. Hence,
there is need for policy makers to take into account the livelihoods of communities
dependent on urban wastewater for agriculture in urban land use planning decisions.
11.2 Data Issues
For designing effective measures to mitigate impacts and assess suitability of various
reuse options (such as crop type and groundwater recharge) it is imperative to know the
concentrations of key parameters of quality of wastewater, groundwater and soil, over a
time period. There is need to expand the set of quality parameters, especially for
wastewater, being monitored by government authorities to include human pathogens,
trace and heavy metals, and trace organic compounds. Further, monitoring needs greater
123
sampling points in the wastewater collection, treatment and disposal system to capture the
nature and extent of contaminants.
11.3 Guidelines for health and environmental quality
There are very few standards pertaining to water quality requirement for irrigation in the
Indian scenario. These standards are also not comprehensive enough and do not cover
various parameters like standards for metals. The major environmental concerns in an
urbanizing India relate to high levels of water pollution due to poor waste disposal,
inadequate sewerage and drainage, and improper disposal of industrial effluents. While
the overall benefits of wastewater use in agriculture are obvious, the technology and
expertise to allow these to be accrued with minimal detriment to public health or
environment need to be developed and promoted. Further, the government needs to
control the process within the broader framework of a national effluent use policy that can
form a part of national plan for water resources.
11.4 Significance of Wastewater Economics
The field assessments show contrasting economic patterns in wastewater irrigated
agriculture between cities where industrial effluents mix with urban sewage to alarming
levels and in cities where it does not. The profit earned by cultivators in the former case is
significant. For example, in Delhi, the total profits earned by the cultivators dependent on
wastewater from two sewage treatment plants itself comes to Rs. 596.5 million (13.5
million USD) for one crop cycle. In addition, wastewater irrigated agriculture seems to be
yielding higher returns as compared to freshwater irrigation as seen in case of vegetable
farming from wastewater which yield net returns twice that of freshwater irrigated areas.
Contrastingly, in Kanpur due to reduced crop productivity the net return from wastewater
areas is lower than freshwater irrigated areas essentially due to lower yields and lower
market rates. Thus, enhancing livelihoods of communities dependent on wastewater,
especially in industrialized cities, will require concerted efforts for appropriately treating
industrial effluents and improving the natural resource base of wastewater irrigated areas.
11.5 Beneficiaries of Wastewater Use
Wastewater-based agriculture and aquaculture provides income to a wide variety of
interdependent actors involved in production and marketing chains. The actual
wastewater users who are central beneficiaries in the production chain have diverse kinds
124
of dependence on wastewater for livelihood. Some groups occasionally do have alternate
livelihood options like small transport businesses, dairy business etc. but agriculture
forms the most important part of their livelihoods. In addition, landless labourers also
form part of the production chain. Often these groups are the poorest of the poor who are
not skilled in other work sectors and agriculture related income alone supports their
families. With regards to fisheries, apart from the fishermen, maintenance workers like
night guards and weed cleaners are employed on a permanent basis, while transporters
and daily-wage labour are contracted on a need basis. As regard the marketing chain,
especially for vegetables, in most cases the family members themselves carry them to
markets. They usually do not hire laborers, as their landholdings are too small. The
complex nature of these chains makes the assessment of economic significance of
beneficiaries of wastewater use even more challenging. Another point in this context is
that these chains distribute the incomes inequitably. There is need for further research in
this area. Thus, policy on wastewater use in agriculture will need to include ways to
address the inequities and take account of the diverse set of beneficiaries from agriculture
by wastewater irrigation.
11.6 Engaging Policy Makers
There is a gap between the volume of wastewater generated and the amount actually
treated. This gap might increase as water supply increases due to rapid urbanization. At
the same time, there is a gap between the availability of research on wastewater related
issues and the use of this research into decision-making processes. Though the National
Water Policy talks about participatory decision-making in water related issues, there
exists no institutional space for either primary users or other CSOs to influence water
policy, much less its implementation. A critical need therefore would be to work towards
creating multi-tiered institutional forums that can address relevant policy and regulatory
and enforcement frameworks.
11.7 Options to Mitigate Impacts
Urban growth has outpaced development of sewerage collection, treatment and disposal
systems in India. And, given that development of sewerage system is capital intensive
with recurring expenditure on its operation and maintenance in situations where most of
the urban bodies face paucity of funds, it is unlikely that effective sewerage systems will
be developed in the near future. Hence, strategies to mitigate detrimental impact will need

125
to be devised for short, medium and long terms: The short-term measures will need to
address acute health risks to wastewater irrigators and consumers of agriculture produce
from wastewater irrigation by imposing restriction on crop types, using appropriate
methods of irrigation, and adoption of preventive measures by wastewater irrigators to
control exposure. In the medium term the gap between available research and required
research on various facets of wastewater use needs to be bridged while engaging policy
makers and other stakeholders in research processes. Finally, the long-term set of options
need to include, a) awareness generation among wastewater irrigators and consumers of
agriculture produce from wastewater irrigation, on health risks and impacts of wastewater
use in agriculture and options to mitigate them, and, b) treatment of wastewater to desired
quality: of the identifiable health effects associated with the use of wastewater, those of
greatest concern for most developing countries are caused by the hookworm, beef worm
etc. These pathogens can, over long periods, damage the health of both the general public
consuming the crops irrigated with wastewater and the agriculturists and their families.
An optimal wastewater treatment system should therefore be able to remove almost all
helminthes while a somewhat lower degree of removal of bacteria and viruses might be
tolerated.
11.8 National Assessment
National assessments on extent of wastewater use are greatly dependent on typologies of
wastewater use. Using the broad typology of direct and indirect uses of wastewater in
agriculture in India, the arable land irrigated by wastewater is approximately 600,000 ha.
Although it is an insignificant proportion of total area under irrigation from other sources
(surface water reservoirs and groundwater), it needs adequate attention of policy makers
for four reasons: it does provide critical income support to many urban and peri urban
farmers; the producers as well as the consumers of their products and the environment are
at a high risk; urban wastewater being three fourths of urban water used is potentially a
considerable and reliable source of water, available year round and which is likely to
grow exponentially with the projected rapid urbanization of India; and, given the urban
water supply scenario in the foreseeable future, wastewater use is an option that we can
ignore only at our peril.

126
References
Aertgeevts. R., Angelais. A., (WHO/SDE/WSH/03.08) State of Art Report Health Risks
in Aquifer Recharge Using Reclaimed Water.
Ahmedabad Urban Development Authority (AUDA), (November 1997) Revised draft
development Plan of AUDA – 2011 AD.
Ali, Nazim., Economic and Institutional Issues of Wastewater Use in Faisalabad,
Pakistan.
Ayers R.S. and Wescot D.W., (1985) Water Quality for Agriculture – FAO irrigation and
Drainage Paper-29 Rev. 1.
Baumgartner, B. and Belevi, H., (2001) A Systematic Overview of Urban Agriculture in
Developing Countries. EAWAG – Swiss Federal Institute for Environmental
Science & Technology, SANDEC – Dept of Water & Sanitation in Developing
Countries.
Bhamoriya Vaibhav (2002) Wastewater and Welfare: Pump Irrigation and Economy of
Peri Urban Vadodra, IWMI-TATA Water Policy Research Program.
Bradford, Andrew, et al Wastewater Irrigation: Hubli Dharwad, India.
Bradford. A, Brook. R, Hunshal. C (2000) Risk Reduction in Hubli-Dharwad, India in
Sewage Irrigated Farming System, UA Magazine.
Brijgopal State of Degradation and Approaches to Restoration of Flood Plain Rivers in
India.
Central Ground Water Board (2000) Status of Ground Water Quality and Pollution
Aspects in NCT of Delhi.
Central Pollution Control Board (1999-2000) Water Qulaity Status of Yamuna River.
Central Pollution Control Board (2003) Performance Evaluation of STP’s in Delhi.
Central Pollution Control Board, Basin Sub Basin: Sabarmati Basin Report. Assessment
and Development Study of River Basin Series ADSORBS/20/1988-89.
Central Pollution Control Board, Quality of Major Rivers : Gujarat State ( The Biennum
1979 & 1980 survey).
Conclusions and Recommendations of the IWMI-RUAF E conference on: Agriculture
Use of Untreated Urban Wastewater in Low Income Countries, 24June-5th July
2002.

127
Confronting the Realities of Wastewater Use in Agriculture, IWMI Research Update,
Issue 1, 2004.
Cornish., G.A., Kielen., N.C., Wastewater Irrigation – hazard or life line ? International
Development Group, HR Wallingford Ltd, Wallingford, Oxon, UK.
[email protected], [email protected].
CPCB (1994-95) Status of Water supply and wastewater generation, collection, treatment
and disposal in metro cities ( 1994-95).
Bartram, J., Fewtrell, L. and Stenström, T.A. (2001) Harmonized assessment of risk and
risk management for water related infectious diseases: an overview. In: Fewtrell,
L. and Bartram, J. (eds) Water Quality: Guidelines, Standards and Health;
Assessment of Risk and Risk Management for Water Related Infectious Disease.
International Water Association (IWA) on behalf of the World Health
Organization, London, UK
Dayem., Safwat Abdel., (2000) "Sustainability of low quality water use in agriculture",
GRID, IPTRID Network Magazine, Issue 15 February 2000, pp 8-9.
Delhi Statistical Handbook (2002) Directorate of Economics and Statistics, Government
of National Capital Territory of Delhi.
Dinesh Kumar, M., Prakashsingh, Om., Singh, Katar. Integerated Water Resources
Management in Sabarmati Basin : Some Issues and Options, India Natural
Resource Economics and Management Foundation, Anand.
Feenstra.S, Hussain. R, Hoek.W (2000) Health risks of Irrigation with Untreated Urban
Wastewater in the Southern Punjab, Pakistan – IWMI Pakistan Program.
Furedy., Christine et al. Reuse of Waste for Food Production in Asian Cities: Health and
Economic Perspectives. Available at : http://web.idrc.ca/en/ev-30609-201-1-
DO_TOPIC.html.
Gabby.S (2004) Rehabilitation of Israel’s Rivers.
Ghosal Amit, Urban Waste Management: A case of Ahmedabad, Unpublished report,
School of Planning, CEPT, Ahmedabad.
Ghosh Santosh. 2002 Wastewater Recycling In Urban Aquaculture. Paper presented at
the July 2002 International Congress in Irrigation & Drainage, Montreal, Canada.
GPCB (1992-99) Annual Reports of Gujarat Pollution Control Board, Gandhinagar.
Guidelines for wastewater reuse in agriculture and aquaculture: recommended revisions
based on new research evidence Task No: 68 Part 1, WELL Study. Task
Management by: Dr Ursula J. Blumenthal Quality Assurance by: Michael D.
128
Smith London School of Hygiene & Tropical Medicine, UK WEDC,
Loughborough University, UK E-mail: [email protected].
Haan, Max, The right to suitable water for Agriculture, an Interpretation of the
Constitution of India. Available at http://www.rauf.org/no11/37_india.html.
Hussain I., Raschid, L., Hanjra, M., Marikar, F. and van der Hoek, W. (2001) A
Framework for Understanding Socioeconomic, Health and Environmental
Impacts of Wastewater Use in Agriculture in Developing Countries, Working
Paper 26. International Water Management Institute (IWMI), Colombo, Sri Lanka
Hussain I., Raschid, L., Hanjra, M., Marikar, F. and van der Hoek, W. (2002).
Wastewater use in agriculture: Review of impacts and methodological issues in
valuing impacts. (With an extended list of bibliographical references). Working
Paper 37. International Water Management Institute (IWMI), Colombo, Sri
Lanka:
India Infrastructure Report 2002.
Industry at Any Cost. Accessed on 27th May 04, at
http://www.rainwaterharvesting.org/Crisis/Industrial-pollution.htm.
Issues in Urban Agriculture (1999). As accessed on 6th May 04 at
http://www.fao.org/ag/magazine/9901sp2.htm.
IWMI Water Policy Briefing (2003) Confronting the Realities of Wastewater Use in
Agriculture.
Mara, D. and Cairncross, S. (1989) Guidelines for the safe use of wastewater and excreta
in agriculture and aquaculture, World health Organization, Geneva, Switzerland,
187 pp
Minhas P.S. Use of Sewage in Agriculture: Some Experiences. Central Soil Salinity
Institute, Karnal.
Ministry of Environment and Forests and Government of National Capital Territory of
Delhi Planning Department (2001) Status Report for Delhi 21 Delhi Urban
Environment and Infrastructure Improvement Project (DUEIIP).
Mudrakartha Srinivas, Negotiating a People Based Governance Institution for Sabarmati
River Basin Management: the Gujarat Experience. Paper presented at
International workshop on Deliberative Democracy Negotiated Development.
129
Mukherjee, M., U. Nath, Sk.A. Kashem and M. Chattopadhyay (2001), The Sewage Fed
Fisheries in Kolkata. Office of the Deputy Director of Fisheries
(M&P),Government of West Bengal, Paper prepared for the DPU International
Conference: Rural-Urban Encounters: Managing the Environment of the Peri-
Urban Interface, London 9-10 November 2001
Parivesh Newsletter (1999) Highlights.
Parkinson, Jonathan, Tayler., Kelvin., Decentralized wastewater management in peri-
urban areas in low income countries. Environment and Urbanization Vol 15 No 1
April 2003.
Parmar, B.J., Gulati O.T., Sustainable Water Resources Development through Integrated
River Basin Management on Sabarmati river basin of India.
Pescod .M.B (1992) Wastewater Treatment and Uses in Agriculture – FAO Paper 47.
Proposal for Sabarmati Riverfront Development, Ahmedabad, Prepared by
Environmental Planning Collaborative (EPC) Ahmedabad.
Rattan R.K, Datta.s.p, Singh.A.K, Chhonkar.P.K,Suribabu.K(2001) Effect of Long Term
Application of Sewage Effluents on Available Water Status in Soils under
Keshopur Effluent Irrigation Scheme.
Recommendations for Decision – making on Municipal Wastewater: Practical Policy
Guidance for Implementing the Global Programme of Action for the Protection of
the Marine Environment from Land Based Activities (GPA) on Sewage, UNEP
working Document. Available at :
http://www.gpa.unep.org/documents/other/recs/Recommendations%20for%20De
cision-making.htm.
S. Marulanda, Liliana, The Greening of Ahmedabad: An Innovative Urban Community
Forestry Model. Available at : http://www.ruaf.org/1-1/21-23.html.
Satija, Sonu., Mishra Bibhu., Sewage treatment through aquaculture. Available at
http://www.tribuneindia.com/1999/99dec27/agro.htm.
Scott, C. A., J. A. Zarazúa, and G. Levine. 2000. Urban-wastewater reuse for crop
production in the water-short Guanajuato river basin, Mexico. Colombo, Sri
Lanka.. Research Report 41. Colombo, Sri Lanka: International Water
Management Institute.
Shaman, David,(1996) India's Pollution Regulatory Structure and Background.

130
Shuval, H.I., Adin, A., Fattal, B., Rawitz, E. and Yekutiel, P. (1986) Wastewater
irrigation in developing countries: health effects and technical solutions.
Technical paper 51, World Bank, Washington, D.C
Singh, Katar, RBI Chair Professor and Director, Institute of Rural Management, Anand,
Water Conservation and Demand Management.
Suhane Rajesh, Dynamics of Water Supply Management System: a case of Ahmedabad.
Unpublished report, School of Planning, CEPT, Ahmedabad.
Trivedi R.C., MakhijaniS.D, Bhardwaj R.M(2001) Status of Water Quality in River
Yamuna-NCT of Delhi Central Pollution Control Board.
Urban Agriculture Magazine accessed at www.ruaf.org.
USEPA 1980 Guidelines (Revised 1992). Fact sheet for water and sanitation for health.
VIKSAT Annual Report 2002 –03.
Wastewater Irrigation: Economic Necessity or threat to Health and Environment? Future
Harvest, Thursday, March 22, 2001. Available at
http://www.futureharvest.org/pdf/wastewater.pdf.
Water and wastewater treatment situation in India, Summary of the final report,
submitted by Indian Environmental Association for Promofirenze – Special
Agency of the Chamber of Commerce of Florence.
Water Pollution Control - A Guide to the Use of Water Quality Management Principles.
© 1997, WHO/UNEP.
WHO (World Health Organization). (1996) Health guidelines for the use of wastewater
in agriculture and aquaculture: Report of the WHO Scientific Group. Who
Technical Report Series 778. World Health Organization, Geneva, Switzerland,
156 pp.
Yasmeen, Gisele, Urban Agriculture in India: A map of research capacity and expertise.
Submitted as Background paper for the FAO regional seminar " Feeding Asian
Cities" Bangkok: November 7-30, 2000.

Annexures

132
Annexure 1: Comparative Study of Income Generation Using Ground Water vis-à-vis Wastewater of Income Generation Using Ground Water vis-à-vis Wastewater S. No Factors Use of fresh water
for irrigation Use of wastewater for irrigation
1. Area of land 1 acre 1 acre
2. Crops Produced Cucurbit (Tori) Cucurbit (Tori)
3. Crop yield (tonnes)/month (summer season vegetables)
Tori - 1.5, Ghiya – 1.5, Eggplant - 2, Okra – 1.5)
Tori - 2.5, Ghiya – 2.5, Eggplant – 3.5, Okra – 2.5)
4. Cost of land (Approximate Lease cost /month)*(Rs)
3000 3000
5. Money invested in buying seeds (Rs)
100 100
6. Money invested in irrigation water (Rs/month)
90-100 NIL/Negligible
7. Money invested in fertilizers/month (Rs)
500 200
8. Money invested in buying insecticides/month (Rs)
1,000 1,500
9. Labour charges/month (average 2-3 laborers on 1 acre land)(Rs)
3000 4500**
10. Equipment O & M cost (Rs) 100 Negligible***
11. TOTAL MONEY INVESTED/month (summation of 4,5,6,7,8,9,10)(Rs)
7,800 9,300
12. TOTAL INCOME FROM SELLING OF CROPS/Month (Rs)****
15,000 25,000
13. NET INCOME GENERATED (12-11) (Rs/month)
7,200 15,700
(Calculations in the table are made for Cucurbit (Tori) indicated in bold
*Assuming the land is taken on lease from the Government by the cultivator (which is true for most cases according to field observations) who further employs labourers to work on it.

133
** Additional cost of 1 labourer has been kept since more individuals are required on wastewater irrigated land for weeding purposes.
*** There are generally no diesel/pumping related costs associated with wastewater because it is supplied through a network of channels in the fields and hence no pumping of water is required.
****Assuming the average price of Tori to be Rs 10/kg (Maximum profit conditions have been taken)

134
Annexure 2: Milk Production in Kanpur: Comparison of freshwater and wastewater irrigated areas
Amount Rate (Rs. / kg) Total cost ( Rs.)
Particulars Fresh water irrigated
Wastewater irrigated
Fresh water irrigated
Waste water irrigated
Fresh water irrigated
Waste water irrigated
Concentrates 5 kg 7kg 6 7.8 30.00 55.00 Green fodder 15 kg 6kg 50
/quintal 50 /quintal
7.50 3.00
Dry fodder (straw)
10 kg 10kg 100 / quintal
100 / quintal
10.00 10.00
Mustard oil 300 ml/month
1000 ml/month
50 / litre 25 / litre 0.50 0.90
Salt / Gur 50 g /day 5 0.25 0.45 Maintenance cost /building /treatment /labour
15 /day 15.00 3.50
Total expenditure
63.25 72.85
Income Milk (litres/day /animal)
8 10 @Rs. 10 /litre
@Rs. 14 /litre
80.00 140.00
Dung (kg/day/ animal)
30 20 0.30 - 9.00 -
Income from calf
@500/- after 6 months
3.00
Gross income 92.00 140.00 Cost of production / litre
7.90 7.30
Net profit /buffalo /day
28.75 67.15

135
Annexure 3: Sabarmati River Water/Soil/Grain Analysis: Heavy Metals (ppm) Village Cadmium Chromium Copper Lead Zinc Arsenic
Galiyana River water
0.02 0.46 0.16 0.00 0.07 0.00
Sahij River water
0.02 0.49 0.28 0.16 0.08 0.00
Gyaspur River water
0.007 0.92 1.57 0.17 0.65 0.00
Vautha Bore well water
0.01 0.61 0.22 0.40 0.56 0.00
Soil
Sahij Soil
0.15 25.04 19.4 0.98 36.59 0.00
Grain
Vautha Wheat
0.00 0.00 0.00 2.675 0.00 0.00
Listed below are permissible limits of heavy metals for water - ISI Standards
Cadmium Chromium Copper Lead Zinc Arsenic
Permissible Limits 0.01 0.05 1.5 0.10 15.00 0.00 No trace of pesticides was found in any of the water, soil or grains samples analysed. Analysis by: Consumer Education Research Centre, Ahmedabad

136
Annexure 4: Mean values for selected quality parameters of untreated wastewater during 1996, Kanpur
PARAMETER Mean TSS (mg/l) 962.0 PH 7.9 COD (mg/l) 578.6 DOM (%) 0.08 TKN (mg/l) 78.5 NH3-N (mg/l) 48.5 Org-N (mg/l) 31.6 T Coli (MPN/100 ml) 1.2E08 F Coli (MPN/100 ml) 1.2E08 Salmonella (MPN/100ml) 1.0E05 Streptococcus (MPN /100 ml) 8.3E06
Source: ITRC, Lucknow

137
Annexure 5: Quality of Wastewater in selected Indian cities
INDORE NAGPUR JAIPUR AHMEDABAD BANGLORE CHENNAI STANDARDS Ph 8.2 8.26 8 6.6 7.3 7.57 5.5 – 9.0 TDS 841 1496 814 8760 1200 12844 Below 2100 BOD 110 320 70 460 160 42.92 Below 30
Source: Urban Water Authorities

138
Annexure 6: Mean of the metal levels in different environmental media near wastewater irrigated areas in Kanpur. Media Cd Cr Cu Fe Mn Ni Pb Zn Surface Water (mg/l)
0.006 0.058 0.018 6.324 0.343 0.041 0.041 0.080
Ground Water (mg/l)
0.001 0.003 0.006 0.767 0.119 0.021 0.026 0.182
Soil (ug/g) 3.03 249.16 60.59 6700.25 297.71 38.01 89.59 169.92
Veg/Crops (ug/g) 0.002 0.278 ND 0.449 0.508 0.479 0.141 1.402
Food Grains (ug/g)
0.17 0.012 2.472 50.636 41.032 1.123 0.207 47.16
Source ITRC, Lucknow, 1996

139
Annexure 7: Water Quality of River Yamuna in Delhi Stretch79
Locations
YEAR
Parameters (Ranges)
PH
Total
dissolved solids mg/l
Chemical
oxygen demand
mg/l
Bio-chemical
oxygen demand
mg/l
Dissolved
oxygen mg/l
Total coliforms
Nos./100 ml
Faecal coliforms
Nos./100 ml
River water quality criteria
6.0-9.0
-
-
3 (max)
4 (min)
5000 (max)
-
2001 7.18- 8.42 128-358 2-22 1-3 5.91-12.4 600-69000 34-5000 1. Yamuna river at Palla 2002 7.03-8.38 181-285 4-16 1-4 7.2-9.9 9800-102000 150-12200
2001 7.00-7.46 187-590 14-96 4-29 Nil- 2.32 104000-14800000 1700-3700000 2. Yamuna river at Agra Canal (Madanpur Khadar)
2002 6.87-7.68 373-573 45-77 10-22 0.4-2.33 45000-18300000 23000-970000
2001 6.98-7.55 171-551 9-77 2-24 0.64-2.39 130000-15800000 1300-2610000 3. Yamuna river at Agra Canal (Okhla)
2002 6.89-7.54 326-506 36-72 8-20 0.2-1.0 158000-3760000 7100-480000
2001 6.91-7.43 226-937 28-199 6-77 Nil-2.01 88000-5,80,00,000
2000-5700000 4. Yamuna river at Okhla after meeting Shahdara drain
2002 6.92-7.64 647-847 80-221 25-67 Nil 207000-41500000 17800-44000000
5. Yamuna river at Nizamuddin
2001 6.94-7.55 185-594 13-156 6-54 Nil-3.7 80000-70000000 500-14100000
2002 6.61-7.74 476-627 70-94 21-42 Nil 1060000-34000000
12100-10200000
79 Trivedi, R.C. , Makhijani, S.D. , Bhardwaj, R.M., Status of Water Quality in River Yamuna - NCT of Delhi, Central Pollution Control Board

140
Annexure 8: Characteristics of soil in the wastewater irrigated area in Kanpur.
Parameter PH (1:5) EC (1.10)
(umho/cm)
Bulk Density (g/cc)
Particle Density (g/cc)
Pore Space (%)
Org C (%)
Tot-N ( ug/g)
P (ug/g) Na (ug/g) K (ug/g) Ca (mg/g)
Mg (mg/g)
Mean 8.1 1160 1.22 1.88 35.56 1.50 738.5 5.96 148.3 93.7 3.36 0.81
Source ITRC, Lucknow-1996
Mean of the pesticide residues levels in different environmental media near wastewater irrigated area.
Mean a-BHC B-BHC r-BHC Tot-BHC Op-DDT pp-DDT pp-DDD pp-DDE Tot-DDT Surface Water (ug/l) 0.002 ND ND 0.002 ND ND ND 0.011 0.013 Ground Water (ug/l) 0.016 ND 0.0124 0.028 ND ND ND 0.077 0.086 Soil (ug/g) 0.026 0.11 0.01 0.142 0.008 0.019 0.002 0.008 0.032 Veg/Crops (ug/g) 0.01 0.033 0.020 0.063 0.011 ND 0.0001 0.012 0.023 Food Grains (ug/g) 0.005 0.312 0.029 0.35 0.003 ND ND 0.021 0.024
Source ITRC, Lucknow, 1996

141
Physico-chemical and elemental content in soil at different depths
Site Soil depth Cms pH 1:2.5
EC 1:2.5
OC %
OM %
N %
Paewandi 0-9 9-18
8.68 8.38
0.408 0.685
0.668 0.623
1.154 1.076
0.083 0.062
Sekhpur Site I
0-9 9-18
8.66 8.62
0.420 0.475
0.742 0.297
1.282 0.513
0.092 0.029
Sekhpur Site II
0-9 8.55 0.448 0.356 0.615 0.044
Exchangeable cation capacity C mol Kg-1 Site Na+ K+ Ca++ Mg++
Paewandi 4.61 5.30
0.31 0.21
9.0 7.0
2.07 2.86
Sekhpur Site I
3.30 4.69
0.36 0.25
9.0 7.0
1.72 1.98
Sekhpur Site II
3.39 0.31 7.0 1.74

142
Annexure 9: Presence of Sodium and Chromium in water and soil in study areas-Kanpur
Physico-chemical and elemental content in water used for irrigation and drinking purposes
Exchangeable cat ionic capacity C mol Kg-1
Site pH 1:2.5
ECe 1:2.5
Na+ K+ Ca++ Mg++
SAR SSP
Tannery effluent
8.34 3.045 0.360 0.062 0.26 0.18 5.494 49.26
Handpump water
7.6 2.737 0.322 0.040 0.20 0.14 4.893 46.08
Cr content (ug ml-1) in the water and milk samples collected from Paewandi and Sheikhpur villages.
Water samples Site I Peawandi Site II Sekhpur Ground water (Hand Pump) 0.155±0.002 0.17±0.001 Channel water 0.27±0.001 ND Water in crop field 0.17±0.002 ND Hand pump (Sekhpur village, 60 ft)
ND 0.16±0.002
Hand pump (Sekhpur village, 100 ft)
ND 0.15±0.001
Milk 0.0735±0.001 ND

143
Annexure 10: Ground water Quality in Study areas in Delhi 80
S. No.
Parameters Ground Water Quality at
village Ranhaula
Ground Water Quality at
Village Mundka
Ground Water Quality at
Village Madanpur
Khadar
1. Salinity/EC in mhos/cm at 250
2200 3570 1790
2. Sodium (Na) % 450 690 230
3. Chloride (Cl) % 337 566 254
4. Nitrate (NO3) mg/l 38 32 42
5. Boron (B) mg/l Nil 0.44 0.40
6. Copper (Cu) mg/l 0.040 0.040 0.060
7. Lead (Pb) mg/l 0.019 0.019 0.019
8. Zinc (Zn) mg/l 0.001 0.001 0.001
9. Chromium (Cr) mg/l 0.025 0.025 0.070
10. Cadmium (Cd) mg/l 0.0003 0.0003 0.00085
11. Iron (Fe) mg/l 0.017 0.017 0.009
12. Nickel (Ni) mg/l Data unavailable Data unavailable Data unavailable
13. Aluminium (Al) mg/l Data unavailable Data unavailable Data unavailable
14. Arsenic (As) mg/l Data unavailable Data unavailable Data unavailable
15. Beryllium (Be) mg/l Data unavailable Data unavailable Data unavailable
16. Faecal Coli Nil Nil Nil
80 Status of Ground Water Quality and Pollution Aspects in NCT-Delhi. January 2000. Central Ground Water Board & Central Pollution Control Board.

144
Annexure 11: Organochlorine Pesticide residue (ppb) in water, fruits and vegetables from the agricultural field, Jajmau, Kanpur
Pumpkin Pestcide Residue Water Kernel Peel Guava
∝-HCH 0.0007 ND 0.0101 0.0036 γ-HCH - ND ND ND β-HCH 0.0035 0.0029 0.005 0.10 δ-HCH - - - 0.003 Aldrin 0.0023 - - 0.002 Endosulphan - - 0.0018 - DDE 0.0042 0.0179 0.0113 0.0354 Op DDT - - - - pp DDD - - - - Pp DDT - 0.006 - -
Source NBRI, 2000

145
Annexure 12: Biological Analysis of Fish grown in Fresh water and Wastewater
Boinchitala (Near Dhapa) Parameters Bone Liver Flesh
Physical 1* 2** 1 2 1 2
Weight 2.8804gm 3.3216gm 0.1967gm 0.5725gm 80.2156gm 121.3565gm
Chemical Mg/kg Mg/kg Mg/kg Mg/kg Mg/kg Mg/kg
Copper 133.07 4.27 23.89 11.00 6.62 21.90 Zinc 28.50 29.28 220.13 20.34 26.15 35.16 Manganese 22.63 20.19 67.61 21.05 18.86 36.64 Chromium <5.00 <5.00 <5.00 <5.00 <5.00 <5.00 Lead <5.00 <5.00 <5.00 <5.00 <5.00 <5.00 Cadmium <0.50 <0.50 <0.50 <0.50 <0.50 <0.50 Mercury BDL BDL BDL BDL BDL BDL Arsenic BDL BDL BDL BDL BDL BDL
*Sample no. 1 (fish collected from a bheri in East Calcutta Wetland) **Sample no. 2 (fish collected from a freshwater pond in Garia)
On comparing the sample fish from the East Calcutta Wetlands with the control from fresh water source we find that copper content in fish bone is very high than the control. All the other parameters show virtually no difference. Concentration of manganese and zinc in fish liver is very high for the wastewater fish than for the freshwater one. The analysis of fish flesh shows higher concentration of copper, manganese and zinc in the freshwater fish than in the wastewater fish. However, arsenic and mercury are present below the detection limit for both the samples.

146
Annexure 13: Comparison table of drinking water quality standards with ground water quality in study areas in Delhi
Parameters Water Quality Criteria for
Drinking Purpose
(IS:10500:1991)
Ground Water
Quality at Village
Ranhaula
Ground Water
Quality at Village
Mundka
Ground Water Quality
at Village Madanpur
Khadar Sample Source ------- HP HP HP Depth in m ------- 10.0 13.0 8.0 pH 6.5-8.5 8.0 7.85 7.77 TDS (mg/l) 2000 1370 2410 1220 CO3 (mg/l) 200 Nil Nil Nil Cl (mg/l) 1000 337 566 254 SO4 (mg/l) 400 105 540 235 NO3 (mg/l) 100 38 32 42 F (mg/l) 1.5 0.01 2.8 0.49 Ca (mg/l) 200 36 58 125 Mg (mg/l) 100 28 89 40 Na (mg/l) 450 690 230 K (mg/l) 1.6 17 27 B (mg/l) 5.0 Nil 0.44 0.40 Total Hardness as CaCO3 (mg/l)
600 911 510 475
Total Coliform/100 ml
Not more than 50 per 100ml
42 14 22
Fecal Coliform/100ml
Should not be detectable in 100ml sample
Nil Nil Nil
Heavy Metals (Average concentrations of city blocks where these villages are present are being given due to absence of data for village level sampling of heavy metals) Cadmium (mg/l) 0.01 0.0003 0.0003 0.00085 Chromium (mg/l) 0.05 0.025 0.025 0.070 Copper (mg/l) 1.5 0.040 0.040 0.060 Lead (mg/l) 0.05 0.019 0.019 0.019 Iron (mg/l) 0.001 0.017 0.017 0.009 Zinc (mg/l) 0.015 0.001 0.001 0.001

147
Annexure 14: Test results of ground water meant for drinking at Wajidpur, Sheikhpur villages at Jajmau Sl No.
Parameters (Heavy Metals/ Pesticides)
Wajidpur (mg/L) ***
Sheikhpur (mg/L)
WHO* Standards (mg/L)
No of times greater/less than WHO Standards for Wajidpur
No of times greater/less than WHO Standards for Sheikhpur
Selective Potential health impact from ingestion of water
1. Arsenic Absent 0.64 0.01 NA** 64 Times
Skin damage or problems with circulatory systems and may have increased risk of cancer
2. Cadmium 1.56 Absent 0.003 520 Times NA Kidney damage
3. Mercury 0.11 0.12 0.001 110 Times 120 Times Neurological toxicant
4. Nickel 1.45 0.01 .05 72.5 Times Below WHO Limits
Increased risk of cancer
5. ChromiumVI 39.52 37.57 .05 790 Times 751 Times Increased risk of cancer
Alpha, Beta, Gamma BHC
0.013 Micro grams /Litre (Beta BHC only)
1.69Micro grams/ Litre (Alpha, Beta, Gamma BHC)
2 Micro grams/Litre
Below WHO Limits
Below WHO Limits
Liver or Kidney problems
Endosulphane Absent 0.22 Micro grams/Litre Banned NA NA Liver or Kidney
problems
6.
Dieldrin Absent 0.78Micro grams/Litre
.03 Micro grams/Litre NA 26 Times Liver or Kidney
problems

148
Sl No.
Parameters (Heavy Metals/ Pesticides)
Wajidpur (mg/L) ***
Sheikhpur (mg/L)
WHO* Standards (mg/L)
No of times greater/less than WHO Standards for Wajidpur
No of times greater/less than WHO Standards for Sheikhpur
Selective Potential health impact from ingestion of water
7. Sulphate 1327 1573.6 400**** 3.3 Times 3.9 Times Liver or Kidney problems
8. Nitrate 1200 6400 50 (Acute) 24 Times 128 Times Increased infant mortality (blue baby syndrome)
9. Chloride 1285.4 595.56 1000*** 1.28 Times Below WHO limits Liver or Kidney problems
*WHO: World Health Organisation **NA: Not Applicable *** mg/L: Milligram Per Litre **** Indian Standards

149
Annexure 15: Livelihood Impact Matrix of Case Study Areas: Ahmedabad S.N. Village Total
Households Surveyed
% Farmers
% Landless
Labourers
% Other
Occupations
Community Composition
Livelihood Impacts
1. Asamli 187 100 0 0 Baxi Panch, SC and others
20 years ago horticulture used to be the main produce. However, at present farmers have taken to growing paddy and wheat. They claim that with the water getting polluted, the fruit bearing capability of the orchards have reduced considerably over the years. Though initially continuous availability of water was seen as a blessing, prolonged use adversely impacted productivity. Income analysis of the period 2002 -2004 shows that income levels have fallen steadily
2. Bakrol 178 54 38 8 Baxi Panch, SC and others
Degradation of top soil has resulted in losses and non-profitable agricultural activity. The decline in yields has resulted in loss of income. Moreover, in around 8-10% of the surveyed households the livestock has been affected by diseases, mostly skin disorders
3. Chitrasar 168 60 30 10 Baxi Panch, SC and others
Yields having gone down over the years, income has also decreased steadily. 35% of the livestock population has been affected by diseases
4. Fatehpura 151 87 13 0 Baxi Panch, SC and others
Yields have also gone down here and the farmers are even robbed of the option of using clean water from bore wells as even the groundwater has been polluted. One major change in the cropping pattern has

150
S.N. Village Total Households Surveyed
% Farmers
% Landless
Labourers
% Other
Occupations
Community Composition
Livelihood Impacts
been the decline in the harvest of a second crop, cumin that used to fetch high prices. Moreover, due to the crops becoming easily vulnerable to pest attacks, the expenditure of pesticides have gone up dramatically. A major impact on the economy of the area has been a radical drop in milk production, which has been accompanied by miscarriages and animals aborting halfway through the gestation period
5. Gyaspur 289 39 55 6 Baxi Panch, SC and OBCs
Initially, the wastewater released from treatment plants was beneficial since it led to higher yields. However, with untreated wastewater and industrial effluents being mixed with treated wastewater, the change in the quality of water for the worse has affected productivity and brought down the income levels in the village. Unlike other villages, Gyaspur has vegetables as its major crop
6. Navapura 185 35 65 0 Mostly the thakore community
Adverse impacts on standing crops of vegetable, fodder, flowering plants, etc, and sudden drying of grain crops before harvest has impacted the income level but the variance is minimal
7. Saroda 219 29 61 10 SC, Baxi Panch, and others
Though crop withering without prior symptoms has been reported, it has not caused noticeable fluctuation in income levels. This perhaps may be due to the fact
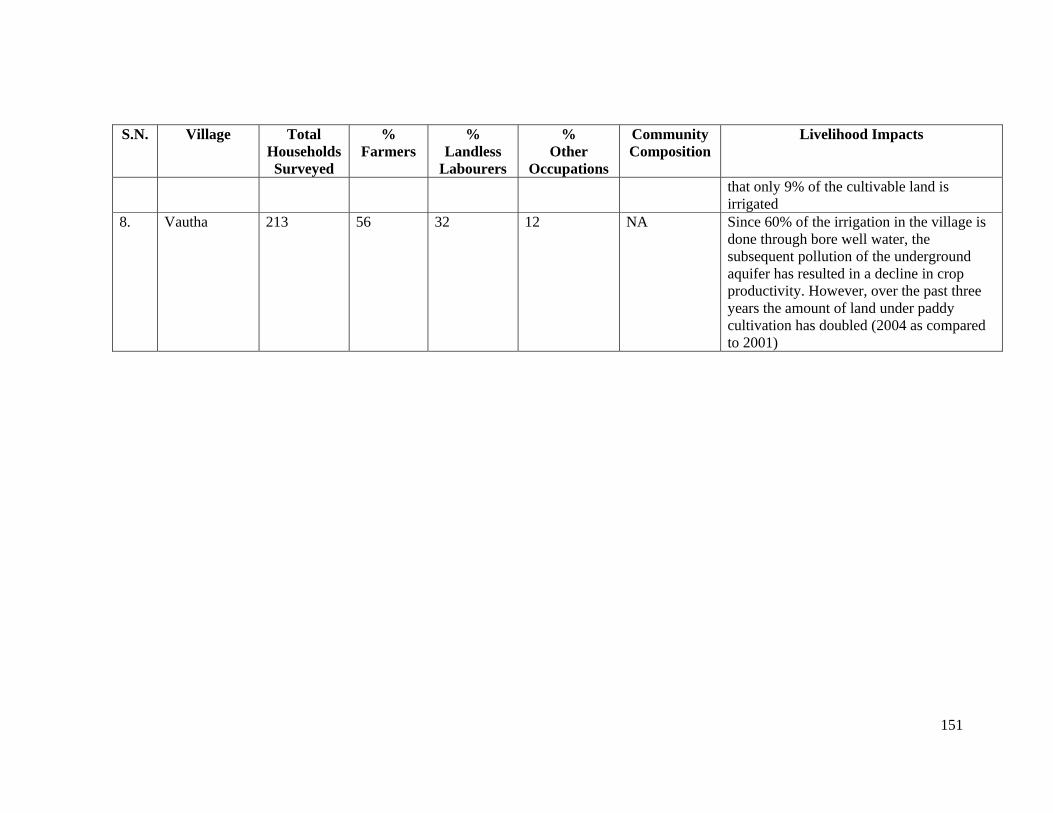
151
S.N. Village Total Households Surveyed
% Farmers
% Landless
Labourers
% Other
Occupations
Community Composition
Livelihood Impacts
that only 9% of the cultivable land is irrigated
8. Vautha 213 56 32 12 NA Since 60% of the irrigation in the village is done through bore well water, the subsequent pollution of the underground aquifer has resulted in a decline in crop productivity. However, over the past three years the amount of land under paddy cultivation has doubled (2004 as compared to 2001)

152
Annexure 16: Ownership Patterns of Sewage-fed Fisheries Type of Holding Percentage Private 93.14 Cooperative 0.86 Government 6.00
Note: These percentages are liable to quick changes since the private bheris are often joined as partnership or cooperatives. Many cooperatives are also taken up as private ones. Division and sub-division of bheris due to inheritance and/or any other disputes is very common.

153
Annexure 17: WHO Recommended Microbiological Quality Guidelines for Wastewater use in Agriculture
Category Reuse Condition
Exposed Group
Intestinal Nematodes (arithmetic mean, no. of
eggs per litre)
Faecal Coliforms (geometric
mean, no. of eggs per 100
ml)
Wastewater Treatment Expected to Achieve the Required
Microbiological Quality
A Irrigation of crops likely to be eaten uncooked, sports fields, public parks
Workers, consumers, public
≤1 ≤1000 A series of stabilization ponds designed to achieve the microbiological quality indicated or equivalent treatment
B Irrigation of cereal crops, industrial crops, fodder crops, pasture and trees
Workers ≤1 No standard recommended
Retention of stabilization ponds for 8-10 days or equivalent for helminth and faecal coliform removal
C Localized irrigation of crops in category B if exposure of workers and the public does not occur
None Not applicable
Not applicable
Pre-treatment as required by the irrigation technology, but not less than primary sedimentation
Source: WHO (1989)
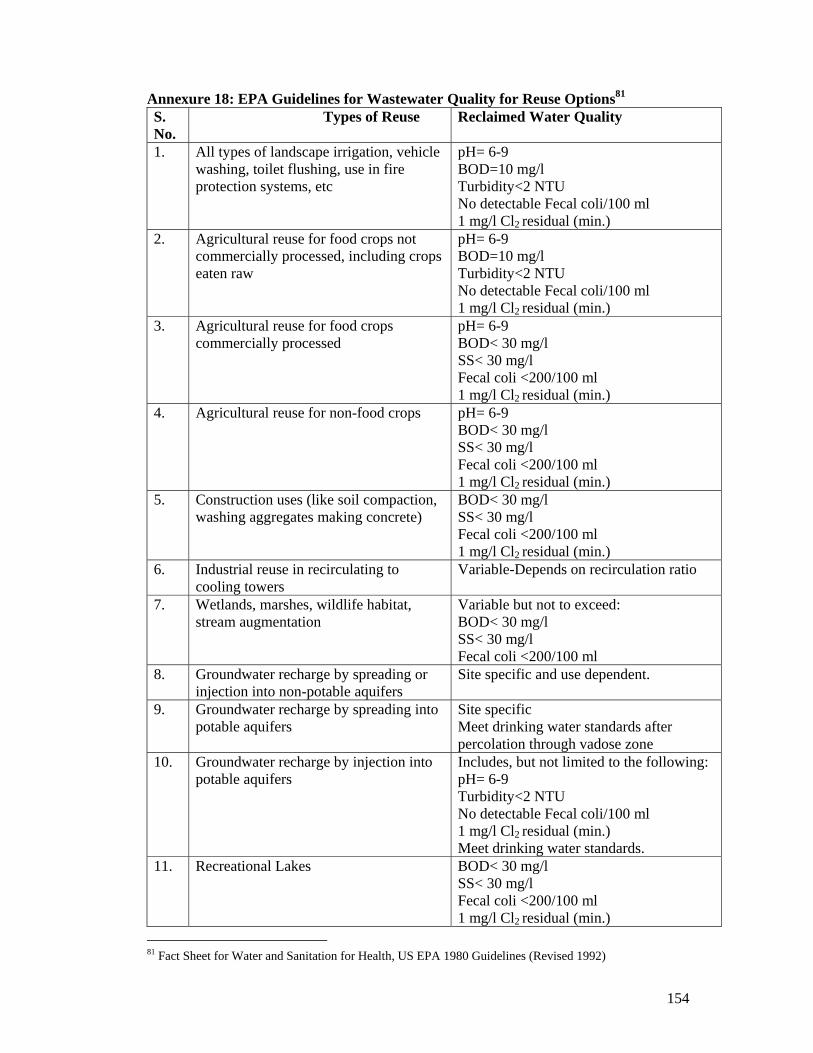
154
Annexure 18: EPA Guidelines for Wastewater Quality for Reuse Options81 S. No.
Types of Reuse Reclaimed Water Quality
1. All types of landscape irrigation, vehicle washing, toilet flushing, use in fire protection systems, etc
pH= 6-9 BOD=10 mg/l Turbidity<2 NTU No detectable Fecal coli/100 ml 1 mg/l Cl2 residual (min.)
2. Agricultural reuse for food crops not commercially processed, including crops eaten raw
pH= 6-9 BOD=10 mg/l Turbidity<2 NTU No detectable Fecal coli/100 ml 1 mg/l Cl2 residual (min.)
3. Agricultural reuse for food crops commercially processed
pH= 6-9 BOD< 30 mg/l SS< 30 mg/l Fecal coli <200/100 ml 1 mg/l Cl2 residual (min.)
4. Agricultural reuse for non-food crops pH= 6-9 BOD< 30 mg/l SS< 30 mg/l Fecal coli <200/100 ml 1 mg/l Cl2 residual (min.)
5. Construction uses (like soil compaction, washing aggregates making concrete)
BOD< 30 mg/l SS< 30 mg/l Fecal coli <200/100 ml 1 mg/l Cl2 residual (min.)
6. Industrial reuse in recirculating to cooling towers
Variable-Depends on recirculation ratio
7. Wetlands, marshes, wildlife habitat, stream augmentation
Variable but not to exceed: BOD< 30 mg/l SS< 30 mg/l Fecal coli <200/100 ml
8. Groundwater recharge by spreading or injection into non-potable aquifers
Site specific and use dependent.
9. Groundwater recharge by spreading into potable aquifers
Site specific Meet drinking water standards after percolation through vadose zone
10. Groundwater recharge by injection into potable aquifers
Includes, but not limited to the following: pH= 6-9 Turbidity<2 NTU No detectable Fecal coli/100 ml 1 mg/l Cl2 residual (min.) Meet drinking water standards.
11. Recreational Lakes BOD< 30 mg/l SS< 30 mg/l Fecal coli <200/100 ml 1 mg/l Cl2 residual (min.)
81 Fact Sheet for Water and Sanitation for Health, US EPA 1980 Guidelines (Revised 1992)

155
Annexure 19: Departments related to Water Supply in India
Name of Central Department Areas of Work Ministry of Water Resources Planning and Development of resource,
policy formulation and infrastructure report Ministry of Agriculture Watershed development and Irrigation Ministry of Power Hydropower development Ministry of Environment & Forests Water quality Ministry of Rural Development Watershed development and drinking water
provision Ministry of Industry Industrial uses of water Ministry of Urban Development Urban drinking water provision and
sanitation Central Pollution Control Board Water quality monitoring Indian council of Agricultural Research Development of water management
techniques

156
Annexure 20: Plan Outlays on Urban Water Supply and Sanitation in India (current price in Rs Billion)
Plan Period Total Outlay Plan Urban Water
Supply & Sanitation
As % of Total Outlay
First Plan 33.59 0.43 1.28 Second Plan 67.69 0.44 .65 Third Plan 85.93 0.89 1.04 3 Annual Plans - - - Fourth Plan 159.32 2.82 1.77 Fifth Plan 392.46 5.49 1.40 Annual Plan 125.27 1.98 1.58 Sixth Plan 976.07 17.67 1.81 Seventh Plan 1797.42 29.66 1.65 2 Annual Plans 1366.17 17.21 1.26 Eighth Plan 4332.84 59.82 1.38 Ninth Plan 7800 117.00 1.50
Source: India – Water Resource Management Sector Review (World Bank Study)
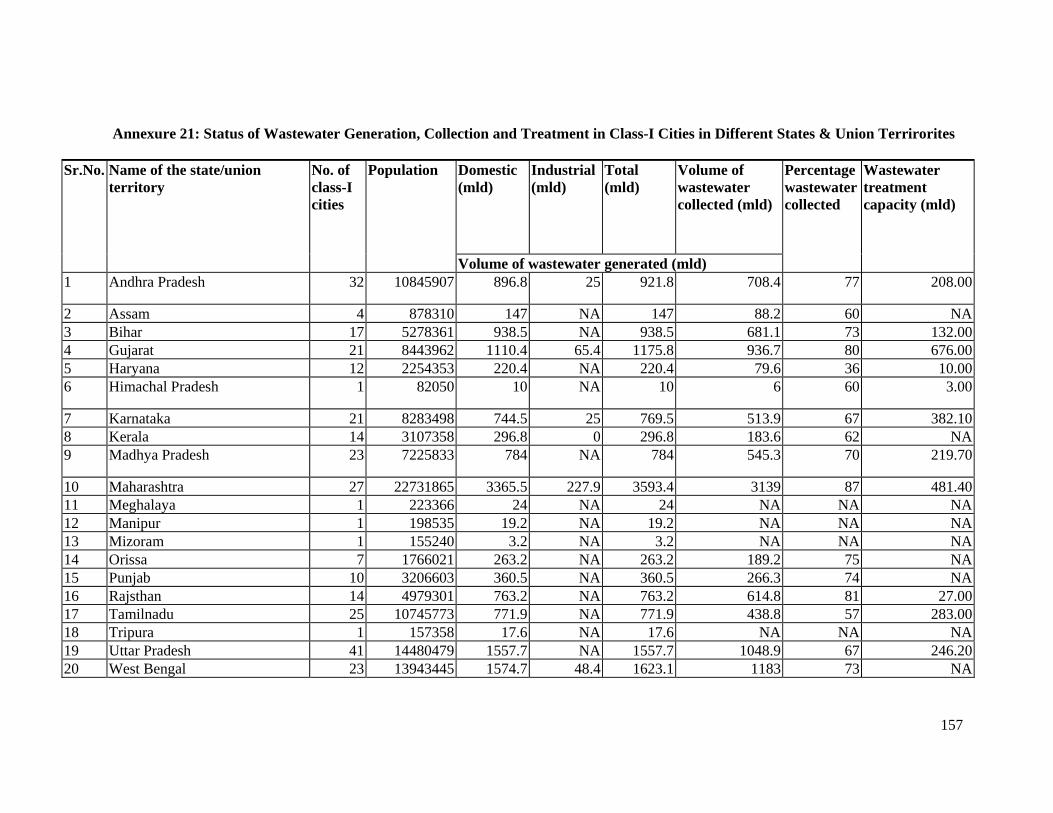
157
Annexure 21: Status of Wastewater Generation, Collection and Treatment in Class-I Cities in Different States & Union Terrirorites
Domestic (mld)
Industrial (mld)
Total (mld)
Volume of wastewater collected (mld)
Sr.No. Name of the state/union territory
No. of class-I cities
Population
Volume of wastewater generated (mld)
Percentage wastewater collected
Wastewater treatment capacity (mld)
1 Andhra Pradesh 32 10845907 896.8 25 921.8 708.4 77 208.00
2 Assam 4 878310 147 NA 147 88.2 60 NA3 Bihar 17 5278361 938.5 NA 938.5 681.1 73 132.004 Gujarat 21 8443962 1110.4 65.4 1175.8 936.7 80 676.005 Haryana 12 2254353 220.4 NA 220.4 79.6 36 10.006 Himachal Pradesh 1 82050 10 NA 10 6 60 3.00
7 Karnataka 21 8283498 744.5 25 769.5 513.9 67 382.108 Kerala 14 3107358 296.8 0 296.8 183.6 62 NA9 Madhya Pradesh 23 7225833 784 NA 784 545.3 70 219.70
10 Maharashtra 27 22731865 3365.5 227.9 3593.4 3139 87 481.4011 Meghalaya 1 223366 24 NA 24 NA NA NA12 Manipur 1 198535 19.2 NA 19.2 NA NA NA13 Mizoram 1 155240 3.2 NA 3.2 NA NA NA14 Orissa 7 1766021 263.2 NA 263.2 189.2 75 NA15 Punjab 10 3206603 360.5 NA 360.5 266.3 74 NA16 Rajsthan 14 4979301 763.2 NA 763.2 614.8 81 27.0017 Tamilnadu 25 10745773 771.9 NA 771.9 438.8 57 283.0018 Tripura 1 157358 17.6 NA 17.6 NA NA NA19 Uttar Pradesh 41 14480479 1557.7 NA 1557.7 1048.9 67 246.2020 West Bengal 23 13943445 1574.7 48.4 1623.1 1183 73 NA

158
Domestic (mld)
Industrial (mld)
Total (mld)
Volume of wastewater collected (mld)
Sr.No. Name of the state/union territory
No. of class-I cities
Population
Volume of wastewater generated (mld)
Percentage wastewater collected
Wastewater treatment capacity (mld)
21 Chandigarh 1 504094 217.9 NA 217.9 45.4 21 90.8022 Pondichery 1 203069 24 NA 24 NA NA NA23 Delhi 1 8419084 2160 NA 2160 1270 59 1270.0 Total 299 128113865 16271 391.7 16662.7 11938.2 72 4029.20

159
Annexure 22: Details of Sewage Farming in Class-I Cities Sr.No. Name of the
class-I city Quantity of wastewater
collected (mld)
Quantity of wastewater supplied to
sewage farms (mld)
Land used for sewage
forming (ha)
Cost of sewage (Rupees /ha/year)
Total annual Income
1 Ahmedabad 445.00 NA NA NA NA2 Anand 10.40 2.60 20.00 NA NA3 Bangalore 300.00 NA NA NA NA4 Bhagalpur 30.00 8.00 60.00 NA NA5 Bhopal 95.00 13.60 44.50 30.60 1,362.006 Bombay 2210.00 20.00 NA NA NA7 Calcutta 1075.00 817.00 NA NA NA8 Chandigarh 209.80 136.20 1000.00 NA NA9 Coimbatore 46.00 NA NA NA NA10 Delhi 1270.00 NA NA NA NA11 Gandhi Nagar 43.50 41.86 500.00 100.00 50,000.0012 Hyderabad 288.00 40.00 1,085.00 75.00 80,400.0013 Indore 118.00 127.30 546.00 200.00 109,200.0014 Jaipur 165.00 22.70 200.00 400.00 80,000.0015 Kanpur 150.00 NA NA NA NA16 Kochi 46.00 NA NA NA NA17 Lucknow 80.00 NA NA NA NA18 Ludhiana 47.00 NA NA NA NA19 Madras 257.00 10.00 8.00 NA NA20 Madurai 40.00 NA NA NA NA21 Nadiad 10.00 2.00 140.00 80.00 11,200.0022 Nagpur 168.00 NA 49.00 NA NA23 Patna 184.00 NA 34.40 NA NA24 Pune 367.00 80.00 NA NA NA25 Rajkot 48.70 40.00 1,000.00 NA NA26 Surat 112.00 1.30 2.60 NA NA27 Tiruchirapalli 52.70 8.00 2.30 NA NA28 Tirunelveli 44.80 18.00 184.00 NA NA29 Tuticorin 1.20 1.00 13.46 NA NA30 Vadodara 105.00 20.00 1,000.00 120.00 120000.0031 Varanasi 127.00 82.00 1,020.00 148.00 15122.0032 Visakhapatnam 55.00 NA NA NA NA Total 8,201.10 1,491.56 6,909.26 467,284.00
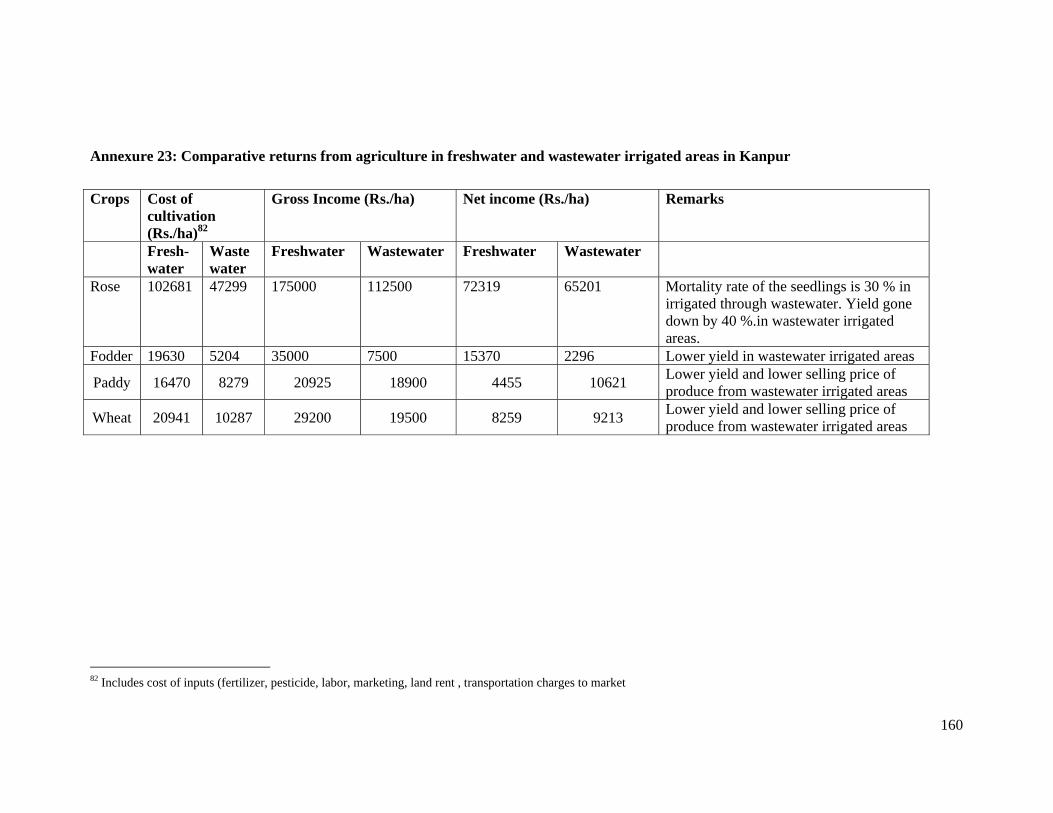
160
Annexure 23: Comparative returns from agriculture in freshwater and wastewater irrigated areas in Kanpur
Crops Cost of cultivation (Rs./ha)82
Gross Income (Rs./ha) Net income (Rs./ha) Remarks
Fresh-water
Wastewater
Freshwater Wastewater Freshwater Wastewater
Rose 102681 47299 175000 112500 72319 65201 Mortality rate of the seedlings is 30 % in irrigated through wastewater. Yield gone down by 40 %.in wastewater irrigated areas.
Fodder 19630 5204 35000 7500 15370 2296 Lower yield in wastewater irrigated areas
Paddy 16470 8279 20925 18900 4455 10621 Lower yield and lower selling price of produce from wastewater irrigated areas
Wheat 20941 10287 29200 19500 8259 9213 Lower yield and lower selling price of produce from wastewater irrigated areas
82 Includes cost of inputs (fertilizer, pesticide, labor, marketing, land rent , transportation charges to market
Copyright © 2022 FDOKUMEN