9. Water and Wastewater Systems - NIST
32
DISASTER RESILIENCE FRAMEWORK 75% Draft for San Diego CA Workshop 11 February, 2015 Water and Wastewater Systems, Introduction Chapter 9, Page 1 of 32 9. Water and Wastewater Systems 1 9.1. Introduction 2 Water and wastewater systems represent essential infrastructure for sustaining the economic and social 3 viability of a community. Although these systems provide basic public health and safety to homes, 4 businesses, and industry, they are often taken for granted because of the high level of service and 5 reliability provided by water and wastewater utilities. The importance of these systems is not recognized 6 until a water main break or other disruption in service occurs. This chapter addresses disaster resilience of 7 public water and wastewater systems. 8 While some utilities are already taking steps to improve the resilience of their systems, capital 9 improvement programs and many others often focus on performing emergency repairs, increasing system 10 capacity to meet population growth, or making system improvements to satisfy public health and 11 environmental regulations. Replacing buried pipelines is often delayed until water main breaks become 12 frequent or wastewater pipeline groundwater infiltration rates create excessive demand on the treatment 13 system. Communities have a perfect opportunity to couple resilience with future/planned retrofits or 14 replacements of old infrastructure, to improve the resilience of water and wastewater infrastructure. This 15 chapter focuses on the water and wastewater infrastructure itself. However, the water and wastewater 16 industry faces challenges beyond just the infrastructure performance. Water quality and environmental 17 impact are two of the biggest concerns. For example, if water of poor quality is delivered to customers, 18 there is significant risk that the public may become ill from consumption. The wastewater industry 19 operates within strict environmental constraints that have and will likely continue to become more 20 stringent. These restrictions prevent excessive pollution that contribute to environmental damage and, 21 ultimately, impact the health of the humans and animals. Although this chapter touches on such 22 challenges, its main focus is how to build a more resilient infrastructure system that will deliver good 23 quality water with fewer disruptions and limit damage to wastewater systems, making spills less frequent. 24 9.1.1. Social Needs and Systems Performance Goals 25 Water services are essential to our daily lives. Using USGS data, Aubuchon & Morley (2012) calculated 26 the average consumption of water across all U.S. states to be 98 gallons per person per day. However, 27 water consumption varies by community and by customer. Personal uses include water for drinking and 28 cooking, personal hygiene, flushing toilets, laundry, landscape irrigation, and many others. Many 29 businesses and industries also depend on a continual supply of potable water and wastewater collection 30 services. Absent functioning drinking water and wastewater systems, the operation of restaurants, child 31 care facilities, hotels, medical offices, food processing plants, paper mills, etc., significantly 32 compromised, if not completely impossible. Additionally, water systems in urban and suburban areas 33 provide water supply for fire suppression. Chapter 2 discusses this societal dependence on water and 34 wastewater systems and other infrastructure systems in more detail. 35 In the United States, communities generally accommodate to short-term (on the order of a few days) 36 disruptions in water and wastewater services resulting from man-made or natural hazard events. However, 37 longer-term disruptions are less tolerable. The Oregon Resilience Plan (OSSPAC, 2013) indicated a 38 business that cannot reoccupy facilities (including functioning water and wastewater systems) within one 39 month would be forced to move or dissolve. This timeline likely varies depending on community needs 40 and the severity of the event. Water and wastewater utility providers need to work with customers and 41 regulatory agencies to establish realistic performance goals for post-disaster level of service, evaluate 42 their systems’ status in relation to those goals, and then develop strategies to close the identified resilience 43 gaps. Flow, pressure, and water quality should be considered in those performance goals. 44
-
Upload
khangminh22 -
Category
Documents
-
view
6 -
download
0
Transcript of 9. Water and Wastewater Systems - NIST

DISASTER RESILIENCE FRAMEWORK
75% Draft for San Diego CA Workshop
11 February, 2015
Water and Wastewater Systems, Introduction
Chapter 9, Page 1 of 32
9. Water and Wastewater Systems 1
9.1. Introduction 2
Water and wastewater systems represent essential infrastructure for sustaining the economic and social 3 viability of a community. Although these systems provide basic public health and safety to homes, 4 businesses, and industry, they are often taken for granted because of the high level of service and 5 reliability provided by water and wastewater utilities. The importance of these systems is not recognized 6 until a water main break or other disruption in service occurs. This chapter addresses disaster resilience of 7 public water and wastewater systems. 8
While some utilities are already taking steps to improve the resilience of their systems, capital 9 improvement programs and many others often focus on performing emergency repairs, increasing system 10 capacity to meet population growth, or making system improvements to satisfy public health and 11 environmental regulations. Replacing buried pipelines is often delayed until water main breaks become 12 frequent or wastewater pipeline groundwater infiltration rates create excessive demand on the treatment 13 system. Communities have a perfect opportunity to couple resilience with future/planned retrofits or 14 replacements of old infrastructure, to improve the resilience of water and wastewater infrastructure. This 15 chapter focuses on the water and wastewater infrastructure itself. However, the water and wastewater 16 industry faces challenges beyond just the infrastructure performance. Water quality and environmental 17 impact are two of the biggest concerns. For example, if water of poor quality is delivered to customers, 18 there is significant risk that the public may become ill from consumption. The wastewater industry 19 operates within strict environmental constraints that have and will likely continue to become more 20 stringent. These restrictions prevent excessive pollution that contribute to environmental damage and, 21 ultimately, impact the health of the humans and animals. Although this chapter touches on such 22 challenges, its main focus is how to build a more resilient infrastructure system that will deliver good 23 quality water with fewer disruptions and limit damage to wastewater systems, making spills less frequent. 24
9.1.1. Social Needs and Systems Performance Goals 25
Water services are essential to our daily lives. Using USGS data, Aubuchon & Morley (2012) calculated 26 the average consumption of water across all U.S. states to be 98 gallons per person per day. However, 27 water consumption varies by community and by customer. Personal uses include water for drinking and 28 cooking, personal hygiene, flushing toilets, laundry, landscape irrigation, and many others. Many 29 businesses and industries also depend on a continual supply of potable water and wastewater collection 30 services. Absent functioning drinking water and wastewater systems, the operation of restaurants, child 31 care facilities, hotels, medical offices, food processing plants, paper mills, etc., significantly 32 compromised, if not completely impossible. Additionally, water systems in urban and suburban areas 33 provide water supply for fire suppression. Chapter 2 discusses this societal dependence on water and 34 wastewater systems and other infrastructure systems in more detail. 35
In the United States, communities generally accommodate to short-term (on the order of a few days) 36 disruptions in water and wastewater services resulting from man-made or natural hazard events. However, 37 longer-term disruptions are less tolerable. The Oregon Resilience Plan (OSSPAC, 2013) indicated a 38 business that cannot reoccupy facilities (including functioning water and wastewater systems) within one 39 month would be forced to move or dissolve. This timeline likely varies depending on community needs 40 and the severity of the event. Water and wastewater utility providers need to work with customers and 41 regulatory agencies to establish realistic performance goals for post-disaster level of service, evaluate 42 their systems’ status in relation to those goals, and then develop strategies to close the identified resilience 43 gaps. Flow, pressure, and water quality should be considered in those performance goals. 44
DISASTER RESILIENCE FRAMEWORK
75% Draft for San Diego CA Workshop
11 February, 2015
Water and Wastewater Systems, Introduction
Chapter 9, Page 2 of 32
9.1.2. Interdependencies 45
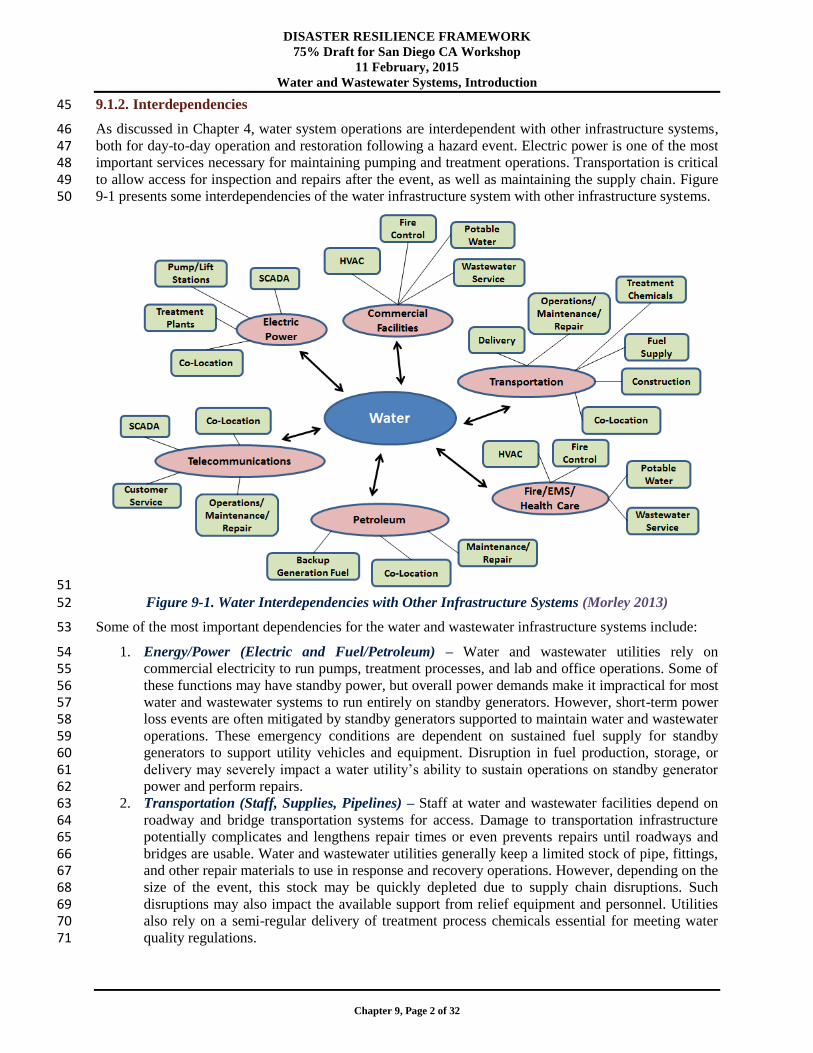
As discussed in Chapter 4, water system operations are interdependent with other infrastructure systems, 46 both for day-to-day operation and restoration following a hazard event. Electric power is one of the most 47 important services necessary for maintaining pumping and treatment operations. Transportation is critical 48 to allow access for inspection and repairs after the event, as well as maintaining the supply chain. Figure 49 9-1 presents some interdependencies of the water infrastructure system with other infrastructure systems. 50
51 Figure 9-1. Water Interdependencies with Other Infrastructure Systems (Morley 2013) 52
Some of the most important dependencies for the water and wastewater infrastructure systems include: 53
1. Energy/Power (Electric and Fuel/Petroleum) – Water and wastewater utilities rely on 54 commercial electricity to run pumps, treatment processes, and lab and office operations. Some of 55 these functions may have standby power, but overall power demands make it impractical for most 56 water and wastewater systems to run entirely on standby generators. However, short-term power 57 loss events are often mitigated by standby generators supported to maintain water and wastewater 58 operations. These emergency conditions are dependent on sustained fuel supply for standby 59 generators to support utility vehicles and equipment. Disruption in fuel production, storage, or 60 delivery may severely impact a water utility’s ability to sustain operations on standby generator 61 power and perform repairs. 62
2. Transportation (Staff, Supplies, Pipelines) – Staff at water and wastewater facilities depend on 63 roadway and bridge transportation systems for access. Damage to transportation infrastructure 64 potentially complicates and lengthens repair times or even prevents repairs until roadways and 65 bridges are usable. Water and wastewater utilities generally keep a limited stock of pipe, fittings, 66 and other repair materials to use in response and recovery operations. However, depending on the 67 size of the event, this stock may be quickly depleted due to supply chain disruptions. Such 68 disruptions may also impact the available support from relief equipment and personnel. Utilities 69 also rely on a semi-regular delivery of treatment process chemicals essential for meeting water 70 quality regulations. 71
DISASTER RESILIENCE FRAMEWORK
75% Draft for San Diego CA Workshop
11 February, 2015
Water and Wastewater Systems, Water and Wastewater Infrastructure
Chapter 9, Page 3 of 32
Water and wastewater buried pipelines are often co-located with other buried infrastructure under 72 or adjacent to roadways. Failure of pipelines may result in damage to the roadway (e.g., sinkhole 73 from water main break or collapsed sewer pipeline) and impact to traffic during repairs. 74 Therefore, the transportation system, particularly the roadway system, is dependent on the 75 performance of the water and wastewater infrastructure systems. 76
3. Communications and Information – Water and wastewater utilities often rely on cellular 77 networks to communicate to operations staff and contractors. If the cellular network is down for 78 an extended period, complications and delays in repairs can occur. Additionally, supervisory 79 control and data acquisition (SCADA) networks are used extensively within both water and 80 wastewater systems to monitor and control widespread components and equipment. 81
The communications system infrastructure also depends on water infrastructure. For example, air 82 conditioning system cooling towers that support communications require water to keep sensitive 83 electronic equipment in Central Offices at safe operating temperatures. Furthermore, technicians 84 cannot enter Central Offices to maintain or repair functionality of the communications system if 85 its water and wastewater systems are not functioning. 86
4. Buildings (Critical, Commercial, General Public) – Water and wastewater utilities rely on 87 customers (e.g., critical facilities, commercial facilities, and households) to pay bills as a 88 continued source of capital. Utilities will potentially experience significant capital expenditures in 89 the aftermath of a disaster and customers may not have the ability to pay bills (i.e., loss of 90 personal income from loss of wages or breakdown of electronic or posted payments), placing a 91 large financial burden on the utilities. Water and wastewater utilities also operate administrative 92 buildings. New Orleans Water & Sewer Board’s treatment, distribution, collection, and 93 administrative operations were severely impacted following Hurricane Katrina. The 94 administration’s disruptions included the loss of customer billing and other records due to 95 significant flooding. During this same event, Children’s Hospital of New Orleans was forced to 96 evacuate when the hospital lost water pressure and was unable to maintain the HVAC system 97 needed by patients in critical care units. 98
Commercial and other public buildings need water supply with adequate flow and pressure for 99 fire suppression, as well as sanitation. Industrial facilities need functional water and wastewater 100 systems for developing, processing, and manufacturing materials and products. The public relies 101 on water and wastewater services for overall health of the community. 102
9.2. Water and Wastewater Infrastructure 103
This section describes basic components of water and wastewater systems. Performance observations 104 from past disaster events characterize some key hazard vulnerabilities in water and wastewater systems. 105 Water and wastewater infrastructure are vulnerable to a number of hazards: buried pipelines are 106 vulnerable to breaks during earthquakes, water and wastewater treatment facilities are vulnerable to flood 107 hazards. Facilities are often designed to be in or near flood hazard areas, given their functional 108 dependency on natural water resources. To become more resilient, each individual community will have 109 to consider its own hazards when implementing plans. Additionally, as discussed in the previous section, 110 system interdependencies (e.g., loss of commercial electrical power in a high wind event) can have a 111 significant impact on operability of water and wastewater systems (Elliott, T. and Tang, A., 2009). 112
9.2.1. Water Infrastructure 113
Water sources include groundwater and surface water, treated to satisfy public health standards and 114 distributed to consumers by a network of pipelines. Some water utilities have their own supplies and 115 treatment infrastructure, while others buy wholesale water from neighboring agencies. 116
Water systems are composed of six general infrastructure categories: 1) Supply, 2) Transmission, 3) 117 Treatment, 4) Pumping, 5) Storage, and 6) Distribution. The basic function of each category and 118
DISASTER RESILIENCE FRAMEWORK
75% Draft for San Diego CA Workshop
11 February, 2015
Water and Wastewater Systems, Water and Wastewater Infrastructure
Chapter 9, Page 4 of 32
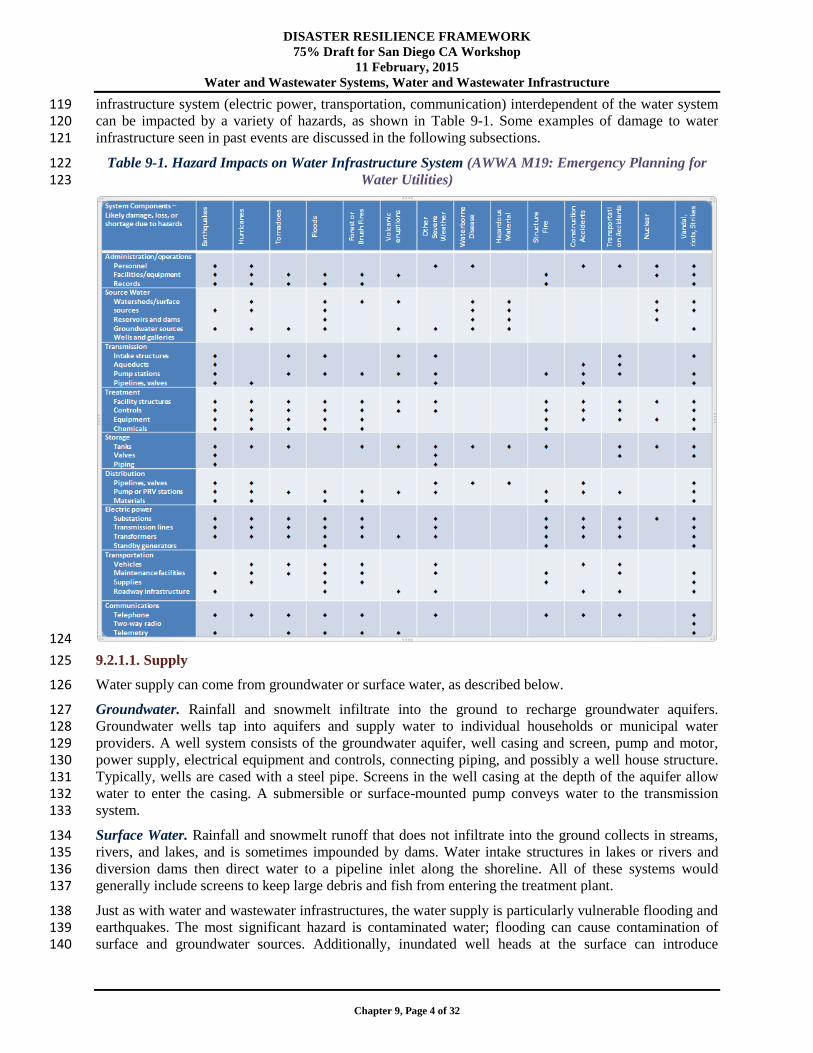
infrastructure system (electric power, transportation, communication) interdependent of the water system 119 can be impacted by a variety of hazards, as shown in Table 9-1. Some examples of damage to water 120 infrastructure seen in past events are discussed in the following subsections. 121
Table 9-1. Hazard Impacts on Water Infrastructure System (AWWA M19: Emergency Planning for 122 Water Utilities) 123
124
9.2.1.1. Supply 125
Water supply can come from groundwater or surface water, as described below. 126
Groundwater. Rainfall and snowmelt infiltrate into the ground to recharge groundwater aquifers. 127 Groundwater wells tap into aquifers and supply water to individual households or municipal water 128 providers. A well system consists of the groundwater aquifer, well casing and screen, pump and motor, 129 power supply, electrical equipment and controls, connecting piping, and possibly a well house structure. 130 Typically, wells are cased with a steel pipe. Screens in the well casing at the depth of the aquifer allow 131 water to enter the casing. A submersible or surface-mounted pump conveys water to the transmission 132 system. 133
Surface Water. Rainfall and snowmelt runoff that does not infiltrate into the ground collects in streams, 134 rivers, and lakes, and is sometimes impounded by dams. Water intake structures in lakes or rivers and 135 diversion dams then direct water to a pipeline inlet along the shoreline. All of these systems would 136 generally include screens to keep large debris and fish from entering the treatment plant. 137
Just as with water and wastewater infrastructures, the water supply is particularly vulnerable flooding and 138 earthquakes. The most significant hazard is contaminated water; flooding can cause contamination of 139 surface and groundwater sources. Additionally, inundated well heads at the surface can introduce 140

DISASTER RESILIENCE FRAMEWORK
75% Draft for San Diego CA Workshop
11 February, 2015
Water and Wastewater Systems, Water and Wastewater Infrastructure
Chapter 9, Page 5 of 32
contaminants to well systems and groundwater. Floodwaters and generally carry contaminants like 141 petroleum, nutrient/organic matter, bacteria, protozoa, and mold spores that pose significant health risks. 142 Contamination can also result from tank or vehicle discharge in the watershed. In 2014, in West Virginia, 143 4-methylcyclohexanemethanol (MCHM) was released into the Elk River, contaminating water serving 144 300,000 people. It took months to restore full water service. 145
Although not often considered for their impact on water quality, wildfires can also lead to water 146 contamination. Wildfires can burn watersheds, destabilizing the ground cover, which can cause landslides 147 that contaminate the water when subsequent rains occur. Denver Water experienced wildfires in 148 significant parts of their watershed in 1996 and 2002 that burned 150,000 acres of land, releasing one 149 million cubic yards of sediment into one of their reservoirs. 150
Reservoirs behind dams often also serve as water supply features, but dam failure can present a secondary 151 hazard in the wake of earthquakes, heavy rainfall, and flood events. Concentrated precipitation and 152 flooding most commonly causes overtopping of the dam. While dams can reduce flooding, older and 153 improperly designed and maintained dams are not equipped to contain large volumes of quickly 154 accumulating water runoff. Landslides, caused by liquefaction from earthquakes can also lead to dam 155 failure. These types of dam failures are rare, but present a significant risk to anyone’s life downstream of 156 a dam. Dams are critical infrastructure components that need to be designed to withstand extreme events. 157
9.2.1.2. Transmission 158
Large diameter transmission pipelines carry raw water 159 from source to treatment plant, and treated water to 160 storage facilities before branching out into smaller 161 distribution pipelines. Depending on the system, these 162 can range from one foot to several tens of feet in 163 diameter. Transmission pipelines are constructed of 164 welded steel, reinforced concrete, concrete cylinder, or 165 ductile iron (historically cast iron). 166
Typically, these pipelines are buried, making them 167 difficult to inspect and expensive and disruptive to 168 repair. Burial reduces pipelines’ vulnerability to 169 hazards, such as high wind events; however, hazards 170 that cause landslides, such as earthquakes, floods, 171 long-term heavy rain, and wildfire, can damage 172 transmission lines. Figure 9-2 shows a transmission 173 pipeline bridge demolished in the Bull Run Canyon in 174 a landslide event induced by heavy rains. 175
9.2.1.3. Treatment 176
Water treatment plants process raw water from groundwater or surface water supplies to meet public 177 health water quality standards and often to improve taste. The processes used depend on the raw water 178 source, removing pathogens, organic or inorganic contaminants, chemicals, and turbidity. The treatment 179 process commonly includes pretreatment, flocculation, sedimentation, filtration, and disinfection with 180 variations of these processes in some modern plants. Water treatment plants typically consist of a number 181 of process tanks, yard and plant piping, pumps, chemical storage and feed equipment, lab and office 182 building space, and associated mechanical, electrical, and control equipment. 183
Water treatment plants are vulnerable to flooding, because they are often located near flooding sources 184 (i.e., lakes, rivers). Electrical control systems are often damaged by flood inundation, leading to loss of 185 functionality and service outages. In 1991, the Des Moines, Iowa Water Treatment Plant was submerged 186 by riverine flooding, resulting in 19 days without potable water for the city of Des Moines. 187
Figure 9-2. Water Transmission Pipeline Bridge
Damaged by Landslide (Courtesy of Portland
Water Bureau)

DISASTER RESILIENCE FRAMEWORK
75% Draft for San Diego CA Workshop
11 February, 2015
Water and Wastewater Systems, Water and Wastewater Infrastructure
Chapter 9, Page 6 of 32
Loss of power at water treatment plants from high wind events (hurricanes, tornadoes), severe storms, or 188 other hazards can severely impact the system by preventing proper treatment prior to transmission and 189 distribution. As a result, potable water may not be available and boil water notices necessary. While 190 standby power systems are usually incorporated into a water treatment plant’s design, they need to be 191 well-maintained, tested regularly, and adequately connected, installed, supplied, and protected from 192 hazard events to be reliable and function properly. 193
Earthquakes also cause damage to water treatment plants and their components. In 1989, the Loma Prieta 194 earthquake in California heavily damaged the clarifiers due to sloshing water at the Rinconada Water 195 Treatment Plant in San Jose, California, greatly curtailing its 40 MGD capacity (Figure 9-3). In the 2011 196 Tohoku earthquake in Japan, liquefaction resulted in differential settlement between pile-supported 197 structures and direct-buried pipe at water treatment plants, as shown in Figure 9-4. 198
Figure 9-3. Santa Clara Valley Water District,
Rinconada Water Treatment Plant Clarifier
Launders Damaged due to Sloshing, 1989 Loma
Prieta Earthquake (Courtesy of Don Ballantyne)
Figure 9-4. Liquefaction Caused Differential Settlement
Between Pile-Supported Structures and Buried Pipe
during the 2011 Tohoku Earthquake (Courtesy of Don
Ballantyne)
9.2.1.4. Pumping 199
Pumping stations increase hydraulic head (i.e., raise water from one elevation to a higher elevation). A 200 pump station typically consists of a simple building that houses pumps, motors that power the pumps, 201 pipes, valves, and associated mechanical, electrical, and control equipment. Pump stations often have 202 standby emergency generators to enable continued operation when commercial power supply is 203 interrupted. 204
Similarly to water treatment plants, loss of 205 commercial electrical power due to any type of 206 hazard event prevents operation of pumps if there 207 is no standby power supply. Furthermore, 208 floodwater can inundate electrical equipment and 209 controls at pump stations located wholly or 210 partially below grade and/or in flood-prone areas. 211 Figure 9-5 shows a pump station adjacent to the 212 Missouri River damaged by flood inundation. 213
9.2.1.5. Storage 214
Water utilities use storage tanks and reservoirs to 215 balance water demand with water production 216 capacity. Stored potable water is drawn down 217 during times of peak usage and recharged during 218 off-peak hours. Typically, one to three days of 219
Figure 9-5. Bismarck, ND Pump Station Damaged by
Flood Inundation from Adjacent Missouri River
(Courtesy of FEMA)
DISASTER RESILIENCE FRAMEWORK
75% Draft for San Diego CA Workshop
11 February, 2015
Water and Wastewater Systems, Water and Wastewater Infrastructure
Chapter 9, Page 7 of 32
daily water demand is stored to satisfy increased demand from fire suppression or other emergency needs. 220 Reservoirs are often constructed by damning a valley with a concrete or earthen dam. If they are being 221 used for treated water, they can be lined with asphalt or concrete and covered. 222
Modern steel storage tanks are either ground-supported, taller standpipes, or elevated tanks supported on a 223 frame or pedestal. Reinforced concrete tanks are typically at grade or buried. Circular concrete tanks can 224 be reinforced with wire wrapping or tendons. 225
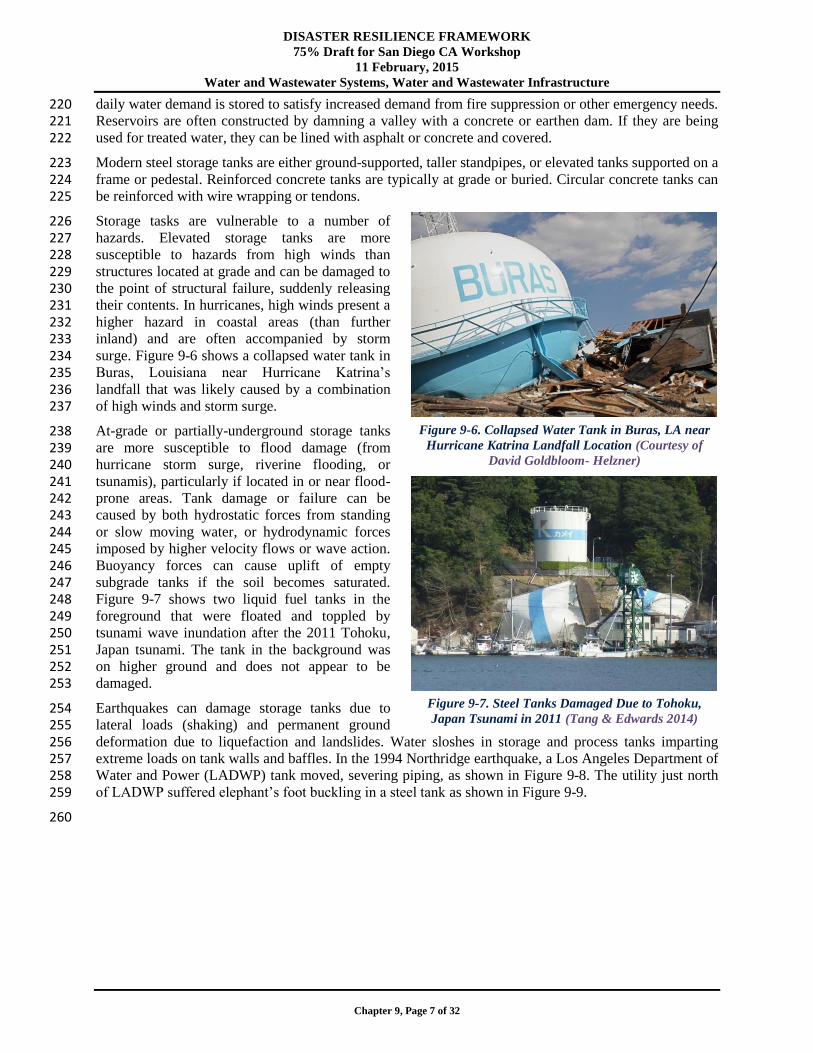
Storage tasks are vulnerable to a number of 226 hazards. Elevated storage tanks are more 227 susceptible to hazards from high winds than 228 structures located at grade and can be damaged to 229 the point of structural failure, suddenly releasing 230 their contents. In hurricanes, high winds present a 231 higher hazard in coastal areas (than further 232 inland) and are often accompanied by storm 233 surge. Figure 9-6 shows a collapsed water tank in 234 Buras, Louisiana near Hurricane Katrina’s 235 landfall that was likely caused by a combination 236 of high winds and storm surge. 237
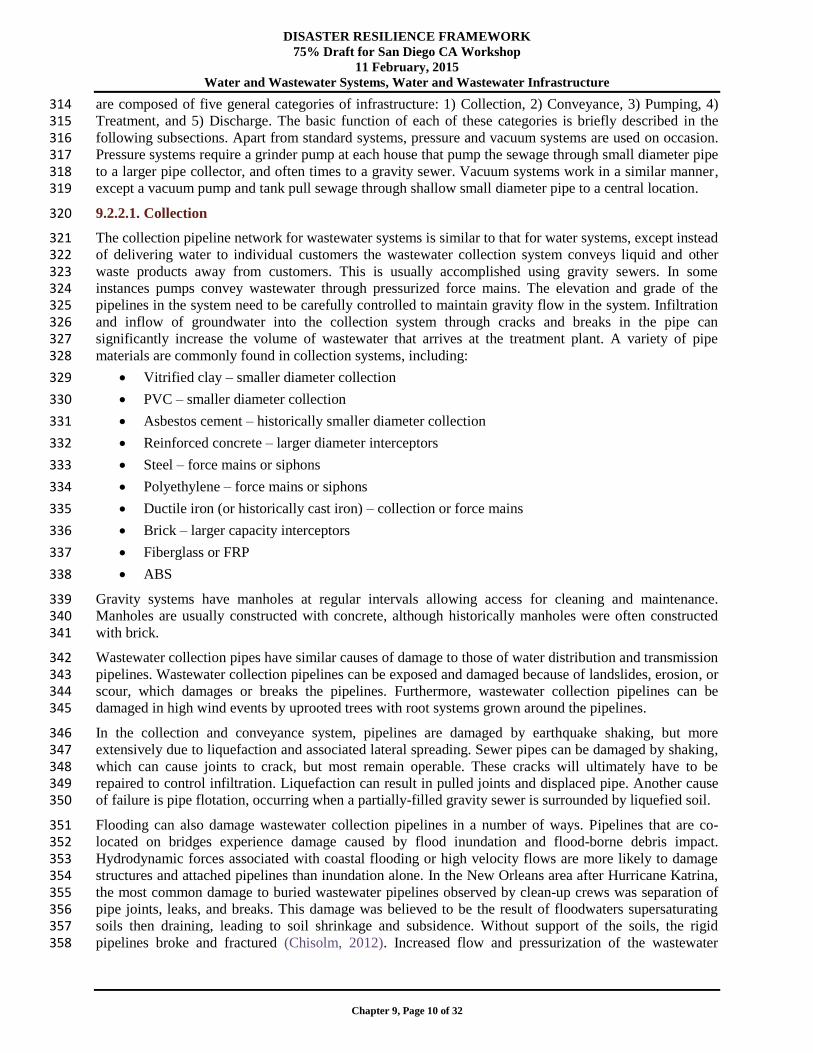
At-grade or partially-underground storage tanks 238 are more susceptible to flood damage (from 239 hurricane storm surge, riverine flooding, or 240 tsunamis), particularly if located in or near flood-241 prone areas. Tank damage or failure can be 242 caused by both hydrostatic forces from standing 243 or slow moving water, or hydrodynamic forces 244 imposed by higher velocity flows or wave action. 245 Buoyancy forces can cause uplift of empty 246 subgrade tanks if the soil becomes saturated. 247 Figure 9-7 shows two liquid fuel tanks in the 248 foreground that were floated and toppled by 249 tsunami wave inundation after the 2011 Tohoku, 250 Japan tsunami. The tank in the background was 251 on higher ground and does not appear to be 252 damaged. 253
Earthquakes can damage storage tanks due to 254 lateral loads (shaking) and permanent ground 255 deformation due to liquefaction and landslides. Water sloshes in storage and process tanks imparting 256 extreme loads on tank walls and baffles. In the 1994 Northridge earthquake, a Los Angeles Department of 257 Water and Power (LADWP) tank moved, severing piping, as shown in Figure 9-8. The utility just north 258 of LADWP suffered elephant’s foot buckling in a steel tank as shown in Figure 9-9. 259
260
Figure 9-6. Collapsed Water Tank in Buras, LA near
Hurricane Katrina Landfall Location (Courtesy of
David Goldbloom- Helzner)
Figure 9-7. Steel Tanks Damaged Due to Tohoku,
Japan Tsunami in 2011 (Tang & Edwards 2014)

DISASTER RESILIENCE FRAMEWORK
75% Draft for San Diego CA Workshop
11 February, 2015
Water and Wastewater Systems, Water and Wastewater Infrastructure
Chapter 9, Page 8 of 32
Figure 9-8. Tank Moved, Severing
Connecting Pipe in 1994 Northridge
Earthquake (Courtesy of Los Angeles
Department of Water and Power)
Figure 9-9. Steel Tank “Elephant’s Foot” Buckling in 1994
Northridge Earthquake (Courtesy of Donald Ballantyne)
9.2.1.6. Distribution 261
Smaller diameter distribution pipelines carry treated water from transmission pipelines to neighborhoods 262 commercial and industrial areas. Service connections with meters branch off distribution pipelines to 263 supply individual customers. The portion of the service connection before the water meter is typically 264 maintained by the water utility and the portion after the water meter is the responsibility of the individual 265 customer. The system is controlled with manually operated valves distributed at most pipeline 266 intersections. Distribution systems have fire hydrants located every 300 feet along the pipeline. 267 Distribution pipelines are commonly made with ductile iron (historically cast iron), welded steel, PVC, or 268 asbestos cement. 269
Leaks and breaks are two main concerns for distribution pipelines. A leak commonly refers to relatively 270 minor damage to a pipe barrel or joint that causes minor to moderate water loss, but does not significantly 271 impair the distribution system’s function. However, breaks commonly refer to major damage to a pipe 272 barrel or joint that causes major water and pressure loss in a zone or drains nearby tanks. When there are 273 breaks in the water distribution system, it can lead to depressurization of the system. Depressurization can 274 result in sediment accumulation within the pipelines affecting the potability of the water, contamination 275 and loss of potability means boil water orders should be issued. Before water can be considered potable 276 again, the distribution systems must be fixed and the water quality monitored and tested continuously to 277 meet public health standards. 278
Breaks of distribution pipelines can result from a number of hazards. Floods cause erosion, exposing, 279 possibly breaking pipelines (see Figure 9-10). 280

DISASTER RESILIENCE FRAMEWORK
75% Draft for San Diego CA Workshop
11 February, 2015
Water and Wastewater Systems, Water and Wastewater Infrastructure
Chapter 9, Page 9 of 32
Figure 9-10. Exposed and Broken Distribution Lines Resulting from Flooding in Jamestown, CO (Courtesy of
David Goldbloom-Helzner)
Earthquakes can cause liquefaction or permanent 281 ground deformation, causing pipeline breaks. In the 282 1994 Northridge earthquake, the Los Angeles 283 Department of Water and Power had approximately 284 1,000 pipeline breaks, primarily in cast iron pipe. 285 While there was only limited liquefaction, ground 286 motions were very strong. A year later, the Kobe 287 earthquake caused approximately 1,200 pipeline 288 failures due to extensive liquefaction. Most of the 289 system was constructed of ductile iron pipe, which 290 primarily failed by joint separation as seen in Figure 291 9-11. 292
High wind events, such as hurricanes or tornadoes, 293 can result in damage to distribution lines, though not 294 directly cause by high winds, but by uprooted trees. 295 For example, during Hurricane Andrew, there was 296 extensive damage to the water distribution systems 297 in Southern Florida primarily caused by tree roots that had grown and wrapped themselves around the 298 water mains and service lines. When these trees were uprooted by hurricane force winds, (Hurricane 299 Andrew was a Category 5 on the Saffir-Sampson scale when it made landfall in Dade County, Florida) 300 they pulled the lines too. Similar damage to water transmission and distribution systems occurred during 301 Hurricanes Katrina and Rita in Louisiana (Allouche, 2006). As stated above, no matter the cause of 302 damage, pipeline breaks resulting in a depressurized system contaminate the pipelines, affecting the 303 potability of the water and requiring additional recovery time. 304
9.2.2. Wastewater Systems 305
Wastewater systems collect domestic and industrial liquid waste products and convey them to treatment 306 plants through collection and conveyance systems and pump stations. After separation of solids, 307 biological processing and disinfection, treated wastewater is discharged as effluent into a receiving body 308 of water or alternatively, may be reused for irrigation or other purposes. Some utilities have separate 309 collection systems for wastewater and storm water; other utilities have collection systems combine 310 collected wastewater and storm water in the same pipelines. 311
Pipeline system failure can discharge raw sewage into basements, on to city streets, and into receiving 312 waters, resulting in public health issues and environmental contamination. Standard wastewater systems 313
Figure 9-11. Joint Separation in Ductile Iron Pipe
due to Liquefaction during 1995 Kobe Earthquake
(Courtesy of Kobe Water Department)
DISASTER RESILIENCE FRAMEWORK
75% Draft for San Diego CA Workshop
11 February, 2015
Water and Wastewater Systems, Water and Wastewater Infrastructure
Chapter 9, Page 10 of 32
are composed of five general categories of infrastructure: 1) Collection, 2) Conveyance, 3) Pumping, 4) 314 Treatment, and 5) Discharge. The basic function of each of these categories is briefly described in the 315 following subsections. Apart from standard systems, pressure and vacuum systems are used on occasion. 316 Pressure systems require a grinder pump at each house that pump the sewage through small diameter pipe 317 to a larger pipe collector, and often times to a gravity sewer. Vacuum systems work in a similar manner, 318 except a vacuum pump and tank pull sewage through shallow small diameter pipe to a central location. 319
9.2.2.1. Collection 320
The collection pipeline network for wastewater systems is similar to that for water systems, except instead 321 of delivering water to individual customers the wastewater collection system conveys liquid and other 322 waste products away from customers. This is usually accomplished using gravity sewers. In some 323 instances pumps convey wastewater through pressurized force mains. The elevation and grade of the 324 pipelines in the system need to be carefully controlled to maintain gravity flow in the system. Infiltration 325 and inflow of groundwater into the collection system through cracks and breaks in the pipe can 326 significantly increase the volume of wastewater that arrives at the treatment plant. A variety of pipe 327 materials are commonly found in collection systems, including: 328
Vitrified clay – smaller diameter collection 329
PVC – smaller diameter collection 330
Asbestos cement – historically smaller diameter collection 331
Reinforced concrete – larger diameter interceptors 332
Steel – force mains or siphons 333
Polyethylene – force mains or siphons 334
Ductile iron (or historically cast iron) – collection or force mains 335
Brick – larger capacity interceptors 336
Fiberglass or FRP 337
ABS 338
Gravity systems have manholes at regular intervals allowing access for cleaning and maintenance. 339 Manholes are usually constructed with concrete, although historically manholes were often constructed 340 with brick. 341
Wastewater collection pipes have similar causes of damage to those of water distribution and transmission 342 pipelines. Wastewater collection pipelines can be exposed and damaged because of landslides, erosion, or 343 scour, which damages or breaks the pipelines. Furthermore, wastewater collection pipelines can be 344 damaged in high wind events by uprooted trees with root systems grown around the pipelines. 345
In the collection and conveyance system, pipelines are damaged by earthquake shaking, but more 346 extensively due to liquefaction and associated lateral spreading. Sewer pipes can be damaged by shaking, 347 which can cause joints to crack, but most remain operable. These cracks will ultimately have to be 348 repaired to control infiltration. Liquefaction can result in pulled joints and displaced pipe. Another cause 349 of failure is pipe flotation, occurring when a partially-filled gravity sewer is surrounded by liquefied soil. 350
Flooding can also damage wastewater collection pipelines in a number of ways. Pipelines that are co-351 located on bridges experience damage caused by flood inundation and flood-borne debris impact. 352 Hydrodynamic forces associated with coastal flooding or high velocity flows are more likely to damage 353 structures and attached pipelines than inundation alone. In the New Orleans area after Hurricane Katrina, 354 the most common damage to buried wastewater pipelines observed by clean-up crews was separation of 355 pipe joints, leaks, and breaks. This damage was believed to be the result of floodwaters supersaturating 356 soils then draining, leading to soil shrinkage and subsidence. Without support of the soils, the rigid 357 pipelines broke and fractured (Chisolm, 2012). Increased flow and pressurization of the wastewater 358
DISASTER RESILIENCE FRAMEWORK
75% Draft for San Diego CA Workshop
11 February, 2015
Water and Wastewater Systems, Water and Wastewater Infrastructure
Chapter 9, Page 11 of 32
collection systems as the result of inflow and infiltration during flood events can also damage pipelines, 359 particularly in cases where pipes are composed of materials such as vitrified clay. For example, during the 360 1997 Red River Flood in Grand Forks, North Dakota, pressurization caused breaking of vitrified clay pipe 361 and hairline cracks increased the rate of overall pipe deterioration (Chisolm 2012). 362
9.2.2.2. Conveyance 363
The conveyance system for the wastewater network is similar to the transmission system in a water 364 system. The conveyance pipelines are larger in diameter, and are often times deeper underground. In 365 many instances, these conveyance systems were installed in the early to mid-1900s as the United States 366 began to clean up its waterways. The conveyance systems are designed to collect sewage from the 367 collection system and move it to the wastewater treatment plant. Like collection systems, it may include 368 pump stations. Recently, the EPA is pushing wastewater utilities to minimize discharge of raw sewage to 369 receive water runoff during heavy rain events. This often resulted in cities having sewers that carried both 370 sewage and storm water. As a result, many conveyance systems now have a built-in large storage 371 capacity, taking the form of a wide point in the line and, in some cases, simplified wastewater treatment 372 facilities. 373
9.2.2.3. Pumping 374
Gravity feed systems use pump or lift stations to lift wastewater to a higher elevation. The pump may 375 discharge at the higher elevation to another section of gravity feed pipeline or may remain a pressurized 376 force main and discharge at a distant location, such as a treatment plant. A pump station typically consists 377 of a simple building that houses pumps, motors that power the pumps, pipes, and associated mechanical, 378 electrical, and control equipment. The pumps can be located in a building (typically wetwell-drywell 379 layout) or a large manhole (submersible). Pump stations are required to have standby generators to enable 380 continued operation when the commercial power supply is interrupted. 381
Pump stations are vulnerable to a number of hazards, most notably earthquakes and flooding. Unless 382 designed to be submersible, floodwater inundating pumps can disable and damage the pumps and their 383 motors. This was a common cause of pump station failure in New York City during flood inundation 384 from Hurricane Sandy (NYCDEP, 2013). Damage is even worse if salt water flooding is involved, 385 leading to corrosion. Loss of commercial electrical power prevents operation of pumps if adequate 386 standby power is not provided or these generators are not refueled in a timely manner. Earthquakes can 387 cause liquefaction, resulting in buried wastewater collection wells at pump stations to float and tilt. This 388 movement likely damages connecting piping and renders the pump station inoperable. Manholes and 389 pump stations can float as well, when founded in liquefied soils, which changes the grade, making the 390 sewer unusable or difficult to maintain. 391
9.2.2.4. Treatment 392
Wastewater treatment plants process raw sewage from household and industrial sources so the resulting 393 effluent discharge meets public health and environmental standards. The typical process is: 1) 394 Pretreatment using screens and grit chambers, 2) Primary treatment in a sedimentation tank, 3) Secondary 395 treatment using biological treatment and clarifiers, and 4) Disinfection using chlorine or other 396 disinfectants. In some cases, the effluent is further treated at a higher level to be used for irrigation. Solids 397 drawn off from the four processes are further treated in digesters and solidified using presses or 398 centrifuges. These processes require an extensive mechanical and electrical equipment and piping. 399
Wastewater treatment plants are susceptible to damage from several natural hazards, particularly flooding. 400 Wastewater treatment plants are often located in or near flood-prone areas because they return treated 401 water to naturally occurring bodies of water via gravity. Therefore, they can be vulnerable to flood 402 inundation or storm surge and wave action from coastal sources, causing damage and loss of functionality 403 to buildings, equipment, and electrical and mechanical systems. The New York City Department of 404

DISASTER RESILIENCE FRAMEWORK
75% Draft for San Diego CA Workshop
11 February, 2015
Water and Wastewater Systems, Water and Wastewater Infrastructure
Chapter 9, Page 12 of 32
Environmental Protection (NYC DEP) noted in a recent study that all 14 of the wastewater treatment 405 plants (WWTP) it owns and operates are at risk of flood damage (NYCDEP, 2013). 406
WWTPs in non-coastal regions of the United States are often located adjacent to rivers. With the 407 projected sea level rise continuing through the 21
st century, the frequency of these facilities flooding will 408
increase. Some recent examples of WWTP riverine flooding include: 1) Nine days of lost functionality 409 due to flooding of Valdosta, Georgia WWTP in 2009; 2) Flooding of the Pawtuxet River in Warwick, 410 Rhode Island in 2010; and 3) Shut down of the Palmyra, Indiana WWTP in 2011 due to rising water 411 levels. 412
In areas where wastewater treatment facilities are elevated or protected by levees, flooding can still lead 413 to access issues. While the treatment facility itself may not be inundated, flooding around the facility can 414 limit both ingress and egress of vital staff. This was the case for several WWTPs located along the 415 Missouri and Mississippi Rivers during the 1993 flood. Access to facilities was only possible by boat, 416 while roads inundated by the flood were not considered stable enough for larger vehicles, such as those 417 that carried supplies for the plants (Sanders, 1997). 418
Release of untreated sewage is relatively common during major flood events when inflow and infiltration 419 can overtax wastewater collection systems or when there are combined sewer overflows. During 420 Hurricane Sandy, over 560 million gallons of untreated and diluted sewage, mixed with storm water and 421 seawater, was released into waterways. This instance of sewage release was caused by infiltration of 422 floodwaters into the sewer system, flood inundation of plant facilities, and power outages (NYC DEP, 423 2013). After Hurricane Sandy, electronic controls were inundated and damaged in many wastewater 424 treatment facilities, which significantly delayed the facilities’ recovery times (FEMA 2013). Similarly, 425 after Hurricane Rita in 2005, the City of Lake Charles had a citywide power loss that affected the 426 wastewater treatment plant serving two-thirds of the city, releasing raw sewage into a nearby lake for over 427 a week, until power was restored. 428
While discharge or raw sewage contaminates the receiving water, chemical contamination of sewage can 429 impact the WWTP treatment process itself. For example, in the 1989 Loma Prieta earthquake in 430 California, the East Bay Municipal Utility District (EBMUD) WWTP biological treatment process failed 431 due to a spill in the collection system contaminating the treatment plant influent. Coupled with the spill, 432 EBMUD lost power and were unable to pump oxygen into the treatment system, resulting in the 433 secondary treatment system being inoperable for several weeks. 434
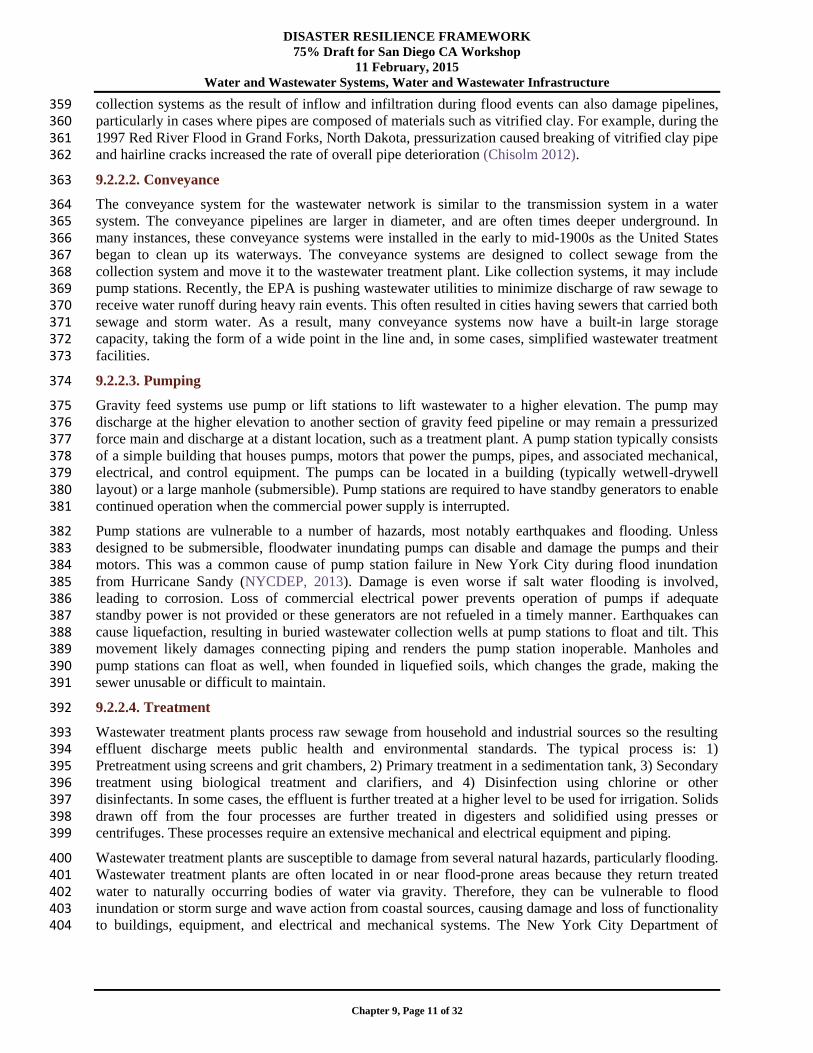
WWTPs are at a low point in the elevation of the system. Though flooding from different hazard events 435 (hurricane storm surge, coastal and riverine flooding, and tsunamis) is a primary concern, earthquakes can 436 damage facilities by shaking, permanent ground deformation, and liquefaction. Shaking is particularly 437 problematic in process tanks and digesters where the hydraulic load from sloshing sewage impacts the 438 tank walls. Liquefaction-induced permanent ground deformation often causes process tank joint 439 separation, damage to pipelines, pipe racks, etc. Even if treatment structures are pile-supported, direct-440 buried piping can settle differentially and break. In the 2011 Christchurch earthquake in New Zealand, 441 clarifiers settled differentially rendering them inoperable. In the 1995 Kobe Earthquake, the Higashinada 442 WWTP site settled differentially as much a one meter, and moved laterally as much as two meters due to 443 liquefaction heavily damaging non-pile-supported structures. The resulting damage is shown in Figure 444 9-12. Figure 9-13 shows the Higashinada influent channel that was offset one meter by liquefaction 445 during the 1995 Kobe earthquake. 446
DISASTER RESILIENCE FRAMEWORK
75% Draft for San Diego CA Workshop
11 February, 2015
Water and Wastewater Systems, Water and Wastewater Infrastructure
Chapter 9, Page 13 of 32
Figure 9-12. Non-Pile Supported Structures Failed Due to
Liquefaction in 1995 Kobe Earthquake (Courtesy of Donald
Ballantyne)
Figure 9-13. Higashinda WWTP Channel Offset
by Liquefaction in 1995 Kobe Earthquake
(Courtesy of Donald Ballantyne)
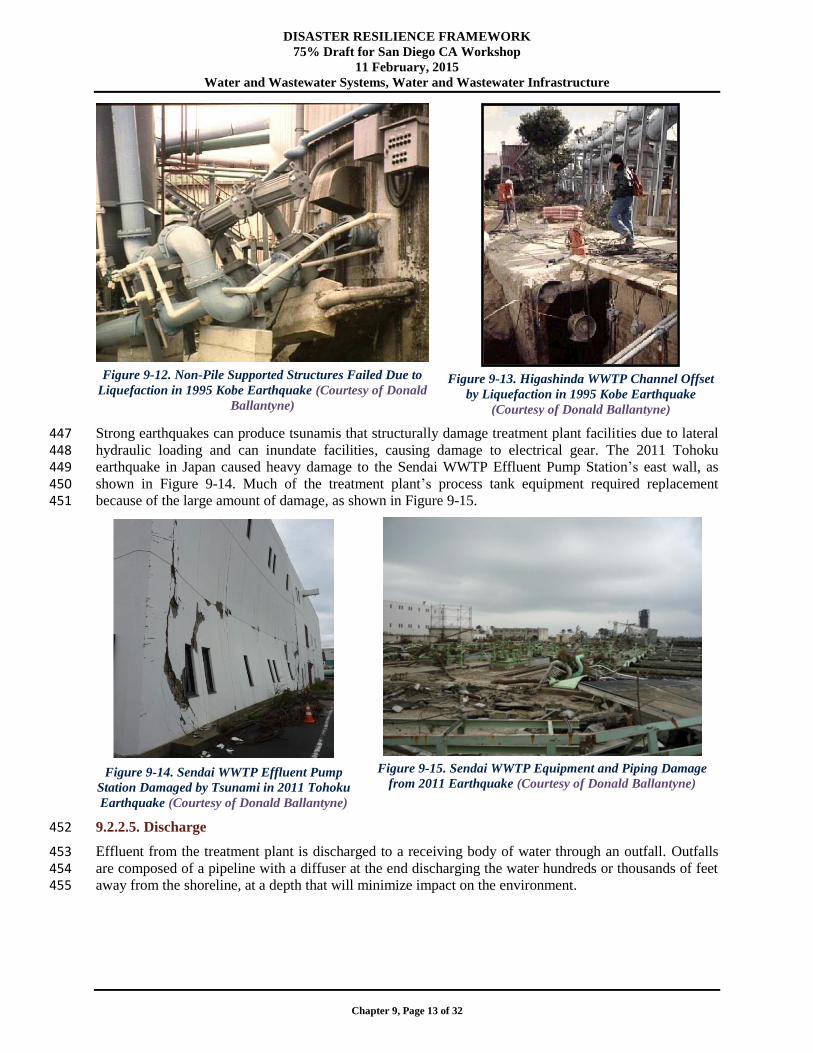
Strong earthquakes can produce tsunamis that structurally damage treatment plant facilities due to lateral 447 hydraulic loading and can inundate facilities, causing damage to electrical gear. The 2011 Tohoku 448 earthquake in Japan caused heavy damage to the Sendai WWTP Effluent Pump Station’s east wall, as 449 shown in Figure 9-14. Much of the treatment plant’s process tank equipment required replacement 450 because of the large amount of damage, as shown in Figure 9-15. 451
Figure 9-14. Sendai WWTP Effluent Pump
Station Damaged by Tsunami in 2011 Tohoku
Earthquake (Courtesy of Donald Ballantyne)
Figure 9-15. Sendai WWTP Equipment and Piping Damage
from 2011 Earthquake (Courtesy of Donald Ballantyne)
9.2.2.5. Discharge 452
Effluent from the treatment plant is discharged to a receiving body of water through an outfall. Outfalls 453 are composed of a pipeline with a diffuser at the end discharging the water hundreds or thousands of feet 454 away from the shoreline, at a depth that will minimize impact on the environment. 455

DISASTER RESILIENCE FRAMEWORK
75% Draft for San Diego CA Workshop
11 February, 2015
Water and Wastewater Systems, Performance Goals
Chapter 9, Page 14 of 32
9.3. Performance Goals 456
The large and distributed nature of water and wastewater systems, combined with their interdependence 457 on other infrastructure systems, limits the practicality of maintaining 100 percent operational capacity in 458 the aftermath of a major natural disaster. This section provides an example of performance goals for water 459 and wastewater systems in the fictional community of Centerville, USA. 460
Performance goals need to be discussed with individual utilities and communities before they are adopted. 461 It is important to consider the uniqueness of the infrastructure of individual utilities and the specific needs 462 of their customers when adopting system performance goals for a community. Water and wastewater 463 stakeholder engagement is critical in establishing a community-specific level of service performance 464 goals for each of the three different hazard levels (routine, expected, and extreme) defined in Chapter 3. 465 Stakeholders should include representation from the following organizations as applicable: 466
Residential customers 467
Business owners 468
Industry representatives 469
Water wholesale customers 470
Hospital representatives 471
Fire department officials and crew 472
Local government officials 473
Local emergency management officials 474
Drinking water regulators (Health Authority, etc.) 475
Wastewater regulators (Dept. of Environmental Quality, Environmental Protection Agency, etc.) 476
Water and wastewater utility operators and engineers 477
Consulting engineers 478
Interdependent infrastructure system operators (power, liquid fuel, transportation, etc.) 479
Establishing performance goals involves a discussion amongst the stakeholders about their expectations 480 for the availability of water and wastewater systems following a hazard event in the short, intermediate, 481 and long term phases for different hazard levels (e.g., routine, expected, and extreme). The assumed 482 expectation of the public is that for routine hazard events there would be little, if any, interruption of 483 service for water and wastewater lifelines. A dialogue is required between utilities and customers to 484 determine the appropriate level of service performance goals for expected and extreme events. While 485 examples are provided in Table 9-2 through Table 9-7 (pages 16 through 21), it is anticipated that actual 486 goals will vary by community and are dependent on community priorities, as determined during the 487 development of the goals and through outreach to and discussion among stakeholders. 488
There may be variability for an individual community’s goals depending on the specific hazard being 489 addressed. For example, if a community is subject to both seismic and wind hazards, they may determine 490 that the damage to major collection lines within a wastewater system from an extreme seismic event is 491 more likely and requires more restoration time, compared to damage from an extreme wind event. 492
There may be elements in a system that are so critical to public safety they need to be designed to remain 493 operational after an extreme event. For example, failure of a water supply impoundment dam presents a 494 significant life-safety hazard to downstream residents and should be designed for an extreme event. 495
Interdependencies of water and wastewater systems with other infrastructure also need to be considered 496 when developing performance goals. For instance, availability of a reliable supply of liquid fuel impacts 497 how long systems can run on standby generators and impacts repair crew’s vehicles and equipment. In 498 turn, delivery of liquid fuels depends on the status of the highway and bridge transportation network. 499
DISASTER RESILIENCE FRAMEWORK
75% Draft for San Diego CA Workshop
11 February, 2015
Water and Wastewater Systems, Performance Goals
Chapter 9, Page 15 of 32
Performance goals are broken down into functional categories (i.e., water for fire suppression at key 500 supply points, treatment plants operating to meet regulatory requirements, etc.) and further broken down 501 into target timelines to restore the functional categories to 30 percent, 60 percent, and 90 percent 502 operational status. 503
The infrastructure components in the example performance goals tables are not intended to be an 504 exhaustive list. Some of the system components may not exist in all communities. For instance, in the 505 water system performance goals, some communities may have the ability to distinguish between the 506 general water supply and distribution and water supply for fire suppression. However, most systems are 507 integrated and will not have a means to separate general supply and distribution from that needed for fire 508 suppression. Additionally, some communities might have wholesale users – a system component listed in 509 the performance goals – meaning their water system supplies all of the water used by other nearby, 510 smaller communities. Wholesale users are treated as a critical part of the distribution system within the 511 example, but are not a consideration for all communities. Each community will need to review these 512 components to determine which ones to incorporate into their systems. 513
Similarly, communities may want to add certain system components to these goals that are not already 514 captured here, to provide additional detail and allow for distinction between restoration timeframes. There 515 may also be system components that are unique to a community that require special consideration. While 516 the lists presented in the examples generally capture significant system components, it is recognized that 517 communities may have additional infrastructure assets to consider. 518
The financial burden associated with upgrading all components of an entire system to be more disaster 519 resilient would overwhelm the short-term capital improvement budgets of most utilities. Therefore, 520 performance goals have been established around certain concepts. 521
Prioritizing potential solutions to be implemented over many years to limit disruptions and 522 recovery time rather than implementing them all at once 523
Recognizing that there may be both short and long-term solutions capable of decreasing recovery 524 times 525
Balancing societal needs with realistic expectations of system performance 526
Focusing on major system components that form a backbone network capable of supplying key health and 527 safety-related community needs shortly after a hazard event is one way to focus priorities. Recognizing 528 that potentially less costly short-term solutions combined with longer term physical hardening of 529 infrastructure allows for increased resilience would manage community’s expectations and the cost of 530 implementing solutions. 531 532

DISASTER RESILIENCE FRAMEWORK
75% Draft for San Diego CA Workshop
11 February, 2015
Water and Wastewater Systems, Performance Goals
Chapter 9, Page 16 of 32
Table 9-2. Example Water Infrastructure Performance Goals for Routine Event in Centerville, USA 533
Disturbance Restoration times
(1) Hazard Any (2) 30% Restored
Affected Area for Routine Event Localized
60% Restored
Disruption Level Minor
90% Restored
(3) X Current
534
Functional Category: Cluster
(4)
Support
Needed
(5)
Target
Goal
Overall Recovery Time for Hazard and Level Listed
Routine Hazard Level
Phase 1 – Short-
Term
Phase 2 --
Intermediate
Phase 3 – Long-
Term
Days Wks Mos
0 1 1-3 1-4 4-8 8-12 4 4-24 24+
Source 1
Raw or source water and terminal reservoirs 90% X
Raw water conveyance (pump stations and
piping to WTP) 90% X
Potable water at supply (WTP, wells,
impoundment) 90% X
Water for fire suppression at key supply points
(to promote redundancy) 90% X
Transmission (including Booster Stations) 1
Backbone transmission facilities (pipelines,
pump stations, and tanks) 90% X
Control Systems
SCADA or other control systems 90% X
Distribution
Critical Facilities 1
Wholesale Users (other communities, rural
water districts) 90% X
Hospitals, EOC, Police Station, Fire Stations 90% X
Emergency Housing 1
Emergency Shelters 90% X
Housing/Neighborhoods 2
Drink water available at community
distribution centers 90% X
Water for fire suppression at fire hydrants 90% X
Community Recovery Infrastructure 3
All other clusters 90% X
Footnotes: 535 1 Specify hazard being considered
Specify level -- Routine, Expected, Extreme
Specify the size of the area affected - localized, community, regional
Specify severity of disruption - minor, moderate, severe
2 30% 60% 90% Restoration times relate to number of elements of each cluster
3 X Estimated restoration time for current conditions based on design standards and current inventory
Relates to each cluster or category and represents the level of restoration of service to that cluster or category
Listing for each category should represent the full range for the related clusters
Category recovery times will be shown on the Summary Matrix
"X" represents the recovery time anticipated to achieve a 90% recovery level for the current conditions
4 Indicate levels of support anticipated by plan
R Regional
S State
MS Multi-state
C Civil Corporate Citizenship
5 Indicate minimum performance category for all new construction.
See Section 3.2.6

DISASTER RESILIENCE FRAMEWORK
75% Draft for San Diego CA Workshop
11 February, 2015
Water and Wastewater Systems, Performance Goals
Chapter 9, Page 17 of 32
Table 9-3: Example Water Infrastructure Performance Goals for Expected Event in Centerville, USA 536
Disturbance Restoration times
(1) Hazard Any (2) 30% Restored
Affected Area for Routine Event Localized
60% Restored
Disruption Level Minor
90% Restored
(3) X Current
537
Functional Category: Cluster
(4)
Support
Needed
(5)
Target
Goal
Overall Recovery Time for Hazard and Level Listed
Expected Hazard Level
Phase 1 – Short-
Term
Phase 2 --
Intermediate
Phase 3 – Long-
Term
Days Wks Mos
0 1 1-3 1-4 4-8 8-12 4 4-24 24+
Source 1
Raw or source water and terminal reservoirs 90%
Raw water conveyance (pump stations and
piping to WTP) 90% X
Potable water at supply (WTP, wells,
impoundment) 30% 60% 90% X
Water for fire suppression at key supply points
(to promote redundancy) 90% X
Transmission (including Booster Stations) 1
Backbone transmission facilities (pipelines,
pump stations, and tanks) 90% X
Control Systems
SCADA or other control systems 30% 60% 90% X
Distribution
Critical Facilities 1
Wholesale Users (other communities, rural
water districts) 60% 90%
Hospitals, EOC, Police Station, Fire Stations 60% 90% X
Emergency Housing 1
Emergency Shelters 60% 90% X
Housing/Neighborhoods 2
Drink water available at community
distribution centers 60% 90%
Water for fire suppression at fire hydrants 90% X
Community Recovery Infrastructure 3
All other clusters 30% 90% X
Footnotes: See Table 9-2, page 16. 538

DISASTER RESILIENCE FRAMEWORK
75% Draft for San Diego CA Workshop
11 February, 2015
Water and Wastewater Systems, Performance Goals
Chapter 9, Page 18 of 32
Table 9-4: Example Water Infrastructure Performance Goals for Extreme Event in Centerville, USA 539
Disturbance Restoration times
(1) Hazard Any (2) 30% Restored
Affected Area for Extreme Event Regional
60% Restored
Disruption Level Severe
90% Restored
(3) X Current
540
Functional Category: Cluster
(4)
Support
Needed
(5)
Target
Goal
Overall Recovery Time for Hazard and Level Listed
Extreme Hazard Level
Phase 1 – Short-
Term
Phase 2 –
Intermediate Phase 3 – Long-Term
Days Wks Mos
0 1 1-3 1-4 4-8 8-12 4 4-36 36+
Source 1
Raw or source water and terminal
reservoirs 30% 60% 90% X
Raw water conveyance (pump stations
and piping to WTP) 60% 90% X
Potable water at supply (WTP, wells,
impoundment) 30% 60% 90% X
Water for fire suppression at key supply
points (to promote redundancy) 90% X
Transmission (including Booster
Stations) 1
Backbone transmission facilities
(pipelines, pump stations, and tanks) 30% 60% 90% X
Control Systems
SCADA or other control systems 30% 60% 90%
Distribution
Critical Facilities 1
Wholesale Users (other communities,
rural water districts) 60% 90% X
Hospitals, EOC, Police Station, Fire
Stations 60% 90% X
Emergency Housing 1
Emergency Shelters 60% 90% X
Housing/Neighborhoods 2
Drink water available at community
distribution centers 30% 60% 90% X
Water for fire suppression at fire
hydrants 60% 90% X
Community Recovery Infrastructure 3
All other clusters 60% 90% X
Footnotes: See Table 9-2, page 16. 541

DISASTER RESILIENCE FRAMEWORK
75% Draft for San Diego CA Workshop
11 February, 2015
Water and Wastewater Systems, Performance Goals
Chapter 9, Page 19 of 32
Table 9-5. Example Wastewater Infrastructure Performance Goals for Routine Event in Centerville, 542 USA 543
Disturbance Restoration times
(1) Hazard Any (2) 30% Restored
Affected Area for Routine Event Localized
60% Restored
Disruption Level Minor
90% Restored
(3) X Current
544
Functional Category: Cluster
(4)
Support
Needed
(5)
Target
Goal
Overall Recovery Time for Hazard and Level Listed
Routine Hazard Level
Phase 1 – Short-
Term
Phase 2 --
Intermediate
Phase 3 – Long-
Term
Days Wks Mos
0 1 1-3 1-4 4-8 8-12 4 4-24 24+
Treatment Plants
Treatment plants operating with primary treatment
and disinfection 90% X
Treatment plants operating to meet regulatory
requirements 90% X
Trunk Lines
Backbone collection facilities (major trunkline, lift
stations, siphons, relief mains, aerial crossings) 60% 90% X
Flow equalization basins 60% 90% X
Control Systems
SCADA and other control systems 90% X
Collection Lines
Critical Facilities
Hospitals, EOC, Police Station, Fire Stations 90% X
Emergency Housing
Emergency Shelters 90% X
Housing/Neighborhoods
Threats to public health and safety controlled by
containing & routing raw sewage away from public 60% 90% X
Community Recovery Infrastructure
All other clusters 60% 90% X
Footnotes: See Table 9-2, page 16. 545

DISASTER RESILIENCE FRAMEWORK
75% Draft for San Diego CA Workshop
11 February, 2015
Water and Wastewater Systems, Performance Goals
Chapter 9, Page 20 of 32
Table 9-6: Example Wastewater Infrastructure Performance Goals for Expected Event in Centerville, 546 USA 547
Disturbance Restoration times
(1) Hazard Any (2) 30% Restored
Affected Area for Expected Event Community
60% Restored
Disruption Level Moderate
90% Restored
(3) X Current
548
Functional Category: Cluster
(4)
Support
Needed
(5)
Target
Goal
Overall Recovery Time for Hazard and Level Listed
Expected Hazard Level
Phase 1 – Short-
Term
Phase 2 --
Intermediate
Phase 3 – Long-
Term
Days Wks Mos
0 1 1-3 1-4 4-8 8-12 4 4-24 24+
Treatment Plants
Treatment plants operating with primary
treatment and disinfection 60% 90%
Treatment plants operating to meet regulatory
requirements 30% 60% 90% X
Trunk Lines
Backbone collection facilities (major trunkline,
lift stations, siphons, relief mains, aerial
crossings) 30% 60% 90% X
Flow equalization basins 30% 60% 90% X
Control Systems
SCADA and other control systems 30% 60% 90% X
Collection Lines
Critical Facilities
Hospitals, EOC, Police Station, Fire Stations 30% 90% X
Emergency Housing
Emergency Shelters 30% 90% X
Housing/Neighborhoods
Threats to public health and safety controlled
by containing & routing raw sewage away
from public 30% 60% 90% X
Community Recovery Infrastructure
All other clusters 30% 60% 90% X
Footnotes: See Table 9-2, page 16. 549
DISASTER RESILIENCE FRAMEWORK
75% Draft for San Diego CA Workshop
11 February, 2015
Water and Wastewater Systems, Performance Goals
Chapter 9, Page 21 of 32
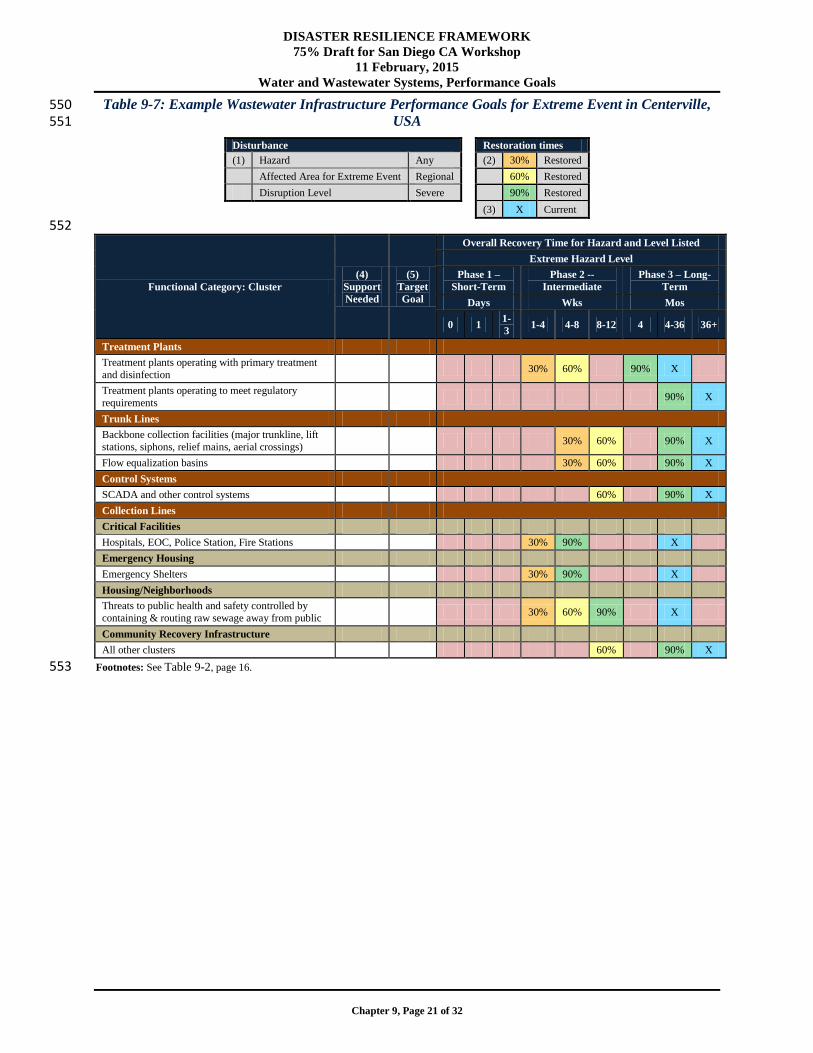
Table 9-7: Example Wastewater Infrastructure Performance Goals for Extreme Event in Centerville, 550 USA 551
Disturbance Restoration times
(1) Hazard Any (2) 30% Restored
Affected Area for Extreme Event Regional
60% Restored
Disruption Level Severe
90% Restored
(3) X Current
552
Functional Category: Cluster
(4)
Support
Needed
(5)
Target
Goal
Overall Recovery Time for Hazard and Level Listed
Extreme Hazard Level
Phase 1 –
Short-Term
Phase 2 --
Intermediate
Phase 3 – Long-
Term
Days Wks Mos
0 1 1-
3 1-4 4-8 8-12 4 4-36 36+
Treatment Plants
Treatment plants operating with primary treatment
and disinfection 30% 60% 90% X
Treatment plants operating to meet regulatory
requirements 90% X
Trunk Lines
Backbone collection facilities (major trunkline, lift
stations, siphons, relief mains, aerial crossings) 30% 60% 90% X
Flow equalization basins 30% 60% 90% X
Control Systems
SCADA and other control systems 60% 90% X
Collection Lines
Critical Facilities
Hospitals, EOC, Police Station, Fire Stations 30% 90% X
Emergency Housing
Emergency Shelters 30% 90% X
Housing/Neighborhoods
Threats to public health and safety controlled by
containing & routing raw sewage away from public 30% 60% 90% X
Community Recovery Infrastructure
All other clusters 60% 90% X
Footnotes: See Table 9-2, page 16. 553
DISASTER RESILIENCE FRAMEWORK
75% Draft for San Diego CA Workshop
11 February, 2015
Water and Wastewater Systems, Regulatory Environment
Chapter 9, Page 22 of 32
9.4. Regulatory Environment 554
9.4.1. Federal 555
The federal EPA has requirements for drinking water quality defined in the Safe Drinking Water Act and 556 wastewater discharge water quality defined in the Clean Water Act. These acts are amended on an 557 ongoing basis. In most cases, the EPA gives states primacy to enforce these requirements. There are 558 certain prescriptive requirements associated with each. 559
SDWA Example Requirements 560
Filtration of surface water supplies, except in some cases special treatment of particularly clean 561 surface water supplies 562
Disinfection of supplies (except a few groundwater supplies) 563
Covering of treated water storage 564
Clean Water Act Example Requirements 565
Secondary treatment of wastewater discharges 566
Disinfection of wastewater discharges 567
In general, these regulations all focus on water quality and have limited interest in catastrophic hazard 568 event impacts and planning. 569
9.4.2. State 570
State Drinking Water Programs. States typically regulate water quality and require treatment approaches 571 for recycled water. States ensure water systems meet Safe Drinking Water Act standards by ensuring 572 water systems test for contaminants, reviewing plans for water system improvements, conducting on-site 573 inspections and sanitary surveys, providing training and technical assistance, and taking action against 574 non-compliant water systems. 575
State Water Quality Programs. States also ensure water systems meet Clean Water Act water quality 576 standards using state water quality programs. They develop and implement water quality standards, 577 regulate sewage treatment systems and industrial dischargers, collect and evaluate water quality data, 578 provide training and technical assistance, and take action against non-compliant wastewater systems. 579
Emergency Planning and Community Right-to-Know Act (EPCRA). Facilities that store, use, or release 580 certain chemicals may be subject to reporting requirements to state and/or local agencies through EPCRA. 581 Information in reports then becomes publically available. Treatment chemicals stored and used at water 582 treatment plants often require this type of reporting. 583
Planning Requirements. Water and wastewater planning and design requirements are generally 584 controlled by states and local governments. States typically require comprehensive plans for water and 585 wastewater system are prepared on a regular basis to assess future system needs (e.g. capacity) and how 586 those needs will be met. The elements of those comprehensive plans are defined by the state. Often times, 587 these plans include requirements to identify hazards to which the system could be subjected, and how the 588 utility will address those hazards. These are typically quite general in nature and do not include detailed 589 design criteria. 590
9.4.3. Local 591
Individual municipalities or utility districts may elect to impose regulatory standards in excess of federal 592 and state standards. In practice, this is seldom done due to the increased cost to customers associated with 593 meeting higher-than-minimum regulatory standards. 594

DISASTER RESILIENCE FRAMEWORK
75% Draft for San Diego CA Workshop
11 February, 2015
Water and Wastewater Systems, Standards and Codes
Chapter 9, Page 23 of 32
9.5. Standards and Codes 595
The state and local government are responsible for adopting model building codes, such as the 596 International Building Code (IBC). Model building codes rely heavily on standards, such ASCE-7, 597 Minimum Design Loads for Buildings and Other Structures. In many cases, the state will adopt these 598 model codes; in some cases, local jurisdictions modify them to suit their needs. The IBC and ASCE-7 599 focus on building structure life safety. State and local agencies will also have special requirements for 600 high risk facilities, such as dams. The Federal Energy Regulatory Commission controls designs of 601 hydroelectric generating dams. 602
The development of design codes is a long and arduous process. Theses codes are updated on a regular 603 basis taking into account performance of facilities since the last code was issued and other developments 604 in the building industry. Once they are finalized, they are voted on by the code committee and finally 605 adopted by state and/or local jurisdictions. Once a code is well vetted, the state and local jurisdictions 606 adopt it. 607
The following subsections discuss some of the codes, standards, and guidelines that are important to the 608 disaster resilience of water and wastewater infrastructure, the anticipated performance of the 609 infrastructure after an expected hazard event, and the long-term recovery levels of the infrastructure when 610 damage does occur. 611
9.5.1. New Construction 612
Design Standards. Developed and adopted by various organizations, the two organizations that have 613 standards most relevant to natural hazard impacts on the water and wastewater industry include: 614
American Concrete Institute – standards addressing concrete process tanks (ACI 350) 615
American Water Works Association (AWWA) – 616 Standards addressing design of water storage tanks (AWWA D100, D110, D115), addressing 617
seismic design of water storage tanks 618 Standard AWWA-J100, Risk and Resilience Management of Water and Wastewater Systems, 619
addressing performance of water and wastewater systems when subjected to natural and 620 manmade hazards 621
AWWA has other standards addressing pipeline design and water quality. However, none of these other 622 standards addresses seismic design for other natural hazards. 623
For the design of new underground pipelines, there is not a unifying code for water and wastewater 624 systems. This is especially true for seismic design of buried water and wastewater pipelines or buried 625 pipelines that may be impacted by landslides induced by flooding. Often the Chief Engineer of a 626 particular utility is responsible for establishing its design practices. While these agency-specific design 627 practices are generally based on industry recommendations, variability in standards used by utilities 628 results in variability in the intended system reliability for natural and man-made hazards. 629
Some utilities develop their own standards to address significant local hazards specifically. For example, 630 the San Francisco Public Utilities Commission (SFPUC) developed its own internal standard that outlines 631 level of service performance goals following a major Bay Area earthquake and specific requirements for 632 design and retrofit of aboveground and underground infrastructure. The SFPUC Engineering Standard 633 General Seismic Requirements for Design of New Facilities and Upgrade of Existing Facilities (SFPUC, 634 2006) establishes design criteria that in many cases are more stringent than building codes and/or industry 635 standards, yet ensures the SFPUC achieves its basic level of service performance goal to deliver winter 636 day demand to their wholesale customers within 24 hours after a major earthquake. 637
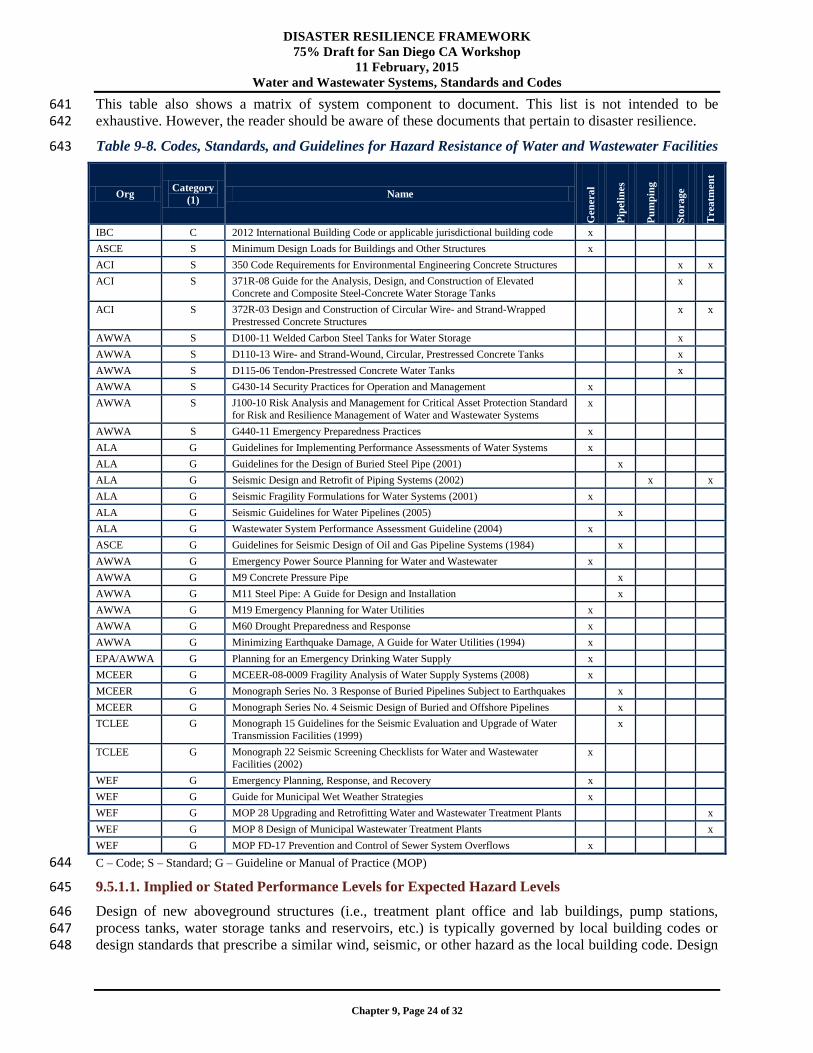
Guidelines and Manuals of Practice. A number of organizations have developed guidelines intended for 638 use by the industry to enhance design of the particular product being addressed. Table 9-8 lists some of 639 the model codes, standards, and guidance documents applicable to water and wastewater infrastructure. 640
DISASTER RESILIENCE FRAMEWORK
75% Draft for San Diego CA Workshop
11 February, 2015
Water and Wastewater Systems, Standards and Codes
Chapter 9, Page 24 of 32
This table also shows a matrix of system component to document. This list is not intended to be 641 exhaustive. However, the reader should be aware of these documents that pertain to disaster resilience. 642
Table 9-8. Codes, Standards, and Guidelines for Hazard Resistance of Water and Wastewater Facilities 643
Org Category
(1) Name
Gen
era
l
Pip
elin
es
Pu
mp
ing
Sto
rage
Trea
tmen
t
IBC C 2012 International Building Code or applicable jurisdictional building code x
ASCE S Minimum Design Loads for Buildings and Other Structures x
ACI S 350 Code Requirements for Environmental Engineering Concrete Structures x x
ACI S 371R-08 Guide for the Analysis, Design, and Construction of Elevated
Concrete and Composite Steel-Concrete Water Storage Tanks x
ACI S 372R-03 Design and Construction of Circular Wire- and Strand-Wrapped
Prestressed Concrete Structures x x
AWWA S D100-11 Welded Carbon Steel Tanks for Water Storage x
AWWA S D110-13 Wire- and Strand-Wound, Circular, Prestressed Concrete Tanks x
AWWA S D115-06 Tendon-Prestressed Concrete Water Tanks x
AWWA S G430-14 Security Practices for Operation and Management x
AWWA S J100-10 Risk Analysis and Management for Critical Asset Protection Standard
for Risk and Resilience Management of Water and Wastewater Systems x
AWWA S G440-11 Emergency Preparedness Practices x
ALA G Guidelines for Implementing Performance Assessments of Water Systems x
ALA G Guidelines for the Design of Buried Steel Pipe (2001) x
ALA G Seismic Design and Retrofit of Piping Systems (2002) x x
ALA G Seismic Fragility Formulations for Water Systems (2001) x
ALA G Seismic Guidelines for Water Pipelines (2005) x
ALA G Wastewater System Performance Assessment Guideline (2004) x
ASCE G Guidelines for Seismic Design of Oil and Gas Pipeline Systems (1984) x
AWWA G Emergency Power Source Planning for Water and Wastewater x
AWWA G M9 Concrete Pressure Pipe x
AWWA G M11 Steel Pipe: A Guide for Design and Installation x
AWWA G M19 Emergency Planning for Water Utilities x
AWWA G M60 Drought Preparedness and Response x
AWWA G Minimizing Earthquake Damage, A Guide for Water Utilities (1994) x
EPA/AWWA G Planning for an Emergency Drinking Water Supply x
MCEER G MCEER-08-0009 Fragility Analysis of Water Supply Systems (2008) x
MCEER G Monograph Series No. 3 Response of Buried Pipelines Subject to Earthquakes x
MCEER G Monograph Series No. 4 Seismic Design of Buried and Offshore Pipelines x
TCLEE G Monograph 15 Guidelines for the Seismic Evaluation and Upgrade of Water
Transmission Facilities (1999) x
TCLEE G Monograph 22 Seismic Screening Checklists for Water and Wastewater
Facilities (2002) x
WEF G Emergency Planning, Response, and Recovery x
WEF G Guide for Municipal Wet Weather Strategies x
WEF G MOP 28 Upgrading and Retrofitting Water and Wastewater Treatment Plants x
WEF G MOP 8 Design of Municipal Wastewater Treatment Plants x
WEF G MOP FD-17 Prevention and Control of Sewer System Overflows x
C – Code; S – Standard; G – Guideline or Manual of Practice (MOP) 644
9.5.1.1. Implied or Stated Performance Levels for Expected Hazard Levels 645
Design of new aboveground structures (i.e., treatment plant office and lab buildings, pump stations, 646 process tanks, water storage tanks and reservoirs, etc.) is typically governed by local building codes or 647 design standards that prescribe a similar wind, seismic, or other hazard as the local building code. Design 648

DISASTER RESILIENCE FRAMEWORK
75% Draft for San Diego CA Workshop
11 February, 2015
Water and Wastewater Systems, Standards and Codes
Chapter 9, Page 25 of 32
loads are prescribed by a consensus-based standard, Minimum Design Loads for Buildings and Other 649 Structures (ASCE, 2010). This standard uses the concept of Risk Category to increase the design force 650 level for important structures. Typical buildings are assigned to Risk Category II. Water and wastewater 651 treatment facilities are assigned to Risk Category III, because failure of these facilities can cause 652 disruption to civilian life and potentially cause public health risks. Water storage facilities and pump 653 stations required to maintain water pressure for fire suppression are assigned to the highest category, Risk 654 Category IV. 655
The building code intends that structures designed as Risk Category III or IV should remain operational 656 or require only minor repairs to be put back into operation following a design level (expected) wind, 657 seismic, or other event. By designing for this performance target for the expected level event, water and 658 wastewater systems should remain operational under a routine level event and may experience moderate 659 to major damage during an extreme level event. 660
The performance level implied by codes and standards for new construction provides an indication of the 661 recovery level (timeframe) expected for individual system components. The timeframe required for water 662 or wastewater systems to return to normal operating status following a hazard event is highly dependent 663 on the recovery time for individual system components and the system’s specific characteristics (e.g., 664 type and number of components, age of construction, system redundancy, etc.). Estimating system 665 recovery times for a specific hazard requires in-depth engineering and operational knowledge of the 666 system. 667
Table 9-9 summarizes water and wastewater system component performance and recovery levels for 668 earthquake hazard levels as implied by current codes and standards for new construction. Predicted 669 recovery times are based on individual system components. 670
Table 9-9. Water and Wastewater System Component Performance and Recovery Levels for Various 671 Earthquake Hazard Levels as Implied by Current Codes and Standards for New Construction 672
System Component Hazard Level Performance Level Recovery Level
Structures (pump
stations, treatment
plants, office/lab buildings, tanks,
reservoirs, etc.)
Routine (50 year return period
earthquake)
Safe and operational Resume 100% service within days
Expected (500 year return
period earthquake)
Risk Category III (I=1.25) – Safe and
usable during repair
Resume 100% service within
months
Risk Category IV (I=1.5) – Safe and
operational Resume 100% service within days
Extreme (2500 year return
period earthquake)
Risk Category III (I=1.25) – Safe and not
usable
Resume 100% service within
years
Risk Category IV (I=1.5) – Safe and usable
during repair or not usable
Resume 100% service within
months to years
Nonstructural
components (process, lab, mechanical,
electrical, and plumbing
equipment, etc.)
Routine (50 year return period
earthquake) Safe and operational Resume 100% service within days
Expected (500 year return
period earthquake)
Risk Category III (I=1.25) – Safe and
usable during repair
Resume 100% service within
months
Risk Category IV (I=1.5) – Safe and
operational Resume 100% service within days
Extreme (2500 year return
period earthquake)
Risk Category III (I=1.25) – Safe and not
usable
Resume 100% service within
years
Risk Category IV (I=1.5) – Safe and usable
during repair or not usable
Resume 100% service within
months to years
Pipelines Routine (50 year return period
earthquake) Operational Resume 100% service within days
Expected (500 year return
period earthquake) Operational to not usable Resume 100% service within
months
Extreme (2500 year return
period earthquake) Not usable Resume 100% service within
years

DISASTER RESILIENCE FRAMEWORK
75% Draft for San Diego CA Workshop
11 February, 2015
Water and Wastewater Systems, Standards and Codes
Chapter 9, Page 26 of 32
9.5.2. Existing Construction 673
9.5.2.1. Implied or Stated Performance Levels for Expected Hazard Levels 674
The design seismic hazard level was refined over time as the engineering and seismology community’s 675 understanding of United States seismicity improved. A significant portion of water and wastewater 676 system components in the high seismicity regions of the western and central United States were designed 677 and constructed considering a significantly lower seismic hazard than the hazard used by current codes 678 and standards. 679
Expected seismic performance of water and wastewater system components is dependent on the hazard 680 level, codes and standards used in original design, and the type of structure. System components built 681 prior to the mid-1970s are generally expected to perform poorly in earthquakes, because design codes and 682 standards used at that time lacked the detailed requirements that reflect our current understanding of 683 structures’ behaviors during earthquakes. System components built after the early 2000s are generally 684 expected to perform similar to new construction as described above. Performance of system components 685 built between the mid-1970s and early 2000s is dependent on the code edition and seismic hazard used in 686 design. Structures that satisfy the benchmark building criteria of ASCE 41-13 (ASCE, 2013) and are in 687 areas that haven’t experienced a significant increase in seismicity are generally expected to perform 688 similar to new construction as described above. However, some types of structures are inherently rugged. 689 For example, many older cast-in-place concrete structures, particularly single story buildings with few 690 opening would be expected to perform well. 691
Anticipated performance of nonstructural components should be evaluated on a case-by-case basis, as 692 engineers now pay closer attention to seismic design and construction of nonstructural components. 693
Anticipated performance of pipelines should be evaluated on a system-by-system basis because 694 performance of pipelines is dependent on pipe type, joint type, and earthquake ground movement 695 parameters. Even today, there is no code or standard for seismic design of pipelines. 696
9.5.2.2. Recovery Levels 697
In the past, infrastructure systems have not performed to the level that communities would desire with 698 extended recovery times beyond the example performance goals in Section 9.3. There are a number of 699 examples of disaster events that have rendered utilities non-functional for weeks following the event and 700 illustrate importance of considering the interdependencies of water and wastewater systems with other 701 systems of the built environment. A few notable events and their actual recover levels are discussed 702 herein. 703
Great Flood of 1993. In the Great Flood of 1993, the Raccoon River overtopped its banks and submerged 704 the Des Moines, Iowa WWTP. The water receded and the plant was able to restore non-potable water 705 within 12 days and potable water within 19 days. The water outage disrupted restaurant and hotel 706 operations. The Principal Insurance Company headquarters had to haul in water and pump it into the 707 building to cool computers. AT&T’s regional central office came within minutes of losing phone service 708 because of computer cooling issues. 709
Northridge and Kobe Earthquakes. In the 1994 Northridge earthquake, the Los Angeles Department of 710 Water and Power’s distribution system suffered approximately 1,000 pipeline failures, primarily in the 711 San Fernando Valley. With their own forces and mutual aid, they were able to fully restore potable water 712 service to everyone within 12 days. A year later, the 1995 Kobe Japan earthquake suffered 1,200 pipeline 713 failures resulting in lost service to all households for up to 60 days. 714
Christchurch, New Zealand and Tohoku, Japan Earthquakes. The recent 2011 Christchurch New 715 Zealand, and Tohoku Japan earthquakes both resulted in outages lasting in excess of 40 days. Impacted 716 Japanese cities were assisted by mutual aid from their colleagues from cities in western Japan. 717

DISASTER RESILIENCE FRAMEWORK
75% Draft for San Diego CA Workshop
11 February, 2015
Water and Wastewater Systems, Strategies for Implementing Community Resilience Plans
Chapter 9, Page 27 of 32
9.6. Strategies for Implementing Community Resilience Plans 718
Section 9.2 discusses components of water and wastewater infrastructure system. The discussion includes 719 examples from different types of hazards to encourage the reader to think about the different hazards that 720 could impact the communication and information infrastructure in their community. The number, types, 721 and magnitudes of hazards that need to be considered will vary from community to community. 722
Section 9.3 discusses example performance goals for the water and wastewater infrastructure system in 723 fictional town Centerville, USA. These example performance goals are provided for the routine, expected 724 and extreme event. However, the performance goals should be adjusted by the community based on its 725 social needs. 726
Section 9.4 and 9.5 outline some of the regulatory levels and issues, and codes and standards that the 727 reader should keep in mind when planning to make upgrades/changes to existing infrastructure as well as 728 building new structures for their water and wastewater infrastructure system. The objective of this section 729 is use the information from Sections 9.2 through 9.5 to provide guidance on how a community should 730 work through the process of assessing their communications infrastructure, defining strategies to make its 731 infrastructure more resilient, and narrowing the resilience gaps. 732
9.6.1. Available Guidance 733
The purpose of the assessment is to quantify the anticipated performance and recovery of the overall 734 system to determine whether it meets the performance goals described in Section 9.3. If the system does 735 not meet the objectives, the assessment should identify system facility and pipe deficiencies that should 736 be improved to achieve those performance goals. 737
Section 9.2.1 describes the basic components of water and wastewater systems and observations of where 738 these systems failed in past disasters. System performance is also highly dependent on the current 739 condition of the system and standards used in its design. Information about past disaster performance of 740 similar systems combined with knowledge of current condition and original design standards of the 741 system help a utility estimate the expected level of service they could provide after a hazard event. There 742 is likely a gap in the level of service a system would provide if a hazard event occurred today versus 743 community-established performance goals. It is likely that the capital expenditure required to close this 744 performance gap far exceeds the short-term capital improvement project budgets of the utility. However, 745 the resilience of any system can be improved incrementally over time by appropriately considering design 746 criteria to reduce the impact of natural and man-made hazards in designing new and upgrading existing 747 infrastructure. To estimate the level of service a water or wastewater system would provide after a given 748 scenario hazard event, an assessment of expected damage to the system and restoration times is required. 749
The level of detail of this assessment can take one of three basic forms. 750
Tier 1 – A high-level assessment of hazards and their performance conducted by persons 751 knowledgeable about the system (chief engineer, operations manager, etc.). This can be 752 accomplished in a workshop setting using system maps and schematics, along with hazard maps 753 of the service area, such as liquefaction susceptibility or flood plain maps. Restoration times will 754 be based on professional judgment of the workshop participants. 755
Tier 2 – A more refined assessment based on published scenario events and hazard zones, system 756 inventory (i.e., facility type, age, condition, and location relative to hazards, and pipe type, length 757 and soil type), site visits, and use of generalized component fragilities, such as those included in 758 HAZUS-MH and ALA documents. Restoration times are based on the extent of damage (e.g., 759 number of pipeline breaks), estimates of the time to repair each category of damage, and crews 760 and equipment available for restoration. 761
Tier 3 – A detailed assessment of all components in a system, specific component fragilities, and 762 the interdependencies of system components. Same as Tier 2, with the addition of detailed 763

DISASTER RESILIENCE FRAMEWORK
75% Draft for San Diego CA Workshop
11 February, 2015
Water and Wastewater Systems, Strategies for Implementing Community Resilience Plans
Chapter 9, Page 28 of 32
analysis (e.g. geotechnical, structural or hydraulic) of facilities and pipelines determined to be 764 vulnerable and critical, should they fail, significantly impacting the overall system operation. 765
To characterize the current disaster resilience of water and wastewater systems appropriately, each service 766 provider should undergo a Tier 1 assessment. If potential resilience vulnerabilities are identified, they 767 should undergo a more refined Tier 2 or 3 assessment. Several methodologies and tools are available to 768 conduct these resilience assessments, a few of which are described below. 769
HAZUS-MH is a multi-hazard (flood, earthquake, and hurricane) loss estimation tool developed by the 770 Federal Emergency Management Agency (FEMA) for use in pre-disaster mitigation, emergency 771 preparedness, and response and recovery planning (FEMA, 2012). Communities can use this tool to 772 characterize their hazard exposure, estimate losses to the water and wastewater systems, and estimate 773 repair costs and duration. It assists in conducting a Tier 2 analysis and an AWWA J100 analysis as 774 discussed below. 775
The ANSI/AWWA J100-10 Standard for Risk and Resilience Management of Water and Wastewater 776 Systems (AWWA, 2010) provides a methodology for conducting multi-hazard system risk and resilience 777 assessments. The J100 aligns the national homeland security objectives in HSPD-5, PPD-8, PPD-21 and 778 EO 13636. The J100 standard consists of a seven-step process for analyzing and supporting management 779 decisions that maximize risk reduction and/or enhance resilience at the utility and the community it 780 serves. 781
1. Asset Characterization 782 2. Threat Characterization 783 3. Consequence Analysis 784 4. Vulnerability Analysis 785 5. Threat Analysis 786 6. Risk/Resilience Analysis 787 7. Risk/Resilience Management 788
Asset level resilience for specific threats is part of the J100 assessment methodology, which may support 789 a community’s process for determining current performance and target performance (Section 9.3). The 790 J100 also includes the Utility Resilience Index (URI), which is a system-level assessment of operational 791 and financial indicators that are essential to resilience and, therefore, an asset’s ability to effectively serve 792 a community. The URI serves as a benchmark to evaluate potential resilience improvement projects and 793 as a measure to track a utility’s progress over time towards achieving resilience performance goals. 794
Several tools were developed by the U.S. Environmental Protection Agency to support the water utility 795 assessment of risks. The Vulnerability Self-Assessment Tool (VSAT) (EPA 2014) is designed to assist 796 water and wastewater utilities’ application of the J100 standard. VSAT is complemented by the Water 797 Health and Economic Analysis Tool (WHEAT), which quantifies three aspects of consequence associated 798 with an adverse event’s 1) public health impact, 2) utility-level financial impact, and 3) direct and indirect 799 regional economic impact (EPA, 2014). WHEAT is specifically aligned with step 3 (consequence 800 analysis) of J100 standard. 801
The EPA’s National Homeland Security Research Center (NHSRC) also supported efforts to enhance 802 utility resilience. Collaboration with AWWA resulted in the development of Planning for an Emergency 803 Drinking Water Supply, which directly supports a capability assessment based on worst reasonable threats 804 in J100 to determine options for maintaining service. 805
An example Tier 2 resilience assessment procedure for water systems is outlined in the following. 806
9.6.1.1. Example Tier 2 Resilience Assessment for Earthquake: 807
1. Identify the appropriate earthquake scenario or scenarios. Develop or obtain ground motion 808 information for each. The USGS has scenarios available for a suite of earthquakes in the U.S. 809
DISASTER RESILIENCE FRAMEWORK
75% Draft for San Diego CA Workshop
11 February, 2015
Water and Wastewater Systems, Strategies for Implementing Community Resilience Plans
Chapter 9, Page 29 of 32
Obtain liquefaction and landslide hazard maps available from the state department of geology. 810 Use GIS for all mapping. 811
For buried pipelines: 812
2. Compile an inventory of system pipelines including pipe material, joint type, and length. 813 3. In GIS, superimpose the pipeline distribution system onto maps of the scenario hazard (peak 814
ground velocity, liquefaction potential, and landslide potential). 815 4. Use empirical relationships developed by the American Lifelines Alliance (ALA) to predict the 816
number of breaks and leaks in the pipeline system. 817 5. Estimate the time required to repair the predicted number of breaks and leaks based on historical 818
crew productivity data. Modify this repair time, as appropriate, based on discussions of the 819 expected damage states of interdependent lifelines (transportation, liquid fuel, etc.). 820
For aboveground infrastructure: 821
6. Compile an inventory of system components (tanks, pump stations, treatment plants, etc.), 822 including type of construction, date of original construction, and any subsequent retrofits. 823
7. Estimate the level of damage predicted for the aboveground water system components based on 824 observations from past earthquakes, the seismic hazard prescribed by the building code at the 825 time of original construction or retrofit, and the professional judgment of engineers 826 knowledgeable in the seismic performance of water systems. Use fragility curves found in 827 HAZUS-MH to determine the anticipated performance for a particular facility type for a given 828 ground motion. 829
8. Estimate the time required to repair the predicted damage to aboveground infrastructure. Modify 830 this repair time, as appropriate, based on discussions of the expected damage states of 831 interdependent lifelines (transportation, liquid fuel, etc.) 832
For the system: 833
9. Determine the expected system performance based on the damage to pipelines and facilities in a 834 workshop format. 835
10. Determine the expected repair time for the system based on the repair times for buried pipelines 836 and aboveground infrastructure estimated in steps 5 and 8. 837
11. Compare this estimate of repair time for the system to the performance goals established by the 838 community to determine the resilience gap. 839
These different resilience assessment approaches should be evaluated and refined into one consistent 840 methodology prior to implementation of nationwide water and wastewater system resilience assessments. 841 The tier level of the assessment increases by conducting detailed analyses of each facility and pipeline. 842
Note that recovery time for utilities that purchase water from wholesale suppliers is highly dependent on 843 the recovery time of the supplying utility. Wholesale water suppliers should work with their customers to 844 assess the expected damage and restorations times from the source to the final individual customers. In 845 this case, water and wastewater system resilience assessments may require a regional approach to 846 characterize the anticipated performance of the system of systems in a hazard event appropriately. 847
9.6.2. Strategies for New Construction 848
Water and wastewater providers should consider resilience performance goals in all new construction 849 projects. Projects should be designed to satisfy or exceed code requirements, where code minimum 850 standards are not anticipated to provide a final product that would be expected to meet the utility’s 851 resilience performance goals. If no codes exist for a particular category of structure or facility, the 852 designer should investigate guidelines that address hazard-resistant design issues (see Table 9.4). The 853 incremental cost of designing and constructing for improved disaster resilience may be a relatively small 854 percentage of total project costs. 855

DISASTER RESILIENCE FRAMEWORK
75% Draft for San Diego CA Workshop
11 February, 2015
Water and Wastewater Systems, References
Chapter 9, Page 30 of 32
9.6.3. Strategies for Existing Construction 856
Water and wastewater providers should consider resilience improvements to existing infrastructure as part 857 of the capital improvement planning process. The process of conducting system resilience assessments 858 will likely identify key pipelines and facilities that significantly impact the overall resilience of a system. 859 These components should be evaluated in detail. Providers should evaluate a number of potential 860 strategies, including retrofit or replacement of existing components, or building redundant components in 861 anticipation of failure of existing components. Retrofit of existing infrastructure or new redundant 862 components should be designed such that the final product would be expected to meet the utility’s 863 resilience performance goals. In some cases, redundant systems can be justified based on increasing 864 demand requirements. The “new” redundant system could provide on its own an adequate supply to meet 865 an average day’s demand until the damaged system was repaired. Whatever is done needs to be part of the 866 day-to-day needs of the utility. That is, if special features added to a system to increase resilience are 867 never used, there is a high likelihood they will not be functional when they are needed. 868
Once water and wastewater providers and the community establish resilience performance goals and 869 complete baseline resilience assessments, there may be a number of goals not currently met due to the 870 anticipated performance of system components, financial resources of the utility, interdependencies with 871 other lifelines, etc. These performance gaps are likely to be addressed by a phased program (perhaps over 872 as long as a 50-year period) of new construction, retrofit of existing system components to better 873 withstand hazard events, modifications to emergency response plans, coordination with interdependent 874 lifeline providers, and other strategies. It is expected that these resilience enhancements will be coupled 875 with other system improvements to maximize the benefit of limited financial resources. 876
For instance, it can be difficult to justify replacing hundreds of miles of water pipelines based on 877 earthquake resilience considerations alone, but coupled with replacement of aging and failing pipelines, 878 the incremental cost of using more earthquake-resistant pipe materials and joints is relatively minor. 879 Major resilience improvements that take place on a shorter timeline require a more extensive campaign of 880 public outreach and education. 881
9.7. References 882
Allouche, E.N., Sterline, R.L., Chisolm, E., Hill, D., and Hall, D. (2006). Assessment of Damage to 883 Urban Buried Infrastructure in the Aftermath of Hurricanes Katrina and Rita. Proceedings 884 Pipelines 2006: Service to the Owner. ASCE. 885
ASCE (2013). Seismic Evaluation and Rehabilitation of Existing Buildings. Reston, VA: American 886 Society of Civil Engineers. 887
Aubuchon, C.P., & Morley, Kevin (2012). The Economic Value of Water: Providing Confidence and 888 Context to FEMA’s Methodology. Journal of Homeland Security and Emergency Management, 889 10(1), 2194-6361. 890
AWWA (1994). Minimizing Earthquake Damage, A Guide for Water Utilities. Denver, CO: American 891 Water Works Association. 892
AWWA (2001). M19 Emergency Planning for Water Utilities. Denver, CO: American Water Works 893 Association. 894
AWWA (2004). Emergency Power Source Planning for Water and Wastewater. Denver, CO: American 895 Water Works Association. 896
AWWA (2010). ANSI/AWWA J100-10 Risk and Resilience Management of Water and Wastewater 897 Systems. Denver, CO: American Water Works Association. 898
AWWA (2011). ANSI/AWWA G440-11 Emergency Preparedness Practices. Denver, CO: American 899 Water Works Association. 900
DISASTER RESILIENCE FRAMEWORK
75% Draft for San Diego CA Workshop
11 February, 2015
Water and Wastewater Systems, References
Chapter 9, Page 31 of 32
AWWA (2014). ANSI/AWWA G430-14 Security Practices for Operation and Management. Denver, CO: 901 American Water Works Association. 902
Ballantyne, D., & Crouse, C. (1997). Reliability and Restoration of Water Supply Systems for Fire 903 Suppression and Drinking Following Earthquakes. Gaithersburg, MD: National Institute of 904 Standards and Technology. 905
Chisolm, E. & Matthews, J. (2012). Impact of Hurricanes and Flooding on Buried Infrastructure. 906 Leadership and Management in Engineering. July 2012. Vol. 12, Issue 3. 907
Eidinger, J. (2012). Performance of Water Systems during the Maule Mw 8.8 Earthquake 27 February 908 2010. Earthquake Spectra, Vol. 28, No. S1, S605-S620. 909
Eidinger, J., & Tang, A. (2014). Christchurch, New Zealand Earthqake Sequence of Mw 7.1 September 910 04, 2010 Mw 6.3 February 22, 2011 Mw 6.0 June 13, 2011: Lifeline Performance. Reston, VA: 911 American Society of Civil Engineers. 912
Elliott, T., & Tang, A. (2009). Pacific Northwest Storms of December 1-4, 2007 Lifeline Performance. 913 Reston, VA: American Society of Civil Engineers. 914
EPA (2010). VSAT – Risk Assessment Tool for Water Sector Utilities. Washington, D.C.: Environmental 915 Protection Agency. 916
EPA (2014). Water Health and Economic Analysis Tool Version 3.0, Consequence Analysis Tool for 917 Water Utilities. Washington, D.C.: Environmental Protection Agency. 918
FEMA (2012). Hazus-MH 2.1 User Manual. Washington, D.C.: Federal Emergency Management 919 Agency. 920
FEMA (2013). Mitigation Assessment Team Report Hurricane Sandy in New Jersey and New York 921 Building Performance Observations, Recommendations, and Technical Guidance . Washington, 922 D.C.: Federal Emergency Management Agency. 923
Matsuhashi, M., Fukatani, W., Yokota, T., Ozaki, M., & Horie, N. (2012). The Damage of Sewage 924 Treatment Systems Caused by the Great East Japan Earthquake. International Symposium on 925 Engineering Lessons Learned from the 2011 Great East Japan Earthquake, Tokyo, Japan. 926
Miyajima, M. (2012). Damage to Water Supply System Induced by the 2011 Great East Japan 927 Earthquake. International Symposium on Engineering Lessons Learned from the 2011 Great East 928 Japan Earthquake, Tokyo, Japan. 929
Morley, Kevin (2013). Correct reference to be provided in next draft. 930
NYCDEP (2013). New York City Wastewater Resiliency Plan: Climate Risk Assessment and Adaptation 931 Study. October 2013. New York City Department of Environmental Protection. 932
NIST (1996). The January 17, 1995 Hyogoken-Nanbu (Kobe) Earthquake: Performance of Structures, 933 Lifelines, and Fire Protection Systems. Gaithersburg, MD: National Institute of Standards and 934 Technology. 935
O’Rourke, T. (2014). Resilient Lifeline Systems, ASCE TCLEE LeVal Lund Lecture, April 2, 2014, 936 California Institute of Technology, Pasadena, CA. 937
OSSPAC (2013). The Oregon Resilience Plan, Reducing Risk and Improving Recovery for the Next 938 Cascadia Earthquake and Tsunami. Salem, OR: Oregon Seismic Safety Policy Advisory 939 Commission. 940
Sanders, D.A. (1997.) Damage to Wastewater Treatment Facilities from Great Flood of 1993. Journal of 941 Environmental Engineering. January 1997. Vol. 123, Issue 1. 942

DISASTER RESILIENCE FRAMEWORK
75% Draft for San Diego CA Workshop
11 February, 2015
Water and Wastewater Systems, References
Chapter 9, Page 32 of 32
SFPUC (2006). General Seismic Requirements for Design of New Facilities and Upgrade of Existing 943 Facilities. San Francisco, CA: San Francisco Public Utilities Commission. 944
Schiff, A. (1997). Northridge Earthquake: Lifeline Performance and Post-Earthquake Response. 945 Gaithersburg, MD: National Institute of Standards and Technology. 946
Tang, A., & Edwards, C. (2014). Tohoku, Japan, Earthquake and Tsunami of March 11, 2011 Lifeline 947 Performance. Reston, VA: American Society of Civil Engineers. 948