Urban Water Management Plan - City of Oceanside
298
APPENDIX R Urban Water Management Plan
-
Upload
khangminh22 -
Category
Documents
-
view
3 -
download
0
Transcript of Urban Water Management Plan - City of Oceanside
APPENDIX R Urban Water Management Plan


Urban Water Management Plan
2016
CITY OF OCEANSIDE


City of Oceanside 2015 Urban Water Management Plan
Final
Prepared by:
June 2016

Page intentionally blank.

2015 Urban Water Management Plan Table of Contents June 2016 Final
City of Oceanside i
TABLE OF CONTENTS
EXECUTIVE SUMMARY .................................................................................................. ES-1
ES.1 PURPOSE AND ORGANIZATION ................................................................................................. ES-1 ES.2 SERVICE AREA BACKGROUND AND WATER SUPPLIES ........................................................... ES-2 ES.3 CURRENT AND PROJECTED DEMANDS ..................................................................................... ES-3 ES.4 WATER SUPPLY RELIABILITY ..................................................................................................... ES-5 ES.5 WATER SHORTAGES AND DEMAND MANAGEMENT .............................................................. ES-5
SECTION 1: INTRODUCTION AND OVERVIEW .......................................................... 1-1
1.1 BACKGROUND AND PURPOSE ....................................................................................................... 1-1 1.2 URBAN WATER MANAGEMENT PLANNING AND THE CALIFORNIA WATER CODE .............. 1-1 1.3 URBAN WATER MANAGEMENT PLANS IN RELATION TO OTHER PLANNING EFFORTS ...... 1-2 1.4 2015 PLAN ORGANIZATION .......................................................................................................... 1-3
SECTION 2: PLAN PREPARATION .................................................................................. 2-1
2.1 AGENCY COORDINATION ............................................................................................................. 2-2 2.2 PUBLIC PARTICIPATION ................................................................................................................. 2-3
SECTION 3: SYSTEM DESCRIPTION .............................................................................. 3-1
3.1 SERVICE AREA PHYSICAL DESCRIPTION ..................................................................................... 3-2 3.1.1 Agency Organizational Structure.................................................................................................. 3-2 3.1.2 Service Area Climate ................................................................................................................... 3-2 3.1.3 Existing and Future Development within Service Area ................................................................. 3-4 3.1.4 Overview of Water Uses in Service Area ...................................................................................... 3-5
3.2 SERVICE AREA POPULATION AND DEMOGRAPHICS .................................................................. 3-5 3.3 CLIMATE CHANGE .......................................................................................................................... 3-6
SECTION 4: SYSTEM WATER USE ................................................................................... 4-1
4.1 WATER USE SECTORS ..................................................................................................................... 4-1 4.2 WATER USE AND DEMANDS ......................................................................................................... 4-3
4.2.1 Demand Forecast ......................................................................................................................... 4-4 4.2.2 Distribution System Water Losses ............................................................................................... 4-7 4.2.3 Low Income Water Use and Demands ......................................................................................... 4-7 4.2.4 Estimating Water Savings from Codes, Ordinances, or Transportation and Land Use Plans ........ 4-8
4.3 WHOLESALE WATER DEMAND PROJECTIONS ........................................................................... 4-9 4.3.1 Wholesale Water Use Reduction Plan .......................................................................................... 4-9
4.4 CLIMATE CHANGE ........................................................................................................................ 4-10
SECTION 5: BASELINES AND TARGETS ........................................................................ 5-1
5.1 SBX7-7 BASELINE ........................................................................................................................... 5-1 5.1.1 Service Area Population ............................................................................................................... 5-1 5.1.2 Baseline Periods ........................................................................................................................... 5-1 5.1.3 Gross Water Use ......................................................................................................................... 5-2 5.1.4 Baseline GPCD Water Use ........................................................................................................ 5-3
5.2 2015 AND 2020 TARGETS ............................................................................................................... 5-3

2015 Urban Water Management Plan Table of Contents June 2016 Final
City of Oceanside ii
5.3 WATER CONSERVATION TARGET COMPLIANCE ........................................................................ 5-4
SECTION 6: SYSTEM SUPPLIES ....................................................................................... 6-1
6.1 SUMMARY OF EXISTING AND PLANNED WATER SOURCES ...................................................... 6-3 6.2 PURCHASED WATER ....................................................................................................................... 6-6 6.3 GROUNDWATER .............................................................................................................................. 6-6
6.3.1 Mission Basin .............................................................................................................................. 6-6 6.3.2 Mission Basin Groundwater Purification Facility ......................................................................... 6-7
6.4 SURFACE WATER ............................................................................................................................. 6-8 6.5 STORM WATER ................................................................................................................................ 6-8 6.6 TRANSFER OPPORTUNITIES........................................................................................................... 6-8 6.7 DESALINATED WATER OPPORTUNITIES ..................................................................................... 6-9 6.8 WASTEWATER AND RECYCLED WATER ....................................................................................... 6-9
6.8.1 Wastewater Collection and Treatment Facilities ............................................................................ 6-9 6.8.2 Potential and Projected Recycled Water Use ................................................................................ 6-14 6.8.3 Methods to Encourage Recycled Water Use ................................................................................ 6-18
6.9 FUTURE WATER PROJECTS .......................................................................................................... 6-19 6.9.1 Mission Basin Groundwater Purification Facility ....................................................................... 6-19 6.9.2 Local Seawater Desalination Facility ......................................................................................... 6-19 6.9.3 Wastewater Recycling ................................................................................................................. 6-20
6.10 CLIMATE CHANGE IMPACTS TO SUPPLY .................................................................................... 6-21
SECTION 7: SUPPLY RELIABILITY ASSESSMENT ....................................................... 7-1
7.1 CONSTRAINTS ON WATER SOURCES ............................................................................................ 7-1 7.1.1 Service Reliability ......................................................................................................................... 7-1 7.1.2 Water Quality ............................................................................................................................. 7-3
7.2 RELIABILITY BY TYPE OF YEAR .................................................................................................... 7-3 7.3 SUPPLY AND DEMAND ASSESSMENT ............................................................................................ 7-3
7.3.1 Normal Supply and Demand Comparison ................................................................................... 7-4 7.3.2 Single-Dry Year Supply and Demand Comparison ...................................................................... 7-5 7.3.3 Multiple-Dry Year Supply and Demand Comparison .................................................................. 7-5
7.4 REGIONAL SUPPLY RELIABILITY .................................................................................................. 7-6
SECTION 8: WATER SHORTAGE CONTINGENCY PLANNING ................................ 8-1
8.1 DROUGHT ORDINANCES ............................................................................................................... 8-1 8.2 STAGES OF ACTION ........................................................................................................................ 8-1 8.3 PROHIBITIONS ................................................................................................................................. 8-4 8.4 PENALTIES AND CHARGES ............................................................................................................ 8-7 8.5 CONSUMPTION REDUCTION METHODS ...................................................................................... 8-7 8.6 DETERMINING WATER SHORTAGE REDUCTIONS ..................................................................... 8-8 8.7 REVENUE AND EXPENDITURE IMPACTS OF WATER SHORTAGE ............................................. 8-8 8.8 MEASURES TO OVERCOME IMPACTS ............................................................................................ 8-9 8.9 CATASTROPHIC SUPPLY INTERRUPTION .................................................................................... 8-11 8.10 MINIMUM SUPPLY OVER THE NEXT THREE YEARS ................................................................ 8-11
SECTION 9: DEMAND MANAGEMENT MEASURES ................................................... 9-1
9.1 DEMAND MANAGEMENT MEASURES .......................................................................................... 9-1 9.1.1 Water Waste Prevention Ordinances ............................................................................................ 9-1

2015 Urban Water Management Plan Table of Contents June 2016 Final
City of Oceanside iii
9.1.2 Metering ...................................................................................................................................... 9-2 9.1.3 Conservation Pricing .................................................................................................................... 9-2 9.1.4 Public Education and Outreach ................................................................................................... 9-3 9.1.5 Programs to Assess and Manage Distribution System Real Loss .................................................. 9-6 9.1.6 Water Conservation Program Coordination and Staffing Support ................................................. 9-6 9.1.7 Other Demand Management Measures ......................................................................................... 9-6
9.2 CALIFORNIA URBAN WATER CONSERVATION COUNCIL REPORTING ................................... 9-7
SECTION 10: PLAN ADOPTION, SUBMITTAL, AND IMPLEMENTATION ........... 10-1
10.1 2015 WATER USE DATA ............................................................................................................... 10-1 10.2 PLAN NOTICING AND ADOPTION .............................................................................................. 10-1 10.3 PLAN SUBMITTAL .......................................................................................................................... 10-2 10.4 PLAN AMENDMENT ...................................................................................................................... 10-2
SECTION 11: REFERENCES ............................................................................................. 11-1
List of Tables
Table ES-1: Organizational Overview of the 2015 UWMP ................................................................. ES-1 Table ES-2: Summary of Projected Supplies (AFY) .............................................................................. ES-3 Table ES-3: Baselines and Targets Summary .......................................................................................... ES-3 Table ES-4: Summary of Projected Demands (AFY) ........................................................................... ES-4 Table 2-1: Public Water System ................................................................................................................... 2-1 Table 2-2: Plan Identification ....................................................................................................................... 2-1 Table 2-3: Agency Identification ................................................................................................................. 2-1 Table 2-4: Water Supplier Information Exchange .................................................................................... 2-2 Table 2-5: Coordination with Appropriate Agencies ............................................................................... 2-2 Table 3-1: City of Oceanside Climate Characteristics .............................................................................. 3-4 Table 3-2: Current and Projected Land Use (acres) .................................................................................. 3-4 Table 3-3: Population – Historical .............................................................................................................. 3-6 Table 3-4: Population – Current and Projected ........................................................................................ 3-6 Table 3-5: Potential Climate Change Impacts to the San Diego Region ............................................... 3-6 Table 3-6: City of Oceanside Climate Change Vulnerabilities ................................................................ 3-7 Table 3-7: Tier 1 Climate Change Strategies Applicable to the City of Oceanside .............................. 3-8 Table 4-1: Demands for Potable and Raw Water – 2015 Actual ............................................................ 4-4 Table 4-2: Baseline and Projected Water Use (AFY)*.............................................................................. 4-5 Table 4-3: Demands for Potable and Raw Water - Projected ................................................................. 4-6 Table 4-4: Total Water Demands (AFY) .................................................................................................... 4-7 Table 4-5: Water Loss Summary Most Recent 12 Month Period Available ......................................... 4-7 Table 4-6: Low-Income Projected Water Demands (AFY) .................................................................... 4-8 Table 4-7: Inclusion of Estimated Water Savings in Water Use Projections ........................................ 4-8 Table 4-8: Agency Demand Projections Provided to Wholesale Supplier (AFY) ................................ 4-9 Table 5-1: Annual Gross Water Use ........................................................................................................... 5-2 Table 5-2: Confirm Minimum Reduction for 2020 Target ...................................................................... 5-4 Table 5-3: Baselines and Targets Summary ................................................................................................ 5-4

2015 Urban Water Management Plan Table of Contents June 2016 Final
City of Oceanside iv
Table 5-4: 2015 Compliance ......................................................................................................................... 5-4 Table 6-1: Summary of Historical and Projected Supplies (AFY) .......................................................... 6-1 Table 6-2: Historical Water Supplies (in FY) ............................................................................................. 6-3 Table 6-3: Water Supplies – 2015 Actual ................................................................................................... 6-3 Table 6-4: Water Supplies - Projected ......................................................................................................... 6-5 Table 6-5: Groundwater Volume Pumped (AFY) .................................................................................... 6-8 Table 6-6: Transfer and Exchange Opportunities .................................................................................... 6-8 Table 6-7: Wastewater Generated Within Service Area in 2015 ........................................................... 6-12 Table 6-8: Wastewater Treatment and Discharge within Service Area in 2015 .................................. 6-13 Table 6-9: Current and Projected Recycled Water Use .......................................................................... 6-17 Table 6-10: 2010 UWMP Recycled Water Use Projection Compared to 2015 Actual Use .............. 6-18 Table 6-11: Methods to Expand Future Recycled Water Use ............................................................... 6-19 Table 6-12: Future Water Supply Projects ............................................................................................... 6-21 Table 7-1: Factors Resulting in Inconsistency in Supply ......................................................................... 7-1 Table 7-2 Basis of Water Year Data ............................................................................................................ 7-3 Table 7-3: Demand and Supply Assumptions, as Percent of Normal ................................................... 7-4 Table 7-4: Normal Year Supply and Demand Comparison .................................................................... 7-5 Table 7-5: Single Dry Year Supply and Demand Comparison ............................................................... 7-5 Table 7-6: Extraordinary Conservation in the Third Year of a Multiple Dry Year Scenario (AF) .... 7-6 Table 7-7: Multiple Dry Year Supply and Demand Comparison ........................................................... 7-6 Table 8-1: Stages of Water Shortage Contingency Plan ........................................................................... 8-2 Table 8-2 Retail Only: Restrictions and Prohibitions on End Uses ....................................................... 8-5 Table 8-3: Penalties and Charges ................................................................................................................. 8-7 Table 8-4: Stages of WSCP - Consumption Reduction Methods ........................................................... 8-7 Table 8-5: Level 2 Drought Alert Rates: up to 20% Mandatory Reduction ........................................ 8-9 Table 8-6: Level 3 Drought Alert Rates: up to 20% Mandatory Reduction ...................................... 8-10 Table 8-7: Level 4 Drought Alert Rates: up to 20% Mandatory Reduction ...................................... 8-10 Table 8-8: Minimum Supply Next Three Years ...................................................................................... 8-11 Table 9-1: Residential Customer Billing Rates ........................................................................................... 9-2 Table 9-2: Commercial Customer Billing Rates ........................................................................................ 9-3 Table 9-3: Residential Water Conservation Rebate................................................................................... 9-4 Table 9-4: Commercial Water Conservation Rebates ............................................................................... 9-5 Table 10-1 Retail: Notification to Cities and Counties ........................................................................... 10-1

2015 Urban Water Management Plan Table of Contents June 2016 Final
City of Oceanside v
List of Figures
Figure ES-1: Historical, Current, and Projected Water Use and Supply for City of Oceanside ..... ES-4 Figure 1-1: 2015 Plan in Relation to Other Planning Efforts ................................................................. 1-3 Figure 1-2: Table Presentation in 2015 Plan .............................................................................................. 1-4 Figure 3-1: City of Oceanside Service Area ............................................................................................... 3-3 Figure 3-2: Average Annual Water Use by Customer Class 2011-2015 (Percent of Total) ................ 3-5 Figure 4-1: Historical, Current, and Projected Water Use and Supply for City of Oceanside ........... 4-1 Figure 4-2: Total Historical Water Production Volume (AFY) .............................................................. 4-3 Figure 4-3: Projected 2020 Regional (SDCWA) Supply Mix ................................................................. 4-10 Figure 6-1: Historical and Projected Supply Mix (AFY) .......................................................................... 6-1 Figure 6-2: City of Oceanside Local Supplies ............................................................................................ 6-2
Appendices
APPENDIX A - .......................................................................................... DWR CHECKLIST
APPENDIX B - .................... REQUIRED TABLES: DWR TABLES AND SBX7-7 TABLES
APPENDIX C- ................................. CLIMATE CHANGE VULNERABILITY ANALYSIS
APPENDIX D- ......................................................................... AWWA WATER LOSS AUDIT
APPENDIX E- ........................................................................... DROUGHT ORDINANCES
APPENDIX F- ................................ WATER EFFICIENT LANDSCAPING ORDINANCE
APPENDIX G- .............................................................. RECYCELD WATER ORDINANCE
APPENDIX H- ... CUWCC BEST MANAGEMENT PRACTICES REPORTING 2013/2014
APPENDIX I- ..................................................................................... NOTIFICATION LIST
APPENDIX J- ............................................................................ ADOPTION RESOLUTION

2015 Urban Water Management Plan Table of Contents June 2016 Final
City of Oceanside vi
Page intentionally blank.

2015 Urban Water Management Plan List of Abbreviations June 2016 Final
City of Oceanside i
LIST OF ABBREVIATIONS
2015 Guidebook 2015 Urban Water Management Plans Guidebook for Urban Water Suppliers 2015 Plan 2015 Urban Water Management Plan AC Asbestos cement AF Acre-feet AFY Acre-feet per year AMI Smart meters AWWA American Water Works Association CII Commercial, Industrial and Institutional City City of Oceanside CMWD Carlsbad Municipal Water District CWC California Water Code CY Calendar Year DIR Demand-initiated regenerating DMM Demand management measures DOF California Department of Finance DSS Decision Support System DWR California Department of Water Resources ETo Evapotranspiration FPUD Fallbrook Public Utility District GHG Greenhouse gas GIS Geographic Information System GPCD Gallons per capita per day HE High efficiency IID Imperial Irrigation District IPR Indirect potable reuse IRWM Integrated Regional Water Management MBGPF Mission Basin Groundwater Purification Facility Methodologies Methodologies for Calculating Baseline and Compliance Urban per Capita
Water Use MGD Million gallons per day MOU Memorandum of Understanding MWD Metropolitan Water District of Southern California NCDP North County Distribution Pipeline NOAA National Oceanic and Atmospheric Administration NSDWRC North San Diego Water Reuse Coalition PRS Pressure reducing stations QSA Quantification Settlement Agreement RAC Regional Advisory Committee RMC RMC Water and Environment RMWD Rainbow Municipal Water District RWFP Recycled Water Facilities Plan RWMG Regional Water Management Group SANDAG San Diego Association of Governments SBx7-7 Senate Bill X7-7

2015 Urban Water Management Plan List of Abbreviations June 2016 Final
City of Oceanside ii
SDCWA San Diego County Water Authority SRTTP South Regional Tertiary Treatment Plant SWP State Water Project TCP Trichloropropane TSS Total Suspended Solids UWMP Urban Water Management Plan UWMP Act Urban Water Management Planning Act VID Vista Irrigation District WCMP Water Conservation Master Plan WFP Water Filtration Plant WRF Water Reclamation Facility WWTP Wastewater Treatment Plant

2015 Urban Water Management Plan Executive Summary June 2016 Final
City of Oceanside ES-1
EXECUTIVE SUMMARY
ES.1 Purpose and Organization
Preparation of an Urban Water Management Plan (UWMP) is required by the California Department of Water Resources (DWR) for all urban water suppliers within the State of California. Urban water suppliers are defined as publicly or privately owned water suppliers that provide water for municipal purposes, either directly or indirectly, to more than 3,000 customers or supply more than 3,000 acre-feet (AF) of water annually. UWMPs must meet requirements established by the California Water Code (CWC) and the Urban Water Management Planning Act (Act).
This report constitutes the 2015 Urban Water Management Plan (2015 Plan) for the City of Oceanside (City), which must be adopted by the Oceanside City Council and submitted to DWR by July 1, 2016. This 2015 Plan satisfies the requirements of the CWC, the Act, and subsequent amendments. In addition to satisfying regulatory requirements, this report is a resource document that includes an analysis of long-term water supply and demand planning for the City’s service area. Table ES-1 includes a summary of each section of this 2015 Plan.
Table ES-1: Organizational Overview of the 2015 UWMP
Section Information Contained within Section Section 1:
Introduction and Overview
General legal requirements for 2015 UWMPs Local planning efforts Plan organization
Section 2: Plan Preparation
Plan preparation Agency coordination and public outreach
Section 3: System Description
Overview of City’s service area and water system Hydrologic and climate characteristics Development within the City’s service area Current and projected population and demographic figures Overview of potential impacts of climate change
Section 4: System Water Use
Overview of the City’s water use sectors Information about existing and projected water use System water losses Water demands for lower income households Wholesale demand projections Climate change impacts on water use
Section 5: Baselines and Targets
Overview of water conservation mandates Baseline gross per capita water use Updated target method Urban water use targets for 2015 and 2020 2015 target compliance
Section 6: System Supplies
Description of existing and projected supplies, including: o Purchased and imported water o Groundwater o Wastewater and recycled water
Description of planned future water projects Climate change impacts to supplies

2015 Urban Water Management Plan Executive Summary June 2016 Final
City of Oceanside ES-2
Section Information Contained within Section
Section 7: Supply Reliability
Assessment
Constraints on each of the City’s supplies Projections for water supply and water demands under normal,
single dry, and multiple dry year conditions Regional supply reliability
Section 8: Water Shortage
Contingency Planning
Description of the City’s drought ordinances Overview of the City’s water shortage stages Prohibitions and penalties enacted during water shortages Methods for reducing water use Catastrophic supply interruption plan Minimum supply available for the next three years
Section 9: Demand Management
Measures
Summary of the City’s demand management measures implemented over the past five years
Summary of future DMM implementation Section 10: Plan
Adoption, Submittal, and Implementation
Summary of 2015 Plan noticing and adoption process Plan submittal and amendment
Section 11: References
Full citations for references used throughout the 2015 Plan
ES.2 Service Area Background and Water Supplies
The City of Oceanside is located in northern San Diego County, encompassing approximately 42 square miles. The City is bordered by the Pacific Ocean to the west, Camp Pendleton Marine Base to the north, the City of Carlsbad to the south, and the City of Vista and unincorporated San Diego County to the east.
The City is characterized by a mild, coastal climate. Temperatures range from 54ºF on average in December to 71ºF on average in August. Annual precipitation averages 10.3 inches, although recent years have experienced a historically dry period, reducing average annual rainfall by as must as 52% of normal. The majority of the rainfall received occurs between January and March.
The City’s current water supplies include water purchased from San Diego County Water Authority (SDCWA), groundwater, and recycled water. The City’s current potable water sources include a blend of imported and desalinated seawater from SDCWA and local groundwater from the Mission Basin. Local groundwater is pumped from the Mission Basin and treated at the Mission Basin Groundwater Purification Facility (MBGPF). The primary MBGPF treatment process utilizes reverse osmosis membranes to reduce salt concentrations present in the groundwater. Recycled water is treated at the San Luis Rey Wastewater Treatment Plant (WWTP) and used for non-potable use to offset demands for potable water.
SDCWA is the regional wholesale water agency in San Diego County, and serves 24 member agencies, including the City of Oceanside. SDCWA’s supply mix includes Colorado River water, State Water Project (SWP) water, and desalinated seawater. SDCWA purchases supplies from the Metropolitan Water District of Southern California (MWD), which receives its supplies primarily from the SWP and the Colorado River. SDCWA also receives Colorado River water via transfers from Imperial Irrigation District (IID) and conservation savings from several canal-lining projects. Both of these sources have become increasingly unreliable since the early 1990s as a result of significant droughts, water rights issues, and environmental restrictions. SDCWA also purchases desalinated seawater and blends it into member agency supplies.

2015 Urban Water Management Plan Executive Summary June 2016 Final
City of Oceanside ES-3
Moving forward, the City plans to increase local supply reliability and offset demands for imported water by increasing groundwater production, expanding its recycled water distribution system, and implementing potable reuse. Wastewater from San Luis Rey WWTP would be advanced treated and stored in the Mission Basin for groundwater recharge. The potable reuse project will allow the City to expand the beneficial reuse of local wastewater and improve local supply reliability. Table ES-2 provides a summary of the City’s projected water supplies from 2020 – 2040.
Table ES-2: Summary of Projected Supplies (AFY)
Supply 2020 2025 2030 2035 2040 Purchased SDCWA Supply 24,728 24,215 22,913 23,130 23,036 Groundwater 3,300 3,700 3,700 3,700 3,700 Recycled Water (Non-Potable) 400 1,700 2,900 3,060 3,500 Advanced Treated Water (Potable Reuse) 3,300 3,300 3,300 3,300 3,300 Total 31,728 32,915 32,813 33,190 33,536
ES.3 Current and Projected Demands
The City’s historical water demands have varied from year to year, which can be attributed to annual variations in weather, economic activity, and droughts. All urban water suppliers in California are mandated by the Water Conservation Act of 2009 (also referred to as SBx7-7) to reduce per capita potable water demands by 20% by the year 2020. For 2015, the City was required to have a per capita water use (measured in gallons per capita per day [GPCD]) of 154 GPCD. The City’s actual potable water demands for 2015 were 116 GPCD, which is well below the 2015 target. Reduced demands in the City’s service area are likely the result of ongoing conservation programs that have been implemented in response to the SBx7-7 legislation, as well as enhanced conservation that is currently in effect in response to a multi-year drought and associated state-mandated emergency conservation requirements. Although the demand analysis demonstrates that there is anticipated to be a rebound effect (increased demands) when the drought subsides, with existing and anticipated conservation efforts, the City is on track to meet its 2020 water use target of 137 GPCD. Table ES-3 provides a summary of the calculated baseline and water use targets for the 2015 Plan.
Table ES-3: Baselines and Targets Summary
Baseline Period Start Years End Years Average
GPCD 2015 Target 2020 Target
10-15 year 1999 2008 171 154 137
Concurrently with this 2015 Plan, the City developed the Water Conservation Master Plan Update (WCMP Update). As part of this effort, the City projected water use, passive conservation, and active conservation into the future. Moving forward, the City assumes implementation of aggressive water conservation, smart meters, and further implementation of recycled water conversions; together, these were considered “Program B” in the WCMP Update. Water use projections, with and without conservation savings, are shown in Table ES-4.

2015 Urban Water Management Plan Executive Summary June 2016 Final
City of Oceanside ES-4
Table ES-4: Summary of Projected Demands (AFY)
2020 2025 2030 2035 2040 Baseline Demands 33,371 36,006 37,227 38,001 38,754 Demands with Passive Conservation (Plumbing Code) 32,641 34,479 34,976 35,263 35,641
Demands with Passive and Active Conservation (Plumbing Code and Program B) 31,728 32,915 32,813 33,190 33,537
Figure ES-1 shows historical and projected water use, by use sector. Recycled (non-potable) water is also shown to provide a comprehensive image of the City’s water supply portfolio.
Figure ES-1: Historical, Current, and Projected Water Use and Supply for City of Oceanside

2015 Urban Water Management Plan Executive Summary June 2016 Final
City of Oceanside ES-5
ES.4 Water Supply Reliability
One of the key requirements of UWMPs is the inclusion of a long-term supply reliability analysis that demonstrates the supply-demand balance in normal, single dry year, and multiple dry year hydrologic conditions. Consistent with SDCWA’s 2015 UWMP, the City projects increased demands (as weather conditions get hotter and drier) during single and multiple dry year scenarios.
The City anticipates no reduction of groundwater supplies for any hydrologic scenario. Groundwater is generally a drought-proof supply because the City’s projected extraction is well below the normal year safe yield. Both advanced treated potable reuse supplies and tertiary recycled water supplies are drought-proof supplies that would remain available during all scenarios. Because local supplies would not increase in availability, however, the City would need to purchase additional water from SDCWA to meet demands. For all years that SDCWA projects supply reliability, the City assumes it will be able to purchase sufficient water from SDCWA to meet demands. Should SDCWA project potential supply deficits, the City would implement extraordinary conservation or convert additional customers to recycled water.
The City’s water supply reliability analysis shows that with implementation of additional planned supplies and conservation measures, supplies will meet demands under all hydrologic scenarios.
ES.5 Water Shortages and Demand Management
The City has four ordinances in place that address water shortages and give the City the authority to prohibit water waste and encourage water use efficiency. Each ordinances is updated as-needed to stay current with State regulations.
Water Conservation Program and Drought Response Conservation Measures for Mandatory Water Reductions (Ordinance No. 08-OR0439-1)
Updates to Water Conservation Program and Drought Response Conservation Measures (Ordinance No. 15-OR0276-1)
Water Efficient Landscaping (Ordinance No. 10-OR0412-1) Recycled Water (Ordinance No. 14-OR0565-1)
The City’s Drought Ordinance includes a sequential, regulatory program of increasingly stringent prohibitions on the use of water delivered within the City. It establishes four levels of drought response actions to be implemented in times of shortage. When the City declares that a particular stage is in effect, City customers must comply with all regulations contained in the declared stage.
The City also engages in a variety of public education and outreach efforts to improve water use management, education, and efficiency. The City provides water conservation messaging to customers through www.SaveWaterOceanside.com, staffs a ‘Save Water Oceanside’ booth at community events, provides workshops on water related themes, offers two school education programs, and offers various rebates in combination with SoCal WaterSmart Program.

2015 Urban Water Management Plan Executive Summary June 2016 Final
City of Oceanside ES-6
Page intentionally blank.

2015 Urban Water Management Plan Section 1: Introduction and Overview June 2016 Final
City of Oceanside 1-1
SECTION 1: INTRODUCTION AND OVERVIEW
This 2015 Urban Water Management Plan (2015 Plan) addresses the City of Oceanside (City) and includes descriptions of the water supply sources, projected water demands, and supply reliability. The Plan presents a comparison of projected water supplies to water demands during normal, single-dry, and multiple-dry years. This chapter provides an introduction to the purpose of the 2015 Plan, an overview of the Urban Water Management Planning Act (UWMP Act), and an explanation of 2015 Plan organization.
1.1 Background and Purpose
Water planning has become increasingly critical as California endures the ongoing drought and prepares for expected long-term climate changes. Prior to the adoption of the UWMP Act, water suppliers were not required to conduct long-term water resources planning, which could leave agencies vulnerable to supply disruptions during periods of drought or other supply shortages. The UWMP Act was adopted to require a minimum level of resource assessment and planning by water suppliers in order to reduce susceptibility to supply shortages. Water resources planning at the local level also allows for local community involvement and consideration of unique circumstances and local conditions of the individual agency. This 2015 Plan is an update to the City’s 2010 Urban Water Management Plan.
1.2 Urban Water Management Planning and the California Water Code
This 2015 Plan has been prepared in accordance with the UWMP Act, as amended, California Water Code (CWC) Division 6, Part 2.6, §10610 through 10657. The UWMP Act became part of the CWC with the passage of Assembly Bill 797 during the 1983–1984 regular session of the California legislature. The Act requires every urban water supplier that provides water for municipal purposes to more than 3,000 connections or supplying more than 3,000 acre-feet (AF) of water annually to adopt and submit a plan every five years to the California Department of Water Resources (DWR). The Act was amended in November 2009 with the adoption of Senate Bill x7-7 (SBx7-7), which sets a goal of achieving a 20 % reduction in urban per capita water use statewide by 2020. This 2015 Plan recalibrates the baseline and targets established for SBx7-7 compliance in the City’s 2010 Plan. The City will be held accountable to the targets set forth in this 2015 Plan.
This 2015 Plan has been developed in accordance with DWR’s 2015 Urban Water Management Plans Guidebook for Urban Water Suppliers (2015 Guidebook), which provides guidance to agencies on how to include the information required under the CWC, as amended. Appendix A includes the 2015 Guidebook’s checklist indicated where each applicable section of the CWC has been addressed in this 2015 Plan. In accordance with the CWC, this 2015 Plan must be adopted and submitted to DWR by July 1, 2016. The UWMP Act states that urban water suppliers should make every effort to assure the appropriate level of reliability in its water service, such that it is sufficient to meet the needs of its various categories of customers during normal, dry, and multiple dry years.

2015 Urban Water Management Plan Section 1: Introduction and Overview June 2016 Final
City of Oceanside 1-2
1.3 Urban Water Management Plans in Relation to Other Planning Efforts
Urban Water Management Plans (UWMPs) allow for integration of information from other planning documents, as well as regional planning efforts. This 2015 Plan synthesizes information from the City’s current planning documents and compliments regional planning documents. Upon completion, the 2015 Plan will help to inform other planning decisions, such as updates to the City of Oceanside General Plan. Further, the information developed for this 2015 Plan will be used to inform and enhance the San Diego County Water Authority (SDCWA) 2015 Urban Water Management Plan, which provides water reliability assessment for the region’s water wholesaler. Figure 1-1 provides a visual demonstration of how the City’s planning documents relate to each other and to the 2015 Plan.
Relevant, related planning efforts include the following:
1. City of Oceanside, 2015 Water Master Plan: The Water Master Plan aids the City of Oceanside in the planning, development, and financing of its water system and facilities, to provide reliable and enhanced service for existing customers, and to serve anticipated land use changes and growth.
2. City of Oceanside, 2015 Sewer Master Plan: The Sewer Master Plan is used to help the City plan, develop, and finance wastewater collection facilities for existing and planned future growth. It acts as a strategic planning guide for upgrading, improving, and expanding the City’s wastewater collection system
3. City of Oceanside, 2015 Recycled Water Facilities Plan: The Recycled Water Facilities Plan is used by the City to identify cost-effective recycled water projects and develop a CIP for expansion of the City’s existing recycled water system.
4. City of Oceanside, 2016 Water Conservation Master Plan Update: The Water Conservation Master Plan (WCMP) Update provides information to the City on how best to expand existing water conservation programs in a cost-effective way, and how these programs will assist the City in meeting future water needs for its service area. The WCMP Update was developed in concert with this 2015 Plan to reflect changes in local demand and supply conditions (such as the recent drought), and help address how the City will meet State-mandated per capita reduction targets per SBx7-7.
5. City of Oceanside, Mission Basin Indirect Potable Reuse Feasibility Study: The Mission Basin Indirect Potable Reuse (IPR) Feasibility Study was created to investigate strategies to implement indirect potable reuse to enhance water supply reliability by recharging the Mission Groundwater Basin using advanced treated water produced by the San Luis Rey Wastewater Treatment Plant (WWTP).
6. City of Oceanside, 2010 Seawater Desalination Pilot Facility and Feasibility Study: The City completed a pilot study investigating the feasibility of adding seawater desalination to its existing Mission Basin Groundwater Purification Facility, and identifying appropriate design parameters.
7. North San Diego Water Reuse Coalition, 2015 Regional Recycled Water Project Program Environmental Impact Report: The North San Diego Water Reuse Coalition is a group of ten agencies located in northern San Diego County; the City of Oceanside being one of those ten agencies. The Regional Recycled Water Project Program Environmental Impact Report (PEIR) established the facilities associated with development of regional recycled water infrastructure and provided programmatic environmental compliance for construction

2015 Urban Water Management Plan Section 1: Introduction and Overview June 2016 Final
City of Oceanside 1-3
activities. The purpose of the program is to increase the capacity and connectivity of the recycled water storage and distribution systems of the Coalition members and maximize reuse of available wastewater.
8. SDCWA, 2015 Urban Water Management Plan: SDCWA’s 2015 UWMP provides a description and analysis of the water supplies provided to the City by SDCWA. Regional Supply reliability is assessed in light of the blend of imported and local water supplies that SDCWA provides to its member agencies.
9. Regional Advisory Committee, 2013 San Diego Integrated Regional Water Management Plan: The San Diego Integrated Regional Water Management (IRWM) Plan presents an overarching assessment of the San Diego region’s water supply, water quality, and ecosystem challenges and provides recommendations for sustainable water management.
Figure 1-1: 2015 Plan in Relation to Other Planning Efforts
1.4 2015 Plan Organization This 2015 Plan is organized into the following chapters, and generally follows the recommended outline of the 2015 Guidebook:
Chapter 1: Introduction and Overview Chapter 2: Plan Preparation Chapter 3: System Description Chapter 4: System Water Use Chapter 5: Baselines and Targets Chapter 6: System Supplies Chapter 7: Water Supply Reliability

2015 Urban Water Management Plan Section 1: Introduction and Overview June 2016 Final
City of Oceanside 1-4
Chapter 8: Water Shortage Contingency Planning Chapter 9: Demand Management Measures Chapter 10: Plan Adoption, Submittal, Implementation
This 2015 Plan also includes a series of appendices intended to clarify the contents of the UWMP and to meet requirements of the CWC and 2015 Guidebook. While the 2015 Guidebook contains a series of tables that are required to be included in the 2015 Plan, the City has elected to include additional tables, as appropriate, to clarify, highlight, or otherwise present information. Tables are numbered sequentially throughout this 2015 Plan, with a special header row added for DWR-required tables. Figure 1-2 demonstrates how tables will be presented to distinguish between DWR-required tables and those added by the City for clarity. All DWR-required tables will be presented in the body of this 2015 Plan. Both the required DWR tables and the required SBX7-7 tables have been included as Appendix B.
Figure 1-2: Table Presentation in 2015 Plan

2015 Urban Water Management Plan Section 2: Plan Preparation June 2016 Final
City of Oceanside 2-1
SECTION 2: PLAN PREPARATION CWC §1608.20
As defined in the California Water Code §10617, the City qualifies as an “Urban Water Supplier” because the City is a public agency directly providing water for municipal purposes to more than 3,000 customers. As such, the City is required to complete an Urban Water Management Plan (UWMP) every five years. This 2015 Urban Water Management Plan (2015 Plan) is an update to the City’s adopted 2010 Plan.
Preparation of the City of Oceanside’s 2015 Plan was contracted to RMC Water and Environment (RMC), as provided for in the California Water Code §10620, paragraph (e). The 2015 Plan has been prepared in conformance with the UWMP Act, California Water Code Division 6, Part 2.6, Urban Water Management Planning.
Table 2-1, Table 2-2, and Table 2-3 provide information on the City of Oceanside as a retail water agency, the water system, and how data will be reported throughout the 2015 Plan.
Table 2-1: Public Water System
DWR Table 2-1 Retail: Public Water Systems Public Water
System Number
Public Water System Name Number of Municipal
Connections 2015
Volume of Water Supplied 2015
CA3710014 City of Oceanside 43,755 25,073
Table 2-2: Plan Identification
DWR Table 2-2: Plan Identification
Individual UWMP Regional UWMP
Table 2-3: Agency Identification
DWR Table 2-3 Agency Identification Name of Agency City of Oceanside
Select one or both Agency is a wholesaler
Agency is a retailer Fiscal or Calendar Year
UWMP Tables are in Calendar Years UWMP Tables are in Fiscal Years
Units of Measure
Acre Feet (AF) Million Gallons (MG) Hundred Cubic Feet (CCF)

2015 Urban Water Management Plan Section 2: Plan Preparation June 2016 Final
City of Oceanside 2-2
2.1 Agency Coordination
CWC §10620(d)(2), §10621(b), §10631(j), §10642
During the preparation of the 2015 Plan, the City coordinated information with SDCWA, the region’s water wholesaler, as shown in Table 2-4. A list of agencies is provided in Table 2-5, along with their involvement with the preparation of this 2015 Plan.
Table 2-4: Water Supplier Information Exchange
DWR Table 2-4 Retail: Water Supplier Information Exchange The retail supplier has informed the following wholesale supplier(s) of projected water use in accordance with CWC 10631. Wholesale Water Supplier Name San Diego County Water Authority
Table 2-5: Coordination with Appropriate Agencies
Organization/Agency Name Sent 60-day UWMP Notice Carlsbad Municipal Water District X City of Carlsbad X City of Escondido X County of San Diego X Leucadia Wastewater District X Metropolitan Water District of Southern California X Olivenhain Municipal Water District X Rainbow Municipal Water District X Rincon del Diablo Municipal Water District X San Diego Association of Governments X San Diego County Water Authority X San Elijo Joint Powers Authority X Santa Fe Irrigation District X U.S. Marine Corps Base Camp Pendleton X Vallecitos Water District X Valley Center Municipal Water District X Vista Irrigation District X

2015 Urban Water Management Plan Section 2: Plan Preparation June 2016 Final
City of Oceanside 2-3
2.2 Public Participation
CWC §10642
The City actively encouraged community participation in its urban water management planning efforts. A Public Hearing was held before the City Council on June 22, 2016, immediately prior to the City Council’s adoption of the 2015 Plan. The public hearing was advertised in the North County Times twice, on June 8 and 15, 2016. Additionally, a public hearing notice was posted on the City’s web site (http://www.ci.oceanside.ca.us) concurrent with release of this 2015 Plan. The 2015 Plan is available for public review at:
Water Utilities Department Oceanside City Hall 300 North Coast Highway Oceanside, California 92054

2015 Urban Water Management Plan Section 2: Plan Preparation June 2016 Final
City of Oceanside 2-4
Page intentionally blank

2015 Urban Water Management Plan Section 3: System Description June 2016 Final
City of Oceanside 3-1
SECTION 3: SYSTEM DESCRIPTION CWC §10631; §10631(a)
The City’s current water supplies include water purchased from SDCWA, groundwater, and recycled water. The City’s current potable water sources include a blend of imported and desalinated seawater from SDCWA and local groundwater from the Mission Basin. Local groundwater is pumped from the Mission Basin and treated at the Mission Basin Groundwater Purification Facility (MBGPF). The primary MBGPF treatment process utilizes reverse osmosis membranes to reduce salt concentrations present in the groundwater. Recycled water is treated at the San Luis Rey WWTP and used for non-potable use to offset demands for potable water.
SDCWA is the regional wholesale water agency in San Diego County, and serves 24 member agencies, including the City of Oceanside. SDCWA’s supply mix includes imported water and desalinated seawater. SDCWA purchases supplies from the Metropolitan Water District of Southern California (MWD), which receives its supplies primarily from the SWP and the Colorado River. SDCWA also receives Colorado River water via transfers from Imperial Irrigation District (IID) and conservation savings from several canal-lining projects. Both of these sources have become increasingly unreliable since the early 1990s as a result of significant droughts, water rights issues, and environmental restrictions. SDCWA also purchases desalinated seawater and blends it into member agency supplies.
The City’s potable water supply system includes connections to SDCWA’s aqueducts, as well as the City’s MBGPF. The City has five connections with SDCWA’s filtered and untreated imported water aqueducts, referred to as Flow Control Facilities (FCFs). These FCFs include connections on Pipelines No. 1 and No. 2, the CWA Tri-Agency Pipeline, and the North County Distribution Pipeline (NCDP). FCF 2, 3, and 5 connect directly with the SDCWA aqueducts and supply both potable and raw water. FCF 4 connects to the SDCWA system via the Tri-Agency Pipeline which is a 7.2 mile long pipeline that provides treated water to the City, Carlsbad Municipal Water District, Vista Irrigation District, and Vallecitos Water District. FCF 6 connects to SDCWA’s regional system via the NCDP, a 4.5 mile pipeline that runs east-west between SDCWA’s Second Aqueduct and the City.
The City receives both treated and untreated water from SDCWA. The City’s 25 MGD Robert A. Weese Water Filtration Plant (WFP) is used to treat raw water from SDCWA to potable standards. Treated water from SDCWA is conveyed directly into the City’s water distribution system. The WFP is located near the City’s Connections 2, 3, and 5 to SDCWA Aqueduct 3, 4, and 5. Local groundwater is treated at the City’s 6.3 MGD MBGPF. The MBGPF treats brackish groundwater extracted from the Mission Basin via eight wells owned and operated by the City. Recycled water is produced by the City at the San Luis Rey WWTP, and currently distributed via the City’s non-potable water distribution system. More information on recycled water is provided in Chapter 6 System Supplies.
Rehabilitation of the Fire Mountain Reservoir

2015 Urban Water Management Plan Section 3: System Description June 2016 Final
City of Oceanside 3-2
The City’s water distribution system includes 12 storage reservoirs located throughout the water system. At least one storage reservoir is located in each of seven primary pressure zones (out of a total of 28 pressure zones). Some of the primary pressure zones have subzones that are supplied via pumping or via pressure reducing stations if the subzone ground elevations are either higher or lower than a primary pressure zone. In addition to the storage reservoirs, the City operates 9 booster pump stations, 2 water supply pumping stations, 54 pressure regulating stations, and 7 altitude valves. Potable water is distributed to customers through 574 miles of pipelines extending throughout the City and ranging from 2 to 42 inches in diameter. The majority of the piping in the system is 8 inches in diameter and is made of asbestos cement (AC) pipe.
The City’s non-potable water system includes the San Luis Rey WWTP, which has a tertiary treatment capacity of 0.7 MGD and a secondary treatment capacity of 13.5 MGD. Tertiary recycled water is conveyed from the San Luis Rey WWTP to maintain the lake level at Whelan Lake and to irrigate the Oceanside Municipal Golf Course. Additional information on the City’s non-potable system is provided in Chapter 6 System Supplies.
3.1 Service Area Physical Description The City is located 35 miles north of the City of San Diego, and encompasses approximately 42 square miles. It is bordered on the west by the Pacific Ocean, the north by Camp Pendleton Marine Base, the south by the City of Carlsbad, and on the east by the City of Vista and unincorporated San Diego County. A map of the City and surrounding municipalities is shown in Figure 3-1.
3.1.1 Agency Organizational Structure
The City of Oceanside was incorporated as a general law city in 1888, pursuant to the California Constitution Article XI and the California Government Code. The City is governed by an elected five-member council. The City is a full service city, providing water and wastewater services through its Water Utilities Department, under the purview of the City Council.
3.1.2 Service Area Climate
The City of Oceanside has a mild, coastal climate. As shown in Table 3-1, the average annual temperature is 60ºF. Average rainfall is 10.3 inches as measured at the National Weather Service Oceanside Marina Weather Station 046377. This rainfall total is typical for Southern California, which is low compared with the national average. Recent years (2012 through 2105) have experienced a historically dry period of ongoing drought in which the City’s annual rainfall fell as much as 52% of normal. Evapotranspiration (ETo) is the quantity of moisture that is both transpired by plants and evaporated by the soil plant surfaces. ETo is important to irrigation management because crop yield relates directly to ETo. Irrigators who are working to achieve maximum yields need to apply water to meet the crop's ETo demand. As shown, the largest ETo demands occur in the summer months.

SOURCE: City of Oceanside, ESRI
N:\P
rojec
ts\03
02 O
cean
side,
City
of\03
02-0
07_O
cean
side 2
015 U
WMP
\04_G
IS\M
XDs\O
cean
side_
Servi
ceAr
ea_F
igure
3-1_
0510
16.m
xd
")
")
%,
%,
Pacific OceanRobert A.
Weese WTP
Twin Oaks Valley WTP
Claude "Bud" Lewis Carlsbad Desalination Plant
Mission Basin Groundwater Purification Facility
BATIQUITOS LAGOON
AGUA HEDIONDA LAGOON
BUENA VISTA LAGOON
SAN MARCOS LAKE
WHALEN LAKE
WINDMILL LAKE
TALONE LAKE
MAERKLE DAM
CALAVERAS LAKE
GUAJOME LAKE
POND 9A
HUBBERT LAKE
MORRO RESERVOIR
POND 1B
San
Luis
Rey
Riv
er
Agua Hedionda Creek
Buena Vista Creek
Santa Margarita River
San Marcos Creek
Sources: Esri, HERE, DeLorme, USGS, Intermap, increment P Corp., NRCAN, Esri Japan, METI, EsriChina (Hong Kong), Esri (Thailand), MapmyIndia, © OpenStreetMap contributors, and the GIS UserCommunity
City of Oceanside
Local Cities
San Diego County WaterAuthority Aqueduct
") Water Treatment Plant
%, Desalination Plant
City of Oceanside WaterDistrict
Carlsbad Municipal WaterDistrict
Vista Irrigation District
Rivers
Water Body
Figure 3-1City of Oceanside
Service Area
¯0 1 20.5 Miles
OceansideVista
Carlsbad
2015 Urban Water Management Plan Section 3: System Description June 2016 Final
City of Oceanside 3-4
Table 3-1: City of Oceanside Climate Characteristics1
Jan Feb Mar Apr May Jun July Aug Sep Oct Nov Dec Annual Standard Monthly Average ETo Demand (in)
1.9 2.2 3.4 4.5 5.3 5.7 5.9 5.6 4.5 3.4 2.4 1.9 46.6
Average Rainfall (in) 2.6 2.9 2.1 1.0 0.2 0.1 0.1 0.1 0.2 0.7 1.1 1.9 10.3
Average Temperature (ºF)
55 55 57 60 63 66 70 71 70 65 59 54 60
Source: NOAA, 2015 1 Normal rainfall and temperature based on 30 years of data (1981-2010), taken as the average across six weather stations in the vicinity of the City of Oceanside, as provided by NOAA, 2015.
3.1.3 Existing and Future Development within Service Area
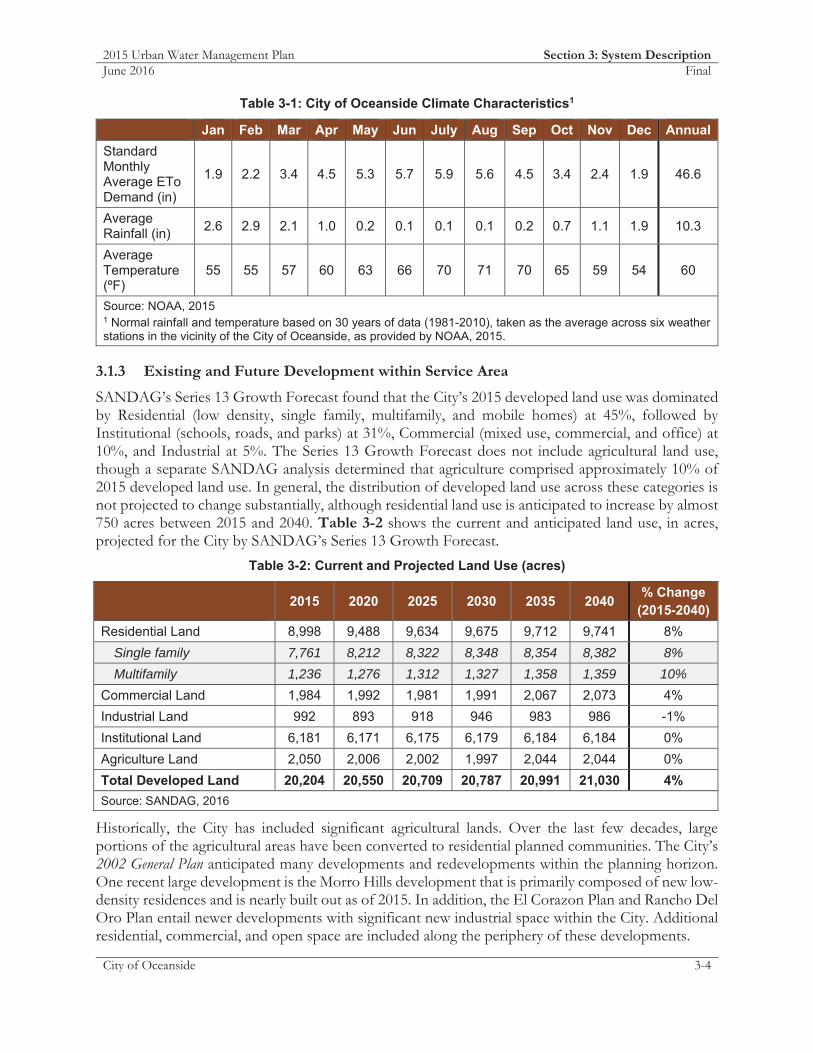
SANDAG’s Series 13 Growth Forecast found that the City’s 2015 developed land use was dominated by Residential (low density, single family, multifamily, and mobile homes) at 45%, followed by Institutional (schools, roads, and parks) at 31%, Commercial (mixed use, commercial, and office) at 10%, and Industrial at 5%. The Series 13 Growth Forecast does not include agricultural land use, though a separate SANDAG analysis determined that agriculture comprised approximately 10% of 2015 developed land use. In general, the distribution of developed land use across these categories is not projected to change substantially, although residential land use is anticipated to increase by almost 750 acres between 2015 and 2040. Table 3-2 shows the current and anticipated land use, in acres, projected for the City by SANDAG’s Series 13 Growth Forecast.
Table 3-2: Current and Projected Land Use (acres)
2015 2020 2025 2030 2035 2040 % Change (2015-2040)
Residential Land 8,998 9,488 9,634 9,675 9,712 9,741 8% Single family 7,761 8,212 8,322 8,348 8,354 8,382 8% Multifamily 1,236 1,276 1,312 1,327 1,358 1,359 10%
Commercial Land 1,984 1,992 1,981 1,991 2,067 2,073 4% Industrial Land 992 893 918 946 983 986 -1% Institutional Land 6,181 6,171 6,175 6,179 6,184 6,184 0% Agriculture Land 2,050 2,006 2,002 1,997 2,044 2,044 0% Total Developed Land 20,204 20,550 20,709 20,787 20,991 21,030 4% Source: SANDAG, 2016
Historically, the City has included significant agricultural lands. Over the last few decades, large portions of the agricultural areas have been converted to residential planned communities. The City’s 2002 General Plan anticipated many developments and redevelopments within the planning horizon. One recent large development is the Morro Hills development that is primarily composed of new low-density residences and is nearly built out as of 2015. In addition, the El Corazon Plan and Rancho Del Oro Plan entail newer developments with significant new industrial space within the City. Additional residential, commercial, and open space are included along the periphery of these developments.

2015 Urban Water Management Plan Section 3: System Description June 2016 Final
City of Oceanside 3-5
3.1.4 Overview of Water Uses in Service Area
Figure 3-2 is the average annual consumption of the various water user categories, based on average historical monthly water use and account data for years 2007 to 2011 for all customer categories. Reflecting the developed land uses described above, the largest water sector in the City is residential at 61% of the City’s total water use. Single family residential customers comprise 46%, while multifamily residential customers comprise 15%. Irrigation users, which include schools, parks, and other large irrigators, make up the next largest use category at 20% of total water use. Commercial and industrial uses total 13%, and agricultural uses comprise 5%. The City’s recycled water deliveries currently total less than 1% of total water use.
Figure 3-2 illustrates the distribution of water use by customer class as an average over the 5 years from 2007-2011. Note that the Fall/Olive Exchange is incorporated into single family use, and losses are excluded from the figure. An overview of these water use categories is provided in Chapter 4 System Water Use.
Figure 3-2: Average Annual Water Use by Customer Class 2007-2011 (Percent of Total)
3.2 Service Area Population and Demographics Historical and projected City population estimates are shown in Table 3-3 and Table 3-4, respectively. Historical data were gathered from California’s Department of Finance (DOF) for the City of Oceanside (DOF 2015). Consistent with the 2015 Guidebook, and as described in Section 5 Baselines and Targets, DOF projections were used because the City of Oceanside’s water service area covers 95% of the City of Oceanside. Projected population for the City was determined by interpolating data from San Diego Association of Governments’ (SANDAG) Series 13 2050 Regional Growth Forecast, provided to SDCWA member agencies for the 2015 UWMP planning process.
Single Family, 46%
Multifamily, 15%
Commercial, 10%
Irrigation, 20%
Agricultural, 5%
Reclaimed Water, 1% Industrial, 3%

2015 Urban Water Management Plan Section 3: System Description June 2016 Final
City of Oceanside 3-6
Table 3-3: Population – Historical
Population Served 2000 2005 2010
161,624 166,859 167,086 Annual Increase - 3.24% 3.58%
Source: DOF. 2015. E-8 Historical Population and Housing Estimates for Cities, Counties, and the State.
Table 3-4: Population – Current and Projected
DWR Table 3-1 Retail: Population - Current and Projected
Population Served 20151 2020 2025 2030 2035 2040
171,183 176,510 181,489 186,140 187,397 188,428 1 Calculated as midpoint between the 2010 Census and 2020 SANDAG forecast Source: SDCWA. 2015. SANDAG Series 13 Growth Forecast for the City of Oceanside.
3.3 Climate Change
The City is an active participant in the San Diego Integrated Regional Water Management (IRWM) Program. The San Diego IRWM Program updated its IRWM Plan in 2013, which included a climate change vulnerability assessment consistent with the IRWM Guidelines. This assessment has been incorporated here as Appendix C. For the San Diego Region, encompassing the coastal-draining watersheds in San Diego County, climate change is anticipated to result in a number of impacts that could affect the City. Table 3-5 presents those potential regional climate change impacts that are anticipated to be realized for the City, while Table 3-6 presents prioritized climate change vulnerabilities, adapted from the San Diego IRWM Program’s climate change assessment to reflect vulnerabilities of greatest concern to the City.
Table 3-5: Potential Climate Change Impacts to the San Diego Region
Impact Effect Temperature 1.5°F to 4.5°F average temperature increase
Rainfall Variable projections predict between 35% drier and 17% wetter Increase in variability between years
Supply Up to 25% decrease in SWP supply Up to 20% decrease in Colorado River supply 164,000 acre-feet per year shortfall in imported supply
Demand Potential 0.6% to 1.8% increase in demand by 2035 Sea level rise 12 to 18 inch rise in mean sea level rise
Wildfires 40% increase in California Coastal Shrub acreage burned in Southwestern U.S. 54% increase in overall acreage burned in Western U.S.
Source: RWMG, 2013.

2015 Urban Water Management Plan Section 3: System Description June 2016 Final
City of Oceanside 3-7
Table 3-6: City of Oceanside Climate Change Vulnerabilities
Priority Level Category and Vulnerability Issue Very High Water Supply: Decrease in imported supply
High
Water Supply: Sensitivity due to higher drought potential Water Quality: Increased constituent concentrations Flooding: Increases in flash flooding and inundation (extreme weather) Ecosystem/Habitat: Decrease in available necessary habitat Sea Level Rise: Inundation of storm drains and sewer systems Ecosystem/Habitat: Decrease in ecosystem services
Medium
Water Demand: Increase in industrial demand Water Supply: Decrease in groundwater supply Water Supply: Lack of groundwater storage to buffer drought Water Quality: Increase in treatment cost Sea Level Rise: Damage to coastal recreation / tourism due to inundation Sea Level Rise: Decrease in land Sea Level Rise: Damage to ecosystem/habitat
Low
Water Demand: Increase in crop demand Water Demand: Limited ability to conserve further Water Quality: Increased eutrophication Flooding: Increases in inland flooding Ecosystem/Habitat: Increased impacts to coastal species
Very Low
Water Demand: Limited ability to meet summer demand Water Supply: Invasive species can reduce supply available Water Quality: Decrease in recreational opportunity Ecosystem/habitat: Decrease in environmental flows
Source: Adapted from RWMG, 2013.
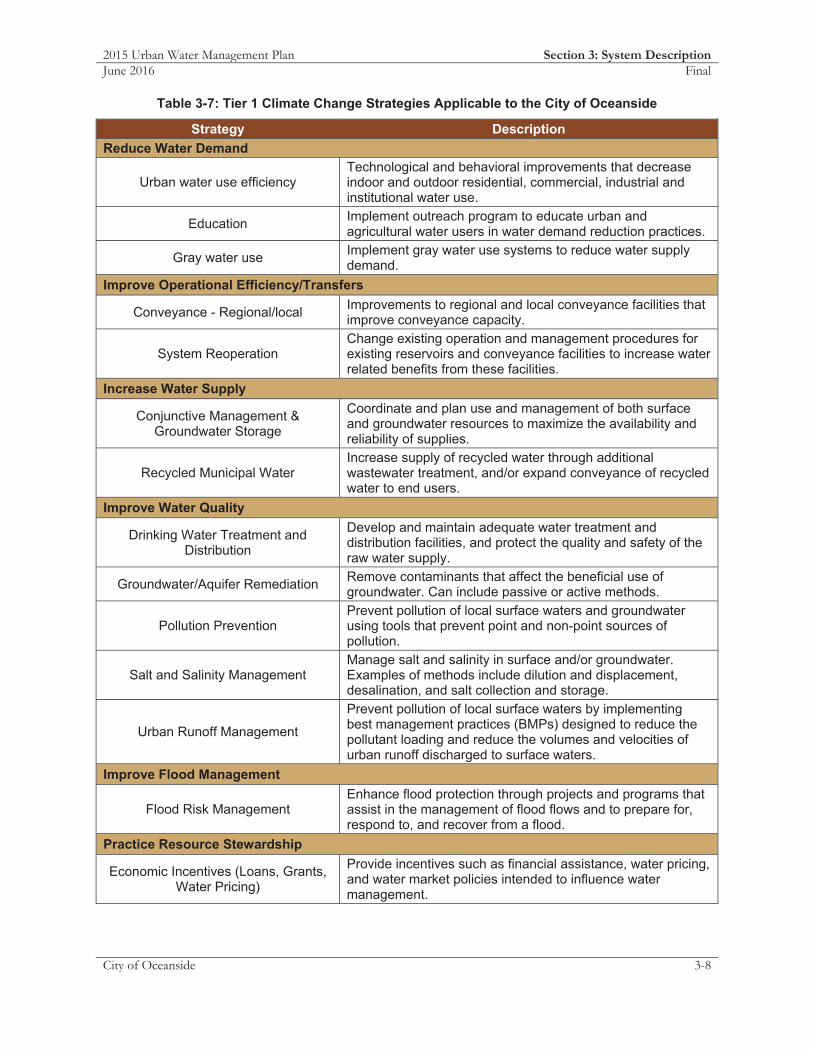
Because of the City’s location along the coast, the region’s dependence on imported supplies, and the unique biodiversity of the region, the potential effects of climate change are of great concern. To help combat the vulnerabilities presented in Table 3-6, a number of strategies were developed for the San Diego IRWM region, many of which are currently being implemented, or are likely to be implemented, within the City or in ways benefitting the City. The strategies identified by the San Diego IRWM region were grouped into three tiers based on level of benefit, reduction in greenhouse gases (GHG), and ease of implementation. Tier 1 strategies, representing “no regrets” strategies, identified in the San Diego IRWM Plan and applicable to the City, are presented in Table 3-7. Tier 2 and 3 strategies can be found in the climate change assessment included in Appendix C.
2015 Urban Water Management Plan Section 3: System Description June 2016 Final
City of Oceanside 3-8
Table 3-7: Tier 1 Climate Change Strategies Applicable to the City of Oceanside
Strategy Description Reduce Water Demand
Urban water use efficiency Technological and behavioral improvements that decrease indoor and outdoor residential, commercial, industrial and institutional water use.
Education Implement outreach program to educate urban and agricultural water users in water demand reduction practices.
Gray water use Implement gray water use systems to reduce water supply demand.
Improve Operational Efficiency/Transfers
Conveyance - Regional/local Improvements to regional and local conveyance facilities that improve conveyance capacity.
System Reoperation Change existing operation and management procedures for existing reservoirs and conveyance facilities to increase water related benefits from these facilities.
Increase Water Supply
Conjunctive Management & Groundwater Storage
Coordinate and plan use and management of both surface and groundwater resources to maximize the availability and reliability of supplies.
Recycled Municipal Water Increase supply of recycled water through additional wastewater treatment, and/or expand conveyance of recycled water to end users.
Improve Water Quality
Drinking Water Treatment and Distribution
Develop and maintain adequate water treatment and distribution facilities, and protect the quality and safety of the raw water supply.
Groundwater/Aquifer Remediation Remove contaminants that affect the beneficial use of groundwater. Can include passive or active methods.
Pollution Prevention Prevent pollution of local surface waters and groundwater using tools that prevent point and non-point sources of pollution.
Salt and Salinity Management Manage salt and salinity in surface and/or groundwater. Examples of methods include dilution and displacement, desalination, and salt collection and storage.
Urban Runoff Management
Prevent pollution of local surface waters by implementing best management practices (BMPs) designed to reduce the pollutant loading and reduce the volumes and velocities of urban runoff discharged to surface waters.
Improve Flood Management
Flood Risk Management Enhance flood protection through projects and programs that assist in the management of flood flows and to prepare for, respond to, and recover from a flood.
Practice Resource Stewardship
Economic Incentives (Loans, Grants, Water Pricing)
Provide incentives such as financial assistance, water pricing, and water market policies intended to influence water management.

2015 Urban Water Management Plan Section 3: System Description June 2016 Final
City of Oceanside 3-9
Strategy Description
Ecosystem Restoration
Improve the condition of modified natural landscapes and biological communities to provide for their sustainability and for their use and enjoyment by current and future generations.
Land Use Planning and Management
Integrate land use and water management for the planning of housing and economic development needs of a growing population while providing for the efficient use of water, water quality, energy and other resources.
Recharge area protection
Protect recharge areas to ensure that areas suitable for recharge continue to be capable of adequate recharge rather than covered by urban infrastructure, and prevent pollutants from entering groundwater.
Water-dependent recreation protection Incorporate planning for water-dependent recreation activities in water projects, and implement projects that protect/create water-dependent recreation opportunities.
Watershed/Soils/Forest management Create and implement plans, programs, projects and activities to restore, sustain, and enhance watershed functions, soil functions, and forests.
Water-dependent cultural resources and practices preservation
Create and implement plans, programs, projects and activities to preserve water-dependent cultural resources and practices
Increase urban forest management Encourage the planting of trees in urban areas to improve urban water quality and local supplies.
Sea Level Rise Building water facilities in coordination with land use/sea level rise planning
Integrate water/wastewater resources planning with land use/sea level rise planning.
Source: Adapted from RWMG, 2013.

2015 Urban Water Management Plan Section 3: System Description June 2016 Final
City of Oceanside 3-10
Page intentionally blank

2015 Urban Water Management Plan Section 4: System Water Use June 2016 Final
City of Oceanside 4-1
SECTION 4: SYSTEM WATER USE
This section describes the City’s historic, current, and projected water use, and describes the types of water uses in the City’s service area.
4.1 Water Use Sectors
The City’s major water use sectors are single family residential, multifamily residential, commercial, industrial, irrigation, and agricultural, along with recycled water. Water use is dominated by residential use, followed by landscape and commercial use. Figure 3-2 in Section 3 System Description provides an overview of the distribution of water use in 2015. Figure 4-1 shows historical and projected water use, by use sector. Recycled water is shown in Figure 4-1, but discussed in greater detail in Section 6 System Supplies.
Figure 4-1: Historical, Current, and Projected Water Use and Supply for City of Oceanside1
1Government Sector was eliminated after 2010, and rolled into Irrigation and Commercial. Note that this figure does not distinguish indirect potable reuse from traditional potable demands. VID exchange is included in the single family residential sector.

2015 Urban Water Management Plan Section 4: System Water Use June 2016 Final
City of Oceanside 4-2
Note that Table 4-1, below, lists the distribution of total water use in 2015, as reported in the discussion below.
Residential (Single Family and Multifamily)
Residential water use includes single family residential and multi-family residential water users, and includes both indoor and outdoor water use. Indoor residential water use includes sanitation, cooking, laundry, and other household water uses. Outdoor residential water use primarily includes landscaping irrigation, and generally represents a substantial portion of water use for homes with landscaping (e.g., single family residences). Residential water use represents 57% of the City’s water use in 2015.
Commercial
Commercial water use includes offices, businesses, and other commercial enterprises, as well as schools, churches, and public buildings. Water use is for both indoor water use, such as for sanitation, and for outdoor irrigation. Commercial water use represents 9% of the 2015 water deliveries.
Industrial
Industrial water use includes water used for industrial processes, as well as water used for other purposes at industrial sites. The City’s industrial water demands were 4% of total water deliveries in 2015.
Irrigation
The irrigation sector includes parks, roadway medians, and other sectors that use water for landscape irrigation. Some of the water needs of the irrigation sector may be met with recycled water in the future, as described in Section 6 System Supplies. Irrigation represented 16% of total water use in 2015.
Agricultural
The Agricultural sector, which represented 6% of potable water demands, includes water used for agricultural irrigation and other agricultural practices. Some agricultural needs may be met with recycled water in the future, as described in Section 6 System Supplies.
Other Water Use and Losses
Approximately 8% of total water use in the City for 2015 went to other water uses that include water losses and non-revenue water. Fiscal Year 2015 losses were calculated using the AWWA Water Loss Audit methodology (see Appendix D) and totaled 1,315 AF. However, the City has elected to estimate Calendar Year 2015 water losses for consistency in data reporting; estimated Calendar Year 2015 water losses were calculated as the difference between potable water production and sales. This process resulted in losses of 1,956 AF in 2015, or approximately 8% of total water use.
Water Sales and Exchanges
The City sold 5.9 AF to 16 customers in Vista Irrigation District’s (VID) service area through the Fall/Olive exchange. This exchange comprised 0.02% of total water use in 2015 and is billed via the Single Family Residential sector (included in this sector in Figure 4-1).

2015 Urban Water Management Plan Section 4: System Water Use June 2016 Final
City of Oceanside 4-3
The City also provides water treatment services to VID’s raw water purchases from SDCWA at its Weese WFP. However, these water treatment services are not quantified as either a demand or supply for the City (and therefore not included in Figure 4-1 or Table 4-2). In 2015, the City treated 3,496 AF water for VID.
Recycled Water
Recycled water is currently delivered for irrigation at the City’s sole recycled water customer, Oceanside Municipal Golf Course. Recycled water deliveries made up 0.4% of total water use in 2015. Excess tertiary-treated recycled water is discharged to Whelan Lake, though this excess water is not metered or accounted for in the City’s water use data.
4.2 Water Use and Demands
CWC §10631(e)(1), §10631(e)(2), §10631.1(a)
Historical and current water use records are maintained in the City’s annual "Public Water System Statistics" reports that are submitted to DWR. Figure 4-2 shows the City’s historical water production by source over the last 14 years (2002 – 2015). For the WCMP Update, historical water production data for the City was analyzed on a monthly basis.
Figure 4-2: Total Historical Water Production Volume (AFY)
0
500
1,000
1,500
2,000
2,500
3,000
3,500
4,000
4,500
Jan
2002
Jul 2
002
Jan
2003
Jul 2
003
Jan
2004
Jul 2
004
Jan
2005
Jul 2
005
Jan
2006
Jul 2
006
Jan
2007
Jul 2
007
Jan
2008
Jul 2
008
Jan
2009
Jul 2
009
Jan
2010
Jul 2
010
Jan
2011
Jul 2
011
Jan
2012
Jul 2
012
Jan
2013
Jul 2
013
Jan
2014
Jul 2
014
Jan
2015
Jul 2
015
SDCWA Purchases Groundwater Recycled Water

2015 Urban Water Management Plan Section 4: System Water Use June 2016 Final
City of Oceanside 4-4
4.2.1 Demand Forecast
Table 4-1 shows the City’s current water use for FY 2015. The City began breaking down billing data for the Industrial sector in 2010 and discontinued the Government sector in 2015. Accounts formerly classified as Government were converted to either Irrigation or Commercial beginning in December 2014, as appropriate. Table 4-1 has been expanded to also show actual recycled water sales in 2015 and resulting total water use for the City of Oceanside.
In November 2013, the City began providing water to 16 homes within VID’s service area through the Fall/Olive Exchange. This exchange is captured in current and projected demands reported in this 2015 Plan. The City also provides water treatment services to VID for raw water purchased from SDCWA. VID’s share of the raw water is sent to the Weese WTP, where it is treated to potable standards and then conveyed to VID. This water is not part of the City’s supplies or demands, and is not reported in this 2015 Plan.
Table 4-1: Demands for Potable and Raw Water – 2015 Actual
DWR Table 4-1 Retail: Demands for Potable and Raw Water - Actual
Use Type
2015 Actual
Additional Description Level of
Treatment When Delivered
Volume (AFY)
Single Family Single family residential detached dwelling Drinking Water 9,500
Multi-Family More than one residential dwelling unit serviced by the meter: Duplex, townhome, condominium,
apartments, mobile homes. Drinking Water 3,982
Commercial Non-residential domestic service Drinking Water 2,047
Industrial Businesses whose discharge to the wastewater system have high concentrations of BOD, TSS
and /or ammonia. Drinking Water 922
Landscape Water only account Drinking Water 3,856
Agricultural Irrigation Irrigation of commercially grown crops or other dedicated agricultural connections Drinking Water 1,345
Sales/Transfers/ Exchanges to other
agencies VID: Fall / Olive Exchange Drinking Water 6
Losses Drinking Water 1,955 Total Potable Water Use 23,613
Recycled Water Use 104 Total Water Use 23,717
NOTES: Governmental uses were converted to either Irrigation or Commercial beginning in January 2015. The AWWA Water Loss Audit included as Appendix D was completed for FY2015 and reflects a lower loss than estimated Calendar Year 2015. Reported here is the estimated water loss for Calendar Year 2015, based on the difference between production and sales.

2015 Urban Water Management Plan Section 4: System Water Use June 2016 Final
City of Oceanside 4-5
Concurrently with this 2015 Plan, the City developed the WCMP Update (also available at the City’s website: http://www.ci.oceanside.ca.us/gov/water/admin/uwmp.asp). As part of this effort, the City used a Decision Support System (DSS Model) tool to project water use, passive conservation, and active conservation into the future. The DSS Model prepares long-range, water demand, and conservation water savings projections. The DSS Model is an end-use model that breaks down total water consumption (i.e., water demand in the service area) into specific water end uses, such as toilets, faucets, irrigation, etc. This “bottom-up” approach allows for detailed criteria to be considered when estimating future demands, such as the effects of natural fixture replacement, plumbing codes, and conservation efforts. The purpose of using end-use data is to enable a more accurate assessment of the impact of water efficiency programs on demand and to provide a rigorous and defensible modeling approach necessary for projects subject to regulatory or environmental review.
As part of the WCMP Update, the City chose to assume implementation of conservation “Program B” in its demand forecast, which includes aggressive water conservation, smart meters (AMI), and further implementation of recycled water conversions. Note that the demand projections reflect average water use assuming average weather conditions and do not reflect drier and hotter drought conditions. Water use projections from the DSS Model, with and without conservation savings, are shown in Table 4-2.
Table 4-2: Baseline and Projected Water Use (AFY)*
2020 2025 2030 2035 2040 Baseline Demands 33,371 36,006 37,227 38,001 38,754 Demand with Passive Conservation (Plumbing Code) 32,641 34,479 34,976 35,263 35,641 Demand with Passive and Active Conservation (Plumbing Code and WCMP Program B) 31,728 32,915 32,813 33,190 33,537
*Data are not weather normalized. Total water use includes agricultural use, recycled water, and water loses.
Water use projections (with conservation) broken out by water use sector are shown in Table 4-3. Consistent with changes to the City’s billing categories since 2010, Governmental sector use from January 2015 was divided evenly between Commercial and Irrigation sectors. The City anticipates continuing to provide a similar level of service to VID customers via the Fall/Olive exchange at was provided in 2015. This exchange is included in the demand projections presented in Table 4-3. The City will continue to provide treatment services to a portion of VID’s raw water purchases from SDCWA, but as noted above, this water is not included in the City’s demands or supplies. As such, the water treated for VID is not included in Table 4-3.
The City replaced landscaping with artificial turf underneath and
alongside the Oceanside Pier to reduce water use

2015 Urban Water Management Plan Section 4: System Water Use June 2016 Final
City of Oceanside 4-6
Future Residential demands represent the projected highest water use, but the City also sells a substantial amount of Irrigation and Agricultural water. Irrigation and Agricultural water is generally used on high-value crops such as cut flowers, nursery stock, citrus, avocado, and other specialty tree crops. Users growing crops have the option of participating in the Special Agricultural Water Rate (SAWR) program, which carries a discount in exchange for doubling the risk of cutbacks in the event of shortages. Growers also can choose to take water as commercial agricultural water, but do not receive a discount and thus have the same level of service reliability as other municipal users.
Table 4-3: Demands for Potable and Raw Water - Projected
DWR Table 4-2 Retail: Demands for Potable and Raw Water - Projected
Use Type Additional Description Projected Water Use
2020 2025 2030 2035 2040
Single Family Single family residential detached dwelling; includes the Fall/Olive
Exchange 13,464 13,225 12,726 12,548 12,418
Multi-Family
More than one residential dwelling unit serviced by the meter: Duplex, townhome,
condominium, apartments, mobile homes.
4,405 4,246 4,039 3,959 3,886
Commercial Non-residential domestic service 2,920 2,986 3,028 3,150 3,265
Industrial Businesses whose discharge to
the wastewater system have high concentrations of BOD, TSS and
/or ammonia. 809 850 880 928 975
Landscape Water only account 5,888 5,967 5,248 5,541 5,467
Agricultural irrigation
Irrigation of commercially grown crops or other dedicated agricultural connections
1,889 1,888 1,895 1,895 1,895
Losses 1,953 2,053 2,097 2,109 2,131
TOTAL 31,328 31,215 29,913 30,130 30,037 NOTES: Projections based on 2020 target and percentage of sector use in 2015. Governmental sector use from January 2015 was divided evenly between commercial and irrigation sectors.
In addition to the potable water demands, the City uses tertiary recycled water. Current and projected recycled water demands are summarized in Table 4-4, along with current and projected potable water use. The City also plans to develop potable reuse supplies, which will serve potable demands. Per the 2015 Guidebook, potable reuse supplies are incorporated into recycled water supplies in the official DWR tables. However, to provide clarification on the actual water demands by end users, the table presented in this section does not include advanced treated potable water in the recycled water demand. Recycled water uses are discussed in more detail in Chapter 6, System Supplies.

2015 Urban Water Management Plan Section 4: System Water Use June 2016 Final
City of Oceanside 4-7
Table 4-4: Total Water Demands (AFY) DWR Table 4-3 Retail: Total Water Demands
2015 2020 2025 2030 2035 2040 Potable and Raw Water 23,613 31,328 31,215 29,913 30,130 30,037
Recycled Water 104 400 1,700 2,900 3,060 3,500 TOTAL WATER DEMAND 23,717 31,728 32,915 32,813 33,190 33,537
NOTES: Demands met by advanced treated water are included here as Potable and Raw Water demands. Non-potable recycled water demands are included here as Recycled Water demand. DWR has directed agencies to include IPR in both Potable Demands and Recycled Water Demands and Supplies. For this reason, the corresponding DWR tables in Appendix B counts the City’s potable reuse in both Potable Water and Recycled Water Demands in this table. The City has elected to only count this water once in the body of this Plan to provide a clear understanding to the reader of the total volume of water that is projected for end uses (including loss).
4.2.2 Distribution System Water Losses
CWC §10631(e)(1), §10631(e)(3)
Water loss is composed of apparent water losses and real water losses. Apparent losses are attributed to unauthorized consumption, customer metering inaccuracies and system data handling errors, while real losses are attributed to leakage along the pipe system, at the storage tanks, or at the service connections. The City has been quantifying water loss using the American Water Works Association (AWWA) water system balance methodology since fiscal year 2010. The City’s AWWA water loss summary report for the most recent 12-month period was produced for FY 2014/2015 and is included as Appendix D. The water loss calculated for FY 2014/2015 is shown in Table 4-5. However, the City has elected to use an estimate of calendar year 2015 water loss, calculated as the difference between production and delivery, based on billing data. This allows for consistency across data presented in this 2015 Plan. Calendar year 2015 water losses were estimated at 1,955 AF.
Table 4-5: Water Loss Summary Most Recent 12 Month Period Available
DWR Table 4-4 Retail: Water Loss Summary Most Recent 12 Month Period Available
Reporting Period Start Date (Month/Year) Loss (AFY)
July 2014 1,316 NOTES: The City has elected to use estimated water losses in its 2015 demand tables for Calendar Year 2015. This was estimated as the difference between production and water use, based on water purchases, well production logs, and billing data for Calendar Year 2015. Calendar year 2015 water losses were estimated at 1,955 AF.
4.2.3 Low Income Water Use and Demands
CWC §10631.1(a)
DWR requires that agencies estimate the projected water use for single-family and multifamily residential housing needed for lower income households within their service area. DWR defines lower income households as those with a median household income (MHI) earning less than 80% of area MHI. Per the City’s 2013 General Plan Housing Element, low income households are those earning $65,500 or less.

2015 Urban Water Management Plan Section 4: System Water Use June 2016 Final
City of Oceanside 4-8
SANDAG’s Series 13 Regional Growth Forecast includes projected number of households by income tiers of $15,000. In 2012, 45% of households in the City earned less than $60,000. Household projections from SANDAG were available for 2012, 2020, 2035, and 2050. The City assumed a straight-line projection in household growth between these years to estimate total households for 2015, 2025, 2030, and 2040. The City’s Inclusionary Housing Ordinance (Municipal Code Chapter 14C) requires developments of three or more units include affordable housing equal to 10% of the total units developed, with some exceptions. Assuming that 10% of the overall increase in households will be low-income, the City has projected its low income households from 2015 to 2040, as shown in Table 4-6. Assuming that a given household will use approximately the same amount of water as another given household in the same billing category regardless of income level, the City is able to estimate the projected low income water use for multi-family and single-family residential demands, as shown in Table 4-6.
Table 4-6: Low-Income Projected Water Demands (AFY)
20151 2020 20251 20301 2035 20401 Total Households 60,744 61,902 63,058 64,214 65,370 65,540 Low Income Households2 26,882 26,995 27,110 27,226 27,341 27,358 Low Income Water Demands (AFY)1 5,966 7,792 7,511 7,108 6,904 6,806 Low Income Multi-Family Demands1 1,761 1,921 1,825 1,712 1,656 1,622 Low Income Single-Family Demands1 4,205 5,871 5,686 5,396 5,248 5,184 1Estimated 2Calculated as existing low-income households plus 10% of household growth
4.2.4 Estimating Water Savings from Codes, Ordinances, or Transportation and Land Use Plans
CWC §10631(e)(4)
The City has a number of conservation measures in effect at all times, and implements additional ones in the event of a drought declaration, as described in Section 8 Water Shortage Contingency Plan. In addition, the City’s mandatory use ordinance means that projected recycled water use is considered a verifiable supply because users will be required to convert to recycled water as it becomes feasible to connect. Further, recent changes to the State’s plumbing and building codes will reduce domestic water demands by requiring installation of water efficient fixtures and other features. These statewide changes include, but are not limited to, AB 715 (efficient toilets and urinals) and SB 407 (retrofitting for efficient fixtures). Conservation efforts are included in the projected demands, as are lower income residential demands, as indicated in Table 4-7.
Table 4-7: Inclusion of Estimated Water Savings in Water Use Projections
DWR Table 4-5 Retail Only: Inclusion in Water Use Projections Future Water Savings Included Y/N Yes If "Yes" to above, state the section or page number where citations of the codes, ordinances, etc… utilized in demand projections are found.
Location in UWMP: Section 4.2.5; Section 6.8.3; Section 8
Lower Income Residential Demands Included Yes

2015 Urban Water Management Plan Section 4: System Water Use June 2016 Final
City of Oceanside 4-9
4.3 Wholesale Water Demand Projections
CWC §10631(k)
Approximately 86% of the City’s water is purchased from the SDCWA. In the future, the City plans to use more water from local sources such as the Mission Basin, desalinated water, and recycled water (including potable reuse), thereby lessening the need for SDCWA purchases. Agency demand projections provided to SDCWA are shown in Table 4-8. Note that the City’s projected demands on SDCWA may be different from those reported in SDCWA’s UWMP due to differences in demand forecast assumptions and methodology.
Table 4-8: Agency Demand Projections Provided to Wholesale Supplier (AFY)
Wholesaler 2015 2020 2025 2030 2035 2040 SDCWA 20,400 24,728 24,215 22,913 23,130 23,037
SDCWA purchases imported water from three main sources: MWD, conserved agricultural water from IID, and conserved water from projects that lined the All-American and Coachella Canals. SDCWA has also acquired spot water transfers to offset reductions in supplies from MWD during water shortage years. In addition to imported water, SDCWA’s supply mix includes desalinated seawater produced at the Claude “Bud” Lewis Carlsbad Desalination Plant (Carlsbad Desalination Plant). This desalinated water, discussed in further detail in Chapter 6 System Supplies, was delivered to SDCWA member agencies as part of SDCWA’s supply mix beginning at the end of 2015. A five-year average (2011-2015) of SDCWA’s supply mix shows 20% of its supply is imported from SWP through MWD, 64% from the Colorado River via MWD and long-term transfers, and 16% from local supplies.
4.3.1 Wholesale Water Use Reduction Plan
The SDCWA Board approved a strategy to aggressively diversify its water supply portfolio by developing new local and imported water supplies. This strategy already is enhancing regional supply reliability. By fiscal year 2010, the San Diego region had reduced its reliance on MWD supplies to 50%. This lessened the impact of water cutbacks from MWD that began in July 2009. SDCWA is working with its 24 local member retail agencies to develop local supplies such as groundwater, recycled water, seawater desalination, and conservation. By 2020, SDCWA projects local water supplies to meet 33% of the region’s water demand. Member agency local supplies and SDCWA’s supplies independent of purchases from MWD are projected to meet 79% of demands by 2020 (see Figure 4-3). SDCWA also partners with its member agencies to promote conservation and conservation education through its WaterSmart programs (www.watersmartsd.org).

2015 Urban Water Management Plan Section 4: System Water Use June 2016 Final
City of Oceanside 4-10
Figure 4-3: Projected 2020 Regional (SDCWA) Supply Mix
Source: SDCWA 2015 UWMP.
4.4 Climate Change
As described in Section 3 System Description, the City faces demand vulnerabilities as a result of potential impacts from climate change. The San Diego Region identified three water-demand related vulnerabilities. Table 3-5, above, summarizes those water demand vulnerabilities applicable to the City. The City anticipates that potential impacts of climate change could increase demands in the industrial and agricultural sectors. Industries may require additional water for cooling processes. As shown in Table 4-3, industrial water use is anticipated to increase over time as industry grows. If climate change increases water intensity of industrial processes, the City’s projections for this water use category could be lower than actual demands. Agricultural water uses in the City are anticipated to remain fairly consistent over time. However, these demands could change substantially as a result of climate change. Water demands for agricultural irrigation may increase as temperatures rise and precipitation patterns change. On the other hand, they may decrease if climate change contributes to conversion of agricultural land to other uses. On-going extended droughts, or the perceived risk of increased drought intensity and frequency, may increase the rate of agricultural land conversions, which would decrease agricultural water demands. At the same time, other categories of water use would increase.
Anticipated temperature rises could contribute to increases in domestic water demands, though these demand increases could be tempered with long-term passive savings achieved through conversion of turf to water-wise landscaping that has been occurring through the current drought. The present drought has also resulted in temporary reduction of demands; however, this is anticipated to rebound. It is evident that short-term demand decreases are achievable, but long-term calls for conservation in the light of hotter summers and greater variability in precipitation could lead to a perceived inability for further demand reduction.
IID Water Transfer
33%
Canal Lining14%
Seawater Desalination
10%
Potable Reuse0%
Groundwater5%
Surface Water9%
Non-Potable Recycled Water
8%
MWD21%

2015 Urban Water Management Plan Section 5: Baselines and Targets June 2016 Final
City of Oceanside 5-1
SECTION 5: BASELINES AND TARGETS
The Water Conservation Act, also known as SBx7-7, was adopted in 2009, requiring the State to reduce urban water use by 20% by the year 2020. SBx7-7 requires each retail urban water supplier to set water use reduction goals to assist in achieving the statewide 20% reduction. To measure progress towards meeting their 2020 targets, DWR requires agencies to meet an interim target in 2015, the halfway point between the baseline and the target year (2020). This chapter establishes the City of Oceanside’s baseline periods and water use targets in accordance with SBx7-7, service area population, gross water use, and confirms compliance with the 2015 interim target. All required SBx7-7 tables are included as Appendix B.
5.1 SBx7-7 Baseline
To establish the SBx7-7 baseline, the City first recalibrated its service area population for potential baseline years, using 2010 U.S. Census data. A baseline period was selected, gross water use for the baseline period added, and water use in gallons per capita per day (GPCD) was calculated. Baseline information is presented in Table 5-1, below.
5.1.1 Service Area Population
CWC §10608.20 (e), §10608.20 (f)
The City’s service area population estimates were updated in this 2015 Plan using the 2010 U.S. Census data to provide correct annual GPCD calculations. A Geographic Information System (GIS) analysis found that the City provides 95% of its service area with water services, which allows it to use California Department of Finance (DOF) population projections for its service area data. These population projections are presented in Table 5-1, below.
5.1.2 Baseline Periods
CWC §10608.12(b), §10608.20(e), §10608.20(g), §10608.22
SBx7-7 requires agencies to determine their baseline per capita water use and calculate their 2020 target water use per the Methodologies for Calculating Baseline and Compliance Urban per Capita Water Use (Methodologies). Baselines are determined by averaging the historical per capita water use of 10 to 15 consecutive years. Agencies may update their urban water use targets in the 2015 Plan by adjusting the years selected for their baseline periods and updating service area population data. Per the Methodologies, the City is required to use a 10 year base period because their 2008 recycled water use, 66 AF, was less than 10% of its 2008 measured retail water demand. Based on analysis of potential baseline periods, the City selected a 10-year baseline period from 1999 to 2008. The per capita water use for each base period year is shown in Table 5-1. The City’s daily system gross water use is the sum of the water purchased and produced each year, with agricultural water use excluded. Annual daily per capita water use for each year, determined by dividing gross water use by population, was averaged to determine the baseline daily per capita water use of 171 GPCD.
According to SBX7-7, the water use reduction must meet a minimum of 95% of the City’s baseline per capita use for a continuous 5-year period ending no earlier than December 31, 2007 and no later than December 31, 2010. As displayed in Table 5-1, the City’s 5-year baseline for 2004 through 2008 is 172 GPCD, therefore, the 2020 target must reduce water consumption to at least 163 GPCD.

2015 Urban Water Management Plan Section 5: Baselines and Targets June 2016 Final
City of Oceanside 5-2
5.1.3 Gross Water Use
CWC §10608.12, California Code of Regulations Title 23 Division 2 Chapter 5.1 Article
Gross water use is a measure of water that enters the distribution system of the supplier over a 12-month period. Table 5-1 shows the annual gross water use for each year of the 10-year baseline period from 1999 to 2008, as well as the 5-year baseline period from 2004 to 2008. This table also shows the GPCD for each year in the 5-year and 10-year baseline periods, which were then averaged to establish the 2020 and interim 2015 water use targets.
Table 5-1: Annual Gross Water Use
SBX7-7 Table 4 Annual Gross Water Use; SBX7-7 Table 5: Gallons Per Capita Per Day (GPCD)1
Baseline Year Volume Into Distribution
System Agricultural
Use Annual Gross
Water Use2
Service Area
Population
Daily Per Capita
Water Use 10 to 15 Year Baseline - Gross Water Use
Year 1 1999 33,254 2,330 30,924 158,451 174 Year 2 2000 33,862 2,719 31,142 161,624 172 Year 3 2001 32,141 2,369 29,772 162,907 163 Year 4 2002 35,467 3,255 32,211 164,312 175 Year 5 2003 32,844 2,480 30,364 165,962 163 Year 6 2004 35,169 2,408 32,760 166,859 175 Year 7 2005 33,611 2,221 31,391 166,958 168 Year 8 2006 34,311 2,530 31,781 165,539 171 Year 9 2007 35,585 2701 32,884 165,545 177 Year 10 2008 33,050 1795 31,255 166,064 168
10 year Baseline Average Gross Water Use 31,448 - 171 5 Year Baseline - Gross Water Use
Year 1 2004 35,169 2,408 32,760 166,859 175 Year 2 2005 33,611 2,221 31,391 166,958 168 Year 3 2006 34,311 2,530 31,781 165,539 171 Year 4 2007 35,585 2701 32,884 165,545 177 Year 5 2008 33,050 1795 31,255 166,064 168
5 Year Baseline Average Gross Water Use 32,014 - 172 2015 Compliance Year - Gross Water Use
2015 23,613 1,345 22,268 171,183 116 NOTES: In order to not artificially lower gross water use, recycled water was not reported here. The Water Code Section 10608.12(g) defines "Gross Water Use" as the total volume of water, whether treated or untreated, entering the water distribution system of an urban retail water supplier, excluding recycled water, the net volume of water that is placed into long-term storage, the volume of water that is conveyed for use by another water supplier, and the volume of water delivered for agricultural use. 1 This table consolidates SBX7-7 Tables 4 and 5. A full set of SBX7-7 tables has been provided in Appendix B. 2 Some differences may occur due to rounding.

2015 Urban Water Management Plan Section 5: Baselines and Targets June 2016 Final
City of Oceanside 5-3
5.1.4 Baseline GPCD Water Use
CWC §10608.12(b)
Table 5-1, above, shows the 10-year and 5-year baselines established for the City. The 10-year baseline was determined from gross water use for the years 1999-2008 and results in 171 GPCD; this is the value that must be reduced by 20% by 2020 (137 GPCD). The City’s 5-year baseline was determined from gross water use for the years 2004-2008 and results in 172 GPCD; this is the value at which 95% would comprise the City’s maximum 2020 target (163 GPCD). If the City’s calculated 2020 target (20% reduction from the 10-year baseline) is higher than 95% of the 5-year baseline, the lower number must be used as its 2020 target. The lower of the two numbers is the “confirmed 2020 target”. As such, the City’s calculated 2020 target is 137 GPCD. The following section addresses the City’s compliance with its water use targets.
5.2 2015 and 2020 Targets
CWC §10608.20(b), §10608.20(e), §10608.20(g), §10608.22, §10608.24(a), §1060 8.40
SB X7-7 requires urban water suppliers to establish per capita water use targets by using one of four methods:
Method 1: A per capita water use by 2020 that is 80% of the urban retail water supplier’s baseline per capita daily water use. The City’s baseline is 171 gallons per capita per day (GPCD). The resulting per capita demand target for 2020 is 137 GPCD (reduction of 20% from baseline), with an interim 2015 target of 154 GPCD (reduction of 10% from baseline).
Method 2: The per capita daily water use that is estimated using the sum of several defined performance standards. This method requires quantifying the landscaped area and the baseline commercial, industrial, and institutional (CII) use.
Method 3: 95% of the applicable state hydrologic region target, as set forth in the 2015 Guidebook (DWR, 2016). Oceanside, located in DWR’s South Coast Hydrologic Region Number 4, has a year 2020 target of 95% of 149 GPCD, which is 142 GPCD.
Method 4: A provisional method that was developed by DWR where the target is based on indoor residential, CII, outdoor, and water loss components. Using the Provisional Method 4 Target Calculator provided by DWR with a CII water use in 2003 of 2,989 ac-ft gives a 2020 target of 151 GPCD.
Table 5-2 shows the 10-year baseline and the 2020 target, as determined through Method 1. The City’s 2020 target is 137 GPCD, calculated as a reduction of 20% from the baseline 171 GPCD. The 2020 target must reduce Oceanside’s 2020 water use by a minimum of 5% from the 5-year baseline. The 5-year baseline GPCD, the maximum 2020 water use target (calculated as 95% of the 5 year baseline GPCD), the calculated 2020 target, and the confirmed 2020 target are also shown in Table 5-2. This confirms that the 2020 target is sufficient. As seen, the 2020 target is well below the maximum 2020 target of 163 GPCD. The 2015 target was calculated as 154 GPCD, or the average between the 10-year baseline and the City’s 2020 target. The interim 2015 target is presented in Table 5-2, which is significantly lower than the 2015 actual of 116 GPCD due to current conservation activities. Table 5-3 provides a summary of the City’s baselines and targets under SBx7-7.

2015 Urban Water Management Plan Section 5: Baselines and Targets June 2016 Final
City of Oceanside 5-4
Table 5-2: Confirm Minimum Reduction for 2020 Target
10-15 Year Baseline GPCD
Calculated 2020 Target
GPCD
5 Year Baseline GPCD
Maximum 2020 Target1
Confirmed 2020 Target GPCD
Interim 2015 Target GPCD
171 137 172 163 137 1542
1 Maximum 2020 Target is 95% of the 5 Year Baseline GPCD 2 The interim 2015 target represents a 10% reduction from the calculated baseline.
Table 5-3: Baselines and Targets Summary
DWR Table 5-1 Baselines and Targets Summary Baseline Period Start Years End Years Average
GPCD 2015 Interim
Target Confirmed 2020 Target
10-15 year 1999 2008 171 154 137 5 Year 2004 2008 172
5.3 Water Conservation Target Compliance
CWC §10608.12(e), §10608.20(e), §10608.24(a), §10608.24(d)(1)
As noted above, water suppliers are required to calculate their actual 2015 GPCD to assess their progress toward their 2020 target and determine whether they have met the 2015 interim target. As shown in Figure 4-1 (refer to Section 4 System Water Use), overall water use has declined in recent years. Based on 2015 gross water use and estimated population, and as shown in Table 5-4, the City of Oceanside’s 2015 actual water use is 116 GPCD. The City has therefore met its 2015 interim water use reduction target and is making substantial progress toward its 2020 target. Water use in 2015 was below the City’s 2020 target, in part due to extraordinary conservation implemented in response to drought conditions. Although the City anticipates water use to rebound once drought response measures are lifted, it still anticipates meeting its 2020 target. Because the City met its 2015 interim target, no optional adjustments were made to its 2015 GPCD.
Table 5-4: 2015 Compliance
DWR Table 5-2: 2015 Compliance
Actual 2015
GPCD
2015 Interim Target
Optional Adjustments to 2015 GPCD
2015 GPCD
Did Supplier Achieve Targeted
Reduction for 2015?
Extr
aord
inar
y Ev
ents
Econ
omic
A
djus
tmen
t
Wea
ther
N
orm
aliz
atio
n
Tota
l A
djus
tmen
ts
Adj
uste
d 20
15
GPC
D
116 154 - - - - 116 116 Yes NOTES: the City was within its 2015 Interim Target prior to adjustments made for extraordinary events, economic adjustments, or weather normalization. No adjustments were made.

2015 Urban Water Management Plan Section 6: System Supplies June 2016 Final
City of Oceanside 6-1
SECTION 6: SYSTEM SUPPLIES
This section addresses the historical, current, and projected supplies available to the City to meet demands discussed in Section 4 System Demands. As described in this section, the City relies on three major supply sources: SDCWA purchases, desalinated groundwater, and recycled water. One potential additional supplies is currently in development: advanced treated water via potable reuse. Figure 4-2 shows monthly water production data for the last 14 years (2002 – 2015). Table 6-1 and Figure 6-2 provide a summary of the City’s existing and projected water supplies from 2010 – 2040. A map showing the location of the City’s local supplies is shown as Figure 6-2.
Table 6-1: Summary of Historical and Projected Supplies (AFY)
Supply 2010 2015 2020 2025 2030 2035 2040 Purchased SDCWA Supply 24,897 20,400 24,728 24,215 22,913 23,130 23,037 Groundwater 3,732 3,213 3,300 3,700 3,700 3,700 3,700 Recycled Water (Non-Potable) 119 104 400 1,700 2,900 3,060 3,500 Advanced Treated Water (Potable Reuse) 0 0 3,300 3,300 3,300 3,300 3,300
Total 28,748 23,717 31,728 32,915 32,813 33,190 33,537
Figure 6-1: Historical and Projected Supply Mix (AFY)
0
5,000
10,000
15,000
20,000
25,000
30,000
35,000
2010 2015 2020 2025 2030 2035 2040
Supp
ly (A
FY)
SDCWA Groundwater Advanced Treated (Potable Reuse) Non-Potable Recycled Water

SOURCE: City of Oceanside, ESRI
N:\P
rojec
ts\03
02 O
cean
side,
City
of\03
02-0
07_O
cean
side 2
015 U
WMP
\04_G
IS\M
XDs\O
cean
side_
Loca
lSup
ply_F
igure
6-1_
0510
16.m
xd
%,
%,
"CD
"CD
"CD
Pacific Ocean
La Salina WWTP
San Luis Rey WRF
Camp Pendleton SRTTP
Claude "Bud" Lewis Carlsbad Desalination Plant
Mission Basin Groundwater Purification Facility
Oceanside Ocean Outfall
SAN LUIS REY VALLEY
SAN MARCOS AREA
SANTA MARGARITA VALLEY
BATIQUITOS LAGOON VALLEYSources: Esri, HERE, DeLorme, USGS, Intermap, increment P Corp., NRCAN, Esri Japan, METI, EsriChina (Hong Kong), Esri (Thailand), MapmyIndia, © OpenStreetMap contributors, and the GIS UserCommunity
City of Oceanside
Local Cities
Existing Recycled Water Pipes
Future Recycled Water Pipes
San Diego County WaterAuthority Aqueduct
"CD Treatment Plant
%, Desalination Plant
Groundwater Basins
City of Oceanside Water District
Rainbow Municipal WaterDistrict
Carlsbad Municipal WaterDistrict
Vista Irrigation District
Rivers
Water Body
OceanOutfall
Figure 6-1City of Oceanside
Local Supply
¯0 1 20.5 Miles
OceansideVista
Carlsbad

2015 Urban Water Management Plan Section 6: System Supplies June 2016 Final
City of Oceanside 6-3
6.1 Summary of Existing and Planned Water Sources
CWC §10631(b)
The City currently has two direct sources of potable water: a blend of imported and desalinated seawater from SDCWA and local groundwater from the Mission Basin of the Lower San Luis Rey River Valley. SDCWA imported water supply is sourced from the SWP via MWD and the Colorado River via transfers from IID and conservation savings from several canal-lining projects. SDCWA also purchases desalinated seawater and blends it into member agency supplies. The City operates well fields that deliver raw groundwater to the MBGPF. Recycled (non-potable) water supply is produced at the San Luis Rey WWTP and delivered to Whelan Lake and one irrigation customer. Historical water supplies are provided in Table 6-2.
Table 6-2: Historical Water Supplies (in FY)
Supply Source Supply (acre feet) Average
Supply (AFY)
Percentage of Supply
(%) 2010 2011 2012 2013 2014 2015
Purchased from SDCWA1 24,897 21,559 23,773 24,139 24,540 20,400 23,218 85%
Groundwater2 3,732 4,522 3,371 4,575 4,735 3,213 3,883 14% Recycled Water3 119 110 125 128 140 104 121 0.4% Total 28,748 26,191 27,269 28,842 29,637 23,717 27,222 100% 1 Includes treated and untreated water purchased from SDCWA. Includes SDCWA water treated and served to VID customers in the Fall/Olive Exchange. 2 Groundwater treated at the Mission Basin Groundwater Purification Facility. 3 Recycled water produced at San Luis Rey WWTP.
As shown in Table 6-2, approximately 85% of the City’s water supply for the period 2010 through 2015 came from water purchased from SDCWA. This period is indicative of historical water supply for the City. In the future, the City plans to use more water from local sources, thereby lessening the need for imported water. Current water supplies utilized in 2015 are shown in Table 6-3.
Table 6-3: Water Supplies – 2015 Actual
DWR Table 6-8 Retail: Water Supplies — Actual
Water Supply Additional Detail on Water Supply
2015
Actual Volume
Water Quality
Total Right or Safe Yield
(optional) Purchased or
Imported Water Blend of imported water and desalinated
seawater purchased from SDCWA 20,400 Raw and Treated --
Groundwater Desalted groundwater from MBGPF 3,213 Raw Water --
Recycled Water Recycled Water produced at San Luis Rey WWTP 104 Recycled
water --
Total 23,717 NOTES: Includes SDCWA water treated and served to VID customers in the Fall/Olive Exchange
2015 Urban Water Management Plan Section 6: System Supplies June 2016 Final
City of Oceanside 6-4
Future potable water supplies include the SDCWA supplies, expanded extraction and treatment of water from the Mission Basin, and advanced treated water (indirect potable reuse). The City has completed construction of additional facilities to produce up to 7,130 acre-ft per year of treated water at the MBGPF. Operation of the MBGPF began in 1992, with an expansion completed in 2002, and a granular activated carbon process added in 2009.
SDCWA supplies both treated and untreated water to the City through five aqueduct connections. Treated water is conveyed directly to the City's water distribution system, while untreated water is first conveyed to the City’s Robert A. Weese Water Filtration Plant (Weese WFP), in Vista California. The Weese WFP is owned and operated by the City and was originally designed and constructed in 1983 with a capacity of 16.5 MGD. As reported in the City’s 2015 Water Master Plan, the annual water supply for the City in 2012 comprised an average day demand (ADD) of 24.9 MGD (City of Oceanside 2015a).
The City is planning the expansion of its recycled water system through both additional non-potable recycled water deliveries and an indirect potable reuse (IPR) project to increase water supply reliability. The IPR project would produce advanced treated water that would eventually be used to meet potable demands. The City’s goal is to have this IPR project produce approximately 3.0 MGD of the City’s potable water supply, which would reduce the reliance on imported water. Advanced treated water would be injected into the Mission Basin for groundwater recharge. Extracted water would be treated at MBGPF, and then pumped into the distribution system.
Future construction of a seawater desalination facility is being considered by the City, but is currently in the feasibility phase. A 2010 Seawater Desalination Pilot Facility and Feasibility Study placed monitoring and test wells at a site near the Oceanside Harbor and utilized a reverse osmosis treatment system. This study was designed to develop design parameters for a treatment process supporting implementation of a full-scale seawater desalination project at the MBGPF. Water would be extracted from the ocean by a series of 10 to 20 wells in the Mission Narrows area, near the mouth of the San Luis Rey River, and blended with brackish groundwater from the Mission Basin prior to treatment. This blend would result in a lower salinity source and allow for greater recovery of potable water by reducing the energy demands for treatment. The City is continuing to explore this supply option, but due to the preliminary nature, this supply is not included in the City’s projections. Planned water supplies are incorporated into the City’s water supply projections. Projected water supplies are provided in Table 6-4. The planned water supplies are based on meeting the 2020 GPCD target for potable water.

2015 Urban Water Management Plan Section 6: System Supplies June 2016 Final
City of Oceanside 6-5
Table 6-4: Water Supplies - Projected
DWR Table 6-9 Retail: Water Supplies — Projected
Water Supply Additional Detail on Water Supply
Projected Water Supply2020 2025 2030 2035 2040
Rea
son-
ably
Av
ail.
Volu
me
Tota
l Rig
ht o
r Sa
fe Y
ield
(opt
.)
Rea
son-
ably
Av
ail.
Volu
me
Tota
l Rig
ht o
r Sa
fe Y
ield
(opt
.)
Rea
son-
ably
Av
ail.
Volu
me
Tota
l Rig
ht o
r Sa
fe Y
ield
(opt
.)
Rea
son-
ably
Av
ail.
Volu
me
Tota
l Rig
ht o
r Sa
fe Y
ield
(opt
.)
Rea
son-
ably
Av
ail.
Volu
me
Tota
l Rig
ht o
r Sa
fe Y
ield
(opt
.)
Purchased or Imported Water From SDCWA 24,728 -- 24,215 -- 22,913 -- 23,130 -- 23,037 --
Groundwater Mission Basin 3,300 10,000 3,700 10,000 3,700 10,000 3,700 10,000 3,700 10,000Recycled Water Non-potable 400 -- 1,700 -- 2,900 -- 3,060 -- 3,500 --
Other Advanced treated water (IPR) 3,300 -- 3,300 -- 3,300 -- 3,300 -- 3,300 --
Total 31,728 32,915 32,813 33,190 33,537NOTES: Assumes purchased water make up and demands not fulfilled by local supplies. Advanced treated water is IPR that is injected into the MissionBasin and extracted for potable use.

2015 Urban Water Management Plan Section 6: System Supplies June 2016 Final
City of Oceanside 6-6
6.2 Purchased Water
MWD is Southern California’s wholesale water agency, and SDCWA is the largest customer among MWD’s 26 member agencies. MWD derives its water supply from the Colorado River (via the Colorado River Aqueduct) and the SWP (via the California Aqueduct). In 1998, SDCWA entered into a transfer agreement with IID to purchase conserved agricultural water. Through the agreement, SDCWA received 70,000 acre-feet (AF) in 2010 and will receive an annually-increasing volume up to 200,000 AF by 2021 for 75 years. Through the 2003 Quantification Settlement Agreement (QSA) on the Colorado River, SDCWA also receives 77,700 AF per year of conserved water from lining of the All-American and Coachella Canals for 110 years (RWMG, 2013).
SDCWA supplies a blend of imported water and desalinated seawater to member agencies within San Diego County. SDCWA’s imported water includes SWP supplies from MWD and Colorado River supplies acquired through other means. SDCWA receives Colorado River supplies via transfers from IID and conservation savings from several canal-lining projects. In October 2015, SDCWA began purchasing and treating desalinated seawater from the Carlsbad Desalination Plant, which is operated by Poseidon Resources Group. This desalinated seawater is blended into SDCWA’s treated water supply and delivered to SDCWA’s member agencies. Additional information regarding SDCWA’s historical, current, and planned supplies is available in SDCWA’s 2015 Urban Water Management Plan.
SDCWA supplies both treated and raw imported water to the City through five aqueduct connections. Treated water is delivered directly into the City’s distribution system. Raw water is treated at the City’s Weese WFP prior to delivery into the City’s distribution system. Of the SDCWA water supply, approximately 31% is purchased treated water and 69% is purchased untreated water that is then treated at the City’s Weese WFP.
SDCWA provided the City with its Draft Member Agency Demand Forecast for City of Oceanside in March 2016. Table 4-9 (above) shows the amount of water the City anticipates purchasing from SDCWA in five-year increments until 2040
6.3 Groundwater
CWC §10631(b)(1), §10631(b)(2), §10631(b)(3), §10631(b)(4)
The City utilizes groundwater from the Mission Basin subbasin of the San Luis Rey Valley Groundwater Basin. An overview of the Mission Basin, along with a summary of the City’s associated facilities and use, is provided here. The Mission Basin is shown on Figure 6-2, above.
6.3.1 Mission Basin
The Mission Basin is currently designated as a subbasin to the San Luis Rey Valley Groundwater Basin (DWR Bulletin 118 Groundwater Basin No. 9-7). The San Luis Rey Valley Groundwater Basin has been designated a medium priority basin under the California Statewide Groundwater Elevation Monitoring (CASGEM) program, meaning that the state considers it a priority basin for monitoring. The City has volunteered as a monitoring entity for the basin, in conjunction with the County of San Diego.
The Mission Basin is an alluvial basin extending from the Pacific Ocean in the west to just beyond the City’s eastern border. The basin is not adjudicated but is estimated to have a natural safe yield of 7,000 to 10,000 AFY. Due to high levels of TDS, ranging between 500 mg/L and 2,000 mg/L, desalting is

2015 Urban Water Management Plan Section 6: System Supplies June 2016 Final
City of Oceanside 6-7
required prior to distribution and use (MWD, 2007). Trichloropropane (TCP), iron and manganese levels are also of concern in the Mission Basin, but are treated to safe levels at the MBGPF (City of Oceanside, 2015a). No groundwater management plan is currently in place for the Mission Basin, but the City is exploring formation as the Groundwater Sustainability Agency (GSA) for the lower basin, along with designation as a formally-recognized basin separate from San Luis Rey Valley Groundwater Basin.
The City has conducted studies to determine the impact of groundwater pumping on local groundwater levels (Welch, 1996). Those studies concluded that the planned expansion of the MBGPF will result in no significant impacts to existing groundwater-dependent vegetation during extended dry-year periods lasting up to three years. With the addition of the IPR project, advanced treated water would recharged into the groundwater basin regardless of hydrologic conditions. Therefore, the MBGPF is considered a reliable source of up to 7,130 AFY of potable water during multiple-dry water years.
6.3.2 Mission Basin Groundwater Purification Facility
MBGPF is a desalting treatment facility that treats brackish groundwater extracted from the Mission Basin via eight wells including four “on-site” wells located at the MBGPF site and four “off-site” wells, located in the eastern portion of the basin near North River Road west of College Blvd. The MBGPF was put into service in 1992 with a capacity of 2.0 MGD, and expanded to its current capacity of 6.37 MGD, or 7,130 acre-feet per year, in 2002.
The primary MBGPF treatment process utilizes reverse osmosis membranes to reduce salt concentrations present in the groundwater. A secondary treatment process, added in 2009, utilizes granular activated carbon to remove 1, 2, 3-trichloropropane (TCP) from six of the wells. A side-stream treatment system is employed to reduce iron and manganese. The reverse osmosis membranes are Hydranautics Model ESPA1 that operate at a feed pressure of approximately 150 psi. The facility is capable of removing many impurities from the groundwater including particles, iron, manganese, TCP, and sodium to meet drinking water standards. Iron and manganese are present in the on-site wells, and manganese is present in the off-site wells.
After the minerals and other impurities are removed through reverse osmosis, the product is then blended with a 20% share of water direct from the well field and subjected to additional post-blend treatment to result in a finished, potable water supply. Table 6-5 shows the amount of groundwater pumped for the past 5 years. During this period, the City experienced some challenges in groundwater extraction, including mechanical limitations and well production. The City is continuing to make improvements to reduce these challenges, but have determined that the reliable average brackish groundwater supply is 3,300 AFY. The addition of IPR will allow for increased extraction of groundwater and help to consistently maximize the use of existing groundwater pumping and treatment facilities. As previously noted, the City anticipates expanding groundwater extraction and use to offset demands for purchased SDCWA water. Projected groundwater supplies are presented in Table 6-4, above.

2015 Urban Water Management Plan Section 6: System Supplies June 2016 Final
City of Oceanside 6-8
Table 6-5: Groundwater Volume Pumped (AFY)
DWR Table 6-1 Retail: Groundwater Volume Pumped
Supplier does not pump groundwater. The supplier will not complete the table below. Groundwater Type Location or Basin Name 2011 2012 2013 2014 2015
Alluvial Basin Mission Basin 4,522 3,371 4,575 4,735 3,213 TOTAL 4,522 3,371 4,575 4,735 3,213
6.4 Surface Water
The City does not use or plan to use self-supplied surface water as part of its water supply.
6.5 Storm Water
The City does not currently divert storm water for beneficial reuse and has no plans to do so as of the development of this plan.
6.6 Transfer Opportunities
CWC §10631(d)
The City has multiple connections to an intricate outside network of water distribution systems through SDCWA and neighboring urban water suppliers that can be utilized in an emergency. Aside from the small volume of water that the City provides to VID customers through the Fall/Olive Exchange, the City does not regularly sell or transfer water to other agencies. The City currently has nine emergency interconnections with four neighboring agencies that can be used to share supplies during short-term emergencies or planned shutdowns. The City has three emergency interconnections with Rainbow Municipal Water District (RMWD), two with Carlsbad Municipal Water District (CMWD), three with VID, and one with USMC Camp Pendleton. These connections are considered short-term exchanges for emergencies and are described in Table 6-6 below.
Table 6-6: Transfer and Exchange Opportunities
Neighboring Agency Location Size/
Capacity (cfs) Direction
VID Rose and Granada 8 City VID Fall Place 8 City VID E. Vista Way and Osborne 14 City and VID
RMWD Camino Corto 6 City RMWD Weese WFP 8 RMWD CMWD Vista Way and El Camino Real 16 Carlsbad CMWD College South of Esplanade 8 Carlsbad
USMC Camp Pendleton Morro Hills Reservoir 12 Camp
Pendleton Source: City of Oceanside, 2015a

2015 Urban Water Management Plan Section 6: System Supplies June 2016 Final
City of Oceanside 6-9
6.7 Desalinated Water Opportunities
CWC §10631(i)
The City has planned for desalinated water as an expected future water supply to become less dependent upon imported water and to diversify its water resources. Overall, the increase in demand over the next 25 years is significant, making the opportunity to use desalinated water even more important in the City’s plan to rely less on imported water and to expand its own water resources. There are two types of desalinated water available or potentially available to the City: desalinated groundwater and desalinated seawater. Desalinated groundwater is discussed in Section 6.3 Groundwater above. When desalinated seawater is included in SDCWA’s blended supply, there is potential for the City to receive some desalinated seawater through its purchases of treated water from SDCWA. SDCWA’s blended treated supplies began to include desalinated seawater from the newly constructed Carlsbad Desalination Plant at the end of 2015. These blended desalinated seawater supplies acquired through regular purchases from SDCWA are considered part of the City’s SDCWA supplies.
In addition to the desalinated seawater the City receives as part of its SDCWA purchases, the City is exploring the potential for an independent supply of desalinated seawater. The City completed a Seawater Desalination Pilot Facility and Feasibility Study in October 2010. The main objective of this study was to identify a feasible, constructible and cost effective project to add a seawater component to the MBGPF. As per the study, the source of the seawater would be a series of extraction wells near the mouth of the San Luis Rey River. The design of the wells would prevent drawdown of the Mission Basin and the drawdown of potential effects on the other City wells and the habitat mitigation areas. The planning would also need to consider the operation of the seawater barriers if the recharge and extraction project were to be implemented.
The seawater would be pumped from the wells back to the MBGPF, where a seawater reverse osmosis plant would be co-located. There is sufficient City-owned land to accommodate this addition, and the treated water would be introduced into the distribution system. The brine and brine disposal limitations would be similar to the groundwater storage and retrieval project described previously.
Combining existing MBGPF brackish water treatment with a nearby seawater component could potentially reduce costs for the City by co-locating facilities and reducing dependence on purchased water. This approach also maximizes the use of Mission Basin supplies and could result in a raw water salt content that is significantly lower than direct seawater, which can reduce energy costs substantially. The City’s 2015 Water Master Plan assumed implementation of a 5.0 MGD desalination plant with a net production of 4.5 MGD, or 5,040 AFY, in the long-term planning period. However, due to uncertainty regarding the feasibility of this project, the City has elected to exclude this potential seawater desalination supply from its supply projections.
6.8 Wastewater and Recycled Water
CWC §10633(a-g)
6.8.1 Wastewater Collection and Treatment Facilities
The City’s wastewater collection and treatment system is composed of two major systems: the San Luis Rey WWTP and the La Salina WWTP along with their collection systems. The San Luis Rey WWTP collects wastewater from the central and eastern portions of the City, as well as the City of Vista and Rainbow Municipal Water District (RMWD). The La Salina WWTP has historically collected wastewater from the western portion of the City; however, the City is currently in the process of

2015 Urban Water Management Plan Section 6: System Supplies June 2016 Final
City of Oceanside 6-10
decommissioning the La Salina WWTP. Effluent from both plants is discharged to the ocean through the Oceanside Ocean Outfall. The Morro Hills area in the northern part of the City uses septic systems and is not currently connected to any of the City’s wastewater facilities. The San Luis Rey WWTP can treat up to 0.7 MGD of wastewater to recycled water standards, while the La Salina WWTP has no tertiary treatment. California Department of Transportation (Caltrans) and one private customer located within the City also receives some recycled water from the Fallbrook Public Utility District (FPUD).
San Luis Rey WWTP
The City of Oceanside has produced recycled water for many years, starting with the construction of the San Luis Rey WWTP in 1972. Secondary effluent was supplied to Whelan Lake for storage, though the lake has since then changed its uses and is presently a bird sanctuary. The City has an existing recycled water system consisting of 1.2 miles of recycled water pipeline that serves one customer, the Oceanside Municipal Golf Course. The golf course received 104 AFY tertiary recycled water in 2015. Tertiary recycled water not delivered to the golf course is discharged into Whelan Lake, which received an estimated 160 AF in 2015. Tertiary recycled water is produced for approximately seven months of the year. Deliveries to Whelan Lake are not included in the City’s recycled water use data because it acts primarily as a form of disposal rather than a customer. Further, deliveries to Whelan Lake are made through an unmonitored meter. Between 2011 and 2015, annual deliveries to Whelan Lake averaged an estimated 194 AF, or approximately 60% of the City’s total recycled water production. Recycled water use in 2015 was lower than historical use as a result of overall water use reduction measures. Although recycled water use was exempt from mandatory restrictions, some changes implemented depressed demand (e.g., conversion to water wise landscaping), as well as behavioral changes in response to public perception.
The San Luis Rey WWTP provides secondary treatment for most of the City service area, as well as RMWD and a portion of the City of Vista. The San Luis Rey WWTP has a peak-month capacity of 15.4 MGD. The 2013 average annual secondary effluent flow was 9.7 MGD and average annual tertiary effluent flow was 0.35 MGD. By agreement, the plant also provides treatment for up to 1.5 MGD of wastewater from the RMWD.
The treatment processes at the San Luis Rey WWTP include preliminary, primary, and activated sludge secondary treatment. The biosolids are anaerobically digested and dewatered by centrifuges prior to land application. The majority of secondary effluent is sent to the Oceanside Ocean Outfall via the La Salina WWTP.
In 1991, a tertiary filter and chlorine contact basin was constructed. Currently, up to 0.7 MGD of the secondary effluent can be treated further to meet Title 22 requirements for unrestricted reuse. The
Installation of recycled water pipelines constructed as part of the Recycled Water Conversion and Pipelines Project

2015 Urban Water Management Plan Section 6: System Supplies June 2016 Final
City of Oceanside 6-11
effluent is disinfected in a chlorine contact channel and then stored in a 2.2 million gallon, lined storage pond located at the southerly portion of the San Luis Rey WWTP. The recycled water is then pumped to the Oceanside Municipal Golf Course or to replenish Whelan Lake. The City plans to expand tertiary treatment capacity at the San Luis Rey WWTP to 1.5 MGD by 2017 and 7.5 MGD by 2045. Secondary treatment capacity will be also increase from 13.5 MGD in 2020 to 17.4 MGD in 2045. The 2015 Recycled Water Facilities Plan included expansion of both an upper and lower distribution system within the City (see discussion below).
La Salina Wastewater Treatment Plant
The La Salina WWTP has a rated secondary treatment capacity of 5.5 MGD. The treatment processes include preliminary, primary, and activated sludge secondary treatment. The biosolids are anaerobically digested, dewatered by belt filter presses, and land applied off-site. There are no recycled water treatment facilities at the La Salina WWTP.
In 2014, the City completed an alternatives analysis for rehabilitating the La Salina WWTP but decided to move forward with the option to convert the plant to a pump station to convey wastewater flows to San Luis Rey WWTP for treatment. Therefore, all projected wastewater flows to La Salina WWTP will augment flows at San Luis Rey WWTP.
Fallbrook Public Utility (FPUD) District Treatment Plant
FPUD currently owns and operates one treatment (Plant No. 1) with a design capacity of 2.7 MGD. Previously FPUD has an additional plant (Plant No. 2) which has since been abandoned. Tertiary recycled water that is not used by FPUD is disposed in the Fallbrook Land Outfall, which runs through the City of Oceanside. By agreement with the City of Oceanside, FPUD can discharge up to 2.4 MGD on an annual average basis through the Oceanside Ocean Outfall.
Historically, recycled water from FPUD was used to irrigate the Arrowood Country Club in the City’s service area. This connection still exists, although in recent years the Arrowood Country Club has used water from private wells located on its property. A 1986 agreement between FPUD and Caltrans allows Caltrans to divert up to 2 MGD of recycled water from the Fallbrook Land Outfall for irrigation purposes.
FPUD is planning to upgrade their treatment plant to produce advanced treated recycled water and use the Fallbrook Land Outfall for brine discharge. Based on the City Council’s decision in November 2014, the Fallbrook Land Outfall will be used to convey raw wastewater to the San Luis Rey WWTP in the near-term. As a result, recycled water that currently serves Caltrans through FPUD will not be available in future projections. The City anticipates serving tertiary recycled water to Caltrans as part of its recycled water system expansion.
Camp Pendleton South Regional Tertiary Treatment Plant
North of the City, the U.S. Marine Corps, Camp Pendleton owns and operates the South Regional Tertiary Treatment Plant (SRTTP) which began operation in August 2006. The SRTTP has a tertiary design capacity of 5.0 MGD and currently treats an annual average flow of about 2.4 MGD. The recycled water produced is supplied through a recycled water distribution system to irrigate four sites in the southern part of the Camp Pendleton Base. Currently, the SRTTP treats all wastewater to tertiary levels, and excess tertiary treated effluent that is not recycled is discharged to the Pacific Ocean via the Camp Pendleton Land Outfall and the City of Oceanside’s Ocean Outfall.

2015 Urban Water Management Plan Section 6: System Supplies June 2016 Final
City of Oceanside 6-12
Table 6-7 shows the volume of wastewater collected in the City’s service area in 2015 from the San Luis Rey WWTP and La Salina WWTP. Table 6-8 summarizes the wastewater treatment and disposal within the City’s service area.
Table 6-7: Wastewater Generated Within Service Area in 2015
DWR Table 6-2 Retail: Wastewater Collected Within Service Area in 2015 Percentage of 2015 service area covered by wastewater collection system (optional) -- Percentage of 2015 service area population covered by wastewater collection system (optional) --
Name of Wastewater Collection Agency
Wastewater Volume
Metered or Estimated?
Volume of Wastewater Collected in
2015 (AF)
Receiving Wastewater Treatment
Name of Wastewater Treatment Agency
Receiving Collected Wastewater
Treatment Plant Name
Is WWTP Located Within UWMP Area?
Is WWTP Operation Contracted to a Third
Party? City of
Oceanside Metered 9,750 City of Oceanside San Luis Rey WWTP Yes No
City of Oceanside Metered 3,225 City of Oceanside La Salina
WWTP Yes No
USMC Camp Pendleton Metered 2,216 USMC Camp Pendleton SRTTP No Yes
Total Wastewater Collected from Service Area in 2015: 15,191
NOTES: Volumes were monitored in million gallons and converted into acre-feet for purposes of this 2015 Plan.

2015 Urban Water Management Plan Section 6: System Supplies June 2016 Final
City of Oceanside 6-13
Table 6-8: Wastewater Treatment and Discharge within Service Area in 2015
DWR Table 6-3 Retail: Wastewater Treatment and Discharge Within Service Area in 2015
No wastewater is treated or disposed of within the UWMP service area. The supplier will not complete the table below.
Wastewater Treatment
Plant Name
Discharge Location Name or Identifier
Discharge Location
Description
Wastewater Discharge ID
Number (optional)
Method of
Disposal
Does This Plant Treat Wastewater Generated Outside the
Service Area?
Treatment Level
2015 volumes
Wastewater Treated
Discharged Treated
Wastewater
Recycled Within
Service Area
Recycled Outside of
Service Area
San Luis Rey WWTP
Oceanside Ocean Outfall
Ocean Outfall Ocean
outfall Yes Secondary, disinfected 9,751 3,224 -- --
San Luis Rey WWTP
City of Oceanside
Recycled Water
Customers Other Yes Tertiary -- -- 264 --
La Salina WWTP
Oceanside Ocean Outfall
Ocean Outfall Ocean
outfall No Secondary, undisinfected 9,427 2,845 -- --
FPUD Plant No.1
Oceanside Ocean Outfall
Ocean Outfall Ocean
outfall Yes Tertiary 1,588 1,004 -- 584
Camp Pendleton
SRTTP
Oceanside Ocean Outfall
Ocean Outfall Ocean
outfall Yes Tertiary 2,216 -- -- --
Total 22,982 7,073 264 584 NOTES: Within the City’s service area, FPUD Plant No. 1 only provides recycled water to Caltrans.

2015 Urban Water Management Plan Section 6: System Supplies June 2016 Final
City of Oceanside 6-14
6.8.2 Potential and Projected Recycled Water Use
As noted previously, the City is actively pursuing substantial expansion of its recycled water system. As a member of the North San Diego Water Reuse Coalition (NSDWRC), the City is coordinating with nine other water and wastewater agencies in northern San Diego County to maximize recycled water use and improve recycled water efficiencies. Many of the planned recycled water projects and uses discussed here are also part of the NSDWRC’s efforts. Additional information on the NSDWRC is provided below.
Non-Potable Recycled Water
In 2015, the City completed its Recycled Water Facilities Plan (RWFP). The RWFP updates projected demands, needed treatment and distribution facilities, and estimated cost of water. Potential uses of recycled water include agricultural irrigation, landscape irrigation, wildlife habitat enhancement at Whelan Lake, and groundwater recharge. The primary use for recycled water will be for landscape irrigation, which includes golf courses (Oceanside Municipal Golf Course, Arrowood Golf Course, Ocean Hills Country Club, Goat Hill Golf Course), cemeteries, parks (El Corazon Site), and home owner associations.
As recommended in the City’s RWFP, two proposed recycled water systems were developed:
1. The Upper SLRWRF system includes service to Arrowood Golf Course, Gilligan Groves, Rocket Farms Herbs and other agriculture and irrigation customers. The Upper SLRWRF would serve 1,110 AFY of recycled water over the next 15 years (2015 – 2030) and includes expansion of the SLRWRF tertiary treatment plant from 0.7 MGD to 2.5 MGD and approximately 12 miles of new 6- to 20-inch diameter pipeline. The Upper SLRWRF system would be implemented in three phases:
Phase 1 would consist of the tertiary treatment expansion, operational storage and a tertiary pump station at the SLRWRF.
Phase 2 would consist of pipelines from the SLR WRF to the most northern area, and also to the western area to connect the inactive recycled water pipelines already in place. Two booster pump stations are needed along the distribution system to serve the northeast area. A storage tank (1 MG) would also be implemented in this phase.
Phase 3 would replace the recycled water supply from Camp Pendleton’s SRTTP and would consist of connecting to the existing recycled water pipelines near Arrowood Golf Course. An additional pump station would be needed at SLRWRF to serve Arrowood Golf Course.
2. The Lower SLRWRF System includes service to El Corazon Site, El Camino Country Club Golf, Ocean Ranch Future Development, Ocean Hills Area and other landscape irrigation customers. The Lower SLRWRF System would serve 2,040 AFY of recycled water over the next 25 years (2015 – 2040) and includes an additional expansion of the SLRWRF tertiary treatment by 3.75 MGD and approximately 23 miles of 6- to 20-inch diameter pipeline. The Lower SLRWRF system would be implemented in five phases:
Phase 1 would consist of supplying recycled water to Goat Hill Golf Course. The SLRWRF would be expanded by an additional 0.8 MGD and a 1.5 MG operation tank will be constructed at the El Corazon site. This phase includes two recently completed pipeline alignments the City constructed from the 10-inch diameter brine pipeline and modification

2015 Urban Water Management Plan Section 6: System Supplies June 2016 Final
City of Oceanside 6-15
to an existing pump station at the San Luis Rey WWTP to deliver recycled water to the El Corazon Recycled Water Tank and the Goat Hill Golf Course.
Phase 2 would consist of serving customers in the Ocean Hills Area, the El Camino Country Golf Club, the El Corazon Site, and Eternal Hills Cemetery. This phase would consist of two pump stations at the El Corazon Recycled Water Tank and a booster pump station near Vista Way and College Boulevard.
Phase 3 would consist of a new 16-inch diameter pipeline (22,700 linear feet) from SLRWRF to the proposed El Corazon Recycled Water Tank, which includes a river crossing, a highway crossing, and a tunnel near the intersection of Ocean Boulevard and Mesa Drive. Approximately 8,000 linear feet of 16-inch diameter pipeline east of the El Corazon Recycled Water Tank would also be implemented to serve the future development in the area of Ocean Ranch. This phase includes a storage tank, a pump station at the San Luis Rey WWTP, and two pump stations at the El Corazon Recycled Water Tank.
Phase 4 would extend the eastern alignment south to serve Mira Costa College and would consist of 11,280 linear feet of 8-inch diameter pipeline. This phase includes a storage tank, treatment expansion at SLRWRF, an additional pump at the San Luis Rey WWTP and an additional pump at El Corazon Recycled Water Tank.
Phase 5 would extend the eastern alignment to the north area and would consists of 20,110 linear feet of 6- to 16 inch diameter pipeline to serve recycled water to Villages of Rancho Del Oro and other customers in the this area. This phase includes a storage tank, additional pumps at the San Luis Rey WWTP and El Corazon Recycled Water Tank, and a new booster pump station near Avenida Del Oro and Avenida De La Plata.
Indirect Potable Reuse
The City is also planning to expand its recycled water program through the implementation of an IPR project. If IPR is implemented, advanced treated water would be stored in the Mission Basin for groundwater recharge through the use of a combination of injection and extraction. The recharged recycled water would help replenish the local groundwater basin, which would later be extracted for potable water usage. The MBGPF would be utilized to treat the additional supply, which would be pumped into the distribution system of the Guajome pressure zone. It is anticipated that the IPR project will provide approximately 3,360 AFY of additional supply by 2020 and 5,000 AFY of additional supply by 2050.
Indirect Potable Reuse (IPR) modeling showing residence time of recycled water in the Mission Basin

2015 Urban Water Management Plan Section 6: System Supplies June 2016 Final
City of Oceanside 6-16
North San Diego Water Reuse Coalition
The City is currently a member of the North San Diego Water Reuse Coalition (NSDWRC), a coalition of ten (10) water and wastewater agencies, developing a Regional Recycled Water Feasibility Study which will be utilized by the Coalition to pursue Title XVI funding from the US Bureau of Reclamation and Proposition 1 Funding from the State of California, as well as other state or local grant funds. Both the non-potable and potable reuse program components are included in the Coalition study.
Table 6-9 presents the current and projected recycled water use in the City through 2040. Projected recycled water supply will serve landscape irrigation demands for customers in the municipal, commercial, and government sectors, as well as potable demands through the City’s planned IPR project.

2015 Urban Water Management Plan Section 6: System Supplies June 2016 Final
City of Oceanside 6-17
Table 6-9: Current and Projected Recycled Water Use
DWR Table 6-4 Retail: Current and Projected Recycled Water Direct Beneficial Uses Within Service Area
Recycled water is not used and is not planned for use within the service area of the supplier. The supplier will not complete the table below.
Name of Agency Producing (Treating) the Recycled Water: City of OceansideName of Agency Operating the Recycled Water Distribution System: City of OceansideSupplemental Water Added in 2015 Not Applicable Source of 2015 Supplemental Water Not Applicable
Beneficial Use Type General Description of 2015 Uses Level of Treatment 2015 2020 2025 2030 2035 2040
Agricultural irrigation Landscape irrigation (exc. golf
courses) Municipal, commercial, and
government sectors. Tertiary 104 400 1,700 2,900 3,060 3,500
Golf course irrigation Commercial use
Industrial use Geothermal and other energy
production
Seawater intrusion barrier Recreational impoundment Wetlands or wildlife habitat
Groundwater recharge (IPR) Surface water augmentation (IPR)
Direct potable reuse Other Type of Use
Total: 104 400 1,700 2,900 3,060 3,500 NOTES: IPR - Indirect Potable Reuse. The City of Oceanside is pursuing IPR via injection of advanced treated water into the Mission Basin, and extracting it for potable use. This advanced treated water is not reported in this table for consistency between auto-calculated supplies and demands in the DWR tables and actual projected supplies and demands. This avoid the appearance of double-counting IPR as both a recycled water demand and a potable demand, and provides clarity for the reader when reviewing these detailed tables against the summary tables also provided in the text. Advanced Treated Water (IPR) will be used in the following volumes for each identified year: 2020 - 3,300 AF, 2025 - 3,300 AF, 2030 - 3,300 AF, 2035 - 3,300 AF, 2040 - 3,300 AF.

2015 Urban Water Management Plan Section 6: System Supplies June 2016 Final
City of Oceanside 6-18
As compared to the projections for 2015 from the 2010 Plan, actual 2015 recycled water use was low. Expansion of the City’s non-potable system was delayed during the planning and design phases, including conversion of an existing brine line into a dedicated recycled water transmission line and completion of environmental compliance. Table 6-10 shows the 2010 projection along with the actual 2015 recycled water use.
Table 6-10: 2010 UWMP Recycled Water Use Projection Compared to 2015 Actual Use
DWR Table 6-5 Retail: 2010 UWMP Use Projection Compared to 2015 Actual Use type 2010 Projection for 2015 2015 actual use
Sales to Other Agencies - - Agricultural irrigation - - Landscape irrigation (ex golf courses) 933 104 Golf course irrigation - - Commercial use - - Industrial use - - Geothermal and other energy production - - Seawater intrusion barrier - - Recreational impoundment - - Wetlands or wildlife habitat - - Groundwater recharge (IPR) - - Other - - Total 933 104
6.8.3 Methods to Encourage Recycled Water Use
Although recycled water is currently only available to the Oceanside Golf Course and Whelan Lake for habitat purposes, the City does offer financial incentives that will encourage recycled water use when it is made available to future customers. The City currently offers a discounted price for recycled water ranging between approximately 16% and 19% below the cost of potable water. In addition, Section 37.144 of the City’s municipal code includes a mandatory use ordinance that states “If recycled water service is determined by the administrative authority to be feasible, applicants for new water service shall be required to install onsite facilities to accommodate both potable water and recycled water service in accordance with the latest Water, Sewer, and Reclaimed Water Design and Construction Manual. The administrative authority may also require existing customers to retrofit existing onsite water service facilities to accommodate recycled water service.” With the expansion of the City’s recycled water distribution system and increased recycled water production, recycled water delivery will become more feasible. In concert with this mandatory use requirement and the expansion of the recycled water system, the City anticipates a substantial increase in recycled water use. Table 6-11 shows the City’s planned methods to expand future recycled water use.

2015 Urban Water Management Plan Section 6: System Supplies June 2016 Final
City of Oceanside 6-19
Table 6-11: Methods to Expand Future Recycled Water Use
DWR Table 6-6 Retail: Methods to Expand Future Recycled Water Use
Actions Description Planned
Implementation Year
Expected Increase in Recycled Water Use
Upper SLRWRF System – Phase 1
Tertiary treatment expansion, operational storage and pump station 2020 -
Upper SLRWRF System – Phase 2
Pipelines, two booster pump stations, storage tank 2025 720
Upper SLRWRF System – Phase 3 Pipelines and pump station 2030 390
Lower SLRWRF System – Phase 1
Tertiary treatment expansion, pipelines, and pump station 2020 60
Lower SLRWRF System – Phase 2
Pipelines, operational storage and pump station 2025 590
Lower SLRWRF System – Phase 3
Tertiary treatment expansion, pipelines, operational storage and pump station
2030 800
Lower SLRWRF System – Phase 4
Tertiary treatment expansion, pipelines, operational storage and pump station
2035 170
Lower SLRWRF System – Phase 5
Pipelines, operational storage and pump station 2040 420
Mandatory Use Ordinance Municipal Code Sec. 37.144 2014 - Total 3,150
6.9 Future Water Projects
CWC §10631 (g)
This section includes planned and alternative water projects to supply the City in the future.
6.9.1 Mission Basin Groundwater Purification Facility
The MBGPF is a very cost-effective source of water. However, limited well capacity and TCP contamination has limited the output to about 4.1 MGD. When capacity is reached, the average cost per acre-foot of operations and maintenance to treat the water will drop even further. The City is taking steps to increase the groundwater capacity to match the existing treatment capacity of 6.4 MGD, which is aligned with the safe yield of the Mission Basin. The 6.4 MGD matches the capacity of the Mission Basin without other sources of groundwater augmentation, which is discussed as an alternative later in this section. The design of new wells and pipelines to the MBGPF is underway.
6.9.2 Local Seawater Desalination Facility
In October 2010, the City completed a feasibility study that examined the potential to add seawater desalination to the existing MBGPF in order to meet future water supply demands. The source of the seawater would be a series of extraction wells near the mouth of the San Luis Rey River. The operation of seawater barriers will also be considered for the recharge and extraction project. The seawater

2015 Urban Water Management Plan Section 6: System Supplies June 2016 Final
City of Oceanside 6-20
reverse osmosis plant would be constructed at the MBGPF where treated water would be introduced into the distribution system.
Combining existing MBGPF brackish water treatment with a nearby seawater component could potentially reduce costs for the City. This approach also maximizes the use of San Luis Rey supplies and could result in a salt content that is significantly lower that direct seawater. Lower salt content can significantly reduce energy costs. Additional feasibility studies are currently underway to determine the potential for local seawater desalination. These studies expand on the work completed in 2010.
6.9.3 Wastewater Recycling
The 2015 RWFP investigated the feasibility of developing an extensive recycled water distribution system for the SLRWRP to identified markets within the City limits.
The Upper SLRWRF System would be implemented in three phases and would have a total capital cost of $42.7 million. The Upper SLRWRF System would serve 62 customers and offset an additional 1,110 AFY of potable water on top of existing production.
The Lower SLRWRF System would be implemented in five phases and would have a total cost of $84.1 million. The Lower SLRWRF System would serve 83 customers and offset 2,040 AFY of potable water.
The City plans to pursue additional direct reuse opportunities for treated effluent in the future, as funding becomes available. The San Luis Rey WWTP expansion included space for increased tertiary treatment capacity of 7.5 MGD for direct reuse. The City will require dual distribution facilities to be built in new developments where recycled water is planned for use.
The City is also actively pursuing the expansion of its recycled water program through an IPR project to increase water supply reliability. The City’s goal is to have this IPR project produce approximately 3.0 MGD of the City’s potable water supply, which would reduce the reliance on imported water. The actual capacity, size, and location of the future IPR facilities, as well as feasibility level cost estimates, are currently being developed by the City.
Table 6-12 lists the future water projects that would increase the City’s water supply.
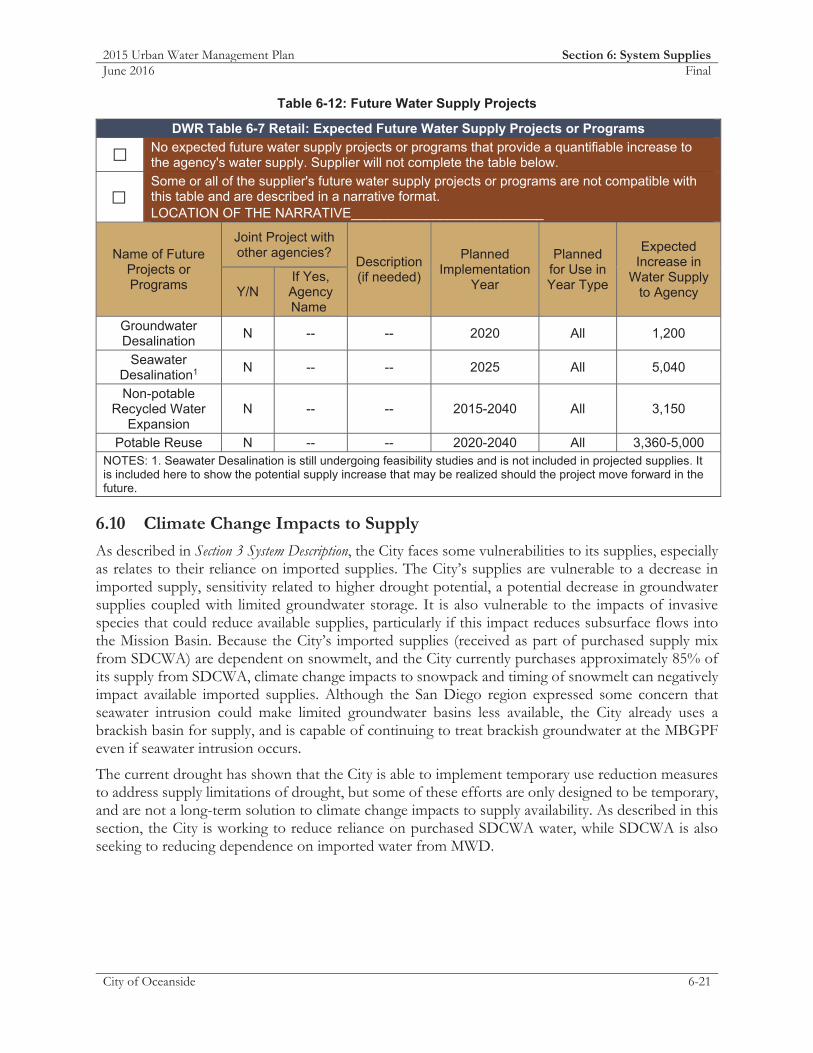
2015 Urban Water Management Plan Section 6: System Supplies June 2016 Final
City of Oceanside 6-21
Table 6-12: Future Water Supply Projects
DWR Table 6-7 Retail: Expected Future Water Supply Projects or Programs
No expected future water supply projects or programs that provide a quantifiable increase to the agency's water supply. Supplier will not complete the table below.
Some or all of the supplier's future water supply projects or programs are not compatible with this table and are described in a narrative format. LOCATION OF THE NARRATIVE__________________________
Name of Future Projects or Programs
Joint Project with other agencies?
Description (if needed)
Planned Implementation
Year
Planned for Use in Year Type
Expected Increase in
Water Supply to Agency Y/N
If Yes, Agency Name
Groundwater Desalination N -- -- 2020 All 1,200
Seawater Desalination1 N -- -- 2025 All 5,040
Non-potable Recycled Water
Expansion N -- -- 2015-2040 All 3,150
Potable Reuse N -- -- 2020-2040 All 3,360-5,000 NOTES: 1. Seawater Desalination is still undergoing feasibility studies and is not included in projected supplies. It is included here to show the potential supply increase that may be realized should the project move forward in the future.
6.10 Climate Change Impacts to Supply
As described in Section 3 System Description, the City faces some vulnerabilities to its supplies, especially as relates to their reliance on imported supplies. The City’s supplies are vulnerable to a decrease in imported supply, sensitivity related to higher drought potential, a potential decrease in groundwater supplies coupled with limited groundwater storage. It is also vulnerable to the impacts of invasive species that could reduce available supplies, particularly if this impact reduces subsurface flows into the Mission Basin. Because the City’s imported supplies (received as part of purchased supply mix from SDCWA) are dependent on snowmelt, and the City currently purchases approximately 85% of its supply from SDCWA, climate change impacts to snowpack and timing of snowmelt can negatively impact available imported supplies. Although the San Diego region expressed some concern that seawater intrusion could make limited groundwater basins less available, the City already uses a brackish basin for supply, and is capable of continuing to treat brackish groundwater at the MBGPF even if seawater intrusion occurs.
The current drought has shown that the City is able to implement temporary use reduction measures to address supply limitations of drought, but some of these efforts are only designed to be temporary, and are not a long-term solution to climate change impacts to supply availability. As described in this section, the City is working to reduce reliance on purchased SDCWA water, while SDCWA is also seeking to reducing dependence on imported water from MWD.

2015 Urban Water Management Plan Section 6: System Supplies June 2016 Final
City of Oceanside 6-22
Page intentionally blank

2015 Urban Water Management Plan Section 7: Supply Reliability Assessment June 2016 Final
City of Oceanside 7-1
SECTION 7: SUPPLY RELIABILITY ASSESSMENT
This section describes the overall reliability of the City’s water supplies, including water quality characteristics and contingency planning under drought conditions.
7.1 Constraints on Water Sources
CWC 10631, CWC 10634
Two major constraints on water sources have potential to affect water supply reliability for the City: service reliability and water quality. This section discusses the reliability of the City’s water supplies with respect to water quality and service reliability.
7.1.1 Service Reliability
The costs of demand management or supply augmentation to reduce the frequency and severity of shortages are now high enough that the City must look more carefully at the costs of unreliability to make the best possible estimate of the net benefit of taking specific actions, hence the term “reliability planning.” Reliability is a measure of a water service system’s expected success in managing water shortages. To plan for long-term water supply reliability, planners examine an increasingly wide array of supply augmentation and demand reduction options to determine the best courses of action for meeting water service needs. Such options are generally evaluated using the water service reliability planning approach.
Service reliability can be effected by climate (e.g., drought, snowmelt, and other factors), environmental (e.g., minimum flow requirements for habitat), and other factors such as cost (e.g., cost to buy or produce water, cost to expand systems to deliver water). Other factors that can cause water supply shortages are earthquakes, chemical spills, and energy outages at treatment and pumping facilities. City planners include the probability of catastrophic outages when using the reliability planning approach. Table 7-1 shows the different factors that may result in inconsistency of supply.
Table 7-1: Factors Resulting in Inconsistency in Supply
Name of Supply (Treatment Plant) Political/ Legal Environmental Water Quality Climatic
SDCWA water supply (Weese WFP)
Increased cost of water
Pumping restrictions on SWP; Earthquake
and aqueduct breakage
Reduced natural
streamflow and/or snowpack
Groundwater
(MBGPF) Increased TDS from seawater
intrusion
Reduced natural recharge
Recycled water (San Luis Rey WWTP)
Cost to install infrastructure
Reduced wastewater flows
in drought
Reliability planning requires information about: (1) the expected frequency and severity of shortages; (2) how additional water management measures are likely to affect the frequency and severity of shortages; (3) how available contingency measures can reduce the impact of shortages when they occur.

2015 Urban Water Management Plan Section 7: Supply Reliability Assessment June 2016 Final
City of Oceanside 7-2
The City of Oceanside is one of 24 member retail agencies of SDCWA. Member agency status entitles the City to directly purchase water for its needs from SDCWA on a wholesale basis. The City looks to SDCWA to ensure, to the best of its ability, that adequate amounts of imported water will be available to satisfy future water requirements. To maximize the reliability of the region’s water supply, SDCWA is executing a long-term strategy to diversify the region's supply sources, make major investments in the region’s water delivery and storage system, and improve water use efficiency.
In 1991, the San Diego region was 95% reliant on a single supplier of imported water – MWD. This made the region extremely vulnerable to water supply shortages. That year, an ongoing drought forced MWD to cut deliveries to the San Diego region by 30%. As a result of that crisis, the SDCWA Board approved a strategy to aggressively diversify its water supply portfolio by developing new local and imported water supplies. This strategy already is enhancing regional supply reliability and lessening the impact of current water cutbacks from MWD during the present drought. SDCWA is working with its 24 local member retail agencies to develop local supplies such as groundwater, recycled water, seawater desalination, and conservation. These efforts will offset demands on imported water, and on MWD in particular, while emphasizing local, drought-proof supplies. By 2020, SDCWA projects local water supplies to meet 33% of the region’s water demand, while 79% of demand will be met with water acquired from sources other than MWD.
SDCWA’s supply reliability analysis found that there would be reliable supplies for all years in a normal year and single-dry year scenario, while supplies would be reliable for all except the third year of a multi-dry year scenario in 2035 and 2040. This analysis was completed using a conservative methodology that only considered member agencies’ “verifiable” supplies, in addition to SDCWA’s supply projections and share of MWD supplies. Verifiable supplies are those that are far enough along in the planning, construction, or funding process to be considered certain during the projected planning period.
As part of the City’s conservation program, the City of Oceanside adopted Ordinance No. 091-15 on March 27, 1991, which established a water conservation program for the City. The City’s “Water Conservation” code was amended in 2008 through adoption of Ordinance No. 08-IR0439-1 and again in 2015 with adoption of Ordinance No. 15-OR0276-1, to revise the existing water conservation program and add drought response conservation measures to be implemented in the event of mandatory water reductions.
The City first completed a comprehensive Water Conservation Master Plan in May 2011, while the WCMP Update was completed in 2016 in conjunction with this 2015 Plan.
Installing Cured-In-Place-Pipe (CIPP) slip lining to rehabilitate the City’s pipelines and protect against leakages and water quality contamination.

2015 Urban Water Management Plan Section 7: Supply Reliability Assessment June 2016 Final
City of Oceanside 7-3
7.1.2 Water Quality
The City currently treats local groundwater supplies to eliminate total dissolved solids (TDS), iron, manganese, and trichloropropane that are characteristic of the groundwater in the region. Groundwater is extracted and treated at the MBGPF for delivery to the potable water system. Due to water quality issues, local groundwater must be treated in order to distribute up to 6.37 MGD of drinking water. Given current and projected operations, no water quality issues are expected to impact the City’s water supply.
7.2 Reliability by Type of Year
CWC 10631
This section identifies the historical water years that meet conditions for an average water year, a single-dry year, and multiple-dry years, for drought planning purposes. Single-dry and multiple-dry year conditions are usually based on historical records of annual runoff from a particular watershed. A multiple-dry year period is generally three or more consecutive years with the lowest average annual runoff. Consistent with SDCWA’s 2015 UWMP, the City’s single-dry year was determined to be 2015 and multiple-dry years were 2013 through 2015. Because the City does not utilize local supplies dependent on local, short-term hydrologic conditions, the City has elected to use a 30-year average (1986-2015) as its normal year, consistent with SDCWA’s 2015 UWMP. Table 7-2 shows the City’s basis for water year data.
Table 7-2 Basis of Water Year Data
DWR Table 7-1 Retail: Basis of Water Year Data
Year Type Base Year Available Supplies if Year Type Repeats
% of Average Supply Average Year 1986-2015 100% Single-Dry Year 2014 100% Multiple-Dry Years 1st Year 2013 100% Multiple-Dry Years 2nd Year 2014 100% Multiple-Dry Years 3rd Year 2015 93%-100% NOTES: The City as selected base years that aligned with SDCWA’s 2015 UWMP supply reliability assessment. The third year of a multiple-dry year scenario may result in deficits that must be met through extraordinary conservation or further expansion of the recycled water system. In years with supply reliability, additional purchases would be made from SDCWA to meet demands. As presented here, “% of Average Supply” indicates percent supply available to meet potable demands due to diversification and/or carryover storage.
7.3 Supply and Demand Assessment
CWC 10635
The UWMP Act requires every urban water supplier to assess the reliability of its water supply for normal, single-dry and multiple-dry years. Single-dry and multiple-dry year conditions were based on the City’s historical water use records.
The City has historically conserved water during single and multiple-dry years, so the forecast demands for dry years are considered conservative. The City anticipates no reduction of groundwater supplies for any hydrologic scenario. Groundwater is generally a drought-proof supply because the City’s projected extraction is well below the normal year safe yield. Both advanced treated IPR supplies and

2015 Urban Water Management Plan Section 7: Supply Reliability Assessment June 2016 Final
City of Oceanside 7-4
tertiary recycled water supplies are drought-proof supplies that would remain available during all scenarios. Because there is sufficient capacity at San Luis Rey WWTP to serve recycled water as demands increase in response to dry year conditions, as recycled water demands increase, deliveries would increase to meet demand. Table 7-3 identifies supply availability as a percent of normal year supplies for each scenario.
Demands are projected to increase during dry year scenarios, as shown in in Table 7-3. Because local supplies would not increase in availability, the City would need to purchase additional water from SDCWA to meet demands. For all years that SDCWA projects supply reliability, the City assumes it will be able to purchase sufficient water from SDCWA to meet demands. Should SDCWA project potential supply deficits, the City would implement extraordinary conservation or convert additional customers to recycled water. Extraordinary conservation measures are described in Section 8 Water Shortage Contingency Planning. As noted above, SDCWA projects potential deficits in the third year of a multiple-dry year in 2035 and 2040.
Table 7-3: Demand and Supply Assumptions, as Percent of Normal
Source Normal Water Year
Single-Dry Water Year
Multiple-Dry Water Years Year 1 Year 2 Year 3
Demands Potable Water 100% 107% 106% 111% 116%
Recycled Water 100% 107% 106% 111% 116% Total Percent of Normal Demands 107% 106% 111% 116%
Supplies
SDCWA Purchases 100% 109% 108% Variable (114%-115%)
Variable (110%-121%)
Groundwater 100% 100% 100% 100% 100% Advanced Treated
Water 100% 100% 100% 100% 100%
Recycled Water 100% 107% 106% 111% 116% Total Percent of Normal Potable
Supplies 107% 106% 111% Variable (108%-116%)
Total Percent of Overall Normal Supplies 107% 106% 111%
Variable (109%-116%)
7.3.1 Normal Supply and Demand Comparison
Table 7-4 compares current and projected water supply and demand. In average precipitation years, the City has sufficient water to meet its customers’ needs, through 2040. This is based on continued commitment to the City’s active and passive conservation programs, maintaining current groundwater rights, additional imported water available when needed from SDCWA, and the supply of recycled water.

2015 Urban Water Management Plan Section 7: Supply Reliability Assessment June 2016 Final
City of Oceanside 7-5
Table 7-4: Normal Year Supply and Demand Comparison
DWR Table 7-2 Retail: Normal Year Supply and Demand Comparison 2020 2025 2030 2035 2040
Supply totals 31,728 32,915 32,813 33,190 33,537 Demand totals 31,728 32,915 32,813 33,190 33,537 Difference 0 0 0 0 0 NOTES:
7.3.2 Single-Dry Year Supply and Demand Comparison
2015 was identified as the driest year in recent record consistent with SDCWA’s 2015 UWMP. The single-dry year scenario investigates the effect of an isolated single dry period similar to this year occurring in the future.
During a single-dry year, demands are expected to increase by an average of 7%. To meet these demands, the City will continue to supply customer with groundwater, recycled water, and projected advanced treated water supplies. To make up the remaining supply, the City will purchase additional water from SDCWA. The City anticipates that SDCWA will have sufficient supplies to allow for these additional purchases because SDCWA projects 100% reliability in the single-dry year scenario with changes in demand and supply consistent with the analysis completed by the City.
In the event of a historical single-year drought, the City has sufficient water to meet its customers’ needs, through 2040, as shown in Table 7-5.
Table 7-5: Single Dry Year Supply and Demand Comparison
DWR Table 7-3 Retail: Single Dry Year Supply and Demand Comparison 2020 2025 2030 2035 2040
Supply totals 33,886 35,153 35,044 35,447 35,818 Demand totals 33,886 35,153 35,044 35,447 35,818 Difference 0 0 0 0 0 NOTES:
7.3.3 Multiple-Dry Year Supply and Demand Comparison
The multiple-dry period supply and demand comparison examines the effect of a historical multiple-dry period occurring in the future. The historical dry year period was identified as the three year period from 2013-2015, consistent with SDCWA’s 2015 UWMP. The City has completed this analysis consistent with SDCWA’s 2015 UWMP, which projected an average increase in demand of 6%, 11%, and 16% for years 1 through 3, respectively, of a multi-dry year scenario (see Table 7-3, above).
During an extended event, an assumption was made that recycled water production would increase to meet additional recycled water demands, while advanced treated water and groundwater supplies would remain consistent with normal year projections. To make up the remaining supply, the City will purchase additional water from SDCWA. These additional purchases are anticipated to be accommodated for all years in which SDCWA projections 100% reliability. As noted in SDCWA’s 2015 UWMP, the third year of a multiple-dry year scenario has potential for a supply deficit in both 2035 and 2040. In those years, SDCWA projects a deficit of 3% and 7%, respectively. The City has

2015 Urban Water Management Plan Section 7: Supply Reliability Assessment June 2016 Final
City of Oceanside 7-6
therefore reduced the potential volume of water available from SDCWA by 3% and 7% in these years from its projected need.
As shown in Table 7-6, the City projects a potential deficit in 2035 and 2040 during the third year. This deficit would be addressed through implementation of extraordinary conservation or conversion of additional customers to recycled water beyond that already projected. These measures would reduce demands such that available supplies would be sufficient to meet demands, as shown in Table 7-7.
Table 7-6: Extraordinary Conservation in the Third Year of a Multiple Dry Year Scenario (AF)
Multiple-Dry Year: Year 3 2020 2025 2030 2035 2040 Potable Supply 36,403 36,272 34,759 33,891 32,392
Potable Demand 36,403 36,272 34,759 35,011 34,903 Potential Difference 0 0 0 1,120 2,511
Extraordinary Conservation or Conversion to Recycled Water 0 0 0 1,120 2,511
Total Potable Demand 36,403 36,272 34,759 33,891 32,392 Difference 0 0 0 0 0
Table 7-7: Multiple Dry Year Supply and Demand Comparison
DWR Table 7-4 Retail: Multiple Dry Year Supply and Demand Comparison 2020 2025 2030 2035 2040
First Year
Supply totals 33,759 35,022 34,913 35,314 35,683 Demand totals 33,759 35,022 34,913 35,314 35,683 Difference 0 0 0 0 0
Second Year
Supply totals 35,282 36,601 36,488 36,907 37,293 Demand totals 35,282 36,601 36,488 36,907 37,293 Difference 0 0 0 0 0
Third Year
Supply totals 36,868 38,247 38,129 37,446 36,459 Demand totals 36,868 38,247 38,129 37,446 36,459 Difference 0 0 0 0 0
NOTES:
7.4 Regional Supply Reliability
CWC 10620
The City continues to evaluate supply enhancement options, including additional water recycling, desalinated seawater, increasing groundwater supplies, potable reuse, water transfers, and additional imported water supplies through its collaboration with SDCWA. The City’s efforts to increase local supplies is discussed in Section 6 System Supplies.

2015 Urban Water Management Plan Section 8: Water Shortage Contingency Planning June 2016 Final
City of Oceanside 8-1
SECTION 8: WATER SHORTAGE CONTINGENCY PLANNING
This section describes the City’s plans and policies to address potential water shortages, including catastrophic interruptions and drought management.
8.1 Drought Ordinances
The City has two ordinances in place to establish operational procedures for long-term (drought) and short-term (catastrophic) water shortages. The two ordinances are listed and described in further detail below.
Water Conservation Program and Drought Response Conservation Measures for Mandatory Water Reductions (Ordinance No. 08-OR0439-1)
Updates to Water Conservation Program and Drought Response Conservation Measures (Ordinance No. 15-OR0276-1)
Water Conservation Program and Drought Response Conservation Measures for Mandatory Water Reductions (Ordinance No. 08-OR0439-1)
Originally adopted in 1991, the July 2008 updates to the City’s “Drought Ordinance” established regulations to be implemented during times of declared water shortages or declared water shortage emergencies. Ordinance No. 08-OR0439-1 establishes four levels of drought response actions, with increasing restrictions on water use in response to decreasing available supplies. This ordinance was based on a model program developed by the SDCWA for its member agencies. A copy of the ordinance is included in Appendix E.
Updates to Water Conservation Program and Drought Response Conservation Measures (Ordinance No. 15-OR0276-1)
The most recent amendment to the City’s “Drought Ordinance” occurred in May 2015 to incorporate Governor Brown’s 2014 state of emergency proclamation for drought and the 2015 Executive Order for 25% reduction of water use statewide. The City first escalated the drought response level from a Level 1 Drought Watch to a Level 2 Drought Alert in August 2014. SDCWA and its member agencies were able to analyze the effectiveness of the drought response program during this timeframe. The City then revised the Levels 1 and 2 drought conditions with the adoption of Ordinance No. 15-OR0276-1. A copy of the ordinance is included in Appendix E.
8.2 Stages of Action
CWC 10632(a)(1)
The water management stages shown in Table 8-1 are a sequential, regulatory program of increasingly stringent prohibitions on the use of water delivered within the City. As described above, the City’s Drought Ordinance establishes four levels of drought response actions to be implemented in times of shortage. When the City declares that a particular stage is in effect, City customers must comply with all regulations contained in the declared stage. In order to encourage water use efficiency and awareness, the City never operates at a level below Level 1.
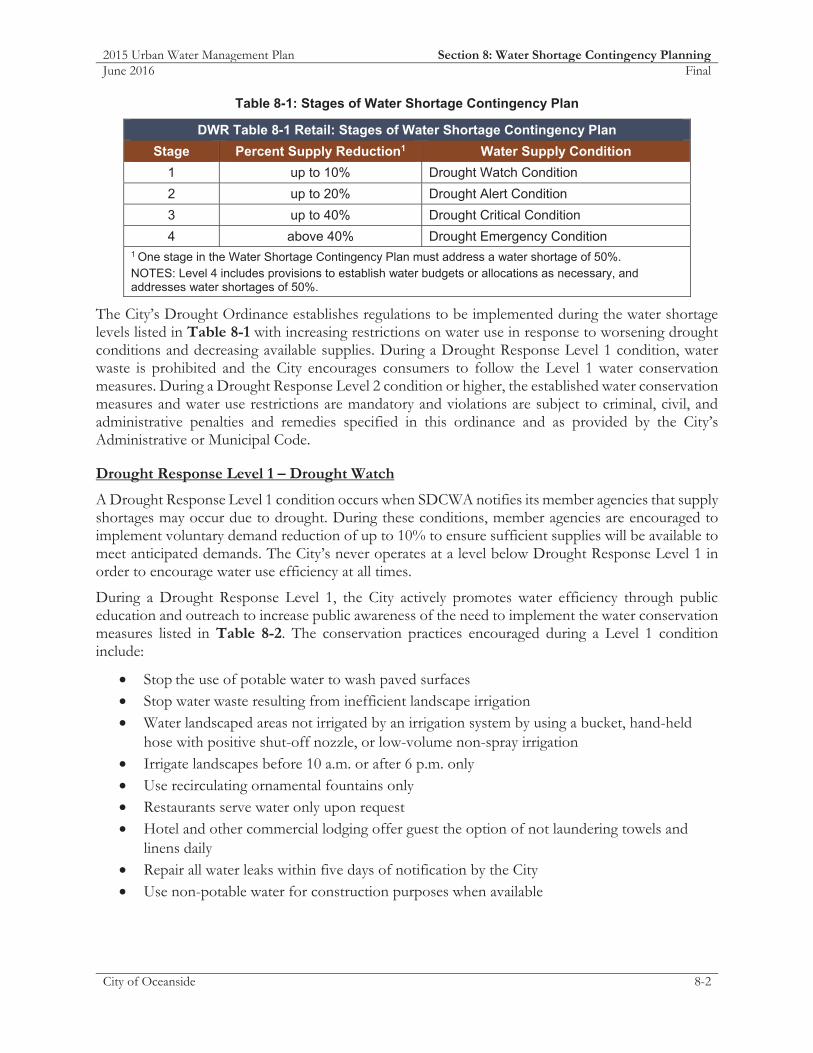
2015 Urban Water Management Plan Section 8: Water Shortage Contingency Planning June 2016 Final
City of Oceanside 8-2
Table 8-1: Stages of Water Shortage Contingency Plan
DWR Table 8-1 Retail: Stages of Water Shortage Contingency Plan Stage Percent Supply Reduction1 Water Supply Condition
1 up to 10% Drought Watch Condition 2 up to 20% Drought Alert Condition 3 up to 40% Drought Critical Condition 4 above 40% Drought Emergency Condition
1 One stage in the Water Shortage Contingency Plan must address a water shortage of 50%. NOTES: Level 4 includes provisions to establish water budgets or allocations as necessary, and addresses water shortages of 50%.
The City’s Drought Ordinance establishes regulations to be implemented during the water shortage levels listed in Table 8-1 with increasing restrictions on water use in response to worsening drought conditions and decreasing available supplies. During a Drought Response Level 1 condition, water waste is prohibited and the City encourages consumers to follow the Level 1 water conservation measures. During a Drought Response Level 2 condition or higher, the established water conservation measures and water use restrictions are mandatory and violations are subject to criminal, civil, and administrative penalties and remedies specified in this ordinance and as provided by the City’s Administrative or Municipal Code.
Drought Response Level 1 – Drought Watch
A Drought Response Level 1 condition occurs when SDCWA notifies its member agencies that supply shortages may occur due to drought. During these conditions, member agencies are encouraged to implement voluntary demand reduction of up to 10% to ensure sufficient supplies will be available to meet anticipated demands. The City’s never operates at a level below Drought Response Level 1 in order to encourage water use efficiency at all times.
During a Drought Response Level 1, the City actively promotes water efficiency through public education and outreach to increase public awareness of the need to implement the water conservation measures listed in Table 8-2. The conservation practices encouraged during a Level 1 condition include:
Stop the use of potable water to wash paved surfaces Stop water waste resulting from inefficient landscape irrigation Water landscaped areas not irrigated by an irrigation system by using a bucket, hand-held
hose with positive shut-off nozzle, or low-volume non-spray irrigation Irrigate landscapes before 10 a.m. or after 6 p.m. only Use recirculating ornamental fountains only Restaurants serve water only upon request Hotel and other commercial lodging offer guest the option of not laundering towels and
linens daily Repair all water leaks within five days of notification by the City Use non-potable water for construction purposes when available

2015 Urban Water Management Plan Section 8: Water Shortage Contingency Planning June 2016 Final
City of Oceanside 8-3
Drought Response Level 2 – Drought Alert
A Drought Response Level 2 condition occurs when SDCWA notifies its member agencies that demand reductions of up to 20% are required in order to maintain sufficient supplies to meet anticipated demands. The City declares a Level 2 condition through adoption of a resolution by City Council. With the declaration of a Level 2 drought condition, mandatory water use restrictions are implemented. All restrictions under Level 1 must continue to be adhered to, with the addition of the following mandatory measures:
Limit landscape irrigation to no more than two assigned days per week (added emergency measure per Ordinance No. 15-OR0276-1)
Limit irrigation using sprinklers to no more than ten minutes per assigned day Water landscaped areas not irrigated by an irrigation system by using a bucket, hand-held
hose with positive shut-off nozzle, or low-volume non-spray irrigation Stop irrigation with potable water of ornamental turf on public street medians Repair all leaks immediately upon notification by the City Stop operation of ornamental fountains or other decorative water features unless
recirculated water is used Stop all watering during and forty-eight hours following measurable precipitation Stop irrigation with potable water of landscapes outside of newly constructed homes and
buildings
Drought Response Level 3 – Drought Critical
A Drought Response Level 3 condition occurs when SDCWA notifies its member agencies that demand reduction of up to 40% is required in order to have sufficient supplies available to meet anticipated demands. All water users shall continue to comply with water conservation measures under Level 1 and Level 2 during a Drought Response Level 3 with the addition of the following mandatory conservation measures:
Limit landscape irrigation to no more than two assigned days per week Water landscaped areas not irrigated by an irrigation system by using a bucket, hand-held
hose with positive shut-off nozzle, or low-volume non-spray irrigation Stop filling or re-filling ornamental lakes or ponds, except to the extent needed to sustain
aquatic life of significant value Stop washing vehicles except at commercial carwashes that re-circulate water Repair all leaks immediately upon notification by the City
Additionally, with the declaration of a Drought Response Level 3 condition, no new potable water service shall be provided, no new temporary meters or permanent meters shall be provided, and no statement of immediate ability to serve or provide potable water service shall be issued. During Drought Response Level 3, the City may choose to implement an offset program that allows for continued development so long as they offset potable demands with recycled water retrofits or infrastructure. The City will suspend consideration of annexations to its service area. The City may establish a water allocation for properties within its service area.

2015 Urban Water Management Plan Section 8: Water Shortage Contingency Planning June 2016 Final
City of Oceanside 8-4
Drought Response Level 4 – Drought Emergency
A Drought Response Level 4 condition occurs when SDCWA declares a water shortage emergency and notifies its member agencies that a demand reduction of more than 40% is required to in order for the City to have maximum water supplies available to meet anticipated demands. The City will declare a Level 4 Drought Emergency in the manner and on the grounds provided in CWC Section 350. All water conservation measures under Levels 1, 2, and 3 shall continue to be adhered to with the addition of the following measure:
Stop all landscape irrigation, except crops and landscape products of commercial growers and nurseries
Additionally, the City may establish a water allocation for properties within its service area.
8.3 Prohibitions
CWC 10632(a)(4); 10632(a)(5); 10632(b); Health and Safety Code Section 115921(a)
In accordance with California Urban Water Conservation Council Best Management Practice 13, the City prohibits gutter flooding, single pass cooling systems in new connections, non-recirculating systems in all new conveyer car wash and commercial laundry systems, and non-recycling decorative water fountains.
The City also support efforts to develop state laws regarding exchange-type water softeners that would: (1) allow the sale of only more efficient, demand-initiated regenerating (DIR) models; (2) develop minimum appliance efficiency standards that (a) increase the regeneration efficiency standard to at least 3,350 grains of hardness removed per pound of common salt used; and (b) implement an identified maximum number of gallons discharged per gallon of soft water produced; (3) allow local agencies, including municipalities and special districts, to set more stringent standards and/or to ban on-site regeneration of water softeners if it is demonstrated and found by the agency governing board that there is an adverse effect on the re-claimed water or groundwater supply.
Further, the City has declared that at no time shall water be wasted or used unreasonably. Unreasonable uses of water include, but are not limited to, the following:
Failure to repair a water leak after notification from the City and opportunity to do so.
Failure to stop water waste resulting from conditions such as inefficient landscape irrigation excessive runoff, low head drainage, overspray of water flows onto non-targeted areas, overspray of water flows onto adjacent property, overspray and water flow onto non-irrigated areas, overspray and water flow onto roadways and adjacent structures.
As described above, the City implements mandatory water use restrictions with the Drought Response Levels 2, 3, and 4. Table 8-2 presents the City’s mandatory prohibitions and indicates at which drought stage the prohibitions takes effect.

2015 Urban Water Management Plan Section 8: Water Shortage Contingency Planning June 2016 Final
City of Oceanside 8-5
Table 8-2 Retail Only: Restrictions and Prohibitions on End Uses
DWR Table 8-2 Retail Only: Restrictions and Prohibitions on End Uses
Stage Restrictions and Prohibitions on End Users Additional Explanation or Reference
Penalty, Charge, or
Other Enforcement?
1 Other - Prohibit use of potable water for washing hard surfaces No
1 Landscape - Restrict or prohibit runoff from landscape irrigation No
1 Landscape - Limit landscape irrigation to specific times Irrigation must take place before 10 a.m. or after 6 p.m. No
1 Other - Require automatic shut of hoses No
1 CII - Other CII restriction or prohibition Limit landscape irrigation to specific times for nursery or commercial growers No
1 Water Features - Restrict water use for decorative water features, such as fountains With the exception of features that use re-circulated water No
1 CII - Restaurants may only serve water upon request No
1 CII - Lodging establishment must offer opt out of linen service No
1 Other - Customers must repair leaks, breaks, and malfunctions in a timely manner Leaks must be repaired within 5 days No
1 Other Non-potable water must be used for construction purposed when available No
2 Landscape - Limit landscape irrigation to specific days Limited to two assigned days per week Yes
2 Landscape - Other landscape restriction or prohibition Limit irrigation using sprinklers to no more than 10 minutes per day Yes
2 Landscape - Other landscape restriction or prohibition Stop irrigation with potable water of ornamental turf on public street medians Yes
2 Other - Customers must repair leaks, breaks, and malfunctions in a timely manner Leaks must be repaired immediately Yes
2 Water Features - Restrict water use for decorative water features, such as fountains With the exception of features that use re-circulated water Yes

2015 Urban Water Management Plan Section 8: Water Shortage Contingency Planning June 2016 Final
City of Oceanside 8-6
DWR Table 8-2 Retail Only: Restrictions and Prohibitions on End Uses
Stage Restrictions and Prohibitions on End Users Additional Explanation or Reference
Penalty, Charge, or
Other Enforcement?
2 Landscape - Other landscape restriction or prohibition Stop all watering during and 48 hours following measurable precipitation Yes
2 Other Stop irrigation with potable water outside newly constructed homes and buildings Yes
3 Landscape - Limit landscape irrigation to specific days Residential and commercial landscape irrigation limited to two assigned days per week from June - October and one day per week from November - May
Yes
3 Other water feature or swimming pool restriction Stop filling or re-filling ornamental lakes or ponds except to the extent needed to sustain aquatic life Yes
3 Other - Prohibit vehicle washing except at facilities using recycled or recirculating water Yes
4 Landscape - Prohibit all landscape irrigation With the exception of crops and landscape products of commercial growers and nurseries or other listed exceptions Yes
NOTES:

2015 Urban Water Management Plan Section 8: Water Shortage Contingency Planning June 2016 Final
City of Oceanside 8-7
8.4 Penalties and Charges
CWC 1063(a)(6)
The City of Oceanside does have provisions for penalties and charges for excessive use and mandatory prohibition violations. These are shown in Table 8-3.
Table 8-3: Penalties and Charges
Penalties or Charges Stage When
Penalty Takes Effect
Section 37.109 of the City Code provides that penalties for violation of the code sections related to water conservation are punishable as misdemeanor crimes under section 1.7 (a) (1) of the City Code with fines not to exceed $1,000 or imprisonment for a term not exceeding six months or both.
2
The City’s Water Conservation Ordinance includes provisions that water service can also be discontinued or limited to any customer who uses excessive water in a drought.
2
8.5 Consumption Reduction Methods
CWC 10632(a)(5)
The City of Oceanside’s Water Shortage Contingency Plan (WSCP) also provides consumption reduction methods to reduce water use in the most restrictive stages. These methods are listed in Table 8-4.
Table 8-4: Stages of WSCP - Consumption Reduction Methods
DWR Table 8-3: Retail Only: Stages of Water Shortage Contingency Plan – Consumption Reduction Methods
Stage Consumption Reduction Methods by Water Supplier Additional Explanation or Reference
1 Expand Public Information Campaign 1 Provide Rebates on Plumbing Fixtures and Devices 1 Provide Rebates for Landscape Irrigation Efficiency
1 Provide Rebates for Turf Replacement Only when funds are made available
1 Offer Water Use Surveys 3 Moratorium or Net Zero Demand Increase on New Connections 3 Implement or Modify Drought Rate Structure or Surcharge
3 Other Water allocations may be established
4 Moratorium or Net Zero Demand Increase on New Connections 4 Implement or Modify Drought Rate Structure or Surcharge
4 Other Water allocations may be established
NOTES:

2015 Urban Water Management Plan Section 8: Water Shortage Contingency Planning June 2016 Final
City of Oceanside 8-8
8.6 Determining Water Shortage Reductions
CWC 10632(a)(5)
Under normal conditions, the City monitors water sales and deliveries on a monthly basis. It also continually monitors water levels at Weese WFP to gauge water supply and demand conditions. All of the City’s water connections are metered with each individual meter are read monthly. The City prepares monthly sales and delivery reports which are reviewed and compared to reports and statistics from prior months and the same period of the prior year. Under shortage conditions, the City will determine water savings made from implementing the stages of the WSCP by reviewing and comparing production reports.
8.7 Revenue and Expenditure Impacts of Water Shortage
CWC 10632(a)(7)
It is difficult to precisely gauge the revenue and expenditure impacts of implementation of the WSCP. The plan provides for prohibitions on outdoor water use and requests for indoor use reductions, enforced by misdemeanor penalties for violation. Ultimate impacts will be based upon a mix of responses to these requirements and overall public cooperation in saving water in additional ways. Revenue will be reduced through lower water sales. However, the City will see this compensated to some degree by lower water purchase, pumping and treatment charges.
During the most recent cutbacks, the City has experienced revenue impacts. The following is the City’s estimate for revenue loss due to conservation efforts, most significantly in CY 2015 as a result of the State’s Emergency Conservation Regulation. These figures assume that percent reductions have a direct offset on all volumetric based charges (i.e., water sales, SDCWA surcharges, clean water surcharge). Estimates are based on data that was available and should be used for judging order of magnitude only. It should also be noted that these estimates do not represent direct reductions to the City’s net operating revenues, because there are offsetting reductions in expenditures that also occur with reduced consumption levels.
FY 2014/15 – Approximately -9.4% consumption reduction from FY 2013/14 levels, which resulted in approximately $2 million in reduced revenues
FY 2015/16 – Approximately -17.5% consumption reduction from FY 2014/15 levels, which will total -25% reduction in consumption (and associated revenue reduction) from FY 2013/14 levels
For planning purposes, it is assumed that City’s consumption reduction targets are met for each WSCP stage. Revenue losses are proportional to the commodity rate revenue not received, less variable cost reductions for treated water purchases from the SDCWA. No additional costs are assumed for WSCP (code) enforcement. While most water savings are likely to accrue from less outdoor water use there will also be revenue losses from somewhat less sewage produced and treated. For purposes here, and since the City charges a commodity charge on estimated sewage flow and can control that charge, revenue losses are assumed to be offset by collection and treatment cost reductions.

2015 Urban Water Management Plan Section 8: Water Shortage Contingency Planning June 2016 Final
City of Oceanside 8-9
8.8 Measures to Overcome Impacts
Impacts during Drought Response Levels 1 through 4 would likely be absorbed by City reserves without requiring a rate increase provided the shortage condition did not persist for more than a year. Impacts beyond a year or impacts from a greater level of shortage would need to be individually assessed. Measures to reduce expenses would be considered during a shortage such as reduction in capital expenditures, deferring non-critical maintenance items and deferring filling of personnel vacancies. Should revenue loss impacts begin to affect essential water system operations, the City has established a drought rate structure to offset loss of revenue.
As a conservation measure, the City has established a Drought Rate Structure, per Ordinance No. 09-OR0336-1, to be implemented to achieve the water reduction targets established in the City’s Drought Ordinance in the event of mandatory water reductions. The following tables (Tables 8-5 through 8-7) show the rate increases to be implemented during each drought level.
Table 8-5: Level 2 Drought Alert Rates: up to 20% Mandatory Reduction
Level 2 Drought Alert Rates: up to 20% Mandatory Reduction Service Fee Surcharge (per account): 10% higher than the current monthly rate
(per meter equivalent)
Commodity Charge: 1 unit = 748 gallons Range
Reduction up to 10% - Increase
Over Current Rate
Reduction up to 20% - Increase
Over Current Rate Single Family First Tier 0-13 units 0% 0% Second Tier 14-20 units 25% 60% Third Tier 21+ units 45% 100% Multi Family First Tier 0-7 units 0% 0% Second Tier 8-14 units 20% 55% Third Tier 15+ units 40% 109% Irrigation per unit 20% 40%
Non-Residential/ Commercial Agricultural per unit 15% 25%

2015 Urban Water Management Plan Section 8: Water Shortage Contingency Planning June 2016 Final
City of Oceanside 8-10
Table 8-6: Level 3 Drought Alert Rates: up to 20% Mandatory Reduction
Level 3 Drought Alert Rates: up to 20% Mandatory Reduction Service Fee Surcharge (per account): 25% higher than the current monthly rate
(per meter equivalent)
Commodity Charge: 1 unit = 748 gallons
Range 1 unit = 748 gallons
Increase over Current Rate
Single Family First Tier 0-11 units 0% Second Tier 12-18 units 70% Third Tier 19+ units 120% Multi Family First Tier 0-7 units 0% Second Tier 8-14 units 65% Third Tier 15+ units 115% Irrigation per unit 60% Non-Residential/ Commercial Agricultural per unit 40%
Table 8-7: Level 4 Drought Alert Rates: up to 20% Mandatory Reduction
Level 4 Drought Alert Rates: up to 20% Mandatory Reduction Service Fee Surcharge (per account): 30% higher than the current monthly rate
(per meter equivalent) Commodity Charge: 1 unit = 748 gallons Range Increase over Current Rate
Single Family First Tier 0-5 units 0% Second Tier 6-10 units 80% Third Tier 11+ units 150% Multi Family First Tier 0-4 units 0% Second Tier 5-8 units 75% Third Tier 9+ units 145% Irrigation per unit 80% Non-Residential/ Commercial Agricultural per unit 50%
Because the City’s accounts are fully metered, accounting for actual consumption can be monitored. Water production records will be examined monthly and compared against historical average monthly consumption data for that period. This data will be analyzed to assess any need for alterations to the WSCP.
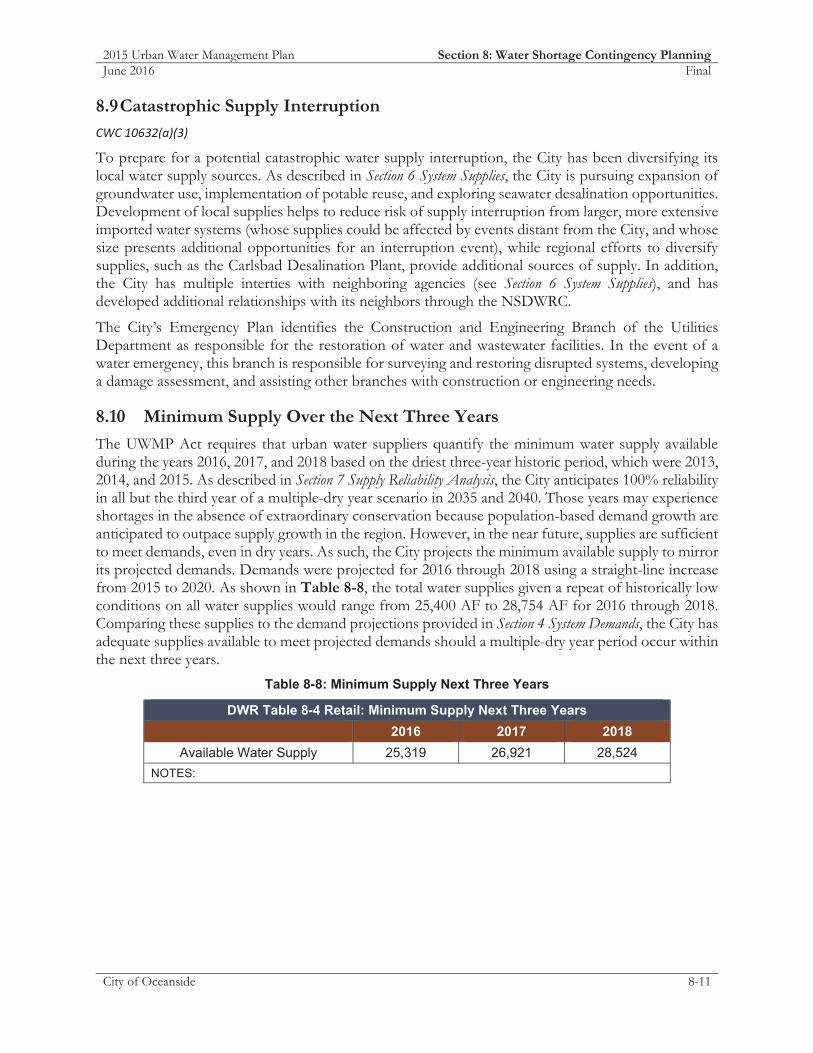
2015 Urban Water Management Plan Section 8: Water Shortage Contingency Planning June 2016 Final
City of Oceanside 8-11
8.9 Catastrophic Supply Interruption
CWC 10632(a)(3)
To prepare for a potential catastrophic water supply interruption, the City has been diversifying its local water supply sources. As described in Section 6 System Supplies, the City is pursuing expansion of groundwater use, implementation of potable reuse, and exploring seawater desalination opportunities. Development of local supplies helps to reduce risk of supply interruption from larger, more extensive imported water systems (whose supplies could be affected by events distant from the City, and whose size presents additional opportunities for an interruption event), while regional efforts to diversify supplies, such as the Carlsbad Desalination Plant, provide additional sources of supply. In addition, the City has multiple interties with neighboring agencies (see Section 6 System Supplies), and has developed additional relationships with its neighbors through the NSDWRC.
The City’s Emergency Plan identifies the Construction and Engineering Branch of the Utilities Department as responsible for the restoration of water and wastewater facilities. In the event of a water emergency, this branch is responsible for surveying and restoring disrupted systems, developing a damage assessment, and assisting other branches with construction or engineering needs.
8.10 Minimum Supply Over the Next Three Years
The UWMP Act requires that urban water suppliers quantify the minimum water supply available during the years 2016, 2017, and 2018 based on the driest three-year historic period, which were 2013, 2014, and 2015. As described in Section 7 Supply Reliability Analysis, the City anticipates 100% reliability in all but the third year of a multiple-dry year scenario in 2035 and 2040. Those years may experience shortages in the absence of extraordinary conservation because population-based demand growth are anticipated to outpace supply growth in the region. However, in the near future, supplies are sufficient to meet demands, even in dry years. As such, the City projects the minimum available supply to mirror its projected demands. Demands were projected for 2016 through 2018 using a straight-line increase from 2015 to 2020. As shown in Table 8-8, the total water supplies given a repeat of historically low conditions on all water supplies would range from 25,400 AF to 28,754 AF for 2016 through 2018. Comparing these supplies to the demand projections provided in Section 4 System Demands, the City has adequate supplies available to meet projected demands should a multiple-dry year period occur within the next three years.
Table 8-8: Minimum Supply Next Three Years
DWR Table 8-4 Retail: Minimum Supply Next Three Years 2016 2017 2018
Available Water Supply 25,319 26,921 28,524 NOTES:

2015 Urban Water Management Plan Section 8: Water Shortage Contingency Planning June 2016 Final
City of Oceanside 8-12
Page intentionally blank

2015 Urban Water Management Plan Section 9: Demand Management Measures June 2016 Final
City of Oceanside 9-1
SECTION 9: DEMAND MANAGEMENT MEASURES
CWC 10631(f) (1)(A); CWC 10631(f)(A); CWC 10631(f)(B)(i) through CWC 10631(f)(B)(vii); CWC 526(a); CWC 257(b)
This section describes the demand management measures (DMM) undertaken by the City and quantify DMM efforts from 2011 through 2015.
9.1 Demand Management Measures
The following sections describe the DMMs that have been implemented by the City of Oceanside over the past 5 years, along with planned implementation to achieve water use targets.
9.1.1 Water Waste Prevention Ordinances
The City has three ordinances in place to give the City the authority to prohibit water waste and encourage water use efficiency within the service area. Each ordinances is updated as-needed to stay current with State regulations. The three ordinances are listed and described in further detail below.
Updates to Water Conservation Program and Drought Response Conservation Measures (Ordinance No. 15-OR0276-1)
Water Efficient Landscaping (Ordinance No. 10-OR0412-1) Recycled Water (Ordinance No. 14-OR0565-1)
Updates to Water Conservation Program and Drought Response Conservation Measures (Ordinance No. 15-OR0276-1)
The most recent amendments to the City’s “Drought Ordinance” occurred in 2015 to incorporate Governor Brown’s 2014 state of emergency proclamation for drought and the 2015 Executive Order for 25% reduction of water use statewide. This ordinance clarifies the four drought response levels and describes the water use restrictions and required reductions for each stage. A copy of the ordinance is included in Appendix E.
Water Efficient Landscaping (Ordinance No. 10-OR0412-1)
To ensure compliance with the State’s Water Conservation in Landscaping Act, this ordinance was implemented to include 2006 development landscape design requirements and is written to be as effective as the State’s Model Water Efficient Landscape Ordinance. This ordinance si currently in the process of being updated.
The City replaced landscaping with artificial turf underneath and alongside the Oceanside Pier to reduce water use

2015 Urban Water Management Plan Section 9: Demand Management Measures June 2016 Final
City of Oceanside 9-2
Recycled Water (Ordinance No. 14-OR0565-1)
The ordinance establishes the authority for the City to enforce connection to and use of recycled water where applicable. A copy of the ordinance is included in Appendix G.
Planned Implementation to Achieve Water Use Targets
The City will maintain and expand its water waste prevention ordinances as needed to meet demand management goals established in this 2015 Plan.
9.1.2 Metering
All water service connections are metered and billed according to water consumed. The City does have Commercial/Industrial mixed-use meters and after a preliminary in-house feasibility study was performed concluded that the potential water savings to separate out the irrigation water usage with an additional meter would be small and unnoticeable and cost prohibitive. Therefore, the project has not perused further.
The City has an active water meter replacement program in place to continually change out older meters based on staff availability each month.
Planned Implementation to Achieve Water Use Targets
The City is planning to implement an advanced metering infrastructure (AMI) program, initially for its dedicated irrigation customers, with potential for future expansion. AMI, in concert with a web-based interface software (WaterSmart), will provide real-time consumption data to facilitate early identification of water loss, allow customers to track daily water use, and provide a mechanism for ongoing outreach and communication between the City and its customers. It will also allow the City to notify customers of overwatering throughout the month, rather than only once month.
9.1.3 Conservation Pricing
The City has and will continue to utilize a combination of uniform and increasing block or tiered rate conservation rate structures. Residential customers comprised of single family, master-metered residential, and multifamily customer classes are billed in increasing block structures where the water rate increases with additional water units consumed. Table 9-1 shows the proposed residential customer billing rates for 2016. Commercial, agricultural, and irrigation customer classes are billed using uniform rate structures where a flat rate is billed for every unit consumed. Table 9-2 shows the proposed billing rates for commercial customers.
Table 9-1: Residential Customer Billing Rates
Tier Block Structure Cost per Unit Single Family and Master – Metered (per dwelling unit) Tier 1 0 – 13 units $2.21/unit Tier 2 14 units and above $2.76/unit Multiple Family (per dwelling unit) Tier 1 0 – 7 units $2.21/unit Tier 2 8 units and above $2.69/unit

2015 Urban Water Management Plan Section 9: Demand Management Measures June 2016 Final
City of Oceanside 9-3
Table 9-2: Commercial Customer Billing Rates
Tier Cost per Unit Commercial Ag rate $2.43/unit Special Ag Rate $1.76/unit Irrigation rate $2.44/unit Commercial rate $2.36/unit
Planned Implementation to Achieve Water Use Targets
The City will maintain and expand its conservation pricing as needed to meet demand management goals established in this 2015 Plan.
9.1.4 Public Education and Outreach
The City engages in a variety of public education and outreach efforts to improve water use management, education, and efficiency. These programs are described here.
Outreach Activities
The City provides water conservation messaging to customers through their dedicated water conservation website www.SaveWaterOceanside.com which contains water conservation tips, rebate program information, water saving videos, and important links to other water conservation websites and regional partners.
The City staffs a ‘Save Water Oceanside’ booth dedicated to promoting water conservation at several events throughout the year. Displayed are brochure handouts containing indoor and outdoor water saving information and conservation tools as free giveaways. Giveaway items include toilet leak dye tabs, water saving buckets, hose nozzles, soil moisture meters, shower timers, shower gauge bags, and San Diego Gas & Electric Water and Energy Saving kits.
In order to reach a wide range of audiences, the City has brochures and handouts available at various community centers and City offices. Bill inserts are included with utility bills to announce available programs and important water conservation reminders. The City has consistently reached out to customers using various methods every quarter within the last five years. In coordination with SDCWA, the City promotes opportunities for residents to participate in regional programs such as Green Oceanside Business Network certification, California-Friendly landscape contest, Speaker Bureaus, and Citizens Water Academy.
Workshops
The City, in coordination with SDCWA, provides workshops on water related themes geared to the residential user. Workshop topics provided in the past include California Friendly Landscape Training and Fix-a-Leak. Workshops are offered for free and held at different locations through the county, with at least two workshops held in a City of Oceanside facility.
Marketing for workshops occurs by the City through strategically placed poster notices at various public locations such as libraries, community centers, and garden centers, as well as through email blasts or bi-monthly bill stuffer notifications.

2015 Urban Water Management Plan Section 9: Demand Management Measures June 2016 Final
City of Oceanside 9-4
School Education
The City offers two school education programs for local schools as well as education materials to teachers upon request through SDCWA. The Splash Lab offers assembly presentations available to grades K – 6 to educate students on water science. For Grades 4 – 6, students can participate in a mobile water lab for a hands-on experience learning water related topics.
The City holds a poster contest for 4th graders to compete for inclusion in the City’s annual water conservation calendar. The top posters are incorporated into the calendar that includes tips conservation tips and reminders. The poster is provided as a giveaway item to customers.
Residential Customer Rebates
In combination with the SoCal WaterSmart Program managed by MWD, rebates are available to upgrade water fixtures to be more water efficient. Table 9-3 provides a list of all rebates available and associated rebate amounts for residential customers.
A popular program that exhausted funds in 2015 was the turf removal rebate program designed to encourage the replacement of water thirsty turf for drought tolerant plants. The program has gathered about 900 participants since it began in 2014. Rebates for clothes washers and high efficiency (HE) toilets continue to be popular programs gathering participation of just over 2,000 fixtures replaced for each rebate program.
Table 9-3: Residential Water Conservation Rebate
Rebate Program Name Rebate Amount Indoor Fixtures Turf removal rebate $2/sqft up to $6,000 Clothes washer rebate $135 HE toilets $100 Outdoor Fixtures Irrigation controllers $80 Irrigation nozzles $4/nozzle - minimum is 15 Rain barrels $75 Soil moisture sensors $35/controller station
Commercial Customer Rebates
The City, in combination with SoCal WaterSmart Program managed by MWD, provides rebates geared towards commercial customers to promote water efficiency. Table 9-4 displays the rebates available grouped into market sectors with associated amounts available per rebate for commercial customers. Within the last five years the most applied for rebates programs by commercial customers include HE toilets with about 160 toilets replaced and turf removal rebates with 62 sites applying for the program.

2015 Urban Water Management Plan Section 9: Demand Management Measures June 2016 Final
City of Oceanside 9-5
Table 9-4: Commercial Water Conservation Rebates
Rebate Name Rebate Amount Indoor Fixtures HE toilet $100 or $145 (for more efficient 4- liter) Flush meters $100 UL Urinal $200 Zero Water urinal $200 Flow valve restrictions $5/valve Outdoor Fixtures Turf removal $2/sqft up to $6,000 Irrigation controllers $35/controller station Irrigation heads $4/nozzle Flow regulators $1 Soil moisture sensors $35/station Restaurant Fixtures Connectionless food steamers $485 Air-cooled ice machines $1,000 Commercial Industrial Cooling tower conductivity controllers $625 Cooling tower pH controllers $1,750 Dry vacuum pump $125 Laminar flow restrictors $10/restrictor
Water Smart Check-up Program
The City has offered, and will continue to offer, the Water Smart Check-up program in coordination with SDCWA, where a WaterSmart representative visits a property upon request to provide water saving tips and perform a water audit which includes an inventor of water fixtures used indoors and outdoors, replacing high use water fixtures, evaluating toilets for leaks, and performing a landscape water audit turning on stations to evaluate for inefficiencies and adjusting water schedules where appropriate. A summary report with additional conservation advertising is left with the customer at the end of the appointment.
Planned Implementation to Achieve Water Use Targets
The City will continue to support numerous public outreach, education, and rebate programs to support demand management. The City’s WCMP Update identifies the following suite of activities in the City’s “toolbox” of conservation programs to be implemented to achieve water use targets:
1. Single Family Indoor Water Surveys 2. High Efficiency Faucet Aerator, Showerhead, and Soil Moisture Sensor Giveaway 3. Residential Clothes Washer Rebate 4. Residential Outdoor Water Surveys 5. Large Landscape Outdoor Water Audit

2015 Urban Water Management Plan Section 9: Demand Management Measures June 2016 Final
City of Oceanside 9-6
6. Large Landscape Water Budgeting/Monitoring 7. Rotating Sprinkler Nozzle Rebates 8. Provide Rain Barrel Incentive 9. Top Water Users Program (Top Customers from Each Customer Category) 10. CII Rebates to Replace Inefficient Equipment 11. Require Plan Review for New CII 12. Promote High Efficiency Pre-Rinse Spray Valves 13. Public Information 14. School Education 15. Incentive for Recycled Water Conversions 16. Agricultural Water Audit Program
9.1.5 Programs to Assess and Manage Distribution System Real Loss
The City has completed the AWWA Water Loss Audit Software program and has determined that water losses are within the acceptable industry standard range. The City is proactive in reducing unaccounted for water by ensuring water meters are regularly maintained, evaluated for functionality, and replaced at industry standards.
Reported leaks are investigated and recorded in a tracking database that collects the time of report, leak location, and type of leaking pipe or fitting. Leaks are repaired to the extent that is cost effective and prioritized based on potential water loss.
Planned Implementation to Achieve Water Use Targets
The City will continue to survey and correct its own infrastructure system and processes to reduce system real loss.
9.1.6 Water Conservation Program Coordination and Staffing Support
Water Conservation program coordination is staffed by a full time Professional Assistant who works as the Water Conservation Coordinator under the direction and supervision of the Senior Management Analyst and program manager for Water Conservation. The City’s Water Conservation Program Manager is Ms. Teresa Gomez, (760) 435-5815, [email protected].
Planned Implementation to Achieve Water Use Targets
The City maintains both a Water Conservation Coordinator and Program Manager as point of contact for demand management activities.
9.1.7 Other Demand Management Measures
To reduce water use and help promote the turf rebate program (which has since run out of funding due to demand), the City reduced turf at City Parks and Facilities. To date, the City has reduced turf at twenty-two City parks and facilities. Information regarding each renovated site is available on the web site and includes before and after pictures, square footage of turf replaced, and anticipated water savings. Within the City’s service area, 55 residential and 2 commercial customers participated in the regional turf conversion rebate program managed by SDCWA. In total, 65,926 square feet of turf was converted by the City’s customers under this program.

2015 Urban Water Management Plan Section 9: Demand Management Measures June 2016 Final
City of Oceanside 9-7
Drought Efforts
Drought restrictions began in June 2015 with the goal to achieve the state-mandated 20% reduction in water use. The City announced through direct mailing to all customers that the City was initiating a Stage 2 Drought Alert Condition Response which incorporates a mandatory two day watering limit to all customers for outdoor irrigation (see Section 8 Water Shortage Contingency Planning). Restaurants were offered table tent cards announcing water will be served upon request, hotels were offered door hangers encouraging reusing towels and free shutoff nozzles were offered to slip renters at the harbor to reduce water use for boat wash-down. The City created signs to be placed in prominent areas around town providing conservation messages, including resident’s yards to announce their commitment for saving water.
To facilitate enforcement, the City initiated a water waste reporting online form to allow customers to report observations of water waste. The City followed up on the reports of water waste through drought violation door hangers and administrative fines of up to $1,000 for repeat offenders.
Planned Implementation to Achieve Water Use Targets
The City will continue to implement drought management conditions as needed, including water waste reporting and investigations.
9.2 California Urban Water Conservation Council Reporting
The City is a signatory of the CUWCC, and reports their water conservation activities every two years. BMP annual reports for years 2013 – 2014 are included in Appendix H. The reports provide documentation that the City is in full compliance with the MOU.

2015 Urban Water Management Plan Section 9: Demand Management Measures June 2016 Final
City of Oceanside 9-8
Page intentionally blank.

2015 Urban Water Management Plan Section 10: Plan Adoption, Submittal, and Implementation June 2016 Final
City of Oceanside 10-1
SECTION 10: PLAN ADOPTION, SUBMITTAL, AND IMPLEMENTATION CWC 10608.26(a); CWC 10621(b) through (c); CWC 10635(b); CWC 10642; Government Code 6066; CWC 10644(a)(1); CWC 10645
This section of the UWMP addresses the steps the City of Oceanside has taken to adopt this UWPM and submit it to DWR, along with the steps that will be taken should it prove necessary to amend this UWMP.
10.1 2015 Water Use Data
In order to demonstrate compliance with SBx7-7, this 2015 Plan contains water for use and planning data for the entire calendar year of 2015. Data from 2015 is documented whenever it appears throughout the plan.
10.2 Plan Noticing and Adoption
A 60-day notice of release of this 2015 Plan and the public hearing was sent to San Diego County and adjacent cities and other entities on March 30, 2016. A notification of a change in the hearing date was sent to all of the same entities on June 1, 2016. The notification list is included in Appendix I and summarized in Table 10-1.
Table 10-1 Retail: Notification to Cities and Counties
DWR Table 10-1 Retail: Notification to Cities and Counties City Name 60 Day Notice Notice of Public Hearing
City of CarlsbadCity of Escondido
County Name 60 Day Notice Notice of Public Hearing
San Diego County
The UWMP was made available for review from May 10, 2016 to June 22, 2016 at the City’s Water Utilities Department (300 North Coast Highway, Oceanside, California 92054) and on the City’s website at http://www.ci.oceanside.ca.us/gov/water/admin/uwmp.asp. A Notice of Public Hearing was published in the San Diego Union Tribune, North County Edition on June 8, 2016 and June 15, 2016 to notify interested parties that the UWMP was available and the date/time of the public hearing.
A public hearing was held on June 22, 2016 at City Council Chambers, 300 North Coast Highway, Oceanside, California 92054 to present, receive comments, and solicit feedback on this 2015 UWMP. The public hearing was open to the public and all interested parties were welcome to attend. The City reviewed all of the comments received and revised the UWMP accordingly. Immediately following the public hearing, the City Council adopted the 2015 UWMP on June 22, 2016 by Resolution No. 16-R0431-1, as included in Appendix J.

2015 Urban Water Management Plan Section 10: Plan Adoption, Submittal, and Implementation June 2016 Final
City of Oceanside 10-2
10.3 Plan Submittal
Within 30 days of adoption, the City submitted copies to DWR, SDCWA, California State Library, and County of San Diego, in addition to placing the adopted 2015 UWMP on the City’s website at http://www.ci.oceanside.ca.us/gov/water/admin/uwmp.asp. The submittal to DWR was electronic, completed through the WUEdata online submittal tool.
The City shall implement the adopted UWMP in accordance with the schedule described herein and as capital funding is available.
10.4 Plan Amendment
If an amendment to this UWMP is necessary due to changing water supply conditions within the City and/or comments from DWR, the City Council will recirculate all required public notices and host a public hearing to consider public comments prior to approval of the amendment.

2015 Urban Water Management Plan Section 11: References June 2016 Final
City of Oceanside 11-1
SECTION 11: REFERENCES
California Department of Finance (DOF). 2015. E-8 Historical Population and Housing Estimates for Cities, Counties, and the State.
California Department of Water Resources (DWR). 2016. 2015 UWMP Guidebook for Urban Water Suppliers. March.
City of Oceanside. 2015a. 2015 Integrated Master Plans. Water Master Plan. June.
City of Oceanside. 2015b. 2015 Integrated Master Plans. Recycled Water Facilities Plan. December.
City of Oceanside. 2015c. 2015 Integrated Master Plans. Sewer Master Plan. June.
City of Oceanside. 2016. 2016 Water Conservation Master Plan Update. June.
City of Oceanside. Mission Basin IPR Feasibility Study. City of Oceanside. 2010. 2010 Seawater Desalination Pilot Facility and Feasibility Study. October.
Metropolitan Water District of Southern California. 2007. Groundwater Basin Reports: San Diego County Basins – Central San Diego County Basins. September.
National Oceanic and Atmospheric Administration (NOAA). 2015. National Climatic Data Center – Custom Monthly Normals, City: US060019 (Oceanside, CA US). Accessed 28 March 2016.
North San Diego Water Reuse Coalition (NSDWRC). 2015. Regional Recycled Water Project Environmental Impact Report. September.
San Diego Association of Governments (SANDAG). 2015. Series 13 2050 Regional Growth Forecast – City of Oceanside.
San Diego County Water Authority (SDCWA). 2016. 2015 Urban Water Management Plan – Member Agency Draft. April.
San Diego Regional Water Management Group (RWMG). 2013. San Diego 2013 Integrated Regional Water Management Plan. September.
Welch, Michael R. 1996. Supplemental Groundwater Pumping Analysis, Expansion of Oceanside Mission Basin Brackish Groundwater Desalting Facility to a Potable Water Production Capacity of 6.37 MGD. February.

2015 Urban Water Management Plan Section 11: References June 2016 Final
City of Oceanside 11-2
Page intentionally blank.


2015 Urban Water Management Plan 2016
City of Oceanside
Page intentionally blank


2015 Urban Water Management Plan 2016
City of Oceanside
Page intentionally blank

2015 Urban Water Management Plan 2016
City of Oceanside
Page intentionally blank


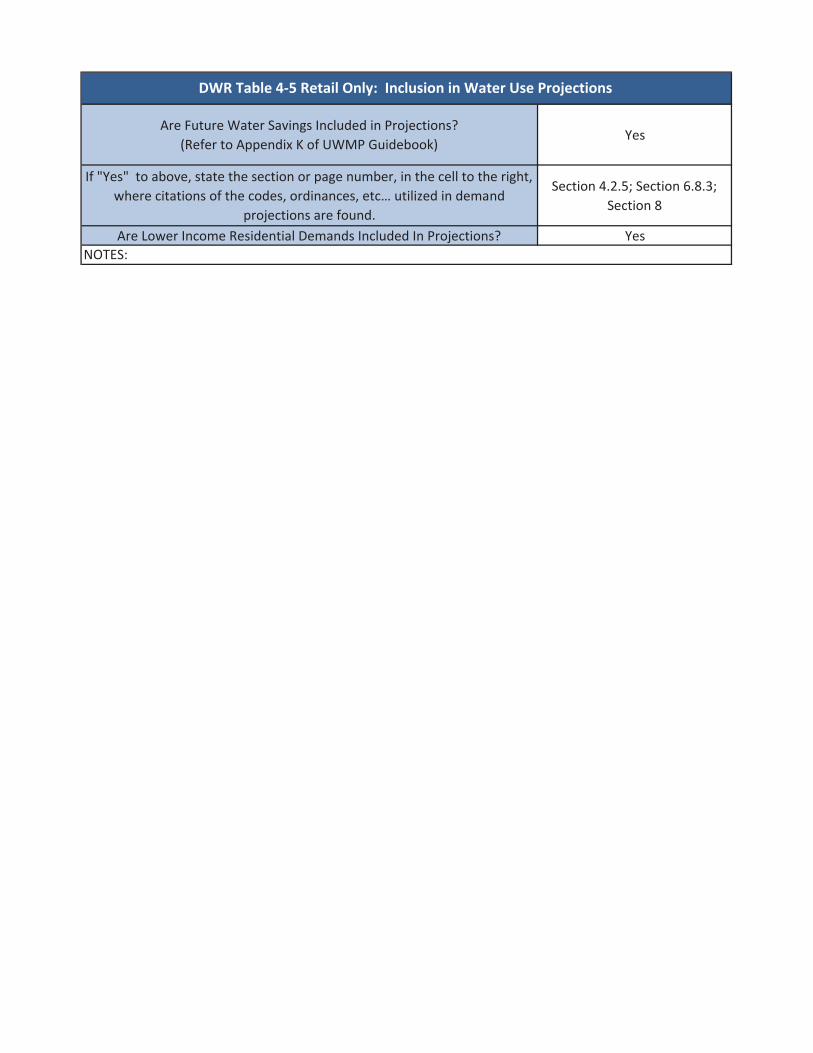


*The unit of measure must be consistent with Table 2-3

1 If the 2008 recycled water percent is less than 10 percent, then the first baseline period is a continuous 10-year period. If the amount of recycled water delivered in 2008 is 10 percent or greater, the first baseline period is a continuous 10- to 15-year period.2 The ending year must be between December 31, 2004 and December 31, 2010.3 The ending year must be between December 31, 2007 and December 31, 2010.


Optional(+/-)
Optional(+/-)
* Meter Error Adjustment - See guidance in Methodology 1, Step 3 of Methodologies Document
* Meter Error Adjustment - See guidance in Methodology 1, Step 3 of Methodologies Document


Contact DWR for these tables


* Maximum 2020 Target is 95% of the 5 Year Baseline GPCD


(in GPCD)(Adjusted if applicable)

2015 Urban Water Management Plan 2016
City of Oceanside
Page intentionally blank


Climate Change Planning Study
Final
Prepared by:
May 2013

Climate Change Planning Study May 2013
i

Climate Change Planning Study May 2013
ii

Climate Change Planning Study May 2013
iii
Climate Change Planning Study May 2013
iv

Climate Change Planning Study May 2013
1
1 Climate Change in Water Resources 2012 IRWM Program Guidelines
California Water Plan (CWP) Update 2009
1.1 Introduction
1.2 Adaptation Relationship
o

Climate Change Planning Study May 2013
2
o
o
o
ooo
o
o
o
o
o
oo
o
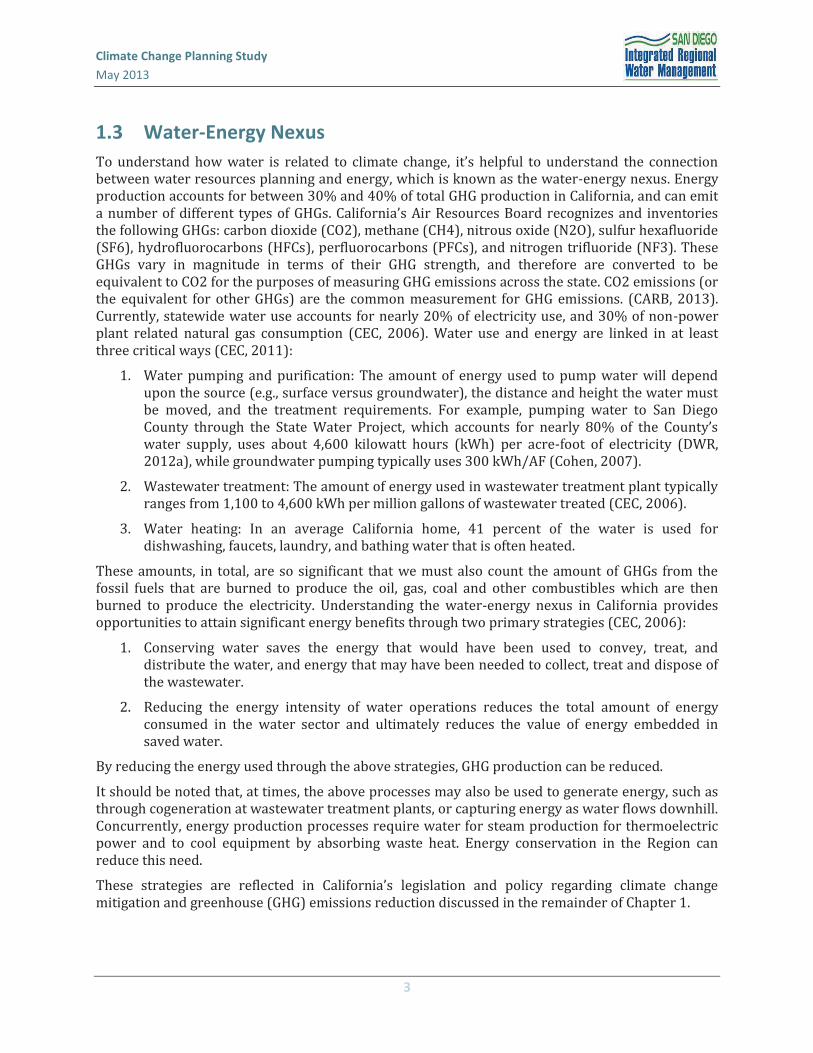
Climate Change Planning Study May 2013
3
1.3 Water-Energy Nexus

Climate Change Planning Study May 2013
4
1.4 Legislative and Policy Context
Executive Order S-3-05
Assembly Bill 32: The California Global Warming Solutions Act of 2006

Climate Change Planning Study May 2013
5
Climate Change Scoping Plan
Senate Bill 97
Managing an Uncertain Future: Climate Change Adaptation Strategies for California’s Water
Executive Order S-13-08
California Climate Adaptation Strategy

Climate Change Planning Study May 2013
6
GHG Reporting Rule
Water Code Section 10541
1.5 AB 32 Scoping Plan and CARB Strategies

Climate Change Planning Study May 2013
7
1.6 California Climate Action Registry/The Climate Registry
1.7 Climate Action Plans and Climate Initiatives

Climate Change Planning Study May 2013
8
2 Climate Change in IRWM Planning 2.1 DWR Requirements

Climate Change Planning Study May 2013
9
Table 1: IRWM Plan Standards in Relation to Climate Change
measures. Consider OPC’s Sea Level Rise Policy
Stay involved in CNRA’s California Adaptation Strategy process
Based on information in DWR’s 2012 Prop 84 and Prop 1E IRWM Guidelines, Appendix C, Table 7
2.2 Adaptation and Mitigation Analysis

Climate Change Planning Study May 2013
10
2.3 San Diego IRWM Region Climate Change Study

Climate Change Planning Study May 2013
11
3 Effects of Climate Change on Region 3.1 Impacts and Effects on Region
Regional Focus 2050 Study
2010 Urban Water Management Plan
Using Future Climate Projections to Support Water Resources Decision Making in California,
Reconciling Projections of Colorado River Streamflow, Southwest Hydrology

Climate Change Planning Study May 2013
12
Table 2: Impacts and Effects of Climate Change on Region by 2050
3.2 Identification of Vulnerabilities
Climate Change Handbook for Regional Water Planning.
Climate Change Handbook

Climate Change Planning Study May 2013
13

Climate Change Planning Study May 2013
14

Climate Change Planning Study May 2013
15
customers’ demands once drought measures were put into
Region’s vulnerability to this issue.
limiting the water bodies’ assimila

Climate Change Planning Study May 2013
16
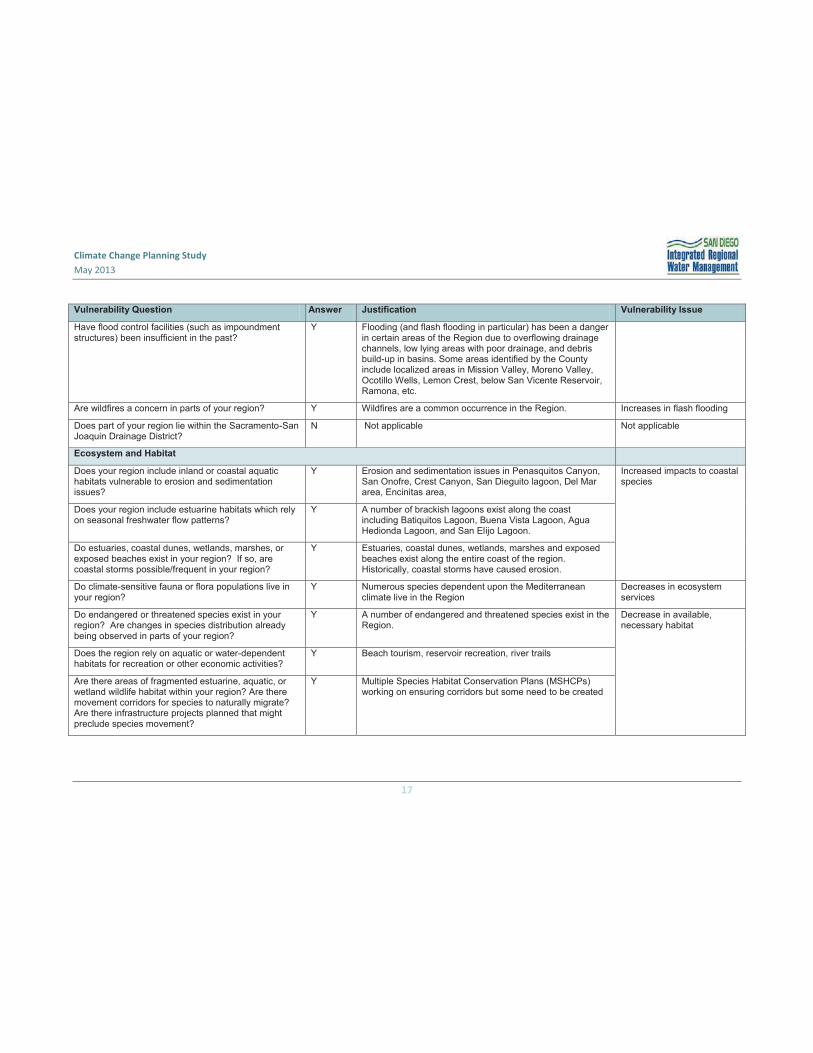
Climate Change Planning Study May 2013
17

Climate Change Planning Study May 2013
18
in the Endangered Species Coalition’s Top

Climate Change Planning Study May 2013
19 San Diego Integrated Regional Water Management Plan DRAFT
4 Vulnerability Analysis
4.1 Vulnerability Prioritization Process
4.2 Vulnerability Prioritization Results
Table 4: Prioritized Climate Change Vulnerability Issues
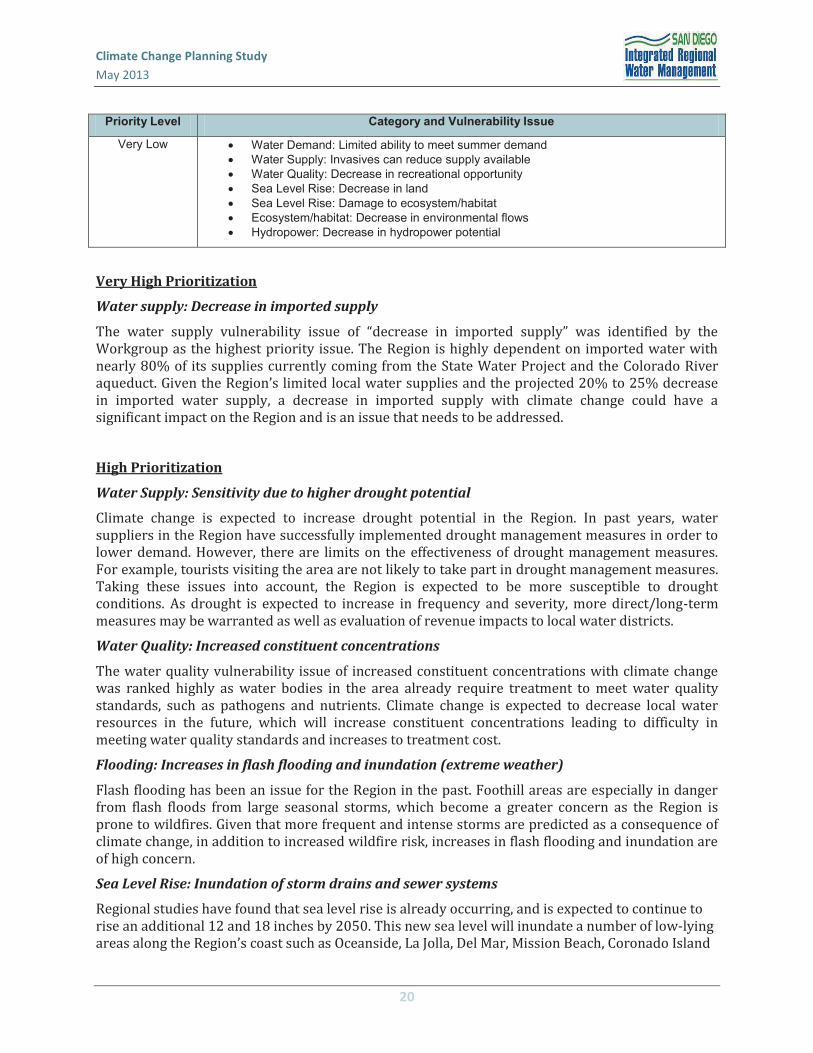
Climate Change Planning Study May 2013
20 San Diego Integrated Regional Water Management Plan DRAFT
Very High Prioritization
Water supply: Decrease in imported supply
High Prioritization
Water Supply: Sensitivity due to higher drought potential
Water Quality: Increased constituent concentrations
Flooding: Increases in flash flooding and inundation (extreme weather)
Sea Level Rise: Inundation of storm drains and sewer systems

Climate Change Planning Study May 2013
21 San Diego Integrated Regional Water Management Plan DRAFT
Figure 2: Projected 2050 Coastal Inundation with Sea Level Rise in La Jolla
Ecosystem/Habitat: Decrease in available necessary habitat

Climate Change Planning Study May 2013
22 San Diego Integrated Regional Water Management Plan DRAFT
Ecosystem/Habitat: Decrease in ecosystem services
Medium Prioritization
Water Demand: Increase in agricultural crop water demand per acre
Water Demand: Increase in industrial demand
Water Supply: Decrease in groundwater supply
Water Quality: Increase in treatment cost

Climate Change Planning Study May 2013
23 San Diego Integrated Regional Water Management Plan DRAFT
Sea Level Rise: Damage to coastal recreation / tourism due to inundation
Sea Level Rise Adaptation Strategy for San Diego Bay
Low Prioritization
Water Demand: Limited ability to conserve further
Water Supply: Lack of groundwater storage to buffer drought
Water Quality: Increased eutrophication
Flooding: Increases in inland flooding
Ecosystem/Habitat: Increased impacts to coastal species

Climate Change Planning Study May 2013
24 San Diego Integrated Regional Water Management Plan DRAFT
Very Low Prioritization
Water Demand: Limited ability to meet summer demand
Water Supply: Invasives can reduce supply available
Water Quality: Decrease in recreational opportunity
Sea Level Rise: Decrease in land
Sea Level Rise: Damage to ecosystem/habitat
increased impacts to coastal species
Ecosystem/habitat: Decrease in environmental flows
Hydropower: Decrease in hydropower potential

Climate Change Planning Study May 2013
25 San Diego Integrated Regional Water Management Plan DRAFT
Vulnerabilities Summary
5 Climate Change Management Strategies
5.1 Identification of Strategies

Climate Change Planning Study May 2013
26 San Diego Integrated Regional Water Management Plan DRAFT
5.2 Strategy Prioritization
Table 5: Initial Strategy Prioritization Criteria
Considered “no regret”
8

Climate Change Planning Study May 2013
27 San Diego Integrated Regional Water Management Plan DRAFT

Climate Change Planning Study May 2013
28 San Diego Integrated Regional Water Management Plan DRAFT
Table 6: Tier 1 Climate Change Management Strategies

Climate Change Planning Study May 2013
29 San Diego Integrated Regional Water Management Plan DRAFT

Climate Change Planning Study May 2013
30 San Diego Integrated Regional Water Management Plan DRAFT
Table 7: Tier 2 Climate Change Management Strategies

Climate Change Planning Study May 2013
31 San Diego Integrated Regional Water Management Plan DRAFT
Table 8: Tier 3 Climate Change Management Strategies
Table 9: Additionally Reviewed Climate Change Management Strategies
–
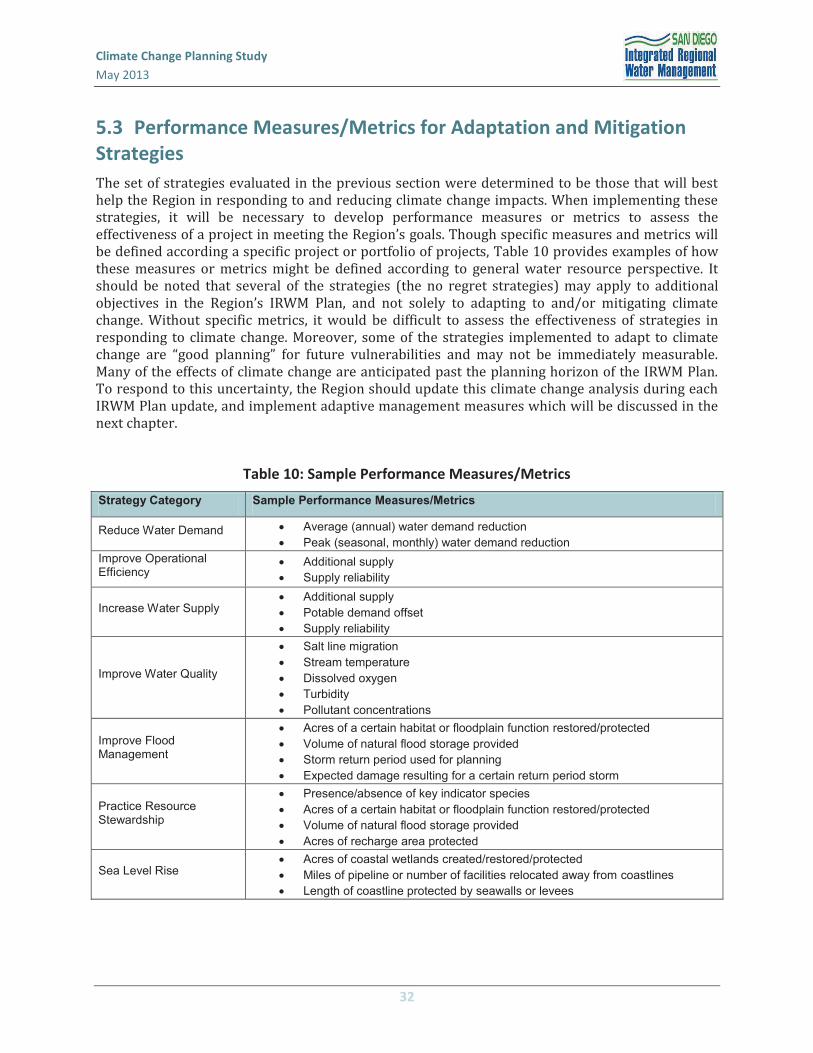
Climate Change Planning Study May 2013
32 San Diego Integrated Regional Water Management Plan DRAFT
5.3 Performance Measures/Metrics for Adaptation and Mitigation Strategies
Table 10: Sample Performance Measures/Metrics

Climate Change Planning Study May 2013
33 San Diego Integrated Regional Water Management Plan DRAFT
6 Recommendations
6.1 Adaptive Management
Climate Change Handbook

Climate Change Planning Study May 2013
34 San Diego Integrated Regional Water Management Plan DRAFT
Figure 3: General Adaptive Management Plan
6.2 Climate Change Related Objectives and Targets
Objective: Effectively address climate change through adaptation and mitigation in water resource management.
6.3 Climate Change in Project Selection Considerations
1st Trigger
2nd Trigger
2nd Trigger
Implement no regret strategies
Implement Tier 1 strategies
Implement partial list of Tier 1
strategies
Yes
No
Yes
Yes
No
No
Implement Tier 2 and Tier 3 strategies
Implement Tier 2 strategies
Implement remaining Tier 1 and Tier 2 strategies
No further investments needed, reassess at later time
Timeline

Climate Change Planning Study May 2013
35 San Diego Integrated Regional Water Management Plan DRAFT
Table 11: Climate Change Project Prioritization Criteria

Climate Change Planning Study May 2013
36 San Diego Integrated Regional Water Management Plan DRAFT
References Climate Change Scoping Plan.
2008 to 2011 Emissions Trends, Mandatory Greenhouse Gas Emissions Reporting.
State of California Sea-Level Rise Interim Guidance Document.
Using Future Climate Projections to Support Water Resources Decision Making in California.
Refining Estimates of Water-Related Energy Use in California
Climate Action Team Biennial Report
Energy Aware Planning Guide: Water Use Strategies.
Sea Level Rise Maps Developed for the Focus 2050 Regional Assessment.
. Southwest Hydrology
Integrated Regional Water Management Proposition 84 & Proposition 1E Draft Guidelines.
Climate Change Handbook for Regional Planning
California Water Plan.
Managing an Uncertain Future: Climate Change Adaptation Strategies for California’s Water.
Southwest Hydrology
Resolution on Sea Level Rise.
Sea Level Rise Adaptation Strategy for San Diego Bay
Regional Focus 2050 Study Summary.
Regional Focus 2050 Study Working Papers.

2015 Urban Water Management Plan 2016
City of Oceanside
Page intentionally blank


2015 Urban Water Management Plan 2016
City of Oceanside
Page intentionally blank

Water Audit Report for: CITY OF OCEANSIDEReporting Year:
WATER SUPPLIED
Volume from own sources: 9 3,231.800 acre-ft/yrMaster meter error adjustment (enter positive value): 10 0.000
Water imported: 9 23,081.700 acre-ft/yrWater exported: acre-ft/yr
WATER SUPPLIED: 26,313.500 acre-ft/yr.
AUTHORIZED CONSUMPTIONBilled metered: 9 24,937.300 acre-ft/yr
Billed unmetered: 0.000 acre-ft/yrUnbilled metered: 0.000 acre-ft/yr Pcnt: Value:
Unbilled unmetered: 8 60.300 acre-ft/yr 1.25%
AUTHORIZED CONSUMPTION: 24,997.600 acre-ft/yr
WATER LOSSES (Water Supplied - Authorized Consumption) 1,315.900 acre-ft/yr
Apparent Losses Pcnt: Value:Unauthorized consumption: 65.784 acre-ft/yr 0.25%
Customer metering inaccuracies: 9 1,039.054 acre-ft/yr 4.00%Systematic data handling errors: 8 7.000 acre-ft/yr
Apparent Losses: 1,111.838
Real Losses (Current Annual Real Losses or CARL)Real Losses = Water Losses - Apparent Losses: 204.062 acre-ft/yr
WATER LOSSES: 1,315.900 acre-ft/yr
NON-REVENUE WATERNON-REVENUE WATER: 1,376.200 acre-ft/yr
= Total Water Loss + Unbilled Metered + Unbilled Unmetered
SYSTEM DATA
Length of mains: 9 591.0 milesNumber of active AND inactive service connections: 9 43,755
Connection density: 74 conn./mile mainAverage length of customer service line: 9 24.0 ft
Average operating pressure: 9 60.0 psi
COST DATA
Total annual cost of operating water system: 8 $46,825,839 $/YearCustomer retail unit cost (applied to Apparent Losses): 10 $3.87
Variable production cost (applied to Real Losses): 9 $1,208.00 $/acre-ft/yr
PERFORMANCE INDICATORS
Financial IndicatorsNon-revenue water as percent by volume of Water Supplied: 5.2%Non-revenue water as percent by cost of operating system: 4.7%
Annual cost of Apparent Losses: $1,874,305Annual cost of Real Losses: $246,507
Operational Efficiency Indicators
Apparent Losses per service connection per day: 22.69 gallons/connection/day
Real Losses per service connection per day*: 4.16 gallons/connection/day
Real Losses per length of main per day*: N/A
Real Losses per service connection per day per psi pressure: 0.07 gallons/connection/day/psi
Unavoidable Annual Real Losses (UARL): 246.42 million gallons/year
From Above, Real Losses = Current Annual Real Losses (CARL): 204.06 million gallons/year
0.27
* only the most applicable of these two indicators will be calculated
WATER AUDIT DATA VALIDITY SCORE:
PRIORITY AREAS FOR ATTENTION:
60.300
AWWA WLCC Free Water Audit Software: Reporting Worksheet
2015 7/2014 - 6/2015
<< Enter grading in column 'E'
acre-ft/yr
Based on the information provided, audit accuracy can be improved by addressing the following components:
*** YOUR SCORE IS: 87 out of 100 ***
Infrastructure Leakage Index (ILI) [CARL/UARL]:
Default option selected for unauthorized consumption - a grading of 5 is applied but not displayed
$/100 cubic feet (ccf)
A weighted scale for the components of consumption and water loss is included in the calculation of the Water Audit Data Validity Score
(pipe length between curbstop and customer meter or property boundary)

2015 Urban Water Management Plan 2016
City of Oceanside
Page intentionally blank


2015 Urban Water Management Plan 2016
City of Oceanside
Page intentionally blank


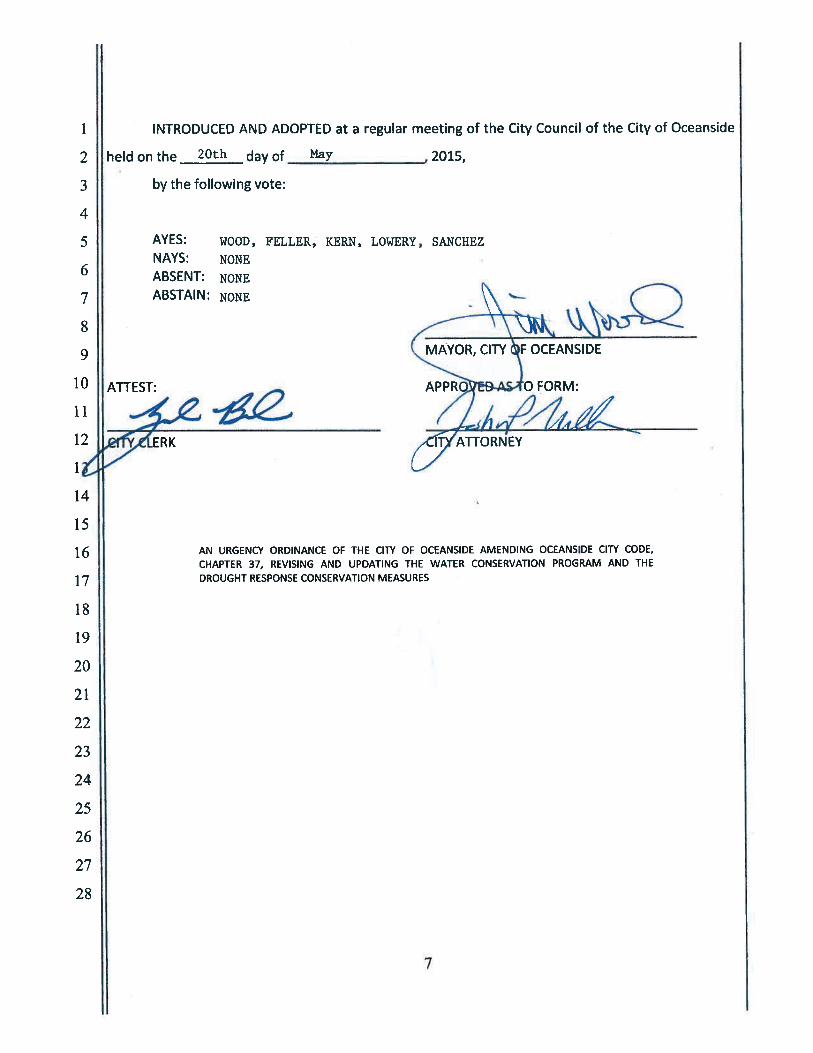


2015 Urban Water Management Plan 2016
City of Oceanside
Page intentionally blank
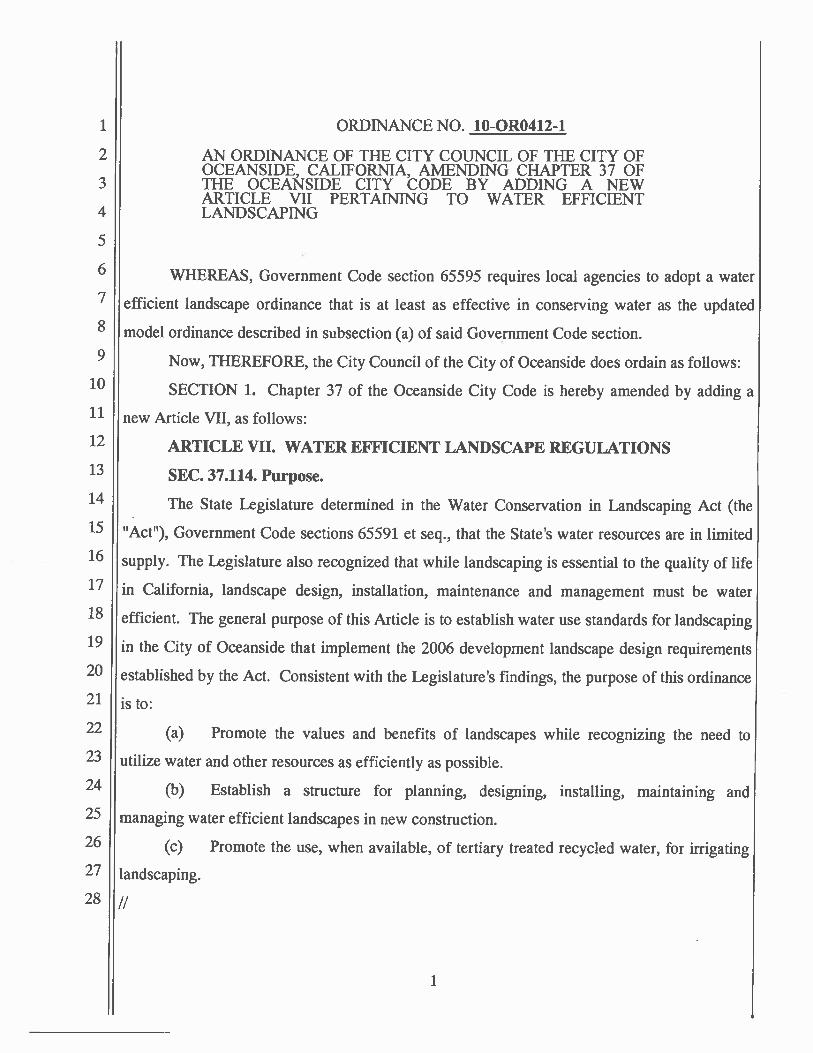


2015 Urban Water Management Plan 2016
City of Oceanside
Page intentionally blank


2015 Urban Water Management Plan 2016
City of Oceanside
Page intentionally blank


2015 Urban Water Management Plan 2016
City of Oceanside
Page intentionally blank

1. Conservation Coordinator provided with necessary resources to implement BMPs?
2. Water Waste Prevention Documents
Foundational Best Managemant Practices for Urban Water Efficiency

At Least As effective As
Exemption
Comments:
Foundational Best Managemant Practices for Urban Water Efficiency

Foundational Best Management Practices For Urban Water Efficiency
At Least As effective As
Exemption

At Least As effective As
Exemption
BMP 1.3 Metering With Commodity
Foundational Best Management Practices For Urban Water Efficiency
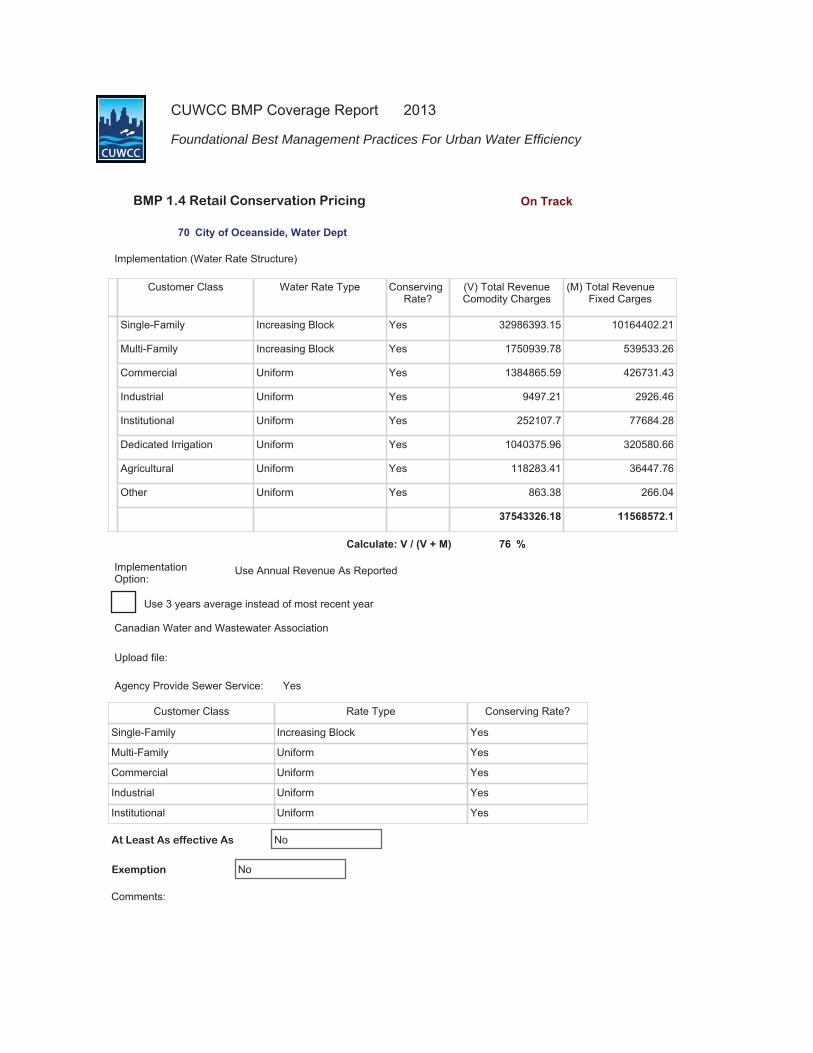
At Least As effective As
Exemption
BMP 1.4 Retail Conservation Pricing
Foundational Best Management Practices For Urban Water Efficiency

Flyers and/or brochures (total copies), bill stuffers, messages printed on bill, information packetsWebsite
Landscape water conservation media campaigns
General water conservation information
Total
Public Outreach 11000
Total Amount:
Exemption
At Least As effective As
BMP 2.1 Public Outreach
Foundational Best Management Practices For Urban Water Efficiency

Exemption
At Least As effective As
BMP 2.2 School Education Programs
Foundational Best Management Practices For Urban Water Efficiency
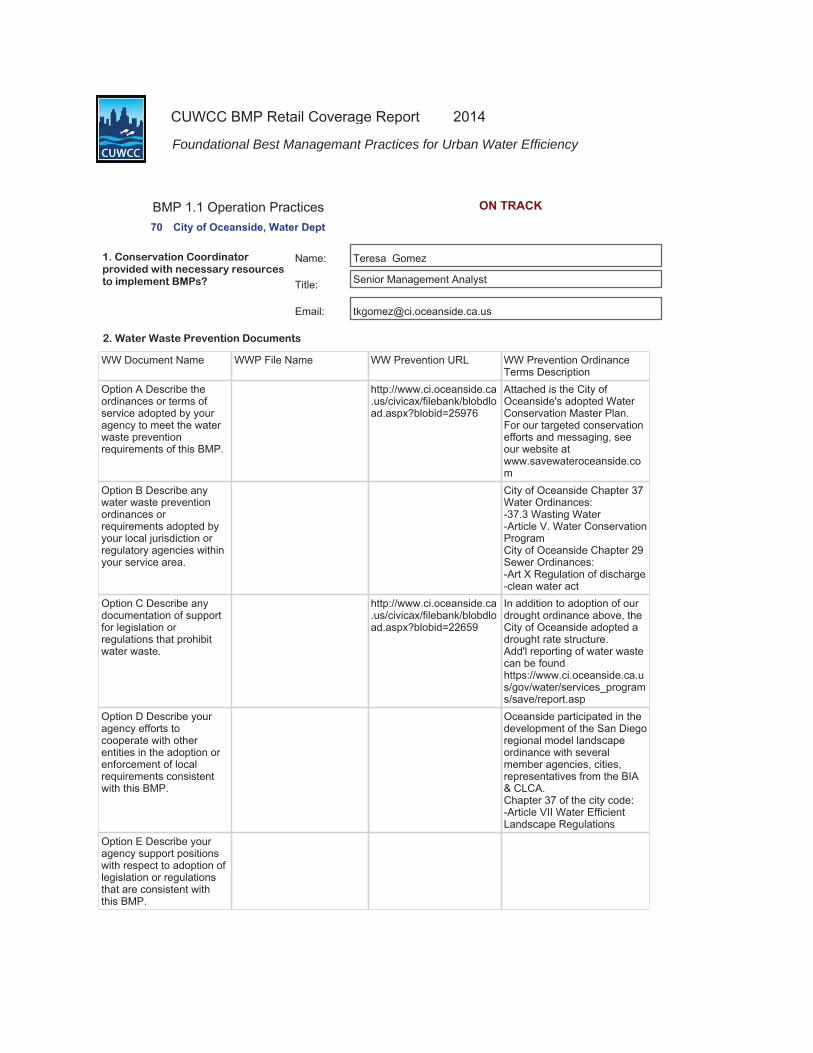
1. Conservation Coordinator provided with necessary resources to implement BMPs?
2. Water Waste Prevention Documents
Foundational Best Managemant Practices for Urban Water Efficiency
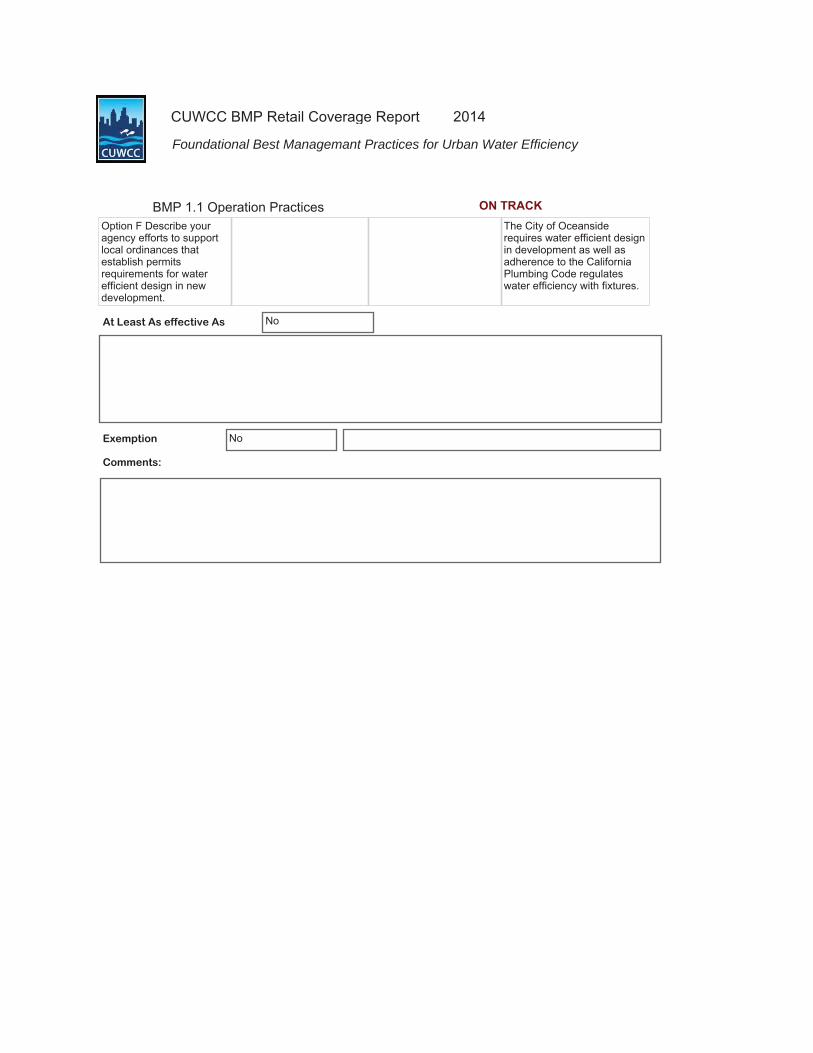
At Least As effective As
Exemption
Comments:
Foundational Best Managemant Practices for Urban Water Efficiency

Foundational Best Management Practices For Urban Water Efficiency
At Least As effective As
Exemption

At Least As effective As
Exemption
BMP 1.3 Metering With Commodity
Foundational Best Management Practices For Urban Water Efficiency

At Least As effective As
Exemption
BMP 1.4 Retail Conservation Pricing
Foundational Best Management Practices For Urban Water Efficiency

Flyers and/or brochures (total copies), bill stuffers, messages printed on bill, information packetsWebsite
Landscape water conservation media campaigns
General water conservation information
Total
Billing inserts 8000
Printing 5000
Design 4000
Public Relations 8000
Total Amount:
BMP 2.1 Public Outreach
Foundational Best Management Practices For Urban Water Efficiency

Exemption
At Least As effective As
BMP 2.1 Public Outreach
Foundational Best Management Practices For Urban Water Efficiency

Exemption
At Least As effective As
BMP 2.2 School Education Programs
Foundational Best Management Practices For Urban Water Efficiency


2015 Urban Water Management Plan 2016
City of Oceanside
Page intentionally blank


2015 Urban Water Management Plan 2016
City of Oceanside
Page intentionally blank