Hawaii Stream Assessment
340
Hawaii Stream Assessment A Preliminary Appraisal of Hawaii’s Stream Resources A Cooperative Project The State of Hawaii Commission on Water Resource Management The National Park Service Rivers and Trails Conservation Assistance Program
-
Upload
khangminh22 -
Category
Documents
-
view
0 -
download
0
Transcript of Hawaii Stream Assessment

Hawaii Stream Assessment
A Preliminary Appraisal of Hawaii’s Stream Resources
A Cooperative Project
The State of HawaiiCommission on Water Resource Management
The National Park ServiceRivers and Trails Conservation Assistance Program


Hawali Stream Assessment
A Preliminary Appraisal of Hawaii’s Stream ResourcesReport R84
Prepared for
COMMISSION ON WATER RESOURCE MANAGEMENTState of Hawaii
By
HAWAII COOPERATIVE PARK SERVICE UNITWestern Region Natural Resources and Research DivisionNational Park Service
Honolulu, Hawaii
December 1990
JOHN WAIHEE
Governor, State of Hawaii
COMMISSION ON WATER RESOURCE MANAGEMENTWILLIAM W. PATY, Chairperson
JOHN LEWIN, M.D.MICHAEL 3. CHUN, Ph.D.
ROBERT S. NAKATARICHARD H. COX, RE.
GUY FUJIMURA
DEPARTMENT OF LAND AND NATURAL RESOURCESWILLIAM W. PATY, Chairperson
Commission on Water Resource Management
MANABU TAGOMORI, RE.Deputy for Water Resource Management
4T Op
qIINATIONAL PARK SERVICE
James Ridenour, Director
WESTERN REGION
Stanley t Albright Regional Director
DIVISION OF PLANNING, GRANTS AND ENVIRONMENTAL QUAUTY
James Huddleston
RIVERS AND TRAILS CONSERVATION ASSISTANCE PROGRAM
Martha Crusius
U
Preface
The 1988 Hawaii State Legislature provided the conceptual foundation for the HawaiiStream Assessment by amending the 1987 Hawaii State Water Code. This amendmentprovided that the Commission on Water Resource Management (CWRM) “identifyrivers or streams, or a portion of a river or stream, which appropriately may be placedwithin a wild and scenic rivers system, to be preserved and protected as part of the publictrust ... the term ‘wild and scenic rivers’ means rivers or streams, or a portion of a riveror stream, of high natural quality or that possess significant scenic value...”
The Hawaii Stream Assessment (HSA) was made possible through the support of theNational Park Service’s River and Trails Conservation Assistance Program. Additionalsupport was providedby the DLNR’s Division of Water Resource Management, including funding for the Hawaii Heritage Program’s development of the aquatic database.
The report and its findings and the supporting database of information were preparedby the HSA Study Team which represented the Hawaii State Department of Land andNatural Resources and the US. National Park Service with the assistance of committeesof experts representing federal and state agencies and private organizations. Streamswere inventoried and then assessed for their values in four resource areas aquatic,riparian, cultural and recreation. These areas cover the beneficial instream uses definedin the State Water Code with the exception ofnavigation and the protection of traditionaland customary Hawaiian rights. While the original intent was to also include importantoffstream uses, sufficient and verified information was not available in time for this study.it is our understanding that the State Commission on Water Resource Management willconsider these missing elements along with the information in this report when makingmanagement decisions.
In the judgement of the study team, the existing information, while limited, wassufficient to conclude that the state’s surface water resources are limited, fragile, and inneed of protective management now. The Water Commission suggested alternatives for
a wild and scenic river system be developed. It is important to note that, while alternatives and recommendations are provided, this study does not initiate any action, protection, designation or zoning changes.
The draft report was presented for public comment in September 1990. Publicparticipation was lively, extensive and substantive, and the final report was revised to
reflect these comments and concerns.
m

We hope the Hawaii Stream Assessment will help provide an overview of Hawaii’ssurface water resources, allowing the evaluation of any given proposal to take placewithin a statewide context. This final report and the database are submitted to the WaterCommission for its use in future decisions about the management of Hawaii’s perennialstreams.
Dr. Clifford W. Smith, DirectorCooperative National Parks Resources Studies UnitUniversity of Hawali
Carol Wilcox, Project CoordinatorDepartment of Land and Natural ResourcesState of Hawaii
Sallie Edmunds, Project CoordinatorCooperative National Parks Resources Studies UnitUniversity of Hawaii
lv

Acknowledgements
T0 all those who in any manner contributed to the Hawaii Stream Assessment, theauthors express their sincere thanks. But, as always in projects of this magnitude, certainindividuals contributed far beyond the original commitment. Audrey Newman and PattyKupchak provided the opportunity for extensive discussion and debate, as well as reviewand comment. Meredith Ching reminded us of the economic importance of streams.Luciana Honigman prepared the aquatic resource inventory data and bibliography.Maps and many of the tables were developed by Jane Lewis. Simon Chan did much ofthe data entry later assisted by Billy Tabuio. Susana Chang and Datta Bhanibareperformed various desktop publishing tasks. Patricia Tummons assisted with editing.Sherrie Samuels was invaluable as primaiy DU4R contact. Martha Crucius and DrewParkin contributed a national perspective of river assessments.
Cooperation was the key to the Hawaii StreamAssessment. The strengths of this reportare due to the participation by many in government and the private sector. Individualsfrom Hawaii’s state government departments of Land and Natural Resources, Businessand Economic Development, and Health; from federal agencies including the U.S.National Park Service, Geological Survey, Army Corps of Engineers, Fish and WildlifeService; County plpnning and public works departments; the professional and businesscommunity, in particular The Nature Conservancy Hawaii; and the University community were all unfailingly generous with their time, expertise and patience.
Fmaliy, none of this would have happened without the support of the water commissioners, ChairmanWilliam Paty, Michael Chun, Richard Cox Guy Fujimura, John Lewinand Robert Nakata. The Commission on Water Resource Management and the Department of Land and Natural Resources, the primary managers of the state’s naturalresources, recognized the importance of an inventory and assessment of surface waterresources for informed decision-making. The commissioning of this independent project, with its conservation point ofview, is an indication of their commitment to long-term
care of Hawaii’s natural resources.
The authors are grateful to all of the project participants listed on the following pageswho made the Hawaii Stream Assessment possible...this is your work.
V

Project Participants
COMMISSION ON WATER RESOURCE MANAGEMENTWilliam Paty, ChairRichard CoxMichael ChunGuy FujimuraJohn LewinRobert Nalcata
NATIONAL PARK SERVICEMartha Crusius, Rivers and Trails Conservation Assistance ProgramJames Huddlestun, Western Regional OfficeDrew Parkin, Consultant, Land and Water Associates
STEERING COMMITI’EEManabu Tagomori (Chair), DLNR, DOWALDMeredith Ching, Alexander & Baldwin, Inc.John Harrison, UH Manoa, Environmental CenterAllen Marmelstein, USFWSSusan Miller, NRDCHenry Sakuda, DLNR, DARClifford Smith, UH Manoa Botany, NPS, CPSUMary Teves, DOll, Environmental PlanningCarol Wilcox, DLNR, DOWALD
PROJECT COORDINATORSSaDie Edmunds, NPS, CPSUCarol Wilcox DLNR, DOWALD
WORKING COMMIUEE MEMBERSMeredith Ching, Alexander & Baldwin, Inc.Sterling Chow, DLNR, DOWALDJohn Clark, ocean recreation consultantRoss Cordy, DLNR, Historic PreservationDoak Co,ç Geologist/HydrologistRichard Davis, Hawaiian Trail and Mountain ClubWilliam Devick, DLNR, DAR
vi

Anne Fielding, Maui residentJohn Ford, USFWSLorin Gill, Moanalua Gardens FoundationMicco Godine; Kayaks KauaiChino Godine; Kayaks KauaiBill Gorst, DLNR, Parks, PlanningGretchen Grove, Hawaii residentJohn Hall, UN ManoaJoe Harabin , Maui residentJohn Harrison, UN Manoa, Environmental CenterSkippy Han, DLNR, DARBob Hee, Garden Island ShootingGarrett Hew, East Maui Irrigation Co.Don Hibbard, DLNR, Historic PreservationBob Hobdy, DLNR, DOFAWLuciana Honigman, The Nature Conservancy of HawaiiKiyoshi Ikeda, UN Manoa SociologyMabel Kekina, Hawaiian Trail and MountainRobert Kinzie, UN Manoa ZoologyDan Kuhns,, Molokai residentPatty Kupchak, Sierra ClubCathie Lowder, Sierra ClubLani Ma’a, Judiciary History CenterAllen Marmeistein, USFWSGeorge Matsumoto, DLNR, DOWALDSusan Miller, NRDCHerbert Minakami, Board of Water SupplyMike Minn, Hana Community AssociationMyrone Murikami, Hawaii Farm Bureau FederationWilliam Murtagh, UH Manoa, Historic PreservationNathan Napoka, DLNR, Historic PreservationAudrey Newman, The Nature Conservancy of HawaiiBob Nishimoto, DLNR, DAR, HiloTom O’Brien, DBED, Energy DivisionEric Onizuka, DLNR, DARJames Parrish, USFWS Cooperative FisheriesMary Place, teacherBill Puleloa, DLNR, DOFAWCharlie Reppun, taro fannerSteve Rohrmayer, Pig Hunters of OahuJo-An Salmon, Molokai residentSherrie Samuels, DLNR, DOWALDClifford Smith, UN Manoa Botany, Ni’S, CPSUKanna Smyth, State Parks and Historic SitesCliff Soares, Ranch managerWayne Souza, DLNR, Parks, PlanningTom Telfer, DLNR, DOFAWMary Teves, DOH, Environmental Planning
Quentin Tomich, consultantKathy Valier, travel writerErnst Ventura, Kauai resident
vu

Ron Walker, DLNR, DOFAWJoe Wierschem, Hawaii residentSadao Yanagi, Maui residentAndrew Yuen, USFWSChris Yuen, Sierra Club
RESOURCE PEOPLEDon Astrab, Honolulu Board of Water SupplyEugene Alcazawa, DOHStan Allen, Idaho Fish and GameTom Arizumi, DOHKaren Asherman, The Nature Conservancy of HawaiiJoyce Bath, DLNR, Historic PreservationCurtis Beck, Pacific Resources IncorporatedPam Blake, SETS Inc.Mike Buck, DLNR, DOFAWDonald Clegg, City and County of Honolulu. General PlanningCarolyn Corn, DLNR, DOFAWScott Derrickson, Office of State PlanningWalter Dudley, UH Hio GeologyRichard Duncan, U.S. Soil Conservation ServiceJohn Enbring, USFWSJoan Esposo, Office of State Planning, GISCharlie Ewert, USGSAlvin Fukunaga, Public Works, County of MaulJon Giffin, DLNR, DOFAWAgnes Estioka-Griffin, DLNR, Historic PreservationSam Gon, The Nature Conservancy of HawaiiDonald Heacock, DLNR, DAR, KauaiTats Hirata, COEFrank Howarth, Bishop MuseumBob Hughes, Retired President, HSPADuncan Hui, computer consultantSonia Hul, UH Manoa, Environmental CenterJim Jacobi, USFWSKen Kaneshiro, U.S. Soil Conservation ServiceGalen Kawalcami, DLNR, DOFAWWarren Keanae, COEMichael Kido, Kauai Community CollegeKenneth Kitabayashi, Public Works, County of KauaiAlvin Kyono, DLNR, DOFAWRobert Lee, DLNR, NARSMichael Lee, COELinda Lee, Dames and MooreBill Lennan, COE, Environmental PlanningDee Dee Letts, Judiciary, Office of Alternative Dispute ResolutionDan Lum, DLNR, DOWALD.Paul Matsuo, DOA, Irrigation DivisionIwao Matsuoka, USGS
vm

Bruce McClure, Public Works, County of HawaiiCarol McCord, SETS Inc.Craig MacDonald, DBED, Ocean Resources BranchNancy McMahon, DLNR, Historic PreservationBill Meyers, USGS, Hawaii District ChiefHerbert Minakami, Honolulu Board of Water SupplyAlan Murikami, Native Hawaiian Legal Corp.Richard Nakahara, USGSJohn Obata, retired teacherSteve Perlman, National Tropical Botanical GardenBill Rozeboom, DLNR, DOWALDRalph Saito, DLNR, DOFAWMike Sato, Hawaiian ElectricMargo Stahl, COELani Stemmermann, UH HioKaren Stockton, Bishop Museum LibrarianRichard Suzuki, Public Works, City and County of HonoluluMel Takalcura, Public Works, City and County of HonoluluAmadeo Thnbol, Kauai Community CollegeWes Wong, DLNR, DOFAWSuzanne Wilkins, American RiversEv Wmgert UH Manoa, GeographyRobert Yanabu, Public Works, County of HawaiiJohnson Yee, USGS
Lx

Table ofContents
Preface .
Acknowledgments.V
Project Participants viList of Tables xiiiList of Maps xvList of Figures xviList of Abbreviations xvii
Summary xix
1
Perennial Streams 5Stream Codes 7Perennial Classification 9Stream Names 13
Monitoring and Modifications 35Gaging 41Water Quality 63Water Supply 70Dams and Diversions 74Hydroelectric Power 93Channelization 97
Special Areas 107
xi

Resource Inventory and Assessment.131Aquatic 133Riparian 169Cultural 205Recreation 232
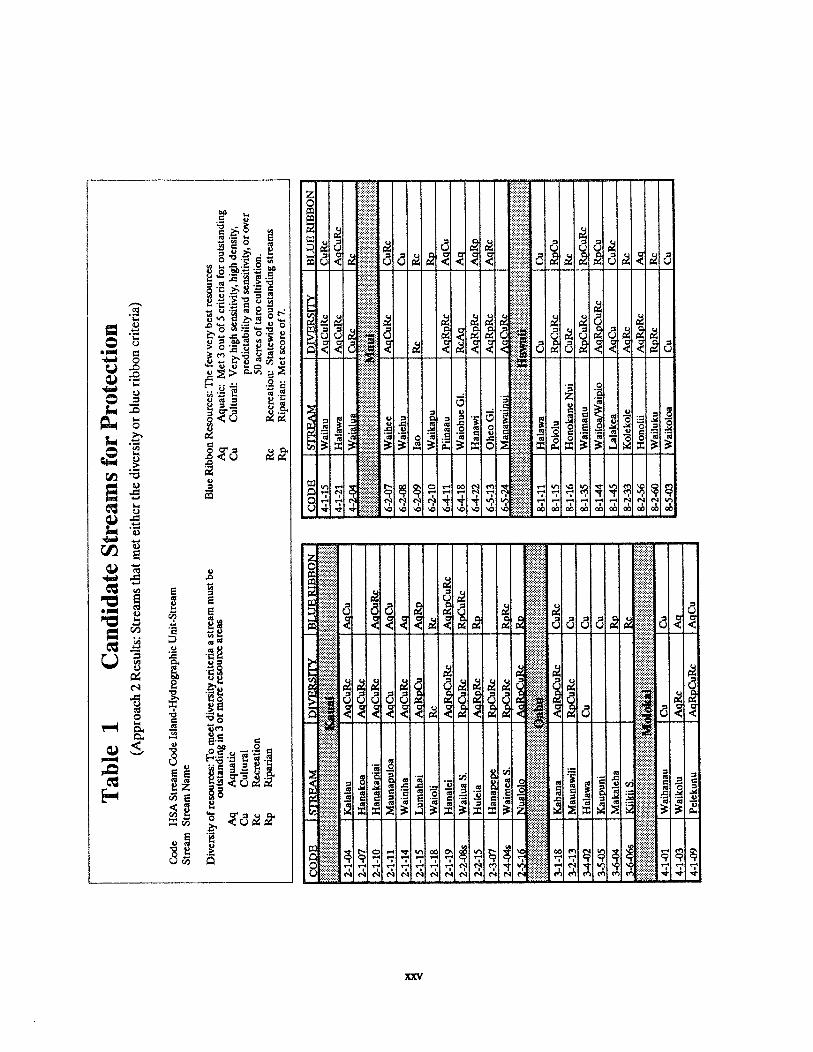
Candidate Streams for Protection 269
Future Actions 279
Database Overview 287
Questions from the Public 291
XI’

List ofTables
Table 1 Candidates Streams for Protection xxvTable 2 Sources of Stream Water 6Table 3 Seven Stream Systems 10Table 4 Alphabetical List of Perennial Streams 15Table 5 Perennial Streams by Island 21Table 6 Tributaries with Associated Streams 26Table 7 Monitoring and Modifications 36Table 8 Gaging Records 46Table 9 Stream Size 55Table 10 Water Supply for Counties and Agriculture 72Table 11 Tunnels, Ditches and Springs 75Table 12 Ditch Gages 78Table 13 Hydroelectric Power 96Table 14 Estuaries and Embayments 112Table 15 Waterfalls 120Table 16 Special Areas 122Table 17 Aquatic Species Groups 136Table 18 Aquatic Resources 151Table 19 Outstanding Aquatic Resources 156Table 20 Methodology for Data Collection and
Sample Data Sheets 157Table 21 Streams with Riparian Information 174Table 22 Threatened and Endangered
Stream-related Birds 175Table 23 Distribution of Native Forest 176Table 24 Distribution of Detrimental Organisms 176Table 25 Island Distribution of Ranked Streams 177Table 26 Distribution of Threatened or Endangered
Birds and Rare Plants 179

Table 27 Distribution of Recovery Habitat andProtected Areas 179
Table 28 Riparian Resources 182Table 29 Outstanding and Substantial Riparian
Resources 192Table 30 Rare, threatened or endangered
stream-associated plants 195Table 31 Category 1 Bridges 213Table 32 Streams used for Taro Cultivation 214Table 33 Cultural Resources 217Table 34 Distribution of Recreational Experiences 241Table 35 ROS Distribution 241Table 36 Distribution of Regional Assessment Ranks 243Table 37 Statewide Outstanding Streams for Recreation 243Table 38 Recreational Resources 248Table 39 Recreational Resource Datasheet 257Table 40 Resource Assessment Summary 263Table 1 Candidate Streams for Protection 272
x1v

List ofMaps
Map Set 1 Perennial Streams of Hawaii .30
Map Set 2 Gaging Stations (1988) 58
Map 3 Channelized Streams of Oahu 106
Map Set 4 Outstanding Aquatic Resources 164
Map Set 5 Outstanding Riparian Resources 200
Map Set 6 Outstanding Cultural Resources 227
Map Set 7 Regionally Outstanding RecreationalResources 258
Map Set 8 Special Stream Candidates 273
xv

List ofFigures
Figure 1 History of Continuous Gaging .57
Figure 2 Flowcharts of Major Ditch Systems 81
Figure 3 Native Aquatic Species Illustrations 150
Figure 4 Stream Impact Review Checklist 284
Figure 5 Database Diagram 290
xi

List ofAbbreviations
BWS: Honolulu Board of Water Supply
CDUA Conservation Us District ApplicationCOE: U.S. Army Corps of EngineersCPSU: Cooperative National Park Resources Study UnitCWRM: Commission on Water Resource ManagementCZM: Coastal Zone Management
DAR Division of Aquatic Resources, DLNRDBED: Department of Business, Economic Development and TourismDLNR Department of Land and Natural ResourcesDLU: Department of Land UtilizationDOk Department of AgricultureDOFAW: Division of Forestry and Wildlife, DLNRDOH: Department of HealthDOWALD: Division of Water and Land Development, DLNRDWRM: Division of Water Resource Management, DLNR (formerly DOWALD)
EIS: Environmental Impact StatementEKI: East Kauai IrrigationEMI: East Maui Irrigation
GIS: Geographic Information System
HALE: Haleakala National ParkHAR Hawaii Administrative RulesHRS: Hawaii Revised StatutesHSA: Hawaii Stream AssessmentHSPA Hawaii Sugar Planters Association
IG1: Introduced Species Group 11G2: Introduced Species Group 2
NARS: Natural Area Reserve SystemNASQAN: National Stream Quality Accounmig NetworkNERR National Estuarine Research ReservesNG1: Native Species Group 1NG2: Native Species Group 2NNL: National Natural LandmarksNOAA. National Oceanographic and Atmospheric Administration
NPS: National Park Service
XVII

NRDC: Natural Resources Defense Council
ROS: Recreation Opportunity Spectrum
SCS: U.S. Soil Conservation ServiceSCAP: Stream Channel Alteration Permit
TNCH: The Nature Conservancy of Hawaii
tJH: University of HawaiiUHEC: University of Hawaii Environmental CenterUSDA U.S. Department of AgricultureUSDOE: U.S. Department of EnergyUSFWS: U.S. Fish and Wildlife ServiceUSGS: U.S. Geological Survey
xn


Summary

SummaryThe State Commission on Water Resource Management (CWRM) recognized theneed for a broad-based collection of existing information on Hawaii’s rivers and streamsto help it make water protection and management decisions. The CWRM initiated theHawaii Stream Assessment (HSA) through a cooperative agreement with the NationalPark Service’s (NPS) State and Local Rivers and Trails Conservation Assistance Pro-.gram. This program was established in response to the National Wild and Scenic RiversAct, which encourages the NI’S to assist states to consider needs and opportunities forestablishing state and local wild, and scenic and recreational river areas (Public Law90-542, Section 11(a)).
The primary task of the HSA was to identify streams appropriate for protection. Itmakes no attempt to assess existing or potential offstream use. The HSA presents theconservation point of view.
The Hawaii Stream Assessment is to be used as a reference. The products are a physicalinventory of Hawaii’s 376 perennial streams and working maps; an assessment ofresources associated with these streams; and a database.
The HSA will help policy-makers, resource managers, developers, scientists and theinterested public to:
o Locate published information for a particular streanio Identify and prioritize areas where information is needed,o Understand stream resources within a statewide context;o Make management decisions based on data;o Develop general stream resource protection guidelines;o Identify specific streams appropriate for protection and enhancement.
This inventory and assessment is of a general nature, is incomplete, and does not takethe place of any specific review and study norm.ally required during the review process.
Study ProcessThe HSA consolidated considerable published information from diverse sources, data
in government and private agency files, and, in some cases, information from knowledgeable people on Hawaii’s streams and associated resources. The approach was modeledon a process developedby the NPS and used inmore than 20 other states, but with certainmodifications to meet Hawaii’s unique needs. These modifications included 1) Streamswere inventoried as complete units, as opposed to segments, and 2) Perennial wasdefined to include streams perennial in only part of their course.
xix
A study team from NPS and Hawaii Department of Land and Natural Resources(DLNR) coordinated this effort, under the direction of a steering committee. Aninventory of perennial streams and their physical characteristics was developed with theassistance of a Physical Resource Committee and a Water Supply Committee and wasbased on needs defined by potential users of the study. Four resource areas were alsoidentified: Aquatic, RipariaLn, Cultural and Recreation. Resource committees composedof individuals with expertise in these areas were established. These committeesdeveloped the criteria used to assess stream resources and identified reliable sources ofinformation.
BackgroundThe state has a leading role in watershed ownership and management responsibility.
Essentially all Hawaii’s perennial streams arise in forest reserves or other state-ownedareas. These streams provide unique and essential habitat for flora and fauna. Certainenvironments such as wetlands and estuaries are dependent on them. Their interfacewith the sea is critically important. Pre-historic cultures settled around water to takeadvantage of its benefits, which included irrigation, food, recreation and quiet enjoyment. Today’s island inhabitants continue to derive these same benefits and more fromstreams.
Hawaii’s streams are small and fragile. They can affect and be affected by action farbeyond their boundaries. Instream flows may be affected by distant tunnels and wells;native fishes ten miles upstream by channelization at the stream mouth; runoff anderosion from the mountains and urban areas ends up on the reef and beaches. It isinappropriate to consider management of segments of Hawaii’s streams in isolation.Rather, it is necessary to look at the entire stream within the context of its watershed.
InventoryPerennial Streams
HSA compiled a list of 376 perennial streams using data from various sources. Overone third of these streams do not flow continuously from the mountains to the ocean butdo have sections that are perenniaL Most of the 376 streams are named but there is notalways agreement on the name. Hawaii’s streams are evenly distributed on Kauai, buton the other four main islands they are concentrated in certain areas, primarily thewindward sides.
MonitoringGaging. Historic and current gaging data was collected from the USGS and included
in the inventory. One hundred thirty nine streams have been gaged since 1909; 97 arecurrently gaged.
Water quality. Physical, chemical, biological and/or sediment water quality informationhas been collected for 65 streams, 14 of those sites are current. The source and type ofdata is included in the inventory but not the actual water quality results.
xx

ModificationsWater supply. Some beneficial offstream use of streams is addressed, in particular large
agricultural companies identified their use of 125 streams and county water suppliers 34streams for municipal water. A full inventory and assessment must wait for the completion of the water use certification process.
Dams and diversions. The HSA inventory of dams and diversions was of limited scope.While a list of approximately 100 of Hawaii’s streams with dams or diversions along theircourse are presented, the water use certification will be the definitive source of information.
Hydroelectric power. Existing, proposed and potential hydroelectric power projectshave been inventoried. There are currently 18 operating hydroelectric plants that supply1.5% of Hawaii’s electrical energy. Eight more projects have been proposed.
Channelization. Approximately 20% of Hawaii’s streams, and almost all of Oahu’sstreams, have been lined or straightened or otherwise channelized according to datacollected from several government agencies and reports.
Special AreasThis category includes areas identified as having natural or cultural resources of
particular value. These include estuaries, embayments, wetlands, recovery habitats,special management areas, natural area reserves, wildlife refuges and sanctuaries,private preserves, national natural landmarks, historic sites, research and educationalsites, parks, and waterfalls.
Resource Inventory and AssessmentAquatic Resources
Hawaii’s streams support a small but unique aquatic fauna most of which have a lifecycle involving both the stream and the sea. Of the 176 streams with biological information, seventy were ranked as outstanding based on the presence of certain native speciesthought to be indicators of high quality habitat. While it is important to note that studiesare more often undertaken in larger, high quality streams, lISA found a positivecorrelation between good aquatic resources and larger streams and a lack of stream
modification.
Riparian ResourcesWhile many riparian values may not be directly stream-related, the quality of the
riparian environment directly determines the quality of the stream and the nearshore
waters. Native species, native forests, waterbird habitat and wetlands were inventoried
and assessed due to a lack of watershed information. Thirty streams were ranked
outstanding,
Cultural ResourcesArchaeological resources, historic sites and current taro cultivation were inventoried.
Only archaeological resources were assessed due to a lack ofconsistent and reliable data,
The committee identified 94 streams as sensitive or highly sensitive to development and

named these outstanding. Although archaeological and historical sites correlate somewhat with stream size, their continued existence is not dependent on the condition of thestream. On the other hand, taro culture is dependent on the quantity of water.
Recreational ResourcesBoating, camping, fishing, hiking, hunting, nature study areas, parks, scenic views, and
swimming were all inventoried. Most of these activities take place from the banks andtherefore access and riparian values are important. Eighteen streams were consideredto have outstanding recreational resources statewide, 84 streams were ranked regionally(by island) outstanding. Good recreational resources were highly correlated with streamsize and a lack of stream channel alteration.
LimitationsThe HSA is a broad-based inventory and assessment of the majority of the instream
uses described in the state water code. The study does not address important offstreamuses of water, water rights, Hawaiian rights, economics, landownership, zoning ornavigation, nor does it map or provide location information for the various resources orcharacteristics. It was based almost entirely on a literature search.
The resource assessment process is based on existing conditions, not past values orpotential. Further, there is a higher degree of confidence about those streams ranked asOutstanding than with the other rankings. It may well be that some streams otherwiseranked would qualify as Outstanding if their resources were sufficiently understood. Therpnking process should not be used to disregard those streams not ranked as Outstand
A rank of “unknown” was assigned to many streams when there was little orno publishedinformation available upon which to make an assessment. Streams with missing datashould not be interpreted as without resources, but merely as without enough data tosupport a rank other than unknown.
The user of the report and database is advised to read the descriptions of the recordeddata carefully to ascertain where, when and how the information was collected and toremember that this report is merely a snapshot of the state of Hawaii’s streams in 1990,and is limited by the data available as of that time.
Hawaii’s biological stream resources are not static entities. They can and do change.The information can become outdated quickly. Studies by various authors are notnecessary consistent with one another.
Future ActionsThrough the HSA a number of possible future actions have been identified.
o Maintain and enhance the lISA,o Develop long-term stream management strategies,o InstItute Interim actions to preserve management options.
Q1
Maintain and Enhance the Hawaii Stream Assessmento Initiate studies, workshops and development of master plans.
o Perform a network analysis of gaging and water quality monitoring programs.
o Develop a research and management plan for watersheds.o Prepare a five year master plan for aquatic research.o Commission a statewide hydroelectric master plan.
o Dedicate a CW.RM staffposition specifically and exclusively toconservation. The responsibilities of the “stream keeper” wouldinclude:
o Maintain HSA database;o Prepare reports with a conservation point of view for CWRM; ando Sponsor and encourage public involvement in stream conservation.
o Request the Office of State Planning to make streams a theme of thestate Geographic Information System.
Develop Long-Term Stream Management Strategies
o Adopt a Hawaii Stream Policy which provides that the importantnatural, cultural and recreational values of Hawaii’s streams areprotected.
o Establish a Hawaii Stream Plan with General Guidelines and aProtected Streams Program.
General Guidelineso Review development vMch affects a stream with reference to lISA resource
assessments and special areas.o Balance offstream water development with preservation of natural, cultural and
recreational values.o Incorporate appropriate types of action for watershed management.o Consider biota in minimum instream flows.o Control non-point source pollution.o Assure publicly accessible stream-related recreational opportunities.
o Target streams with substantial recreational use for water quality enhancement.
Protected Streams
In response to the CWRM mandate to “identify rivers or streams or a portion ofa river or stream, which appropriately may be placed within a wild and scenic riversystem, to be preserved and protected as a part of the public trust” a streamprotection program should be established. HSA developed several approaches
li

toward the identification of streams and appropriate levels of protection. Theseare outlined in the Candidate Streams for Protection and Future Actions chapters.
Interim Actions to Preserve Management Optionso Declare a moratorium on development of significant streams.
o Use HSA General Guidelines in the interim
xxiv
CO
DE
ST
R1A
MD
IVE
RS
ITY
BL
UE
RIB
BO
N
4-1-
15W
aiau
AgC
uRc
CuR
e
4-1-
21H
alaw
aA
gCuR
eA
gCuR
c4-
2-04
Wal
alna
CuR
c
6-2-
07W
aihe
cA
gCuR
eC
uRe
6-2-
08W
aich
uC
u
6-2-
09la
oR
cR
c
6-2-
10W
aika
puR
,p
6-4-
11P
iina
auA
gRpR
cA
gCu
6-4-
18W
aioh
ueG
i.R
eAg
Ag
6-4-
22H
anaw
iA
gRpR
cA
qRp
6-5-
13O
heo
GI.
AgR
pRc
AgR
c
!.
I 8-1-
11H
alaw
aC
uC
u
8-1-
15P
olol
uR
pCuR
cR
pCu
8-1-
16H
onok
anc
Nui
CuR
eR
e
8-1-
35W
aim
anu
RpC
uRc
RpC
uRc
8-1-
44W
ailo
a/W
aipi
oA
gRpC
uRc
RpC
u
8-1-
45L
alak
eaA
gCu
CuR
e
8-2-
33K
olek
ole
AgR
cR
c
8-2-
56H
onol
iiA
gRpR
cA
g
8-2-
60W
aalu
kuR
pRc
Rc
8-5-
03W
aiko
loa
Cu
Cu
Tab
le1
Can
dida
teS
trea
ms
for
Pro
tect
ion
(App
roac
h2
Res
ults
:S
trea
ms
that
met
eith
erth
edi
vers
ityor
blue
ribb
oncr
iteri
a)
Cod
eH
SA
Str
eam
Cod
eIs
land
-Hyd
rogr
aphi
cU
nit-
Str
eam
Str
eam
Str
eam
Nam
e
Div
ersi
tyof
reso
urce
s:To
mee
tdi
vers
ity
cait
eria
ast
ream
mus
tbe
outs
tand
ing
in3
or
mor
ere
sour
cear
eas
Aq
Aqu
atic
Cu
Cul
tura
lR
eR
ecre
atio
nR
pR
ipan
an
Blu
eR
ibbo
nR
esou
rces
:T
hefe
wve
lybe
stre
sour
ces
Aq
Aqu
atic
:M
et3
out
ofS
crit
eria
for
outs
tand
ing
Cu
Cul
tura
l:V
ciy
high
sens
itivi
ty,
high
dens
ity,
pred
icta
bili
tyan
dse
nsiti
vity
, or
over
50ac
res
ofta
rncu
ltiv
atio
n.R
eR
ecre
atio
n:S
tate
wid
eou
tsta
ndin
gst
ream
sR
pR
ipar
ian:
Met
scor
eof
7.
CO
DE
ST
RE
AM
DIV
ER
SIT
YU
TI
IP1
TU
Ufl
M
2-1-
04K
atal
auM
Cu
Rc
AgC
u
2-1-
07H
anak
oaM
CU
Re
2-1-
10H
anak
apia
iM
CU
Re
Aq
cuR
e
2-1-
11M
auna
pulo
sA
qCu
AgC
u
2-1-
14W
aini
haA
qCuR
eA
g
2-1-
15L
umah
aiA
gRpC
uA
gRp
2-1-
18W
aiol
iR
eR
e
2-1-
19H
anal
eiA
qRpC
uRc
AgR
pCuR
e
2-2-
08s
Wai
lua
S.R
pcuR
eR
pCuR
c
2-2-
15H
ulci
aA
qR
Re
Rp
2-3-
07H
anap
epe
RpC
uRe
2-4-
04s
Wai
mea
S.R
puR
cR
pRe
2-5-
16A
Of’.O
Rn
3-1-
18K
ahan
aA
qRpC
uRc
CuR
e
3-2-
13M
auna
wil
iR
pCuR
cC
u
3-4-
02H
alaw
aC
uC
u
3-S-
OS
Kau
puni
Cu
3-6-
04M
akal
eha
Rp
3-6-
06s
Kiik
iiS.
Re
4-1-
01W
aiha
nau
Cu
Cu
4-1-
03W
aiko
luA
gRe
Ag
4-1-
09P
elek
unu
AgR
pCuR
cA
gCu
(data analysis) of streams and their resources has been used in over 20 states. The designof each state’s process is slightly different. The criteria for stream inclusion, physicalcharacteristics inventoried, resources assessed and the final form of the information areunique to the HSA.
Hawaii Stream Assessment Organization
The HSA was established in October 1988. The NPS, which provided the methodologyfor the project, designated Dr. Clifford Smith, Director, Cooperative National ParkResources Studies Unit at the University of Hawaii at Manoa (CPSUIUH), PrincipalInvestigator. A steering committee designed to provide general direction to the projectwas chaired by Manabu Tagomori, Deputy Director DLNR. Sherrie Samuels, DLNRDivision ofWater and Land Development planner, served as primary liaison for the state.Project coordinators were Carol Wilcox, Hawaii Department of Land and NaturalResources and Saffle Edmunds (CPSU/LJH). The coordinators, principal investigator,NPS’s Martha Crusius, and consultant Drew Parkin formed the study team.
Committees were established and expert opinion sought to help guide the inventory ofphysical characteristics and water supply. Resource committees were also establishedto design the inventory and assessment of the four resource areas, i.e., aquatic, cultural,recreation, and riparian, chosen by the steering committee. Members were chosenbecause of their expertise in the subject area. A considerable amount of data wascontributed by staff of federal, state and private agencies, university faculty and volunteers.
The two coordinators were pivotal, collecting and orgni7ing information, facilitatingthe work of the committees, editing committee reports and writing all other parts of thedocument.
Project Structure
The HSA was a two year project designed in five phases.
Phase 1 involved planning and establishing budgets and timetables. Products were apreliminary identification of the needs of potential users of this inventory and assessment, and a preliminary bibliography. The project design was based on the needs ofpotential users.
Phase 2 required a general scoping of the project. Products were draft working mapsof perennial streams, a final report of user needs, the physical characteristics to beinventoried, the resource categories to be inventoried and assessed, the relationaldatabase design, a preliminary list of perennial streams, and a preliminary list of datasources. Other activities during this phase included convening the working committees,developing a ranking system and public involvement.
Phase 3 concluded the scoping of the HSA. Products were a list of perennial streams,the semi-final bibliography, the minimum standards for data inclusion, evaluationcriteria and the database design.
2


Introduction


Introduction
Though the preseivation of natural rivers is first an ecological necessity, the benefitsapply to an array of human needs, too. Communities are discovering that rivers keptclean and damless arepositive economic influences, especially in metropolitan areas,enhancing localproperty values and giving habitable character to municipal settings.Riversprovide simple recreations,from self-propelled leisures such asfishing canoeingrafting swimming hunting and sfreamside hiking to motorizedpursuits like boating.Increasingly iiver lands are gainingprotection becausefloodplains leftfree ofmanmadestructures act as giant sponges in times offloo4 giving low-cost, damage-free control
of inundation.
Rivers are refuges for the sou4 places of spititual refreshment where the natural flowandplay ofrunning watermirror the movement oflife itself. Theyprovidefor elementa6relatively unadorned experiences in which man and nature can come together. Ecologically and aesthetically, rivers are indivisible from the larger American latuL Whenpreserved, rivers serve as visible symbols of the care we take as temporary inhabitantsandfull time stewards ofa livingprofound beautiful heritage ofnature.
Henry David Thoreau saith “Man is rich in proportion to the number ofthings he canafford to let alone.” That succinctly describes the sod a!purpose ofpreservation.
W. Kent Olson, American Rivers President
In 1987, the Hawaii State Legislature approved a statewide water code to address thesupply and conservation of Hawaii’s water resources. It called for the organization of aCommission on Water Resource Management (CWRM) to implement and administerthe code. The Commission was charged with plpnning and coordinating “programs forthe development, conservation, protection, control and regulation of water resourcesbased upon the best available information” (HRS, Chapter 174C). A 1988 amendmentto the water code further required the commission to “identify rivers or streams, or aportion of a river or stream, which appropriately may be placed within a wild and scenicriver system, to be preserved and protected as part of the public trust.”
The CWRM had the foresight to recognize the need for an inventory of existinginformation on Hawaii’s rivers and streams to help it make water protection andmanagement decisions. The Commission initiated the Hawaii Stream Assessment(HSA) through a cooperative agreement with the National Park Service (NPS).
The NPS State and Local Rivers and Trails Conservation Assistance Program wasestablished in response to the Wild and Scenic Rivers Act, which encourages theNational Park Service to assist states to consider the needs and opportunities forestablishing state and local wild, scenic, and recreational river areas (Public Law 90-542,Section 11(a)). The NPS methodology for inventory (data collection) and assessment
1
Phase 4 involved data collection, refining of the database and preparation of an interimreport. The product was a database of the basic information on Hawaiian streams.
PhaseS required preparation of the final products. These include this technical reportwith an executive summary and maps, and the Hawaii Stream Assessment database withaccompanying guide.
Additional related phases may be undertaken at a future time.
Uses and Limitations
The HSA is a broad-based inventory and assessment of the majority of the instreamuses described in the state Water Code. The study does not address important offstreamuses of water, water rights, Hawaiian rights, economics, landownership, zoning ornavigation nor does it map or provide location information for the various resources orcharacteristics. It was based almost entirely on a literature search. No field work wasdone. Neither the report nor the database information is intended to substitute forspecific research or assessment.
A rank of unknown was assigned to many streams when there was little or no publishedinformation available upon which to make an assessment. Streams with missing datashould not be interpreted as without resources, but merely as without enough data tosupport a rank other than unknown.
Hawaii’s biological stream resources are not static entities. They can and do change.The information can become outdated quickly since most observations are made onstreams during a specific period of time and at specific locations. Furthermore, studiesby various authors are not necessarily consistent with one another. The user of the reportand database is advised to read the descriptions of the recorded data carefully toascertain where, when and how the information was collected, and to remember that thisreport is merely a “snapshot” of the state of Hawaii’s streams in 1990 using availableinformation.
The information generated by the Hawaii Stream Assessment may prove useful topublic and private sector planners and decision makers in addition to the Commission.
Applications for other government agencies could include a comprehensivehydroelectric plan or a recreational development plan, for example. Developers and
people in the environmental community may use the information as a guide to flagpotential siting problems. Scientists may fmd the study helps them do broad-based
analyses as well as identify areas where further research is needed. Finally, the publicmay find the Stream Assessment a good source of information about Hawaii’s streams.
The consolidated source of information will assist all involved in the use and managementof Hawaii’s streams.
Finally, HSA is a reference document and although several recommendations areprovided, this project does not call for action.
3

Hawaii’s Perennial Streams


Hawali’s Perennial Streams
N0 commonly agreed upon list or map of Hawaii’s perennial streams existed when theHawaii Stream Assessment (HSA) got underway in 1988, but such an inventory wasessential. The HSA considered more than 500 streams and major tributaries and finallyidentified 376 perennial streams. Each stream mouth was assigned a code number toidentify it in the report and database and was classified as either continuous or interrupted. Major tributaries were identified and in certain cases assigned code numbers.Stream names and alternative names were confirmed where possible. These factors aredescribed and discussed in the next few sections.
BackgroundA general description of Hawaii’s hydrology is provided to help illustrate the com
plexity of determining the perennial nature of the streams. The water currently flowingin Hawaii’s streams may represent today’s rainfall, last week’s, last year’s or ever waterthat fell decades ago. The rain may have reached the stream through direct surfacerun-off, through a shallow layer of soil, bog, or stream bank or by way of deeper dike,perched or basal groundwater.
Tradewinds dominate Hawaii’s weather pattern. During these times rainfall isamplified by orographic effects. That is, as air masses are lifted over or around amountain they cool and create localized rain. The result is a high rainfall frequency andrate on the windward sides of the islands. The continuity of stream flow over timedepends on the frequency of rains in the drainage basins and the course that therainwater must take to the ocean. The sources of stream water, their characteristics, andtheir location and contribution to stream flow are all important to understandingHawaii’s hydrologic cycle.
The amount of surface flow depends on the intensity and persistence of the rain, thepermeability of the soil which includes the degree of saturation. The lag period, the timeit takes for rain to enter a stream, is quite short for run-off - minutes to hours to days -
and slightly longer for water that flows through the soil. Runoff dominates stream flowin Hawaii and is responsible for the highly variable flow rates. In normal situations, themedian flow would approximate the average flow, but this is not true for Hawaiianstreams. In Hawaii, streams exceed average flow just 10 percent of the time.
There are four general types of groundwater, dike, perched, confined basal, andunconfined basal, yet only the first three contribute to stream water. Generallygroundwater is water that accumulates in an underground aquifer. The distinctionamong these four groundwater sources is important because of the difference in lag timesand the locations of spring which contribute to streams.
5

Dike waters are usually located at high elevations and therefore may contributeperennial flow to long reaches of streams. The lag time for water to reach dike springscan be from one month to a few years (Table 2). Perched groundwater springs aresignificant in areas of high to moderately high rainfall and can have a lag period of oneweek to a few months. Confined basal groundwater springs are generally located below25 feet in elevation and therefore may contribute to very short perennial streams.Unconflned basal groundwater flows directly into the sea and does not contribute tostreams.
Table 2 Sources of Stream Water
Source Lag tim Nature i2f Stream Ekw
Runoff short Flood Flow, Intermittent
Interfiow days to Mostly intermittent flow but responBog flow weeks sible for perennial flow in high
rainfall areas.
Perched weeks to Perennial flows in moderategroundwater months to high rainfall areas
Dike months to May contribute substantially togroundwater years long reaches of perennial streams
at upper elevations.
Confined, years to May contribute substantially to verybasal groundwater decades short, coastal perennial streams.
Unconfined, years to None. Discharges direct to oceanbasal groundwater decades Does not contribute to stream flow
Streams that are continuously perennial in low rainfall areas often cross rift zonescontaining high elevation aquifers. In high rainfall areas continuous perennial streamsmay receive a constant flow of water through soil interfiows. Interrupted streams thatare perennial at upper elevations may be fed by high elevation springs and then, as theyflow over permeable lavas, the flow disappears from the surface.
SourcesPublished and Unpublished Documents
DLNR. 1990. Hawaii Water Plan: Water Resources Protection Plan. Prepared by GeorgeA. L. Yuen and Associates, Inc. (Draft).
Personal CommunicationsCox Doak. 1990. UH Environmental Center (retired).Co; Doak. 1990. Memo to the Hawaii Stream Assessment.
6
Stream Codes
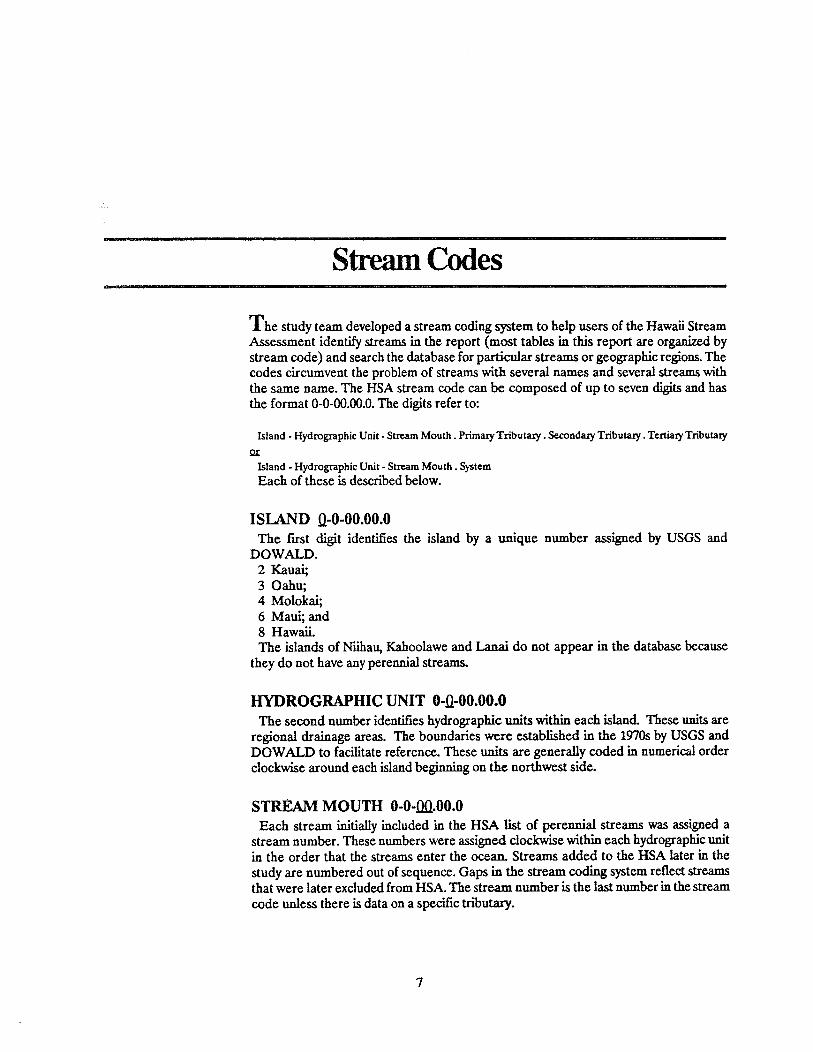
The study team developed a stream coding system to help users of the Hawaii StreamAssessment identify streams in the report (most tables in this report are organized bystream code) and search the database for particular streams or geographic regions. Thecodes circumvent the problem of streams with several names and several streams withthe same name. The HSA stream code can be composed of up to seven digits and hasthe format 0-0-00.00.0. The digits refer to:
Island - Hydrographic Unit - Stream Mouth. Primary Tributary. Secondary Tributary. Tertiary Tributary
Island - Hydrographic Unit- Stream Mouth . System
Each of these is described below.
ISLAND il-O-OO.OO.OThe first digit identifies the island by a unique number assigned by USGS and
DOWALD.2 Kauai;3 Oahu;4 Molokai;6 Maul; and8 Hawaii.The islands of Niihau, Kahoolawe and Lanai do not appear in the database because
they do not have any perennial streams.
HYDROGRAPHIC UNIT O-fl-OO.OO.OThe second number identifies hydrographic units within each island. These units are
regional drainage areas. The boundaries were established in the 1970s by USGS andDOWALD to facilitate reference. These units are generally coded in numerical orderclockwise around each island beginning on the northwest side.
STREAM MOUTH O-O-j)fl.OO.OEach stream initially included in the HSA list of perennial streams was assigned a
stream number. These numbers were assigned clockwise within each hydrographic unitin the order that the streams enter the ocean. Streams added to the HSA later in thestudy are numbered out of sequence. Gaps in the stream coding system reflect streamsthat were later excluded from HSA. The stream number is the last number in the streamcode unless there is data on a specific tributary.
7

TRIBUTARY O-O-OO.QfLf]The digits separated by decimals identify tributaries. Generally these tributaries are
numbered consecutively from the mouth as they appear on the USGS 1:100,000 map.HSA has not assigned tributary numbers to all tributaries, only those that have data ofsome type. Further assignments can be made as the database is broadened.
SYSTEM O-O-OOaSeveral streams have tributaries that drain separate valleys and merge close to the
mouth. HSA stream systems are Waimea and Wailua on Kauai, and Kahaluu, Ala Wal,Kiikii, Paukauila and Anahulu on Oahu. The final “Sr in the stream code denotes a system(Table 3).
8

Perennial Classification
The Hawaii Stream Assessment considered more than 500 streams and majortributaries for inclusion as perennial streams. In this study, perennial streams are thosewhich normally have surface flow year-round, in all or part of their course, as opposedto intermittent streams, which are normally dxy during part of the year. Streams areconsidered separate entities when they have a separate mouth to the sea. Canals areincluded when they serve as the mouth for a perennial stream. Streams with majortributaries that extend into distinctly different valleys yet merge near the sea are calledsystems. Using these guidelines, the HSA has identified Hawaii’s 376 perennial streams.
MethodsHSA classified perennial streams using two definitions:
Continuous streams flow to the sea year-round under normal conditions. Thisincludes some streams with diversions.
Interrupted streams flow year-round in the upper portions and intermittently atlower elevations under normal conditions. The interruption may be natural orman-made.
While the inclusion of interrupted streams may be questionable to some, they areincluded because there are often significant resources associated with their perennialsegments. Interruptions typically occur in two ways: naturally, when the stream disappears into the porous ground at the lower elevations; or, by modification, when water isremoved from the stream by diversion or by depletion of groundwater. A diversion doesnot necessarily mean a stream is categorized as interrupted; if water occurs below thediversion, a stream is categorized as continuous. Diversions are discussed in a latersection of this report.
The twopsources for perennial information were Timbol and Maciolek (1978)and USGS topographic quadrangle maps. These comprehensive works were reviewedand augmented by HSA project participants to develop the final HSA perennial streamclassification list.
ResultsThere are 376 streams on HSA’s perennial stream lists (Tables 4,5). Sixty-one are on
Kauai, 57 on Oahu, 36 on Molokai, 90 on Maui, and 132 on Hawaii. Niihau, Lanai andKahoolawe have no perennial streams. Seven of these are stream systems (Table 3).Approximately two-thirds of Hawaii’s streams are continuous, one third interrupted.
9

Table 3 Seven Stream Systems*
KauaiWailua River System (2-2-08s)
OpaekaaWailua segmentNorth Fork WailuaSouth Fork Wailua
Waimea River System (2-4-04s)Makaweli (2nd trib) OlokeleWaimea Segment (2nd trib) Mokihana,Waialae, Waiahulu(3nd trib-Kokee, Halemano),Koaie, Poomau (3nd trib- Mohihi, Kawaikoi)
OahuKahaluu System (3-2-07s)
WaiheeKahaluuAhuimanu
Ala Wai Canal System (3-3-07s)Manoa (2nd trib) PabloMakiki
Kiikii System (3-6-06s)PoamohoKaukonahua (2nd trib) North Kaukonahua,
South Kaukonahua
Paulcauila System (3-6-07s)OpaeulaHelemano
Anahulu System (3-6-08s)KawalikiKawailoaKawainui
* Streams iith two or more major tributaries that extend into distinctlydifferent valleys and converge on the coastal plains.
Canals and the streams that feed them are: on Kauai Waikaea Canal(2-2-06) —
Konohiki; and on Oahu Kawainui Canal(3-2-13)—Maunawili stream; Ala Wai Canal(3-3-07s) — Manoa, Makiki, and Pablo stream.
10
DiscussionIntermittent streams have been excluded from this study but should not be considered
unimportant. They serve as drainageways and recharge areas, and may have essentialecological functions as well.
The most obvious conclusion from the inventory and mapping of perennial streams istheir uneven geographic distribution. Most perennial streams are concentrated on thewindward sides of the islands. Also, larger stream systems have developed only on thegeologically older islands ofKauai and Oahu. Whether these networks provide additional or unique resources has not been determined.
LimitationsFor many reasons, the classification of streams is not precise or static. There may be
disagreement and error with respect to the perennial nature of individual streams.
The 100-plus streams on Hawaii’s Kohala-Hamakua coast are particularly difficult tosee and access and there is very llttle information on them. For these reasons, the levelof confidence regarding perennial status and other attributes for most of these streamsis low.
SourcesPublished and Unpublished Documents
Garratt Callahan Company. 1986. East & West Wailuaiki Hydroelectric Project FEIS.
Hirota, Sam 0. Inc. 1978. Determination of Headwaters for Oahu and Kauai with maps.U.S. Army Corps of Engineers, Honolulu.
Kilauea Agricultural Water Management Study Report. 1984. U.S. Dept of Agriculture/DLNR.
DLNR. 1990. Hawaii Water Plan: Water Resources Protection plan. Prepared by GeorgeA. L. Yuen and Associates, Inc. (Draft).
Timbol, A.S. and John Maciolek. 1978. Stream Channel Modification in Hawaii. Part A:Statewide inventory of streams, habitat factors and associated biota. FWS/OBS-78/16.Prepared for USFWS National Stream Alteration Team. Columbia, Missouri.
Maps
USGS maps 1:24,000 (quads), 1:100,000, 1:125,000U.S. Army Corps of Engineers, Headwater Survey maps, 1978.
Personal Communications
Cox, Doak. UH Environmental Center (retired). 1990.Cox, Doalc. Memo to the Hawaii Stream Assessment. 1990.Nishimoto, Robert T., Dennis Shinno, Skippy Hau, Don Heacock, Bill Puleloa. DLNR,
Division of Aquatic Resources. 1989-90.
11

Telfer, Torn,, Alvin Kyono, Galen Kawakami, Ralph Saito, Bob Hobdy, Wes Wong JonGiffin. DLNR, Division of Forestry. 1990.
Gill, Lorin. Moanalua Gardens Foundation. 1990.Gon, Sam. The Nature Conservancy Hawaii. 1990.HSA State and Regional Recreation Committees. 1990.Timbol, Amadeo. Kauai Community College. 1990.
12
Stream Names
There is not always agreement on stream names or spellings. Changes occur asinformation is passed by word of mouth, when mistakes are published and later acceptedas correct, and as streams are realigned, channelized, or otherwise developed.
The task of identifying names for all of the perennial streams included in this study wasfar more difficult than anticipated. Even the most commonly used source of geographicinformation, the United States Geological Survey topographic quad map, does not listnames for all of the streams drawn on its maps. Timbol and Maciolek (1978) found nearlyone fourth of the streams they identified to be unnamed and therefore chose names fromthe surrounding environment. As a result, the sources of the “Names” and “AlternateNames” used in this study are referenced in the database. The stream was assigned astream code and identified as “Unnamed”when the stream name was not identified byany of our sources.
This list ofnames and alternate names may well contain errors and omissions. However,it reflects considerable information collected from a review of documents and personalcommunications with people from federal and state government agencies, private organizations and various regions.
HSA has chosen not to use Hawaiian diacritical marks in place names to be consistentwith our primary source of place names, the U.S. Geological Survey and due to theconstraints of time and expertise. it is recognized that diacritical marks are extremelyimportant in Hawaiian place names and a supplement to this report would be quitevaluable.
MethodsThe HSA used names printed on USGS maps and those used by Timbol and Maciolek
(1978) as primary sources. These names were checked against Pukui L 1. (1974) andthe Bishop Museum’s place names maps. They were then drafted on the HSA workingmap.
This list and updated versions of it were circulated for review throughout the project.As stream name information was collected, the study team determined which would bethe “Name” and the “Alternate name.” Priority was generally given to USGS names dueto the wide use of USGS reference maps. All “Names,” “Alternate names” and“Tributary names and sources” are noted in the database. The sources of this informationappear below.
13

ResultsOnly five of the 36 initially unnamed streams included in this study remain unnamed.
The primary source is USGS (Table 5,6). Twenty-seven streams have alternate namesor spellings which are noted in the database.
SourcesPublished and Unpublished Documents
Pukui, Mary Kawena. 1974. Place Names ofHawaiL University of Hawaii Press, Honolulu.
Timbol, Amadeo and 3ohn Maciolek. 1978. Stream Channel Modification in Hawaii. PartA: Statewide inventory of streams, habitat factors and associated biota. FWS/OBS/78/16. Prepared for USFWS National Stream Alteration Team. Columbia, Missouri.
Maps
Bishop Museum. 1974. Maps with place names. Prepared by Lee Motler, Librarian.Hirota, Sam 0. Inc. 1978. Determination of Headwaters for Oahu and Kauai with maps.
US. Army Corps of Engineers, Honolulu.U.S. Geological Survey. 1970’s. Topographic Quadrangle Maps, 1:24,000.
Personal Communications
Samuels, Sherrie. Department of Land and Natural Resources, DOWALD.
14

Table 4 Perennial Streams(Alphabetically)
NAME Stream name at mouth ISLAND Island location
CODE HSA Stream Code QUA]) USGS Quadrangle map at mouthisland - hydrographic unit -
streamlsystem
NAME COtE ISLANE) GUAI> NAME COtE ISLAND QEYAI)
Aakukui 2-4-02 Kauai Hanapepe Hakalau 8-2-32 Hawaii Papaaloa
Aamalcao 8-142 Hawaii Hawi Haldpuu 3-2-01 Oahu Kahana
Aanianu 8-1-79 Hawaii Kukaiau Halawa 8-1-11 Hawaii Ha
Ahole 8-2-18 Hawaii Papaaloa Halawa 4-1-21 Molokai Halawa
Aiea 3-4-03 Oahu Waipahu Halawa 3-4-02 Oahu Puuloa
Ala Wai S. 3-3-07s Oahu Honolulu Haloa 8-5-01 Hawaii Kamuela
Alaalaula 6-5-06 Maui Kipahulu Haloku 4-1-11 Molokai Kamalo
Alakahi 8-2-45 Hawaii Papaikou Hanakapiai 2-1-10 Kauai Haena
Aleamai 8-2-48 Hawaii Papaikou Hanakoa 2-1-07 Kauai Haena
Alelele 6-5-20 Maui Kaupo HanaleiR. 2-1-19 Kauai Hanalei
Alia 8-2-39 Hawaii Papaikou Hanamaulu 2-2-12 Kauai Kapaa
Ahlipali 8-1-71 Hawaii Honokaa Hanapepe 2-3-07 Kauai Hanapepe
Aliomanu 2-1-36 Kauai Anahola Hanaula 8-1-06 Hawaii Hawi
Anahola 2-2-01 Kauai Anahola Hanawana 6-3-13 Maui Haiku
Anahulu S. 3-6-08s Oahu Haleiwa Hanawi 6-4-22 Maui Nahiku
Anapuhi 4-1-05 Molokai Kamalo Hanawi 8-2-46 Hawaii Papaikou
Anini 2-1-21 Kauai Hanalei Hanehoi 6-3-11 Maui Haiku
Awaawapuhi 2-1-01 Kauai Makaha Haneoo 6-5-02 Maui Hana
E. Waiakalua 2-1-30 Kauai Anahola Hapahapal 8-1-07 Hawaii Has4i
E. Wailuaiki 6-4-16 Maw Keanae Heeia 3-2-08 Oahu Kaneohe
E. Waipake 2-1-33 Kauai Anahola Heleleikeoha 6-4-31 Maui Hana
Haakoa 8-2-10 Hawaii Papaaloa Hoalua 6-3-12 Maui Haiku
Haeleele 2-5-10 Kauai Makaha Honanana 6-2-02 Maui Kahakuloa
Hahalawe 6-5-11 Maui Kipahulu Honokahua 6-1-09 Maui Honolua
Haipuaena 6-407 Maui Keanae Honokane Iki 8-1-17 Hawaii Honokane
Halcaaano 4-1-22 Molokai Halawa Honokane Nui 8-1-16 Hawaii Honokane
15

NAME... CODE ISLAND QUAD t’AME CODE lSLANt GUAD
Honokea
Honokohau
Honokowai
Honolewa
Honolii
Hoaolua
Honomanu
Honomu
Honomuni
Honopou
Honopu
Honopue
Honoulimaloo
Honouliuli
Honouliwai
Hoolawa
Hoolulu
Huleia
Tao
Kaaawa
Kaahakini
Kaalieiki
Kaaiea
Kaala
Kaalaea
Kaapahu
Kaapoko
Kaawaffi
Kaawaloa
Kaelepulu Canal
Kahakuloa
Kahaluu S.
Kahana
Kahana
8-1-20 Hawaii Honokane
6-1-11 Maui Honolua
6-1-07 Maui Lahaina
6-5-08 Maui Kipahulu
8-2-56 Hawaii Papaikou
6-1-10 Maui Honolua
6-4-09 Maui Keanae
8-2-35 Hawaii Papailcou
4-2-06 Molokai Halawa
6-3-08 Maui Haiku
2-1-02 Kauai Makaha
8-1-22 Hawaii Honokane
4-2-02 Molokai Halawa
3-4-11 Oahu Ewa
4-2-03 Molokai Halawa
6-3-09 Maui Haiku
2-1-09 Kauai Haena
2-2-15 Kauai Lihue
6-2-09 Maui Wailuku
3-1-19 Oahu Kahana
8-2-62 Hawaii Hilo
8-2-22 Hawaii Papaaloa
6-4-02 Maui Keanae
8-1-85 Hawaii Kukaiau
3-2-05 Oahu Kaneohe
6-5-18 Maui Kipahulu
8-2-51 Hawaii Papailcou
8-2-02 Hawaii Kukaiau
2-5-07 Kauai Kekalia
3-2-14 Oahu Mokapu
6-2-03 Maui Kahakuloa
3-2-07s Oahu Kaneohe
6-1-08 Maui Honolua
3-1-18 Oahu Kahana
Kahananui
Kahaupu
Kahawaihapapa
Kahawailiuli
Kahawainui
Kahiwa
Kahoma
Kahoopuu
Kahuku
Kaieie
KiIii1i
Kailikaula
Kailua
Kaimu
Kainalu
Kaipapau
KaiW
Kaiwilahilahi
Kakipi
Kakiweka
Kalalau
Kalaoa
Kalapahapu Gi
Kalauao
Kalele GL
Kalepa
Kalihi
Kalihiwai R.
Kalopa
Kaluaaha
Kaluahine Falls
Kaluanui
Kamaee
Kamalo
4-2-10
8-1-65
6-4-27
8-1-66
3-1-07
4-1-18
6-1-05
8-1-39
8-2-25
8-2-49
4-1-08
8-1-21
6-3-14
8-1-33
4-2-05
3-1-10
8-1-89
8-2-09
6-3-07
6-5-10
2-1-04
8-2-47
8-1-81
3-4-04
8-1-18
6-5-21
3-3-11
2-1-25
8-1-68
4-2-09
8-1-46
3-1-13
8-2-31
4-2-14
Molokai
Hawaii
Maui
Hawaii
Oahu
Molokai
Maui
Hawaii
Hawaii
Hawaii
Molokal
Hawaii
Maui
Hawaii
Molokai
Oahu
Hawaii
Hawaii
Maui
Maui
Kauai
Hawaii
Hawaii
Oahu
Hawaii
Maui
Oahu
Kauai
Hawaii
Molokai
Hawaii
Oahu
Hawaii
Molokai
Kamalo
Honokaa
Hana
Honokaa
Kahuku
Halawa
Lahaina
Kukuihaele
Papaaloa
Papaikou
Kanialo
Honokane
Keanae
Honokane
Halawa
Hauula
Kukaiau
Papaaloa
Haiku
Kipahulu
Haena
Papailcou
Kukaiau
Waipahu
Honokane
Kaupo
Honolulu
Hanalei
Honokaa
Kamalo
Kukuihaele
Hauula
Papaaloa
Kainalo
16

Kaneohe 3-2-10 Oahu Kaneohe Kilau 8-2-05 Hawaii Papaaloa
Kaohaoha 8-2-01 Hawaii Kukaiau Kllauea 2-1-28 Kauai Anahola
Kapaa 2-2-04 Kauai Kapaa Kinekine Ditch 2-5-06 Kauai Kekaha
Kapalama 3-3-10 Oahu Honolulu Kipu Kai 2-3-01 Kauai Lihue
Kapaula 6-4-21 Maui Nahiku Koholalele GI 8-1-80 Hawaii Kukaiau
Kapehu 8-2-37 Hawaii Papaikou Kolea 6-4-03 Maui Keanae
Kapehu 8-2-12 Hawaii Papaaloa Kolealiilii 8-1-23 Hawaii Honokane
Kapia 6-5-03 Maui Hana Kolekole 8-2-33 Hawaii Papaikou
Kapue 8-2-53 Hawaii Papaikou Koloa GL 3-1-09 Oahu Kahuku
Kapulena 8-1-52 Hawaii Kukuihaele Kopiliula 6-4-17 Maui Keanae
Kauaula 6-1-04 Maui Lahaina Koukouai 6-5-13 Maui Kipahulu
Kauhao 2-5-13 Kauai Makaha Kuliiwa 6-4-24 Maui Nahiku
Kaula 8-1-90 Hawaii Kulcaiau Kuiaha 6-3-02 Maui Haiku
Kaulaula 2-5-09 Kauai Makaha Kukaiau 8-1-82 Hawaii Kukaiau
Kaumoali Gi 8-1-73 Hawaii Honokaa Kukui 8-1-29 Hawaii Honokane
Kaupakulua 6-3-03 Maui Haiku Kukuilanialamahii 8-1-70 Hawaii Honokaa
Kaupuni 3-5-05 Oahu Waianae Kukuiula 6-5-17 Maui Kipahulu
Kawa 3-2-11 Oahu Kaneohe Kulanakii 8-2-17 Hawaii Papaaloa
Kawaikalia 8-1-53 Hawaii Kukuihaele Kulihaili 2-1-29 Kauai Anahola
Kawailoa 2-2-10 Kauai Kapaa Kuliouou 3-3-03 Oahu Koko
Kawainui 4-1-19 Molokai Halawa Kumakua 8-1-03 Hawaii Hawi
Kawainui 8-2-43 Hawaii Papaikou Kumukumu 2-2-02 Kauai Kapaa
Kawain 3-2-13 Oahu Mokapu Kupapaulua 8-1-88 Hawaii KukaiauMaunawth
Kuwaikalii 8-2-07 Hawaii PapaaloaKawaipapa 6-4-34 Maui Hana
Laimi 8-2-36 Hawaii PapaikouKawakoe 6-4-32 Maui Hana
Lalakea 8-145 Hawaii KukwhaeleKawela 3-1-04 Oahu Kahuku
Lamimaumau 8-5-02 Hawaii KamuelaKawela 4-2-15 Molokai Kaunakakai
Lanikele 6-4-30 Maui HanaKeaahala 3-2-09 Oahu Kaneohe
Launiupoku 6-1-03 Maui LaliamaKeaaiki 6-4-28 Maui Hana
Laupahoehoe 8-2-04 Hawaii PapaaloaKeahua 8-1-67 Hawaii Honokaa
Lawai 2-3-04 Kauai KoloaKealakaha 8-1-86 Hawaii Kukaiau
Lelekea 6-5-19 Maui KaupoKeawanul 4-1-07 Molokai Kamalo
Limahuli 2-1-12 Kauai HaenaKihalani 8-2-08 Hawaii Papaaloa
Loko Ea 3-6-09 Oahu HaleiwaKiikii S. 3-6-06s Oahu Haleawa
17

Hanalei Nakeikionaiwi Kauai HaenaLumahai R.
Maakua
Maiiinauli
Maulili
Makaha
Makahanaloa
Makaleha
Malcamakaole
Malcapipi
Makaua
Makea
Makua
Malaekahana
Malanahae
Maliko
Manawai
Manawaiiao
Manawaikeae
Manawainui
Manoa
Manoloa
Manowaiopae
Manuwailcaalio
Mapulehu
Maulua
Maunapuluo
Miolli
Moanalua
Moikeha Canal
Moloaa
Moomoonui
Nahornalu
Ni1i1ihaele
2-1-15
3-1-11
2-4-01
8-2-57
3-5-04
3-5-07
8-2-40
3-6-04
6-2-06
6-4-23
3-1-20
8-2-38
3-5-08
3-1-06
8-1-54
6-3-01
4-2-11
6-3-04
6-4-26
6-5-24
2-1-13
8-2-20
8-2-06
8-1-37
4-2-08
8-2-14
2-1-11
2-5-15
3-3-12
2-2-05
2-1-34
6-5-01
2-5-08
6-3-15
Kauai
Oahu
Kauai
Hawaii
Oahu
Oahu
Hawaii
Oahu
Maui
Maui
Oahu
Hawaii
Oahu
Oahu
Hawaii
Maui
Molokai
Maui
Maui
Maui
Kauai
Hawaii
Hawaii
Hawaii
Molokai
Hawaii
Kauai
Kauai
Oahu
Kauai
Kauai
Maui
Kauai
Maui
Hauula
Hanapepe
Papaikou
Waianae
Waianae
Papaikou
Kaena
Kabakuloa
Nahiku
Kahana
Papaikou
Kaena
Kahuku
Kukuihaele
Paia
Kamalo
Haiku
Hana
Kaupo
Haena
Papaaloa
Papaaloa
Kukuihaele
Halawa
Papaaloa
Haena
Malcaha
Honolulu
Kapaa
Anahola
Hana
Kekaha
Keanac
Nakooko
Naluea
Nanakuli
Nanue
Nawiliwili
Nienie
Ninole
Niu
Niuhli
Nuaailua
Nualolo
Nuanuaaloa
Nuuanu
Oheo Gi
Ohia
Ohia
Ohiahuea
Oio
Oloupena
Olowalu
Onomea
Oopuola
Opea
Opelu
Paakea
Paauilo
Pae
Paeohe
Pahale
Paheehee
Pahoehoe
Pall Akamoa
Paopao
2-1-03
8-1-25
8-1-38
3-5-01
8-2-27
2-2-13
8-1-61
8-2-21
3-3-04
8-1-13
6-4-10
2-5-16
6-5-22
3-3-09
6-5-13
6-4-12
4-2-12
8-1-24
3-1-05
4-1-12
6-1-02
8-2-44
6-4-01
8-2-28
6-5-16
6-4-19
8-1-78
8-1-34
8-2-13
8-2-11
8-2-34
8-2-54
8-1-08
8-1-30
Hawaii
Hawaii
Oahu
Hawaii
Kauai
Hawaii
Hawaii
Oahu
Hawaii
Maui
Kauai
Maui
Oahu
Maui
Maui
Molokai
Hawaii
Oahu
Molokai
Maui
Hawaii
Maui
Hawaii
Maui
Maui
Hawaii
Hawaii
Hawaii
Hawaii
Hawaii
Hawaii
Hawaii
Hawaii
Honokane
Kukuihaele
Schofield
Papaaloa
Lihue
Honokaa
Papaaloa
Koko
Honokane
Keanae
Malcaha
Kaupo
Honolulu
Kipahulu
Keanae
Kamalo
Honokane
Kahuku
Kainalo
Olowalu
Papaikou
Keanae
Papaaloa
Kipahulu
Nahiku
Kukaiau
Honokane
Papaaloa
Papaaloa
Papaikou
Papaikou
Hawi
Honokane
18

Papaa 2-1-35 Kauai Anahola Umauma 8-2-30 Hawaii Papaaloa
Papaahawahawa 6-5-05 Maui Kipahulu Unnamed 3-6-03 Oahu Kaena
Papaikou 8-2-52 Hawaii Papaikou Unnamed 2-1-27 Kauai Anahola
Papio 4-2-16 Molokai Halawa Unnamed 3-1-21 Oahu Kahana
Papuaa 8-1-62 Hawaii Honokaa Unnamed 6-4-36 Maui Hana
Paukaa 8-2-55 Hawaii Papaikou Unnamed 8-1-10 Hawaii Hawi
Paukauila S. 3-6-07s Oahu Haleiwa W. Wailuaiki 6-4-15 Maui Keanae
Paumalu 3-1-03 Oahu Wainiea W. Waipake 2-1-32 Kauai Anahola
Peleau 8-2-29 Hawaii Papaaloa Wahiawa 2-3-06 Kauai Hanapepe
Pelekunu 4-1-09 Molokai Kamalo Wahikuli 6-1-06 Maui Lahaina
Piinaau 6-4-11 Maui Keanae Waiaaka 6-4-20 Maui Nahiku
Pilaa 2-1-31 Kauai Anahola Waiaalala 8-1-31 Hawaii Honokane
Pipiwai 4-1-20 Molokai Halawa Waiaama 8-2-42 Hawaii Papaikou
Poelua 6-2-01 Maui Kahakuloa Waiaha 8-4-02 Hawaii Kailua
Pohakuao 2-1-05 Kauai Haena Waiahole 3-2-04 Oahu Kaneohe
Pohakupili 4-2-01 Molokai Halawa Waiahookalo 4-1-17 Molokai Halawa
Pohakupuka 8-2-16 Hawaii Papaaloa Waiahualcua 2-1-08 Kauai Haena
Pololu 8-1-15 Hawaii Honokane Waialaenui 3-3-06 Oahu Honolulu
Poupou 8-2-19 Hawaii Papaaloa Waialeale 8-1-50 Hawaii Kukuihaele
Puaaluu 6-5-12 Maui Kipahulu Waialeia 4-1-02 Molokai Kamalo
Puali 2-2-14 Kauai Lihue Waialua 4-2-04 Molokai Halawa
Pukiliae 8-2-59 Hawaii Hilo Unnamed 3-2-03 Oahu Kaneohe
Pukoa 8-1-36 Hawaii Honokane Waiapuka 8-1-26 Hawaii Honokane
Punalau 6-4-08 Maui Keanae Walawa 3-4-06 Oahu Waipahu
Punalulu 8-1-32 Hawaii Honokane Waiehu 6-2-08 Maui Wailuku
Punaluu 3-1-16 Oahu Kahana Waiehu 8-2-26 Hawaii Papaaloa
Puohokamoa 6-4-06 Maui Keanae Waieli 6-5-09 Maui Kipahulu
Puukaoku 4-1-13 Molokai Kamalo Waihanau 4-1-01 Molokai Kaunakakai
Puukumu 2-1-26 Kauai Hanalei Waihee R. 6-2-07 Maui Wailuku
Puuokalepa 8-2-50 Hawaii Papaikou Waihole 6-4-25 Maui Nahiku
Uaoa 6-3-05 Maui Haiku Waikaalulu 8-1-69 Hawaii Honokaa
Ukumehame 6-1-01 Maui Olowalu Waikaea Canal 2-2-06 Kauai Kapaa
Ulaino 6-4-33 Maui Hana Waikaloa 8-1-27 Hawaii Honokane
Ulehawa 3-5-02 Oahu Waianae Waikaina 8-1-14 Hawaii Honokane
19

__________
CODE ISLAND QUAD
Wailcamoi
Waikane
Waikapu
Waikaumalo
Waikele
Waikoko
Waikoloa
Waikoloa
Waikolu
Waikolu
Waikomo
Wailau
Waileia
Wailele
Wailele 01
Wailoa R.
Wailoa/Waipio
Wailua
Wailua S.
Wailuanui
WailukuR.
Wailupe
Waimaauou
Waimaile
Walinalu
Waimanalo
6-4-04
3-2-02
6-2-10
8-2-24
3-4-10
2-1-16
8-1-51
8-5-03
8-2-23
4-1-03
2-3-02
4-1-15
2-1-20
4-1-14
3-1-08
8-2-61
8-1-44
6-5-07
2-2-08s
6-4- 14
8-2-60
3-3-05
8-241
8-1-28
3-4-05
3-2-15
Maui
Oahu
Maui
Hawaii
Oahu
Kauai
Hawaii
Hawaii
Hawaii
Molokai
Kauai
Molokai
Kauai
Molokai
Oahu
Hawaii
Hawaii
Maui
Kauai
Maui
Hawaii
Oahu
Hawaii
Hawaii
Oahu
Oahu
Keanae
Kaneohe
Maalaea
Papaaloa
Waipahu
Hanalei
Kukuihaele
Kawaihae
Papaaloa
Kamalo
Koloa
Kamalo
Hanalei
Kamalo
Kahuku
Hio
Kukuihaele
Kipahu.Iu
Kapaa
Keanae
Hio
Koko
Papaikou
Honokane
Waipahu
Koko
Waimanu
Waimea R.
Waimea S.
Wainaia
Waineae
WainihaR.
Waiohonu
Waiohookalo
Waiohue GI.
Waiokamilo
Waiolaa
Waiolai
Waioli
Waioni
Waipa
Waipalii
Waipahoehoe
Waipao
Waipio
Waipu
Waipunahina
Waipunahoe
Waipunalau 01
Waipunalei
Waiulili
Wawaia
8-1-35
3-6-10
2-4-04s
8-1-09
4-1-04
2-1-14
6-5-04
4-1-06
6-4-18
6-4-13
2-1-06
6-2-05
2-1-18
6-4-29
2-1-17
8-1-19
8-142
24-03
6-3-10
4-1-10
8- 1-76
8-1-49
8-1-77
8-2-03
8-147
4-2-13
Hawaii
Oahu
Kauai
Hawaii
Molokai
Kauai
Maui
Molokai
Maui
Maui
Kauai
Maui
Kauai
Maui
Kauai
Hawaii
Hawaii
Kauai
Maui
Molokai
Hawaii
Hawaii
Hawaii
Hawaii
Hawaii
Molokai
Honokane
Waimea
Kekaha
Hawi
Kamalo
Haena
Kipahulu
Kamalo
Nahiku
Keanae
Haena
Kahakuloa
Hanalei
Hana
Hanalci
Honokane
Kukuihaele
Hanapepe
Haiku
Kamalo
Honokaa
Kukuihaele
Kukaiau
Keanakolu
Kukuihaele
Kanialo
20

Table 5 Perennial StreamsV (By Island, by Code)
CODE HSA code; island-hydrographic TRIB Tributaryunit-stream (system)
Y stream has listed tributaries in HSAdatabase
N stream has no listed tributaries in HSASTREAM Stream name at mouthdatabase
CONT/ Continuous/InterruptedQUAD USGS Quadrangle map of stream INT
mouth C Stream flows to the sea year-round
I Stream flows year-round in the upperportions, and intermittently at lowerelevations
CODE STREAM QUAD TR1EW CODE STREAM QUAD TRIB
2 1-34 Moloaa Anahola N C2-1 35 Papaa Anahola N C
2-1-01 Awaawapuhi Malcaha N C2-1-36 AhCfln11U Anahola N I
2-1-02 Honopu Makaha N C2-2-01 Anahola Anahola Y C
2-1-03 Nalceikionaiwi Haena N C2-2-02 Kuu Kapaa N I
2-1-04 Kalalau Haena N C2-2-04 Kapaa Y C
2-1-05 Pohakuao Haena N C2-2-05 Moikeha Canal Kapaa N C
2-1-06 Waiolaa Haena N C2-2-06 Waikaea Canal Kapaa N C
2-1-07 Hanalcoa Haena N C2-2-08s Wailua S. Kapaa Y C
2-1-08 Waialiualcua Haena N C2-2-10 Kawailoa Kapaa V N I
2-1-09 Hoolulu Haena N C2-2-12 Hanamaulu Kapaa N C
2-1-10 Hanakapiai Haena N C2-2-13 NaliWili Lihue N C
2-1-11 Maunapuluo Haena N C2-2-14 Pu Lihue N C
2-1-12 Limahuli Haena N C2-2-15 Huleia Lihue Y C
2-1-13 Manoa Haena N C2-3-01 Lihue N C
2-1-14 Wainiha R. Haena Y C2-3-02 Waikomo Koloa Y C
2-1-15 LumahaiR. Hanalei N C2-3-04 Lawai Koloa N C
2-1-16 Waikoko Hanalei N C2-3-06 Wahiawa Hanapepe N C
2-1-17 Waipa Hanalei N C2-3-07 Hanapepe Hanapepe Y C
2-1-18 Waioli Hanalei Y C2-4-01 Mahinauli Hanapepe N C
2-1-19 HanaleiR. Hanalei Y C2-4-02 Aakukui Hanapepe N I
2-1-20 Waileia Hanalei N C2-4-03 Waipao Hanapepe N C
2-1-21 Anixü Hanalei N C2-4-04s Waimea S. Kekaha Y C
2-1-25 Kalihiwai R. Hanalel Y C2-5-06 Kinekine Ditch Kekaha N C
2-1-26 Puukumu Hanalei N C2-5-07 Kaawaloa Kekaha N I
2-1-27 Unnamed Anahola N C2-5-08 Nahomalu Kekaha N I
2-1-28 Kilauea Anahola Y C2-5-09 Kaulaula Makaha N I
2-1-29 Kulihaili Anahola N C2-5-10 Haeleele Makaha N I
2-1-30 E. Waiakalua Anahola N I2413 Kauliao Makaha N I
2-1-31 Pilaa Anahola N C2-5-15 Milolli Makaha N C
2-1-32 W. Waipake Anahola N 12-5-16 Nualolo Makaha N C
2-1-33 E. Waipake Anahola N I
21

0 T1 cJ
0 = -.
i*
t3t’.
)t’.
)‘J
--‘
,-
-.
.-.
-‘
-‘
-.
II
II
II
II
II
II
-\Q
n -
til
00
00
00
0)
‘000000000
EE
EE
E°
—O
fl—
OO
CO
OO
--—
-4O
OO
CII
(#
10
[iIiF
i[flP
iiiPf
PiPi
ifff
1.1
im
iii:
ZZ
I.<
ZZ
ZZ
ZZ
ZZ
I<
ZZ
l.<
ZZ
ZZ
Z.<
ZZ
ZZ
ZZ
ZZ
U1i
11
c
00
c.
z<
<I<
zzzz<
zzz

CODE STREAM QUAD TRII3 CODE STREAM QUAD TRIB
4-2-114-2-12
4-2-134-2-14
4-2-154-2-16
ManawaiOhiaWawaiaKamaloKawelaPapio
KamaloKatnaloKamaloKamalo
KaunakakaiHalawa
NNNNNN
IIIIIC
Maui.... ..
.
6-4-046-4-066-4-076-4-086-4-096-4-106-4-116-4-126-4-U6-4-146-4-156-4-166-4-176-4-186-4-196-4-206-4-216-4-226-4-236-4-246-4-256-4-266-4-276-4-286-4-296-4-306-4-316-4-326-4-336-4-346-4-366-5-016-5-026-5-036-5-046-5-056-5-066-5-076-5-086-5-096-5-106-5-116-5-126-5-136-5-156-5-16
6-1-016-1-026-1-036-1-046-1-056-1-066-1-076-1-086-1-096-1-106-1-116-2-016-2-026-2-036-2-056-2-066-2-076-2-086-2-096-2-106-3-016-3-026-3-036-3-046-3-OS6-3-076-3-086-3-096-3-106-3-116-3-126-3-136-3-146-3-156-4-016-4-026-4-03
WaikamoiPuohokanioaHaipuaenaPunalauHonomanuNuaailuaPiinaauOhiaWaiokamiloWailuauuiW. WailuaikiE. WailuaikiKoplilulaWaiohue GLPaakeaWaiaakaKapaulaHanawiMakapipiKuhiwaWaiholeManawaikeaeKahawaihapapaKeaalkiWaiomLanikeleHeleleikeohaKawakoeUlainoKawaipapaUnnamedMoomoonuiHaneooKapiaWaiohonuPapaahawahawaAlaalaulaWailuaHonolewaWaieiKakiwekaHahalawePuaaluuOheo GiKoukouaiOnelii
UkumehameOlowaluLauniupokuKauaulaKahomaWahikuliHonokowaiKahanaHonokahuaHouoluaHonokohauPoeluaHonananaKahakuloaWaiolaiMakamakaoleWaihee R.WaiehulaoWaikapuMalikoKuiahaKaupakuluaManawaiiaoUaoaKakipiHonopouHoolawaWaipioHanehoiHoaluaHanawanaKailuaNailiilihaeleOopuolaKaaieaKolea
KeanaeKeanaeKeanaeKeanaeKeanaeKeanaeKeanaeKeanaeKeanaeKeanaeKeanaeKeanaeKeanaeNahikuNahikuNahikuNahilcuNahikuNahikuNahikuNahikuHanaHanaHanaHanaHanaHanaHanaHanaHanaHanaHanaHanaHana
KipahuluKipahuluKipahuluKlpahuluKipahuluKipahuluKipahuluKipahuluKipahuluKipahuluKipahuluKiDahulu
OlowaluOlowaluLahainaLahainaLahainaLahainaLahainaHonoluaHonoluaHonoluaHonolua
KaliakuloaKahakuloaKahalculoaKahakuloaKahakuloa
WailukuWailukuWailukuMaalaea
PaiaHaikuHaiku
HaikuHaikuHaikuHaikuHaikuHaikuHaikuHaikuHaiku
KeanaeKeanaeKeanaeKeanaeKeanae
YNNYYNYNNYNNYNNNNNNNNNNNNNNYNNYNNNNNNNNNNYNYNN
YNNNYYYYNNNNNNNNYYYNNYNNNYYYNYNNYNYNN
CCCCCCCCCCCCCCCCCCCCCIIIIICIIICIIIIICCCCCCCCIC
IIIIIIIICCCIICCCCCCCIIIIICCCCCCCCCCCC
23

CODE STREAM QUAD TRIB - CODE STREAM QUAD TRIB
6-5-17 Kukuiula Kipahulu N C 8-1-44 Wailoa/Waipio Kukuihaele Y C
6-5-18 Kaapahu Kipahulu N C 8-145 Lalakea Kukuthaele N C
6-5-19 Lelekea Kaupo N C 8-1-46 Kaluahine Falls Kukuihaele N C
6-5-20 Alelele Kaupo N C 8-147 Wainlili Kukuihaele N C
6-5-21 Kalepa Kaupo N C 8-1-49 Waipunahoe Kukuihaele N C6-5-22 Nuanuaaloa Kaupo N I 8-1-50 Waialeale Kukuihaele N C
6-5-24 Manawainui Kaupo Y I 8-1-51 Waikoloa Kukuihaele N I
8-1-52 Kapulena Kukuihaele N I
_____________________________
8-1-53 Kawaikalia Kukuihaele N I8-154 Malanahae Kukuthaele N I
_______
flawan8-1-61 Nieme Honokaa N I
8-1-03 Kumakua Hawi N C8-1-62 Papuaa Honokaa N C
8-1-06 Hanaula Hawi N I8-1-65 Kahaupu Honokaa N I
8-1-07 Hapahapai Hawi N I8-1-66 Kahawailiili Honokaa N I
8-1-08 Pall Alcamoa Hawi N I8-1-67 Keahua Honokaa N C
8-1-09 Wainaia Hawi N I8-1-68 Kalopa Honokaa N I
8-1-10 Unnamed Hawi N I8-1-69 Waikaalulu Honokaa N I
8-1-11 Halawa Hawi N I8-1-70 KukuilamalamahF Honokaa N C
8-1-12 Aamakao Hawi N C8-1-71 Honokaa N I
8-1-13 Niulii Honokane N C8-1-73 Kaumoali Gi Honokaa N I
8-1-14 Waikama Honokane N C8-1-76 Waipunahina Honokaa N I
8-1-15 Pololu Honokane Y C8-1-77 Waipunalau Gi Kukaiau N I
8-1-16 Honokane Nui Honokane N C8-1-78 Paauilo Kükaiau N I
8-1-17 Honokane Iki Honokane N C8-1-79 Aanianu Kulcaiau N C
8-1-18 Kalele Gi. Honokane N C8-1-80 Koholalele Gi Kukaiau Y I
8-1-19 Waipahi Honokane N C8-1-81 Kalapahapu Gi Kukaiau N I
8-1-20 Honokea Honokane N C8-1-82 Kukaiau Kukaiau N I
8-1-21 Kailikaula Honokane N C8-1-85 Kaala Kukaiau N I
8-1-22 Honopue Honokane N C8-1-86 Kealakaha Kukaiau N C
8-1-23 Koleahulii Honokane Y C8-1-88 Kupapaulua Kukaiau N I
8-1-24 Ohiahuea Honokane N C8-1-89 Kaiwiki Kukaiau N C
8-1-25 Nakooko Honokane N C8-1-90 Kaula Kulcaiau N C
8-1-26 Waiapuka Honokane Y C8-2-01 Kaohaoha Kukaiau N C
8-1-27 Waikaloa Honokane N C8-2-02 Kaawalii Kulcaiau N C
8-1-28 Waimaile Honokane N C8-2-03 Waipunalei Keanakolu N C
8-1-29 Kukui Honokane N C8-2-04 Laupahoehoc Papaaloa Y C
8-1-30 Paopao Honokane N C8-2-05 Kilau Papaaloa N C
8-1-31 Waiaalala Honokane N C8-2-06 Manowaiopae Papaaloa N C
8-1-32 Punalulu Honokane N C8-2-07 Kuwaikabi Papaaloa N C
8- 1-33 Kaimu Honokane N C8-2-08 Kihalani Papaaloa N C
8-1-34 Pae Honokane N C8-2-09 Kaiwilahilalii Papaaloa N C
8-1-35 Waimanu Honokane Y C8-2-10 Haakoa Papaaloa Y C
8-1-36 Pukoa Honokane N C8-2-11 Pahale Papaaloa Y C
8-1-37 Manuwaikaalio Kukuihaele N C8-2-12 Kapehu Papaaloa N C
8-1-38 Naluea Kulcuihaele N C8-2-13 Paeohe Papaaloa N C
8-1-39 Kahoopuu Kukuihaele N C8-2-14 Maulua Papaaloa Y C
8-142 Waipalioehoe Kukuihaele N C
24

CODE STREAM QUAD TRIB - CODE STREAM QUAD TRIB
8-2-168-2-178-2-188-2-198-2-208-2-218-2-228-2-238-2-248-2-258-2-268-2-278-2-288-2-298-2-308-2-318-2-328-2-338-2-348-2-358-2-368-2-378-2-388-2-398-2-40
PohakupukaKulanakiiAholePoupouManoloaNinoleKaaheikiWaikoluWaikaurnaloKahukuWaiehuNanueOpeaPeleauUmaumaKamaeeHakalauKolekolePaheeheeHonomuLainilKapehuMakeaAliaMakahanaloa
PapaaloaPapaaloaPapaaloaPapaaloaPapaaloaPapaaloaPapaaloaPapaaloaPapaaloaPapaaloaPapaaloaPapaaloaPapaaloaPapaaloaPapaaloaPapaaloaPapaaloaPapailcouPapaikouPapaikouPapaikouPapaikouPapaikouPapaikouPapaikou
YNNNNNNNNNNYNNYNYYNNNNNNN
CCCCCCCCCCCCCCCCCCCCCCCCC
8-2-418-2-428-2-438-2-448-2-458-2-468-2-478-2-488-2-498-2-508-2-518-2-528-2-538-2-548-2-558-2-568-2-578-2-598-2-608-2-618-2-628-4-028-5-018-5-028-5-03
WaimaauouWaiaamaKawainuiOnomeaAlakahiHanawiKalaoaAleamaiKaieiePuuokakpaKaapokoPapaikouKapuePahoehoePaukaaHonoliiMailiPulcihaeWailuku R.Wailoa R.KaahakiniWaiahaHaloaLarnimaumauWaikoloa
PapaikouPapaikouPapaikouPapaikouPapaikouPapaikouPapaikouPapaikouPapaikouPapaikouPapaikouPapaikouPapaikouPapaikouPapaikouPapaikouPapaikou
HiloHio11110Hio
KailuaKamuelaKamuelaKamuela
NNNNNNNNNYNNNYNYNNYYNNNNN
CCCCCCCCCCCCCCCCCCCCCIIII
25

Table 6 Tributaries with Associated Streams(Alphabetically by Island)
TRIBUTARY Tributary name STREAM Stream name at mouth
CODE HSA code; island-hydrographic unit- CODE HSA code; island-hydrographic unitstream.tributary streamlsystem
CODE STREAM CODE TRIBUTARY CODE STREAM CODE
K* Koholoina Waimea S 2 4-04s
2—2—’1..0S.1_ ‘/‘a.ixiiea S.Awini Waimea S. 2-4-04s . . Waikaea
Konohiki 2-2-06.01 2-2-06Elekenmui Waimea S. 2-4-04s Canal
Halaulani Kilauea 2-1-28 Koula Hanapepe 2-3-07
Halehaha Waimea S. 2-4-04s Kuia Huleia 2-2-15
Halekua Waimea S. 2-4-04s Loll Waimea S. 2-4-04s
Haletnanu 2-2-04.05.2 Waimea S. 2-4-04s Maheo 2-2-08.023 Wailua S. 2-2-08s
Halenanahu Huleia 2-2-15 Maiakii Kapaa 2-2-04
Halepaakai Waimea S. 2-4-04s Makaleha Kapaa 2-2-04
Hall Wailua 5. 2-2-08s Makawea Wainiha R. 2-1-14
Hauhili Hanapepe 2-3-07 Makaweli 2-2-04.04.1 Waimea S. 2-4-04s
Hiaupe Wainiha R. 2-1-14 Maluapopoki Waimea S. 2-4-046
Hoinakauna- . Mamalahoa Waioli 2-1-18Huleta 2-2-15
lehua Maunahma Waintha R. 2-1-14
Illhiula Wailua S. 2-2-08s Mimino Kapaa 2-2-04lole Wailua S. 2-2-08s Moalepe Kapaa 2-2-04Kaalula Anahola 2-2-01 Mohihi 2-2-04.06.1 Waimea S. 2-4-04sKaapoko HanaleiR. 2-1-19 Mokihana 2-2-04.04.2 WainieaS. 2-4-04s
Kahiliholo Kilauea 2-1-28 Mokuone Waimea S. 2-4-04sKahoopulu Anahola 2-2-01 Nawaimaka Waimea S. 2-4-04s
Kalai Hanapepe 2-3-07 Noe Waimea S. 2-4-04s
Kalanza 2-2-08.01.1 Wailua S. 2-2-08s North Fork2-2-08 02 Wailua S 2-2-08s
Kalaumakua Kilauea 2-1-28 Wailua
Kamooloa Hulela 2-2-15 Olokele 2-2-04.01.3 Waimea S. 2-4-04s
Kapahi Kapaa 2-2-04 Oinao 2-3-02.01 Waikomo 2-3-02
Kapohaku- Opaekaa 2-2-08.01 Wailua S. 2-2-08skilomanu
Hanapepe 2-3-07Palikea Wailua S. 2-2-08s
Kauaikinana Waimea S. 2-4-04s Paohia Huleia 2-2-15Kaulu Wailua S. 2-2-08s Papakolea Hulela 2-2-15Kaumoku KalihiwaiR. 2-1-25 Papuaa Huleia 2-2-15Kaupaku Anahola 2-2-01 Poeleele 2-3-02.02 Waikomo 2-3-02
Kawaikoi 2-2-04.06.3 Waimea S. 2-4-04s Pohalcuhonu Kilauea 2-1-28Kawaipuua Hanapepe 2-3-07 Poomau 2-2-04.06 Waimea S. 2-4-04s
Kawi Wailua S. 2-2-08s Pouli Kalihiwai R. 2-1-25
Kealiua Wailua S. 2-2-08s Puakukul Huleia 2-2-15Kealia 2-2-04.01 Kapaa 2-2-04 Pubi Huleia 2-2-15Keaoopu Anahola 2-2-01 Puu Ka Ele
_________
Kilauea 2-1-28Koaie 2-2-04.04 Wainiea S. 2-4-04s
26
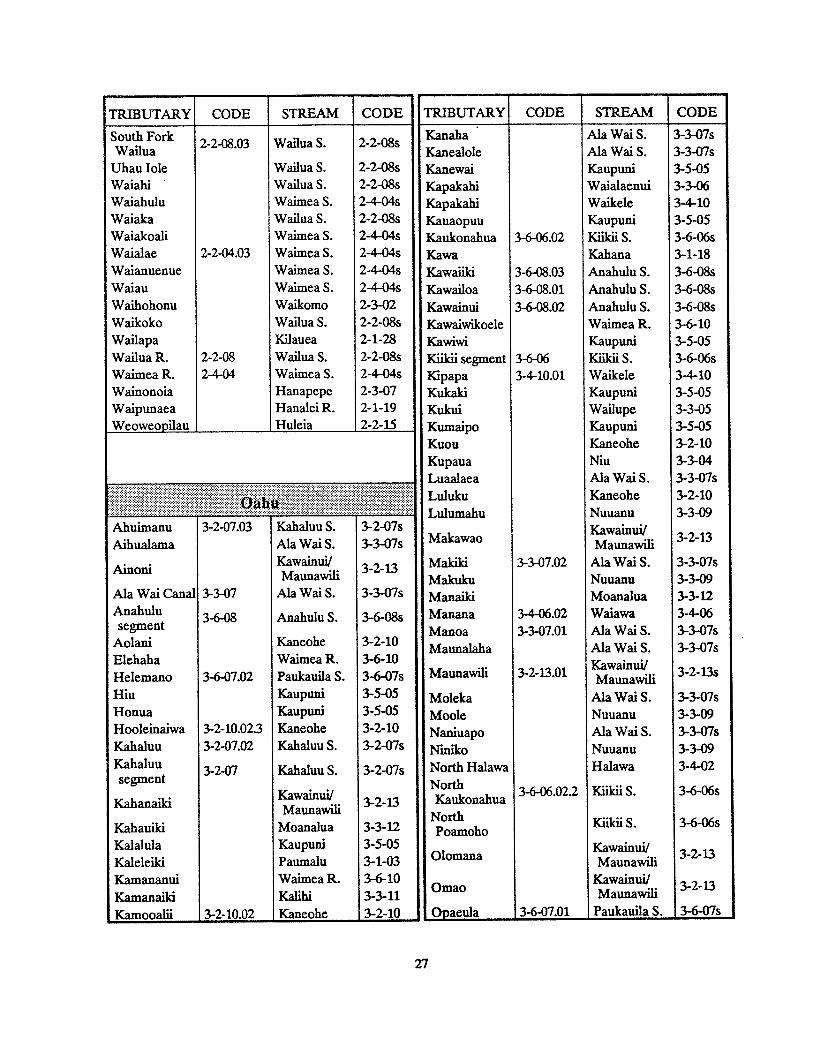
TRIBUTARY CODE STREAM CODE TRIBUTARY CODE STREAM CODE
South Fork . Kanaha Ala Wai S. 3-3-07s2-2-08.03 Wailua S. 2-2-08s
Wailua Kanealole Ala Wai S. 3-3-07sUhau lole Wailua S. 2-2-08s )Cnewaj Kaupuni 3-5-05Waiahi Wailua S. 2-2-OSs Kapakahi Waialaenui 3-3-06Walahulu WaimeaS. 2-4-04s Kapakahi Waikele 3-4-10Waialca Wailua S. 2-2-08s Kauaopuu Kaupuni 3-S-OSWaiakoali Waimea S. 2-4-04s Kaukonahua 3-6-06.02 Kilkil S. 3-6-06sWaialae 2-2-04.03 Waimea S. 2-4-04s Kawa Kahana 3-1-18Waianuenue Waimea S. 2-4-04s Kawaiiki 3-6-08.03 Anahulu S. 3-6-08sWaiau Waimea S. 2-4-04s Kawailoa 3-6-08.01 Anahulu S. 3-6-08sWaihohonu Waikomo 2-3-02 Kawainui 3-6-08.02 Anahulu S. 3-6-08sWaikoko Wailua S. 2-2-08s KawJcoe1e Waimea R. 3-6-10Wailapa Kilauea 2-1-28 Kawiwi Kaupuni 3-5-05Wailua R. 2-2-08 Wailua S. 2-2-08s Kiikii segment 3-6-06 Kiikii S. 3-6-06sWaimea R. 2-4-04 Waimea S. 2-4-04s Kipapa 3-4-10.01 Waikele 3-4-10Wainonoia Hanapepe 2-3-07 Kulcalci Kaupuni 3-S-OSWaipunaea HanaleiR. 2-1-19 Kukui Wailupe 3-3-05Weoweopllau
_________
Huleia 2245 Kumaipo Kaupuni 3-5-05Kuou Kaneohe 3-2-10Kupaua Niu 3-3-04
_______________________________
Luaalaea Ala Wai S. 3-3-O7s
Oabu LUIUkU Kaneohe 3-2-10
Lttlii.riialiu ?uua,1u 3—3—09Ahuimanu 3-2-07.03 Kahaluu S. 3-2-07s
Aihualama Ala WaiS. 3-3-07s Makawao Mauna 3-2-13
Ainoni 3-2-13 Makiki 3-3-07.02 Ala WaiS. 3-3-07sMaunawilt Makuku Nuuanu 3-3-09
Ala Wai Canal 3-3-07 Ala Wai S. 3-3-07s Manaiki Moanalua 3-3-12AnahulU :3-6-08 Anahulu jg Manana 3-4-06.02 Waiawa 3-4-06segment Manoa 3-3-07.01 Ala Wai S. 3-3-07s
Aolani Kaneohe 3-2-10 Maunalaha Ala Wal S. 3-3-07sElehaha Wairnea R. 3-6-10 Kawainui/Helemano 3-6-07.02 Paukauila S. 3-6-07s Maunawili 3-2-13.01 Maunawili
3-2-13s
Hiu Kaupuni 3- Moleka Ala Wai S. 3-3-07sHonua Kaupuni 3-5-05 Mnie Nuuanu 3-3-09Hooleinaiwa 3-2-10.02.3 Kaneohe 3-240 Naniuapo Ala Wai S. 3-3-07sKahaluu 3-2-07.02 Kahaluu S. 3-2-07s Niniko Nuuanu 3-3-09KaIIaIUU 3-2-07 Kahaluu S. 3-2-07s North Halawa Halawa 3-4-02segment
KahanaikiwaIIIj 3-2-13 Kaukonahua
3-6-06.02.2 Kiikii S. 3-6-06s
Kahauiki Moanalua 3-3-12 ohoKuku S. 3-6-06s
Kalalula Kaupuni 3-505 Kawainui/Kaleleiki Paumalu 3-1-03 Olomana Maunawili
3-213
Kamananui Waimea R. 3-6-10 Kawainui/ 3-213Kamanaiki Kalilil 3-3-11
Omao Maunawili -
Kamooalli 3-2-10.02 Kaneohe 3-2-10 Opaeula 3-6-07.01 Paukauila S. 3-6-07s
27

TRIBUTARY CODE STREAM CODE TRIBUTARY CODE I STREAMICODEJ
Palapu
PabloPaukauilasegment
PauoaPoamohoPukelePunanaulaSouth HalawaSouthKaukonahua
UwauWaaloaWaiakeakuaWaianuWaiauWaiheeWaihiWaikalcalauaWaikeekeeWaimanoWaiomaoWaolani
3-2-13.01.1
3-3-07.01.1
3-6-07
3-6-06.01
3-6-06.02.1
3-4-05.013-2-07.01
3-4-10.02
3-4-06.01
Kawainui/Maunawili
Ala WaiS.
Paukauila S.
NuuanuKilkilS.Ala WaiS.KaupuniHalawa
KiikilS.
WaiaholeAla WaIS.Ala WaiS.WaiaholeWaimaluKahaluu S.Ala WaiS.WaikeleWaikaneWaiawaAla WaiS.Nuuanu
3-2-13
3-3-07s
3-6-07s
3-3-0936s3-3-07s3-5-053-4-02
3-6-06s
3-2-043-3-07s3-3-07s3-2-043-4-053-2-07s3-3-07s3-4-103-2-023-4-063-3-07s3-3-09
I Molokal I
AmaluEastWailuanui
HaiiakeaHalonaHealaniHokuulaHoolawaliilhiHoolawanuiHueloHuluhulupueo
KahakapauGi.
KanahaKapalaalaeaKapaloaKauluKinihapaiKoaleKoleaKuoMailepaiMakaaMakanaliMaluhianaiwiMananoleMokulehuaNakalaloaNorth WaiehuOanuiOhiaOpanaPalauhuluPalilceaPapaluaPilIoiPipiwalPokakaekanePoohahoahoaPualcaaPuniawa
laoWaikamolHonokowai
Wailuanui
WahikuliKa.homaManawainuiUkumehameHoolawaHoolawaHanehoi
Waihee R.
Maliko
KahomaKakipiHonokowaiKakipilaoKakipiPunalauPiinaauKahanaKakipiOopuolaHahalaweWaihee R.KawakoeTaoWaiehuKailuaKuiahaKakipiPiinaauOheo GLKakipiKakipiOheo GI.PiinaaulaoKopiliulaHonopou
6-2-096-4-046-1-07
6-4-14
6-1-066-1-056-5-246-1-016-3-096-3-096-3-11
6-2-07
6-3-01
6-1-056-3-076-1-076-3-076-2-096-3-076-4-086-4- 116-1-086-3-076-4-016-5-116-2-076-4-326-2-096-2-086-3- 146-3-026-3-076-4-116-5-136-3-076-3-076-5-136-4-116-2-096-4-176-3-08
6-3-01.01
6-1-05.01
6-3-07.02
6-5-13.026-3-07.01
6-5-13.01
HipuapuaKahawaiikiKapeaKapuhiKawailkiKawailenaKawainuiKawaipakaL.anipu.niMoaluaNawaihuliliPilipililauPulenaPunaulaUluwiniWaiakeakuaWaiokeela
HalawaWailauKawainuiPelekunuPelekunuPelekunuPelekunuPelekunuPelekunuHalawaHalawaPelekunuWailauMapulehuAhainoWailauWailau
4-1-214-1-154-1-194-1-094-1-094-1-094-1-094-1-094-1-094-1-214-1-214-1-094-1-IS4-2-084-2-074-1-154—1-15
28

South WaiehuUluiniWaiheeWestWailuanui
TRIBUTARY CODE STREAM CODE TRIBUTARY CODE STREAM CODE
WaiehuHonomanuKaldpi
Wailuanui
6-2-086-4-096-3-07
6-4-14
8-2-10.02
8-2-61.01.1
KapiliKapoloa
Kawaiki
‘Kawaili
Kawainui
KeanuiomanoKipiKohakohau
Koiawe
KumuawaneLaualuMakahiloaMokupauNakakauila
Nanaue
OniuPainiuPakaluahinePohakupaaPuumaile 01.WaawaaWaiakalaeWaiakeaWaiauWaihilauWalilikahiWaikoana
Wailoa
Waima
WainakuWaipahoehoe
AaleAhoa
Alakahi
AlenaioAwebiHanapueoHiilawe
Hiilawe
HookelekeleHuliulliKaahakiniKaahinaKaalauKahoama
Kainehe 01.
Kahi1dKakaaukiICalakooKalohewahewa
KaluiildKamaeeKamoloumiKaoheanuKapehu
LaupahoehoePololuWailoa/Waipio
Koholalele 01WailoaJWaipio
WaikoloaWailukuR.WaikoloaWailoa/Waipio
PuuokalepaWailukuR.MauluaWailuku R.WailukuR.WalloWWaipio
KolealiilliNanueWailuku R.HonolliLauhala 01HakalauPololuWailoa R.WailUkUR.WalinanuWaimanuPahoehocWailoa/Waipio
WalloWWaipio
Wailuku R.Wailoa R.
8-2-048-1-15
8-1-44
8-1-80
8-1-44
8-5-038-2-608-5-03
8-1-44
8-2-508-2-608-2-148-2-608-2-60
8-1-44
8-1-238-2-278-2-608-2-568-1-838-2-328-1-158-2-618-2-608-1-358-1-358-2-54
8-1-44
8-1-44
8-2-608-2-61
WailukuR.HaakoaWailoa/Waipio
Wailoa R.Wailuku R.UmaumaLalalceaWalloWWaipio
Wailuku R.PohakupukaKolekoleNanuePahaleWaIIUkUR.Kalapahapu01
HonolliWaimanuKolekole
Wailuku R.
Wailoa R.HakalauWaiapukaPohakupulcaWailuku R.
8-2-608-2-10
8-1-44
8-2-618-2-608-2-308-1-45
8-1-44
8-2-608-2-168-2-338-2-278-2-118-2-60
8-1-81
8-2-568-1-358-2-33
8-2-60
8-2-618-2-328-1-268-2-168-2-60
8-5-03.01
8-1-83.01
8-2-60.018-2-61.01
8-2-60.03
8-1-81.01
8-2-60.02
29
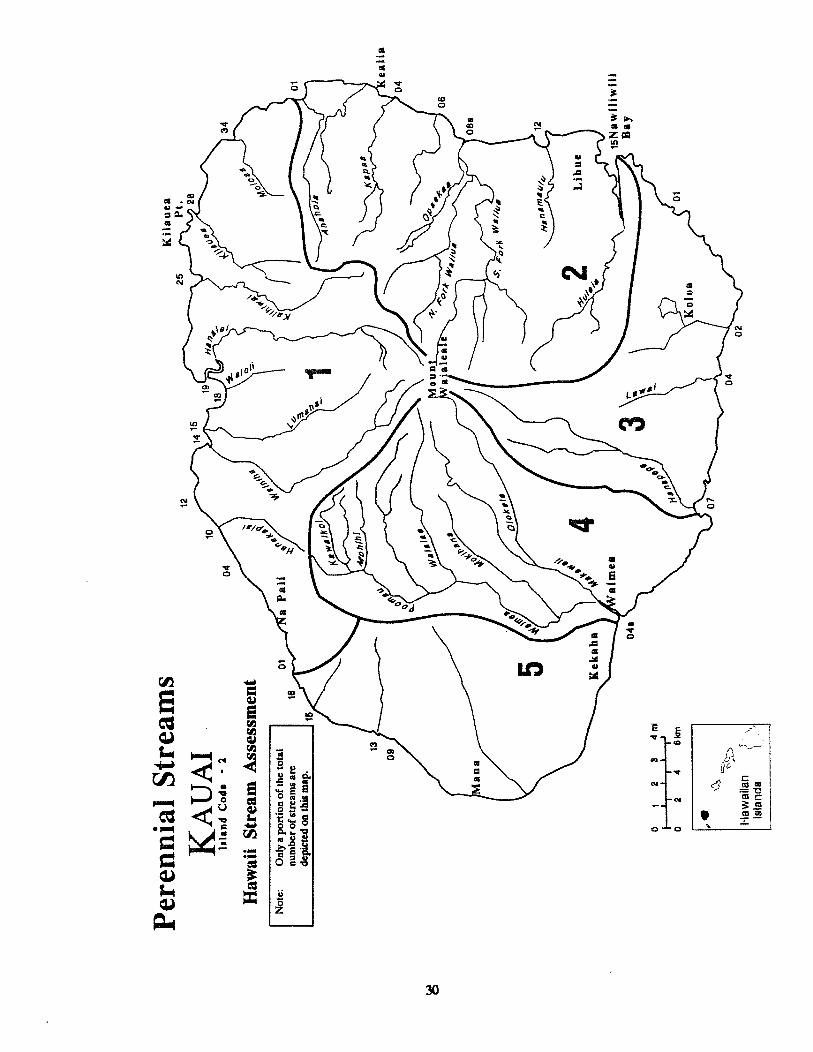
Not
e:O
nly
ap
ort
ion
of
the
tota
ln
um
ber
of
stre
ams
are
dcpa
ctcd
onth
ism
ap.
oj
28
4ta
II
I-I
II
II
o2
46k
m
Haw
aIIa
n•
lula
nde
I
Per
enni
alS
trea
ms
KA
UA
I.Is
land
Cod.
Haw
aii
Str
eam
Ass
essm
ent
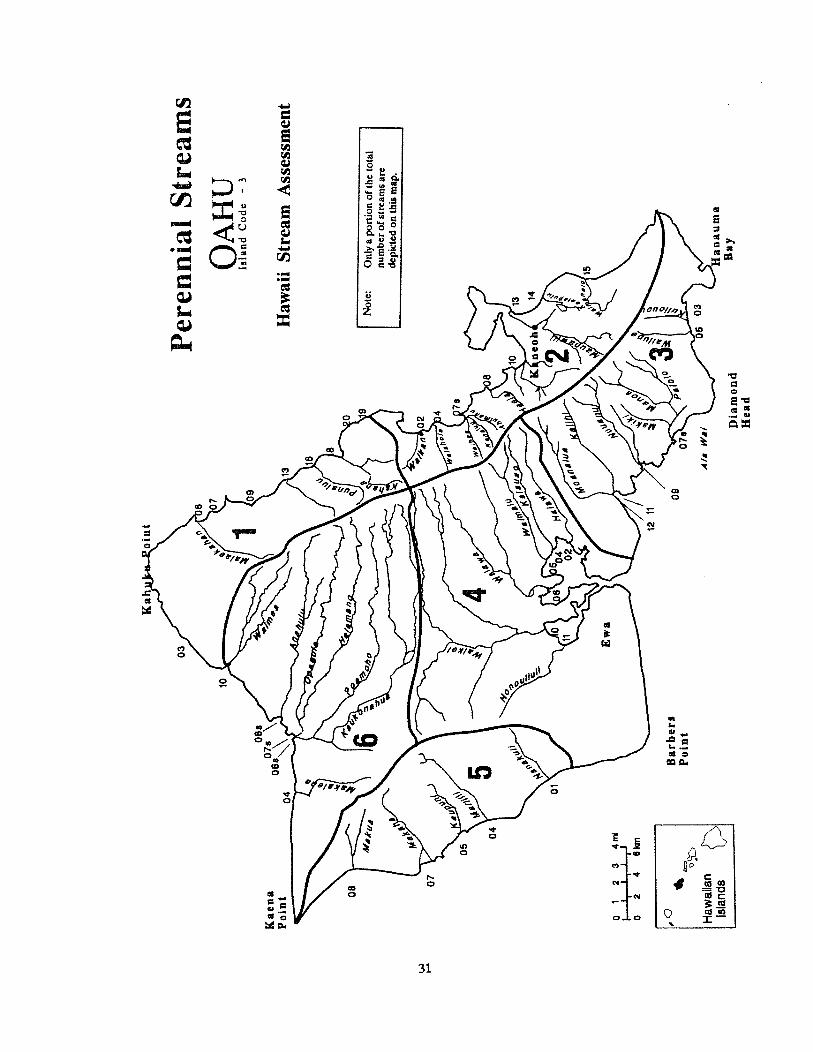
lot
Not
e:O
nly
aport
ion
of
the
tota
lnum
ber
of
stre
ams
are
dep
icte
don
this
map
.
-C
%, 0
)
Haw
aIIa
nIs
land
s
03
Kae
na
Poin
t
10
Per
ennia
lS
trea
ms
OA
HU
Isla
ndC
od
e-
3
07
Haw
aii
Str
eam
Ass
essm
ent
05
04
01
0I
23
4rnI
II
II
II
II
02
481
cm
Barb
eri
Poin
t
12
09
A/a
Wa?
Bay
Dia
mond
Hea
d

IIio
Po
int
Per
ennia
lS
trea
ms
MO
LO
KA
IIs
land
Cod
e-
4
Haw
aii
Str
eam
Ass
essm
ent
O1
23r
rdI
II
02
48k
m
Not
e:O
nly
aport
iono(t
heto
tal
num
ber
ofst
ream
sar
edep
icte
don
this
map
Kah
iuP
oin
t
Laa
uP
ain
tK
amal
a
-o
OD
Haw
aiia
n(J’
\Is
land
s

01
o1
23
4rr
I‘
o2
46k
m
0708
01
09
08
10
15
01
01
07
Kean
ae
Per
enn
ial
Str
eam
sM
AU
II1
and
Code
-2
Haw
aii
Str
eam
Ass
essm
ent
Han
03
TNot
e:O
nly
apo
rtio
nof
the
tota
lnu
mbe
rof
stre
ams
are
depi
cted
onth
ism
ap.

Perennial Streams
Note: Only a portion of the totalnumber of streams aredepicted on this map.
-Q I
HawalanIands Hawaii Stream Assessment
Upolo Point
16
6068
8790
02
16
0 3 6 9ffd
0 5 V km
South Point 1-tAviAiIIsland Code - S
34

Monitoring and Modifications


/
Monitoring and Modifications
An inventory of monitoring and modification information is an important step towardunderstanding streams. Guidance in these areas was provided by a committee andnumerous resource experts.
Physical Characteristics CommitteeChair, George Matsumoto, DLNR, DOWALDSherrie Samuels, DLNR, DOWALDSterling Chow, DLNR, DOWALDTom O’Brien, DBED Energy DivisionMary Teves, DOH, Environmental Planning
Monitoring: The availability of information on stream flow and water quality characteristics depends primarily on monitoring. In Hawaii, monitoring of flow is done primariiy by stream gaging. About one third of Hawaii’s streams have gaging records, althoughthe data must be used with caution. Surface water-quality monitoring records have beenidentifed by major source and type only.
Modifications: Stream modifications often diminish instream values. it is thereforeimportant to identify the type of stream modification, such as dams, diversions andchannelization, and the degree to which it alters the stream. Streams do provide waterfor many important off stream uses. This subject is discussed briefly in the Water Supplychapter.
The following reports provide some detailed information. Each report is essentiallyindependent and self-contained and represents a consolidation of scientific studies andgovernment documents. Much of the information is scattered, limited and dated. Consequently, the inventories are incomplete. A summary is provided in Table 7.
35

2-1-01
2-1-02
2-1-03
2-1-04
2-1-05
2-1-06
2-1-07
2-1-08
2-1-09
2-1-10
2-1-11
2-1-12
2-1-13
2-1-14
2-1-15
2-1-16
2-1-17
2-1-18
2-1-19
2-1-20
2-1-21
2-1-25
2-1-26
2-1-27
2-1-28
2-1-29
2-1-30
2-1-31
2-1-32
2-1-33
Awaawapuhi
Honopu
Nakeikionaiwi
Kalalau
Pohakuao
Waiolaa
Hanakoa
Waiahuakua
Hoolulu
Hanakapiai
Maunapuluo
Limahuli
Manoa
WainihaR.
Lumahai R.
Waikoko
Waipa
Waioli
Hanalei R.
Waileia
An
KalihiwaiR.
Puukumu
Unnamed
Kilauea
Kulihaili
B. Waiakalua
Pilaa
W. Waipake
B. Waipake
2-1-34
2-1-35
2-1-36
2-2-01
2-2-02
2-2-04
2-2-05
2-2-06
2-2-08s
2-2-10
2-2-12
2-2-13
2-2-14
2-2-15
2-3-01
2-3-02
2-3-04
2-3-06
2-3-07
2-4-01
2-4-02
2-4-03
2-4-04s
2-5-06
2-5-07
2-5-08
2-5-09
2-5-10
2-5-13
2-5-15
2-5-16
Moloaa
Papaa
Aliomanu
Anahola
Kumulcumu
Kapaa
Moilceha Canal
Waikaea Canal
WailuaS.
Kawailoa
Hanamaulu
Nawiliwili
Puali
Huleia
Kipu Kai
Wailcomo
Lawai
Wahiawa
Hanapepe
Malilnauli
Aakukui
Waipao
Waimea S.
Kinekine Ditch
Kaawaloa
Nahomalu
Kaulaula
Haeleele
Kaithao
Miolii
Nualolo
GQ
GQ Y
Y
YH
Y
YH
Y
N
N
N
N
N
N
Table 7 Monitoring and Modifications(By Island, by Code)
Code HSA Stream Code Dam/Div Dani or Diversion
Natne Stream name at mouth Y Dam or diversion weir noted
Monitor Monitoring information N No known dam or diversion weir
G Gaging information exists H Hydroelectric diversion
Q Water quality information exists Chan Channelization Information
L Portion of stream is lined
Code Name‘
Chan Code Name ‘ Cban
Kauai N
N
N
Y
G
G
G
GQ
G
G
GO
G
G
GQ
N
N
N
N
N
N
N
N
N
N
N
N
N
YH
N
N
N
N
Y
N
N
N
N
Y
N
Y
N
N
N
Y
N
G
G
GQ
GQ
GQ
G
G
L
YH
36

3-1-03
3-1-04
3-1-OS
3-1-06
3-1-07
3-1-08
3-1-09
3-1-10
3-1-11
3-1-13
3-1-16
3-1-18
3-1-19
3-1-20
3-1-21
3-2-01
3-2-02
3-2-03
3-2-04
3-2-05
3-2-07s
3-2-08
3-2-09
3-2-10
3-2-11
3-2-13
3-2-14
3-2-15
3-3-03
3-3-04
3-3-OS
3-3-06
3-3-07s
3-3-09
3-3-10
3-3-11
3-3-12
3-4-02
3-4-03
Paumaiu
Kawela
Oio
Malaekahana
Kahawainui
Wailele Gi.
Koloa Gi.
Kaipapau
Maakua
Kaluanui
Punaluu
Kahana
Kaaawa
Malcaua
Unnamed
Hakipuu
WaikaneUnnamed
Waiahole
Kaalaea
Kahaluu S.
Heeia
Keaahala
Kaneohe
Kawa
Kawairnii/Maunawili
Kaelepulu Canal
Wainianalo
Kuliouou
Mu
Wailupe
Waialaenui
Ala WaiS.
Nuuanu
Kapalama
Kaffi
Moanalua
Halawa
Aiea
GQ
GQ
GQ
G
G
GQ
G
GO
G
GO
GO
GO
G
G
G
G
GO
GO
GO
GO
N
Y
Y
Y
N
N
Code NameI Moni I Darn? Chan
______
I tor
G N
G
GQ
G
L
Y
N
N
N
L
L
G
3-4-04
3-4-OS
3-4-06
3-4-10
3-4-11
3-5-01
3-5-02
3-5-04
3-5-05
3-5-07
3-5-08
3-6-03
3-6-04
3-6-06s
3-6-07s
3-6-08s
3-6-09
3-6-10
Y
Y
Y
N
N
N
Y
Y
N
iauao
Waimalu
Walawa
Waikele
Honouliuli
Nanakuli
Ulehawa
Malilili
Kaupuni
Makaha
Makua
Unnamed
Makaleha
KilkilS.
Paukauila S.
Anahulu S.
Loko Ea
Waimea R.
L
L
L
L
L
L
GQ
G
L
N
N
N
N
Y
N
N
N
N
Y
Y
Y
Y
N
Y
Y
Y
Y
N
N
N
N
Y
Y
Y
L
L
L
L
L
L
L
L
L
L
L
L
L
L
L
L
4—1-01
4-1-02
4-1-03
4-1-04
4-1-05
4-1-06
4-1-07
4-1-08
4-1-09
4-1-10
4—1-11
4-1-12
4-1-13
4-1-14
4—1-15
4-1-17
4-1-18
4-1-19
4—1-20
4-1-21
Waihanau
Waialeia
Waikolu
Wainene
Anapuhi
Waiohookalo
Keawanui
Kallüli
Pelekunu
Waipu
Haloku
Oloupena
Puukaoku
Wailele
Wailau
Waiahookalo
Kahiwa
Kawainui
Pipiwal
Halawa
N
N
Y
N
N
N
N
N
N
N
N
N
N
N
N
N
N
N
N
N
G
GO
G
GO
GO
37

Code Name Moni DamJ Ch Code Name Morn Dam! citor Divtor Div
4-1-22 Hakaaano N 6-3-02 Kuiaha Y L
4-2-01 Pohakupili G N 6-3-03 Kaupákulua G Y
4-2-02 Honoulimaloo N 6-3-04 Manawaiiao
4-2-03 Honouliwai N 6-3-05 Uaoa Y
4-2-04 Waialua N 6-3-07 Kakipi G Y
4-2-05 Kainalu N 6-3-08 Honopou GO Y
4-2-06 Honomuni N 6-3-09 Hoolawa G Y
4-2-08 Mapulehu GO N 6-3-10 Waipio Y
4-2-09 Kaluaaha N 6-3-11 Hanehoi Y
4-2-10 Kahananui N 6-3-12 Hoalua Y
4-2-11 Manai N 6-3-13 Hanawana Y
4-2-12 Ohia N 6-3-14 Kailua G Y
4-2-13 Wawaia N 6-3-15 Nailiilihaele GO Y
4-2-14 Kamalo G N 6-4-01 Oopuola G Y
4-2-15 Kawela GO N 6-4-02 Kaaiea Y
4-2-16 Papio GO N 6-4-03 Kolea Y
6-4-04 Waikamoi GO Y
_________________________________________
6-4-06 Puohokamoa G Y
6-4-07 Haipuaena GO Y
6-1-01 Ukumehame G N 6-4-08 Punalan Y
6- 1-01 Ukumehame G N6-4-09 Honomanu G Y
6-1-02 Olowalu GO Y 6-410 Nuaailua Y
6-1-03 Launiupoku G 6-4-11 Piinaau 0 Y
6-1-04 Kauaula 0 YH L 6-4-12 Ohia Y
6-1-05 Kahoma GO Y L 6-4-13 Waiokaxnilo Y
6-1-06 wahikuli 6-4-14 Wailuanui G Y
6-1-07 Honokowai G Y L 6-4-15 WWailuaiki GO Y
6-1-08 Kahana 6-4-16 E.Wailuaild 0 Y
6-1-09 Honokahua 6-4-17 Kopiliula G Y
6-1-10 Honolua 0 6-4-18 Waiohue GI. G Y
6-1-11 Honokohau GO6-4-19 Paakea G Y
6-2-01 Poelua 0 N 6-4-20 Waiaalca G Y
6-2-02 Honanana N 6-4-21 Kapaula 0 Y
6-2-03 Kahakuioa GQ N 6-4-22 Hanai GO Y
6-2-05 Waiolai N 6-4-23 Makapipi 0 Y
6-2-06 Makamakaole G6-4-24 Kuliiwa N
6-2-07 Waihee R. GO y 6-4-25 Waihole N
6-2-08 Waiehu o 6-426 Manawaikeae N
6-2-09 lao GO L6-4-27 Kahawaihapapa
6-2-10 Waikapu o 6-4-28 Keaaiki N
6-3-01 Maliko 0— 6-4-29 Waioni
____
N
38

Code Name Moni Dam/ Chan Code Name Moni DamJtor Divtor Div
G
G
6-4-30
6-4-31
6-4-32
6-4-33
6-4-34
6-4-36
6-5-01
6-5-02
6-5-03
6-5-04
6-5-05
6-5-06
6-5-07
6-5-08
6-5-09
6-5-10
6-5-11
6-5-12
6-5-13
6-5-15
6-5-16
6-5-17
6-5-18
6-5-19
6-5-20
6-5-21
6-5-22
6-5-24
Lanikele
Heleleikeoha
Kawakoe
Ulaino
Kawaipapa
Unnamed
Moomoonui
Haneoo
Kapia
Waiohonu
Papaahawahawa
Alaalaula
Wailua
Honolewa
Waiell
Kalciweka
Hahalawe
Puaaluu
Oheo Gi
Koukouai
Opelu
Kukuiula
Kaapahu
Lelekea
Alelele
Kalepa
Nuanuaaloa
Manawainui
N
N
Y
Y
N
N
N
N
N
N
N
N
N
N
N
N
N
N
N
N
N
N
N
N
N
N
G
GO
G
G
G
G
G
G
G
G
G
G
Q
8-1-14
8-1-15
8-1-16
8-1-17
8-1-18
8-1-19
8-1-20
8-1-21
8-1-22
8-1-23
8-1-24
8-1-25
8-1-26
8-1-27
8-1-28
8-1-29
8-1-30
8-1-31
8-1-32
8-1-33
8-1-34
8-1-35
8-1-36
8-1-37
8-1-38
8-1-39
8-1-42
8-1-44
8-1-45
8-1-46
8-1-47
8-149
8-1-SO
8-1-51
8-1-52
8-1-53
8-1-54
8-1-61
8-1-62
8-1-65
8-1-66
Waikama
Pololu
Honokane Nui
Honokane Iki
Kalele Gi.
Waipahi
Honokea
K1ikau.la
Honopue
Kolealiilii
Ohiahuea
Nakooko
Waiapuka
Waikaloa
Waimaile
Kukui
Paopao
Waiaalala
Punalulu
Kaimu
Pae
Waimanu
Pukoa
Manuwaikaalio
Naluca
Kahoopuu
Waipahoehoe
Wailoa/Waipio
Lalakea
Kaluahine Falls
Waiulili
Waipunahoe
Waialeale
Waikoloa
Kapulena
Kawaikalia
Malanahae
Nienie
Papuaa
Kaliaupu
Kahawalliili
Y
Y
Y
Y
Y
Y
Y
Y
Y
Y
Y
Y
N
N
N
N
N
N
N
N
Y
Y
Y
G
8-1-03
8-1-06
8-1-07
8-1-08
8-1-09
8-1-10
8-1-11
8-1-12
8-1-13
Kumakua
Hanaula
Hapahapai
Pall Akamoa
Wainaia
Unnamed
Halawa
Aamakao
Niulli
39

Code Name Moni Darn! c’ Code Name Moni Dam! Chantor Div tor Div
8-1-67 Keahua 8-2-25 Kahuku N
8-1-68 Kalopa 8-2-26 Waiehu N
8-1-69 Waikaalulu 8-2-27 Nanue N
8-1-70 Kukuilamalamahil 8-2-28 Opea N
8-1-71 Alilipali 8-2-29 Peleau N
8-1-73 Kausnoali Gi 8-2-30 Umauma N
8-1-76 Waipunahina 8-2-31 Kamaee N
8-1-77 Waipunalau Gi N 8-2-32 Hakalau Q N
8-1-78 Paauilo N 8-2-33 Kolekole 0 N
8-1-79 Aamanu N 8-2-34 Paheehee N
8-1-80 Koholalele Gi N 8-2-35 Honomu N
8-1-81 Kalapahapu Gi N 8-2-36 Laimi N
8-1-82 Kukaiau N 8-2-37 Kapehu G N
8-1-85 Kaala N 8-2-38 Makea N
8-1-86 Kealakaha N 8-2-39 Alia GO N
8-1-88 Kupapaulua N 8-2-40 Makahanaloa N
8-1-89 Kaiwiki N 8-2-41 Waimaauou N
8-1-90 Kaula N 8-2-42 Waiaama Y
8-2-01 Kaohaoha N 8-2-43 Kawainui Y
8-2-02 Kaawalii N 8-2-44 Onomea N
8-2-03 Waipunalei N 8-2-45 Alalcalii Q Y
8-2-04 Laupahoehoe N 8-2-46 Hanawi N
8-2-05 Kilau N 8-2-47 Kalaoa G N
8-2-06 Manowaiopae GO N 8-2-48 Aleamai N
8-2-07 Kuwaikahi N 8-2-49 Kaieie NH
8-2-08 Kihalani N 8-2-50 Puuokalepa
8-2-09 Kaiwilahilahi N 8-2-51 Kaapoko N
8-2-10 Haalcoa N 8-2-52 Papaikou N
8-2-11 Pahale N 8-2-53 Kapue N
8-2-12 Kapehu N 8-2-54 Pahoehoe N
8-2-13 Paeohe N 8-2-55 Paukaa N
8-2-14 Maulua N 8-2-56 Honolli GO N
8-2-16 Pohakupuka GO N 8-2-57 Maili N
8-2-17 Kulanakii N 8-2-59 Pukihae N
8-2-18 Ahole N 8-2-60 Wailuku R. GO YH
8-2-19 Poupou N 8-2-61 Wailoa R. G Y L
8-2-20 Manoloa N 8-2-62 Kaahakini
8-2-21 Ninole N 8-4-02 Walaha GO
8-2-22 Kaaheiki N 8-5-01 Haloa
8-2-23 Wailcolu N 8-5-02 Lamimaumau Y L
8-2-24 Waikaumalo N 8-5-03 Waikoloa G
40

GaggThe United States Geological Survey (USGS) is the only government agency that gagessurface water in Hawaii. Except for seven index stations and five flood stations, fundingfor all stations is on a 50-50 cooperative basis between USGS and another governmentagency, such as DLNR, or the counties. The USGS gaging program is professionallystaffed and conforms to national standards. Private sector gaging in Hawaii is limited, isnot well documented, and reliability is not assured, and for these reasons is not referenced.
The USGS monitors Hawaii’s streams as indicators and predictors of climatic change,to assist in water resource and water quality management and for flood control purposes.Besides monitoring streams, the USGS has gaged most of Hawaii’s major irrigationsystems, or ditches.
Data provided by the USGS refer to measurements at the point of the gaging stationonly. These figures may not always be the most appropriate indicators of stream size orgeneral stream characteristics. In no case should the information presented here substitute for specific analysis on a stream by stream basis.
Background
The USGS surface water gaging program began in Hawaii with the
...establishment of 12 gaging stations in 1909. These first stations wereoperated primarily to evaluate the potential of the streams for supplying theirrigation needs of the sugar industry. From this modest beginning, the program rapidly expanded to the point where, in 1914, the USGS operated 87gaging stations in the State. By 1968, the USGS was operating 240 daily flowsurface-water gaging stations, the highest number of stations ever operatedby the Hawaii District.
Between 1968 and 1983, there was a net reduction of 116 continuous streamgages... Decisions to drop the gages were based on various economic, technical and political reasons (USGS 1985).
The USGS currently funds a basic network of “index stations” which includes ahydrologic Benchmark station and six NASQAN stations where continuous flow andwater quality information is collected.
41
The location of a gaging station is determined by the purpose of the monitoringprogram. For example, in Hawaii a primary purpose was to monitor or assess thepotential for off-stream use of stream water. Stations established for this purpose wereusually placed at existing or proposed diversions.
Types of information: There are several types of gaging stations, including continuousand partial record stations. Continuous gaging stations keep a constant record ofdischarge. From this, average and median discharge values can be derived. Hawaii’sstreams typically have a somewhat unique flow characteristic in that it includes very largepeak flows, and therefore the average discharge values are not necessarily an accuratemeasure of the available water during normal times. Median flows (flow exceeded 50percent of time) is a more accurate measure oftypical instream conditions. Partial recordgaging stations record the extremes only, peak and/or low flows.
The type of information (low, peak, continuous flow) collected is also determined bythe purpose of the monitoring program. For instance, low flow information may be ofparticular importance for climatic monitoring and for aquatic habitat requirementanalysis. Hourly flow records may also be important to the aquatic biologist. Peak flowinformation is critical for flood control project design. Average and median (dischargewhich is exceeded 50 percent of the time) flows are important for irrigation and storagepurposes.
The USGS provides auxiliary information along with each gage discharge record. Thisinformation is essential for a full understanding and interpretation of discharge figures.Remarks are often induded in the record that address the quality of the records,existence of upstream diversions, and whether water quality information is available.
Methods
The Hawaii Stream Assessment has relied solely on the United States GeologicalSurvey for its gaging information. In a few cases, the HSA calculated the average andmedian flow of the mainstem by combining the tributary figures. USGS data reside invarious published and unpublished documents and in computer data files. Most discharge information included here is from the USGS Water Resources Data, water years1970,1979,1987, and summary ofyears prior to 1950. Median discharge figures are fromthe computer data files.
For each perennial stream or ditch with over five years of continuous gaging information exists, the following information was recorded in the HSA database: gage number;date of annual report used as reference, number of years of record; quality of records;average discharge in cubic feet per second; median flow in cubic feet per second;drainage area above gage measured in square miles; presence or absence of diversionabove gage; whether measurement is on a ditch or stream; USGS collected water qualitydata; gage is active in 1989; water quality data collection active in 1989.
The USGS has determined that it is not possible to predict with any meaningfulaccuracy the median or low flow discharge characteristics of an ungaged stream inHawaii by correlation method, which uses adjacent and similar stream gage information;
42

or by regression analysis, which is an indirect statistical method of calculating discharge.Therefore, discharge estimates of ungaged streams made by other agencies, whilecarefully considered, are not referenced in this report.
ResultsOne hundred and thirty-nine of Hawaii’s perennial streams have been gaged at some
time or another since the start of the gaging program in 1909. In 1989, 97 streams weregaged, at about 125 stations. Of these, 86 are continuous gage stations. Seven ditches arecurrently gaged (Table 8).
Stream Slze The size of a stream is an important criterion used in many planningclassifications and protection decisions. A number of different criteria or combinationthereof can be used to suggest size, e.g., overall length, stream flow, area of watershed.
Length information is inconsistent and unreliable. The U.S. Army Corp of Engineersprepared maps of stream segments thought to have an average flow of at least 5 cfs.While recognizing the deficiencies in the measurement strategy, estimates of thoselengths can be useful in providing a rough framework of comparative size. Using theCOE maps, there are 28 streams that have a length of ten miles or more.
Code Name Total Main Stem3-6-06 Kiikii 60.41
2.2-08 Wailua R. 59.02
2.4-04 Wailua R 44.68 19.88
8-1.44 Waimea S. 44.01 11.10
3.6-07 Waipio 41.35
8-2-60 Paukauila 35.07 7.60
3-4-10 Wailuku R. 33.62 19.97
24-19 Waikelc 26.39 14.58
8.2-32 Hanalci R 22.50 10.60
8-2-30 Umauma 21.30 10.10
2-2-15 Hulcia 20.74 14.67
2-3-07 Hanapepe 20.69 13.54
3.6-08 Anahulu R. 19.73 14.22
2-1-14 Wainiha R. 18.65 13.25
8-2-56 Honolli 1&10 14.50
8-2-43 Kawainui 17.90 9.70
8-2-33 Kolekolc 17.30 10.10
34.06 Waiawa 15.62 1122
6-3.07 Kakipi 15.10 10.60
6-4-11 Piinau - 13.10 5.40
8-2-24 Waikaumalo 12.30 7.00
2-1-28 Kilauca 12.04 8.04
8-2.14 Maulua 12.00 4.00
2.1-15 Lumahai R. 1124 8.99
8-2-27 Nanuc 10.88 7.90
2-3-06 Wahiawa 10.03 10.03
2-1-25 K.alihiwui R. 10.03
8-2.53 Kapuc
__________________
12.70
43

The HSA relied on stream discharge as the determinant of size. Such information isavailable for only about a hundred of Hawaii’s 376 streams. For purposes of comparingstream size, those 101 streams with continuous gaging records were categorized by sizebased on largest median and average discharge recorded at any gaging station on thestream.
The only Waimanu (8-1-35) gage is on a tributary, but that stream is likely to be in themedium range. Private gaging indicates the Waihee streams is probably among the largestreams. Ungaged streams suggested by COE to have large flows are:
Maile (8-2-57), Kawainiu (8-2-43), Hakalau (8-2-32), Kolekole (8-2-33), Urnaunia (8-2-30), Pokakupuka (8-2-16), Kapehu (8-2-12), Kaula (8-1-90)
HSA Criteria for Size Categorization of Hawaii’s Gaged Perennial Streamsin cubic feet per second (cfs)
Large streams - Median flows greater than or equal to 50 cfs or average flowsgreater than or equal to 80 cfs.
Medium streams - Median flows between 10 and 50 cfs or average flowsbetween 20 and 80 cfs.
Small streams - Median flows less than or equal to 10 cfs or average flows lessthan or equal to 20 cfs.
Among the gaged streams, median and average discharge values clustered into somewhat distinct categories, with a disproportionate number of small streams and very fewlarge ones. Using this method, Hawaii gaged streams include 11 large streams, 36medium and 56 small ones (Table 9).
DiscussionDischarge figures should be used with extreme caution. The USGS monitoring pro
gram in Hawaii was and is not designed to determine general stream characteristics orto calculate instream flow. Therefore using data from stations located above a diversion,on a tributary, old records or records prior to diversion, will likely give an inaccuratepicture of instream flow. Using this sometimes inappropriate or inadequate data toestimate instream flow or arrive at relative stream size has obvious drawbacks. On theother hand, it is the only standardized measurement available, and until more appropriate data is collected, can serve as a starting point for stream size determination.
Two estimates of stream length are available. The 1978 Army Corps of EngineersHeadwater Survey and Maps study combined length and flow to arrive at size estimates.The 1978 Timbol and Maciolek report estimated total length of the perennial sectionsof channelized streams. These studies had limitations such that no attempt was made tocategorize streams by length. However, the information is provided in the database.
Future Research
It may be time to re-evaluate the surface water monitoring program in Hawaii in light
of the 1987 Water Code. Besides needing flow information for management purposes,surface water may be the single most reliable indicator and predictor of climate change.
44

Considering prediction ofglobal climatic changes, expanded monitoring for this purposemght be a priority. This maybe facilitated possibly through the USGS Network Analysisprogram.
Data are not cheap. In 1989, it cost around $25,000 to install a new station. To rim itcost around $6,500 a year. Participation by all agencies with monitoring and management responsibility may maximize the monitoring dollar.
Both the State of Hawaii and the USGS are developing computerized GeographicInformation System, (GIS) capability and are compatible in their choice of ARC-INFOprogram. GIS is considered by many to be an ideal tool for managing water resources.
SourcesPublished and Unpublished Documents
Summary of Available Data on Surface Water. November. 1981. State of Hawaii, Volume1-Island of Kauai Open-File Report 81-1056. USGSJDLNR DOWALD Honolulu.
Summary of Available Data on Surface Water, State of Hawaii Volume 2-Oahu, Molokai,Maui and Hawaii Open-File Report 81-1056 USGS/DLNR DOWALD.
USGS Water Resources Data, Water years 1970, 1979, 1987, and summary of 1950.(Reports Published Annually).
USGS. 1985. Cost Effectiveness of the Stream-Gaging Program in the Hawaii District,USGS Water Resources Investigation Report 84-4126.
USGS Open Files (unpublished computer files of gaging station records).
USGS, Station List, F.Y. 1988-89,1989 (unpublished).
Maps
Hirota, Sam 0. Inc. 1978. Determination of Headwaters for Oahu and Kauai with maps.U.S. Army Corps of Engineers, Honolulu.
M&E Pacific. 1978. Determination of Headwaters of Streams on Hawaii, Molokai andMaui with maps. US. Army Corps of Engineers, Honolulu.
Personal Communications
Matsuoka, Iwao. 1989-90. USGS.Meyer, Bill. 1989-90. USGS.Nakahara, Richard. 1989-90. USGS.
45

Table 8 Gaging Records(By Island, by Code)
CODE Gage is associated ‘with stream with this QUAL USGS ement of quality of recordsHSA code DATA
NAME USGS Station Name DRAIN Drainage area above gage (sq. mi.)
GAGE # USGS number of gage station. If all zeros, DiV Diversions per USGSmedian and average are Y Diversion is present above gagecalculated flows. N No diversion is present above gage
D Gage is on a ditchACT- A - Active in January, 1991lyE TYPE Type of data collected
DATAMED- Flow at gaging station exceeded 50% of c Continuous recordIAN time in cubic feetJsecond (cfs) E Extreme flows only, low and/or peak
AVE. Average of yearly mean flow in cubic C-E Converted from continuous to extreme
DAr’E . L Lowflowfeet/second (cfs) at gaging station Peak flow
YRS Years of record, 19.-19.. new New gage 1988 - continuous record
REC
Note: cfsxO.646 = MGD
CODE NAME GAGE #ACT- MED. AyE- YRS QUAL DRA.. DIV
Kaual2-1-04 Kalalau Str. nr Hanalci 117000 5.2 6.89 I 31-55 N C2-1-07 Hanakoa Str. nr Hanalei 116000 1.8 5.51 31-52 N C2-1-10 Hanakapiai Str. nr Hanalei 115000 8.4 16.90 31-52 N C2-1-14 Wainiha R. nr Hanalei 108000 A 79.0 138.00 52- G 1020 N C2-1-14 Wainiha Canal at intake ar Wainiha 110000 10-16 E2-1-14 Wainiha R. nr Wainiha 113000 12-16 N E2-1-15 Lumahai R. nr Hanalci 106000 67.0 117.00 14-33 7.50 N C2-1-18 Waioli Str. nr Hanalei 105000 20.0 31.60 14-33 N C2.1-19 Hanalei Ditch Kilauea 099500 56-62 D C2-1-19 Hanalei Tunnel outlet ar Lihue 100000 2&0 27.30 32-85 G D C2-1-19 Hanalei at alt. 625 ft nr Hanalci 101000 49.0 83A0 14-55 Y C., , Combined records of sttaions
-
16100000, 161010002-1-19 China Ditch ar Hanalci 102000 29.0 27.20 11-80 D C-L2-1-19 Hanalei R. nr Hanalei 103000 A 130.0 212.00 12- G 19.10 Y C2.1-19 Kuna Ditch nr Hanalei 104000 12-19 1) E2-1-19 Hanalci R.. at Hwy 56 bridge nr Hanalci 104200 A 62- Y P2-1-25 Kalihiwai R. nr Hanalei 098000 32.0 47.70 14-23 N C2-1-26 Puukumu Str. nr Kilauca 097900 A 64- N P2-1-28 Puu Ka Ele Ditch nr Kilauea 095000 34 32-67 D C2-1-28 Ross Ditch nr Kilauea 095200 3.1 56-67 D C
2-1-28 Kalihiwai Ditch above wasteway nr 0959(J() 4.3 60-68 D C
2-1-28 Kilauea 096000 — j.
____
34-67 — — D •.._
46

CODE NAME GAGE# ACE- ME)- AVE.. YRS QUAL DRA- DW TYPEWE IAN RAGE REC DATA IN DATA
2-1-28 Pohakuhono Str. nr Kilauca 097000 3.5 821 34-67 G 1.80 Y C2-1-28 Hanaulani Str. nr Kilauca 097300 2.7 57-72 N C2-1-28 Halaulani Str. at alt. 400 ft nr Kilauca 097500 A 7.2 11.50 57- G 1.90 N C2-2-01 Anahola Str. nr Kalia 089000 9.7 22.40 10-85 P 4.27 N C2-2-01 Anahola Str. at Anahola 093200 15.0 34.20 62-82 F 924 Y C
Combined records of 16(fl9000,16080000 . -
2-2-04 Kapaa str. nr Kealia 078000 27.0 36.10 10-20 Y C2-2-04 Kapaastr. at Kapahi Ditch intake or 080000 A 5.9 21.50 36- Y C-E
2-2-04 KapaaStr. at old Hwy crossing 084500 A 62- N P2-2-04 Kapahi Ditch nr Kealia 079000 A 4.5 6.16 09- G D C2-2-04 Kaneha Ditch ar Kealia 081200 A 64- Y P2-2-06 Konohiki Sty. nr Kapaa 073500 A 64- Y P2-2.0& Wailua K. System 000000 110.0 238.562-2-08 Wailua K. or Kapaa 071800 A 62- P2-2-08.01 Left branch Opaekaa nr Kapaa 071500 A 1.8 2.56 60- G 0.65 N C2-2-08.02 N. Fork Wailua K. at alt 650 ft nr Lihue 063000 50.0 73.10 14-85 G 5.29 Y C2-2-08.02 B. branch of N. Fork Wailua K. r 068(X)0 A 32.0 48.00 12- G 6.27 N C2-2-08.02 N. Fork Wailua K. or Lihue 0700 10-14 Y E2-2-08.02 N. Fork Wailua R. nrKapaa 071000 A 73.0 122.00 52- G 17.90 Y C2-2-08.03 S. Fork Wailua K.. Lihue 060000 A 36.0 114.00 11- G 22.40 Y C2.2-08.03 S. Fork Wailua K. or rock quarry or 058500 74- Y L2-2-15 HuIela Str. nr Llhue 055000 A 10.0 28.00 12- G 17.60 Y C-P2-2-15 Kamooloa Str. or Puhi 053800 0.6 17.00 63-71 G 5.94 Y C2-2-15 Kuia Str. nr Puhi 054500 3.5 63-66 Y C2-2-15 Kamooloa Str. or Puhi 053800 0.6 17.00 63-71 G 5.94 Y2-3-04 Lawai Str. nr Koloa 052500 A 3.0 49- Y C-P2-3-04 Hanapepe R. at Hanapepe 052000 A 49- y p2-3-07 B. Fork Koula K.nr Eleele 041000 11-15 Y E2.3-07 Koula K. at Koula or Eleele 047000 34.0 7430 10-16 Y C2-3-07 Hanaepe K. bekw Manuahi Str. or 049000 A 32.0 84.70 17- G 18.50 Y C
2.3-07 HanPc Ditch at Hanapepe FaUs or 042000 11-15 D E2-3-07 Hanapepe Ditch below intake or Eleele 043000 42.50 30-38 D C2-3-07 Hanapcpe Ditch at Koula ar Elcele 044000 38.50 10-49 D C2-4-04a Waimea R. System 000000 63.0 253.002-4.04 WaiakoaliStr.nrWaimca 011000 3.5 8.88 09-80 N C-L24-04 Kokee Ditch or Waimea 014000 20.0 24.20 26-82 G D C2-4-04 Kauaikioana Str or Waimea 012000 22 624 19-80 N C-L24-04 Waimea K. at alt 3,420 ft or Waimea 016000 19.0 44.90 16-68 Y C24-04 Waialae Sty. at alt 800 ft or Waitnea 019000 A 6.7 21.80 20- G 1.79 N C24.04 Waialac Sty. or Waimea 020000 9.9 10-16 N C24-04 Waialae Sty, at alt 800 ft or Waimea 021000 16.0 16-21 N C24-04 Waimea K. below Kekaha Ditch intake 028000 1.4 67.90 21-69 Y C
2.4-04 Waimea K. near Waimea 031000 A 15.0 124.00 10- G 57.80 Y CCombined records of stations (fflflj fl 1 Y C16031000, 16036000 U.).LUJJ. JU.U
24-04 Waimea K. at Waimea 038000 A 43- Y P24-04 Kekaha Ditch at Camp 1, or Waimca 022000 55.0 57.10 09-68 D C24-04 Kckaha Ditch below tunnel 12 or onooo — 51.0 50.00 08-34 D C
47
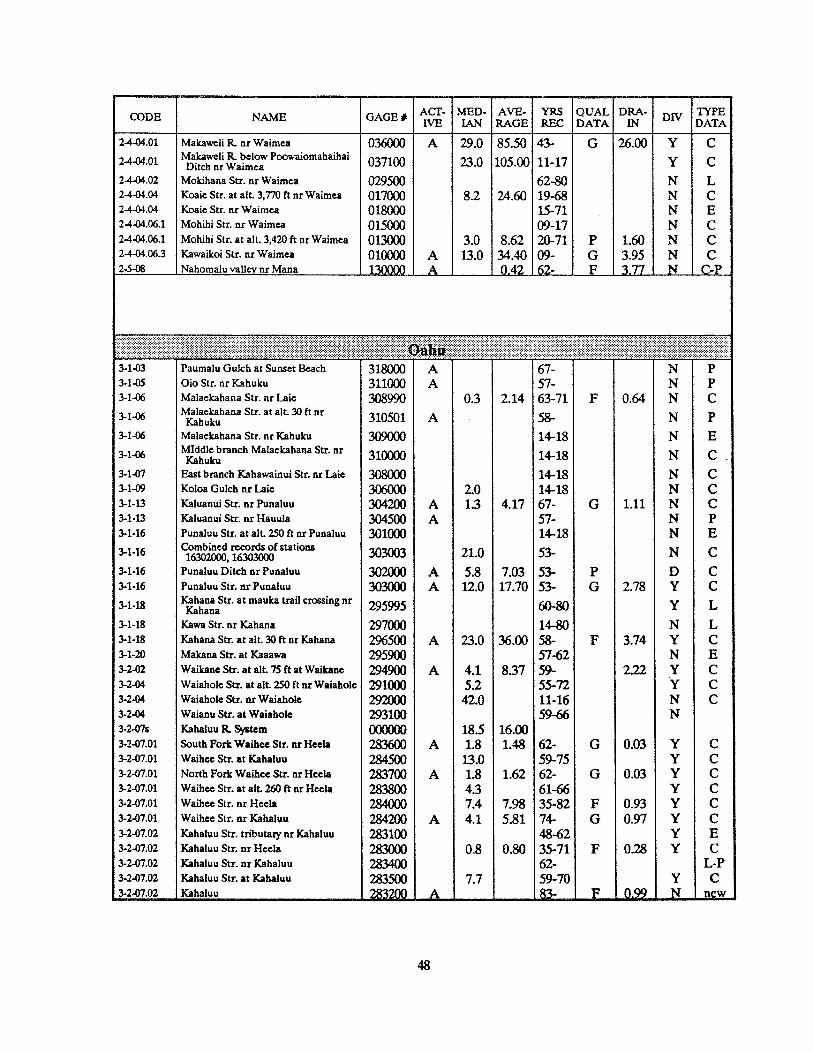
ACr- MED. AyE- YRS QUAL DRA- DWCODE NAME GAGE # WE IAN RAGE REC DATA IN DATA
2-4-04.01 Makawei R. nr Wainiea 036000 A 29.0 85.50 43- 0 26.00 Y C2-4.04.01 Makaweli R. below Poowaiomahailiai 037100 23.0 105.00 11-17 Y CDitch or Waimea24-04.02 Mokihana Str. or Waimea 029500 62-80 N L2-4-04.04 Koaie Str. at alt. 3,770 ft or Waimea 017000 8.2 24.60 19-68 N C24-4)4.04 Koaie Str. nr Waimea 018000 15-71 N E2-4-04.06.1 Mohihi Str. or Waimea 015000 09-17 N C2.4.04.06.1 MohihiStr.atalt.3,42OftnrWaimea 013000 3.0 8.62 20-71 P 1.60 N C2-4-04.06.3 KawaikoiStr.nrWaimea 010000 A 13.0 34.40 09- G 3.95 N C2.5.08 Nahomalu valley or Mana 130000 ._A.. 0.42 2:..... .IZL ..IL. ..f..
3-1-03 Paumalu Gulch at Sunset Beach 318000 A 67- N P3-1-05 Olo Str. nr Kahuku 311000 A 57- N P3-1-06 Malaekahana Str. or I.aie 308990 0.3 2.14 63-71 F 0.64 N C3-1-06 Malaekahana Str. at aft. 30 ft or 310501 A 58- N P3-1.06 Malaekahaia Str. nr Kahuku 309000 14-18 N E
MIddle branch Malaekahana Str. orKahuku
3-1.07 East branch Kahawainui Str. nr Laic 308000 14-18 N C3-1.09 Koloa Gulch or Laie 306000 2.0 14-18 N C3.1-13 KaluanuiStr.nrPunaluu 304200 A 1.3 4.17 67- G 1.11 N C3-1.13 Kaluaoui Str. or Hauula 304500 A 57- N P3-1-16 Punaluu Str. at alt. 250 ft or Punaluu 301000 14-18 N E
Combined records of Stations- 16302000, 16303000
3.1.16 Punaluu Ditch or Punaluu 302000 A 5.8 7.03 53- P D C3-1.16 Punaluu Str. nr Punaluu 303000 A 12.0 17.70 53- G 2.78 Y C3-1-18 KahanaStr. at mauka trail crossing or Y L3.1-18 Kawa Str. or Kahana 297000 14—80 N L3-1-18 Kahana Str. at alt. 30 ft or Kahana 296500 A 23.0 36.00 58- F 3.74 Y C3-1-20 Makana Str. at Kaaawa 295900 57-62 N E3-2-02 Waikane Str. at alt. 75 ft at Waikaae 294900 A 4.1 8.37 59- 2.22 Y C3-2.04 Wajahole S&r. at alt. 250 ft nrWaiahole 291000 5.2 55-72 Y C3-2-04 Waiaholc Str. nrWaiahole 292000 42.0 11-16 N C3-2-04 Waianu Str. at Waiaholc 293100 59-66 N3-2.07s Kahaluu R. System 000000 18.5 16.003.2.07.01 South Pork Waihec Str. or Hecla 283600 A 1.8 1.48 62- G 0.03 Y C3-2.07.01 Waihee Str. at Kahaluu 284500 13.0 59-75 Y C3-2.07.01 North Pork Waihee Str. or Heels 283700 A 1.8 1.62 62- G 0.03 Y C3-2.07.01 Waihec Str. at alt. 260 ft or Heels 283800 4.3 61-66 Y C3-2.07.01 Waihcc Str. or Heela 284000 7.4 7.98 35-82 F 0.93 Y C3-2.4)7.01 Waihee Str. or Kahaluu 284200 A 4.1 5.81 74- G 0.97 Y C3-2-07.02 Kahaluu Str. tributaiy or Kahaluu 283100 48-62 Y E3-2-07.02 Kahaluu Str. or Heela 283000 0.8 0.80 35-71 F 0.28 Y C3-2.07.02 Kahaluu Str. or Kahaluu 283400 62- L-1’3-2.07.02 Kahaluu Str. at Kahaluu 283500 7.7 59-70 Y C3-2-07.02 Kahaluu 283200 _j_ — — F 0.99 ew
48

Acr- MED- AVE. YRS QUAL DRA- DW TYPECODE NAME GAGE#
WE IAN RAGE REC DATA IN DATA
3-2-07.03 Ahuimanu Str. nr Kahaluu 283480 A 62- N L—P3-2-08 Haiku Str. nr Heeia 275000 A 1.6 2.12 14- F 0.97 Y C3-2.08 Hecia Str. at Kaneohe 279500 A 65-80 P3-2-08 Iolekaa Str. mauka ‘ix Hecia 278000 0.5 0.64 40-70 F 0.29 Y C3 2-09 Keaahala Str. at Kamehameha
Hwy at Kaneohe
3 2 10 Kamooalii Str. below Kuou Str. ‘ix- Kaneohe - -
3-2-10 Luluku Str. at alt. 220 ft nr Kaneohe 270900 A 1.6 60- F 0.44 Y C-P3-2-10 StL 272200 A 6.4 10.50 76- G 3.81 Y C3-2-10 Kamooalii Str. at Kaneohe 273900 11.0 14.00 59-79 F 4.38 Y C3-2-10 Kaneohe 273950 A new3-2-10 Kaneohe 265600 A 83- F 1.11 new3-2-11 Kawa Str. at Kaneohe 265000 A 14- P3-2-13 Kawainui canal at Kailua 264800 A 56- P3-2-13 Makawao Str. nr Kailua 254000 4.94 12- G 2.04 Y3-2-13 Maunawili Str. nr Kailua 260000 12-16 Y E3-2-13 Maunawili Str. at Hwy 61 nr Kailua 260500 A 8.7 22- Y C-P3-2-13 Maunawili Dictch nr Waimanalo 250000 2.8 54-68 D C3-2-13 Makawao Str. ‘ir Kailua 254000 A 2.6 4.93 12- G 2.04 Y C3 2 14 KaWaInUU swamp drainage canal at E-
- Kailua Road at Kailua
3-2 14 Kawainui swamp canal at Wanaao 2 E- Road at Kailua
3-2-IS Waimanalo Str. at Waimanalo 249000 A 1.7 67- Y C-P3-3-03 Kuliouou valley at Kuliouou 247900 A 57- N P
Wailupe Gulch at Ama 247500 A 57- N P
3-3-06 Waialacnui Gulch at Honolulu 247200 57-68 N E3-3-07.01 East Manos Dich nr Honolulu 239500 1.0 15-39 D C3-3-07.01 Waiakeakua Str. at Hpnolulu 240500 A 3.6 5.01 13- F L06 Y C
3-3-07.01 at College olHawaii 242000 7.1 09-18 Y C
3-3-07.01 Manoa-Palolo drainage canal at 247100 A 67- N P
3-3-07.01 Waihi Str. at Honolulu 238500 1.7 359 13-83 F 1.14 Y C3-3-07.01 Pukcle Str. ‘ix Honolulu 244000 0.8 1.93 26-82 P 1.18 N C3-3-075 Ala WaiSystem 000000 55 10.603-3.07.01 Manoa 239000 4.78 1.00 C3-3.07.01 Manoa 240000 3.99 1.14 C3-3-07.01.1 Waiomao Str. ‘ix Honolulu 246000 0.5 L86 11-71 F 1.04 Y C3-3-07.01.1 Pablo Str. ax Honolulu 247000 1.8 5.64 52-79 P 3.63 Y C3-3-09 Moole Ditch makai station nr Honoluli 231700 0.1 18-23 D C3-3-09 Waolani Str. at Honolulu 235400 A 57- Y P
NUUaflUStr.bCIOWYCSCWOIf2 232000 A 3.7 6.90 13- G 335 N C
3-3-09 Pauoa Str. at Honolulu 237500 A 57- N P3-3-12 Moanalua Str. ‘ix Tnplcr Hospital 228600 A 70- N P3-3-11 Moanalua Str. nrTxipler Hospital 228900 A 0.4 66- N C-P3-3-11 Kalihi Stx. ‘ix Honolulu 229000 A 3.0 6.59 13- G 2.61 N C3-3-11 Kalihi Str. at Kalihi 229300 A 3.9 1030 62- F 5.18 N C3-3-12 Moanalua Str. ‘ix Kaneohe 227500 68-78 C3-3-12 Moanalua SLr. tributary as Kaneohe 227700 68-78 C3-3-12 Moanalua Str. tributary ‘ix Aica 227900 72-78 E3-3-12 Moanalua Stt ‘is Honolulu 228000 A 3.26 26- N C-P3-3-12 cir nr WfYi A fR_ N P
49

CODE NAME GAGE I MED- AyE- YRS QUAL DRA- TYPEWE IAN RAGE REC DATA IN
DIVDATA
3-3-123-4-02
3-4-0234-023-4-043-4-043-4-043-4-053-4.063-4.0634-103-4-103-4-103-4-103-4-103-4-103-4-113-5-013-5-043-5-053-5-053-5-073-5-073-5-083-6-043-06s3-6-063-6-06.013-6-06.01
3-6-06.01
3-6-06.01
3-6-06.02i
3-6-06.02.1
3-6-06.02.1
3-6-06.02.1
3-6.06.02.2
3-6-06.02.2
3-6-06.02.2
3-6-06.02.2
3-6.07i3-6-07.013-6-07.013-6-07.02
3-6-083-08
3-6-10
3-6-10
3-6-10
Moanalua Str. at alt. 100 ft nr HonoluluNorth Halawa Str. nr AieaHalawa Str. at AicaHalawaPearl Harbor springs at KalauaoKalauao Str, at AieaKalauao Str. at Moanalua Road at AieaWaimalu Str. nr AieaPearl Harbor springs at WaiawaWaiawa Str. nr Pearl CityWaikele Str. at Wheeler FieldWaikele Str. at WaipahuWaikakalaua Str. nr WahiawaHuliwai Gulch nr Kunia CampKipapa Str. nr WahiawaKipapa Str. nr WaipahuHonouliuli Str. nr WaipahuNanakuli SLr. nr NanakuliMailiili Str. nr WaianaeKaupuni SLr. at alt. 374 ft nr WaianaePuea Mauka Ditch nr WaianaeMakaha Str. nr MakahaMakaha Str. at MakahaMakua Str. nr MakuaMakaleha Str. nr WaialuaKiikü SystemKaukonahua Str. at WaialuaPoamoho tunnel nr WahiawaPoamoho Str.nr WahiawaCombined records of stations
16210900, 16211000Poamoho Str. at WaialuaNorth Fork Kaukonahua Str. aboveright branch nr Wahiawa
Right branch of North forkKaukonahua Str. nr Wahiawa
Mauka Ditch nr WahiawaNorth Fork Kaukonahua Str. nrWahiawa
South Pork Kaukonahua Str. nrWahiawa
South Fork Kaukonahua str. at eastpump reservoir nr Wahiawa
Right branch of South ForkKaukonahua Str. nr Wahiawa
South Fork Kaukonahua Str. aboveWahiawa reservoir nr Wahiawa
Paukaulla SystemOpaeula Str. ar Wahiawa
Opaeula Str. nr HaleiwaHelemano Str. at Haleiwa
Anahulu R. nr HaleiwaAnahulu R. tributary nr HaleiwaWaimea Gulch nr Kawailoa CampKamananui Str. at Pupukea militaryRoad nr Maunawai
Kaiwikoete Str. tributary nr Maunawai
228500226000227000226200224000225000224500223000214000216000212601213000212700212750212800212900212500212300212200211800211850211600211700211500211300000000210500210900211000
211003
211200
200000
201000
203000
204000
206000
208000
208500
209000
000000345000350000343000340000340500331000
325000
A
AA
AAAAAAAAA
AAAA
AAAA
A
A
A
A
AA
A
A
A
0.3 4.823.8
25.0 24.401.90.21.3
19.0 18.407.3 32.60
25.0 37.60
2.6 10.60
030.50.5 L88
14.9 32.00
1.0 4.851.5 4.07
7.7 16.30
4.9 11.30
3.8
13.0
5.7 11.70
8.8 2120
0.7 2.03
13.0
4.5 24.304.3 13.50
0.2 10.80
3.3 10.10
57-6829-53-8083-31-53-5757-8252-31-8052-59-51-57-73-57-.66855.67-57-60-8060-6759.66-57-57.
67-58-7947-74
58-74
67-
13-
13-80
47-68
46-68
13-57
57.
57-72
46-58
59-55-67-8257-67-7167-
60-67-71
G 3.45
F 4.01
G 26.40
G 45.70
G 4.29
G 2.31
GG 1.79
G 138
G 4.04
F 0.86
G 2.98
P 14.20
F 3.13
NNY
YY
Y
YYNNYYNNYDNYNN
YDY
NY
N
N
D
Y
N
N
Y
Y
NYYYYN
N
N
EC
c-PC
C-LCP
c-PC-LCPCPPCCPPP
c-PCcPP
c-P
PCC
CP
C
C-L
C
C
C
C
C
C
CPCPEP
C
c-
50
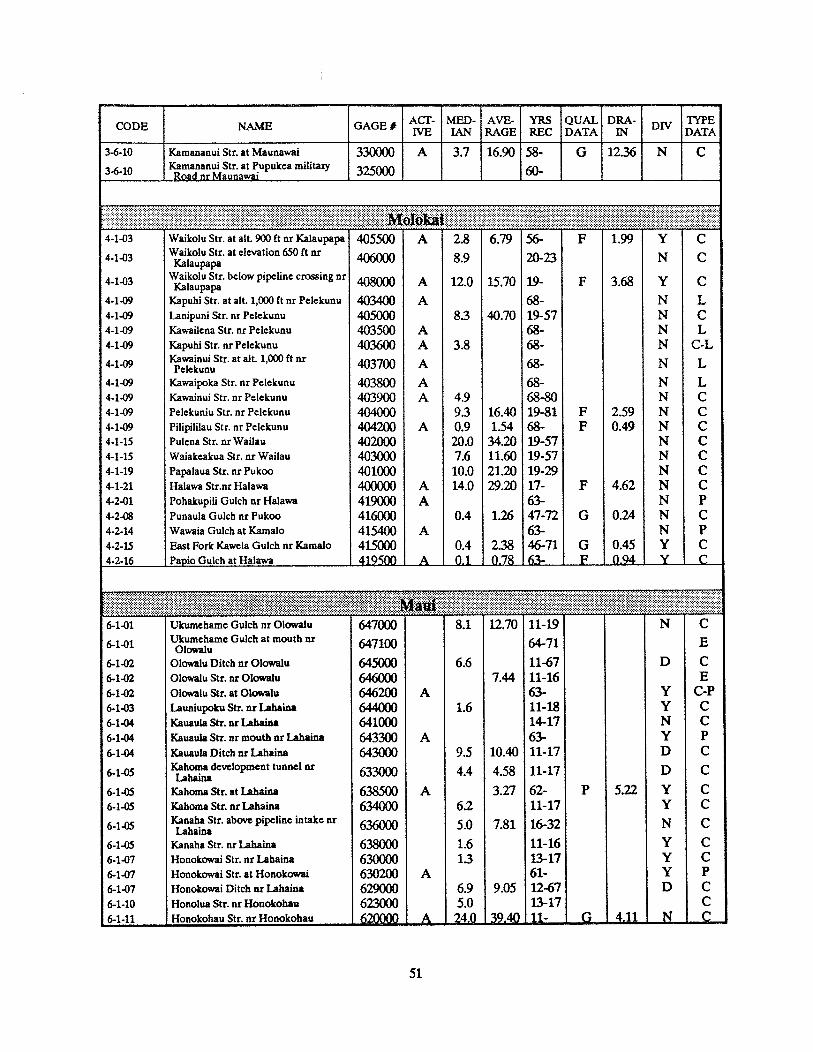
CODE NAJ4E GAGE #ACE- MED. AVE- YRS QUAL DRA- DWEVE LAN RAGE REC DATA IN DATA
3-6-10 Kamananui Sir. at Maunawai 330000 A 3.7 16.90 58- G 12.36 N CKamananui Sir. at Pupukea nlilita!y 325000 60-3-6-10 Road nr Maunawai
4-1-03 ‘Waikolu Str. at alt. 900 ft nr Kalaupapa 405500 A 2.8 6.79 56- F 1.99 Y C44-03 Waikolu Sir. at elevation 650 ft nr 44)(()()() 8.9 20-23 N C
4-1-03 below pipeline crossing nr 408000 A 12.0 15.70 19- F 3.68 Y C4-1-09 Kapuhi Str. at alt. 1,000 ft nr Pelekunu 403400 A 68- N L4-1-09 Lanipuni Sir. nr Pelekunu 405000 8.3 40.70 19-57 N C4-1-09 Kawailena Str. nr Pelekunu 403500 A 68- N L4-1-09 Kapuhi Sir. nr Pelekunu 403600 A 3.8 68- N C-L4 1-09 KaWaHIUI Sir. at alt. 1,000 ft nr N L
- Pelekunu4-1-09 Kawaipoka Str. nr Pelekunu 403800 A 68- N L4-1-09 Kawainui Str. nr Pelekunu 403900 A 4.9 68-80 N C4-1-09 Pelekuniu Sir. nr Pelekunu 404000 93 16.40 19-81 F 2.59 N C4-1-09 Pilipiliiau Sir. nr Pelekunu 404200 A 0.9 1.54 68- F 0.49 N C4-1-15 Pulena Str. nr Wailau 402000 20.0 34.20 19-57 N C4-1-15 Waiakeakua Sir. nr Wailau 403000 7.6 11.60 19-57 N C4-1-19 Papalaua Sir. nr Pukoo 401000 10.0 21.20 19-29 N C4-1-21 Halawa Str.nr Halawa 400000 A 14.0 29.20 17- F 4.62 N C4-2-01 Pohakupili Gulch nr Halawa 419000 A 63- N P4-2-08 Punaula Gulch nr Pukoo 416000 0.4 1.26 47-72 G 0.24 N C4-2-14 Wawaia Gulch at Kamalo 415400 A 63- N P4-2-15 East Fork Kawela Gulch nr Kamalo 415000 46-71 Y C4-2.16 Panlo Gulch at Halawa 419500 63- Y C
0.4 238A 01 0.7R
GF
0.450.94
6.67.44
6-1-01
6-1-026-1-026-1.026.1.036-1-046-1-04
6-1.04
6-1-05
6-1.056-1-05
6-1-05
6-1-056-1-076-1-076-1-076-1-106-1-11
D
Ukumehame Gulch at mouth nrOlowalu
Olowalu Ditch nr OlowaluOlowalu Sir. ur Olowalu
Olowalu Sir. at OlowaluLauniupoku Sir. nr Lahaina
Kauaula Str. ar Lahaina
Kauaula Sir. nr mouth nr Lahaina
Kauaula Ditch nr LahainaKahoma development tunnel arLahaina
Kahoma Sir. at L.ahainaKahoma Str. nr LahainaKanaha Str. above pipeline intake nrLahaina
Kanaha Sir. nr I.abaina
Honokowni Str. nr Lahaina
Honokowai Str. at HonokowaiHonokowai Ditch nr Lahaina
Honolua Str. nr HonokohauT4nncknhau Sir. nr Hnnokohau
647100
645000646000646200644000641000643300643000
633000
638500634000
636000
638000630000630200629000623000
A
A
A
A
A
64-71
11-6711-1663-11-1814-1763-11-17
11-17
62-11-17
16-3211-1613-1761-12-6713-17ii-
1.6
9.5
4.4
62
5.0
1.613
6.95.0240
E
CE
C-PCCPC
C
CC
C
CCPCCC
10.40
4.58
3.27
7.81
9.05
3Q44.)
YYNYD
D
YY
N
YYYD
N
P
G
5.22
4.11
51

CODE NAME GAGES Acr- MED- AVE- ‘IRS QUAL DRA- TYPEWE IAN RAGE REC DATA IN DATA
6-1-11 Honokohau Ditch intake nr 621000 36.6 34.10 07-13 D CHonokohau6-2-01 Poelua Gulch nr Kahakuloa 619700 A 64- P6-2-03 Kahakuloa Str. nr Honokohau 618000 A 8.9 17.30 39- F 3.47 N C6 2-06 Left branch Makamakaole Str. nr
Waihee 617000 1.7 2.88 3952 Y C6-2-07 Waihec R. nrWaihee 612000 13-17 C6-2-07 Waihee Rat dam nrWaihec 614000 A 59 84 83- F 4.20 Y new6-2-08 North Waichu Ditch nr Wailuku 609000 10-17 D E6-2-08 South Waichu Str. nr Wailuku 610000 10-17 Y C6-2-09 IaoStr.nrWailuku 604000 10-15 N E6-2-09 Tao 6045(J0 A 43 65 83- F 5.98 Y new6-2-09 lao Str. at Wailuku 607000 A SO- Y P6-2.10 Waikapu Str. nr Waikapu 650000 6.71 10-17 Y E6-2-10 Waikapu Str. nr Kihei 650500 A 63- Y P6-2-10 South side Waikapu Ditch nrWaikapu 648000 6.8 7.55 10-17 1) C6-2-10 Pablo Ditch nr Waikapu 649000 3.4 3.42 10-17 D C6-3-01 Unnamed Gulch at Maliko Bay 603300 A 62- N P6-3-03 Awalau Gulch at Kailiij 602400 2.7 3.56 65-71 G 0.23 C6-3-07 Halehaku Gulch nrKailiili 596200 0.5 LO0 65-71 G 0.13 N C6-3-07 OpanaTunnelnrKakipi 599500 A 2.0 3.12 65- G D C6-3-07 Kauhikoa Ditch at Opana wer nr 602000 10.0 22.70 10-28 D CHuebo6-3-07 Opana Str. nr Huelo 601000 10-16 N E6-3-08 Honopou Str. nr Huebo 587000 A 2.5 4.69 10- G 0.64 N C
Honoi,ou Str. below Haiku Ditch nr6-3-08 Huefo 595000 1.2 7.94 3247 Y C
6-3-08 Honopou Str. at Lowrie Ditch siphon 591000 0.2 2.09 32-47 Y Cnr HueboHonopou Str. aboc Haiku Ditch nr6-3-08 Huefe 593000 0.7 2.43 3247 Y C
6-3-09’ Hoolawanui Strnrfluelo 585000 5.6 11.90 10-71 G 134 N C6-3-09 Hoolawaliilii Str. nr Huelo 586000 7S3 11-57 055 N C6 3-14 Kailua Str. at Haiku-uka boundazy fly 574000 03 6.13 18-34 N CKafizili6-3-14 Kailua Str. nr Hucbo 577000 9.8 29.60 10-58 N C6-3-14 Kailua nr Kailiili 574500 1.1 6.83 63-71 G 1.10 N C6-3.14 East branch Kailua Str. nr Kailiili 576200 63-68 N E6-3-14 Oanui Str. nr Huelo 580000 10-16 N E6-3-15 Nailiulihaelc Str. nr Kailiili 569100 63-68 N E6-3-15 Nailiilihaete Sty. nr Huebo 570000 17.0 3550 10-75 0 3.49 Y C6-4-01 Oopuola Str. nr Hucbo 566000 12 2.74 30-57 N C6-4-01 Oopuola Str. above spreckels Ditch 567000 2.5 38.40 10-15 Y Ccrc*ssing nr Huelo6-4-01 Kaalca Gulch nr Huebo 565000 2.9 7.23 21-62 N C6-4-04 Waikamoi Str. nr Huclo 556000 93 28.20 10-22 Y C6-4-04 Waikamoi Str. at Puu Luau nr Olinda 552600 49-66 N C6-4-04 Waikamo Sty. obove reservoir at KuLa 55)() 0.1 53-68 N CPipeline intake near Olinda
64-04 Waikamoi Sty. below reservoir at Kula y EPipeline intake ar OlindaWaikamoi Sty, at Haiku-uka boundasy 554000 23 1260 18-34 Y C64-04
6-4-04 East branch Waikamoi Sty. at Haiku- 554500 1.5 424 18-33 Y Cuka boundaiy ar KailiiliWaikamoi Sty. above Waioa Ditch iir 555000 8.0 25.50 22-57 Y C6-4-04 Huebo
64-04 AloSttnrHuebo 5570(1) — i 75R 10-57 N C
52
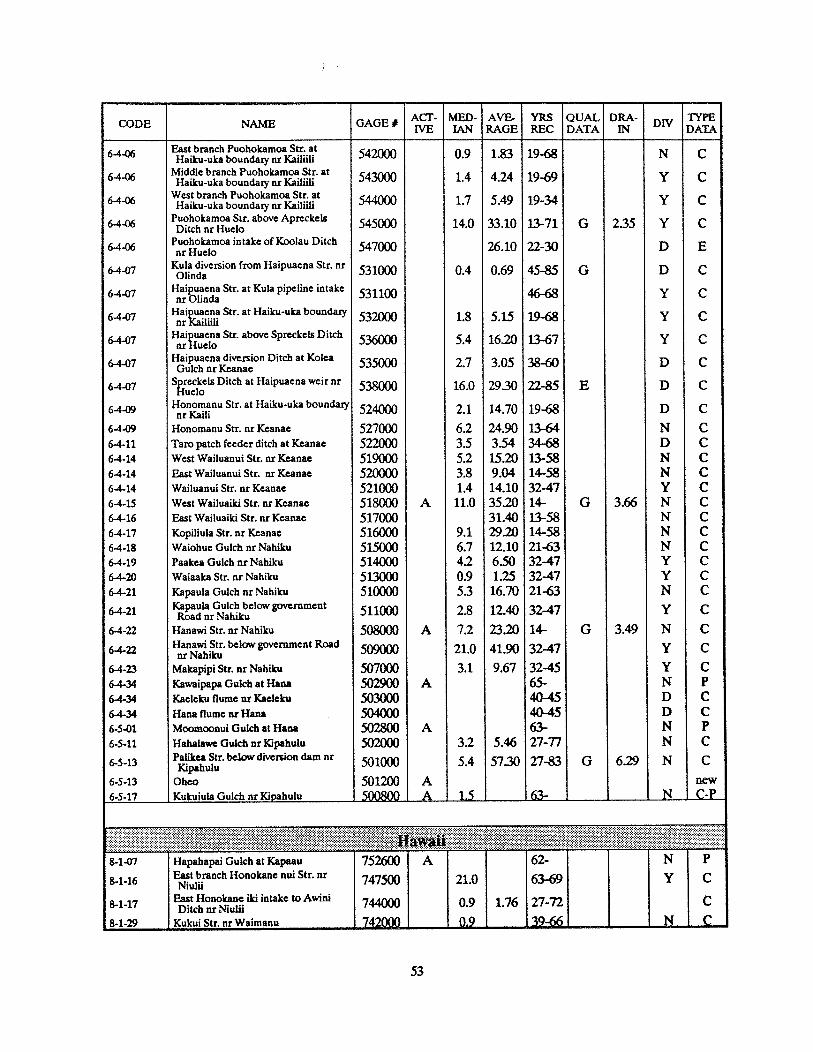
1
PO
•°
9=
9o
E
3c
cnn -I
0
•
—0
0C
r0
Ii
co
flJ
CI
C3
0C
00
C5
(3
9 —0
-.
0.
0
LA
LA
LA
LALA
LAL
AL
AL
AL
ALA
LA
LA
LALA
LALA
LAL
ALA
F.
—I-
..•
t’.)
--‘
I—.
e-
> •‘LA
(.J
LA
(C
\t.
)c..)
AI-.
Ab
bob
00
LA
b.
00
LA
LALA
.
,.%a.
..
cL
it’
.)-‘
L)
e:i
iLM
o
C)C)
C)C)
C)
0’
L
LAi
zzzzzzz<
<zzzz<
zzze
e<
<<
<z
OO
OIO
9O
I-
I.-
•t,
I—‘C
-0%
0%0%
0%0%
0%0%
0%0%
0%0%
0%0%
0%0%
0%0%
Q%0%
‘?‘
.k..
4..
Ll
VI
l.A
LAL
A
--
i-
‘C.-
I..)
l..)
I-I
-.-:-i
—rC
:o
CA
0
9i
0Z
,ro
!.;.
rr
30
-. p
0%0%
0%0%
0%
n 0
C z.<
z
ôeô
nO
ôrô
nO
rô
ôrO
nn
nô
nr
rnn
OO

CODE NAME GAGE# ACr- MED. AVE- YRS QUAL DRA. DIVWE IAN RAGE REC DATA IN DATA
Paopao Str. nr Waimanu 741000 1.1 333 39-52 N C8.1.31 Waiaalala Str. nr Wainianu 740000 0.6 1.10 39-52 N C8.1-32 Punalulu Str.nr Waimanu 739000 2.4 6.53 39-52 N C8-1-33 Kaimu Str. nr Waimanu 738000 32 8.68 39-52 N C8-1-35 Waiilikahi S. nr Waimanu 737000 4.3 10.00 39-60 N C8-1-44 Kawainui Sty. nr Kamuela 720000 A 4.3 1480 64- G 1.58 N C8-1-44 Alakahi Str. nr Kamuela 725000 A 3.1 6.88 64- G 0.87 Y C8-1-44 WailoaStr.nrWaipio 732200 51.0 75 01-69 Y C8-1-44 Kawaiki Str. nr Kamuela 720300 A 1.7 427 68- G 0.45 N C8-1-55 Honokala Gulch tributaty or Honokaa 717950 A 62- N P8-1-60 Ahualoa Gulch at Honokaa 717924) A 62- N P8-1-87 Keehia Gulch nr Ookala 717850 A 62- N P8-2-06 Manowaiopae Str. nr Laupahoehoe 717820 3.4 8.42 65-71 G 1.04 Y C8-2-16 Pohakupuka Str. nr Papaaloa 717800 A 7.7 27.10 62- G 2.76 N C-P8-2-37 Kapehu Str. nr Pepeekeo 717650 A 62- N P8-2-37 Kapehu Str. at Piihonua or Hilo 709000 50.90 28-37 4.84 N8.2-39 Alia Str. or Hilo 717600 A 12.0 62- N C-P8-2-47 Kalaoa Mauka Str. nr Hilo 717400 A 62- N new8-2-56 Honolii Str. or Hilo 716000 13.0 52.00 24-32 N C8-2.56 Honolii Str. or Papaikou 717000 A 38.0 125.00 11- F 1L60 N C8-2-60 Wail uku R. nr Pua Akala 701700 64-65 N C8-2.60 Wailuku R. at Hilo 713000 A 160.0 386.00 77- G 256.00 Y C8-2.60 Wailuku R. or Humuula 701750 2.82 65- G 34.80 N C8-2-60 Wailuku R. or Kaumana 701800 2.9 27.60 66- G 43.40 N C8-2-60 Wailuku R. at Pukaniaui nr Hilo 703000 26.7 9334) 23-40 Y C8-2-60 Wailuku R at Piihonua 704000 A 83.8 279.00 28- F 230.00 Y C8.2.61 Waiakea Str. nr Mountain View 700000 A 8.9 11.60 30- G 17.40 N C8.2.61 Wailoa R. at Hilo 701300 A 67- Y P8.2-61 Wailoa R. nr Hilo 701200 57-67 Y C8-3-01 Hilea Gulch tributaiy or Honuapo 764000 A 1.2 7.47 66- F 9.17 N C8-3-01 Hilea Gulch tributaiy no.2 or Hoauap 765000 3.00 66- G 1.86 N C84-01 Kiilac Sty. or Honaunau 759800 0.21 58- G 0.67 N C84.02 Right branch Waiaha Str. or Holualoa 759200 031 60- G 1.89 N C84-02 Waiaha Str. or Holualoa 759500 57-68 Y C84-02 Waiaha Str. at Luawai or Holualoa 759300 A 60- Y C-P8.5.03 Waikoloa Str. or Kamuela 757000 4.0 721 47-71 G 0.78 N C8-5-03 Waikoloa at marine dam or Kamuela 758000 A 4.2 9.00 47- 0 1.18 Y C8-5.03 Kohakohau Str. or Kamuela 756000 A 1.9 8.49 56- 0 2.51 Y C8-5-03 Hauani Gulch nr Kamuela 759000 _ — 1.61 56- 0 ..47
Note: Gaging records for stream and ditch gages are directlyassociated with a particular stream.See Table 12 Ditch Gages for a complete list of thoseassociated with Ditches.
54

Table 9 Stream Size(Limited to streams with gaging records)
CODE HSA code; island-hydrographic Stream sizes based on average or medianunit-stream(system) discharge.
STREAM Stream name at mouth Large Median flows greater than or equal tostreams 50 cfs or average flows equal or greater
# GAGE Number of gages on a stream than to 80 cfs.
AVER Average of yearly mean flow
Small Median flows less than or equal to 10MEDIAN Flow equalled or exceeded streams cfs or average flows less than or equal
50% of time to 20 cfs.
(iie: When a stream has more than one gaging station, the largestaverage and median flows were used. In some cases, tributary flows
were combined to arrive at main stem estimates. See Table 8. J
CODE] STREAM JGi3E CODE STREAM G3E ‘k’3-4-04 Kalauao 3 2440 25.0
Large 3-4-06 Waiawa 2 3260 7.3
2-1-14 — Wainiha R. 3’ 138.00 79.0 34-10 Waikele 6 37.60 25.0
2-1-15 Lumahai R. 1 117.00 67.0 36-06S Kiikii S. 13 32.00 14.9
2-1-19 Hanalei R. 8 212.00 130.0 3-6-07s Paukauila 3 24.30 4.5
2-2-08s Wailua S. 8 238.56 110.0 44.03 Waikolu 3 15.70 12.0
2-3-07 Hanapepe 6 84.70 32.0 4-1-09 Pelekunu 9 40.70 83
2-4-04s Waimea S. 21 253.00 63.0 4145 Wailau 2 34.20 20.0
6-2-07 Waihee 1 82 4- 1-19 Kawainui 1 21.20 10.0
6-2-09 Tao 1 65 43.0 4- 1-21 Halawa 1 29.20 14.0
8-1-44 Wailoa/Waipio 4 75 51.0 6-1-11 Honokohau 2 39.40 24.0
8-2-56 Honolii 2 125.00 38.0 6-344 Kailua 5 29.60 9.8
8-2-60 Wailuku R. 6 84 59.0 6-3-15 Niliilihaele 2 35.50 17.06-4-01 Oopuola 3 38.40 2.56-4-04 Waikamot 8 28.20 93
MedIum 6-4-06 Puohokamoa 5 33 10 140
_____ _____
6-4-09 Honomanu 2 24.90 62Waioh
6-4-15 W.Wailuaiki 1 35.20 11.0
2-2-01 Anahola 2 34.20 15.0 6-4-16 E. Wailuaiki 1 31.40
2-2-04 Kan 6 21.50 59 6-4-17 Kopiliula 1 29.20 9.1
6-4-22 Hanawi 2 41.90 21.02-2-15 Huleia 4 28.00 10.0
6-5-13 Oheo Gi 2 57.30 5.43-1-16 Punaluu 4 17.70 12.0
8-1-16 Honokane Nw 1 21.03-1-18 Kahana 3 36.00 23.0
8-2-16 Pohakupuka 1 27.10 7.73-2-04 Waiahole 2 42.03-2-07s Kahaluu S. 12 16.00 18.5 8-2-37 Kapehu 2 50.90
3-2-10 Kaneohe 6 14.00 11.0 8-2-39 Aba 1
_______
12.0
55

# AVER MED- # AVER MED.CODE STREAM GAGE AGE TAN CODE STREAM GAGE AGE JAN
6-1-07 Honokowai 3 13Small 6-1-10 Honolua 1 50
2-1-04 Kalalau 1 6.89 52 6-203 Kahakuloa 1 1730 8.9
2-1-07 Hanakoa 1 5.51 1.8 6-2-06 Makamakaole 1 2.88 1.7
2-1-10 Hanakapiai 1 16.90 8.4 6-2-10 Waikapu 4 6.71
2-1-28 Kilauea 7 8.21 3.5 6-3-03 KaupakulUa 1 3.56 2.7
2-3-04 Lawai 2 3.0 6-3-07 Kakipi 4 1.00 05
2-5-08 Nahomalu 1 0.42 03 6-3-08 Houopou 4 7.94 1.2
3-1-06 Malaekahana 4 2.14 2.0 6-3-09 Hoolawa 2 11.90 5.6
3-1-09 Koloa Gi. 1 13 6-4-07 Haipuaena 6 16.20 5.4
3-1-13 Kaluanui 2 4.17 4.1 6441 Piinu 1 3.54 3.5
3-2-02 Waikane 1 837 6-444 WailuanUi 3 1520 5.2
3-2-08 Heela 3 2.12 1.6 6448 Wthohue Gi. 1 12.10 6.7
6-4-19 Paakea 1 6.5 4.2-
- Maunawili 6-4-20 Waiaaka 1 125 0.9
3-2-15 Waimanalo 1 1.7 6-4-21 Kapaula 2 16.70 53
3-3-07s Ala Wai S. 10 10.60 5.5 6-4-23 Makapipi 1 9.67 3.1
3-3-09 Nuuanu 4 6.90 3.7 6-5-11 Hahalawe 1 5.46 32
3-3-11 Kalthi 3 10.30 3.9 6-5-17 Kukuiula 1 1.5
3-3-12 Moanalua 7 3.26 8-1-17 Honokane Iki 1 1.76 0.9
3-4-02 Halawa 3 3.8 8-1-29 Kukui 1 0.9
3-4-05 Waimalu 1 13 8-1-30 Paopao 1 3.33 1.1
3-5-05 Kaupuni 2 0.5 8-1-31 Waiaala12 1 1.10 0.6
3-5-07 Makaha 2 1.88 0.5 8-1-32 Punalulu 1 6.53 2.4
3-6-10 Waimea R. 5 16.90 3.7 8-1-33 Kalinu 1 8.68 32
4-2-08 Mapulehu 1 1.26 0.4 8-1-35 Waimanu 1 10.00 4.3
4-2-14 Kamalo 1 0.00 8-2-06 Manowaiopae 1 8.42 3.4
4-2-15 Kawela 1 2.38 0.4 8-2-47 Kalaoa 1
4-2-16 Papio 1 0.78 0.1 8-2-61 WailoaR. 3 11.60 8.9
6-1-01 Ukumehame 2 12.70 8.1 8-3-01 Hilea 2 7.47 1.2
6-1-02 Olowalu 3 6.6 8-4-01 KiiIae 1 021
6-1-03 Launiupoku 1 1.6 8-4-02 Walaba 3 031
6-1-05 Kahoma 5 3.27
_____
8-5-03 Waikolca 3 9.00 4.2
Discharge figures should be used with extreme caution. The USGSmonitoring program in Hawaii was and is not designed to determinegeneral stream characteristics or to calculate instream flow. Thereforeusing data from stations located above a diversion or on a tributary, orold records or records prior to diversion, will likely give an Inaccuratepicture of Instream flow. Using this sometimes inappropriate or inadequate data to estimate instream flow or arrive at relative stream size hasobvious drawbacks. On the other hand, it Is the only standardized measurement available, and until more appropriate data Is collected, canserve as a starting point for stream size comparison.
56

History of Continuous Gaging
Y ERR
Source: Cost Effectiveness of the Stream Gaging Program in the Hawaii Distrk, USGS, 1985.
Figure 124B
ILlI
U0
v-IU
I
2ø
I 6
1 2
80
40
aI 900 1910 1920 1930 1940 1950 1960 1970 1980 1990
57

Map2
Gag
ing
Sta
tion
s(1
988)
KA
UA
Io
i2
34
5M
ftE
S
I o2
46
KIL
OM
ET
ER
S
15945
15930
221
SI
15.
2.
00
EXPL
MAT
ION
.4G
AG
ING
AN
DW
AT
ER
QU
AL
ITY
(PE
RIo
DIc
TE
MPE
RA
TU
RE
)ST
AT
ION
*G
AG
ING
AN
DW
ATE
R—
QU
ALI
TY(C
HE
MIC
AL
,T
EM
PER
AT
UR
E)
PAR
TIA
L—
RE
CO
RD
STA
TIO
N
CR
EST
—ST
AG
EG
AG
EST
AT
ION
:G
AG
ING
AN
DW
ATE
R—
QU
ALI
TY(C
tIE
MIC
AL
,T
EM
PER
AT
UR
E,
SED
IME
NT
,M
ICR
OB
IOL
OG
ICA
L)
PAR
TIA
L-R
EC
OR
DST
AT
ION
2T
00
15945’
FIG
UR
E2.—
-LocA
TIo
Ns
OF
GA
GIN
G,
WA
TE
R-Q
UA
LIT
Y,
AN
DPA
RT
IAL
—R
EC
OR
DST
AT
ION
SO
NK
AU
AI
159
30
Sou
rce:
USG
SW
ater
Dat
aR
eport
HT
-88-
1

2V-
3a 21 15
158
15
15
815
FIG
UR
E14
•-—
LO
CA
TIO
NS
OF
GA
GIN
G,
WA
TE
R-Q
UA
LIT
Y,
AN
DPA
RT
IAL
-RE
CO
RD
STA
TIO
NS
ON
OA
HU
.
Gag
ing
Sta
tions
(198
8)15
74
5’
15
74
5
Mo
ko
p,
Fl
2 21 5V
Map2
15
80
0
Po,n
i
OA
HU
O1
23
4S
MIL
ES
II
I
O2
46R
ILO
ME
TE
RS
EXP1
PNAT
IOt
GA
GIN
GA
ND
WA
TER
—Q
UA
LITY
(PE
RIO
DIC
TE
IIPE
RA
TU
RE
)ST
AT
ION
GA
GIN
GA
ND
WA
TE
R-Q
UA
LIT
Y(C
HE
NIC
AL
,T
EM
PER
AT
UR
E)
PAR
TIA
L-R
EC
OR
DST
AT
!ON
j-G
AG
ING
AN
DW
AT
ER
-QU
AL
ITY
(CH
EM
ICA
L,
TE
MPE
RA
TU
RE
,SE
DIM
EN
T)
DA
ILY
AN
DPA
RT
IAL
-RE
CO
RD
STA
TIO
N
GA
GIN
GA
ND
WA
TE
R-Q
UA
LIT
Y(C
HE
IIIC
AL
,T
EM
PER
AT
UR
E,
AW
ASE
DII
1EN
T,
MIC
RO
BIO
LO
GIC
AL
)D
AIL
YA
ND
PA
RT
IAL
-•
REC
OR
DST
AT
ION
AC
RE
ST—
STA
GE
GA
GE
STA
TIO
N
ALo
w-F
Low
PAR
TIA
L-R
EC
OR
DST
AT
ION
WA
!A
N
Bo
rb.r
i
1 5800
I
_______
I
Sou
rce:
USG
SW
ater
Dat
aR
epor
tH
I-88
.-1
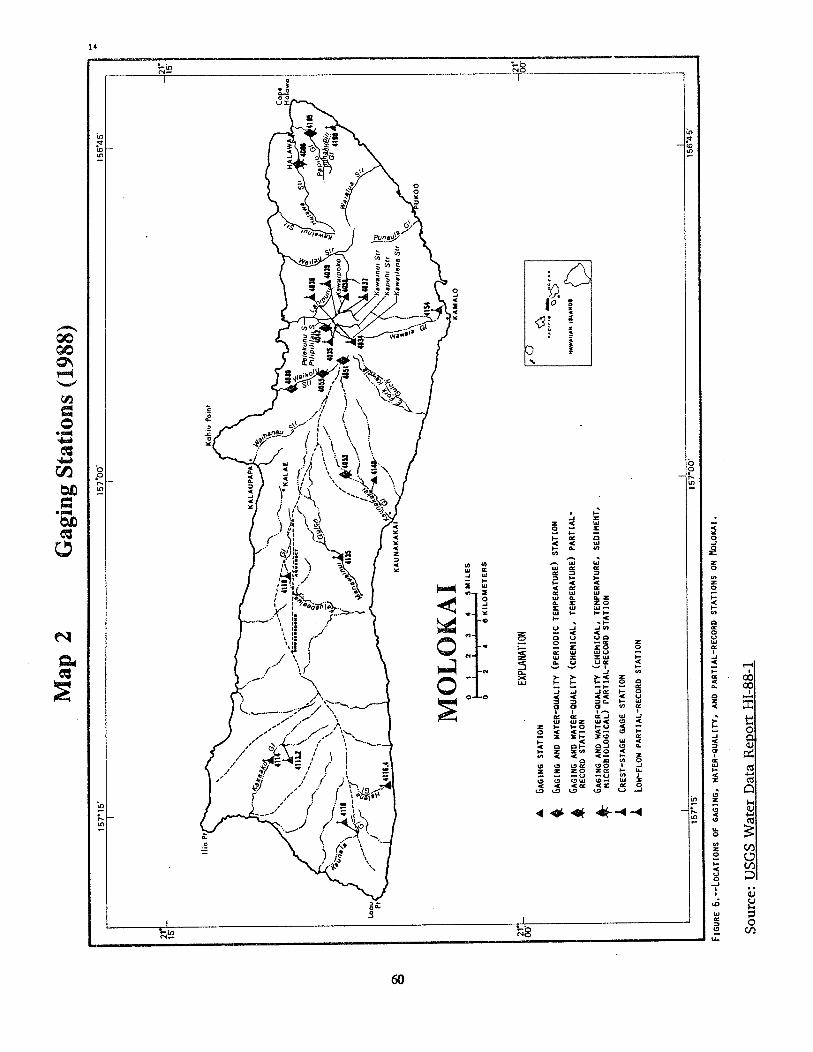
21 15
15
7’1
5
Map
2G
agin
gS
tati
ons
(198
8)1
57
00
15645
GA
GIN
GA
ND
WA
TE
R-Q
UA
LIT
Y(P
ER
IOD
ICT
EM
PER
AT
UR
E)
STA
TIO
N
GA
GIN
GA
ND
WA
TE
R-Q
UA
LIT
Y(C
HE
MIC
AL
,T
EM
PER
AT
UR
E)
PAR
TIA
L—
REC
OR
DST
AT
ION
GA
GIN
GA
ND
WA
TER
—Q
UA
LITY
(CH
EM
ICA
L,
TE
MPE
RA
TU
RE
,SE
DIM
EN
T,
MIC
RO
BIO
LO
GIC
AL
)PA
RT
IAL
-RE
CO
RD
STA
TIO
N
CR
EST
-ST
AG
EG
AG
EST
AT
ION
Kah
n,P
on
i
21 15
MO
LO
KA
I0
12
34
5M
ILE
SI—
•..
.I
I6K
ILO
ME
TE
FIS
&—
EXPL
ANAT
ION
AG
AG
ING
STA
TIO
N
1(00
A AL
ow—
FLow
PAR
TIA
L—
RE
CO
RD
STA
TIO
N
21
00
FIG
UR
E6.
——
L0C
AT
I0N
SO
FG
AG
ING
,W
AT
ER
-QU
AL
ITY
,A
ND
PAR
TIA
L—
RE
CO
RD
STA
TIO
NS
ON
NO
LO
KA
I.
15715
15
70
0I5
64
5’
Sou
rce:
USG
SW
ater
Dat
aR
epor
tH
I-88
-1

Map2
Gag
ing
Sta
tio
ns
(198
8)
15645
2V—
00’
,I.I
.Pt
15
0%20 45
Popow
ol
Pelt
MA
UI
O2
34
SM
ILE
SI
II
II
II
Io
24
6X
ILO
ME
TE
RS
2 2O 45
4 A
EXPL
ANAT
ION
GA
GIN
GA
ND
)IA
TER
—Q
UA
LITY
(PE
RIO
)IC
(EI4
PER
AT
UR
E)
STA
TIO
N
CR
EST
—ST
AG
EG
AG
EST
AT
ION
GA
GIN
GA
ND
WA
TE
R-Q
UA
LIT
Y(c
HE
IIIC
AL
,T
EM
PER
AT
UR
E,
SED
IME
NT
,M
ICR
OB
IOL
OG
ICA
L)
PAR
TIA
L—
RE
CO
RD
STA
TIO
N
H.o
d-
Cap
.I
15645’
30
man
00
AH
UL
U
FIG
UR
E8.
—-L
0CA
TI0
N5
OF
GA
GIN
G,
WA
TE
R-Q
UA
LIT
Y,
AN
DPA
RT
IAL
—R
EC
OR
DST
AT
ION
SO
N1A
UI.
15’
15&
0O’
Sou
rce:
USG
SW
ater
Dat
aR
epor
tH
I-88
-1

Map2 Gaging Stations (1988)
HAWAIIo 3 6 9 12M11.ESI I I II Io 5 10 15KILOUE1ERS
EXPLANATION
• GAGING AND WATER-QUALITY (PERIODIC TEMPERATURE)STATION
jT-GAGING AND WATER—QUALITY (çHEMICAL TEMPERATURE,
SEDIMENT, MICROBIOLOGICAL) DAILY AND PARTIAL-
RECORD STATION
& CREST—STAGE GAGE STATION
FIGURE 1O.-—L0cAT!oNs OF GAGING, WATER—QUALITY, AND PARTIALRECORD STATIONS ON HAWAII.
Source: USGS Water Data Report HI-88-1.
62
Water Quality
“Water quality monitoring is an essential part ofany evaluation ofwater for health, safetyand habitat protection. Results of monitoring aid in the assessment of mitigation andmanagement practices. The type ofwater quality information collected varies dependingon the user’s need.
Information on surface water quality has been collected in Hawaii since the 1960s. Mostagencies collect water quality data to meet specific goals that are usually problem-oriented and of short duration.
Monitoring of stream water is best done at instream stations, however testing ofnearshore waters may provide information about the water quality of streams that enterthose waters. A list of these uearshore monitoring sites and associated streams isprovided.
This report is an inventory of water quality efforts only. It makes no attempt to providethe data itself, or to assess the quality of Hawaii’s surface or nearshore water. HSAprovides an index of the type of water quality information that has been collected(physical, chemical, biological, and sediment), the dates collected and sources of thatinformation.
BackgroundIndependent surface water quality monitoring programs were initiated in the 1960s by
the U.S. Geological Survey, State Department of Health, Honolulu Board of WaterSupply and USFWS. A program was initiated by the University ofHawaii at Hio in 1987for Hilo Bay and related nearshore waters. Monitoring reached its peak in the 1970s.Currently it is at a relatively low level.
United States Geological Survey: The USGS has collected water quality informationat stream gaging stations since 1967 as part of a nationwide program. This programrecords basic water quality characteristics, noting long-term changes in the quality ofwater for monitoring and prediction purposes. This comprehensive survey is conductedat the six National Stream Quality Accounting Network (NASQAN) stations, which are“data-collection facilities for obtaining regional and nationwide overviews of the qualityof our streams” (USGS 1977), and at the one Hydrologic Benchmark station. ABenchmark station is more specific than a NASQAN station, in that it is located in awater basin which is anticipated to remain in a natural condition. Physical, biologicaland chemical information is collected at these stations. Less comprehensive water
63

quality information is usually collected at other stations. In addition to these regularprograms, USGS collects information on a special project basis.
State Department of Health: The DOH is responsible for monitoring the quality ofwater used for consumptive or recreational purpose and has different standards foracceptable levels of contaminants, depending on the use. DOH drinking water qualitymonitoring focuses on groundwater, which is the primary source of Hawaii’s potablewater supply. The various county water departments cooperate with the DOH inmonitoring drinking water. The DOH also identifies Water Quality Limited Segmentswhich are waterbodies within the state which, without additional action to controlnon-point source of pollution, cannot reasonably be expected to attain or maintain StateWater Quality Standards.
The DOH also monitors chemical and biological pollutant levels in some nearshorewaters, for the health and safety of recreational users. When monitoring is conductedin the receiving water of specifically identified streams, this may provide information onstream water quality.
The Honolulu Board of Water Supp1 This is the only county water department thatindependently maintains surface water quality records. The BWS collects physical,chemical and biological records for the Lulumahu stream, a tributary of the NuuanuStream, and at the Nuuanu Tunnels.
The University of Hawaii at Hilo: UH-Hilo has conducted both instream and near-shore water quality testing in the Hio area since 1987, primarily to determine watermovement.
U.S. Fish and Wildlife Service: The USFWS measured certain heavy metals andorganochiorine pesticides in freshwater fish in their National Contaminant Biomonitoring Program from 1976 - 1984.
The DOH and several other agencies have opted to concentrate resources on management rather than monitoring, for reasons of cost and efficiency. “Toxic pollution isdifficult and costly to monitor. A single water sample analysis for the U.S. EnvironmentalProtection Agencs ‘priority pollutants’ costs over $2,000.” This issue is “complicatedby the difficulty and cost of identifying the specific sources of pollutants which have animpact on receiving waters. At this point in time, monitoring for the sake of recordingwater quality trends will not greatly help to accomplish this program’s goals. Money nowis better spent on the implementation of pollution control programs which will help toreduce nonpoint source inputs (DOH 1989). This conclusion corresponds with the SoilConservation Service (SCS) decision to put resources to study Best ManagementPractices (BPM) instead of general water quality monitoring.
New, more stringent federal water quality standards for drinking surface water sourcestake effect in 1991. The consequence of this in Hawaii appears to be the terminationwherever possible of surface water sources for consumptive use, so that these newregulations will not necessarily lead to greater monitoring of surface water.
64
MethodsAll the agencies and individuals listed in the Sources section of the report were queried
for water quality information. Agencies with water quality information were: USGS,DOH, University of Hawaii at Hio, and the University of Hawaii at Manoa WaterResources Research Center. The type of information collected varied according to theuser’s needs and interest. Surface water quality information is inventoried by source,type and dates.
Water Quality Information Types
Physical characteristics include temperature, specific conductance, turbidity,color, odor, pH, and suspended solids. The most common measurement taken istemperature.
Biological characteristics include bacteria (bacteria includes fecal coilform andfecal streptococcus), phytoplankton, zooplanicton, periphyton, and macroinvertebrates.
Chemical characteristics include total dissolved solids, major ions, hardness, silica,phosphorus species, nitrogen species, detergents, other minor elements,radiochemical species, organic species, pesticides species, biochemical oxygendemand, chemical oxygen demand, dissolved oxygen, and other dissolved gasses.
Sediment characteristics include suspended sediment concentration, suspendedsediment discharge, bed load, total concentration, and particle size and distribution.
This report does not provide the actual water quality testing results (for example,specific levels of chemical analysis), nor does it make any attempt to interpret thoseresults.
The relationship between the nearshore water quality test results and water quality ofassociated streams is tenuous. Unless streams are discharging into the nearshore watersat the time of sampling, stream water characteristics will not be represented. Thereforeinformation is provided for inventory purposes only.
Aquatic studies often include water quality ratings pertinent to those studies. Thesehave not been included in this water quality monitoring inventory, as they are inconsistent, hard to access, and often not appropriate.
Results
Sixty-five streams have some instream water quality information (Table 7). Of these,46 stations have physical information only 19 stations have additional chemical, biological or sediment information. Water quality information is currently being collected at14 streams. This includes the seven USGS index stations. USGS is currently collectingsediment data from six daily stations on the Halawa and Kaneohe streams on Oahu toquantify sediment yields from highway construction activities.
65

Distribution of Streams with Water Quality InformationCurrent and Past Data Collection
Total #strms Current #strins
Kauai 10 2Oahu 25 6Molokai 6 1Maui 13 2Hawaii 11 3
Streams with considerable Water Quality Information
Kauai: Wailua River, Hanapepe, WaimeaOahu: Kaneohe, Kaelepulu Canal, Ala Wai Canal, Nuuanu
(Lulumahu), Kalihi, Moanalua, WaikeleMolokai: HalawaMaui: KahakuloaHawaii: Wailuku, Honolii
The University ofHawaii at Hilo will continue monitoring Hio Bay and related streamsfor at least another year or two.
The Honolulu Board of Water Supply plans to expand its water quality monitoringprogram to include tunnel water sources.
The U.S. Geological Survey plans to continue water quality monitoring at its NASQANand Benchmark stations as part of its national program. Expansion of this programwould have to be with the cooperation of a state or county agency.
USGS Index Stations
Benchmark Station: Honolii Stream, HawaiiNASQAN Stations:
Waimea River - Waimea, KauaiWaikele Stream - Waipahu, OahuKalihi Stream - Kalihi, OahuHalawa Stream - near Halawa, MolokaiKahakuloa Stream - Kahakuloa, MauiWailuku River - Hio, Hawaii
CBR Stations: Kalihi, Oahu; Waialae, Kauai
The U.S. Soil Conservation Service (SCS) has undertaken a National Initiative onWater Quality mitigation. Its purpose is to determine best management practices tocontrol erosion and sedimentation. The SCS has prioritized five hydrologic units for thisinitiative. SCS is pursuing funding for this program for fiscal year 1991.
66

The SCS National Initiative on Water Quality Mitigation areasfor mitigation efforts and study
Maunawili/Waimanalo, Oahu - special projectMaunawainui, Molokai - hydrologic unit projectWaialua-Kaialca Bay, Oahu - hydrologic unit projectNorth Kohala, Hawaii - Demonstration project
The USFWS program documented some of the highest concentrations of contaminents(metal and organochiorine) in the country in fish collected from Manoa and WaikeleStreams on Oahu from 1976 1984.
The DOH has decided to concentrate its surface water quality monitoring efforts in“Water Quality-Limited Segments” of nearshore waters. These are coastal areas whichhave water quality problems from nonpoint source pollution sources, much of which iscarried to the ocean in the stream. The DOH has targeted these segments for testingto obtain baseline information on the type and level of pollution. This may be relevantto instream water quality when the receiving waters can be associated with a particularstream. The DOH will continue, increase or initiate monitoring of most of the segmentsand other nearshore areas as funds and laboratory time allow.
DOH Water Quality-Limited Segments and 1)011 Water Quality rating 1989and associated streams
Station location, Island, DOH water quality rating (A,M) (associated streams)
M = Objective that water remain in their natural, pristine state as nearly as possible with an absolute
minimum of pollution or alteration of water quality from any human-caused source or action.
A = Objective that the use of these waters for recreational and aesthetic purposes be protected.
(DOH 1988)
Ala Wai Canal, Oahu, A (Makiki, Manoa, Pablo)Hanapepe Bay, Kauai, A (Hanapepe River)Hio Bay, Hawaii, A (Wailoa, Wailuku, etc)Honolulu Harbor, Oaliu, (Kapalama, Nuuanu)Kahana Bay, Oahu, AA (Kahana River)Kaneohe Bay, Oahu, A-AA, (Heeia)Keehi Lagoon, Oahu, A (Kalihi, Moanalua)Nawiliwili Bay, Kauai, A (Huleia, Nawiliwili, Puali)Pearl Harbor, Oahu, A (Aiea, Halawa, Honouliuli, Kalauao,
Waiawa, Waikele, Waimalu)Waialua-Kaiaka Bay, Oahu, A (Anahulu, Kiikii, Paukauila)Waimea Bay, Kauai A (Waimea)
67

DOH Nearshore Water Quality Testing Sites
Hanalei River (Kauai) 805, 804, 850Hanamaulu Stream (Kauai) - 806Hanapepe River (Kauai) - 861, 821Kalihiwai (Kauai) - 811Nawiliwili, Huleia and Puoli streams (Kauai) - 881Wailua River (Kauai) 818Waimea River (Kauai) - 823Ala Wai Canal (Oahu) - 321Anahulu stream (Oahu)- 170, 171Heeia Stream - (Oahu) 401,402,403,362ICahana River - (Oahu) 178Kaneohe Stream - (Oahu) 190Punaluu (Oahu) - 177Olowalu (Maui) - 663Honolil (Hawaii) 1110Wailuku and Wailoa (Hawaii) - 1101, 1110, 1107, 1108, 1118
DiscussionWhile monitoring is costly, it is essential for evaluating the results of mitigation and
best management practices. Further, monitoring alone enables detection of long-termchanges in water quality.
The current surface water quality monitoring includes testing by USGS at about 14stations and by DOH’s blue waters program, primarily in nearshore waters.
Judging from agency reports, those entrusted with various aspects of water qualityappear to agree that nonpoint source pollution is Hawaii’s greatest surface water qualityproblem. Sedimentation is considered a serious, significant threat to Hawaii’s surfaceand nearshore water quality. Methods for monitoring sediments are available andconstistent. Monitoring is needed to address this serious concern.
Future Research
A “Network Analysis” for water quality monitoring would be helpful. The CWRMmight take the lead in a coordinated effort involving SCS, DOH, USGS, U.S. Army Corpsof Engineers and DLNR to produce a long-range monitoring plan. Participation wouldreduce duplicated effort and possibly encourage more federal financial participation.
Results of the USFWS monitoring program are highly unusual. The elevated levels ofcontaminants may pose public health and fishery isssues, suggesting priorities be givento update this information.
68

SourcesPublished and Unpublished Documents
DOH. Hawaii Administrative Rules. Title 11, Department of Health, Chapter 54. WaterQuality Standards. Adapted April 1988.
DOH. July 1989.Hawaii’sAssessment ofNonpointSourcePollution Water QualityProblems.DOll. July 1989. Hawaii’s Nonpoint Source Water Pollution Management Plan.Timbol Amadeo and John Maciolek. 1978. Stream Channel Modification in Hawaii. Part
A: Statewide inventory of streams, habitat factors and associated biota. FWS/OBS/78/16. Prepared for USFWS National Stream Alteration Team. Columbia, Missouri.
USGS. 1977. “NASQAN, Measuring the Quality of America’s Streams”, brochure.
Databases
DOH. STORET Database.University of Hawaii Environmental Center. Wetlands inventory database for Oahu and
Maui.USGS WATSTORE data. F.Y. 1988-89. All water quality data query, courtesy of USGS,
Hawaii office - National WATer Data STOrage and REtrieval System(WATSTORE)contact: Chief Hydrologist. USGS 437 National Center, Reston, Virginia 22092 USGSStation List. (unpublished)
Maps
DOH. 1987. Water Quality Maps.
Personal Communications
County Water Departments. 1989-90.Akazawa, Eugene T. Department of Health. 1990.Astrab, Donald P. Honolulu Board of Water Supply. 1990.Dudley, Walter. U.H. at Hio. 1990.Fujioka, Roger. U.H. at Manoa, WRRC. 1990.Hongiman, Lucianna. The Nature Conservancy of Hawaii. Heritage Program. 1989 - 90.Ford, John. U.S.Fish and Wildlife Service. 1989 - 90.HSA Water Supply Committee. 1990.Kaneshiro, Ken. U.S. Soil Conservation Service. 1990.Stahl, Margo. U.S. Army Corps of Engineers. 1990.Teves, Mary-Rose. Department of Health. 1989 -90.Whalen, Stephanie. Hawaii Sugar Planters Association. 1990.Yee, Johnson. U.S. Geological Survey. 1990.Yuen, Andy. U.S. Fish and Wildlife Service. 1990.
69

Water Supply
Streams provide needed water for many important offstream uses. Surface water fromstreams is the lifeline for many communities and for much agricultural activity (bothlarge scale and small) in this State. Thus, streams, as suppliers of water for offstreamuses, are indeed a resource for the people of Hawaii and, as such, are clearly in the publicinterest. Streams are vital to our economic and social well-being.
The committee felt that it was important for the HSA to both identify and assess thosestreams which supply beneficial offstream uses of water. However, the lack of availableinformation that is both complete and reliable rendered this task difficult at the presenttime. A thorough inventory of surface water use is presently being developed by theCommission on Water Resource Management as part of their water use certificationprogram called for by the State Water Code. Thus, upon completion of theCommission’s program, an inventory will be available for use by the HSA. The committee concluded that each stream which supplies water for an offstream use, as confirmedby the water use certification process, should be “tagged” in recognition of the beneficialnature of offstream uses.
MethodsCommittee
The Water Supply Committee consisted of representatives of the agricultural community and municipal water suppliers.
Water Supply Committee
Meredith Ching, Chair. Alexander and Baldwin Inc.Paul Matsuo, Department of Agriculture, Irrigation DivisionHerbert Minakami, Honolulu Board of Water SupplyMyrone Murikami, Hawaii Farm Bureau Federation
The Committee identified the major categories of offstream water uses as beingmunicipal, large-scale agriculture (sugar, pineapple, cattle, etc.), diversified agriculture(including State irrigation systems and taro), and other (small domestic systems,Hawaiian Homes, etc.).
Inventory and Assessment
Lengthy discussions were held on the problems of inventory and assessment. Bothtasks were deemed by the committee to be essential for the purpose of this study.
70
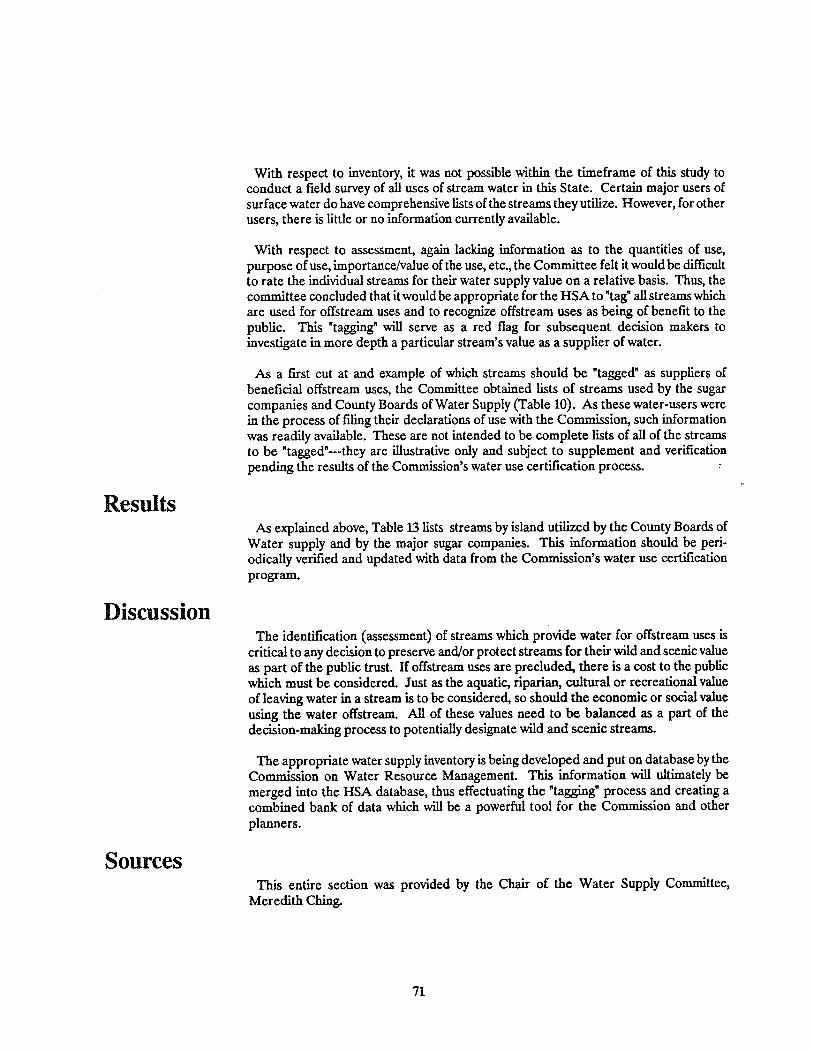
With respect to inventory, it was not possible within the tinieframe of this study toconduct a field survey of all uses of stream water in this State. Certain major users ofsurface water do have comprehensive lists of the streams they utilize. However, for otherusers, there is little or no information currently available.
With respect to assessment, again lacking information as to the quantities of use,purpose of use, importance/value of the use, etc., the Committee felt it would be difficultto rate the individual streams for their water supply value on a relative basis. Thus, thecommittee concluded that it would be appropriate for the HSA to “tag” all streams whichare used for offstream uses and to recognize offstream uses as being of benefit to thepublic. This “tagging” will serve as a red flag for subsequent decision makers toinvestigate in more depth a particular stream’s value as a supplier of water.
As a first cut at and example of which streams should be “tagged” as suppliers ofbeneficial offstream uses, the Committee obtained lists of streams used by the sugarcompanies and County Boards of Water Supply (Table 10). As these water-users werein the process of filing their declarations of use with the Commission, such informationwas readily available. These are not intended to be complete lists of all of the streamsto be ‘tagged”—-they are illustrative only and subject to supplement and verificationpending the results of the Commission’s water use certification process.
ResultsAs explained above, Table 13 lists streams by island utilized by the County Boards of
Water supply and by the major sugar companies. This information should be periodically verified and updated with data from the Commission’s water use certificationprogram.
DiscussionThe identification (assessment) of streams which provide water for offstream uses is
critical to any decision to preserve and/or protect streams for their wild and scenic valueas part of the public trust. If offstream uses are precluded, there is a cost to the publicwhich must be considered. Just as the aquatic, riparian, cultural or recreational valueof leaving water in a stream is to be considered, so should the economic or social valueusing the water offstream. All of these values need to be balanced as a part of thedecision-making process to potentially designate wild and scenic streams.
The appropriate water supply inventory is being developed and put on database by theCommission on Water Resource Management. This information will ultimately bemerged into the HSA database, thus effectuating the “tagging” process and creating acombined bank of data which will be a powerful tool for the Commission and otherplanners.
SourcesThis entire section was provided by the Chair of the Water Supply Committee,
Meredith Ching
71

Table 10 Water Supply for Counties and Agriculture(Information supplied by the Water Supply Committee. Use may also include tributaries of these streams.)
Code HSA Stream Code LPC Lihuc Plantation Company
Name HSA Stream Name MKSC Mauna Kea Sugar Company
County Y County Water SupplySource MSC McBxyde Sugar Company
Ag Large Agricultural Company Diversion OS Olokele Sugar Company
HSC Hamakua Sugar Company OSC Oahu Sugar Company
HCSC Hawaiian and Commercial Sugar Co PMSC Pioneer Mill Sugar Company
KAC Ka’u Agnbusine WAC Wailuku Agribusiness
KSC Kekaha Sugar Company WSC Wailua Sugar Company
Code Name County Ag Code Name County Ag
____
Kaüai
2-1-14
2-1-16
2-1-19
2-2-01
2-2-04
2-2-08s
2-2-12
2-2-15
2-3-02
2-3-04
2-3-06
2-3-07
2-4-04s
Wainiha R.
Waikoko
Hanalei R.
Anahola
Kapaa
WailuaS.
Hanamaulu
Huleia
Waikomo
Lawai
Wahiawa
Hanapepe
Waimea S.
MSC
LPC
LPC
LPC
LPC
LPC
LPC
MSC
MSC
MSC
MSC
MSOS
KSC
Y
Oahu
6-1-07
6-1-09
6-1-10
6-1-11
6-2-06
6-2-07
6-2-08
6-2-09
6-2-10
6-3-01
6-3-02
6-3-03
6-3-05
6-3-08
6-3-09
6-3-10
6-3-11
6-332
6-3-14
6-3-15
6-4-01
6-4-02
6-4-03
6-4-04
6-4-06
6-4-07
6-4-08
6-4-09
6-4-10
Honokowai
Honokahua
Honolua
Honokohau
Makarnakaole
Waihee R.
Waiehu
Tao
Waikapu
Maliko
Kuiaha
Kaupakulua
Uaoa
Honopou
Hoolawa
Waipio
Hanehoi
Hoalua
Kailua
Nailhilihaele
Oopuola
Kaaiea
Kolea
Waikamoi
Puohokamoa
Haipuaena
Punalau
Honomanu
Nuaailua
3-1-18
3-2-02
3-2-04
3-4-06
3-4-10
3-4-11
3-6-06s
3-6-07s
3-6-08s
Kahana
Waikane
Waia]iole
Waiawa
Waikele
Honouiiuli
Kiikii S.
Paukauila S.
Anahulu S.
PMSC
PMSC
PMSC
PMSC
WAC
WAC,HDSC
WAC,HcSC
WAC,HcSC
WAC,HCSC
WDSC
HSC
H’DSC
HCSC
HDSC
HCSC
HCSC
HCSC
HCSC
HSC
HDSC
HCSC
HcSC
HSC
HCSC
HSC
HcDSC
HCSC
HcDSC
HSC
Y
Y
Y
Y
Y
Y
Y
Y
Y
Y
Y
Y
Y
Y
Y
Y
Y
oscoscoscoscoscoscwscwscwsc
__
_Maui I6-1-01
6-1-02
6-1-04
6-1-05
Ukumehame
Olowalu
Kauaula
Kahoma
PMSC
PMSC
PMSC
PMSCY
72
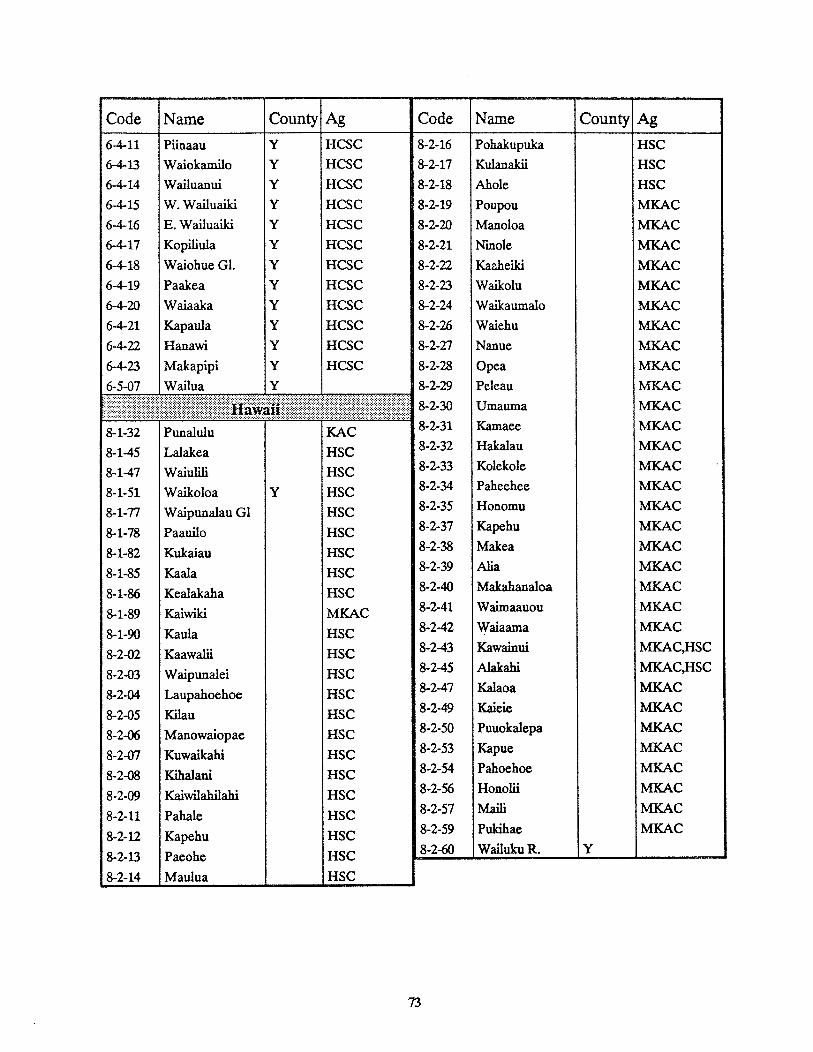
Code Name County Ag Code Name County Ag
6-4-11 Piinaau Y HCSC 8-2-16 Pohakupuka HSC
6-4-13 Waiokamilo Y HCSC 8-2-17 Kulanakii HSC
6-4-14 Wailuauui Y HCSC 8-2-18 Ahole HSC
6-4-15 W. Wailuaiki Y HCSC 8-2-19 Poupou MKAC
6-4-16 E. Wailuaiki Y HCSC 8-2-20 Manoloa MKAC
6-4-17 Kopiliula Y HCSC 8-2-21 Ninole MKAC
6-4-18 Waiohue Gi. Y HCSC 8-2-22 Kazheiki MKAC
6-4-19 Paakea Y HCSC 8-2-23 Waikolu MKAC
6-4-20 Waiaaka Y HCSC 8-2-24 Waikaumalo MKAC
6-4-21 Kapaula Y HCSC 8-2-26 Waiehu MKAC
6-4-22 Hanawi Y HCSC 8-2-27 Nanue MKAC
6-4-23 Makapipi Y HCSC 8-2-28 Opea MKAC
6-5-07 Wailua Y 8-2-29 Peleau MKAC
HawaiI 8230 Umauma MKAC
8-1-32 Punalulu KAC 8-2-31 Kamaee MKAC
8-1-45 Lalakea HSC 8-2-32 Hakalau MKAC
8-1-47 Waiulili HSC 8-2-33 Kolekole MKAC
8- 1-51 Waikoloa Y HSC 8-2-34 Paheehee MKAC
8-1-77 Waipunalau G1 HSC 8-2-35 Honomu MKAC
8-1-78 Paauilo HSC 8-2-37 Kapehu MKAC
8-1-82 Kukaiau HSC 8-2-38 Malcea MKAC
8-1-85 Kaala HSC 8-2-39 Alia MKAC
8-1-86 Kealalcaha HSC 8-2-40 Makahanaloa MKAC
8- 1-89 Kaiwilci MKAC 8-2-41 Waimaauou MKAC
8-1-90 Kaula HSC 8-242 Waiaama MKAC
8-2-02 Kaawalii HSC 8-243 Kawainui MKAC,HSC
8-2-03 Waipunalei HSC 8-245 Alakahi MKAC,HSC
8-2-04 Laupahoehoe 8-247 Kalaoa MKAC
8-2-05 Kilau HSC 8-249 Kaieie MKAC
8-2-06 Manowaiopae HSC 8-2-50 Puuokalepa MKAC
8-2-07 Kuwaikalii HSC 8-2-53 Kapue MKAC
8-2-08 Kihalani HSC 8-2-54 Pahoehoe MKAC
8-2-09 Kaiwilahilalii HSC 8-2-56 Honolli MKAC
8-2-11 Pahale HSC 8-2-57 Mail MKAC
8-2-12 Kapehu HSC 8-2-59 Pukihae MKAC
8-2-13 Paeohe HSC 8-2-60 Wailuku R. Y
_______
8-2-14 Maulua
_______
HSC
73

Dams and Diversions
Dams and diversions are common modifications in Hawaii’s streams. For this study,dams are those listed by the U.S. Army Corps of Engineers (COE), and diversions referto weirs that span the streambed, directing water into ditch systems. Other diversionssuch as small auwal and pipes, which can also affect the instream flow, are not inventoried.
Hawaii’s major ditch systems are significant physical and historic features. They haveallowed agriculture and settlement on otherwise arid land. They have been essential tothe success of the sugar industry, a foundation of Hawaii’s economy and social patternsfor almost a hundred years. Some counties depend on surface water for municipal usc.Today’s landscape is highly altered by and dependent on these systems.
At the same time, these diversions can be detrimental to instream values. They reducethe instream flow, which in turn can alter the flow characteristics and chemical andphysical nature of the water and stream bed. Aquatic and recreational values are usuallyreduced as a result of diversions and dams. When diversions are at upper eLevations andthe stream gains flow below the diversion by spring or feeder tributary, or when there isa conservation flow, the impact to the stream is lessened. Diversions at the lowerelevations that interrupt streams have significantly greater impact on instream resources.
About a hundred streams are listed by the HSA as having dams or diversions. Becausethe HSA definitions are limited, this is only a portion of the actual inventory of dams anddiversions. The DLNR water use certification program, scheduled for completion in1991, will provide verified information.
BackgroundEarly Hawalians depended almost exclusively on surface water for irrigation and
domestic use. Their sophisticated and extensive irrigation systems watered crops whichwere a major part of the landscape and culture. The subsequent development ofirrigation systems by sugar companies differed from these earlier ones in capacity andin distance water was removed from the water source.
The first sugar irrigation ditch was built by William H. Rice on Kauai in 1856, and itwas not very large or successful. Larger systems were built starting in the 1870s. Theywere the key to the success of sugar in Hawaii. Most existing systems were in place by1930. The first great ditch, the Hamakua, was built on Maui, in 1878, by Alexander andBaldwin. Since then, over a dozen major systems have been developed on the four largestislands. These systems, consisting of tunnels, ditches and flumes, are locally referred toas “ditches.” However, the word belies their size.
74

The diversion structure typical of these ditch systems is a cement weir that diverts mostor all of the low and average flow out of the stream. The water is delivered to fields orreservoirs, or, in a few cases, to hydroelectric power plants. In only a few cases does thestream bed itself serve as a significant storage area. Ditch systems usually divert waterat upper elevations. In some cases the water is transported within the hydrographic unit,such as the Waialua Sugar Company’s system. More often, the water is transported outof the general watershed such as the Waiahole Ditch on Oahu, which takes water fromthe windward valleys through the Koolau mountains to the leeward Ewa plains. Thelarge and complex East Kauai Irrigation (EKI) system can theoretically take water fromHanalei and deliver it to Lihue. The plains of central Maui are watered from both theEast and West Maui mountains. The most impressive of these is the East Maui Irrigation(EMI) system, which may be the largest private water company in the United States.
MethodsDam information was taken from the U. S. Army Corps of Engineers’ 1975 Dam
Inventory. Irrigation system information was from the USGS, DOWALD, unpublishedreports, and the information provided by the sugar companies through the HSA WaterSupply Committee. The various county water departments provided lists of their streamand stream associated water sources. The counties are all primarily dependent ongroundwater sources, however the surface sources listed in Table 11 are significantespecially on Maui.
ResultsThe geographic distribution ofdiversions is directly related to the present and historical
cultivation of sugar. For this reason, one third of Oahu’s and Hawaii’s streams and overone half of Maui’s streams are diverted. Conversely, there is very little diversion onMolokai, the eastern part of East Maui, or on the north shore of Kauai.
Table 7 identifies those streams known to be or thought to be dammed or diverted byweir, based on information from the above sources. Based on COE’s inventory HSA hasidentified dams on 24 streams. Table 12 lists historic and active ditch gages anddischarge figures. Some of this data are old and therefore maybe unreliable for currentuse. Table 11 lists other sources of county water supply.
Table 11 County Water Supply Sources
OahuTunnels:
Waianae Plantation TunnelsWaianae TunnelWaimanalo Tunnels 1,11,111, IVLuluku TunnelHaiku TunnelKahaluu TunnelKalihi Tunnel ifi, IV, V, WAlewa Hts. SpringNuuanu Tunnel Ill, lilA, IV, IVB
75

Booth SpringMakiki SpringHerring SpringManoa Tunnel ifiPablo Tunnel
MolokalTunnels:
Molokai TunnelMauiDitches:
East Maui IrrigationHailimaill -Kamole WeirMalcawaoPukalaniHaikuHonokohau DitchAleoloa DitchKanaha DitchAwalau System
Tunnels:lao Tunnel
DiscussionLimitations
The complexity of the irrigation systems and limited data on their current conditionprecludes any attempt to identify individual stream diversions or to suggest that they areall functional. Several of the major historic irrigation systems are known to be indisrepair. Examples are sections of Kohala Ditch, Upper Hanzalcua Ditch and theHanalei Tunnel. This project has not attempted to inventory the many smaller privatewater systems, diversions etc. It is anticipated that these will be recorded by the DLNRunder the water use certification program, scheduled for completion in 1991.
SourcesPublished and Unpublished Documents
DLNR/DOWALD. November 1989. Declaration of Water Use certification program.
U.S. Army Corps of Engineers. May, 1975. National Program for Inspection of Dams.“Inventory of Dams in the U.S.”
USGSIDLNR DOWALD. November, 1981. Summary of Available Data on SurfaceWater. State of Hawaii, Volume 1-Island ofKauai Open-File Report 81-1056. Honolulu.
USGS/DLNR DOWALD. 1981. Summary of Available Data on Surface Water. State ofHawaii Volume 2-Oahu, Molokal, Maui and Hawaii Open-File Report 81-1056.
USGS Water Resources Data, Water years 1970, 1979, 1987, and summary of 1950.(Reports are published annually.)
USGS Open Files (unpublished computer sheets of gage readouts)
76

USGS Station List, F.Y. 1988-89, 1989 (unpublished)Wilcox, Carol. 1984. Hawaii’s Plantation Irrigation Systems. DLNR/Historic Sites.
Maps
USGS 1:100,000 Maps
Personal Communications
HSA Water Supply Committee. 1989-90.
77

Table 12 Ditch Gages
Ditch Name Name of Ditch Quality USGS assessment of record quality
Gage # USGS Gage e Excellent
Status a Gage active in 1989 g Good
Average Average Flow (cfs) at gaging station f Fair
Median Median Flow (cfs) at gaging station p PoorYears Years of Record
* EMI maintains recording station
Note: cfs X 0.646 = MGD
Ditch Name Gage# H Average I Median..
KauaIAahoaka D 070000 66-72Anahola D 086000 15-21Anahola D 087000 4.51 0.50 g 36-Anahola D 088000 a 432 2.90 g 21-
China Ditch 102000 27.20 29.00 11-Hanalei D 099500 56-62Hanalei Tunnel 100000 2730 28.00 32-Hanamaulu D 058000 29.60 32.00 10-20Hanapepe D 043000 42.50 44.00 30-38
Hanapepe D 044000 38.50 39.00 10-49Hanapepe D 046000 12-17Hanapepe D 042000 11-15Ka Loko D 094200 5.71 3.80 32-68
Kalihiwai D 095900 430 60-68Kalihiwai D 096000 4.08 2.80 34-67Kanaha D 064000 2.40 10-55
KapaliiD 079000 a 4.50 09-
Kekaha D 027000 51.00 08-34
Kekaha D 022000 55.00 09-68
Kokee D 014000 20.00 2420 g 26-
KoloaD. 054200 2130 15.00 g 46-71
KunaD 104000 12-19
Lihue D 057000 9.20 10-19
Lower Anahola D 090000 09-14
Lower Anahola D 091000 a 2.73 2.70 g 36-
Lower Haiku D. 053600 8.09 330 g 63-71
Makaleiha D 077000 a 6.84 730 g 36-
North Wailua D 061200 a 23.30 24.00 f 65-
North WailuaD 061000 18.80 19.00 g 32-
Olokele D 032000 66.00 10-17
Olokele D 033000 64.00 12-17
Puu Ka Ele D 095000 3.40 32-67
Ross D 095200
______ _______
3.10
_______
56-67
78

I.•
c?31)
.)
.
V0\
(‘4‘t
0._0v.c
(‘4m
•
qr—
Vbfic0
_0
0,-
‘00o\
Q’
V_ca
Fh!p
p(3
c
i
bObO
UbO
0•
%Q
00
.
0
FU
0
LL
9.
-g
NU
HU
zQz-
0Z

Ditch Name Gage # Status Average Median Quality Years
New Hamakua D 596000 68.70 84.00 10-23
New HamakuaD 589000 a* 36.20 4.90 e 18-
Old Hamakua D 590000 4.12 0.10 18-65
Olowalu D 645000 6.60 11-67
Opana Tunnel 599500 a 3.12 2.00 g 65-
Spreckles D (E) 565500 9.89 2.30 17-30
Spreckies D (E) 552000 12.20 1.50 28-38
Spreckles D (E) 538000 22-
Taro D - Keanae 522000 150 34-68
Wailoa D 588000 a* 171.00 170.00 22-
Awini D 744000 27-72
Awini D 745500 19.40 g 07-72
Awini D 743000 17.90 g 27-72
Honokaa Diver. 733200 15.70 g 64-73
KehenaD 755000 1766
Kohala D 752000 33.10 07-17
Kohala D 751000 27-72
Kohala D 750000 07-12
Kohala D 750900 37.20 g 63-72
Lower Hamakua D 733000 64-73
Lower Hamakua D 733100 46.10 g 64-73
Lower Hamakua D 733101 65-72
Lower Hamakua D 733300 23.50 g 64-73
Lower Hamakua D 732900 10-20
Upper Hamakua D 732300 13-20
Upper Hamakua D 727000 a 2.69 0.10 g 77-
Upper Hamakua D 726000 a 11.00 6.60 f 74-
Upper Hamakua D 724800 a 4.98 320 g 68-
Upper Hamakua D 720500 a 7.10 4.80 g 64-
Upper Hamakua D 718000 14.80 13-20
80

Figure 2 Flowcharts of Major Ditch SystemsFrom Water Resources Protection Plan, Mink, Yuen, 1990.
Waimpa River Drainage:Waimea Aquifer System
Makaweli River Drainage:Makaweli Aquifer System
KAUAIMajor Stream Diversions
1450 ft.
Hanapepe River Drainage: Hanapepe Aquifer System
490 ft.
Ocean
Indicated Flows Are Averages in million gallons/day.
USGS Station Number(abbreviated) and elevation at gage are provided.
“A” indicates gage active 1989.Flows are based on figures available through water year 1989Conversion MGD = CFS /1.5472
Waimea River
MGDKokeeDitch
140
36 MGDKekahaDitch
220
31020 ft.
3310 ft. 520 ft. 50 ft.
Olokele River
Ocean
360 A18 ft.
320
HanapepeRiver
440
490222 ft.
81

Figure 2 Flowcharts of Major Ditch SystemsFrom Water Resources Protection Plan, Mink, Yuen, 1990.
Streams in Hulela Drainage
KAUAIMajor Stream Diversions
Indicated Flows Are Averages in million gallons/day.
USGS Station Number(abbreviated) and elevation at gage are provided.
“A indicates gage active 1989.Flows are based on figures available through water year 1989.
Conversion MGD = CFS / 1.5472
KamooloaStream
SouthWaiIua
TI
__
4MGD 9MGDUpper Haiku Lower Haiku
Ditch Ditch
534 536470 ft. 400 ft.
538390 ft.
568730 ft.
KuiaStream 545
393 ft.
420620 ft.
HuleiaStream
544
Waita Reservoir
WilcoxDitch
82

Figure 2 Flowcharts of Major Ditch SystemsFrom Water Resources Protection Plan, Mink, Yuen, 1q90.
KAUAIMajor Stream Diversions
Wailup River Drainage: Wailua Aquifer System
SouthFork
WailuaRiver
Indicated Flows Are Averages in million gallons/day.USGS Station Number(abbreviated) and elevation at gage are provided.A* indicates gage active 1989.Flows are based on figures available through water year 1989.Conversion MOD CFS/ 1.5472
I 17MGD
I Hanalei
LTunnel
__________
1210 ft. 31 MGDEast
Branch680
500 ft.NorthFork
WailuaRiver
10 MGDN .Wailua
690462 ft.
6101106 ft.
6121070
Aft.
Ocean
HuleiaStream
570550 ft.
83
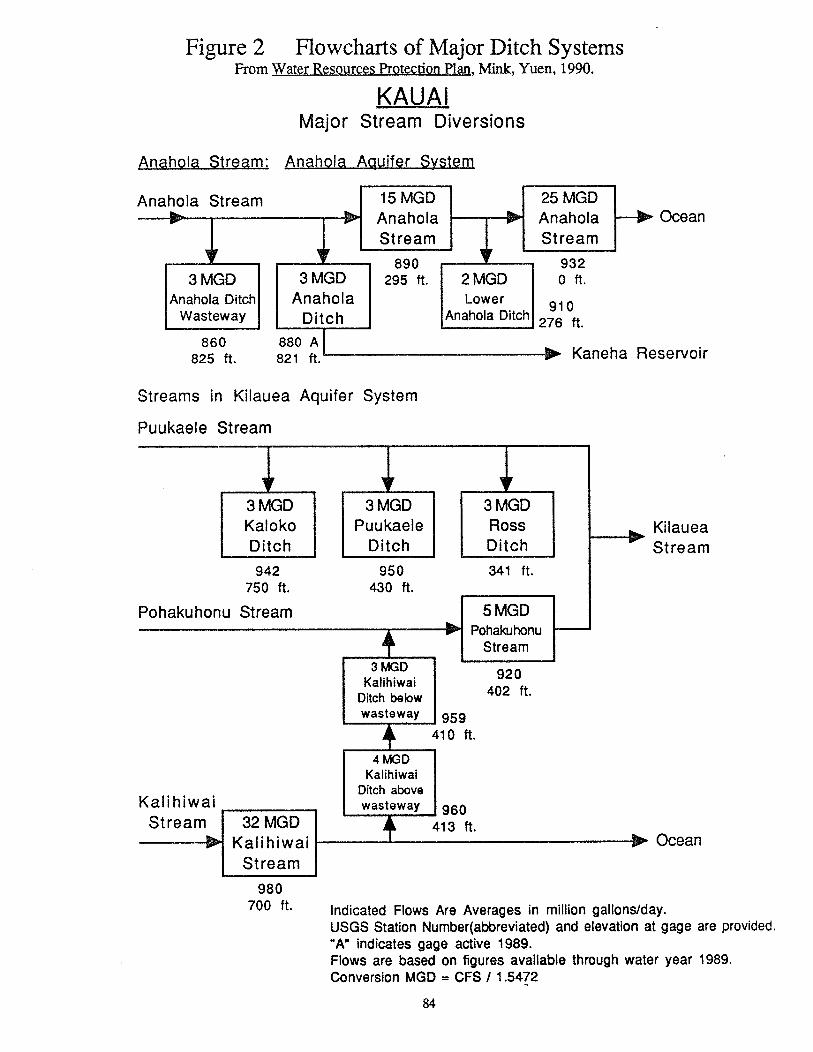
Figure 2 Flowcharts of Major Ditch SystemsFrom Water Resources Protection Plan, Mink, Yuen, 1990.
KAUAIMajor Stream Diversions
Anahola Stream: AnhnL Arniifr Svstm
Ocean
Streams in Kilauea Aquifer System
Puukaele Stream
KflaueaStream
Ocean
Indicated Flows Are Averages in million gallons/day.USGS Station Number(abbreviated) and elevation at gage are provided.A” indicates gage active 1989.Flows are based on figures available through water year 1989.Conversion MGD = CFS I 1.5472
Anahola Stream
Kaneha Reservoir
942 950750 ft. 430 ft.
Pohakuhonu Stream
341 ft.
920402 ft.
Kali hiwalStream
980700 ft.
84

Figure 2 Flowcharts of Major Ditch SystemsFrom Water Resources Protection Plan, Mink, Yuen, 1990.
Kaoaa Drainage
Hanalei River:
KAUAIMajor Stream Diversions
ForkRiver
Ocean
Ocean
Indicated Flows Are Averages in million gallons/day.USGS Station Number(abbreviated) and elevation at gage are provided.“ATM indicates gage active 1989.Flows are based on figures available through water year 1989.Conversion MGD = CFS I 1 .5472
Kapaa Stream
780470 ft.
800382 ft.
770A 790A518 ft. 377 ft.
Hanalei River
1010625 ft.
1 0001210 ft.
NorthWailua
“F
[ StableStormDitch
620 A
Kali hiwaiDitch
102070 ft.
85

ID Co 0 CD > 0 rz (0 CD CD -D CD
00
CD Co -h CD CD
Fig
ure
2F
low
char
tsof
Maj
or
Dit
chS
yst
ems
Fro
mW
ater
Res
ourc
esP
rote
ctio
nP
lan,
Min
k,Y
uen,
1990
.
OA
HU
Maj
orS
trea
mD
iver
sion
Indi
cate
dFl
ows
Are
Ave
rage
sin
mill
ion
gall
ons/
day.
Con
vers
ion
MG
D=
CFS
/1.
5472
Leg
end
SW
Sur
face
Wat
erR
unof
f
0 Rec
ordi
ngG
e
8000
12000
16000
20000
Dis
tance
Alo
ng
Tra
nsm
issi
on
Tunnel
(fee
t)
Adi
t8
—4000
—30
00
—20
00
/s
*.
Sout
h
/
Port
al/
“Mc
Can
dle
ss
Sta
teLa
nd—I
Bis
hop
Est
ate
•La
nd
.1 IS
tate
1Land
Mai
n
sv
0
SW
U C!)
Cy)
SWSW 4
Tra
nsm
issi
onT
unne
l
Wal
anu
31B
ypas
s
Pum
pat
EIev
.46
0ft.
Kah
ana
21
04000
Wai
ahole
Tunnel
Syst
em
II
II
II
1I
24000
28000
32000
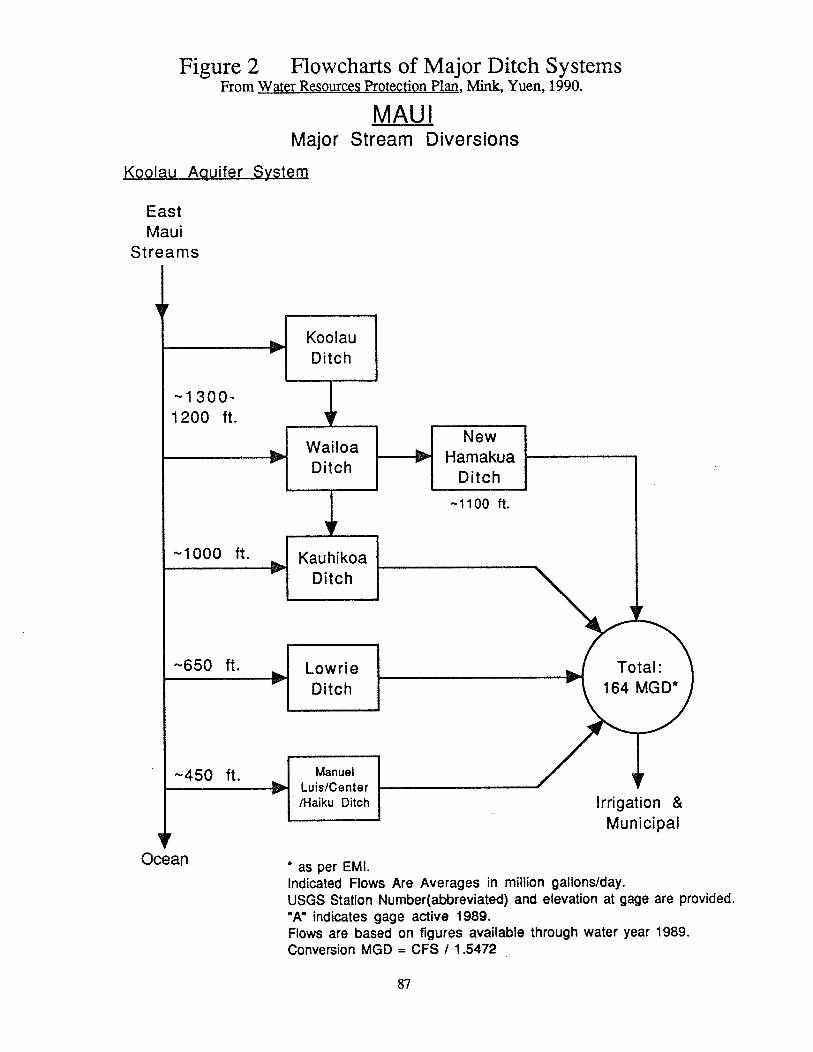
Figure 2 Flowcharts of Major Ditch SystemsFrom Water Resources Protection Plan, Mink, Yuen, 1990.
Koolau Aquifer System
East
MAUIMajor Stream Diversions
as per EMI.Indicated Flows Are Averages in million gallons/day.USGS Station Number(abbreviated) and elevation at gage are provided.aa indicates gage active 1989.Flows are based on figures available through water year 1989.Conversion MGD = CFS / 1.5472
MauiStreams
Ocean
Municipa
87
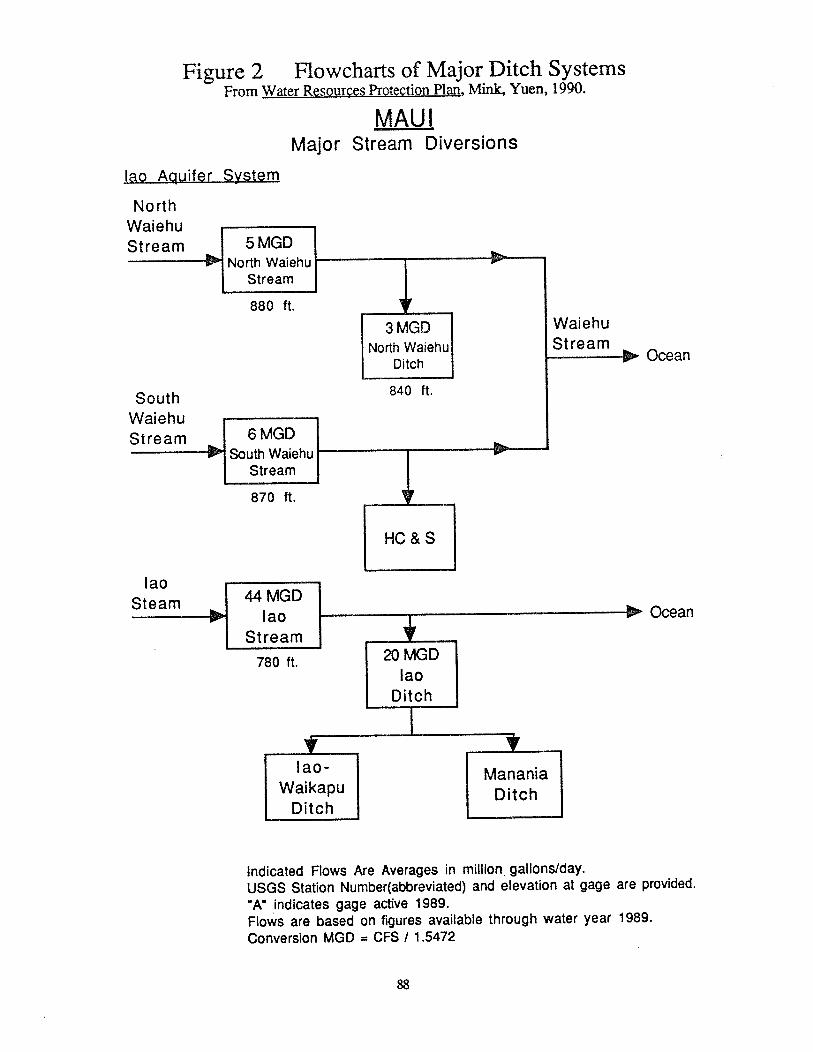
Figure 2 Flowcharts of Major Ditch SystemsFrom Water Resources Protection Plan, Mink, Yuen, 1990.
lap Aquifer System
MAUIMajor Stream Diversions
Ocean
Ocean
Indicated Flows Are Averages in million, gallons/day.USGS Station Number(abbreviated) and elevation at gage are provided.
“K indicates gage active 1989.Flows are based on figures available through water year 1989.
Conversion MGD = CFS / 1.5472
North
Wai e h U
Stream
880 ft.
South
Wai e h u
Stream
Waiehu
840 ft.
870 ft.
lao
Steam
780 ft.
88
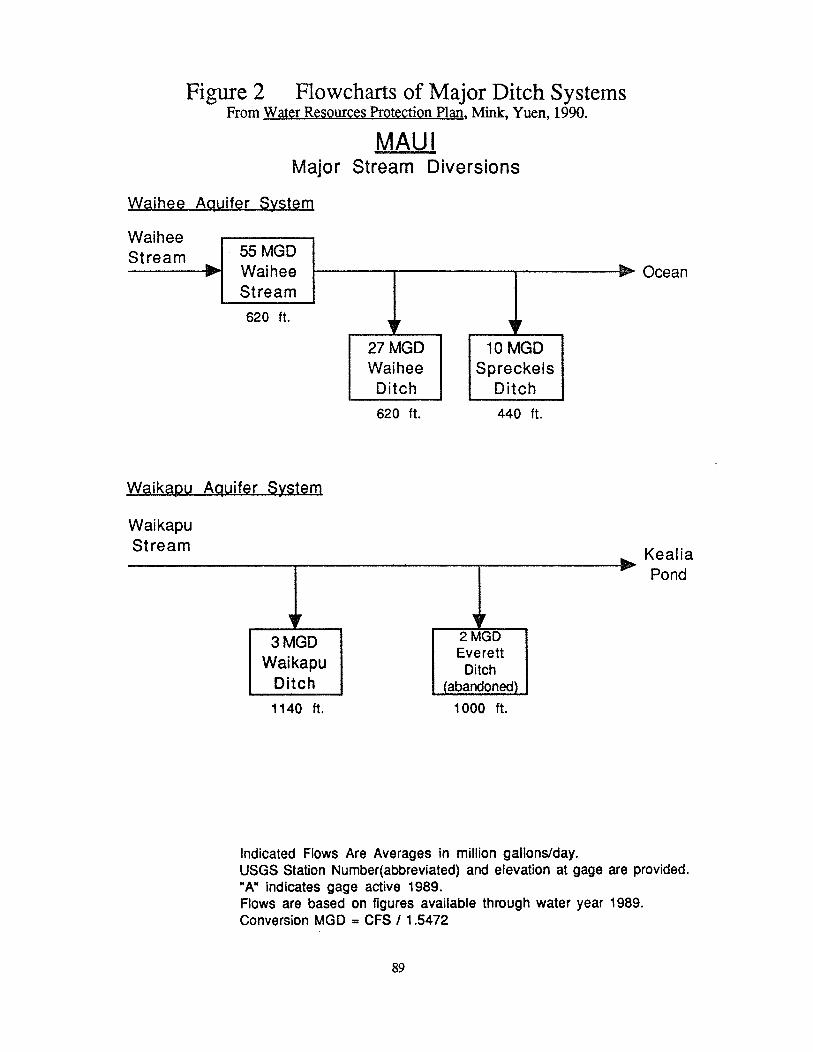
Figure 2 Flowcharts of Major Ditch SystemsFrom Water Resources Protection Plan, Mink, Yuen, 1990.
Waihee Aquifer System
MAUIMajor Stream Diversions
Ocean
Waikapu Aquifer System
Wai kapuStream Kealia
Pond
Indicated Flows Are Averages in million gallons/day.USGS Station Number(abbreviated) and elevation at gage are provided.“A indicates gage active 1989.Flows are based on figures available through water year 1989.Conversion MGD = CFS / 1.5472
WaiheeStream
620 ft.
27MGD 1OMGDWaihee SpreckelsDitch Ditch
620 ft. 440 ft.
1140 ft. 1000 ft.
89

C&H
Figure 2 Flowcharts of Major Ditch SystemsFrom Waxer Resources Protection Plan, Mink, Yuen, 1990.
MAUIMajor Ditch Systems
Indicated Flows Are Averages in million gallons/day.USGS Station Number(abbreviated) and elevation at gage are provided.
indicates gage active 1989.Flows are based on fiugres available through water year 1989.Conversion MGD = CFS I 1.5472
Honokohau
Stream
850 ft.
90
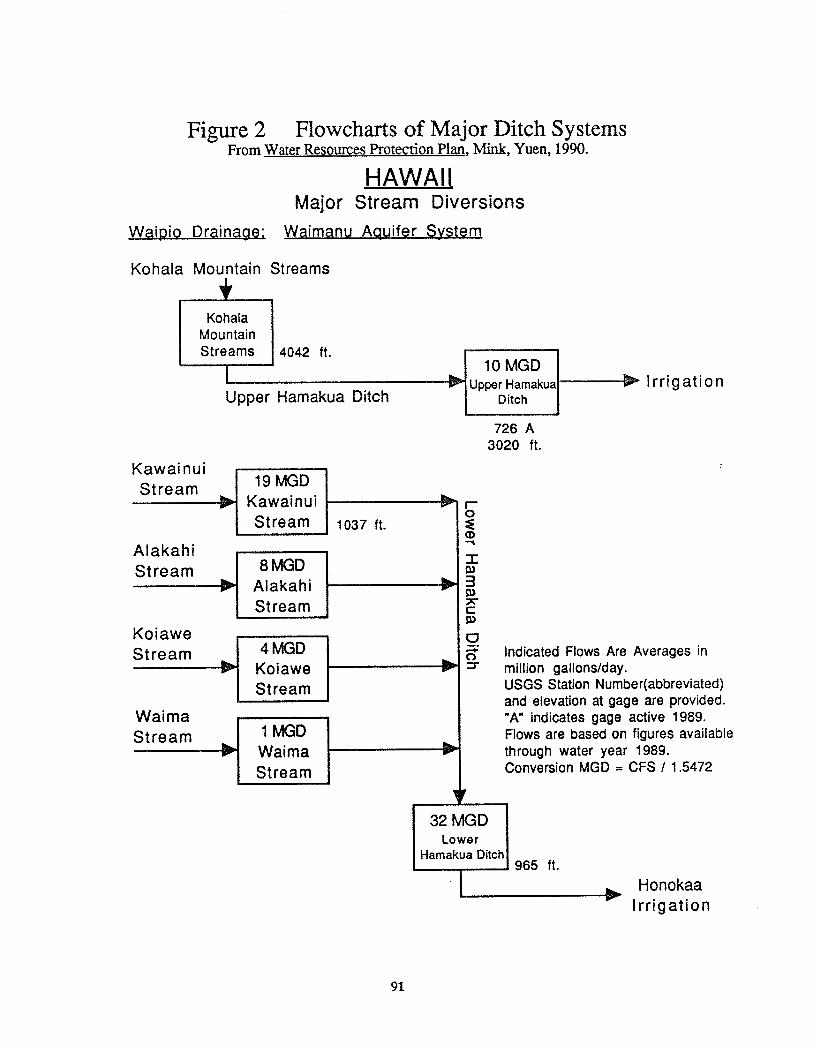
Figure 2 Flowcharts of Major Ditch SystemsFrom Water Resources Protection Plan, Mink, Yuen, 1990.
HAWAIIMajor Stream Diversions
Waipip Drainage: Waimanu Aquifer System
Kawainul19MGD
Kawainui
Alakahi8MGD-EAlakahi
Koiawe4MGD
Kolawe-E Indicated Flows Are Averages inmillion gallons/day.USGS Station Number(abbreviated)and elevation at gage are provided.A” indicates gage active 1989.Flows are based on figures availablethrough water year 1989.Conversion MGD = CFS /1.5472
Kohala Mountain Streams
4042 ft.
Upper Hamakua Ditch
726 A3020 ft.
I r r I g at i 0 fl
I0
3
C
Q0
‘p
1037 ft.
I0’
Waima1MGD
Stream
32 MGDLower
Hamakua Ditch965 ft.
HonokaaIrrigation
91

Figure 2 Flowcharts of Major Ditch SystemsFrom Water Resources Protection Plan, Mink, Yuen, 1990.
HAWAIIMajor Stream Diversions
Kohala Ditch System; Waimanu Aquifer SystemPlantation Era
Kohala Mountain Streams
7MGD
Ditch
Ko hal aIrrigation
Indicated Flows Are Averages in million gallons/day.USGS Station Number(abbreviated) and elevation at gage are provided.WA indicates gage active 1989.Flows are based on figures available through water year 1989.Conversion MGD = CFS I 1.5472
-1000 ft.
abandoned section
MGD
92

Hydroelectric Power
Hydroelectricity is typically generated by instream dams and power generators, butHawaii’s conditions call for a different design. In Hawaii, stream water is diverted to anoffstream powerplant. In run-of-the-river designs, water is diverted into ditches, pipesand penstocks to the powerplant, then returned to the river. Other designs position thepowerplant along the delivery system to utilize the drop of water (head) to the fieldswhere it is used for irrigation. This water is not returned to the stream.
There are 18 hydroelectric power plants in operation in Hawaii today; seven on Kauai,four on Maui, and seven on Hawaii. Nine additional plants have been proposed, six onKauai, one on Maui, and two on Hawaii. Hydropower has provided significant (up to16%) power on Kauai and supplements other sources on Maui and Hawaii.Hydroelectricity currently represents about L5% of the state’s total electrical energyconsumption.
BackgroundThe Hawaii Department of Planning and Economic Development (now DBED), in
conjunction with the U.S. Department of Energy, published Hydroelectric Power inHawaii: A Reconnaissance Survey, in 1981. The purpose was to study the potential ofdeveloping clean hydroelectric power and thereby reducing Hawaii’s dependence on oil.it is a comprehensive inventory of potential sources of hydroelectric power. It considered, among other things, storage, utilization of irrigation systems and reservoirs,upgrading existing facilities and new run-of-the-river plants. The study estimates werebased on using all of the stream water and did not take environmental issues into account.
The primary impacts of run-of-the-river hydroelectric on the stream are the diversionitself and the reduction in flow between the diversion and the powerhouse. Thesechanges may also adversely affect water quality, the stream corridor, native habitat andrecreational values. The powerhouse itself may entrain and destroy native species. Byreducing or eliminating the frequent peak flows typical of Hawaii’s streams, the flowregime can be altered from the point of diversion to the sea.
MethodsThe Hawaii Stream Assessment has compiled a simple inventory of existing, potential
and proposed hydroelectric sites. The primary source for existing sites was the DBED1988 summary of existing hydroelectric sites in Hawaii. The source for potential siteswas the Hydroelectric Reconnaissance Survey (DPED 1981) The DBED study identified
93

28 sites with enough potential to warrant cost/benefit analysis. Proposed hydroelectric
sites were taken from the DPED 1988 summary and CDUA applications and Environmental Impact Statements. The figures for energy output occasionally differ forproposed and potential projects because of changes in design.
ResultsOf the 18 existing hydropower plants, most were developed and are operated by sugar
companies. The two exceptions are on the Wailuku River in Hilo and are operated byHELCO, the local utility. According to the DBED, the 18 existing hydroelectric plantshave a total capacity of 18.95 megawatts (MW) and an annual average output of 104.4million kwh, with a 20 percent variation depending on annual flow (DBED 1988).
In the last several years, hydroelectric development has been proposed on the followingstreams and ditches: Kauai: Wainiha (Upper Wainiha), Lumahai (Lumahai Hydro),Hanalei (Hanalei Hydro and the Upper Wailua Hydro), Wailua (Lower Wailua Hydro),and the Kokee Ditch (Kitano Hydro); Maui: East/West Wailuaiki Stream (East/WestWailuaiki Hydro); Hawaii: Wailuku River (Wailuku Hydro) and Honolii (Honolii
Hydro). Some of these have received approval but have not been built, others are invarious stages of permitting or the applications have been withdrawn.
DiscussionAs a result of the 1981 study which indicated that the hydroelectric potential is low,
and the costs relatively high, DBED has devoted little agency time to its furtherdevelopment. However, DBED believes that hydropower is an important renewableenergy resource which can and should be developed in harmony with aquatic, riparian,cultural and recreational use of our streams. Whether this harmony can be achieved inHawaii’s small streams is a matter of considerable debate. The fact remains thatpresence of diversion for hydroelectric facilities is a significant modification to a streamand that if the proposed projects were all developed, HawaII may have no large freeflowing streams left.
Future Research
A statewide hydroelectric master plan is needed that balances river protection withhydroelectric power. CWRM, DBED, appropriate government agencies, environmental
organizations and hydroelectric developers should all be involved in developing such aplan.
94
SourcesPublished and Unpublished Documents
CDUA applications and Environmental Impact Statements for Kauai: Wainiha (UpperWainiha), Lumahai (Lumahai Hydro), Hanalei (Hanalei Hydro and the Upper WailuaHydro), Wailua (Lower Wailua Hydro), and the Kokee Ditch (Kitano Hydro). Maui:East/West Wailuailci Stream (East/West Wailuailci Hydro). Hawaii: Wailuku River(Wailuku Hydro) and Honolii (Honolli Hydro).
DBED. 1987. State Energy Resorces Coordinator Report. Honolulu.DBED. 1988. Hydroelectric Summary (Unpublished).DBED. 1989. The State of Hawaii Data Book. Honolulu.DPED/USDOE. 1981. Hydroelectric Power in Hawaii: A Reconnaissance Survey.
Prepared by Hirai and Associates, Hio.U.S. Army Corps of Engineers. May, 1975. National Program of Dam Safety (Un
published).USGS/DLNR DOWALD. November, 1981. Summary ofAvailable Data on Surface Water,
State of Hawaii Volume 1-Island of Kauai Open—File Report 81-1056. Honolulu.USGS/DLNR DOWALD. 1981. Summary of Available Data on Surface Water, State of
Hawaii Volume 2-Oahu, Molokai, Maui and Hawaii Open—File Report 81-1056.
Personal Communications
Beck, Curtis. Pacific Resources Incorporated, Hio. 1989.O’Brien, Tom. DBED, Energy Division. 1989, 1990.HSA Water Supply Committee. 1989-90.
95

Table 13 Hydroelectric Power
Active Hydroelectric plant active in 1988 Source Source of water used for hydro
Potential Hydroelectric potential --DPED 1981 Hydro Name Common reference name
Proposed Proposed hydroelectric plant Operator, surveyed by DPED, or
applicant gin 3)
Island Island location Cap. MW Megawatt capacity
Code HSA Stream Code Ann. mm kWh Annual output - million kilowatt hours
Island Code Source - Stream or Ditch Hydro Name Operator survey or
Active
Kauai Kekaha Ditch Waiawa Kekaha Sugar 0.48 1.80
N. Wailua Ditch LowerWaiahi LihuePlantation 036 4.30
N. Wailua Ditch Upper Waiahi LiliuePlantation 0.46 3.10
2-1-14 Wainiha Wainiha Hydro McBryde Sugar 3.60 30.00
Alexander Res. Kalaheo Pwrhse McBryde Sugar 1.00 5.00
2-4-04 Waimea Mauka Pwrhse Kekaha Sugar 1.00 5.60
2-4-04.01 Makaweli Olokele Olokele Sugar 1.25 6.00
Maui Wailoa Ditch Paia Hydro HC&S L00 3.00
Wailoa Ditch Hamakua HC&S 0.50 2.20
Wailoa Ditch Kaheka HC&S 4.50 19.00
6-1-04 Kauaula Kauaula Hydro Pioneer Mill 0.30 0.90
Hawaii Kohala Ditch Hawi Ha Ag. Engineer. 0.20 1.50
Harnakua Ditch Haina Hamakua Sugar 0.50 2.50
Ainalco Wenco En.. Wenco Energy om 0.10
8-2-49 Kaieie Hoowaiwai 0.05 0.20
8-2-60 Wailuku Waiau HELCO 1.00 6.30
8-2-60.01 Wainaku Puueo HELCO 2.25 12.80
8-5-03.02 Waikaloa Waimea Hawaii County 0.02 0.10
PotentialKauai Kokee Ditch - Kitano DPED 1.60 7.30
2-1-14 Wainiha DPED 3.70 17.40
2-1-15 Lumahai DPED 2.80 14.10
2-1-19 Hanalei DPED 2.55 11.46
2-1-19 Hanalei-Hanalei Tunnel DPED lAO 8.20
2-2-08 Wailua DPED 11.70 25.20
Molokai Molokai Tunnel-Kualapuu Res. DPED 0.07 0.30
4-1-09 Pelekunu DPED 0.86 3.79
4-1-21 Halawa DPED Z10 9.90

Island Code Source - Stream or Ditch Hydro Name
Maui Wahiawa Res. DPED 0.30 1.65
Hopoi Chute DPED 1.00 3.00
Honokohau Ditch DPED 0.13 0.83
Maui 6-2-03 Kahakuloa DPED 0.23 1.59
6-2-07 Waihee DPED 1.86 8.49
6-3-15 Nailiulihaele DPED 0.40 3.00
6-4-03 Kolea DPED 1.10 4.46
6-4-15,16 E & W Wailuailci OPED 2.75 15.08
6-4-22 Hanavi DPED 1.00 5.03
Hawaii Papaikou Mill DPED 0.10 1.00
Kohala Ditch - Union Mill DPED 0.50 4.60
Keaiwa-Meyer Reservoir DPED 0.28 1.65
8-1-16 Honokane Nui - East Branch DPED 1.10 6.19
8-1-16 Honokane Nui - Awini Falls DPED 1.50 7.68
8-1-44 Wailoa DPED 1.85 10.29
8-2-16 Pohakupulca DPED 0.60 2.30
8-2-39 Alia DPED 033 1.54
8-2-56 Honolii DPED 3.90 17.57
8-2-60 Wailuku DPED 2.00 11.07
ProposedKauai 2-1-14 Wainiha Upper Wainiha McBryde Sugar 3.80 20.00
2-1-15 Lumahai Lumahai Hydro Garratt Callahan 4.00 23.70
2-1-19 Hanalei HanaleiHydro Dominion 6.00 29.00
2-2-08 Wailua Wailua Hydro Bonneville 6.60 17.50
2-1-19 Hanalei Upper Wailua Bonneville 1.30 7.00
Maui 6-4- 15, 16 Wailuaiki E&W Wailuaiki Bonneville 2.70 7.90
Hawaii 8-2-56 Honolil Honolii Hydro Mauna Kea Power 14.60 35.00
8-2-56 Honolli Honolii Hydro Island Power 4.80 20.40
8-2-60 Wailuku Wailuku Hydro Garrett Callahan 5.00 17.70
8-2-60 Wailulcu Wailuku Hydro Kahala Energy 9.00 27.00
97
Channelization
Channelization in this study refers to the lining, partial lining or alteration of a streamcourse. Other channel alteration activities that can change the nature of a stream —
dredging and maintenance, for example — were not inventoried.
Channelization is generally undertaken to increase land available for development.This action can reduce the likelihood of frequent or sizable flooding, drain lowland areas,limit or prevent erosion, and allow for roadcrossings or other construction over thestream course. The type of channelization used depends on the purpose, effectiveness,cost of construction and maintenance, availability of land or right of way, steepness ofslope, soil conditions, and degree of concern for aquatic and riparian species, recreational opportunities, and aesthetics.
Seven types of channelization are inventoried in this study. Sources of information usedto compile the data in this section include the 1978 Timbol and Maciolek channelizationstudy, and permit files from the U.S. Army Corps of Engineers, DLNR Division ofWaterand Land Development, and county Departments of Public Works. The relatively largenumber of sources was necessary due to varying jurisdictions and periods of time thatagencies and researchers collected information.
Over 19 percent of Hawaii’s 376 perennial streams have been channelized to somedegree, including most of those on Oahu. Approximately 34 have been lined withconcrete or other material; one on Kauai, 26 on Oahu, four on Maui, and three on Hawaii.
BackgroundStreams can be a focal point of recreational or urban development, but they also create
physical barriers, overflow their channels during storms, and occupy valuable propertyas they meander through the landscape. Channelization has been used as a partialsolution to these problems. Indeed, it has become commonplace in Hawaii and elsewhere.
Channelization has had a major effect on the urban landscape since the first streamalterations in Hawaii in the early 1900s to huge concrete-lined channels today. It allowsflood waters to be carried out to sea away from people and property; stabilizes streambanks to prevent meanders and resulting erosion of valuable property; facilitates roadcrossings; and can even increase the amount of developable land by confining watersunderground and out of sight. These goals can and are being achieved by constructingextensive concrete lined channels and revetments with natural beds, installing culverts,or realigning the natural stream channel. Though there may be important benefits, there
98

are also important costs. Problems include effects on marine, aquatic and riparianspecies, changes in recreational values, reduced groundwater recharge and a decreasein scenic qualities.
The Department of Health (1989) states that “channels constructed to facilitate therapid transport and disposal of runoff from urbanized areas now discharge large volumesof storm water to the ocean. Much of this water would have normally seeped into theground before channellzation. Increases in the size and frequency of freshwater discharge events in Hawaii create imbalances in salinity and may limit coral growth orthreaten long-term survival of coral reefs.”
The City and County of Honolulu’s Water Management Plan (1980) also suggests thatchannelization can be quite harmful to marine animals. “Studies have shown this methodof storm water disposal to be harmful to environments near the channel discharges.Freshwater ‘slugs (storm induced flous)’ may cause severe degradation and even totaldestruction of saline sensitive biota.”
Parrish j. (1978) evaluated specific types of channelization from an aquatic resources perspective. They found that virtually every channelization project began by destroying some or all of the riparian vegetation and created short-term turbidity. Realignedchannels suffer primarily from increased velocity, excessive illumination and warmingdue to the removal of shade producing vegetation. Replanting could mitigate theseeffects to some degree. Revetments have characteristics similar to realigned channels.However, the artificial banks may increase water temperature and alter habitat characteristics.
Lined channels present serious problems (Parrish I. 1978). Habitat destroyedduring construction never recovers. Lined channels that are built oversize to accommodate storm-induced freshet flows, usually have shallow water which provides verypoor habitat for aquatic species. With the elimination of streamside vegetation and theconductivity of concrete/masonry substances, the shallow water heats up rapidly totemperatures lethal to some aquatic species. Mitigative measures such as low flownotches, periodic interruption of lined channels with natural channels, and shading canreduce some of the negative effects of lined channels.
The 1978 study also examined culverts and found that short, stream-level culverts didnot have a significant effect on aquatic organisms. Extended culverts, however, appearto provide unsuitable habitat due to the lack of illumination.
Generally, Parrish 1. (1978) recommended that any channelization should “amproximate the original channel length to retain natural water speed and avoid destructiveerosion below the channelized sections.”
Most types of channelization severely affect if not ruin the aesthetic qualities of astream. Concrete lined channels are usually oversized to accommodate 10-, 30-, or100-year floods. They are generally denuded of vegetation, and often enclosed inchain-link fences for public safety. “Present flood control design criteria in effect forcesconstruction of a lined channel or oversized concrete ditch” (Nuuanu Plan, 1974). TheHonolulu Building Code states that “every effort should be made to minimize floodpotential and to protect the lives and property of the inhabitants of the City and Countyof Honolulu.” It further states that “the owner shall dedicate and the city shall accept
99

the land or any interest in the land necessary for the drainage facilities.” In addition, “42inch fences may be required depending on the height of the wall or bank, shape of thechannel, or the location of the channel improvement and/or the possibility of peopleinjuring themselves because of the channel improvement” (City and County ofHonolulu,1988).
Channelized streams have very little recreational value. Small urban streams thatprobably once served as playgrounds for children are now concrete lined and fenceddrainageways. Large “canals,” such as Oahu’s Ala Wai and Kawainui, are boaters’havens. Some think that canals such as the Ala Wai actually enhance the aestheticqualities of urban streams. Other channels that are frequently dry are illegally used forskateboarding.
Once a stream is channelized, both the extent of potential flooding and the restrictionson development are reduced. However, the City and County of Honolulu land useordinance does allow for various types of construction in flood hazard districts. Development can co-exist with the natural stream characteristic flooding by elevating structuresabove the “regulatory flood elevation.” This approach has been used throughout thetropics in the past.
Streams can also be valuable resources for urban design. “Adequate flood control canbe provided without destroying the natural environment if aesthetic considerations aregiven top priority in design” (Nuuanu plan, 1974). “Flood control” can be accomplishedthrough land use and development guidelines or through less destructive artificial typesof channelization that incorporate mitigative measures and aesthetic considerations.
MethodsInventory
Members of the Physical Characteristics Committee from DOWALD helped determine the content of this inventory, the data sources, and the process that would be usedto gather that information. The committee decided to build upon the 1978 studyprepared byAmadeo Timbol and John Maciolek. This decision determined the structureof the database.
Data on the type, length and last date of channelization were collected for each streamidentified as altered. All of this information was tied to the data source. Permit numberswere also recorded when possible as references. Very short stream-level culverts are notincluded in this study.
Channelization TypesLined: An artificial channel, usually lined with concrete. It can have either a flatbottom or a modified “V”-shaped bottom. There is no natural bed. Streams withlined channels are noted in Table 7.
Lined with low flow notch: This is a lined channel with a notch in the bottom tocollect the lowest flow.
Realigned: The stream is realigned and the original riparian vegetation generallyremoved.
100

Culvert: Cylindrical drainage conduit.
Elevated Culvert - Used to carry streams under highways. Culvertsare elevated such that a waterfall is created on the downstream end.
Extended Culvert - A long culvert that is usually found inresidential areas.
Revetment: One or both banks are reinforced or replaced but the channel bedremains natural.
Drainageway Conduit in a waterway that is backfilled and used for other than avehicular crossing. it is not a culvert.
LengthThe length of the channelization was recorded when possible but the information was
not consistent nor recorded using the same scales. Timbol and Maciolek estimated thelength of the channelization in kilometers from the Real Estate Atlas. Length of projectsidentified through the COE permit files varied by applicant. Usually some size figurewas provided but occasionally it was the cubic yardage of fill material. DOWALDprovided HSA with all information regarding channelization projects regulated by theirStream Channel Alteration Permits (SCAP). County public works departments generally reported length in feet.
DateThe date a stream was last channelized was deemed important as a reference point and
for database updating purposes. Timbol and Maciolek (1978) collected constructiondates from government agencies. DOWALD and neighbor island public works departments provided dates from their records. City and County of Honolulu Public Worksdates were obtained from reports, personnel and from blueprints stamped “As Built.”COE dates were generally the date the permits were issued.
Permit NumberPermit numbers were provided for projects regulated by the COE or DOWALD.
Neither county public works departments nor Timbol and Maciolek (1978) providedpermit numbers.
Data Sourceslimbo! and Maciolek Timbol and Maciolek (1978) prepared a channelization inven
tory during the mid-1970s using field surveys and the 1975 Real Estate Atlas. Estimatesof length in kilometers were made from the Real Estate Atlas whenever possible, whilethe construction dates were obtained from government agencies. All data from theirreport are included in this study. Their information represents the majority of channellzation data prior to 1975.
Department Land and Natural Resources/Division ofWater and Land Development:DLNR has been charged with regulating the activities in Windward Oahu’s streams since1984. The DLNR also regulates all streams statewide (except on federal lands) throughits Stream Channel Alteration Permit (SCAP) process Since the passage of the StateWater Code in 1987. SCAPs are required for actions that “alter stream channel, or the
101
flow of water therein, by changing the shape of the channel, placing materials in orremoving materials from a stream channel” (Department of Planning and EconomicDevelopment, 1986).
DOWALD staff provided HSA with a list of pending and completed stream alterationprojects.
U. S. Army Corps of Engineers: The COE has jurisdiction over channelization up tothe stream headwaters. Headwater is defined as uppermost point on a non-tidal streamwhere the average annual flow is five cubic feet per second. The COE also has jurisdictionover projects which “will cause the loss or significant adverse modification of more thanone acre of waters of the United States” (including wetlands) (COE 1986).
The COE considers all factors relevant to the project including “conservation,economics, aesthetics, general environmental concerns, historic values, fish and wildlifevalues, flood damage prevention, land use, navigation, recreation, water supply, waterquality, energy needs, safety, food production and, in general, the needs and welfare ofthe people” before it issues a permit (DLU 1986).
DOWALD, COE staff, and the HSA Study Team determined that a review of the COEGeneral and Nationwide Permit indexes and files for channelization projects since 1976would identify the type, extent and location of recent projects.
County Public Works: HSA asked County Public Works Departments on each islandto provide a list of channelization projects that they were involved with between the yearsof 1976 and 1986 or more recent projects that had been done independent of eitherDOWALD or COE. This proved to be a manageable task for all counties exceptHonolulu. Information regarding channelization in Honolulu County was collected fromknowledgeable Public Works engineers, flood control reports, and subdivision maps.
ResultsMore than 70 streams have been channelized statewide (Table 7). Most of the
channelized streams are on Oahu and therefore only that island is mapped (Map 3). Atotal of at least 100 miles of perennial streams have been altered through channelizaiion.
DiscussionStreams that conflict with land ownership or land development plans often are chan
nelized. Stream channel alteration increases with urbanization pressure. The rate ofchannelization has not decreased since the 1978 channelization study, which revealedthe negative impacts of channelization on natural resources. Since the report, severalmiles of Tao stream were lined with a low flow notch at the bottom to improve the habitatfor aquatic species. However, a significant number of straightlined channels, those mostdestructive to aquatic habitat, continue to be constructed to this day.
102

Clearly a variety of factors are considered from the time decision is made to dosomething about flood control to the actual construction. But, once the decision tochannel the stream is made, the design is left primarily to an engineer. A mechanism isneeded whereby the enhancement of the habitat of aquatic organisms and aesthetics arefactored into the design decision before the project reaches the Commission on WaterResource Management for final decision.
Limitations
Government agencies on federal, state and county levels are all involved in thechannelization permit process. For some major projects, permits from all three agenciesmight be necessary, whereas for other projects, only one agency permit may be required.Information therefore, has had to be obtained from six different governmental agenciesfor channelization activity since 1977. This use of multiple sources has resulted in someduplication, inconsistancies and gaps of information. However, the number of sourceshas increased the reliability of the data.
HSA has relied primarily on Timbol and Maciolek (1978) for channelization information prior to 1977. Each agency source has a unique set of information based on differentpermitting times and jurisdictions for data after 1977. The information presented heremay not include:
o smaller channelization projects between 1976 and 1977;o channellzation projects on streams with less than 5 cfs between 1976 and 1984-86;
o channelization projects on streams with less than 5 cfs on federal lands;
o smaller scale development (subdivision developments) on neighbor islands priorto 1977 missed through field surveys (because Timbol and Maciolek onlyconsulted the Real Estate Atlas for Oahu);
o channelization within subdivision developments on Oahu between 1977 and 1987;and
o channelization project initiated in 1990 or later.
Channelization length is not measured consistently by the data sources. Some usekilometers, some feet, some cubic yards of fill. Others have added the total length ofstream bank revetted rather than the length of the stream affected. However, in anattempt to get a composite picture of channelization in the state, we have combined thisinformation. Most channelization measurements prior to 1976 are in kilometers; subsequent measurements are generally in feet. Since it is inappropriate to convert all of theinformation to the small-scale measurement “feet”, we have chosen to convert to miles,another common measurement. This figure must be used with extreme caution.
Future Research
One need identified by DOWALD staff was to locate all channelization. This wasdetermined to be important information that would be best illustrated on a map or GIS.This inventory does not identify all channelization developments in the state. Various
103

projects that are part of subdivision developments gain approval at the county level.Therefore a thorough review of subdivision blueprints at each county department ofpublic works would result in a more comprehensive inventory.
It would be very helpful for future inventories if every channelization project wasrequired to list the length of altered stream as part of the application.
Channelization has become the usual solution for construction and developmentprojects faced with stream-related issues. The impacts on aesthetic and natural resourcesin particular are increasingly apparent. Alternative solutions for flood control, floodavoidance, and living with floods are needed before all streams become channelized insome part of their reach. Mitigative and restoration techniques could be explored forstreams already channelized.
SourcesPublished and Unpublished Documents
City and County of Honolulu, Department of Land Utilization. 1988.Land Use Ordinance.Honolulu.
City and County of Honolulu, Department of Land Utilization. September 1989. PermitRegister.
City and County of Honolulu. Revised Ordinances of Honolulu. Building Code Article 6,Drainage and Flood Control.
City and County of Honolulu Public Works. Open Files. Various dates.Department Land and Natural Resources, Division of Water and Land Development.
October 1989. Stream Channel Alteration Permits. Internal Report. Prepared by Sterling Chow (Unpublished).
Department of Planning and Economic Development. June 1986. Applicants Guide to StatePermits andApprovaisforLand and Water Development. Honolulu.
Hathaway, Charles B. 1978. Stream Channel Modification in Hawaii. Part C: “Tolerance ofNative Species to Observed Levels of Environmental Variability.” FWS/OBS-78/18.Prepared for USFWS National Stream Alteration Team. Columbia, Missouri.
Norton, S.E., A.S. Timbol and J.D. Parrish. 1978. Strewn Channel Modification in Hawaii.Part B: “Effect of Channelization on the Distribution and Abundance of Fauna InSelected Streams.” FWS/OBS-78/17. Prepared for USFWS National Stream AlterationTeam. Columbia, Missouri.
Parrish, James D., John A. Maciolek, Amadeo S. Timbol, Charles B. Hathaway and SusanE. Norton. 1978. Strewn Channel Modification in HawaiL Part D: “Summary Report.”FWS/OBS-78/19. Prepared for USFWS National Stream Alteration Team. Columbia,Missouri.
Sierra Club Legal Defense Fund. September 1989. Petition to list Lentipes concolor as aThreatened and Endangered Species (Unpublished).
Timbol, A.S. and J.A. Maciolek. 1978. Stream Channel Modification in HawaiL Part A:“Statewide inventory of streams, habitat factors and associated biota.” FWS/OBS-78/16.Prepared for USFWS National Stream Alteration Team. Columbia, Missouri.
104

U. S. Army Corps of Engineers. 1976-1989. General and Nationwide Permit Files andIndex. COE permits are a result of Section 10 of the Rivers and Harbors Act of 1899,Section 404 of the Clean Water Act and Section 103 of the Marine Protection, Researchand Sanctuaries Act of 1972. Unpublished.
Personal Communications
Chow, Sterling. DLNR, DOWALD. 1989.Suzuki, Richard. City and County of Honolulu Public Works, Chief Drainage Engineer.
December 1989.Hawaii County Public Works. September 1989. Letter prepared by Robert Yanabu
(Unpublished).Kitabayashi, Kenneth. Kauai County Public Works. September 1989.Matsumoto, George. 1989, 1990. DLNR, DOWALD.
Maul County Public Works. November 1989. Letter from Alvin Fukunaga, Director ofPublic Works.
Samuels, Sherrie. DLNR, DOWALD. 1989, 1990.Kenai., Warren, Willy Chang and Phil Kim. US. Army Corps ofEngineers. Fall 1989, Spring
1990.
105
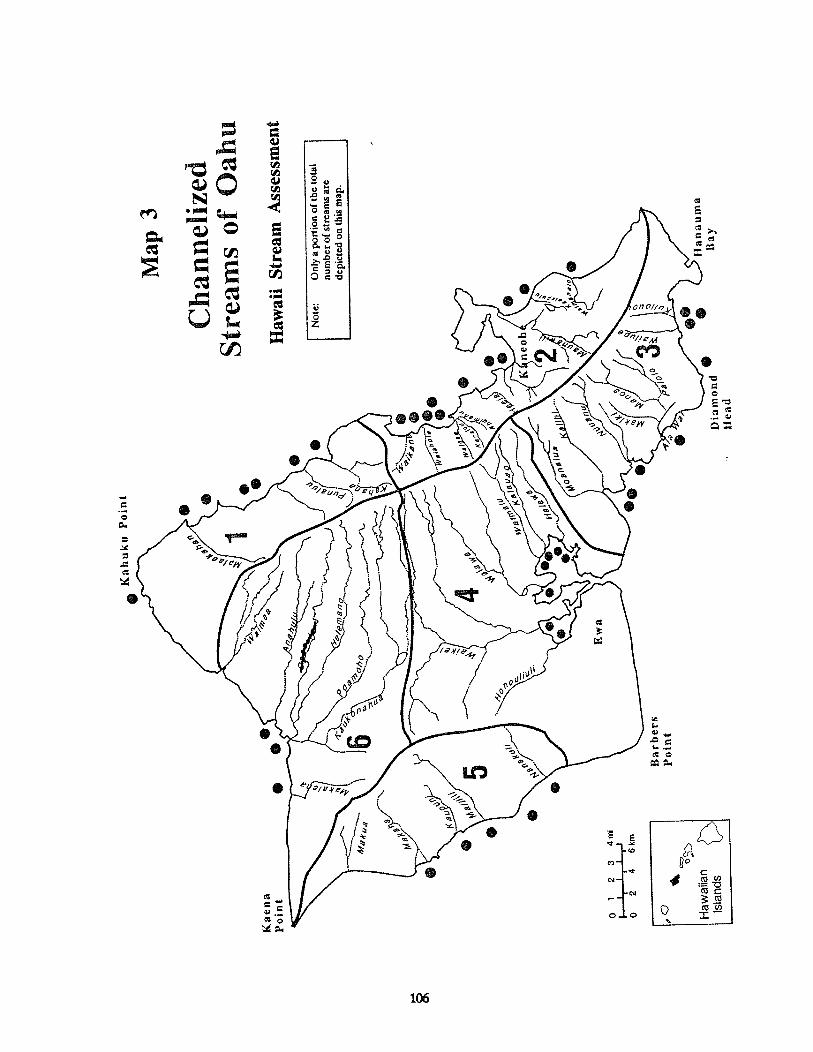
Po
int
Kaena
Poin
t,
0
Map
3
Cha
nnel
ized
Str
eam
sof
Oah
u
0H
awai
iS
trea
mA
sses
smen
t
TN
ote
:O
nly
port
ion
ofth
eto
tal
num
ber
of
stre
ams
arc
dep
icte
don
this
map
.
0
o1
23
4rii
II
II1
I—
iI
I
02
46
km
Barb
ers
Po
int
Iian
au
ma
Bay
Special Areas


Special Areas
Special areas are locales which have been identified by federal, state, county or privateagencies as having natural or cultural resources of particular value. These sites wereidentified because they were stream-associated, close to streams or because they encompass a stream or part of a stream. They may or may not have been established for theirstream resources. They include estuaries, embayments, wetlands, recovery habitats,natural area reserves, wildlife refuges and sanctuaries, private preserves, nationalnaturallandmarks, historic sites, and research and educational sites, parks, and waterfalls.Forest reserves, possibly the most important statewide special area, are not included inthis inventory because they are so widespread.
This chapter outlines the various types of special areas and their associated streams.The presence of these can serve as a flag for review when any development project isproposed in the vicinity, even if it is beyond the boundaries of a special area. Table 16 isa summary checklist.
Methods and ResultsA variety of different elements comprise this Special Areas section. Each element is
defined, the methods and sources documented and the general results noted. Thecategories used here and in Table 16 reflect the general nature of the information.
DesignationsNationwide Rivers InventoryThe National Park Service, in the early 1980s, identified rivers across the United States
eligible for Wild and Scenic River status. Generally these rivers were identified as havingoutstanding natural, cultural and recreational characteristics, andwere free-flowing andrelatively undeveloped. Eighteen Hawaiian streams and tributaries received this recognition.
Kauai2-4-04s Waimea tributaries Waialae and Koaie2-1-15 Lumahai2-5-16 Nualolo2-1-19 Hanalei2-1-10 Hanakapiai2-1-04 Kalalau
107

Molokai4-1-21 Halawa4-1-19 Kawainui4-1-13 Wailau
Maui6-4-22 Hanawi6-2-03 Kahakuloa6-5-13 Oheo and tributaries Palikea and Pipiwai
Hawaii8-2-33 Kolekole8-2-60 Wailuku8-1-35 Waimanu
Priority Aquatic SitesDr. George Fenwick, TNC’s National Project Director for Aquatic Ecosystems, iden
tified “Priority Aquatic Sites for Biodiversity Conservation” nationwide. This list in
cluded sites meeting one or more of the following criteria:
o Best intact remnants of damaged or declining systems;
o Best opportunities for protection of representative viable examples of majorregional systems;
o Sites of endangered species;
o Sites of endangered communities.
Kauai2-1-15 Luniahai2-4-04s Waimea2-1-14 Wainiha
Molokai4-1-09 Pelekunu
Maui6-5-11,12 Puaaluu-Hahalawe6-4-04 Waikamoi6-4-22 Hanawi6-4-09 Honomanu-Keanae
High Quality StreamsUSFWS developed a statewide “List ofHigh Quality Streams” in 1988 for DLNR, using
the following criteriao High habitat value for native, migratory stream animals
o Presence of candidate endangered species Lentipes concolor-,
o Presence of riparian wetlands of value to migratory birds and endangeredHawaiian waterbirds;
o Recognition on the Hawaii Component list of the NPS’s Nationwide RiversInventoay,
o Streams in National Parks or Wildlife Refuges, State Wilderness Areas, NaturalArea Reserves, and private nature preserves;
o Streams that are the subject of ongoing scientific research projects.
108

More than 80 Hawalian streams were identified as High Quality. These are listed inthe database.
National Natural Landmarks and proposed NNLNational Natural Landmarks are established “to protect the best examples of physical
and natural landmarks for this and future generations.” NNL and proposed NNL wereidentified by the National Park Service Cooperative Park Research Unit.
National Natural LandmarksMolokai Cliffs4-1-09 Pelekunu4-1-10 Waipu4-1-11 Haloku4-1-12 Oloupena4-1-13 Puukaoku4-1-14 Waiele4-1-15 WailauTao Valley6-2-09 lao
Proposed National Natural LandmarksMixed Lowland Forest2-1-08 WaiahuakuaEragrostis Grasslands6-1-03 LaniupokuMontane Bogs6-1-05 Kahoma6-1-07 Honokowal6-1-11 HonokohauPandanus Forest6-4-32 Kawakoe tributary Mokulehua6-4-33 Honomaele
Marine
Marine Life Conservation Districts/Fishery Management AreasMarine Life Conservation Districts are established by DLNR to protect, conserve, and
propagate marine life by prohibiting or limiting consumptive uses of the marine resour
ces. Honolua Stream on Maui is the only stream-associated MLCD.
Fishery management areas were established by DLNR to enhance and improve near-
shore recreational fishing by restricting certain types of fishing activities within the high
water marked boundaries of the area. Three stream-associated FMAs were identified
on Oahu Waialua Stream, Ala Wai Canal, and Kapalama Canal.
National Estuarine Research ReserveResearch Reserves serve as field laboratories managed for long-term environmental
monitoring and scientific research on estuaries. While NOAA is responsible for designating and adminictering the NERR Program, management of the Reserve is left up to
the state. In Hawaii, the program was established as part of the Coastal Zone Manage-
109

merit Act of 1972 and is administered by the Natural Area Reserve System. There is only
one NERR in Hawaii, at Waimanu, Hawaii, which encompasses eight streams.
Estuaries and EmbayznentsEstuaries and embaynients provide important habitat for terrestrial, marine and
aquatic species. Their importance to the life cycle of various species is not fully understood, but they may be critical to the survival of some species. The distinction betweenan estuary and an embayment is not always precise. Sometimes the definition depends
on one’s perspective, be it scientific or jurisdictional.
EstuariesEstuaries are defined by the DOH as “deep, characteristically brackish coastal waters
in well defined basins with a continuous or seasonal surface connection to the ocean thatallows entry of marine fauna. Estuaries maybe either natural, occurring mainly at streamor river mouths; or developed, artificially, or strongly modified from the natural statesuch as dredged and revetted stream termini” (lIAR, Chapter 11-54).
Estuaries were identified by two sources: John Ford, USFWS; and the EstuarineSanctuary Site Selection Program, developed by DPED’s Coastal Zone Management
Program with the National Oceanic and Atmospheric Administration (NOAA).
“Tentative List of Estuaries in the Hawaiian Islands,” prepared by Ford, was based onthe Department of Health definition stated above. It represents his professional opinionbased on his personal knowledge with reference to USGS quadrangle maps and doesnot include quality judgments. He recommends field confirmation of these sites. Morethan 50 streams have associated estuaries by Ford’s count (Table 14).
The DPEDINOAA estuary list was prepared as part of the National Estuarine
Sanctuary Program Site Evaluation. The database includes and distinguishes betweenthose estuaries inventoried and those determined to be of high quality. These estuariesnumber around 15 and were coded to streams by lISA (Table 14).
EmbaymentrEmbayments are described by the DOH as “land confined and physically protected
marine waters with restricted openings to open coastal waters defined by the ratio of
total bay volume to the cross-sectional entrance area of seven hundred to one or greater”
(lIAR, Chapter 11.54).
Embayments included in the database were identified from two sources: the State
Department of Health and the Estuarine Sanctuary Site Selection Program.
The DOH classified the water quality of each embayment as AA or A. DOH recommends that Class AA embayments “remain in their natural pristine state as nearly as
possible with an absolute minimum of pollution or alteration of water quality from anyhuman-caused sources or actions. To the extent practicable, the wilderness character of
these areas shall be protected.” Class A waters are suggested for protection for recreational and aesthetic enjoyment. “Any other use shall be permitted as long as it is
compatible with the protection and propagation of fish, shellfish and wildlife and with
recreation in and on these waters.” Embaymentswere associated with 41 streams flowing
into them as indicated on USGS maps (Table 14).
110

The 1974 CZMJNOAA list was prepared as part of the National Estuarine SanctuaryProgram Site Evaluation. The database includes both those embayments inventoried andthose that received the highest score. Scores were based on the following criteria:
o Fits the definitions of an estuarine sanctuary;o Would provide pertinent CZM input;o Has potential for non-destructive multiple use;o Conflicts least with existing uses, owners, and zoning;o Is of documented scientific or public concern;o Threats to current conditions are perceivedo Has relevant research potential if preserved;o Is in a relatively unaltered pristine condition;o Ecological condition can be preserved through acquisition;o Best land ownership conditions for state equity.
Embayments were associated with the streams that flow into them as shown on USGSmaps (Table 14).
Historic
Historic SitesThe National Register of Historic Places lists sites that are associated with events or
the lives of significant persons, embody distinctive characteristics, historic or prehistoricinformation or cultural significance. These sites are given special designation but littleprotection. The State Register ofHistoric Places also lists historic sites. Stream relatedhistoric sites included on the national and state lists were included in the database.
111

Table 14 Estuaries and Embayments
Estuaiy Embayment
I Identified by3ohn Ford or CZM / Identified by CZM
+HighQualitybyCZM + IdenfiedashighqualitybyCZM
A DOH Water Quality Classification
AA DOH Water Quality Classification
CODE NAME ES11JARY EMBAYMEW1
2-144 Wainiha R /2-1-15 Lunaahai K / +2-1-16 Waikoko + ,AA2-1-17 Waipa + ,AA2-1-18 Waioli I + ,AA2-1-19 Hanalei R. + + ,AA2-1-20 Waileza +,AA2-1-25 Kalihiwai R. I2-1-28 Kilauea I I2-2-01 Anahola I2-2-04 Kapsa I2-2-06 Waikaea Canal /2-2-08s Wailua R. System /2-2-12 flanamaulu / A2-2-13 Nawiliwili A2-2-14 Puali2-2.15 Hulcia / A2-3-06 Wahiawa A2-3-07 Hanapepe / A2-4-04. Waimea R. System / I3-1.13 Kaluanui /3-1-16 Punaluu I3-1-18 Kahana + +,.AA3-2-07. Kahaluu K. System I3-2-88 Hecia AA3-2-09 Keaahala AA3-2-10 Kancohe AA3-2-11 Kawa / AA3-2-13 Kawainui/Maunawili I3-2-15 Waimanalo I /3-3-03 Kuliouou I3-3-07. Ala Wai C. System / A3-3-09 Nuuanu / A3-3-10 Kapalama / A3-3-11 Kalihi / A3-3-12 Moanalua I A3-4-02 Halawa / A3-4-03 Aica I A3-4-04 Kalauao / A34-05 Waimalu I A3-4-06 Waiawa / A3-4-10 Waikele / A3-4-fl Honouliuli / A3-5-05 Kaupuni A3-6-06. Kiikn System / A3-6-07. Paukauila System / A3-6-08. Anahulu System I AA4-1-09 Pelekunu /4-1-15 Wailau /4-1-21 Halawa + +6-1-05 Kahoma A6-1-10 Honolua + +6-2-10 Waikapu I6-4-01 Oopuola I64-09 Honomanu I8-1-15 Pololu I I8-1-35 Waimanu + +8-1-44 Waioa/Waipio + +8-2-32 Hakalau /8-2-33 Kolekolc /8-2-43 Kawainui I8-2-56 Hoto4li I8-2-59 Pukihac A8-2-60 Wailuku R. I A8-2-61 WailoaR. I A
112

Habitat
Natural Area Reserve SystemThe Natural Area Reserve System was established by DLNR “to preserve and protect
in perpetuity, unique and representative samples of [the state’s] remaining naturalenvironment.” These environments encompass bogs, grasslands, marine coastal reefs,forests, lava flows, coastal dunes and ice-age terrain. NARS maps were used to associatethe protected areas with streams.
Hono 0 Na Pall NAR2-1-07 Hanakoa2-1-08 Waiahuilua2-1-09 Honolulu2-1-10 Hanakapiai
Kuia NAR2-5-16 Nualolo
Mount Kaala NAR3-6-06s Kiiki System, Kaukonahua (3-6-06.02)3-6-04 Makaleha3-6-07 Paukauila
Puu Alii NAR4-1-03 Waikolu4-1-04 Wainene4-1-05 Anapuhi4-1-06 Waiohookalo
Olokui NAR4-1-10 Waipu4-1-11 Halekou4-1-12 Oloupena4-1-13 Puukaoku4- 1-14 Wailele
West Maui NAR--Kahakuloa Section6-2-02 Honanana6-2-03 Kahakuloa6-2-06 Makamaksole6-2-01 Poelua
West Maul NAR--Panaewa Section6-1-OS Kahoma tributaries6-1-05.01 Halona and Kanaha
West Maui NAR--Honokowai Section6-1-07 Honokowai tributary Amau
Hanawi NAR6-4-17 Kopiliula6-4-21 Kapaula6-4-22 Hanawi6-4-23 Makapipi6-4-24 Kuiiiwa6-4-31 Heleleikeoha
PuuOUmiNAR8-1-16 Honokane Nui
113

8-1-33 Kaimu8-1-34 Pae8-1-35 Waimanu8-1-44 Wailoa tributaries Kawainui and Kawaild8-1-42 Waipahoehoe8-5-0101 Waikoloa tributary Kohakohau
Lapahoehoe NAR8-2-05 Kilau8-2-09 Kaiwilahilahi8-2-10 Haakoa8-2-11 Pahale
Plant SanctuaryPlant sanctuaries are small areas (usually fewer than 50 acres) set aside to preserve
remnant populations of rare native plant species. The State Division of Forestry andWildlife (Dr. Carolyn Corn) informed HSA that at present there are no stream-relatedplant sanctuaries.
Waterbird Recovery HabitatThese habitats were identified by USFWS as locations that, if protected, would help
foster the recovery of threatened and endangered species of birds. This listing protectsthe areas from projects involving state and federal dollars but provides no protectionfrom private developers. Management recommendations such as acquisition, cooperation with landowners, and cooperative agreements are also noted. Recovery habitatswere associated with over 40 streams by the USFWS (John Enbring and Andy Yuen).
Private PreservesNature Conservancy of Hawaii manages land in Hawaii for the purpose of protecting
unique natural environments and rare and endangered species of plants and animals.Nature Conservancy Preserves were associated with streams by the HSA with theassistance of TNCH (Audrey Newman).
Pelekunu Preserve-TNCH4-1-04 Wainene4-1-05 Anapuhi4-1-06 Waiohookalo4-1-07 Keawanui4-1-08 K4iliili4-1-09 Pelekunu
Puu Kukui Watershed Management Area-TNCH6-1-08 Kahana6-1-09 Honokahua6-1-10 Honolua6-1-11 Honokohau
Waikamoi Preserve-TNCH6-4-04 Waikanioi6-4-06 Puohokamoa6-4-07 Haipuaena
114

6-4-09 Honomanu6-4-10 Nuaailua6-4-11 Piinaau6-4-14 Wailuanui6-4-15 W.Wailuaiki6-4-16 E. Wailuaiki6-4-17 Kopiliula
Wildlife RefugesWildlife refuges are established by the USFWS to provide important habitat for
wildlife. These refuges were tied to streams by HSA with the assistance of the USFWS(John Ford).
2-1-19 Hanalei R.2-2-15 Huleia3-4-11 Honouliuli8-2-30 Umauma8-2-32 Hakalau8-2-33 Kolekole8-2-53 Kapue8-2-56 Honolii8-2-60 WailukuR.
Wildlife SanctuaryWildlife sanctuaries are established for “the conservation, management, and protection
of indigenous wildlife” (HRS 13-125-3). Sanctuary maps were reviewed to tie PaikoWildlife Sanctuary to Kuliouou Stream on Oahu.
Parks
National ParksNational Parks are established “to preserve physical, natural, and cultural resources
for the enjoyment of this and future generations.” The four perennial streams that flowthrough National Parks in Hawaii were identified on USGS quad maps, and included inthe database.
Kalaupapa National Historic Park4-1-01 Waihanau4-1-02 Waialeia4-1-03 Waikolu
Haleakala National Park6-5-13 Oheo
State ParksState Parks are established “to make available examples of Hawaii’s natural, cultural,
and scenic treasures. Attempts are made to interpret the natural and cultural areas todevelop a keener public awareness, appreciation and understanding of [Hawaii’s] richlegacy. The exceptional scenic areas are managed for their aesthetic and inspirational
115

values while vantage points are developed for their superb views of [Hawaii’s]
landscape.” Hawaii’s state parks range from highly landscaped areas to wilderness.
2-1-03 Nakeikionaiwi2-1-04 Kalalau2-1-05 Pohakuao2-1-06 Waiolaa2-1-07 Hanakoa2-1-08 Waiahuakua2-1-09 Hoohilu2-1-10 Hnibpiai2-1-11 Maunapuluo2-2-08s Wailua R. System2-4-046 Waimea R. System3-1-18 Kahana
County ParksCounty Parks are established for recreational use. Restrooms, drinking water, showers
and pavilions are often providei
2-1-13 Manoa2-1-19 Hanalei2-2-06 Waikaea Canal2-2-14 Puali3-3-11 Kalihi4-1-21 Halawa8-1-13 Niuhil8-2-24 Waikaumalo8-2-33 Kolekole
Research and Education
Agriculture, Aquatic and Aquaculture Research Sites
The inventory of research sites with existing or proposed facilities include UH Agricul
turalExperiment Stations, TNCWs proposed aquatic research site and UH aquaculture
research sites and taro research. Stream related taro research takes place near the
Limahuli (2-1-12), Hanalci (2-1-19), Wailua (2-2-08s), Manoa (3-3-07s) and Kaupuni
(3-5-05). Other sites include aquaculture research at Hakipuu (3-2-01), and proposed
aquatic research at Pelekunu (4-1-09)
Nature Study AreasNature Study Areas include established educational facilities or published guides to
streams, botanical gardens and arboretums. Most of these sites were identified by the
HSA Recreation Committee. The Bishop Museum’s Ohia Project proposed program
sites will also be included in this category upon completion.
2-1-U Limahuli2-1-19 Hanalei R.2-2-13 Nawiliwili2-3-04 Lawai
116

3-1-18 Kahana3-2-05 Kaalaea3-2-10 Kaneohe3-3-07.01 Manoa3-3-09 Nuuanu3-3-10 Kapalama3-3-12 Moanalua3-5-05 Kaupuni3-6-10 Waimea R.6-2-09 lao6-2-10 Waikapu6-3-01 Maliko6-4-11 Piinaau6-4-33 Ulaino8-2-46 Hanawi
NASQANComprehensive water quality data are collected at six USGS NASQAN sites. These
are the Waimea River, Kauai; Waikele Stream, Oahu; Kaithi Stream, Oahu; HalawaStream, Molokai; Kahakuloa Stream, Maui; and Wailuku River, Hawaii. See WatcrQuality Chapter.
BenchmarkUSGS maintains one monitoring station in Hawaii for long-term National monitoring
of water quality and other hydrologic information. This benchmark station is on theHonolii on Hawaii.
Wetlands
Wetlands serve as reservoirs for storm-water, groundwater recharge areas, filters forwater-borne pollutants before they reach groundwater and/or inshore waters, habitat forwaterbirds, and open space.
There are several definitions ofwetlands. However, the termgenerally includes streamsand refers to areas where:
o the soil is covered or saturated with water (ground or surface) continuously or atsome time of the year,
o the substrate is primarily characterized by undrained moist or saturated soils; and
o the land supports water-loving plants (SRFP, February 1988).
The HSA database contains information from three different sources: the Universityof Hawaii Environmental Center Wetland Database (1990), Elliott and Hall (1977), andUSFWS (1978). Each inventory lists a somewhat different type of wetland.
The U.H. Environmental Center (UHEC) Wetland Database contains information onwetlands fed by groundwater. These sites were identified by John Mink and Steven Lauof the U.H. WaterResources Research Center. The UHEC database is currently limited
117

to sites identified on Oahu and Maui. The Environmental Center searched its database
for 26 stream-associated wetlands and provided HSA with this information.
Geographers Marge Elliott and Erin Hall define wetlands as land areas “where water
(fresh, saline or brackish) is the major factor controlling the development of soils and
the development of the vegetative cover, if present.” All wetland maps and descriptions
included in their publication “Wetlands and Wetland Plants in Hawaii” were reviewed
for reference or proximity to streams. Those 19 that appeared to be stream-associated
were entered into the HSA database.
USFWS previously classified a wetland as an area having one of the following condi
tions:o open standing water,
o the presence of hydrophytic vegetation (plants that grow in saturatedconditions); or
o presence of hydric soils.
From that general definition it separates wetlands into five types: Marine; Estuarine;
Riverine; Lacustrine; and Palustrine. The USFWS (Andy Yuen) determined that
Palustrine wetlands (89 percent of Hawaii’s wetlands) were stream-related resource
systems and recommended that HSA include them in the inventory. This type ofwetland
is associated with inland marshes, bogs and swamps. The size varies greatly. All
Palustrine wetlands indicated on the 1978 USFWS wetland maps were included in the
database. More than 200 streams have associated Palustrine wetlands.
Waterfalls
The list of waterfalls was taken from the 1990 draft of National Landmarks of theHawaiian Islands. This paper cites the Atlas of Hawaii as its source for waterfalls and
notes that it is not exhaustive. The criteria used for the Atlas of Hawaii list of “Major
Named Waterfalls” is: largest named waterfall on each major island, either in height oraverage discharge; all other named falls 250 feet or higher; and well-known smaller falls.
Waterfalls noted in the index of Bier’s reference maps of Hawaii were also included.
Table 15 lists waterfalls from both sources.
DiscussionImpacts on special areas may occur as a result of actions far beyond the boundaries. It
has become apparent that stream flows may be affected by distant tunnels and wells,
aquatic species are affected by channelization, and watershed erosion and urban runoff
end up downstream. Developments and other management decisions should be reviewed
for their impact on these areas.
This is a fairly complete list of stream-associated special areas. It should serve as a
preliminary checklist against which impacts of proposed developments should be
measured. However, this list may not be inclusive of all of the special areas throughout
118
the state and a more thorough search for special areas associated with proposeddevelopments may be warranted.
SourcesPublished and Unpublished Documents
Division of Historic Sites. State Register of Historic Places.
Department of Land and Natural Resources. March 1988. Wetland Resource Addendum.
State Recreation Functional Plan Technical Reference Document and State OutdoorRecreational Plan (SCORP).
Elliott, Margaret E. and Erin Marie Hall. September 1977. Wetlands and Wetland Vegeta
tion ofHczwaiL Prepared for the U. S. Army Corps of Engineers. Fort Shafter, Hawaii.
Environmental Center. 1989. Wetlands Inventory and Assessment Database. (Oahu andMaui)
Ford, John I, U. S. Fish and Wildlife Service. February 1988. “Tentative List of Estuariesin the Hawaiian Islands.” Honolulu. (unpublished)
Hawaii Revised StatutesChapter 11, Department of Health, Hawaii AdministrativeRules. Honolulu. January 14,1988.Chapter 125, Department of Land and Natural Resources.September 1981.
The Nature Conservancy. 1985. “Priority Aquatic Sites for Biodiversity Conservation”Prepared by George Fenwick, National Project Director for Aquatic Ecosystems.
National Park Service. 1982. Nationwide Rivers Inventory.
U. S. Fish and Wildlife Service. 1985. Recovery Plan for Hawaiian Waterbirds. Portland,Oregon.
U. S. Department of the Interior. National Register of Historic Places.
Maps
Department of Land and Natural Resources. Division of State Parks. State Park Map.
Department of Land and Natural Resources. NARS Maps.
U. S. Fish and Wildlife Service. 1978. Wetlands Maps. Portland.
U. S. Geological Survey. Quadrangle Maps.
Personal Communications
Smith, Clifford. CPSU, University of Hawaii.
Gon. ifi, Sam, and Audrey Newman. The Nature Conservancy.
Ford, John. USFWS.
119

Table 15 Hawaii’s Waterfalls(Best known falls are boldfaced)
KauaiHanakoa Falls (Hanalcoa 2-1-07)Hinalele Falls (Wainiha 2-1-14)Puwainui Falls (Wainiha 2-1-14)Keanaawi Falls (Hanalei 2-1-19)Hoopouli Falls (Anini 2-1-21)Waihunehune Falls (Kalihiwal 2-1-25)Kilauea Falls (Kilauea 2-1-28)Waianuenue Falls (Wailua System 2-2-08s)Kapalcanui Falls (Wailua System. 2-2-08s)Wailua Falls (Wallua System 2-2-OSs)Mana Waipuna Falls (Waliua System 2-2-08s)Koholalele Falls (Wailua System 2-2-08s)Opaekaa Falls (Wallua System 2-2-08s)Halii Fails (Wailua System 2-2-08s)Uhauiole Falls (Wailua System 2-2-08s)Kapalcaiki Falls (Wailua System 2-2-08s)Ooiki Falls (Hanapepe 2-3-07)Kahill Falls (Hanapepe 2-3-07)Waipoo Falls (Waimea System 2-4-04s)Mohihi Falls (Waimea System 2-4--04s)Hihinui Falls (Waimea System 2-4-04s)Oopulele Falls (Waimea System 2-4-04s)Aini Falls (Waimea System 2-4-04s)Moeloa Falls (Waimea System 2-4-04s)Waialae Falls (Waimea System 2-4-04s)Waikaka Falls (Waimea System 2-2-04s)
OahuSacred Falls (Kaluanul 3-1-13)Manoa Falls (Ala Wai System 3-3-07s)Kahuawai Falls (Nuuanu 3-3-09)Waipuhia (Nuuanu 3-3-09) (upside down falls)Waihee (a.k.a. Waitnea) Falls (Waimea 3-6-10)
MolokaiHaloku Falls (Haloku 4-1.11)Oloupena Falls (Oloupena 4-1-12)Wailele Falls (Wailele 4-1-14)Kalilwa Falls (Kahiwa 4-1-18)Hipuapua Falls (Halawa 4-1-21)Moaula Falls (Halawa 4-1-21)Mooloa Falls (Kamaio 4-2-14)Haha Falls (Kamalo 4-2-14)Hina Falls (Kamalo 4-2-14)
120

MauiHonokohau (Honokohau 6-1-11)Waiohiwi Falls (Maliko 6-3-01)Twin Falls (Honopou 6-3-08)Puohokamoa (?uohokamoa 6-4-06)Haipuaena Falls (Haiuaena 6-4-07)Waiokilo Falls (Waikainilo 6-4-13)Waikani Falls (Wailuanui 6-4-14?)Kopiliula Falls (Kopiliula 6-4-17)Wailua Falls (Wailua 6-5-07)Waihiumalu Falls (Wailua 6-5-07?)Kekuapoowai Falls (Wailua 6-5-07)Kanahuali’i Falls (Honolewa 6-5-08)Waimoku Falls (Palikea/Oheo 6-5-13)“Seven Sacred Pools” (PallkeqOheo 6-5-13)Kipahulu Falls (Koukouai 6-5-15)
HawailWaulikahi Falls (Waimanu 8-1-35)Kaluahine Falls (Wailoa (8-1-44)Ilonokane Nul (Kohala Ditch to Anini Ditch)Hillabi Falls (Lalakea 8-1-45)Hikiau FaIls (Kupapaulua 8-1-88)Kahuna Falls (Kaahakini 8-2-62)Akaka Falls (Kolekole 8-2-33)Waiemi Falls (Hanawi 8-2-46)Waialae Falls (Honolii 8-2-56)Wahiloa Falls (Wailuku 8-2-60)Hali Falls (Wailuku 8-2-60)Rainbow Falls (Wailuku 8-2-60)Kaimukanaka Falls (Wailuku 8-2-60)Waiale Falls (Wailuku 8-2-60)Peepee Falls (Wailuku 8-2-60)Naalapa Falls (Wailoa 8-2-61)
SourcesDepartment of Geography, University of Hawaii. 1983. Atlas ofHawaii, 2nd Edi
tion. UH Press.Bier, James A. Reference Maps of the Islands of Hawaii. Third and Fourth Edi
tions. UH Press.Bigelow, Gordon. 1990. Natural Landmarks of the Hawaiian Islands, Geological
Themes, Preliminary Evaluation of Significance. Department of General Science,UI! Manoa. (in draft)
MacDonald, Abbott and Petersen. Volcanoes in the Sea. 2nd Edition.
121
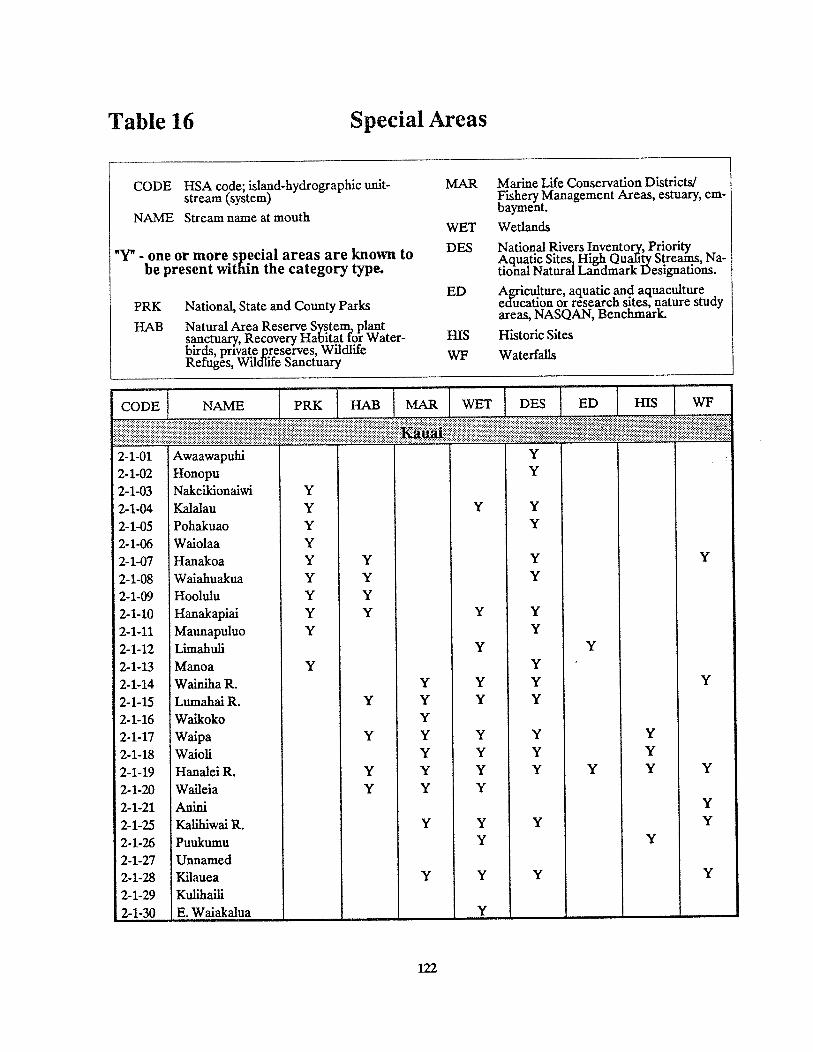
Table 16 Special Areas
CODE NAME PRK HAB MAR WET DES ED HIS WF
_____ ____________ _____
Kaai
_____ ______ ___________________
2-1-01 Awaawapuhi Y
2-1-02 Honopu Y
2-1-03 Nakeikionaii Y
2-1-04 Kalalau y y y
2-1-05 Pohakuao y y
2-1-06 Waiolaa Y
2-1-07 Hanakoa Y Y Y Y
2-1-08 Waiahuakua Y Y Y
2-1-09 Hoolulu Y y
2-1-10 Hanalcapiai Y Y Y Y
2-1-11 Maunapuluo Y Y
2-1-12 Limahuli Y Y
2-1-13 Manoa Y Y
2-1-14 WainihaR. Y Y Y Y
2-1-15 LumahaiR. Y Y Y Y
2-1-16 Waikoko Y
2-1-17 Waipa Y Y Y Y Y
2-1-18 Waloli Y Y Y Y
2-1-19 HanaleiR. Y Y Y Y Y Y Y
2-1-20 Waileia y y y
2-1-21 Anini y
2-1-25 KalihiwaiR. Y Y Y Y
2-1-26 Puulcumu Y Y
2-1-27 Unnamed2-1-28 Kilauea Y Y Y Y
2-1-29 Kulihaili
2-1-30 E. Waiakalua Y
CODE HSA code; island-hydrographic unit-stream (system)
NAME Stream name at mouth
- one or more special areas are known tobe present within the category type.
MAR Marine Life Conservation Districts/Fishery Management Areas, estuary, embayment.
WET Wetlands
PRK National, State and County Parks
DES National Rivers Inventory, PriorityAquatic Sites High Oualiy Streams, National Natural Landmark Designations.
HAB Natural Area Reserve Systen, plantsanctuary, Recovery Habitat for Water-birds, private preserves, WildlifeRefuges, Wildlife Sanctuary
ED Agriculture, aquatic and aquacultureeducation or research sites, nature studyareas, NASQAN, Benchmark.
HIS Historic Sites
WF Waterfalls
122

CODE NAME PRK HAB MAR WET DES ED HIS WF
2-1-31 Pilaa2-1-32 W. Waipalce2-1-33 E. Waipake2-1-34 Moloaa Y Y
2-1-35 Papaa Y2-1-36 Aliomanu Y
2-2-01 Anahola Y Y2-2-02 Kumukumu2-2-04 Kapaa Y Y Y2-2-05 Moikeha Canal Y2-2-06 Waikaea Canal Y Y Y
2-2-08s Wailua S. Y Y Y Y y2-2-10 Kawailoa2-2-12 Hanamaulu Y Y Y
2-2-13 Nawiliwili Y Y y y
2-2-14 Puali Y Y Y
2-2-15 Huleia Y Y Y y y
2-3-01 Kipu Kai Y2-3-02 Waikomo Y Y Y2-3-04 Lawai Y Y Y2-3-06 Wahiawa Y Y y2-3-07 Hanapepe Y Y Y Y
2-4-01 Mahinauli Y2-4-02 Aa1cukñ y
2-4-03 Waipao Y2-4--04s Waimea S. Y Y Y Y Y Y Y
2-5-06 Kinekine Ditch Y2-5-07 Kaawaloa Y2-5-08 Nahomalu Y2-5-09 Kaulaula Y2-5-10 Haeleele Y2-5-13 Kauhao2-5-15 Miolil2-5-16 Nualolo
_______ _______ _______
3-1-03 Paumalu y
3-1-04 Kawela Y
3-1-05 Oio Y
3-1-06 Malaekahana Y
3-1-07 Kahawainui Y Y
3-1-08 Wailele Gi. Y Y
3-1-09 Koloa Gi. Y Y
YY
Y Y
123

CODE NAME PRK HAB MAR WET DES ED HIS WF
3-1-10 Kaipapau Y
3-1-11 Maakua3-1-13 Kaluanui Y Y Y Y
3-1-16 Punaluu Y Y
3-1-18 Kahana Y Y Y Y Y Y
3-1-19 Kaaawa Y
3-1-20 Malcaua Y
3-1-21 Unnamed3-2-01 Haldpuu Y Y
3-2-02 Waikane Y
3-2-03 Uflflaflled y
3-2-04 Waiahole Y
3-2-05 Kaalaea Y
3-2-07s Kahaluu S. Y Y
3-2-08 Heeia Y Y Y
3-2-09 Keaahala Y Y Y
3-2-10 Kaneohe Y Y Y Y Y
3-2-11 Kawa Y Y Y
3-213Kawainui/
Maunawili3-2-14 Kaelepulu Canal Y Y
3-245 Waimanalo Y Y Y
3-3-03 Kuliouou y y y
3-3-04 Nm Y
3-3-05 Wailupe Y y
3-3-06 Waialaenui Y
3-3-07s Ala Wai S. Y Y y y y
3-3-09 Nuuanu y y y y y y
3-3-10 Kapalama Y Y Y
3-3-11 Kalilai y y y y y
3-3-12 Moanalua Y
3-4-02 Halawa y y
3-4-03 Aiea Y Y
3-4-04 Kalauao y y
3-4-05 Waimalu Y Y Y
3-4-06 Waiawa Y y
3-4-10 Waikele Y Y Y Y
3-4-11 Honouliuli Y Y Y Y
3-5-01 Nanakuli Y
3-5-02 Ulehawa3-5-04 Mailiili y
3-5-05 Kaupuni y y
3-5-07 Malcalia y y
3-5-08 Makua y
3-6-03 Unnamed
_____
y
124

po
Jo

TCODE 1 NAME PRK TAB WET DES j ED HIS WF
Y Y
YY
YY
Y Y
6-1-016-1-026-1-036-1-046-1-OS6-1-066-1-076-1-086-1-096-1-106-1-116-2-016-2-026-2-036-2-OS6-2-066-2-076-2-086-2-096-2-106-3-016-3-026-3-036-3-046-3-056-3-076-3-086-3-096-3-106-3-116-3-126-3-136-3-146-3-156-4-016-4-026-4-036-4-046-4-4)66-4-076-4-086-4-096-4-106-4-11
UkumehameOlowaluLauniupokuKauaulaKahoinaWahikuliHonokowaiKahanaHonokahuaHonoluaHonokohauPoeluaHonananaKahakuloaWaiolaiMakamakaoleWaihee R.WaiehulaoWaikapuMalikoKuiahaKaupakuluaManawaliaoUaoaKakipiHonopouHoolawaWaipioHanehoiHoaluaHanawanaKailuaNailiilihaeleOopuolaKaaieaKoleaWaikamoiPuohokamoaHaipuaenaPunaiauHonomanuNuaailuaPilnaau
YYYYYYYY
Y
Y
YYY
YYY
YY
YYYYYYY
YYYYY
YY
YYY
YYY
Y
Y
Y
YY
Y
Y
Y
Y
Y
Y
Y
YY
Y
Y
YYYY
YYYYYYY
126

CODE NAME PRK HAB MAR WET DES ED HIS WF
6-4-12 Ohia64-13 Waiokamilo Y Y6-4-14 Wailuanui Y Y6-4-15 W.Wailuaiki Y y
6-4-16 E. Wailuailci y y y
6-4-17 Kopiliula Y Y Y Y
6-4-18 Waiohue Gi. Y Y6-4-19 Paakea Y6-4-20 Waiaalca6-4-21 Kapaula Y y
6-4-22 Hanawi Y y y6-4-23 Malcapipi Y y y
6-4-24 Kuhiwa Y y
6-4-25 Waihole6-4-26 Manawaikeae y6-4-27 Kahawaihapapa Y
6-4-28 Keaaiki y
6-4-29 Waioni Y6-4-30 Lanikele Y6-4-31 Heleleikeoha Y y
6-4-32 Kawakoe y
6-4-33 Ulaino y y y
6-4-34 Kawaipapa Y
6-4-36 Unnamed6-5-01 Moomoonui Y6-5-02 Haneoo6-5-03 Kapia Y Y y
6-5-04 Waiohonu y y
6-5-05 Papaahawahawa6-5-06 Alaalaula6-5-07 Wailua y y
6-5-08 Honolewa y y
6-5-09 Waiell y6-5-10 Kakiweka Y6-5-11 Hahalawe Y
6-5-12 Puaaluu y
6-5-13 OheoGi Y Y Y y y
6-5-15 Koulcouai y
6-5-16 Opelu6-5-17 Kukuiula y
6-5-18 Kaapahu6-5-19 Lelekea6-5-20 Alelele y y
6-5-21 Kalepa Y
6-5-22 Nuanuaaloa6-5-24 Manawainul Y
127

UnnamedHalawaAamakaoNiulilWaikamaPololuHonokane NuiHonokane lidKalele Gi.WaipahiHonokeaKailikaulaHonopueKolealiulliOhiahuea
KukuiPaopaoWaiaalalaPunaluluKaimuPaeWaimanuPukoaManuwaikaalioNalueaKahoopuuWaipahoehoeWailoaiWaipioLalakeaKaluahine Falls
128

CODE NAME PRK HAB MAR WET DES ED HIS WF
8-1-53 Kawaikalia Y8-1-54 Malanahae8-1-61 Nienie y8-1-62 Papuaa8-1-65 Kahaupu y
8-1-66 Kahawailiili y8-1-67 Keahua8-1-68 Kalopa y
8-1-69 Waikaalulu y8-1-70 Kukuilamalamalili y
8-1-71 Alilipali y
8-1-73 Kaumoali GI y8-1-76 Waipunahina Y y
8-1-77 Waipunalau Gi Y8-1-78 Paauilo y
8-1-79 Aamanu y8-1-80 Koholalele Gi y
8-1-81 Kalapahapu GI Y8-1-82 Kulcaiau y8-1-85 Kaala y8-1-86 Kealalcaha y
8-1-88 Kupapaulua Y y y
8-1-89 Kaiwilci8-1-90 Kaula y
8-2-01 Kaohaoha8-2-02 Kaawalii y y8-2-03 Waipunalei8-2-04 Laupahoehoe y y
8-2-05 Kilau y y y
8-2-06 Manowaiopae Y Y
8-2-07 Kuwaikahi y
8-2-08 Kihalani y
8-2-09 Kaiwilaliilahi Y y y y
8-2-10 Haakoa Y 1’8-2-11 Pahale8-2-12 Kapehu Y Y
8-2-13 Paeohe y
8-2-14 Maulua y
8-2-16 Pohakupulca8-2-17 Kulanakli8-2-18 Ahole8-2-19 Poupou8-2-20 Manoloa y
8-2-21 Ninole y
8-2-22 Kaaheilci8-2-23 Waikolu
_______ _______ _____
129

CODE NAME PRK HAB MAR WET DES ED HIS WF
8-2-24 Waikaumalo Y8-2-25 Kahuku
8-2-26 Waiehu
8-2-27 Nanue Y Y
8-2-28 Opea Y Y
8-2-29 Peleau Y
8-2-30 Umauma Y Y Y
8-2-31 Kamaee8-2-32 Hakalau Y Y Y Y Y
8-2-33 Kolekole Y Y Y Y Y Y
8-2-34 Paheehee Y Y
8-2-35 Honomu Y Y
8-2-36 Laimi8-2-37 Kapehu Y
8-2-38 Makea8-2-39 Alia8-2-40 Makahanaloa8-2-41 Waiinaauou8-2-42 Waiaama Y
8-2-43 Kawairiui Y Y
8-2-44 Onomea8-245 Alakahi8-2-46 Hanawi Y Y
8-2-47 Kalaoa8-2-48 Aleamai8-2-49 Kaieie Y
8-2-50 Puuokalepa Y Y
8-2-5 1 Kaapoko Y
8-2-52 Papaikou8-2-53 Kapue Y8-2-54 Pahoehoe8-2-55 Paukaa8-2-56 Honolii Y Y Y Y Y Y Y
8-2-57 Maili Y
8-2-59 Pukihae Y Y Y
8-2-60 WailukuR Y Y Y Y Y Y
8-2-61 WailoaR. Y Y Y
8-2-62 Kaahakini Y
8-4-02 Waiaha8-5-01 Haloa8-5-02 Laininiaumau8-5-03 Waikoloa
_______ _______ _______
130

Resource Inventoiy and Assessment


/
Resource Inventoiy and AssessmentOne purpose of this study was to identify those streams with the high value stream-related “beneficial uses.” These were developed after extensive surveys of users. The firsttask was to categorize these uses, or “resources,” into more manageable units.
o Aquatic Resources
oRiparian Resourceso Cultural Resources
o Recreational Resources
Committees were established to inventory and assess each resource area. The committees consisted of people knowledgeable in the resource area and a state official from thedepartment responsible for the management of the resource.
Each committee identified the elements to be inventoried, and, using those elements,design the criteria for assessing streams. Recommended stream rnHngs were Outstanding, Substantial, Moderate, Limited, and Unknown. Each committee was given theoption of using one or more of these ranks. The Aquatic Committee added a sixthrnking Without.
The committees reviewed the assessment of the streams, which was based on theinventory data and the criteria, and made adjustments based on their collective expertise.The committees participated in the writing and approved the final report.
Every committee ranked streams reluctantly. The common concern was that users ofthe report would interpret all streams not ranked Outstanding as being unworthy ofprotection. This was not the design or intent of the Hawaii Stream Assessment, andneither this report nor the ranks should be used in that way. A rpnking of Outstandingwas based on good information being available. In some cases streams not rankedOutstanding may have resources as good as those classified as such, but were rankedotherwise because of incomplete or inadequate information. Therefore, it should beemphasized that this report and assessment is general in nature and is a first step. Whileit should serve as a flag for areas of concern, and may suggest where development mighttake place, it does not substitute for any review, survey or other study normally requiredof a project.
Finally, this inventory and assessment was the first attempt at such a task in Hawaii.The inventory elements and criteria represent each committee’s best attempt to quantifyand qualify enormously complexsubjects, and the discussion ofhow and even if this couldbe accomplished was intense in every group. The committees did their best, and, after
131

more than a year of meeting, acknowledge that the results are useful and important, yetimperfect.
Members of the committees agreed to assess, knowing that not every stream in Hawaiican be protected for its stream-related values, but hoping that this study may help protecta few. If some are to be protected, they should be the best ones.
132
Aquatic Resources
Hawaiian streams support a small but unique aquatic fauna, including freshwater fish,mollusks, crustaceans, and insects. Although the diversity of native species in Hawaii’sstreams is low, most of those species are found only in the Hawaiian islands.
A number of these unique native stream animals have a life cycle involving both thestream and the sea. This type of life history, in which an animal lives its entire adult lifein fresh water and its early larval period in the ocean, is called amphidromy.
The common perception among aquatic biologists is that Hawaii’s native stream faunais limited in abundance and distribution, however these characteristics are not welldocumented. Better understanding of the life history and habitat requirements of thenative aquatic fauna is needed in order to manage the natural resources for their survival.
An inventory and assessment of Hawaii’s native aquatic resources were needed toinform and assist managers of those resources. An advisory committee of aquaticbiologists and resource managers was formed to obtain expert input on the design anddevelopment of such an inventory and assessment. The Aquatic Resources Committeewas responsible for overseeing the inventory of the available information and theassessment of streams.
Although the habitat requirements of certain stream animals are not fully understood,the committee assumed that their presence indicated that conditions necessary for theirsurvival were also present. Since at least some of the native species traverse or use theentire length of the stream in their life history, conditions on any part of the stream mayaffect these species. Therefore, the entire stream was considered important as a singleunit and assessment of streams by segments was considered inappropriate.
An important first step for this inventory was a search of all available publishedliterature, unpublished reports and field notes. The Board of Land and Natural Resources contracted ‘vith The Nature Conservancs Hawaii Heritage Program to compile allthe literature available on biological resources of Hawaiian streams. Personal observations were obtained from the committee and active aquatic biologists. A complete list ofsources consulted is provided.
Available biological information for individual streams was entered on standardizeddata sheets, (Table 20)and then were entered into the HSA database.
The committee established assessment criteria to identify streams continhig ecosystems with potentially high quality aquatic resources. They identified four key nativespecies considered to be indicators of the health of the native aquatic ecosystem. The
133
assessment criteria were based on the presence and abundance of the indicator species,evidence of their spawning, and on unaltered stream conditions. Based on these criteria,streams were ranked as Outstanding, Substantial, Moderate, Limited, Without, Unknown. Aquatic insects were not considered only because their taxonomy and distribution are poorly understood.
Using the information in the data sheets, the Aquatic Resources Committee reviewedthe ranldngs. In those few cases where the rank derived from the database conflictedwith the committee’s collective expert opinion, the committee adjusted the rnicings.
Of 376 perennial streams, 164 (44 percent) have some biological information. Basedon the committee’s criteria, 73 streams are ranked outstanding, 19 Substantial, 36Moderate, 27 Limited, 12 Without, and 212 (56 percent) Unknown.
BackgroundPrior to human habitation in the Hawaiian islands most continuous streams may have
been occupied by one or more native stream species. Adult gobies and certain invertebrates breed in streams or estuaries, and the newly hatched larvae are swept out to seawhere they become part of the marine zooplankton. After a protracted period ofdevelopment the postlarvac enter stream mouths and begin a migration upstream.
Native Hawaiian stream species are often described as “current loving” (rheophylic).Their native habitats include clear, well-oxygenated stream water that flows overboulders, cobbles, and gravel. Goblld gobies are uniquely adapted to life in turbulentcoastal waters and streams, and have modified (fused) ventral fins that function assuction disks. This adaptation allows them to ‘climb’ waterfalls and colonize streamsections inaccessible to other fishes. Kinzie (in press) has summarized details on thetaxonomy, life history, ecology, and management of amphidromous fishes, crustaceans,and mollusks found in Hawaiian streams.
The populations and distributions of amphidromous native stream animals have beenreduced in modified streams, especially those in which the physical habitat, flow regime,water temperature and chemistry have been significantly altered. Studies by Timbol andMaciolek (1978) showed that 15 percent (55 of 366) of all perennial streams had beensignificantly altered by channel modification before 1978 and that the biological qualityand condition of nearly 75 percent (275) of Hawaii’s perennial streams had beendegraded.
The introduction of non-native aquatic species, many of which appear to be highlysuccessful competitors or predators, may have also reduced the original distribution andabundance of Hawaii’s unique stream fauna in recent years. Oahu streams appear to bethe most affected by stream alterations and introduced species.
MethodsCommittee
The Aquatic Resources Committee consisted of seven aquatic biologists and resourcemanagers. They directed all aspects of the inventoiy and assessment. The committee
134
approved the procedures for summarizing observations of aquatic fauna and habitat,developed ranking criteria for assessing the biological significance of individual streams,and reviewed all final ranks. They also provided bibliographies, reprints and access tofiles contpining significant information sources on Hawaiian stream fauna.
Aquatic Resource CommitteeChair, Audrey Newman, TNCHWilliam Devich, DAR, DLNRJohn Ford, USFWSJohn Harrison, UH Manoa Environmental CenterLuciana Honigman, TNCHRobert Kinzie, UH Manoa ZoologyJames Parrish, UR Cooperative Fishery Research Unit
Inventory
A great deal of relevant literature on aquatic species exists, but it is widely scatteredand highly variable. The inventory prepared by the Hawaii Heritage Program is basedon literature made available to them up to February 1990.
All available information on the distribution and abundance of freshwater species onthe five main Hawaiian islands (Hawaii, Maui, Molokal, Oahu, and Kauai) was compiled.The major references were the limnological surveys by Shima in the 1960s (Shima,unpub). More recent reports included surveys by Archer (1981, 1982, 1983, 1984, 1985),Archer et al. (1980), Ford and Kinzie (unpub.), Heacock (1984, unpub), Kinzie and Ford(1977, 1982), Maciolek (1971, 1972, 1977), Maciolek and Timbol (1981), Norton (1976,1977), Timbol (1972,1977,1979,1982,1983,1986), and Timbol L al. (1980a, 1980b). Acomplete list of sources consulted, including personal communications, is provided inthe bibliography.
Due to the amphidromous nature of the life cycle of the native freshwater fauna andtheir presumed need to use the entire stream, each stream was considered as a unit, andnot in segments. Types of information induded in the inventory were presence, abundance and spawning ofnative species, occurrence and abundance of introduced species,habitat factors, and information sources. In this aquatic report the u’ina (glottal stop) isincorporated into the Hawaiian names of aquatic animals only.
Native Species: Eleven native species were classified into two groups, depending ontheir scarcity (Table 17).
Native Species Group 1 (NG1): Four native freshwater species were classified as“indicator species” and comprised the Native Species Group One (NG1). Thecommittee considered these as representatives of potentially high quality streamecosystems. They included three gobies and a mollusk. Of the four NG1 Species,only ‘o’opu alwno’o (Lentipes concolor) is listed by the USFWS (1989) as acandidate endangered species. However, the Aquatic Resources Committeebelieves that two other ‘o’opu (Awaous stamineus and Sicyopteius stimpsoni), asweli as the hthiwai (Nerñina ganosa) may be declining in Hawaiian streams.
135

Table 17 Aquatic Species Groups
Native Species Group One (NG1)Scientific name Hawaiian name TypeAwaous starnineus ‘O’opu nakea GobyLenhpes concolor ‘O’opu hiukole Goby
‘O’opu alamo’oNetitinagranosa Hthiwai SnailSicyopterus stimpsoni ‘O’opu nopili Goby
Native Species Group Two (NG2)Scientific name Hawaiian name TypeAtyoida bisulcata ‘O’pae kala’ole ShrimpEleot,is sandwicensis ‘O’opu okuhe Eleotrid
‘O’opu akupa‘O’apu oau‘O’apu owau
Kuhila sandvicensis Aholehole KuhuiidMacrobrachium ‘O’pae ‘oeha’a Prawn
grandimanusMugil cephalus ‘Ama’ama MulletStenogobius ‘O’opu naniha Goby
genivittatusTheodoxus Hapawai Snail
vespeitinus
Introduced Species Group One (IG1)Scientific name Common nameCichiasoma nigrofcssciatum Convict cichlidClariasfuscus Chinese catfishCorbiculafluminea ClamGambusia affinis Mosquito fishMacrobrachiwn rosenbergil Malaysian prawnMicroptents dolomieu Smailmouth bassPoecilia spp. Guppy (limia, Toprninnow)Tilapia (Sarotherodon, Tilapia
Oreochroniis) spp.Xiphophorous spp. Swordtail
* Macrobrachium lar is excluded because it is believed to bepresent in nearly all Hawaiian streams
Introduced Species Group Two (1G2)All those species not listed in IG1; considered innocuous or accidentaL
136
Native Species Group 2 (NG2): The other seven native species considered morecommon comprised Native Species Group Two (NG2). These included two streamand two marine fishes, one shrimp, one prawn, and one snail. Presence of thesespecies was considered to be typical of a healthy native stream ecosystem.
Introduced Species: The committee divided the introduced (non-native) species intotwo groups depending on their potential threat to native species.
Introduced Species Group One (IG1): This group included noxious, non-nativestream animals that may prey upon and/or out-compete with native species.Macrobrachium 1w-. (Talutian prawn), was not included in this group even thoughit may pose a threat to native stream animals because it is believed to be presentin almost all Hawaiian streams. Thus, no stream is “pristine” and the presence ofMacrobrachiwn 1w- cannot be used for comparing stream quality.
Introduced Species Group Two (1G2): This consists of the non-native speciesconsidered to be innocuous to Hawaiian streams.
Data Sheets: Available biological information compiled for each stream was summarized in a three-page data sheet (Table 20). These data sheets included the presenceand abundance of both native and introduced species. When available, physical information was included. The total numbers of native species observed were then summarized by group (NG1 and NG2) and were this way used to rate the abundance anddiversity of native species in the stream.
The second page of the data sheet contained information on presence and abundanceof introduced species.
The Factor Summary Table on the third page of the data sheet noted the total numberof native and introduced species, along with ratings for diversity, spawning and recruitment, habitat quality, dams, diversions and channelizations (Table 20).
Assessment
To assess and compare the biological quality of individual streams, the AquaticResources committee developed a ranking system based primarily on the presence andabundance of the four native species believed to be indicators of potentially outstandinghabitat.
little information is available on aquatic habitat. Because of the data available, almostthe only criteria that seemed to be applicable broadly across most streams, werebiological, ie. based on presence and abundance of the various species. In large measure,this accounts for the specific criteria chosen for Outstanding (and other) categories.
Concern about the scarcity of Lentipes concolor seemed to make any stream where itis at least common a potentially very important resource, i.e. Outstanding.
Observation of egg mass or gravid females constitued evidence of spawning. While itis likely that frequent spawning by NG1 gobies occurs in many streams, not enough abouttheir biology is known to say. Until or unless it becomes clear that there are many such
137

streams for all the NG1 species, any that are known must be considered especiallyvaluable, i.e. Outstanding.
While there are a good many streams where NG1 species are reported, there arerelatively few where each individual species is reported as abundant. Each species isimportant because of its relative rarity. Abundance suggests strongly that populationsare well established and are more likely to be reproducing locally, as opposed to beingcomposed of strays or ephemeral groups. Therefore, the relatively few streams withknown strong populations of any NG1 species are very valuable, i.e. Outstanding.
All four NG1 species are reported in relatively few streams. The requirements of somespecies seem rather different. The presence of all four species suggest high qualityhabitat, i.e., Outstanding.
Aquatic Resources Ranking CriteriaOutstandingEither A or BA. Any of these criteria
-Lentipes concolor is common in any reach of the stream. V
-Evidence of spawning by any of the NG1 gobies.-An abundance (abundant or very abundant) of any ofthe four rare NG1 species anywhere in the stream.(This might indicate special significance for spawning.)-Presence of all of the four NG1 species in the stream.
B. All of these criteria-Two or more representatives of NG1 and NG2 each,
representing high native species diversity.-One or fewer IG1 introduced species-No dams, diversions, or channelization.
SubstantialBoth A andBA. At least three total representatives from NG1 and NG2.B. One or fewer introduced species IG1.ModeratePresence of at least one native species from NG1.Lhnlted V
Presence of at least one NG2.WithoutNo native species present.UnknownInsufficient biological information available for the stream.
Individual streams were then assigned to one of the six ranking categories. To applythese criteria to large stream systems, observations of the main stream and its tributarieswere summarized together, and the highest rank earned by any segment of the streamwas assigned to the entire stream. This procedure represents a simplification of the realsystem, but it acknowledges that amphidromous species mayuse much ofa stream systemat some life stage and require suitable habitat there. Other limitations to the assessmentare discussed at the end of this report.
138
The Aquatic Resource Committee reviewed the initial rankings. In a few cases, whereappropriate, it changed the rank based on personal observations as well as habitatquality.
ResultsInventory
Biological information was obtained for 178 streams, 45 percent of Hawaii’s total of376 streams. All except 18 of these studies were conducted on continuous streams. Ofthe total number of streams studied, 63 (K16, 028, Mo2, Ma12, HiS) were surveyed since1984, and 122 since 1974 (1(36, 029, Mo5, Ma27, Hi25). NG1 species were found to bepresent in 111 of these streams. Only 6 streams had any records of spawning and only 16of spawning ancL’or recruitment, possibly because these events are extremely difficult toobserve.
The records of dams, diversions and channelization in the aquatic resources reportwere taken exclusively from the biological reports, although better sources for thisinformation exist. The Hawaii Stream Assessment has more complete information aboutthese modifications from other sources. Much of the literature suggested that thepresence of these modifications may negatively affect native aquatic habitat. Modification information is included in the database for further correlation work. (Tables 7,10)
Assessment
Of the 178 streams with biological information, 74 fulfilled the criteria for Outstanding.Breaking that down according to specific criteria, the results are as follows: Lentipes
concotor was common in 44 streams. NG1 were abundant or very abundant in 47 streams(1(12,05, Mo4, MalS, Hill), and spawning of NG1 fish was observed in 6 streams. Allfour NG1 specks were recorded in 20 streams. (Kb, 00, Mo2, Ma 6, Hi2). Criteria B,which took diversity and habitat into account, was met by 12 streams.
DiscussionContinuous perennial streams are the principal habitat for native stream species.
Extensive water development is incompatible with outstanding aquatic resources. The
maps and data suggest that outstanding aquatic resources tend to be concentrated in theless developed areas, particularly the north shores of Kauai, Molokai and a small sectionof Oahu, and several areas on Maui. Survey coverage summarized in this report isgeographically more complete for Oahu, Kauai and Maui than for Molokai and Hawaii.
While the concern about the viability of native aquatic species is high, scientificinformation to guide management efforts is limited. The Aquatic Resources committee
endorses Robert Kinzie’s expression of concern related to stream management:
A serious deterrent to the formulation of rational management practices for
native amphidromous species is the lack of knowledge of their population bi
ology, larval life history, and genetic structure. Two possible extreme scenarios illustrate the problems involved. In the first instance, while a species may
139

be found in both large and small streams, only a few or even one breedingpopulation may be responsible for the bulk of the reproductive output of theentire species. In this case, habitat destruction in the majority of the streamswould have little impact on the species as a whole, but any degradation of theprimary breeding stream could be disastrous. Because so little is knownabout the genetic structure of any of these species or about the ocean currentpatterns among the islands, we could not identify which streams would be theimportant ones if this scenario were true.
At the other extreme, it is possible that each stream with a population ofadults contributes recruits to the total species pool in proportion to the adultpopulation size, modified by chance events including unusual streaniflowevents, offshore currents, and conditions at potential settling sites. In thiscase, reduction of the suitability of any stream would reduce the reproductivepotential of the total population in proportion to the reduction in numbers ofadults in the stream.
The actual situation probably lies somewhere between these two extremes,but because of an almost total lack of information, judgements cannot bemade about the relative expendability of any potential breeding population.Given this situation, the most careful review should be given to any proposedaction that could potentially interfere with the link between the freshwaterhabitats and the sea. Because we cannot evaluate the potential effects of anaction on the species, extreme caution is advised in each instance where anyof the native populations are threatened by a proposed activity, particularlyin the critical lowland elevations (Robert A. Kin7ie ffl AmphidromousMacrofauna of Island Streams, 1990).
Similar concerns apply to the aquatic environments that form the interface betweenstreams and the sea. There are no comprehensive studies to define the biologicalsignificance for stream fauna of estuaries and embayments. However, the availableevidence and general ecological experience suggests that these environments provideimportant habitat for marine and migrating freshwater nimls. A list of estuaries andembayments (Table 14) is in the Special Areas section of this report.
These stream ranking criteria simplify the many complex factors important to nativestream ecosystems. For example, physical characteristics may be very important predictors of stream habitat quality for native species. However, it was not possible to use thesecharacteristics unifornily as criteria, because the available information was limited andinconsistent. The presence of aquatic insects was also not considered, as their distributions are not well understood.
While the presence of native species is a good indication of valuable resources, theirabsence during a limited survey may not mean that they are absent from the stream. Someof the surveys are old and may not reliably indicate the current status of the stream.Others are very selective in their scope, and do not provide complete data for the scopeof this study. There is no information for over half of the perennial streams. The percentof coverage for continuous perennial streams, however, is much higher. Therefore, it isimportant to note that the available data provide only a limited view of the actualdistribution of stream animals.
140

A stream might be inappropriately ranked Limited because only a few species wereseen on a single survey, and might actually qualify for higher rank. In contrast, anOutstanding stream is clearly indicated by its high reported species diversity or abundance.
Spawning and recruitment events are unpredictable in time and sometimes occurduring periods of flooding, when observation is difficult or hazardous. Thus, the limitedobservations of spawning and recruitment cannot be interpreted as a statement aboutthe frequency or distribution of these events, only that the information has not beencollected.
This Aquatic Resources report represents a s11mmry of available surveys and observations of Hawaiian streams. It should not be construed as a reliable assessment of thequality of stream habitats or of the occurrence and distribution ofbiota within or betweenstreams. it is not the final arbiter of the biological importance of a given stream. It shouldnot be substituted either for needed research or the proper biological reconnaissancesurveys that should be performed and carefully reviewed before development is seriouslyconsidered. It is instead a document that should provide valuable source material forfuture research and for evaluation of potential impacts from developments.
SourcesPublished and Unpublished Documents
Kin7ie, RA. ifi. Aug 1990. Species profiles: life histories and environmental requirementsof coastal vertebrates and invertebrates, Pacific Ocean Region, Report 3, Amphidromous macrofauna of island streams. Technical Report EL-89-1O, US. Army EngineerWaterways Experiment Station, Vicksburg, MiSSOUrI. 28 pp.
Also see Aquatic Resources Bibliography in this report
Databases
The Nature Conservancy of Hawaii Heritage Program database.
Personal Communications
Hau, Skippy. DLNR. Aquatic Resources, Maul.
Heacock, Don. DLNR. Aquatic Resources, Kauai.
Kido, Mike. Kauai Community College.Lee, Mike. U.S. Army Corps of Engineers.
Maciolek, John. USFWS (retired).Nishimoto, Bob. DLNR. Aquatic Resources, Hilo.
Puleloa, BilL DLNR. Aquatic Resources, Molokal.
Timbol, Amadeo. Kauai Community College.
Yuen, Andy. USFWS.
141

AQUATIC RESOURCES BIBUOGRAPHYPrepared by Luciana Honignian,The Nature Conservancy Hawaii,Hawaii Heritage Program
Archer, KM. 1981. Liinnological assessment ofLumahai estuary, island ofKauai. Prepared
for Lumahai aquaculture farm for environmental impact assessment. 30 pp.
Archer, KM. 1982. Leaflitter decomposition in Hawaiian streams. M.S. Thesis, University
of Hawaii, Honolulu. 52 pp.
Archer, KM. 1983. Biological survey of Maunawili, Ainoni and Makawao streams,
windward Oahu. 13 pp.
Archer, KM. 1984. Biological survey of East and West Wailuald stream, windward Maui,Hawaiian Islands. Prepared for W.A.. Hirai and Associates, Inc., Hilo, Hawaii. 7pp.
Archer, KM. 1984. Biological survey and quality rating of windward Oahu streams.
Prepared for VTN Pacific, Inc. 43 pp.Archer, KM. 1985. Biological survey of East and West Wailuaki stream, windward Maui,
Hawaiian Islands. Prepared for Assoc. Engineering Inc., Auburn, California. 11 pp.
Archer, KM. 1985. Aquatic survey of Kamananui stream and Ukoa marsh, Waialua,
Kaliuku, island of Oahu. Submitted to Wilson, Okamoto and Associates, Honolulu,
Hawaii.
Archer, KM. 1986. Aquatic survey of Wailuku river and Hookelekele stream, island ofHawaii. Prepared for Associated Engineering Consultants Inc., Auburn, California.
Archer, KM., A.S. Timbol, and 3.D. Parrish. 1980. Biological survey of Kahana streamsystem. Hawaii Cooperative FisheryResearch Unit Technical Report 80-2. Final report
to Department of Land and Natural Resources under Contract No. 9817.41 pp.
Biefang P.K. A description of the environmental conditions of the Kawainui marshecosystem. Study conducted by the Oceanic Foundation in cooperation with the Bureau
of Sport Fisheries and Wildlife. 15 pp.
Broshears, RE. 1979. The influence of trophic interaction on the distribution and abun
dance of selected aquatic species in a Hawaiian taro pond ecosystem. M.S. Thesis,
University of Hawaii, Honolulu. 63 pp.
Broshears, R.E. and 3.D. Parrish. 1980. Aquatic habitat and aquatic food sources for
endangered waterbirds at Hanalei National Wildlife Refuge. Hawaii Cooperative
Fishery Research Unit Technical Report 80-3. Final Report to U.S. Fish and Wildlife
Service under Contract 14-16-0001-78134.47 pp.
Chan, J.G. 1978. Some aspects of a shell disease in the Hawaiian freshwater shrimp, Atya
bLru?cata (Randall). Proc. Second Conference in Natural Sciences, Hawaii Volcanoes
National Park, May 1978:42-50.
Chan, J.G. 1986. Bacteria-caused mortality of freshwater shrimp (‘opae-kala-’ole,Atyoida
bisulcata) from the island of Hawaii. ‘Elepaio 46(18):191-192.
Couret, CL. 1976. The biology and taxonomy of a freshwater shrimp, Atya bisulcata
Randall, endemic to the Hawaiian Islands. M.S. Thesis, University of Hawaii, Honolulu.
log pp.
142

Deacon., J.E., G. Kobetich, J.D. Williams, S. Contreras, and Endangered Species Committee of the American Fisheries Society. 1979. Fishes of North America: Endangered,threatened, or of special concern. Fisheries 4(2):29-44.
Devick. W. 1989. Oaliu streams survey summary, summer 1989. Hawaii Division of AquaticResources, Department of Land and Natural Resources. Unpublished.
Edmonson, CR. 1929. Hawaiian Atyidac. Bernice P. Bishop Museum, Honolulu 66:1-37.
Ego, K 1956. Life history of freshwater gobies. Project No 4-4R, Freshwater Game FishManagement Research. Department of Land and Natural Resources, State of Hawaii,Honolulu. 24 pp.
Ford, 3.1. 1975. Preliminary biological survey of Kawainui marsh and the MaunawiliKahanaki stream system. Water Resources Research Center, University of Hawaii,Honolulu. 11 pp.
Ford, 3.1. 1979. Biology of a Hawaiian fluvial gastropod Neritina granosa Sowerby(Prosobranchia: Neritidae). M.S. Thesis, University of Hawaii, Honolulu. 94 pp.
Ford, 3.1. 1988. Personal letter to Christopher N. Brown (24 Feb 88).
Ford, 3.1. and R.A. Kinzie, ifi. 1982. Life crawls upstream. Natural History 91:60-67.
Ford, 3.1. and RA. Kinzie, ifi. 1986. Status of Lentipes concolor (Gill 1860), a rarediadromous goby endemic to Hawaii. Paper presented at the West. Soc. Nat., 67th Ann.Mtg., Hilo, Hawaii, December 27-30, 1986.
Ford, 31. and R.A. Kinzie, ifi. Unpublished. Factors influencing the distribution of anendangered freshwater fish in streams in Haleakala National Park. Department ofZoology, University of Hawaii, Honolulu.
Ford, 31. andA.R. Yuen. 1988. Naturalhistory ofPelekunu stream and its tributaries, islandof Molokai, Hawaii. Part 1: Summary Report. Unpublished report prepared for TheNature Conservancy of Hawaii. 69 pp. + appendices.
Ford, 31. and A.R. Yuen. Unpublished. Biological reconnaissance survey of Waikolustream, Molokai. U.S. Fish and Wildlife Service. 11 pp.
Gagne, W.C.. 1973. Summaries of aquatic ecosystems completed in part from tablesprepared by 3. Maciolek for IBP. Partial document compiled by W. Gagne.
Gon, S.M., 1111976. A pre1iminry report The freshwater fauna of the Manawainui region.In. The Scientific Report of the Manawainui Re.rearch Projecc ed. D. Peterson, NSF-SOSGrant No. 76-07608, pp. 289-298.
Hathaway, C.B., Jr. 1978. Stream channel modification in Hawaii. Part C: Tolerance ofnative stream species to observed levels of environmental variability. FWS/OBS-78118,U.S. Fish and Wildlife Service National Stream Alteration Team, Columbia, MO. 59 pp.
Hathaway, C.B. Jr. 1979. Tolerance of native Hawaiian stream macrofauna to environmental stress associated with stream channel modification, with particular reference toelevated temperatures. M.S. Thesis, University of Hawaii, Honolulu. 91 pp.
Hawaii Division of Aquatic Resources. 1985. Establishment and operation of o’opupopulation monitoring stations. Job progress report, Project No. F-14-R-9, Job No. 1(study Vi). Department of Laud and Natural Resources.
Hawaii Division ofAquatic Resources. 1987. Environmental impact assessment. Statewidefreshwater fisheries technical guidance. Job progress report, Project No. F-15-T-11.Department of Land and Natural Resources.
143
Hawaii Division ofAquatic Resources. 1988. Environmental impact assessment. Statewide
freshwater fisheries technical guidance. Job progress report, Project No. F-15-T-12.
Department of Land and Natural Resources.
Hawaii Division ofAquatic Resources. 1988. Disturbance and fluctuations in the Wahiawa
reservoir ecosystem. Freshwater fisheries research and surveys. Job progress report,
Project No. F-14-R-12, Job No.2 (study I). Department ofLand and Natural Resources.
Heacoclç DLE. 1984. Survey of aquaticmacrofauna in Nualolo Ama, Awaawapuhi, Kalalau,
Miolii, and Hanakapiai streams along the Na Pall Coast, Kauai. 6 pp. + tables and
figures.
Holcomb, J., 3. Jacobi, R. Klnzie, H. McEldowney, and R. Warshauer. Unpublished.
Geological, biological, and archeological survey of the windward coast of east Molokai
Volcano, Hawaii. National Geographic Society Research Grant No. 2252-80. Prelimi
nary Report.
Holthuis, LB. 1950. The Decapoda ofthe Siboga Expedition. The Palaemonidae. El. Brili,
Leiden. 268 pp.
Hoithuis, L.B. 1973. Caridean shrimps found in land-locked saltwater pools at four Indo
west Pacific localities (Sinai Peninsula, Funafuti Atoll, Maui and Hawaii Islands), with
the description of the one new genus and four new species. Rijksmuseum van Natuurlijke
Historie, Leiden. 48 pp. + plates.
Hookano B. and J.G. Chan. 1979. Morphological anomalies of the eye in the Hawaiian
freshwater shriinp,Atya bisidcata. The Wasmann Journal of Biology 37 (1&2):40-47.
Ibara, W. and P. Conant. Unpublished. Aquatic fauna of the streams ofWaihoi valley, Maui,
Hawaii. Draft.
Kawate, D. 1969. An ecological comparison of two Hawaiian streams. M.S. Thesis, Univer
sity of Hawaii, Honolulu. 29 pp.
Kinzie, R.A. UL Aug 1990. Species profiles: life histories and environmental requirements
of coastal vertebrates and invertebrates, Pacific Ocean Region, Report 3, Am
phidromous inacrofauna of island streams. Technical Report EL-89-10, U.S. Army
Engineer Waterways Experiment Station, &ksburg Missouri. 28 pp.
Kinzie, R.A. ifi and 3.1. Ford. 1977. Lininological survey of lower Palikea and Pipiwai
streams, Kipahulu, Maui. Cooperative National Park Resources Studies Unit Technical
Report No. 17. 44 pp.
Kinzie, R.A. ifi and 3.1. Ford. 1982. Population biology in small Hawaiian streams. Water
Resources Research Center Technical Report No 147. 60 pp.
Kin2ie, R.A. 111,31. Ford, P.K Higashino, L.K Croft, and D.E. Hardy. 1979. An ecological
survey ofPua’alu’u stream. Cooperative National Park Resources Studies Unit Techni
cal Report No. 27.
Kinzie, RA. 111,31. Ford, AR. Yuen and SJ.L Chow. 1984. Habitat utilization curves for
native Hawaiian streams fishes. Special Report No. 6:20:84. Water Resources Research
Center. University of Hawaii, Honolulu. 68 pp.
Kinzie, R.A. ifi, 31. Ford, A.R. Yuen, and SIL. Chow. 1986. Habitat modeling ofHawaiian
streams. Water Resources Research Center Technical Report No. 17L
144

Kinzie, RA. ifi, 31. Ford, and A.R. Yuen.. 1987-88. Unpublished field notes.
KRP Information Services. 1989. Final environmental impact statement Wailuku riverhydroelectric project. Prepared for Kahala Energy Development Corp., Honolulu.
Kubo, I. 1942. Studies of the Japanese palaemonid shrimps. ifi. Leandur. 3. Imp. Fish. lEst.35: 17-85.
Kubota, W.T. 1972. The biology of an introduced prawn, Macrobrachium lar (Fabricius)in Kahana stream. M.S. Thesis, University of Hawaii, Honolulu. 185 pp.
Lau, E.Y.K 1973. Dimorphism and speciation in the Hawaiian freshwater goby genusLentipes. B.S. Thesis (Honors), University of Hawaii, Honolulu. 83 pp.
Madolek, LA. 1971. Aquatic ecosystems of Kealia floodplain and Maalaea bay, Maui.Hawaii Institute of Marine Biology.
Maciolek. J.A. 1972. Diadromous macrofauna of Kaliana stream-estuary system. FinalReport to U.S. Fish and Wildlife Service under Contract 14-16-0001-4085.
Maciolek, J.A. 1977. Taxonoiuic status, biology, and distribution of Hawaiian Lentipes, adiadromous goby. Pacific Sciences 31(4):355-362.
Maciolek, 3.A. 1978. Shell character and habitat of non-marine Hawaiian neritid snails.Micronesica 14(2):209-214.
Maciolek, LA. 1978. Ecosystem-based Hawaiian water quality standards. Reprinted fromProceedings of the Colloquium on Aquatic Environment in Pacific Region (21-23 Aug).
pp. 215-226.
Maciolek, 3.A. 1979. Hawaiian streams: diversion versus natural quality. 1n The MitigationSymposium, Rocky Mtn. Forest and Range Expt. Sta., Gen. Tech. Report RM-65, pp.604O6.
Maciolek, LA. 1980. Electroshocking in tropical insular streams. Progressive Fish-culturist42(1):57-58.
Maciolek, LA. 1981. Consumer trophic relations in a tropical insular estuary. BulletinMarine Science 31(3):702-711.
Maciolek LA. 1982. Lakes and lake-like waters of the Hawaiian archipelago. OccasionalPapers of Bernice P. Bishop Museum 25(1):1-14.
Maciolek, LA. and A.S. ThnboL 1981. Environmental features and inacrofauna of Kahanaestuary, Oahu, Hawaii. Bulletin Marine Science 31(3):712-722.
Miller, R. 1972. Threatened freshwater fishes of the United States. Trans. Am. Fish. Soc.21:239-252.
Miller, R. and LA. Maciolek. 1976. Lentipes concolor (Gill, 1860). Unpublished Report. 2
pp.Nishimoto, R.T. and 3M. Fitzsimons. 1986. Courtship, territoriality, and coloration in the
endemic Hawaiian freshwater goby, Lentipes concolor. In Indo-Pacific Fish Biology:Proceedings of the Second International Conference on Indo-Pacific fishes, edited byT. Uyeno, R. Arai, T. Taniuchi, and K Matsuura. Icthyological Society of Japan, pp.811-817.
Norton, SE. 1976. A comparative study of the patterns of distribution and abundance offishes and crustaceans in altered and unaltered Hawaiian streams. Progress report:September-December 1976.47 pp.
145

Norton, S.E. 1977. A comparative study of fish and crustacean populations in altered and
unaltered Hawaiian streams. MS. Thesis, University of Hawaii, Honolulu. 88 pp.
Norton, S.E., A.S. Timbol, and J.D. Parrish. 1978. Stream dinnel modification in Hawaii.
Part B: Effect of channelization on the distribution and abundance of fauna in selected
streams. FWSIOBS-78117, U.S. Fish and Wildlife Service National Stream Alteration
Team, Columbia, MO. 47 pp.Parrish, J.D.., 3.A. Maciolek, AS. Timbol, C.B. Hathaway,Jr.., and S.E. Norton. 1978. Stream
channel modification in Hawaii. Part D: Summary report FWS/OBS-78119, U.S. Fishand Wildlife Service National Stream Alteration Team, Columbia, MO. 18 pp.
Payne, T.R. and Associates. 1987. Analysis of instream flow requirements and flow release
recommendation, Lurnahai river hydroelectric project, Kauai, Hawaii. Unpublished
contract report prepared for Garratt-Callahan Co., Millbrae, California. 10 pp. +
figures.
Payne, T.R. and Associates. 1987. Habitat utilization criteria for four native Hawaiian
freshwater aquatic species (Awaousstamineus, Sicyopterus stimpsoni,Atya bindcata, and
Neritinagrwiosa) in the Lumahai river, Kauai, Hawaii. Unpublished report prepared for
Hawaii Department of Plpnning and Energy Development and Garratt-Callahan Co.,Millbrae, California. 7pp. + figures.
Payne, T.R. and Associates. 1987. Instream flow assessment for Lumahai river, Lurnahalriver hydroelectric project, Kauai, Hawaii. Unpublished report prepared for GarrattCallahan Co, Millbrae, California. 6pp. + figures.
Payne, T.R. 1988. Instream flow assessment for East, Middle and West Wailuaiki streams,East and West Wailuaiki hydroelectric project, Maui, Hawaii. Contract report preparedfor Bingham Engineering Co., Salt Lake City, Utah.
Shima, SI. 1960-69. Unpublished field notes of statewide limnological surveys. Hawaii
Division of Aquatic Resources, Department of Land and Natural Resources.
Shima, SI. 1961. Limnological survey for introduction of exotic species of fish. Freshwater
game fish management research. Job Completion Report, Project No. F-4-R-9, Job No.
3. Hawaii Division ofAquatic Resources, Department ofLand and Natural Resources.17 pp.
Shima, SI. 1962. Limnological survey for introduction of exotic species of fish. Freshwater
game fish management research. Job Completion Report, Project No. F-4-R-10, Job No.
3. Hawaii Division of Aquatic Resources, Department of Land and Natural Resources.21 pp.
Shima, SI.1963. Limnological survey for introduction of exotic species of fish. Freshwatergame fish management research. Job Completion Report, Project No. F-4-R41, Job No.
3. Hawaii Division of Aquatic Resources, Department of Land and Natural Resources.
13 pp.Shima, S.I. 1964. Lixnnological survey for introduction of exotic species of fish. Freshwater
game fish management research. Job Completion Report, Project No. F-4-R-12, Job No.
3. Hawaii Division of Aquatic Resources, Department ofLand and Natural Resources.
1lpp.Shima, SI. 1965. Limnological survey for introduction of exotic species of fish. Freshwater
game fish management research. Job Completion Report, Project No. F-4-R-13, Job No.
3. Hawaii Division of Aquatic Resources, Department ofLand and Natural Resources.
9pp.
146
shima, Si. 1965. Liinnological survey for introduction of exotic species of fish. Freshwatergame fish management research. Job Completion Report, Project No. F..4-R-14, Job No.3. Hawaii Division of Aquatic Resources, Department of Land and Natural Resources.8pp.
Shima, Si. 1966. Limnological survey for introduction of exotic species of fish. Freshwatergame fish management research. Job Completion Report, Project No. F-4-R-l5, Job No.3. Hawaii Division of Aquatic Resources, Department of Land and Natural Resources.
15pp.Shima, Si. 1967. Limnological survey for introduction of exotic species of fish. Freshwater
game fish management research. Job Completion Report, Project No. F-4-R-16, Job No.3. Hawaii Division of Aquatic Resources, Department of Land and Natural Resources.
1opp.Shima, Si. 1968. Limnological survey for introduction of exotic species of fish. Freshwater
game fish management research. Job Completion Report, Project No. F-4-R-17, Job No.3. Hawaii Division of Aquatic Resources, Department of Land and Natural Resources.I2 pp.
Shima, Si. 1969. Limnological survey for introduction of exotic species of fish. Freshwatergame fish management research. Job Completion Report, Project No. F-4-R-18, Job No.3. Hawaii Division of Aquatic Resources, Department of Land and Natural Resources.
spp.Shima, 51. 1971. Statewide linuiological surveys. Freshwater game fish management re
search. Job Completion Report, Project No. F-9-1, Job No.2 (study IV). Hawaii Divisionof Aquatic Resources, Department of Land and Natural Resources. ip.
Shima, Si. 1972. Statewide limnological surveys. Freshwater game fish management research. Job Completion Report, Project No. F-9-2, Job No.2 (study VI). Hawaii Divisionof Aquatic Resources, Department of Land and Natural Resources. 2 pp.
Shima, Si. 1973. Statewide limnological surveys. Freshwater game fish management research. Job Completion Report, Project No. F-9-3, Job No.2 (study VI). Hawaii Divisionof Aquatic Resources, Department of Land and Natural Resources. 2 pp.
Shiina, Si. 1974. Statewide lininological surveys. Freshwater game fish management research. Job Completion Report, Project No. F-9-4, 3ob No.2 (studyVI). Hawaii Divisionof Aquatic Resources, Department of Land and Natural Resources. ip.
Shims, Si. 1979. Survey of the freshwater aquatic fauna in the Na Pall coast streams, islandofKauai. Hawaii Division of Fish and Game, Department ofLand and Natural Resources. Unpublished.
Shima, Si. and F.W. BalL 1978. Hanalei river flood control, Kauai, Hawaii. Memorandumto Kenji Ego, Director, Hawaii Division of Fish and Game, Department of Land andNatural Resources. Summary of proposed project by US. Army Corps of Engineers. 8
pp.Shokita, S. 1975. Distribution and speciation of the island water shrimps and prawns of the
Ryukyu Islands. Bull. Science and Engineering. Div. Ryukyus 18:115-136.
Tabashnik, B., S.M. Gon ifi, and 3. Herr. 1988. An invertebrate survey of the WimnuEstuarine Sanctuary, Waimanu valley, Hawaii. Unpublished NOAA Technical Report.16 pp. + figures and tables.
147

Timbol, AS. 1972. The trophic ecology of the macrofauna in Kahana estuary, Oahu. Phi).Dissertation, University of Hawaii, Honolulu. 228 pp.
Timbol, A.S. 1977. Aquatic survey of stream macrofauna for the hydroelectric power studyfor Hawaii. Prepared for the Department of Army Corps of Engineers, Pacific Ocean
Div., Honolulu, Hawaii, 48 pp.
Timbol, AS. 1978. A survey of endangered and threatened aquatic macrofauna in
Ahuimanu stream and wetland. Report prepared for Gray, Rhee, and Associates, Inc.,
Honolulu. 18 pp.Timbol, A.S. 1978. Survey of endangered and threatened aquatic macrofauna in Waiola
stream and tributaries. Prepared for Grey, Rhee, and Associates, Honolulu. 13 pp.
Timbol, A.S. 1979. Limnological survey of Kahana stream, Oahu. Prepared for U.S. ArmyCorps of Engineers, Pacific Ocean Division, Honolulu. 48 pp. + appendix
Timbol, A.S. 1982. Aquatic macrofauna in Anini stream, Kauai. Report submitted to Belt,Collins and Associates, Honolulu. 10 pp.
Timbol, A.S., 1983. A survey of aquatic macrofauna in Wninih river, Kauai. Prepared forEDAW, Inc. for environmental impact statement. 15 pp. + appendices.
Timbol, A.S. 1986. A survey of aquatic macrofauna in Hanalei river, and the potentialimpact of hydroelectric development. Prepared for Island Power Co. for environmentalimpact statement. 26 pp.
Timbol, AS. 1986. Biological reconnaissance of Makaleha tributary and the mainstreamchannel of Kapaa stream, Kauai. Prepared for Portugal and Associates, Lihue, Kauai.
12pp.Timbol, A.S. and D. Heaco± 1986. Native fishes in Hanaki river, Kauai, and the potential
impact of hydroelectric development: a preliminary study. Proc. Sixth Conference inNatural Sciences, Hawaii Volcanoes National Park; June 1978:25-26.
Timbol, A.S. and JA. Maciolek. 1978. Stream channel modification in Hawaii. Part A:Statewide inventory of streams, habitat factors and associated biota. FWSIOBS-78J16,US. Fish and Wildlife Service National Stream Alteration Team, Columbia, MO. 157
pp.Timbol, A.S., AJ. Sutter, and Ji). Parrish. 1980a. Distribution, relative abundance, and
stream environment ofLentipes concolor (Gill, 1860), and associated fauna in Hawaiian
streams. Water Resources Research Center Technical Report No.5. Mpp.
Timbol, A.S., A.J. Sutter, and Ji). Parrish. 1980b. Distribution and relative abundance ofthe endemic freshwater goby, Lenapes concolor, in Hawaii. Hawaii CooperativeFisheries Research Unit Technical Report 80-1. Final Report to Hawaii Department ofLand and Natural Resources. 117 pp.
Tomihajna, M.T. 1972. The biology of Siydium stimpsoni, freshwater goby endemic toHawaii. B.S. Thesis (Honors). University of Hawaii, Honolulu. 123 pp.
U.S. Fish and Wildlife Service. Unpublished. Detailed report, Waimea river flood control
project, Kauai, Hawaii. 26 pp.
U.S. Fish and Wildlife Service. 1989. Endangered and threatened wildlife and plants-notice
of review. Federal Register, 50 CPR, Part 17. U.S. Department of Interior, Washington,
D.C. 34 pp.
148

Wilson, Okamoto and Associates, Inc. 1977. Kahakuloa water study. Report No. R54.Prepared for the Hawaii Division ofWater and Land Management, Department of Landand Natural Resources. 84 pp. + appendices.
Wilson, Okanioto and Associates, Inc. 1979. Environmental impact assessment for theHanalei National Wildlife Refuge. Prepared for U.S. Fish and Wildlife Service. 9lpp.
+ appendices.
Yamamoto, M.N. 1989. Recent surveys of Oahu streams. Hawaii Division of Aquatic
Resources, Department of Land and Natural Resources. Unpublished.
Yamamoto, M.N. 1989. Waimea fails survey, Oahu (9/21189). Hawaii Division of AquaticResources, Department of Land and Natural Resources. Unpublished.
Yuen, A.R. 1987. Social and territorial behavior of the endemic freshwater goby Sicyop
teras stimpsonL Department of Zoology, University of Hawaii, Honolulu. Unpublished.
149

Figure 3 Native Aquatic Species Illustrations
Awaous stamineus,‘o’opu nakea
Sicyopterus stimpsoni,‘o’opu nopili
Macrobrachium grandimanus,‘opae ‘oeha’a
Atyoida bisulcata,‘opae kala’ole
Figuri 10b ff,r,tb,, qrJn,s.upstr.a. .orpa 2-c. Shellnldth
Eleotris sandwicensis,‘o’opu okuhe or‘o’opu akupa
Stenogobius genivittatus,‘o’opu naniha
Figure I. E1,.iris s.ndnlc,nsis 8.5-c. (SI.) ci C
Fiqur. 2 Stenogobl,, gtnIvIllnus 3 u-c.
FIg.r. 3. a.,, I.,..,, 9.0-c. (SI) .1e
‘o’opu alamo’o or‘o’opu hi’ukole
figuri 4,. Sicycpl.rs,u slI.çS.ni 3.5-c. (St) fec..?.Figure 40. SIcop2ere, ,1Iap.t S.5-c.(SL) cii.
Lentipes concolor,
Fig,r. 6a. 5.tip.z cc.c,l,r 4.5-c. ($1) F..,?. Fig,.,-. 60. Lc.t(p., cc.c.?.r $ S-c. (SL) cal.
Fignr. S. M.crob,-.chi..e gr df.a,,, 25-.. FOCI. (Hal.)FIgure 7. Aly,ida o,,.,Ic,la S )Po,t-Orbitul C,r,p.c, I.c5ch (FOCI.)
Neritina granosa,hihiwai or wi
Neritina vespertina,hapawai
Source: Kinzie, R.S., III, 1989, Species Profiles.
Figure lOu. Strut., grinasidoc.strea. eorpi 3-c, shell‘lath
Fh5cre II.t,flrl is.. I S-c.
shell ,,Oth
150

Table 18 Aquatic Resources
CODE HSA code; island-hydrographic unit-stream (sys- Nopilitern) y oopu nopili.
STR.EAM Stream name at mouth Sicyoptems stimpsoni has been observed.
RANK Aquatic Ranking determined by the HSAAquatic Resources Y Hthrwai.Committee Neritina granosa, has been observed.
L Outstanding # NG2 Number of NG2 species observed
I IG1 Number of introduced s1)ecies (IG1)
S Substantial Year Year Last surveyedU Unknown Last
W Without I Suxv Number of surveys
Last Suiv Year of mo€t recent surveyAiamoo
tipesconoIor, has been observed. * Rank changed from 0 on basis of degradation of habitat
ksubsequent to studies
Ca** Rank raised on basis of evaluation of habitat and data
Y oopu nakea.Awu stamincus. has been observed. Rank lowered from Mon basis of habitat degradation
CODE STREAM [RANK Nakea Nopili #NG2 #IG1 #Surv
I2-1-01 Awaawapuhi 0 Y Y Y Y 1 1 842-1-04 Kalalau 0 Y Y Y Y 2 7 89
2-1-OS Pohakuao 0 Y 1 2 802-1-07 Hanakoa 0 Y Y Y 1 1 3 892-1-08 Waiahuakua 0 Y 1 2 802-1-09 Hoolulu L 1 2 802-1-10 Hanakapiai 0 Y Y Y Y 2 1 12 892-1-11 Maunapuluo 0 Y Y Y Y 1 4 892-1-12 Limahuli 0 Y Y Y 2 5 892-1-13 Manoa S Y Y Y 1 1 892-1-14 Wainiha R. 0 Y Y Y Y 6 3 11 892-1-15 LumahaiR. 0 Y Y Y Y 7 1 10 89
2-1-16 Waikoko W 1 78
2-1-17 Waipa S Y 3 1 2 66
2-1-18 Waioil S Y Y 3 1 1 662-1-19 HanaleiR. 0 Y Y Y Y 6 5 7 862-1-20 Waileia M Y 1 892-1-21 Anini M Y 6 3 5 89
2-1-25 KalihiwaiR. 0 Y Y Y 6 2 5 79
2-1-26 Puukumu M Y 1 1 3 89
2-1-28 Kilauea M Y Y 7 5 5 89
2-1-29 Kulihaili S Y Y Y 5 1 1 79
2-1-30 E. Waiakalua S Y Y 3 1 79
2-1-31Pilaa L
______ _____ _____ _____
1
______
1 79
151

CODE STREAM RANK Nakea Nopili ‘!,?J #NG2 #IG1 #surv
2-1-32 W. Waipake W 1 792-1-33 E. Waipake S Y 6 1 792-1-34 Moloaa L 4 4 1 792-2-01 Anahola 0 Y Y Y Y 4 3 4 892-2-02 Kuniukwnu L 1 1 1 782-2-04 Kapaa 0 Y Y 5 4 4 902-2-06 Waikaca Canal U 1 792-2-088 WailuaS. M Y Y Y 6 7 10 902-2-12 Hanamaulu L 1 3 2 662-2-15 Huleia 0 Y 6 7 4 902-3-02 Walkomo M Y 2 4 2 902-3-04 Lawai M Y Y 3 2 1 782-3-07 Hanapepe M Y Y 4 3 3 782-4-03 Waipao U 1 782-4-04s Waimea S. M Y Y Y 7 3 5 902-5-15 Miolii 0 Y Y Y Y 2 2 842-5-16 Nualolo 0 y y y y 3 2 84
Y Y Y
Y YYY
YY
3-1-073-1-093- 1-103-1-113-1-133- 1-163- 1-183- 1-193-1-203-2-013-2-023-2-043-2-053-2-07s3-2-083-2-093-2-103-2-11
3-2-13
3-2-143-2-153-3-07s3-3-09
KahawainuiKoloa GLKaipapauMaakuaKaluanuiPunaluu
KaaawaMakauaHakipuuWalkaneWaiaholeKaalaeaKahaluu S.’HeciaKeaahaiaKaneohe’Kawa”Kawainui/Maunawili’ ‘
Kaelepulu CanalWaimanaloAla WaiS.Nuuanu
L0LL00000MMMMMMMMU
L
wMML
YYYYYYYYYYYYY
Y
YY
11115571125556746
1
274
1312871311341041175155
8
1163
849084849089908484848484848484848984
84
84848989
4462
334455465
S
3364
152

CODE STREAM RANK Nakea Nopili J• #NG2 #IG1 #Surv
3-3-11 Kalihi M Y 4 5 3 893-4-02 Halawa W 1 2 893-4-06 Waiawa W 1 2 693-4-10 Waikele W 5 3 893-5-07 Makaha M Y 1 2 2 763-6-06s KilkilS. M Y 3 6 4 893-6-07s Paukauila 0 Y Y 3 7 3 893-&-08s Anahulu S. S Y 1 2 693-6-09 LokoEa W 1 853-6-10 WaimeaR. M Y Y Y 3 2 5 89
4-1-03 Waikolu 0 Y Y Y Y 3 6 874-1-06 Waiohookalo 0 Y Y Y 1 2 904-1-09 Pelekunu 0 Y Y Y Y 8 5 894-1-15 Wailau 0 Y 8 884-1-19 Kawainui U 1 664- 1-21 Halawa 0 Y Y Y 4 3 804-2-04 Waialua U 2 734-2-14 Kamalo W 1 904-2-IS Kawela W 1 90
6-1-01 Ukumehame S Y Y 2 6 906-1-02 Olowalu S Y Y 1 1 6 906-1-04 Kauaula W 2 636-1-05 Kahoma M Y 1 4 906-1-07 Honokowai L 1 3 636-1-09 Honokahua U 2 636-1-10 Honolua L 1 3 636-1-11 Honokohau 0 Y Y Y Y 5 1 8 906-2-03 Kahakuloa 0 Y Y 4 6 906-2-06 Makamakaole 0 Y Y Y 2 2 906-2-07 Waihec R. 0 Y Y Y 1 1 8 90
6-2-08 Waiehu S Y Y 1 3 636-2-09 lao S Y Y 2 1 5 906-2-10 Waikapu S Y Y 1 3 636-3-09 Hoolawa L 1 4 806-3-14 Kailua M Y 1 2 636-3-15 N1iiIihae1e L 1 2 636-4-04 Waikamoi W 1 5 90
153

CODE - STREAM RANK Nakea Nopili ?f #N02 #IG1 #Surv
6-066-076-4-086-4-096-4-106-4-116-4-136-4-146-4-156-4-166-4-176-4-186-4-196-4-216-4-226-4-236-4-326-5-036-5-076-5-086-5-096-5-106-5-116-5-126-5-136-5-176-5-206-5-24
PuohokamoaHaipuaenaPunalauHonomanuNuaailuaPiinaauWaiokanailoWailuanuiW. WailuaikiE. WailuaikiKopiliulaWaiohue Gi.PaakeaKapaulaHanawiMakapipiKawakoeKapiaWailuaHonolewaWaieliKakiwekaHahalawePuaaluuOheo GiKukuiulaAleleleManawainui
LLLLL0U0MMM0ML00000000000000
1
Y
Y
Y
YYYYYyYYYYyYYY
11
111
11117
1211
11
141
1
Y
Y
YY
YYY
YYY
Y
Y
Y
Y
YY
YYYY
YYYY
22
327256528121152222354510233
Y
YYYY
Y
Yy
Y
6363
90639063809090639079638490.8080:80808090908480809080
Y8-1-128-1-158-1-168-1-208-1-358-1-388-1428-1-448-1458-1-518-1-898-1-908-2-02
Y
AmkoPololuHonokane NuiHonokeaWairnnuNalueaWaipahoehoeWailoalWaipioakeaWaikoloaKaiwKaulaKaawalli
1
0UMUMLL00wUU0
Y
Y
Y
YY
Y
80696969907676696969
2
11
Y
Y
2222633222
22
71122
1
YY
Y69go
154

CODE STREAM RANK Nakea Nopili ?j #NG2 #IG1 #Surv
8-2-04 Laupahoehoc U 2 698-2-05 Kilau 0 Y 1 1 2 808-2-06 Manowaiopae 0 Y Y 1 2 808-2-07 Kuwaikahi 0 Y 1 2 808-2-09 Kaiwilahi1hi 0 Y 1 4 808-2-12 Kapehu 0 Y 1 4 808-2-14 Maulua 0 Y Y 1 2 698-2-16 Pohakupuka 0 Y Y 1 1 2 698-2-20 Manoloa 0 Y Y 1 5 908-2-21 Ninole 0 Y 1 3 808-2-23 Waikolu U 1 698-2-24 Waikaumalo L 1 1 3 798-2-27 Nanue 0 Y Y Y Y 1 1 2 698-2-28 Opea 0 Y Y 1 1 4 808-2-29 Peleau 0 Y 1 1 2 808-2-30 Umauma S Y Y Y 1 1 5 908-2-32 Hakalau 0 Y Y Y 3 2 5 808-2-33 Kolekole 0 Y Y Y 2 1 4 798-2-34 Paheehec 0 Y Y Y 3 2 3 698-2-35 Honomu 0 Y Y Y 1 1 4 808-2-37 Kapehu 0 Y 1 1 3 808-242 Waiaama L 1 1 2 698-2-43 Kawainui M Y 2 1 2 698-2-45 Alakahi S8-2-46 Hanawi 0 Y Y Y Y 1 1 2 698-249 Kaieie L 1 18-2-51 Kaapoko 0 Y 1 1 2 808-2-53 Kapue M Y 1 2 3 808-2-54 Pahoehoc S Y Y Y 4 1 2 698-2-56 Honolil 0 1’ Y Y Y 1 1 4 898-2-57 Maili 0 Y Y Y 2 1 2 698-2-59 Pukihac S Y Y Y 2 1 5 908-2-60 WailukuR. M Y Y Y 1 2 12 908-2-61 WailoaR. S Y 2 1 908-5-03 Waikoloa______ W
____ ____ ____ ____ ____
2 69
155

Table 19 Outstanding Aquatic Resources
Streams ranked outstanding In Aquatic Resources NG1 Y - Abundance of any NG1*and the criteria satisfied to be outstanding. Abn
NG1 Y - All 4 NG1 species presentCODE lISA code; island-hydrographic unit-
stream Crit Y - Good diversity and habitat as perB criteriaBSTREAM Stream Name at mouthQual Quality of informationAla- Y
-
Lendpes concolor commonmoo B Excellent
Spa- Y - Evidence of spawning by NG1* G GoodWU goby
‘ Poor
CODE STREAM Ala Spamoo wn
NG1NG1 CritAIm 4 B CODE SThEAM Ala Spa
moo wnG1Abn
NG14
CgtQUa
YYYYYY
YY YYYYYY
4-1-034—1-064-1-094-1-154-1-21
WaikoluWalohookaloPelekunuWailau
2-1-012-1-042-1-052-1-072-1-082-1-102-1-112-1-122-1-142-1-152-1-192-1-252-2-012-2-042-2-152-5-152-5-16
Y
Y
Y
Y
YY
AwaawapuhiKalalauPohakuaoHanakoaWaiahuakuaHanakapiaiMatmapuluoTimhujjWinih R.Lumahai R.Hanalei R.Kalihiwai R.AnaholaKapaaHuleiaMiloliiNualolo
Y
YYY
GEGEGEEEBEEEEEEBG
YYY
Y
YYYYYYy
Y
YYYY
Y Y -
Y YY YYYYGY E
__ ____
Y Y YG
I____
__--
6-1-Il Honokohau E6-2-03 Kahakuloa Y Y E6-2-06 Makarnakaole Y E6-2-07 WaiheeR. Y Y E6-4-11 Piinaau Y Y Y E6-4-14 Wailuanui Y Y G6-4-18 Walohue GI. Y Y Y E6-4-22Hanawi Y Y Y Y E6-4-23 Makapipi Y Y B6-4-32 Kawaikae Y G6-5-O3Kapia Y Y G6-5-07 Wailua Y Y G6-5-08 Honolewa Y Y G6-5-09 Waiei Y Y B6-5-10 Kalciweka Y Y E6-5-11 Hahalawe Y Y6-5-12 Puaaluu Y Y Y E6-5-13 OheoGi Y Y Y Y E6-5-17 Kukulula Y Y G
I 6-5-20 Alelele — — Y — — E
3-1-09 KoloaGi. Y E3-1-13 Kaluanui Y E3-1-16 Punaluu Y Y B3-1-18 Kahana B3-1-19 Kaaawa Y E3-1-20 Makaua Y 03-6-07 PaukauilaS. Y G
156

6-5-241 Manawainui Y
CODE I STREAM
Y
Ala Spa ING1moo wn Abn
NG14
GilCODE
CritB
STREAM
Y y
Ala Spa G1 G1moo wn Abn 4
8-1-12
8-1-44
8-1458-2-028-2-058-2-068-2-07
CritB )ua
AamakaoWailoa/WaipioLalakeaKaawaliiKilauManowaiopaeKuwikhi
Y
YYYYYY
0
P
PG00G0
YYYY
8-2-09 Kaiwilhilhi
8-2-208-2-218-2-278-2-288-2-298-2-328-2-338-2-348-2-358-2-378-2-468-2-518-2-568-2-57
ManoloaNinoleNanueOpeaPeleauHakaiauKolekolePaheeheeHonomuKapehuHanawiKaapokoHonoliiMaili
YY
YYY
YY
YY
YY
YYYYYYYYYYYYYY
8-2-12 Kapehu Y G8-2-14 Maulua y pR-2-16 Pohakunuka Y Y P
Y
Y
Y
EGP0GGEGGGP0EP
Y
Y
157

Table 20 Methodology For Data Collection andSample Data Sheet
The available biological information compiled for each stream is summarized in a threepage data sheet. Each data sheet is identified with the name of the stream, the HSAstream code, and the list of sources used. The sources are coded with the first letterindicating the type of source (unpublished, book field notes, personal communications),the two numbers following are the last two digits of the year in which it was prepared orpublished; following are the first three letters of the first author’s last name. The last twodigits are a tie breaker. For example, in Attachment 2* the first source is U88FORO1.This refers to an unpublished report prepared in 1988 by John Ford and Andy Yuen.
The first page contains information on the presence, abundance or absence of nativespecies observed. For each species, the maximum abundance (Max) and most currentobservation (Cur) with their respective years were recorded. If only one observation wasmade at a particular stream, the information was recorded in the current observationscolumn. When the abundance in the most current survey and the maximum abundancewere the same, then the information was recorded under the current column with themost current date adjacent to it.
While aquatic biologists commonly use “abundant,” “very abundant,” “common,” andso forth, there is no commonly accepted numerical standard for defining these terms.Thus, the distinction between them is imprecise and somewhat subjective.
Information on spawning (Spn) and/or recruitment (Rcrt) was also recorded. Nativeaquatic plant or animal species not listed on the data sheet were written in below thespecies lisi
The total number of native species observed was then summarized by group in the tablein the middle of page 1. The totals for NG1 and NG2 species were later used to rate theabundance and diversity of native species in the stream.
The second page of the data sheet lists introduced species. The information onpresence and abundance of introduced species was recorded in the same way as fornative species. At the bottom of page 2 is a table summarizing the total number ofintroduced species observed in the stream by group. Marcrobachium lar was notedseparately.
The Factor Summary Table on page three noted the total number of NG and IG species,along with ratings for diversity, spawning and recruitment. Habitat quality, dams,diversions and channelizatious were ranked only if mentioned specifically in the biological sources consulted for this project. Timbol and Maciolek (1978) was not referenced.Otherwise these factors were ranked as “U”.
158
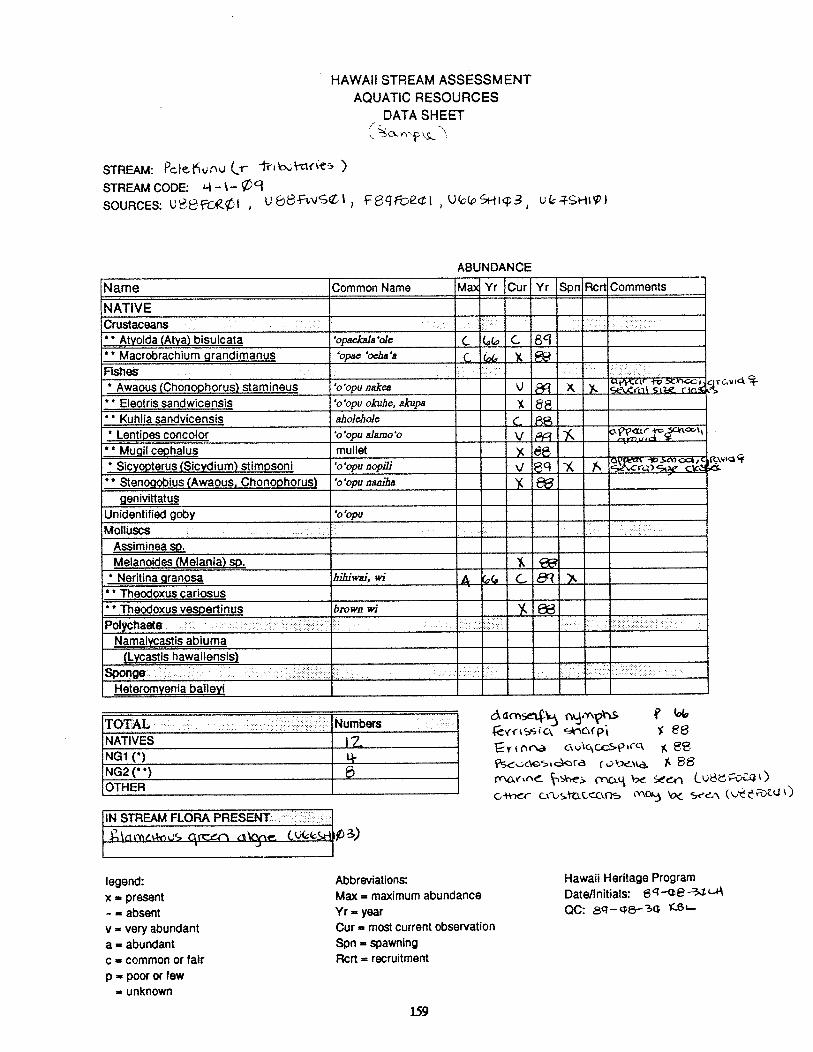
HAWAII STREAM ASSESSMENTAQUATIC RESOURCES
DATA SHEET
STREAM: PI’ni (r trxAt1(t’ )STREAM CODE: - -Ø9SOURCES: UFc4I U eWS1 J(oi-tç3, uL4--j)
ABUNDANCE
aansei4
r(95ic
-3Cr?,Cr2),.a’ ck S.
rrnr’a Cj\CCCS(C
sS.-àcsidofà /sr’w cr Secn Coe-’)c-c sjccns iYC* (J oQ’)
legend:x present- — absentv very abundanta — abundantC — common or fair
p — poor or fewunknown
Abbreviations:Max = maximum abundanceYr - yearCur — most current observationSpn — spawningRcrt recruitment
Hawaii Heritage ProgramDatellnitials: —8 —3i’-4
00: 8q---3G
Name Common Name Ma Yr Cur Yr Spn Rcr Comments
NATIVECrustaceans
* Atyolda (Atya) bisulcata opaeJcnia ‘ale (. ( C.Macrobrachium Qrandimanus ‘opac ‘oeha’a ç — —
FishesAwaous (Chonoohorus) stamineus ‘o’opu nakea =
•* Eleotris sandwicensis ‘o’opu okuhe, akupa — — — —
‘ Kuhila sandvicensis abolehole
Lentipes concolor ‘o’opu alamo’o VMuail ceohalusSicyopterus (Sicydium) stimpsoni
* Stenooobius (Awaous, ChonophcQenivittatus
mullet x‘O’OPU fl?P11‘o’apfinaniha
Unidentified goby O’Opu
MolluscsAssiminea so.Melanoides (Melania) sp. — — —Neritina cranosa hibiwai, wi
Theodoxus cariosus• * Theodoxus vespertinus brown wi — — — —
Po1ychaaNamalycastis_abiuma
(Lycastis hawailensis)Sponge
Heteromyenia_baileyi
TOTAL NumbersNATIVES 12.NG1(*)NG2(”)OTHER
IN STREAM FLORA PRESENT.r ((4It;)
159

z
øI
(0
0
..eO
rrO
<0
1<
øc
c).
z00
(0
a,
E
zzD
InCa,
EE0C)c::C
’>
>-
-“-
------
----
-.-
a,
C‘C
C0
=0
CC
’C
Eco
0‘C
(F
ooo
Ea,
Q
In
:3
.-
.cI,
1;
-.4
‘B+
(‘4

HAWAII STREAM ASSESSMENTAQUATIC RESOURCES DATA SHEETCONTINUED (page 3)
STREAM:STREAM CODE: 4-4-Q
FACTOR SUMMARY TABLE
Iw NET) i- ‘i tBGI
Faötor: : Ranks Comments
Native Species Group 1 (NG1)Native Species Group 2 (NG2)Native Species DiversityNative Species Spawning or RecruitmentExotic Species Group 1 (EG1) M•arExotic Species Group 2 (EG2)Habitat Suitability (e) u3 QqDams and DiversionsChannelizationData Quality 1 j
Legend: E = excellentG = goodP = poorU = unknown
* For exotic species the number of species observed rather than a rank is assigned
Dams and diversions and channelization factors include only information
other than Timbol and Maciolek 1978
TABLE OF STREAM RANKCOMMENTS
INITIALCOMMITTEEFINAL osroridi
161

Criteria for Additional Aquatic Resources Factors
Native Species Group Qn (NG1)E = More than two species present or two species present with at
least one common to abundant.G = Two species present or one species that is common to abun
dant.P = Fewer than two species present and uncommon.
Native Species Group Two (N02)E = More than two species present or two species present with at
least one common to abundant.G = Two species present or one species that is common to abun
dant.P = Fewer than two species present and uncommon.
Native Sp.& DiversityE = At least two species present from each of the groups NG1 and
NG2.G = At least one species present from each of the groups NG1 and
NG2.P = One or fewer species present from groups NG1 or NG2.
Native Species Spawning RecruitmentE = Evidence of significant spawning or recruitment by any NG1
fish.G = Evidence of significant spawning or recruitment by any NG2
species or occasional spawning by any NG1 species.P = No spawning or recruitment by NG1 or NG2 species.
Introduced Species Group Qn.e. (IG1)Codes were not used for introduced species; the number of species present
was recorded instead. IG1 does not include insects.
Introduced Species Group Twa (102)Codes were not used for introduced species; the number of species present
was recorded instead. 1G2 does not include insects.
Habitat Suitability*E = Good pools and riffles with a gentle slope in the lower reaches,
gravel bottom with niinini1 sedimentation, and continuouswater flows with low turbidity except during freshets.
G = Steep slope in the lower reaches with nearly continuous to intermittent water flows or gentle slope with significant sedimentation.
P = Limited intermittent water flows with extended disappearanceof riffles.
* Habitat was only ranked if mentioned specifically in the biological sourcesconsulted, otherwise it was ranked “13”
162

Dams ni DiversionsE = No darns or diversions.G = No dams or diversions in the middle to lower reaches.P = Dams or diversions below the upper reaches or a loss of 50% of
the mean annual flow.
ChannelizationE = No channelization.G = Channelization limited to grading or straightening with
retention of a gravel substrate.P = Concrete linings, chutes, or flumes installed.
Data OualityE = Two or more recent surveys (1975 - present).G = At least one recent survey.P = one or more surveys, all prior to 1975.
Legend:E = excellent, G = good, P = poor, U = unknown
Note: This is supplemental information that was used to rank the streamdirectly. The ranking or the streams came from the database based on thedefinitions by advisors.
163
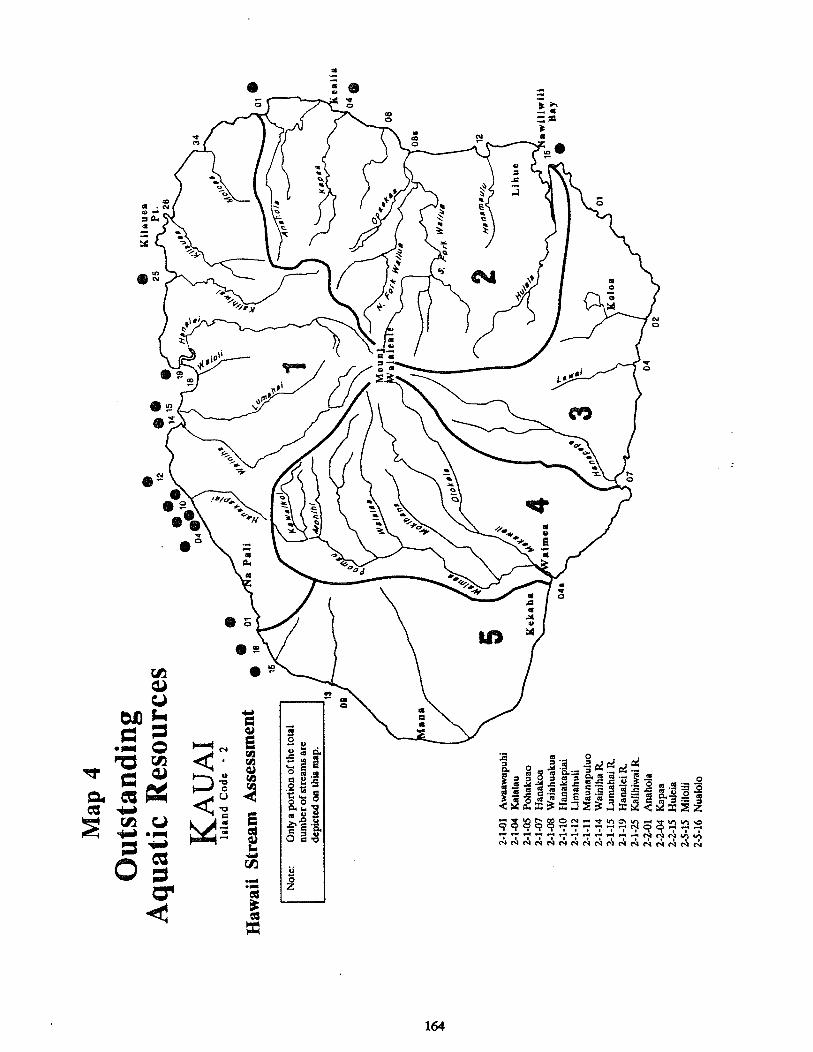
Map
4
Ou
tsta
nd
ing
Aquat
icR
esou
rces
KA
UA
Ila
land
Code
-2
Haw
aii
Str
eam
Ass
essm
ent
Not
e:O
nly
apo
rtio
nof
the
tota
lnu
mbe
rof
stre
ams
arc
depi
cted
onth
iam
ap.
2-1-
01A
waa
wap
uhi
2-1-
04K
alal
au2-
i-O
SP
ohak
uao
2-1-
07H
anak
oa2-
1-08
Wai
ahua
kua
2-1-
10H
anak
apia
i2-
1-12
Lim
ahul
i2-
1-11
Mau
napu
luo
2-1-
14W
aini
tia
R.
2-1-
15L
umah
aiR
.2-
1-19
Han
alci
R.
2-1-
25K
allh
iwai
R.
2-2-
01A
naho
la2-
2-04
Kap
aa2-
2-15
Hul
cia
2-5-
15M
ilol
ii2-
5-16
Nua
lolo
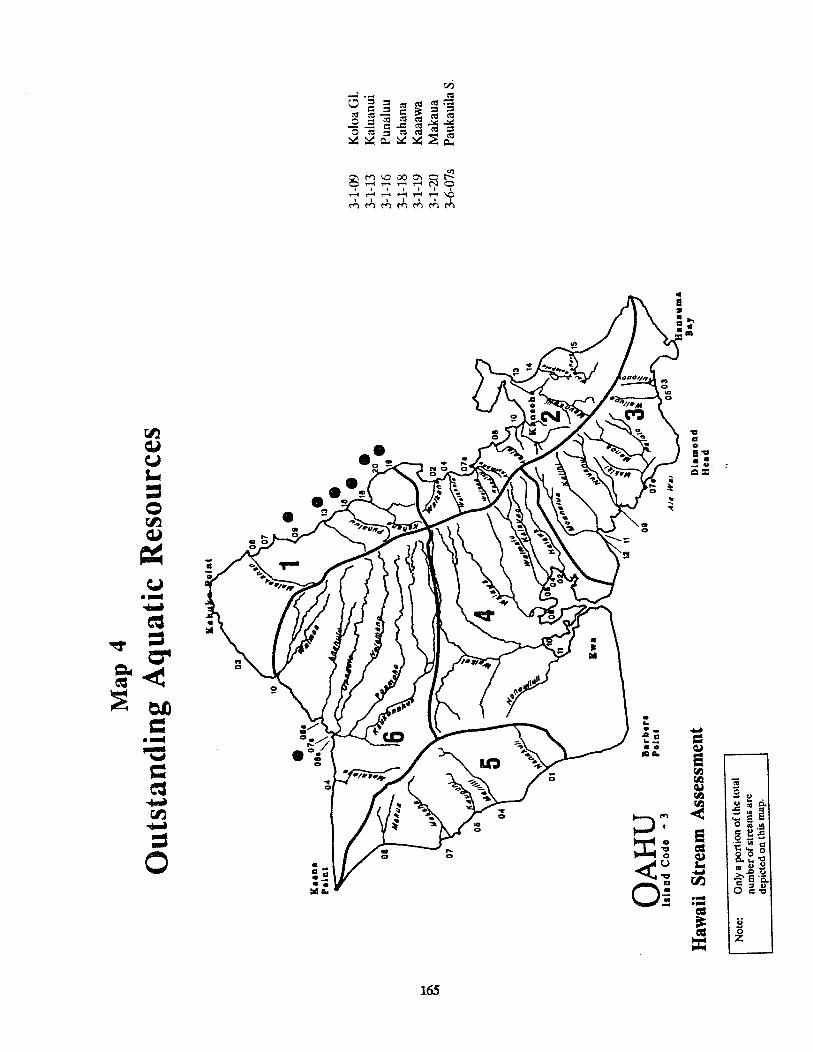
Map
4
Out
stan
ding
Aqu
atic
Res
ourc
es
OA
HU
Isla
nd
Cod
e-
3
Haw
aii
Str
eam
Ass
essm
ent
Not
e:O
nly
aport
ion
of
the
tota
l
num
bcr
ofst
ream
sar
c
dep
icte
don
this
map
.
lat
Ka.n
aP
ain
t
.
.
07
05
04
3-1-
09K
oloa
Gi.
3-1-
13K
alua
nui
3-1-
163-
1-18
3-1-
19
Pun
aluu
Kah
ana
Kaa
awa
3-1-
20M
akau
a3-
6-07
sP
auka
uila
S.
aarb
.r.
A/a
Wa,
Dia
mond
Hea
d
*n*
aB
ay

Map
4O
uts
tandin
gA
qu
atic
Res
ourc
es
4-1-
034-
1-06
4-1-
094-
1-15
4-1-
21
Wai
kolu
Wai
ohoo
kalo
Pel
ekun
uW
aila
uH
alaw
a
[e:
Onl
ya
port
ion
ofth
eto
tal
num
ber
ofst
ream
sar
ede
pict
edon
this
map
.
fib
Poin
tK
ahin
Po
int
Laa
uK
am
alo
Poin
t
MO
LO
KA
IIs
lan
dC
ode
-4
Haw
aii
Str
eam
Ass
essm
ent

64-1
16-
2-03
6-2-
066.
2-07
6-4-
116-
4-14
6.4-
186-
4-22
64-2
36-
5-03
6-5-
076-
5-08
6-5-
096-
5-10
6-5-
116-
5-12
6-5-
136-
5-17
6-5-
206-
5-24
Hon
okoh
auK
ahak
uloa
Mak
amak
aole
Wai
hee
R.
Pii
naau
Wai
luan
uiW
aioh
ue01
.H
anaw
iM
akap
ipi
Kap
iaW
ailu
aH
onol
ewa
Wai
cli
Kak
iwek
aH
ahal
awe
Pua
aluu
Ohe
o01
Kuk
uiul
aA
lele
leM
anaw
ainu
i
Not
e:O
nly
aport
ion
ofth
eto
tal
num
ber
ofat
ream
sar
c
[de
pict
edon
this
map
.
07 Lah
01
Map
4
Outs
tandin
gA
quat
icR
esou
rces
2
Hau
s
MA
UI
Isla
nd
Code
-a
Haw
aii
Str
eam
Ass
essm
ent

Map4
OutstandingAquatic Resources
8-1-128-1-448-1458-2-028-2-058-2-068-2-078-2-098-2-128-2-148-2-168-2-208-2-218-2-278-2-288-2-298-2-328-2-338-2-348-2-358-2-378-2-468-2-518-2-568-2-57
AamakaoWailoa/WaipioLalakeaKaawaffiKilauMaaowaiopacKUWaikahiKaiwilahilahiKapehuMauluaPohakupukaManoloaNinoleNanucOpeaPcleauHakalauKolekolePaheeheeHonomuKapehuHanawiKaapokoHonoliiMaili
Upal. P.iaI07
S..th P.lat
HAWAIIIsland Code - *
Hawaii Stream Assessment
Note: Only a portion of the totalnumber of atreania arcdepicted o this map.
168

Riparian Resources
Streams are dependent on and affected by the physical and biological entities thatsurround them and compose their watersheds. No statewide inventory or assessment ofHawaiian watersheds has been conducted, even though their deterioration has been aconcern since the turn of the century (Hail 1904, Judd 1931). This inventory has,therefore, concentrated on known stream-associated resources (e.g., rare, threatenedand endangered species and communities, protected areas, wetlands, native forests)because of their intrinsic value and because their presence or absence provides anindication of the status of the watershed. This indirect approach to assessing watershedquality is very limited and identifies an important area where research is needed.
Riparian resources have been defined in US. main1nd stream assessments to includeeverything within a strip extending either a quarter of a mile or 1,000 feet on each sideof a stream or river. But an arbitrary fixed distance from the stream was consideredinappropriate to define riparian resources in Hawaii. A Hawaiian stream may passthrough narrow gorges, plunge down cliffs in excess of2,000 feet and/or meander throughbroad flood plains during its short course to the ocean. Therefore, natural resources areconsidered riparian in this assessment if they.
o could affect the quality of the stream;
o could be affected by changes in stream management;
o were adjacent to and possibly dependent on the stream.
Many riparian resources in Hawaii have been addressed in a broad array of publications. The most comprehensive report, the US. Fish and Wildlife Service’s (IJSFWS)Forest Bird Survey (Scott ci 1. 1986), indudes distribution maps of various resources.Several databases have been compiled. wetland plants (USFWS 1989); wetland physicaldata (U.H. Environmental Center 1989); and rare plant distribution (The NatureConservancy of Hawaii’s ongoing Heritage Program). Government agency files andmaps, particularly those of the USFWS and the state Division of Forestry and Wildlife,provided information on rare plants, weeds, vegetation type, etc. Data from all of thesesources have been abstracted and incorporated into the inventory and assessmentcompiled by this project.
All of the categories of riparian resources inventoried for the assessment are biological/ecological. The committee considered for a time the inclusion of notable geologicfeatures such as the exposures of pillow lavas at the base of Wailua Falls on the SouthFork of the Wailua River and at the Menehune Ditch next to the Waimea River, bothon Kauai. However, the committee decided that, on the one hand, the association of suchfeatures with the streams was insufficient to warrant their inclusion in the inventory and,
169

on the other hand, the features having significant influence on stream characteristics(such as the dikes responsible for springs) were too ubiquitous to warrant inclusion.
Background
Many factors in the surrounding area affect the purity of water in a stream; e.g., thestatus of the surrounding vegetation, the area! extent of unvegetated soil, and thepresence of animals. The role ofvegetation is complex. It controls runoff directly as wellas the recharge of groundwater, which may affect stream flow downslope. Vegetationalso prevents or reduces soil erosion, which directly affects the purity of streamwater.Disturbance from alien influences can exacerbate the natural processes of erosionenormously. Adjacent land uses can affect streams directly and indirectly.
The ideal riparian assessment would evaluate the quality of the watershed in conjunction with the unique or special features and organisms found within it. However,information on the condition ofwatersheds in Hawaii is fragmentary at best. On the otherhand, the distribution of Hawaii’s native organisms, especially the more charismaticspecies, is reasonably well-documented and is the focus of this inventory and assessment.
Many rare native species are dependent on undisturbed habitat. Their presence is,therefore, an indication of the integrity of the native vegetation. The presence of asubstnti21 native forest similarly indicates that aliendisturbances are minimpl. All nativeorganicmc and communities have evolved in these habitats over the millennia and areadapted to Hawalis environment and its inherent variability Their presence along astream course indicates that “natural” (pre-Cook or perhaps even pre-Polynesiandiscovery) processes are still occurring. it is presumed that a greater extent of nativeforest and number of rare communities and species indicate a higher level of nativeecological processes in the watershed and consequently an ecosystem better adapted toHawaiian conditions.
Wetlands are important riparian resources but many have been drained and convertedto agricultural or urban uses. The conservation of those that remain is of criticalimportance to the USFWS.
Conservation of Hawaii’s unique heritage by national parks, wildlife refuges, naturalarea reserves, and private preserves provide special protection from exploitation anddegradation. Few streams are protected throughout their course with preservation ofriparian resources and processes a primary management objective. Yet the presence ofthese areas along a part of a stream reduces the risk of degradation and is therefore afavorable feature.
Some alien animals and plants (i.e., those introduced since 1778) have a negativeinfluence on streams. Feral animals (e.g., pigs, sheep, goats), none of which are nativeto Hawaii, destroy vegetation, open up forests, accelerate soil erosion, and contaminatethe water with fecal material. Weedy plants can dramatically alter the nature of a streamgenerally by impeding water flow. Three species California grass, han, and red mangroveare considered to have the greatest influence. The presence of any of these animals orplants along a stream course has the potential to disrupt the natural processes. Each
170
species has a characteristic impact, the cumulative effects of which can be compoundedsiflcantly.
MethodsCommittee
The definition of riparian resources, identification of sources, methods of gatheringinformation and development of criteria for this inventory and assessment were conducted by a committee of six people from federal, state and private agencies. Thecommittee met seven times between February 1989 and June 1990. Occasionally,specialists and other interested individuals also participated.
Riparian Resource Committee
Co-Chair John Harrison, UH Environmental Center,Co-Chair Clifford Smith, Unit Leader CPSU/UH;Doak Cox, retired UH ManoaAudrey Newman, TNCH;Ron Walker, Wildlife Manager DLNR;Andy Yucn, USFWS or John Ford, USFWS.
InventoiyThe riparian inventory elements are: Listed threatened and endangered species;
Recovery habitats; Other rare organisms and communities; Protected areas; Wetlands;Native forest; and, Detrimental org2nicm.
Listed threatened and endangered species. These species are generally dependent onundisturbed habitat. Their presence is, therefore, an indication of the integrity of thenative vegetation. We consider the presence of these species along a stream course tobe a positive attribute; the more types of threatened and endangered species associatedwith a stream the higher the value of the resource. Only federally listed threatened orendangered forest or water birds that have been extensively documented within the last15 years are included. No stream associated plant has been officially listed as endangered or threatened to date. Sources used include Scott tai. (1986); TNCH HawaiiHeritage database; Wagner, Herbst and Sohmer (1990); USFWS wetland plant inventory database.
Recovery habitat. Recovery habitat consists of those areas identified by the USFWS(1985) and DLNR as essential for the recovery of threatened and endangered species.Streams that have recovery habitat anywhere along their length are included.
Other rare organisms and communities. Many species that are candidates for endangered or threatened status have not been processed through all of the requirementsof the Endangered Species Act Also a number of plant communities associated withstreams have become extremely rare. We consider these rare organisms and communities to be as indicative of natural Hawaiian biological processes as are listedthreatened and endangered species. Species listed as candidate endangered species bythe USFWS, or classified 01(5 or fewer populations or less than 1,000 individuals) or02 (between 6-20 populations and 1,001-3,000 indMduals) by TNCH Hawaii Heritage
171

database, or considered rare by experienced field botanists (Obata; Wagner, Herbst andSohmer) are included in this category. Species are listed only if their presence has beenconfirmed in the last 15 years.
Protected areas. The riparian resources of streams that pass through natural areareserves, refuges and other protected areas are accorded special protection fromdegradation. Protected areas were so designated because of features other than theirriparian resources. The presence of these areas along a stream, however, indicates thatnative processes are promoted and alien influences controlled. Streams that passthrough areas protected by the federal government (National Park, National WildlifeRefuge, National Natural Landmarks, and National Estuarine Research Reserve), stategovernment (Natural Area Reserves, Wildlife Sanctuary, Plant Sanctuary, and MarineLife Conservation District) as well as areas not under state or federal management (TheNature Conservancy Hawaii Preserves) are included. Forest reserves, recorded in thedatabase, are not included because they have not been evaluated. State and county parksare also excluded because their principal function is recreation not conservation. Sources for this infonnation include Atlas of Hawaii, HSA Recreation Committee; StateDivision of Parks and Recreation; NARS Maps; DAR, Eric Onizuka l{RS 13-125-3;USGS maps; and DOFAW Carolyn Corn.
Wetlands. Wetlands are important riparian resources. They provide habitat for manyspecies and are often important nursery areas. Because they are often extensive areas offlat land generally with deep soil, many have been drained and converted to agriculturalor urban uses. Those that remain are, therefore, invaluable as well as being indicators oflack of disturbance. Three enumerations of wetlands have been produced in Hawaii:Elliott & Hall (1977), UHEnvironmental Center (1990), and USF4VS (1978). The Elliott& Hall and Environmental Center systems are quite specialized.
Native forest. The proportion of a stream course flowing through native forest providesan indication of the potential “naturalness” on the quality of a stream’s watershed; thegreater the percentage of a stream flowing through native forest most of which isprotected in forest reserves the more significant the resource. Only the length of the maincourse of a stream (to the nearest 10 percent) that passes through native forest wasrecorded. Inclusion of all tributaries was beyond the scope of the project due to timeconstraints. Streams were measured from vegetation map overlays on topographic quadmaps. Small pockets of native vegetation within alien vegetation and yj ir wereignored. The data was obtained from the Hawaii Forest Bird Survey maps (Scott L AL1986) for Hawaii, Maui and Molokai. Oahu’s native forest limits were from personalconsultation with Obata. Kauai’s were from Scott l. (1986) supplemented by information from Perlman. Other information was obtained from Jacobi (1989).
Detrimental organisms. Some nmIc and plants have a negative influence on streams.Wild knimsIts (e.g., pigs, goats, deer) destroy vegetation, open up forests, accelerate soilerosion, and contaminate the water with fecal material. Weedy plants can dramaticallyalter the nature of a stream generally by impeding water flow. Three species, Californiagrass, han, and red mpngrove, are considered to have the greatest influence. Thepresence of any of those animals on plants along a stream course is considered apotentially negative factor. The degree of detriment is dependent on the number ofspecies present. These species were identified by DOFAW wildlife biologists and Smithin consultation with R. Hobdy, L Stemmermann, P. Higashino, S. Penman.
172
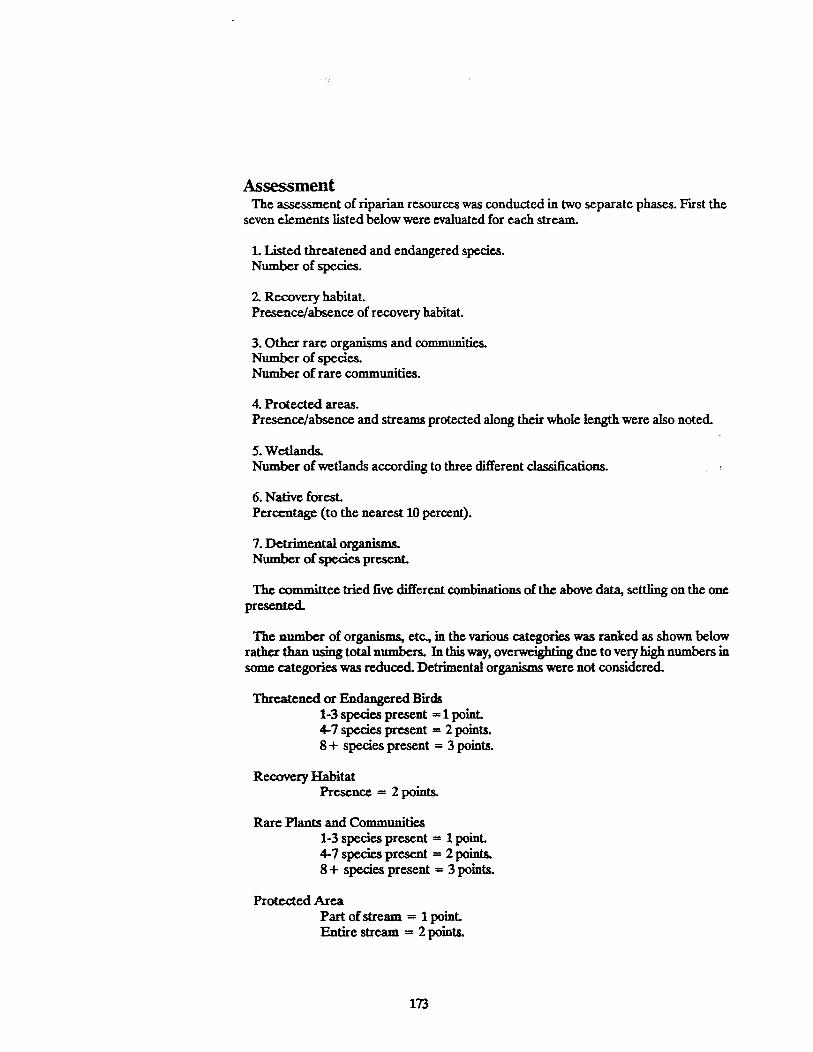
AssessmentThe assessment of riparian resources was conducted in two separate phases. First the
seven elements listed below were evaluated for each stream.
1. Listed threatened and endangered species.Number of species.
2. Recovery habitat.Presence/absence of recovery habitat.
3. Other rare organisms and communities.Number of species.Number of rare communities.
4. Protected areas.Presence/absence and streams protected along their whole length were also noted.
5. Wetlands.Number of wetlands according to three different classifications.
6. Native forest.Percentage (to the nearest 10 percent).
7. Detrimental organisms.Number of species present.
The committee tried five different combinations of the above data, settling on the onepresented.
The number of organisms, etc., in the various categories was ranked as shown belowrather than using total numbers. In this way, overweighting due to very high numbers insome categories was reduced. Detrimental organisms were not considered.
Threatened or Endangered Birds1-3 species present = 1 point.4-7 species present = 2 points.8 + species present = 3 points.
Recovery HabitatPresence = 2 points.
Rare Plants and Communities1-3 species present = 1 point.4-7 species present = 2 points.8+ species present = 3 points.
Protected AreaPart of stream = 1 point.Entire stream = 2 points.
173

WetlandSmall wetlands = 1 point.Large wetlands = 2 points.Elliot and Hall or Environmental Center Identified = 3
Percent Native Forest10- 30% = 1 point.40-60% = 2 points.70%+ =3points.
Streams were classified as follows:Outstanding =6or more pointsSubstantial = 4-5 pointsNot classified = 3 or fewer.
Other streams were reviewed for inclusion to ensure that there were no obviousmistakes or inadequacies in the database. No streams were added or subtracted fromthe computer-generated listing.
ResultsInventory
Riparian information is provided for all streams (Table 28) and summarized (Table21). Information on rare plants is relatively incomplete. This reflects a general problem,which is now being addressed by the Hawaii Heritage Program Database and otherefforts. As a general rule, the larger, well-known streams have more complete andlonger-term records.
Table 21 Number of Streams with Riparian Information.
Island T&E Recovery Rare Protected Palustrine DetrimentalBirds Habitat Plants Part All Wetlands 1 or fewer
Kauai 38 9 15 70 33 23Oahu 37 10 14 30 44 9Molokai 11 0 5 148 12 2Maui 14 1 9 201 39 50Hawaii 19 4 11 14 1 70 111
Threatened and endangered birds Eighteen species of threatened and endangeredbirds are associated with streams (Table 22): Kauai -10 species on 38 streams; Oahu -
4 species on 37 streams; Molokai -2 species on 11 streams; Maui -7 species on 14 streams;and Hawaii -5 species on 19 streams. Four of these species are water birds. One, thepuaiohi, is a forest bird, the only two nests of which ever recorded were along streambanks. The remainder are forest birds whose habitat includes streams but the degree ofrelationship is unknown. One hundred and nineteen streams have threatened andendangered birds within their riparian zone (Table 26). There are four or more birds on22 streams —213 of which are on Kauai. Only one stream, Waimea, Kauai, has ninethreatened and endangered birds. One streamhas six seven streams have five, 13 streams
174

have four, 35 have three, 29 have two, and 33 have one. There is no correlation foundbetween length of stream and the number of rare threatened and endangered birds noris there any relationship between the extent ofnative forest and number ofstream-relatedforest bird species.
Table 22 Threatened and Endangered Stream-Related Birds
Scientific name Common nameFzdica americana alal Hawaiian cootGallimila chioropus sandvicensis Hawaiian GallinuleHemignathu.cparvus AnianiauHemignathus lucidus NukupuuHemignathus mum-ol AlciapolaauHinwiztopus mexica,ws knudseni Hawaiian stiltAiias iyviZliana Koloa, Hawaiian duckLoxops coccineus AkepaMelamprosopsphaeosoma PoouliMoho braccaass Kauai ooMyadestes lanaien.rir OlomaoMyadestes myadesfiiw KamaoMyadestespaisnen PualohiOreomystis bairdi Kauai CreeperOreomystis mona Hawaii CreeperPabnena dolei Crested HoneycreeperPseudonesrorxanthophiys Maui parrotbillFsittirostrapsittacea Ou
Recovery habitatTwenty-four perennial streams have waterbird recovery habitat associated with the
stream (Table 27): Kauai has nine streams (37%), Oahu ten (42%), Hawaii four (17%),Maui one (4%), and Molokai.
Rare, threatened and endangered plants None of the currently listed threatened andendangered plants are associated with perennial streams.
There are 180 tam of rare vascular plants associated with streams in Hawaii (Table30). Kauai has 48 species associated with 21 streams, Oahu 37 species on 21 streams,Molokai 18 species on 18 streams, Maui 25 species on 13 streams, and Hawaii 11 specieson 13 streams. Most of the species (105) are found only on one island, 21 on two islands,three on three islands, and one on five islands. None of these species are federally listed.
Twelve streams have four or more rare plants within their riparian zone (six streamson Kauai, two on Oahu, one on Molokai and three on Maui). Waimea system on Kauaihas 17 rare plants. There is no correlation between length of stream and the number ofrare plants.
Rare communitiesOnly one of the 18 natural Hawaiian communities classified by the Hawaii Heritage
Program that are associated with streams is considered rare, and that community is theKauai diverse lowland mesic forest. Three examples of this forest are along Kalalau,Milolii, and Waimea streams.
175

Protected areas A total of 61 streams flow through federal, state or privately protectedareas, at least in part seven on Kauai; four on Oahu; 14 on Molokai; 22 on Maui; and,13 on Hawaii. Only 13 streams (3 percent of total assessed) are protected along theirentirety: Wainianu, Hawaii; Oheo, Maui; nine on Molokai’s northshore; and two onKauai’s Na Pall coast.
Wetlands There are 198 streams with associated palustrine wetlands (USFWS 1978):33 on Kauai; 44 on Oahu, 12 on Molokai; 39 on Maui; and, 70 on Hawaii. Elliott & Hall(1977) list 29: 8 on Kauai, 19 on Oahu and one each on Maui, and Hawaii. TheEnvironmental Center currently lists 18 on Oahu. There are some inconsistenciesbetween the various evaluations which are dependent on different criteria.
Native Forest No perennial stream has native forest along its entire length (Table 23).There is an apparent correlation between the degree of urbanization/agriculturaldevelopment on an island and the degradation of forest around the streams.
Table 23 Number of streams with Native Forest (percent)
Percentage Kauai Oahu Molokal Maui Hawaii100 0 0 0 0 090 0 0 1 0 080 0 0 3 3 170 0 0 2 5 260 1 0 3 2 1050 2 0 1 4 1040 4 2 0 4 130 11 1 6 6 1120 7 1 7 11 1410 12 13 10 13 190 30 40 8 31 65
Detrimental organismsAll of Hawaii’s perennial streams have detrimental organisms associated with them
(Table 24).
Table 24 Number of streams with Detrimental Organisms
Island Number detrimental nrgniimc6 5 4 3 2 1 0
Kauai 0 1 2 17 18 23 0Oahu 0 0 21 14 7 9 0Molokai 0 6 6 21 0 2 0Maui 0 0 0 19 29 42 0Hawaii A ii U 111Total 1 4 35 61 67 187 0
176

AssessmentThirty streams have outstanding riparian resources, 65 substantial and the remainder
ale left unclassified (Table 28,29). Of the 30 streams classified outstandingTwelve have four or more threatened and endangered birds, 26 have threatened and
endangered birds;Six have four or more rare plants, 12 have rare plants;Six have 70% or more native forest, 16 have 40 % or more native forest;Fifteen have Recovery Habitat;Nineteen are protected, four of them along their total length;All have pigs, eight have other detrimental nimutc, and 23 have detrimental plants
associated with the stream in some part of its course.
Table 25 Island Distribution of Ranked Streams
Rank IslandKauai Oahu Molokai Maui Hawaii
Outstanding 8 6 2 9 5Substantial 18 13 11 10 13 -
Unclassified 35 38 23 71 114
DiscussionThe absence of information on watershed quality in Hawaii made consideration of this
important resource in the riparian assessment of streams very difficult. An evaluation ofHawaii’s watersheds is considered to be a top priority research need. Other problemsinclude significant lack of data for certain areas; data collected at widely different times,some of it more than 15 years old, inconsistencies in the reporting of information atdifferent times and from different areas, etc., all of which result in a very tenuousassessment.
A number of approaches to assessing riparian resources were made. The objective wasto include as many inventoried elements in the assessment as possible. Outstandingriparian resources were identified primarily on the presence ofrare species or significanthabitats. The chosen assessment included almost all elements inventoried but rankedeach element so that there was a relative equality in the scoring for each element.Detrimental organisms, though included in the inventory were not used in the finalassessment to avoid excluding streams with significant resources that might otherwisebe penW’rd.
It could be argued that the use of indirect measurements would result in a somewhatinaccurate rnking The fact that the committee felt there was no need to add or subtractfrom the computer-generated listing indicates that the final assessment agreed well withexpert opinion.
177

Limitations
Rare, threatened and endangered communities and species.These communities and species present four problems when used for assessment
purposes. First, the communities and/or species may be confined to a small area of astream otherwise dominated by alien influences. Second, some species, e.g., tree species,can remain for a long time in a sea of aliens. Third, our knowledge of the distributionand condition of these rare riparian resources is inconsistent and incomplete for manystreams. Fourth, threatened and endangered species have a legal definition and status.The processing of the proposed lists of species has been very slow so very few have beenaccorded this legal status. The provisional lists were based on the best assessment ofspecialists at that time. it is only recently that systematic evaluations have been conductedby The Nature Conservancy ofHawaii, U.S. Fish & Wildlife Service, etc., but even thesehave not covered the whole state. The consolidated list is incomplete but it is the best sofar.
Wetlands.Wetlands were enumerated only if they were associated with a stream. Therewas no deterniination of condition.
Detrimental organisms.The data used in this evaluation are the presence or absenceofalien herbivorous animals and three plant species. Mere presence does not necessarilymean that these organisms have a negative impact. However, there is a potential forsignificant damage. Conversely, there are some riparian resources that have beendevastated by alien orgnicm, e.g., East Molokal. The evaluation presupposes that thedegree of potential impact is directly related to the number of detrimental speciespresent. Ideally, the assessment would consider the size and extent of the population ofeach organism.
Native forest.There is no statewide vegetation map that delimits native vs. alienvegetation. Supplementing the Hawail Forest Bird data with personal opinions ofinformed individuals presents problems of consistency The data from Hawaii, Maui andMolokai are reliable. The data from Oahu and some from Kauai information are not asrigorous or consistent.
Initially, only the main streamwas measured. It was assumed that since it was the longeststretch of the stream and penetrated further into the center of the island, it wouldprobably pass through as much native forest as any other part of the stream. In certaincases, this may not be true. Measurements were made on topographic quad maps sowhere there are steep gradients the linear measurement is not an accurate measure ofthe actual length. A final problem was the interpretation of native vs. alien forest,particularly where there were mixtures of the two t)pes.
Special protected areas .Very few watersheds are protected completely. The fact thatpart ofa stream is in a protected area is no guarantee that the resources will be protected.However, the fact that part of a stream is protected can sometimes influence plans fordevelopment.
178

Other Considerations
Biological threats, both plants and animals, are pervasive. There is no correlationbetween the number of species of detrimental organisms and the degradation of thewatershed. Habitat destruction is related to the number of any particular species presentand the combination of species. For example, the almost total destruction of the foreston East Molokai was effected by feral pigs and axis deer. Any assessment of Hawaii’swatershed must take these species into account.
Association of rare birds and plants. Threatened and endangered birds generally donot occur on the same stream as rare plants (Table 26). This result was somewhatsurprising because one of the committee’s earlier assumptions had been that threatenedand endangered species would be associated with the least disturbed native habitat Itwould follow that the habitat would be equally favorable to birds and plants.
Table 26 DistrIbution of Threatened or Endangered Birds, and Rare Plants
ISLAND NUMBER OF STREAMSBirds Plants Both Neither
Kauai 34 9 6 13Oahu 30 7 7 13Molokai 10 4 1 21Maui 12 7 2 69Hawaii 17 9 2 106
Recovery habitat/Protectedareas.There is an inverse relationship between islands thathave the largest number of streams with threatened and endangered species recoveryhabitat (Oahu and Kauai) and those where the streams are protected by various agencies(Molokal, Maul and Hawaii; Table 27). The discrepancy illustrates the fact that streamshave not received much attention from conservation ningers in the past, an oversightthat should be perhaps addressed.
Table 27 DistrIbution of Recovery Habitat and Protected Areas
ISLAND NUMBER OF STREAMSRecovery Protected
habitat areas
Kauai 16 7Oahu 22 5Molokai 1 14Maui 1 22Hawaii 4 15
179

Future ActionsA statewide evaluation of the condition ofwatersheds/forest reserves should include a
number of elements: the status of vegetation (e.g., cover, structure, species diversity,percentage native forest); alien disturbance factors (e.g., feral niml activity, stream-associated alien plants); land use (e.g., zoning, non-point source pollutants, development); geology geomorphology soils; and, climate. Sedimentation and stream flowchanges should be evaluated and a quantitative statement of watershed and forestreserve status developed.
SourcesPublished and Unpublished Documents
Elliott, Margaret E. and Erin Marie Hall. 1977. Wetla.’zd.r and Wetland Vegetation ofHawaii.Fort Shafter, Hawaii: U. S. Army Corps of Engineers.
Funk, E. 3. 1986. Wetlands Reconnaissance for an aquatic weed control program. FortShafter, Hawaii: U. S. Army Corps of Engineers.
Hal], W. L 1904. The forests of the Hawaiian Islands. Bulletin 48. U.S. Department ofAgriculture, Bureau of Forestry. Government Printing Office. 29 pp.
Hawaii Water Resources Regional Study. 1975. Fish and Midlife. Study Element,Honolulu.
Jacobi, S.D. 1989. Vegetation maps ofthe uplandplantcommunities on the iEltmds ofHawaii,Maui, Molokai, andLanai. Cooperative NationalPark Resources Studies Unit TechnicalReport #68. University of Hawaii, Honolulu.
Judd, C. S. 1931. Forestry in Hawaii for water conservation. Jownal ofForestry 29.363-367.
Obata, 3. 198x Oahu Rare Plants. Hawaiian Botanical Society Newsletter.
Scott, J. M., S. Mountainspring, F. L. Ramsey and C. B. Kepler. 1986. Forest Bird Communities of the Hawaiian Islands: TheirDynamics, Ecology, and Conseivation. LawrenceKansas.
DLNR. 1988. Wetlands Resource Addenthun. State Recreation Functional Plan TechnicalReference Document and State OutdoorRecreational Plan (SCORP). Honolulu: State ofHawaii Department of Land and Natural Resources.
DOFAW. 1984. Hawañ WUdlife Plan. Honolulu: State of Hawaii Division of Forestry andWildlife..
Stemmermnn,L 1981.A Guide to Pacific WetlandPlants. Fort Shafter, Hawaii: U.S. ArmyCorps of Engineers.
USFWS. 1985. Recovery Plan for Hawaiian Waterbirds. Portland, Oregon. U. S. Fish andWildlife Service.
Wagner, W. H.,D. Herbst, and S. H. Sóhmer. 1990.F7oa oftheHawaiian Islands. Honolulu,Hawaii: University of Hawaii Press.
Databases
Nature Conservancy of Hawaii, Hawaii Heritage Program Database.
University of Hawaii Environmental Center. Wetlands Inventory and AssessmentDatabase. 1989. (Oahu complete, Maul in progress)
U.S. Fish and Wildlife Service. National Wetlands Plant List. 1989.
180

Maps
Jacobi, 3. D. 1989. Vegetation maps ofthe uplandplant communities on the islands ofHawaii,Mau Moloka4 andLanal. Cooperative National Park Resources Studies Unit TechnicalReport #68. University of Hawaii, Honolulu.
State of Hawaii Department of Land and Natural Resources. 1990. Natural Area ReserveSystem Maps. (DOFAW ifies).
State of Hawaii Department of Land and Natural Resources. 1990. Feral Animal Distribution Maps (DOFAW files).
U. S. Fish and Wildlife Service. Wetlands Maps. Portland: 1978.U. S. Geological Survey. Topographic Quadrangle maps. Map scales 1:24,000, 1:100,000,
1:125,000. 1950’s - 1980’s.
181

Table 28 Riparian Resources
CODE HSA code; island-hydrographic PLT Number of Rare Plantsunit-stream (system) RAR
NAME Stream name at mouthWEflAND
DFIRMTL E Wetlands identified by Environmental
PLT Detrimental PlantsCenter or Elliott and Hall
C California Grass H Hau FWS Wetland identified by the USFWS
M Mangrove w Paustrine Wetland
ANL Detrimental Animals W + Over 1(2 square mile of Palusthne wedand
A Axis Deer B Black-tailed deerG Goats M Mouflan PROTECTP Pigs S Sheep
PT 1 Streams partially protected due to the%NAT Percent Native forest presence of a NARS, NPS or preserve.
RH Presence of Recovery Habitat TL Y Streams protected from the headwaterr
BRD Number of Threatened and En- to the sea
T&E dangered Birds
DETRMTL DDTh DY j’ WETLAND PROTECTCODE NAME %NAT RH
PLT ANL E FWS TL PT
Kau&
2-1-01 Awaawapuhi H PGB 30 3
2-1-02 Honopu G 0 1
2-1-03 Nakeikionaiwi 0 0
2-1-04 Kalalau H PG 10 7 W
2-1-05 Pohakuao 0 0 1
2-1-06 Waiolaa 0 0
2-1-07 Hanakoa PGB 10 1 1
2-1-08 Waiahuakua 0 0 2 Y 1
2-1-09 Hoolulu 0 0 4 Y 1
2-1-10 Hanakapiai H POB 40 3 W 1
2-1-11 Maunapuluo 0 0
2-1-12 Limahuli H G 10 6 W+
2-1-13 Manoa P 0 1
2-1-14 Wainiha R. HC P 30 6 W +
2-1-15 Lumahai R. HC P 20 2 5 E W +
2-1-16 Waikoko P 0
2-1-17 Waipa H P 0 2 4 W +
2-1-18 Wajoli HC P 30 4 W +
2-1-19 Hanalei R. HC P 30 2 5 E W + 1
2-1-20 Waileia H P 0 2 B
2-1-21 Anini H P 0
2-1-25 Kalihiwai R. H P 20
___
5
____
B W
___ ____
182
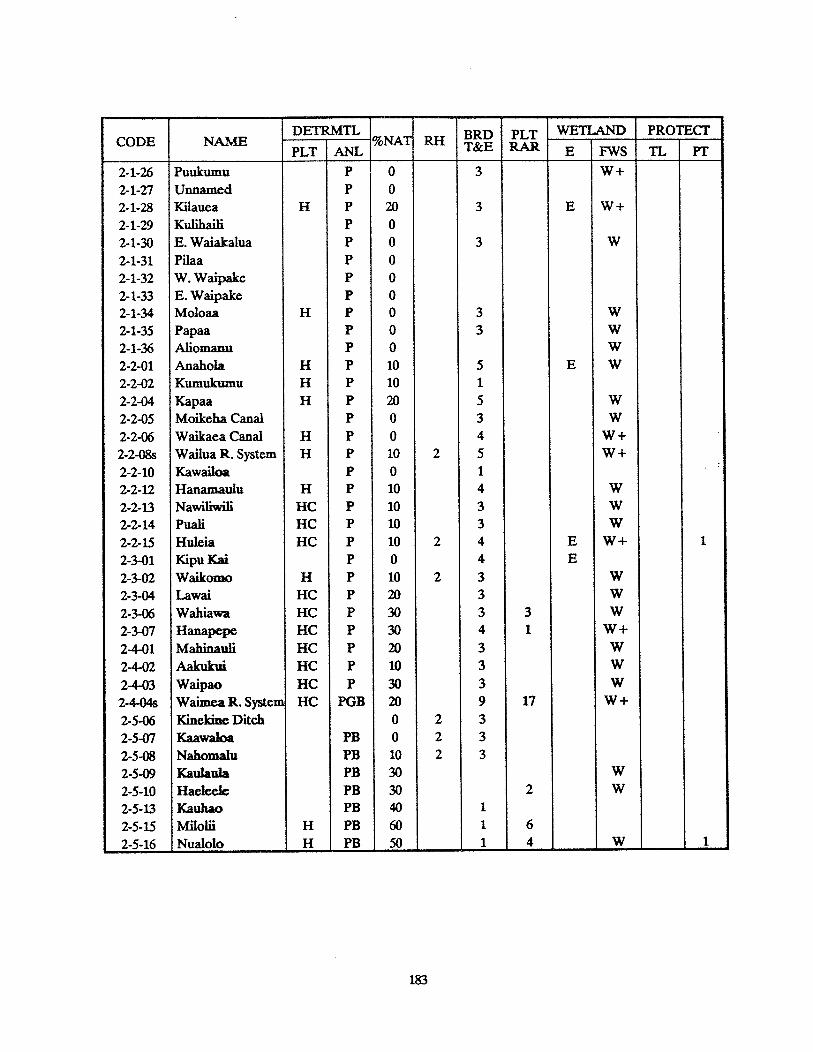
CODE NAMEDETRMTL
%NA1 RH BRD PLT WETLAND PROTECT
PLT ANL T&E PAR E FWS ii yr2-1-26 Puukumu P 0 3 W+2-1-27 Unnamed P 02-1-28 Kilauea H P 20 3 E W+
2-1-29 Kulihaili P 02-1-30 E. Waiakalua P 0 3 W
2-1-31 Pilaa P 02-1-32 W. Waipake P 02-1-33 E. Waipake P 02-1-34 Moloaa H P 0 3 W2-1-35 Papaa P 0 3 W2-1-36 Aliomanu P 0 W
2-2-01 Anahola H P 10 5 E W2-2-02 Kumukumu H P 10 1
2-2-04 Kapaa H P 20 5 W
2-2-05 Moikeha Canal P 0 3 W
2-2-06 Waikaea Canal H P 0 4 W +
2-2-08s Wailua R. System H P 10 2 5 W +
2-2-10 Kawailoa P 0 12-2-12 Hanamaulu H P 10 4 W
2-2-13 Nawiliwili HC P 10 3 W
2-2-14 Puali HC P 10 3 W
2-2-15 Huleia HC P 10 2 4 E W+
2-3-01 KipuKal P 0 4 E
2-3-02 Waikomo H P 10 2 3 W
2-3-04 Lawai HC P 20 3 W
2-3-06 Wahiawa HC P 30 3 3 W
2-3-07 Hanapepe HC P 30 4 1 W+
2-4-01 Mabinauli HC P 20 3 W
2-4-02 Aakukui HC P 10 3 W
2-4-03 Waipao HC P 30 3 W
2-4-04s Waimea R. Systen HC PGB 20 9 17 W +
2-5-06 Kinekine Ditch 0 2 3
2-5-07 Kaawaloa PB 0 2 3
2-5-08 Nahomalu PB 10 2 3
2-5-09 Kaulaula PB 30 W
2-5-10 Haelecle PB 30 2 W
2-5-13 Kauhao PB 40 1
2-5-15 Milolii H PB 60 1 6
2-5-16 Nualolo H PB 50
____
1 4
____
W
____
183

DETRMTL I DY,. WETLAND PROTECTCODE NAME %NAT RH
PLT ANL T&E PAR E FWS TL I. PT
___ _______
..Oahu______
____ ____ ____
3-1-03 Paumalu P 0 1 W3-1-04 Kawela P 0 W3-1-05 Oio P 0 3 W3-1-06 Malaekaliana MHC P 0 2 W+
3-1-07 Kahawainui MHC P 10 2 W
3-1-08 Wailele Gi. MHC P 10 2 W3-1-09 Koloa GL MHC P 10 2 1 W
3-1-10 Kaipapau MHC P 20 2 W
3-1-11 Maakua MHC P 10 1
3-1-13 Kaluanui MHC P 40 2 E W+
3-1-16 Punaluu MHC P 10 3 E W+
3-1-18 Kahana MHC P 10 2 3 E W+
3-1-19 Kaaawa MHC P 0 2 E W+
3-1-20 Makaua P 0 E
3-1-21 Unnamed P 03-2-01 Hakipuu M1{C P 0 2 E W
3-2-02 Waikane MHC P 0 2 E W
3-2-03 Waianu MHC P 0 2 W
3-2-04 Waiahole MHC P 0 2 1 E W
3-2-05 Kaalaea MHC P 0
3-2-07s Kahaluu R. MHC P 0 2 E W
3-2-08 Heela MHC P 0 2 4 E W+
3-2-09 Keaahala MHC P 0 3 E W3-2-10 Kaneohe MHC P 0 2 4 W
3-2-11 Kawa MHC P 0 E
3-2-13 MCH P 0 2 4 E W+
3-2-14 Kaelepulu Canal M P 0 4 E W3-2-15 Waimanalo CM P 0 2 3 W
3-3-03 Kuliouou MR P 0 1 W3-3-04 Niu MH P 0 1 W
3-3-05 Wailupe MH P 10 2 W
3-3-06 Waialaenui P 10 1 W3-3-07s Ala Wai C. System MH P 10 1 W
3-3-09 Nunanu M P 0 2 1 W
3-3-10 Kapalama M P 0 1
3-3-11 Kalihi HM P 0 1 W
3-3-12 Moanalua HM P 0
3-4-02 Halawa MCII P 10 E W
3-4-03 Aiea M P 0 E W3-4-04 Kalauao MCII P 10
____ ___ ___
E W
184

DETRMTL iors PT m WETLAND PROTECTCODE NAME %NAT RH
PLT ANL ‘-‘-“ E FWS TL PT
3-4-05 Waijnalu MCH P 10 E W
3-4-06 Waiawa MCII P 10 2 W3-4-10 Waikele M PG 0 2 2 7 W
3-4-11 Honouliuli M P 0 2 1 W 1
3-5-01 Nanakuli H P 0 W
3-5-02 Ulehawa P 03-5-04 Mailiili H PG 0 1 W
3-5-05 Kaupuni H PG 0 W +
3-5-07 Makaha H PG 0 3 W
3-5-08 Makua PG 0 2 W
3-6-03 Unnamed P 0 2 W
3-6-04 Makaleha HC PG 30 2 3 6 W 1
3-6-06s Kiikii System HC PG 30 2 2 W 1
3-6-07s Paukauila System HC P 40 2 W
3-6-08s Anahulu System HC P 30 3 1 W
3-6-09 Loko Ea 0 2 2 E W +
3-6-10 Waimea R. HC P 10 2 1 E W
4-1-01 WRihanau PAG 10 1
4-1-02 Waialeia PAG 10 1
4-1-03 Waikolu PAG 30 1
4-1-04 Wainene PAG 70 1
4-1-05 Anapuhi PAG 60 1
4-1-06 Walohookalo HC PAG 50 1
4-1-07 Keawanui PAG 0 1
4-1-08 )CHHi PAG 0 1
4-1-09 Pelekunu HC PAG 10 1 W+ 1
4- 1-10 Waipu PAG 70 1
4-1-11 Haloku PAG 60 1
4-1-12 Oloupena PAG 80 1
4-1-13 Puukaoku PAG 80 1
4-1-14 Wailele PAG 90 1
4-1-15 Wailau HC PAG 10 W+
4- 1-17 Waiahookalo PAG 60
4-1-18 Kahiwa PAG 50
4-1-19 Kawainui HC PAG 80
4-1-20 Pipiwai PAG 0
4-1-21 Halawa HC PAG 0 1 W+
4-1-22 Hakaaano 0
4-2-01 Pohakupili M PA 0
4-2-02 Honoulimaloo M PA 0
4-2-03 Honouliwai M PA 10 1 W
H
w
23
33
YYYYYYYY
Y
185

DETRMTL BRD PLT WETLAND PROTECTCODE NAME %NAT RH T&E E FWS TL PTPLT ANL
4-2-04 Waialua MH PA 10
4-2-05 Kainalu MH PA 20 1 W4-2-06 Honomuni M PA 20 1 W +
4-2-08 Mapulehu MR PA 10 1 W4-2-09 Kaluaaha M PA 204-2-10 Kahananui MR PA 204-2-11 Manawai M PA 20 14-2-12 Ohia M PA 20 2 W
4-243 Wawaia MEl PAG 10 2 W
4-2-14 Kamalo MR PAG 10 2 W+4-2-15 Kawela M PAG 10 1 4 W
4-2-16 Papio 0
6-1-01 Ulcumehame P 206-1-02 Olowalu P 306-1-03 Launiupoku P 106-1-04 Kauaula P 306-1-05 Kahoma P 506-1-06 Wahikuli P 206-1-07 Honokowai P 50 4 W
6-1-08 Kahana P 50 W
6-1-09 Honokahua HC P 306-1-10 Honolua P 30 1
6- 1-11 Honokohau HC P 60 1 W
6-2-01 Poelua P 06-2-02 Honanana P 20 W
6-2-03 Kahakuloa HC P 30 1 W
6-2-05 Waiolai HC P 106-2-06 Makamakaole HC P 10 16-2-07 WaiheeR. HC P 30 W
6-2-08 Waiebu HC P 20 W
6-2-09 lao HC P 20 7 W+
6-2-10 Waikapu P 30 2 2 1 E W +
6-3-01 Maliko P 30 w6-3-02 Kuiaha P 0 W
6-3-03 Kaupakulua P 0 W
6-3-04 Manawaiiao P 06-3-05 Uaoa P 0 W
6-3-07 Kakipi H P 0 W+
6-3-08 Honopou H P 0 W
6-3-09 Hoolawa H P 0 W
6-3-10 Waipio H P 0 W
wwWWW4 1
186

‘R BRD PLT WETLAND PROTECT’CODE NAME %NAT RH
PLT ANL T&E RAR E FWS TL YT’
6-3-11 Hanehoi P C)6-3-12 Hoalua P 06-3-13 Hanawana P 06-3-14 Kailua H P 20 W6-3-15 Nai1ii1ihe1e H P 20 W+6-4-01 Oopuola H P 06-4-02 Kaaiea H P 10
6-4-03 Kolea P 06-4-04 Wikimoi H P 30 3 W 1
6-4-06 Puohokamoa H P 40 W 1
6-4-07 Haipuaena P 0 W 1
6-4-08 Punalau CH P 30 26-4-09 Honomanu CH P 50 3 W + 1
6-4-10 Nuaailua P 10 W 1
6-4-11 Piinaau CH P 60 3 W+ 1
6-4-12 Ohia P 06-4-13 Waiokmi1o H P 40
6-4-14 Wailuanui H P 70 1
6-4-15 W.Wailuaiki P 70 3 1
6-4-16 E.Wailuaiki P 70 3 W 16-4-17 Kopiliula H P 80 3 W 16-4-18 Walohue GL P 206-4-19 Paakea P 206-4-20 Waiaaka P 106-4-21 Kapaula P 30 1
6-4-22 Hanawi H P 80 5 1 1
6-4-23 Makapipi H P 50 1
6-4-24 Kuhiwa P 80 2 1
6-4-25 Walhole P 206-4-26 Manawalkeae P 106-4-27 Kabawaihapapa P 06-4-28 Keaaiki p 06-4-29 Waioni P 20
6-4-30 Lanlkele P 106-4-31 Helelcikeoha P 40 1 1
6-4-32 Kawakoe H P 306-4-33 Ulaino H P 2(3
6-4-34 Kawaipapa H P 30 W
6-4-36 Unnamed 06-5-01 Moomoonui P 10 W
6-5-02 Haneoo P 0
6-5-03 Kapia p io W
6-5-04 Waiohonu H P 40 2 W
6-5-05 Paraahawahawa P 0
187
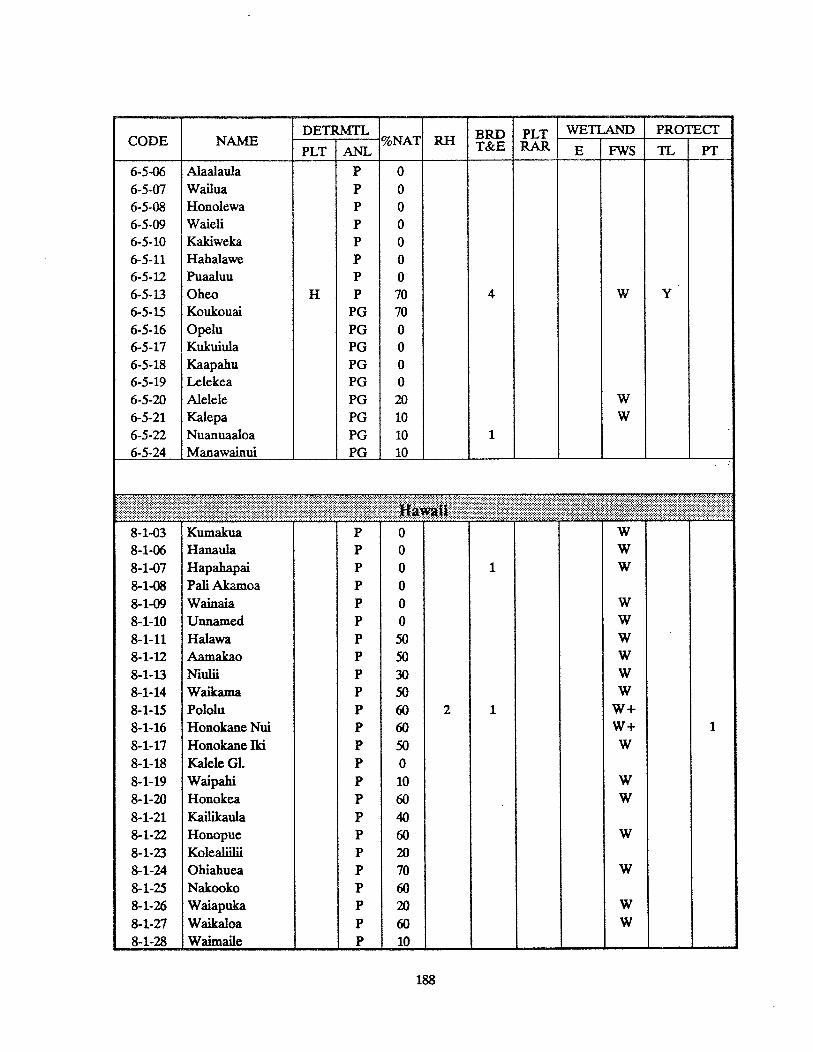
DETRMTLCODE NAME %NAT BRD PLT WETLAND PROTECT
PLT ANL T&E RAR E FWS TL PT
6-5-06 Alaalaula P 06-5-07 Wailua P 06-5-08 Honolewa P 06-5-09 Waieli P 06-5-10 Kakiweka P 06-5-11 Hahalawe P 06-5-12 Puaaluu P 06-5-13 Oheo H P 70 4 W Y6-5-15 Koukouai PG 706-5-16 Opelu PG 06-5-17 Kulcuiula PG 06-5-18 Kaapahu PG 06-5-19 Lelekea PG 06-5-20 Alelele PG 20 W6-5-21 Kalepa PG 10 W6-5-22 Nuanuaaloa PG 10 16-5-24 Manawainui PG 10
8-1-03 Kumakua P 08-1-06 Hanaula P 08-1-07 Hapahapai P 08-1-08 Pali Akamoa P 08-1-09 Wainaia P 0 W
8-1-10 Unnamed P 0 w8-1-11 Halawa P 50 W8-1-12 Aamakao P 50 W
8-1-13 Niulli P 30 W8-1-14 Waikama P 50 W
8-1-15 Pololu P 60 2 1 W+8-1-16 Honokane Nui P 60 W+
8-1-17 Honokane Iki P 50 W8-1-18 Kalele GL P 08-1-19 Waipahi P 10 W8-1-20 Honokea P 60 W
8-1-21 K4ilik2uIa p 413
8-1-22 Honopue P 60 W
8-1-23 Kolealiilii P 208-1-24 Ohiahuea P 70 W
8-1-25 Nakooko P 608-1-26 Waiapuka P 20 W
8-1-27 Waikaloa P 60 W
8-1-28 Waimaile P 10
ww
1 w
188
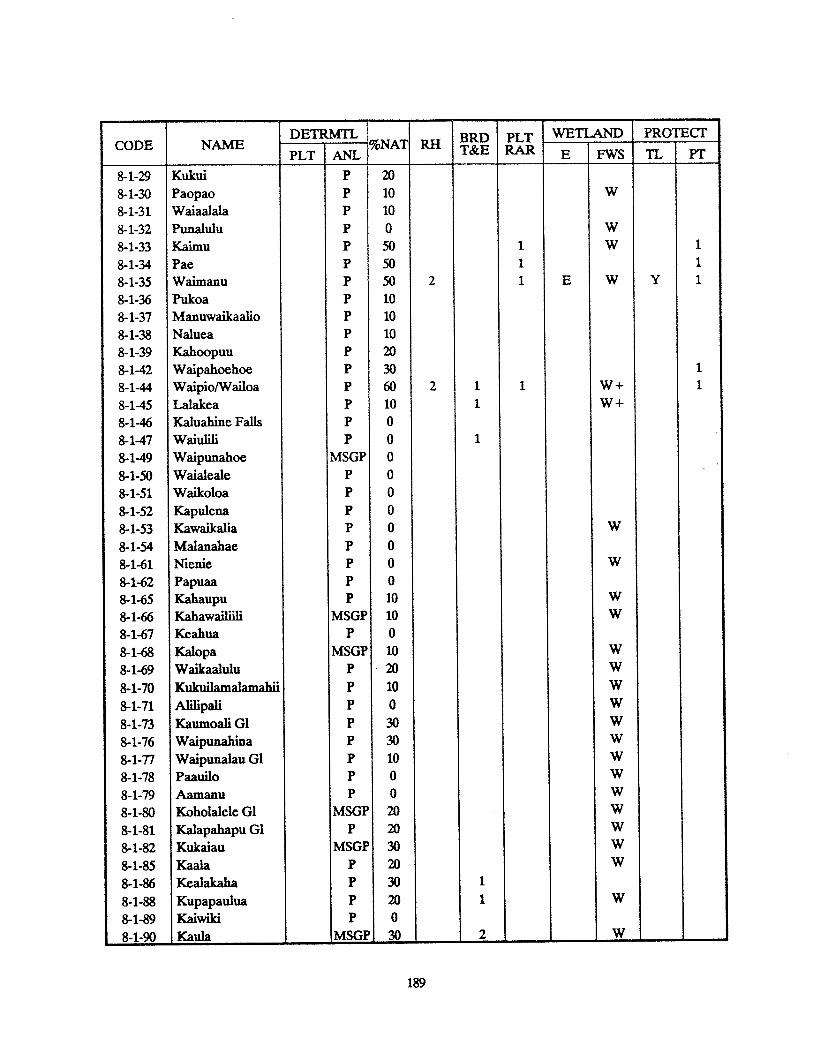
DETRMTL BRD PLT AND PROTECODE NAME
PLT ANL T&E RAR E FWS TL PT
8-1-29 Kukul P 20
8-1-30 Paopao P 10 W
8-1-31 Waiaalala P 108-1-32 Punalulu P 0 W
8-1-33 Kaimu P 50 1 W
8-1-34 Pae p 50. 18-1-35 Waimanu P 50 2 1 E W Y
8-1-36 Pukoa P 108-1-37 Manuwaikaalio P 108-1-38 Naluea P 108-1-39 Kahoopuu P 208-1-42 Waipahoehoe P 308-1-44 Waipio/Wailoa P 60 2 1 1 W +
8-1-45 Lalakea P 10 1
8-1-46 Kaluahine Falls P 0
8-1-47 Waiulili P 0 1
8-1-49 Waipunahoe MSGP 0
8-1-50 Waialeale P 08-1-51 Waikoloa P 0
8-1-52 Kapulena P 0
8- 1-53 Kawaikalia P 0 W
8-1-54 Malanahae P 08-1-61 Nienie P 0 W
8-1-62 Papuaa P 08-1-65 Kahaupu P 10 W
8-1-66 Kahawailiili MSGP 10 W
8-1-67 Keahua P 0
8-1-68 Kalopa MSGP 10 W
8-1-69 Waikaalulu P 20 w8-1-70 Kukuilanialaniahii P 10 W
8-1-71 Alilipali p 0 W
8-1-73 Kaumoali Gi p 30 W
8-1-76 Waipunaliina P 30 W
8-1-77 Waipunalau Gi P 10 W
8-1-78 Paauilo P 0 W
8-1-79 Aamanu P 0 W
8-1-80 Koholalele Gi MSGP 20 W
8-1-81 Kalapahapu Gi P 20 W
8-1-82 Kukaiau MSGP 30 W
8-1-85 Kaala p 20 W
8-1-86 Kealakaha P 30 1
8-1-88 Kupapaulua P 20 1 W
8-1-89 Kaiwiki P 0
8-1-90Kaula
MSGP 30
_____
2
_____ _____
W
189

DETRMTL BRD PLT PROTECTCODE NAME %NAT RH
PLT T&E RAR E FWS Th PT
8-2-01 Kaohaoha P 08-2-02 Kaawalii H P 20 2 1 W8-2-03 Waipunalei P 08-2-04 Laupahoehoe P 0 3 W8-2-05 Kilau P 0 3 W8-2-06 Manowaiopae P 0 W8-2-07 Kuwaikahi P 08-2-08 Kilialani P 0 w8-2-09 Kaiwilahulaizi P 10 2 W8-2-10 Haakoa H P 30 1 W8-2-11 Pahale P 208-2-12 Kapehu P 0 W8-2-13 Paeohe P 0 W8-2-14 Maulua P 0 W8-2-16 Pohakupuka P 208-2-17 Kulanakii P 08-2-18 Ahole P 08-2-19 Poupou P 08-2-20 Manoloa P 08-2-21 Ninole P 08-2-22 Kaaheiki P 08-2-23 Waikolu P 08-2-24 Waikaumalo H P 30 2 W8-2-25 Kahuku P 208-2-26 Waiehu P 08-2-27 Nanue H P 0 1 W8-2-28 Opea H P 10 W
8-2-29 Peleau P 08-2-30 Umaunia H MSGP 50 2 W
8-2-31 Kamaee P 108-2-32 Hakalau H P 60 3 W
8-2-33 Kolekole H MSGP 60 38-2-34 Paheehee P 0 W
8-2-35 Honomu H P 10 W
8-2-36 Laimi P 08-2-37 Kapehu P 08-2-38 Makea P 08-2-39 Alia P 08-2-40 Makahanaloa H P 08-2-41 Waimaauou H P 08-2-42 Waiaama H P 108-2-43 Kawainui H P 50 1 W
8-2-44 Onomea P 08-2-45 Alakahi
____
P 0 —
190

DETRMTLCODE NAME %NAT RH BRD PLT WETLAND PROTECT
PLT ANL T&E PAR E FWS TL PT
8-2-46 Hanawi p 30 W
8-2-47 Kalaoa p o8-2-48 Aleamai p o8-2-49 Kaieie p o8-2-50 Puuokalepa p o W8-2-5 1 Kaapoko p o8-2-52 Papaikou p o8-2-53 Kapue H MSGP 70 38-2-54 Pahoehoe P 508-2-55 Paukaa p o8-2-56 Honolil H p 80 3 W8-2-57 Maili p 0 W8-2-59 Pulcihae p io W8-2-60 Wailuku R. CH MSGP 60 4 W8-2-61 Wailoa R. p o 2 18-2-62 Kaahakina 08-4-02 Waiaha P 0 18-5-01 Haloa p 08-5-02 Lamimaumau p 08-5-03 Waikoloa p 0 W
191
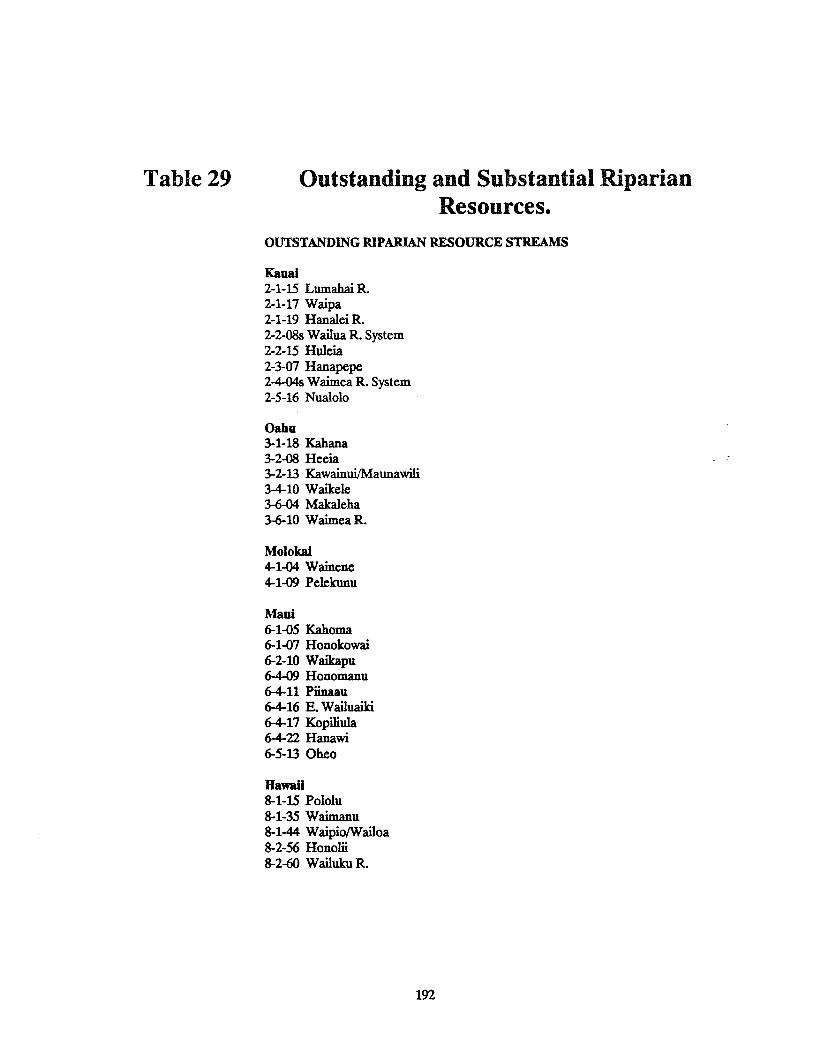
Table 29 Outstanding and Substantial RiparianResources.
OUTSTANDING RIPARIAN RESOURCE STREAMS
Kaual2-1-15 Lumahai R.2-1-17 Waipa2-1-19 Hanalei R.2-2-08s Wailua R. System2-2-15 Huleia2-3-07 Hanapepe2-4-04s Waimea R. System2-5-16 Nualolo
Oahu3-1-18 Kahana3-2-08 Heeia3-2-13 Kawainui/Maunawili3-4-10 Waikele3-6-04 Makaleha3-6-10 WaimeaR.
Molok.aI4-1-04 Wainene4-1-09 Pelekunu
Maui6-1-05 Kahoma6-1-07 Honokowai6-2-10 Waikapu6-4-09 Honomanu6-4-11 Piinaau6-4-16 E. Wailuaiki6-4-17 Kopiliula6-4-22 Hanawi6-5-13 Oheo
Hawaii8-1-15 Pololu8-1-35 Wimanu8-1-44 Waipio/Wailoa8-2-56 Honolii8-2-60 Wailuku R.
192

SUBSTANTIAL RIPARIAN RESOURCE STREAMS
Kaual2-1-04 Kalalau2-1-09 Hoolulu2-1-10 Hnkpiai2-1-12 Timahu1j2-1-14 Wainiha2-1-18 Waioli2-1-20 Wallela2-1-25 Kalihiwai2-1-28 Kllanea2-2-01 Anahola2-2-04 Kapaa2-2-06 Waikaea Canal2-2-12 Hanamaulu2-3-01 Kipu Kai2-3-02 Waikomo2-3-06 Wahiawa2-5-08 Nahonialu2-5-15 Milolii
Oahu3-1-09 KoIoaGL3-1-13 Kaluanui3-1-16 Punaluu3-2-04 Waiahole3-2-10 Kaneohe3-2-14 Kaelepulu Canal3-2-15 Waimanalo3-3-09 Nuuanu3-4-11 Honouliuli3-6-06s Klikii System3-6-07s Paukaulla System3-6-08s Anahulu System3-6-09 Loko Ea
Molokal4-1-01 Waihanau4-1-03 Waikolu4-1-05 Anapuhi4-1-06 Waiohookalo4-1-10 Waipu4-1-12 Oloupena4-1-13 Puukaoku4-1-14 Wailele4-2-06 Honomuni4-2-14 Kamalo4-2-15 Kawela
193

Maul6-1-11 Honokohau6-2-03 Kahakuloa6-2-09 lao6-4-04 Wkmoi6-4-06 Puohokamoa6-4-14 Wailuanui6-4-15 W. Wailuaiki6-4-24 Kubiwa6-4-31 Heleleikeoha6-5-04 Waiohouu
Hawail8-1-16 Honokane Nui8-1-24 Ohiahuea8-1-33 Kaimu8-1-34 Pae8-1-45 Lalakea8-2-02 Kaawalil8-2-09 Kaiwilahilahi8-2-24 Waikaumalo8-2-30 Umauma8-2-32 Hakalau8-2-33 Kolekole8-2-43 Kawainui8-2-53 Kapue
194

Table 30 Rare, threatened, and endangeredstream-associated plants
Sources: Hawaii Heritage DatabaseNational list of plant species that occur inwetlands (IJSFWS 1988).
Abutilon swtdwicensefMalvaceae
Acacia koaiafFabaccae
Acaena exigua/Rosaceae
Alectiyon macrococcus var. macrococcuslSapindaceae
A&inidendron ychnoid€sICaryophyllaceae
Alsinidendron viscosum/Caryophyllaceae
Aiymxiphiwn caliirnIAsteraccae
Asplenium schizophyllum/Aspleniaceae
Bidens wiebkei/Asteraceae
Bobea sandwicensisfRubiaceae
Bonamia menziesii/Convolvulaceae
Brighamia insignis/Campanulaceae
Caesalpinia avaiensLIFabaceae
Cala.’nagrostis epansa/Poaceae
Calamagrostis hilebrandiifPoaceae
Canavalia napaliensis/Fabaccae
Cenchms agrimonloides var. agrimonioides/Poaceae
Centaurium sebaeoides/Asteraceae
chamaesyce herbstiifEuphorbiaceae
chwentiera densifloralAmarantuaceae
cherirodendron dominii/Araliaceae
leimontia drepanomorpha/Campanulaceac
ada lindseyana/Campanulaceae
cknnontia oblongifolia/Campanulaceae
Colubrina oppositifolia/Rhamnaceae
Cyanea grimesiana sap. grimesiana/Campanulaceae
Cyanea grimesiana sap. obatae/Canipanulaceae
Cyanea honidalCampanulaccae
Cyanea kunthiana/Canipanulaceae
Cyanea lobata/Campanulaceae
Cyanea macrostegia/Campanulaceae
Cyanea scabra/Carnpanulaceae
Cyanea solanacea/Carnpaaulaceac
195

Cyanea solenoca4ixICampanu1aceae
Cyanea supetha ssp. reginalCampanulaceae
Cyanea tiitomwuha/Campanulaceae
Cyanea buncata/Canipanulaceae
Cypeius trachysanthos/Cyperaceae
Cyrtandra biseirata/Gesneriaceae
Cyrtandm dentata/Gesneriaceae
Cyrtandrafluipes/Gesneriaceae
Cyrtandra gffardli/Gesneriaceae
Cyrtandra halawensi/Gesneriaceae
Cyrtandra munroilGesueriaceaeCyrtandra tintinnabula/Gesneriaceae
Cyrtandra viridiflora/Gesneriaceae
Delissea rivulwis/Campanulaceae
Delissea subcordatalCampanulaceae
Diellia erectafPteridaceae
DielliafalcatafPterkjaceae
Diellia laciniaa/Pteridaceae
Dissochondius bijlontsfPoaceae
Dryopteris minutafPteridaceae
Ththantia imbricata/Asteraceae
Dubautia knudsenii/Asteraceae
Dubautia microcephala/Asteraceae
Dzthautiapauciflorula/Asteraceae
Dthaudaplantaginea ssp. hwnilis/Asteraceae
Eugenia koolauensis/Myrtaceae
Euphothia haeleeleanafEuphorbiaceae
Ewya sandwicensistTheaceae
Exocaspos luteolus/Santalaceae
Flueea neowawaeafEuphorbiaceae
Gaidenia mwmii/Rubiaccae
Gardenia rmyi/Rubiaceae
Geranium hwniie/Geraniaceae
Geranium muftiflorum/Geraniaceae
Hedyotis elatiorfRubiaccae
HefluviatilisfRubiaceae
Hedyotisformosa[Rubiaceae
Hedyotis littoralisfRubiaceae
Hesperomannia arbuscula/Asteraceae
Hesperomannia lydgateilAsteraceac
RibisCzLs brackenridgei ssp. brackenridgei/Malvaceae
196

Hibiscus distansfMalvaceac
Hibiscus koo ssp. kokio/Malvaccae
Hibiscus kokio ssp. sathjohnianusfMalvaceae
Hibiscus waimeae ssp. ha,menefMa1vaccae
Huperzia maimii/Lycopodiaccae
Isodendrion lawifoliumfViolaceae
Isodenddon longifoliwnfviolaceae
Isoetes hawaiiensis/Isoetaceae
Joinvillea ascendens ssp. ascendens/Flagellariaceae
Kbkia kauaiensis/Malvaceae
LabordiapumilalLoganiaceae
Lagenifera maviensislAsteraceaeLepidium seniz/Brassicaceae
LipochaetafawieilAsteraceae
Lipochaeta tenuislAsteraceae
Lobelia dunbarii ssp. dunbazii/Caznpanulaceae
Lobelia hypoleuca/Campanulaccac
Lobelia nthauensis/Campanulaceae
Lobelia oahuensis/Campanulaceae
Lobelia yuccoides/Campanulaceae
Lysimachia daphnoidesfPrimulaccae
Lysinachiaflhifolia/Primu1aceae
LythnachiafoibesiilPrimulaceae
Lysimachia iütinosa/Primu1accac
Lysimachia kalalauensislPrimulaceae
Marsilea viflosa/Marsileaceae
Mwuoidendron racemosum/Araliaceae
Myrsinefosbergii/Myrsinaceae
Myrsinejuddii/Myrsinaceae
MyinepedoIatafMyrsinaceae
Myrsine vacdnioidesfMyrsnaceae
Nemudia kauaiensis/Urticaceac
Neraudia meastonufoliafurticaceae
Nesolumapo?ynesicwn/Sapotaccae
Nothocestnsm lanfolium,Solanaccae
Noto€,ichium hwnile/Amaranthaceae
Panicum napaliensefPoaceae
Pelea crudata/Rutaceae
Pelea degenen/Rutaceac
Pelea haleakalaefRutaceac
Pelea hawaieiuis/Rutaccae
197

Peka othicuia,WRutaceaePelea refl&a/Rutaccae
Pelea waialealae/Rutaceae
Peueedanwn sandcense/Apiaceac
Phyllosteafloribwtda/Lamiaceae
Phyllostegia hirsutalLamiaceae
Phyllostegia manniifLanilaceae
Phyllostegia mollisfLamiaceae
Phyllotegiapar’iflora var. glabiiusculafL.amiaceae
Phyllostegiaparviflora var.pwvzflora/Lamiaceae
Phyllostegiaparviflora varlfLaniiaceae
Phyllostegia stachyoideslLamiaceae
Phyllostegia vestitalLamiaceae
Phyllostegia wawrana/Lamiaceae
Pisonia wagneriaiwlNyctaginaceae
Pzttospoum ncpalienseIPittosporaceae
Plantagopiinceps var. laxzflom/Plantagiuaceae
Plantagopnnceps var. longibmcteata/Plantaginaceae
Plantagoprinceps var.pthcepslPlantaginaceae
Platanthera holochila/Orchidaceae
P1aydesma cornuta var. comuta/Rutaceae
Platydesma comuta var. decwrens/Rutaceae
Platydesma remyi/Rutaceae
Faa ma,miifPoaceae
Foa sandvicensisfPoaceae
Poa s4honog1ossa/Poaceae
Piitchardia glabrata/Arecaceae
hitchardia hardyi/Arecaceae
P,itchardia kaalae/Arecaceae
Pritchardia lanigera/Arecaceae
Piitchardia lowre-yana/Arecaceae
Thitchardia munroi/Arecaceae
Fiitchardia napaliensislArecaceae
Piitchardia viscosa/Arecaceae
Prychotria andiflorafRubiaceae
Prychotia hob4i/Rubiaccae
Pteralyda kauaiensislApocynaceae
Pteralyxia macrocarpa/Apocynaceae
Pteiis lidgatiifPteridaceae
Ranunculus mauiensis/Ranunculaceae
Remya kauaiensis/Astesaceae
198

Rollandiapwpurellifolia/Campanulaccae
Roilandia st-johnii/Campanulaccae
Saiziculapwpurea/Apiaceae
Schiedea globosa/Caryophyllaceae
Schiedea kualae/Caryophyllaccae
Schiedea membranacea/Caryophyllaceae
Schiedea menziesii/Caryophyllaceae
Sicyos cucwneiinus/Cucurbitaccae
Sicyos spa/Cucurbitaceae
Silene lanceolata/Caryophyllaceae
Solanwn sandwicense/Solanaceae
Stenogyne macranthalLamiaceae
Stenogyne scrophu1arioide.ILamiaceae
Trematolobelia grandifolialCampanulaceae
Tilsetum inaequale/Poaceae
Urera kaalaeflJrticaceae
Vandenboschia draytonianafHyznenophyllaceae
Viola chamissoniana/Violaccae
Viola helenae/Violaceae
Viola kauaensis var.wahiawaensis/Violaceae
Viola oahuensis/Violaceae
Wikstroe,nia bkomutaiThyzneliaceae
Xylosma csenatum/Flacourtiaccae
Zanthoxylum oahuense/Rutaceae
199

Map
SO
uts
tandin
gR
ipar
ian
Res
ourc
es
2-1-
15L
umah
aiR
.2-
1-17
Wai
pa2-
1-19
Han
alci
R.
2-2-
OSs
Wai
lua
S.2-
2-15
Hul
cia
2.3-
07H
anap
epe
2-4-
04s
Wai
mea
S.2-
5-16
Nua
lolo
KA
UA
I10
Isla
nd
Code
-2
04
Haw
aii
Str
eam
Ass
essm
ent.
12
Not
e:O
nly
apo
rtio
nof
the
tota
lnu
mbe
rof
stre
ams
are
depi
cted
onth
ism
ap.
Kil
auca
Pt.
34
01 04
06
04*
01
02

Map
5
Out
stan
ding
Rip
aria
nR
esou
rces
3-1
48
Kah
ana
3-2-
08H
eeia
3-2-
13K
awai
nuij/
Mau
naw
ili
3-4-
10W
aike
lc3-
6-04
Mak
aleh
a3-
6-10
Wai
mea
R.
OA
HU
Isla
nd
Code
-3
Haw
aii
Str
eam
Ass
essm
ent
Not
e:O
nly
apo
rtio
nof
the
tota
lnu
mbe
rof
stre
ams
arc
depi
cted
onth
ism
ap.
. l0
Kasn
e.
Os’
,P
oin
t13
07
-06
04
Barb
er.
Pain
t
Ala
Wa,
Dia
mond
Hea
d
inau
ma
Bay

Illo
Poin
t
Map5
Outs
tandin
gR
ipar
ian
Res
ourc
es MO
LO
KA
Ikia
nd
Co
de
-4
Haw
aii
Str
eam
Ass
essm
ent
Not
c:O
nly
apo
rtio
nof
the
tota
lnu
mbe
rof
drea
ms
arc
depi
cted
onth
ism
ap.
Kah
tuP
oin
tC
ape
Hala
wa
Lan
aP
•int
4-1-
04W
aine
ne4-
1-09
Pel
ekun
u
Ka
ina
10

MA
UI
Isla
nd
Coda
Haw
aii
Str
eam
Ass
essm
entH
asa
Not
e:O
nly
apo
rtio
nof
the
tota
lnu
mbe
rof
stre
ams
arc
depi
cted
onth
ism
ap.
01
•07
06
Map
5
08
01
Outs
tandin
gR
ipar
ian
Res
ourc
es
15
01
,,anae 23
6-1-
056-
1-07
6-2-
1064
-09
64-1
16-
4-16
6-4-
1764
-22
6-5-
13
Kah
oma
Hon
okow
aiW
aika
puH
onom
anu
Pii
naau
EW
ailu
aiki
Kop
iliul
aH
anaw
iO
hco
01
0$
11
24
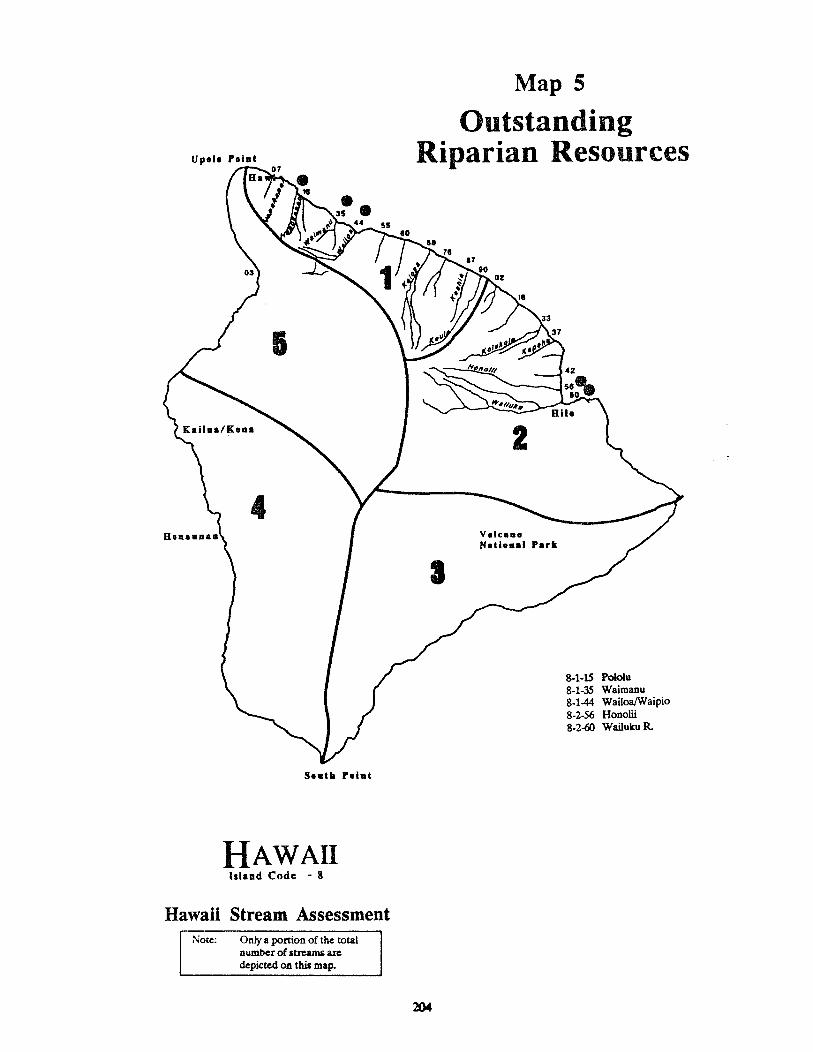
HAWAIIIsland Code - S
Hawaii Stream Assessment
Map5
OutstandingRiparian Resources
Note: Only a portion of the totalnumber of streams aicdepicted on this map.
Upal. PaInt
55
a?
02
S.ntb Paint
8-1-15 Pololu8-1-35 Waiinanu8-144 WailoalWaipio8-2-56 Honolii8-2-60 Wailuku R.
204
Cultural Resources
Streams have played an important role in prehistoric, historic and modern ways of lifein Hawaii. This inventory and assessment focuses on the relationships with surface waterwhich are of historic, architectural, spiritual or aesthetic value. Some of these are easilyidentifiable, such as bridges or taro lo’i, while others have less tangible historic ormythological associations.
The Cultural Resources Committee, which directed the inventory and assessment,determined that in order to be considered stream-related, a cultural resource had tomeet one of the following criteria:
o Changes in stream management would affect the resource.
o The resource was functionally dependent on the stream.
o The resource was in close proximity to the stream.
Cultural resources include prehistoric, historic and modern elements. In Hawaii,prehistoric resources generally refer to those prior to contact with the western world,which was marked by the arrival of Captain Cook in 1778. The prehistoric elementsconsist primarily of archaeological sites and the probability of uncovering such sites.Elements of historic, or post-contact, resources include sites listed on the State orNational Register of Historic Places, historic districts and bridges. Modern culturalresources listed here are sites where taro is grown.
The primary source of information on cultural resources is the Department of Landand Natural Resources. The Historic Preservation Division provided the historic andarchaeological data. Location of taro cultivation was collected from the Water UseCertification Program currently being compiled by the DLNR Division of Water andLand Development. Additions and adjustments were made by the committee.
Comprehensive and consistent inventories of historic and modern cultural resourceswere not available. Some cultural elements, such as legends or events, are subjective andintangible. As such, they do not lend themselves well to inventory or assessment. Criteriafor assessment of cultural resources were therefore based exclusively on prehistoricarchaeological resources.
Ninety-five streams were judged Outstanding for cultural reasons. Thirty-four of thesestreams are on Kauai, six on Oahu, 15 on Molokai, nine on Maul and 31 on Hawaii. Threeof these streams have more than 100 archaeological sites each.
205

BackgroundPrehistoriclArchaeologic Resources
A key to understanding stream-related cultural resources in Hawaii is the realizationthat in prehistoric and historic times, Hawaiians were as much farmers as they werefishermen, and stream water was crucial to successful farming. Many valley floors in theislands had irrigated taro fields (lo’i) fed by canals (‘auwai) from streams, springs, andwaterfall ponds. Houses were located on the narrow dry slopes at the base of valley wallsand across sand flats and dunes at valley mouths. Burials and dry agricultural areas fortree crops, sweet potatoes, wauke, and the like were also associated with these houses.Some valleys had continuous sites of these types; other, narrower valleys had scatteredclusters of sites extending upstream. Many of the larger fertile valleys have large heiausand residences because they served as residential centers for rulers or high chiefs. Thesesites are often nearer the shore.
With depopulation in the 1800s and other changes of that century, housing and religiousstructures and agricultural fields fell into ruin with only the stone and earthen foundations remaining. These sites have been destroyed in some areas over the years with newuse of the land — sugarcane cultivation, urbanization, etc. Until the 1970s archaeological documentation of these sites was extremely limited. This changed with the advent ofhistoric preservation law requirements tied to development. Archaeological surveyshave accompanied development since the 1970s, and more and more is being learned.Also, a few University of Hawaii and Bishop Museum projects have aided knowledge —
e.g., UN Manoa’s work in Pololu and the Honokane valleys on Hawaii, and the BishopMuseum’s Makaha, Kahana, and Anahulu projects on Oahu and its Halawa project onMolokai. Archaeologists are now better able to predict site patterns in most valleys.
Historic ResourcesHistoric patterns of settlement tended to duplicate the prehistoric, and thus a close
physical relationship with the water was maintained, even if the dependency on ripariancultivation was diminished. For these reasons, Hawaii has several historic districts thatmight be considered stream related.
Modern ResourcesTaro is the primary modern cultural resource which lends itself to inventory. Taro was
- a staple of the traditional Hawaiian diet. Wetland taro was irrigated from paddy to paddy(lo’i) by gravity flow irrigation systems. This crop is visually distinctive both in its largeheart shaped leaf, and in the landscape pattern of the flooded taro lo’i. The earlyWestern voyagers to Hawaii eloquently described the irrigated river valleys as the mostcompelling feature of the Hawaiian cultivated landscape.
Taro is dependent on a combination of several physical factors, the two most obviousbeing a water source and agriculturally appropriate land. Extensive taro cultivationprovides the modern viewer with a picture of the ancient landscape of Hawaii. Raisingtaro has several cultural ramifications. As in ancient times, the interdependence ofmultiple users on the same water source mandates cooperation and controls. Thetraditional spiritual importance of taro is perpetuated by its growers. The physically
206

demanding cultivation and harvest process, little changed from ancient times, providesexperience and understanding of what life must have been like.
Taro cultivation is a contemporary continuation of ancient practices. It helps themodern observer understand the oral, archaeological and written records of the ancientHawaiian culture. For these reasons, the contemporary cultivation of taro was considered a cultural resource by the HSA Cultural Resources Committee.
MethodsConunittee
A committee of experts in the fields ofcultural prehistory, history and current Hawaiianpractices from the community, state government, and the University of Hawaii wasassembled. This group identified inventory elements and assessment criteria.
Cultural Resource CommitteeKiyoshi Ikeda, (chair) UH Manoa Sociology,
Hawaii Historic Preservation Review BoardWilliam Murtagh, UH Manoa Historic PreservationRoss Cordy, DLNR Historic PreservationDon Hibbard, DLNR Historic PreservationLani Ma’a, Judiciary History CenterCharlie Reppun, taro farmer
Inventory
Data were collected in three general areas: archaeological, historical and modernpractices. All archaeological data were compiled by the state Historic PreservationDivision and submitted to HSA in final form. Historic resource information was obtainedthrough files and documents housed at the Historic Preservation Division. Taro data wasextracted from the November 1989 printout of the Division of Water and LandDevelopment’s Water Certification Database and from committee input.
Prehistoric/Archaeological Resources
Several variables were analyzed for each valley. Each is briefly described below.
Survey Coverage. The extent of archaeological survey coverage was analyzed andrecorded as complete, partial, very limited and none. Few valleys are completelysurveyed. Many have little or no survey coverage.
Predictability. The ability to predict what historic sites might be in unsurveyed areaswas scored as high, medium or low predictability or unable to predict. A high score wasassigned if archaeologists were able to predict likely site patterns in a valley given historicdocuments, extensive archaeological surveys in nearby or similar valleys, and/or partialsurvey coverage. A low score was assigned if archaeologists were unable to predict site
207

patterns in a valley because of a lack of historical or archaeological information. Amedium score was assigned to all other cases.
Number of Sites. The actual number of historic sites known in each valley is straightforward yet very time consuming to count. Instead, archaeologists used survey informationto estimate the number of sites in each valley. These figures, adequate for this broad-based assessment, are only rough estimates.
Valley Significance as a Whole District. The overall evaluation of each valleys significance was made considering each valley a district. The significance criteria of theNational and Hawaii Registers of Historic Places was used. Criterion A applies if thedistrict is significant in addressing broad patterns ofprehistory or early history. CriterionB applies if the district is associated with important people (rulers) or deities. CriterionC applies if the district contains excellent examples of site types. Criterion D applies ifthe district is significant for information contained in its sites. Finally, criterion E appliesif the district is culturally significant for traditionally known places or events or for sitessuch as burials, religious structures, trails, and other culturally noteworthy sites.
Site Density. The density patterns of historic sites make up a variable extremelyimportant to planners. Three ranks were assigned: low for very few sites due either tonormal site patterning or extensive land alteration, moderate for scattered clusters ofsites, and high for continuous sites. Valleys with moderate or high density patterns aregenerally considered moderate or high sensitivity areas.
Site Specific Significance. The site specific significance variable was developed forvalleys that had low densities of sites (very few sites) due either to normal site patterningor to extensive land alteration. An example of the first type might be a valley with housingsites on the side but too narrow for taro or housing sites on the valley floor. The secondtype might be a valley in which there had been sugar cane cultivation but a large heiauwas left.
The site specific significance of these valleys was categorized as either 1) sites significant solely for information content which can undergo archaeological data recoveryor 2) sites significant for multiple criteria and merit preservation consideration. Thosecategorized as meriting preservation consideration would likely include large heiaus,burial sites, and excellent examples of site types.
Overall Sensitivity. The overall sensitivity of a valley was ranked very high, high,moderate, low or unknown. Very high sensitivity areas have moderate or high densitiesof sites with little or no land alteration. They are extremely important archaeologicaland/or cultural areas. High sensitivity areas have moderate or high densities of sites withlittle or no land alteration. Moderate sensitivity areas have very few sites with the sitesmeriting preservation consideration due to multiple criteria or moderate densities ofsites with moderate land alteration. Low sensitivity areas have very few sites due tonormal site patterning or due to extensive land alteration. The sites present are significant solely for their informational content, which enables mitigation through datarecovery. Those valleys where no surveying had been undertaken and the ability topredict what might be found was low were ranked unknown.
208

Historic Resources
Several types of sites were considered for inclusion in this section, particularly bridges,sugar mills and irrigation systems. Those that are listed on the State or National registerwere inventoried but none of them assessed.
Bridges. State bridge inventories have been compiled for the islands of Kauai, Oahu,Maui and Hawaii. Each of these inventories addressed evaluation in a different way.The Kauai and Hawaii inventories used a similar system: Category 1: Preserve; and,Category 2: Photograph before destruction. Only Category 1 bridges were listed onOahu. The Maui inventory used a scoring system. HSA included all Category 1 or 2bridges on Kauai and Hawaii, Category ion Oahu, and all bridges that received a scoregreater than 0 on Maui. The categories and scores are noted in the database.
Historic Register Sites. All properties listed on the State and National Registers anddetermined to be stream-related were included in the inventory. These include selectedbridges, buildings, mills and irrigation systems.
Modern Resources
Streams and stream water have been and continue tobe an integral part of the Hawaiianlifestyle. The committee identified a number of factors important to current Hawaiianpractices. These include current taro cultivation, the potential for taro cultivation,appurtenant rights, subsistence gathering areas and stream-related mythology. Thecommittee felt that a complete assessment of the cultural resources of Hawaii’s streamsshould include these items but, due to limits of information, only the current cultivationof taro was included.
Taro Cultivation. Streams that currently supply irrigation water for taro cultivationwere included. Contemporary taro raising falls into two basic categories: The large farmproducing taro for commercial purposes, and the small diversified farm growing taro asone of several crops, usually part of a subsistence life style.
Information about streams that supply water for taro, along with approximate acreage,was taken from the Declaration of Water Use certification list (November 1989). Thiswas augmented and adjusted by the Cultural Resources Committee. (The informationis not verified so it is impossible to make any more than general estimates of actualacreage of taro cultivation.) Acreage was estimated by the HSA only to determine thosevalleys where taro was truly a part of the large landscape.
Assessment
The committee determined that the data for historic and modern resources wereinadequate and should not be made a part of the cultural assessment. Therefore, theranks are based solely on archaeological data.
209
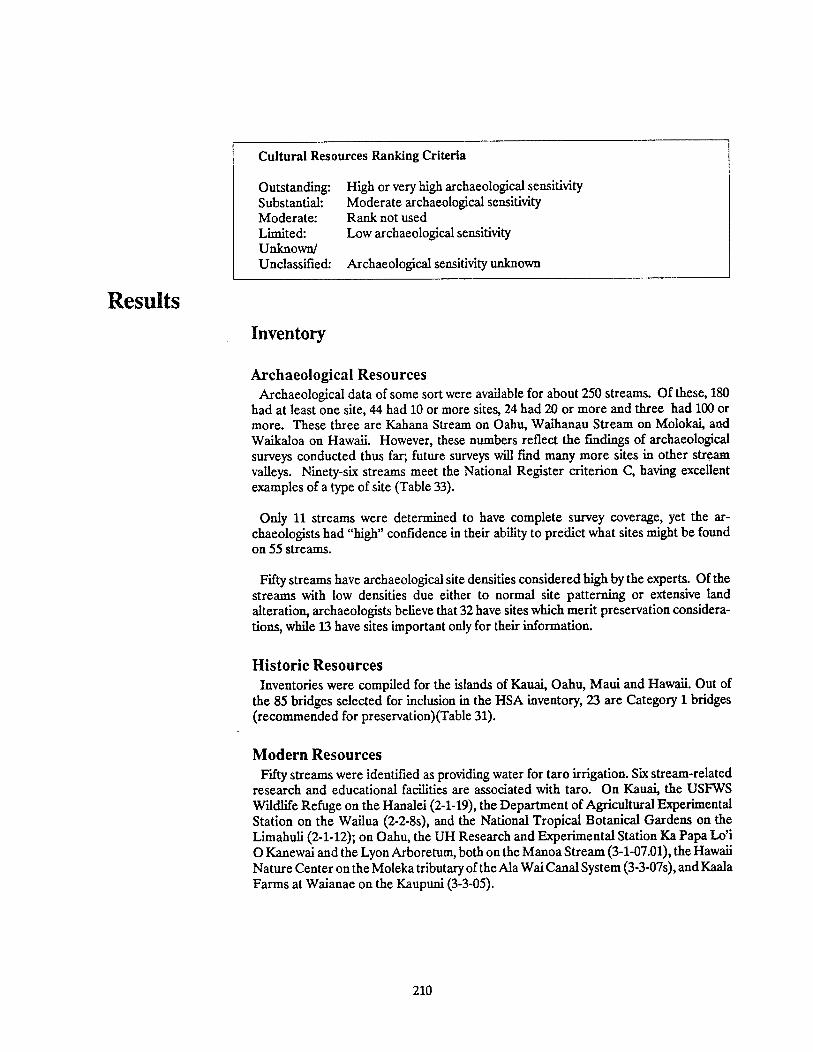
Cultural Resources Ranking Criteria
Outstanding: High or very high archaeological sensitivitySubstantial: Moderate archaeological sensitivityModerate: Rank not usedLimited: Low archaeological sensitivityUnknownlUnclassified: Archaeological sensitivity unknown
ResultsInventory
Archaeological Resources
Archaeological data of some sort were available for about 250 streams. Of these, 180had at least one site, 44 had 10 or more sites, 24 had 20 or more and three had 100 ormore. These three are Kahana Stream on Oahu, Waihanau Stream on Molokai, andWailcaloa on Hawaii. However, these numbers reflect the fmdings of archaeologicalsurveys conducted thus far; future surveys will find many more sites in other streamvalleys. Ninety-six streanis meet the National Register criterion C, having excellentexamples of a type of site (Table 33).
Only 11 streams were determined to have complete survey coverage, yet the archaeologists had “high” confidence in their ability to predict what sites might be foundon 55 streams.
Fifty streams have archaeological site densities considered high by the experts. Of thestreams with low densities due either to normal site patterning or extensive landalteration, archaeologists believe that 32 have sites which merit preservation considerations, while 13 have sites important only for their information.
Historic ResourcesInventories were compiled for the islands of Kauai, Oahu, Maui and Hawaii. Out of
the 85 bridges selected for inclusion in the HSA inventory, 23 are Category 1 bridges(recommended for preservation)(Table 31).
Modern ResourcesFifty streams were identified as providing water for taro irrigation. Six stream-related
research and educational facilities are associated with taro. On Kauai, the USFWSWildlife Refuge on the Hanalei (2-1-19), the Department of Agricultural ExperimentalStation on the Wailua (2-2-8s), and the National Tropical Botanical Gardens on theLimahuli (2-1-12); on Oahu, the UH Research and Experimental Station Ka Papa Lo’i0 Kanewai and the Lyon Arboretum, both on the Manoa Stream (3-1-07.01), the HawaiiNature Center on the Moleka tributary of the Ala Wai Canal System (3-3-07s), and KaalaFarms at Waianae on the Kaupuni (3-3-05).
210

There are eight poi mills: On Kauai, Waimea Poi and Kapaa Poi; on Oahu, HaleiwaPoi, Kalihi Poi and Honolulu Pol; on Maui, Aloha Poi; and on Hawaii, Pueo Poi. TheTaro Farmers Co-op plans a mill on Molokai. None of these mills appears to use streamwater.
Assessment
Ninety-five streams were identified as Outstanding by the Cultural Resources Committee. These were all of the streams identified as having high or very high sensitivityfor archaeological reasons. Historic and modern cultural resources were not includedin the assessment process due to the limited amount of information available (Table 33).
VignettesThe State Historic Preservation Division’s Ross Cordy prepared thumbnail sketches,
or vignettes, of five valleys that have significant archaeological evidence indicatingprehistoric settlements of some magnitude or importance.
Hanalei Valley, KauaiHanalei Valley lies within the traditional ahupua’a of Hanalei, the largestahupua’a in the Halalea district. it is a windward valley characterized bybroad alluvial flats that flank the Hanalei River narrowing as one proceedsup the long upper valley. Prehistoric archaeological sites are still present inthe valley today. Remnents of taro fields and canals are in the lower valleyand on the flats in the upper valley. House sites are present in the upper valley and along the lower valley’s dry slopes in scattered clusters, and wereonce present along the shore. Other sites include religious structures likePo’oku heiau found on the eastern bluff.
Interestingly, for a valley of considerable importance within its district and onthe island, archaeological survey in Hanalei is still quite limited. The bestcoverage is in the Hanalei National Wildlife Refuge in the lower valley,where a number of house sites and buried taro fields have been found. Excavation in cultural deposits that may pre-date the irrigated taro fields haveyielded dates from ca. the A.D. 600s, which are quite early dates for Kauai.
Wailua Valley, KaualThe Wailua River is on the eastern, windward side of Kauai in the ancient district of Puna. This river has a long drainage with two major forks, north andsouth. Wailua’s renown is as the major royal center of Kauai in late prehistory. The royal and high ranking residential areas with their associated majorheiau and a pu’uhonua were focused at the mouth of the river in the lowervalley. A number of ruins of this royal center remain today the pu’uhonuaarea, four heiau, royal birthstones, petroglyphs and a sacrificial rock. Manyof these sites are protected within a state park.
Other historic sites do exist in the Wailua drainage, however. The agricultural fields which supported the elite and the commoners were scatteredalong the valley floor, and remnants of the irrigated taro fields and canals arepresent here and there as well as stone field terraces along the slopes of the
211

valley. Historical places associated with oral histories of people and underwater caves exist above Wailua Falls.
Waihe’e Valley, MauiOral and written historical accounts indicate that the four large valleys ofMaui - Wailcapu, Wail uku, Waiehu, and Waihe’e - known as Na Wai Ehaor Na Wai Kaulana, contained some of the largest continuous areas of wettaro cultivation in the islands and one of the densest populations. Agricultural terraces and irrigation systems still exist today in these valleys.
Wailuku was one of the most important royal centers on Maui. Unfortunate
ly, much of the lower valley has long been altered, although the HalekiiPihana heiau are still present. The lands at Waihe’e are closely associatedwith major figures of later prehistoric times and Kamehameha’s time. Theselands were held around 1765 by Namahana, a daughter of a ruler of Maui(Kekaulike) and wife to her half-brother and ruler (Kamehamehanui). WithKamehamehanui’s death and the start of Kahekili’s reign, she marriedKe’eaumoku —. a Hawai’i Island high chief who had fled Hawai’i after afailed revolt — and they resided in Waihe’e. Kahekili and the Ke’eaumokuNamahana faction clashed in a battle known as Kalae’ili’ili. In this battle,Kahekili prevailed, and Ke’eaumoku and Namahana fled, eventually returning to Hawai’i Is land, where Ke’eaumoku became one of the four major advisers to Kamehameha.
Waihe’e contains important archaeological remains. These include one of theearliest occupations for Maui identified so far — subsurface deposits alongthe coast dating back to A.D. 900-1200. Two heiau and surface remains ofsome coastal village settlements are also found in this shore area. In theupper reaches of the valley, numerous intact taro terraces are still present.
Halawa Valley, MolokalFrom an archaeological viewpoint, Halawa Valley is one of the best studiedvalleys in Hawaii — with results providing an understanding of continuouswindward settlement spanning nearly 1,200 years, from prehistoric throughhistoric times. Evidence of very early occupation of the valley was identifiedin a subsurface coastal site in the sand areas adjacent to the mouth of HalawaStream. Postmolds, hearths, and stone-lined and paved structural foundations were uncovered, along with artifacts and food remains. These remainsdate back to A.D. 600-1200. The inland portion of the valley was evidentlypermanently occupied in the period from A.D. 1200-1400. Residential sitesand wet and dry agricultural complexes are found on both sides of the valleyfloor.
Waipi’o Valley, Hawai’iWaipi’o Valley is renowned on Hawai’i Island as a place with many significant historic sites, with rich oral historical records, and as a place wherecultural lifeways of an older Hawai’i still can be seen and felt. Waipi’o appears to have been the ruling center that first unified the Island of Hawai’i,perhaps in the A.D. 1400s. Here, the Pu line developed their power, withLioa and his son Umi two of the most famous earlier rulers of the Pill line.
212

Kamehameha was also a ruler in this line. The royal residence was just behind the sand dune at the mouth of the valley, with a pu’uhonua and luakiniheiau. Paka’alana, and a royal mausoleum, Hale o Lono, adjacent. The largeheiau of Honua’ula was also in the dune area, as was an arena for boxing andother sports. Other heiau were scattered about in the lower valley. Deposits— probably associated with these royal features — are still present in thedune with stone pavings and walls visible. Other heiau are visible as largeplatforms.
Waipi’o was also a population center on Hawai’i, with about 2,500 peopleprobably in residence when Captain Cook arrived, making Waipi’o one of thedensest population centers in the islands. Houses were located on the dunesand along the valley sides at the base of the cliffs and across the mouth of theside valley of Hi’ilawe. Today, many of these areas contain archaeologicalremains of house sites — stone pavings, platforms and enclosures.
Waipi’o was also an economic center, a massive supplier of taro. The entirevalley floor was a maze of taro lo’i fed by numerous canals (‘auwai) leadingfrom the main stream, from side streams such as Hi’ilawe, and from the baseof waterfalls along the valley sides. Many of these taro lo’i and canals arepresent today. Some are buried under more modem taro, rice and otherfields. Fishponds were also present in the valley, with two huge fishponds atthe front of the valley behind the dune — Lalakea and Muliwai. The ruins ofboth are present today, walls and internal silt deposits. Sweet potatoes andother crops were planted in dry areas along the slopes at thebase of the valleywalls, and archaeological remains of these fields also remain as stone terraces and mounds.
Table 31 Category 1 Bridges
Bridge Name Stream NameKauai
Waipa WaipaWaioli WaloliHanalei HanaleiMoloaa MoloaaWailua WailuaWaikomo WaikomoWahiawa WahiawaHanapepe HanapepeWaimea Walinea
OahuWailele Gulch WaileleKaneohe KaneoheAla Wal Canal Ala Wai SystemManoa Ala Wal SystemPablo Ala Wai SystemNuuanu Nuuanu
213
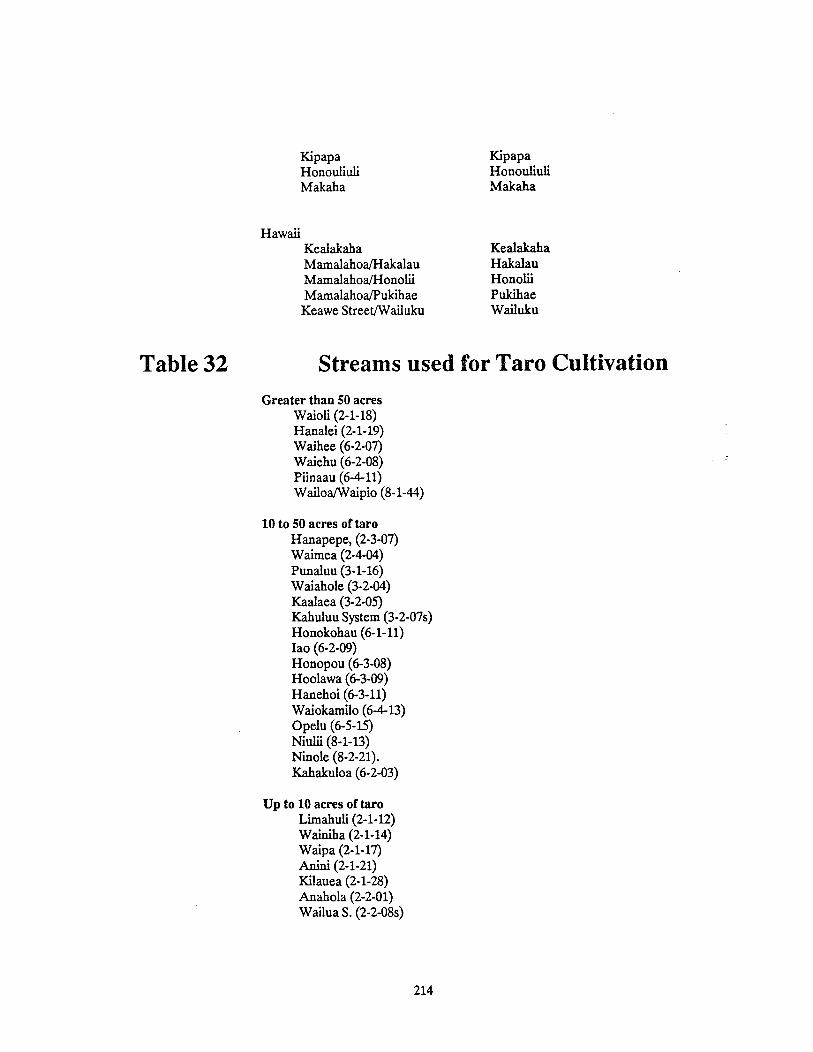
Kipapa KipapaHonouliuli HonouliuliMakaha Makaha
HawaiiKealalcaha KealalcahaMamalahoa/Hakalau HakalauMamalahoa/Honolii HonohilMamalahoaJPukihae Pukihae
Keawe Street/Wailuku Wailuku
Table 32 Streams used for Taro Cultivation
Greater than 50 acresWaioll (2-1-18)Hanalei (2-1-19)Waihee (6-2-07)Waiehu (6-2-08)Piinaau (6-4-11)Wailoa/Waipio (8-1-44)
10 to 50 acres of taroHanapepe, (2-3-07)Waimea (2-4-04)Punaluu (3-1-16)Waiahole (3-2-04)Kaalaea (3-2-05)Kahuluu System (3-2-07s)Honokohau (6-1-11)lao (6-2-09)Honopou (6-3-08)Hoolawa (6-3-09)Hanehoi (6-3-11)Waiokamio (6-4-13)Opelu (6-5-15)Niulii (8-1-13)Ninole (8-2-21).Kahakuloa (6-2-03)
Up to 10 acres of taroLimahull (2-1-12)Wainiha (2-1-14)Waipa (2-1-17)Anini (2-1-21)Kilauea (2-1-28)Anahola (2-2-01)Wailua S. (2-2-08s)
214

Nawiliwili (2-2-13)Puali (2-2-14)Huleia (2-2-15)Punaluu (3-1-16)Waianu (3-2-03)Kahaluu S. (3-2-07s)Ala Wai S. (3-3-07s)Nuuanu (3-3-09)Paukaulla S. (3-6-07s)Anahulu S. (3-6-08s)Honouliwai (4-2-03)Waialua (4-2-04)Mapulehu (4-2-08)Kauaula (6-1-04)Waikapu (6-2-10)Nuaailua (6-4-10)Ohia (6-4-12)Wailuanul (6-4- 14)Kawaipapa (6-4-34)Opelu (6-5-16)Aamakao (8-1-12)Kilau (8-2-05)
DiscussionMuch of Hawaiian settlement was concentrated around streams, and to that degree
the archeological record can be considered stream-related. However, subsequent settlement has obliterated most of this record. The ancient relationship between the streamand the land can best be seen in those valleys which have gone through least change, suchas those described in the vignettes. Protection of this relationship is most appropriatein stream planning in these and similar valleys. In most other places, the archeologicalresource is no longer dependent on water being in the stream.
Limitations
The inventory and assessment of cultural resources is incomplete. While the inventoryof archaeological resources is well addressed, the historic resource data has not beencollected in a consistent enough manner to be useful for assessment purposes. Moderncultural elements are sorely lacking. As a result, the criteria for assessment does notinclude historic or modern cultural elements, nor are they particularly selective amongthe archaeological resources.
The listing of archaeological information should be used only as a general guide forplanners, drawing attention to stream valleys with outstanding or substantial rankings.The details of historic site information are available at the state’s Historic PreservationDivision.
215

Taro information is incomplete because it was taken from the DLNR Declaration ofWater Use, which was not designed to identify taro cultivation. It is anticipated that thecompleted declaration process will provide more definitive answers to this culturalresource.
Future Research
Archaeological survey coverage will gradually increase over time which will improveinformation and predictions for many of Hawaii’s streams. Periodic updating of thisassessment could occur in coordination with the state Historic Preservation Division, asthis office maintains the state Inventory of Historic Places and archaeological information. Also, archaeological surveys could be funded for some valley types and areas forwhich information is completely lacking and where predictions cannot yet be made.
Expansion of the inventory of historic and modern cultural resources is needed,especially historic districts. Districts are widely recognized as major historic assets andcan range from urban districts, such as Chinatown, to communities, such as Hanapepeor Lahaina, to rural landscapes, such as Hanalei or Keanae. Because of man’s historictendency to settle near water, many districts are stream related. -
Among modern cultural resources, there is a need for an inventory of appurtenantrights, established at the time of the mahele. Other inventories needed include streamswith riparian lands considered prime for taro cultivation and the streams associated withHawaiian gathering practices. The subjective and intangible resources of history andlore as told through songs, chants, legends, while extremely important culturally, do notlend themselves to assessment.
SourcesPublished and Unpublished Documents
DLNR/DOWALD. November 29, 1989. Declaration of Water Use, Category 1, CWRM.
DLNR, Historic Preservation. 1989. Inventory of Historic Sites. Prepared by Ross Cordy,Agnes Estioka-Griffm, Maui; Joyce Bath, Oahu; Nancy McMahon, Kauai.
DLNR, Historic Preservation, State Inventory and Register of Historic Places.
U.S. Dept. of Interior, National Register of Historic Places.Cordy, Ross. 1989. Vignettes prepared for the Hawaii Stream Assessment.
Personal Communications
Enos, Eric. Kaala Farms, Waianae, Oahu.Haraguchi, Karole. Haraguchi Farms, Hanalei, Kauai.Hughes, Bob. Retired president, HSPA.Napoka, Nathan. DLNR Historic Sites.
216

Table 33 Cultural Resources
CODE HSA code; island-hydrographic unit-stream
STREAM Stream name at mouth
ARCHAEOLOGICAL
SURV Extent of survey coverageCOVR
C CompleteP PartialL Very limitedN None
PRE- Abilities to predict what historic sitesDICI might be in unsurveyed areas.
H Substantial information exist to assist prediction
L Little or no information exists to assist prediction
M AU others
# Rough estimates of total number of arSITES chaeological sites
DENSITYH Continuous sitesM Scattered clusters of sitesL Veiy few sites
VALLEY Significance of valley as district usingNational Register of Historic PlacesCriteria
A Pre.contact or early contactB Associated with important people or dictiesC E’ccellent examples of site typeD Contains important informationB Contains culturally noteworthy sites
SENSI- Overall sensitivity of a valley based onTINE density of archaeological sites and laud
disturbance.V VeiyhighH HighM ModerateL Low
OTHER
HIST A historic or potentially historicSITE resource has been associated with this
stream (usually a bridge).
TARO Taro cultivation has been associatedwith this stream.
CODEARCHAEOLOGICAL OTHER
98
-
TARO
HHHHMHHM
2-1-012-1-022-1-032-1-042-1-052-1-062-1-072-1-082-1-092-1-102-1-112-1-122-1-132-1-142-1-152-1-162-1-172-1-18
266692
ACOEACOEACDEACOE
cDCO
ACDECD
AwaawapuhiHonopuNakeikionaiwiKalalauPohakuaoWaiolaaHanakoaWaiahuakuaHooluluHrrnakspiaiMaunapuluolimahuliManoaWainiha R.Lumahai R.WaikokoWaipaWaioli
PCNPPPCPNPPPLLLNLL
MMMHMMHLLHHLLLLLLL
HHHHHHHHHHHHHHH
H
211741410
63
HHMMMM
HM
ACOEACDEDECOCOCD
ACDEACDE
Y
Y
YYY
YY
217

ARCHAEOLOGICAL OTHERCODE STREAM SURV PRE- # DEN- VALL- SENSI- HIST TARO
COVR DICT SITES SITY EY TIVE SITE
2-1-19 HanaleiR. P M 15 H ACDE H Y Y
2-1-20 Waileja P M 2 L AD M
2-1-2lAnini L L 2 M D Y
2-1-25 Kaliliiwai R. L L 2 L ACDE M2-1-26 Puukuniu2-1-27 Unnamed N L L2-1-28 Kilauea L L 1 L ACDE Y
2-1-29 Kulihaili N L L L2-1-30 E. Waialcalua L L 3 H ACDE H2-1-31 Pilaa L L 2 L ACD M
2-1-32 W. Waipake L L 5 L ACD M
2-1-33 E. Waipake N L M2-1-34 Moloaa N L L Y
2-1-35 Papaa L L 3 M ACD H2-1-36 Alionianu N L L2-2-01 Anahola L L S M ACD M2-2-02 Kumukumu N L L2-2-04 Kapaa L L 2 L CDE M2-2-05 Moikeha Canal N L L2-2-06 Waikaea Canal L L 2 M CDE M
2-2-08s Wailua S. C H 6 H ABCDE H Y
2-2-10 Kawailoa N L L2-2-12 Hanamaulu L L 1 L D L Y
2-2-13 Nawi1ili N L L L Y Y2-2-14 Puali L L 1 L BCDE L Y
2-2-15 Huleia L L 1 L AD L Y Y
2-3-01 KipuKai N L L L2-3-02 Waikomo P M 16 H CDE H Y
2-3-04 Lawai L L 6 H CDE H Y
2-3-06 Wahiawa P M 6 M CDE H Y2-3-07 Hanapepe P M 8 M CDE H Y Y
2-4-01 Mahinauli N L2-4-02 Aakukui - N L2-4-03 Waipao N L2-4-04s Waimea S. P M 8 M ACDE H Y Y
2-5-06 Kinekine Ditch N L2-5-07 Kaawaloa N L2-5-08 Nahomalu L L 1 M CDE H2-5-09 Kaulaula L L 1 M AD H
2-5-10 Haeleele L L 4 M AD H
2-5-13 Kauhao L L 1 M AD H
2-5-15 Miolil C H 24 H ACDE H
2-5-16 Nualolo C H 25 H
_______
H
218

CODE STREAMARCHAEOLOGICAL
SURV I PRE- I DEN- VAIL- I SENSI- I{ISTCOVR DIC1 SITES I SITY EY TIVE slit TARO
OTHER
10 M CD
L314
D
LPNNLLPPCN
M YYY
3-1-033-1-043-1-053-1-063-1-073-1-083-1-093-1-103-1-113-1-133-1-163-1-183-1-193-1-203-1-213-2-013-2-023-2-033-2-043-2-053-2-07s3-2-083-2-093-2-103-2-11
3-2-13
3-2-143-2-153-3-033-3-043-3-053-3-063-3-07s3-3-093-3-103-3-113-3-123-4-023-4-033-4-043-4-053-4-06
PaumaluKawelaOioMalaekahanaKahawainuiWailele Gi.Koloa 01.KaipapauMaakuaKaluanulPunaluuKahanaKaaawaMakauaUnnamedHakipuuWaikaneUnnamed
WalaholeKaalaeaKahaluu S.HeeiaKeaahalaKaneoheKawaKawainuijMaunawiliKaelepulu CanalWaimanaloKuliououNiuWailupeWaialacnuiAla WaiS.NuuanuKapalamaKalihiMoanaluaHalawaAieaKalauaoWaimaluWaiawa
HLLLMLLMMMMHL
HMMMLMLLLL
H
HL
LLLLHHLL
CD
CDECD
CDECDEDE
CDECDECDECDE
CDE
CDE
DD
H?D
DE
LMMHH
HMMM
L
M
L
HH
12
20291252
1107
26
11
10
417
1866
537511
MMMMH
MMMM
M
H
H
HH
Y
YYYY
Y
YY
PPPPNLLNNN
P
PLNNNNPPPCPNNNN
YY
Y
Y
YYYY
Y
219

ARCHAEOLOGICAL OTHERCODE STREAM SURV PRE- # DEN- VALL- SENSI- HIST TARO
COVR DICI SITES SITY EY TIVE SITE
3-4-10 Waikele L M 10 L D L
3-4-11 Honouliuli L H 10 M D L Y
3-5-01 Nanakuli P H 35 H CDE M3-5-02 Ulehawa N L3-5-04 Mailiili N L3-S-OS Kaupuni L H 25 M CDE H Y
3-5-07 Makaha C H 75 H CDE M Y
3-5-08 Makua N L3-6-03 Unnamed N L3-6-04 Makaleha N L3-6-06s Kiikil S. N L3-6-07s Paukauila S. L L Y
3-6-08s Anahulu S. P H Y
3-6-09 LokoEa L L 2 Y3-6-10 Waimea R. P H 10 M DE M Y
______________ _______
Molokal — -
4-1-01 Waihanau P H 307 H ACDE H4-1-02 Waialeia L M 1 M ADE M4-1-03 Waikolu L M 1 M ADE M4-1-04 Wainene N4-1-OS Anapuhi L L 1 L AD M
4-1-06 Waiohookalo N Y
4-1-07 Keawanui N4-1-O8Kailiili L H 1 H ACD H4-1-09 Pelekunu L H 3 H ACDE V
4-1-10 Waipu N4-1-11 Haloku N4-1-12 Oloupena N4-1-13 Puukaoku N4-1-14 Wailele N4-1-15 Wailau L H 6 H ACDE V4- 1-17 Waiahookalo N4-1-18 Kahiwa N4-1-19 Kawainui N4-1-20 Pipiwai N4- 1-21 Halawa C H 20 H ACDE V4-1-22 Halcaaano N L4-2-01 Pohalcupili L M 3 M ADE M
4-2-02 Honoulimaloo L M 1 H ADE H
4-2-03 Honouliwai L M 2 H ADE H Y
4-2-04 Waialua L H 4 H ACDE H Y
4-2-05 Kainalu L H 10 H ACDE H
_____ _____
220

ARCHAEOLOGICAL OTHERCODE STREAM SURV PRE- # DEN- VALL- SENSI- HIST TAROCOVR DId’ SITES SITY EY TIVE SITE
4-2-06 Honomuni L H 3 M ADE M
4-2-08 Mapulehu L H 2 M ACDE H Y
4-2-09 Kaluaaha L H 4 H ACDE H
4-2-10 Kahananui L M 1 M ADE M
4-2-11 Manawai L H 6 M ACDE H
4-2-12 Ohia L M 5 M ACDE M4-2-13 Wawala L M 2 M ADE M4-2-14 Kamalo P H 10 H ACDE H
4-2-15 Kawela P H 15 H ACDE V
I—6-1-01 Ukumehame L M 2 L ADE M
6-1-02 Olowalu L M 3 L ADE M
6-1-03 Launiupoku N6-1-04 Kauaula N6-1-05 Kahorna P M 3 M ADE M
6-1-06 Wahikuli N6-1-07 Honokowai L M 5 M AD M
6-1-08 Kahana N
6-1-09 Honokahua L M 3 M ADE M
6-1-10 Honolua P H 10 M ADE H Y
6-1-11 Honokohau L H 1 M ACDE H Y
6-2-01 Poelua N
6-2-02 Honanana L L 1 L ADE L
6-2-03 Kahalculoa L H 1 H ADE H Y
6-2-05 Waiolai L L 1 L ADE M
6-2-06 Malcaniakaole L M 1 L ADE M
6-2-07 Waihee R. P H 14 M ADE H Y
6-2-08 Waiehu L M 2 L ADE M Y
6-2-09 lao N Y
6-2-10 Waikapu L M 10 M ADE M Y Y
6-3-01 Maliko L M 1 M ADE M
6-3-02 Kuiaha N6-3-03 Kaupakulua L L 1 L AD M
6-3-04 Manawaliao N
6-3-05 Uaoa N
6-3-07 Kakipi L L 1 L ADE M
6-3-08 Honopou L L 1 L ADE M Y
6-3-09 Hoolawa L M 1 M ADE M Y
6-3-10 Waipio N
6-3-11 Hanehoi N y
6-3-12 Hoalua L M 2 L ADE M Y
6-3-13 Hanawana L M 1 L ADE M
_____
221

ARCHAEOLOGICAL OTHERCODE STREAM SURV PRE- # DEN- VALL- SENSI- HIST TARO
COVR DICT SITES SITY EY TIVE SITE
6-3-l4Kailua L M 2 L AD M Y
6-3-15 Ni1ii1ihae1e N6-4-01 Oopuola N Y
6-4-02 Kaaiea N Y
6-4-03 Kolea N6-4-04 Waikamoi N Y
6-4-06 Puohokamoa N Y
6-4-07 Haipuaena N6-4-08 Punalau N Y
6-4-09 Honomanu N Y
6-4-10 Nuaailua N Y Y
6-4-11 Piinaau N Y Y
6-4-12 Ohia L L 1 L ADE M Y
6-4-13 Waiokamilo N Y Y
6-4-14 Wailuanui L M 1 M ADE M Y
6-4-IS W.Wailuaiki N Y
6-4- 16 E. Wailuaiki N Y
6-4-17 Kopiliula N Y
6-4-18 Waiohue GI. N Y
6-4- 19 Paakea N6-4-20 Waiaalca N6-4-21 Kapauia N Y6-4-22 Hanawi N6-4-23 Malcapipi L M 3 M ADE H Y
6-4-24 Kuhiwa N Y
6-4-25 Waihole N6-4-26 Manawailceae N Y6-4-27 Kahawaihapapa N6-4-28 Keaailci N Y
6-4-29 Waioni N Y6-4-30 Lanikele N6-4-31 Heleleikeoha N Y
6-4-32 Kawakoe N6-4-33 U1aino L M 1 M ACDE M Y
6-4-34 Kawaipapa L M 6 M ADE M Y
6-5-01 Moomoonui L L 1 L ADE M
6-5-02 Haneoo L L 2 L ADE M
6-5-03 Kapia N Y6-5-04 Waiohonu L M 1 L AD M Y
6-5-05 Papaahawahawa L M 1 M ADE M
6-5-06 Alaalaula L H 1 M ADE M
6-5-07 Wailua N6-5-08 Honolewa N6-5-09 Waieli N
_______ _____
222

II
II
II
aI
IC
II
Ia
aa
II
II
II
I-
tn C-,
gEiii
‘Ir
o
()C
)
rzrrzzzrrrzz
x1
— CE
P ‘A
Q-‘
-.-
—a-
—C
Cl)
> (-J rn
rnrn
C-,
akn1
co
I-’ z
oo
ooooQ
ooooo
II
II
aI
II
Ia
aa
Ia
Ii
aa
aa
aa
aa
ai
aa
-a—
fr
.0
-
:J1
-D
0t
z —.
Ja
UI
>>
>>
>>
nn
flfln
nn
OC
DCD
CDCD
tnlr
!1tn
rntn
rlltx
Iltn
rllrn
tii
<<
C rn
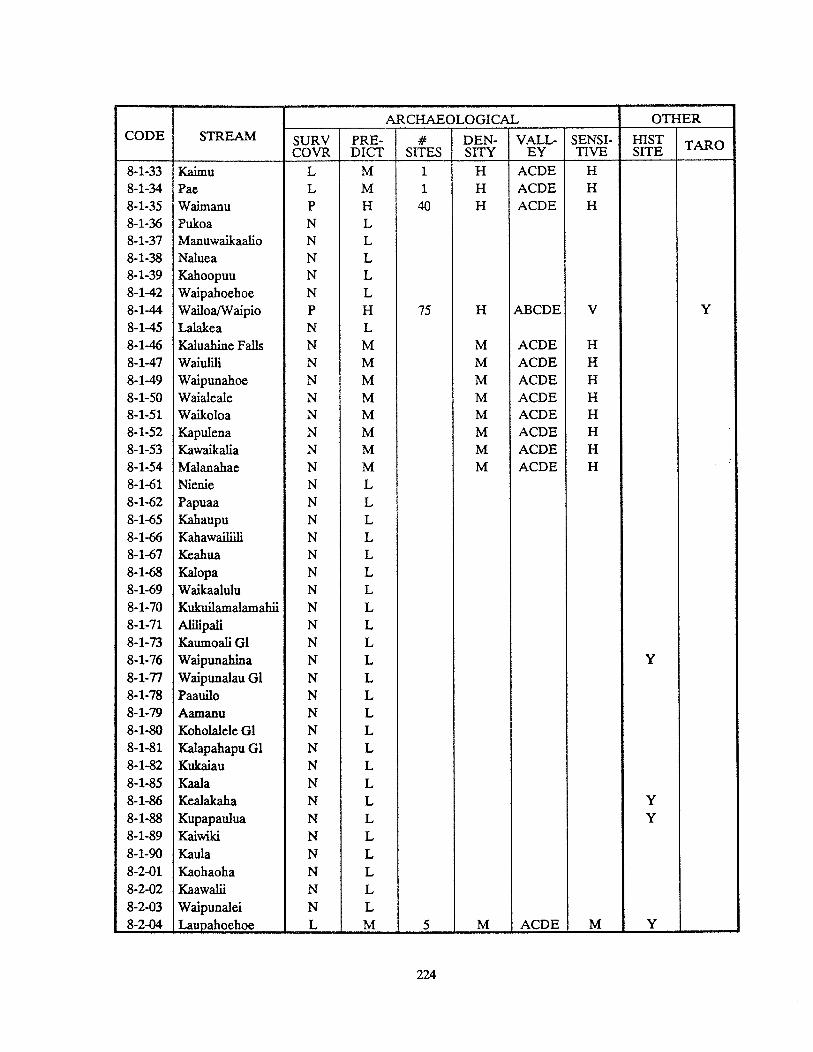
ARCHAEOLOGICAL OTHERCODE STREAM SURV PRE- # DEN- VALL- SENSI- HIST TARO
COVR DICT SITES SITY EY TIVE SITE
8-1-33 Kaimu L M 1 H ACDE H8-1-34 Pae L M 1 H ACDE H8-1-35 Waimanu P H 40 H ACDE H8-1-36 Pukoa N L8-1-37 Manuwaikaalio N L8-1-38 Naluea N L8-1-39 Kahoopuu N L8-1-42 Waipahoehoe N L8-1-44 Wailoa/Waipio P H 75 H ABCDE V Y
8-1-45 Lalalcea N L8-1-46 Kaluahine Falls N M M ACDE H8-1-47 Walulili N M M ACDE H8-1-49 Waipunahoe N M M ACDE H8-1-50 Waialeale N M M ACDE H8-1-51 Waikoloa N M M ACDE H8-1-52 Kapulena N M M ACDE H8-1-53 Kawailcalia N M M ACDE H8-1-54 Malanahae N M M ACDE H8-1-61 Nienie N L8-1-62 Papuaa N L8-1-65 Kahaupu N L8-1-66 Kahawailiili N L8-1-67 Keahua N L8-1-68 Kalopa N L8-1-69 Waikaalulu N L8-1-70 Kukuilamalamahii N L8-1-71 Alihipali N L8-1-73 Kautnoali Gi N L8-1-76 Waipunahina N L Y8-1-77 Waipunalau Gi N L8-1-78 Paauilo N L8-1-79 Aamanu N L8-1-80 Koholalele Gi N L8-1-81 Kalapahapu Gi N L8-1-82 Kukaiau N L8-1-85 Kaala N L8-1-86 Kealalcaha N L Y8-1-88 Kupapaulua N L Y8-1-89 Kaiwiki N L8-1-90 Kaula N L8-2-01 Kaohaoha N L8-2-02 Kaawalii N L8-2-03 Waipunalei N L8-2-04 Launahoehoe L M 5 M ACDE M Y
224

ARCHAEOLOGICAL OTHERCODE STREAM SURV PRE- # DEN- VALL- SENSI- HIST TAROCOVR DICE SITES SITY EY TIVE SITE
8-2-05 Kilau N L Y8-2-06 Manowaiopae N L8-2-07 Kuwaikahi N L8-2-08 Kihalani N L8-2-09 Kaiwilahilahi N L y8-2-10 Haakoa N L8-2-11 Pahale N L8-2-12 Kapehu N L8-2-13 Paeohe N L8-2-14 Maulua N L8-2-16 Pohakupuka N L8-2-17 Kulanakii N L8-2-18 Ahole N L8-2-19 Poupou N L8-2-20 Manoloa N L8-2-21 Ninole N L8-2-22 Kaaheiki N L8-2-23 Waikolu N L8-2-24 Wailcaumalo N L8-2-25 Kahuku N L8-2-26 Waiehu N L8-2-27 Nanue N L8-2-28 Opea N L8-2-29 Peleau N L8-2-30 Umauma N L Y8-2-31 Kamaee N L8-2-32 Hakalau N L Y8-2-33 Kolekole N L Y8-2-34 Paheehee N L8-2-35 Honomu N L8-2-36 Laimi N L8-2-37 Kapehu N L8-2-38 Makea N L8-2-39 Alia N L8-2-40 Malcalianaloa N L8-2-41 Waimaauou N L8-2-42 Waiaama N L Y8-2-43 Kawainui N L8-2-44 Onomea N L8-2-45 Alakahi N L8-2-46 Hanawi N L8-2-47 Kalaoa N L8-2-48 Aleamai N L8-2-49 Kaieie N L
______
225

ARCHAEOLOGICAL OTHER
CODE STREAM SURV PRE- DEN- VALL- SENSI- HIST TAROCOVR DICT SITES SITY EY liVE SITE
8-2-50 Puuokalepa N L ‘I
8-2-51 Kaapoko N L
8-2-52 Papaikou N L
8-2-53 Kapue N L
8-2-54 Pahoehoe N L
8-2-55 Paukaa N L8-2-56 Honolil L M 4 L D L Y
8-2-57 Maui N 0
8-2-59 Pukihae N L
8-2-60 Wailuku R. L L 5
8-2-61 Wailoa R. L M 5 M ACDE H
8-2-62 Kaahakini 08-4-02 Waiaha N L8-5-01 Haloa N L8-5-02 Lamimaumau N L
8-5-03 Waikoloa P H 100 H ABCDE V
226

Map
6
Outs
tan
din
gC
ult
ura
lR
esou
rces
.25
Pt.
.28
•19
Ha,,
1834
a
.\4
..
•oi
aP
all
18
1L
I
01
4..
0fl(h
l.1
3
04•
09/
Mo
06a
alea
....
ana
-.-----.--
08
.
5\‘
P$
•/
42,10
psm
2u1.
12
Lih
ue
Kekaha
-.
alm
ea
315
NB
W1I
IWiI
I
04.
I-.
C.
01
aay
Ko
loa
07 ••
0402
KA
UA
IIs
lan
dC
ode
-2
Haw
aii
Str
eam
Ass
essm
ent
Not
e:O
nly
apo
rtio
nof
the
tota
lnu
mbe
rof
stre
ams
are
depi
cted
onth
ism
ap.
2-1.
01A
waa
wap
uhi
2.1-
02H
onopu
2-1-
03N
akei
klon
aiw
i2.
1-04
Kal
alau
2-1-
05P
ohak
uao
2-1-
06W
aiol
aa2-
1-07
Han
akoa
2-1-
08W
aiah
uak
ua
2-1-
09H
oolu
lu2-
1-10
Han
akap
iai
2-1-
11M
aunap
ulu
o2-
1-12
Lim
ahul
i2-
1-13
Man
oa2-
1-14
Wai
niha
R.
2-1-
15L
umah
aiR
2-1-
17W
aipa
2-1-
19H
anal
eiR
.2-
1-26
Puu
kum
u2-
1-30
B.W
aiak
alua
2-1-
35P
apaa
2-2-
08s
Wai
lua
S.2-
3-02
Wai
kom
o2-
3-04
Law
ai2-
3-06
Wah
iaw
a2-
3-07
Han
apep
e2-
4-04
sW
aim
eaS.
2-5-
08N
ahom
alu
2-5-
09K
aula
ula
2-5-
10il
acle
cle
2-5-
13K
auha
o2-
5-.5
M1
oIi
2-5-
16N
ualo
lo

Map
6
Outs
tandin
gC
ult
ura
lR
esou
rces
Haw
aii
Str
eam
Ass
essm
ent
Not
e:O
nly
apo
t-lio
no
fth
eto
tal
nu
mb
erof
stre
ams
arc
[dep
icte
don
this
map
.
KaI
tint
03
10
34-1
83-
2-13
3-2-
153-
3-12
3-4-
023-
5-05
Kah
ana
Kaw
ainu
i/M
auna
wjj
jW
aim
anal
oM
oan
alu
a1-
lala
wa
Kau
puni
07
.06
K..na
Po
int
04
Barb
.r.
Poin
tla
land
Co
de
-3
09
A/a
àVa/
Dia
mond
Hea
d
Ifla
am
aB
ay

Map
6
Outs
tandin
gC
ult
ura
lR
esou
rces
Wai
hana
uK
ailii
IiP
eick
unu
Wai
lau
Hal
awa
Hon
ouli
mal
ooH
onou
hwai
Wai
alua
Kai
nalu
Map
uich
uK
alua
aha
Man
awai
Kam
alo
Kaw
cla
Ilto
Poin
tK
ablu
Po
int
.cap
eIl
ala
wa
4-1-
014-
1-08
4-1-
894-
1-15
4-1-
214-
2-02
4-2-
034-
2-04
4-2-
054-
2-08
4-2-
094-
2-11
4-2-
144-
2-15
MO
LO
KA
IIs
lan
dC
od
e-
4
Haw
aii
Str
eam
Ass
essm
ent
Not
e:O
nly
apo
rtio
nof
the
tota
lnu
mbe
rof
stre
ams
are
depi
cted
onth
iam
ap.

Map
6
Outs
tandin
gC
ult
ura
lR
esou
rces
MA
UI
1*li
nd
Co
de
-
Haw
aii
Str
eam
Ass
essm
ent
nu
mb
ero
lst
ream
sar
c
depi
cted
onth
ism
ap.
a09
1
07 05
Lii
01
15
01
01
6-1-
106-
1-11
6-2-
036-
2-07
6-4-
236-
5-15
6-5-
196-
5-24
Hon
olua
Hon
okoh
aUK
ahak
uloa
Wai
hee
RM
akap
ipi
Kou
koua
iL
elek
eaM
anaw
ainui
34
lana
03
1113
24 a
a

Map6
HAWAIILsland Code - S
Hawaii Stream AssessmentNo Only a portion of the total
number of streams aredepicted on this map.
84-11 Halawa8.1-12 Aamakao8-1.13 Niulil8-1-14 Waikama8-1-15 Pololu8-1-16 Honokane Nul8-1-17 Honokane Iki8-1-19 Waipahi8-1-22 Honopue8-1-25 Nakooko8-1-31 Waiaalala8-1-32 Punalulu8-1-33 Kaimu8-1-34 Pae8-1-35 Waimanu8-1-44 Wailoa/Waipio8-1-45 Lalakea8-1-46 Kaluahine Falls8-1-47 Waiulili8-1-49 Waipunahoe8-1-50 Waialeale84-51 Waikoloa8-1-52 Kapulena8-1-53 Kawaikalia8-1-54 Malanahac8-2-61 Wailoa R.8-5-03 Waikoloa
Up.I. Point
OutstandingCultural Resources
so
•i
01
H.ns.nai
S..th P.1.1
231

Recreational Resources
‘SVater-related recreation is a part of life in Hawaii. Although beaches draw more users,stream-related recreation is also significant. It includes water-based activities such asboating and swimming, land-based activities such as hildng and camping, and lessenergetic ventures such as nature study or sightseeing. This is the first attempt toinventory and assess stream-related recreation in Hawaii.
A state Recreational Resources Committee was formed to design the recreationinventory and assessment. Members identified boating, camping, fishing, hildng, hunting,nature study areas, scenic views, public parks and swimming as the elements to beincluded in the inventory. They next identified two basic sources of information: 1)government documents and other published information such as guide books and maps;and 2) residents who were familiar with local recreational opportunities.
Regional committees were then established on each island and given responsibility forcompiling an inventory for their respective islands, based on current uses and facilities.Members included representatives from state and local governments, hunting clubs,longtime residents, recreational user groups, and other members of the public whoresponded to a call for participation issued by HSA.
Island by island recreational inventories were then developed, using a modified U.S.Forest Service Recreation Opportunity Spectrum, or ROS classification. Assessmentfactors used to rank the streams were diversity of experiences, quality of the experiences,specific unique characteristics, and unique combinations of attributes. The regionalcommittees ranked all streams for their islands as Outstanding, Substantial, Moderateand Limited/Unknown. Based on the list of 70 regionally outstanding streams, the statecommittee, using regional input, identified 18 outstanding streams statewide. Five ofthese are on Kauai, two on Oahu, three on Molokai, three on Maui and five on Hawaii.Several of these “streams” are actually large stream systems.
The results of this inventory and assessment are somewhat subjective in that they arerelated to the composition of the committees and their collective experiences. Inaddition, the inclusion of an experience in this study does not necessarily mean that it isone the general public can take advantage of. Rather it means only that it was identifiedby some user. Finally, this report should not be considered a complete and final inventoryof stream-related recreational resources.
232
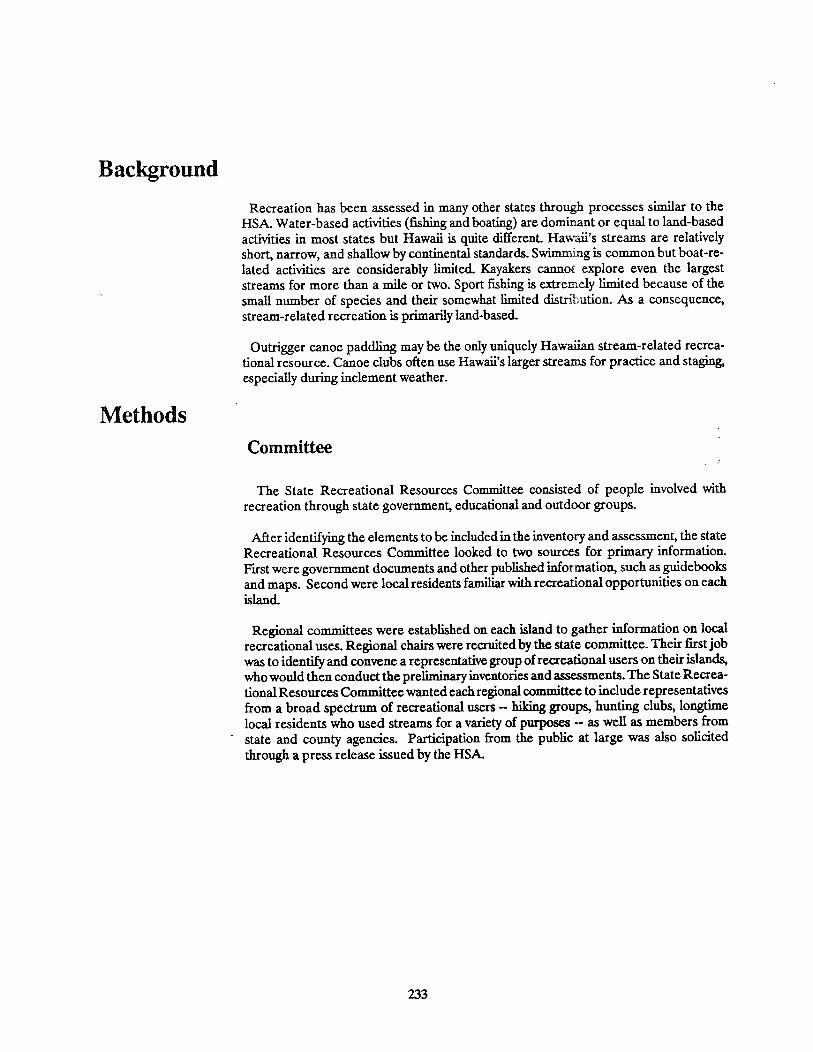
Background
Recreation has been assessed in many other states through processes similar to theHSA. Water-based activities (fishing and boating) are dominant or equal to land-basedactivities in most states but Hawaii is quite different. Hawaii’s streams are relativelyshort, narrow, and shallow by continental standards. Swimming is common but boat-related activities are considerably limited. Kayakers cannot explore even the largeststreams for more than a mile or two. Sport fishing is extreniely limited because of thesmall number of species and their somewhat limited distribution. As a consequence,stream-related recreation is primarily land-based.
Outrigger canoe paddling may be the only uniquely Hawaiian stream-related recreational resource. Canoe clubs often use Hawaii’s larger streams for practice and staging.especially during inclement weather.
MethodsCommittee
The State Recreational Resources Committee consisted of people involved withrecreation through state government, educational and outdoor groups.
After identifying the elements to be included in the inventory and assessment, the stateRecreational Resources Committee looked to two sources for primary information.First were government documents and other published information, such as guidebooksand maps. Second were local residents familiar with recreational opportunities on eachisland.
Regional committees were established on each island to gather information on localrecreational uses. Regional chairs were recruited by the state committee. Their first jobwas to identify and convene a representative group of recreational users on their islands,who would then conduct the preliminary inventories and assessments. The State Recreational Resources Committee wanted each regional committee to include representativesfrom a broad spectrum of recreational users — hiking groups, hunting clubs, longtimelocal residents who used streams for a variety of purposes — as well as members fromstate and county agencies. Participation from the public at large was also solicitedthrough a press release issued by the HSA.
233

Recreational Resources CommitteesSTATE
Chair, Patty Kupchak, Sierra Club
Lorin Gill, Moanalua Gardens Foundation
Eric Onizuka, DLNR Aquatic Resources
Wayne Souza, DLNR Parks and Recreation
Oahu
Chair, John Hall, Hawaiian Trail and Mountain Club
Richard Davis, Hawaiian Trail and Mountain Club
John Clark Ocean Recreation Consultant
Lorin Gill, Moanalua Gardens Foundation
Bill Gorst, DLNR Parks and Recreation
Mabel Kekina, Hawaiian Trail and Mountain Club
Steve Rohrmayer, Pig Hunters Association
Jason Yuen,City and County of Honolulu, Parks and Recreation
Molokal
Co-Chair, Mary Place
Co-Chair, Jo-An Salmon
Cliff Soares, Molokai resident
Dan Kuhns, Molokai resident
Bill Puleloa, DLNR Aquatic Resources
Kauai
Chair, Tom Teller, DLNR Forestry and Wildlife
Chico Godinez, Kayaks Kauai
Micco Godiner, Kayaks Kausi
Bob Hee, Garden Island Shooting
Glenn Ikemoto, Light Tackle Anglers of Kauai
Karma Smyth, DLNR Division of State Parks
Kathy Valier, Sierra Club
Ernest Ventura, Garden Island Archery Club
Maul
Co-Chair, Anne Fielding, The Nature Conservancy
Co-Chair, Mike Minn, Hana Community Association
David Brown, Sierra Club
Joe Harabin, Maui resident
Skippy Hau, DLNR, Aquatic Resources
Garrett Hew, East Maui Irrigation Company
Bob Hobdy, DLNR Forestry and Wildlife
Sadao Yanagi, Maui resident
Hawaii
Chair, Chris Yuen, Sierra Club
Gretchen Grove, Hawaii resident
Cathy Lowder, Sierra Club
Bob Nishimoto, DLNR, Aquatic Resource
Quentin Tomich, Conservation Council
Joe Wierschem, Sierra Club
234

Members of the regional committees met to augment the published information withtheir personal knowledge of the recreational resources on their islands. The state chairand at least one member of the study team attended meetings to provide specificdirection and maintain consistency. All information was recorded on specially prepareddatasheets (Table 39). This information served as the primary data source. When a lackof information about a certain activity or region was identified, specific resource peoplewere called upon to provide information.
The data were compiled and reviewed by the regional committee chairs and then senton to the state committee for additions and final approval. Then, the streams wereassessed using the regional criteria and, in a very few cases, adjusted by the regionalcommittees. The final list of regionally Outstanding streams was used as the candidatelist for statewide Outstanding. Finally, the state committee determined statewide Outstanding streams, based on the work by the regional committees. These inventory andassessment methods are discussed in the next section.
Inventory
Opportunity Types
All recreation opportunity types initially considered stream-related were inventoriedbased on current usage or facilities. These were boating, camping, fishing, hiking,hunting, nature study areas, scenic views, public parks and swimming.
Boating Canoeing, kayalcing, windsurfing and motorized boating were inventoried.
Camping: All authorized camp sites as well as frequently used camping areas wereincluded.
Fishing: Fishing for and/or taking of introduced or native fresh-water or marine(estuarine) species and, on Kauai, frogging were placed in this category. Both “serious”fishing and neighborhood children “fishing” from bridges were included.
Hiking: All hiking trails identified by the recreation committee as stream-related wereentered. This includes maintained hiking trails, local “unimproved” trails, dirt roads, andjogging routes in urban areas. Stream-related trails are those leading to streams, paralleling streams and trails in which a view of the stream is important.
Hunting: Hunting areas were identified by the committee and may not necessarily bethose shown on DLNR’s hunting maps. This inventory includes hunting for pigs, goats,deer and game birds.
Nature Study Areas: Nature study areas include botanical gardens adjacent to a streamand established educational programs that either have a facility adjacent to a stream ora published guide to a stream.
235

Parks: Public parks that encompass portions of or are adjacent to streams andmanaged by the counties, the state or the National Park Service were inventoried.
Scenic Views: Scenic views (of waterfalls and scenic valleys, etc.) from the road, ocean,air and trail are included. Roads requiring four-wheel drive vehicles were recorded astrails.
Swimming All swimming holes identified by the committee were recorded. Theregional committee on Hawaii determined that surfing at stream mouths on the islandof Hawaii should be included in this category. The committee argued that these sites,created by shoals formed at stream mouths, were an important resource due to thelimited reef-associated surfing sites on that geologically young island.
ClassificationsEach of these opportunity types was classified according to a Recreational Opportunity
Spectrum (ROS). Then, each was rated according to the quality of experience itafforded.
Recreational Opportunity Spectrum: This classification was developed by the U.S.Forest Service to provide a framework for the collection and evaluation of recreatianinventory data (USFS 1978). It allows the user to distinguish among the variety ofexperiences associatedwith outdoor recreation in different settings. The state committeeadapted the original categories for use in the Hawaii Stream Assessment.
After the opportunity types were identified, they were categorized as Urban, Country,Semi-Natural and Natural. Each of these combinations is a field in the database.
Urban/Suburban: This is where most people live and work. Buildings and pavedroads dominate. Recreational places are often city or county parks with exotic plantsand mowed lawns. Non-recreational uses may dominate.
Country/Rural: Small outlying communities with open space and often cultivatedland. Recreational areas are often county or state parks, or large campgrounds.Recreational facilities may be common and include cooking grills and restroomfacilities. Non-recreational uses may be present but not as common or as intrusiveas on urban streams.
Semi-Natural: The settings are more remote, away from the main traveled highways.Access may require a 4-wheel drive vehicle. Facilities may be present at parks butare not present elsewhere. Surrounding vegetation/forest has been highly altered byprevious use or intrusion of introduced species.
Natural: These are the most remote settings, where fewer people go. Often thesettings are completely away from the sights and sounds of people. Facilities andnon-recreational resource uses are scarce or absent entirely. Hiking trails (generallythe only access) leading to these areas are long and often difficult. The vegetationhas a high proportion of native species and/or is relatively pristine.
236
By combining the recreational opportunity category (e.g., boating or hiking) with thesetting category (eg., urban/suburban or natural) recreational experiences could be ratedand compared, while holding subjective qualitative judgments to a minimum. Boatingon the Ala Wai Canal and the Hanalei River may both be high quality experiences, forexample, but cannot be compared with each other. However, boating on the Huleia andthe Hanapepe Rivers, both rural locations, can be more objectively compared.
Quality: Each identified experience was then assigned a quality class, common or highquality. A high quality experience is one of the best of its type on that island. All thosedetermined to be of high quality were described detailing the outstanding feature.
DescriptorsDescriptions of high quality experiences, access problems, detractions, local impor
tance, unique characteristics and potential for improvement were also collected andnoted in database comment fields.
High Quality Experience: A description of each high quality experience was requestedfrom the committees.
Access: The inventory includes all recreational activities on Hawaii’s streams regardlessof restrictions in access. Conditions noted are closed private land, private accessavailable through waiver, and restricted access.
Detractions: Detractions such as litter, inadequate facilities, overuse, helicopter noise,pollution, leptospirosis contamination, flash flooding, or artificially diminished flow werenoted, especially when they served to downgrade the inventory ranking from high qualityto common.
Local: Streams with great local but not necessarily island or state importance werenoted in the inventory. Local experiences are important to the quality of life in certainareas and therefore their identification could be useful for county planning.
Unique: This category allowed the committee to directly rank a stream as outstandingbased on features it considered to be of such value or scarcity on an island or statewidethat the stream should be considered outstanding regardless of the lack of other qualitycharacteristics or experiences. A description of the features was required in the commentfield.
Potential: A stream with potential is defined as one that would be outstanding ifrestoration, public access, acquisition, protection, regulation, or recreational development took place. A description of the needed action was required.
Assessment
The committee developed a two-step assessment process: 1) regional assessment, and2) state assessment. This process made the task of assessing 376 streams manageable. Italso created separate regional inventories and assessments which are useful tools for
237

county-level planners. Both regional and state assessments were based on the followinggeneral factors:
Diversity of experiences;
o Unique characteristic (scarcity);
o Quality of experience;
o Unique combination of attributes.
Regional Assessment MethodsThe inventory data was tallied for each of the 500 streams and tributaries; however the
assessment was based on only the 376 streams finally determined to be perennial.
Number of High Quality Experiences: The number of high quality experiences (opportunities within any of the ROS settings -- Urban, Country, Semi-natural, Natural) wasinventoried.
Total Number of Experiences: The total number of experiences high quality orcommon, was inventoried.
Potential or Unique: Streams with unique characteristics and those with potential werealso noted.
The state committee assigned preliminary Outstanding, Substantial, Moderate, andLimited/Unknown rankings to streams based on the regional assessment criteria. Someregional committees were more generous in assigning high quality experience rankingsthan others. Consequently, some subjective adjustments were made by the state committee such that the number of high quality experiences required for an Outstanding streamvaried island by island. This information was sent to the regional committee membersfor review and correction.
Regional Recreation Assessment Criteria
Outstanding: Diversity of high quality experiences, uniquecharacteristic, or a unique combinatim ofattributes. Streams with potential to becomeOutstanding through restoration, acquisition,protection, regulation, or facilities developmentwere also included.
Substantial: Diversity of experiences or some experiences ofhigh quality
Moderate: Several experiences but none of high quality.
Liniited/ No experiences were identified or the recreationalUnknown: experiences are unknown.
238

State Assessment Methods
The next step required the regional committees to compare the resources on theirisland to resources statewide. All of the streams rated Regionally Outstanding orRegionally Potentially Outstanding were placed on the candidate list for StatewideOutstanding and seat to the 35-plus committee members. The state ranking criteria foroutstanding were defined as diversity of experiences, high quality experiences, uniquecharacteristics, or a unique combination of attributes.
State Recreational Resource Assessment Criteria
Outstanding: Diversity of experiences, high qualityexperiences, unique characteristic, ora unique combination of attributes.
The regional committees were asked to choose their top 10 streams, including no morethan five from any single island, and then to choose their next 15 top streams, includingno more than seven from any single island. This was to be based on the informationprovided to them and their own knowledge.
The assessments were straightforward with the exceptions of Kauai and Molokai.Kauai, in addition to choosing 25 Outstanding streams as requested, named nine morethey felt were worthy of “Honorable Mention.” Committee members felt their island hadso many great streams that they should not be restricted by the 25- stream limit and thegeographic distribution requirement. The state committee noted that the relatively oldgeologic age of Kauai has resulted in a greater number of larger and better developedstreams. Based on that, the state committee accepted these “Honorable Mentions” andawarded them the same rank as the second 15. The Molokai committee did not feelqualified to rank any streams on other islands so they limited their assessment to Molokaistreams.
This information was compiled and sent back to the state committee for the finaldetermination of state Outstanding and other important streams statewide.The StateRecreation Committee reviewed the outstanding ranks awarded by the regional committees and determined that any stream that was selected in the top 10 by that island’s
- committee would be declared Outstanding (able 37).
ResultsInventory
Table 34 shows the number of streams with various activities and the number ofexperiences within each activity type. The first line for each island shows the number ofstreams with at least one opportunity type. The second line shows the actual experiencesrecorded. For example, 45 streams on Kauai were recorded as having scenic value,whereas 109 scenic experiences were noted (some from each of the vantage points, trail,air, ocean and road). Similarly, 39 streams on Oahu were recorded as having some sort
239

of swimming holes whereas 42 swimming experiences were recorded — thus, at least afew streams had swimming holes in more than one ROS area. Hunting data wereintentionally excluded from this table because the activity was determined to be onlyindirectly stream-related.
Only 31 boating experiences were identified statewide. In contrast, there are approximately 200 experiences each for fishing, hiking or swimming statewide. Half of allof the boating experiences are on Kauai, while none were identified on Maui. These fewexperiences are due to the short length of Hawaii’s streams and is illustrated by the factthat boating only encompasses one ROS category, either urban or country.
Camping opportunities near streams appear to be limited on Maui and Molokai.Stream- related hiking opportunities seem to be relatively evenly distributed throughoutthe state. Fishing takes place on all islands, but on Hawaii it appears to encompass morethan one ROS more often than on other islands. Fishing experiences were fairly welldistributed around the state except for the limited experiences on Molokai.
There are only a few stream-related parks on Molokai, Maui and Hawaii, while thereare a number of them on Oahu and Kauai. The numbers do not represent the numberof different parks since in some cases one park is associated with many individual streams(such as the Na Pall State Park and Kokee State Park on Kauai). Only Kahana State Parkon Oahu and lao State Park on Maui encompass more than one ROS. That may be duepartly to the relatively short nature of our streams but is also indicative of the small sizeof most of our stream-related parks.
Only 20 stream-related nature study areas were identified statewide. Most of these arebotanical gardens, and most are on Oahu. Educational programs are also included inthis category. These are Kahana and Makiki on Oahu, Kolekole on Hawaii, and lao,Waikapu and Maliko on Maui. The lack of educational materials on streams has beennoticed and is being addressed by the Ohia Project. In this project, the Bishop Museumand Moanalua Gardens Foundation are working with the State Department of Education to develop ecological educational curriculum and materials to integrate into regularlessons for grades K-S. Students participating in the Ohia Project will learn about streamsthrough field trips. This important nature studyprogram willbe linked to specific streamsin the near future.
All of the neighbor island committees ranked their streams as more scenic than theOahu committee did. Furthermore, neighbor island committees ranked many of theirstreams scenic from more than one viewpoint. The less developed parts of the islands,such as the north shore of Molokal, the north Kohala and Hamakua coasts of Hawaii,the Hana area ofMaui and the Na Pall coast ofKauai, accounted for many of these scenicratings.
240

Table 34. Distribution of Selected Recreational ExperiencesBoat Camp Fish Hike Swim ParkNatStdy View
KauaiStreams 16 24 47 42 39 31 3 45Experiences 16 28 59 48 48 31 4 109OahuStreams 9 18 53 37 39 33 10 21Experiences 9 20 63 38 42 34 12 28MolokalStreams 1 8 10 10 13 5 0 25Experiences 1 12 16 15 20 5 0 50MaulStreams 0 8 42 54 54 4 4 51Experiences 0 9 51 66 60 5 5 124HawaiiStreams 5 20 63 42 44 9 2 82Experiences 5 20 125 49 47 9 2 189
The Recreational Opportunity Spectrum allows analysis of a different sort By viewingopportunity types through this spectrum, oae can see the range of experiences available.It is a recreational management tool that helps assure that the broadest range of thepublic has access to the quality of recreation experiences they seek. The following tableshows the number of streams with one or more experiences in a particular recreationalopportunity spectrum setting for each island. Parks and hunting were excluded from thistally because parks often encompass more than one stream and hunting was determinedto be only indirectly related to streams. Scenic view were also excluded as they were notclassified using the ROS.
Table 35. Recreation Opportunity Spectrum DistributionUtban Country Semi-Natural Natural
Kaual 3 34 45 9Oahn 24 32 37 3Molokal 0 7 13 8Maul 0 56 42 2hawaII 3 37 72 50
Streams with natural experiences were rare on all islands except Hawaii. Molokai hasa deceivingly large percentage of streams with experiences in the natural area. Three ofthe streams with natural experiences refer to experiences in the headwaters of theKamakou Nature Conservancy Preserve. Others are located in the Pelekunu NatureConservancy Preserve. Combined, half of all natural experiences are in TNC preserves.Most of the natural experiences on Kauai were on tributaries of the Waimea River in theKokee area, the rest on the Hanapepe and Wabiawa Rivers. (Streams on Kauai’s Na Pallcoast were not considered natural due to the abundance of non-native vegetation.) OnHawaii, 42 of the 50 streams with natural experiences involved only fishing opportunitieson Hamakua Coast streams. The other eight streams with natural experiences were inNorth Kohala and on the Wailuku River.
241

Few urban experiences were identified on the mostly rural outer islands while only
three streams with natural experiences were recorded on the heavily urbanized island ofOaliu. These were Kaluanui and Makaua and Kiikii System (Kaukonahua Stream).
Descriptive information was collected as committees inventoried the recreation experiences. However, since only high quality experiences required descriptions, theinformation is not summarized in tabular form.
Access was mentioned as a problem on all islands, but only the Oahu and Kauai regional
committees noted access problems on specific streams. Access was perceived to be sucha problem for the Maui group that they did not always mention it stream by stream. A
permit is required to visit portions of any stream between Kahului/Wailuku and theoutskirts of Hana on East Maul and all except three streams on West Maul (Tao, Waihee,
and Makamalcaole).
In many less developed areas of the state, it is local custom to allow general access toa stream across private property. The committees on Molokai and Hawaii reported fewcurrent access problems but noted that as population and development increase, this
local custom may disappear. As a result, these committees identified several streams towhich they felt public access should be maintained. Examples include streams along theKohala Ditch trail and Waialua on Molokai.
Helicopter noise is perceived as a particular problem on the north shore of Kauai andthe Hana area of Maul. Other detractions mentioned by the committees include litter,overuse, poorly maintained and/or hazardous road and trail access to the stream,vandalism of parked cars, marijuana growing, military maneuvers, and various developments (hydroelectric, golf course, highway).
Leptospirosis contamination of a few streams was mentioned, although the StateDepartment of Health considers it to be a problem on all streams in Hawaii.
“Overuse,” a perception based on what one expects an experience to be, was used withreference to Kalalau Stream on Kauai’s Na Pall Coast, yet not the Ala Wal Canal.
Locally important swimming holes were the main experience identified by all committees. This special descriptive category was not used in the assessment but was includedbecause of its value to county planning.
Streams with potential to be outstanding were identified by all regional committees.
Actions recommended include improving public access, better management of parkareas, trail development on public lands, and the cleaning up of streams. In several cases,proposals (Na Ala Hele’s plan for demonstration trails at Maunawili, Oahu and Waioli,Kauai, and state plans for recreational development of the upper Hanalei, Kauai, andAlu Like’s plans for Makamakaole, Maul) and unimplemented plans (urban greenwaysalong Oahu’s Nuuanu and Manoa streams) led committees to identify streams as havingpotential.
Unique streams were identified by all regional committees. Specific geologic or stream
features and the scarcity of a recreational resource in a particular area were the mostcommon reasons for describing a stream as unique.
242

Assessment
Regional Assessment ResultsThe following table shows the number of streams ranked in each categoly by island.
Table 36. Distribution of Regional Assessment RanksOutstanding Substantial Moderate Ltd/Unknown Total
Kauai 17 19 15 10 =61Oahu 7 30 15 5 =57Molokai 7 11 11 7 =36Maui 22 36 14 18 =90Hawaii 17 50 49 16 =132
Total = 70 = 146 = 104 = 56 = 376
State Assessment ResultsThe 70 Regionally Outstanding streams are shown on Map Set 7.
Table 37. Statewide Outstanding Streams for Recreation
Kauai2-1-10 Hanakapiai2-1-18 Waioli2-1-19 Hanalei2-2-O8sWailua System2-4-O4sWaimea System
Oahu3-1-18 Kahana3-6-O6sKlikii System
Molokai4-1-13 Wailau4-1-21 Halawa4-2-04 Waialua
Maui6-2-07 Waihee6-2-09 lao6-5-13 Oheo
Hawali8-1-16 Honokane Nw8-1-35 Waimanu8-1-45 Lalakea8-2-33 Kolekole8-2-60 Wailuku
243

DiscussionMuch land use planning is done island by island rather than statewide so that the
regional assessment of streams is very important. It includes streams that are not onlycurrently outstanding but also those that have the potential to be outstanding. Streamsranked regionally outstanding for recreation warrant consideration by local parksdepartments for recreational development and should receive extra scrutiny whennon-recreational developments are proposed.
Streams that received votes from more than two regional committees are clearlysignificant. However, name fmiliirity may indirectly be a factor in the identification ofthese streams. Many of the streams that have associated state or national parks or wildliferefuges are on the list, as are those that have been the topic of public controversy. Parksand refuges are clearly identified and promoted for their facilities, educational opportunities and,, indirectly, for the access they provide. Streams that have been in the publiceye may be brought to the attention of the recreational user who then plans a visit.
The statewide outstanding streams are those considered the most outstanding byresidents of that island. These streams deserve special protection and consideration forrecreational development. Many of these streams are now associated with parks andthose that aren’t should be considered for park development, after giving due consideration to their aquatic and riparian resources.
Streams ranked highly for recreation tend to be correlated with high flow rates, and toa lesser extent with stream length. All of the largest 25 streams were ranked eitherOutstanding or SubstantiaL Only three of the 50 largest streams for which gaging datais available were ranked Moderate: Waikele, Oahu; Hapuaena, Maui; and Nailiilihele,Maui. All except six streams of the 50 that are 10 miles or longer (based on the U.S. ArmyCorps of Engineers Headwaters survey), were ranked outstanding or substantial on theregional ranking scale.
Boating and natural experiences are rare throughout the islands. Streams with theseresources tend to be included in the list of outstanding and important streams.
Hunting was initially considered stream-related, but later that relationship was questioned. Hunting may occur along a stream, but the quality of the experience is notdirectly affected by the stream. it is rather related more to the abundance of animals,physical access, and other factors. In addition, hunting is often incompatible with otherstream-related recreational activities.
Liniltations to Inventory
The methodology used to create this inventory is by its nature subjective and dependenton the individual members of the committee and their experiences. The regionalcommittee chairs were nominated by the state committee from among their personal andprofessional acquaintances. Then, these regional chairs chose their own members usingstate committee guidelines. Others were identified through HSA press releases. Thecommittees, as a result, differed in composition, expertise and size. A different committee may or may not have arrived at the same results.
244

The experiences available on a particular stream might be under-represented in somecases and over-represented in others. Each of the streams was inventoried and thatinformation recorded on a datasheet. The datasheet allowed for only one opportunity-type within any one recreational opportunity spectrum. A stream that has, for example,two semi-natural camping experiences will only be counted once and therefore may beunder-represented. Sometimes one physical feature can be overrepresented. One waterfall can be counted as scenic from all four vantage points and would receive four “points”.Other streams that would also receive four points might have hiking, camping, swimmingand fishing. Whether these are equivalent is debatable. The length of the stream and thenumber of recreational opportunity spectra it encompasses also affected its ranking. Forexample a stream which goes through several ROS’s has more chance to be ranked thana stream that only flows through “Country”.
As previously indicated, this inventory includes all recreational activities that take placeon Hawaii’s streams regardless of public access. No detailed location information wascollected nor any specific mapping undertaken.
Limitations to State Assessment Results
This assessment is by nature subjective. However, the validity and reliability of theprocess are considered adequate due to the breadth of the recreation committees’collective experiences and opinions. In other words, the streams categorized Outstanding statewide are probably inclusive of all of the truly great recreational streams, but itis possible that some may have been overlooked or that some have been ranked higherthan they should have been.
Neither the state chair nor the study team attended the second meeting of the regionalcommittees. Therefore the criteria used were not necessarily consistently interpreted.In fact, each regional committee did things a little differently. For example, the Mauicommittee felt that the amount of use was an important positive factor and thereforebased its decision on this in addition to the ranking criteria provided.
The state committee arbitrarily decided to allow each regional committee to choose amaximum of five streams for the statewide outstanding list from their island. Five seemedlike a reasonable number but using a percentage approach (25 percent) could have beenmore useful. The Kauai committee felt strongly that they had so many outstanding
- streams that they awarded additional streams “Honorable Mention” status. The statecommittee accepted these additional “votes” even though this option was not presentedto the other regional committees. They reasoned that Kauai had a greater number ofbetter developed streams.
Future Research
The Hawaii Stream Assessment was designed to obtain a broad overview of Hawaii’sstream-related resources. While there are considerable benefits to such a study, a morein-depth survey could yield other useful results. A follow-up review of Hawaii’s recreational resources could.
245
Refine the definition of stream-related recreational resources. What are stream-related recreational resources and how do people use them? Have all the appropriateopportunities been inventoried?
Are there other general areas that should or should not have been included? Shouldall of the opportunities be combined and given equal weight or are some more importantthan others?
What kinds of information should be collected with regard to these opportunities?Should information be collected on resources accessible to only a few along with thoseaccessible to the many? How do people use these resources? Are the areas HSAidentified exclusive or inclusive? How can recreation be measured at all?
Develop more objective evaluation criteria. In the HSA survey, committee memberswere asked to consider “where they would most like to go” as the criterion for a highquality resource. Better standards than this should be developed and employed.
Develop data collection processes that have increased reliability. Assuming that theregional committee approach is the best approach, it mightbe possible to set up regionalcommittees whose members have similar profiles. How does one identify good resourcepeople? Would committee members intentionally skip over or underrate a resource toprotect it from over exploitation? Can accurate data be obtained?
More interaction with these hand-picked committees would allow for a more exhaustive search for information. The short-term commitment required by the Hawaii StreamAssessment’s process may have increased the willingness of some busy people toparticipate, but more follow-up might result in more comprehensive information.
Other future research might include identification of streams to be targeted forrecreational development. Criteria might take into account conflicts with other resources, geographic distribution, availability to urban populations and predictions of futurerecreational needs.
SourcesPublished and Unpublished Documents
Clark, 3ohn. 1977. Beaches of Oahu. University of Hawaii Press: Honolulu.Clark, John. 1985. Beaches of Maul County. University of Hawaii Press: Honolulu.Clark, John. 1985. Beaches of The Big Island. University of Hawaii Press: Honolulu.Department ofLand and Natural Resources. December1985. State Recreation Functional
Plan Technical Reference Document and State Outdoor Recreational Plan (SCORP).Department of Land and Natural Resources. “Guide to State Parks.” No date.Department of Parks and Recreation, City and County of Honolulu. October 1988. “Index
of Oahu Parks and Facilities.”Governors Ocean Resources Tourism Development Task Force. December 1988. En
hance, Preserve, Restore. An Interim Report.
246

Hawaii Stream Assessment State Recreation Committee. Spring 1989. Recreation Opportunity Spectrum adapted for Hawaii. Prepared for the Hawaii Stream Assessment.
Sutherland, Audrey. 1988. Paddling Hawaii. Mountaineers Publishing, Seattle.U.S. Forest Service. January 1978. “The Outdoor Spectrum Concept and Behavioral
Information in Outdoor Recreation Resource Supply Inventories: Background andApplication.” Paper presented at the National Workshop on Integrated Inventories ofRenewable Natural Resources, Tucson, Arizona..
Wenger, KarL 1984. Forestry Handbook, Second Edition. Edited for the Society ofAmerican Foresters. New York.
Maps
Bier, James A. References Maps of the Islands of Hawaii. Maps of Maui, Kauai, Hawaii,Molokai, and Oahu. University of Hawaii Press. Honolulu: 1988.
Department of Land and Natural Resources. Statewide Trail Map. Early 1970’s.Department ofLand and Natural Resources. March1986. Recreation Map, Island of MauLDepartment of Land and Natural Resources. September 1988. Recreation Map, Island of
Molokai.U. S. Geological Survey. 1950s - 1980s. Map scales 1:24,000, 1:100,000, 1:125,000.
Personal Communications
Abreu, Debbie. 1989. State Trail and Access Inventory, DLNR.Misald, Ed. 1989. The Nature Conservancy of Hawaii.
247

Table 38 Recreational Resources
CODE HSA code; [sland-hydrographic unit- PLUS Number of high quality experiences.stream (system) * Number could not be calculated for
stream systems.STREAM Stream name at mouth
REG Rank assigned to the stream by theOPPORTUNITIES regional committee
C camping H HIkIIig 1 Outstanding 2 SubstantialF Fishing S Swimming 3 Moderate 4 LimitedB Boating U HUnting p PotentialN Nature Study V Scenic Views
p REG Rank assigned to the stream by theregional committee
EXP Number of experiences (opoortunities STATE Statewide Outstanding streamscategorized by Recreational opportunity spectrum. * Number couuld not 1 Outstandingbe calculated for stream systems.
CODE STREAM OPPORTUNITIES j EXLP REG STATE
______ ___________
Kauai
____ _____________
2-1-01 Awaawapuhi HFSPUV 8 1 22-1-02 Honopu SPUV 5 0 22-1-03 Nakeikionaiwi CHFSPUV 10 3 12-1-04 Kalalau CHFSPUV 9 9 12-1-05 Pohalcuao HSPUV 6 1 22-1-06 Waiolaa HSPUV 6 0 22-1-07 Hanakoa CHFSPUV 8 6 12-1-08 Waiahualcua HPUV 6 4 22-1-09 Hoolulu HPUV 6 4 22-1-10 Hanakapiai CHFSPV 8 5 12-1-11 Maunapuluo HPV 4 0 32-1-12 Limahuli HSNV 7 2 22-1-13 Manoa CPUV 5 0 22-1-14 Wainiha R. CHFSBUV 8 3 iF2-1-15 Lumahai R. CHFSBUV 7 2 2P2-1-16 Waikoko V 1 0 32-1-17 Waipa 0 0 42-1-18 Waioli HFSBUV 9 3 iF2-1-19 Hanalei R. CHFSBPUNV 15 8 1P2-1-20 Waileia 0 0 42-1-21 Anini 0 0 42-1-25 Kalihiwai R. CHFSBUV 8 2 22-1-26 Puulcumu V 1 1 22-1-27 Unnamed 0 0 42-1-28 Kilauea CHFSBUV 10 8 iF2-1-29 Kulihaili 0 0 42-1-30 East Waiakalua F 1 1 22-1-31 Pilaa F 1 1 22-1-32 West Waipake F 1 1 22-1-33 East Waipake CHFU 4 3 22-1-34 Moloaa U 1 0 3
_______
248

CODE STREAM OPPORTUNITIES EXP PLUS REG STATE
2-1-35 Papaa 0 0 42-1-36 Aliomanu 0 0 42-2-01 Anahola FSBUV 7 0 22-2-02 Kumukumu 0 0 42-2-04 Kapaa HFSBUV 8 1 12-2-05 Moilceha Canal FS 2 0 32-2-06 Waikaea Canal FSBP 4 0 22-2-08s Wailua System CHFSBPUV 0 0 12-2-10 Kawailoa F 1 0 32-2-12 Hanamaulu CFBPV 5 0 22-2-13 Nawiliwili SPNV 4 0 32-2-14 Puali CFP 3 0 32-2-15 Huleia HFSBPUV 10 3 12-3-01 Kipu Kai CHUV 6 6 22-3-02 Wailcomo HPUV 4 0 32-3-04 Lawai HFSUNV 9 4 22-3-06 Wahiawa HFSUV 7 5 12-3-07 Hanapepe HFSBUV 14 8 if2-4-01 Mahinauli U 1 0 32-4-02 Aakukui U 1 0 32-4-03 Waipao U 1 0 32-4-04s Waimea System CHFSUUBPV * * 12-5-06 Kinekine Ditch 0 0 42-5-07 Kaawaloa 0 0 42-5-08 Nahomalu U 1 1 32-5-09 Kaulaula U 1 1 32-5-10 Haeleele U 1 1 32-5-13 Kauhao U 1 1 32-5-15 Miolii CHFSPUV 9 2 22-5-16 Nualolo CHFSPUV 9 5 1
Oabu j3-1-03 Paumalu 0 0 23-1-04 Kawela 0 0 43-1-05 Oio U 1 0 33-1-06 Maläekahana HU 2 0 33-1-07 Kaliawainui CFSPU 6 0 23-1-08 Wailele GI. 0 0 43-1-09 Koloa Gi. CHSPUV 6 3 13-1-10 Kaipapau SU 2 0 21’3-1-11 Maakua CHFSPV 6 2 13-1-13 Kaluanui CHFSPUV 11 4 13-1-16 Punaluu CHFSPU 8 0 23-1-18 Kahana CHFSBPUNV 14 10 13-1-19 Kaaawa FPU 3 03-1-20 Malcaua HV 2 03-1-21 Unnamed 0 03-2-01 Hakipuu
_________________
0 0 -
________
249
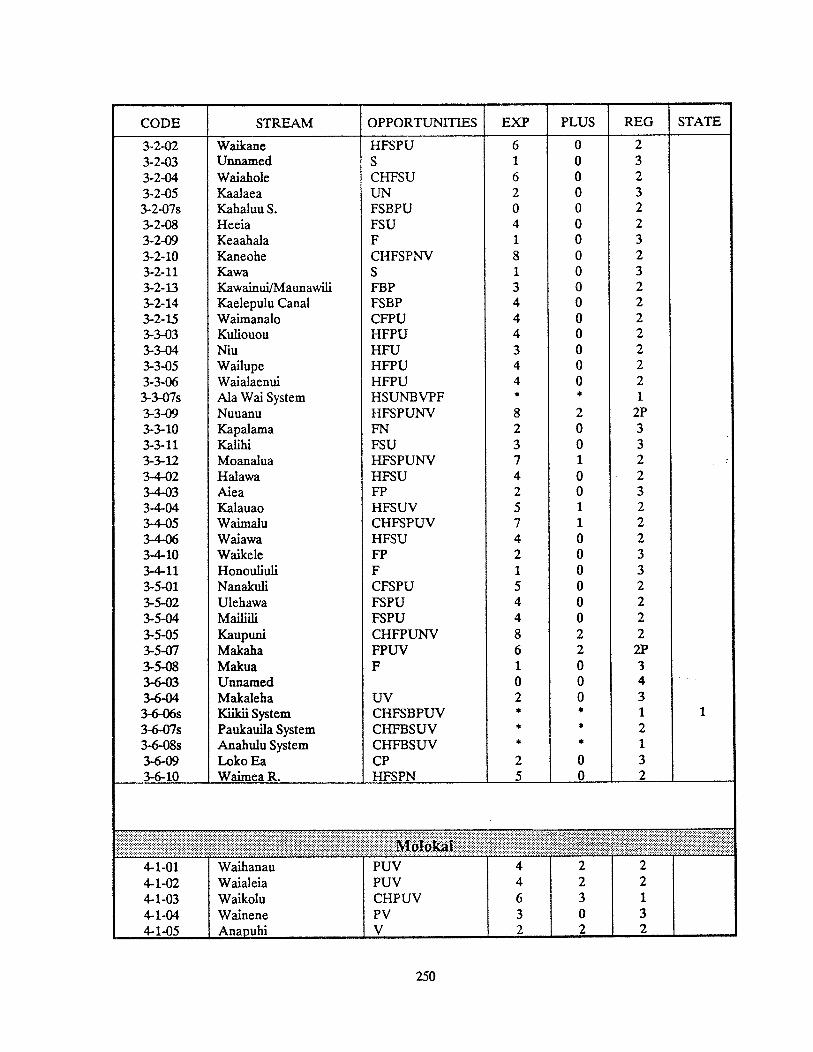
CODE STREAM OPPORTUNITIES EXP PLUS REQ STATE
3-2-02 Waikane HFSPU 6 0 23-2-03 Unnamed S 1 0 33-2-04 Waiahole CHFSU 6 0 23-2-OS Kaalaea UN 2 0 33-2-07s Kahaluu S. FSBPU 0 0 23-2-08 Heeia FSU 4 0 23-2-09 Keaahala F 1 0 33-2-10 Kaneohe CHFSPNV 8 0 23-2-11 Kawa S 1 0 33-2-13 Kawainui/Maunawili FBP 3 0 23-2-14 Kaelepulu Canal FSBP 4 0 23-2-15 Waimanalo CFPU 4 0 23-3-03 Kuliouou HFPU 4 0 23-3-04 Niu HFU 3 0 23-3-OS Wailupe HFPU 4 0 23-3-06 Waialaenui HFPU 4 0 23-3-07s Ala Wai System HSUNBVPF * * 13-3-09 Nuuanu HFSPUNV 8 2 2P3-3-10 Kapalama FN 2 0 33-3-11 Kalihi FSU 3 0 33-3-12 Moanalua HFSPUNV 7 1 23-4-02 Halawa HFSU 4 0 23-4-03 Aiea Fl’ 2 0 33-4-04 Kalauao HFSUV 5 1 23-4-OS Waimalu CHFSPUV 7 1 23-4-06 Waiawa HFSU 4 0 23-4-10 Waikele FP 2 0 33-4-11 Honouliuli F 1 0 33-5-01 Nanakuli CFSPU 5 0 23-5-02 Ulehawa FSFU 4 0 23-5-04 Mailiili FSPU 4 0 23-S-OS Kaupuni CHFPUNV 8 2 23-5-07 Makaha FPUV 6 2 2P3-5-08 Makua F 1 0 33-6-03 Unnamed 0 0 43-6-04 Makaleha UV 2 0 33-6-06s Kiikii System CHFSBPUV * * 13-6-07s Paukauila System CHFBSUV * * 23-6-08s Anahulu System CHFBSUV *
* 13-6-09 LokoEa CP 2 0 33-6-10 Waimea R. HFSPN 5 0 2
___
Molokal4-1-01 Waihanau PUV 4 2 24-1-02 Waialeia PUV 4 2 24- 1-03 Waikolu CHPUV 6 3 14-1-04 Wainene PV 3 0 34-1-05 Anapuhi V 2 2 2
________
250

UkumehanieOlowaluLaniupokuKauaulaKahomaWahikuliHonokowaiKahanaHonokahuaHonoluaHonokohauPoeluaHonananaKahalculoaWaiolai
CODE STREAM OPPORTUNITIES EXP PLUS REG STATE
4-1-064-1-074-1-084-1-094-1-104-1-114-1-124-1-134-1-144-1-154-1-174-1-184-1-194-1-204-1-214-1-224-2-014-2-024-2-034-2-044-2-054-2-064-2-084-2-094-2-104-2-114-2-124-2-134-2-144-2-134-2-16
WalohookaloKeawanuiKaililliPelekunuWaipuHalokuOloupenaPuukaokuWaileleWailauWaiahookaloKahiwaKawainuiPipiwaiHalawaHakaanoPohakupiliHonoulLmalooHonouliwaiWaialuaKainaluHonomuniMapulehuKaluaahaKahananuiManawaiOhiaWawaiaKamaloKawelaPanin
VCCHFSUVVVVVCVCHFSUVCHFSUVVVVCHFSBPUVCFS
SSUvHFSUVSSHV
SUHFUVCHFSUVV
021
1222223131322315S013711200002781
000120222013922173001400000000S21
4331322221122413432133344443213
1
1
1
HV
HFSV6-1-086-1-096-1-106-1-116-2-016-2-026-2-036-2-05
H
ES
0010020
010000
424434
251

CODE STREAM OPPORTUMTIES EXP PLUS REG STATE
6-2-06 Makamakaole HFS 3 1 16-2-07 Waihee R. HFSUV 5 5 16-2-08 Waiehu S 1 0 36-2-09 lao HFSPNV 10 6 16-2-10 Waikapu HSNV 4 2 26-3-01 MaUlco HFSN 4 1 26-3-02 Kuiaha 0 0 46-3-03 Kaupakulua 5 1 0 36-3-04 Manawaiiao 0 0 46-3-05 Uaoa 0 0 46-3-07 Kakipi HS 2 0 36-3-08 Honopou S 1 0 36-3-09 Hoolawa HSV 3 2 26-3-10 Waipio 0 0 46-3-11 Hanehoi 0 0 46-3-12 Hoalua 0 0 46-3-13 Hanawana HS 2 0 36-3-14 Kallua S 1 1 26-3-15 Naillilihaele SV 2 0 36-4-01 Oopuola HUV 5 2 26-4-02 Kaaiea HSV 5 0 26-4-03 Kolea 0 0 46-4-04 Wailcanioi SUV 5 0 26-4-06 Puohokamoa SUV 5 2 26-4-07 Haipuaena SUV 4 0 36-4-08 Punalau 0 0 46-4-09 Honomanu CHFSUV 8 3 16-4-10 Nuaailua HFV 5 1 26-4-11 Piinau HFSUNV 6 5 16-4-12 Ohia FV 2 1 26-4-13 Waiokamilo FSUV 9 3 16-4-14 West Wailuanui FSUV 7 5 16-4-15 West Wailuaiki HFSUV 8 3 16-4-16 East Wailuailci HFSUV 8 3 16-4-17 Kopiliula FSUV 5 0 26-4-18 Waiohue CHFSPV 12 9 16-4-19 Paakea F 1 1 26-4-20 Waiaaka F 1 1 26-4-21 Kapaula F 1 1 26-4-22 Hanawi CHFSUV 12 8 16-4-23 Makapipi HFSUV 6 2 26-4-24 Kuhiwa HFSUV 5 0 26-4-25 Waihole HS 2 0 36-4-26 Manawaikeae HFSV 6 0 26-4-27 Kahawaihapapa HFSV 6 0 26-4-28 Keaailci HFSV 6 0 26-4-29 Waioni HFSV 6 0 26-4-30 Lanikele HFSV 6 0 26-4-31 Heleleikeoha HSUV 5 3 26-4-32 Kawakoe HFSV 6 5 16-4-33 Ulaino HSUNV 6 0 2
252

OO
9O
cO
ccc<
<<
<<
<ct

CODE STREAM OPPORTUNITIES EXP PLUS REG STATE
8-1-27 Waikaloa HV 4 4 2
8-1-28 Waimaile HV 3 3 2
8-1-29 Kulcui HV 3 3 2
8-1-30 Paopao HV 3 3 28-1-31 Waiaalala HUV 4 3 2
8-1-32 Punalulu 0 0 4
8-1-33 Kaimu HV 3 3 28-1-34 Pae HV 3 3 28-1-35 Waimanu CHFSBUV 9 6 18-1-36 Pukoa CHFS 4 1 28-1-37 Manuwaikaalio CHFS 4 1 28-1-38 Naluea CHFS 4 1 28-1-39 Kahoopuu CHFS 4 2 28-1-42 Waipahoehoe CHFS 4 2 28-1-44 Wailoa/Waipio CHFSBV 9 7 1
8-1-45 Lalakea HFSV 4 2 2P8-1-46 Kaluahine Falls V 1 1 28-1-47 Waiulili 0 0 48-1-49 Waipunahoe U 1 0 38-1-50 Waialeale U 1 0 38-1-51 Waikoloa U 1 0 38-1-52 Kapulena U 1 0 38-1-53 Kawaikalia U 1 0 38-1-54 Malanahae U 1 0 38-1-61 Nienie U 1 0 38-1-62 Papuaa U 1 0 38-1-65 Kahaupu U 1 0 38-1-66 Kahawailiili U 1 0 38-1-67 Keahua U 1 0 38-1-68 Kalopa U 1 0 38-1-69 Waikaalulu U 1 0 38-1-70 Kukuilamalamahli U 1 0 38-1-71 Alilipali U 1 0 38-1-73 Kaumoali U 1 0 38-1-76 Waipunalilna U 1 0 38-1-77 Waipunalau GI U 1 0 38-1-78 Paauilo U 1 0 38-1-79 Aamanu U 1 0 38-1-80 Koholalele Gi U 1 0 38-1-81 Kalapahapu GI U 1 0 38-1-82 Kukaiau U 1 0 38-1-85 Kaala U 1 0 38-1-86 Kealalcaha U 1 0 38-1-88 Kupapaulua U 1 0 38-1-89 Kaiwiki U 1 0 38-1-90 Kaula U 1 0 38-2-01 Kaohaoha FUV 5 0 2
8-2-02 Kaawalli HFSUV 7 0 38-2-03 Waipunalei FUV 5 0 38-2-04 Laupahoehoe CFPUV 7 0 28-2-05 Kilau HFSUV 8 2 2
254

CODE STREAM OPPORTUNITIES EXP PLUS REG STATE
8-2-06 Manowaiopae FSUV 6 0 28-2-07 Kuwaikahi FSUV 7 0 28-2-08 Kihalani FUV 5 0 38-2-09 Kaiwilahilahi FSUV 8 2 18-2-10 Haakoa FSUV 6 0 28-2-11 Pahale FUV 6 0 28-2-12 Kapehu 0 0 48-2-13 Paeohe FSUV 6 0 28-2-14 Maulua FSUV 6 1 28-2-16 Pohakupuka FSUV 6 0 28-2-17 Kulanakii 0 0 48-2-18 Ahole FUV 5 0 38-2-19 Poupou FUV 5 0 38-2-20 Manoloa FSUV 7 0 28-2-21 Ninole FSUV 7 1 28-2-22 Kaaheiki V 2 0 38-2-23 Waikolu V 2 0 38-2-24 Waikaumalo HFSPUV 9 1 28-2-25 Kahuku V 2 0 38-2-26 Waiehu FUV 5 0 38-2-27 Nanue HFSUV 8 3 18-2-28 Opea FSUV 7 1 28-2-29 Peleau FUV 6 0 28-2-30 Umauma HFSUV 7 1 28-2-31 Kamaee FSUV 6 0 28-2-32 Hakalau CFSUV 8 3 18-2-33 Kolekole CHFSPUV 13 7 18-2-34 Paheehee FUV 5 0 38-2-35 Honomu V 2 0 38-2-36 Laimi HFUV 7 0 28-2-37 Kapehu FSUV 6 0 28-2-38 Makea V 2 0 38-2-39 Alia V 2 0 38-2-40 Makahanaloa V 2 0 38-2-41 Waimaauou V 2 0 38-2-42 Waiaama FSUV 6 0 28-2-43 Kawainui HFSBUV 10 3 18-2-44 Onomea HFSPUV 9 2 28-2-45 Alakahi HFSPUV 9 1 28-2-46 Hanawi HFSUNV 10 1 28-2-47 Kalaoa FUV 6 1 28-2-48 Aleamai V 2 0 38-2-49 Kaieie FSUV 6 0 28-2-50 Puuokalepa V 2 0 38-2-51 Kaapoko V 2 0 38-2-52 Papaikou V 2 0 38-2-53 Kapue FSUV 6 0 28-2-54 Pahoehoe FSUV 7 0 28-2-55 Paukaa V 2 0 38-2-56 Honolli HFSBPUV 10 2 18-2-57 Maui FSUV 6 0 2
255

CODE STREAM OPPORTUNITIES EXP PLUS REG STATE
8-2-59 Pukihae FSUV 6 0 2
8-2-60 Wailuku R. HFSPUV 13 6 18-2-61 Wailoa R. FIFBPV 6 3 2
8-2-62 Kaahakina 0 0 4
8-4-02 Waiaha 0 0 4
8-5-01 Haloa 0 0 4
8-5-02 Lamimaumau 0 0 4
8-5-03 Waikoloa 0 0 4
256

Table 39 Recreation1 Resource Datasheet
Detractions Note Activity. ROS Category and CommentsOverusePollutedInadequate FacilitiesLitterDiscarded tires, appliances, cars etc.Noise from HeliocoptersAltered Flow/diversion/channeledOther_____________
Local Importance Describe:
Potential Describe what might make this stream outstanding:
Unique Features Describe feature that makes stream outstanding:
257
Island — Cod. — Stream Name —
Urban Country SemiNat Natural* J ? + + /?
Camp 000 000 000 000
Hike 000 000 000 000
Fish 000 000 000 000
Hunt 000 000
Swim 000 000 000 000
Boat 000 000 000 000
Parks 000 000 000 000
ParkNames
Educational Botanical GardensNature +J ? +/ ?Study 000 000
Names
Trail Road Air OceanScenic + J ? + d ? + / ? + v’ ?Views 000 000 000 000
Explain al]. +‘S
Camp
Hike
Fish
Hunt
Swim
Boat
Parks
Nature Study
Iscenic Views
Access Problems Note Activity, ROS Category and CommentsAccess ForbiddenAccess with WaiverOther

Map
7
Reg
iona
lly
Ou
tsta
nd
ing
Rec
reat
iona
lR
esou
rces
KA
UA
Ihi
and
Cod
a-
2
Haw
aii
Str
eam
Ass
essm
ent
Not
e:O
nly
apo
xtio
not
the
tota
lnu
mbc
r0
1st
ream
sar
ede
pict
edon
this
map
.
2-1-
032-
1-04
2-1-
072-
1-10
2-1-
142-
1-18
2-1-
192-
1-28
2-2-
042-
2-08
s2-
2-15
2-3-
012-
3-04
2-3-
062-
3-07
2-4-
04s
2-5-
16
Nak
eiki
onai
wi
Kal
alau
Han
akoa
Han
akap
iai
Wai
niha
R.
Wai
oli
Han
alei
R.
Kil
auea
Kap
aaW
ailu
aR
.Sys
tem
Hul
eia
Kip
uK
aiL
awai
Wah
iaw
aH
anap
epe
Wai
rnea
SN
ualo
lo
ealI
O4

Map
7
Reg
iona
lly
Ou
tsta
nd
ing
Rec
reat
ional
Res
ourc
es
3-1-
09K
oloa
GI.
3-1-
113-
1-13
3-1-
183-
3-07
s3-
6-06
s3-
6-08
s
at
03
10
I.
Maa
kua
Kal
uanu
iK
ahan
aA
laW
aiC
. Sys
tem
Kiik
iiSy
stem
Ana
hulu
Syst
em
07
04
01
OA
FIIJ
P.4
.1Is
land
Co
da
-3
Haw
aii
Str
eam
Ass
essm
ent
num
ber
ofst
am
sa
J[e:
Onl
ya
port
ion
ofth
eto
tal
dep
icte
do
nth
ism
ap.
AIe’al D
iam
on
dH
ead

Map
7
illo
Poin
t
Reg
ional
lyO
uts
tandin
gR
ecre
atio
nal
Res
ourc
es
Pel
ekun
uW
aila
uW
aiah
ooka
loH
alaw
aW
aial
uaK
awel
a
MO
LOK
AT
lata
nd
Co
de
-4
Haw
aii
Str
eam
Ass
essm
ent
Not
e:O
I4a
porh
oeo
fth
eto
tal
num
ber
ofst
ream
sar
cde
pict
edon
thia
map
.
Kah
luP
oin
t
•C
ap
eH
ala
wa
La..
Pain
t
4-1-
03W
aiko
lu4-
1-09
4-1-
154-
1-17
4-1-
214-
2-04
4-2-
15
ICam
alo

6-2-
066-
2-07
6-2-
096-
4-09
6-4-
116-
4-13
6-4-
146-
4-15
6-4-
166-
4-18
6-4-
226-
4-32
6-5-
076-
5-08
6-5-
096-
5-11
6-5-
126-
5-13
6-5-
156-
5-20
6-5-
216-
5-24
Mak
azna
kaol
eW
aihe
eR
.Ta
oH
onom
anu
Pii
naau
Wal
okam
ilo
Wai
luan
ulW
Wad
uaik
iE
.W
ailu
aiki
Wai
ohue
GI.
Han
awi
Kaw
akoe
Wai
lua
Hon
olew
aW
alel
iH
ahal
awe
Puaa
Luu
Ohe
oK
ouko
uai
Ale
lek
Kal
epa
Man
awai
nui
Map
7
07
06
S01
Reg
iona
lly
Outs
tandin
gR
ecre
atio
nal
Res
ourc
es
10
15
01
..
..
0
Isla
idC
od.
-
MA
UI
Haw
aii
Str
eam
Ass
essm
ent
Not
c:O
nty
aport
i000ft
hct
oL
.I1
num
bcro
fhtr
cam
sar
cdC
pIC
ICd
onLh
iam
ap.

Map7
Regionally OutstandingRecreational Resources
8-1-158-1-168-1-178-1-208-1-228-1-238-1-248-1-268-1-358-1-448-2-098-2-278-2-328-2-338-2-438-2-568-2-60
PololuHonokane NuiHonokane IkiHonokeaHonopueKolealiilliOh.iahueaWaiapukaWaimanuWailoa/WaipioKaiwilahilaMNanueHakalauKolekoleKawainuiHonoliiWailuku R.
Up.le ?,at
S.ith r.I.t
HAwAIIIslat Code - $
Hawaii Stream Assessment
Noic: On)yaithe
J number of iueami are
[ depicted oe thie map.
262

Table 40 Resource Assessment Summary
CODE NAME AQU RIP CUL REC CODE
K2-1-01 Awaawapuhi 0 0 S 2-2-062-1-02 Honopu 0 S 2-2-08s2-1-03 Nakeikionaiwi 0 0 2-2-102-1-04 Kalalau 0 S 0 0 2-2-122-1-05 Pohakuao 0 0 S 2-2-132-1-06 Waiolaa 0 S 2-2-142-1-07 Hanakoa 0 0 0 2-2-152-1-08 Waiahuakua 0 0 S 2-3-012-1-09 Hoolulu L S 0 S 2-3-022-1-10 Hanakapiai 0 S 0 0 2-3-042-1-11 Maunapuluo 0 0 M 2-3-062-1-12 Limahuli 0 S 0 S 2-3-072-1-13 Manoa S 0 S 2-4-012-1-14 WainihaR. 0 S 0 0 2-4-022-1-15 LumahaiR. 0 0 0 S 2-4-032-1-16 Waikoko L M 2-4-04s2-1-17 Waipa S 0 0 2-5-062-1-18 Waioli S S 0 2-5-072-1-19 HanaleiR 0 0 0 0 2-5-082-1-20 Waileia M S S 2-5-092-1-21 Anini M 2-5-102-1-25 KalihiwaiR. 0 S S S 2-5-132-1-26 Puuknmu M S 2-5-152-1-27 Unnamed 2-5-162-1-28 Kilauea - M S 02-1-29 Kulihaili S L2-1-30 E.Waiakalua S 0 S2-1-31 Pilaa L S S2-1-32 W. Waipake L S S2-1-33 E. Waipake S S2-1-34 Moloaa L M I2-1-35 Papaa 0
2-1-36 Aliomanu2-2-01 Anahola 0 S S S2-2-02 Kumukumu L
____ ______
KapaaMoikeha CanalWaikaea CanalWailua S.KawailoaHanamauluNawiliwiliPualiHuleiaKipu KaiWaikomoLawalWahiawaHanapepeMahinauliAakukuiWaipaoWaimeaS.Kinekine DitchKaawaloaNahomaluKaulaulaHaeleeleKauhaoMioliiNualolo
CODE HSA Code; island-hydrographic unit- Resource Ranksstream (system) Aquatic. Riparian, Cultural, Recreational resource
ranks. treams with unknown resources are notranked.
STREAM Stream name at mouth 0 OutstandingS SubstantialM ModerateL Limited
NAME AQU RIP CUL REC
0
M
L
0
MM
M
M
00
S
S0
S
0SS
S0
0
S
S0
S
S0
LLLLL0000
0
000000
0MS0MSMM0SMS00MMM0
MMMMS0
3-1-03 Paumalu S S
I 3-1-04 Kawela3-1-05 Oio S M3-1-06 Malaekahana M3-1-07 Kahawainui L S S
a I 3-1-08 Wailele Gl.
263

CODE NAME AQU RIP CUL REC I I CODE NAME AQU RIP CUL REC
3-1-09 Koloa GI. 0 S 03-1-10 Kaipapau L S S3-1-11 Maakua L S 03-1-13 Kaluanui 0 S S 03-1-16 Punaluu 0 S S S3-1-18 Kahana 0 0 0 03-1-19 Kaaawa 0 S3-1-20 Makaua 0 M3-1-21 Unnamed3-2-01 Hakipuu M S3-2-02 Wailcane M S S
4-1-01 Waihanau3-2-03 unnamed S M
4-1-02 Waialeia3-2-04 Waiahole M S S S
4-1-03 Waikolu S3-2-OS Kaalaea M M
4-1-04 Wainene 03-2-07s Kahaluu S. M S S
4-1-05 Anapuhi S S3-2-08 Heeia M 0 S
4-1-06 Waiohookalo 0 S3-2-09 Keaahala M M
4-1-07 Keawanui M3-2-10 Kaneohe M S S
4-1-08 Kailiili 0 M3-2-11 Kawa M
4-1-09 Pelekunu 0 0 0 03-2-13 KaWanlUl/ L 0 0 S 4-1-10 Waipu S MMaunawili
4-1-11 Haloku S3-2-14 L S S 4-1-12 Oloupena S S3-2-15 Waimanalo M S 0 S 4-1-13 Puukaoku S S3-3-03 Kuliouou S 4-1-14 Wailele S S3-3-04 Niu S 4-1-15 Wailau 0 0 03-3-05 Wailupe S 4-1-17 Walahookalo 03-3-06 Waialaenui S 4-1-18 Kahiwa S3-3-07s Ala Wai S. M 0 4-1-19 Kawainui S3-3-09 Nuuanu L S S 4-1-20 Pipiwai3-3-10 Kapalama M 4-1-21 Halawa 0 0 03-3-11 Kalihi M M 4-1-22 Halcaaano M3-3-12 Moanalua 0 S 4-2-01 Pohakupili S3-4-02 Halawa L 0 S 4-2-02 Honoulimaloo 0 M3-4-03 Aiea M 4-2-03 }{onouliwai 0 S3-4-04 Kalauao S 4-2-04 Waialua 0 03-4-05 Waimalu - S 4-2-05 Kainalu 0 M3-4-06 Waiawa M S 4-2-06 Honomuni S S M3-4-10 Waikele L 0 L M 4-2-08 Mapulehu 0 M3-4-11 Honouliuli S L M 4-2-09 Kaluaaha 03-5-01 Nanakuli S S 4-2-10 Kahananui S3-5-02 Ulehawa S 4-2-11 Manawai 03-5-04 Maililli S 4-2-12 Ohia S3-S-OS Kaupuni 0 S 4-2-13 Wawaia S M3-5-07 Makaha M S S 4-2-14 Kanialo L S 0 S3-5-08 Makua M 4-2-15 Kawela L S 0 03-6-03 Unnamed 4-2-16 Paulo M
3-6-043-6-O6s3-6-07s3-6-08s3-6-09.4c-1 C)
MakalehaKiikil S.Paukauila S.Anahulu S.Loko EaWaimea R.
0SSSS0
M0SLM
M0S0MSS
S
0
0SS
SS0MS
264

CODE NAME AQU RIP CUL REC CODE NAME AQU RIP CUL REC
6-4-13 Waiokamilo 06—4—11 ‘.‘ai1iaii,i 0 S S 0
6-1-01 Ukumehame S S M &4-L5 W. Wailuaiki M S 06-1-02 Olowalu S S 6-4-16 E. Wailuaiki M 0 06-1-03 Launiupoku M 6-4-17 Kopillula M 0 S6-1-04 Kauaula L 6-4-18 Waiohue GI. 0 06-1-05 Kahoma M 0 S S 6-449 Paakea M S6-1-06 Wahikuh 6-4-20 Waiaaka S6-1-07 Honokowai L 0 S S 6-4-21 Kapaula L S64-08 Kahana 6-4-22 Hanawi 0 0 06-1-09 Honokahua S 6-4-23 Makapipi 0 0 S6-1-10 Honolua L 0 6-4-24 Kuhiwa S S6-1-11 Honokohau 0 S 0 S 6-4-25 Waihole M6-2-01 Poelua 6-4-26 Manawaikeae S6-2-02 Honanana L 6-4-27 Kahawaihapapa S6-2-03 Kahakuloa 0 S 0 M o-t-s Keaaiki S6-2-OS Waiolai 6-4-29 Waioni S6-2-06 Makamakaole 0 S 0 6-4-30 Lanikele S6-2-07 Waihee R. 0 0 0 6-4-31 Heleleikeoha S S6-2-08 Waiehu S S M 6-4-32 Kawakoe 06-2-09 lao S S 0 6-4-33 Ulaino 0 5 S -
6-2-10 Waikapu 5 0 S S 6-4-34 Kawaipapa S M6-3-01 Maliko S S 6-4-36 Unnamed6-3-02 Kuiaha 6-5-01 Moomoonui S M6-3-03 Kaupakulua S M 6-5-02 Haneoo S M6-3-04 Manawanao 6-5-03 Kapia 0 S6-3-05 Uaoa 6-5-04 Waiohonu S S S6-3-07 Kakipi S M6-3-08 Honopou S M 6-5-05 Wa-
6-3-09 Hoolawa L S S 6-5-06 Alaalaula S S6-3-10 Waipio 6-5-07 Wailua 0 06-3-11 Hanehoi 6-5-08 Honolewa 0 06-342 Hoalua S 6-5-09 Waieli 0 06-3-13 Hanawana S M 6-5-10 Kakiweka 0 S6-3-14 Kailua M S S 6-5-11 Hahalawe 0 06-3-15 Nailiilihaele L M 6-5-12 Puaaluu 0 S 06-4-01 Oopuola S 6-5-13 Oheo Gi. 0 0 5 06-4-02 Kaaiea S 6-5-15 Koukouai 0 06-4-03 Kolea 6-5-16 Opelu S6-4-04 Waikamoi L S 5 6-5-17 Kukuiula 0 56-4-06 Puohokamoa L S S 6-5-18 Kaapahu S6-4-07 Haipuaena L M 6-5-19 Lelekea 0 S6-4-08 Punalau L 6-5-20 Alelele 0 S 06-4-09 Honomanu L 0 0 6-5-21 Kalepa S 06-4-10 Nuaailua L S 6-5-22 Nuanuaaloa S6-4-11 Piinaau 0 0 0 6-5-24 Manawainui 0 — 0 06-4-12 Ohia S S
265

CODE NAME AQU RIP CUL REC CODE NAME AOU RIP CUL REC
8-1-61 Nieme M
________________
8—1—62 Papuaa8-1-03 Kumakua 8-1-65 Kahaupu M8-1-06 Hanaula 8-1-66 Kahawailiili M8-1-07 Hapahapai 8-1-67 Keahua M8-1-08 Pall Akamoa 8-1-68 Kalopa M8-1-09 Wainaia 8-1-69 Waikaalulu M8-1-10 Unnamed Kukuilama- M8-i-il Halawa 0 8-1-70
8-1-12 Aamakao 0 0 S 8-1-71 Alilipali M8-1-13 Niulii 0 M 8-1-73 Kawnoali Gi. M8-1-14 Waikama 0 S 8-1-76 Waipunahina M8-1-15 Pololu 0 0 0 8-1-77 Waipunalau GI. M8-1-16 Honokane Nui M S 0 0 8-1-78 Paauilo M8-1-17 Honokane lId 0 0 8-1-79 Aamanu M8-1-18 Kalele Gi. S 8-1-80 Koholalele GI. M8-1-19 Waipahi 0 S 8-1-81 Kalapahapu GI. M8-1-20 Honokea 0 8-1-82 Kukaiau M8-1-21 Kailikaula S 8-1-85 Kaala M8-1-22 Honopue 0 0 8-1-86 Kealakaha M8-1-23 Kolealiulii 0 8-1-88 Kupapaulua M -
8-1-24 Ohiahuea S 0 8-1-89 Kaiwiki M8-1-25 Nakooko 0 S 8-1-90 Kaula M8-1-26 Waiapuka 0 8-2-01 Kaohaoha S8-1-27 Waikaloa S 8-2-02 Kaawalii 0 S M8428 Waimaile S 8-2-03 Waipunalei M84-29 Kukui S 8-2-04 Laupahoehoe S S8-1-30 Paopao S 8-2-05 Kilau 0 S8-1-31 Waiaalala 0 S 8-2-06 Manowaiopae 0 S8-1-32 Punalulu 0 8-2-07 Kuwikhi 0 S8-1-33 Kaimu S 0 S 8-2-08 Kihalani M8-1-34 Pae S 0 S 8-2-09 Kaiwilahilalii 0 S 08-1-35 Waimanu M 0 0 0 8-2-10 Haakoa S8-1-36 Pukoa S 8-2-11 Paliale S8-1-37 Manuwaikaalio S 8-2-12 Kapehu 08-1-38 Naluea L S 8-2-13 Paeohe S8-1-39 Kahoopuu - S 8-2-14 Maulua 0 S8-142 Waipahoehoe L S 8-2-16 Pohakupuka 0 S8-1-44 WailoalWaipio 0 0 0 0 8-2-17 Kulanakii8-1-45 Lalakea 0 S S 8-2-18 Ahole M8-1-46 Kaluahine Falls 0 S 8-2-19 Poupou M8-147 WalUhh 0 8-2-20 Manoloa 0 S8-1-49 Waipunahoe 0 M 8-2-21 Ninole 0 S8-1-SO Waialeale 0 M 8-2-22 Kaaheiki M8-1-51 Waikoloa L 0 M 8-2-23 Waikolu M8-1-52 Kapulena 0 M 8-2-24 Waikaumalo L S S8-1-53 Kawaikalia 0 M 8-2-25 Kahuku M8-1-54 Malanahae —
— 8-2-26 Waiehu — M
266

CODE NAME AQU RIP CUL REC
8-2-278-2-288-2-298-2-308-2-318-2-328-2-338-2-348-2-358-2-368-2-378-2-388-2-398-2-408-2-418-2-428-2-438-2-448-2-458-2-46
NanueOpeaPeleauUmaumaKamaeeHakalauKolekolePaheeheeHonomuLnilKapehuMakeaAliaMakahanaloaWaimaauouWaiaaniaKawainuiOnomeaAlakahiT4nw
000S
0000
0
LM
S0
S
SS
S
0SSSS00MMSSMMMMS0SSS
CODE NAME AQU RIP CUL REC
8-2-47 Kalaoa S8-2-48 Aleamai M8-2-49 Kaieie L S8-2-50 Puuokalepa M8-2-51 Kaapoko 0 M8-2-52 Papaikou M8-2-53 Kapue M S S8-2-54 Pahoehoe S S8-2-55 Paukaa M8-2-56 Honolli 0 0 L 08-2-57 Mail 0 S8-2-59 Pukihae S S8-2-60 Wailuku R. M 0 08-2-61 Wailoa R. S 0 S8-2-62 Kaahakini8-4-02 Waiaha8-5-01 Haloa8-5-02 Lamimaumau8-5-03 Waikoloa L 0
267

Candidate Streams for Protection


Candidate Streaus for Protection
Identification ofstreams eligiNe for preservation and protection is the primary mandateof the Hawaii Stream Assessment. There are various ways or combinations of ways toapproach the selection of streams for a protection program. The six included here weredeveloped by the study team and others and revised based on public comment.
Approach 1: All Streams with Outstanding ResourcesThe broadest approach to the selection of candidate streams for protection is to include
all those ranked Outstanding n any resource area. This would result in almost half ofHawaii’s streams being so identified. The results of this approach are listed in Table 40Resource Assessment Summary. -
Approach 2: Streams with Diverse or Blue Ribbon ResourcesA more discriminating approach to the identification of streams for protection is to
include streams that meet one of two criteria:
o Diversity of resources
o Blue Ribbon resources
Diversity of Resources
Presence of a diversity of resources as identified by the four resource assessments--Aquatic, Riparian, Cultural, Recreational---shouldbe considered candidates for protection. Those streams which were ranked Outstanding (or, in the case of Recreation,regionally Outstanding) in at least three resource areas are considered high in diversityof resources (Table 40).
Blue Ribbon ResourcesBlue ribbon resources stand out among the best in the resource area. The four resource
committees generally defined Outstanding broadly, which resulted in a large number ofstreams ranked Outstanding. The study team fuçther discriminated among these Outstanding streams by using the committee criteria in a more selective way. Althoughcommittee information was used, these blue ribbon criteria were not developed by thecommittee members.
Aquatic blue ribbon resources: The Aquatic Resource Committee considered a streamthat met any one of five criteria outstanding: Lentipes at least common; spawning byselected native fish (NG1) observed; abundant populations of any one of the four NOl
269

aquatic species observed; all four NG1 species present; and good native species diversityand habitat. A stream which fulfills any three of these criteria was considered blue ribbon.
Riparian blue ribbon resources: Criteria used by the Riparian Resource Committeeincluded threatened and endangered birds, waterbird recovery habitat, rare plants andcommunities, protected areas, wetlands and native forest. These resources were ratedusing a point system. Outstanding streams were those that received 6 or more points.A score of 7 or more was required for riparian blue ribbon stream status.
Cultural blue ribbon resources: Standards used for cultural blue ribbon streams are:very high archaeological sensitivity over 50 acres of taro; or a combination of predictablyhigh density and sensitivity, many known archaeological sites, taro and historic sites.
Recreational blue ribbon resources: The recreational assessment included camping,fishing, boating, nature study areas, parks, hiking, swimming, and scenic views. TheRecreational Resources committee selected those 18 streams which it considered to beof statewide importance based on evaluation by regional committees on each island.
The results of the diversity and blue ribbon approach are shown in Table 1.
Approach 3: Streams with High Quality Natural ResourcesAnother approach to identifying candidate streams for protection is to consider only
natural values, aquatic and riparian resources. Outstanding values in these two resourceareas suggest that a stream may be relatively pristine. Eighteen streams meeting these‘Kapu” criteria can be identified from Table 1. Since the HSA is based on existinginformation, exceptional streams with little documentation will be missed by this approach. For example, with further studies, Wailau, on Molokal, and Kahakuloa, onMaui, are likely to qualify as Kapu Streams.
Proposed criteria are:o Outstanding for Riparian and Aquatic resources
OR0 Blue ribbon Aquatic Resources
Approach 4: Aquatic Resource DistrictsThere is some evidence that clusters of streams are biologically very important and
may provide values and habitats that single isolated streams do not. Protection of areaswhich have a high concentration of outstanding streams will provide a larger naturallandscape; No attempt has been made to identify such districts.
Approach 5: Free Flowing StreamsAnother approach to the identification of outstanding streams is to start with an
inventory of free flowing (free of dams, diversions, or channelization) or stream segments (not identifled)and protect those with the most outstanding values using any ofthe above approaches.
270

Approach 6: National Wild and Scenic RiversTo be eligible for designation under the federal Wild and Scenic Rivers Act a stream
must meet strict standards. Once designated, the streams are afforded substantialprotection from federal actions that is not possible through state action alone. Hawaii’sstreams might be reviewed for eligibility and possible nomination.
271

(‘fl
flp
DIA
K
)DT
VR
RS
ITV
R1T
JP.R
IRR
ON
2-1-
04K
alal
auA
qCuR
cA
gCu
2-1-
07H
anak
oaA
qCuR
c
2.1-
10H
anak
apia
iA
qCuR
cA
qCuR
c2-
1-11
Mau
napu
loa
AqC
uA
qCu
2.1-
14W
aini
haA
qCuR
cA
g2-
1-15
Lum
ahai
AL
IRPC
uA
qRp
2-1-
18W
aiol
iR
eR
c2-
1-19
Han
alei
AqR
pDuR
cA
gRpC
uRe
2-2-
418s
Wai
lua
S.R
pDuR
cR
pDuR
c
2-2-
15H
ulei
aA
qRpR
cR
p
2-3-
07H
aiaa
pcpe
RpC
uRc
2-4-
04s
Wai
mca
S.R
pCuR
cR
pRc
3-1.
18K
ahan
AoR
nCuR
eC
uRc
3-2-
13M
auna
wili
RpC
uRc
Cu
34-0
2H
alaw
aC
uC
u
3-5-
05K
aupu
niC
u
3.6-
04M
akal
eha
Ri,
,;
4-1-
01““
Cu
Cu
4-1-
03W
aiko
luA
qRc
Ag
4-1-
09P
elek
unu
AgR
pCuR
eA
qCu
CO
DE
STR
EA
MD
IVE
RS
ITY
BL
UE
RIB
BO
N
4-1.
15W
aila
uA
gCuR
cC
uRe
4-1-
21H
alaw
aA
gCuR
cA
gCuR
e4-
2-fl
4W
aiI
uC
uRc
Re
6-2-
07W
aihe
cC
uRe
6.2.
08W
aleh
uC
u6-
2-09
lao
Re
Re
6-2-
10W
aika
puR
p6-
4-11
Pii
naau
ftgR
pRc
MC
u64
-18
Wai
ohuc
01.
RcA
gA
g
6-4-
22H
an
aA
gRpR
cA
gRp
6-5-
13O
heo
GI.
AqR
pRc
AqR
c
I/
/
8-1-
11H
aLaw
aC
uC
u
8-1.
15P
olol
uR
pCuR
cR
pCu
8-1-
16H
onok
ane
Nui
CuR
eR
e
8-1.
35W
aim
anu
RpC
uRe
RpC
uRc
8-1-
44W
ailo
a/W
aipi
oA
qRpC
uRc
RpC
u
8-1-
45L
alak
eaA
gCu
CuR
e
8-2-
33K
olek
ole
AgR
eR
e
8-2-
56H
onol
iiA
gRpR
eA
g8-
2-60
Wai
luku
RpR
cR
e
8-5-
03W
aiko
loa
Cu
Cu
Tab
le1
Can
dida
teS
trea
ms
for
Pro
tect
ion
Cod
eH
SA
Str
eam
Cod
eIs
land
-Hyd
rogr
aphi
cU
nit-
Str
eam
Str
eam
Str
eam
Nam
e
(App
roac
h2
Res
ults
:S
trea
ms
that
met
eith
erth
edi
vers
ity
orbl
ueri
bbon
crit
eria
)
Div
ersi
tyof
reso
urcc
sTo
qice
tdiv
ersi
tycr
iter
iaa
stre
amm
ust
beou
tsta
ndin
gin
3or
mor
ere
sour
cear
eas
Aq
Aqu
atic
Cu
Cul
tura
lR
eR
ecre
atio
nR
pR
ipar
ian
Blu
eR
ibbo
nR
esou
rces
:T
hefe
wve
tybe
stre
sour
ces
Aq
Aqu
atic
:M
et3
out
of5
crit
eria
for
outs
tand
ing
Cu
Cul
tura
l:V
ery
high
sens
itiv
ity,
high
dens
ity,
pred
icta
bili
tyan
dse
nsiti
vity
,oro
ver
50ac
res
ofta
rocu
ltiv
atio
n.R
eR
ecre
atio
n:S
tate
wid
eou
tsta
ndin
gst
ream
sR
pR
ipar
ian:
Met
scor
eof
7.
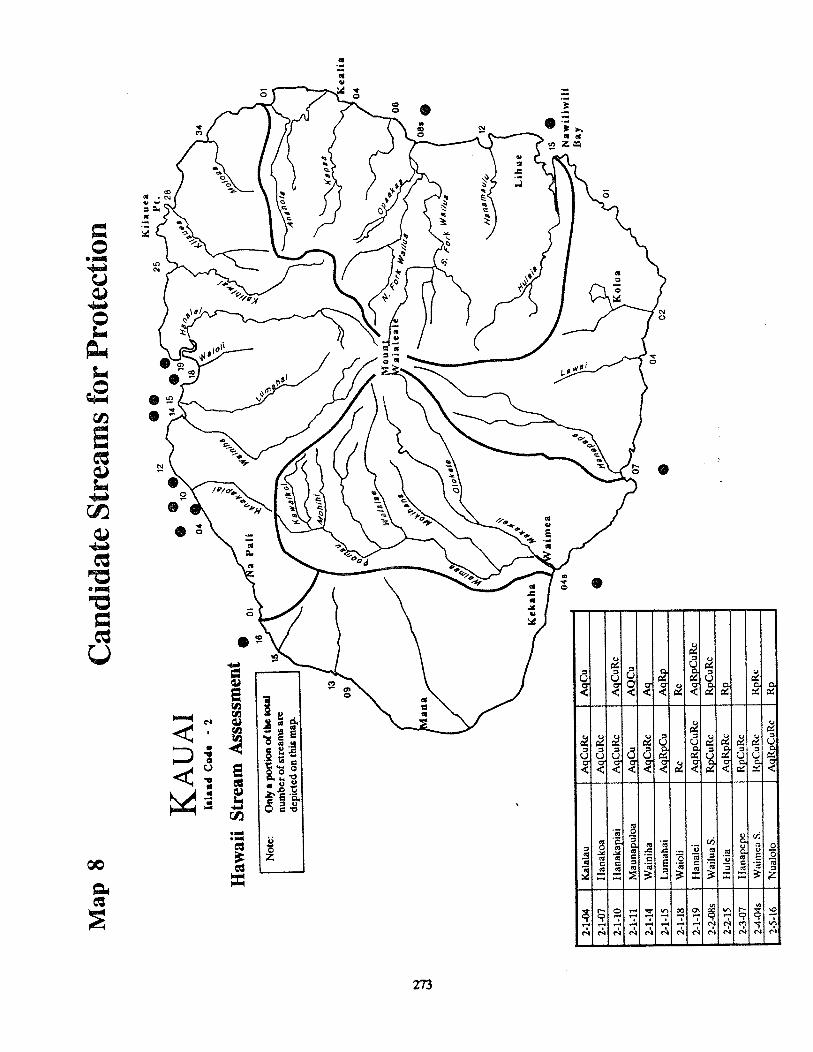
Not
e:O
nly
apo
rtio
nof
tbc
tota
l
nu
mb
erof
stre
ams
are
depi
cted
onth
ism
ap.
Can
dida
teS
trea
ms
for
Pro
tect
ion K
ilsu
es
12•
•25
P1.
•14
••
28
19H
a,,
04/ I
•1._
16P
ali
Haw
aii
Str
eam
Ass
essm
ent
01a
-.
1501
0I0
0ih
eali
a13
0904
aia
leale
064l/u
an
a+0
08s
clo
t”F
o,K
Wa,
,,,.
pH
an$m
a1,,
12
Kek
ah
aL
ihue
-.
aim
ea
15
04s
Naw
iliw
ili
__
______________
___________
______________
Bay
__
_______________
__
__
__
__
__
__
__
__
__
__
__
__
__
_
•0l
Kolo
a
07
04
•02
24-0
4K
alal
auA
gC
u&
AqC
u
2-1-
07H
anak
oaA
gCuR
c
2-1-
10ll
anak
apia
iA
gCuR
cA
gCuR
c
2-1-
11M
auna
pulo
aA
gCu
AQ
Cu
2-1-
14W
aini
haA
gCuR
cA
g
2-1-
15L
umah
aiA
gRpC
uA
gRp
2-1-
18W
aiol
iR
cR
c
2-1-
19H
anak
iA
gRpC
uRc
AgR
pCuR
c
2-2-
08s
Wai
lua
S.R
pCuR
cR
pCuR
c
2-2-
15ll
ulci
aA
gRpR
cR
p
2-3-
07ll
anap
epe
RpC
uRc
2-4-
04s
Wai
rnca
S.R
pCuR
cR
pRc
2-5-
16N
ualo
loA
gRpC
uRc
Rp
Map8
KA
UA
Ili
land
Cod
.-
2

Map8
Can
dida
teS
trea
ms
for
Pro
tect
ion
I-la
wni
lS
trea
mA
sses
smen
t
num
ber
ofst
ream
sar
cdcp
iCtC
do
nth
ism
ap.
3-1-
18E
4h
na
AaR
Cu
&C
uRe
3-2-
BM
auna
wil
iR
pCuR
cC
u3-
4-02
Hal
awa
Cu
Cu
3-5
-0K
aupu
niC
u3-
6-04
Mak
akha
Rp
3-6-
06K
iiki
iS.
Re
Kal
inl
03
Ks
ens
Poin
t
07
O.A
.1-{1
JB
arb
ers
Po
int
Isla
nd
Co
de
-3
1211
Hay
111a
mon
itIIrd

Map
8C
andi
date
Str
eam
sfo
rP
rote
ctio
n
4-1-
01W
aiha
nau
Cu
Cu
4-1-
03W
aiko
luA
gRc
Ag
4-1-
09P
elek
unu
AgR
pCuR
cA
gCu
4-1-
15W
aila
uA
gCuR
cC
uRc
4-1-
21H
alaw
aA
gCuR
cA
gCuR
c
4-2-
04W
aial
uaR
cCu
Rc
MO
LO
KA
IIs
lan
dC
od
e-
4
Haw
aii
Str
eam
Ass
essm
ent
Not
e:O
nly
apo
rtio
nof
the
tota
lnu
mbe
rof
stre
ams
arc
depi
cted
onth
ism
ap.
lIio
Poin
tK
ah
iuP
oin
t
Cap
e•
Kam
ala

Map8
Can
dida
teS
trea
ms
for
Pro
tect
ion
MA
UI
Tal
aud
Co4.
-
Haw
aii
Str
eam
Ass
essm
ent
Not
e:O
nly
apo
thon
ofth
eto
tal
num
ber
of
stre
ams
arc
depi
cted
onth
ism
ap.
Kean
ae
2223
24
13
1715
•
07
06
08•
01
15
01
liana
6-2.
07W
aih
eeA
gC
uR
cC
uRc
6-2.
08W
aieh
uC
u
6-2-
09la
oR
cR
6-2-
10W
aika
puR
p
64
-11
Pii
naao
AgR
cRp
AgC
u
6-4-
18W
aioh
ue01
.R
cAg
Ag
6-4-
22H
anaw
iA
gR
pR
cA
gR
p
6-5-
13O
heo
GI.
AgR
pR
cA
gRc
6-5-
24M
anaw
ainu
iA
gC
uR
c
03
11

Map 8 Candidate Streams for Protection
HAWAIIIsland Code - 8
8-1-11 Hatawa Cu Cu
8-1-15 Pololu RpCuRc RpCu
8-1-16 Honokanc Nui CuRe Rc
8-1-35 Waimanu RpCuRe RpCuRc
8-1-44 WailoalWaipio AgRpCuRe RpCu
8-145 Lalakea AgCu CuRe
8-2-33 Kolekole AgRe Rc
8-2-56 1-Ionolii AgRpRc Ag
8-2-60 Wailuku RpRc Re
8-5-03 Wajkoioa Cu Cu
Hawaii Stream AssessmentNote: Only a portion of the total
number of streams aredepicted on this map.
Upolo Point
55
7687
02
Honunai
South Point
m


Future Actions


Future Actions
The Hawaii Stream Assessment was a two-year project designed to bring relevantstream-related information together in one place. This has been accomplished to thedegree possible given the project limitations. Through this process a number of possiblefuture actions have been identified and recommended:
o maintain and enhance the HSA database;o develop long-term stream management strategies;o institute Interim actions to preserve management options.
These recommended actions reflect study team opinion. While they are based on HSAfindings, there are other actions that could be developed to help protect and manageHawaii’s stream resources. -
Maintain and Enhance the Hawaii Stream AssessmentThe Hawaii Stream Assessment is an important building block for use in long-term
stream management. However, the information needs to be refined, periodically updated and expanded to ensure its ongoing usefulness. The following CWRM or DLNRactions can help achieve this goal.
° Initiate studies, workshops and development ofmaster plans.
Monitoring, It is suggested that the CWRM ask the U.S. Geological Survey (USGS)to take the lead in a Monitoring Network Analysis. The purpose of this analysis shouldbe to identify objectives of the state’s water flow and quality monitoring, design aprogram based on these objectives and describe funding to implement it. Participantsshould include the appropriate DLNR divisions, especially DAR, DWRM, DOFAW,Department of Health, US. Army Corps of Engineers, U.S. Fish and Wildlife Service,-and Soil Conservation Service, Hawaiian interests, major water users, county waterdepartments, and environmental groups.
Watershed Management. As the major landowner and custodian of conservation landin Hawaii, the DLNR might initiate a watershed roundtable to identify problems anddevelop a research and management plan for watersheds. Besides appropriate DLNRdivisions, participants might include, the Department of Health, the U.S. Soil Conservation Service and U.S. Fish and Wildlife Service, and other major landowners.
Aquatic Studies. The Division of Aquatic Resources, DLNR, should establish aprotocol for updating the aquatic resource database. The DAR might also take the leadin developing a five-year master plan for aquatic research in cooperation with others
279

interested in study and management of this resource, such as U.S. Fish and WildlifeService, U.S. Army Corps of Engineers and University of Hawaii.
The CWRM might urge the USFWS to take the lead, with water development companies and appropriate agencies, in a cooperative research project to quantify biologicalimpacts of stream restoration and stream dewaterment.
Hydroelectric Masterplan. The CWRM should commission a statewide hydroelectricmasterplan which balances river protection with hydroelectric power.
o Dedicate a CWRM staff position specifically and exclusively toconservation. The responsibilities of the “stream keepe? wouldinclude:
a. Maintain HSA database by periodically updating data from DLNR divisions, andother appropriate state and federal agencies;
b. Prepare reports with a conservation point of view for CWRM; andc. Sponsor and encourage public involvement in stream conservation.
o Request the Office of State Planning to make streams a theme of the.
state Geographic Information System.While the HSA database will be useful in helping OSP locate stream data, it does not
contain geographic information.
Develop Long-Term Stream Management Strategieso Adopt a Hawaii Stream Policy which provides that the important
natural, cultural and recreational values of Hawaii’s streams areprotected.
The state of Hawaii should adopt a stream management policy which states the intentof the citizens of Hawaii to have their stream resources managed so that the natural,cultural and recreational values of those streams are either unimpaired or enhanced byfuture actions affecting stream resources. This does not preclude ‘development” ofstream resources but it implies that any action which is detrimental to a stream must beaccompanied by some other action which enhances the stream resources.
o Establish a Hawaii Stream Plan with general guidelines and aProtected Streams Program.
The implementation of the Hawaii Stream Policy would be through the Hawaii StreamPlan, which would consist of several programs including General Guidelines for allstreams and several levels of protection for designated streams.
280

General Guidelineso Development that affects a stream should be reviewed with reference to HSA
resource assessments and special areas. A checklist such as Figure 4 should bedeveloped to facilitate this review.
o Offstream water development should be balanced with preservation of natural,cultural and recreational values.
o Appropriate types of action to consider for watershed management includestream corridor setbacks, increased floodplain protection, restrictions onchannelization, noxious species control, and no net loss of wetlands and streamhabitats.
o Minimum instream flows should take aquatic biota into account.o Control of non-point source Rollution from the entire watershed induding urban
areas should be given high pnority.o Each island and urban population center should have publicly accessible
stream-related recreation.o Streams with substantial recreational use should be targeted for water quality
enhancement.
Protected Streams ProgramNow that a preliminary identification of streams appropriate for protection has been
completed, a stream protection program should be established. HSA developed sixapproaches toward the identification of streams to be considered for protection. Theseare outlined in the Candidate Streams for Protection chapter. A process by which thepublic can nominate additional streams for consideration for protection needs to bedevised.
The study team analyzed the six approaches and recommends the Commission considerthree of these in combination to form a Hawaii State Protected Streams Program:Approach 2 (Diverse or Blue Ribbon Resources), Approach 3 (High Quality NaturalResources), and Approach 4 (Aquatic Districts). Approach 6 (National Wild andScenic Rivers) is recommended where it is deemed appropriate to protect the State fromFederal action.
Approaches 1 and 5 are not recommended. Using Approach 1 (all streams with anOutstanding value in any resource area), about half of all streams would be eligible forprotection. The study team rejected this approach as lacking in sufficiently discriminat-lug criteria to provide the basis for a meaningful stream protection program. UsingApproach5 (all free-flowing streams with the most outstanding values) eliminates almostall of Hawaii’s largest streams, many of which have been identified as having the mostoutstanding values, from consideration for protection. The study team rejected thisapproach being too discriminating to provide the base for a meaningful stream protection program.
Approach 2 identifies streams which are important based on the diversity of resourcesor blue ribbon values. These should be the focus for a range ofmanagement and planningactivities. Maiagement decisions should be based on natural resource conservationstandards and priority given to instream values. This would include discouraging chan
281

nelization, hydroelectric development and diversions which would detract from naturalvalues, and when allowed, a sufficient instream flow should be required.
Approach 3 identifies streams with outstanding aquatic and riparian values whichshould receive full watershed protection (from the mountains to the ocean) as Kapustreams. Using the strict criteria developed in approach 3 very few streams qualify, noneon Oahu. We recognize that the quality of Oahu’s resources have been severelydegraded and therefore it may be unfair to compare them with the stream resources onother islands. However, new criteria could be developed comparing Oahu’s streamsonly, so that at least one stream on that island could be considered for Kapu status.
Restrictions placed on Kapu streams should include all man-made modifications,including alteration for agricultural use, hydroelectric, storage, diversion, aquaculture,channelization. Span bridges could be considered as appropriate only if they do notinterfere with the free flow of the stream. Development in the immediate watershedwhich would produce non-point or point source pollution or which would deplete thesurface water should be discouraged. Control of noxious species in the watershed wouldbe emphasized. Stream corridor maintenance would receive high priority. RestrictiveState zoning might be an appropriate level of protection for Kapu streams and theirassociated watersheds. -
Approach 4 discusses the concept of aquatic stream districts. Aquatic biologists thinkthat clusters of streams may provide values and habitats that single isolated streams donot. Stream districts might be identified and management for aquatic resourcesdeveloped.
Approach 6 suggests that streams appropriate for protection under the National Wildand Scenic Rivers Act be identified. CWRM should consider determining which streamsare eligible and recommending them for designation.
Institute Interim Actions to Preserve Management OptionsSeveral measures can be taken to preserve management options until long-term Stream
management policies are developed.
o Declare a moratorium on development of significant streams.- Development of a number of streams with significant resources is proposed or underconsideration. To preserve management options candidate Kapu (approach 3) andpossibly blue ribbon streams (approach 2) could be given immediate protection.
o Use HSA General Guidelines in the interim, especiaflyo Development which effects the stream should be reviewed with reference to
HSA resource assessments and candidate streams for protection areas. Achecklist such as Figure 4 should be developed to facilitate this review.
o Offstream water development should be balanced with preservation of natural,cultural and recreational values.
282

o Consider stream corridor setbacks, increased floodplain protection, restrictionson channelization, noxious species control, and no net loss of wetlands andstream habitats.
283

Fig
ure
4.S
trea
mIm
pac
tR
evie
wPh
ysic
alC
hara
cter
isti
csP
roje
ctId
enti
fica
tion
Num
ber:
Pro
pose
dby
:
Pro
ject
Des
crip
tion
:A
ddre
ss:
Con
tinuo
usor
Inte
rrup
ted
flow
:
Mod
ific
atio
ns
Phon
e:D
iver
sion
s:
Con
tact
:C
hann
eliz
atio
n:
Qua
dM
ap:
Hyd
roel
ectr
ic:
Str
eam
,tr
ibut
arie
s,an
dH
SAS
trea
mC
ode:
Mon
itori
ng
Oth
erst
ream
saf
fect
ed:
Wat
erQ
ualit
y:
(fil
lo
ut
afo
rmfo
rea
chst
ream
affe
cted
)G
agin
g:
Sum
mar
yan
dR
ecom
men
dati
ons
(gag
en
um
ber
,ac
tive
,fl
ow, y
ears
of
reco
rd,
div
erte
dab
ove
gage
etc.
)
Ism
onito
ring
need
ed?
Impo
rtan
ceof
stre
amfr
oma
stat
ewid
e,is
land
wid
ean
dhy
drog
raph
icun
irjg
ener
alar
eape
rspe
ctiv
e.S
peci
alA
reas
(Lis
tea
chon
e)
Park
s
Add
itio
nalc
omm
ents
:H
abita
ts--
pres
erve
s,re
serv
es,r
efug
es, e
tc.
Est
uary
/Em
baym
ent
Rec
omm
enda
tion
s:W
etla
nds
Des
igna
ted
Are
a
Res
earc
h,ed
ucat
ion,
natu
rest
udy
His
tori
csi
tes/
dist
rict
s
DL
NR
Staf
fR
evie
wer
and
date
ofre
view
Wat
erfa
lls

Aquat
icR
ecre
atio
n
Rea
son
for
rank
HSA
Ran
k
Dat
aQ
ualit
y
Rev
ised
Ran
kR
easo
n
Sign
ific
ance
ofth
ere
sour
ce
Inth
eS
tate
On
the
isla
nd
With
inth
ehy
drog
raph
icun
itor
gene
ral
area
Pot
enti
alto
enha
nce
orre
esta
blis
hth
ere
sour
ce
Poss
ible
effe
cts
this
deve
lopm
ent w
illha
veon
the
reso
urce
Oth
erco
nsid
erat
ions
Cult
ura
l
Rea
son
for
rank
HSA
Ran
k
Dat
aQ
ualit
y
Rev
ised
Ran
kR
easo
n
Sign
ific
ance
ofth
ere
sour
ce
Inth
eS
tate
On
the
isla
nd
With
inth
ehy
drog
raph
icun
itor
gene
ral
area
Pot
enti
alto
enha
nce
orre
esta
blis
hth
ere
sour
ce
Poss
ible
effe
cts
this
deve
lopm
entw
illha
veon
the
reso
urce
Oth
erco
nsid
erat
ions
Rea
son
for
rank
HSA
Ran
k
Dat
aQ
ualit
y
Rev
ised
Ran
kR
easo
n
Sign
ific
ance
ofth
ere
sour
ce
Inth
eSt
ate
On
the
isla
nd
With
inth
ehy
drog
raph
icun
itor
gene
ral
area
Pot
enti
alto
enha
nce
orre
esta
blis
hth
ere
sour
ce
Poss
ible
effe
cts
this
deve
lopm
ent w
illha
veon
the
reso
urce
Oth
erco
nsid
erat
ions
HSA
Ran
k
Dat
aQ
ualit
y
Rev
ised
Ran
k
Sign
ific
ance
ofth
ere
sour
ce
Inth
eSt
ate
Rip
ari
an
Rea
son
for
rank
Rea
son
On
the
isla
nd
With
inth
ehy
drog
raph
icun
itor
gene
ral
area
Pot
enti
alto
enha
nce
orre
esta
blis
hth
ere
sour
ce
Poss
ible
effe
cts
this
deve
lopm
ent
will
have
onth
ere
sour
ce
Oth
erco
nsid
erat
ions


Database Overview

Database OverviewThe Hawaii Stream Assessment database is a compilation of information collectedduring the Hawaii Stream Assessment project. The database developed throughout theproject and is expected to be expanded and updated periodically by the National ParkService’s Cooperative Park Research Unit and the state Department of Land andNatural Resources.
Information was entered into the database using dBase 1V and can be made availableto users on diskettes in either dBase 1V or ASCII formats. A detailed database guide,“The 1990 Guide to the Hawaii Stream Assessment Database,” accompanies each set ofdiskettes. The guide describes the fields in the databases, defines any codes used, andnotes the bibliographic source. Related information is cross-referenced whenever appropriate. -
This section is intended to give the reader of this technical report an overview of thecontents of the database. Generally, each resource area has at least two databases, onevery detailed and usually one summarized with assessment data. The physical data iscontained in many more databases. The databases are entirely relational, primary linkedby the stream code. The Master.dbf includes all stream codes found in every databaseand must be used to link any other database files together (Figure 5).
Physical Characteristics
Master.dbf This .dbf contains all of the stream codes used in any of the otherdatabases. This includes the codes and names for tributaries and streams that werethought to be perennial at one time. The “finallist” field indicates those streams used inthe assessment processes. This database should always be used to link any other twodatabases together. See the “1990 Guide to the Hawaii Stream Assessment Database”br more information.
Dbasic.dbl Contains name, tributary location, map, size, and perennial stream classification information.
Gaging.dbf All USGS gaging data such as gage number, average and median flow,discharge data type, diversions above gaging station, years and quality of record andnon-USGS predicted natural median flow are included in this database. The gagenumber field links this database with the Ditches.dbf.
Dltches.dbf This database contains much of the same information contained in thegaging database but instead ofbeing stream coded, it is associated with a ditch. The gagenumber links this database with the gaging database.
287

Hydro.dbf The hydroelectric developer and project name and the associated ditch orstream name can all be used to identify a proposed or existing hydro project. The annualelectrical output, the potential electrical capacity, and the average and median flows arerecorded when available.
Modiflcations.dbf Channelization type and length compose most of this database.Dam height and impound capacity and the presence of diversions are also noted.
SpeclaLdb( Special areas encompass estuaries, embayments, wetlands, parks, reserves, preserves, managed areas, research and educational sites, and those areas withspecial designations.
Supply.dbf Water supplied by streams for municipal and plantation uses is outlinedhere. The names of the sugar companies using stream water are also given.
WQdbf Water quality information type, data of collection and the source of thatinformation are listed here.
Aquatic Resources
Aq.dbf This .dbf contains detailed aquatic data. For each stream, the scientific and/orcommon name of the species observed, the abundance and year of observation are listed.This .dbf contains more than 1,000 records, as there are often several records for onestream.
Aqassess.dbt This .dbf contains summary data for all streams as well as some detailedinformation on native species. Summary data includes number of native and introducedspecies, the diversity of species, the quality of the information and the HSA rank.
Cukur Resources
Archaeo.dbf All of the archaeological information in this database was provided bythe state HistoricPreservation Division. It includes the number of sites, amount ofswveycoverage, ability to predict what sites might be found in a location, the significance oflow density sites, and the overall sensitivity of a stream to development.
Hlstoric.db( This database contains all of the historic information collected. Thepresence of national and state historic register sites are noted. Bridge name andinventory rank (or score if one was assigned) are also included.
Modern.dbf The acreage and number ofpeople who declare they grow taro with waterfrom a particular stream and the estimated acreage of taro cultivated are in this .dbf.
Recreation Resources
Rec4hf This ifie contains data on the quality and recreation opportunity spectrumcategory for camping, hiking, swimming, boating, fishing, parks and hunting experiences.The quality of educational programs and the quality and vantage point for scenic viewsare also included, as are some data for intermittent streams.
Recassess.db( This .dbf contains summary data for all streams including those laterdeleted from the assessment process. The number of high quality experiences and totalexperiences, the activity types, HSA regional rank, and HSA state ranks are included.
Recmemo.dbf All detractions, access problems, unique features and high qualityopportunities are described in memo fields in this database.
288

Riparian
Rip.dbf Wetlands, recovery habitat, protected riparian areas, percent of native forest,and detrimental organisms are listed.
Plants.dbf All rare stream-related plants and their Nature Conservancy HawaiiHeritage Program database element code, the general location the plant was observed,and the last year seen are indicated. This .dbf contains one record for each plant observedon a stream.
Blrds.db( All threatened and endangered stream-dependent and stream-relatedforest birds and their Nature Conservancy Hawaii Heritage Program database elementcode, the general location and last year of observation are indicated. This .dbf containsone record for each species of bird observed on a stream.
For More Information
The Hawaii Stream Assessment Database can be made available on diskette with theaccompanying “Guide to the Hawaii Stream Assessment Database” from the DLNRDivision of Water and Land Development. A compiled version of this database whkhcan be queried without knowledge of a database program is in preparation and may beavailable in 1991. The HSA database may be linked to the state of Hawaii GeographicInformation System in the future. -
289

Figure 5Hawaii Stream Assessment Database Diagram
Hawaii’sOutstanding
StreamsOutstanding
Riparian
r dBaseW
Stream Code
[ Physical{__Aquatic
Physical dataincluding gaging,
water quality,perennial status,
names,hydroelectric,
channelization,diversions,
water supply.
Modem tarocultivation,
archeologicaland historic
sites areincluded.
Camping, hiking,swimming, boating,
fishing, hunting,parks, nature study
and scenic viewsare classified and
described.
SpecialAreas
OutstandingCultural
OutstandingRecreation
The abundanceand observationdate for nativeand introducedaquatic species.
Threatened,endangered andrare plants, andbirds in additionto native forests,recoveryhabitat,wetlands, anddetrimentalorganisms.
Outstanding
_________
Aquatic
Candidate Streams for Protection
290

Questions from the Public

Questions from the Public
The Hawaii Stream Assessment held six public information meetings throughout thes;te between September 17 and 28, 1990. Written comments were accepted until thee:d of September. Most of the new information was given to DWRM for processing intothe database. When appropriate, revisions were made for this final report, especially inthe candidate streams for protection and future action chapters. A number of questionsthat were raised are summarized and answered below.
VVhat are “beneficial instream uses?”The State Water Code, Chapter 174C-3 says:Tnstream use” means beneficial uses of stream water for significant purposes which are
located in the stream and which are achieved by leaving the water in the stream. Instreamuses include, but are not limited to:
(1) Maintenance of fish and wildlife habitats;(2) Outdoor recreational activities;(3) Maintenance of ecosystems such as estuaries, wetlands, and stream vegetation;(4) Aesthetic values such as waterfalls and scenic waterways;(5) Navigadon(6) Instream hydropower generation;(7) Maintenance of water quality;(8) The conveyance of irrigation and domestic water supplies to downstream points of
diversion;(9) The protection of traditional and customary Hawaiian rights.”Note: The HSA did not include uses described in (5) or (9) in its scope of work.
Why isn’t my stream included on the HSA list?HSA developed the list of 376 perennial streams using maps, reports and first-hand
kbowledge of the project participants. If your stream is not included it could be atiibutary of one of the HSA streams, it might be intermittent (sometimes dry), or we mayhve missed it. The streams recommended for inclusion during public review arefrclicated on the USGS maps as tributaries or as intermittent, correctly or not. A reviewp:cess for future additions to the perennial list needs to be devised.
W1iat is the Wild and Scenic Rivers Act?According to a 1988 report by the organization American Rivers, “The emphasis of the‘Id and Scenic Rivers Act is to protect our most outstanding rivers from inundation by
fe:1erally-supported dams and hydroelectric projects and to have stream courses remainfrom channelization, diversions and similar alterations.” Federal Wild and Scenic
291

designation does not adversely affect existing land uses along a river because they are an
integral part of the river corridor and its history. Designation may lead to some restrictions (if local governments adopt them) on major new building development on privately
owned land and to land use activities on federal land if they would be destructive to majoraspects of the river environment. While designation does affect activities on federal landthere is no power to force state and local governments to zone land for conservation.
Why wasn’t field work done?The Hawaii Stream Assessment was designed as a broad based inventory and assess
ment of stream-related resources based on existing information in published documentsor government files. A major exception was recreation for which we had to develop theinformation and where we used a committee consensus approach for each island. Theprocess used for HSA is efficient in that it suggests where fieldwork is needed.
What was the purpose of the Hawail Stream Assessment?The purpose of the HSA was to provide the CWRM with information to help them to
“identify rivers or streams, or a portion of a river or stream, which appropriately may beplaced within a wild and scenic river system, to be preserved and protected as part ofthe public trust.”
Why haven’t economic uses of streams been assessed?
First, streams appropriate for protection are those with the best instream resources,not those with the highest economic use. It was also determined early in the lISA thatthe water use certification database that would indicate economic uses would not becomplete in time and therefore could not be used.
Since streams change significantly from the mountains to the oceanwhy weren’t streams considered in sections?
We attempted to segment streams using various criteria, e.g. segments between majortributaries, above and below diversions, lowland vs. upland, above and below the 1,000ft contour. All approaches evaluated had significant detractions and there was no strong
argument in defense of any of them. Drew Parkin, a national expert on streams recommended that we consider streams as entire units because of their short length and, moreimportantly, several native aquatic animals depend on the entire length of the stream to
- complete their life cycle.
If the HSA is a reference document why are recommendationsprovided?
The CWRM asked us to develop some recommendations after our initial presentationof the draft report and associated materials.
What is the next step?Continue updating the database incorporating authenticated new or additional infor
mation, encouraging research to in the gaps, and linking the database into the state’scomputerized geographic based information system.
292
How can or will the HSA be used?HSA can and should be used to learn more about Hawaii’s streams in general or the
resources associated with specific streams. It will help to clarify what information existsand/or needs to be collected. Streams can be reassessed by applying the criteria to thecontinuously updated database. It should be the starting point of any stream-related useor management planning activity.
J1ow can I gain access to or get a copy of the database?A “user friendly” version of the database is being prepared through the assistance of:ie National Park Service, and should be available in 1991. Inquiries should be directedo the HSA Streamline.
PYow will this conservation-biased document be balanced for decisionaking?
Water users, landowners and others with economic interests should be sure to present.hefr perspective during any decision-making process.
What relation does HSA have to the instream flow standards?The database consolidates information from a wide array of sources that could con-
tribute to the establishment of instream flow standards.
Why haven’t “traditional and customary Hawaiian rights” been inventoned?
This is a separate and equally daunting task. We determined early in the scoping ofthis project that it was beyond our capabilities to even define these rights. Hopefully, theinventory of the resources themselves will be some help to this important work.
What about land ownership, land use and zoning?Indeed, very important, but not included in the report primarily because this spatial
information is best handled through mapping, which was beyond the scope of lISA. Thisemphasizes our point that streams need to be a theme of the state’s GIS.
I live along one of the candidate streams for protection. If it is designated for protection will my land be condemned? Would additionaloI stream uses of water be allowed?
The state’s “wild and scenic” protection program canbe designed in manyways, to allownot to allow degrees of diversion, to differ from one stream to the next, to do almost
uything. As an riparian owner or user, you will be interested not only in the use of yourstream, but in its protection. Your participation in helping to design a stream protectionpogram is critical to its success.
I don’t think that stream should be ranked outstanding!The four resource committees reached their decisions using existing information and
citeria that they developed. Since the criteria is subjective, so is the ranking as the
293

committees will be the first to agree. However, the committees did their best with theinformation available. It is unlikely that everyone will agree with all the rankings.
Isn’t this really a plot to take my water, condemn my land, and settlethe Hanapepe water rights case?
No.
What happened to the Kapu streams?Kapu streams are suggested in Approach 3, Candidate Streams for Protection. The
data indicates a number of streams would be candidate Kapu streams based on naturalresources (Table 1).
You do not have enough information to make recommendations!The study team believes that the existing data, while limited, is sufficient to conclude
that the state’s surface water resources are limited and fragile and need protectivemanagement now. Recommendations for future action are based on this conclusion,along with calls for more study and data.
What is DWRM? -
The Division of Water and Land Development (DOWALD) has recently beenrenamed Division of Water Resource Management (DWRM).
The data are wroig or missing. What is the process for changing orupdating the database?
This report is a snapshot” of the presently recorded information, some of it is alreadyobsolete. It is anticipated that the database will be periodically updated with verifiedinformation.
Write to:HSA StreamlineDivision of Water Resources Management, DLNRP.O. Box621Honolulu, Hawaii 96809
294