Blood flow analysis with considering nanofluid effects in ...
Upload
independentCategory
view
2download
0
Hydrobiologia 516: 331–346, 2004.D. Hering, P.F.M. Verdonschot, O. Moog & L. Sandin (eds), Integrated Assessment of Running Waters in Europe.© 2004 Kluwer Academic Publishers. Printed in the Netherlands.
331
Assessment of organic pollution effect considering differences betweenlotic and lentic stream habitats
Karel Brabec1, Svetlana Zahradkova1, Denisa Nemejcova2, Petr Paril1, Jiri Kokeš2 &Jiri Jarkovsky3
1Department of Zoology & Ecology, Faculty of Science, Masaryk University, Kotlarska 2, 611 37 Brno,Czech RepublicFax: +42-5-41211214. E-mail: [email protected]. Water Research Institute, Drevarska 12, 657 57 Brno, Czech Republic3Centre for Biostatistics and Analyses, Kamenice 126/3, 625 00 Brno, Czech Republic
Key words: macroinvertebrates, organic enrichment, riffle-pool habitats, AQEM, stream assessment
Abstract
Based on the requirements of the Water Framework Directive, a macroinvertebrate-based assessment system toevaluate the ecological quality of streams has been developed by AQEM project consortium. In the Czech Republicthe impact of organic pollution was principal pressure studied, but some morphological degradation of somesampling sites could not be avoided. A multimetric assessment system for three stream types was developed.Detrended Correspondence Analysis was used for the detection of the response of macroinvertebrate communitiesto the gradient of organic degradation. Significant relationships between abiotic (BOD, TOC, nutrients) and biotic(saprobic index, ASPT) indicators of organic enrichment/eutrophication were identified. Separate storage of theriffle and pool components of each multi-habitat sample allowed differences between these habitats to be com-pared in context of the metrics applied in the assessment system. Lotic and lentic habitats differed in taxonomiccomposition, ecological traits and biotic indices. The separate assessment of the riffle and pool parts of samplesprovides additional useful information when combined effects of organic pollution and morphological degradationare to be considered.
Introduction
Particulate and dissolved non-living organic matter areimportant energy inputs in running water ecosystems(Allan, 1995). The natural budget of organic matterin the running waters is frequently supplemented byhuman activity. Organic enrichment and eutrophica-tion of aquatic ecosystems induced by urbanizationand agricultural activities are the oldest and most fullydocumented forms of pollution. Attention has beenpaid to this type of pollution from the mid-19th cen-tury onwards (Cohn, 1853). Various methods for theevaluation of organic pollution exist, mostly based onlists of indicator organisms. These methods have usedplankton, periphyton, macrophytes, fish and benthicmacroinvertebrates, but Rosenberg & Resh (1993)
considered macroinvertebrates to represent the mostsuitable group.
The organic enrichment of streams comprises twoaspects: trophism and saprobity. Whereas trophismis the extent and intensity of organic primary pro-duction, saprobity is characterized by communities oforganisms reflecting the extent and intensity of organicmatter decomposition. In practice, the two factors aredifficult to separate.
For organic pollution assessment, single metricssuch as biotic indices and biotic scores are widelyused and are usually based on higher taxonomic levels,(e.g., BMWP, ASPT, Belgian Biotic Index; Metcalfe,1989). The saprobic system based on benthic macroin-vertebrates identified predominantly to the specieslevel, is preferred in Central Europe and is codified
332
in standards such as the Austrian Standard ÖNORMM 6232, 1997 and the German Standard DIN 38 410– DEV, 1987, 1992). Based on the traditional sap-robic system (Kolkwitz & Marsson, 1902), in theCzech Republic saprobiological methods were furtherdeveloped by Zelinka & Marvan (1961), Sladecek(1973) and Rotschein (1982). The statutory methodsare summarized in the current Czech Standards CSN75 7716 and CSN 75 7221.
Biotic indices, taxonomic measures and functionalfeeding group methods are used in ecological assess-ment; e.g., Rhithron Feeding Type Index – RETI(Schweder, 1990) or the percentages of Ephemerop-tera, Plecoptera and Trichoptera taxa. Their suitabilityfor ecological assessment has been tested (Resh et al.,1995; Rawer-Jost et al., 2000).
A multimetric approach of bioassessment fre-quently used in the USA (Barbour et al., 1992) wasalso adopted for assessment purposes in the AQEMproject (see, e.g., Hering et al., 2004; Dahl et al., 2004;Ofenböck et al., 2004). Multimetric systems based ona set of variables or metrics representing communitystructure (taxa richness, relative abundance, domin-ance) pollution tolerance, functional feeding groups,habitat preferences, and life history strategies offer ro-bust and sensitive insights into how an assemblage re-sponds to natural and anthropogenic stressors (Klemmet al, 2003). Multimetric indices have been developedfor macroinvertebrates, fish and periphyton (Kerans &Karr, 1994; DeShon, 1995), fish (Miller et al., 1988),periphyton (Hill et al., 2000), and riparian birds (Bryceet al., 2002).
The Water Framework Directive requires assess-ment of impairment based on comparison with streamtype specific conditions. There are several approacheshow to deal with fact that parameters used for as-sessment of human impact naturally fluctuates ac-cording to local physical habitat (e.g., hydraulics,substratum, temperature; Statzner & Sperling, 1993)and biogeographic differences depending on geomor-phologic and ecoregional conditions (geology, climateand discharge regime; Dolédec et al., 1999). TheRiver Invertebrate Prediction and Classification Sys-tem (RIVPACS) offer a prediction of the site-specificmacroinvertebrate communities to be expected in theabsence of major environmental stress (Moss et al.,1999). Development of stream typology is anotherway how to separate the impairment effect fromnatural variability in the freshwater ecosystems (seeVerdonschot & Nijboer, 2004).
Multivariate approaches, generally based on simi-larity indices, are also widely used in water quality as-sessment using macroinvertebrates. The most widelyused methods are: TWINSPAN (Hill, 1979) and UP-GMA (Sneath & Sokal, 1973) for classification anddirect and indirect correspondence analysis for gradi-ent analysis (ter Braak & Prentice, 1988). All themethods mentioned above can serve in different waysto assess organic pollution. However, a combinationof these methods seems to be powerful tool linking thecomplexity of macroinvertebrate communities and therequirements of the water management.
Riffle-pool sequences are natural features of run-ning waters associated with erosional and depositionalprocesses (Allan, 1995). Site-specific factors such aslocal hydraulic conditions and substrate characterist-ics that influence the macroinvertebrate communitystructure (Corkum & Ciborowski, 1988) may complic-ate assessment of impairment. Information needed tocompare the capacity of each habitat to indicate theimpact of stressors is often limited due to the use ofdifferent sampling techniques in riflles and pools. Rel-atively shallow riffle areas which are easily accessibleby wading are studied more frequently than deeperpools (Logan & Brooker, 1983).
In the Czech saprobiological method recently ap-plied in the national monitoring programme, samplingin riffle stretches is preferred, with sampling being car-ried out in spring in order to reduce effects of habitatheterogeneity and seasonal variation. This approachis supported by partial knowledge of (i) distributionalpatterns of macroinvertebrates at habitat scale (Logan& Brooker, 1983; Beisel et al., 2000), and (ii) seasonaldynamics in species composition (Furse et al., 1984).
We developed the multimetric assessment systemusing complex analysis of large dataset. Additionally,the role of site-specific parameters beeing importantfor the assessment of water bodies impaired by morethan one stressor type was pointed out.
The main objectives of this study are:
• to document the development of a multimetric sys-tem for assessing the impact of organic pollution inthree different stream types in the Czech Republic;
• to test relationships between environmental para-meters related to stressor gradient and benthic com-munity characteristics;
• to analyse the differences in macroinvertebratecommunities inhabiting riffle and pool habitats inrelation to the potential effect on the developedmultimetric systems.
333
Table 1. Ranges of the environmental characteristics of studied sites
Stream type C01 C02 C03
Altitude (m a.s.l.) 350–510 200–457 190–633
Catchment area (km2) 231–1380 9–72 58–460
Distance to source (km2) 41–94 4–13 18–43
Forest in catchment (%) 17–62 22–100 21–72
Cropland in catchment (%) 6–72 0–67 5–73
Alkalinity (mmol l−1) 0.2–2.4 2.4–7.2 1.3–5.6
Description of study sites
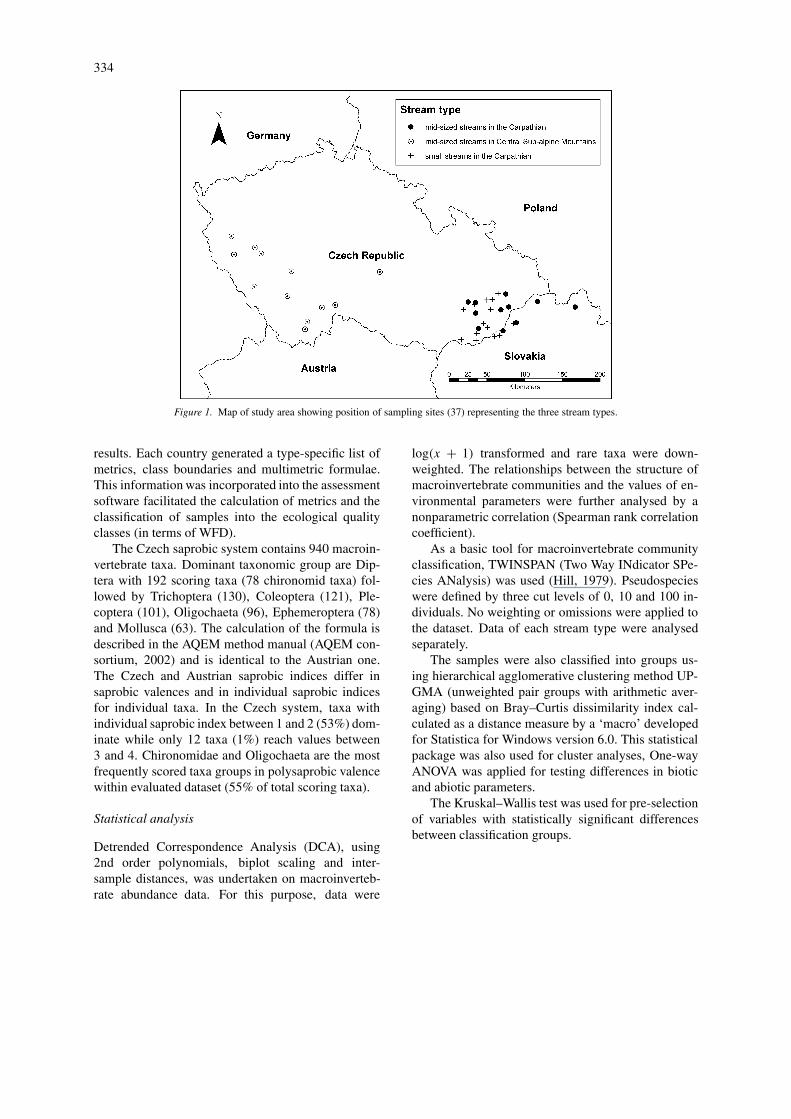
Since a water body typology is currently being de-veloped in the Czech Republic, the study sites werefirst divided into types using ‘system A’ of the WaterFramework Directive (WFD; Directive 2000/60/EC –Establishing a Framework for Community Action inthe Field of Water Policy). The 37 sites (Fig. 1) aredistributed over 12 medium-sized streams in the cent-ral sub-alpine mountains (stream type C01), 14 smallstreams in the Carpathian (C02), and 11 medium-sizedstreams in the Carpathian (C03). The medium-sizedC01 streams had, on average, a larger catchment area,a higher stream order (Strahler) and a lower thalwegslope than C03 streams (Table 1). Geological dif-ferences between the regions of C01, C02 and C03streams are expressed by a higher proportion of flyschand molasse and a lower share of acid silicate rocks inthe Carpathian catchments. Consequently, alkalinityand total hardness are higher in flysch and molasseregion. Small streams had significantly higher slopeof the thalweg than medium-sized rivers (p < 0.001).The sites were selected in such way that the largestpossible gradient of organic degradation was obtainedfor each stream type.
Methods
Sampling
Macroinvertebrate samples were taken in spring andsummer using the standardized method developed inthe AQEM project (Hering et al., 2002, 2004). Amulti-habitat scheme was used to sample the habit-ats proportionally according to their presence withina sampling site. A sample consisted of 20 samplingunits, all taken from those microhabitat types at a sitethat covered at least 5% of the stream section. For each
sampling unit, stationary sampling was carried out bypositioning a long handled net (500 µm mesh size)upright on the stream bed and disturbing the upstreamsubstratum over an area of 0.25×0.25 m (0.0625 m2).Material collected from all microhabitats was pooled,though the lotic and lentic part of the sample waskept separate. Samples were preserved immediatelyin 4% formaldehyde. All macroinvertebrates were sor-ted, identified and counted. Before statistical analyses,biological data were taxonomically adjusted usinga standardization procedure described by Schmidt-Kloiber (2003). The entire AQEM methodology isdescribed in detail in the ‘Manual for application ofthe AQEM system’ available at www.aqem.de (AQEMconsortium, 2002).
Environmental parameters
A set of environmental parameters was collected foreach site. Hydromorphological, hydrological, landcover and other features at habitat, site, stretch (flood-plain) and catchment level are described in detail in theAQEM method manual (AQEM consortium, 2002).BOD (biochemical oxygen demand), TOC (total or-ganic carbon) and concentration of nutrients wererecorded as the water chemistry parameters potentiallyrelated to organic pollution and/or eutrophication. AllGIS analyses were based on stream network and catch-ments data provided by the Water Research InstituteTGM in Prague and by Water Research Institute inBratislava. Land cover data were obtained from theCORINE system (provided by the Ministry of En-vironment of the Czech Republic) using ARCview3.1 software. The digital atlas of the Czech Republic(‘Atlas GEOCR 500’) produced by the Czech Geolo-gical Institute was used as the source of informationabout the catchment geology. As a measure of micro-habitat heterogeneity the Shannon–Wiener diversityindex, evenness and microhabitat richness were used.Formulae usually used for species data were modi-fied by the substitution of species quantity with theproportion of microhabitats.
Biotic metrics
Karr & Chu (1999) defined metrics as measurableparts or processess of biological system empiricallyshown to change in value along a gradient of humaninfluence. During the AQEM project, two tools for cal-culation of biota-based metrics were developed. ATICis a collection of macros developed in Microsoft Excelwhich was used for evaluation of sampling programme
334
Figure 1. Map of study area showing position of sampling sites (37) representing the three stream types.
results. Each country generated a type-specific list ofmetrics, class boundaries and multimetric formulae.This information was incorporated into the assessmentsoftware facilitated the calculation of metrics and theclassification of samples into the ecological qualityclasses (in terms of WFD).
The Czech saprobic system contains 940 macroin-vertebrate taxa. Dominant taxonomic group are Dip-tera with 192 scoring taxa (78 chironomid taxa) fol-lowed by Trichoptera (130), Coleoptera (121), Ple-coptera (101), Oligochaeta (96), Ephemeroptera (78)and Mollusca (63). The calculation of the formula isdescribed in the AQEM method manual (AQEM con-sortium, 2002) and is identical to the Austrian one.The Czech and Austrian saprobic indices differ insaprobic valences and in individual saprobic indicesfor individual taxa. In the Czech system, taxa withindividual saprobic index between 1 and 2 (53%) dom-inate while only 12 taxa (1%) reach values between3 and 4. Chironomidae and Oligochaeta are the mostfrequently scored taxa groups in polysaprobic valencewithin evaluated dataset (55% of total scoring taxa).
Statistical analysis
Detrended Correspondence Analysis (DCA), using2nd order polynomials, biplot scaling and inter-sample distances, was undertaken on macroinverteb-rate abundance data. For this purpose, data were
log(x + 1) transformed and rare taxa were down-weighted. The relationships between the structure ofmacroinvertebrate communities and the values of en-vironmental parameters were further analysed by anonparametric correlation (Spearman rank correlationcoefficient).
As a basic tool for macroinvertebrate communityclassification, TWINSPAN (Two Way INdicator SPe-cies ANalysis) was used (Hill, 1979). Pseudospecieswere defined by three cut levels of 0, 10 and 100 in-dividuals. No weighting or omissions were applied tothe dataset. Data of each stream type were analysedseparately.
The samples were also classified into groups us-ing hierarchical agglomerative clustering method UP-GMA (unweighted pair groups with arithmetic aver-aging) based on Bray–Curtis dissimilarity index cal-culated as a distance measure by a ‘macro’ developedfor Statistica for Windows version 6.0. This statisticalpackage was also used for cluster analyses, One-wayANOVA was applied for testing differences in bioticand abiotic parameters.
The Kruskal–Wallis test was used for pre-selectionof variables with statistically significant differencesbetween classification groups.

335
Development of multimetric assessment systems
System development consists from the followingsteps: testing of community response to stressor gradi-ent and divisive clustering based on community struc-ture (a), transformation of TWINSPAN groups intogroups being differentiated by saprobic index values(b), setting provisional class boundaries for saprobicindex (c), selection of other core metrics (d), andcalculation of the stressor-specific quality class (e).(a) The abiotic classification, based on parametersindicating organic pollution, was tested against thebiotic metrics but gave unsatisfactory results. Sincethe project consortium had a common target to con-struct multimetric assessment systems by integratinginformation from a range of biotic metrics, the initialsteps were to classify samples and to select metricswith the highest discriminatory power. Application ofseveral clustering methods showed that TWINSPANprovided results related to known indicators of or-ganic pollution. Data from individual stream typeswere processed separately.(b) Using the theoretical range of the saprobic indexscores, groups were merged into 4 or 5 groups (‘bad’status conditions for stream types C01 and C03 werenot identified in the dataset). As a guide for the fu-sion of groups, a non-significant difference betweengroups or, in the case of groups with low number ofsites, a large overlap of saprobic index values wereused. The position in the hierarchical structure of thedendrogram was also taken into account. Differencesin saprobic index values between merged groups werestatistically significant (Kruskal–Wallis test, p < 0.01for all stream types).(c) Draft class boundaries were set for the saprobicsystem generated using box-plots characteristics ofmerged TWINSPAN groups and by estimation whenan inter-class gap occurred without values. Externaldata set from reference sites were used for settingthe class boundary between high and good status.These draft class boundaries were used for draft clas-sification of samples based on saprobic index values.This was necessary because of the modification ofmultivariate results for efficient using in multimetricsystems. In this way, ‘draft classification’of sampleswas subsequently used for selection of another metricsforming multimetric system together with saprobicindex.(d) All biotic and abiotic parameters were tested withthe Kruskal–Wallis test for differences between the‘draft groups’. The aim was also that the system
should incorporate representatives of all biotic met-ric types (sensitive taxa indices, diversity, ecologicaltraits). Another criterion for metric selection was arelationship to stressor gradient and differentiationamong groups. Selected metrics were tested by step-wise discriminant analysis to find the best combinationof metrics that provided the highest percentage of cor-rectly classified samples (compared to ‘draft groups’membership). Discriminant analysis was used withcaution as a supportive tool since the data did notfully meet the criteria for parametric analysis. The dis-criminatory power of metrics for the differentiation ofindividual classes was tested by non-parametric post-hoc tests. The final set of core metrics included in themultimetric system and their class boundaries used inthe multimetric formula are listed in Table 3.(e) For each sample, each metric value was classifiedinto a metric-specific class (score) and in case of anoverlap of class ranges the mean values of both classeswere used. These metric results were subsequentlyaveraged and rounded into a final class value for therespective sample - the stressor-specific quality class.
Results
Relationships of macroinvertebrate variability toenvironmental gradients
Preliminary, top-down stream typology was confirmedbecause all three stream types formed fairly well sep-arated groups of sites in the DCA ordination diagram(spring and summer data were analysed separately).Separation of sites within stream types was mostmarked on the second axis; these sample scores weresignificantly correlated (p < 0.001) with geologicalcharacteristics of the catchments, differentiating theflysch and molasse part of the Carpathian ecoregionand the acid silicate rocks of the Central Sub-alpineMountains ecoregion (Spearman R = 0.55 and R =−0.63, respectively). Statistically significant correl-ations with distance to source, catchment area, andStrahler stream order reflected the differences betweenthe macroinvertebrate communities that are linked tostream size. Stream types were better separated byspring data than summer data, where an overlap of themedium-sized streams of both ecoregions was evident.
The first axis of DCA, which explained 14%(summer data) and 15% (spring data) of macroinver-tebrate variability, was significantly correlated withthe known environmental indicators of organic en-richment (BOD, TOC, nutrient concentration). This

336
indicated that site selection had reached its main goal– to include a gradient of organic pollution.
Riffle proportion, biochemical oxygen demand(BOD), proportion of arable land in the catchment,mean slope of the thalweg, and chloride, nitrate, andtotal phosphate concentrations had comparable rela-tionships to the first axis scores in both seasons (allSpearman R with p < 0.001). Percentage of or-ganic mud, current velocity, and total organic carbon(TOC) explained macroinvertebrate variability betterin spring than in summer. In contrast, water depth andcoverage of shoreline with woody riparian vegetationwere more important in summer. Amongst those para-meters crucial for an explanation of biota variability,there are factors operating in various spatial scalesfrom microhabitat to catchment level (Table 2).
The final classification in values of the Czech sap-robic index, with class boundaries is shown in Fig. 2.The difference between the original TWINSPAN clas-sification, sorted by the saprobic index, and the fi-nal classification illustrates the relationships betweenmultivariate system based on taxonomic structure ofentire communities and scoring system based on sens-itive indicators. About half of all the 74 samplesremained in the same class in both systems. The vastmajority of shifts involved changes of only one class,and only 2 samples differed in two classes between theapplied classifications.
Core metrics
For the purpose of the core metrics selection, the datafrom individual stream types were analysed separately.The Czech saprobic index, ASPT (Average Scoreper Taxon) and the RETI index (Rhithron FeedingType Index) were chosen for medium-sized streams ofstream type C01. Differences among the TWINSPANgroups and the final classifications were confirmed bya Kruskal–Wallis ANOVA at level p < 0.001 (withthe exception of ASPT and the TWINSPAN classi-fication, p < 0.01). Besides the Czech saprobicindex, two additional metrics were selected for theassessment system of small streams in the Carpathian(C02) – the number of stonefly taxa and the numberof mayfly taxa. Both classifications produced groupssignificantly different in terms of core metrics at levelp < 0.01. Furthermore, for the saprobic index andthe number of stonefly taxa, the final classificationincreased statistical significance to p < 0.001. Itwas relatively difficult to find metrics which, togetherwith saprobic index, would form a reliable multi-
metric assessment system for stream type C03. Thenumber of EPT taxa (Ephemeroptera + Plecoptera +Trichoptera) was found to give the best fit. Results ofa non-parametric ANOVA for final classification il-lustrated the discriminatory power of this parameter(p < 0.001), exceeding the saprobic index (p <
0.01). Number of EPT taxa was linearly correlatedwith the number of EPT individuals in stream typesC01 and C02 (R2 = 0.29, p < 0.01 and R2 = 0.42,p < 0.001).
A common element of the multimetric assessmentsystems developed for the three stream types studiedin the Czech Republic is the saprobic index (Czechversion) used as tolerance metric representing com-munity characteristic based on sensitive taxa. This is atraditional metric used in assessment systems focusedon the evaluation of impairment by stressors related toorganic pollution or eutrophication.
The Czech saprobic index differed significantlyamong the stream types due to lower values in smallstreams (Kruskal–Wallis ANOVA, N = 74, p <
0.05). The difference between the median saprobicindex values of between small (CO2) and medium-sized (CO1 and CO3) streams is equal to 0.5 (C01 =1.97; C02 = 1.45; C03 = 1.99), but only the differ-ence between stream types C02 and C03 is statisticallysignificant (p < 0.05). Statistically significant differ-ences related to stream size were also recorded by theRETI index – its values were higher in small streams(p < 0.001). The remaining core metrics did not differsignificantly among stream types.
Since the dataset contained relatively few samplesin each individual season, the common assessmentcriteria (core metrics, class boundaries) were appliedto spring and summer samples together. Final classdifferences between seasons were higher in medium-sized streams than in small streams.
Linking biotic metrics to environmental parameters
The final classification was significantly related tosome other biotic metrics (Fig. 3) that were excludedfrom the multimetric system in order to keep thebalance between the number of samples used for de-velopment of the assessment system and the numberof metrics used for classification. These parametersoffer a potential for future improvements of class dis-crimination when a greater number of samples areavailable.
The responses of the individual metrics to wa-ter chemistry, habitat characteristics and catchment

337
Table 2. Correlation between the first DCA-axis and the selected environmental parameters. Spearmancorrelation coefficients for spring and summer samples were evaluated separately, N = 37
Parameter Spring Summer
R p-level R p-level
% of organic mud 0.60 <0.001 0.41 <0.05
Chloride 0.86 <0.001 0.79 <0.001
BOD 5 0.78 <0.001 0.44 <0.01
Ammonium 0.59 <0.001 0.38 <0.05
Nitrite 0.69 <0.001 0.73 <0.001
Nitrate 0.62 <0.001 0.38 <0.05
Total phosphate 0.71 <0.001 0.74 <0.001
Mean slope of the thalweg −0.53 <0.001 −0.64 <0.001
TOC 0.59 <0.001 0.41 <0.05
% of cropland in catchment 0.73 <0.001 0.68 <0.001
Percent of riffle −0.70 <0.001 −0.70 <0.001
Altitude −0.44 <0.01 −0.29 N.S.
Conductivity 0.39 <0.05 0.16 N.S.
Mean depth 0.34 <0.05 0.57 <0.001
Mean current velocity −0.41 <0.05 −0.21 N.S.
Maximum current velocity −0.38 <0.05 −0.18 N.S.
% of shoreline covered with woody riparian vegetationa −0.41 <0.05 −0.48 <0.01
Maximum depth 0.09 N.S. 0.37 <0.05
Stream density −0.30 N.S. −0.42 <0.05
aAverage of both banks.
Figure 2. Final multimetric classification displayed as a box-whiskers plots of the Czech saprobic index with its class boundaries representedby dotted lines; results of the Kruskal–Wallis ANOVA reflect difference among classes.

338
Table 3. Core metrics and their class boundaries for individual ecological status classes
Stream type Core metrics Ecological status classes
5 (High) 4 (Good) 3 (Moderate) 2 (Poor) 1 (Bad)
C01 Saprobic index (CZ) ≤1.80 1.81–2.10 2.11–2.50 2.51–3.00 ≥3.01a
ASPT ≥6.01 ≥6.01 5.21–6.00 4.01–5.20 ≤4.00a
RETI ≥0.471 0.281–0.470 0.151–0.280 0.051–0.150 ≤0.050a
C02 Saprobic index (CZ) ≤1.20 1.21–1.50 1.51–2.00 2.01–2.70 ≥2.71
Plecoptera (number of taxa) ≥5 2–4 1 0 0
Ephemeroptera (number of taxa) ≥12 7–11 4–7 ≤3 ≤3
C03 Saprobic index (CZ) ≤1.70 1.71–2.20 2.21–2.50 2.51–3.00 ≥3.01a
EPT (number of taxa) ≥18 15–18 8–15 5–8 ≤5a
aIndicates class boundary set up without sufficient data set.
characteristics were analysed. In the medium-sizedstreams, the organic enrichment indicated both byBOD and TOC was positively correlated with Czechsaprobic index (Spearman R, p < 0.001) and negat-ively with ASPT (p < 0.001) and RETI (p < 0.001).On the other hand, in the small streams, these bioticmetrics were much more highly correlated to nutrientgradients (nitrite, nitrate, phosphate) and to the pro-portion of arable land in the catchment. The RETIindex, for example, was negatively correlated to ni-trite, ortho-phosphate concentrations and also to theproportion of cropland in the catchment (Spearman R,p < 0.001).
The biotic metrics were also related to microhab-itat characteristics. For example, IBE versus propor-tion of coarse particulate organic matter – CPOM(R = 0.49, p < 0.001), and Czech saprobic indexvalues versus the proportion of organic mud (R =0.53, p < 0.001) in medium-sized streams. In smallstreams, there were distinct relationships between pro-portion of CPOM and ASPT or RETI (both R =−0.58, p < 0.001). Coverage of fine sediments(argyllal + FPOM + organic mud) at the sites (C02type) was related to the proportion of cropland inthe catchment (Spearman R, p < 0.01). Habitatpreference of benthic fauna to fine sediments (POM,pelal, argyllal) and gathering collectors density exhib-ited relationships to reach-scale characteristics in themedium-sized rivers (share of the fine substrata cover)while the percent of cropland in catchment was moreimportant in the small streams.
Many presumable relationships between site char-acteristics and trophic strategies or microhabitat pref-erences of macroinvertebrate communities have beendetected. For instance, pelal (mud with grain size<0.063 mm) microhabitat preferences of macroinver-
tebrates were related to the percentage of cropland incatchment, percentage of passive filter feeders wasrelated to the proportion of megalithal (grain size>40 cm) in the stream substratum and proportion ofgrazers in the macroinvertebrate community was re-lated to proportion of riffles at the site (all SpearmanR significant at p < 0.001).
Differences between lotic and lentic habitats
The ecological attributes of organic pollution pre-determines possible differences between lotic (riffles)and lentic (pools) stream habitats. Effects of organicmatter degradation in streams are significantly influ-enced by local conditions of current velocity, sub-stratum and channel morphology. The proportion ofboth habitats varied within the studied sites. In eachseason, only lentic habitats were present at 4 sites,whilst only lotic habitats were present at 9 sites. How-ever, a mixture of both habitats occurred at 19 sites. Atthe remaining 5 sites only lotic habitats were presentin spring but these differentiated into a mixture of bothhabitats in summer.
Despite the high variability of depth and currentvelocity, statistically significant differences betweenhabitats were observed (p < 0.001). Current velocitydecreased from riffles to pools but also from springto summer. Considerable decline in current in sum-mer, associated with seasonal flow regime, is mostevident in small streams where mean current velocitydecreased from 0.54 m s−1 to 0.19 m s−1 in riffles,and from 0.23 m s−1 to 0.03 m s−1 in pools (Table 4).Lower mean current velocity in C01 than C03 couldbe due to a lower slope of C01 streams.
Differences in microhabitat diversity were testedby calculating the Shannon–Wiener index of diversity,

339
Figure 3. Selected metrics and environmental parameters showing significant discriminatory power for class separation in individual streamtypes, that were not used in the final assessment system (Kruskall–Wallis test p < 0.01). Legend: see Figure 2; final class 1 = bad status, class5 = high status.
the eveness and the microhabitat richness, usingpercentage data of each microhabitat. Differencesbetween habitats were registered only in the C02 typewith the diversity index and the number of microhab-itats both higher in riffles than pools (p < 0.05).Although lower microhabitat heterogeneity would alsobe expected in the pools of C01 and C03 streamtypes, due to sampling only taking place in wadablestretches, microhabitat diversity was comparable inboth habitats. However, microhabitat composition dif-fers significantly between habitats, with a higher pro-
portion of organic mud, psammal/psammopelal andakal in pools, and a higher proportion of macrolithal(20–40 cm) and mesolithal (6–20 cm) in riffles.
The subset of samples collected from sites whereboth habitats were present was analysed for differ-ences in biotic parameters of macroinvertebrate com-munities. In total 43 samples included riffle and poolcomponents (8 samples of C01 type, 22 samples ofC02 type and 13 samples of C03 type). Besides dif-ferences in habitat preference, feeding strategies, andcurrent preference, significant differences in the val-

340
Table 4. Current velocity (m s−1) summarized for in-dividual stream types, seasons and habitats (mean ±standard error)
Stream Season Riffle Pool
type
C01 Spring 0.57 ± 0.030 0.24 ± 0.015
C01 Summer 0.42 ± 0.028 0.04 ± 0.009
C02 Spring 0.54 ± 0.025 0.23 ± 0.021
C02 Summer 0.19 ± 0.01 0.03 ± 0.006
C03 Spring 0.74 ± 0.023 0.29 ± 0.024
C03 Summer 0.37 ± 0.021 0.13 ± 0.019
ues of the core metrics were also found (Table 5).These results should be considered with caution thatvalues of some metrics (especially the taxa richnessmetrics) can be related to the sampled area whichwas in some cases different for riffle and pool hab-itats. Riffles are characterized by higher proportionof fauna preferring lithal, rheophils, passive filtrators,grazers/scrapers and total abundance of macroinver-tebrates. Taxa with pelal and particulate organic mattermicrohabitat preference, active filtrators and gather-ers/collectors exhibited higher densities in pools. Ahigher Czech saprobic index and RETI in pools anda higher number of EPT taxa in riffles caused 14samples taken from riffle part of a site to be classi-fied as in a better class than the related pool (8 pairsof samples differed by 1 class and 6 by two classes)samples. Most of the samples were classified in thesame class for both habitats (23) and in 6 samplesthe pools were calculated to be one class better thanthe riffles. These results are important considerationin the context of an assessment system whose rangeof application includes sites with varying mixture ofhabitats.
Another subset of 16 samples with an equal pro-portion of riffle and pools was analysed to see whetherthe taxonomic composition of the samples was similarin both habitats. Bray–Curtis dissimilarity index val-ues between habitats were negatively correlated withthe Czech saprobic index of mixed samples (R2 =0.39, p < 0.01). There was no significant difference(N = 16, p > 0.05) found in total number of taxa,number of Ephemeroptera taxa, number of Plecopterataxa, number of families and total density (N m−2)
between the two habitats. Number of EPT taxa andpercentage of EPT individuals were higher in rifflehabitat (Wilcoxon test, N = 16, p < 0.001). Slightly
Table 5. Biotic metrics with statistically significant differencebetween lotic and lentic habitats; Wilcoxon test for dependentdesign were used (N = 43)
Metrics p-level Higher
median
Habitat preference – lithal [%] <0.001 Riffle
Current preferences – rheophils [%] <0.001 Riffle
Passive filter feeders [%] <0.001 Riffle
Habitat preference – pelal [%] <0.001 Pool
Coleoptera [number of taxa] <0.001 Riffle
Grazer and scrapers [%] <0.001 Riffle
Czech saprobic index <0.001 Pool
Active filter feeders [%] <0.001 Pool
Diptera [%] <0.001 Pool
EPT [%] <0.001 Riffle
Habitat preference – POM [%] <0.001 Pool
IBE <0.001 Riffle
Trichoptera [%] <0.001 Riffle
Gatherers/collectors [%] <0.001 Pool
Trichoptera [number of taxa] <0.001 Riffle
RETI <0.001 Riffle
EPT [number of taxa] <0.01 Riffle
Ephemeroptera [%] <0.01 Riffle
Number of taxa <0.05 Riffle
Abundance [ind. m−2] <0.05 Riffle
higher RETI index in riffles was on the border of stat-istical significance (Sign test was non significant andWilcoxon test was significant at p < 0.05 level).
Discussion
Development of multimetric assessment system
The multimetric system for the assessment of organicpollution and eutrophication based on macroinverteb-rates was developed for three stream types in theCzech Republic. The wide application of the mul-timetric concept in the U.S.A. shown that it is aneffective tool for the assessment of a broad rangeof human impacts on aquatic ecosystems (Barbouret al., 1995). This type of assessment system isbased on the deviation from the type-specific referencecondition. Stream typologies developed in individualEuropean countries differ in parameters being used(biotic/abiotic) and also in general approach (top–down/bottom–up).
Detrended correspondence analysis of data collec-ted in the Czech Republic showed that community

341
structure was related to gradients of parameters usedin typology (geology in the catchment, stream size).Separation of the geological types on the second axisof correspondence analysis was also found by Charvetet al. (2000) in semi-natural streams in France.
Core metrics were selected to be predominantlybased on the detailed taxonomic identification ofmacroinvertebrates, different types of metrics to beinvolved and to maintain metrics traditionally used inthe region. An example of the application of the lastrule is the saprobic system. Although the saprobic sys-tem was criticized for not working in turbulent streams(Chandler, 1970), and for not taking into accountof local factors (Hynes, 1960; Statzner & Sperling,1993), traditional usage in some countries of CentralEurope initiated its adaptation to the Water FrameworkDirective requirements (Rolauffs et al., 2004). An as-sumption that saprobic index is a plausible measureof the response of the macroinvertebrate communityto organic pollution reflected in the observed dataand the Czech version of the saprobic index has beenincorporated in all three stream-type specific assess-ment systems. This index was significantly correlatedto BOD, TOC and organic mud coverage at the site.Metcalfe-Smith (1994) referred limitations for usingbiotic indices as bioassessment tools. Scoring withinstream type specific conditions and long term recordsdemonstrating relationships to the environmental in-dicators of organic pollution partially reduced theselimits. The only biotic index operating at family levelwhich exhibited a fit with the assessment system de-veloped for stream type C01 was ASPT (AverageScore Per Taxa). This index combines pollution tol-erance (mostly organic) and a diversity measure (DePauw et al., 1992).
Richness measures are frequently included in mul-timetric systems (Roy et al., 2003; Klemm et al.,2003). Perhaps due to taxonomic difficulties with thetypical Chironomidae and Oligochaeta fauna in thelentic benthos the taxa richness is more frequentlyused for assessment of disturbance effects in streamsand rivers than in stagnant waters (Resh & McElvary,1993). Resh et al. (2000) found that richness met-rics were most accurate in detecting impairment andavoiding classification errors. As the richness met-rics most supplemented saprobic system informationwere found EPT, Ephemeroptera and Plecoptera taxarichness. Linear relationship between density and taxarichness of EPT taxa in stream types C01 and C02 in-dicated importance of precise following the samplingmanual to collect a comparable samples. This results
should be taken into consideration in case of applica-tion of subsampling procedure or other manipulationwith the sample size.
Breaking the EPT into separate orders, as we usedfor stream type C02, may allow more effective di-agnosis of the stressor among impaired waters becauseeach order responds differently to a different stressor(Clements, 1994; Fore et al., 1996; Klemm et al.,2003). Study at unimpacted sites had shown that EPTtaxa richness was more stable and more predictablethan total taxa richness (Lenat & Penrose, 1996).
Since the functional relationships among speciesin terms of ecosystem processing and uniqueness ofspecies are unpredictable (Covich, 1996) it is useful tocombine biodiversity measures with metrics based onspecies traits. In the background of developed assess-ment systems are statistically significant relationshipsbetween feeding and habitat preferences of macroin-vertebrate communities and impairment characterist-ics. However case studies focused on microhabitat-scale pattern would be needed for a better understand-ing of the interrelationships between natural patternsand effect of impairment. It is not clear how well somechanges in these ecological traits measures are relatedto changes in water or habitat quality (Barbour et al.,1999). Furthermore, metrics based on functional feed-ing groups can be highly variable depending on bothinstar and food conditions (Cranston, 1990; Hildrewet al., 1985). The effect of organic pollution on thefeeding strategies of macroinvertebrates is expressedby the RETI index. This index represents the percent-age of grazers/scrapers, shredders and xylophagoustaxa.
Considering number of sites involved in the studywe would recommend further validation and tuningof the system. Development of systems for additionalstream types and different types of stressors wouldbe needed. Resh at al. (2000) compared multimetricapproaches with multivariate models and they recom-mended combination of both methods to enhance wa-ter quality monitoring and assessment programs. TheCzech Republic has good preconditions to developan assessment system based on the database of refer-ence sites (PERLA project unpublished data) and thestressor-specific multimetric systems in future.
Relationships among biotic and environmentalmeasures of impairment
Relationships between macroinvertebrate communitystructure and stressor intensity (organic pollution)
342
were detected at level of individual taxa composition(DCA ordination) and also at derived metrics. FirstDCA axis was significantly correlated to abiotic para-meters indicating organic pollution/eutrophication atvarious spatial scales. It is in agreement with resultsof Lammert & Allan (1999) who found that detectionof significant relationships between biotic integrityof streams and local or catchment factors are res-ults of processes that occur at multiple scales. Royet al. (2003), studying effect of urbanisation, foundstrong relationships between catchment land cover andstream biota, but they also reported that reach-scalevariables had higher capabilities for predicting vari-ation in biotic indices than land cover parameters. Therelatively low proportion of community structure vari-ability explained by DCA ordination axis (first axis15%) might be related to the character of multihabitatsample in which macroinvertebrates taken from all mi-crohabitats with at least 5% cover of sampled stretchare pooled.
Oxygen deficiency represents the primary abioticindicator of the intensity of organic matter decomposi-tion. Biochemical oxygen demand (BOD) is a measureof microbial respiration and it is frequently used as anindicator of organic pollution. Saprobic index, ASPTand RETI indices were significantly correlated withBOD and these relationships were particularly evidentin medium-sized rivers. The fact that individual taxadiffer in sensitivity to low oxygen saturation levels isused for the organic enrichment assessment. The num-ber of Plecoptera taxa, used as a core metric for thestream type C02, decreases with an increase in stressorpressure. Absence of Plecoptera in poor and bad classsites showed that the relationship between a metric anda stressor gradient need not be necessarily be linearwithin the full extent of stressor intensity. Gener-ally, Plecoptera provide a high bioindication potential(especially where oxygen-demand pollutants are con-cerned) for the assessment of small streams becauseof their sensitivity to the concentration of dissolvedoxygen (e.g., Baumann, 1979).
The input of organic matter into channels modifiesthe bottom substrate characteristics. Sedimented par-ticulate organic matter forms patches dependent on theinstream hydraulic conditions. Because fine organicparticles have hydrological properties similar to thoseof silt (Inman, 1949), food quantity is rarely a limit-ing factor in silt-bottom habitats (Ward, 1992). Thesereach-scale geomorphic and chemical parameters arerelated to catchment land cover (Roy et al., 2003). Thiswas in agreement with our results from small streams
where coverage of fine sediments at the sites wassignificantly related to proportion of cropland in thecatchment. Feeding strategies and microhabitat pref-erences are key biotic aspects indicating these kindsof degradation. We found predictable relationshipsbetween microhabitats proportions and the microhab-itat preference of benthic fauna (fine sediments) whichindicated suitability of developed methodology forstudying this type of linkages. Charvet et al. (2000)pointed the potential of various biological and ecolo-gical traits for detection of different human impacts.Dolédec et al. (1999) found that biological traits wereless confounded by natural spatial gradients and in-dicated human impact better than ecological traits. Inthis study feeding strategies did not differ significantlybetween medium-sized rivers from Central highlandsand the Carpathians, but relative abundance of shred-ders was significantly higher in the small streams thanin both medium-sized rivers. Microhabitat character-istics exhibited were related to the feeding strategies(fine sediments vs. gathering collectors) and to bi-otic indices (CPOM vs. IBE; organic mud vs. Czechsaprobic index). Fine sediments suspension and de-position affects benthic macroinvertebrates by alter-ing substrate composition, changing suitability of thesubstrate for some taxa, increasing drift, affectingrespiration and affecting feeding activities (Wood &Armitage, 1997).
Since the key products of organic matter decom-position are nutrients, eutrophication is very closelylinked to organic pollution. Addition of nitrate andphosphate in combination with a greater light inputresults in enhanced plant growth. In these condi-tions, the primary effects of eutrophication on benthicmacroinvertebrates are shifts in the feeding strategy ofcommunities towards herbivory. A negative correla-tion between percentage shoreline covered by woodyriparian vegetation and the DCA axis I representingfauna response to stressor supported studies indicat-ing the role of riparian buffers in protecting waterquality (e.g., Gregory et al., 1991). On the otherhand, autochthonous primary production is an import-ant source of organic matter and its decompositionmay result in phenomena comparable with the effectof allochthonous organic enrichment (increased BOD,amount of particulate organic matter, low dissolvedoxygen concentration). Furthermore, decompositionof organic matter in streams may be influenced by theconcentration of nutrients (Meyer & Johnson, 1983).
Effects of organic pollution and eutrophication onstream benthic fauna are linked to each other by pro-

343
cesses of organic matter and nutrients transformations.Common assessment system for both stressors is re-commended and the effect of each of them can beindicated by individual stressor specific metrics. Fu-ture multi-scale investigation of physical and bioticstructure and function of stream ecosystems would beneeded for the assessment of impairment and also forthe development of restoration strategies.
Differences between riffle and pool macroinvertebratefauna
Spatial and temporal variability complicate detectionof stressor effects, and natural gradients must be con-sidered in sampling or evaluation design (Lammert& Allan, 1999). Factors related to organic pollutionor eutrophication (dissolved oxygen content, substratecharacter and nutrient cycling) differ between lotic andlentic habitats. The flow type (turbulent/laminar) af-fects the water aeration, supplying the water with oxy-gen and enhancing decomposition. Seasonal and hab-itat differences in discharge and hydraulic conditionswere documented at studied streams. Microhabitat di-versity differed significantly between habitats only insmall streams, but composition differences were signi-ficant also for medium-sized rivers. As shown by theanalysis of between-habitats taxonomical similarityrelated to saprobic index, organic pollution reduces thedifference between biota of naturally different unitsof a stream ecosystem. This could be also explainedby a higher environmental heterogeneity in slightlyimpacted sites that resulted in a more diverse macroin-vertebrate community. Logan & Brooker (1983) foundthat riffles and pools at the same site were generalymore closely related (cluster analyses of Jaccard sim-ilarity coefficient) to each other than to other riffles andpools. As we tried to cluster samples based on Bray–Curtis similarity (unpublished results) we obtainedmore inter-site similarity than the above-mentionedstudy which used data from several investigations.Riffle-pool sequences are also important for nutrientexchange between a channel and a hyporheic zone interms of nutrient spiraling concept (Newbold et al.,1982). Anthropogenic input of organic matter (sewageand domestic waste) and nutrients (fertilizers) altersthe energy base and trophic pathways of communities(Covich et al., 1999).
Statistically significant differences of environ-mental parameters and biotic metrics, including somecore metrics, showed that habitat-specific parametersmay enhance separation of stressor effect from over-
all variability. Total density was significantly higherin riffles compared with pools and this is in agree-ment with conclusion reported by Logan & Brooker(1983). Scarsbrook & Townsend (1993) found highertaxa richness in riffles than pools in a stable streambut no difference between the two habitats in an un-stable stream. Logan & Brooker (1983) found nosignificant differences in richness at several taxonomiclevels between habitats. In our study no significantdifference was found in total taxa richness, numberof families, number of Ephemeroptera taxa and num-ber of Plecoptera taxa between riffle and pool habitatsof 16 samples having equal proportion of both hab-itats. Number of EPT taxa and percentage of EPTindividuals were higher in riffle habitat. A review ofbiodiversity variation at various spatial scales by Vin-son & Hawkins (1998) also contains several examplesshowing significant interhabitat variation in richness.Differences were found also in Czech Saprobic in-dex, IBE, relative abundance of gatherers/collectors,grazers, active filter feeders which had direct effect onthe final class of ecological quality.
Although only limited part of dataset was suitablefor evaluation of habitat difference we suggest for fu-ture studies to test using separate metrics and/or scor-ing of metrics for riffle and pool habitats. Otherwisethe final results would be influenced by the proportionof habitats within sampled stretch. This is associatedwith the selection of a ‘representative stretch’ haslimited repeatability. Klemm et al. (2003) separatedriffle and pool components of a sample to develop asystem for assessing a particular reach on only thedominant habitat of that reach. They found that theMacroinvertebrate Biotic Integrity Index, with its de-velopment based mainly on riffle-dominated sites, hadlower applicability in pool-dominated reaches. Logan& Brooker (1983) reported that effects of particu-late solids were greater on the pool fauna than theriffle fauna. On the other hand, macroinvertebrate as-sessment model for small-sized rivers in the southernItalian Apennines was based on data from depos-itional areas only (Buffagni et al., 2004). Harper et al.(1993) determined functional habitats as useful ap-proach for river conservation bridging the gap betweenbiological and geomorphological surveys. Our resultsshowed that separate assessment of the riffle and poolparts of samples provides additional information use-ful when combined effects of organic pollution andmorphological degradation are to be considered.
344
Acknowledgements
The AQEM project was funded by the EuropeanCommission, 5th Framework Program, Energy, En-vironment and Sustainable Development, Key Ac-tion Water, Contract no. EVK1-CT1999-00027. Wewish to thank S. Nemejc for assistance in the fieldand laboratory works, L. Opatrilova for assistance inthe manuscript preparation, M. Furse and R. Govierfor linguistic correction of the manuscript and twoanonymous reviewers for helpful comments.
References
Allan, J. D., 1995. Stream Ecology – Structure and Function ofRunning Waters. Chapman & Hall, London, 388 pp.
AQEM consortium, 2002. Manual for the application of the AQEMmethod. A comprehensive method to assess European streamsusing benthic macroinvertebrates, developed for the purpose ofthe Water Framework Directive. Version 1.0, February 2002.
Barbour, M. T., J. L. Plafkin, B. P. Bradley, C. G. Graves &R. W. Wiseman, 1992. Evaluation of EPA’s Rapid Bioassess-ment benthic metrics: metric redundancy and variability amongreference stream types. Environ. Toxicol. Chem. 11: 437–449.
Barbour, M. T., J. B. Stribling & J. R. Karr, 1995. The multimetricapproach for establishing biocriteria and measuring biologicalcondition. In Davis, W. S. & T. P. Simon (eds), BiologicalAssessment and Criteria. Tools for Water Resources Planningand Decision Making. Lewis Publishers, Boca Raton, Florida:63–77.
Barbour, M. T., J. Gerritsen, B. D. Snyder & J. B. Stribling, 1999.Rapid bioassessment protocols for use in streams and wadablerivers: periphyton, benthic macroinvertebrates and fish, secondedition. EPA 841-B-99-002. Office of Water, US EnvironmentalProtection Agency, Washington DC.
Baumann, R. W., 1979. Nearctic stonefly genera as indicators ofecological parameters (Plecoptera: Insecta). Great Basin Nat. 39:241–244.
Beisel, J. N., P. Usseglio-Polatera & J. C. Moreteau, 2000. Thespatial heterogeneity of a river bottom: a key factor determ-ining macroinvertebrate communities. Hydrobiologia 422/423:163–171.
Bryce, S. A., R. M. Hughes & P. R. Kaufmann, 2002. Developmentof a bird integrity index: using bird assemblages as indicators ofriparian condition. Environ. Manag. 30: 294–310.
Buffagni, A., S. Erba, M. Cazzola & J. L. Kemp, 2004. The AQEMmultimetric system for the southern Italian Apennines: assess-ing the impact of water quality and habitat degradation on poolmacroinvertebrates in Mediterranean rivers. Hydrobiologia 516:313–329.
Chandler, J. R., 1970. A biological approach to water qualitymanagement. Water Pollut. Control 69: 415–421.
Charvet, S., B. Statzner, P. Usseglio-Polatera & B. Dumont, 2000.Traits of benthic macroinvertebrates in semi-natural Frenchstreams: an initial application to biomonitoring in Europe. Fresh-wat. Biol. 43: 277–296.
Clements, W. H., 1994. Benthic invertebrate community responseto heavy metals in the Upper Arkansas River Basin, Colorado. J.North Am. Benthol. Soc. 13: 30–44.
Cohn, F., 1853. Über lebende Organismen im Trinkwasser. Güns-berg’s Z. Klin. Med. 4: 229–237.
Corkum, L. D. & J. J. H. Ciborowski, 1988. Use of alternative clas-sification in studying broad-scale distributional patterns of loticinvertebrates. J. North Am. Benthol. Soc. 7: 167–179.
Covich, A. P., 1996. Stream biodiversity and ecosystem processes.Bull. North Am. Benthol. Soc. 13: 294–303.
Covich, A. P., M. A. Palmer & T. A. Crowl, 1999. Therole of benthic invertebrate species in freshwater ecosystems:zoobenthic species influence energy flows and nutrient cycling.BioScience 49: 119–127.
Cranston, P. S., 1990. Biomonitoring and invertebrate taxonomy.Environ. Monit. Assessment 14: 265–273.
CSN 75 7221, 1998. Water Quality – Classification of Surface Wa-ter Quality. Czech Technical State Standard, Czech StandardsInstitute, Prague, 10 pp.
CSN 75 7716, 1998. Water Quality, Biological Analysis, Determin-ation of Saprobic Index. Czech Technical State Standard, CzechStandards Institute, Prague, 174 pp.
Dahl, J., R. K. Johnson & L. Sandin, 2004. Detection of or-ganic pollution of streams in southern Sweden using benthicmacroinvertebrates. Hydrobiologica 516: 161–172.
De Pauw, N. P., P. F. Guetti, D. P. Manzini & R. Spaggiari, 1992.Biological assessment methods for running waters. In New-man, P., A. Piavaux & R. Sweeting (eds), River Water Quality:Ecological Assessment and Control. EC, Brussels: 217–248.
DeShon, J. E., 1995. Development and applicability of the inver-tebrate community index. In Davis W.S. & T.P. Simon (eds),Biological Assessment and Criteria: Tools for Water ResourcePlanning and Decision-Making. Lewis Publishers, Boca Raton,Florida.
DEV (Deutsches Institut für Normung e.V.), 1987. Biologisch-ökologische Gewässeruntersuchung (Gruppe M): AllgemeineHinweise, Planung und Durchführung von Fließgewässerunter-suchungen (M1). In Deutsche Einheitsverfahren zur Wasser,Abwasser und Schlammuntersuchung. VCH VerlagsgesellschaftmbH, Weinheim, 13 pp.
DEV (Deutsches Institut für Normung e.V.), 1992. Biologisch-ökologische Gewässeruntersuchung: Bestimmung des Saprobi-enindex (M2). In Deutsche Einheitsverfahren zur Wasser, Ab-wasser und Schlammuntersuchung. VCH VerlagsgesellschaftmbH, Weinheim, 13 pp.
Dolédec, S., B. Statzner & M. Bournard, 1999. Species traits forfuture biomonitoring across ecoregions: patterns along a human-impacted river. Freshwat. Biol. 42: 737–758.
Fore, L. S., J. R. Karr, & R. W. Wisseman, 1996. Assessing in-vertebrate responses to human activities: evaluating alternativeapproaches. J. North Am. Benthol. Soc. 15: 212–231.
Furse, M. T., D. Moss, J. F. Wright & P. D. Armitage, 1984. The in-fluence of seasonal and taxonomic factors on the ordination andclassification of running-water sites in Great Britain and on theprediction of their macro-invertebrate communities. Freshwat.Biol. 14: 257–280.
Gregory, S. V., F. J. Swanson, W. A. McKee & K. W. Cummins,1991. An ecosystem perspective of riparian zones. Bioscience41: 540–551.
Harper D. M., C. D. Smith & P. J. Barham, 1993. Habitats asthe building blocks for river conservation assessment. In Boon,P. J., P. Callow & G. E. Petts (eds), River Conservation andManagement. Wiley & Sons, New York: 311–319.
Hering, D., A. Buffagni, O. Moog, L. Sandin, M. Sommerhäuser, I.Stubauer, C. Feld, R.K. Johnson, P. Pinto, N. Skoulikidis, P. Ver-donschot & S. Zahradkova, 2002. The development of a systemto assess the ecological quality of streams based on macroinver-

345
tebrates – design of the sampling programme within the AQEMproject. Int. Rev. Hydrobiol.
Hering, D., O. Moog, L. Sandin & P. F. M. Verdonschot, 2004.Overview and application of the AQEM assessment system.Hydrobiologia 516: 1–20.
Hildrew, A. G., C. R. Townsend & A. Hasham, 1985. The predatoryChironomidae of ironrich stream: feeding ecology and food webstructure. Ecol. Entomol. 10: 403–414.
Hill, M. O., 1979. TWINSPAN – A FORTRAN program forarranging multivariate data in an ordered two-way table by clas-sification of individuals and attributes. Cornell University Ithaca,N.Y., 90 pp.
Hill, B. H., A. T. Herlihy, P. R. Kaufmann, R. J. Stevenson, F.H. McCormick & C. B. Johnson, 2000. Use of periphyton as-semblage data as an index of biotic integrity. J. North Am.Benthol. Soc. 19: 50–67.
Hynes, H. B. N., 1960. The Biology of Polluted Waters. LiverpoolUniversity Press, Liverpool.
Inman, D. L., 1949. Sorting of sediments in the light of fluidmechanics. J. Sediment Petrol. 19: 51–70.
Karr, J. R. & E. W. Chu 1999. Restoring Life in Running Waters:Better Biological Monitoring. Island Press, Washington D.C.
Kerans, B. L. & J. R. Karr, 1994. A benthic index of biotic integrity(B-IBI) for rivers of the Tennessee Valley. Ecol. Appl. 4: 768–785.
Klemm, J. D., K. A. Blocksom, F. A. Fulk, A. T. Herlihy, R. M.Hughes, P. R. Kaufmann, D. V. Peck, J. L. Stoddard, W. T.Thoeny, M. B. Griffith & W. S. Davis, 2003. Development andevaluation of a macroinvertebrate biotic integrity index (MBII)for regionally assessing mid-atlantic highlands streams. Environ.Manag. 31: 656-669.
Kolkwitz, R. & M. Marsson, 1902. Grundsätze für die biologischeBeurteilung des Wassers nach seiner Flora und Fauna. Mitt. ausd. Kgl. Prüfungsanstalt für Wasserversorgung u. Abwasserbesei-tigung, Berlin 1: 33–72.
Lammert, M. & J. D. Allan, 1999. Assessing biotic integrity ofstreams: Effects of scale in measuring the influence of landuse/cover and habitat structure on fish and macroinvertebrates,Environ. Manag. 23: 257–270.
Lenat, D. R. & D. L. Penrose, 1996. History of the EPT taxa richnessmetric. Bull. North Am. Benthol. Soc. 13: 305–307.
Logan P. & M. P. Brooker, 1983. The macroinvertebrate faunas ofriffles and pools. Wat. Res. 17: 263–270.
Metcalfe, J. L., 1989. Biological water quality assessment of run-ning waters based on macroinvertebrate communities: historyand present status in Europe. Envir. Pollut. 60: 101–139.
Metcalfe-Smith, J. L., 1994. Biological water quality assessmentof rivers: use of macroinvertebrate communities. In Calow, P.& G. E. Petts (eds), The Rivers Handbook, Hydrological andEcological Principles, Volume 2. Blackwell Science, Oxford:144–170.
Meyer, J. L. & C. Johnson, 1983. The influence of elevated ni-trate concentration on rate of leaf decomposition in a stream.Freshwat. Biol. 13: 177–183.
Miller, D. L., P. M. Leonard, R. M. Hughes, J. R. Karr, P. R. Moyle,L. H. Schrader, B. A. Thompson, R. A. Daniels, K. D. Fausch, G.A. Fitzhugh, J. R. Gammon, D. B., Halliwell, P. L. Angermeier& D. J. Orth, 1988. Regional applications of an index of bioticintegrity for use in water resource management. Fisheries 13: 12–20.
Moss, D., M. T. Furse, J. F. Wright, P. D. Armitage, 1987. Theprediction of the macroinvertebrate fauna of unpolluted running-water sites in Great Britain using environmental data. Freshwat.Biol. 17: 41–52.
Newbold, J. D., J. W. Elwood, R. V. O’Neil & W. Van Winkle, 1982.Nutrient spiralling in streams: Implications for nutrient limitationand invertebrate activity. Am. Nat. 120: 628–652.
Ofenböck, T., O. Moog, J. Gerritsen & M. Barbour, 2004. A stressorspecific multimetric approach for monitoring running waters inAustria using benthic macro-invertebrates. Hydrobiologia 516:251–268.
ÖNORM M 6232, 1997. Richtlinien für die ökologische Unter-suchung und Bewertung von Fließgewässern. ÖsterreichischesNormungsinstitut, Wien, 84 pp.
Rawer-Jost, C., J. Böhmer, J. Blank & H. Rahman, 2000. Macroin-vertebrate functional feeding group methods in ecological as-sessment. Hydrobiologia 422/423: 225–232.
Resh, V. H. & E. P. McElravy, 1993. Contemporary quantitative ap-proaches to biomonitoring using benthic macroinvertebrates. InRosenberg D. M. & V. H. Resh (eds), Freshwater Biomonitoringand Benthic Macroinvertebrates. Chapman and Hall, New York;159–194.
Resh, V. H., R. H. Norris & M. T. Barbour, 1995. Design and im-plementation of rapid assessment approaches for water resourcemonitoring using benthic macroinvertebrates. Aust. J. Ecol. 20:108–121.
Resh, V. H., D. M. Rosenberg, & T. B. Reynoldson, 2000. Selectionof benthic macroinvertebrate metrics for monitoring water qual-ity of the Fraser River, British Columbia: implications for bothmultimetric approaches and multivariate models. In Wright J. F.,D. W. Sutclife & M. T. Furse (eds), Assessing the BiologicalQuality of Fresh Waters. Freshwater Biological Association,Ambleside: 195–206.
Rolauffs, P., I. Stubauer, S. Zahrádkova, K. Brabec & O. Moog,2004. Integration of the saprobic system into the European UnionWater Framework Directive: Case studies in Austria, Germanyand Czech Republic. Hydrobiologia 516: 285–298.
Rosenberg, D. M. & V. H. Resh (eds), 1993. Introduction. In Rosen-berg, D. M. & V. H. Resh (eds). Freshwater Biomonitoring andBenthic Macroinvertebrates. Chapman and Hall, New York: 1–9.
Rotschein, J., 1982. Nove metody stanoveni indexu saprobity. [Newmethods of saprobic index assessment]. Vodni hospodarstvi B 6:159–162.
Roy, A. H., A. D. Rosemond, M. J. Paul & J. B. Wallace, 2003.Stream macroinvertebrate response to catchment urbanisation(Georgia, U.S.A.). Freswat. Biol. 48: 329–346.
Schweder, H., 1990. Neue Indizes für die Bewertung des öko-logischen Zustandes von Fliessgewässern abgeleitet aus derMakroinvertebraten-Erährungstypologie. In Fridriech, G. & J.Lacombe (eds), Ökologische Bewertung von Fliessgewässern. G.Fisher Verlag, Stuttgart, Limnologie aktuell 3: 353–377.
Scarsbrook, M. R. & C. R. Townsend, 1993. Stream communitystructure in relation to spatial and temporal variation: a habitattemplet study of two contrasting New Zealand streams. Freshwat.Biol. 29: 395–410.
Schmidt-Kloiber, A. & R. C. Nijboer, 2004. The effect of taxonomicresolution on the assessment of ecological water quality classes.Hydrobiologia 516: 269–283.
Sladecek, V., 1973. System of water quality from the biologicalpoint of view. Arch. Hydrobiol. Beih. Ergebnisse der Limnologie7, pp. 218.
Sneath, P. H. A. & R. R. Sokal, 1973. Numerical Taxonomy: thePrinciples and Practice of Numerical Classification. Freeman,San Francisco.
Statzner, B. & F. Sperling, 1993. Potential contribution of system-specific knowledge (SSK) to stream management decission:ecological and economic aspects. Freshwat. Biol. 29: 313–342.

346
ter Braak, C. J. F., 1986. Canonical correspondence analysis: a neweigenvector technique for multivariate direct gradient analysis.Ecology 67: 1167–1179.
ter Braak, C. J. F. & I. C. Prentice, 1988. A theory of gradientanalysis. Adv. Ecol. Res. 18: 272–317.
Verdonschot, P. F. M. & R. C. Nijboer, 2004. Testing the Europeanstream typology of the Water Framework Directive for macroin-vertebrates. Hydrobiologia 516: 35–54.
Vinson, M. R. & C. P. Hawkins, 1998. Biodiversity of stream in-sects: Variation at local, basin and regional scales. Annu. Rev.Entomol. 43: 271–293.
Ward, J. V., 1992. Aquatic Insect Ecology, Biology and Habitat.Wiley & Sons, New York: 438 pp.
Wood, P. J. & P. D. Armitage, 1997. Biological effects of finesediment in the lotic environment. Environ. Manag. 21: 203–217.
Zelinka, M. & P. Marvan, 1961. Zur Präzisierung der biologis-chen Klassifikation der Reinheit fließender Gewässer. Arch.Hydrobiol. 57: 389–407.
Copyright © 2022 FDOKUMEN