
Energy and tourism in Hawaii
12
Pergamon Annals of Tourism Research, Vol. 24, No. 2, 390-401, 1997 pp. 0 1997 Elsevier Science Ltd Printed in Great Britain. All rights reserved 0160.7383/97 $17.00+0.00 PII:SO160-7383(96)00059-X ENERGY AND TOURISM IN HAWAII Natalia Tabatchnaia-Tamirisa Matthew K. Loke PingSun Leung Ken A. Tucker University of Hawaii at Manoa, USA Abstract: This paper explores the linkage between energy use and a tourism destination experiencing a rapid growth in visitors arrivals and changing visitor mix. The approach taken is to estimate the derived demand for a primary input (energy) using input-output analysis. The main finding of the study is that tourists account for a significant share (averaging 60%) of total energy and fuel use in Hawaii. Since foreign and domestic tourists, on average, use energy and fuel with different intensity, a rising proportion of foreign tourists in the total mix of tourists is predicted to increase the demand for energy and fuel in Hawaii by the end of the century. Keywords: energy demand, input-utput model, Hawaii. 0 1997 Elsevier Science Ltd. All rights reserved R&urn& I?nergie et tourisme en Hawaii. L’article examine le rapport entre I’utilisation de I’tnergie et one destination touristique qui subit one croissance rapide d’arrivCes de visiteurs et on changement de mtlange de visiteurs. On aborde le sujet en estimant la demande dtrivCe pour I’Cnergie primaire et en utilisant one analyse des &changes interindustriels. Le rtsultat principal de I’ttude est que les touristes reprksentent one part significative (60% en moyenne) de I’utilisation totale d’tnergie et de combustibles en Hawaii. Puisque les touristes inttrieurs et internationaux, en moyenne, utilisent I’tnergie et les combustibles B des niveaux diffkrents, one plus grande proportion de touristes &rangers indique que la demande pour I’tnergie et les combustibles va s’intensifier. Mots-cl&: Cnergie, demande, modPle des Cchanges inter- industriels, Hawaii. 0 1997 Elsevier Science Ltd. All rights reserved INTRODUCTION Tourism has been the leading source of Hawaii’s export earnings since 1972. In 1992, some 6.5 million visitors to the islands collectively spent US$9.5 billion (all dollars hereafter are US$). Relative to Hawaii’s gross state product, this visitor spending figure is 32.6%, more than double its comparable ratio of 15.83% in 1972. The tourism industry is also one of the largest consumers of energy, particularly the urban tourism segment, which includes meetings-incentive- convention-exhibition and also sun-sand-surf pursuits. Directly and indirectly the industry absorbs up to 40% of total energy demand in Hawaii. The importance of energy to tourism is beyond debate. Energy literally sustains Hawaii’s tourism economy-from the bright neon All authors are at the University of Hawaii at Manoa, Natalia Tabatchnaia-Tamirisa is a Ph.D. candidate in economics; Matthew Lake was a researcher in the School of Travel Industry Management; PingSun Leung is Professor of Agricultural and Resource Economics (Depart- ment of Agricultural and Resource Economics, University of Hawaii at Manoa, Honolulu HI 96822, USA. Email [email protected]); and Ken Tucker was Matson Navigation Company Distinguished Professor of Travel Industry Management. 390
-
Upload
manoa-hawaii -
Category
Documents
-
view
1 -
download
0
Transcript of Energy and tourism in Hawaii
Pergamon
Annals of Tourism Research, Vol. 24, No. 2, 390-401, 1997 pp. 0 1997 Elsevier Science Ltd
Printed in Great Britain. All rights reserved 0160.7383/97 $17.00+0.00
PII:SO160-7383(96)00059-X
ENERGY AND TOURISM IN HAWAII
Natalia Tabatchnaia-Tamirisa Matthew K. Loke
PingSun Leung Ken A. Tucker
University of Hawaii at Manoa, USA
Abstract: This paper explores the linkage between energy use and a tourism destination experiencing a rapid growth in visitors arrivals and changing visitor mix. The approach taken is to estimate the derived demand for a primary input (energy) using input-output analysis. The main finding of the study is that tourists account for a significant share (averaging 60%) of total energy and fuel use in Hawaii. Since foreign and domestic tourists, on average, use energy and fuel with different intensity, a rising proportion of foreign tourists in the total mix of tourists is predicted to increase the demand for energy and fuel in Hawaii by the end of the century. Keywords: energy demand, input-utput model, Hawaii. 0 1997 Elsevier Science Ltd. All rights reserved
R&urn& I?nergie et tourisme en Hawaii. L’article examine le rapport entre I’utilisation de I’tnergie et one destination touristique qui subit one croissance rapide d’arrivCes de visiteurs et on changement de mtlange de visiteurs. On aborde le sujet en estimant la demande dtrivCe pour I’Cnergie primaire et en utilisant one analyse des &changes interindustriels. Le rtsultat principal de I’ttude est que les touristes reprksentent one part significative (60% en moyenne) de I’utilisation totale d’tnergie et de combustibles en Hawaii. Puisque les touristes inttrieurs et internationaux, en moyenne, utilisent I’tnergie et les combustibles B des niveaux diffkrents, one plus grande proportion de touristes &rangers indique que la demande pour I’tnergie et les combustibles va s’intensifier. Mots-cl&: Cnergie, demande, modPle des Cchanges inter- industriels, Hawaii. 0 1997 Elsevier Science Ltd. All rights reserved
INTRODUCTION
Tourism has been the leading source of Hawaii’s export earnings since 1972. In 1992, some 6.5 million visitors to the islands collectively spent US$9.5 billion (all dollars hereafter are US$). Relative to Hawaii’s gross state product, this visitor spending figure is 32.6%, more than double its comparable ratio of 15.83% in 1972. The tourism industry is also one of the largest consumers of energy, particularly the urban tourism segment, which includes meetings-incentive- convention-exhibition and also sun-sand-surf pursuits. Directly and indirectly the industry absorbs up to 40% of total energy demand in Hawaii. The importance of energy to tourism is beyond debate. Energy literally sustains Hawaii’s tourism economy-from the bright neon
All authors are at the University of Hawaii at Manoa, Natalia Tabatchnaia-Tamirisa is a Ph.D. candidate in economics; Matthew Lake was a researcher in the School of Travel Industry Management; PingSun Leung is Professor of Agricultural and Resource Economics (Depart- ment of Agricultural and Resource Economics, University of Hawaii at Manoa, Honolulu HI 96822, USA. Email [email protected]); and Ken Tucker was Matson Navigation Company Distinguished Professor of Travel Industry Management.
390

TABATCHNAIA-TAMIRISA ET AL 391
lights in Waikiki to neighbor island flights which transport ecotourists to their intended destinations.
However, there is a glaring lack of understanding on the linkages between tourism development and energy use in the state. In the past, most studies on energy in the state have focused on end-use consumption by residents. There has been only one study (Leung and Hsu 1984) in the literature on intermediate demand of energy in Hawaii. In that study, the authors constructed an energy flow matrix to identify energy use pattern in Hawaii, and then examined the economic impacts of energy shortages using a linear programing input-output (I-O) model.
Despotakis and Fisher (1988) evaluated the effects of energy shocks on a regional economy in California using a computable general equilibrium model. They found that following an upward energy price shock, substitutability of energy inputs lead to higher sectoral input intensities and lower gross output in the economy. Gidwani (1974), in a study on the effects of a fuel crisis on tourism in India, found adverse effects with respect to long-haul air travel. However, the windfall gains accruing to Arab countries as a result of higher oil prices stimu- lated more travel to India. All things considered, the OPEC oil shock had no predictable impact on tourism in India. In another country- specific study, Hollander, Threlfall and Tucker (1982) estimated the energy demands generated by tourist expenditures in Australia. Using an I-O approach and scenario analysis, the authors concluded that tourism is energy-intensive, consuming a much higher proportion of total energy than the contributions of tourism to Australia’s gross domestic product.
This paper extends the analysis to a situation where rapid tourism growth has outpaced growth in the host population. It is apparent in Hawaii today that slightly over I million local residents share their resources with 6 million visitors from elsewhere annually. In other words, there are approximately 150,000 tourists present within the state at any given time. Given the state’s population of 1.2 million, this indicates that 1 out of 8 people present randomly in Hawaii, on any given day, is a tourist.
Since there has been a lack of research done on tourism growth and its derived demand on energy, this paper adds to the literature by providing a methodological framework for estimating energy demands generated by the rapidly growing tourist arrivals and their expen- ditures. Specifically, this paper examines the extent of energy usage by industries supplying tourism-related services. The approach taken is to estimate the derived demand for a primary input (energy) using I-O analysis.
This investigation is crucial considering that tourism is energy- intensive, and that future growth in the industry will be of concern to energy planners and suppliers alike. In addition, the demand for travel to a competitive destination may be affected by the energy cost component of key services, such as transportation, hotel, and retail trade. This question becomes more significant to Hawaii because the total consumption of energy has steadily increased in the past two decades while energy consumption for residential purposes has

392 ENERGY AND TOURISM
remained unchanged. Available data suggest the demand for energy in Hawaii is driven by the transportation sector (Figure 1).
Furthermore, the changing mix of visitors to Hawaii may lead to changing energy-intensity in some types of services and structural adjustment problems on the supply side may arise. From a policy standpoint, changes in energy consumption patterns arising from a changing visitors mix present new challenges to managing Hawaii’s energy requirement. Many fuel types consumed in the tourism trade are industry specific and are non-substitutable in nature. Air trans- port, for example, depends exclusively on aviation fuel, while hotels and retail trade count on electricity for their energy needs. Since 92% of Hawaii’s energy is generated from imported petroleum, it is conceivable that an inadequate supply of fuel types to certain tourism- intensive sectors could adversely affect the degree of competitiveness in tourism-related services. This, in turn, would inflict negative conse- quences on Hawaii’s tourism economy.
ENERGY AND TOURISM
Methodology and Data
This study used the 1987 Hawaii input-output table (HI-O), the latest table developed by the State Department of Business, Economic Development and Tourism (State of Hawaii 1993b). The HI-O was collapsed to the same 26 sectors as in Leung and Hsu (1984). The use of I-O analysis imposes familiar restrictive assumptions on the study-that is, fixed market structure, the state of technology, rela- tive prices, and geographic distribution of economic interaction, as well as the elastic supply of inputs and demand for outputs. Due to
n Residential
+ Commercial 300
r
% Industrial
q Transportation x’ X-X
/ ‘x
250
i
x Total consumption X-X
’ \ /
X-X / x-x-x
” 70 71 72 73 74 75 76 77 78 79 80 81 82 83 85 85 86 87 88 89 90 91
Year
Figure 1. Consumption of Energy in Hawaii by End-Use Sector, 1970-91
TABATCHNAIA-TAMIRISA ET AL 393
its restrictive assumptions, the I-O analysis ignores price variation. One possible extension of this paper is to supplement the I-O analysis with an econometric estimation of the price elasticity.
Another basic element of this study, an “energy matrix”, was con- structed following Leung and Hsu (1984). The energy matrix was developed both in absolute and coefficient form. In absolute form, the elements of the energy matrix represent estimates of energy and fuel use in specific industries, as well as in final demand and total output. In coefficient form, elements of the energy matrix represent inter- mediate and final energy and fuel requirements per dollar of industry output and final demand.
Energy and fuel estimates were based primarily on the records of the Energy Division of the Hawaii State Department of Business, Economic Development and Tourism (State of Hawaii 1987). Elec- tricity use was estimated using the records of the Hawaii Electric Company (HECO) and other electric companies (HECO 1987; KECO 1987; MECO 1987). Based on the State of Hawaii Energy Division records (State of Hawaii 1987), energy and fuel use was broken down by the components of final demand including residents, tourists, defense, federal, state, and local governments. Energy and fuel use by industry and components of final demand in 1987 was compared to the corresponding data for 1977 from Leung and Hsu (1984). The study attempted to relate changes in energy and fuel use in 1977-87 to changes in real output and changes in the efficiency of energy/fuel use. The efficiency of energy/fuel use was defined as a ratio of energy/ fuel use to real output.
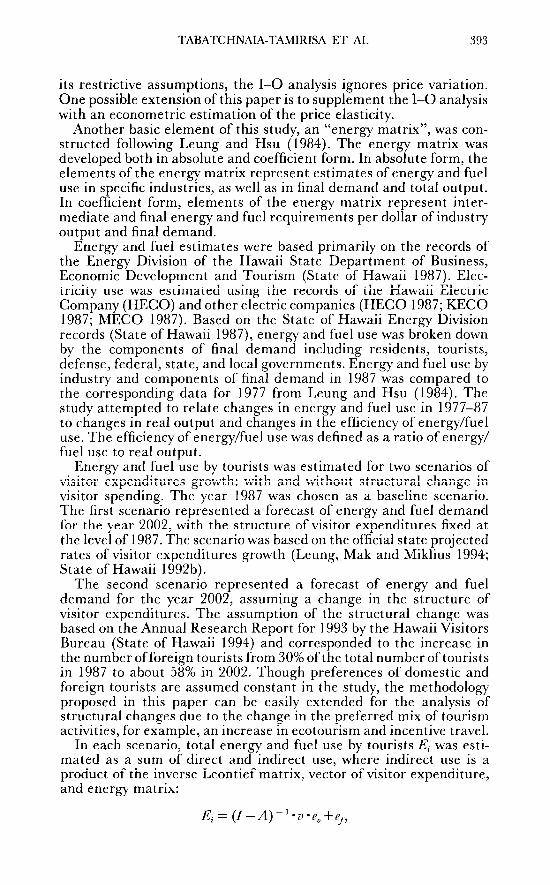
Energy and fuel use by tourists was estimated for two scenarios of visitor expenditures growth: with and without structural change in visitor spending. The year 1987 was chosen as a baseline scenario. The first scenario represented a forecast of energy and fuel demand for the year 2002, with the structure of visitor expenditures fixed at the level of 1987. The scenario was based on the official state projected rates of visitor expenditures growth (Leung, Mak and Miklius 1994; State of Hawaii 1992b).
The second scenario represented a forecast of energy and fuel demand for the year 2002, assuming a change in the structure of visitor expenditures. The assumption of the structural change was based on the Annual Research Report for 1993 by the Hawaii Visitors Bureau (State of Hawaii 1994) and corresponded to the increase in the number offoreign tourists from 30% of the total number of tourists in 1987 to about 58% in 2002. Though preferences of domestic and foreign tourists are assumed constant in the study, the methodology proposed in this paper can be easily extended for the analysis of structural changes due to the change in the preferred mix of tourism activities, for example, an increase in ecotourism and incentive travel.
In each scenario, total energy and fuel use by tourists Ei was esti- mated as a sum of direct and indirect use, where indirect use is a product of the inverse Leontief matrix, vector of visitor expenditure, and energy matrix:
Ej = (I-A)-‘*v*e,+ef-,

394 ENERGY AND TOURISM
where E, = 1 x 4 vector of total energy/fuel use by tourists by
energy/fuel type; (I-A) -’ = Leontief inverse, a 26 x 26 matrix; u = 26 x 1 vector of
visitor expenditure; e, = 26 x 4 energy matrix by industry; ef= 1 x 4 energy vector of final demand by tourists.
In addition, both scenarios assume that average spending per day and average length of stay of domestic and foreign tourists were fixed. Average spending per day and the length of stay for Japanese tourists (State of Hawaii 1992b) were chosen as a proxy for the respective data for foreign tourists. Such approximation was justified, as Japanese accounted for about 60% of the total number of foreign visitors, and the data on non-Japanese expenditure patterns were not available. Additionally, Japanese tourists are an appropriate representation of the rapidly growing Asian market, which prefers urban attractions and generally a shorter length of stay than Hawaii’s habitual Westbound market.
Study Results
Based on the matrix of total energy use and the data on inter- industry flows, it is straightforward to estimate direct and indirect energy use by tourists in Hawaii. The sensitivity of estimated energy use by tourists can be evaluated by varying parameters of number and mix of tourists.
Table 1 presents estimates of energy and fuel use in 1987 and average annual percentage change in energy and fuel use from 1977 to 1987. The constructed energy matrix for 1987 shows that total demand for all categories of energy and fuel increased from 1977 to 1987. Total demand for electricity and aviation fuel was rising at an average rate of 3% per year, whereas total demand for gasoline and other fuels (including diesel fuel, residual fuel, liquefied gas, bagasse, and hydropower) was rising at an average rate of 2% per year. The increase in total demand for energy and fuel in some categories was
Table 1. Hawaii Aggregate Energy Matrix, 1987
Demand Electricity Gasoline Aviation Fuel Other Fuels”
(GWh) (x10’BTU) (xlO”BTU) (xlO”BTU)
Intermediate Demand 4,278 10,774 90,592 134,560
(5? (- l)b (4)b (2)” Final Demand 3,441 36,037 26,581 18,965
(0)b (2)h (3)b (2)h Total Demand 7,719 46,8 11 117,173 153,525
(3)h (2)” (3)b (2)b
“Other fuels include diesel fuel, residual fuel, liquified gas, bagasse, hydropower, etc. ‘Average annual percentage change from 1977 to 1987. ‘Numbers may not sum up due to rounding.

TABATCHNAIA-TAMIRISA ET AL 395
caused primarily by an increase in only one component of total demand: either intermediate or final demand. Intermediate (or indirect) demand refers to inter-industry use of energy and fuel as inputs into the production of final goods and services. Final demand is direct use of energy and fuel by consumers. In particular, final demand for electricity including demand by residents, tourists, local, state, and federal government remained almost stable (i.e., average annual growth rate is about 0.004%), and intermediate demand for gasoline was falling at an average rate of 1% per year. One possible explanation of these changes is a demand response to rising prices for electricity and gasoline.
Next energy and fuel use per dollar of industry output and final demand is considered. Intermediate use per dollar of industry output is the highest for other fuels (5760 BTU/$) followed by aviation fuel (3970 BTU/$), gasoline (470 BTU/$), and electricity (0.19 GWh/$). Final consumers intensively use gasoline (1290 BTU/$), aviation fuel (430 BTU/$), and electricity (0.19 GWh/$). Overall, other fuels and aviation fuel are used most intensively followed by gasoline and elec- tricity. This result is not surprising, since other fuels and aviation fuel are used mostly in energy-intensive industries (e.g., air transport and electricity generation).
As a percentage of total demand, intermediate and final demand for energy and fuel vary. Among all categories of energy and fuel, proportions of electricity use in intermediate and final demand are most balanced: 59% in intermediate and 4 1% in final. Gasoline is used primarily in final demand (77%), w ereas most aviation fuel and other h fuels are directed for intermediate purposes (77 and 83% cor- respondingly).
Estimates of energy and fuel use by the components of final demand (i.e., residents, tourists, defense, federal government, state, and local government) are shown in Table 2. Electricity is used primarily by residents and defense (66 and 24%, respectively). Gasoline is the only energy component that tourists purchase directly for transportation. Residents and tourists account for the largest share of final demand for gasoline (56 and 33%, respectively). The remaining share is allocated among defense, federal, state, and local government. Final demand
Table 2. Direct Energy Use by the Components of Final Demand in Hawaii, 1987
Components of Electricity Gasoline Aviation Fuel Other Fuels”
Final Demand (GWh) (xlO”BTU) (xlOqBTU) (xlO”BTU)
Residents 2,369 20,278 0 18,211
Tourists 0 11,920 0 0
Defense 740 2,809 26,577 264 Federal Govt. 32 94 4 130
State and Local Govt. 300 936 0 360
Total 3,441 36,037 26,581 18,965
“Other fuels include diesel fuel, residual fuel, liquified gas, bagasse, hydropower, etc.

396 ENERGY AND TOURISM
Table 3. Direct Energy Use/$ of Final Demand in Hawaii, 1987
Components of
Final Demand
Electricity Gasoline Aviation Fuel Other Fuels”
(GWh/$ ( x 10” BTU/$ ( x 10’ BTU/$ ( x 10’ BTU/$
conk ‘82) const. ‘82) const. ‘82) const. ‘82)
Residents 0.24 2.02 0.00 1.81 Tourists 0.00 1.99 0.00 0.00 Defense 0.37 1.39 13.17 0.13 Federal Govt. 0.23 0.68 0.03 0.93 State and Local Govt. 0.12 0.36 0.00 0.14
“Other fuels include diesel fuel, residual fuel, liquified gas, bagasse, hydropower, etc.
for aviation fuel is almost solely used by the defense sector, whereas other fuels are used mostly by residents (96%).
Table 3 presents estimates of energy and fuel use per dollar of final demand. Electricity is used most intensively by defense, followed by federal government and residents. Gasoline use per dollar of final demand is similar for tourists and residents and is higher compared with that of defense, federal, state, and local government. Per dollar use of aviation fuel by defense is the highest across components of final demand and energy types.
Energy and fuel use by tourists in 1987 (i.e., the baseline scenario) was estimated using the data on total real visitor expenditures (dom- estic and foreign). Visitor expenditure measured in constant 1982 dollars is $3?916 million for domestic tourists and $1,828 million for foreign tourists. The results of the I-O analysis (Table 4) compared to the energy matrix (Table 1) show that demand by tourists accounts for a significant share of total demand for energy and fuel, in particular 22% for electricity, 33% for gasoline, 68% for aviation fuel, and 18% for other fuels. Clearly, the demand for transportation services by
Table 4. Direct and Indirect Energy Use by Tourists, 1987
Electricity Gasoline Aviation Fuel Other Fuels”
(GWh) ( x 10” BTU) ( x 10” BTU) ( x IO” BTU)
Domestic Tourists: Direct 0 7,788 0 0 Indirect 1,005 2,470 39,789 17,211 Total 1,005 10,258 39,789 17,211
Foreign Tourists: Direct 0 4,132 0 0 Indirect 623 1,219 39,386 10,164 Total 623 5,351 39,386 10,164
Total: Direct 0 11,920 0 0 Indirect 1,628 3,689 79,175 27,375 Total 1,628 15,609 79,175 27,375
“Other fuels include diesel fuel, residual fuel, liquified gas, bagasse, hydropower, etc.

TABATCHNAIA-TAMIRISA ET AL 397
tourists generates their respective demand for gasoline and aviation fuel.
This result reflects the high dependence of Hawaii’s economy on tourists: the ratio of host to guest population is about 1:6. Demand by domestic tourists constitutes a major part of the total demand for energy and fuel by tourists, specifically 61% for electricity, 66% for gasoline, 50% for aviation fuel, and 63% for other fuels. The reason for domestic tourists’ demand for energy exceeding that of foreign tourists is in the larger percentage of domestic than foreign tourists out of total number of tourists. In 1987 domestic tourists constituted about 68% and foreign tourists 32% of the total number of tourists in Hawaii.
Estimates of direct and indirect energy use by tourists per dollar of visitor expenditures (Table 5) show that for most types of energy and fuel, domestic and foreign tourists have different patterns of use. On average, a foreign tourist uses energy and fuel more intensively than a domestic tourist. In particular, foreign tourists’ indirect use of aviation fuel per dollar of visitor expenditures is about twice as high as that of domestic tourists (21,550 vs. 10,160 BTU/constant 1982 $), that is not surprising considering a longer flight distance for foreign tourists.
Indirect use of electricity per dollar of visitor expenditures is about 24% higher for foreign tourists than for domestic tourists (0.34 vs. 0.26 kwhlconstant 1982 $). This is due to differences in the spending patterns by foreign and domestic tourists on such electricity-intensive activities as hotels, retail trade, eating, and drinking. Indirect use of gasoline is similar for domestic and foreign tourists, and a 5% dif- ference can be also explained by differences in the patterns of spend- ing by domestic and foreign tourists and the low gasoline-intensity of the hotel, retail trade, and eating and drinking industries.
Table 5. Direct and Indirect Energy Use by Tourists per Dollar of Visitor Expenditure
Electricity
(GWh)
Domestic Tourists: Direct 0
Indirect 0.26
Total 0.26
Foreign Tourists: Direct 0
Indirect 0.34
Total 0.34
Total: Direct 0
Indirect 0.28
Total 0.28
Gasoline Aviation Fuel Other Fuels”
( x 10” BTU) ( x 10’ BTU) ( x 10q BTU)
1.99 0 0
0.63 10.16 4.39
2.62 10.16 4.39
2.26 0 0
0.67 21.55 5.56
2.93 21.55 5.56
2.08 0 0
0.64 13.78 4.77
2.72 13.78 4.77
“Other fuels include diesel fuel, residual fuel, liquified gas, bagasse, hydropower, etc.
398 ENERGY AND TOURISM
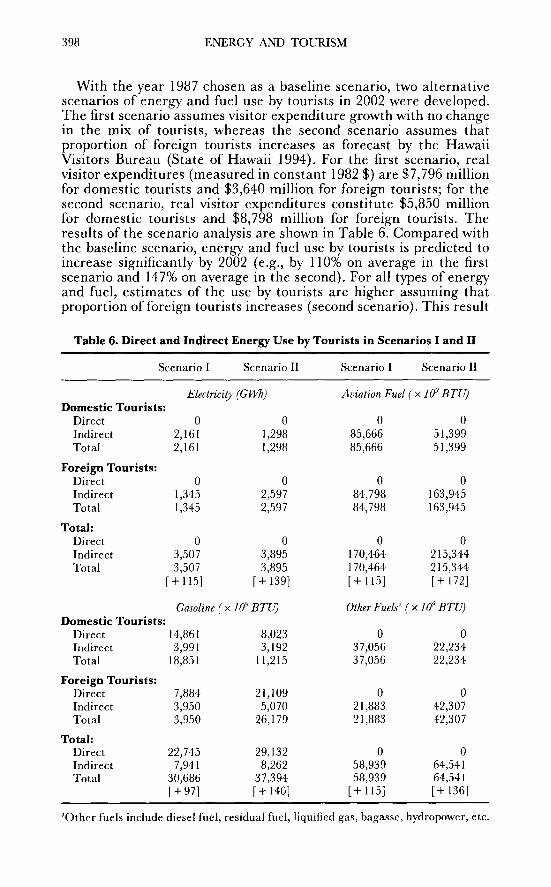
With the year 1987 chosen as a baseline scenario, two alternative scenarios of energy and fuel use by tourists in 2002 were developed. The first scenario assumes visitor expenditure growth with no change in the mix of tourists, whereas the second scenario assumes that proportion of foreign tourists increases as forecast by the Hawaii Visitors Bureau (State of Hawaii 1994). For the first scenario, real visitor expenditures (measured in constant 1982 $) are $7,796 million for domestic tourists and $3,640 million for foreign tourists; for the second scenario, real visitor expenditures constitute $5,850 million for domestic tourists and $8,798 million for foreign tourists. The results of the scenario analysis are shown in Table 6. Compared with the baseline scenario, energy and fuel use by tourists is predicted to increase significantly by 2002 (e.g., by 110% on average in the first scenario and 147% on average in the second). For all types of energy and fuel, estimates of the use by tourists are higher assuming that proportion of foreign tourists increases (second scenario). This result
Table 6. Direct and Indirect Energy Use by Tourists in Scenarios I and II
Scenario I Scenario II Scenario I Scenario II
Electricip (G Wh) Domestic Tourists:
Direct 0 0
Indirect 2,161 1,298
Total 2,161 1,298
Foreign Tourists: Direct 0 0
Indirect 1,345 2,597
Total 1,345 2,597
Total: Direct 0 0
Indirect 3,507 3,895
Total 3,507 3,895
[+115] [+ 1391
Gasoline (X 10’ BTU) Domestic Tourists:
Direct 14,861 8,023 Indirect 3,991 3,192 Total 18,851 11,215
Foreign Tourists: Direct 7,884 21,109 Indirect 3,950 5,070 Total 3,950 26,179
Total: Direct 22,745 29,132 Indirect 7,94 1 8,262 Total 30,686 37,394
r+971 [+140]
Aviation Fuel (X I@ BTU)
0 0 85,666 51,399 85,666 51,399
0 0 84,798 163,945
84,798 163,945
0 0 170,464 2 15,344 170,464 215,344 [+ 1151 [+ 1721
Other Fuels” (x I@ BTU)
0 0 37,056 22,234 37,056 22,234
0 0 21,883 42,307 21,883 42,307
0 0 58,939 64,54 1 58,939 64,54 1
[+115] [+ 1361
“Other fuels include diesel fuel, residual fuel, liquified gas, bagasse, hydropower, etc.

TABATCHNAIA-TAMIRISA ET AL 399
is consistent with the earlier finding that foreign tourists use energy and fuel more intensively on average than domestic tourists.
CONCLUSION
Hawaii as a leading destination is famed for its scenic natural environment and its well-equipped tourism facilities, amenities, and overall infrastructure. As tourism products are constantly changing, Hawaii may have to adapt to new market challenges. However, the state is unlikely to deviate from its primary composition of sun-sand- surf features with excellent tourism facilities for shipping, dining and entertainment, and rural and ocean adventure with natural outdoor activities. Urban tourism is energy intensive and will continue to grow with new facilities such as the Honolulu Convention Center. Though rural and ocean adventure tourism is less energy intensive, it still requires fuel to transport tourists, mostly inter-island flights and boat charters. Hence, the growth of the industry has important impli- cations for energy and fuel demand in Hawaii.
The study evaluates energy demand by tourists in Hawaii using the HI-O model. This model traces inter-industry flows of goods and services, enabling the estimation of tourism-generated energy, fuel demand at various stages of production, and final demand. The main finding of the study is that tourists account for a significant share (a weighted average of about 405) of the total energy and fuel use in Hawaii. Foreign tourists generate about 60% of the total energy and fuel demand by visitors in Hawaii. Since foreign and domestic tourists, on average, use energy and fuel with different intensity, a rising proportion of foreign tourists in the total mix is predicted to increase the demand for energy and fuel in Hawaii, particularly gasoline and aviation fuel, by the end of the century. This long-run demand trend will exert an upward pressure on energy and fuel prices, particularly for gasoline and aviation fuel.
Policy implications of the study are primarily supply-side related. First, an increase in the total number of tourists generates added demand pressure for energy and fuel. Assuming no technological change, a scenario analysis indicated that the elasticity of demand for energy and fuel with respect to the total number of tourists is 1.0 (unitary-elastic). Matching the supply of energy and fuel with the rising demand will be contingent upon the availability of energy pro- duction capacity, storage, and infrastructure. In the long-run, however, energy- and fuel-supplying industries can be expected to adjust to the demand change by restructuring their output and prices.
Second, a change in the domestic-foreign tourist mix results in a changing mix of energy and fuel types demanded. Keeping technology constant, a 1% increase in the number of foreign tourists results in an increase in electricity consumption of about 0.9%, gasoline consumption increases by about 1.7%, and aviation fuel consumption rises by 2.2%. This changing demand, leading to different growth rates in the production of various energy and fuel types, will require a certain adjustment of existing production and conversion tech-
400 ENERGY AND TOURISM
nologies, and may change energy and fuel production costs. In response, oil refineries may have to change the product mix.
The changes in demand for energy and fuel necessitate the devel- opment of a comprehensive policy and action plan to meet future projections. The role of policymakers in this respect is to avoid hin- dering and, if possible, to facilitate the long-run adjustment in the Hawaiian energy and fuel market. The diversification into alternative sources of energy, such as solar, wind, geothermal, biomass, ethanol, etc., can help to ensure a sufficient supply of energy in the future. Appropriate fiscal measures, such as investment tax credits or tax holidays, may be extended to energy suppliers in an attempt to allevi- ate potential shortages in energy supply.
Furthermore, to encourage energy conservation, the state govern- ment should implement educational programs that promote energy conservation by both the tourism and residential sectors. Tax credits can be introduced for the installation of energy-saving devices and equipment (e.g., light fixtures, air-conditioning systems, and heating equipment). In addition, electric-powered vehicles have to be con- sidered as an alternative to internal fuel combustion engines. Efficiency in energy use can be promoted by providing incentives for the design and construction of energy-efficient housing and public infrastructure, as well as the use of more energy-efficient production equipment and power transmission by utility companies. 0 0
Acknowledgments-The authors greatly appreciate the cooperation of Lynn Zane from the Deuartment of Business. Economic Develooment and Tourism. State of Hawaii. who provided the data for the project. Any remaining errors are the authors’ responsi- bility alone.
REFERENCES
Despotakis, K. A., and A. Fisher 1988 Energy in a Regional Economy: A Computable General Equilibrium Model
for California. Journal of Environmental Economics and Management 15:313- 330.
Gidwani, B. S. 1974 Effects of Fuel Crisis on Tourism in India. New Delhi: Ministry of Tourism
and Civil Aviation. HECO
1987 Records. Honolulu: Hawaii Electric Company. Hollander. G.. P. Threlfall. and K. A. Tucker
1982 Energy and the Australian Tourism Economy. Working Paper No. 25. Can- berra: Bureau of Industry Economics.
KECO 1987 Records. Honolulu: Kauai Electric Company.
Leung, P. S., and G. Hsu 1984 An Integrated Energy Planning Model for Hawaii. Energy Economics
6(2):117-121. Leung, P. S., J. Mak, and W. Miklius
1994 Documentation for the Hawaii Population and Economic Projection and Simulation Model. Unpublished paper.
MECO 1987 Records. Honolulu: Maui Electric Company.

TABATCHNAIA-TAMIRISA ET AL 401
State of Hawaii 1987 Records of Fuel and Energy Use. Honolulu: Hawaii Department of Business,
Economic Development and Tourism. 1992a The State of Hawaii Data Book. Honolulu: Hawaii Department of Business,
Economic Development and Tourism. 1992b Visitor Expenditure Report 1991. Honolulu: The Hawaii Visitors Bureau. 1993a Hawaii Energy Strategy: Program Status Report. Honolulu: Hawaii Depart-
ment of Business, Economic Development and Tourism. 1993b Hawaii State Input-Output Model System for 1987. Honolulu: Hawaii
Department of Business, Economic Development and Tourism. 1994 Annual Research Report 1993. Honolulu: The Hawaii Visitors Bureau.
Submitted 17 August 1995 Resubmitted 8 May 1996 Accepted 30 May 1996 Refereed anonymously Coordinating Editor: Linda Low