Multi-criteria evaluation of wastewater treatment plant control strategies under uncertainty
13
Multi-criteria evaluation of wastewater treatment plant control strategies under uncertainty Xavier Flores-Alsina a,b , Ignasi Rodrı´guez-Roda a, *, Gu ¨ rkan Sin b , Krist V. Gernaey b a Laboratory of Chemical and Environmental Engineering, University of Girona, Montilivi Campus s/n 17071, Girona, Spain b Center for BioProcess Engineering, Department of Chemical and Biochemical Engineering, Technical University of Denmark, Building 229, DK-2800 Kgs. Lyngby, Denmark article info Article history: Received 24 January 2008 Received in revised form 13 May 2008 Accepted 29 May 2008 Published online 24 June 2008 Keywords: Wastewater treatment Control Benchmarking Multi-criteria decision analysis Uncertainty Monte Carlo simulation abstract The evaluation of activated sludge control strategies in wastewater treatment plants (WWTP) via mathematical modelling is a complex activity because several objectives; e.g. economic, environmental, technical and legal; must be taken into account at the same time, i.e. the evaluation of the alternatives is a multi-criteria problem. Activated sludge models are not well characterized and some of the parameters can present uncertainty, e.g. the influent fractions arriving to the facility and the effect of either temperature or toxic compounds on the kinetic parameters, having a strong influence in the model predictions used during the evaluation of the alternatives and affecting the resulting rank of preferences. Using a simplified version of the IWA Benchmark Simulation Model No. 2 as a case study, this article shows the variations in the decision making when the uncertainty in activated sludge model (ASM) parameters is either included or not during the evaluation of WWTP control strategies. This paper comprises two main sections. Firstly, there is the evaluation of six WWTP control strategies using multi-criteria decision analysis setting the ASM parameters at their default value. In the following section, the uncertainty is intro- duced, i.e. input uncertainty, which is characterized by probability distribution functions based on the available process knowledge. Next, Monte Carlo simulations are run to propagate input through the model and affect the different outcomes. Thus (i) the variation in the overall degree of satisfaction of the control objectives for the generated WWTP control strategies is quantified, (ii) the contributions of environmental, legal, technical and economic objectives to the existing variance are identified and finally (iii) the influence of the relative importance of the control objectives during the selection of alternatives is analyzed. The results show that the control strategies with an external carbon source reduce the output uncertainty in the criteria used to quantify the degree of satisfaction of environmental, technical and legal objectives, but increasing the economical costs and their variability as a trade-off. Also, it is shown how a preliminary selected alternative with cascade ammonium controller becomes less desirable when input uncertainty is included, having simpler alternatives more chance of success. ª 2008 Elsevier Ltd. All rights reserved. * Corresponding author. Tel.: þ34 972 418281; fax: þ34 972 418150. E-mail addresses: [email protected], (X. Flores-Alsina), [email protected] (I. Rodrı´guez-Roda), [email protected] (G. Sin), [email protected] (K.V. Gernaey). Available at www.sciencedirect.com journal homepage: www.elsevier.com/locate/watres 0043-1354/$ – see front matter ª 2008 Elsevier Ltd. All rights reserved. doi:10.1016/j.watres.2008.05.029 water research 42 (2008) 4485–4497
-
Upload
independent -
Category
Documents
-
view
0 -
download
0
Transcript of Multi-criteria evaluation of wastewater treatment plant control strategies under uncertainty
w a t e r r e s e a r c h 4 2 ( 2 0 0 8 ) 4 4 8 5 – 4 4 9 7
Avai lab le a t www.sc iencedi rec t .com
journa l homepage : www.e lsev ie r . com/ loca te /wat res
Multi-criteria evaluation of wastewater treatment plantcontrol strategies under uncertainty
Xavier Flores-Alsinaa,b, Ignasi Rodrıguez-Rodaa,*, Gurkan Sinb, Krist V. Gernaeyb
aLaboratory of Chemical and Environmental Engineering, University of Girona, Montilivi Campus s/n 17071, Girona, SpainbCenter for BioProcess Engineering, Department of Chemical and Biochemical Engineering, Technical University of Denmark, Building 229,
DK-2800 Kgs. Lyngby, Denmark
a r t i c l e i n f o
Article history:
Received 24 January 2008
Received in revised form
13 May 2008
Accepted 29 May 2008
Published online 24 June 2008
Keywords:
Wastewater treatment
Control
Benchmarking
Multi-criteria decision analysis
Uncertainty
Monte Carlo simulation
* Corresponding author. Tel.: þ34 972 418281E-mail addresses: [email protected],
[email protected] (K.V. Gernaey).0043-1354/$ – see front matter ª 2008 Elsevidoi:10.1016/j.watres.2008.05.029
a b s t r a c t
The evaluation of activated sludge control strategies in wastewater treatment plants
(WWTP) via mathematical modelling is a complex activity because several objectives; e.g.
economic, environmental, technical and legal; must be taken into account at the same
time, i.e. the evaluation of the alternatives is a multi-criteria problem. Activated sludge
models are not well characterized and some of the parameters can present uncertainty,
e.g. the influent fractions arriving to the facility and the effect of either temperature or
toxic compounds on the kinetic parameters, having a strong influence in the model
predictions used during the evaluation of the alternatives and affecting the resulting rank
of preferences. Using a simplified version of the IWA Benchmark Simulation Model No. 2 as
a case study, this article shows the variations in the decision making when the uncertainty
in activated sludge model (ASM) parameters is either included or not during the evaluation
of WWTP control strategies. This paper comprises two main sections. Firstly, there is the
evaluation of six WWTP control strategies using multi-criteria decision analysis setting the
ASM parameters at their default value. In the following section, the uncertainty is intro-
duced, i.e. input uncertainty, which is characterized by probability distribution functions
based on the available process knowledge. Next, Monte Carlo simulations are run to
propagate input through the model and affect the different outcomes. Thus (i) the variation
in the overall degree of satisfaction of the control objectives for the generated WWTP
control strategies is quantified, (ii) the contributions of environmental, legal, technical and
economic objectives to the existing variance are identified and finally (iii) the influence of
the relative importance of the control objectives during the selection of alternatives is
analyzed. The results show that the control strategies with an external carbon source
reduce the output uncertainty in the criteria used to quantify the degree of satisfaction of
environmental, technical and legal objectives, but increasing the economical costs and
their variability as a trade-off. Also, it is shown how a preliminary selected alternative with
cascade ammonium controller becomes less desirable when input uncertainty is included,
having simpler alternatives more chance of success.
ª 2008 Elsevier Ltd. All rights reserved.
; fax: þ34 972 418150.(X. Flores-Alsina), [email protected] (I. Rodrıguez-Roda), [email protected] (G. Sin),
er Ltd. All rights reserved.
Nomenclature
AD anaerobic digester
ADM1 Anaerobic Digestion Model No. 1
AER aerobic reactor
Aj alternative to be evaluated
ANOX anoxic reactor
ASM activated sludge model
BOD5 biochemical oxygen demand (g COD m�3)
BSM2 Benchmark Simulation Model No. 2
C uncertainty class
COD chemical oxygen demand (g COD m�3)
D probability distribution
DH dewatering unit
DO dissolved oxygen
EQ effluent quality index (kg pollution day�1)
IWA International Water Association
KLa oxygen transfer coefficient (day�1)
Kp proportional gain (units depend on context)
np number of evaluation criteria applied to
quantify the degree of satisfaction for OBJknt total number of evaluation criteria
OBJk control objective
PI proportional integral
PRIM primary clarifier
Qcarb external carbon source (ANOX1) (m3 day�1)
Qintr internal recycle (from AER3 to ANOX1)
(m3 day�1)
Qr external recycle (from SEC to ANOX1)
(m3 day�1)
s(Aj) weighted sum for an alternative j
SNH ammonium concentration (g N m�3)
SNO nitrate concentration (g N m�3)
SO dissolved oxygen concentration (g (-COD) m�3)
ST storage tank
THK sludge thickener
Ti integral time constant (days)
TIV time in violation (days)
TN total nitrogen (g N m�3)
TSS total suspended solids (g TSS m�3)
Tt anti-windup constant (days)
U uncertainty factor
v(Xj) value function for a criterion j
v(xj,i) normalized value i for a given alternative j
wk weights applied to control objectives
wi weights applied to criteria
WWTP Wastewater Treatment Plant
Xi evaluation criteria
xi* best situation for a criterion i
xi* worst situation for a criterion i
xj,i quantified criterion i for a given alternative j
w a t e r r e s e a r c h 4 2 ( 2 0 0 8 ) 4 4 8 5 – 4 4 9 74486
1. Introduction
Nowadays, evaluation of the feasibility of wastewater
treatment plant (WWTP) design, operation and control
strategy alternatives is to a large extent based on simulation
of mechanistic models. Computer codes implementing the
International Water Association (IWA) activated sludge
model (ASM) family (Henze et al., 2000) are employed to
support decision making on implementation of different
technological alternatives such as: controllers (Stare et al.,
2007), reactor volume and configuration (Yuan et al., 2000;
Flores et al., 2005) and recycle streams (Salem et al., 2002).
The recent developments in the WWTP modelling field –
for example the release of the Anaerobic Digestion Model No.
1 (ADM1, Batstone et al., 2002), the development of model
interfaces coupling the ASM and ADM models (Nopens et al.,
submitted for publication) – have allowed the construction of
plant-wide WWTP models. The latter models combine sub-
models for primary (Otterpohl et al., 1994) and secondary
settlers (Takacs et al., 1991), activated sludge reactors,
anaerobic digesters, dewatering units, etc., which are linked
together by a number of recycles and bypasses. Thus, apart
from studying the performance of individual WWTP unit
processes it is nowadays also possible to investigate the
interactions amongst such processes. Some applications of
this approach can be found already, for example comparing
technologies to treat rejected water streams (Volcke et al.,
2006), evaluating the effect of a control strategy on a long-term
basis (Vrecko et al., 2006; Jeppsson et al., 2007) or analyzing the
simulation results by multivariable analysis (Flores et al.,
2007a)
Uncertainty is a central concept when dealing with biolog-
ical systems like activated sludge systems, which inherently
are subjected to large natural variations. However, tradition-
ally WWTP process simulators assume constant rather than
variable model parameters, and are thus not capable to take
into account the inherent randomness. Indeed, the activated
sludge process cannot be considered as a well characterized
process and some activated sludge model parameters are
uncertain. Examples are the parameters describing the
influent COD fractionation, or the parameters describing the
effect of temperature or toxic compounds on the model
kinetics, which will both have a significant influence on the
model predictions. Hence, the assessment and presentation of
uncertainty is widely recognized as an important part of the
analysis of complex water systems (Beck, 1987).
The Monte Carlo simulation technique is a practical way of
imitating the inherent randomness in biological systems
using deterministic models. Monte Carlo simulation is based
on a probabilistic sampling method of input uncertainties
followed by determination and analysis of the propagation of
input uncertainty to model outputs (Helton and Davis, 2003).
Some authors have used the Monte Carlo simulation tech-
nique in the water research field, for example addressing the
design and upgrade of a WWTP under uncertainty balancing
effluent costs and risk of effluent standards’ exceedance
(Benedetti et al., 2006), predicting the disinfection perfor-
mance of a full scale reactor in drinking water treatment
(Neumann et al., 2007), generating different wastewater
influent compositions for posterior process performance
evaluation (Martin et al., 2007), or also as a pragmatic proce-
dure to automate the calibration of ASM models (Sin et al.,
2008).
It is important to emphasize that several types of objec-
tives (economic environmental, legal and technical), must be
w a t e r r e s e a r c h 4 2 ( 2 0 0 8 ) 4 4 8 5 – 4 4 9 7 4487
taken into account simultaneously during the evaluation of
design/control alternatives, i.e. the evaluation of the
competing alternatives is a multi-criteria problem (Vincke,
1992; Belton and Stewart, 2002). The main limitation of
previously published works is the lack of systematic
approaches to support decision making when such multi-
criteria problems arise. Moreover, despite the importance of
considering uncertainty during simulation-based WWTP
performance evaluation, multi-criteria evaluation under
uncertainty has only been treated sparsely in the wastewater
engineering field. Clearly, there is a need to fill this gap by
providing technologies to support the decision makers that
have to deal with this type of multi-criteria problems in the
wastewater treatment field.
The objective of this paper is therefore to demonstrate the
influence of considering uncertainty in activated sludge
model parameters on the decision making process during the
multi-criteria evaluation of WWTP control strategies. A plant-
wide WWTP model is used as a case study. First a reference
case will be presented, by evaluating and comparing several
WWTP control strategies based on the traditional way, i.e. by
using the default (deterministic) values of model parameters.
Secondly, the WWTP control strategies are compared while
considering uncertainty in the ASM parameters. Hence input
uncertainties are propagated to the set of applied plant
performance evaluation criteria, and as a consequence the
influence of input uncertainty during multi-criteria decision
making can be investigated. To this purpose, input uncer-
tainty is quantified by assuming probability distributions for
each parameter based on the available process knowledge.
The WWTP model is then coupled to a Monte Carlo engine
that randomly samples parameters from the previously
defined probability distributions, thus solving the model and
quantifying the evaluation criteria for each parameter sample.
2. Methods
2.1. Wastewater treatment plant (WWTP) under study
The WWTP under study has the same layout as the IWA
Benchmark Simulation Model No. 2 (BSM2) proposed by
Jeppsson et al. (2007). The activated sludge unit is a modified
Ludzack–Ettinger configuration consisting of 5 tanks in series.
Tanks 1 (ANOX1) and 2 (ANOX2) are anoxic with a total volume
of 2000 m3, while tanks 3 (AER1), 4 (AER2) and 5 (AER3) are
aerobic with a total volume of 3999 m3. The circular secondary
settler (SEC) has a surface area of 1500 m2 with a total volume
of 6000 m3. The BSM2 plant further contains a primary clarifier
(PRIM), a sludge thickener (THK), an anaerobic digester (AD),
a storage tank (ST) and a dewatering unit (DH). Further
information about the BSM2 layout and the description of the
process models can be found in Jeppsson et al. (2007).
Plant performance evaluation has been reduced from 1-
year simulation to 1 week in order to reduce the computa-
tional burden of the whole study. The default wastewater to
be treated has a dry weather flow rate of 18446 m3 day�1 with
a carbon and nitrogen load of 12228 kg COD day�1 and
1025 kg N day�1, respectively. The wastewater influent is the
same as for the Benchmark Simulation Model No. 1 (Copp,
2002), but increasing the concentrations of particulate carbon
and nitrogen in order to take into account the effect of the
primary clarifier.
2.2. Implemented control strategies
Five control strategies were implemented to a default open
loop case (A1). The operational settings of the open loop base
case considered in this case study were slightly modified
compared to the BSM1 (Copp, 2002). The constant waste
sludge flow rate was reduced from 385 m3 day�1 to
300 m3 day�1 and the constant oxygen transfer coefficient
(KLa) for the third aerobic reactor (AER3) was increased from
84 day�1 to 240 day�1. The values for other manipulated vari-
ables (Qintr¼ 55,338 m3 day�1, Qr¼ 18,446 m3 day�1 and
Qcarb¼ 0 m3 day�1) remained at the default BSM1 values. The
control strategies A¼ {A2,.,Aj,.,A6}, summarized in Table 1,
were applied to the activated sludge reactor section. The
simulation results (open loopþ 5 control strategies) are the
starting point for the work presented in this paper.
The dissolved oxygen (DO) sensor was assumed to be ideal
without noise or delay. The nitrate (SNO) and ammonium (SNH)
sensors had a time delay of 10 min, with zero mean white
noise (standard deviation of 0.1 g N m�3). All the dynamic
simulations were preceded by a steady state simulation to
ensure an appropriate starting point for the dynamic simu-
lations and to eliminate bias due to the selection of the initial
conditions on the dynamic modelling results (Copp, 2002).
Even though the length of the dynamic influent file used to
carry out the simulations was 28 days, only the data generated
during the last 7 days were used to evaluate the plant
performance.
The control strategies presented in this study assume
constant rather than variable set points. Previous studies have
demonstrated that different set points might lead to different
conclusions (see, e.g. Flores et al., 2007b). However, the
selected operational settings of the controllers (set points, Kp,
Tt) are reasonable values that will lead to an acceptable plant
performance, since the operational settings have been
extracted from the literature and were for a large part defined
by the IWA Task Group on Benchmarking of Control Strategies
for WWTPs (www.benchmarkwwtp.org). The literature refer-
ences mentioned in Table 1 can be consulted for further
details about the controllers.
2.3. Objectives, criteria and evaluation procedure
Environmental, economical, technical and legal objectives
were taken into account [OBJ¼OBJ1,.,OBJk,.,OBJp] during
the evaluation procedure (hence p¼ 4). The degree of satis-
faction of the defined control objectives OBJ1, OBJ2, OBJ3 and
OBJ4 was quantified by a set [n¼ n1,.,nk,.,np] of 1, 1, 1 and 4
criteria, respectively ðPp
k¼1 nk ¼ nt ¼ 7Þ. Weight factors
[w¼w1,.,wk,.,wp] are then assigned to each objective (k).
The relative importance of the objectives is normalized to sum
1, orPp
k¼1 wk ¼ 1. For each control objective, the criteria used
to evaluate the degree of satisfaction of that objective are
weighted equally. Thus, the weight factor applied to each
evaluation criterion (wi, i¼ 1, 2,.,nt) is obtained by dividing wk
by the number of evaluation criteria nk belonging to a specific

Table 1 – Main features of the control strategies evaluated in this case study
Oxygen controller in the aerated section (AER1, 2 and 3) (Vanrolleghem and Gillot, 2002)
Controller type PI with anti-windup Units
Proportional gain (Kp) 100 m3 (g (-COD))�1 days�1
Integral time constant (Ti) 0.01 days
Anti-windup constant (Tt) 0.01 days
Controlled variable SO in AER1, 2 and 3
Set point 2 g (-COD) m�3
Manipulated variable (MV) KLa days�1
Maximum value of MV 360 days�1
Implemented in alternatives A2, A3, A4, A5 and A6
Nitrate controller in the anoxic section (ANOX2) (Copp, 2002)
Controller type PI with anti-windup Units
Proportional gain (Kp) 10,000 m3(g N)�1 days�1
Integral time constant (Ti) 0.04 days
Anti-windup constant (Tt) 0.04 days
Controlled variable SNO in ANOX2
Set point 1 g N m-3
Manipulated variable (MV) Qintr m3 days�1
Maximum value of MV 92,336 m3 days�1
Implemented in alternatives A3 and A5
Nitrate controller in the anoxic section (ANOX2) (Gernaey et al., 2007)
Controller type PI with anti-windup Units
Proportional gain (Kp) �1 m3(g N)�1 days�1
Integral time constant (Ti) 0.1 days
Anti-windup constant (Tt) 0.1 days
Controlled variable SNO in ANOX2
Set point 1 g N m�3
Manipulated variable (MV) Qcarb m3 days�1
Maximum value of MV 5 m3 days�1
Implemented in alternatives A4 and A6
Ammonium controller in the aerated section (AER3) (Gernaey et al., 2007)
Controller type Cascaded PI Units
Proportional gain (Kp) �1 m3(g N)�1 days�1
Integral time constant (Ti) 0.2 days
Anti-windup constant (Tt) 0.2 days
Controlled variable SNH in AER3
Set point 1 g N m�3
Manipulated variable (MV) SO set point in AER3, 4 and 5 g (-COD) m�3
Maximum value of MV 4 g (-COD) m�3
Implemented in alternatives A5 and A6
w a t e r r e s e a r c h 4 2 ( 2 0 0 8 ) 4 4 8 5 – 4 4 9 74488
control objective. The effluent quality index (EQ, Copp, 2002)
was the single criterion (X1) used to evaluate the accom-
plishment of OBJ1 (minimize the environmental impact). The
operational cost index (X2) proposed by Vrecko et al. (2006)
was applied for evaluating the accomplishment of objective
OBJ2 (minimize economic cost). The risk for occurrence of
microbiology-related solids separation problems (X3) was
used to evaluate the technical reliability of the controllers
(OBJ3). The risk for occurrence of separation problems (Comas
et al., 2006) was assessed by punishing control strategies that
create operation conditions that potentially can drive the
plant to bulking (X3–1), foaming (X3–2) and rising sludge (X3–3).
Finally the percentage of time that the plant violates the legal
effluent limits (OBJ4) was quantified using the time plant in
violation index (Copp, 2002) for the different pollutants, i.e.
total suspended solids (X4, TSS), chemical oxygen demand (X5,
COD), biochemical oxygen demand (X6, BOD5) and total
nitrogen (X7, TN). Compared to OBJ4, OBJ1 provides additional
information about the impact on water by the treated effluent,
since the contribution of each pollutant is weighted differ-
ently to calculate the value of OBJ1 (Copp, 2002). It could
indeed happen that scenarios providing the same degree of
satisfaction of the legal requirements (OBJ4) will have different
potential impacts on the receiving water (OBJ1).
All criteria [X] were quantified based on dynamic simula-
tions. The quantification of an option Aj with respect to crite-
rion Xi is indicated as xj,i. Thus, each option under evaluation
can be formulated as a vector of scores and represented as a n-
dimensional performance score profile ½Aj ¼ ðxj;i;.; xj;ntÞ�.
Value functions [v(Xi)] map the score profiles of all options into
a value v(xj,i) normalized from 0 to 1. The 0 and 1 values were
associated with the worst (xi*) and the best (xi*) situation,
respectively, whilst a mathematical function was used to
evaluate the intermediate effects. The collection of the best

w a t e r r e s e a r c h 4 2 ( 2 0 0 8 ) 4 4 8 5 – 4 4 9 7 4489
½x� ¼ ðx�1;.; x�ntÞ� and the worst ½x� ¼ ðx1�;.; xnt�Þ� scores for all
criteria determined the best ½vðx�Þ ¼ ðvðx�1;.;vðx�ntÞÞ ¼ 1Þ� and
the worst profiles ½vðx� ¼ ðvðx1�Þ;.; vðxnt�ÞÞ ¼ 0Þ�. Finally,
a multi-objective function was calculated to obtain a unique
value for each alternative (Eq. (1)). The multi-objective function
is presented as a weighted sum and calculated by summing up
the product of each normalized criterion v(xj,i) with its corre-
sponding weight (wi). The options were ranked according to the
obtained scores. The alternative with the highest score was the
one that was considered to give the higher degree of satisfac-
tion of the considered objectives, and thus corresponds to the
recommended alternative for implementation (Flores et al.,
2007b).
s�Aj
�¼ v
�xj;1
�$w1 þ.þ v
�xj;i
�wi þ.þ v
�xj;nt
�wnt ¼
Xn
i¼1
v�xj;i
�wi
(1)
3. Multi-criteria evaluation of WWTP controlstrategies without uncertainty
In this section the deterministic multi-criteria evaluation of
WWTP control strategies is presented. WWTP control strate-
gies defined in Table 1 were tested and evaluated using multi-
criteria decision analysis for default values of the activated
sludge model parameters. Table 2 summarizes the score
profile for each evaluated alternative. Note that the criteria X4,
X5 and X6 had identical values for each tested control strategy
in this case study, and thus these criteria were not useful to
discriminate the competing alternatives.
It should be emphasized that results of this base case
analysis depend strongly on the model selection prior to
performing the simulations. When modelling activated sludge
plants, there is often disagreement on the best model to apply
for a given case. The representation of biomass decay (Siegrist
et al., 1999), the modelling of nitrogen removal (Gujer et al.,
1999) and the oversimplification of the settling models (i.e.
non-reactive in most cases, despite the fact that a significant
amount of biomass is often stored at the bottom of the
secondary clarifier, e.g. Gernaey et al., 2006) are key issues that
are still under discussion.
To compare the effects of the different criteria during the
evaluation procedure, it is necessary to map these score
profiles into normalized values because all those criteria are
Table 2 – Score profiles for the six evaluated control strategies
A1 A2 A3
X1 8114.10 7770.90 7784.70 58
X2 10682 9853 9787 135
X3–1 78.89 78.00 78.08
X3–2 77.94 77.94 77.75
X3–3 86.32 94.37 91.01
X4 0.00 0.00 0.00
X5 0.00 0.00 0.00
X6 0.00 0.00 0.00
X7 44.79 15.18 18.01
measured in different units. Value functions award values
from 0 to 1 to the worst and the best situation considered,
respectively, whilst a mathematical function is proposed to
evaluate the intermediate effects. The extreme profiles (based
on expert judgment) are summarized in the following lines.
[(xi*)¼ (x1*¼ 60935 kg pollution day�1, x2*¼ 15,000, x3–1*¼100%, x3–2*¼ 100%, x3–3*¼ 100%, x4*¼ 100%, x5*¼ 100%, x6*¼100%, x7*¼ 100%)] and
[(xi*)¼ (x1*¼ 0 kg pollution day�1, x2*¼ 7500, x3–1*¼ 0%, x3–2*
¼ 0%, x3–3*¼ 0%, x4*¼ 0%, x5*¼ 0%, x6*¼ 0%, x7*¼ 0%)].
A linear model was applied between these extreme values
to calculate the intermediate effects (e.g. for criterion X2 the
value function is v(X2)¼�0.000113X2þ 2). Finally, a multi-
objective function calculated as a weighted sum (Eq. (1)) was
applied in order to obtain a single value for all the alternatives
which were then ranked according to the scores obtained,
with the final decision as to which alternative is best in ful-
filling the evaluation criteria resting on the decision maker. As
weight assessment is not a central topic in this paper, equal
importance for all the objectives is assumed wp¼ 0.25. The
results of the weighted sum lead us to the following conclu-
sion: in accordance with the control objectives, alternative A5
with a scores (A5) of 0.75 is the selected, while A1, A2, A3, A4
and A6 with a score in the weighted sum of 0.68, 0.72, 0.72, 0.63
and 0.66, respectively, are rejected.
Despite the fact that this control strategy shows a higher
risk of favouring formation of rising sludge, alternative A5 is
the most favourable mainly because this alternative showed
the lowest scores in OBJ2 (minimize economic costs). The
latter result is basically attributed to an efficient use of
the aeration energy in this control strategy, providing just the
sufficient quantity of oxygen to maintain a reasonable effluent
ammonium concentration. Also, it is important to mention
that alternative A5 performed well in both environmental
(OBJ1) and legal (OBJ4) objectives, because this control strategy
improves the overall nitrification efficiency.
4. Multi-criteria evaluation of controlstrategies under uncertainty
This section of the manuscript provides details of the proce-
dure followed to evaluate the WWTP control strategies under
uncertainty: first, the quantification of the input uncertainty
of the ASM model parameters is presented; then the set-up of
without uncertainty
A4 A5 A6 Units
79.90 7108.70 5824.90 g pollution m�3
51 9187 12746 –
80.79 77.93 80.33 %
81.94 77.73 81.05 %
91.25 97.67 85.05 %
0.00 0.00 0.00 %
0.00 0.00 0.00 %
0.00 0.00 0.00 %
0.00 6.85 0.00 %
w a t e r r e s e a r c h 4 2 ( 2 0 0 8 ) 4 4 8 5 – 4 4 9 74490
the Monte Carlo simulations is explained, and finally multi-
criteria evaluation of the simulation results is presented and
discussed in detail.
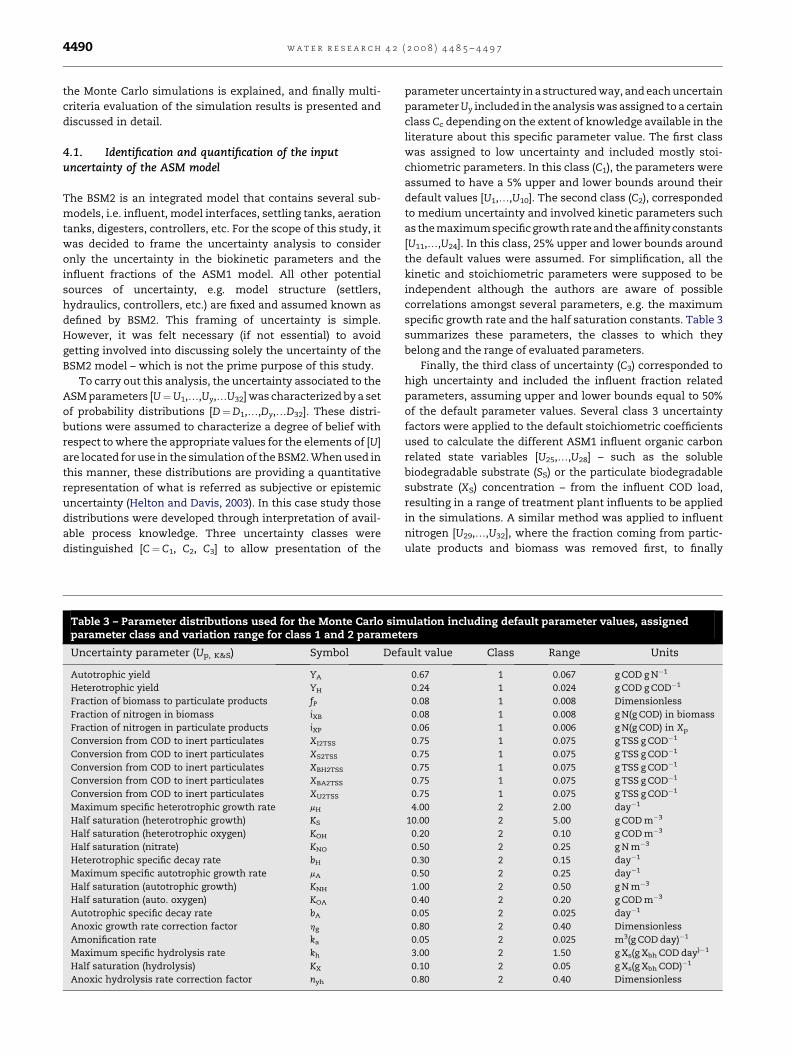
4.1. Identification and quantification of the inputuncertainty of the ASM model
The BSM2 is an integrated model that contains several sub-
models, i.e. influent, model interfaces, settling tanks, aeration
tanks, digesters, controllers, etc. For the scope of this study, it
was decided to frame the uncertainty analysis to consider
only the uncertainty in the biokinetic parameters and the
influent fractions of the ASM1 model. All other potential
sources of uncertainty, e.g. model structure (settlers,
hydraulics, controllers, etc.) are fixed and assumed known as
defined by BSM2. This framing of uncertainty is simple.
However, it was felt necessary (if not essential) to avoid
getting involved into discussing solely the uncertainty of the
BSM2 model – which is not the prime purpose of this study.
To carry out this analysis, the uncertainty associated to the
ASM parameters [U¼U1,.,Uy,.U32] was characterized by a set
of probability distributions [D¼D1,.,Dy,.D32]. These distri-
butions were assumed to characterize a degree of belief with
respect to where the appropriate values for the elements of [U]
are located for use in the simulation of the BSM2. When used in
this manner, these distributions are providing a quantitative
representation of what is referred as subjective or epistemic
uncertainty (Helton and Davis, 2003). In this case study those
distributions were developed through interpretation of avail-
able process knowledge. Three uncertainty classes were
distinguished [C¼ C1, C2, C3] to allow presentation of the
Table 3 – Parameter distributions used for the Monte Carlo simparameter class and variation range for class 1 and 2 paramet
Uncertainty parameter (Up, K&S) Symbol Def
Autotrophic yield YA
Heterotrophic yield YH
Fraction of biomass to particulate products fPFraction of nitrogen in biomass iXB
Fraction of nitrogen in particulate products iXP
Conversion from COD to inert particulates XI2TSS
Conversion from COD to inert particulates XS2TSS
Conversion from COD to inert particulates XBH2TSS
Conversion from COD to inert particulates XBA2TSS
Conversion from COD to inert particulates XU2TSS
Maximum specific heterotrophic growth rate mH
Half saturation (heterotrophic growth) KS
Half saturation (heterotrophic oxygen) KOH
Half saturation (nitrate) KNO
Heterotrophic specific decay rate bH
Maximum specific autotrophic growth rate mA
Half saturation (autotrophic growth) KNH
Half saturation (auto. oxygen) KOA
Autotrophic specific decay rate bA
Anoxic growth rate correction factor hg
Amonification rate ka
Maximum specific hydrolysis rate kh
Half saturation (hydrolysis) KX
Anoxic hydrolysis rate correction factor nyh
parameter uncertainty in a structured way, and each uncertain
parameter Uy included in the analysis was assigned to a certain
class Cc depending on the extent of knowledge available in the
literature about this specific parameter value. The first class
was assigned to low uncertainty and included mostly stoi-
chiometric parameters. In this class (C1), the parameters were
assumed to have a 5% upper and lower bounds around their
default values [U1,.,U10]. The second class (C2), corresponded
to medium uncertainty and involved kinetic parameters such
as the maximum specific growth rate and the affinity constants
[U11,.,U24]. In this class, 25% upper and lower bounds around
the default values were assumed. For simplification, all the
kinetic and stoichiometric parameters were supposed to be
independent although the authors are aware of possible
correlations amongst several parameters, e.g. the maximum
specific growth rate and the half saturation constants. Table 3
summarizes these parameters, the classes to which they
belong and the range of evaluated parameters.
Finally, the third class of uncertainty (C3) corresponded to
high uncertainty and included the influent fraction related
parameters, assuming upper and lower bounds equal to 50%
of the default parameter values. Several class 3 uncertainty
factors were applied to the default stoichiometric coefficients
used to calculate the different ASM1 influent organic carbon
related state variables [U25,.,U28] – such as the soluble
biodegradable substrate (SS) or the particulate biodegradable
substrate (XS) concentration – from the influent COD load,
resulting in a range of treatment plant influents to be applied
in the simulations. A similar method was applied to influent
nitrogen [U29,.,U32], where the fraction coming from partic-
ulate products and biomass was removed first, to finally
ulation including default parameter values, assigneders
ault value Class Range Units
0.67 1 0.067 g COD g N�1
0.24 1 0.024 g COD g COD�1
0.08 1 0.008 Dimensionless
0.08 1 0.008 g N(g COD) in biomass
0.06 1 0.006 g N(g COD) in Xp
0.75 1 0.075 g TSS g COD�1
0.75 1 0.075 g TSS g COD�1
0.75 1 0.075 g TSS g COD�1
0.75 1 0.075 g TSS g COD�1
0.75 1 0.075 g TSS g COD�1
4.00 2 2.00 day�1
10.00 2 5.00 g COD m�3
0.20 2 0.10 g COD m�3
0.50 2 0.25 g N m�3
0.30 2 0.15 day�1
0.50 2 0.25 day�1
1.00 2 0.50 g N m�3
0.40 2 0.20 g COD m�3
0.05 2 0.025 day�1
0.80 2 0.40 Dimensionless
0.05 2 0.025 m3(g COD day)�1
3.00 2 1.50 g Xs(g Xbh COD day)�1
0.10 2 0.05 g Xs(g Xbh COD)�1
0.80 2 0.40 Dimensionless
w a t e r r e s e a r c h 4 2 ( 2 0 0 8 ) 4 4 8 5 – 4 4 9 7 4491
obtain the inorganic (ammonium, SNH) and organic influent
nitrogen compound concentrations (either soluble or partic-
ulate, SND and XND).
It is important to point out that despite of the apparent
advantages of a formal assessment of uncertainty, one should
be aware that the conclusions arising from this case study
considering uncertainty can always only be as good as the
underlying assumptions. Thus, the results of the uncertainty
analysis will to a large extent depend on the characteristics of
the defined distributions, similar to the base case perfor-
mance where the obtained results will depend on the model
selection, as indicated earlier.
4.2. Monte Carlo simulations
The input uncertainty space is sampled using the Latin
hypercube method (McKay et al., 1979; Iman et al., 1981). In
this study, 1000 samples [Uy¼Uy,1,.,Uy,f,.,Uy,1000] are gener-
ated to make sure that the input uncertainty space is covered
uniformly. Each Latin hypercube sample contains one
randomly selected value Uy,f from each of the previously
defined probability distributions Dy. The Monte Carlo simula-
tions are performed by evaluating the BSM model for each one
of the generated Latin hypercube samples, solving the entire
model and quantifying the defined criteria [X] for each tested
alternative [A]. The solution of the model for each parameter
combination results in a distribution of possible values for the
desired performance criteria, whose distributions reflect the
possible variation of the performance criteria taking into
account the input uncertainty. Both interpretation and
representation of the results of the Monte Carlo simulations is
subsequently carried out using descriptive statistical tech-
niques such as multiple box plots, error bar charts, three
dimensional representations of the inter-quartile range, etc.
4.2.1. Environmental objectives (OBJ1)According to the previous section, a single criterion (X1) is
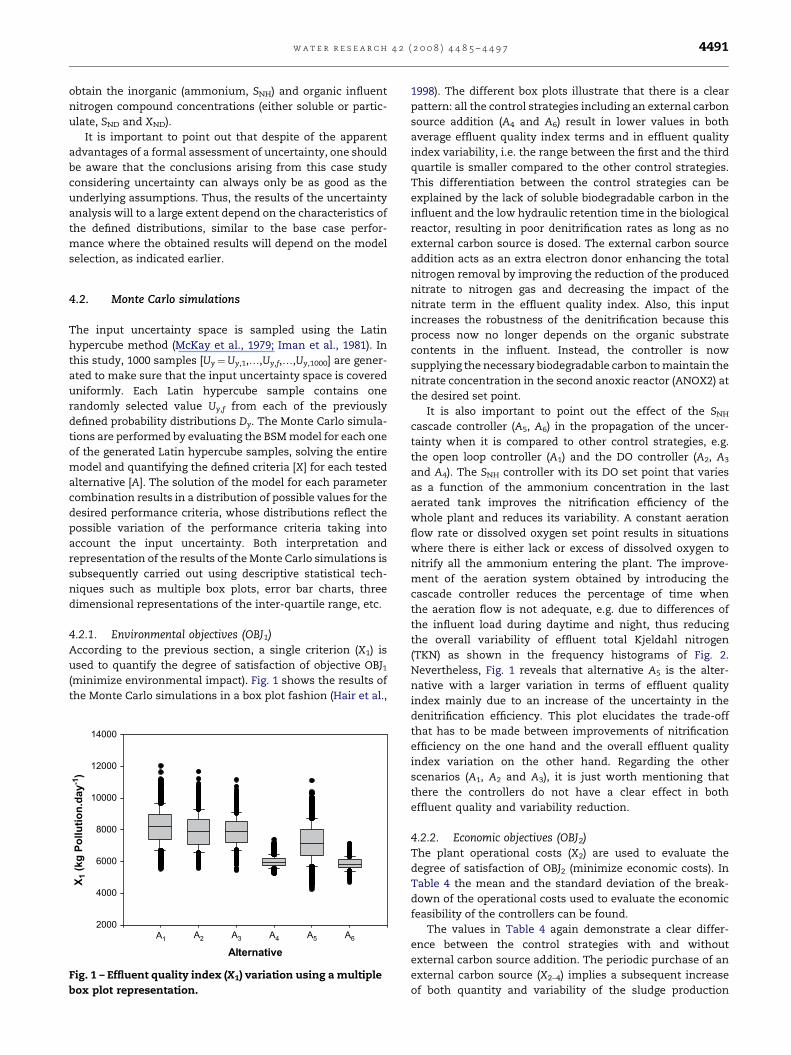
used to quantify the degree of satisfaction of objective OBJ1(minimize environmental impact). Fig. 1 shows the results of
the Monte Carlo simulations in a box plot fashion (Hair et al.,
Alternative
X1 (k
g P
ollu
tio
n.d
ay
-1)
2000
4000
6000
8000
10000
12000
14000
A1 A2 A3 A4 A5 A6
Fig. 1 – Effluent quality index (X1) variation using a multiple
box plot representation.
1998). The different box plots illustrate that there is a clear
pattern: all the control strategies including an external carbon
source addition (A4 and A6) result in lower values in both
average effluent quality index terms and in effluent quality
index variability, i.e. the range between the first and the third
quartile is smaller compared to the other control strategies.
This differentiation between the control strategies can be
explained by the lack of soluble biodegradable carbon in the
influent and the low hydraulic retention time in the biological
reactor, resulting in poor denitrification rates as long as no
external carbon source is dosed. The external carbon source
addition acts as an extra electron donor enhancing the total
nitrogen removal by improving the reduction of the produced
nitrate to nitrogen gas and decreasing the impact of the
nitrate term in the effluent quality index. Also, this input
increases the robustness of the denitrification because this
process now no longer depends on the organic substrate
contents in the influent. Instead, the controller is now
supplying the necessary biodegradable carbon to maintain the
nitrate concentration in the second anoxic reactor (ANOX2) at
the desired set point.
It is also important to point out the effect of the SNH
cascade controller (A5, A6) in the propagation of the uncer-
tainty when it is compared to other control strategies, e.g.
the open loop controller (A1) and the DO controller (A2, A3
and A4). The SNH controller with its DO set point that varies
as a function of the ammonium concentration in the last
aerated tank improves the nitrification efficiency of the
whole plant and reduces its variability. A constant aeration
flow rate or dissolved oxygen set point results in situations
where there is either lack or excess of dissolved oxygen to
nitrify all the ammonium entering the plant. The improve-
ment of the aeration system obtained by introducing the
cascade controller reduces the percentage of time when
the aeration flow is not adequate, e.g. due to differences of
the influent load during daytime and night, thus reducing
the overall variability of effluent total Kjeldahl nitrogen
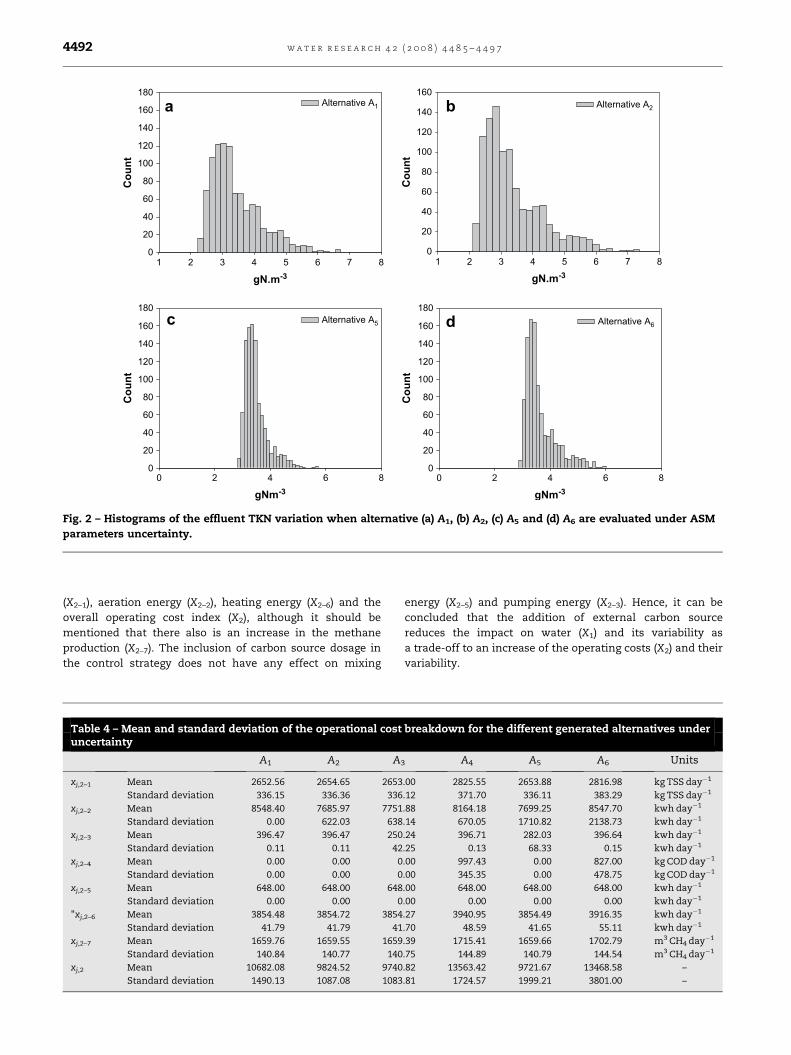
(TKN) as shown in the frequency histograms of Fig. 2.
Nevertheless, Fig. 1 reveals that alternative A5 is the alter-
native with a larger variation in terms of effluent quality
index mainly due to an increase of the uncertainty in the
denitrification efficiency. This plot elucidates the trade-off
that has to be made between improvements of nitrification
efficiency on the one hand and the overall effluent quality
index variation on the other hand. Regarding the other
scenarios (A1, A2 and A3), it is just worth mentioning that
there the controllers do not have a clear effect in both
effluent quality and variability reduction.
4.2.2. Economic objectives (OBJ2)The plant operational costs (X2) are used to evaluate the
degree of satisfaction of OBJ2 (minimize economic costs). In
Table 4 the mean and the standard deviation of the break-
down of the operational costs used to evaluate the economic
feasibility of the controllers can be found.
The values in Table 4 again demonstrate a clear differ-
ence between the control strategies with and without
external carbon source addition. The periodic purchase of an
external carbon source (X2–4) implies a subsequent increase
of both quantity and variability of the sludge production
gN.m-3
gNm-3
1 2 3 4 5 6 7 8
gN.m-3
1 2 3 4 5 6 7 8
Co
un
t
0
20
40
60
80
100
120
140
160
180
Co
un
t
0
20
40
60
80
100
120
140
160
180
Co
un
t
0
20
40
60
80
100
120
140
160
180
Alternative A1 Alternative A2
Alternative A5 Alternative A6
a
Co
un
t
0
20
40
60
80
100
120
140
160
b
0 2 4 6 8
gNm-3
0 2 4 6 8
c d
Fig. 2 – Histograms of the effluent TKN variation when alternative (a) A1, (b) A2, (c) A5 and (d) A6 are evaluated under ASM
parameters uncertainty.
w a t e r r e s e a r c h 4 2 ( 2 0 0 8 ) 4 4 8 5 – 4 4 9 74492
(X2–1), aeration energy (X2–2), heating energy (X2–6) and the
overall operating cost index (X2), although it should be
mentioned that there also is an increase in the methane
production (X2–7). The inclusion of carbon source dosage in
the control strategy does not have any effect on mixing
Table 4 – Mean and standard deviation of the operational costuncertainty
A1 A2 A
xj,2–1 Mean 2652.56 2654.65 2653
Standard deviation 336.15 336.36 336
xj,2–2 Mean 8548.40 7685.97 7751
Standard deviation 0.00 622.03 638
xj,2–3 Mean 396.47 396.47 250
Standard deviation 0.11 0.11 42
xj,2–4 Mean 0.00 0.00 0
Standard deviation 0.00 0.00 0
xj,2–5 Mean 648.00 648.00 648
Standard deviation 0.00 0.00 0
"xj,2–6 Mean 3854.48 3854.72 3854
Standard deviation 41.79 41.79 41
xj,2–7 Mean 1659.76 1659.55 1659
Standard deviation 140.84 140.77 140
xj,2 Mean 10682.08 9824.52 9740
Standard deviation 1490.13 1087.08 1083
energy (X2–5) and pumping energy (X2–3). Hence, it can be
concluded that the addition of external carbon source
reduces the impact on water (X1) and its variability as
a trade-off to an increase of the operating costs (X2) and their
variability.
breakdown for the different generated alternatives under
3 A4 A5 A6 Units
.00 2825.55 2653.88 2816.98 kg TSS day�1
.12 371.70 336.11 383.29 kg TSS day�1
.88 8164.18 7699.25 8547.70 kwh day�1
.14 670.05 1710.82 2138.73 kwh day�1
.24 396.71 282.03 396.64 kwh day�1
.25 0.13 68.33 0.15 kwh day�1
.00 997.43 0.00 827.00 kg COD day�1
.00 345.35 0.00 478.75 kg COD day�1
.00 648.00 648.00 648.00 kwh day�1
.00 0.00 0.00 0.00 kwh day�1
.27 3940.95 3854.49 3916.35 kwh day�1
.70 48.59 41.65 55.11 kwh day�1
.39 1715.41 1659.66 1702.79 m3 CH4 day�1
.75 144.89 140.79 144.54 m3 CH4 day�1
.82 13563.42 9721.67 13468.58 –
.81 1724.57 1999.21 3801.00 –
w a t e r r e s e a r c h 4 2 ( 2 0 0 8 ) 4 4 8 5 – 4 4 9 7 4493
Alternatives with a DO controller (A2, A3, A4, A5 and A6) are
characterized by having a larger variation in the aeration costs
(see values of Xj,2–2) when they are compared to the plant
running in open loop regime (A1). The effect of the cascade
ammonium controller can be noticed clearly from the results
of Table 4 in both alternatives A5 and A6: a large variation in
operational costs can be observed mainly due to variation in
the aeration energy cost (see values of X5,2–2 and X6,2–2). This
fact is attributable to the dynamics of the cascade controller
which introduces a variable DO set point instead of the
permanent DO set point (2 g (-COD) m�3) that is applied for the
alternatives A2, A3 and A4.
Control strategies A3 and A5 have lower average values and
higher variability in pumping energy (X2–3) because the
controller manipulates the internal recycle in order to main-
tain the nitrate concentration in ANOX2 to the desired set
point of 1 g N m�3.
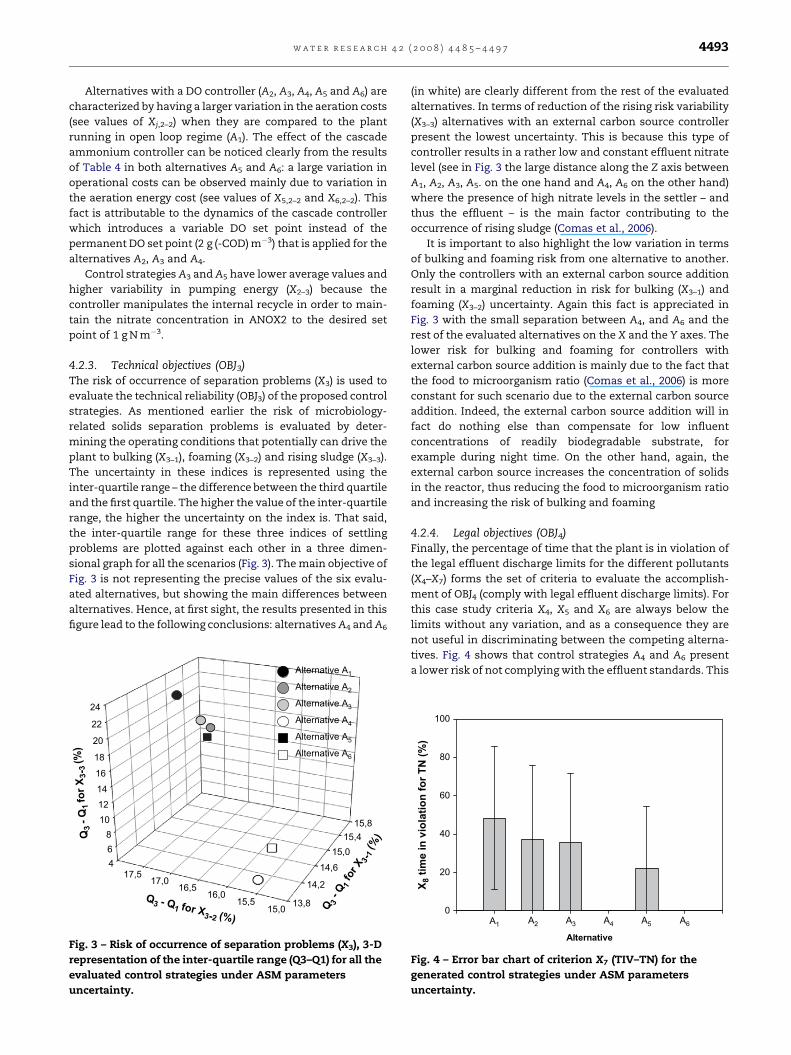
4.2.3. Technical objectives (OBJ3)The risk of occurrence of separation problems (X3) is used to
evaluate the technical reliability (OBJ3) of the proposed control
strategies. As mentioned earlier the risk of microbiology-
related solids separation problems is evaluated by deter-
mining the operating conditions that potentially can drive the
plant to bulking (X3–1), foaming (X3–2) and rising sludge (X3–3).
The uncertainty in these indices is represented using the
inter-quartile range – the difference between the third quartile
and the first quartile. The higher the value of the inter-quartile
range, the higher the uncertainty on the index is. That said,
the inter-quartile range for these three indices of settling
problems are plotted against each other in a three dimen-
sional graph for all the scenarios (Fig. 3). The main objective of
Fig. 3 is not representing the precise values of the six evalu-
ated alternatives, but showing the main differences between
alternatives. Hence, at first sight, the results presented in this
figure lead to the following conclusions: alternatives A4 and A6
468
10121416
18
20
22
24
13,8
14,2
14,615,0
15,415,8
15,015,5
16,016,5
17,017,5
Q3 - Q
1 fo
r X
3-3 (%
)
Q3 - Q
1 for X3-2 (%)
Q3 - Q
1 fo
r X
3-1
(%
)
Alternative A1
Alternative A2
Alternative A3
Alternative A4
Alternative A5
Alternative A6
Fig. 3 – Risk of occurrence of separation problems (X3), 3-D
representation of the inter-quartile range (Q3–Q1) for all the
evaluated control strategies under ASM parameters
uncertainty.
(in white) are clearly different from the rest of the evaluated
alternatives. In terms of reduction of the rising risk variability
(X3–3) alternatives with an external carbon source controller
present the lowest uncertainty. This is because this type of
controller results in a rather low and constant effluent nitrate
level (see in Fig. 3 the large distance along the Z axis between
A1, A2, A3, A5. on the one hand and A4, A6 on the other hand)
where the presence of high nitrate levels in the settler – and
thus the effluent – is the main factor contributing to the
occurrence of rising sludge (Comas et al., 2006).
It is important to also highlight the low variation in terms
of bulking and foaming risk from one alternative to another.
Only the controllers with an external carbon source addition
result in a marginal reduction in risk for bulking (X3–1) and
foaming (X3–2) uncertainty. Again this fact is appreciated in
Fig. 3 with the small separation between A4, and A6 and the
rest of the evaluated alternatives on the X and the Y axes. The
lower risk for bulking and foaming for controllers with
external carbon source addition is mainly due to the fact that
the food to microorganism ratio (Comas et al., 2006) is more
constant for such scenario due to the external carbon source
addition. Indeed, the external carbon source addition will in
fact do nothing else than compensate for low influent
concentrations of readily biodegradable substrate, for
example during night time. On the other hand, again, the
external carbon source increases the concentration of solids
in the reactor, thus reducing the food to microorganism ratio
and increasing the risk of bulking and foaming
4.2.4. Legal objectives (OBJ4)Finally, the percentage of time that the plant is in violation of
the legal effluent discharge limits for the different pollutants
(X4–X7) forms the set of criteria to evaluate the accomplish-
ment of OBJ4 (comply with legal effluent discharge limits). For
this case study criteria X4, X5 and X6 are always below the
limits without any variation, and as a consequence they are
not useful in discriminating between the competing alterna-
tives. Fig. 4 shows that control strategies A4 and A6 present
a lower risk of not complying with the effluent standards. This
Alternative
X8 tim
e in
vio
latio
n fo
r T
N (%
)
0
20
40
60
80
100
A1
A2
A3
A4
A5
A6
Fig. 4 – Error bar chart of criterion X7 (TIV–TN) for the
generated control strategies under ASM parameters
uncertainty.
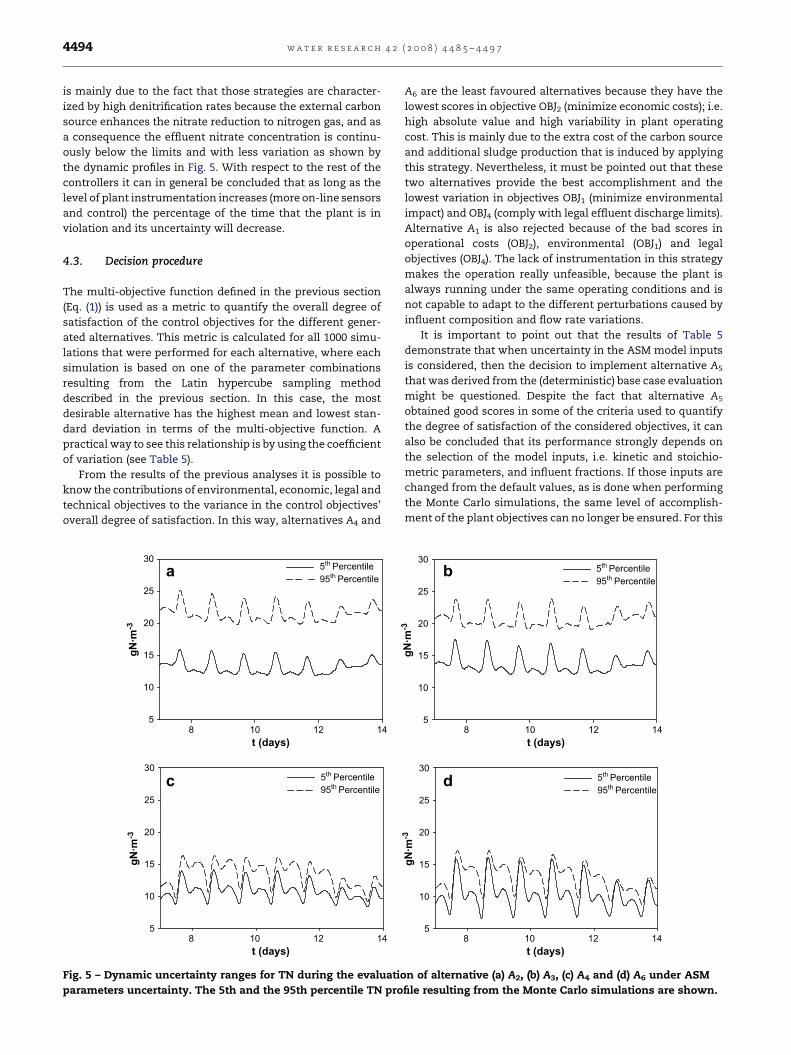
w a t e r r e s e a r c h 4 2 ( 2 0 0 8 ) 4 4 8 5 – 4 4 9 74494
is mainly due to the fact that those strategies are character-
ized by high denitrification rates because the external carbon
source enhances the nitrate reduction to nitrogen gas, and as
a consequence the effluent nitrate concentration is continu-
ously below the limits and with less variation as shown by
the dynamic profiles in Fig. 5. With respect to the rest of the
controllers it can in general be concluded that as long as the
level of plant instrumentation increases (more on-line sensors
and control) the percentage of the time that the plant is in
violation and its uncertainty will decrease.
4.3. Decision procedure
The multi-objective function defined in the previous section
(Eq. (1)) is used as a metric to quantify the overall degree of
satisfaction of the control objectives for the different gener-
ated alternatives. This metric is calculated for all 1000 simu-
lations that were performed for each alternative, where each
simulation is based on one of the parameter combinations
resulting from the Latin hypercube sampling method
described in the previous section. In this case, the most
desirable alternative has the highest mean and lowest stan-
dard deviation in terms of the multi-objective function. A
practical way to see this relationship is by using the coefficient
of variation (see Table 5).
From the results of the previous analyses it is possible to
know the contributions of environmental, economic, legal and
technical objectives to the variance in the control objectives’
overall degree of satisfaction. In this way, alternatives A4 and
t (days)
8 10 12 14
t (days)
8 10 12 14
gN
·m
-3
5
10
15
20
25
30
gN
·m
-3
5
10
15
20
25
30
5th Percentile95th Percentile
5th Percentile95th Percentile
a
c
Fig. 5 – Dynamic uncertainty ranges for TN during the evaluatio
parameters uncertainty. The 5th and the 95th percentile TN pro
A6 are the least favoured alternatives because they have the
lowest scores in objective OBJ2 (minimize economic costs); i.e.
high absolute value and high variability in plant operating
cost. This is mainly due to the extra cost of the carbon source
and additional sludge production that is induced by applying
this strategy. Nevertheless, it must be pointed out that these
two alternatives provide the best accomplishment and the
lowest variation in objectives OBJ1 (minimize environmental
impact) and OBJ4 (comply with legal effluent discharge limits).
Alternative A1 is also rejected because of the bad scores in
operational costs (OBJ2), environmental (OBJ1) and legal
objectives (OBJ4). The lack of instrumentation in this strategy
makes the operation really unfeasible, because the plant is
always running under the same operating conditions and is
not capable to adapt to the different perturbations caused by
influent composition and flow rate variations.
It is important to point out that the results of Table 5
demonstrate that when uncertainty in the ASM model inputs
is considered, then the decision to implement alternative A5
that was derived from the (deterministic) base case evaluation
might be questioned. Despite the fact that alternative A5
obtained good scores in some of the criteria used to quantify
the degree of satisfaction of the considered objectives, it can
also be concluded that its performance strongly depends on
the selection of the model inputs, i.e. kinetic and stoichio-
metric parameters, and influent fractions. If those inputs are
changed from the default values, as is done when performing
the Monte Carlo simulations, the same level of accomplish-
ment of the plant objectives can no longer be ensured. For this
t (days)
8 10 12 14
t (days)
8 10 12 14
gN
·m
-3
5
10
15
20
25
30
gN
·m
-3
5
10
15
20
25
30
5th Percentile95th Percentile
5th Percentile95th Percentile
b
d
n of alternative (a) A2, (b) A3, (c) A4 and (d) A6 under ASM
file resulting from the Monte Carlo simulations are shown.
w2
0,2
0,4
0,6
Alternative A1Alternative A2Alternative A3Alternative A4Alternative A5Alternative A6
Table 5 – Mean, standard deviation and coefficient of variation of the multi-objective function for the different controlstrategies under uncertainty
s(Aj) A1 A2 A3 A4 A5 A6
Mean 0.68 0.71 0.72 0.63 0.71 0.64
Standard deviation 0.04 0.03 0.02 0.04 0.06 0.10
CV 17.00 24.73 36.00 15.75 11.83 6.40
w a t e r r e s e a r c h 4 2 ( 2 0 0 8 ) 4 4 8 5 – 4 4 9 7 4495
reason, when considering uncertainty on model inputs alter-
native A3 comes out as the most desirable alternative that has
a higher chance of success, since A3 has good scores in all the
objectives and can thus be considered as the most balanced of
the alternatives. Also, the good value in terms of multi-
objective mean and standard deviation ensures the robust-
ness of the decision. Hence it cannot be said that alternative
A5 is better than A3, as was concluded in the deterministic
case. Instead, it is now probable that alternative A3 is better
than A5. This analysis – including uncertainty – thus brings
about a better documented decision about which alternative
to choose, since balancing the accomplishment of the objec-
tives is combined with taking into account the deviations
created by the input uncertainties that are considered.
It should be emphasized that the use of multi-criteria
decision analysis inherently implies a certain degree of
subjectivity. Indeed, the selection of criteria, the definition of
the extreme profiles before the normalization and the relative
‘‘weight’’ given to the control objectives are important factors
affecting the scores. Nevertheless, the main focus of the study
was not on the subjectivity (i.e. the choices mentioned before)
involved in the construction of a multi-objective function.
Rather the main focus was to study how the uncertainty
involved in quantifying different objectives of the multi-
objective function (assuming the multi-objective function is
constructed) influences the decision making. For this study,
the multi-objective function was defined in an explicit and
transparent way by using equal weights for all the objectives.
The key to solving this multi-criteria decision making
problem is not easily found, and the solution is based on
realizing that different process alternatives have many
uncertainties in common. For example, all the generated
WWTP control strategies are subjected to identical uncertain
influent fractions and kinetic and stoichiometric parameters,
but depending on the evaluated alternative, the uncertainty
will be propagated in a different way. Assuming that the
decision maker is particularly interested in a control strategy
that promises the lowest environmental impact, then the
selected alternative would be A4. On the other hand, if
a compromise between operation costs and risk wants to be
ensured that controller should be A3. The preferences of the
decision maker can be considered in the analysis by adjusting
the weights wk such that they reflect the importance given by
the decision maker to each objective (see also below).
w1
0,0 0,2 0,4 0,60,0
Fig. 6 – Scenario analysis of the weights of the OBJ1
(minimize environmental impact), OBJ2 (minimize
operating cost) and OBJ3 (maximize technical reliability).
5. Scenario analysis and final discussion
The scenario analysis of the weights applied to the multi-
objective function (Eq. (1)) presented in this last part of the
paper is intended to contribute to clarifying how the selected
alternative resulting from the multi-criteria decision making
procedure under activated sludge model input uncertainties
will vary when the relative importance of the different
objectives – expressed by the weights wk – is changed. The
weights represent the desires or preferences of the decision
makers to obtain an alternative that maximises the degree of
satisfaction and reduces variability for one or several specifc
objectives.
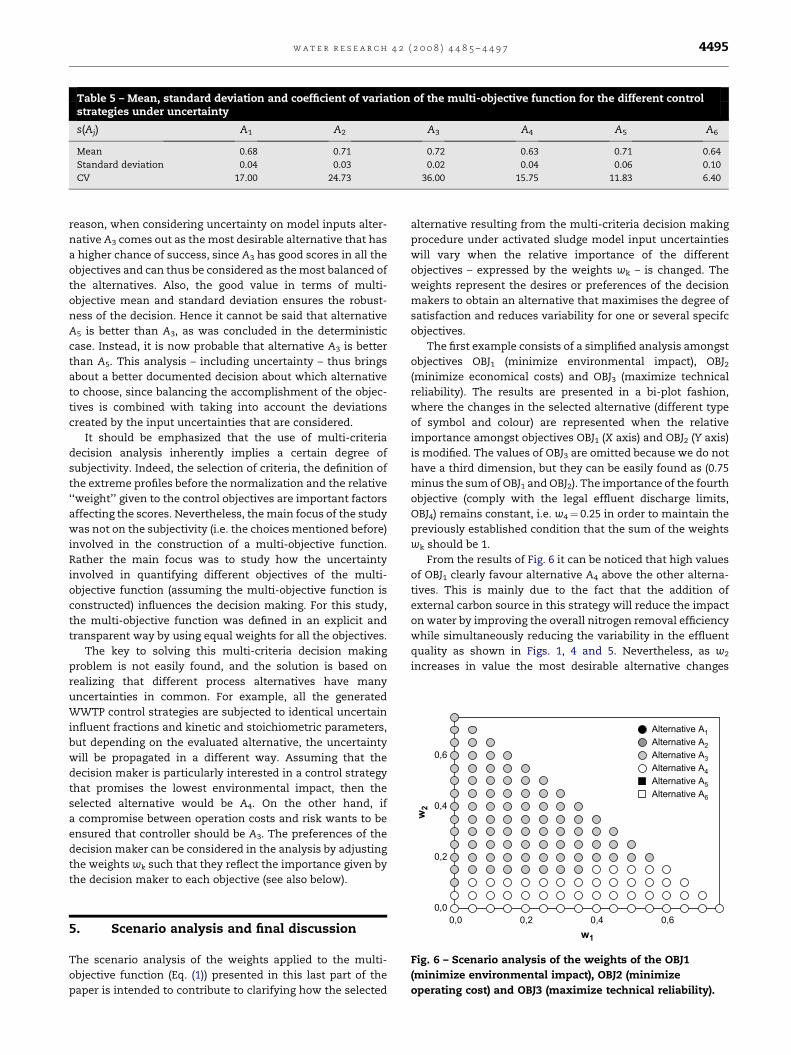
The first example consists of a simplified analysis amongst
objectives OBJ1 (minimize environmental impact), OBJ2(minimize economical costs) and OBJ3 (maximize technical
reliability). The results are presented in a bi-plot fashion,
where the changes in the selected alternative (different type
of symbol and colour) are represented when the relative
importance amongst objectives OBJ1 (X axis) and OBJ2 (Y axis)
is modified. The values of OBJ3 are omitted because we do not
have a third dimension, but they can be easily found as (0.75
minus the sum of OBJ1 and OBJ2). The importance of the fourth
objective (comply with the legal effluent discharge limits,
OBJ4) remains constant, i.e. w4¼ 0.25 in order to maintain the
previously established condition that the sum of the weights
wk should be 1.
From the results of Fig. 6 it can be noticed that high values
of OBJ1 clearly favour alternative A4 above the other alterna-
tives. This is mainly due to the fact that the addition of
external carbon source in this strategy will reduce the impact
on water by improving the overall nitrogen removal efficiency
while simultaneously reducing the variability in the effluent
quality as shown in Figs. 1, 4 and 5. Nevertheless, as w2
increases in value the most desirable alternative changes

w a t e r r e s e a r c h 4 2 ( 2 0 0 8 ) 4 4 8 5 – 4 4 9 74496
from A4 to A3 because alternative A3 presents lower operating
costs and variability as shown in Table 4. It is important to
mention that all the alternatives with an ammonium
controller (A4, A6), although having the lowest values in
operating costs, are anyhow not selected when the economic
objectives are prioritized. This is mainly due to the high
sensitivity of the ammonium controller to the input uncer-
tainty, increasing the variance of the multi-criteria index and
thus reducing the coefficient of variation. Finally when
objective OBJ3 is prioritized, the selected alternative depends
on the relative contribution of OBJ1 and OBJ2 because both
alternatives satisfy OBJ3 in a similar way. Again, it can be said
that alternative A4 improves the coefficient of variation of OBJ1(minimize environmental impact) at the expense of sacrificing (to
an extent) its economical variability (OBJ2).
This analysis opens the door to a number of discussions.
One can note in this example that the preliminary selected
alternative A5 is no longer selected as the best for any of the
possible combinations of weights. The considered input
uncertainties had a large impact on the behaviour of this
controller (cascade ammonium), where in some cases this
controller was not capable to compensate for the different
disturbances. After this analysis, it was possible to conclude
that this alternative was only the best for a limited range of
conditions. Thus, when considering uncertainty in the multi-
criteria decision making it is possible to answer questions
such as: What would happen if there is a change in the
influent composition? What are the expected effects of either
temperature changes or toxic spills and how can the
controller handle them? Secondly, this type of representa-
tions clearly distinguishes the different processes and their
more important features, while at the same time it highlights
their main weaknesses. Finally, it is highly encouraged to
perform this type of analysis because it can better guide
decision makers on such important questions as whether to
go ahead with the implementation of a controller and what is
the potential risk of failures in the event of the selection of an
alternative.
6. Conclusions
This paper has demonstrated a method to consider the
influence of activated sludge input uncertainty in the decision
making process during the multi-criteria evaluation of control
strategies in a WWTP. In the first section several WWTP
control strategies were tested and evaluated using standard
deterministic multi-criteria decision analysis using a modified
version of the BSM2 as a case study. In the second part, the
uncertainty in those parameters was quantified by means of
model input probability distributions that were based on the
available knowledge about the different parameters. Next the
plant mechanistic model was coupled to a Monte Carlo engine
that randomly selected parameters from the previously
defined distributions using Latin hypercube sampling, i.e.
input uncertainty, solving the model for each set of model
inputs. Such approach gave a range of possible solutions for
the desired WWTP performance criteria representing their
possible variation. The results were analyzed using several
descriptive statistical tools and it was possible to see how
these input uncertainties were propagated through the model
and affected the different outcomes.
From the evaluated controllers, alternatives with an
external carbon source (alternatives A4 and A6) reduced the
uncertainty in the degree of satisfaction of environmental,
legal and technical objectives but increasing the economical
costs and its variability as a trade-off. The alternatives with
DO and SNO controller (A2 and A3) reduced operational costs
while at the same time improving the effluent quality. Finally,
it was shown how the preliminary selected alternative
A5 – resulting from a deterministic multi-criteria decision
analysis – became less desirable when the input uncertainty
was considered. When considering uncertainty, a simpler
controller structure (A3) was evaluated to have a larger chance
of success.
The relative importance of the control objectives (weights)
on the selection of alternatives was investigated. One one
hand it was possible to discover the affinity of alternative A4
for objectives OBJ1 and OBJ4. On the other hand the scenario
analysis revealed that when OBJ2 was favoured alternative A3
would be selected.
Finally, it should be emphasized that this type of analysis
results in a more transparent decision making process, since
the uncertainty analysis contributes to developing an
improved understanding on the process and the trade-offs
between different objectives. Practically, the uncertainty
analysis allows identification of potential WWTP problems
early on and reduces the risk of controller failures.
Acknowledgments
The authors gratefully acknowledge financial support from
the Spanish ‘‘Ministerio de Ciencia y Tecnologıa’’ projects:
DPI2006-15707-C02-01, 018/SGTB/2007/3.1 and NOVE-
DAR_Consolider. Gurkan Sin also wishes to acknowledge his
post-doctoral scholarship of the Hans Christian Oersted
Postdoc Programme at DTU.
r e f e r e n c e s
Batstone, D.J., Keller, J., Angelidaki, I., Kayuznyi, S.V.,Pavlostathis, S.G., Rozzi, A., Sanders, W.T.M., Siegrist, H.,Vavilin, V.A., 2002. Anaerobic Digestion Model No. 1. IWAScientific and Technical Report No. 13. IWA Publishing,London, UK.
Beck, M.B., 1987. Water quality modelling: a review of the analysisof uncertainty. Water Resour. Res. 23 (8), 1393–1442.
Belton, V., Stewart, T.J., 2002. Multiple Criteria Decision Analysis:an Integrated Approach. Kluwer Academic Publishers,Dordrecht,.
Benedetti, L., Bixio, D., Vanrolleghem, P.A., 2006. Assessment ofWWTP design and upgrade options: balancing costs and risksof standards’ exceedance. Wat. Sci. Technol. 54 (6–7), 371–378.
Comas, J., Rodriguez-Roda, I., Poch, M., Gernaey, K.V., Rosen, C.,Jeppsson, U., 2006. Extension of the IWA/COST simulationbenchmark to include expert reasoning for systemperformance evaluation. Wat. Sci. Technol. 53 (4–5), 331–339.
w a t e r r e s e a r c h 4 2 ( 2 0 0 8 ) 4 4 8 5 – 4 4 9 7 4497
Copp, J.B., 2002. The COST Simulation Benchmark: Descriptionand Simulator Manual. Office for Official Publications of theEuropean Community, Luxembourg.
Flores, X., Bonmatı, A., Poch, M., Rodriguez-Roda, I., Banares-Alcantara, R., 2005. Selection of the activated sludgeconfiguration during the conceptual design of activated sludgeplants using multcriteria analysis. Ind. Eng. Chem. Res. 44 (10),3556–3566.
Flores, X., Comas, J., Rodriguez-Roda, I., Jimenez, L., Gernaey, K.V.,2007a. Application of multivariable statistical techniques inplant-wide WWTP control strategies analysis. Wat. Sci.Technol. 56 (6), 75–83.
Flores, X., Poch, M., Rodrıguez-Roda, I., Banares-Alcantara, R.,Jimenez, L., 2007b. Systematic procedure to handle criticaldecisions during the conceptual design of activated sludgesystems. Ind. Eng. Chem. Res. 46 (17), 5600–5613.
Gernaey, K.V., Jeppsson, U., Batstone, D.J., Ingildsen, P., 2006.Impact of reactive settler models on simulated WWTPperformance. Wat. Sci. Technol. 53 (1), 159–167.
Gernaey K., Vrecko D., Rosen C., Jeppsson U. 2007. BSM1 versusBSM1_LT: is the control strategy performance rankingmaintained? In: Proceedings of the Seventh International IWASymposium on Systems Analysis and Integrated Assessmentin Water Management, Washington DC, USA, 7th–9th May2007.
Gujer, W., Henze, M., Mino, T., van Loosdrecht, M.C.M., 1999.Activated sludge model no. 3. Wat. Sci. Technol. 39 (1),183–193.
Hair, J.F., Andersen, R.E., Tatham, R.L., Black, W.C., 1998.Multivariable Data Analysis, fifth ed. Prentice-Hall, London,UK.
Helton, J.C., Davis, F.J., 2003. Latin hypercube sampling methodand the propagation of uncertainty in analyses of complexsystems. Reliab. Eng. Syst. Saf. 81 (1), 23–69.
Henze, M., Gujer, W., Mino, T., van Loosdrecht, M.C.M., 2000.Activated Sludge Models ASM1, ASM2, ASM2d and ASM3. IWAScientific and Technical Report No. 9. IWA Publishing, London,UK.
Iman, R.L., Helton, J.C., Campbell, J.E., 1981. An approach tosensitivity analysis of computer models, Part 1. Introduction,input variable selection and preliminary variable assessment.J. Qual. Technol. 13 (3), 174–183.
Jeppsson, U., Pons, M.N., Nopens, I., Alex, J., Copp, J.B., Gernaey, K.V., Rosen, C., Steyer, J.P., Vanrolleghem, P.A., 2007. BenchmarkSimulation Model No 2 – general protocol and exploratory casesudies. Wat. Sci. Technol. 56 (8), 287–295.
Martin, C., Eguinoa, I., McIntyre, N.R., Garcıa-Sanz, M. and Ayesa,E., 2007. ARMA models for uncertainty assessment of timeseries data: application to Galindo-Bilbao WWTP. In:Proceedings of the Seventh International IWA Symposium on
Systems Analysis and Integrated Assessment in WaterManagement, Washington DC, USA, 7th–9th May 2007.
McKay, M.D., Conover, W.J., Beckman, R.J., 1979. A comparison ofthree methods for selecting values of input variables in theanalysis of output from a computer code. Technometrics 21,239–245.
Neumann, M.B., von Gunten, U., Gujer, W., 2007. Uncertainty inprediction of disinfection performance. Wat. Res. 41 (11),2371–2378.
Nopens, I., Batstone, D., Copp, J.B., Jeppsson, U., Volcke, E., Alex, J.,Vanrolleghem, P.A. A new interface for ASM–ADM for use in theBenchmark Simulation Model No. 2. Water Res., submitted forpublication.
Otterpohl, R., Raak, M., Rolfs, T. 1994. A mathematical model forthe efficiency of the primary clarification. In: Proceedings ofthe 17th IAWQ Biennial Conference on Water Quality,Budapest, Hungary, July 1994.
Salem, S., Berends, D., Heijnen, H.J., van Loosdrecht, M.C.M., 2002.Model-based evaluation of a new upgrading concept for N-removal. Wat. Sci. Technol. 45 (6), 169–177.
Siegrist, H., Brunner, I., Koch, G., Con Phan, L., Van Chieu, L., 1999.Reduction of biomass decay under anoxic and anaerobicconditions. Wat. Sci Technol. 39 (1), 129–137.
Sin, G., De Pauw, D.J.W., Weijers, S., Vanrolleghem, P.A., 2008. Anefficient approach to automate the manual trial and errorcalibration of activated sludge models. Biotechnol. Bioeng. 100(3), 516–528.
Stare, A., Vrecko, D., Hvala, N., Strmcnik, S., 2007. Comparison ofcontrol strategies for nitrogen removal in an activated sludgeprocess in terms of operating costs: a simulation study. Wat.Res. 41 (9), 2004–2014.
Takacs, I., Patry, G.G., Nolasco, D., 1991. A dynamic model of theclarification thickening process. Wat. Res. 25 (10), 1263–1271.
Vanrolleghem, P., Gillot, S., 2002. Robustness and economicmeasures as control benchmark performance criteria. Wat.Sci. Tech 45 (4/5), 117–126.
Vincke, P., 1992. Multicriteria Decision-Aid. John Wiley & Sons,Chichester, UK.
Volcke, E.I.P., Gernaey, K.V., Vrecko, D., Jeppsson, U., vanLoosdrecht, M.C.M., Vanrolleghem, P.A., 2006. Plant-wide(BSM2) evaluation of reject water treatment with a SHARON-Anammox process. Wat. Sci. Technol. 54 (8), 93–100.
Vrecko, D., Gernaey, K.V., Rosen, C., Jeppsson, U., 2006.Benchmark Simulation Model no. 2 in Matlab-Simulink:towards plant-wide WWTP control strategy evaluation. Wat.Sci. Technol. 54 (8), 65–72.
Yuan, Z., Boagert, H., Leten, J., Verstraete, W., 2000. Reducing thesize of the nitrogen removal activated sludge plant byshortening the retention time of the inert solids via sludgestorage. Wat. Res. 34 (2), 539–554.