
Activated carbons from coffee husk - hnue.edu.vn
16
Journal of Chemical Research 1–16 © The Author(s) 2020 Article reuse guidelines: sagepub.com/journals-permissions DOI: 10.1177/1747519820970469 journals.sagepub.com/home/chl Creative Commons Non Commercial CC BY-NC: This article is distributed under the terms of the Creative Commons Attribution-NonCommercial 4.0 License (https://creativecommons.org/licenses/by-nc/4.0/) which permits non-commercial use, reproduction and distribution of the work without further permission provided the original work is attributed as specified on the SAGE and Open Access pages (https://us.sagepub.com/en-us/nam/open-access-at-sage). Activated carbons from coffee husk: Preparation, characterization, and reactive red 195 adsorption Thu Thuy Luong Thi , Huu Son Ta and Khu Le Van Abstract Activated carbons are prepared from coffee husks by chemical activation with ZnCl 2 and are characterized by employing Brunauer, Emmett and Teller, scanning electron microscopy, Fourier-transform infrared spectroscopy, and Boehm titrations. The effects of ZnCl 2 /coffee husks, activation temperature, and activation time are studied, and the results show that the sample ACZ3-600-2 has a high surface area of 1383 m 2 g −1 , a high pore volume of 1.6482 cm 3 g −1 , and numerous surface functional groups. The adsorption of reactive red 195 onto the prepared coffee husk activated carbon can be well-described by the pseudo-second-order kinetic model and is found to be controlled by film diffusion followed by intra-particle diffusion. The adsorption isotherm data obtained at 10–40 °C are analyzed and found to follow the Sips model at lower temperatures (10 and 20 °C) and the Redlich–Peterson model at higher temperatures (30 and 40 °C). The obtained thermodynamic parameters (ΔG° < 0, ΔH° = 33.487 kJ mol −1 , and ΔS° = 202.30 J K −1 mol −1 ) suggest that the adsorption of reactive red 195 onto the prepared activated carbon is spontaneous, endothermic, and demonstrates an increasing of randomness at the adsorbate–adsorbent interface. The investigated results show that coffee husk activated carbon is an efficient adsorbent for the removal of reactive red 195 from aqueous solutions. Keywords activated carbon, adsorption, coffee husk, mesopore, reactive red 195 Date received: 31 July 2020; accepted: 13 October 2020 Faculty of Chemistry, Hanoi National University of Education, Hanoi, Vietnam Corresponding author: Le Van Khu, Faculty of Chemistry, Hanoi National University of Education, 136 Xuan Thuy, Hanoi 1000, Vietnam. Email: [email protected] 970469CHL 0 0 10.1177/1747519820970469Journal of Chemical ResearchLuong Thi et al. research-article 2020 Research Paper
-
Upload
khangminh22 -
Category
Documents
-
view
1 -
download
0
Transcript of Activated carbons from coffee husk - hnue.edu.vn

https://doi.org/10.1177/1747519820970469
Journal of Chemical Research 1 –16
© The Author(s) 2020Article reuse guidelines:
sagepub.com/journals-permissionsDOI: 10.1177/1747519820970469
journals.sagepub.com/home/chl
Creative Commons Non Commercial CC BY-NC: This article is distributed under the terms of the Creative Commons Attribution-NonCommercial 4.0 License (https://creativecommons.org/licenses/by-nc/4.0/) which permits non-commercial use,
reproduction and distribution of the work without further permission provided the original work is attributed as specified on the SAGE and Open Access pages (https://us.sagepub.com/en-us/nam/open-access-at-sage).
Activated carbons from coffee husk: Preparation, characterization, and reactive red 195 adsorption
Thu Thuy Luong Thi , Huu Son Ta and Khu Le Van
AbstractActivated carbons are prepared from coffee husks by chemical activation with ZnCl2 and are characterized by employing Brunauer, Emmett and Teller, scanning electron microscopy, Fourier-transform infrared spectroscopy, and Boehm titrations. The effects of ZnCl2/coffee husks, activation temperature, and activation time are studied, and the results show that the sample ACZ3-600-2 has a high surface area of 1383 m2 g−1, a high pore volume of 1.6482 cm3 g−1, and numerous surface functional groups. The adsorption of reactive red 195 onto the prepared coffee husk activated carbon can be well-described by the pseudo-second-order kinetic model and is found to be controlled by film diffusion followed by intra-particle diffusion. The adsorption isotherm data obtained at 10–40 °C are analyzed and found to follow the Sips model at lower temperatures (10 and 20 °C) and the Redlich–Peterson model at higher temperatures (30 and 40 °C). The obtained thermodynamic parameters (ΔG° < 0, ΔH° = 33.487 kJ mol−1, and ΔS° = 202.30 J K−1 mol−1) suggest that the adsorption of reactive red 195 onto the prepared activated carbon is spontaneous, endothermic, and demonstrates an increasing of randomness at the adsorbate–adsorbent interface. The investigated results show that coffee husk activated carbon is an efficient adsorbent for the removal of reactive red 195 from aqueous solutions.
Keywordsactivated carbon, adsorption, coffee husk, mesopore, reactive red 195
Date received: 31 July 2020; accepted: 13 October 2020
Faculty of Chemistry, Hanoi National University of Education, Hanoi, Vietnam
Corresponding author:Le Van Khu, Faculty of Chemistry, Hanoi National University of Education, 136 Xuan Thuy, Hanoi 1000, Vietnam. Email: [email protected]
970469 CHL0010.1177/1747519820970469Journal of Chemical ResearchLuong Thi et al.research-article2020
Research Paper

2 Journal of Chemical Research 00(0)
Introduction
The textile industry discharges a large amount of dye wastewater, which is difficult to biodegrade and poses severe environmental and health hazards to the communi-ties and the aquatic ecosystem. Among the methods to remove the contaminants from effluents, adsorption has many advantages over others due to its easy operation, low installation cost, large-scale application, and complete removal of impurities from dilute solutions.1 Adsorbents can be silica gel,2 alumina,3 carbon,4 zeolites,5 polymers and resins,6 clay,7 and so on, in which activated carbon (AC) is a stand-out material owing to its large surface area, high pore volume, and high amount of surface functional groups. Recently, the preparation of AC with the desired chemical and physical properties from agricultural waste has gained significant interest8 and can be applied as adsor-bents in many purification processes such as wastewater treatment,9 gas cleaning,10 and metal removal.11 The prop-erties of AC not only depend on the source precursors but also depend on the activation methods. Generally, chemical activation is more applicable compared to physical activa-tion due to the lower temperature of the process, the higher production yields, and the easier control of AC pore size distribution.12 In the chemical activation process, the pre-cursor is impregnated with the chemical activating agent, and then heated at a temperature from 400 to 800 °C for a defined time. The activating agents help to develop the porosity of AC through dehydration or degradation pro-cesses, which creates pores, cracks, and crevices. According to the literature,13,14 the pore size is mostly depended on the types of activation agents. As a general rule, AC activated by (1) alkali compounds, especially KOH, has a majority of micropores, (2) H3PO4 includes both micropores and mesopores,15 and (3) ZnCl2 possesses mostly mesopores.16 Note that the appropriate pore size of the adsorbent ensures the effectiveness and selectivity for the specific contami-nants that need removal. Large molecules such as dyes should be treated by mesopore-AC. ZnCl2 activation not only produces mesopore-AC as demanded but can also lower the activation temperature significantly during the activation process,17 which is economically beneficial for the activation process.
The aim of this study was to optimize the production of AC using ZnCl2 activation in a one-step process in order to produce highly mesoporous AC with a pore size suitable for the adsorption of reactive red (RR) 195, a commonly used acidic (anionic) dye. The effects of the ZnCl2/coffee husk (CFH) ratio, activation temperature, and activation time on the physical properties and the adsorption abilities toward RR 195 of the CFH-AC have been investigated.
Results and discussion
Physicochemical characterization of AC
The elemental analysis results of the starting CFH and the obtained ACs are shown in Table 1. It can be seen that besides the two main elements, C and O (more than 45%), CFH also contains about 3.5% of K and trace contents (less than 0.6%) of some other metal elements (Mg, Al, and Ca) T
able
1.
Elem
enta
l ana
lysi
s of
the
AC
sam
ples
.
Sam
ple
Elem
enta
l wei
ght
%
C
OM
gA
lSi
PS
Cl
KC
aT
otal
CFH
49.3
845
.30
0.18
0.23
0.31
0.14
0.28
0.08
3.50
0.60
100
AC
Z0-
600-
286
.34
13.2
4–
––
–0.
180.
24–
–10
0A
CZ
1-60
0-2
88.5
610
.65
––
––
0.30
0.49
––
100
AC
Z2-
600-
288
.24
10.9
6–
––
–0.
290.
51–
–10
0A
CZ
3-60
0-2
88.5
010
.74
––
––
0.27
0.49
––
100
AC
Z4-
600-
288
.64
10.4
5–
––
–0.
300.
61–
–10
0
AC
: act
ivat
ed c
arbo
n; C
FH: c
offe
e hu
sk.

Luong Thi et al. 3
and non-metal elements (Si, P, S, and Cl). Heat treatment followed by washing process removed most of the metal and non-metal elements and had a strong effect on the car-bon contents of the resulting samples. The carbon content of the sample ACZ0-600-2 (no ZnCl2) was as high as 86.34%, an increase in more than 50% compared to the pre-cursor. The presence of ZnCl2 (regardless of the ZnCl2 ratio) further enhances the carbon content to more than 88%. There was no trace of other metals, especially Zn, observed in the energy-dispersive X-ray (EDX) spectrum, suggesting the effectiveness of the washing process and providing proof of the low level of impurities (ash).
The N2 adsorption–desorption isotherms conducted at 77 K of the ACs prepared from ZnCl2 activation at different impregnation ratios, activation temperatures, and activation times are shown in Figure 1. It appears that the presence of
ZnCl2 in the activation process can enhance significantly the surface areas of the obtained ACs, since nitrogen uptake is very high compared to that of the ACZ0-600-2 sample. According to the IUPAC classification, the isotherm of ACZ1-600-2 is defined as type I, which is associated with micropore structures. The others are categorized as a mixed type of I and IV with a hysteresis loop in the p/po range of 0.5–1.0, indicating the simultaneous presence of micropores and mesopores. The specific surface areas and pore textures determined for the obtained ACs at different impregnation ratios, activation temperatures, and activation times are shown in Table 2. As the ZnCl2/CFH ratio increases from 1:1 to 3:1, the SBET and Vtot (total pore volume, equal to the sum of Vmic and VBJH) increase from 1049 m2 g−1 and 0.5551 cm3 g−1 to 1383 m2 g−1 and 1.6482 cm3 g−1, respec-tively. These changes mostly contributed to the develop-ment of mesopores, with the growth of mesopores observed from 25.22% to 87.86% along with the enlargement of DBJH from 3.85 to 6.28 nm. At a low ZnCl2/CFH ratio, ZnCl2 has a milder effect with respect to the release of volatiles, but at a high ZnCl2/CFH proportion, the higher ZnCl2 content pro-vides a more violent response that leads to the widening of pores and subsequently converts the micropores into mesopores.18 Nevertheless, when the ZnCl2/CFH ratio was further increased to 4:1, the SBET decreased to 1306 m2 g−1, while the Vtot continuity increased to 1.9189 cm3 g−1. Since carbon in the precursor is a finite amount, the loss of carbon during the activation process at high ZnCl2 content, on the contrary, will restrict the increase in SBET.
It also can be seen from Table 2 that as the temperature increases from 500 to 600 °C, the SBET and Vtot values increase from 918 to 1383 m2 g−1 and from 0.8379 to 1.6482 cm3 g−1, respectively. This increase is due to the evaporation of sub-stances, which directly results from the decomposition of the CFH at elevated temperatures. However, at the activation temperature of 650 °C, the SBET value decreases to 1101 m2 g−1, and Vtot drops to 1.3404 cm3 g−1. This is possibly due to the sintering effect, which results in the shrinkage of pores, and consequently reduces the specific surface area and pore volume. Besides, a high temperature also promotes the evap-oration of zinc chloride19 and leads to a decrease in the perfor-mance of ZnCl2 at activation temperatures greater than 600 °C.
The effect of activation time is not as pronounced as the other two conditions, even though they follow the same trend. With an increase in the activation time from 1.0 to 2.0 h, SBET and Vtot advance to a certain degree and then decrease when the activation time is further increased to 2.5 h. The reduction in SBET and Vtot is attributable to the seal-off of some portion of pores after a prolonged time.20 The highest specific surface area obtained is found to be 1383 m2 g−1, which was achieved at a ZnCl2/CFH ratio of 3:1, an activation temperature of 600 °C, and an activation time of 2.0 h.
The mesopore size distribution of the obtained AC is calculated using the Barrett–Joyner–Halenda (BJH) method21 and is elucidated in Figure 2. Clearly, mesopores are mostly accumulated in the range of 2–25 nm, with a majority at around 4 nm. As seen in Figure 2(a), the mesopore volume increases with a rise in the ZnCl2/CFH
(c)
Relative Pressure (p/p°)0.0 0.2 0.4 0.6 0.8 1.0
ACZ3-600-1ACZ3-600-1.5ACZ3-600-2ACZ3-600-2.5
400
(b)
Qua
ntity
Ads
orbe
d (c
m³/g
STP
)
ACZ3-500-2ACZ3-550-2ACZ3-600-2ACZ3-650-2
(a)ACZ0-600-2 ACZ1-600-2ACZ2-600-2ACZ3-600-2ACZ4-600-2
500
500
Figure 1. Adsorption–desorption isotherms of N2 at 77 K of the AC samples prepared at different (a) impregnation ratios (activation temperature: 600 °C and activation time: 2 h), (b) activation temperatures (ZnCl2/CFH ratio: 3:1 and activation time: 2 h), and (c) activation times (ZnCl2/CFH ratio: 3:1 and activation temperature: 600 °C).

4 Journal of Chemical Research 00(0)
ratio. However, the amount of mesopores with pore sizes from 2 to 10 nm decreases, while the larger pore sizes con-stantly increase when the ZnCl2/CFH ratio is as high as 4:1. At this high ZnCl2/CFH ratio, the vaporization and decom-position of ZnCl2 happen intensely and result in the enlarge-ment of pores, which in turn lower the amount of pores with pore size less than 10 nm and increase the amount of pores with pore size larger than 10 nm.
Figure 3 shows the morphologies of the ACs prepared at different ZnCl2/CFH ratios. The AC samples comprise spherical-shaped particles that stack irregularly to form cracks, crevices, and voids. Due to the sufficient amount of activation agent, the ACZ3-600-2 and ACZ4-600-2 sam-ples show a small particle size compared to those of ACZ1-600-2 and ACZ2-600-2.
The Fourier-transform infrared (FTIR) spectra of the ACs are shown in Figure 4. It can be seen that all the FTIR spectra are identical and that most of the absorbance bands are positioned at the same wavenumbers. The band at 3450 cm−1 indicates the presence of the O–H stretching of hydroxy groups, possibly due to the adsorbed water.22 The peak at 1700 cm−1 is ascribed to a C=O stretching of car-bonyl.23 The peak located at 1630 cm−1 is associated with stretching of an unsaturated aromatic C=C24 and C=O stretching of a ketone carbonyl. The peak observed at 1390 cm−1 is ascribed to oxygen functionalities such as C=O stretching, O–H bending, and C–O stretching. Finally, the peak at 1070 cm−1 is assigned to C–O stretching of an alcohol.25
The surface functional groups of the prepared ACs are quantitatively assessed by applying the Boehm titration method, and the results are summarized in Table 3. As can be seen, the ACs prepared via ZnCl2 activation present both acidic and basic functional groups. The amount of acidic groups (0.94–1.59 mmol g−1) is always higher than that of the basic groups (0.47–0.57 mmol g−1), and the acidic group/basic group ratio is in the range of 1.6–2.8. An increase in the ZnCl2/CFH ratio from 1:1 to 4:1 and the
activation time from 1.0 to 2.5 h lead to enhancement of both the acidic and basic functional groups; consequently, the acidic group/basic group ratio at different ZnCl2/CFH ratios and activation times fluctuates from 2.2 to 2.5. However, by increasing the activation temperature from 500 to 650 °C, the amount of acidic groups diminishes from 1.59 to 0.94 mmol g−1, in which the amount of carboxyl groups decreases from 0.68 to 0.42 mmol g−1, although the basic groups remain nearly unchanged (0.52–0.57 mmol g−1). As a result, the acidic group/basic group ratio reduces from 2.8 to 1.6. This result might be due to the diversity in the decomposition temperatures of different functional groups. Carboxyl groups start to decompose at ~250 °C, lactonic groups at ~350 °C, and phenolic groups at 500 °C, while the basic groups decompose at much higher temperatures (650–980 °C).25,26 Therefore, the amount of acidic groups decreases faster than that of basic groups, and the carboxyl groups are the most affected.
The point of zero charge (pHPZC) method measures the pH at which the total number of positive and negative charges on the surface becomes zero. From Figure 5, it can be seen that the pHPZC values of the ACs prepared at differ-ent activation temperatures are in the range of 5.8–6.4, implying the acidic nature of the as-prepared AC surfaces. The acidity of AC surface decreases in the order ACZ3-500-2 > ACZ3-550-2 > ACZ3-600-2 > ACZ3-650-2, which is in the same order as the acidic groups/basic groups obtained from the Boehm titrations.
Adsorption of RR 195
Effect of activation conditions
The adsorption capacity of the ACs prepared under differ-ent activation conditions was investigated under the experi-mental conditions of an initial RR 195 concentration of 200 mg L−1, a pH of 2.5, an AC dose of 1.0 g L−1, and a tem-perature of 30 °C, and the results are shown in Figure 6. It
Table 2. Specific surface area and pore texture of activated carbons produced under different activation conditions.
Activation conditions
Label SBET (m2 g−1)
Smic (m2 g−1)
SBJH (m2 g−1)
SBJH/SBET (%)
Vmic (cm3 g−1)
VBJH (cm3 g−1)
VBJH/Vtot (%)
DBJH (nm)
ZnCl2/CFH ratio (activation temperature: 600 °C and activation time: 2 h)0:1 ACZ0-600-2 150 141 9 6.00 0.0680 0.0025 3.55 –1:1 ACZ1-600-2 1049 903 146 13.92 0.4151 0.1400 25.22 3.842:1 ACZ2-600-2 1169 491 678 58.00 0.2155 0.8249 79.29 4.873:1 ACZ3-600-2 1383 461 922 66.67 0.2001 1.4481 87.86 6.284:1 ACZ4-600-2 1306 363 943 72.21 0.1552 1.7637 91.91 7.48Activation temperature (°C) (ZnCl2/CFH ratio: 3:1 and activation time: 2 h)500 ACZ3-500-2 918 410 508 55.34 0.1796 0.6583 78.57 5.18550 ACZ3-550-2 1242 440 802 64.57 0.1927 1.2871 86.98 6.42600 ACZ3-600-2 1383 461 922 66.67 0.2001 1.4481 87.86 6.28650 ACZ3-650-2 1101 400 701 63.67 0.1782 1.1622 86.71 6.63Activation time (h) (ZnCl2/CFH ratio: 3:1 and activation temperature: 600 °C)1.0 ACZ3-600-1 1101 374 727 66.03 0.1633 1.1097 87.17 6.111.5 ACZ3-600-1.5 1205 480 725 60.17 0.2169 1.2234 84.94 6.752.0 ACZ3-600-2 1383 461 922 66.67 0.2001 1.4481 87.86 6.282.5 ACZ3-600-2.5 1250 496 754 60.32 0.2204 1.3981 86.38 7.42
CFH: coffee husk.

Luong Thi et al. 5
is apparent that the sample activated without the activation agent has a very small qe value (5.57 mg g−1) compared to others, which is due to its low specific surface area and pore volume.
It also can be seen from Figure 6 that the impregnation ratio has the most noticeable effect and that the activation time has the least influence on the adsorption ability of the prepared ACs. The qe value increases significantly from sample ACZ1-600-2 (139.45 mg g−1) to sample ACZ3-600-2 (188.12 mg g−1) when the impregnation ratios increase from 1:1 to 3:1, while fluctuations occur between 177.12 and 188.12 mg g−1 when the activation times increase from 1 to 2.5 h. For the effect of the activation tem-perature, the adsorption capacity increases from 160.66 to 188.12 mg g−1 and then decreases to 173.87 mg g−1 as the activation temperature increases from 500 to 650 °C.
The change in the RR 195 adsorption capacity of the AC samples is similar to the change in specific surface area and pore volume, especially those of mesopores (see Table 2), and thus can be explained according to these variables. The ACs that have a higher specific surface area and mesopore volume will have a greater adsorption capacity.
The highest adsorption capacity of 188.12 mg g−1 was obtained with the AC sample activated at a ZnCl2/CFH ratio of 3:1, an activation temperature of 600 °C, and an activation time of 2 h. Therefore, in this section, the adsorp-tion kinetics and equilibria were only studied with the ACZ3-600-2 sample.
Effect of the AC dose and pH on the adsorption equilibrium of RR 195
Under adsorption conditions involving a Co of 200 mg L−1 and a pH of 2.5, the effects of the adsorbent dose on the adsorption capacity and the removal of RR 195 are shown in Figure 7. It can be observed that the AC dose from 0.50 to 1.75 g L−1 showed an enhancement of the RR 195 removal percentage from 55.18% to 99.05%, which is due to the increase in surface area and adsorption sites.27 However, the equilibrium adsorption capacity decreases from 220.70 to 113.20 mg g−1 when the AC amount increases from 0.5 to 1.75 g L−1. The drop in the RR 195 adsorption capacity with the adsorbent dosage might be associated with the unsatu-rated adsorption degree of the AC.28 At an activated dosage higher than 1.0 g L−1, the increase in adsorbent dose did not change the RR 195 removal appreciably but reduced the adsorption capacity significantly. Therefore, for further experiments, the AC dose is fixed at 1.0 g L−1.
The effect of the pH on the removal efficiency of RR 195 and the adsorption capacity of CFH-AC was conducted in the pH range of 1.5–9.0 and is shown in Figure 8. It can be seen from Figure 8 that both the removal percentage and the adsorption capacity decrease as the pH increases. At a pH greater than 3.0, both the percentage removal and the adsorption capacity reduce quickly. The reason is associ-ated with the value of pHPZC of the AC. The pHPZC value of ACZ3-600-2 is around 6.2, so at a pH less than 6, the AC surface is positively charged, which promotes the attraction force between the AC and RR 195 (an anionic dye, nega-tively charged). As the pH increases to over 6.2, the AC surface becomes negatively charged, leading to the enhancement of the repulsive force between the AC and RR 195, and thus lowering the RR 195 adsorption capacity of the AC sample.
Based on the above investigation and considering the RR 195 removal as well as the adsorption capacity, a pH value of 2.5 was selected for further study.
Adsorption kinetic. Figure 9 shows the kinetics of the adsorp-tion of RR 195 onto the ACZ3-600-2 sample with different initial concentrations (150–300 mg L−1) and at four temper-atures (10–40 °C). The shapes of all the kinetic curves are similar and consist of a fast adsorption range (0–60 min), followed by a slow adsorption range, and then reaching equilibrium. The fast adsorption process during the initial
(c)
Pore Width (nm)2.0 4.0 10.0 25.0 50.0
ACZ3-600-1ACZ3-600-1.5ACZ3-600-2ACZ3-600-2.5
(a)ACZ1-600-2ACZ2-600-2ACZ3-600-2ACZ4-600-2
0.05
0.05
(b)
dV/d
w P
ore
Volu
me
(cm
³/g·n
m)
ACZ3-500-2ACZ3-550-2ACZ3-600-2ACZ3-650-2
0.05
Figure 2. Pore size distribution of the AC samples prepared at different (a) impregnation ratios (activation temperature: 600 °C and activation time: 2 h), (b) activation temperatures (ZnCl2/CFH ratio: 3:1 and activation time: 2 h), and (c) activation times (ZnCl2/CFH ratio: 3:1 and activation temperature: 600 °C).

6 Journal of Chemical Research 00(0)
Figure 3. SEM images of the as-prepared activated carbons at different impregnation ratios.
(a)
Wavenumbers (cm-1)5001000150020002500300035004000
Abs
3450
1390
1630
17001070
ACZ1-600-2
ACZ2-600-2
ACZ3-600-2
ACZ4-600-2
0.05
(b)
Wavenumbers (cm-1)5001000150020002500300035004000
Abs
3450
1390
1630
17001070
ACZ3-500-2
ACZ3-550-2
ACZ3-600-2
ACZ3-650-2
0.05
(c)
Wavenumbers (cm-1)5001000150020002500300035004000
Abs
3450
1390
1630
17001070
ACZ3-600-1
ACZ3-600-1.5
ACZ3-600-2
ACZ3-600-2.5
0.05
Figure 4. FTIR spectra of AC samples prepared at different (a) impregnation ratios (activation temperature: 600 °C and activation time: 2 h), (b) activation temperatures (ZnCl2/CFH ratio: 3:1 and activation time: 2 h), and (c) activation times (ZnCl2/CFH ratio: 3:1 and activation temperature: 600 °C).

Luong Thi et al. 7
stage is attributed to the abundant active sites for adsorp-tion, and the gradual rate of adsorption might be due to the occurrence of pore diffusion resistance. The time required to reach equilibrium for the adsorption of RR 195 onto CFH-AC at a concentration of 150–300 mg L−1 and a tem-perature of 10–40 °C is estimated to be 240 min.
The adsorption kinetics of the adsorption of RR 195 onto the ACZ3-600-2 sample was estimated using the three com-mon kinetic models in their linear forms as follows
Pseudo-first-order PFO e t e( ) − = −: ln( ) lnq q q k t1 (1)
Pseudo-second-order PSO t e
2e
( ) = +:t
q k q qt
1 1
2
(2)
Elovich : = 1/ ln + 1/ lntq tβ αβ β( ) ( ) ( ) ( ) (3)
where qt and qe (mg g−1) are the amounts of RR 195 adsorbed at time t (min) and at equilibrium, respectively, k1 (min−1) and k2 (g mg−1 min−1) are the rate constants of
Table 3. Surface functional groups of the AC samples.
Label Carboxyl (mmol g−1)
Lactone (mmol g−1)
Phenol (mmol g−1)
Acidic groups (mmol g−1)
Basic groups (mmol g−1)
Acidic groups/basic groups
ZnCl2/CFH ratio (activation temperature: 600 °C and activation time: 2 h)1:1 ACZ1-600-2 0.39 0.28 0.37 1.04 0.48 2.22:1 ACZ2-600-2 0.48 0.32 0.36 1.16 0.51 2.33:1 ACZ3-600-2 0.53 0.35 0.32 1.20 0.54 2.24:1 ACZ4-600-2 0.67 0.36 0.38 1.41 0.56 2.5Activation temperature (°C) (ZnCl2/CFH ratio: 3:1 and activation time: 2 h)500 ACZ3-500-2 0.68 0.45 0.46 1.59 0.56 2.8550 ACZ3-550-2 0.57 0.41 0.38 1.36 0.52 2.6600 ACZ3-600-2 0.53 0.35 0.32 1.20 0.54 2.2650 ACZ3-650-2 0.42 0.29 0.23 0.94 0.57 1.6Activation time (h) (ZnCl2/CFH ratio: 3:1 and activation temperature: 600 °C)1 ACZ3-600-1 0.46 0.37 0.33 1.16 0.49 2.41.5 ACZ3-600-1.5 0.49 0.33 0.37 1.19 0.47 2.52 ACZ3-600-2 0.53 0.35 0.32 1.20 0.54 2.22.5 ACZ3-600-2.5 0.52 0.35 0.32 1.19 0.55 2.2
AC: activated carbon; CFH: coffee husk.
pHi
2 3 4 5 6 7 8 9 10 11
pHf
2
3
4
5
6
7
8
9
10
11
ACZ3-500-2ACZ3-550-2ACZ3-600-2 ACZ3-650-2
Figure 5. pHpzc of the AC samples.
ACZ0
-600
-2AC
Z1-6
00-2
ACZ2
-600
-2AC
Z3-6
00-2
ACZ4
-600
-2
q e (m
g g-1
)
0
50
100
150
200
ACZ3
-500
-2AC
Z3-5
50-2
ACZ3
-600
-2AC
Z3-6
50-2
X Data
ACZ3
-600
-1AC
Z3-6
00-1
.5AC
Z3-6
00-2
ACZ3
-600
-2.5
Figure 6. RR 195 adsorption capacity of the AC samples at 30 °C (Co = 200 mg L−1, pH = 2.5, and AC dose = 1.0 g L−1).
m (g L-1)0.25 0.50 0.75 1.00 1.25 1.50 1.75 2.00
% re
mov
al
0
20
40
60
80
100
120
q e (m
g g-1
)
100
125
150
175
200
225
250
% removalqe
Figure 7. Effect of the different adsorbent doses on the adsorption capacity and the removal of RR 195 (Co = 200 mg L−1 and pH = 2.5).

8 Journal of Chemical Research 00(0)
pseudo-first-order (PFO) and pseudo-second-order (PSO) adsorption, respectively, α is the initial adsorption rate (mg g−1 min−1), and β is the desorption constant (g mg−1).
The parameters of these equations were obtained using linear regression. The validity of these models was evaluated
by the coefficient of determination (R2) and the average rela-tive errors (AREs). The model with the highest R2 value and the lowest ARE value is considered to be the most applicable model, which presents a good correlation between experi-mental data and the kinetic equation as well as between the empirical and predicted data. The values of ARE were obtained using equation (4)
ARE =100 t,pre t,mes
t,mesN
q
ii
N −
=∑
q
q1
(4)
where qt,mes and qt,pre are the experimental and predicted amount of RR 195 adsorbed at time t, respectively; and N is the number of experimental data.
Figure 10 demonstrates the fitting lines of PFO, PSO, and the Elovich models for adsorption of RR 195 onto ACZ3-600-2 at dye concentrations in the range of 150–300 mg L−1, at 30 °C, and a pH of 2.5. It can be seen that the PSO kinetic model has a much better correlation fit for the RR 195 adsorption data than the PFO and Elovich models for all the conditions investigated. The parameters of the models at different initial RR 195 concentrations and adsorption temperatures are calculated and are summarized
(a)
t (min)0 50 100 150 200 250 300
q t (m
g g-1
)
0
50
100
150
200
250
Co = 150 mg L-1
Co = 200 mg L-1
Co = 250 mg L-1
Co = 300 mg L-1
(b)
t (min)0 50 100 150 200 250 300
q t (m
g g-1
)
0
50
100
150
200
T = 10 oCT = 20 oCT = 30 oCT = 40 oC
Figure 9. Adsorption kinetics of RR 195 using the ACZ3-600-2 sample at different (a) initial concentrations and (b) temperatures (pH = 2.5; the solid curves were calculated by the PSO equation).
(a)
t (min)0 50 100 150 200 250 300
t/qt(m
g-1 g
min
)
0.0
0.5
1.0
1.5
2.0
2.5
3.0
ln(qe -q
t )
2.0
2.5
3.0
3.5
4.0
4.5
5.0Co = 150 mg L-1
Co = 200 mg L-1
Co = 250 mg L-1
Co = 300 mg L-1
(b)
ln(t)2.0 2.5 3.0 3.5 4.0 4.5 5.0 5.5 6.0
q t(mg
g-1)
0
50
100
150
200
250
Co = 150 mg L-1
Co = 200 mg L-1
Co = 250 mg L-1
Co = 300 mg L-1
Figure 10. (a) The PFO and PSO and (b) the Elovich kinetic models for RR 195 adsorption at 30 °C to the ACZ3-600-2 sample (the solid, dashed, and dotted lines are calculated from the PSO, PFO, and Elovich equations, respectively).
pHo
0 2 4 6 8 10
% re
mov
al
0
20
40
60
80
100
q e (m
g g-1
)100
125
150
175
200
% removalqe
Figure 8. Effect of the different pH on the adsorption capacity and the removal of RR 195 (Co = 200 mg L−1 and AC dose: 1.0 g L−1).

Luong Thi et al. 9
in Table 4. It was observed that the R2 values were closest to 1 when applying the PSO model. Besides, ARE value of the PSO model is relatively small (0.43%–0.93%), com-pared to that of the PFO model (60.70%–70.67%) and the Elovich model (3.30%–4.17%). Furthermore, the qe value calculated using the PSO model is from 146.63 to 255.1 mg g−1, which is in the same range as the experimen-tal qe. Therefore, it can be concluded that the PSO model is well-fitted for the adsorption of RR 195 onto CFH-AC.
It can also be seen from Table 4 that the rate constant of PSO adsorption decreases with an increase in the initial RR 195 concentration and increases with a rise in the adsorp-tion temperature. However, the initial adsorption rate, ho (mg g−1 min−1), which is calculated using equation (5) is unaffected by the initial RR 195 concentration, while it increases immensely with an increase in the temperature. The constant ho at different adsorbate concentrations is due to the sufficient number of mesopores in the ACs, which facilitate the transport of dye molecules at the surface and inside the pores. Nevertheless, the heat diffusion rate of the dye molecule at high temperatures resulted in an increase in ho at elevated temperatures
h k qo e= 22 (5)
The activation energy (Ea) of the adsorption of RR 195 onto CFH-AC was calculated using the Arrhenius equation
ln lnk AE
RT2a= − (6)
where k2 is the PSO rate constant (g g−1 s−1), Ea is the activa-tion energy (kJ mol−1), A is the Arrhenius factor, R is the gas constant (8.314 J mol−1 K−1), and T is the absolute tempera-ture (K).
From the slope of the linear plot of lnk2 versus reciprocal temperature (Figure 11), the activation energy is found to be 8.558 kJ mol−1. The value of Ea infers that the adsorption of RR 195 onto CFH-AC is the physisorption process.
Generally, the adsorption process of a dye involves three sequential processes: (1) film diffusion: the dye is adsorbed on the external part of the AC, (2) particle diffusion: trans-port and adsorption of dye molecules within the pores of the AC occurs, and (3) physisorption or chemisorption of the dye molecules on the inner surface of the AC. Step (3) is relatively fast, but it is not the rate-determining step.29 In order to determine the rate-determining step for the adsorp-tion of RR 195 onto AC, the experimental data were further investigated using the Weber and Morris model, which is shown in equation (7)
q k t Ct d= +1 2/ (7)
where C is the intercept and kd is the intra-particle diffusion rate constant.
The plots of qt versus t1/2 for the adsorption of RR 195 onto the ACZ3-600-2 sample at different initial concentra-tions of RR 195 and temperatures are shown in Figure 12. These lines do not pass through the origin and contain two straight lines, implying that the intra-particle is not the sole
Table 4. The parameters of the adsorption of RR 195 onto the ACZ3-600-2 sample calculated from kinetic models.
Co (mg L−1) 150 200 250 300 200 200 200
T (°C) 30 30 30 30 10 20 40
Experimental qe (mg g−1) 146.64 188.12 225.43 254.09 179.26 184.63 193.87
Pseudo-first-order model qe (mg g−1) 71.24 93.98 123.25 151.37 102.24 98.60 88.03 k1 × 103 (min−1) 9.24 9.22 8.61 8.53 8.55 9.11 10.00 R2 0.9447 0.9418 0.9421 0.9555 0.95017 0.9523 0.9446 ARE (%) 69.05 67.95 64.87 60.70 62.93 66.09 70.67Pseudo-second-order model qe (mg g−1) 146.63 188.68 225.23 255.10 179.53 185.53 195.31 k2 × 104 (g mg−1 min−1) 3.82 2.80 1.97 1.47 2.27 2.53 3.24 ho (mg g−1 min−1) 8.2 10.0 10.0 9.6 7.3 8.7 12.4 R2 0.9999 0.9999 0.9998 0.9995 0.9999 0.9998 0.9999 ARE (%) 0.93 0.43 0.55 0.84 0.58 0.75 0.51Elovich model α (mg g−1 min−1) 28.94 31.81 27.31 24.10 19.20 25.53 49.65 β (g mg−1) 0.039 0.030 0.023 0.020 0.029 0.029 0.031 R2 0.9726 0.9721 0.9792 0.9881 0.9851 0.9800 0.9661 ARE (%) 3.86 4.17 4.08 3.30 3.59 3.76 4.00
1/T (K-1)0.0031 0.0032 0.0033 0.0034 0.0035 0.0036
lnk 2
-8.5
-8.4
-8.3
-8.2
-8.1
-8.0
-7.9
-7.8
y = -1029.3x - 4.7628R2 = 0.9882
Figure 11. Plot of lnk2 versus 1/T.

10 Journal of Chemical Research 00(0)
rate-limiting step. The first stage up to 50 min is the rapid surface loading due to the sufficient amount of active sites on the AC. The second stage has a smaller slope, presenting a slower adsorption rate, which is governed by intra-parti-cle diffusion.30 Similar results were obtained for the adsorp-tion of RR 195 onto wheat bran.31
The calculated adsorption rate, the C constant, and the coefficient of determination are summarized in Table 5. It can be seen that the R2 values are relatively high, implying the good fit between the model and the experimental data. The rate of diffusion in the initial stage is much larger than that of the second stage. The adsorption rate during both stages increases with the increase in initial RR 195 concen-trations and temperatures. This is due to the promotion effect on the diffusion rate at the higher concentration gra-dients and temperatures.
Adsorption isotherms
The RR 195 uptakes of the ACZ3-600-2 sample at four dif-ferent adsorption temperatures (10, 20, 30, and 40 °C) are displayed in Figure 13. As can be seen, the adsorbed amounts of RR 195 increase with RR 195 concentration, rather sharply in the region of concentration less than 40 mg L−1 and more smoothly at higher concentration. Besides, the RR 195 adsorption increases with temperature, which shows the endothermic characteristic of the process. At all temperatures studied, the isotherms display no pla-teau, indicating unsaturated adsorption under the investi-gated conditions.
The distribution of the adsorbate and the interaction between the adsorbate and AC sample at equilibrium are investigated using two-parameter models, namely, the Langmuir, Freundlich, and Elovich isotherms, and three-parameter models including the Radke–Prausnitz, Redlich–Peterson, Sips, and Tóth isotherms. The models applied to the adsorption data are introduced in Table 6.
The parameters of the seven isotherms equations for the RR 195 adsorption on ACZ3-600-2 were evaluated using non-linear regression by minimizing the root mean square
(a)
t1/2 (min1/2)
2 4 6 8 10 12 14 16 18
q t (m
g g-1
)
0
50
100
150
200
250
Co = 150 mg L-1
Co = 200 mg L-1
Co = 250 mg L-1
Co = 300 mg L-1
(b)
t1/2 (min1/2)
2 4 6 8 10 12 14 16 18
q t (m
g g-1
)
0
50
100
150
200
T = 10 oCT = 20 oCT = 30 oCT = 40 oC
Figure 12. Intra-particle diffusion model plots for RR 195 adsorption on the ACZ3-600-2 sample.
Table 5. Calculated parameters of the Weber and Morris model for the RR 195 adsorption on the ACZ3-600-2 sample.
Co (mg L−1) T (°C) kd1 (mg g−1 min−0.5)
C1 (mg g−1) R 12 kd2
(mg g−1 min−0.5)C2 (mg g−1) R 2
2
150 30 14.00 13.23 0.9814 2.49 99.28 0.9837200 30 18.52 11.16 0.9887 3.31 125.25 0.9854250 30 21.45 6.75 0.9838 4.39 139.72 0.9837300 30 23.11 3.90 0.9832 5.77 143.10 0.9805200 10 16.73 3.96 0.9833 3.83 105.41 0.9802200 20 17.67 8.74 0.9882 3.74 114.57 0.9865200 40 20.26 15.58 0.9855 2.98 138.71 0.9822
RR 195: reactive red 195.
Ce (mg L-1)0 20 40 60 80 100
q e (m
g g-1
)
100
150
200
250
300
T = 10 oCT = 20 oCT = 30 oCT = 40 oC
Figure 13. RR 195 uptakes at different adsorption temperatures for ACZ3-600-2 (the solid and dashed curves were calculated by the Langmuir and Freundlich equations).
Luong Thi et al. 11
error (RMSE). The applicability of these equations is veri-fied through the coefficient of determination (R2) and ARE. In this case, RMSE, R2, and ARE are calculated according to equations (8), (9), and (10), respectively
RMSE =1
e,pre e,mes
2
N ii
N
q q−( )=∑
1 (8)
Ri
i
N
ii
N2
e,mes e,pre2
e,mes e,mean2
= 1
( )
( )
−
−
−
=
=
∑
∑
q q
q q
1
1
(9)
ARE =100 e,pre e,mes
e,mesNii
N q q
q
−
=∑
1
(10)
where qe,mes, qe,pre, and qe,mean are the experimental, pre-dicted, and average adsorption capacities, respectively; and N is the number of experimental data.
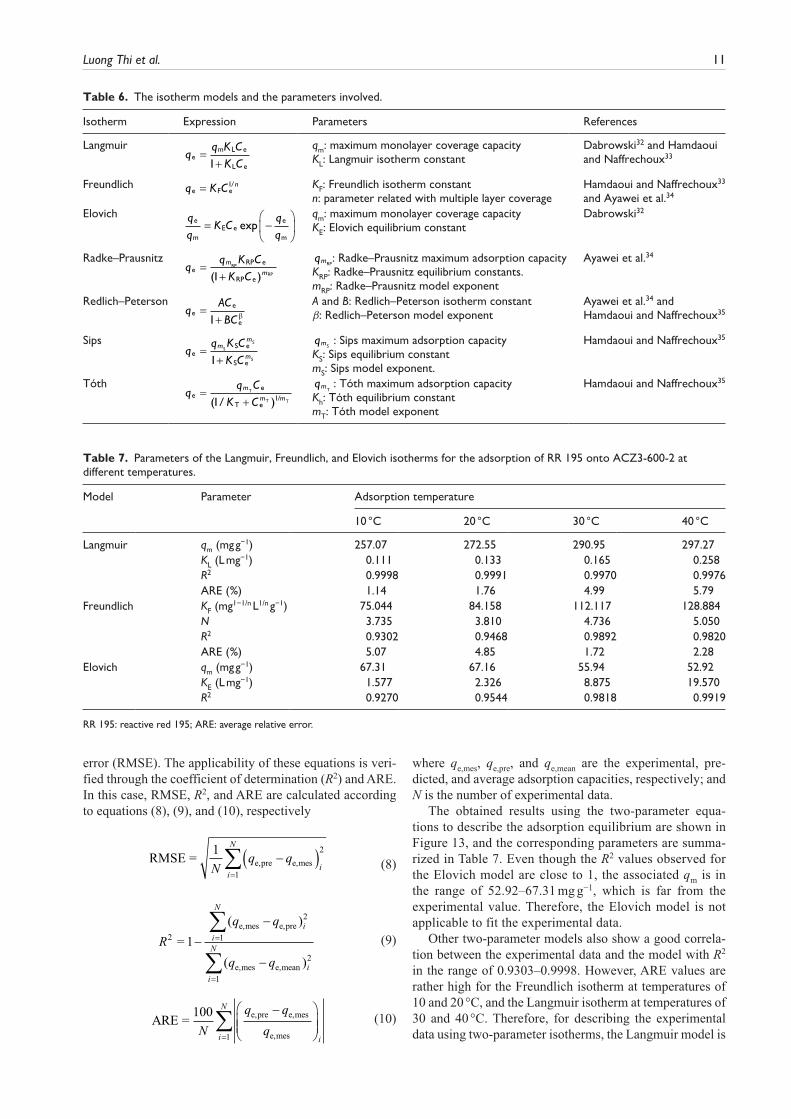
The obtained results using the two-parameter equa-tions to describe the adsorption equilibrium are shown in Figure 13, and the corresponding parameters are summa-rized in Table 7. Even though the R2 values observed for the Elovich model are close to 1, the associated qm is in the range of 52.92–67.31 mg g−1, which is far from the experimental value. Therefore, the Elovich model is not applicable to fit the experimental data.
Other two-parameter models also show a good correla-tion between the experimental data and the model with R2 in the range of 0.9303–0.9998. However, ARE values are rather high for the Freundlich isotherm at temperatures of 10 and 20 °C, and the Langmuir isotherm at temperatures of 30 and 40 °C. Therefore, for describing the experimental data using two-parameter isotherms, the Langmuir model is
Table 6. The isotherm models and the parameters involved.
Isotherm Expression Parameters References
Langmuirq
q KK C
em L e
L e
=+
C1
qm: maximum monolayer coverage capacityKL: Langmuir isotherm constant
Dabrowski32 and Hamdaoui and Naffrechoux33
Freundlich q K C ne F e= 1/ KF: Freundlich isotherm constant
n: parameter related with multiple layer coverageHamdaoui and Naffrechoux33 and Ayawei et al.34
Elovich qq
K Cqq
e
mE e
e
m
= −
exp
qm: maximum monolayer coverage capacityKE: Elovich equilibrium constant
Dabrowski32
Radke–Prausnitzq
q K CK C
mme
RP e
RP e
RP
RP=
+( )1
qmRP: Radke–Prausnitz maximum adsorption capacity
KRP: Radke–Prausnitz equilibrium constants.mRP: Radke–Prausnitz model exponent
Ayawei et al.34
Redlich–Petersonq
ACBC
ee
e
=+1 β
A and B: Redlich–Peterson isotherm constantβ: Redlich–Peterson model exponent
Ayawei et al.34 and Hamdaoui and Naffrechoux35
Sipsq
q K CK C
mm
meS e
S e
SS
S=
+1
qmS: Sips maximum adsorption capacity
KS: Sips equilibrium constantmS: Sips model exponent.
Hamdaoui and Naffrechoux35
Tóthq
q CK C
mm mee
T e
T
T T( )=
+1 1/ /
qmT: Tóth maximum adsorption capacity
Kh: Tóth equilibrium constantmT: Tóth model exponent
Hamdaoui and Naffrechoux35
Table 7. Parameters of the Langmuir, Freundlich, and Elovich isotherms for the adsorption of RR 195 onto ACZ3-600-2 at different temperatures.
Model Parameter Adsorption temperature
10 °C 20 °C 30 °C 40 °C
Langmuir qm (mg g−1) 257.07 272.55 290.95 297.27 KL (L mg−1) 0.111 0.133 0.165 0.258 R2 0.9998 0.9991 0.9970 0.9976 ARE (%) 1.14 1.76 4.99 5.79Freundlich KF (mg1−1/n L1/n g−1) 75.044 84.158 112.117 128.884 N 3.735 3.810 4.736 5.050 R2 0.9302 0.9468 0.9892 0.9820 ARE (%) 5.07 4.85 1.72 2.28Elovich qm (mg g−1) 67.31 67.16 55.94 52.92 KE (L mg−1) 1.577 2.326 8.875 19.570 R2 0.9270 0.9544 0.9818 0.9919
RR 195: reactive red 195; ARE: average relative error.
12 Journal of Chemical Research 00(0)
suitable for use at lower temperatures (10 and 20 °C) and the Freundlich model is relevant at higher temperatures (30 and 40 °C). The small KL value and 1/n < 1 suggest that the adsorption of RR 195 onto CFH-AC is favorable for all the temperatures investigated.
The qm value calculated by the Langmuir equation increases with the adsorption temperature and is in the range of 257.07–297.27 mg g−1, suggesting that the CFH-AC has a good adsorption capacity for RR 195 removal and is compa-rable with TiO2 nanoparticles (87 mg g−1),36 poly-pyrrole composite (204.08 mg g−1),37 dried soybean leaves modi-fied with acetic acid (12 mg g−1),38 chitosan particles (82.1 mg g−1),39 and AC (1.2 mg g−1).40
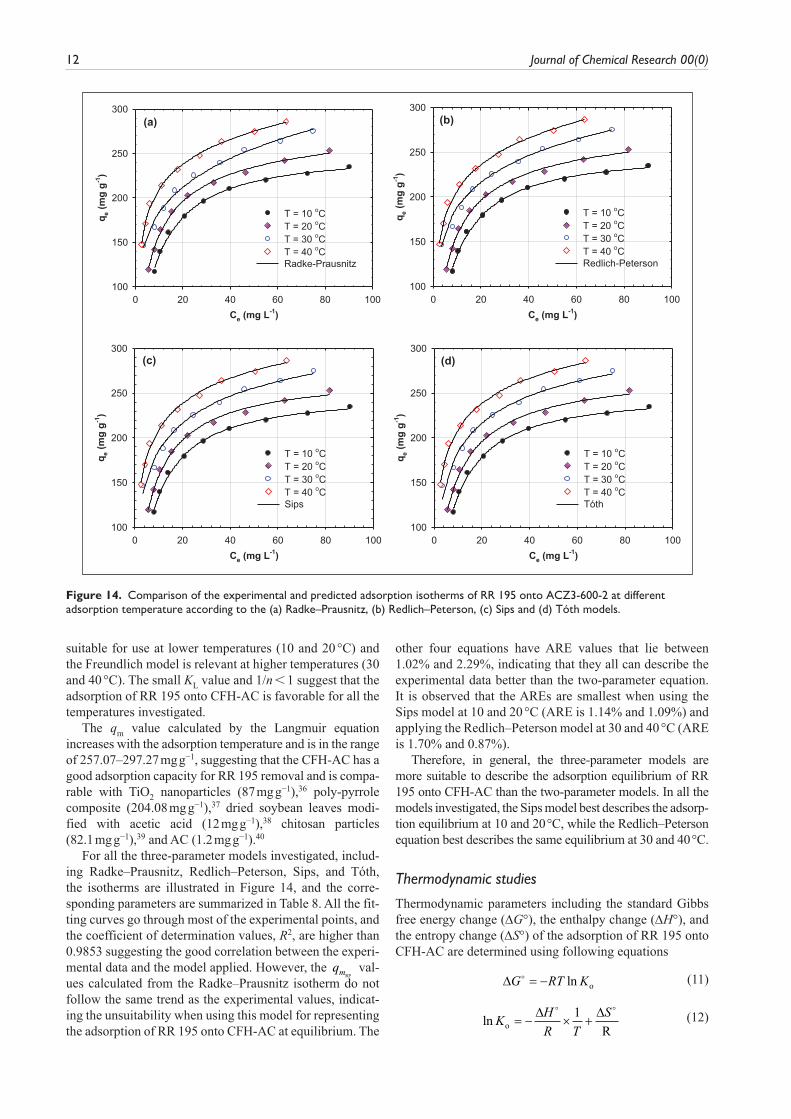
For all the three-parameter models investigated, includ-ing Radke–Prausnitz, Redlich–Peterson, Sips, and Tóth, the isotherms are illustrated in Figure 14, and the corre-sponding parameters are summarized in Table 8. All the fit-ting curves go through most of the experimental points, and the coefficient of determination values, R2, are higher than 0.9853 suggesting the good correlation between the experi-mental data and the model applied. However, the qmRP
val-ues calculated from the Radke–Prausnitz isotherm do not follow the same trend as the experimental values, indicat-ing the unsuitability when using this model for representing the adsorption of RR 195 onto CFH-AC at equilibrium. The
other four equations have ARE values that lie between 1.02% and 2.29%, indicating that they all can describe the experimental data better than the two-parameter equation. It is observed that the AREs are smallest when using the Sips model at 10 and 20 °C (ARE is 1.14% and 1.09%) and applying the Redlich–Peterson model at 30 and 40 °C (ARE is 1.70% and 0.87%).
Therefore, in general, the three-parameter models are more suitable to describe the adsorption equilibrium of RR 195 onto CFH-AC than the two-parameter models. In all the models investigated, the Sips model best describes the adsorp-tion equilibrium at 10 and 20 °C, while the Redlich–Peterson equation best describes the same equilibrium at 30 and 40 °C.
Thermodynamic studies
Thermodynamic parameters including the standard Gibbs free energy change (ΔG°), the enthalpy change (ΔH°), and the entropy change (ΔS°) of the adsorption of RR 195 onto CFH-AC are determined using following equations
∆G RT K = − ln o (11)
ln KH
R T
So R= − × +
∆ ∆ 1 (12)
(a)
Ce (mg L-1)0 20 40 60 80 100
q e (m
g g-1
)
100
150
200
250
300
T = 10 oCT = 20 oCT = 30 oCT = 40 oCRadke-Prausnitz
(b)
Ce (mg L-1)0 20 40 60 80 100
q e (m
g g-1
)
100
150
200
250
300
T = 10 oCT = 20 oCT = 30 oCT = 40 oCRedlich-Peterson
(c)
Ce (mg L-1)0 20 40 60 80 100
q e (m
g g-1
)
100
150
200
250
300
T = 10 oCT = 20 oCT = 30 oCT = 40 oCSips
(d)
Ce (mg L-1)0 20 40 60 80 100
q e (m
g g-1
)
100
150
200
250
300
T = 10 oCT = 20 oCT = 30 oCT = 40 oCTóth
Figure 14. Comparison of the experimental and predicted adsorption isotherms of RR 195 onto ACZ3-600-2 at different adsorption temperature according to the (a) Radke–Prausnitz, (b) Redlich–Peterson, (c) Sips and (d) Tóth models.

Luong Thi et al. 13
where R is the universal gas constant (8.314 J mol−1 K−1), T is the temperature (K), and Ko is the equilibrium constant and can be calculated using following equation41
Kq
CCo
e
ee
=→
lim0
(13)
where Ce (mg mL−1) is the equilibrium concentration and qe (mg g−1) is the amount of RR 195 adsorbed at equilibrium calculated according to the Sips (10 and 20 °C) or the Redlich–Peterson (30 and 40 °C) isotherms, with the parameters listed in Table 8.
The intercept of the plot of ln(qe/Ce) versus Ce gives the value of Ko (data not shown). The calculated ΔG°, ΔH°, and ΔS° values are summarized in Table 9. A negative value of ΔG° and a positive value of ΔH° reflect the spontaneous and endothermic nature of the adsorption process. The values of both ΔG° and ΔH° are slightly larger than the value of phys-ical adsorption (−20 to 0 kJ mol−1 for ΔG° and 2.1–20.9 kJ mol−1 for ΔH°)42 but not up to the chemisorption range (−80 to −400 kJ mol−1),43 suggesting that the adsorp-tion of RR 195 onto ACZ-600-2 is mainly physisorption and promoted by chemisorption. The chemisorption is due to the
surface functional groups of AC which can form donor-acceptor complexes with RR 195, thus contributing to RR 195 adsorption. The positive value of ΔS° demonstrates the increase in randomness at the adsorbate-adsorbent interface, which might be due to the competition adsorption between RR 195 and the solvent molecules as well as the breakage of the hydration shell of RR 195 molecules during the adsorp-tion onto the ACZ-600-2 sample.44
Scale-up design. The batch adsorption process is usually designed based on the adsorption isotherm.45 It is assumed that when RR 195 is mixed with W mass of AC from CFHs, the RR 195 concentration is decreased from Co to Ct in a solution volume V at any specific time wherein the adsorbed RR 195 quantity of each gram of the AC which can form donor–acceptor complexes with RR 195, thus contributing to RR 195 adsorption. The positive value of ΔS° demonstrates the increase in randomness at the adsorbate–adsorbent inter-face, which might be wherein the adsorbed RR 195 quantity of each gram of the AC is altered from qo to qt.
When t = 0, qo = 0, and the mass balance is expressed as equation (14)
V C C W q q Wq( ) ( )o t t o t− = − = (14)
At equilibrium, Ct = Ce and qt = qe, equation (14) is modi-fied as equation (15)
WV C C
q
V C C
q=
−=
−( ) ( )o t
t
o e
e (15)
Using the best supportive Sips and Redlich–Peterson models for the adsorption at 20 and 30 °C, respectively, equation (15) is modified to form equations (16) and (17)
Table 8. Parameters of the Redlich–Peterson, Radke–Prausnitz, Sips, and Tóth isotherms for the adsorption of RR 195 onto ACZ3-600-2 at different temperatures..
Model Parameter T (°C)
10 20 30 40
Radke–Prausnitz qmRP (mg g−1) 272.20 225.79 83.05 157.31
KRP (L mg−1) 0.102 0.191 5.687 1.302 mRP 1.023 0.941 0.800 0.863 R2 0.9963 0.9966 0.9906 0.9976 ARE (%) 1.16 1.18 1.73 0.85Redlich–Peterson A (L g−1) 27.17 44.68 306.57 310.85 B (L mg−1)β 0.097 0.204 2.230 1.962 β 1.020 0.954 0.837 0.854 R2 0.9964 0.9964 0.9853 0.9961 ARE (%) 1.16 1.30 1.70 0.87Sips qm
S (mg g−1) 250.10 272.71 389.18 396.77 K m
S( )Lmg S−1 0.092 0.151 0.311 0.401 mS 1.102 0.956 0.465 0.443 R2 0.9968 0.9950 0.9867 0.9959 ARE (%) 1.14 1.09 1.95 1.07Tóth qm
T (mg g−1) 249.96 280.44 386.22 445.09
K mT( )Lmg T−1 0.075 0.210 1.078 1.867
mT 1.125 0.860 0.413 0.309 R2 0.9967 0.9950 0.9790 0.9962 ARE (%) 1.16 1.18 2.29 1.02
RR 195: reactive red 195; ARE: average relative error.
Table 9. Thermodynamic parameters for adsorption of RR 195 onto ACZ3-600-2.
T (°C) Ko ΔG° (kJ mol−1)
ΔH° (kJ mol−1)
ΔS° (J K−1 mol−1)
10 24362.2 −23.766 33.487 202.3020 38051.7 −25.692 30 66976.7 −27.993 40 91692.0 −29.734
RR 195: reactive red 195.
14 Journal of Chemical Research 00(0)
At 2 Co o e S e
S e
S
S
01
:( )( )
WV C C K C
q K C
m
mm
S
=− +
(16)
At 3 Co o e e
e
01
:( )( )
WV C C BC
AC=
− + β (17)
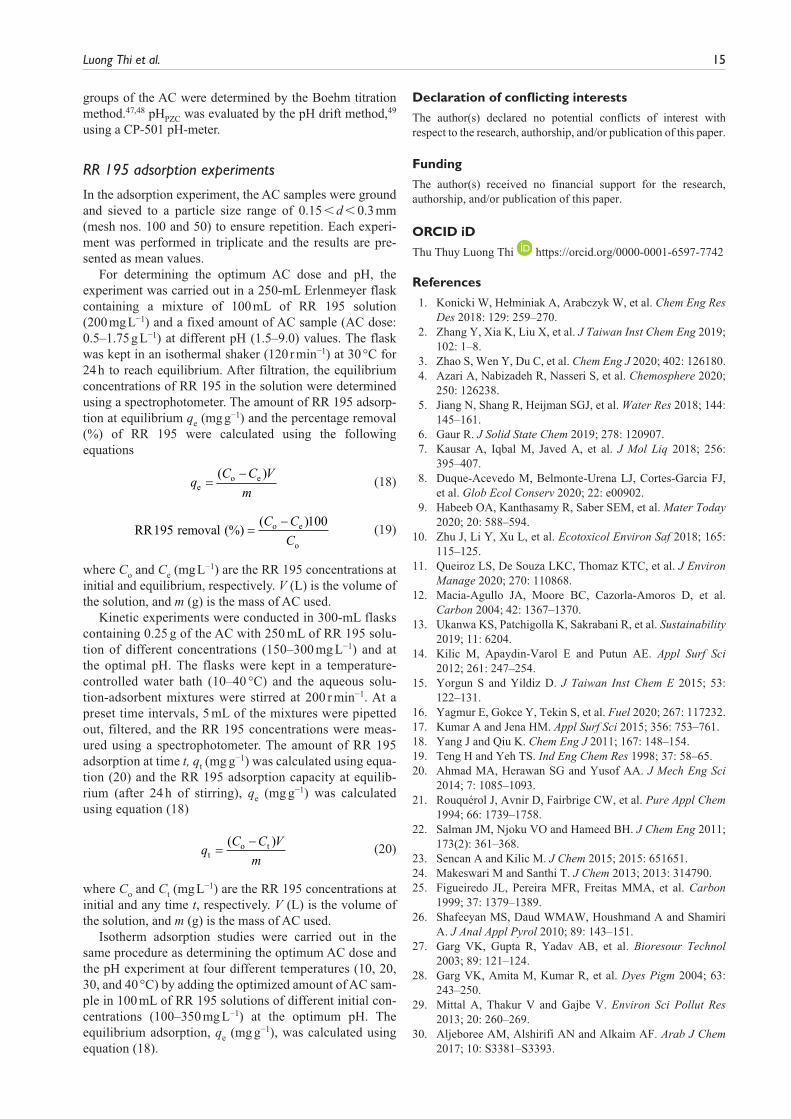
Using equations (16) and (17) with the parameters from Table 8, the required weight of AC from CFH for the removal of RR 195 with a concentration of 150 mg L−1 at 20 and 30 °C for different volumes (2–10 L) of aqueous RR 195 solutions (wastewater or effluent) was evaluated and the results are given in Table 10.
It can be seen from Table 10 that it is easier to remove RR 195 at 30 °C than at 20 °C as the weight of AC was always lower. This is due to the better adsorption ability of ACZ-600-2 at elevated temperature. The required amount of ACs is relatively low, only 0.4980 and 0.4631 g L−1 at 20 and 30 °C, respectively, to remove 75% of the initial RR 195 concentration of 150 mg L. This result suggests the applicability of CFH-AC for the removal of RR 195 from wastewater.
Conclusion
In this work, the preparation of AC from CFHs by chemical activation with ZnCl2 as an activating agent using a one-step process has been investigated. The obtained ACs present a high specific surface area (918–1383 m2 g−1) with predomi-nantly mesoporous (25.22%–91.91% mesopore volume). Under the optimized condition of a ZnCl2/CFH mass ratio of 3:1, an activation temperature of 600 °C, and an activa-tion time of 2 h, the SBET, SBJH, VBJH, and Vtot values are 1383 m2 g−1, 922 m2 g−1, 1.4481 cm3 g−1, and 1.6482 cm3 g−1, respectively. The adsorption of RR 195 from aqueous solu-tion onto AC follows a PSO equation, with an activation energy of 8.558 kJ mol−1, which is controlled by the external and intra-particle diffusion mass transfers. The equilibrium data fit well with the Sips model (at 10 and 20 °C) or the Redlich–Peterson model (at 30 and 40 °C). The adsorption process is mainly physisorption and is promoted by chem-isorption with an enthalpy change of 33.487 kJ mol−1. The CFH-ACs in this work have a high adsorption capacity for RR 195 in aqueous solution and have been evaluated to design a scale-up system of up to 10 L of RR 195 solution
(150 mg L−1) at 20 and 30 °C for 25%–90% RR 195 removal. The experimental data obtained in this study indicate the potential for the preparation of AC from CFH waste toward applications for wastewater treatment in Vietnam at a rea-sonable price.
Experimental
Materials
Zinc chloride (CAS: 7646-85-7, purity ⩾ 98%) was sup-plied by Xilong Chemical, China. RR 195 (CAS: 93050-79-4, chemical formula: C31H19O19N7S6Na5Cl) was provided by Shanghai Anoky Group Co., Ltd., China.
ACs were prepared from Arabica CFHs (Son La Province, Vietnam) using the one-step process. Before use, the CFH precursor was washed and oven-dried at 110 °C for 12 h, followed by grinding and sieving to a particle size of about 1.0 mm. The required amount of ZnCl2 was dis-solved in about 100 mL of distilled water at 100 °C and then 20 g of the crushed CFH was added. The mixture was con-tinuously stirred at 100 °C for 1 h, then oven-dried at 120 °C for 12 h. Afterward, the resulting samples were activated in a vertical cylindrical furnace with a nitrogen flow rate of 300 mL min−1 at four different temperatures (500–650 °C) for a specific amount of time (1–2.5 h) using a heating rate of 10 °C min−1. After cooling, the product was immersed in a 0.5-M HCl solution for 12 h to leach out the ZnCl2. The filtered solution was kept for recycling, and the solid com-ponent was washed several times with hot water and finally with cold distilled water until constant pH (~6.0). The washed AC samples were subsequently dried at 120 °C for 24 h and stored in a desiccator. The samples were labeled as ACZa-b-c, in which “a” is the ZnCl2/CFH mass ratio, “b” is the activation temperature (°C), and “c” is the activation time (h).
RR 195 stock solution of 1.0 g L−1 was prepared within 24 h prior to use by dissolving solid RR 195 in double dis-tilled water. The stock solution was then diluted to obtain solutions of various concentrations. The pH of the solution was adjusted with HCl and NaOH (1 M). The concentra-tions of RR 195 were determined using a UV-Vis spectro-photometer (LIUV-310S) at the maximum wavelength of 541 nm.
AC characterization
The chemical compositions of the prepared AC samples were determined using an energy-dispersive X-ray spectros-copy, EDX-LE VIOEL 6610 LV (Jeol). Nitrogen adsorption isotherms were evaluated at 77 K using an automated gas adsorption analyzer, TriStar 3000-Micromeritics, from which the specific surface area (SBET), the micropore surface area (Smic), the micropore volume (Vmic), the mesopore sur-face area (SBJH), the mesopore volume (VBJH), and the aver-age of mesopore width (DBJH) were estimated.21,46 The morphology was examined by a high-resolution field-emis-sion scanning electron microscope, S4800 (Hitachi). The FTIR spectra were recorded using an FTIR spectroscopy, Nexus 670 spectrometer (Nicolet). The surface functional
Table 10. Weight of activated carbon (g) for the removal of RR 195 (%) at 20 and 30 °C for different volumes of RR 195 solution.
V (L) 20 °C 30 °C
25% 50% 75% 90% 25% 50% 75% 90%
2 0.295 0.609 0.996 1.482 0.255 0.546 0.926 1.3224 0.590 1.218 1.992 2.965 0.510 1.093 1.852 2.6446 0.885 1.826 2.988 4.447 0.764 1.639 2.778 3.9658 1.180 2.435 3.984 5.930 1.019 2.185 3.704 5.28710 1.475 3.044 4.980 7.412 1.274 2.732 4.631 6.609
RR 195: reactive red 195.
Luong Thi et al. 15
groups of the AC were determined by the Boehm titration method.47,48 pHPZC was evaluated by the pH drift method,49 using a CP-501 pH-meter.
RR 195 adsorption experiments
In the adsorption experiment, the AC samples were ground and sieved to a particle size range of 0.15 < d < 0.3 mm (mesh nos. 100 and 50) to ensure repetition. Each experi-ment was performed in triplicate and the results are pre-sented as mean values.
For determining the optimum AC dose and pH, the experiment was carried out in a 250-mL Erlenmeyer flask containing a mixture of 100 mL of RR 195 solution (200 mg L−1) and a fixed amount of AC sample (AC dose: 0.5–1.75 g L−1) at different pH (1.5–9.0) values. The flask was kept in an isothermal shaker (120 r min−1) at 30 °C for 24 h to reach equilibrium. After filtration, the equilibrium concentrations of RR 195 in the solution were determined using a spectrophotometer. The amount of RR 195 adsorp-tion at equilibrium qe (mg g−1) and the percentage removal (%) of RR 195 were calculated using the following equations
qC C V
meo e=−( )
(18)
RR removal o e
o
195100
(%)( )
=−C C
C (19)
where Co and Ce (mg L−1) are the RR 195 concentrations at initial and equilibrium, respectively. V (L) is the volume of the solution, and m (g) is the mass of AC used.
Kinetic experiments were conducted in 300-mL flasks containing 0.25 g of the AC with 250 mL of RR 195 solu-tion of different concentrations (150–300 mg L−1) and at the optimal pH. The flasks were kept in a temperature-controlled water bath (10–40 °C) and the aqueous solu-tion-adsorbent mixtures were stirred at 200 r min−1. At a preset time intervals, 5 mL of the mixtures were pipetted out, filtered, and the RR 195 concentrations were meas-ured using a spectrophotometer. The amount of RR 195 adsorption at time t, qt (mg g−1) was calculated using equa-tion (20) and the RR 195 adsorption capacity at equilib-rium (after 24 h of stirring), qe (mg g−1) was calculated using equation (18)
qC C V
mto t=−( )
(20)
where Co and Ct (mg L−1) are the RR 195 concentrations at initial and any time t, respectively. V (L) is the volume of the solution, and m (g) is the mass of AC used.
Isotherm adsorption studies were carried out in the same procedure as determining the optimum AC dose and the pH experiment at four different temperatures (10, 20, 30, and 40 °C) by adding the optimized amount of AC sam-ple in 100 mL of RR 195 solutions of different initial con-centrations (100–350 mg L−1) at the optimum pH. The equilibrium adsorption, qe (mg g−1), was calculated using equation (18).
Declaration of conflicting interests
The author(s) declared no potential conflicts of interest with respect to the research, authorship, and/or publication of this paper.
Funding
The author(s) received no financial support for the research, authorship, and/or publication of this paper.
ORCID iD
Thu Thuy Luong Thi https://orcid.org/0000-0001-6597-7742
References
1. Konicki W, Hełminiak A, Arabczyk W, et al. Chem Eng Res Des 2018: 129: 259–270.
2. Zhang Y, Xia K, Liu X, et al. J Taiwan Inst Chem Eng 2019; 102: 1–8.
3. Zhao S, Wen Y, Du C, et al. Chem Eng J 2020; 402: 126180. 4. Azari A, Nabizadeh R, Nasseri S, et al. Chemosphere 2020;
250: 126238. 5. Jiang N, Shang R, Heijman SGJ, et al. Water Res 2018; 144:
145–161. 6. Gaur R. J Solid State Chem 2019; 278: 120907. 7. Kausar A, Iqbal M, Javed A, et al. J Mol Liq 2018; 256:
395–407. 8. Duque-Acevedo M, Belmonte-Urena LJ, Cortes-Garcia FJ,
et al. Glob Ecol Conserv 2020; 22: e00902. 9. Habeeb OA, Kanthasamy R, Saber SEM, et al. Mater Today
2020; 20: 588–594. 10. Zhu J, Li Y, Xu L, et al. Ecotoxicol Environ Saf 2018; 165:
115–125. 11. Queiroz LS, De Souza LKC, Thomaz KTC, et al. J Environ
Manage 2020; 270: 110868. 12. Macia-Agullo JA, Moore BC, Cazorla-Amoros D, et al.
Carbon 2004; 42: 1367–1370. 13. Ukanwa KS, Patchigolla K, Sakrabani R, et al. Sustainability
2019; 11: 6204. 14. Kilic M, Apaydin-Varol E and Putun AE. Appl Surf Sci
2012; 261: 247–254. 15. Yorgun S and Yildiz D. J Taiwan Inst Chem E 2015; 53:
122–131. 16. Yagmur E, Gokce Y, Tekin S, et al. Fuel 2020; 267: 117232. 17. Kumar A and Jena HM. Appl Surf Sci 2015; 356: 753–761. 18. Yang J and Qiu K. Chem Eng J 2011; 167: 148–154. 19. Teng H and Yeh TS. Ind Eng Chem Res 1998; 37: 58–65. 20. Ahmad MA, Herawan SG and Yusof AA. J Mech Eng Sci
2014; 7: 1085–1093. 21. Rouquérol J, Avnir D, Fairbrige CW, et al. Pure Appl Chem
1994; 66: 1739–1758. 22. Salman JM, Njoku VO and Hameed BH. J Chem Eng 2011;
173(2): 361–368. 23. Sencan A and Kilic M. J Chem 2015; 2015: 651651. 24. Makeswari M and Santhi T. J Chem 2013; 2013: 314790. 25. Figueiredo JL, Pereira MFR, Freitas MMA, et al. Carbon
1999; 37: 1379–1389. 26. Shafeeyan MS, Daud WMAW, Houshmand A and Shamiri
A. J Anal Appl Pyrol 2010; 89: 143–151. 27. Garg VK, Gupta R, Yadav AB, et al. Bioresour Technol
2003; 89: 121–124. 28. Garg VK, Amita M, Kumar R, et al. Dyes Pigm 2004; 63:
243–250. 29. Mittal A, Thakur V and Gajbe V. Environ Sci Pollut Res
2013; 20: 260–269. 30. Aljeboree AM, Alshirifi AN and Alkaim AF. Arab J Chem
2017; 10: S3381–S3393.

16 Journal of Chemical Research 00(0)
31. Cicek F, Ozer D, Ozer A, et al. J Hazard Mater 2007; 146: 408–416.
32. Dabrowski A. Colloid Interface Sci Adv 2001; 93: 135–224. 33. Hamdaoui O and Naffrechoux E. J Hazard Mater 2007; 147:
381–394. 34. Ayawei N, Ebelegi AN and Wankasi D. J Chem 2017; 2017:
3039817. 35. Hamdaoui O and Naffrechoux E. J Hazard Mater 2007; 147:
401–411. 36. Belessi V, Gomanos G, Boukos N, et al. J Hazard Mater
2009; 170: 836–844. 37. Palanisamy PN, Agalya A and Sivakumar P. E-J Chem 2012;
9: 1823–1834. 38. Mahanna H and Samy M. Desalin Water Treat 2020; 178:
312–321. 39. Perez-Calderon J, Santos MV and Zaritzky N. J Environ
Chem Eng 2018; 6: 6749–6760.
40. Sulaymon AH and Abood WM. Desalin Water Treat 2014; 52: 5485–5493.
41. Li Q, Yue QY, Su Y, et al. Chem Eng J 2010; 158: 489–497. 42. Liu Y. J Chem Eng Data 2009; 54: 1981–1985. 43. Yu Y, Zhuang YY, Wang ZH, et al. Chemosphere 2004; 54:
425–430. 44. Li YH, Di Z, Ding J, et al. Water Res 2005; 39: 605–609. 45. Naiya TK, Bhattacharya AK and Das SK. Environ Prog
Sustain Energy 2009; 28: 535–546. 46. Webb PA and Orr C. Analytical Methods in Fine Particle
Technology. Norcross, GA: Micromeritics Instrument Corp, 1997.
47. Boehm HP. Carbon 2002; 40: 145–149. 48. Le Van K, Luong Thi TT, Nguyen Thi TH, et al. Russ J
Electrochem 2019; 55: 900–907. 49. Lopez-Ramon MV, Stoeckli F, Moreno-Castilla C, et al.
Carbon 1999; 37: 1215–1221.