Shear-band structure in ballistically tested carbide-free bainitic ...
Upload
independentCategory
view
0download
0
Thermogravimetric Analysis of Activated Carbons, OrderedMesoporous Carbide-Derived Carbons, and Their DeactivationKinetics of Catalytic Methane DecompositionVidyasagar Shilapuram,† Nesrin Ozalp,*,† Martin Oschatz,‡ Lars Borchardt,‡ Stefan Kaskel,§
and Robert Lachance†
†Mechanical Engineering Department, Texas A&M University at Qatar, P.O. Box 23874, Doha, Qatar‡Department of Inorganic Chemistry, Dresden University of Technology, Dresden 01069, Germany§Department of Chemical Surface and Reaction Technology, Fraunhofer Institute for Material and Beam Technology IWS, Dresden01277, Germany
ABSTRACT: This study presents the deactivation kinetics of methane decomposition for the activated carbons Fluka-05105and Fluka-05120, ordered mesoporous carbon (CMK-3), and ordered mesoporous carbide-derived carbon (DUT-19). Theexperimental and thermodynamically predicted carbon deposition, the average and total hydrogen production, and the effect offlow rate on carbon formation rate of these catalysts were investigated. Results indicate that the experimental conditions chosenwere within the reaction control regime. Catalytic activity was calculated via two different definitions present in literature: one interms of carbon deposition rate and the other in terms of carbon mass deposited. Deactivation kinetics were obtained by fittingthe experimental data by nonlinear regression analysis. Differences between the two methods in determining activity resulted insignificant changes in the estimation of deactivation kinetics. The activity calculated based on the rate method results in the bestfit of experimentally collected data. A deactivation order and methane concentration dependency of approximately 1.0 and 0.5were determined for all the catalysts tested (Fluka-05105, Fluka-05120, CMK-3, and DUT-19). The activation energy ofdeactivation (Ed) was determined to be 192, 154, 166, and 181 kJ/mol for Fluka-05120, Fluka-05105, CMK-3, and DUT-19,respectively. DUT-19 was the best performing catalyst in terms of carbon formation rate, total carbon production, hydrogenproduction rate, average hydrogen production, and total hydrogen production.
1. INTRODUCTION
Hydrogen is a promising fuel because it has a high heating valueand water vapor is the only product of its combustion.1 Thesecharacteristics attract researchers concerned with the effects ofclimate change due to CO2 emission. As a result, varioushydrogen processing and production technologies are indevelopment to utilize it as feedstock and develop differentproduction scales.2 In industry, hydrogen is typically producedby steam reforming of methane, resulting in hydrogen andcarbon dioxide product gases. Hydrogen as a product of steamreforming of methane requires carbon dioxide separation beforehydrogen can be used as a fuel or feedstock, increasing theenergy intensity and carbon footprint of the process. Therefore,an alternative process that is less energy intensive with a lowerCO2 output would be beneficial to both industry and theenvironment.One such application for hydrogen production is solar
thermal natural gas cracking. In this process, solar energy isconcentrated and used as process heat to create hydrogen andsolid carbon. Solar cracking of natural gas is an attractive optionin the transition from hydrocarbon-dependent processes torenewable energy-based processes.3 The products of solarcracking of natural gas are both valuable; hydrogen can becombusted as a fuel source or used as a feedstock and carboncan be used as a fuel or material commodity. Although naturalgas is used as a feedstock of the solar cracking, no CO2emission is created as a product of the process. Solar thermal
natural gas cracking allows the separation of carbon in the solidphase, completely eliminating the need for CO2 capture,storage, and transportation.In order to design a reactor to house solar cracking of natural
gas, kinetics, heat transfer, and reactant flow patterns must bestudied and optimized concurrently. Kinetics studies can beconducted using a lab scale reactor in order to optimize inputand operation parameters for the design of commercialreactors. Thermodynamics of methane decomposition showsthat noncatalytic methane decomposition requires temper-atures above 1200 °C for complete decomposition of methaneinto hydrogen and carbon.8 In the past, various transition metaland carbonaceous catalysts have been investigated to test theirimpact on methane decomposition.9−13 However, metalcatalysts tend to rapidly deactivate and their regenerationrequires a reactor shutdown. As a result, researchers have mostrecently focused on carbon-based catalysts because they do notrequire further separation from the product carbon, they aremuch less expensive than metal catalysts, regeneration is not
Special Issue: Recent Advances in Natural Gas Conversion
Received: July 12, 2013Revised: September 18, 2013Accepted: September 18, 2013Published: September 18, 2013
Article
pubs.acs.org/IECR
© 2013 American Chemical Society 1741 dx.doi.org/10.1021/ie402195q | Ind. Eng. Chem. Res. 2014, 53, 1741−1753

required, and replacing catalyst in a fluidized reactor does notrequire a reactor shutdown.This study examines the catalytic behavior of the various
carbonaceous catalysts for methane decomposition using athermogravimetric analyzer (TGA). In literature, carbons ofeither commercial or synthesized origin with various crystallo-graphic and surface structures were used as catalysts by manyresearch groups for methane decomposition.14−21 Muradov’sgroup has initiated and made significant contributions to thefield of catalytic decomposition of methane using variouscarbonaceous catalysts in different reactor types.22−24
Thermogravimetric analysis is considered advantageous overlaboratory-scale reactors in finding the kinetics because of itsability to measure the changes of mass with time and ofcatalytic activity as the carbon deposits and the requirement ofonly a small amount of catalyst.25 This study focuses onthermogravimetric analysis of methane decomposition usingvarious catalysts to obtain the kinetics and deactivationparameters of the process. The paper examines methanedecomposition at various temperatures and methane partialpressures with the use of Fluka-05120, Fluka-05105, CMK-3,and DUT-19 catalysts. The effect of flow rate, catalytic activity,hydrogen production, carbon weight gain, and deactivationkinetics were determined.Similar research on carbonaceous catalytic methane decom-
position was previously carried out via thermogravimeticanalysis by Abbas et al.25−27 Palm-shell-based activated carbon(ACPS) manufactured from palm oil shells of various particlesizes as well as commercial-based activated carbon (AC Norit)were used as catalysts for methane decomposition.25 Resultsshowed a reaction order of 0.5, and activation energy of 210 kJ/mol was obtained for both catalysts. For the same ACPS sampletested with a fixed bed reactor, Abbas and Daud26 observed areaction order of 2 and an activation energy of 163 kJ/mol forACPS catalyst. The reason for this difference was determined tobe either large sample mass creating a gradient in methanepartial pressure from the bulk gas to the catalyst surface or themethod of calculation.Abbas and Daud27 studied the deactivation kinetics with
ACPS samples and the results showed a deactivation order of0.5 and a deactivation energy of 194 kJ/mol for ACPS. Acomparison of activated carbon samples obtained from palm oilshell (ACPS) and another commercial activated carbon (ACnorit) showed similar deactivation kinetics. XRD resultsshowed that fresh ACPS has a higher degree of disorder thanthe other catalysts tested and also displayed higher catalyticactivity during experimentation. Carbon deposition on thecatalyst was observed to decrease the degree of disorder anddecrease the activity of the sample. An increase in reactiontemperature was also observed to decrease the degree ofdisorder. Relatively disordered amorphous carbons wereobserved to be highly catalytically active compared to orderedturbostatic and graphitic carbon.26,27 The initial rate of methanedecomposition was modeled using the effect of processparameters by two statistical analysis approaches: (1) a factorialdesign method and (2) an analysis of variance (ANOVA).28
The factorial design results showed temperature has a largereffect on carbon deposition rate than feed gas methane partialpressure. ANOVA results determined catalyst weight has amore significant effect than temperature on the initial rate ofmethane decomposition.Methane decomposition using carbonaceous catalysts was
also studied by Pinilla et al.29 and Suelves et al.30 Results show
that the reaction order was 0.5 for both samples. Activationenergies were determined to be 141 and 238 kJ/mol for CGNorit and BP2000, respectively. Methane decomposition wascontrolled by two simultaneous processes: (1) decreases inmethane decomposition due to active sites being blocked bythe deposition of formed carbon and (2) an increase inmethane decomposition due to the formation of catalyticallyactive carbon produced from methane decomposition. Suelveset al.30 studied the thermocatalytic decomposition of methanein a TGA using a wide range of carbon blacks and commerciallyavailable activated carbon with different textural properties andsurface chemistry. Results show that commercially availablecarbon black (BP2000) has the highest capacity of carbonaccumulation, with 6.13 g deposition/gram of catalyst.Serrano et al.31−33 and Botas et al.34,35 also investigated
methane decomposition using synthesized ordered mesoporouscarbons CMK-3 and CMK-5 in addition to commerciallyavailable activated carbon. The results showed that CMK-5 hashigher reaction rates compared to those of CMK-3 andactivated carbon. Higher hydrogen production rates wereobtained from the synthesized mesoporous carbon samplesCMK-3 and CMK-5 as a result of exceptional activity andstability due to their high surface area and bimodal mesoporesystem. Botas et al.31 observed that CMK-5 still retains somecatalytic activity with 25 g of carbon deposited per gram ofcatalyst after 72 h of reaction at 950 °C. Further work measured31 and 15 g of carbon deposited per gram of CMK-5 andCMK-3 catalyst, respectively, at a reaction temperature of 990°C for 72 h.32
Ozalp and Shilapuram previously studied the catalyticcharacteristics of activated carbons Fluka-05105 and Fluka-05120 for methane decomposition in a thermogravimetricanalyzer.36,37 A higher threshold temperature was observed forFluka-05120. Under the same reaction temperature andmethane partial pressure conditions, higher hydrogen produc-tion and carbon weight gain with higher catalytic performancewas observed for Fluka-05105 compared to Fluka-05120.Shilapuram et al.38 also studied the catalytic activity of inhouse synthesized CMK-3 and DUT-19 to obtain methanedecomposition reaction kinetics. These ordered mesoporous/nanoporous carbons were determined to have better catalyticperformance for methane decomposition than commerciallyavailable carbons.Recent studies show that hierarchical ordered meso- and
microporous carbons are of growing importance, and they findapplications in various other fields.39 It is seen that themesoporous/nanoporous carbons to have better performancein applications such as high pressure gas storage, energystorage, and lithium storage than current best practices.40−42
Furthermore, it has been observed that carbonaceous materialsalso have improved heat transfer characteristics for reactorapplications in addition to high reaction rates.43 This paperfurthers the literature concerning carbonaceous catalysts formethane cracking by examining methane decomposition atvarious temperatures and methane partial pressures with Fluka-05120, Fluka-05105, CMK-3, and DUT-19. The effect of flowrate, catalytic activity, hydrogen production, carbon weight gain,and deactivation kinetics were determined for these catalystsand presented in this paper.
2. EXPERIMENTAL METHODOLOGYMethane decomposition experiments were performed in athermogravimetric analyzer (Setsys Evolution 16/18, M/s;
Industrial & Engineering Chemistry Research Article
dx.doi.org/10.1021/ie402195q | Ind. Eng. Chem. Res. 2014, 53, 1741−17531742

Setaram Instrumentation, France). In the thermogravimetricanalyzer, methane is decomposed into hydrogen gas and solidcarbon. Hydrogen exits the TGA, and carbon is deposited onthe catalyst surface. The TGA records an increase in the massof catalyst sample over the course of the reaction as a result ofthis deposition. The crucible used in these experiments wasmade of 10% Pt−Rh alloy with a 130 μL volume.A catalyst sample of known mass was loaded into the crucible
and deposited in the furnace. Air introduced into the reactionchamber as a result of sample loading was purged by applying avacuum followed by filling the reaction chamber with a carriergas (He). This procedure was repeated three times after eachsample introduction in order to avoid oxidizing the catalyst orfeed gas upon reaching high temperature. The temperatureprogram of the experiment consisted of three zones. In the firstzone, carrier gas flow was set with a temperature ramp rate of30 °C/min until achieving the desired reaction temperature.Carrier gas continued to flow for 15 min to ensure the reactortemperature was stable and allow any gases adsorbed on thecatalyst during sample introduction to desorb. In the secondzone, auxiliary gas (CH4) with the methane partial pressure ofinterest was then introduced into the furnace whilesimultaneously adjusting the carrier gas flow rate. The reactionwas allowed to proceed for the time period of interest.Automated data acquisition allowed high data resolution over 6and 24 h reaction periods as shown in Table 1. In the finalzone, auxiliary gas flow was replaced by carrier gas flow and thefurnace was allowed to cool to ambient temperatures.This procedure was adopted for the various reaction
temperatures and inlet mole fractions of methane shown inTable 1 for each catalyst. Experiments were conducted at a totalflow rate of 20, 40, and 100 mL/min with a methane feed gasmole fraction varying from 0.1 to 0.5. The reaction temper-atures investigated were 950, 880, and 780 °C. The resultingdetails are presented in Table 1. Experimental conditions wereselected such that the effect of flow rate, temperature, carbonweight gain, hydrogen production, deactivation kinetics witheach catalyst could be studied and compared. The catalyticproperties of the catalysts studied is shown in Table 2.
3. RESULTS AND DISCUSSION3.1. Effect of Flow Rate. The amount of carbon deposited
and the derivative of carbon deposition with respect to timewere observed and recorded. From this data, the carbonformation rate was calculated as the ratio of the derivative ofcarbon weight gain per initial amount of catalyst sample mass.In this study, the carbon formation rate or carbon depositionrate is termed reaction rate. Mass gain and weight gain aredefined as the amount of carbon formed per amount of initialcatalyst sample. Figure 1 shows the carbon formation rate as afunction of time. At each flow rate, the maximum carbonformation rate occurs within a few minutes after the methanedecomposition reaction begins. These initial carbon formationrates vary among the catalysts and flow rates. Exceptionally highinitial reaction rates were observed with CMK-3 and DUT-19compared to those of commercially available activated carbons.Across the panels in Figure 1, it can be observed that the
reaction rate dropped with time as a result of deactivation,immaterial of reaction conditions or the nature of catalyticmaterial. Additionally, the trend of reaction rate drop wassimilar for all of the carbonaceous catalysts. Initially, thereaction rate drops quickly, and it then transitions to a steadyreaction rate close to zero. The trend of carbon formation rate
can be divided into two zones of different reaction ratebehavior. In the initial zone, the reaction rate decreases at alarge rate. This can be explained by rapid carbon deposition inthe pore systems of the catalysts. The initial reaction rate wasalso higher with a higher flow rate due to more rapid carbondeposition in the catalysts’ pore systems. It was observed thatafter some particular time, reaction rates converge to a constantvalue regardless of flow rate for all catalysts tested. The value towhich the reaction rate converges in the final zone at high and
Table 1. Experimentally Observed Carbon Formation for theChosen Reaction Conditions
runno.
name ofthe
catalysttemperature,
°C
auxiliarygas flowrate
(CH4),mL/min
total flowrate
(CH4+He),mL/min
experimentalobservation ofcarbon formed(initial weightof catalyst), mg
1a Fluka-05105
950 10 40 12.8 (11.1)
2a Fluka-05105
950 5 20 15.80 (11.8)
3a Fluka-05105
900 10 40 9.14 (10.8)
4a Fluka-05105
900 5 20 9.98 (12)
5a Fluka-05105
850 10 40 5.78 (8.20)
6a Fluka-05105
850 5 20 7.94 (11.8)
7a Fluka-05105
950 10 20 22.12 (11.3)
8a Fluka-05120
950 10 20 18.14 (16.2)
9a Fluka-05120
950 10 40 11.95 (16.5)
10a Fluka-05120
950 5 20 18.45 (16.3)
11 CMK-3 950 10 100 15.96 (6.2)12 CMK-3 950 2 20 17.21 (6.2)13 CMK-3 950 5 20 27.88 (4.9)14 CMK-3 950 10 20 49.16 (5.4)15 CMK-3 880 2 20 7.38 (5.6)16 CMK-3 880 5 20 9.69 (6.5)17 CMK-3 880 10 20 13.44 (7)18 CMK-3 780 2 20 5.02 (5.2)19 CMK-3 780 5 20 7.47 (7.1)20 CMK-3 780 10 20 6.18 (4.5)21 DUT-
19950 10 100 14.55 (4.1)
22 DUT-19
950 2 20 14.00 (3.7)
23 DUT-19
950 5 20 24.39 (4.1)
24 DUT-19
950 10 20 35.01 (4.6)
25 DUT-19
880 2 20 9.91 (3.9)
26 DUT-19
880 5 20 10.72 (3.9)
27 DUT-19
880 10 20 13.95 (4.3)
28 DUT-19
780 2 20 6.01 (4.2)
29 DUT-19
780 5 20 8.55 (4.2)
30 DUT-19
780 10 20 11.49 (5.0)
aDenotes 6 h of methane decomposition reaction for run numbers 1−10. The remainder of the experiments have a duration of 24 h.
Industrial & Engineering Chemistry Research Article
dx.doi.org/10.1021/ie402195q | Ind. Eng. Chem. Res. 2014, 53, 1741−17531743

low flow rate converges for Fluka-05105, CMK-3, and DUT-19because of the complete filling of the carbons pore systems withdeposited carbon. In consequence, only external particlesurfaces are available for carbon deposition, significantlylowering the catalytic activity. For the variables examined, thecondition that had the largest bearing on the rate of carbondeposition was temperature. As temperature increased, a highercarbon deposition rate was observed, corresponding to a higherreaction rate and confirming that the catalytic reaction was in akinetically controlled regime.44 The particle size of catalystschosen in the present study was less than those used by theKim et al.45 and Abbas and Daud,25 where they had assumedthe intraparticle mass transfer effects were negligible anddiffusional control can be ruled out under the chosenconditions. Furthermore, no film mass transfer exists becauseall of the catalysts chosen were porous.46 This evidence furtherconfirms that catalytic system was reaction-controlled.Figure 2 shows the effect of flow rate on carbon weight gain
(Cdep/Ccatalyst), defined as the mass of carbon formed as a resultof methane decomposition per initial catalyst mass. A two zonephenomena was observed with respect to catalyst weight. Thisis expected, as catalyst weight gain is a result of reaction rate,which also showed a two zone phenomena. At 950 °C, Fluka-05105, CMK-3, and DUT-19 had more initial carbondeposition at higher flow rates because the reaction iskinetically controlled. After a particular length of time, therate at which carbon deposits decreased below that of the lowflow condition. Therefore, more carbon weight gain wasobserved with the lower flow rate due to the reaction durationchosen. At lower temperatures (850 and 900 °C), the carbonformation rates were lower compared to the reaction rate at950 °C, resulting in a slower carbon deposition anddeactivation rate. As a result, the number of active sites weredepleted at a slower rate. Therefore, at lower temperatures, thehigher the flow rate, the higher the carbon weight gainobserved. The carbon weight deposited with time (Figure 2)was in agreement with carbon formation rate with time asshown in Figure 1. This shows flow rate, in addition to reactiontemperature, and carbon deposition effect as controllingresistances during the course of the methane decompositionprocess. For Fluka-05120 in Figure 2c, the mass of carbondeposited and the carbon formation rate were larger at lowerflow rates compared to higher flow rates. Upon comparison ofFigures 1a−d and 2a−d, results show that higher reactions rateswere obtained with Fluka-05105 compared to Fluka-05120 forthe same experimental conditions. This is in agreement withwork done by Shilapuram and Ozalp.37
3.2. Comparison of Catalysts for Carbon Weight Gain,Carbon Formation Rate, Total Hydrogen Production,and Average Hydrogen Production. Figure 3 shows thecarbon weight gain for different carbonaceous catalysts at 950
°C, methane partial pressure of 0.5, and total flow rate of 20mL/min. The corresponding carbon formation rate is shown inFigure 4. With Fluka-05120 and Fluka-05105, experiments wereconducted for 6 h, whereas for CMK-3 and DUT-19experiments were conducted for 24 h. Figures 3 and 4 showthat the amount of carbon deposition was highest for DUT-19,followed by CMK-3, Fluka-05105, and Fluka-05120 corre-sponding to the pore volume available for carbon deposition.Equivalently, DUT-19 has a higher reaction rate than CMK-3,Fluka-05105, and Fluka-05120. From Figure 4, it can beobserved that the carbon formation rate approaches a constantvalue for all four carbon samples 5000 s after reactioninitialization. Therefore, the average carbon formation ratecan be calculated from 5000 s to the end of the reaction. Theaverage carbon formation rates were 0.005, 0.0056, 0.0037, and0.002 mgcarbon mgcatalyst
−1 min−1 for DUT-19, CMK-3, Fluka-05105, and Fluka- 05120, respectively.BET surface area and XRD results showed that Fluka-05105
and Fluka-05120 contain microporous and amorphous carbon.Small angle X-ray scattering results showed that CMK-3 andDUT-19 were determined to be of amorphous and mesoporousmaterial. The surface areas of CMK-3 and DUT-19 were higherthan that of Fluka samples.38 Total surface areas measured byShilapuram et al.37 for Fluka-05105 and Fluka-05120 were 890and 892 m2/g, respectively. The particle size of Fluka-05105was 33.6 μm, whereas the particle size for Fluka-05120 was 46.1μm. Although the surface areas of the two materials are thesame, it is possible that the utilization of the active sites waslower for Fluka-05120 because a larger percentage of siteswithin the particle become blocked by surface agglomeration.Therefore, particle size effect is reflected in catalytic perform-ance, showing that Fluka-05105 performs better than Fluka-05120 in methane decomposition.An experimental study of Kim et al. shows that no
intermediate gases were formed during the methane decom-position where hydrogen remains as the only product gas. Also,a thermodynamic analysis by Yoon et al.47 shows that hydrogenis the only product gas for the reaction at temperatures below1400 K. In this study, the hydrogen production rate wascalculated from the stoichiometric balance of methanedecomposition assuming only carbon and hydrogen wereproduced. Total hydrogen production at the end of eachreaction was calculated by summing over the instantaneoushydrogen produced. Table 3 shows the total and averagehydrogen production of each catalyst for both methane partialpressures at a reaction temperature of 950 °C. Results showthat the total and average hydrogen production varied witheach catalyst, corresponding to the variation in the molarcarbon formation rate of each catalyst. The highest hydrogenproduction was observed with DUT-19, very closely followedby CMK-3. The reason for increased hydrogen production ofthe synthetic carbons may due to the presence of additionalmesopores and higher surface areas compared to the Flukasamples.Approximately 1.5 to 2 times the total and average hydrogen
production was observed with DUT-19 and CMK-3 comparedto that of Fluka-05105, whereas more than 3 times the total andaverage hydrogen production was observed compared to thatobserved with Fluka-05120.A two zone phenomena in carbon weight gain or carbon
formation rate with time was observed for all catalysts. In thefirst zone, the carbon weight gain increases and the carbonformation rate decreases more rapidly with time. In the second
Table 2. Catalytic Properties of the Catalysts Chosen forMethane Decomposition Study
catalystparticle size
(μm)surface area(m2/g)
commercial/synthesized
Fluka-05120 891.6 46.1 commercialFluka-05105 890.1 33.6 commercialCMK-3 1400 a synthesizedDUT-19 2420 a synthesizedaSynthesized catalyst amount was very small; hence, particle sizeanalysis data is not provided.
Industrial & Engineering Chemistry Research Article
dx.doi.org/10.1021/ie402195q | Ind. Eng. Chem. Res. 2014, 53, 1741−17531744

zone, the change in carbon weight gain and carbon formation
rate was extensively reduced. Though the change in carbon
formation rate in the second zone was reduced with all the
catalysts, the comparison shows that a higher carbon formation
rate was possible with CMK-3 and DUT-19 catalysts compared
to Fluka samples. After 24 h of reaction with DUT-19 and
CMK-3, a significant average and total hydrogen production isobserved, as shown in Table 3.Figures 3 and 4 show that the carbon formation rate for
DUT-19 and CMK-3 intersected after approximately 1 h ofoperation. A similar profile was also observed in terms ofultimate weight gain versus time for DUT-19 and CMK-3.However, the point of intersection of weight gain occurred after
Figure 1. (a) Effect of flow rate on carbon formation rate with Fluka-05105 catalyst. (b) Effect of flow rate on carbon formation rate with Fluka-05105 catalyst. (c) Effect of flow rate on carbon formation rate with Fluka-05105 catalyst. (d) Effect of flow rate on carbon formation rate withFluka-05120 catalyst. (e) Effect of flow rate on carbon formation rate with CMK-3 catalyst. (f) Effect of flow rate on carbon formation rate withDUT-19 catalyst.
Industrial & Engineering Chemistry Research Article
dx.doi.org/10.1021/ie402195q | Ind. Eng. Chem. Res. 2014, 53, 1741−17531745
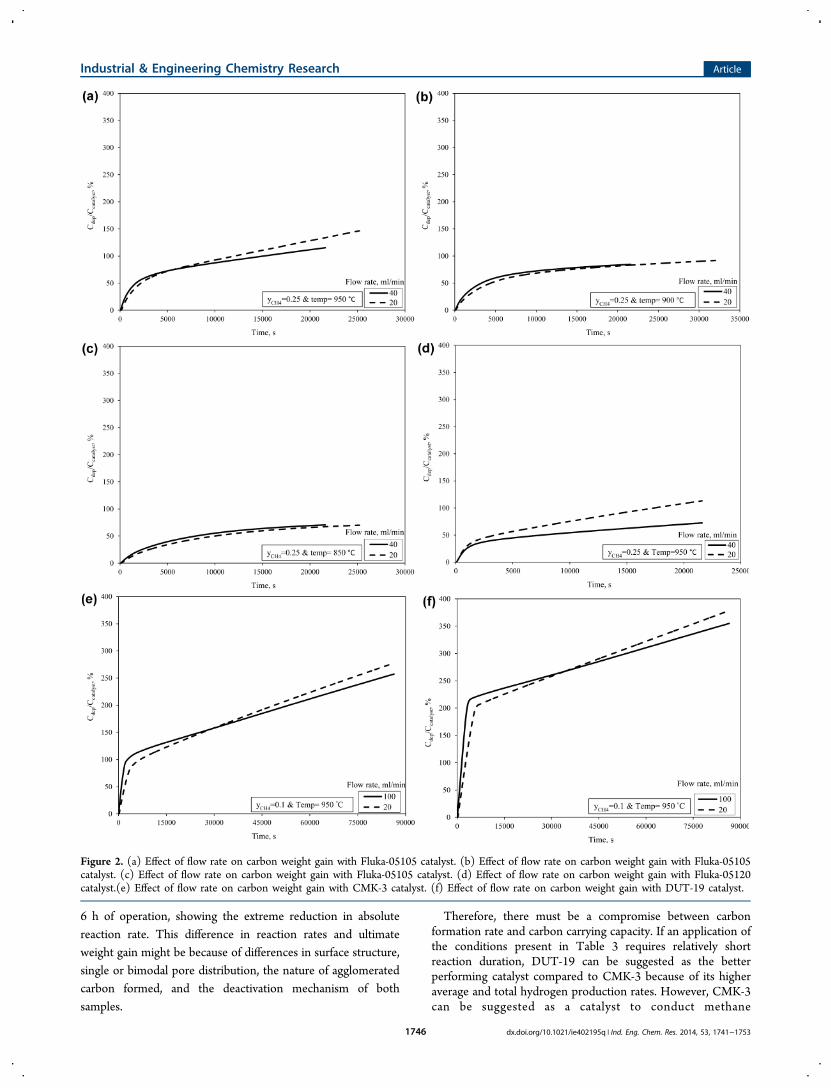
6 h of operation, showing the extreme reduction in absolutereaction rate. This difference in reaction rates and ultimateweight gain might be because of differences in surface structure,single or bimodal pore distribution, the nature of agglomeratedcarbon formed, and the deactivation mechanism of bothsamples.
Therefore, there must be a compromise between carbonformation rate and carbon carrying capacity. If an application ofthe conditions present in Table 3 requires relatively shortreaction duration, DUT-19 can be suggested as the betterperforming catalyst compared to CMK-3 because of its higheraverage and total hydrogen production rates. However, CMK-3can be suggested as a catalyst to conduct methane
Figure 2. (a) Effect of flow rate on carbon weight gain with Fluka-05105 catalyst. (b) Effect of flow rate on carbon weight gain with Fluka-05105catalyst. (c) Effect of flow rate on carbon weight gain with Fluka-05105 catalyst. (d) Effect of flow rate on carbon weight gain with Fluka-05120catalyst.(e) Effect of flow rate on carbon weight gain with CMK-3 catalyst. (f) Effect of flow rate on carbon weight gain with DUT-19 catalyst.
Industrial & Engineering Chemistry Research Article
dx.doi.org/10.1021/ie402195q | Ind. Eng. Chem. Res. 2014, 53, 1741−17531746

decomposition reaction for longer reaction duration applica-tions with reasonably good reaction rates.The reason for the lower performance of DUT-19 compared
to that of CMK-3 at a reaction temperature of 950 °C andmethane partial pressure of 0.5 can be explained as follows.Characterization of our synthesized catalytic samples showedthat CMK-3 has a 2D hexagonal structure with a pore diameterof 4.4 nm and surface area of 1400 m2/g. DUT-19 has a 3Dcubic structure with bimodal pores and pore diameters of 1 and4.6 nm, with a surface area of 2420 m2/g.35 The difference inthe surface structure and pore size of these catalysts determinesthe rate of carbon deposition. However, the activities of CMK-3and DUT-19 were comparable because one pore diameter isapproximately the same for both catalysts. For the initial 6 h ofoperation, the ultimate weight gain was determined to behigher for DUT-19 because the surface area, and therefore thenumber of active sites within its bimodal pore structure, were
higher. After 6 h of operation, the common 4.5 nm porestructure of DUT-19 and CMK-3 may have been filled, whereasthe 1 nm pore size of DUT-19 was unfilled. The active sites ofthe 1 nm pore size of DUT-19 may have been blocked,resulting in a lower reaction rate. After deactivation in thesecond reaction zone, the reaction rate of all catalysts shouldeither be the equivalent or zero depending on the activity of theagglomerated carbon and the amount of thermally inducedreaction. The differences observed in reaction rate for the samereaction conditions across catalysts may be due to a variation inthe properties of the carbon formed with each catalyst as aresult of catalyst source, origin, preparation, and so forth.Formed carbon may also be participating as a catalyst, resultingin a higher reaction rate for CMK-3.48
3.3. Calculation of the Thermodynamically PredictedCarbon Deposition and the Comparison to Experimen-tally Observed Carbon Formation. Molar flow rates of
Figure 3. Carbon weight gain with each carbon catalyst (Fluka-05105, Fluka-05120, CMK-3, and DUT-19).
Figure 4. Carbon formation rate with each carbonaceous catalyst (Fluka-05105, Fluka-05120, CMK-3, and DUT-19).
Industrial & Engineering Chemistry Research Article
dx.doi.org/10.1021/ie402195q | Ind. Eng. Chem. Res. 2014, 53, 1741−17531747

methane (FCH4,0) and inert gas (FHe,0) of the inlet feed mixturewere calculated from the inlet volumetric flow rate (mL/min)and mole or volume fraction of each gas. Assuming time as the
basis, this means that nCH4,0 = FCH4,0, nHe,0 = FHe,0 and n0 = nCH4,0
+ nHe,0 (where nCH4,0, nH2,0, and n0 were the initial moles ofmethane, hydrogen, and total gas present before the methanedecomposition reaction).Methane decomposes into hydrogen and carbon according
to the following reaction:
→ +CH C 2H4 2 (1)
Chemical reaction thermodynamics defines the relationbetween the equilibrium constant (K), reaction coordinates(ε), pressure ratio (p/p0) and initial moles (including inert) as
εε ε
=+
+ −
−
⎪ ⎪
⎪ ⎪⎛⎝⎜⎜
⎞⎠⎟⎟
⎧⎨⎩
⎫⎬⎭
pp
Kn
n n
( 2 )
( )( )0
1H ,0
2
0 CH ,0
2
4 (2)
Hydrogen was not present in the feed gas mixture for all of thereactions conducted, so nH2,0 = 0. The TGA was operated atambient pressure, and therefore, p/p0 = 1. As a result, eq 2reduces to
εε ε
=+ −
⎪
⎪
⎪
⎪
⎧⎨⎩
⎫⎬⎭
Kn n
4( )( )
2
0 CH ,04 (3)
The equilibrium constant K was calculated from the proceduredescribed in Ozalp et al.49 Upon rearrangement to obtain thevalue of reaction coordinate, ε, from the known values of K, n0,and nCH4,0, the following is obtained:
ε =− − ± − + +
+
K n n K n n K Kn n
K
( ) ( ( )) 4(4 )
2(4 )0 CH ,0 0 CH ,0
20 CH ,04 4 4
(4)
The relation between reaction coordinates and methaneconversion found by Lieb and Pereira50 is given by
εν
=X nCH CH ,0
CH
4 4
4 (5)
Therefore XCH4can be evaluated from the known values nCH4,0,
ε, and vCH4as
εν=X
nCHCH
CH ,04
4
4 (6)
where ε is the reaction coordinate, vCH4is the stoichiometric
coefficient of methane decomposition (=1), XCH4is methane
conversion, and nCH4,0 is the initial moles of methane present.
Once XCH4was obtained, the molar carbon formation rate
can be evaluated by
=r F Xcm CH ,0 CH4 4 (7)
The amount of carbon deposited over the course of thereaction, CDT, can be calculated as the product of themolecular weight of carbon (MWC), reaction time (t) andmolar carbon formation rate (rcm) as follows:
= r tCD MWT C cm (8)
This thermodynamically predicted carbon deposition onlydetermines the amount of deposition due to thermal methane
cracking and does not take into account the use of a catalyst,the type of catalyst, or catalyst deactivation. Therefore,experimentally observed carbon formation at the end of thecatalytic reaction is higher than the thermodynamic calculation.It should be noted that the autocatalyzed reaction mightcontinue even after complete pore blocking of the catalyst.Also, the reaction might run on the outer surface of the blockedcatalyst particles. After the very rapid initial blocking, thereaction continues for a long time. These are the main reasonsfor observing high carbon formation rates. In summary, we canlist the reasons to have differences between the theoretical andexperimental findings as follows:
i. Carbon formed during methane decomposition canparticipate in an autocatalytic reaction; therefore,conversion cannot be quantified because carbon isformed as a function of time.
ii. Thermodynamics is time independent. The experimentalstudy shows that methane is fed with a definite flow rate,whereas the carbon formation rate depends on thereaction conditions chosen, such as temperature andconcentration. In this view and in agreement with theprevious literature, it is seen that methane decompositionis kinetically controlled.
iii. Furthermore, with a carbon catalyzed reaction, there issimultaneous methane decomposition reaction as well ascatalyst deactivation taking place at the same time.Therefore, the deactivation mechanism might alsochange during the course of the reaction. Initial
Table 3. Comparison of Total and Average HydrogenProduction for 6 h of Reaction from MethaneDecomposition by Various Carbonaceous Catalysts atReaction Temperature of 950°C
methanevolume, % catalyst
total hydrogenproduction, mmol/
gcatalyst
average hydrogenproduction, mmol/(gcatalyst
min)
50 Fluka-05120
186.584 0.519
Fluka-05105
326.1127 0.907
CMK-3 553.374 1.538(1517.366)a (1.054)a
DUT-19
560.5 1.56
(1267.86)a (0.880)a
25 Fluka-05120
188.570 0.524
Fluka-05105
244.010 0.583
CMK-3 494.334 1.376(1222.627)a (0.849)a
DUT-19
498.334 1.389
(991.161)a (0.688)a
aFor the reaction time of 24 h.
Industrial & Engineering Chemistry Research Article
dx.doi.org/10.1021/ie402195q | Ind. Eng. Chem. Res. 2014, 53, 1741−17531748

deactivation occurs inside the catalyst pores followed bydeactivation on catalysts’ external surface as a function oftime. Therefore, average conversion during a run can befound by assuming a steady state conversion at varioustimes and summing over time. However, this conversionkeeps changing with different experimental durations.
3.4. CATALYTIC ACTIVITYActivity is defined as ratio of rate of carbon formation at time tto initial rate of carbon formation (r0).
46 This can berepresented mathematically as
=a tr t
r( )
( )c
0 (9)
Where rc(t) is the rate of carbon formation at time t and r0 isthe initial rate of carbon formation. However, the change ofactivity based on the carbon formation weight is
= −⎡⎣⎢⎢
⎤⎦⎥⎥a t
C t
C( ) 1
( )dep
CM (10)
Where Cdep is the weight of carbon deposited at time t, and CCMis the maximum weight of carbon deposited. The activity basedon the weight method (eq 10) assumes that deactivation orcarbon deposition occurs uniformly on the catalyst sur-face.25,47,52
In eq 9, the initial reaction rate (r0) is a function of the partialpressure of methane and reaction temperature as observed byAbbas et al.25 However, the second definition of activity definesCCM as the maximum weight of carbon deposited, which varieswith reaction temperature and methane partial pressure. Themaximum amount of carbon deposited depends on bothreaction temperature and methane partial pressure. As methanepartial pressure and reaction temperature increase, the value ofCCM will also increase. Therefore, determining a value of CCMfor activity plots and calculations was very important. Inaddition, the plot of Cdep/CCM versus activity will always belinear, as per eq 10, immaterial of variations in C(t)dep and CCM
in time. However, Abbas and Daud25,27 did not observe lineardata for C(t)dep/CCM versus activity for the various methanepartial pressures and reaction temperatures studied. Therefore,CCM was taken as the maximum amount of carbon deposited atthe highest temperature and methane partial pressure in theirstudy in order to be able to compare results.The catalytic activity of CMK-3 calculated via eqs 9 and 10
was plotted as a function of time in Figure 5 in order tocompare the results of the two methods. A significant differencein activity was observed in calculations made on the basis of thetwo aforementioned methods because of the assumptions madein the activity calculations of the weight method. Recentliterature describes various methods of determining catalystactivity, such as measuring the conversion of a diluted methanestream in a fixed bed/plug-flow reactor, monitoring outlethydrogen concentration in a plug-flow reactor, and monitoringthe weight gain in time using a TGA.53−55
Monitoring weight gain with time has the advantage ofeliminating the space limitation issues encountered when usinga fixed bed reactor.54,55As a result, Rahman et al.56 selected theTGA for deactivation studies and calculated the catalyst activityin terms of carbon formation rates as shown by eq 9. In thisstudy, activity calculated by carbon formation rate (eq 7)qualitatively matched with those published by Rahman et al.56
Catalyst activity is a very important variable of interest thatmust be determined correctly as any error will cascade into thedeactivation kinetics calculations in which it is utilized.Therefore, the result of both methods of calculating activitywas used to determine deactivation kinetics.
3.5. Deactivation Kinetics. As shown in Figure 1, thecarbon formation rate decreased as the reaction proceeded dueto carbon deposition on the catalyst surface. The decrease incarbon formation rate illustrates the deactivation of the catalystdue to carbon deposition. Therefore, deactivation and catalystactivity were coupled because the former was the result of thelatter; the faster the carbon deposition, the more quicklyagglomeration results in a decrease in activity. Carbonaceouscatalyst deactivation is one of the most technically challengingproblems for the commercial development of hydrogen
Figure 5. Activity by rate and weight method with CMK-3 catalyst for methane decomposition.
Industrial & Engineering Chemistry Research Article
dx.doi.org/10.1021/ie402195q | Ind. Eng. Chem. Res. 2014, 53, 1741−17531749
produced via methane decomposition.57,58 Depending on thetextural properties and surface chemistry of the catalyst, variousmechanisms were proposed for deactivation.26,45,48,59 Detailedstudies of deactivated samples are in progress to determine themechanism of deactivation for CMK-3, DUT-19, and Flukasamples.Catalyst deactivation rate can be considered to be a function
of reactor temperature, methane partial pressure, and thepresent state of the catalyst sample.46 The deactivation rate interms of the Arrhenius temperature dependency andconcentration of gas phase species can be represented as
− = = −at
k p a k p add
edm d
dE RT m d
CH 0/
CHd
4 4 (11)
where:
kd = kd0e(−Ed/RT)
a is the activity of the catalystkd is the catalyst deactivation rate constant in (atmm s)−1
m is a measure of the concentration (pCH4) dependency
d is the order of deactivationEd is the activation energy or temperature dependency ofthe deactivation in kJ/molkd0 is the pre-exponential factor in (atmm s)−1
There are two possible methods to determine thedeactivation kinetic parameters kd0, Ed, m, and d. The firstmethod assumes a simple kinetic form and checks to see if theequation fits the data. In this method, eq 9 is integrated throughtime for constant values of temperature and methane partialpressure. The result is a catalyst deactivation equation foractivity versus time at constant temperature and partial pressureof methane
= − −−a d k p t1 (1 )dd CH
m14 (12)
Thus, a1−d versus t was plotted for various assumed values of d.The resulting plot yields a straight line with a slope S
= − −S d k p(1 ) d CHm
4 (13)
The value of d for which the correlation coefficient was highestcan be assumed to be the deactivation order. This value shouldfit data for all methane partial pressures and reactiontemperatures chosen. The resulting slope values for eachmethane partial pressure and reaction temperature will be usedto determine the remaining deactivation parameters. Once Swas obtained, kd and m can be obtained by plotting the ln(S)versus ln(pCH4
) at various reaction temperatures. This can bewritten as
= − − +S d k m pln( ) ln( (1 ) ) ln( )d CH4 (14)
The slope of the above equation gives the methaneconcentration dependency m, and the intercept gives thecatalyst deactivation rate constant kd. Different kd values will beobserved at different temperatures. By assuming Arrheniustemperature dependency, the catalyst deactivation rate constantkd can be expressed as
= −k k ed dE RT
0/d (15)
Therefore, a plot of ln(kd) versus 1/T results in a straight linewith a value of −Ed/R. The y axis intercept gives the pre-exponential factor.Using this method to determine deactivation kinetic
parameters is less robust, generally providing a poor fit betweena1−d versus t for all sets of methane partial pressure andtemperature. The deactivation order d obtained by this methodwas a less versatile value for all reaction conditions. Abbas andDaud26,27 chose this first method to calculate the deactivationkinetics for methane decomposition. Activity was calculated bythe weight method (eq 10) to determine deactivationkinetics.27
An alternative method to calculate the deactivation kineticswas used in this study. Once the activity and deactivation ratewere determined, eq 11 was directly fit with the experimentaldata by nonlinear regression analysis. This method gives the allthe deactivation kinetic parameters (kd0, Ed, m, d) byconsidering the simultaneous effect of temperature, methanepartial pressure, and deactivation of the catalyst by minimizingthe sum of the squared error between the model and
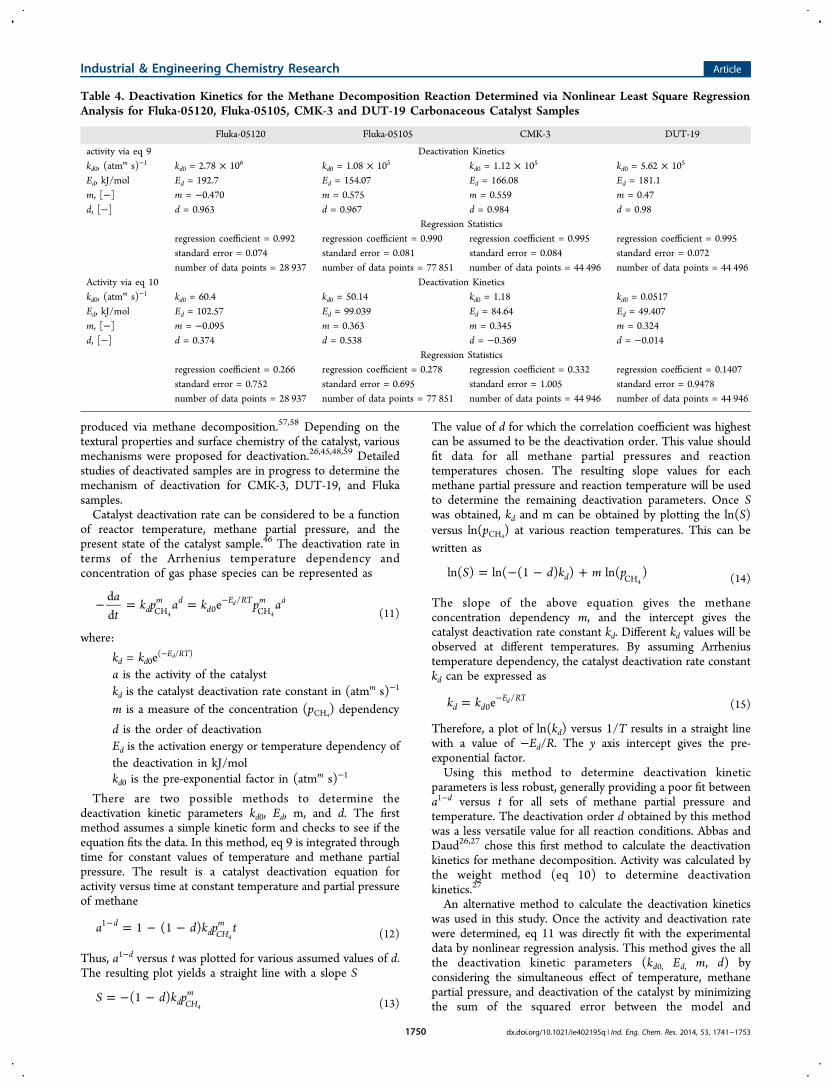
Table 4. Deactivation Kinetics for the Methane Decomposition Reaction Determined via Nonlinear Least Square RegressionAnalysis for Fluka-05120, Fluka-05105, CMK-3 and DUT-19 Carbonaceous Catalyst Samples
Fluka-05120 Fluka-05105 CMK-3 DUT-19
activity via eq 9 Deactivation Kineticskd0, (atm
m s)−1 kd0 = 2.78 × 10⁶ kd0 = 1.08 × 10⁵ kd0 = 1.12 × 10⁵ kd0 = 5.62 × 10⁵
Ed, kJ/mol Ed = 192.7 Ed = 154.07 Ed = 166.08 Ed = 181.1m, [−] m = −0.470 m = 0.575 m = 0.559 m = 0.47d, [−] d = 0.963 d = 0.967 d = 0.984 d = 0.98
Regression Statisticsregression coefficient = 0.992 regression coefficient = 0.990 regression coefficient = 0.995 regression coefficient = 0.995standard error = 0.074 standard error = 0.081 standard error = 0.084 standard error = 0.072number of data points = 28 937 number of data points = 77 851 number of data points = 44 496 number of data points = 44 496
Activity via eq 10 Deactivation Kineticskd0, (atm
m s)−1 kd0 = 60.4 kd0 = 50.14 kd0 = 1.18 kd0 = 0.0517Ed, kJ/mol Ed = 102.57 Ed = 99.039 Ed = 84.64 Ed = 49.407m, [−] m = −0.095 m = 0.363 m = 0.345 m = 0.324d, [−] d = 0.374 d = 0.538 d = −0.369 d = −0.014
Regression Statisticsregression coefficient = 0.266 regression coefficient = 0.278 regression coefficient = 0.332 regression coefficient = 0.1407standard error = 0.752 standard error = 0.695 standard error = 1.005 standard error = 0.9478number of data points = 28 937 number of data points = 77 851 number of data points = 44 946 number of data points = 44 946
Industrial & Engineering Chemistry Research Article
dx.doi.org/10.1021/ie402195q | Ind. Eng. Chem. Res. 2014, 53, 1741−17531750

experimental data. This method is considered to be moreaccurate in obtaining the deactivation parameters because it fitsthe data best by design.A recent study by Serrano et al.48 observed three different
carbon deposition rate regimes over the course of methanedecomposition reactions for the carbon blacks CB-bp and CB-vand ordered mesoporous carbons CMK-3 and CMK-5.Deactivation phenomena was modeled by considering differentfunctions for deactivation of the initial active sites, autocatalyticbehavior of formed carbon, and deactivation of the new activesites by formed carbon deposits occurring during the reaction.A power law model was considered for the autocatalytic effect,whereas a linear or power law function was used fordeactivation in Zones 1 and 3 of their study to obtain thedeactivation kinetics. Zones 1 and 2 observed by Serrano etal.48 were not observed in this study, as shown in Figure 2.Therefore, deactivation of the initial carbonaceous catalyst andthe autocatalytic effect function was not considered in ourmodel to obtain the deactivation kinetics as shown by eq 11.Table 4 shows the deactivation kinetics and regression
statistics of the nonlinear regression analysis for the variouscarbon samples studied (Fluka-05120, Fluka-05105, CMK-3,and DUT-19) for methane decomposition. Deactivationkinetics were calculated by evaluating the activity by eqs 9and 10. From the table, it can be seen that for the samecarbonaceous catalyst and experimental data there was asignificant difference in the deactivation kinetic parameters. A 5or 6 orders of magnitude difference in the pre-exponentialfactor (kd0) was determined by the two methods of calculation.A significant difference in methane concentration dependency(m) and deactivation order (d) were also observed.Furthermore, the regression statics were very poor, and thedeactivation kinetics calculated by eq 10 appear to be unrealisticcompared to the data. Similar deviations between the twomethods were also observed for each catalyst sample studied.The deactivation kinetics calculated from activity determinedfrom the rate method (eq 9) were more appropriate, as the fitto the data was much better. The regression coefficientobtained for activity by eq 9 was above 0.99 for all catalystsamples studied. A deactivation order (d) of approximately 1.0and a concentration dependency (m) of approximately 0.5 wascalculated for all samples. This confirms that deactivation is notoccurring uniformly on the catalyst surface. In fact, deactivationis started from the inner pores of the catalyst and moves towardthe outer surface. Conversely, Abbas and Daud27 observed amethane concentration and a deactivation order of 0.5 forpalm-shell-based activated carbon. Though this is the secondstudy analyzing the deactivation kinetics of carbonaceouscatalysts in a TGA,48 a more appropriate approach is utilizedin order to determine deactivation kinetic parameters.Shilapuram et al. determined the kinetics for in-house
synthesized ordered mesoporous carbons (CMK-3) andcarbide derived carbons (DUT-19).38 Arrhenius energy valuesof 187 kJ/mol for CMK-3 and 196 kJ/mol for DUT-19 weredetermined, as well as a reaction order of 0.5 for both catalysts.Table 4 shows that the concentration dependence of methanecan be approximated as 0.5 in both reaction kinetics andcatalyst deactivation kinetics. The activation energy required forthe methane decomposition reaction was higher than thecatalytic deactivation of both CMK-3 and DUT-19. This is inagreement with the Abaas and Daud et al.,25,27 where theyobserved an activation energy of 210 kJ/mol for methane
decomposition and an activation energy for the deactivation ofmethane decomposition of 194 kJ/mol.
4. CONCLUSIONS
Experiments were conducted in a thermogravimetric analyzerto study catalytic methane decomposition with differentcarbonaceous catalysts, including activated carbons (Fluka-05120 and Fluka-05105), ordered mesoporous carbons (CMK-3), and ordered carbide-derived carbons (DUT-19). Hydrogenand carbon were produced at various reaction temperatures andfeed gas methane mole fractions. The weight of the depositedcarbon and the derivative of the carbon deposition rate weredetermined. Carbon weight gain, carbon formation rate,average hydrogen production, cumulative hydrogen production,and catalytic activity were calculated for each experimental run.The effect of total flow rate was studied with each catalyst.Average and cumulative hydrogen production was comparedfor each catalyst. Activity was calculated by two definitions, theweight method and the rate method. Deactivation kinetics wereobtained by fitting the experimental data via nonlinearregression analysis. The following conclusions were madewith respect to the present study:
i. Fluka-05105 demonstrates higher catalytic performancethan Fluka-05120.
ii. DUT-19 has the best catalytic properties of all thecatalysts studied (Fluka-05120, Fluka-05105, CMK-3,and DUT-19) with higher carbon formation rate, carbondeposited, and average and cumulative hydrogenproduction.
iii. The effect of flow rates confirms that the system was in areaction control regime for the particle size and reactionconditions chosen.
iv. A comparison of the thermodynamically predictedcarbon formation for the chosen experimental conditionsand experimentally observed carbon formation showsthat catalytic methane decomposition via carbonaceouscatalyst was kinetically controlled as opposed toequilibrium controlled.
v. That there was a large deviation in the activity of thecatalysts calculated via the rate method versus the weightmethod confirmed that deactivation occurred from thepores to outside of the catalyst particle but not uniformlyon the catalyst surface.
vi. The deactivation kinetics obtained utilizing the ratemethod was appropriate for all of the catalysts (Fluka-05120, Fluka-05120, CMK-3, and DUT-19). Resultsshow a deactivation order of approximately 1.0 with amethane concentration dependency of approximately 0.5.
vii. Activation energies of 192, 154, 166, and 181 kJ/molwith pre-exponential factors of 2.78 × 10⁶, 1.08 × 105,1.12 × 105, and 5.62 × 10⁵ were obtained for Fluka-05120, Fluka-05105, CMK-3, and DUT-19, respectively.
■ AUTHOR INFORMATION
Corresponding Author*N. Ozalp. Phone: +974.6686.2832. E-mail: [email protected].
NotesThe authors declare no competing financial interest.
Industrial & Engineering Chemistry Research Article
dx.doi.org/10.1021/ie402195q | Ind. Eng. Chem. Res. 2014, 53, 1741−17531751

■ ACKNOWLEDGMENTSThis research has been funded by National Priorities ResearchProgram of Qatar National Research Fund (QNRF) Project no.NPRP 09-671-2-255.
■ NOMENCLATUREa = catalyst activityAC = activated carbonACPS = palm-shell-based activated carbonCdep = amount of carbon deposited on catalyst, mgCCatalyst = initial amount of catalyst, mgCCM = maximum weight of carbon depositedCB = carbon blackCFD = computational fluid dynamicsd = order of deactivationEd = activation energy of deactivation, kJ/molFCH4,0 = molar flow rate of methane in the feed gas, mol/hFHe,0 = molar flow rate of helium in the feed gas, mol/hK = equilibrium constantkd = catalyst deactivation rate constant, (atmm s)−1
kd0 = pre-exponential factor, (atmm s)−1
m = measure of the methane concentration (pCH4)
dependencynCH4,0 = initial moles of methane in the feednH2,0 = initial moles of hydrogen in the feednHe,0 = initial moles of helium in the feedn0 = initial moles of feed mixtureP = pressureP0 = atmospheric pressurepCH4
= partial pressure of methaneR = gas constantr0 = initial rate of methane decomposition, mgcarbon (mgcatalystmin)−1
rc = carbon formation rate, mgcarbon (mgcatalyst min)−1
rcm = molar carbon formation rate, molcarbon/hS = slope of catalyst deactivation equation in timeSEM = scanning electron microscopyT = temperatureXCH4
= methane conversionXRD = X-ray diffractionyCH4
= methane mole fraction in the feed gas
Greek Symbolsε = reaction coordinates
■ REFERENCES(1) Muradov, N. Z.; Veziroglu, T. N. “Green” path from fossil-basedto hydrogen economy: An overview of carbon-neutral technologies.Int. J. Hydrogen Energy 2008, 33, 6804.(2) Holladay, J. D.; Hu, J.; King, D. L.; Wang, Y. An overview ofhydrogen production technologies. Catal. Today 2009, 139, 244.(3) Steinfeld, A. Solar thermochemical production of hydrogen-areview. Solar Energy 2005, 78, 603.(4) Shilapuram, V.; Jaya Krishna, D.; Ozalp, N. Residence timedistribution and flow field study of aero-shielded solar cyclone reactorfor emission-free generation of hydrogen. Int. J. Hydrogen Energy 2011,36, 13488.(5) Rodat, S.; Abanades, S.; Flamant, G. Experimental evaluation ofindirect heating tubular reactors for solar methane pyrolysis. Int. J.Chem. React. Eng. 2010, 8, 1.(6) Kogan, A.; Israeli, M.; Alcobi, E. Production of hydrogen andcarbon by solar thermal methane splitting. IV. Preliminary simulationof a confined tornado flow configuration by computational fluiddynamics. Int. J. Hydrogen Energy 2007, 32, 4800.
(7) Maag, G.; Zanganeh, G.; Steinfeld, A. Solar thermal cracking ofmethane in a particle flow reactor for the co-production of hydrogenand carbon. Int. J. Hydrogen Energy 2009, 34, 7676.(8) Ozalp, N.; Shilapuram, V. Step-by-step methodology ofdeveloping a solar reactor for emission-free generation of hydrogen.Int. J. Hydrogen Energy 2010, 35, 4484.(9) Li, Y.; Li, D.; Wang, G. Methane decomposition to CO2-freehydrogen and nano-carbon material on group 8−10 base metalcatalysis: A review. Catal. Today 2011, 162, 1.(10) Piao, L.; Li, Y.; Chen, J.; Chang, L.; Lin, J. Y. S. Methanedecomposition to carbon nanotubes and hydrogen on an aluminasupported nickel aerogel catalyst. Catal. Today 2002, 74, 145.(11) Yeheskel, J.; Epstein, M. Thermolysis of methane in a solarreactor for mass-production of hydrogen and carbon nanomaterials.Carbon 2011, 49, 4695.(12) Pinilla, J. L.; Torres, D.; Lazaro, M. J.; Suelves, I.; Moliner, R.;Canadas, I.; Rodriguez, J.; Vidal, A.; Martinez, D. Metallic andcarbonaceous-based catalysts performance in the solar catalyticdecomposition of methane for hydrogen and carbon production. Int.J. Hydrogen Energy 2012, 37, 9645.(13) Sharif, H.; Sharif, A. Z.; Mohamed, R.; Sesha, T. S. Kineticstudies on catalytic decomposition of methane to hydrogen andcarbon over Ni/TiO2 catalyst. Ind. Eng. Chem. Res. 2004, 43, 4864.(14) Muradov, N.; Smith, F.; T-Raissi, A. Catalytic activity of carbonsfor methane decomposition. Catal. Today 2005, 102−103, 225.(15) Muradov, N.; Smith, F.; Huang, C.; T-Raissi, A. Auto-thermalcatalytic pyrolysis of methane as a new route to hydrogen productionwith reduced CO2 emissions. Catal. Today 2006, 116, 281.(16) Suelves, I.; Lazaro, M. J.; Moliner, R.; Pinilla, J. L.; Cubero, H.Hydrogen production by methane decarbonization: carbonaceouscatalysts. Int. J. Hydrogen Energy 2007, 32, 3320.(17) Lee, K. K.; Han, G. Y.; Yoon, K. J.; Lee, B. K. Thermocatalytichydrogen production from the methane in a fluidized bed withactivated carbon catalyst. Catal. Today 2004, 93−95, 81.(18) Ryu, B. H.; Lee, S. Y.; Lee, D. H.; Han, G. Y.; Lee, T. J.; Yoon,K. J. Catalytic characterization of various rubber-reinforcing carbonblacks in decomposition of methane for hydrogen production. Catal.Today 2007, 123, 303.(19) Bai, Z.; Li, W.; Bai, J.; Li, B.; Chen, H. The effects of texturalproperties and surface chemistry of activated carbon on its catalyticperformance in methane decomposition from hydrogen production.Energy Sources, Part A 2012, 34, 1145.(20) Gatica, J. M.; Gomez, D. M.; Harti, S.; Vidal, H. Monolithichoney comb design applied to carbon material for catalytic methanedecomposition. Appl. Catal., A 2013, 458, 21.(21) Fidalgo, B.; Menendez, J. A. Carbon materials as catalysts fordecomposition and CO2 reforming of methane: A review. Chin. J.Catal. 2011, 32, 207.(22) Muradov, N. Z. CO2-free production of hydrogen by catalyticpyrolysis of hydrocarbon fuel. Energy Fuels 1998, 12, 41.(23) Muradov, N. Catalysis of methane decomposition overelemental carbon. Catal. Commun. 2001, 2, 89.(24) Muradov, N.; Smith, F.; Bokerman, G. Methane activation bynon-thermal plasma generated carbon aerosols. J. Phys. Chem. C 2009,113, 9737.(25) Abbas, H. F.; Daud, W. M. A. W. Thermo-catalyticdecomposition of methane using palm shell based activated carbon:kinetic and deactivation studies. Fuel Process. Technol. 2009, 90, 1167.(26) Abbas, H. F.; Daud, W. M. A. W. Hydrogen production bythermocatalytic decomposition of methane using a fixed bed activatedcarbon in a pilot scale unit: apparent kinetic, deactivation anddiffusional limitation studies. Int. J. Hydrogen Energy 2010, 35, 12268.(27) Abbas, H. F.; Daud, W. M. A. W. Deactivation of palm shell-based activated carbon catalyst used for hydrogen production bythermocatalytic decomposition of methane. Int. J. Hydrogen Energy2009, 34, 6231.(28) Abbas, H. F.; Baker, I. F. Thermocatalytic decomposition ofmethane using activated carbon: Studying the influence of process
Industrial & Engineering Chemistry Research Article
dx.doi.org/10.1021/ie402195q | Ind. Eng. Chem. Res. 2014, 53, 1741−17531752

parameters using factorial design. Int. J. Hydrogen Energy 2011, 36,8985.(29) Pinilla, J. L.; Suelves, I.; Lazaro, M. J.; Moliner, R. Kinetic studyof the thermal decomposition of methane using carbonaceouscatalysts. Chem. Eng. J. 2008, 138, 301.(30) Suelves, I.; Pinilla, J. L.; Lazaro, M. J.; Moliner, R. Carbonaceousmaterials as catalysts for decomposition of methane. Chem. Eng. J.2008, 140, 432.(31) Serrano, D. P.; Botas, J. A.; Pizarro, P.; Guil-Lopez, R.; Gomez,G. Ordered mesoporous carbons as highly active catalysts forhydrogen production by CH4 decomposition. Chem. Commun. 2008,48, 6585.(32) Serrano, D. P.; Botas, J. A.; Guil-Lopez, R. H2 production frommethane pyrolysis over commercial carbon catalysts: kinetic anddeactivation study. Int. J. Hydrogen Energy 2009, 34, 4488.(33) Serrano, D. P.; Botas, J. A.; Fierro, J. L. G.; Guil-Lopez, R.;Pizarro, P.; Gomez, G. Hydrogen production by methane decom-position: Origin of the catalytic activity of carbon materials. Fuel. 2010,89, 1241.(34) Botas, J. A.; Serrano, D. P.; Guil-Lopez, R.; Pizarro, P.; Gomez,G. Methane catalytic decomposition over ordered mesoporouscarbons: a promising route for hydrogen production. Int. J. HydrogenEnergy 2010, 35, 9788.(35) Botas, J. A.; Serrano, D. P.; Pizarro, P.; Gomez, G. Orderedmesoporous carbons as catalyst with remarkable activity and stabilityfor hydrogen production without CO2 emissions by CH4 decom-position. Proc. World Hydrogen Energy Conf., 18th; Stolten D., Ed.;Wiley-VCH: Weinheim, Germany, 2010; pp 243−248.(36) Ozalp, N.; Shilapuram, V. Characterization of activated carbonfor carbon laden flows in a solar reactor (Paper no. AJTEC2011-44381). Proc. ASME/JSME Therm. Eng. Jt. Conf., 8th; ASME: NewYork, 2011.(37) Shilapuram, V.; Ozalp, N. Carbon catalyzed methanedecomposition for enhanced solar thermal cracking (Paper no.ESFuelcell2011-54644). ASME Int. Conf. Energy Sustainability, Proc.,5th; ASME: New York, 2011.(38) Shilapuram, V.; Ozalp, N.; Oschatz, M.; Borchardt, L.; Kaskel, S.Hydrogen production from catalytic decomposition of methane overordered mesoporous carbons (CMK-3) and carbide-derived carbon(DUT-19). Carbon, accepted for publication.(39) Krawiec, P.; Kockrick, E.; Borchardt, L.; Geiger, D.; Corma, A.;Kaskel, S. Ordered mesoporous carbide derived carbons: Novelmaterials for catalysis and adsorption. J. Phys. Chem. C 2009, 113,7755.(40) Kockrick, E.; Schrage, C.; Borchardt, L.; Klein, N.; Rose, M.;Senkovska, I.; Kaskel, S. Ordered mesoporous carbide derived carbonsfor high pressure gas storage. Carbon 2010, 48, 1707.(41) Oschatz, M.; Kockrick, E.; Rose, M.; Borchartdt, L.; Klein, N.;Senkovska, I.; Freudenberg, Y.; Korenblit, G.; Yushin, G.; Kaskel, S. Acubic ordered, mesoporous carbide-derived carbon for gas and energystorage applications. Carbon 2010, 48, 3987.(42) Zhou, H.; Zhu, S.; Hibino, M.; Honma, I.; Ichihara, M. Lithiumstorage in ordered mesoporous carbon (CMK-3) with high reversiblespecific energy capacity and good cycling performance. Adv. Mater.2003, 15, 2107.(43) Ozalp, N.; Ibrik, K.; Al-Meer, M. Kinetic and heat transferanalysis of carbon catalyzed solar cracking process. Energy 2013, 15,74.(44) Foggler, H. S. Elements of chemical reaction engineering, 4th ed.;Pearson Education, Inc.: Upper Saddle River, NJ, 2006.(45) Kim, M. H.; Lee, E. K.; Jun, J. H.; Kong, S. J.; Han, G. Y.; Lee, B.K.; Lee, T. J.; Yoon, K. J. Hydrogen production by catalyticdecomposition of methane over activated carbons: kinetic study. Int.J. Hydrogen Energy 2004, 29, 187.(46) Levenspeil, O. Chemical Reaction Engineering, 3rd ed., John Wiley& Sons: New York; 1999.(47) Yoon, Y. H.; Park, N. K.; Chang, W. C.; Lee, T. J.; Hur, T.; Lee,B. G.; Baek, Y. S. Hydrogen production by pyrolysis of natural gas:
thermodynamic analysis. Trans. Korea Hydrogen Energy Soc. 2002, 13(1), 42.(48) Serrano, D. P.; Botas, J. A.; Pizarro, P.; Gomez, G. Kinetic andautocatalytic effects during the hydrogen production by methanedecomposition over carbonaceous catalysts. Int. J. Hydrogen Energy2013, 38, 5671.(49) Ozalp, N.; Shilapuram, V. Step-by-step methodology ofdeveloping a solar reactor for emission-free generation of hydrogen.Int. J. Hydrogen Energy 2010, 35, 4484.(50) Leib, T. M.; Pereira, C. J. Reaction Kinetics. In Green, D. W.,Perry, R. H., Eds.; Perry’s Chemical Engineers’ Handbook, 8th ed.;McGraw-Hill: New York, 2008; p 7-1−7-39.(51) Kim, M. H.; Lee, E. K.; Jun, J. H.; Han, G. Y.; Kong, S. J.; Lee, B.K.; Lee, T. J.; Yoon, K. J. Hydrogen production by catalyticdecomposition of methane over activated carbons: deactivationstudy. Korean J. Chem. Eng. 2003, 20, 835.(52) Oudar, J.; Wise, H. Deactivation and Poisoning of catalysts;Marcel Dekker: New York, 1985.(53) Shah, N.; Panjala, D.; Huffman, G. P. Hydrogen production bycatalytic decomposition of methane. Energy Fuels 2001, 15, 1528.(54) Zhang, T.; Amiridis, M. D. Hydrogen production via the directcracking of methane over silica-supported nickel catalysts. Appl. Catal.,A 1998, 167, 161.(55) Aiello, R.; Fiscuc, J. E.; Loye, H. C.; Amiridis, M. D. Hydrogenproduction via the direct cracking of methane over Ni/SiO2 catalystdeactivation and regeneration. Appl. Catal., A 2000, 192, 227.(56) Rahman, M. S.; Croiset, R. E.; Hudgins, R. R. Catalyticdecomposition of methane for hydrogen production. Top. Catal. 2006,37, 137.(57) Abanades, A.; Rubbia, C.; Salmieri, D. Technical challenges forindustrial development of hydrogen production based on methanecracking. Energy 2012, 46, 359.(58) Abanades, A.; Rubbia, C.; Salmieri, D. Thermal cracking ofmethane into hydrogen for a CO2-free utilization of natural gas. Int. J.Hydrogen Energy 2013, 20, 8491.(59) Lazaro, M. J.; Pinilla, J. L.; Suelves, I.; Moliner, R. Study of thedeactivation mechanism of carbon blacks used in methanedecomposition. Int. J. Hydrogen Energy 2008, 33, 4101.
Industrial & Engineering Chemistry Research Article
dx.doi.org/10.1021/ie402195q | Ind. Eng. Chem. Res. 2014, 53, 1741−17531753
Copyright © 2022 FDOKUMEN