Effects of Fly Ash Content on Properties of Cement Paste ...
Upload
independentCategory
view
1download
0
58 (2007) 1189–1198
Materials CharacterizationNanoindentation mapping of mechanical properties of cement pasteand natural rocks
Wenzhong Zhu a,⁎, John J. Hughes a, Nenad Bicanic b, Chris J. Pearce b
a Advanced Concrete and Masonry Centre, University of Paisley, High Street, Paisley PA1 2BE, Scotland, United Kingdomb Department of Civil Engineering, University of Glasgow, Glasgow G12 8LT, Scotland, United Kingdom
Received 20 February 2007; received in revised form 22 May 2007; accepted 22 May 2007
Abstract
This paper reports a study to assess nanoindentation mapping of mechanical properties of cement paste and natural rocks. Initialwork seems to show that mechanical property mapping by nanoindentation is feasible and can be related to microscopicinformation. Further work is however required on the effect of indent size and spacing. Such a testing technique can be very usefulfor materials with different phases to study the intrinsic properties of each component, and also the interaction and properties of theinterfacial regions of different phases. The values of Young's modulus and hardness of the individual mineral phases were alsodetermined by statistically analysing a large number of experimental data.© 2007 Elsevier Inc. All rights reserved.
Keywords: Nanoindentation; Mapping; Young's modulus; Hardness; Cement; Rocks
1. Introduction
Cement based materials and natural rocks are amongthe most utilized materials, essential to the constructionindustry and built environment. Studies by microscopictechniques, such as SEM, TEM and image analysis, etc,have revealed that cementitious materials are complexheterogeneous composite materials, with a randommicrostructure at different length scales, from the nanoto the macroscale. Such complex composites are madeeven more complicated by the time dependent nature ofthe cement hydration processes which begin at the mixing
⁎ Corresponding author. Tel.: +44 141 848 3578; fax: +44 141 8483275.
E-mail addresses: [email protected] (W. Zhu),[email protected] (J.J. Hughes), [email protected](N. Bicanic), [email protected] (C.J. Pearce).
1044-5803/$ - see front matter © 2007 Elsevier Inc. All rights reserved.doi:10.1016/j.matchar.2007.05.018
of cement clinker minerals with water and continue formonths and even years. Similarly, natural rocks areessentially composites made from minerals, containingstructural features down to the micro/nanoscale.
The engineering properties and durability perfor-mance of these materials at the macroscale are allsignificantly affected, if not dominated, by theirstructural features and properties at the micro/nanoscalewhere the deterioration and failure process starts.Traditionally, however, cement paste and rock materialshave been treated more or less as homogeneousmaterials with uniform mechanical properties sincemechanical characterisation of such materials has beenpossible only at a macroscale. It is not until recent yearsthat progress and improved availability of advancedinstruments and characterisation techniques, such asdepth-sensing micro/nanoindentation, has made itpossible to study mechanical properties of various
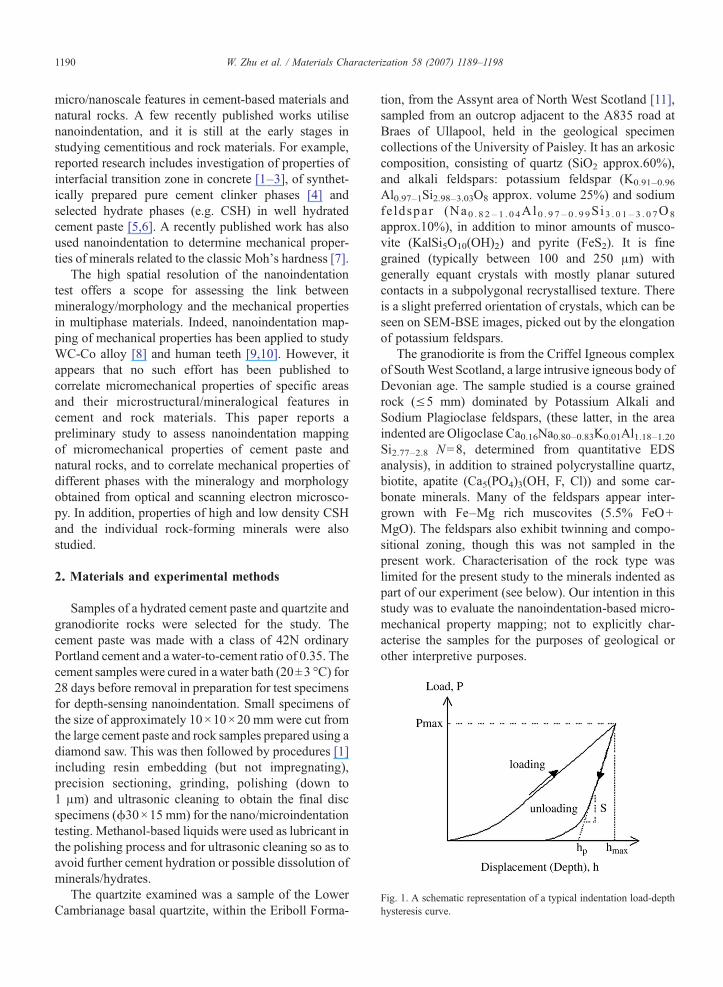
Fig. 1. A schematic representation of a typical indentation load-depthhysteresis curve.
1190 W. Zhu et al. / Materials Characterization 58 (2007) 1189–1198
micro/nanoscale features in cement-based materials andnatural rocks. A few recently published works utilisenanoindentation, and it is still at the early stages instudying cementitious and rock materials. For example,reported research includes investigation of properties ofinterfacial transition zone in concrete [1–3], of synthet-ically prepared pure cement clinker phases [4] andselected hydrate phases (e.g. CSH) in well hydratedcement paste [5,6]. A recently published work has alsoused nanoindentation to determine mechanical proper-ties of minerals related to the classic Moh's hardness [7].
The high spatial resolution of the nanoindentationtest offers a scope for assessing the link betweenmineralogy/morphology and the mechanical propertiesin multiphase materials. Indeed, nanoindentation map-ping of mechanical properties has been applied to studyWC-Co alloy [8] and human teeth [9,10]. However, itappears that no such effort has been published tocorrelate micromechanical properties of specific areasand their microstructural/mineralogical features incement and rock materials. This paper reports apreliminary study to assess nanoindentation mappingof micromechanical properties of cement paste andnatural rocks, and to correlate mechanical properties ofdifferent phases with the mineralogy and morphologyobtained from optical and scanning electron microsco-py. In addition, properties of high and low density CSHand the individual rock-forming minerals were alsostudied.
2. Materials and experimental methods
Samples of a hydrated cement paste and quartzite andgranodiorite rocks were selected for the study. Thecement paste was made with a class of 42N ordinaryPortland cement and a water-to-cement ratio of 0.35. Thecement samples were cured in a water bath (20±3 °C) for28 days before removal in preparation for test specimensfor depth-sensing nanoindentation. Small specimens ofthe size of approximately 10×10×20 mm were cut fromthe large cement paste and rock samples prepared using adiamond saw. This was then followed by procedures [1]including resin embedding (but not impregnating),precision sectioning, grinding, polishing (down to1 μm) and ultrasonic cleaning to obtain the final discspecimens (ϕ30×15 mm) for the nano/microindentationtesting. Methanol-based liquids were used as lubricant inthe polishing process and for ultrasonic cleaning so as toavoid further cement hydration or possible dissolution ofminerals/hydrates.
The quartzite examined was a sample of the LowerCambrianage basal quartzite, within the Eriboll Forma-
tion, from the Assynt area of North West Scotland [11],sampled from an outcrop adjacent to the A835 road atBraes of Ullapool, held in the geological specimencollections of the University of Paisley. It has an arkosiccomposition, consisting of quartz (SiO2 approx.60%),and alkali feldspars: potassium feldspar (K0.91–0.96
Al0.97–1Si2.98–3.03O8 approx. volume 25%) and sodiumfe ldspar (Na0 . 8 2–1 . 0 4Al0 . 9 7– 0 . 9 9Si 3 . 0 1–3 . 0 7O8
approx.10%), in addition to minor amounts of musco-vite (KalSi5O10(OH)2) and pyrite (FeS2). It is finegrained (typically between 100 and 250 μm) withgenerally equant crystals with mostly planar suturedcontacts in a subpolygonal recrystallised texture. Thereis a slight preferred orientation of crystals, which can beseen on SEM-BSE images, picked out by the elongationof potassium feldspars.
The granodiorite is from the Criffel Igneous complexof SouthWest Scotland, a large intrusive igneous body ofDevonian age. The sample studied is a course grainedrock (≤5 mm) dominated by Potassium Alkali andSodium Plagioclase feldspars, (these latter, in the areaindented are Oligoclase Ca0.16Na0.80–0.83K0.01Al1.18–1.20Si2.77–2.8 N=8, determined from quantitative EDSanalysis), in addition to strained polycrystalline quartz,biotite, apatite (Ca5(PO4)3(OH, F, Cl)) and some car-bonate minerals. Many of the feldspars appear inter-grown with Fe–Mg rich muscovites (5.5% FeO+MgO). The feldspars also exhibit twinning and compo-sitional zoning, though this was not sampled in thepresent work. Characterisation of the rock type waslimited for the present study to the minerals indented aspart of our experiment (see below). Our intention in thisstudy was to evaluate the nanoindentation-based micro-mechanical property mapping; not to explicitly char-acterise the samples for the purposes of geological orother interpretive purposes.

Fig. 2. Secondary electron image of the area of indents on the cementsample studied. Areas of harder phases, such as clinker grains areeasily identified. Note how the indent size, or even the presence of avisible indent, varies with phase type, in response to mechanicalproperty.
1191W. Zhu et al. / Materials Characterization 58 (2007) 1189–1198
The methodology and operating principle for thenanoindentation technique have been reviewed andpresented in detail elsewhere [12,13]. A typical outcomeof the nanoindentation testing is an indentation load-depth hysteresis curve as shown in Fig. 1. As a load isapplied to an indenter in contact with a specimensurface, an indent/impression is produced which con-sists of permanent/plastic deformation and temporary/elastic deformation. Recovery of the elastic deformationoccurs when unloading is started. Determination of the
Fig. 3. Element distribution maps o f the area of indents on the cement sample,paste, such as unhydrated clinker, calcium hydroxide, C–S–H. The rectangl
elastic recovery by analysing the initial part of theunloading data according to a model for the elasticcontact problem leads to a solution for calculation of theelastic modulus E and hardness H of the test area.
The nanoindentation apparatus used in this study wasNanoindenter XP(MTS Systems Corporation). In thisstudy, all testing was programmed in such a way that theloading started when the indenter came into contact withthe test surface and the load maintained for 30 secondsat the pre-specified maximum value before unloading.Progressive multistep indentation testing [14] with fiveloading–unloading cycles at different depths wasapplied at each test point. The unloading data for thelower indentation depth (i.e. hp=300–400 nm) wasused to determine the modulus and hardness values ofthe indentation point, whereas the indent impressionproduced at the higher depth (hp=1000–1500 nm)allows easy examination of the indent and the tested areaafter the testing using optical and scanning electronmicroscopes (SEM).
Two different shapes of diamond indenter wereselected for this study. A common Berkovich indenter,which has a relationship between the projected area Aand the depth hp for the indentation as A≈24.5h2, wasused for studying the rock samples. A conical indenterwith A≈4.44h2 was used for studying the cement pastesample as it copes better with the rougher surface andsmaller-scale spatial details often seen in hydratedcement specimens. The comparatively sharper conicalindenter allows smaller spacing between indents (so to
permitting the clearer identification of phase constituents in the cemente in the Ca map indicates approximate area of indents.

Fig. 4. Maps of mechanical properties (elastic modulus E and hardnessH) of the test area in cement paste, together with the correspondingoptical microscopic image.
1192 W. Zhu et al. / Materials Characterization 58 (2007) 1189–1198
avoid possible overlapping of indented areas) to be usedas well. Information on the mechanical properties wasobtained from a matrix of a minimum of 240 indentscovering a representative area of at least 150×150 μm2
and 300×300 μm2 on the surface for cement and rockspecimens, respectively. The selected indent spacingwas 10 μm and 20 μm for the cement and rockspecimens, respectively. The tested areas in eachsample, including the matrix of indentation, were thenexamined using an optical microscope utilising reflectedlight. The samples were also studied using a FESEM(Hitachi S4100), in both secondary electron (workingdistance of N15 mm, accelerating voltage between 5 and20 kV) and backscattered electron (BSE, 20 kV)imaging modes, in conjunction with energy-dispersivespectroscopy (EDS) analysis for the determination ofqualitative and quantitative mineral compositions (co-balt gain and natural mineral calibration was applied).These enable the assessment of correlation between thenanoindentation results and the visual appearance of thecorresponding surface (i.e. morphology), as well as themineralogy and composition of the phases involved.
3. Results and discussion
3.1. Mapping of mechanical properties
Fig. 2 shows a secondary electron image of the areaof indents on the cement sample. Fig. 3 shows theelement maps, determined by EDS, for a portion of thecorresponding area (within the rectangle on the Camap), that allows the identification of phases, and Fig. 4presents the corresponding mechanical property maps. Itappears in these figures that the Young's modulus mapand the hardness map have a similar appearance. Theunhydrated, or partially hydrated, cement clinkerparticles can be identified as a dark grey shade in theoptical image, whereas the hydrate phases are a lightergrey shade, confirmed by the EDS elemental mappingpresented in Fig. 3. The EDS mapping also permits theidentification of areas of calcium hydroxide, and offers ahigher resolution, permitting an identification of thephases indented. Viewing the modulus/hardness mapand the optical and SEM images together, the generalcorrelation between the mechanical properties and phasefeatures can be clearly seen. For example, it is apparentthat the highest value of modulus/hardness is in the coreof the large unhydrated/partially-hydrated cement par-ticles, and the property values rapidly decrease outwardsand into the space filled by the cement hydrate phaseswhich are reported to have modulus values in the rangeof 20–40 GPa [5,6]. The lowest values of modulus (i.e.,
2–20 GPa) are believed to be due to the porosity orsurface defects present in the space originally occupiedby mixing water.
Similarly, for the quartzite and granodiorite samples,maps of elastic modulus and hardness of the tested areahave a similar appearance (Figs. 5 and 8). These prop-erties maps can also be seen to correlate well, on aqualitative level, with the mineralogical features of theoptical and SEM images of the corresponding areas. Fig. 6

Fig. 5. Maps of mechanical properties (elastic modulus E and hardnessH) of the test area in quartzite, together with the corresponding opticalmicroscopic image.
1193W. Zhu et al. / Materials Characterization 58 (2007) 1189–1198
presents an element distribution map for the tested area inthe quartzite sample, which permits the identification ofquartz (the area with no Al, K or Na) and also K and Nafeldspars, orthoclase and albite. The area of quartzcorresponds closely to the area with consistent modulusvalues of 100–110 GPa and hardness of 12–14 GPa. Theorthoclase feldspar corresponds to areas with modulusvalues of 80–90 GP and hardness values of 8–10 GPa.
Fig. 7 is a BSE image of the area of indents on thegranodiorite, which reveals a high apparent heteroge-neity with in the feldspar grains. The image confirms thepresence of Na rich Plagioclase feldspars, revealed to beOligoclase from quantitative EDS analysis in the SEM),with intergrowths of a fine grained Mg/Fe-containingmuscovite mica, areas of calcite and also Apatite.Element mapping was also carried out, but is notpresented here as the BSE image summarises thecomposition of the sample adequately. The BSE imagealso reveals useful detail of the locations of indents, inthis case as there is apparently a significant SE contri-bution to the sample image.
For the granodiorite sample, the general comparison ofthe mechanical property maps (Fig. 8) and the mineralphase distribution is clear , but there appears to a con-siderable variation in property across the majority of thesample. This is primarily due to areas of an intergrowth offeldspar with relatively fine-grained muscovite within thesample (Fig. 7). The area of low modulus to the upper leftof the sampled area corresponds to an area of Mg–Fecontaining muscovite, a sheet silicate mineral with lowvalues of mechanical property. High modulus areas to theright of the area sampled correspondwith grains ofApatite.
It is also apparent that the variation of mechanicalproperties was smaller in the quartzite and granodioritesamples than in the cement paste sample. This is due tothe detailed nature of the distribution of phases, anddefects in the sample. For the granodiorite sample,though it is a coarse-grained rock, the nature of the areasampled, with many small grains of mica within thefeldspar grains (areas labelled “Mix” in Fig. 7), meansthat the mapped values of modulus and hardness reflect aheterogeneity that is of a similar scale to the density ofsampling, therefore producing a material property mapthat is undulating. The method of contouring the valuesof mechanical property also tends to emphasise a tran-sition in values that does not reflect the discrete spatialnature of mineral grains. For the granodiorite sample, thesize and spacing of indents should be decreased andnumber of indents increased to improve the resolution ofthe mechanical property maps. The phase grain size inthe quartzite specimen is significantly larger than thosein the cement paste sample, and the effective size in thegranodiorite sampled, therefore producing a “flatter”property map than either of these two.
3.2. Determination ofmechanical properties of individualhydrate and mineral phases
With the large number of indentation test resultsgenerated for the mapping of mechanical properties,

Fig. 6. Element distributionmaps of the area of indent in the quartzite sample, highlighting the presence of quartz, Na andK feldspars in the area of sampling.Note also the presence of surface defects in the sample (cracks and voids) that can affect the quality of data obtained. The inclined rectangle in the Siliconmapindicates the approximate area of the indents.
1194 W. Zhu et al. / Materials Characterization 58 (2007) 1189–1198
attempts were also made to extract mechanical proper-ties of specific individual phases in the tested area bystatistically analysing all the test results, using a method
Fig. 7. BSE image of the area of indent in the granodiorite sample. Thisshould be viewed along with Fig. 8. The image is dominated by anoligoclase plagioclase feldspar (Ofs), which constitutes the entirebackground to the sample area. The sample also contains a Mg/Fe(∼5%) containing muscovite (M), and minor Calcite (C) and Apatite(A). The texture is mixed in many areas (e.g. Mix) with intergrowths offine grained muscovite and feldspar, and many of the indents samplemore than one mineral. In the lower right and top centre areas there isfeldspar with no muscovite intergrowth.
similar to that presented by Constantinides et al. [5].Basically, the experimental data (i.e. modulus andhardness values) were statistically analysed to producea frequency histogram. Then, the best model fit to theexperimental results with multimodal normal distribu-tion curves (also known as Gaussian distribution, seeEq. (1)) was produced using nonlinear least squaresmethod. These curves are shown in Figs. 9–11.
f ðx; l; rÞ ¼ 1
rffiffiffiffiffiffi2p
p exp �ðx� lÞ22r2
!ð1Þ
From each model fit, the mean value μ and standarddeviation σ of the distribution were extracted, whoseassociation with a specific hydrate or mineral phaseswas ascertained by SEM-BSE and SEM-EDS analysis[6]. The area under the normal distribution curve couldalso provide an estimate of the volume fraction for thehydrate/mineral phase it associated with, within the areaof the sample covered by indents.
Results for the cement paste in Fig. 9 were obtainedby using only experimental data considered to be asso-ciated with cement hydration products (i.e., in the rangeof 10–40 GPa and 0.1–1.7 GPa for modulus and hard-ness, respectively). It was not difficult to separate thisdata group from the entire data set as the experimental

Fig. 8. Maps of mechanical properties (elastic modulus E and hardnessH) of the test area in granodiorite, together with the correspondingoptical microscopic image.
1195W. Zhu et al. / Materials Characterization 58 (2007) 1189–1198
E andH values associated with the unhydrated/partially-hydrated clinker phases were much higher and no sig-nificant overlapping for the two data groups was present.As shown in Fig. 9, two modal normal distributioncurves could be used to produce a good fit to the expe-rimental data. Analysis by SEM-BSE and EDS alongwith comparison with the modulus and hardness maps,allowed a further corroboration to be made between the
two main hydration products; low density and highdensity calcium silicate hydrates (i.e. LD-CSH andHD-CSH), and the modelled curves. The mechanicalproperty values extracted for the two phases are in verygood agreement with the values reported by Constan-tinides et al. [5] (e.g. ELD-CSH=21.7±2.2 GPa, andEHD-CSH=29.4±2.4 GPa) and by Acker [15] (e.g.ELD-CSH=20±2 GPa, and EHD-CSH=31±4 GPa). Thisfurther supports the argument that the elastic proper-ties of the two types of CSH are intrinsic to cementpaste [5].
Fig. 10 shows the experimental data and the modelfitting curves as well as mechanical properties extractedfor the individual mineral phases identified for thequartzite specimen. Clearly, three model normal distri-bution curves are required to produce the best fit to theexperimental data. SEM-BSE and EDX analysis furtheridentified three mineral phases present in the tested areaas Albite, Orthoclase and Quartz. Thus, the E and Hvalues extracted from the fitting curves could be linkedwith the individual mineral phases present, as shown inFig. 10. Broz et al. [7] has reported E and H values oforthoclase and quartz obtained by carrying out micro/nanoindentation testing of specially prepared purephases of such minerals. For the orthoclase mineraltheir reported E and H values are 89.2±7.1 GPa and9.11±0.58 GPa, respectively. For the quartz mineral,their reported E and H values are 117.6±2.7 GPa and14.54±0.42 GPa, respectively. It is interesting to notethat the E and H values for orthoclase in the quartzitesample (as determined in this study) are in excellentagreement with those reported. For quartz, the agree-ment of our values and the reported values is reasonable,but not as good as in the case for orthoclase. It isbelieved that different crystal orientations of the anisotropic minerals tested might have contributed suchdifferences in properties.
Similar to the quartzite sample, three model normaldistribution curves were also used to fit the experimen-tal data for the granodiorite sample. The three mineralphases identified in the test area and their E and Hvalues extracted from model fits are shown in Fig. 11.There is clearly no quartz present in the area of thegranodiorite sampled. There is a mineral with low Eand H values (59.2±8.1 and 3.3±0.6 GPa, respective-ly) which is identified by BSE and EDS analysis as aMg/Fe-containing muscovite. The third model curve isfitted to values of E and H of 91.6±6.5 and 8.6±1.1,and this can be correlated through the images andmechanical property maps to be oligoclase feldspar.The middle values of modulus fit a curve with valuesof E and H of 77.6±5.1 and 5.8±0.9. Comparing the

Fig. 9. Mechanical property frequency histograms for test results of cement hydrates, together with the E and H values extracted from model fits forthe individual hydrate phases identified.
1196 W. Zhu et al. / Materials Characterization 58 (2007) 1189–1198
mechanical property maps and the BSE images of thegranodiorite sample, it is apparent that this middle valuecurve represents values from indents formed feldsparcrystals with a significant intergrowth of muscovite.Many indents can be seen to impact at the interfacebetween these two minerals. It is possible also to arguethat the property values presented for the intermediatevalue curve appear to sit midway between the puremineral phases, though it would not be possible toconfirm the quantitative nature of the mixing effectwithout further analysis.
Fig. 10. Mechanical property frequency histograms for test results of quartzindividual mineral phases identified.
3.3. General discussion
With the use of the progressive multistep indentationtests (five cycles in this study), five sets of modulus andhardness values were obtained at each test point ( eachone at a different depth). This made it possible to assessthe effect of indentation depth or length scale (i.e.,size effect) on measured properties. Determination ofmechanical properties at reduced indentation depthwould potentially allow the use of smaller indent spacingand higher spatial resolution in test/mapping. The results
ite, together with the E and H values extracted from model fits for the

Fig. 11. Mechanical property frequency histo grams for test results of granodiorite, together with the E and H values extracted from model fits for theindividual mineral phases identified.
1197W. Zhu et al. / Materials Characterization 58 (2007) 1189–1198
obtained from this study, however, appeared to show thatat the smaller indentation depths of∼100 nm both E andH values were significantly affected by the surfaceroughness of the specimen and showed much increasedvariations, particularly for the cement sample. Therefore,the specimen preparation for such materials may have tobe improved if indentation depths smaller than 100 nmare required. Currently, with the available instrument andthe use of the steep conical indenter, the minimum indentspacing possible is probably 3–4 μm. For materials withrelatively large grain size, such as quartzite andgranodiorite used in this study, the results appeared toshow very small variations in properties within the samemineral grain. Thus, an increase of indent spacing forsuch materials may be more beneficial as for the samenumber of indents it would allow a larger, more rep-resentative surface area to be studied/mapped. Furtherwork is clearly required in this aspect.
The creation of maps of mechanical properties usingnanoindentation can be useful in many applications. Asin this study, it can be used on materials with differentphases to study the intrinsic properties of each com-ponent. It is also valuable to study the interaction andproperties of the bond and interfacial regions of differ-ent phases. Furthermore, mechanical property maps andtheir improved link with microstructural features cansignificantly support realistic image-based modelling.
However, the mapping method interpolates contoursand implies intermediate values in areas away from thepoints of testing. It has been shown that minerals,especially in some natural rocks with a relatively large
grain size, will have consistent values within grainboundaries, though not in all cases. This means that it islikely that the interpolated, contoured values shown onthe mechanical property maps are artefacts of interpre-tation and do not necessarily (and probably do not)represent the real distribution of properties at a highersampling resolution. Minerals are mostly discretegranular entities within materials. Correct modelling ofproperties that utilises indentation mapping requiresa higher resolution of spatial information to remainaccurate. This emphasises the need for detailed, thor-ough microscopy to accompany and corroborate theindentation mapping. With further work (perhaps in-cluding targeted indentations on minerals, in addition togrid-like sampling) it should be possible to establish amethod to map properties to a high resolution, and up tothe interfaces between grains. The interfaces betweenmineral grains within composite materials are central toan understanding of the physical and mechanicalbehaviour of bulk materials, and should properly be anarea of study using the indentation method.
Values for intrinsic mechanical properties, such ashardness and elastic modulus, of individual phases incementitious and geo-materials have particular relevancein construction, geology and materials research. Forexample, weathering and degradation of cementitiousand geo-materials have significant impact on durabilityof buildings/infrastructures and conservation of histor-ical monuments. However, the relationships betweenchemical, biological and physical weathering/degrada-tion of these materials and the mechanical properties of

1198 W. Zhu et al. / Materials Characterization 58 (2007) 1189–1198
the specific constituent phases responsible are poorlyunderstood. The high spatial resolution of the nanoin-dentation method appears to be ideally suited to the studyof the fundamental behavioural factors related tomaterial durability and deformation (e.g., creep andshrinkage) at the macroscale.
4. Conclusions
1. The results of this study showed that the mapping ofmechanical properties of cement paste and naturalquartzite and granodiorite samples by nanoindenta-tion is feasible and can be related to microscopicinformation. Results from such tests can also be usedto study the intrinsic properties of each component,as well as the interaction and properties of theinterfacial regions of different phases for materialswith different phases. Potentially, the mechanicalproperty maps can be very useful in supportingrealistic image-based modelling.
2. Further work is, however, required to study theeffect of the indent size and spacing so that optimumselection of these parameters could be made for thespecific material in order to study a representativematerials area and volume, and to provide mechan-ical property maps with high spatial resolution.
3. The values of Young's modulus and hardness of theindividual hydrate and mineral phases determinedby the statistical method appeared to be in goodagreement with the limited published data.
Acknowledgements
The authors acknowledge the financial support fromUK engineering and physical sciences research council(EPSRC) for establishing the inter-university Centre forMicrostructural Modelling and Characterisation ofCementitious Materials. Margaret Corrigan, SEMMicroscopist (University of Paisley), is thanked forher assistance in obtaining the SEM micrographs.
References
[1] ZhuW, Bartos PJM. Assessment of interfacial microstructure andbond properties in aged GRC using a novel micro indentationmethod. Cem Concr Res 1997;27(11):1701–11.
[2] Trtik P, Bartos PJM. Micromechanical properties of cementitiouscomposites. Mat Struct 1999;32:388–93.
[3] Zhu W, Bartos PJM. Application of depth-sensing microindenta-tion testing to study of interfacial transition zone in reinforcedconcrete. Cem Concr Res 2000;30:1299–304.
[4] Velez K, Maximilien S, Damidot D, Fantozzi G, Sorrentino F.Determination by nanoindentation of elastic modulus andhardness of pure constituents of Portland cement clinker. CemConcr Res 2001;31:555–61.
[5] Constantinides G, Ulm FJ, Van Vliet K. On the use ofnanoindentation for cementitious materials. Mat Struct 2003;36:191–6.
[6] Hughes JJ, Trtik P. Micro-mechanical properties of cement pastemeasured by depth-sensing nanoindentation: a preliminarycorrelation of physical properties with phase type. Mater Charact2004;53:223–31.
[7] Broz ME, Cook RF, Whitney DL. Micro hardness, toughness,and modulus of Mohs scale minerals. Am Mineral 2006;91:135–42.
[8] Engquist H, Wiklund U. Mapping of mechanical properties ofWC-Co using nanoindentation. Tribol Lett 2002;8:147–52.
[9] Cuy JL, Mann AB, Livi KJ, Teaford MF, Weihs TP.Nanoindentation mapping of the mechanical properties ofhuman molar tooth enamel. Arch Oral Biol 2002;47:281–91.
[10] Balooch G, Marshall GW, Warren OL, Asif SAS, Balooch M.Evaluation of a new modulus mapping technique to investigatemicrostructural features of human teeth. J Biomech 2004;37:1223–32.
[11] Park RG, Stewart AD, Wright DT. The Hebridean terrane. In:Trewin NH, editor. The Geology of Scotland. 4th Edition. TheGeological Society; 2002.
[12] Oliver WC, Pharr GM. An improved technique for determininghardness and elastic modulus using load and displacementsensing indentation experiments. J Mater Res 1992;7:1564–79.
[13] Fischer-Cripps AC. Nanoindentation, mechanical engineeringseries. Springer-Verlag New York, Inc.; 2002.
[14] Shuman DJ, Costa ALM, Andrade MS. Calculating the elasticmodulus from nanoindentation and microindentation reloadcurves, Mater Charact in press.
[15] Acker P. Micromechanical analysis of creep and shrinkagemechanisms. In: Ulm FJ, Bazant ZP, Wittmann FH, editors.Creep, shrinkage and durability mechanics of concrete and otherquasi-brittle materials, Cambridge, MA. Oxford, UK: Elsevier;August 2001.
Copyright © 2022 FDOKUMEN