about jk cement limited
40
• R Durgaram (Sr. GM) – Lead Presenter • Ajay Kulkarni • Shubham Ambure
-
Upload
khangminh22 -
Category
Documents
-
view
2 -
download
0
Transcript of about jk cement limited
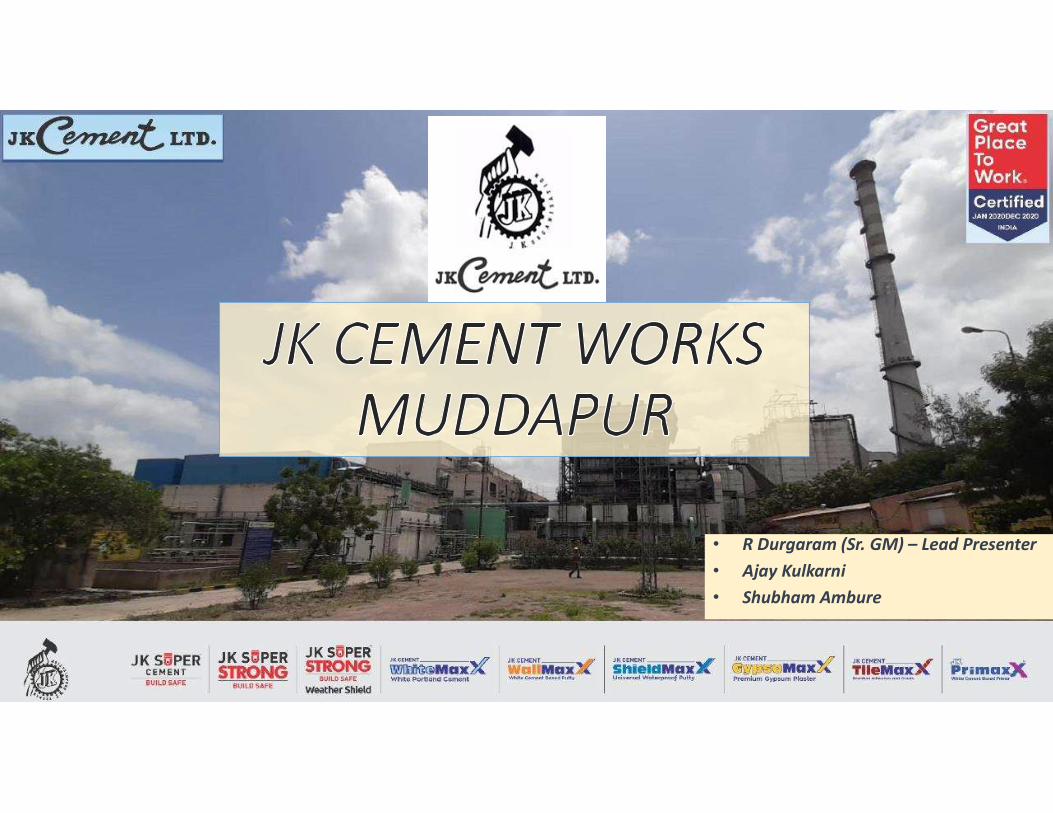
• R Durgaram (Sr. GM) – Lead Presenter• Ajay Kulkarni• Shubham Ambure
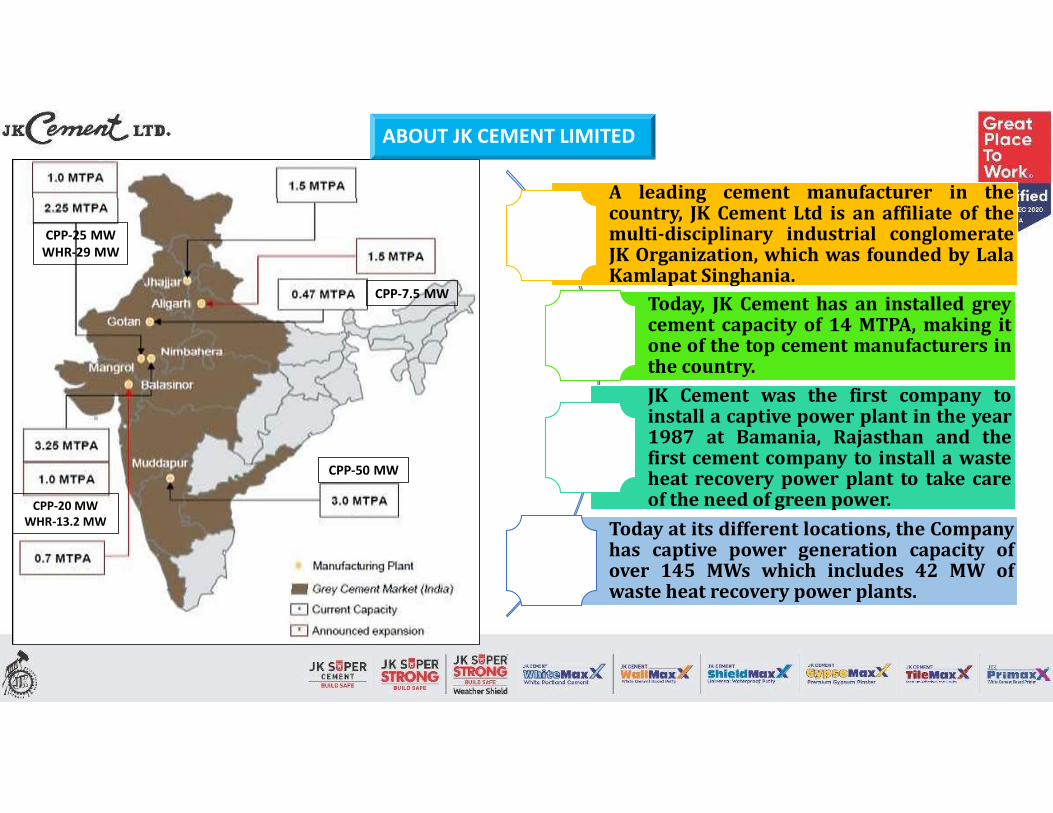
CPP-50 MW
CPP-25 MWWHR-29 MW
CPP-20 MWWHR-13.2 MW
CPP-7.5 MW
A leading cement manufacturer in thecountry, JK Cement Ltd is an affiliate of themulti-disciplinary industrial conglomerateJK Organization, which was founded by LalaKamlapat Singhania.
Today, JK Cement has an installed greycement capacity of 14 MTPA, making itone of the top cement manufacturers inthe country.JK Cement was the first company toinstall a captive power plant in the year1987 at Bamania, Rajasthan and thefirst cement company to install a wasteheat recovery power plant to take careof the need of green power.
Today at its different locations, the Companyhas captive power generation capacity ofover 145 MWs which includes 42 MW ofwaste heat recovery power plants.
ABOUT JK CEMENT LIMITED
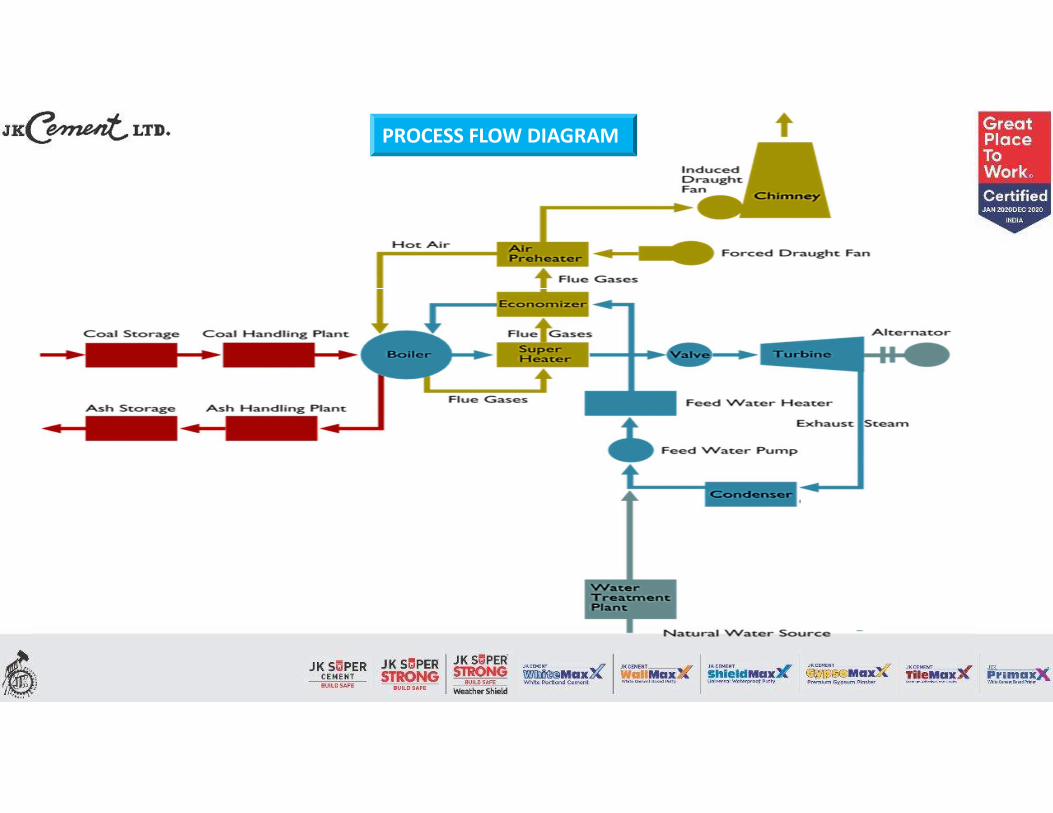
PROCESS FLOW DIAGRAM
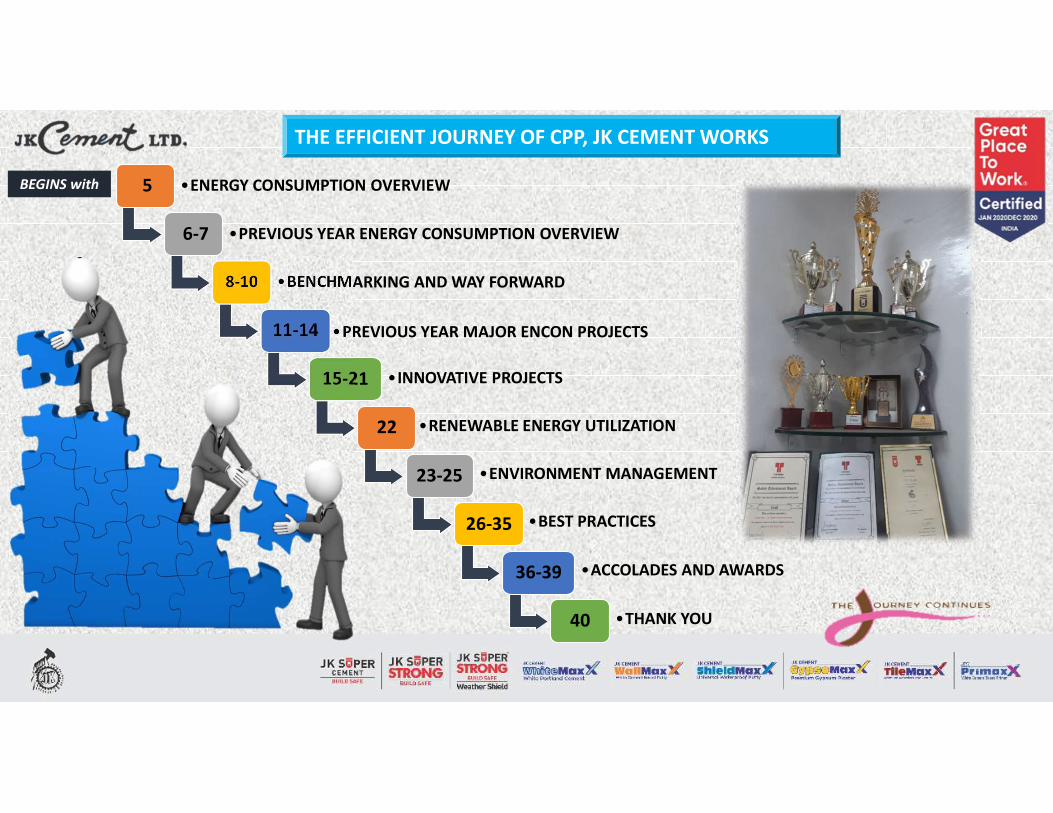
5 •ENERGY CONSUMPTION OVERVIEW
6-7 •PREVIOUS YEAR ENERGY CONSUMPTION OVERVIEW
8-10 •BENCHMARKING AND WAY FORWARD
11-14 •PREVIOUS YEAR MAJOR ENCON PROJECTS
15-21
22
23-25
26-35
36-39
THE EFFICIENT JOURNEY OF CPP, JK CEMENT WORKS
•INNOVATIVE PROJECTS
•RENEWABLE ENERGY UTILIZATION
•ENVIRONMENT MANAGEMENT
•BEST PRACTICES
•ACCOLADES AND AWARDS
•THANK YOU
BEGINS with
40

PERFORMANCE UNIT 2019-20 2020-21 (July’20)
ANNUAL GENERATION KWH 111502740 25127410
AVG. AUX. CONSUMPTION % 7.57 7.83
PLANT AVAILABILITY FACTOR (PAF) % 99.91 99.85
PLANT LOAD FACTOR (PLF) % 79.5 81.2
GROSS HEAT RATE Kcal/KWH 3621 3452
DM WATER CONSUMPTION 𝐌𝟑 4208 1747
RAW WATER CONSUMPTION 𝐌𝟑 43158 13325
ENERGY CONSUMPTION OVERVIEW
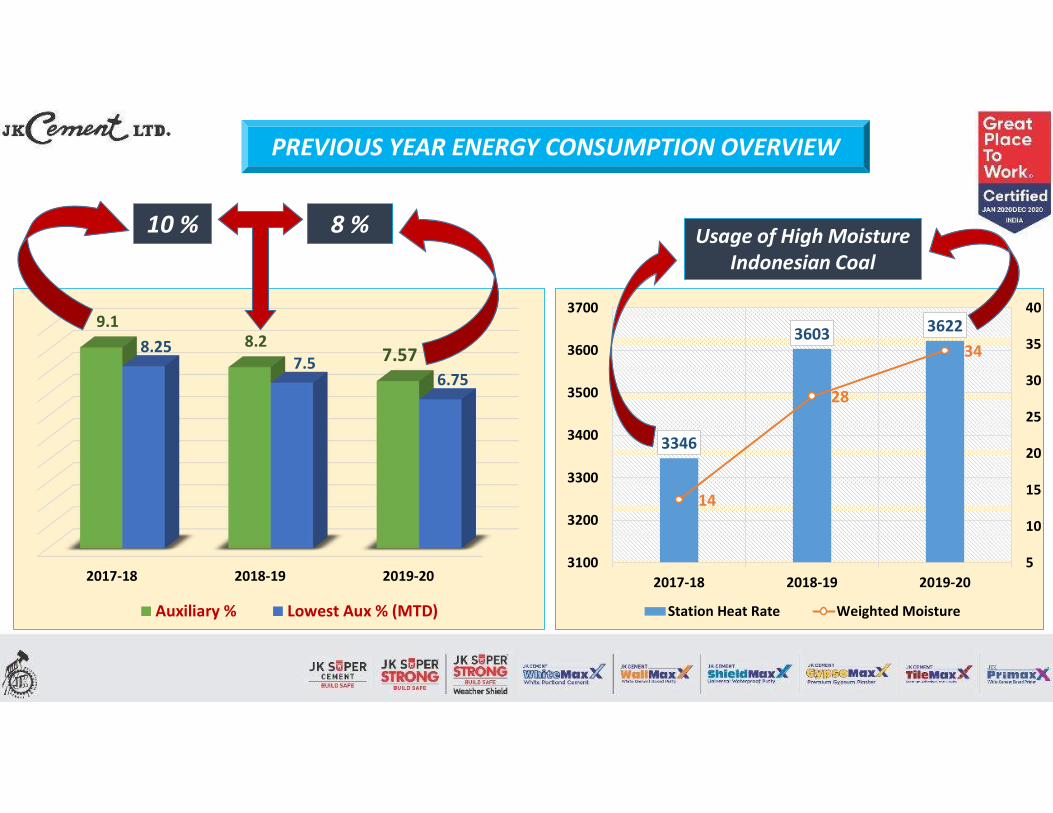
2017-18 2018-19 2019-20
9.18.2
7.578.257.5
6.75
Auxiliary % Lowest Aux % (MTD)
3346
3603 3622
14
28
34
5
10
15
20
25
30
35
40
3100
3200
3300
3400
3500
3600
3700
2017-18 2018-19 2019-20
Station Heat Rate Weighted Moisture
10 % 8 % Usage of High Moisture Indonesian Coal
PREVIOUS YEAR ENERGY CONSUMPTION OVERVIEW

2017-18 2018-19 2019-20
81.4
83.4
79.5
PLANT LOAD FACTOR %
97
98
99
100
101
2017-18 2018-19 2019-20
98.6
99.96 99.91
PLANT AVAILABILITY FACTOR %
PREVIOUS YEAR ENERGY CONSUMPTION OVERVIEW

VisionTarget
PlanExecution
Success
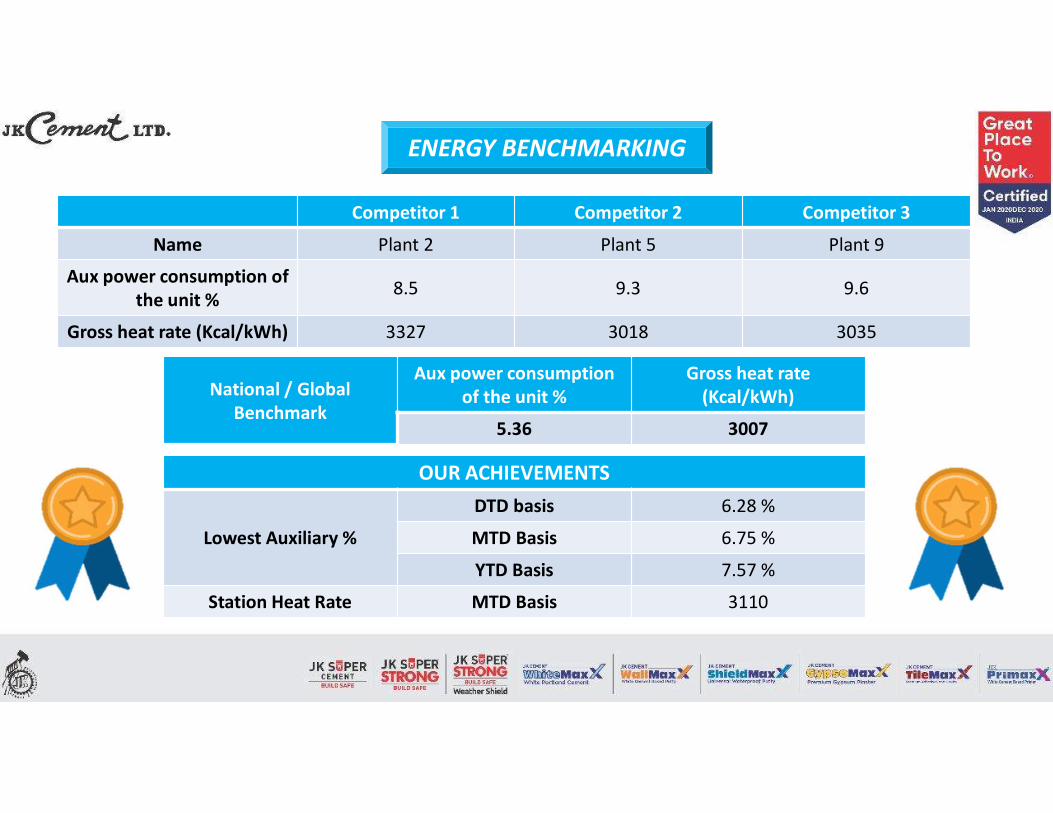
ENERGY BENCHMARKING
Competitor 1 Competitor 2 Competitor 3
Name Plant 2 Plant 5 Plant 9
Aux power consumption of the unit % 8.5 9.3 9.6
Gross heat rate (Kcal/kWh) 3327 3018 3035
National / Global Benchmark
Aux power consumption of the unit %
Gross heat rate (Kcal/kWh)
5.36 3007
OUR ACHIEVEMENTS
Lowest Auxiliary %
DTD basis 6.28 %
MTD Basis 6.75 %
YTD Basis 7.57 %
Station Heat Rate MTD Basis 3110
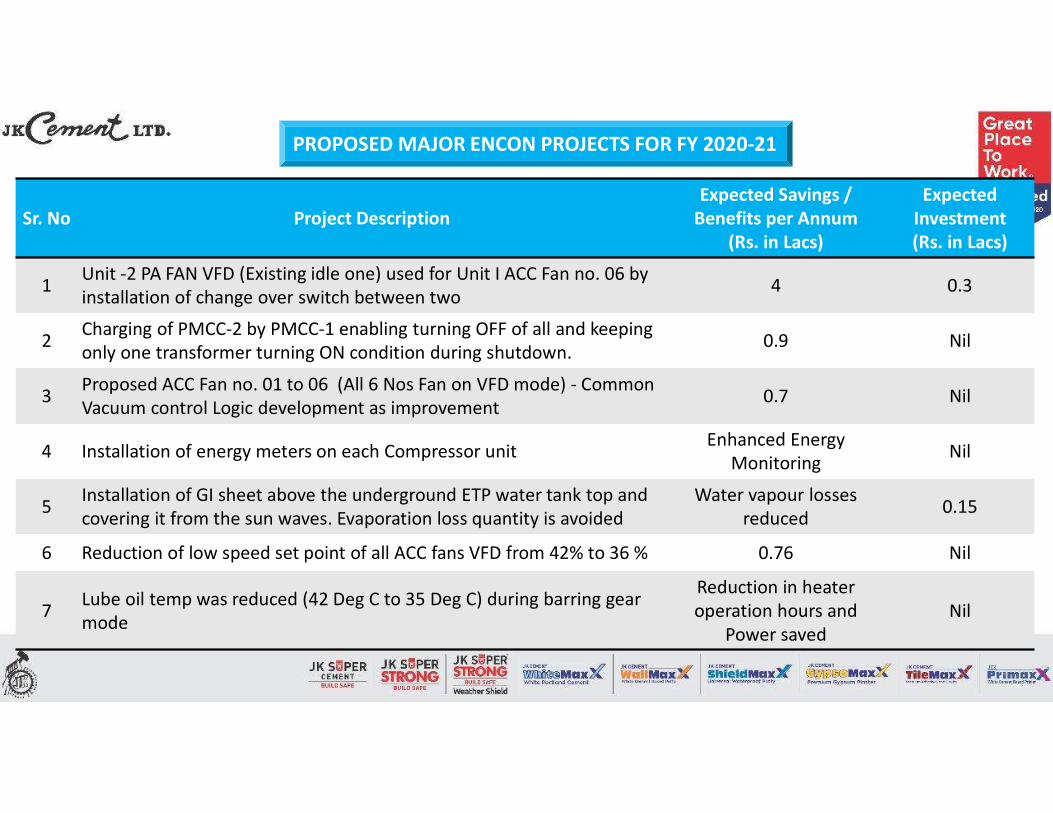
PROPOSED MAJOR ENCON PROJECTS FOR FY 2020-21
Sr. No Project DescriptionExpected Savings /
Benefits per Annum(Rs. in Lacs)
Expected Investment(Rs. in Lacs)
1 Unit -2 PA FAN VFD (Existing idle one) used for Unit I ACC Fan no. 06 by installation of change over switch between two 4 0.3
2 Charging of PMCC-2 by PMCC-1 enabling turning OFF of all and keeping only one transformer turning ON condition during shutdown. 0.9 Nil
3 Proposed ACC Fan no. 01 to 06 (All 6 Nos Fan on VFD mode) - Common Vacuum control Logic development as improvement 0.7 Nil
4 Installation of energy meters on each Compressor unit Enhanced Energy Monitoring Nil
5 Installation of GI sheet above the underground ETP water tank top and covering it from the sun waves. Evaporation loss quantity is avoided
Water vapour losses reduced 0.15
6 Reduction of low speed set point of all ACC fans VFD from 42% to 36 % 0.76 Nil
7 Lube oil temp was reduced (42 Deg C to 35 Deg C) during barring gear mode
Reduction in heater operation hours and
Power savedNil

ENCON PROJECTS SUMMARY
Year No. of Projects Implemented
Total Investment(Rs. in Lacs)
Total Savings (Rs. in Lacs)
2017-18 14 111 42
2018-19 24 36 101
2019-20 25 122(0.15% of turnover) 139
1424 25
42
101
139
111
36
1229.1
8.2 7.57
6
7
8
9
10
0
50
100
150
2017-18 2018-19 2019-20No. of Projects Implemented Total Savings (Rs. in Lacs) Total Investment (Rs. in Lacs) Auxiliary %
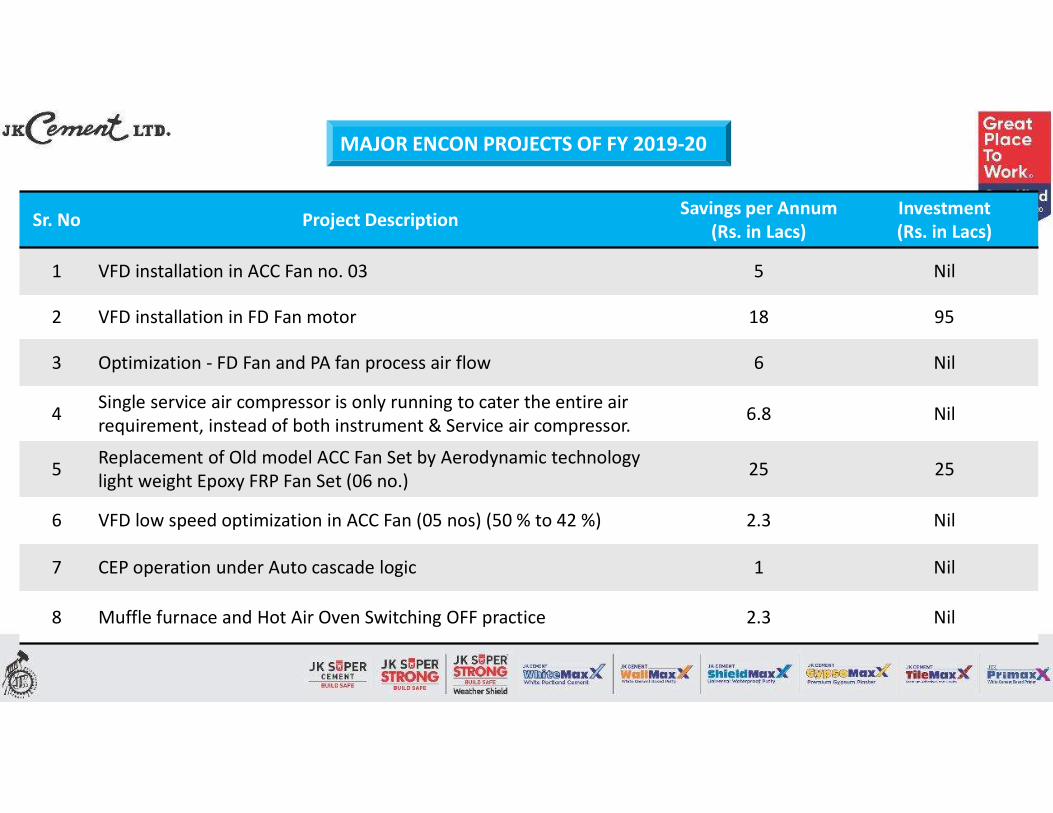
MAJOR ENCON PROJECTS OF FY 2019-20
Sr. No Project Description Savings per Annum(Rs. in Lacs)
Investment(Rs. in Lacs)
1 VFD installation in ACC Fan no. 03 5 Nil
2 VFD installation in FD Fan motor 18 95
3 Optimization - FD Fan and PA fan process air flow 6 Nil
4 Single service air compressor is only running to cater the entire air requirement, instead of both instrument & Service air compressor. 6.8 Nil
5 Replacement of Old model ACC Fan Set by Aerodynamic technology light weight Epoxy FRP Fan Set (06 no.) 25 25
6 VFD low speed optimization in ACC Fan (05 nos) (50 % to 42 %) 2.3 Nil
7 CEP operation under Auto cascade logic 1 Nil
8 Muffle furnace and Hot Air Oven Switching OFF practice 2.3 Nil

Sr. No Project Description Savings per Annum(Rs. in Lacs)
Investment(Rs. in Lacs)
1 Replacement of ACW old pump (110 KW) by new energy efficient pump (75KW) and also VFD interchanged. 6 0.4
2 Replacement of the existing Attemperator control valve by latest designed one (Feed water line) in Boiler No.1 10.4 2
3 Installation of VFD For Unit I ACC Fans (4 No’s) 18 18
4ECO/APH ash conveying system discharge has been taken into Boiler-I, instead of ASH SILO as a recycling method and noticed LOI reduction in fly ash.
22 1
5 Installation of new ARC Valve in Boiler feed pump 5.4 6
6 Installation of Turbo Ventilator in TG hall roof. 2.5 1.5
7 Turning off 3 no. of LT Transformer during the plant shutdown 1.6 Nil
MAJOR ENCON PROJECTS OF FY 2018-19
Sr. No Project Description Savings per Annum(Rs. in Lacs)
Investment(Rs. in Lacs)
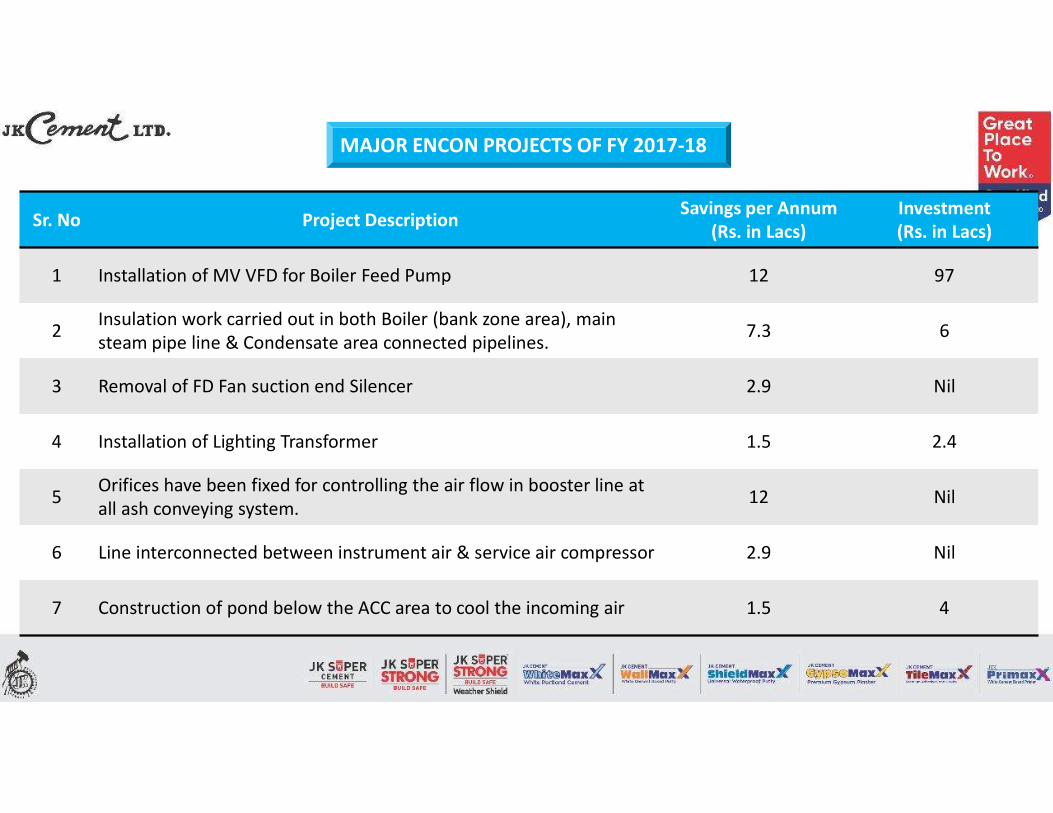
1 Installation of MV VFD for Boiler Feed Pump 12 97
2 Insulation work carried out in both Boiler (bank zone area), main steam pipe line & Condensate area connected pipelines. 7.3 6
3 Removal of FD Fan suction end Silencer 2.9 Nil
4 Installation of Lighting Transformer 1.5 2.4
5 Orifices have been fixed for controlling the air flow in booster line at all ash conveying system. 12 Nil
6 Line interconnected between instrument air & service air compressor 2.9 Nil
7 Construction of pond below the ACC area to cool the incoming air 1.5 4
MAJOR ENCON PROJECTS OF FY 2017-18

Reduction in Free Cost Export Power
LOI reduction - By High LOI ash refeeding into
furnace
LOI Reduction - High LOI Pond ash mixing with
High moisture Indonesian coal and refeeding
INNOVATIVE PROJECTS

Problem Description:
During CPP operation with Grid on synchronisation mode, good amount of CPP power was injecting towardsGrid as free cost export power due to load fluctuations.
Constraints during Island operation:
As mentioned the STG was operated most of the time on an island mode only. STG has to be synched withgrid for the certain conditions like:
Starting major HT drive (Fan/Mill) to accommodate the sharp increase in load
CPP side abnormal conditions and coal feeding issues due to high moisture/wet/rain.
Load fluctuations due to sudden plant equipment tripping
Development of New Solution:
As demonstrated, above the export power was still too high like 78 MWH in one month. So, to reduce thefree cost export power further, Export Control Logic was made (In-house) and implemented. This logicgradually reduces the free cost export power to zero during synch time automatically.
REDUCTION IN FREE COST EXPORT POWER
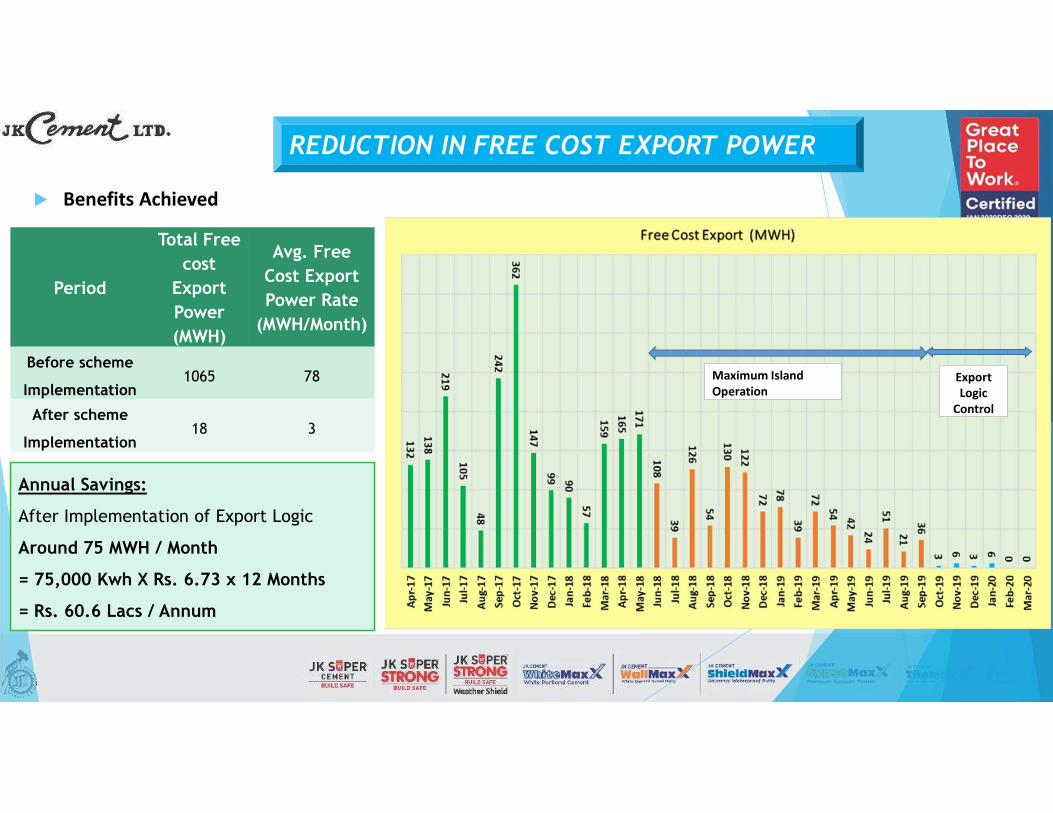
REDUCTION IN FREE COST EXPORT POWER
Maximum Island Operation
Export Logic
Control
Period
Total Free cost
Export Power (MWH)
Avg. Free Cost Export Power Rate
(MWH/Month)
Before scheme
Implementation1065 78
After scheme
Implementation18 3
Annual Savings:
After Implementation of Export Logic
Around 75 MWH / Month
= 75,000 Kwh X Rs. 6.73 x 12 Months
= Rs. 60.6 Lacs / Annum
Benefits Achieved
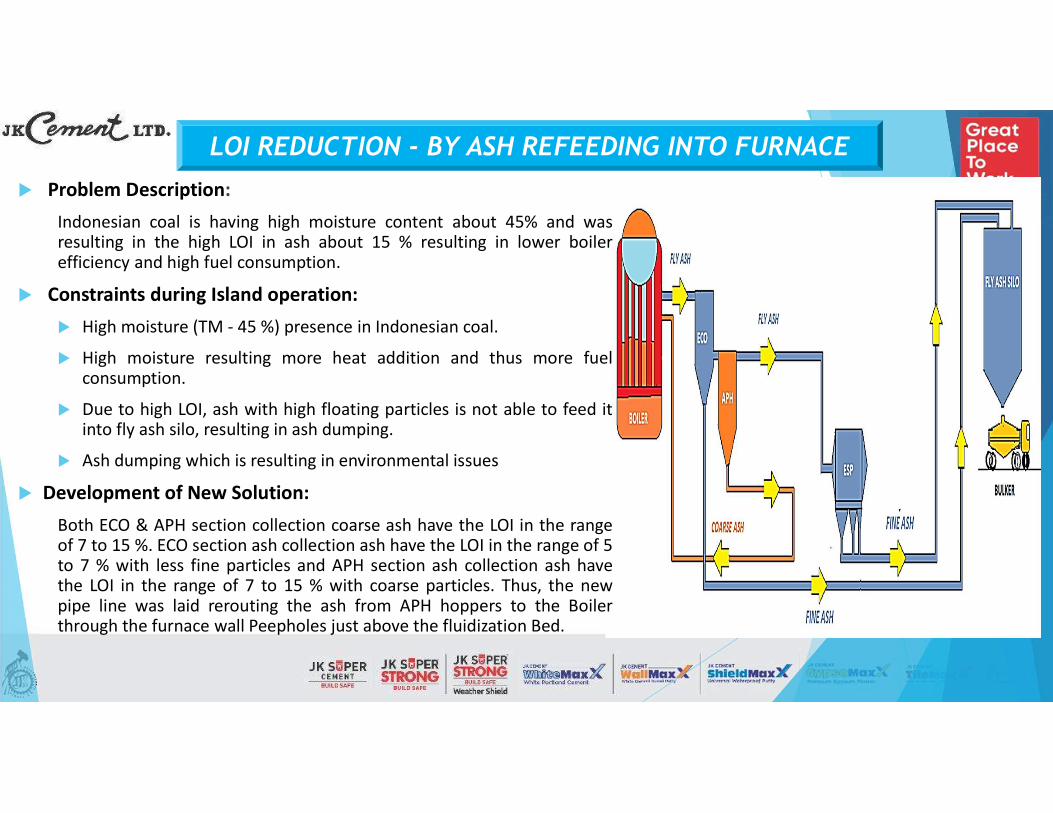
LOI REDUCTION - BY ASH REFEEDING INTO FURNACE
Problem Description:Indonesian coal is having high moisture content about 45% and wasresulting in the high LOI in ash about 15 % resulting in lower boilerefficiency and high fuel consumption.
Constraints during Island operation: High moisture (TM - 45 %) presence in Indonesian coal.
High moisture resulting more heat addition and thus more fuelconsumption.
Due to high LOI, ash with high floating particles is not able to feed itinto fly ash silo, resulting in ash dumping.
Ash dumping which is resulting in environmental issues
Development of New Solution:Both ECO & APH section collection coarse ash have the LOI in the rangeof 7 to 15 %. ECO section ash collection ash have the LOI in the range of 5to 7 % with less fine particles and APH section ash collection ash havethe LOI in the range of 7 to 15 % with coarse particles. Thus, the newpipe line was laid rerouting the ash from APH hoppers to the Boilerthrough the furnace wall Peepholes just above the fluidization Bed.

Benefits Achieved
LOI REDUCTION - BY ASH REFEEDING INTO FURNACE
Savings – LOI ReductionParameter UOM Values
Reduction in LOI % 9Reduction in fuel consumption
TPD 2
Cost of fuel (Indonesian) Rs/MT 4600
Total savings cost Rs/Year Rs. 20,70,000CPP run days Days/Year 225Cost of Required Pipelines
Rs Rs. 1,00,000
Payback Period Months 1.0
Particulars UOM Value
GCV of the coal Kcal/kg 3400
Coal consumption per day MT 550
LOI of the Ash Before % 15
LOI of the Ash After % 6
GCV of the ash before Kcal/kg 500
GCV of the ash after Kcal/kg 200
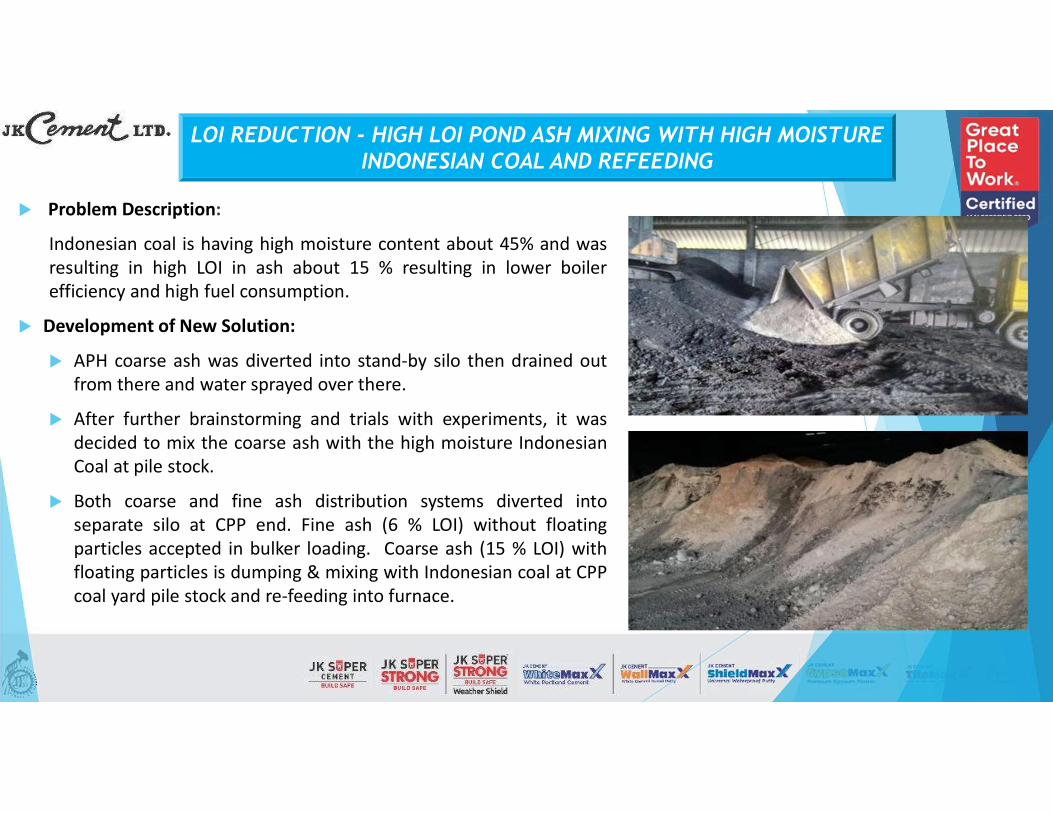
LOI REDUCTION - HIGH LOI POND ASH MIXING WITH HIGH MOISTURE INDONESIAN COAL AND REFEEDING
Problem Description:
Indonesian coal is having high moisture content about 45% and wasresulting in high LOI in ash about 15 % resulting in lower boilerefficiency and high fuel consumption.
Development of New Solution:
APH coarse ash was diverted into stand-by silo then drained outfrom there and water sprayed over there.
After further brainstorming and trials with experiments, it wasdecided to mix the coarse ash with the high moisture IndonesianCoal at pile stock.
Both coarse and fine ash distribution systems diverted intoseparate silo at CPP end. Fine ash (6 % LOI) without floatingparticles accepted in bulker loading. Coarse ash (15 % LOI) withfloating particles is dumping & mixing with Indonesian coal at CPPcoal yard pile stock and re-feeding into furnace.

LOI REDUCTION - HIGH LOI POND ASH MIXING WITH HIGH MOISTURE INDONESIAN COAL AND REFEEDING
Savings – LOI Reduction
Based on fuel
Parameter UOM Values
Reduction in LOI % 9
Reduction in fuel consumption
TPD 2
Cost of fuel (Indonesian) Rs/MT 4600
Thermal savings costRs /
AnnumRs. 20,70,000
CPP run daysDays / Annum
225
Benefits Achieved
Particulars UOM Value
GCV of Indonesian coal Kcal/kg 3400
Coal consumption per day
MT 550
LOI of the Ash Before % 15
LOI of the Ash After % 6
GCV of the ash before Kcal/kg 500
GCV of the ash after Kcal/kg 200
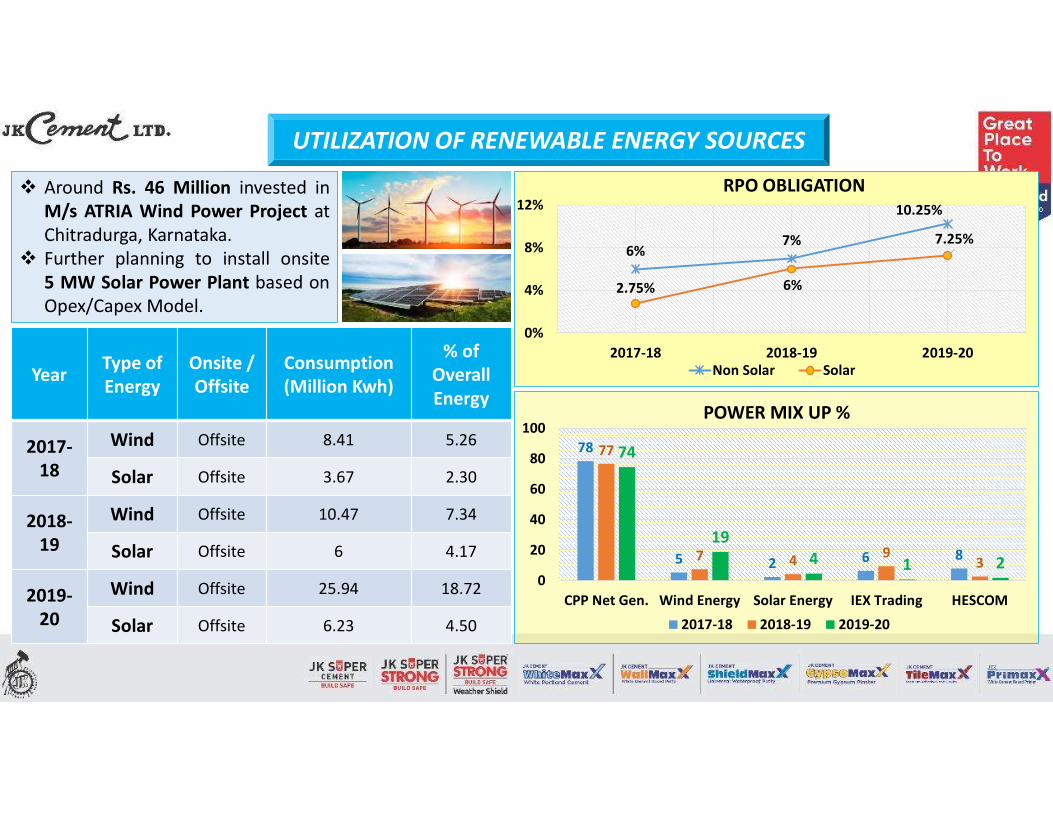
Year Type of Energy
Onsite / Offsite
Consumption (Million Kwh)
% of Overall Energy
2017-18
Wind Offsite 8.41 5.26
Solar Offsite 3.67 2.30
2018-19
Wind Offsite 10.47 7.34
Solar Offsite 6 4.17
2019-20
Wind Offsite 25.94 18.72
Solar Offsite 6.23 4.50
78
5 2 6 8
77
7 4 93
74
194 1 2
0
20
40
60
80
100
CPP Net Gen. Wind Energy Solar Energy IEX Trading HESCOM
POWER MIX UP %
2017-18 2018-19 2019-20
UTILIZATION OF RENEWABLE ENERGY SOURCES
Around Rs. 46 Million invested inM/s ATRIA Wind Power Project atChitradurga, Karnataka.
Further planning to install onsite5 MW Solar Power Plant based onOpex/Capex Model.
6%7%
10.25%
2.75% 6%
7.25%
0%
4%
8%
12%
2017-18 2018-19 2019-20
RPO OBLIGATION
Non Solar Solar
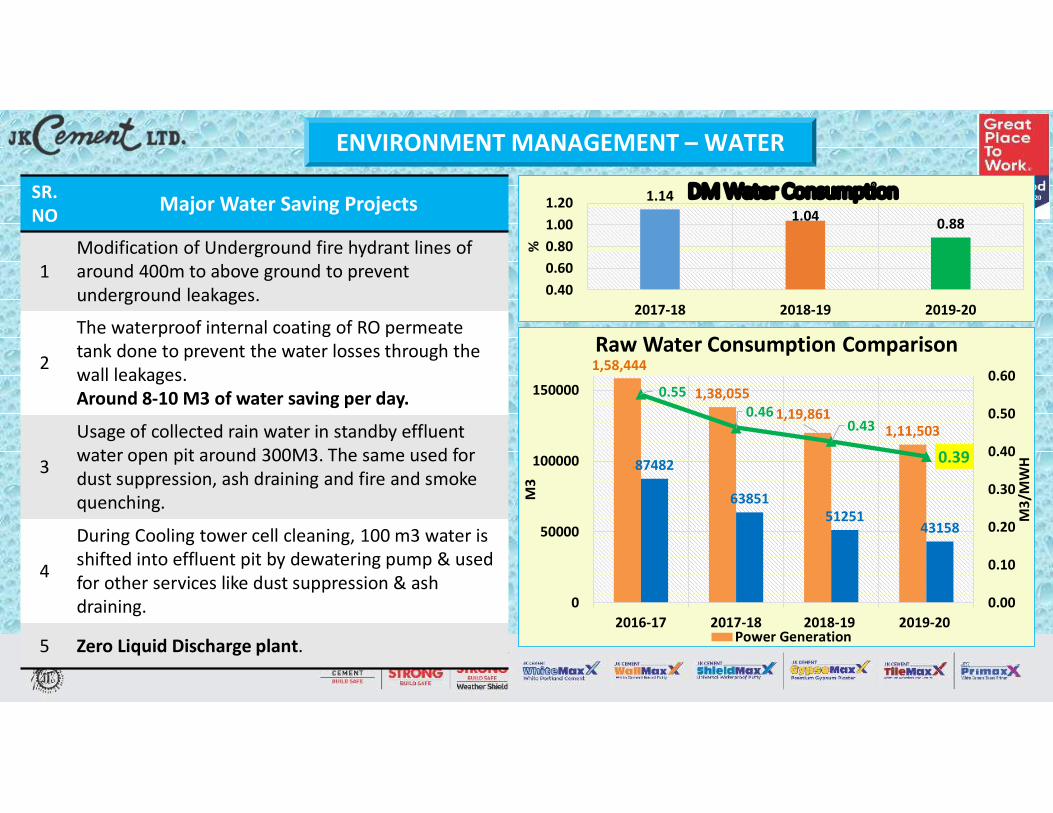
ENVIRONMENT MANAGEMENT – WATER
SR.NO Major Water Saving Projects
1Modification of Underground fire hydrant lines ofaround 400m to above ground to prevent underground leakages.
2
The waterproof internal coating of RO permeate tank done to prevent the water losses through the wall leakages.Around 8-10 M3 of water saving per day.
3
Usage of collected rain water in standby effluent water open pit around 300M3. The same used for dust suppression, ash draining and fire and smoke quenching.
4
During Cooling tower cell cleaning, 100 m3 water is shifted into effluent pit by dewatering pump & used for other services like dust suppression & ash draining.
5 Zero Liquid Discharge plant.
1,58,444
1,38,0551,19,861
1,11,503
87482
6385151251
43158
0.550.46
0.43
0.39
0.00
0.10
0.20
0.30
0.40
0.50
0.60
0
50000
100000
150000
2016-17 2017-18 2018-19 2019-20
M3/
MW
H
M3
Raw Water Consumption Comparison
Power Generation
1.141.04 0.88
0.400.600.801.001.20
2017-18 2018-19 2019-20
%
DM Water Consumption
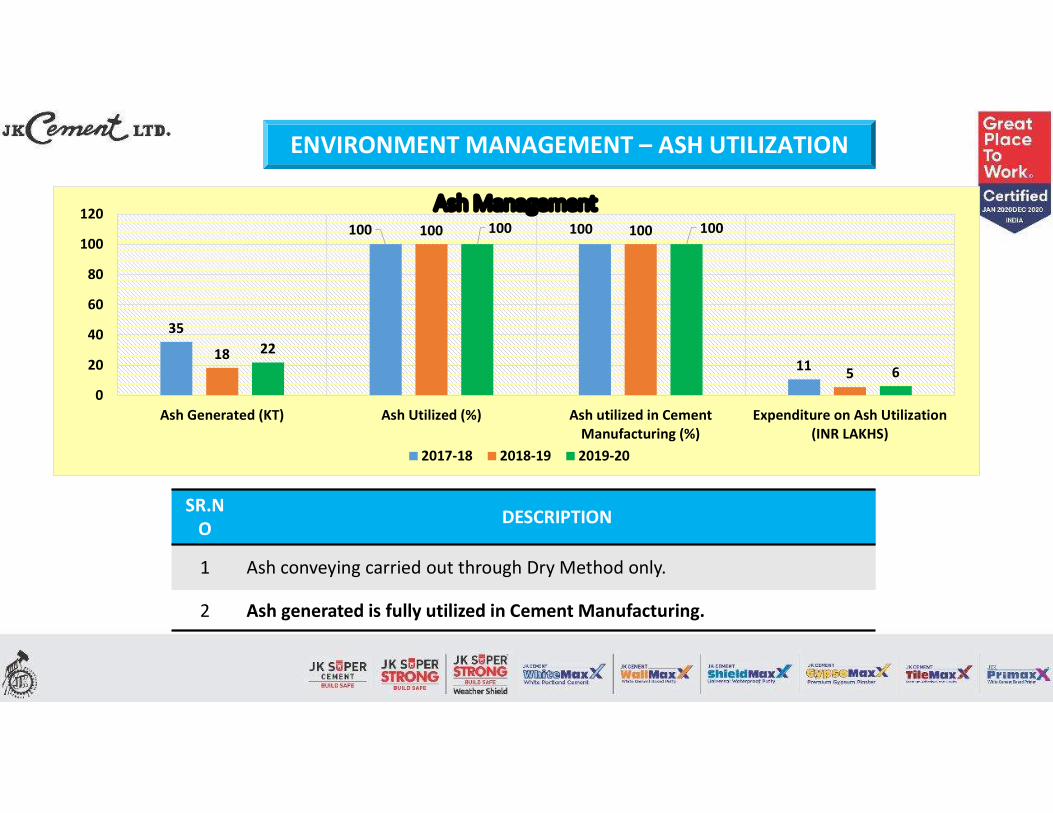
ENVIRONMENT MANAGEMENT – ASH UTILIZATION
SR.NO DESCRIPTION
1 Ash conveying carried out through Dry Method only.
2 Ash generated is fully utilized in Cement Manufacturing.
35
100 100
1118
100 100
5
22
100 100
60
20
40
60
80
100
120
Ash Generated (KT) Ash Utilized (%) Ash utilized in CementManufacturing (%)
Expenditure on Ash Utilization(INR LAKHS)
Ash Management
2017-18 2018-19 2019-20
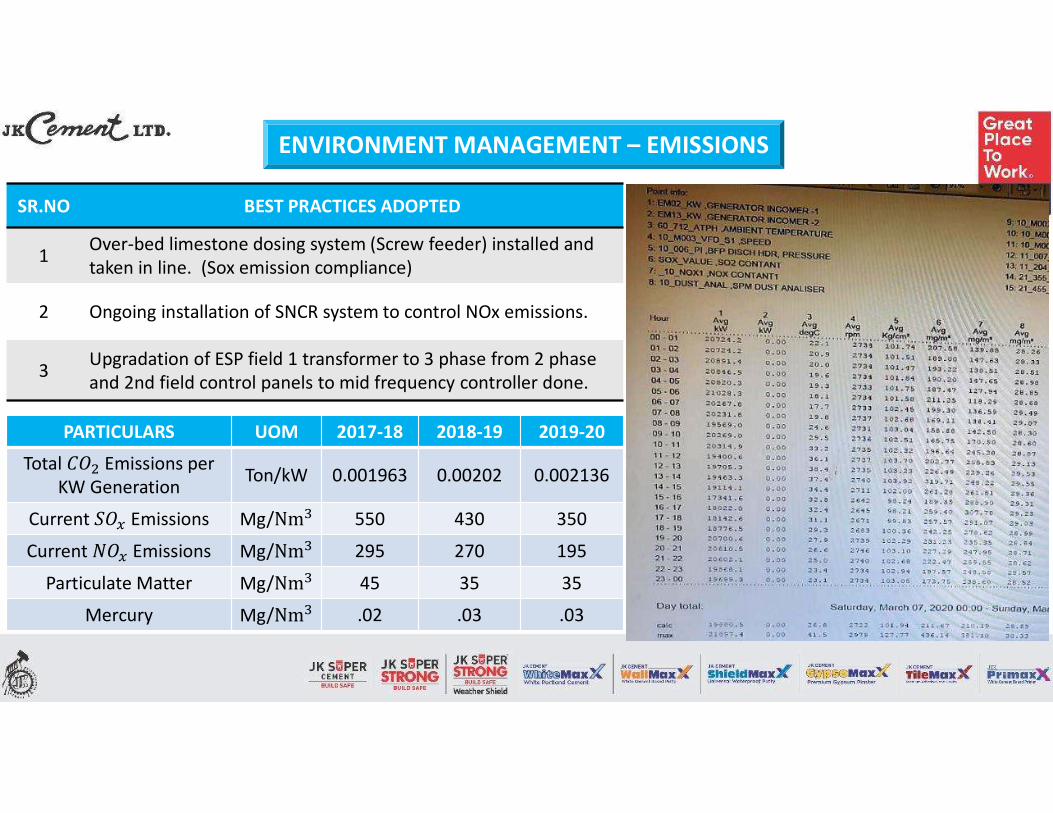
ENVIRONMENT MANAGEMENT – EMISSIONS
SR.NO BEST PRACTICES ADOPTED
1 Over-bed limestone dosing system (Screw feeder) installed and taken in line. (Sox emission compliance)
2 Ongoing installation of SNCR system to control NOx emissions.
3 Upgradation of ESP field 1 transformer to 3 phase from 2 phase and 2nd field control panels to mid frequency controller done.
PARTICULARS UOM 2017-18 2018-19 2019-20
Total 𝐶𝑂 Emissions per KW Generation Ton/kW 0.001963 0.00202 0.002136
Current 𝑆𝑂 Emissions Mg/Nm 550 430 350
Current 𝑁𝑂 Emissions Mg/Nm 295 270 195
Particulate Matter Mg/Nm 45 35 35
Mercury Mg/Nm .02 .03 .03

BEST PRACTICES
BEST PRACTICES – ENERGY MONITORING
Daily Performance Monitoring
Date 01-07-2020 02-07-2020 03-07-2020 04-07-2020 05-07-2020 06-07-2020 07-07-2020 08-07-2020
FUEL - INDIAN COAL 100% 100% 100% 100% 100% 100% 200% 100%
GEN 250.03 280.44 426.69 551.25 558.21 532.72 541.88 487.09
Avg Gen. 10.42 11.69 17.78 22.97 23.26 22.20 22.58 20.30Aux 24.91 24.78 33.70 42.05 43.56 42.13 41.42 37.34Aux 9.96 8.84 7.90 7.63 7.80 7.91 7.64 7.67PLF 41.67 46.74 71.12 91.88 93.04 88.79 90.31 81.18
R.Hrs. 24.00 24.00 24.00 24.00 24.00 24.00 24.00 24.00Ambient Temp 27.90 27.00 26.80 26.10 26.50 26.90 26.40 24.40
ID Fan 0.85 0.82 1.92 2.87 3.03 2.79 2.52 2.28PA Fan 1.15 0.91 1.70 2.07 2.04 2.03 2.05 2.07FD Fan 6.56 6.59 8.64 10.23 10.82 10.89 10.47 9.94
BFP 7.20 7.35 9.70 12.35 12.67 12.05 12.09 11.09
CEP 0.65 0.68 0.79 0.91 0.93 0.91 0.90 0.85ACC 1.05 0.90 2.72 4.27 4.59 4.03 4.06 2.24AHP 1.37 1.52 1.67 1.98 2.03 2.10 2.34 2.16ESP 1.53 1.52 1.58 1.67 2.16 1.92 1.62 1.67CHP 0.73 0.73 0.94 1.16 1.24 1.01 0.99 1.08ACW 1.18 1.17 1.16 1.17 1.21 1.20 1.17 1.17
AC & VENT 0.89 0.90 0.92 0.90 0.89 0.94 1.05 0.96WTP 0.22 0.13 0.16 0.30 0.12 0.17 0.29 0.16
Daily Auxiliary Monitoring

SR.NO DESCRIPTION
1 Technical PD is being conducted on daily basis.
2 ACC fins cleaning by high pressure water jet (Internal & External).
3 Periodical Tripping Interlocks checking during every stoppage.
4 Screen/Crusher inspection in each shift and tunnel cleaning in a week.
5 High LOI fly ash conveying system is being recycled into furnace.
6 SILO fly ash is being mixed up with Indonesian coal at Coal Stock yard.
7 Adopted island operation and reduced unutilised export power. All cement mills manual stop push button on emergency provided to cut off load during island operation.
8 Periodical IR thermography testing of electrical panels and Boiler.
9 Periodical watering at earth pits & checking of earth resistance values.
BEST PRACTICES - OPERATION
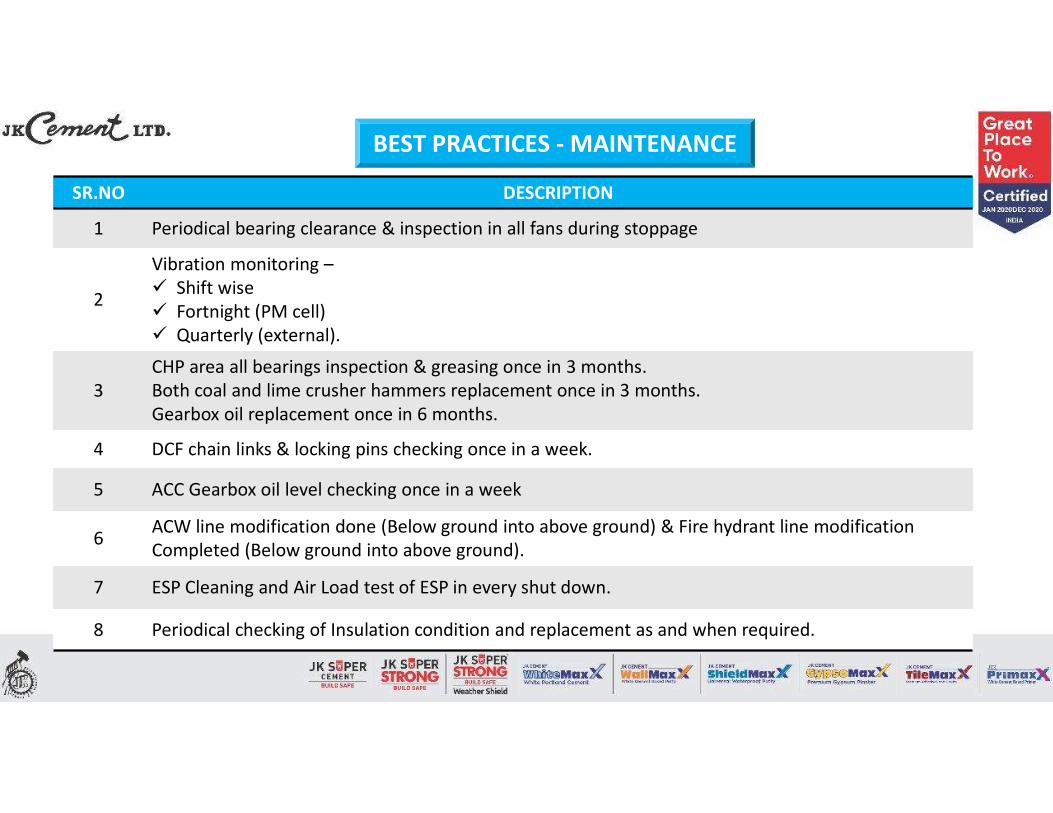
BEST PRACTICES - MAINTENANCE
SR.NO DESCRIPTION
1 Periodical bearing clearance & inspection in all fans during stoppage
2
Vibration monitoring – Shift wise Fortnight (PM cell) Quarterly (external).
3CHP area all bearings inspection & greasing once in 3 months.Both coal and lime crusher hammers replacement once in 3 months.Gearbox oil replacement once in 6 months.
4 DCF chain links & locking pins checking once in a week.
5 ACC Gearbox oil level checking once in a week
6 ACW line modification done (Below ground into above ground) & Fire hydrant line modification Completed (Below ground into above ground).
7 ESP Cleaning and Air Load test of ESP in every shut down.
8 Periodical checking of Insulation condition and replacement as and when required.
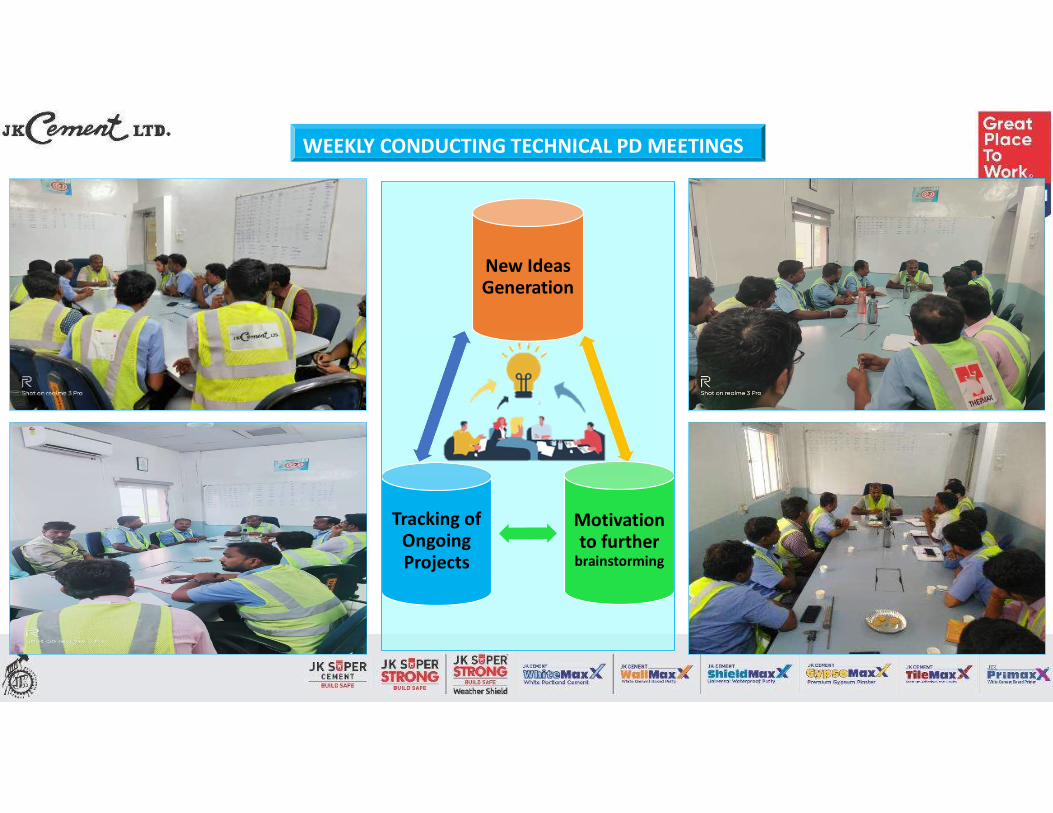
WEEKLY CONDUCTING TECHNICAL PD MEETINGS
New Ideas Generation
Motivation to further
brainstorming
Tracking of Ongoing Projects

BEST PRACTICES – SAFETY
72
77
84
SAFETY TRAININGS
2017-18 2018-19 2019-20
5S implementation Completed.
Checking of all power tools, gas cutting set & etc.
(monthly basis).
Mechanical and Electrical LOTOTO system implemented.
Internal Safety audit being carried out on monthly basis.
Safety Review meeting is being conducted on monthly basis.
Motivational Program (offering gifts) is being conducted.
84 safety training classes conducted in FY 2019-20.
Three no. of emergency mock drills conducted in FY 2019-20.
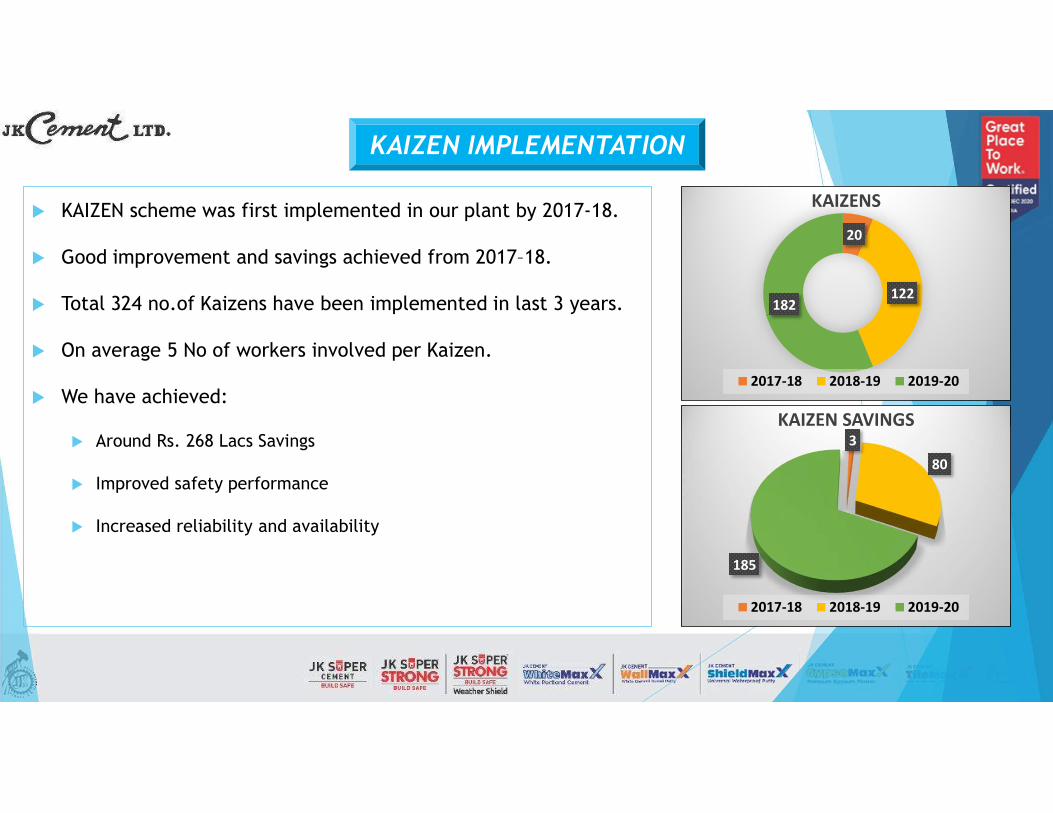
KAIZEN IMPLEMENTATION
KAIZEN scheme was first implemented in our plant by 2017-18.
Good improvement and savings achieved from 2017–18.
Total 324 no.of Kaizens have been implemented in last 3 years.
On average 5 No of workers involved per Kaizen.
We have achieved:
Around Rs. 268 Lacs Savings
Improved safety performance
Increased reliability and availability
20
122182
KAIZENS
2017-18 2018-19 2019-20
3
80
185
KAIZEN SAVINGS
2017-18 2018-19 2019-20

MASS HOUSE-KEEPING
Twice in a month
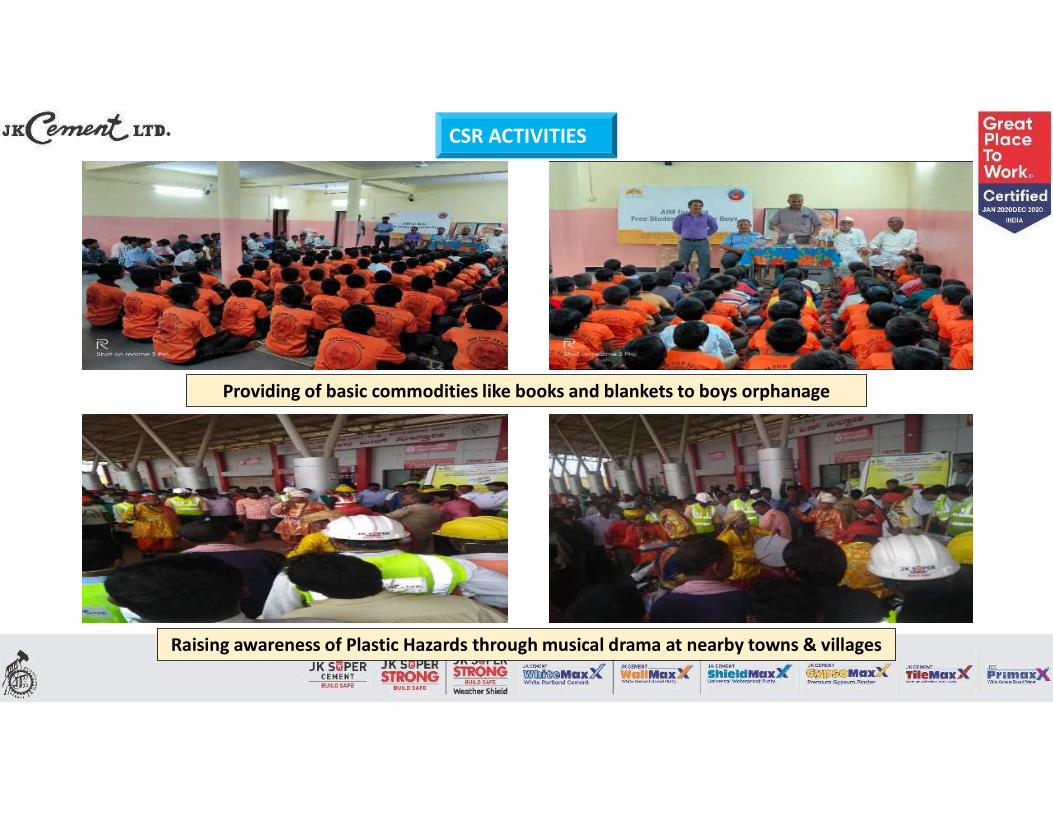
Providing of basic commodities like books and blankets to boys orphanage
Raising awareness of Plastic Hazards through musical drama at nearby towns & villages
CSR ACTIVITIES
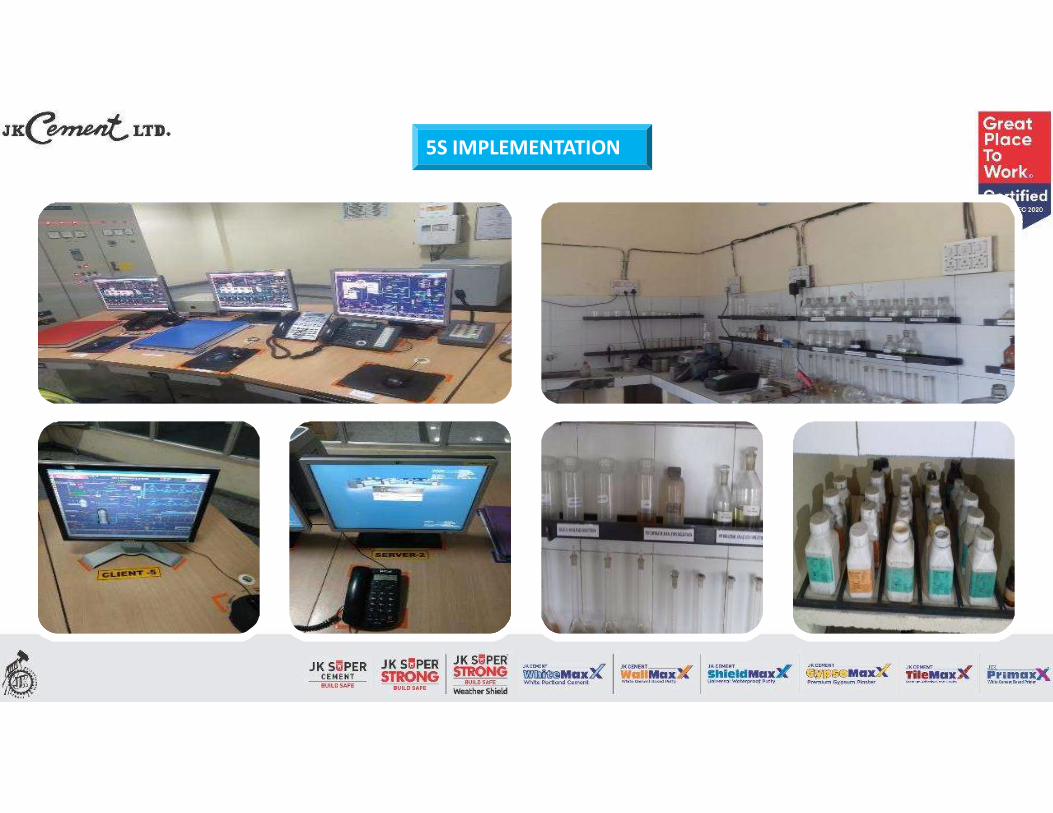
5S IMPLEMENTATION

GREEN DEVELOPMENT
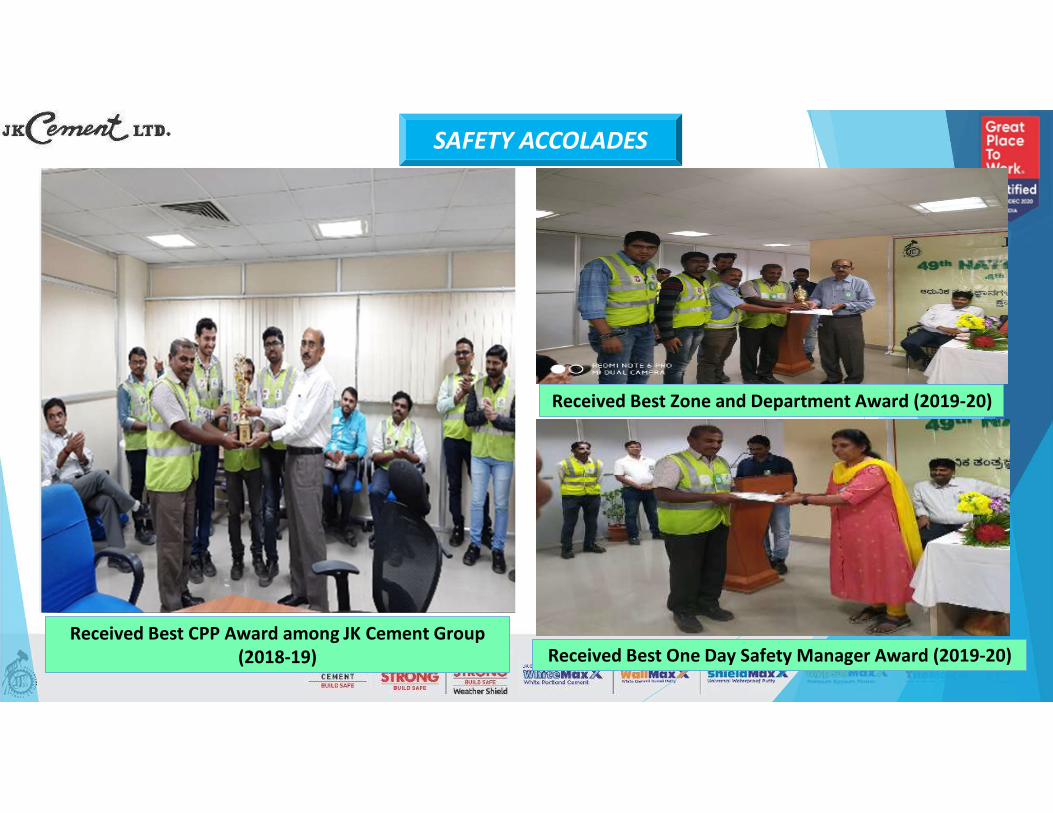
SAFETY ACCOLADES
Received Best Zone and Department Award (2019-20)
Received Best CPP Award among JK Cement Group (2018-19) Received Best One Day Safety Manager Award (2019-20)

OTHER ACCOLADES
BEST KAIZEN IMPLEMENTED MOST KAIZEN’S IMPLEMENTED MISSION ENERGY FOUNDATION’S AWARD (2018)
• Environmental Excellence – Existing TPPs (Winner)
• Efficient Management of Fly Ash – CPP (Runner Up)
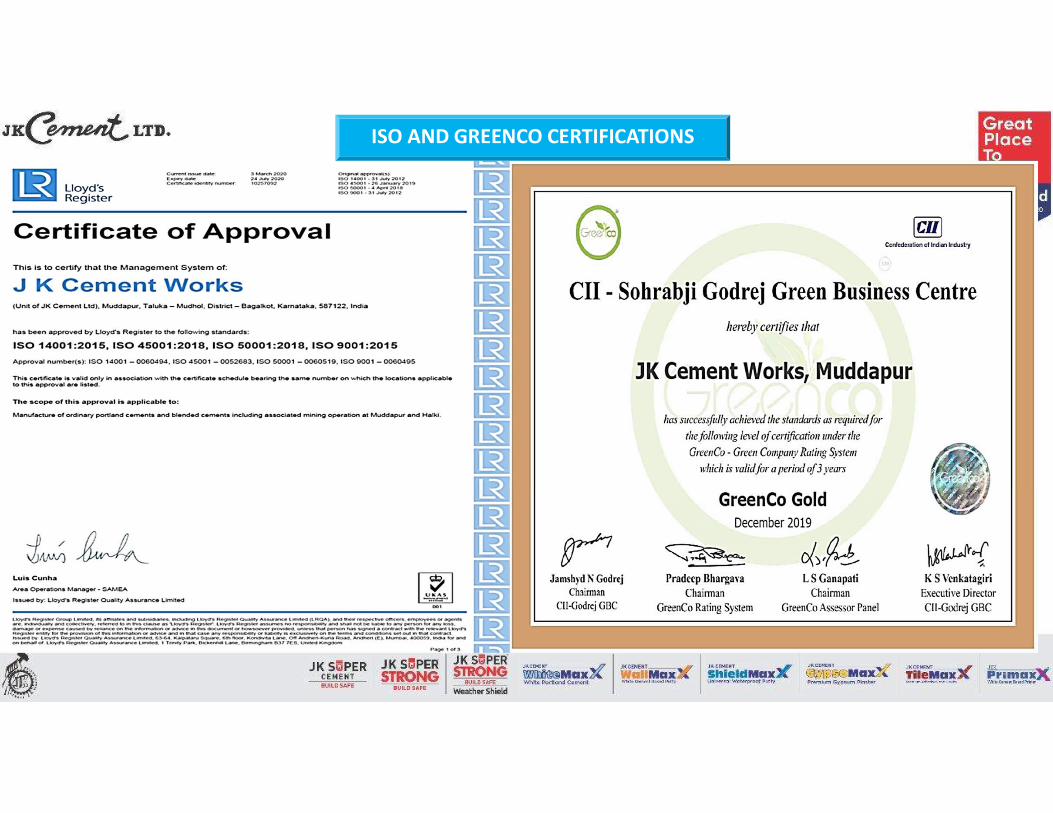
ISO AND GREENCO CERTIFICATIONS

Email: [email protected]
![k jk;iqj MsOgyiesaV vFkkWfjVh] u](https://static.fdokumen.com/doc/165x107/6322d92d117b4414ec0c1209/k-jkiqj-msogyiesav-vfkkwfjvh-u.jpg)

![465 fnYyh] 'kqØokj] fnlEcj 22] 2017@ikS"k 1] 1939 ¹jk-jk](https://static.fdokumen.com/doc/165x107/63203ca9b71aaa142a03b884/465-fnyyh-kqookj-fnlecj-22-2017iksk-1-1939-jk-jk.jpg)