From Dental Enamel to Synthetic Hydroxyapatite-Based ...
123
From Dental Enamel to Synthetic Hydroxyapatite-Based Biomaterials DISSERTATION Submitted for the Doctorate Degree of Natural Sciences at the Department of Earth Sciences of the University of Hamburg By JIANMIN SHI From Shandong, P. R. China Hamburg 2004
-
Upload
khangminh22 -
Category
Documents
-
view
2 -
download
0
Transcript of From Dental Enamel to Synthetic Hydroxyapatite-Based ...
From Dental Enamel to Synthetic
Hydroxyapatite-Based Biomaterials
DISSERTATION
Submitted for the Doctorate Degree
of Natural Sciences at the Department
of Earth Sciences of the University of Hamburg
By
JIANMIN SHI
From Shandong, P. R. China
Hamburg 2004
Als Dissertation angenommen vom Fachbereich
Geowissenschaften der Universität Hamburg
Auf Grund der Gutachten von: Prof. Dr. Ulrich Bismayer
und: Dr. Arndt Klocke
Hamburg, den 14, Januar 2005
Prof. Dr. H. Schleicher Dekan
des Fachbereichs Geowissenschaften

For my wife and my daughter

I
Contents
Abstract V
Chapter 1 Calcium phosphate minerals
1.1 Importance of calcium phosphates in biological and geological systems 1
1.2 Calcium phosphate biominerals 1
1.3 General principles of biomineralization 3
1.4 Phase diagram of Ca(OH)2-H3PO4-H2O system 3
1.5 Calcium phosphate minerals 6
1.5.1 Monocalcium phosphate monohydrate and moncalcium phosphate 6
1.5.2 Dicalcium phosphate dihydrate and dicalcium phosphate andydrate 6
1.5.3 Octacalcium phosphate 7
1.5.4 Tricalcium phosphate 7
1.5.5 Tetracalcium phosphate 7
1.5.6 Hydroxyapatite, fluorapatite and chlorapatite 8
1.5.7 Amorphous calcium phosphate 12
Chapter 2 Synthetic hydroxyapatite-based biomaterials
2.1 Historical overview 14
2.2 Present status of hydroxyapatite-based biomaterials 15
2.2.1 Pure hydroxyapatite materials 15
2.2.2 Hydroxyapatite-based composites 17
2.3 Disadvantages in conventionally fabricated hydroxyapatite-based biomaterials 21
2.4 New concepts and processing for hydroxyapatite-based biomaterials 22
Chapter 3 Experimental methods
3.1 Scanning electron microscopy and electron probe microanalysis 23
3.1.1 Scanning electron microscopy 23
3.1.2 Electron probe microanalysis 23
3.2 Vibrational spectroscopy 24
II
3.2.1 Origins of infrared and Raman spectroscopy 24
3.2.2 Vibrational theory of molecules and crystals 25
3.2.3 Selection rules for infrared and Raman spectra 26
3.2.4 Comparison of infrared and Raman spectroscopy 27
3.3 X-ray analysis 27
3.3.1 X-ray powder diffraction 27
3.3.2 X-ray fluorescence spectroscopy 28
3.4 Measurements of mechanical properties 28
3.4.1 Microhardness 28
3.4.2 Fracture toughness 29
3.4.3 Flexural force and bending strength 30
3.5 High pressure and temperature compaction 31
3.6 Cell culture 32
Chapter 4 Microstructure, chemistry and thermal behaviour of dental enamel
4.1 Introduction 34
4.2 Materials and methods 36
4.2.1 Sample preparation 36
4.2.2 Microstructure investigation and chemical analysis 36
4.2.3 Infrared spectroscopy 37
4.3 Results and Discussion 37
4.3.1 Microstructure and chemistry of dental enamel 37
4.3.2 Thermal behaviour of dental enamel apatite 42
4.4 Conclusions 56
Chapter 5 High pressure and temperature compaction of nanostructured
hydroxyapatite
5.1 Introduction 58
5.2 Materials and methods 58
5.3 Results and discussion 58
5.3.1 Characterization of powders 58
5.3.2 Physical appearance of the compacted HA ceramics 60
III
5.3.3 Microstructure of the compacted hydroxyapatite ceramics 60
5.3.4 Mechanical properties 65
5.4 Conclusions 67
Chapter 6 Investigation of high pressure and temperature consolidification of
Hydroxyapatite-metal composites
6.1 Introduction 68
6.2 Materials and Methods 68
6.2.1 Hydroxyapatite powders 68
6.2.2 Metal powders 69
6.2.3 High pressure and temperature consolidification 70
6.2.4 Microstructure and mechanical properties 70
6.3 Results and Discussion 71
6.3.1 Hydroxyapatite-50vol% Ti composites 71
6.3.2 Hydroxyapatite-50vol% Ag composites 77
6.3.3 Hydroxyapatite-50vol% Au composites 82
6.3.4 Toughening mechanisms of hydroxyapatite-metal composites 86
6.4 Conclusions 88
Chapter 7 Biocompatibility of hydroxyapatite-metal composites fabricated at high
pressure and temperature
7.1 Introduction 89
7.2 Materials and methods 89
7.2.1 Raw materials 89
7.2.2 Fabrication of Hydroxyapatite -metal composites 89
7.2.3 Characterization of microstructure and measurement of mechanical properties 89
7.2.4 Biocompatibility study 90
7.3 Results and discussion 90
7.3.1 Hydroxyapatite -Ti composites 90
7.3.2 Hydroxyapatite -Ag composites 94
7.4 Conclusions 98
IV
Chapter 8 Potential applications and future works
8.1 Potential applications 99
8.2 Future works 99
References 101
Acknowledgements 110
Curriculum Vita 112
Publications 113

Abstract
V
Abstract The mineral hydroxyapatite ( HA: Ca10(PO4)6(OH)2 ) belongs to the most bioactive and biocompatible materials available. The clinical application of pure HA is currently limited to powders, porous bodies, and coatings on metallic substrates because of its poor mechanical properties, particularly the low fracture toughness. Much effort has been made to prepare HA-metal composites via a conventional powder sintering process, however, the improvement of mechanical properties was often accompanied by the deterioration of structural stability and biocompatibility, which resulted mainly from reinforcement phases and the decomposition products of the HA phase. So far, HA-based biomaterials including HA-metal composites have not clinically been used in load-bearing conditions. New design concepts and processing methodologies are therefore needed in order to optimize the microstructure and to improve the mechanical properties of HA-based materials. Biological materials, e. g. mollusc shells, teeth and bones have excellent physical properties to fulfill their functions because of their hierarchically organized structures through a dimensional scale from nanometer to submeter. Such biominerals are a source of inspiration for the design and development of new synthetic materials based on their structures and/or processes. Dental enamel is composed of 96 wt % hydroxyapatite and a small amount of protein and water. The functional success of dental enamel through life with rare disastrous mechanical failure makes it therefore attractive to be studied from the materials science perspective. In this dissertation, dental enamel was chosen as a model substance to derive microstructural design and processing concepts for developing novel synthetic biomaterials. The ultimate goal was to fabricate HA-based biomaterials for hard tissue replacement including dental enamel and tooth root. Therefore, the main work of this project consists of: (1) Investigation of the microstructure, chemistry and thermal stability of dental enamel; (2) Fabrication and characterization of HA-based biomaterials based on the concepts derived from the investigation of the microstructure of dental enamel; (3) Biocompatiblility evaluation of the fabricated HA- based products. Conclusions are summarized as follows: (1) Microstructure, chemistry and thermal stability of dental enamel The microstructure of dental enamel was revealed after etching in 37 % phosphate acid for 60s. Dental enamel is composed of crossed groups of enamel rods. In each group, enamel rods with a diameter of 3-5 microns are arranged nearly parallel. An enamel rod consists of nanosized apatite crystals. The enamel inter-rods form a network surrounding the enamel rods. It indicates that this inter-rod network plays an important role in determining the mechanical properties of dental enamel. Enamel apatite is a nonstoichiometric hydroxyapatite with carbonate groups both at the phosphate site (B-type carbonate) and the OH site (A-type carbonate). The detailed structure of enamel apatite is not clear yet, although several structural models have been proposed. Variations of the chemical composition and molecular structure have been analyzed in this work using electron microprobe, synchrotron radiation X-ray fluorescence and infrared microscopy. Results showed that dental enamel is a gradient material. The mineral apatite content decreases from the surface to the dentin enamel junction (DEJ). The amount of total carbonate groups in enamel apatite increases on moving from the surface to the DEJ while the
Abstract
VI
ratio of A-type to B-type substitution decreases from the surface to the DEJ. Other elements, such as K, Na, Cl and trace elements of Sr, Cu, Ni and Zn are not homogeneously distributed either. The thermal stability of dental enamel was studied using infrared spectroscopy and compared with a single crystalline apatite of geological origin. This investigation focused on the hydrous species in c-axis channels of the apatite structure. In situ IR spectral analysis of dental enamel reveals two different thermal regions below and above 600 K. The thermal behavior in the region below 600 K corresponds to the loss of adsorbed and lattice water, and combined with an increase of structural OH groups. In the second thermal region (above 600 K), the similarity of the thermal response of enamel and geologic apatite suggests the existence of a highly ordered system. This may be explained by the former dehydration and atomic rearrangements in the channels of enamel apatite below 600 K. Thermally induced structural modifications of dental enamel were also studied using enamel powders after heat-treatment in air from 300 K to 1193 K for 1 h at each temperature interval. Results from this annealing regime showed that the loss of B-type and A-type carbonate ions occurs near 373 K; the amount of B-type carbonate ions and the total carbonate content decreases on heating while the amount of A-type carbonate ions increases from 573 to 973 K. Almost 50 % of the carbonate ions were released from dental enamel after heat treatment at 973 K for 1h. The incorporation of CO2 and CNO species in dental enamel was found in the temperature range 473-973 K and 673-1073 K, respectively. The content of CO2 in dental enamel increased from 473 K to a maximum near 773 K and thereafter it decreased. The formation of β-tricalcium phosphate was detected in samples heated above 973 K for 1h. (2) Fabrication and characterization of HA-based biomaterials based on the concepts derived from the microstructure of dental enamel It has been shown that two of the distinctive microstructural features of dental enamel are nanostructured HA and micron-sized enamel rods surrounded by a network of enamel inter-rods. The preparation of nanostructured HA ceramics and HA-metal network composites mimicking the microstructural features of dental enamel was successfully fulfilled in this dissertation using a new high pressure and temperature compaction process. Nanosized HA powders were compacted at high pressure and temperature with the aim to obtain nanostructured HA ceramics for replacing or filling missing dental enamel. The HA grains remained on the nanosized scale when the densification temperature was below 700 oC. Grain coarsening into micronsized HA crystals occured in samples compacted at 2.5 GPa, 700 oC. XRD patterns and IR spectra indicated that with increasing compaction temperature the crystal growth and perfection was accompanied by the release of water and a loss of carbonate groups. The microhardness of the nanostructured HA ceramics was about 5.0 GPa and fracture toughness was in the range 0.6-1.0 MPa•m1/2 depending on the compaction conditions, similar to those of dental enamel (microhardness: 3.0-5.0 GPa, fracture toughness: 0.52-1.3 MPa·m1/2). Moreover, the optical nature of the nanostructured HA ceramics changes from transparent to translucent, and to opaque depending processing conditions. This change in the appearance could be explained in terms of crystal growth, the release of water, and the loss of carbonate groups from the apatite structure.
HA -metal composites with different volume ratios were consolidified at pressures from 1.4 GPa to 6.0 GPa and temperatures from 700 oC to 1000 oC. The investigation of the fracture surface of HA-Ti, HA-Ag and HA-Au composites indicated that the metal component was infiltrated into the boundaries of HA grains to form a metallic network. Dimples resulted

Abstract
VII
from pullouts of HA grains from the metallic network and transgranular cleavages inside HA grains were found in three HA-metal systems. In HA-Ag composites, a well developed silver network was formed compared with the HA-Ti and HA-Au systems at 2.5 GPa, 800 oC. This microstructure is quite similar to dental enamel cut perpendicular to enamel rods. XRD patterns of HA-metal composites indicated no detectable decomposition products of the HA phase and the reaction products of HA with metal phase, unlike the conventionally sintered HA-metal composites where HA decomposed into nonapatitic phases. The structural stability of HA in HA-metal composites is ascribed to the short sintering time during the high pressure and temperature processing. The flexural force of HA-metal composites measured using 3-point bending test with a rectangular bar (dimensions: ∼4mm × 1.2mm × 0.5mm) is about 2-3 times of the conventionally sintered HA ceramics. Toughening mechanisms in HA-metal composites were also discussed in terms of crack deflection and branching, interfacial bonding.
(3) Biocompatible evaluation of fabricated HA-based biomaterials The effect of the metal content in HA-metal composites fabricated at 2.5 GPa, 800 oC on the microstructure, mechanical properties and biocompatibility of HA-Ag and HA-Ti composites was also evaluated. The microhardness of HA-Ag and HA-Ti composites decreased and the bending strength increased with increasing metal content. Osteoblasts isolated from calvaria of neonatal SD rats were cultured on sections of HA-Ag, and HA-Ti composites. After cultured for 3 and 7 days, cells differentiated and attached on the materials with extensions, indicating good biocompatibility of HA-metal composites, however, the cell response showed negative effect with increase in Ti and Ag content. From both, the mechanical and biocompatible aspects, up to 25 vol % metal component can be incorporated in HA-metal composites in order to improve mechanical properties and biocompatibility. HA-based biomaterials fabricated at high pressure and temperature based on new design concepts derived from the microstructural investigation of dental enamel allow for promising applications in the field of hard tissue implant, especially in dentistry. A translucent nanostructured HA ceramic can be used to replace dental enamel and the HA-metal composite with a metallic network is suitable for dental root implants. A concept of a whole tooth replacement with nanostructured HA together with HA-metal network composites is proposed.
Chapter 1 Calcium phosphate minerals
1
Chapter 1
Calcium Phosphate Minerals
1.1 Importance of calcium phosphates in biological and geological systems Calcium phosphates are an integral component of geological and biological systems. They are found in virtually all rocks, and are the major structural component of vertebrates. Calcium and phosphorus are widely distributed elements on our planet. The surface layer of the Earth contains about 3.4% of calcium and 0.10% of phosphorus [Weast, 1985-1986]. Combinations of oxides of these two elements with or without incorporation of water give different calcium phosphates. All calcium phosphates are only sparingly soluble in water, and some can be considered to be insoluble, but all dissolve in acids. Although ortho-(PO4
3-), pyro-(P2O74-),
and poly- ((PO3)nn-) phosphates can be formed in the calcium-phosphorous system. Only
calcium orthophosphates are interested mainly because they are the major component of human calcified tissues. Hence calcium phosphates are important materials in the fields of biology, geology, industry, medicine and dentistry. Their formation, function, and applications depend on their structure, composition, solubility, and stability.
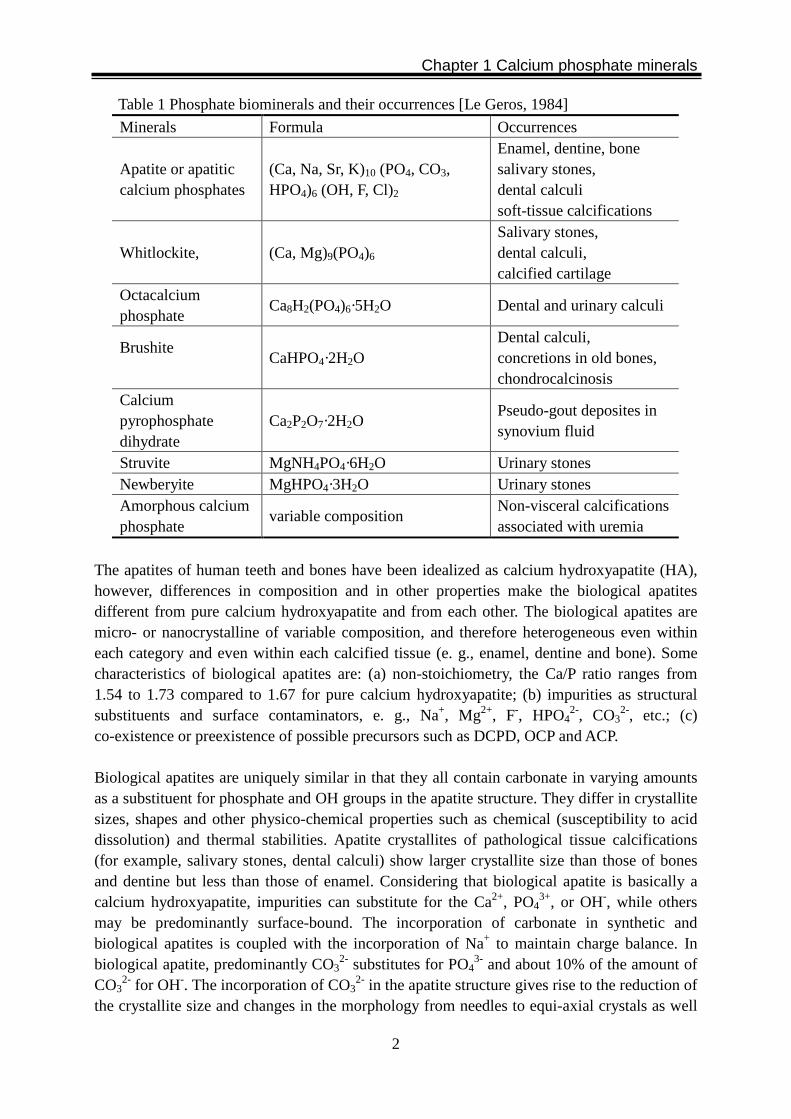
1. 2 Calcium phosphate biominerals Biological mineralization (biomineralization) is the process of in-vivo formation of inorganic minerals. Over 60 different biominerals have been identified. They are composed commonly of H, C, O, Mg, P, S, Ca, Mn and Fe elements of the 20 to 25 essential elements required by living organisms. In invertebrates (e. g. echinoderms, mollusks, arthropods, etc.), the mineral phase is usually calcium carbonate, predominantly in the form of either calcite or aragonite or both. In vertebrates, the inorganic phase consists of one or more types of phosphate minerals (predominantly calcium phosphates) depending on the nature of calcification, i.e. normal (e. g. bones and teeth) or abnormal or pathological (e. g., dental calculi, salivary and urinary stones, soft tissue calcification, etc.). In several pathologically calcified tissues, the mineral is non-phosphoric such as calcium oxalates (whewellite and weddellite), sodium urates, uric acid, cysteine. Apatites in normal calcified tissues of teeth and bones have been supposed to form either directly or indirectly by way of precursor calcium phosphates such as octacalcium phosphate (OCP), amorphous calcium phosphate (ACP), and brushite (DCPD), [Le Geros, 1984]. Several types of phosphate minerals co-exist in some pathological tissue calcifications, e. g. DCPD, OCP, β-tricalcium phosphate (β-TCP), and apatite in dental calculi, urinary and salivary stones [Mann, 2001]. In some cases of pathological tissue calcifications, the phosphate minerals co-exisit with non-phosphate minerals. The general occurrence and co-existence of phosphate minerals in human tissues is summarized in Table 1.
Chapter 1 Calcium phosphate minerals
2
Table 1 Phosphate biominerals and their occurrences [Le Geros, 1984]
Minerals Formula Occurrences
Apatite or apatitic calcium phosphates
(Ca, Na, Sr, K)10 (PO4, CO3, HPO4)6 (OH, F, Cl)2
Enamel, dentine, bone salivary stones, dental calculi soft-tissue calcifications
Whitlockite, (Ca, Mg)9(PO4)6 Salivary stones, dental calculi, calcified cartilage
Octacalcium phosphate
Ca8H2(PO4)6·5H2O Dental and urinary calculi
Brushite
CaHPO4·2H2O Dental calculi, concretions in old bones, chondrocalcinosis
Calcium pyrophosphate dihydrate
Ca2P2O7·2H2O Pseudo-gout deposites in synovium fluid
Struvite MgNH4PO4·6H2O Urinary stones Newberyite MgHPO4·3H2O Urinary stones Amorphous calcium phosphate
variable composition Non-visceral calcifications associated with uremia
The apatites of human teeth and bones have been idealized as calcium hydroxyapatite (HA), however, differences in composition and in other properties make the biological apatites different from pure calcium hydroxyapatite and from each other. The biological apatites are micro- or nanocrystalline of variable composition, and therefore heterogeneous even within each category and even within each calcified tissue (e. g., enamel, dentine and bone). Some characteristics of biological apatites are: (a) non-stoichiometry, the Ca/P ratio ranges from 1.54 to 1.73 compared to 1.67 for pure calcium hydroxyapatite; (b) impurities as structural substituents and surface contaminators, e. g., Na+, Mg2+, F-, HPO4
2-, CO32-, etc.; (c)
co-existence or preexistence of possible precursors such as DCPD, OCP and ACP. Biological apatites are uniquely similar in that they all contain carbonate in varying amounts as a substituent for phosphate and OH groups in the apatite structure. They differ in crystallite sizes, shapes and other physico-chemical properties such as chemical (susceptibility to acid dissolution) and thermal stabilities. Apatite crystallites of pathological tissue calcifications (for example, salivary stones, dental calculi) show larger crystallite size than those of bones and dentine but less than those of enamel. Considering that biological apatite is basically a calcium hydroxyapatite, impurities can substitute for the Ca2+, PO4
3+, or OH-, while others may be predominantly surface-bound. The incorporation of carbonate in synthetic and biological apatites is coupled with the incorporation of Na+ to maintain charge balance. In biological apatite, predominantly CO3
2- substitutes for PO43- and about 10% of the amount of
CO32- for OH-. The incorporation of CO3
2- in the apatite structure gives rise to the reduction of the crystallite size and changes in the morphology from needles to equi-axial crystals as well
Chapter 1 Calcium phosphate minerals
3
as a contraction of the a-axis and an expansion of the c-axis. The chemical stability is reduced as well. Contrary to the carbonate, the effects of fluoride incorporation on the properties of biological and synthetic apatites are: (a) increase in crystallite size; (b) decrease in strain due to an increased stability of the apatite structure; (c) contraction of the a-axis and no significant change of the c-axis when compared to unsubstituted calcium hydroxyapatite; (d) increase in chemical stability; and (e) increase in thermal stability.
1.3 General principles of biomineralization [Mann, 2001] Although little is known about the details concerning the molecular interactions during biomineral formation, there are some general principles that are reasonably well established. In biologically induced mineralisation, biominerals are deposited by adventurous precipitation, which arises from secondary interactions between various metabolic processes and the surrounding environment. The minerals formed in this biomineralization process are closely associated with the cell walls and are crystallochemically heterogeneous. In contrast to biologically induced mineralization, biologically controlled biomineralisation is a highly regulated process that produces materials such as bones, shells and teeth that have specific biological functions and structures. These biominerals are distinguished by reproducible and species-specific crystallochemical properties, which include: � Uniform particle sizes � Well-defined structures and compositions � High levels of spatial organization � Complex morphologies � Controlled aggregation and texture � Preferential crystallographic orientation � High-order assembly into hierarchical structures From a fundamental point of view, biomineralization processes are governed by the gene pool, driven by bioenergetic processes and adapted to environmental influences. It is completely unknown how these generic processes operate. However, the embedded regulations are reflected by the specific control mechanisms in biomineralization involving the regulation of chemistry, space, structure, morphology and construction. A general model of biomineralization involves of both vesicles and organic matrices as potential intra- and extracellular mineralization sites respectively. Vesicles are often involved in the long-range transport of ions or mineral deposits to the extracellular matrix. The latter can be used as prefabricated building blocks for the construction of higher-order mineral assemblies.
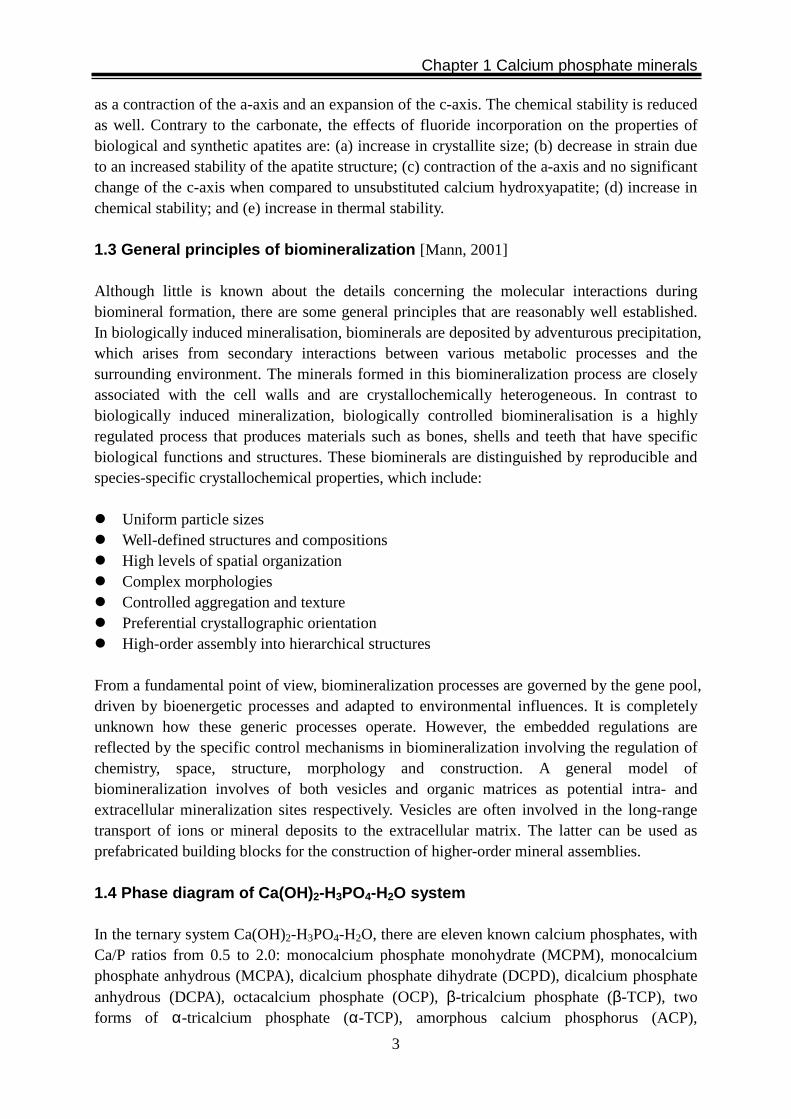
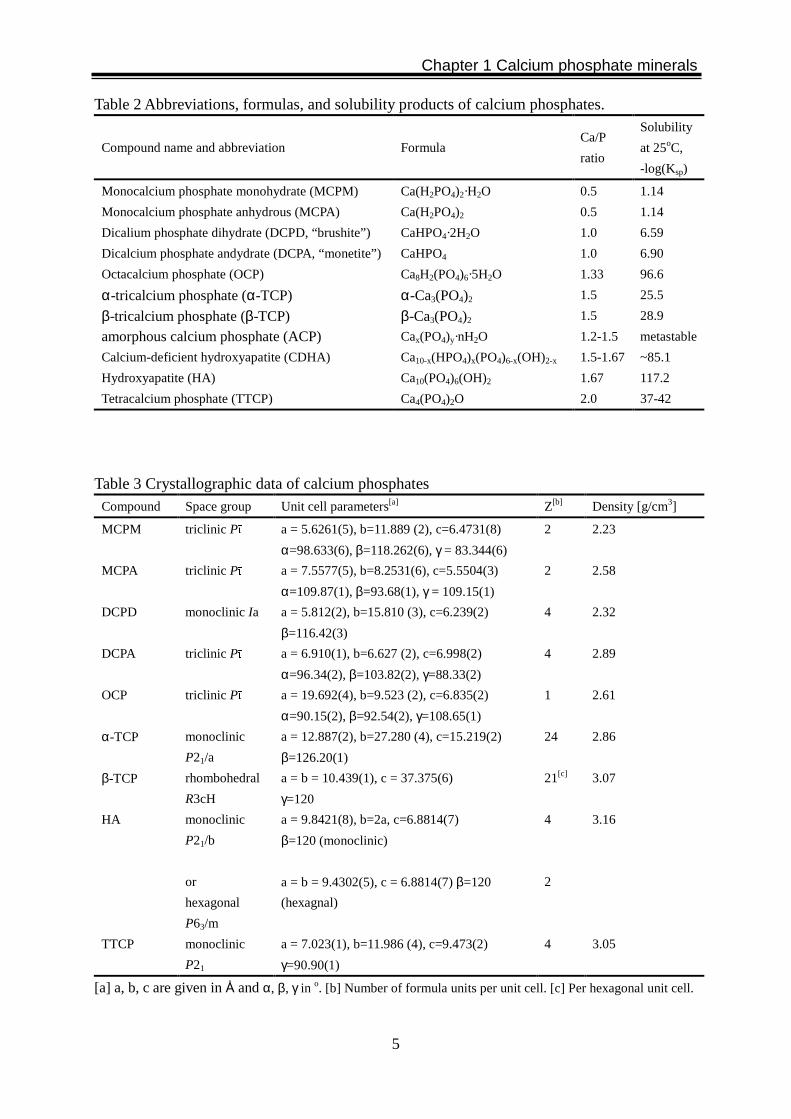
1.4 Phase diagram of Ca(OH)2-H3PO4-H2O system
In the ternary system Ca(OH)2-H3PO4-H2O, there are eleven known calcium phosphates, with Ca/P ratios from 0.5 to 2.0: monocalcium phosphate monohydrate (MCPM), monocalcium phosphate anhydrous (MCPA), dicalcium phosphate dihydrate (DCPD), dicalcium phosphate anhydrous (DCPA), octacalcium phosphate (OCP), β-tricalcium phosphate (β-TCP), two forms of α-tricalcium phosphate (α-TCP), amorphous calcium phosphorus (ACP),
Chapter 1 Calcium phosphate minerals
4
hydroxyapatite (HA), and tetracalcium phosphate (TTCP). With the substitution of halide for the hydroxide ion, fluorapatite (FA) or chlorapatite (ClA) is obtained. Whitlockite can form in the presence of magnesium ions, and carbonate apatite in the presence of carbonate. The calcium phosphates are listed in Table 2 and 3 indicating their chemical formulas with their abbreviations, crystal space groups and lattice parameters, and solubility products [Fernandez et al., 1999 ; Dorozhkin and Epple, 2002]. Phase diagrams show the thermodynamically stable phases and give an indication of the conditions required for synthesis. However, the actual phase that form under any given conditions is often dictated by kinetic rather than thermodynamic considerations. The phase diagram for the system Ca(OH)2-H3PO4-H2O at normal temperatures and pressures is given in Fig. 1 (a) and (b) [Chow, 1991]. In these Figures, the HA curves show the log[Ca] and log[P] of the solutions in equilibrium with this phase as a function of the pH value. Since the isotherms define solution in equilibrium with respect to HA, they also demarcate the regions of undersaturation (low region) and supersaturation (upper region). The solubility product is calculated from the data obtained in the solubility measurements using various dissociation constants of phosphoric acid and ion-pair formation constants [Chow, 1991].
(a) (b)
Fig. 1 Solubility phase diagrams for the ternary system, Ca(OH)2-H3PO3-H2O, 37 oC showing two logarithms of concentrations of (a) calcium and (b) phosphate as a function of the pH in solution, saturated with various salt in the solubility isotherm [Chow, 1991].
Chapter 1 Calcium phosphate minerals
5
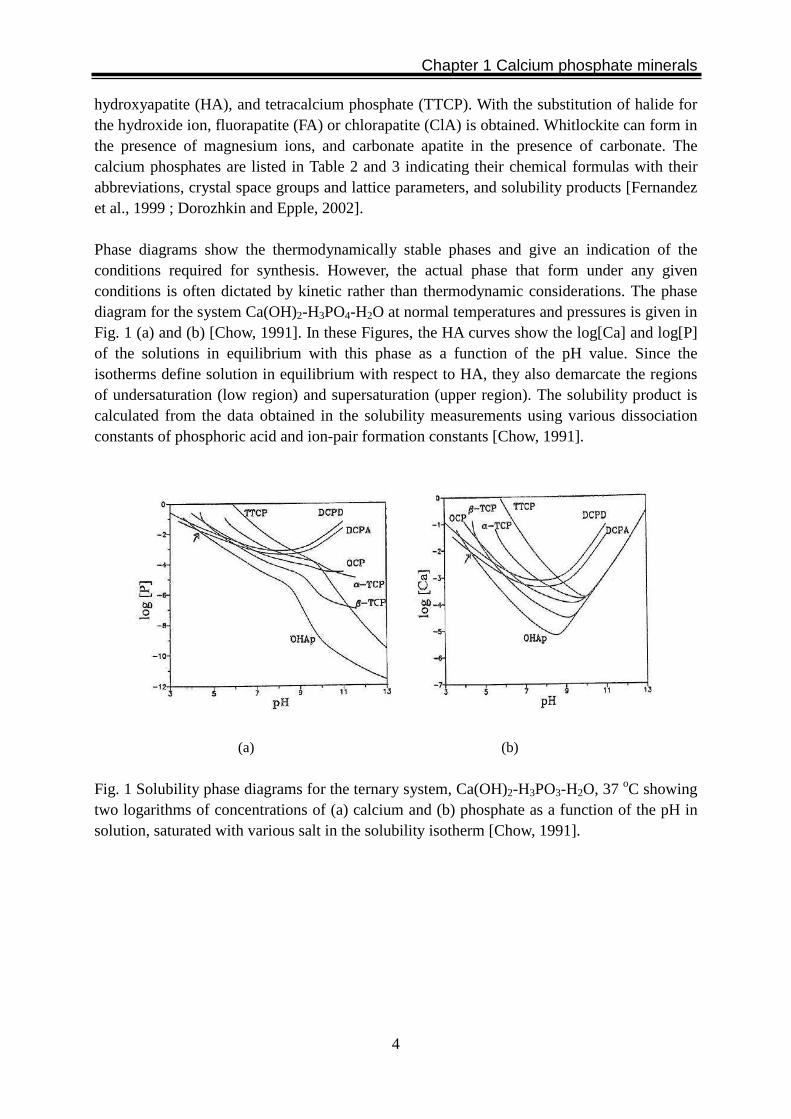
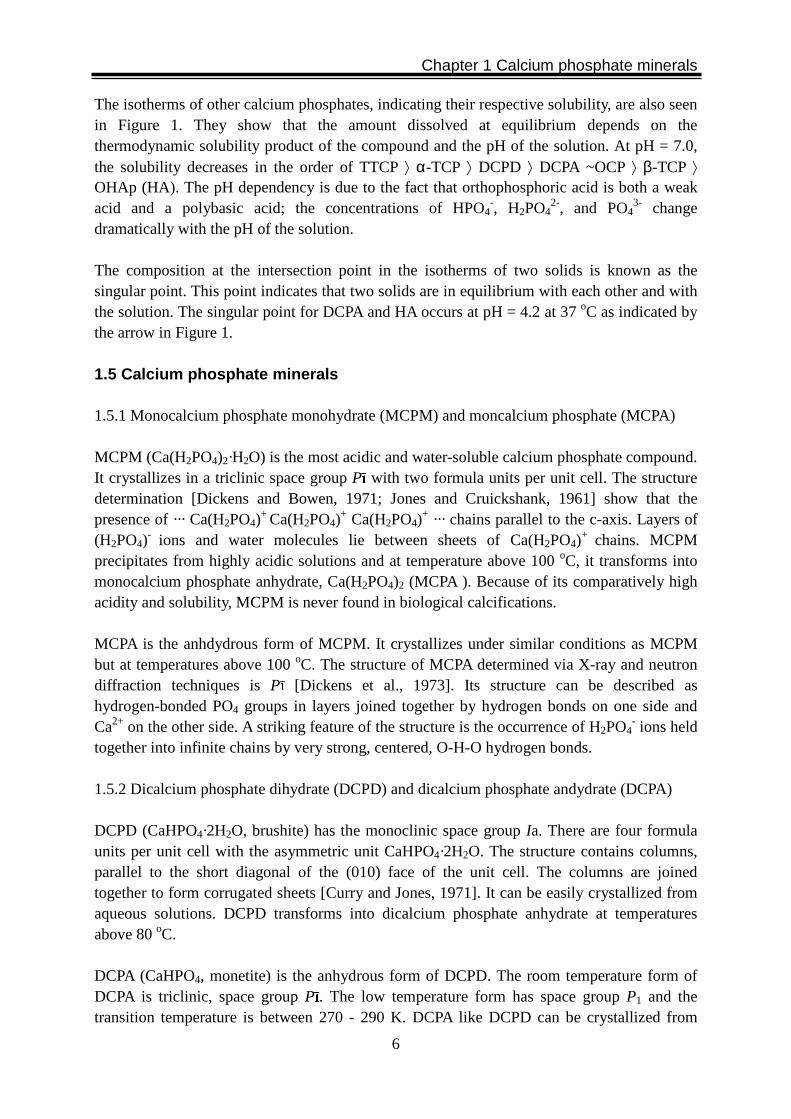
Table 2 Abbreviations, formulas, and solubility products of calcium phosphates.
Compound name and abbreviation Formula Ca/P
ratio
Solubility
at 25oC,
-log(Ksp)
Monocalcium phosphate monohydrate (MCPM) Ca(H2PO4)2·H2O 0.5 1.14
Monocalcium phosphate anhydrous (MCPA) Ca(H2PO4)2 0.5 1.14
Dicalium phosphate dihydrate (DCPD, “brushite”) CaHPO4·2H2O 1.0 6.59
Dicalcium phosphate andydrate (DCPA, “monetite”) CaHPO4 1.0 6.90
Octacalcium phosphate (OCP) Ca8H2(PO4)6·5H2O 1.33 96.6
α-tricalcium phosphate (α-TCP) α-Ca3(PO4)2 1.5 25.5
β-tricalcium phosphate (β-TCP) β-Ca3(PO4)2 1.5 28.9
amorphous calcium phosphate (ACP) Cax(PO4)y·nH2O 1.2-1.5 metastable
Calcium-deficient hydroxyapatite (CDHA) Ca10-x(HPO4)x(PO4)6-x(OH)2-x 1.5-1.67 ~85.1
Hydroxyapatite (HA) Ca10(PO4)6(OH)2 1.67 117.2
Tetracalcium phosphate (TTCP) Ca4(PO4)2O 2.0 37-42
Table 3 Crystallographic data of calcium phosphates Compound Space group Unit cell parameters[a] Z[b] Density [g/cm3]
MCPM triclinic Pī a = 5.6261(5), b=11.889 (2), c=6.4731(8)
α=98.633(6), β=118.262(6), γ = 83.344(6)
2 2.23
MCPA triclinic Pī a = 7.5577(5), b=8.2531(6), c=5.5504(3)
α=109.87(1), β=93.68(1), γ = 109.15(1)
2 2.58
DCPD monoclinic Ia a = 5.812(2), b=15.810 (3), c=6.239(2)
β=116.42(3)
4 2.32
DCPA triclinic Pī a = 6.910(1), b=6.627 (2), c=6.998(2)
α=96.34(2), β=103.82(2), γ=88.33(2)
4 2.89
OCP triclinic Pī a = 19.692(4), b=9.523 (2), c=6.835(2)
α=90.15(2), β=92.54(2), γ=108.65(1)
1 2.61
α-TCP monoclinic
P21/a
a = 12.887(2), b=27.280 (4), c=15.219(2)
β=126.20(1)
24 2.86
β-TCP rhombohedral
R3cH
a = b = 10.439(1), c = 37.375(6)
γ=120
21[c] 3.07
HA monoclinic
P21/b
or
hexagonal
P63/m
a = 9.8421(8), b=2a, c=6.8814(7)
β=120 (monoclinic)
a = b = 9.4302(5), c = 6.8814(7) β=120
(hexagnal)
4
2
3.16
TTCP monoclinic
P21
a = 7.023(1), b=11.986 (4), c=9.473(2)
γ=90.90(1)
4 3.05
[a] a, b, c are given in Å and α, β, γ in o. [b] Number of formula units per unit cell. [c] Per hexagonal unit cell.
Chapter 1 Calcium phosphate minerals
6
The isotherms of other calcium phosphates, indicating their respective solubility, are also seen in Figure 1. They show that the amount dissolved at equilibrium depends on the thermodynamic solubility product of the compound and the pH of the solution. At pH = 7.0, the solubility decreases in the order of TTCP ⟩ α-TCP ⟩ DCPD ⟩ DCPA ~OCP ⟩ β-TCP ⟩ OHAp (HA). The pH dependency is due to the fact that orthophosphoric acid is both a weak acid and a polybasic acid; the concentrations of HPO4
-, H2PO42-, and PO4
3- change dramatically with the pH of the solution.
The composition at the intersection point in the isotherms of two solids is known as the singular point. This point indicates that two solids are in equilibrium with each other and with the solution. The singular point for DCPA and HA occurs at pH = 4.2 at 37 oC as indicated by the arrow in Figure 1.
1.5 Calcium phosphate minerals
1.5.1 Monocalcium phosphate monohydrate (MCPM) and moncalcium phosphate (MCPA)
MCPM (Ca(H2PO4)2·H2O) is the most acidic and water-soluble calcium phosphate compound. It crystallizes in a triclinic space group P
ī with two formula units per unit cell. The structure
determination [Dickens and Bowen, 1971; Jones and Cruickshank, 1961] show that the presence of ··· Ca(H2PO4)
+ Ca(H2PO4)+ Ca(H2PO4)
+ ··· chains parallel to the c-axis. Layers of (H2PO4)
- ions and water molecules lie between sheets of Ca(H2PO4)+ chains. MCPM
precipitates from highly acidic solutions and at temperature above 100 oC, it transforms into monocalcium phosphate anhydrate, Ca(H2PO4)2 (MCPA ). Because of its comparatively high acidity and solubility, MCPM is never found in biological calcifications. MCPA is the anhdydrous form of MCPM. It crystallizes under similar conditions as MCPM but at temperatures above 100 oC. The structure of MCPA determined via X-ray and neutron diffraction techniques is P
ī [Dickens et al., 1973]. Its structure can be described as
hydrogen-bonded PO4 groups in layers joined together by hydrogen bonds on one side and Ca2+ on the other side. A striking feature of the structure is the occurrence of H2PO4
- ions held together into infinite chains by very strong, centered, O-H-O hydrogen bonds.
1.5.2 Dicalcium phosphate dihydrate (DCPD) and dicalcium phosphate andydrate (DCPA) DCPD (CaHPO4·2H2O, brushite) has the monoclinic space group Ia. There are four formula units per unit cell with the asymmetric unit CaHPO4·2H2O. The structure contains columns, parallel to the short diagonal of the (010) face of the unit cell. The columns are joined together to form corrugated sheets [Curry and Jones, 1971]. It can be easily crystallized from aqueous solutions. DCPD transforms into dicalcium phosphate anhydrate at temperatures above 80 oC. DCPA (CaHPO4, monetite) is the anhydrous form of DCPD. The room temperature form of DCPA is triclinic, space group P
ī. The low temperature form has space group P1 and the
transition temperature is between 270 - 290 K. DCPA like DCPD can be crystallized from

Chapter 1 Calcium phosphate minerals
7
aqueous solutions but at 100 oC.
1.5.3 Octacalcium Phosphate (OCP)
OCP (Ca8(HPO4)2(PO4)4·5H2O) is often found as an intermediate phase during the precipitation of the thermodynamically more stable calcium phosphates (e. g. HA) from aqueous solutions. OCP is triclinic, space group Pī with 2 asymmetric units per unit cell [Brown, 1962]. It consists of apatitic layers separated by hydrated layers. The presence of the apatite layer explains the similarities of the lattice parameters with those of HA. An apatite layer consists of alternating sheets of phosphate ions interspersed with Ca2+ ions; and the hydrated layers consist of more widely spaced phosphate and Ca2+ ions with a slightly variable number of water molecules between them. OCP is of great biological importance because it is one of the stable components of human dental and urinary calculi. It plays an important role in the in vivo formation of apatitic biominerals. A central OCP inclusion, also known as central dark line is seen by transmission electron microcopy in many biological apatites and in some synthetically precipitated HA [Marshall and Lawless, 1981].
1.5.4 Tricalcium Phsopahte (TCP) β-TCP (β-Ca3(PO4)2) is the true calcium orthophosphate of the stoichiometric composition Ca3(PO4)2. β-TCP has the rhombohedral space group R3cH with 21 formula units per hexagonal unit cell. It can not be precipitated from solution, but may only be prepared by calcinations of calcium deficient hydroxyapatite (CDHA) at temperatures above 800oC:
Ca9(HPO4)(PO4)5OH → 3Ca3(PO4)2 + H2O Near 1125 oC, it transforms into the high-temperature phase α-TCP. Being the stable phase at room temperature, β-TCP is less soluble in water than α-TCP. Pure β-TCP never occurs in biological calcification. Only the magnesium-containing form called whitlockite (β-(Ca, Mg)3(PO4)2) is found in dental calculi and urinary stones, dental caries, salivary stones, arthritic cartilage, as well as in some soft-tissue deposits [Le Geros, 1994]. α-TCP (α-Ca3(PO4)2) is a metastable phase at room temperature, prepared from β-TCP at above 1125 oC. α-TCP has a monoclinic space group P21/a, with 24 formula units per unit cell. α-TCP is more reactive in aqueous systems than β-TCP and can be hydrolyzed to a mixture of other calcium phosphates. 1.5.5 Tetracalcium Phosphate (TTCP) TTCP (Ca4(PO4)2O) is a monoclinic phase, P21. Its solubility in water is higher than that of HA. TTCP cannot be precipitated from aqueous solutions, and thus can only be prepared by a solid-state reaction above 1300 oC, for example, by heating homogenized, equimolar quantities of DCPA and CaCO3 in dry air, or in a stream of dry nitrogen [Elliot, 1994]:
2CaHPO4 + 2CaCO3 → Ca4(PO4)2O + 2CO2 + H2O

Chapter 1 Calcium phosphate minerals
8
TTCP is not very stable in aqueous solutions; it slowly hydrolyses to HA and calcium hydroxide.
1.5.6 Hydroxyapatite, Fluorapatite and Chlorapatite [Hughes et al., 2002] Crystallographic structure The term apatite defines three unique minerals, fluorapatite [Ca10(PO4)6F2], chlorapatite [Ca10(PO4)6Cl2], and hydroxyapatite [Ca10(PO4)6(OH)2]. The atomic arrangements of the 3 apatite phases differ principally in the positions of the occupants of the 00z anion positions, i. e. fluorine, chlorine and hydroxyl groups, for the three end-members, respectively. The lattice parameters and the atomic parameters for well characterized samples of fluorapatite, hydroxyapatite, and chlorapatite are shown in Table 4. As noted in Table 4, the atoms lie on or near four (00l) planes in the atomic arrangement. Ca2, P, O1, O2, and the X anion (where X = F, Cl, OH) lie on (or are disordered about) special positions on the mirror planes at z =1/4 and 3/4. Intercalated approximately halfway between these planes are Ca1 (in a special position at z = ~0, ~1/2) and O3, in general position with z values of ~0.07 and 0.57. The atomic arrangement of apatite is formed of three polyhedra. The structure variations among the three anion endmembers is perhaps better understood by examining variations that occur in the three polyhedra concomitant with substitution of the three column anions.
The PO4 tetrahedron Phosphorous occurs in apatite in tetrahedral coordination, with the central P atom in 6h position. Typical of such rigid polyhedra is that the PO4 polyhedron is essentially invariant in the three apatite structures. Figure 2 displays the PO4 tetrahedra for fluorapatite, hydroxyapatite, and chlorapatite, and illustrates the invariance of the polyhedron among the three end members.
Fig 2. Drawing of PO4 tetrahedron (left) and Ca1 and Ca2 polyhedra for the three apatite structures. Each overlay is a superposition of the analogous polyhedra from the fluorapatite, hydroxyapatite, and chlorapatite end-members, drawn to the same scale and with coincident central cations (Hughes et al. 1989).
The Ca1O9 polyhedron

Chapter 1 Calcium phosphate minerals
9
In the apatite structure, ten Ca ions in the unit cell exist in two ployhedra. Ca1, with the central cation in the 4f (1/3, 2/3, z) position, is coordinated by nine oxygen atoms in the arrangement of a tricapped trigonal prism. Ca1, with z values near 0 and 1/2, bonds to six of those oxygen (3 × O1, 3 × O2) in planes 1/2 unit cell above and below the central cation, forming a trigonal prism. Three more oxygen atoms (3 × O3), essentially coplanar with Ca1, are bonded trough the prism faces to form the tricapped trigonal prism.
The Ca2O6X polyhedron Ca2 in the 6h special position of space group P63/m, bonds to 6 oxygen atoms (O1, O2, 4×O3) and one column anion (X). The major structural response to substitution of the three column anions occurs in this polyhedron. Figure 2 displays the superposition of the three Ca2 polyhedra for pure anion end-members, and illustrates the large shifts that occur in the positions of the X anions in the [002] anion column. The Ca2 cations form triangles on the planes at z = 1/4 and z = 3/4 (Fig. 3). Each of the three Ca atoms at the corners of the triangles is bonded to the central anion in the [00z] column. Fluorine lies on the planes at z=1/4, 3/4 (at 0, 0, 1/4; 0, 0, 3/4) with Ca2-F bonds lying in (001). The OH anionic complex and Cl anion are too large to lie on the rigid plane defined by the Ca atoms, and the OH or Cl anion associated with the plane is displaced above or below the plane. Such a displacement locally destroys the P63/m symmetry by eliminating the mirror plane, as only one of the two mirror-symmetric sites above and below the plane is occupied. However, except in rare cases, over the crystal as a whole each mirror-related site is half-occupied, thus preserving the average P63/m symmetry.
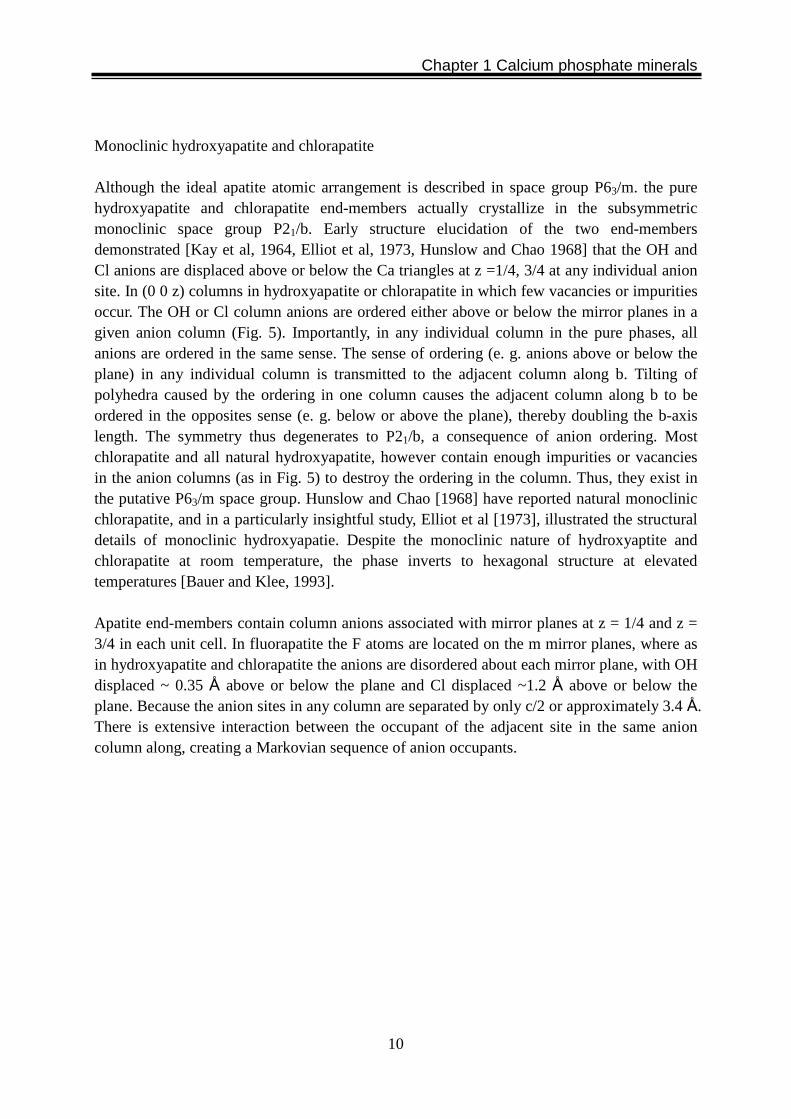
The polyhedral components of the apatite atomic arrangement combine to form the atomic arrangement pictured in Figure 4. That [001] projection shows the packing of the three polyhedra described above to yield the atomic arrangement of apatite.
Fig. 3 Schematic illustration of the anion positions in the (00z) plane. The F- anions are positioned in the center of the Ca2 triangles. The OH-
anions (illustrated) and Cl- are located above or below this position (Elliot, 1994)
Chapter 1 Calcium phosphate minerals
10
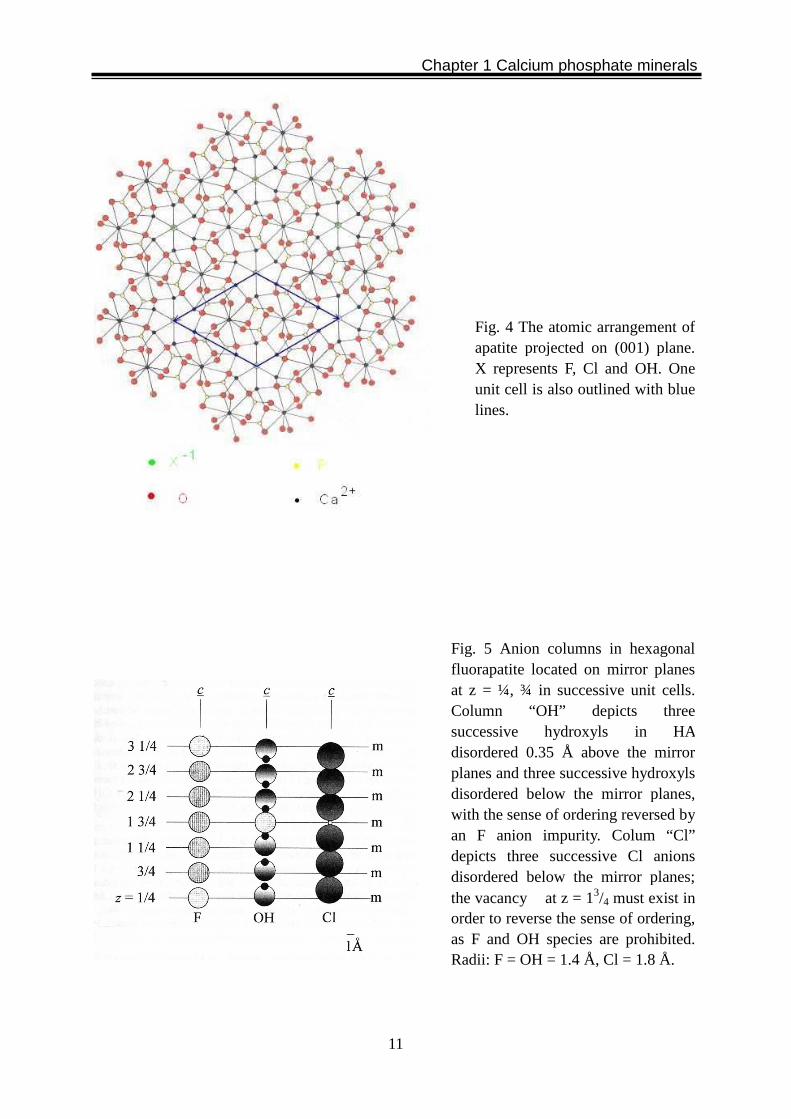
Monoclinic hydroxyapatite and chlorapatite Although the ideal apatite atomic arrangement is described in space group P63/m. the pure hydroxyapatite and chlorapatite end-members actually crystallize in the subsymmetric monoclinic space group P21/b. Early structure elucidation of the two end-members demonstrated [Kay et al, 1964, Elliot et al, 1973, Hunslow and Chao 1968] that the OH and Cl anions are displaced above or below the Ca triangles at z =1/4, 3/4 at any individual anion site. In (0 0 z) columns in hydroxyapatite or chlorapatite in which few vacancies or impurities occur. The OH or Cl column anions are ordered either above or below the mirror planes in a given anion column (Fig. 5). Importantly, in any individual column in the pure phases, all anions are ordered in the same sense. The sense of ordering (e. g. anions above or below the plane) in any individual column is transmitted to the adjacent column along b. Tilting of polyhedra caused by the ordering in one column causes the adjacent column along b to be ordered in the opposites sense (e. g. below or above the plane), thereby doubling the b-axis length. The symmetry thus degenerates to P21/b, a consequence of anion ordering. Most chlorapatite and all natural hydroxyapatite, however contain enough impurities or vacancies in the anion columns (as in Fig. 5) to destroy the ordering in the column. Thus, they exist in the putative P63/m space group. Hunslow and Chao [1968] have reported natural monoclinic chlorapatite, and in a particularly insightful study, Elliot et al [1973], illustrated the structural details of monoclinic hydroxyapatie. Despite the monoclinic nature of hydroxyaptite and chlorapatite at room temperature, the phase inverts to hexagonal structure at elevated temperatures [Bauer and Klee, 1993]. Apatite end-members contain column anions associated with mirror planes at z = 1/4 and z = 3/4 in each unit cell. In fluorapatite the F atoms are located on the m mirror planes, where as in hydroxyapatite and chlorapatite the anions are disordered about each mirror plane, with OH displaced ~ 0.35 Å above or below the plane and Cl displaced ~1.2 Å above or below the plane. Because the anion sites in any column are separated by only c/2 or approximately 3.4 Å. There is extensive interaction between the occupant of the adjacent site in the same anion column along, creating a Markovian sequence of anion occupants.
Chapter 1 Calcium phosphate minerals
11
Fig. 5 Anion columns in hexagonal fluorapatite located on mirror planes at z = ¼, ¾ in successive unit cells. Column “OH” depicts three successive hydroxyls in HA disordered 0.35 Å above the mirror planes and three successive hydroxyls disordered below the mirror planes, with the sense of ordering reversed by an F anion impurity. Colum “Cl” depicts three successive Cl anions disordered below the mirror planes; the vacancy � at z = 13/4 must exist in order to reverse the sense of ordering, as F and OH species are prohibited. Radii: F = OH = 1.4 Å, Cl = 1.8 Å.
Fig. 4 The atomic arrangement of apatite projected on (001) plane. X represents F, Cl and OH. One unit cell is also outlined with blue lines.
Chapter 1 Calcium phosphate minerals
12
Figure 5 depicts anion columns in fluorapatite, and near-end member hydroxyapatite and chlorapatite, and illustrates the nature of interaction in the anion columns in binary and ternary apatites. The spherical atoms are drawn to scale and illustrate the same in fluorapatite, with F atoms lying on the mirror planes. The hard-sphere model allows a fluorine atom at each successive anion site. In hydroxyapatite the hydroxyls are located ~0.35 Å above and below each mirror plane. To achieve the average disordered P63/m structure, half the hydroxyls in
any column must be located above the particular mirror plane and half below; this arrangement requires reversal sites in which the sense of ordering (above or below) is reversed. Figure 5 illustrates such a reversal site, with a fluorine impurity allowing a reversed sense of the ordering; a vacancy would also allow the same. Without such impurities the hydroxyl groups at a reversed site would be separated by ~2.7 Å, and the hydrogen atoms associated with the hydroxyl groups would be by ~0.8 Å which is clearly impossible. Thus with sufficient F or vacancy reversed sites, reversal of the ordering of the hydroxyl groups is facilitated and hydroxyapatite inverts from P21/b to P63/m symmetry. Incorporation of large Cl anion (1.81 Å radius) in the anion columns adds additional constraints to the structure. Because the lager Cl anion is displaced by ~1.2 Å below or above the plane as depicted in Fig. 5, the reversal from Cl ordered above the mirror plane to Cl ordered below the plane can only take place in combination with a vacancy, assuming that no adjustment in the anion site is required. Thus, for pure chlorapatite, the hexagonal phase must have stoichiometric vacancies to cause anion reversals in the anion columns.
1.5.7 Amorphous Calcium Phosphate (ACP) Crystalline hydroxyapatite is generally considered to be the final, stable products in the precipitation of calcium and phosphate ions from neutral to basic solutions. However, over the broad range of solution conditions in which precipitation occurs spontaneously, unstable amorphous calcium phosphates (ACPs) are unique among calcium phosphate salts as they lack the long-range, periodic order of crystalline materials. The ordered atomic arrangements which can exist in ACP are highly localized, occurring within domains that do not exceed 0.9 nm in diameter. Regularity in the local environment of individual Ca2+ ions in ACP appears to be limited within a distance of 0.3 nm. It was proposed that the basic structural unit of ACP is a 9.5 Å diameter, roughly circular cluster of ions comprising Ca9(PO4)6. The morphology seen in electron microscopy consists of roughly spherical Ca9(PO4)6 clusters aggregated randomly with their inter-cluster spaces filled with water. Temperature programmed dehydration of ACPs by Sedlak and Beebe [Sedlak and Beebe 1974] indicates that about 75% of this water is tightly bound inside the ACP particles, the rest is more loosely held surface water. These data suggest that solution-matured ACPs are hydrated salts with 1-3 water molecules associated with each formula unit as defined above. The transition of ACP to crystalline material is not gradual but occurs rather precipitously, and particularly sensitive to temperature and pH [Boskey and Posner, 1973]. The transformation processes occurs via a multiplicative proliferation of small crystals possibly through a dendritic-like growth mechanism. At pH values below 9.25, the concentration level falls off sharply when the preparative solutions reach the same thermodynamic stability as systems in
Chapter 1 Calcium phosphate minerals
13
equilibrium with OCP. This pause in the transformation process as the precipitate approaches the solubility of OCP is probably the most compelling thermodynamic evidence for OCP being the first crystalline phase to form at these lower pHs. The higher Ca/PO4 molar ratios and lower HPO4
2- % content of the solids possibly indicates that OCP already begins to convert to HA in this stage. This OCP/HA transformation, unlike ACP/OCP, seems to be partly an in-situ solid state rearrangement of the OCP structure, with simultaneous water loss, into the anhydrous apatite structure.
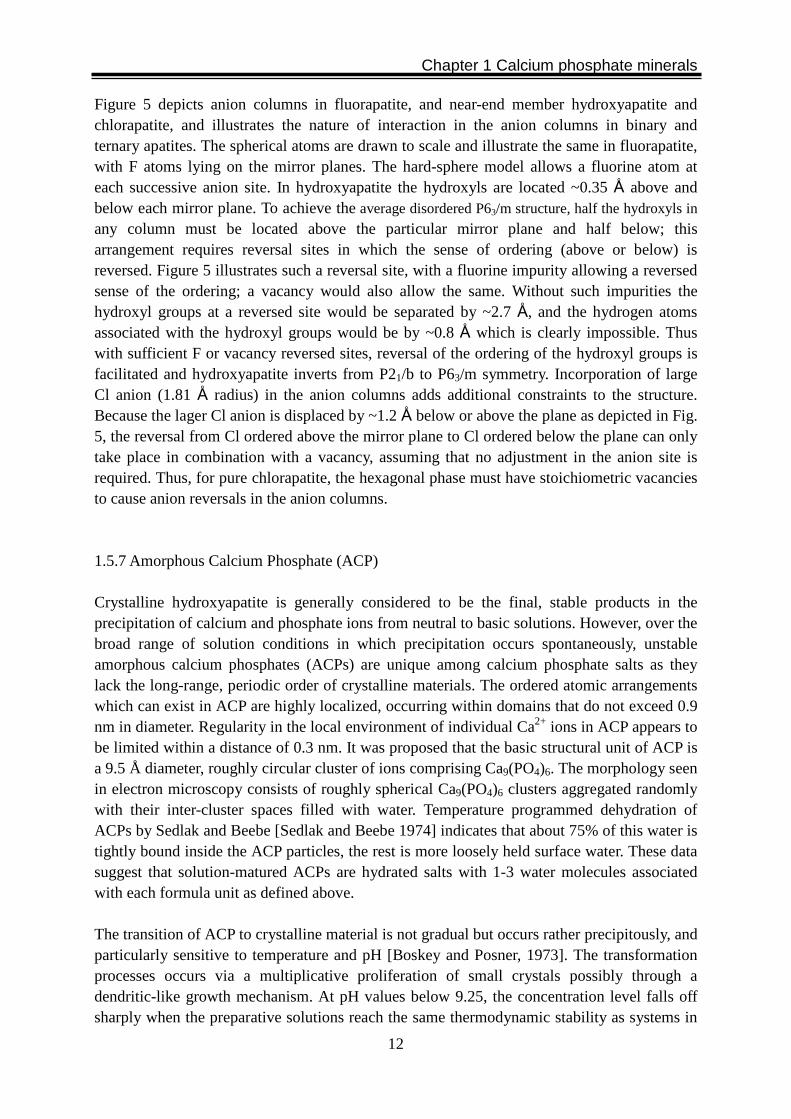
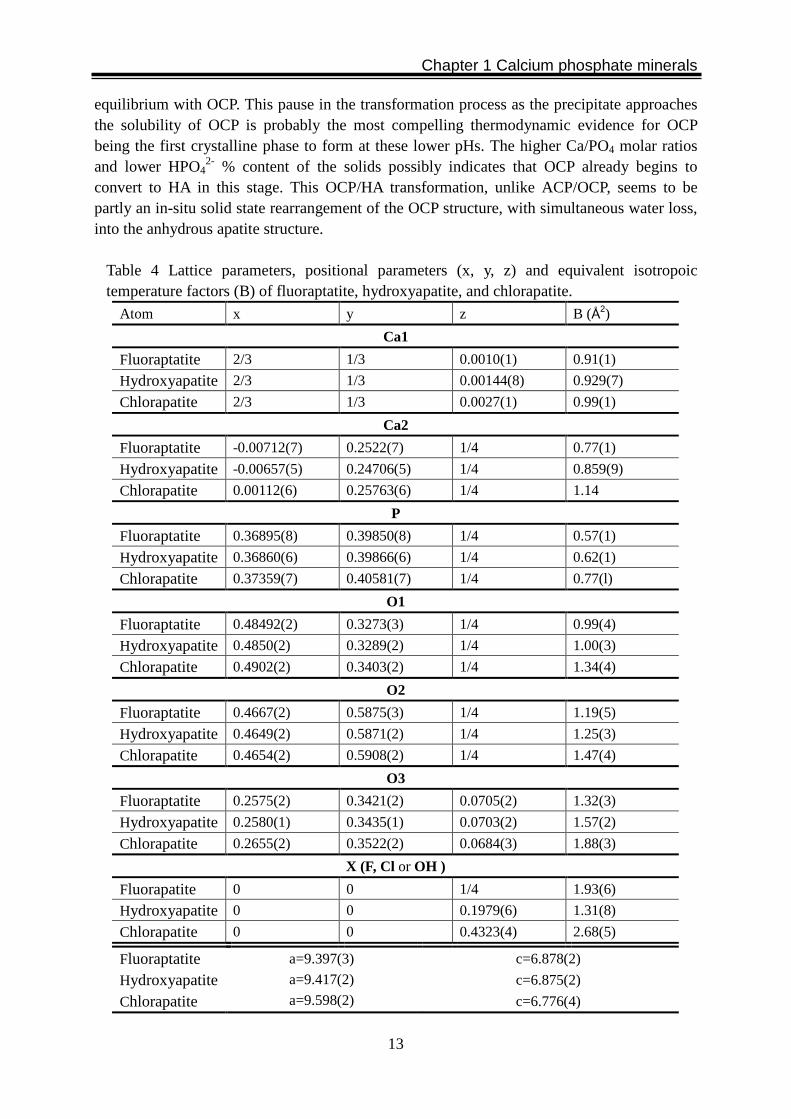
Table 4 Lattice parameters, positional parameters (x, y, z) and equivalent isotropoic temperature factors (B) of fluoraptatite, hydroxyapatite, and chlorapatite.
Atom x y z B (Å2)
Ca1
Fluoraptatite 2/3 1/3 0.0010(1) 0.91(1)
Hydroxyapatite 2/3 1/3 0.00144(8) 0.929(7)
Chlorapatite 2/3 1/3 0.0027(1) 0.99(1)
Ca2
Fluoraptatite -0.00712(7) 0.2522(7) 1/4 0.77(1)
Hydroxyapatite -0.00657(5) 0.24706(5) 1/4 0.859(9)
Chlorapatite 0.00112(6) 0.25763(6) 1/4 1.14
P
Fluoraptatite 0.36895(8) 0.39850(8) 1/4 0.57(1)
Hydroxyapatite 0.36860(6) 0.39866(6) 1/4 0.62(1)
Chlorapatite 0.37359(7) 0.40581(7) 1/4 0.77(l)
O1
Fluoraptatite 0.48492(2) 0.3273(3) 1/4 0.99(4)
Hydroxyapatite 0.4850(2) 0.3289(2) 1/4 1.00(3)
Chlorapatite 0.4902(2) 0.3403(2) 1/4 1.34(4)
O2
Fluoraptatite 0.4667(2) 0.5875(3) 1/4 1.19(5)
Hydroxyapatite 0.4649(2) 0.5871(2) 1/4 1.25(3)
Chlorapatite 0.4654(2) 0.5908(2) 1/4 1.47(4)
O3
Fluoraptatite 0.2575(2) 0.3421(2) 0.0705(2) 1.32(3)
Hydroxyapatite 0.2580(1) 0.3435(1) 0.0703(2) 1.57(2)
Chlorapatite 0.2655(2) 0.3522(2) 0.0684(3) 1.88(3)
X (F, Cl or OH )
Fluorapatite 0 0 1/4 1.93(6)
Hydroxyapatite 0 0 0.1979(6) 1.31(8)
Chlorapatite 0 0 0.4323(4) 2.68(5)
Fluoraptatite c=6.878(2)
Hydroxyapatite c=6.875(2)
Chlorapatite
a=9.397(3)
a=9.417(2)
a=9.598(2) c=6.776(4)

Chapter 2 Synthetic HA-based biomaterials
14
Chapter 2
Synthetic Hydroxyapatite-based biomaterials
The fields of biomedical materials has grown rapidly over the past 20 years and offers solutions to repair defects, correct deformities, replace damaged tissues and provide therapy. In developing materials used for implantation consideration must be given to both, the influence of implanted material on the body and, how the body affects the integrity of the implanted material. According to Hench, the implanted materials can be classified as inert, bioactive, or resorbable materials [Hench, 1998]. Generally, “inert” materials will evoke a physiological response to form a fibrous capsule, thus, isolating the material from the body. Calcium phosphates fall into the categories of bioactive and resorbable materials. A bioactive material will dissolve slightly, but promote the formation of an apatite layer before interfacing directly with the tissue on the atomic level. Such an implant will provide good stabilization for materials that are subject to mechanical loading. A bioresorbable material will, however, dissolve and allow tissue to grow into any surface irregularities but may not necessarily interface directly with the original material [Le Geros, 2003 and Neo et al., 1992].
2.1 Historical overview
Calcium phosphate materials are abundant in nature and in living system. It is not surprising therefore, that calcium phosphate is considered as a potential biomaterial. However, it was not until 1920 that the first use of calcium phosphate for bone repair as an implanted biomaterial was reported [Albee and Morrison, 1920]. More than fifty years later the first dental application of a calcium phosphate [Nery, et al., 1975] and the use of dense hydroxyapatite (HA) cylinders for immediate tooth root replacement [Denissen and de Groot, 1979] were reported. Commercialization of synthetic calcium hydroxyapatite in dental and medical applications occurred in the 1980’s, largely through the pioneering efforts of Jarcho [1977], de Groot [1983] and Aoki [1987]. A very important reason for preparation of HA based biomaterials is the similarity of its chemical composition and structure to the mineral constituents of hard tissue. HA seems to be the most appropriate ceramic materials for artificial teeth and/or bones due to excellent biocompatibility and bioactivity. Unfortunately, mechanical properties of pure HA ceramic are poor. For example, fracture toughness (K1c) does not exceed the value of 1.0 MPa·m1/2
(human bone 2-12 MPa·m1/2). Additionally, the weibull modulus (n) is low in wet environments (n=5-12) [Hench 1991; De With et al., 1981], which indicates low reliability of HA implants. Presently the HA ceramics cannot be used as heavy-load implants such as artificial teeth or bones. Its medical applications are limited to small unloaded implants, powders, coatings and low-loaded porous implants. In order to improve the reliability of HA
Chapter 2 Synthetic HA-based biomaterials
15
ceramics, various reinforcements (ceramic, metallic, or polymer) have been used. Moreover HA coated metals have been introduced as artificial bones and tooth root.
2.2 Present status of HA-based biomaterials
2.2.1 Pure HA materials The present status of the pure HA ceramics as a biomaterial has already been well established, however, calcium phosphate biomaterials that are available commercially from different suppliers exhibit high chemical variability [Tadic and Epple, 2004]. This section summarizes the knowledge about processing of the HA ceramics, starting from the synthesis of powders, sintering of dense and porous bodies. HA powders Multiple techniques have been used to synthesize HA powders, as reviewed in several works [e. g., Le Geros et al., 1995]. Two main ways are wet methods and solid state reactions. The wet methods can be divided into three groups: precipitation, hydrothermal technique and hydrolysis of other calcium phosphates. Depending on the technique, materials with varying morphology, stoichiometry and level of crystallinity can be obtained. Solid state reactions usually give a stoichiometric and well-crystallized product, but they required relatively high temperatures and long heat-treatment times. Precipitation from solution is the most common synthesis route and involves simultaneous addition of a calcium salt and a phosphate compound to water, or drop-wise addition of the phosphate into an aqueous solution of the calcium salt. Examples of calcium salts include calcium nitrate, calcium hydroxide, calcium chloride, or calcium acetate. The salts are reacted with a hydrogen phosphate or the phosphate ions are introduced into the solution from di-ammonium hydrogen phosphate or orthophosphoric acid. The crystals obtained using the precipitation method have shapes of blades, needles, rods, or equiaxed particles. Their crystallinity and Ca/P ratio depends strongly upon the precipitation conditions and are in many cases lower than 1.67. During aqueous precipitation, other species, such as NH4+, H2O, O2-, CO3
2-, HPO42-, may be
substituted in the structure or adsorbed onto the surface [Pan and Fleet, 2002]. Addition of more than one substitute element/group can lead to a combination of an expansion and contraction of the unit cell. The hydrothermal technique usually gives HA materials with a higher degree of crystallinity and with a Ca/P ratio close to the stoichiometric value. Their crystal size is in the range of nanometers to millimetres. Hydrolysis of tricalcium phosphate, monetite, brushite or octocalcium phosphate requires low temperatures (usually below 100 oC) and results in HA needles or blades having the size of microns. However, the hydrolysis products are highly nonstoichiometric and containing impurities. There are also alternative techniques for precipitation of HA powders, such as sol-gel, flux method, electrocrystallization [Shirkhanzadeh et al., 1993], spay-pyrolysis [Luo et al., 1995], mechano-chemical method [Toriyama et al., 1996], or emulsion processing [Elliot, 1994]. Dense HA ceramics
Chapter 2 Synthetic HA-based biomaterials
16
Pure, dense HA ceramics can be obtained through a sintering process. The sintering process involves calcification, and compaction at room temperature followed by heating at high temperature. Calcification is usually performed at 600-900 oC for apatites intended for high temperature processing. Adsorbed moisture, carbonates and chemicals remaining from the synthesis stage, such as ammonia and nitrates in some specific reactions, are removed as gaseous products. The removal of these gases facilitates the production of dense materials during sintering. The chemical changes are accompanied by an increase in crystal size and a decrease in the specific surface area. Apatites with a Ca/P molar ratio exceed the value of 1.67, and CaO forms during sintering. The existence of CaO is reported to decrease the strength and may even cause the decohesion of the whole material due to stresses arrising from the formation of Ca(OH)2 which subsequently transforms into CaCO3, and related volume changes [Slosarczyk et al., 1996]. It may also alter the rate and extent of biodegradation. If the Ca/P molar ratio of HA is lower than 1.67, β-TCP or α-TCP forms in the HA ceramics [Raynaud et al., 2002]. Moreover, the decomposition process itself may have a negative influence on the densification of the HA ceramics due to the formation of a new phase and evaporation of water. The Ca/P ratio was reported not to influence significantly the grain growth of HA ceramics. Many of the HA powders can be pressurelessly sintered up to theoretical density at moderated temperatures 1000oC -1200oC [Aoki, 1991; Fang et al., 1995; Barralet et al., 2003]. Processing at higher temperatures may lead to exaggerated grain growth [van Lanuyft et al., 1995] and/or decomposition of HA and subsequently to strength degradation [Ruys, et al., 1995]. Hot pressing (HP) [Aoki, 1991], hot isostatic pressing (HIP) [Uematsu et al., 1989], or HIP-post sintering [Somiya et al., 1988] make it possible to decrease grain size, and achieve higher densities. This leads to finer microstructures, higher thermal stability of HA, and subsequently better mechanical properties of the prepared HA ceramics. An alternative technique to conventional sintering, HP, or HIP, is a plasma-discharged sintering process [Guo et al., 2003; Li and Gao, 2003; Shen et al., 2001]. Fracture toughness (KIc) of pure, dense HA ceramics is in the range of 0.8-1.2 MPa·m1/2 with an average of 1.0 MPa·m1/2 [Suchanek and Yoshimura, 1998; Elliot, 1994]. It decreases almost linearly with increasing porosity, and the fracture energy is in the range of 2.3-20 J/m2 [Aoki, 1991; Elliot, 1994]. Bending strength, compressive strength, and tensile strength of the dense HA ceramics are in the range of 38-250 MPa [Suchanek and Yoshimura, 1998], 120-900 MPa, and 38-300 MPa, respectively. The scatter of data is caused by statistical nature of strength distribution, influence of remaining microporosity, grain size, impurities etc.. The Young’s modulus (E) of dense ceramics is in the range of 35-120 GPa [Aoki, 1991]. It depends mostly on the measurement technique, also on remaining porosity, presence of impurities, etc.. The Young’s modulus measured in bending mode is between 44 GPa and 88 GPa [Aoki, 1991]. Ultrasonic techniques give higher values of about 115 GPa [de With et al., 1981]. The Vicker’s hardness (Hv) of dense HA is between 3.0 GPa and 7.0 GPa [Suchanek and Yoshimura, 1998]. Dense HA ceramics exhibit superplasticity at 1000-1100 oC, with a deformation mechanism based on grain boundary sliding [Wakai et al., 1990]. The wear
Chapter 2 Synthetic HA-based biomaterials
17
resistance and friction coefficient of dense HA ceramics is comparable to that of human enamel [Rootare, 1978]. Porous HA materials A porous HA ceramic provides mechanical fixation in addition to allowing chemical bonding between HA and bone. Moreover, an interconnecting pore network offers circulation of nutrients and facilitates deeper bone penetration. The inclusion of pores increases the solubility at the expense of mechanical properties. Thus porous HA implants can not be heavy loaded and are used to fill only small bone defects. Pore size can be divided in two different groups: microporous (< 5 µm pores) and macroporous (> 100 µm pores) [de Groot, 1981]. The microporosity is important for the bioresorbability of the material. The macroporosity plays an important role in the osteoconductivity. A large macroporosity (i.e., 400 – 600 µm) facilitates infiltration by fibrovascular tissue and revascularization, allowing bone reconstruction. The optimum macroporosity for the ingrowth of bone tissue, as stated by several investigators, is in the range between 150 and 500 µm. Pores can be created by a variety of techniques. Via sintering methodology, pores can be created by control of crystallite morphology [Nakahira et al., 2000] or sintering parameters [Liu, 1996] to obtain a different degree of particle coalescence. Such pores are small and can not accommodate bone ingrowth. The process can be modified by including a foaming agent prior to heating [Dong et al., 2001] or by the evolution of gases from hydrogen peroxide [Peelen et al., 1978] or organic compounds such as naphthalene [Monroe et al., 1971], polyvinylacrylate [Vaz et al., 1999] or starch [Rodriguez-Lorenzo et al., 2001] during the heating cycle. The pore architecture of naturally occurring porous networks in coral can be preserved by converting carbonate to carbonate-hydroxyapatite via a hydrothermal process in diammonium hydrogen phosphate solution at 275 oC, and 82.7 MPa [Roy and Linnehan, 1974]. The pseudo-hexagonal structure of aragonite facilitates the conversion to the hexagonal unit cell of HA. Conversions of calcite, under the same conditions produces tricalcium phosphate [Zaremba et al., 1998]. This process preserves the interconnection porosity and produces a carbonated, strontium enriched HA along with magnesium substituted β-TCP. The stimulation of bone ingrowth by strontium shown in other studies improves the integration of converted corals in bones. Recent work has revealed that hydrothermal processing in the presence of a potassium dihydrogen phosphate can cause a complete transformation to an apatite [Xu et al., 2001]. Trabecular bone from a bovine source already possesses the desired porosity [Hing et al., 1999] and can be used as a suitable porous body after removal of the organic fraction by heating [Juang et al., 1994]. 2.2.2 HA-based composites It seems that if the physical and chemical parameters can be well controlled it is possible to prepare dense and/or porous HA ceramics with tailed microstructure and chemical composition. This is necessary for a sufficient understanding of HA processing, both during
Chapter 2 Synthetic HA-based biomaterials
18
powder preparation and ceramic fabrication as discussed in the previous section. However, there is a limit of HA applications due to low mechanical reliability. The preparation of HA based composites can partially solve the problem, as will be discussed below. Moreover, HA composites can be fabricated to control the biological properties of implants. HA ceramic composites In recent years, many reinforcements, including particles [Guo et al., 2003; Juang et al., 1994], platelets [Noma et al., 1993], whiskers [Nonami and Satoh, 1995; Ioku et al., 1990], or long fibres [de With and Corbijn, 1989] have been used in HA ceramics to improve its reliability. Table 5 summarizes the components and some mechanical properties of HA-based ceramic composites. An advantage of the composite approach is the increase of toughness and strength of the HA ceramics. However, the introduction of foreign materials into the HA matrix may lead to a decrease of the biocompatibility and may promote the decomposition of HA and the formation of tricalcium phosphate. Generally speaking, bioactivity (i.e. ability of bonding to the bone) of HA reinforced with bioinert materials should be lower than the bioactivity of pure HA [Kasuga et al., 1992]. Another disadvantage of the composite approach applied to HA is related to its processing. It is difficult to densify the HA-based composites by pressureless sintering. So sintering additives are used to enhance the densification of HA by liquid phase sintering and/or the increase of diffusion coefficients of HA. In most cases, however, a decomposition of HA with subsequent formation of TCP or CaO occurred [Adolfsson et al., 1999 and 2000]. The first bioactive material developed by Hench almost 30 years ago exhibit high bioactivity and biocompatibility [Hench, 1991]. The combination of bioactive glass with HA resulted in bioceramics with improved mechanical properties without degradation of the biocompatibility and/or bioactivity. Bioactive glass ceramic, A/W, is an excellent example of this kind of composite. In such composites, apatite and/or wollastonite crystalline phases crystallize from the glassy matrix during appropriate heat treatments [Kukubo, 1991]. Bioactive glass-ceramics maintain high strength for a longer time than HA both in vitro and in vivo conditions [Kukubo, 1991]. Generally, in spite of significantly improved strength and toughness HA-based ceramic composites did not find wide applications due to their decrease of biocompatibility and/or bioactivity, as well as due to difficulties with processing. It should be mentioned that another kind of HA based ceramic composites aiming to control its biological performance, for example, HA/TCP biphasic calcium phosphate ceramics has attracted much attention in recent years [Livingston et al., 2003; Gauthier et al., 1999]. HA coatings One of the most important clinical applications of HA is the coating on metal implants to form a macrocomposite material. This macrocomposite combines mechanical advantages of metal alloys with the excellent biocompatibility and bioactivity of HA. First of all, such composites provide stable fixation of the implant to the bone and minimize an adverse reaction caused by the release of metal ions from the implant body.
Chapter 2 Synthetic HA-based biomaterials
19
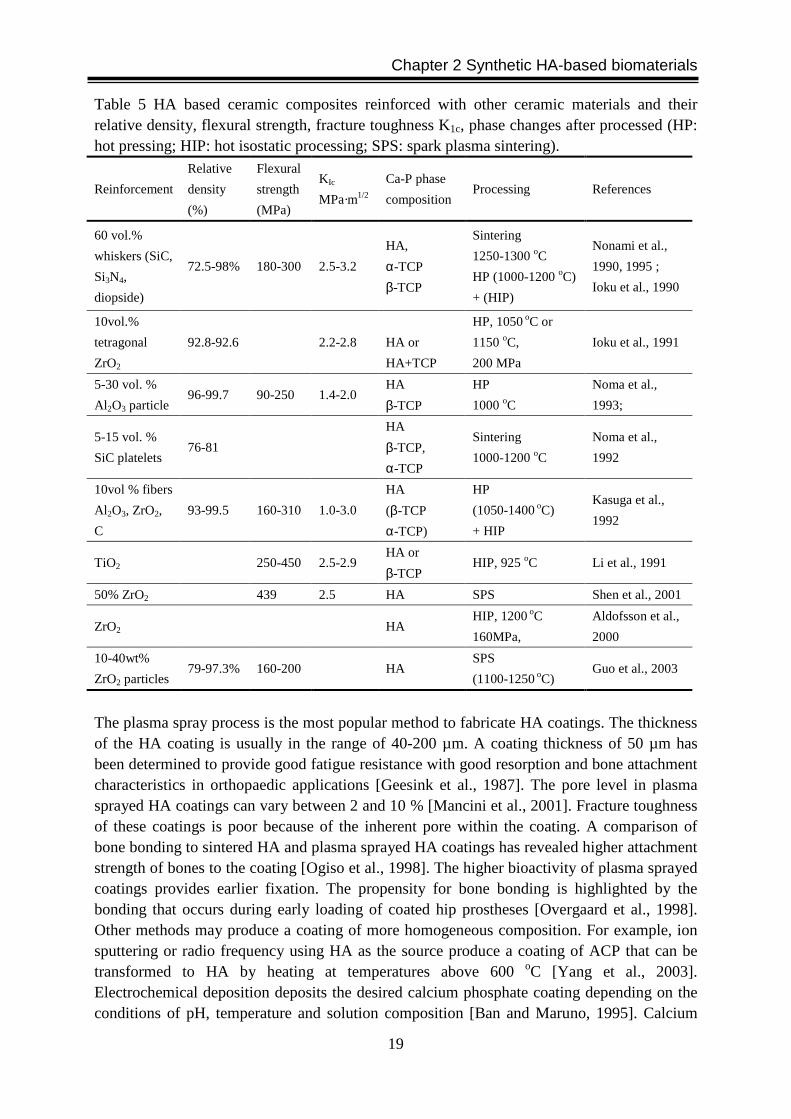
Table 5 HA based ceramic composites reinforced with other ceramic materials and their relative density, flexural strength, fracture toughness K1c, phase changes after processed (HP: hot pressing; HIP: hot isostatic processing; SPS: spark plasma sintering).
Reinforcement
Relative
density
(%)
Flexural
strength
(MPa)
K Ic
MPa·m1/2
Ca-P phase
composition Processing References
60 vol.%
whiskers (SiC,
Si3N4,
diopside)
72.5-98% 180-300 2.5-3.2
HA,
α-TCP
β-TCP
Sintering
1250-1300 oC
HP (1000-1200 oC)
+ (HIP)
Nonami et al.,
1990, 1995 ;
Ioku et al., 1990
10vol.%
tetragonal
ZrO2
92.8-92.6 2.2-2.8
HA or
HA+TCP
HP, 1050 oC or
1150 oC,
200 MPa
Ioku et al., 1991
5-30 vol. %
Al 2O3 particle 96-99.7 90-250 1.4-2.0
HA
β-TCP
HP
1000 oC
Noma et al.,
1993;
5-15 vol. %
SiC platelets 76-81
HA
β-TCP,
α-TCP
Sintering
1000-1200 oC
Noma et al.,
1992
10vol % fibers
Al 2O3, ZrO2,
C
93-99.5 160-310 1.0-3.0
HA
(β-TCP
α-TCP)
HP
(1050-1400 oC)
+ HIP
Kasuga et al.,
1992
TiO2 250-450 2.5-2.9 HA or
β-TCP HIP, 925 oC Li et al., 1991
50% ZrO2 439 2.5 HA SPS Shen et al., 2001
ZrO2 HA HIP, 1200 oC
160MPa,
Aldofsson et al.,
2000
10-40wt%
ZrO2 particles 79-97.3% 160-200 HA
SPS
(1100-1250 oC) Guo et al., 2003
The plasma spray process is the most popular method to fabricate HA coatings. The thickness of the HA coating is usually in the range of 40-200 µm. A coating thickness of 50 µm has been determined to provide good fatigue resistance with good resorption and bone attachment characteristics in orthopaedic applications [Geesink et al., 1987]. The pore level in plasma sprayed HA coatings can vary between 2 and 10 % [Mancini et al., 2001]. Fracture toughness of these coatings is poor because of the inherent pore within the coating. A comparison of bone bonding to sintered HA and plasma sprayed HA coatings has revealed higher attachment strength of bones to the coating [Ogiso et al., 1998]. The higher bioactivity of plasma sprayed coatings provides earlier fixation. The propensity for bone bonding is highlighted by the bonding that occurs during early loading of coated hip prostheses [Overgaard et al., 1998]. Other methods may produce a coating of more homogeneous composition. For example, ion sputtering or radio frequency using HA as the source produce a coating of ACP that can be transformed to HA by heating at temperatures above 600 oC [Yang et al., 2003]. Electrochemical deposition deposits the desired calcium phosphate coating depending on the conditions of pH, temperature and solution composition [Ban and Maruno, 1995]. Calcium
Chapter 2 Synthetic HA-based biomaterials
20
phosphate precipitation on treated titanium or titanium alloy substrates also produces an apatite coating [Habibovic et al., 2002]. HA-polymer composites One of the most interesting approaches to improve the reliability and decreases the stiffness of the HA biomaterials is the fabrication of HA-polymer composites. Bonfield and co-workers [1988] developed HA-polyethylene composites. With increasing HA content both, the Young’s modulus and the bioactivity of the composites increase, while the ductility decreases. The HA-polyethylene composites exhibit brittle/ductile transition at a HA volume content of 40-50 %. As compared to the cortical bone, the composites have superior fracture toughness for HA concentrations lower than 40 % and similar fracture toughness in the 45-50 % range. Their young’s modulus is in the range of 1-8 GPa, which is quite close to the Young’s modulus of bones. Unfortunately, the HA-polyethylene composites are not biodegradable. Moreover, the presence of bioinert polyethylene decreases the ability of bonding to the bones. Resorbable polymer systems have been used to fabricate HA-polymer composites for bone remodelling and rebuilding. Bone can be filled the empty space and adapt to the new loading conditions as the material degrades. The polymer systems used for this approach include polylactic acid [Ignjatovic et al., 2001], collagen [Yamasaki et al., 2003] starch [Mano et al., 1999], chitosan [Hu et al., 2004] and polyglycolic acid [Durucan and Brown, 2000]. A polylactic acid-hydroxyapatite composite has been successfully used for repair of the rib cage in a child [Watanabe et al., 1989]. HA-metal composites The combination of the bioactivity of HA and the favourable mechanical properties of metals are considered as a promising approach to fabricate more perfect biomedical materials for load-bearing applications. On the one hand, improvements of mechanical properties of HA-metal composites have been clearly demonstrated, on the other hand, some undesired drawbacks with the HA-metal composites were observed as well. The 20vol % Ti reinforced HA, sintered at 1000 oC, shows a doubled bending strength and the fracture toughness improves from 0.663 to 0.987 MPa•m1/2 compared with the pure HA ceramics sintered at a similar conditions [Chu et al., 2002]. Moreover, the serious reaction between HA and Ti greatly reduces the structural stability of HA. In vacuum, HA-Ti composites with a Ti content of 10 wt% and 20 wt%, respectively, converted after heat treatment at 1100 oC into a ceramic composites with the phases of HA, α-TCP, CaTi2O5 [Yang et al., 2004]. For Ag-HA composites pressurelessly sintered at 1250 oC, the fracture toughness is consistently improved with increasing silver inclusions. At 30 vol % Ag the composites has a toughness 3.5 times larger than that of the matrix HA. The toughening is partly due to crack deflection and mostly due to crack bridging at silver particles [Zhang et al., 1997].
Chapter 2 Synthetic HA-based biomaterials
21
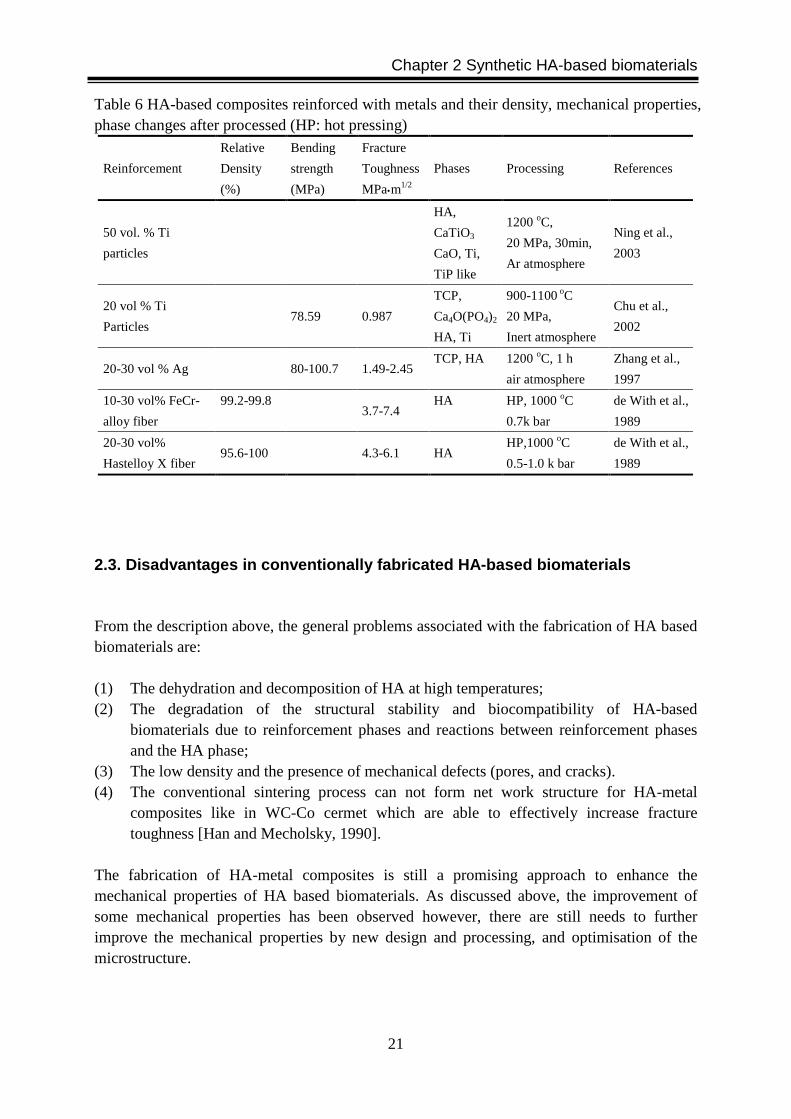
Table 6 HA-based composites reinforced with metals and their density, mechanical properties, phase changes after processed (HP: hot pressing)
Reinforcement
Relative
Density
(%)
Bending
strength
(MPa)
Fracture
Toughness
MPa•m1/2
Phases Processing References
50 vol. % Ti
particles
HA,
CaTiO3
CaO, Ti,
TiP like
1200 oC,
20 MPa, 30min,
Ar atmosphere
Ning et al.,
2003
20 vol % Ti
Particles 78.59 0.987
TCP,
Ca4O(PO4)2
HA, Ti
900-1100 oC
20 MPa,
Inert atmosphere
Chu et al.,
2002
20-30 vol % Ag 80-100.7 1.49-2.45 TCP, HA
1200 oC, 1 h
air atmosphere
Zhang et al.,
1997
10-30 vol% FeCr-
alloy fiber
99.2-99.8
3.7-7.4
HA
HP, 1000 oC
0.7k bar
de With et al.,
1989
20-30 vol%
Hastelloy X fiber 95.6-100 4.3-6.1 HA
HP,1000 oC
0.5-1.0 k bar
de With et al.,
1989
2.3. Disadvantages in conventionally fabricated HA-based biomaterials
From the description above, the general problems associated with the fabrication of HA based biomaterials are: (1) The dehydration and decomposition of HA at high temperatures; (2) The degradation of the structural stability and biocompatibility of HA-based
biomaterials due to reinforcement phases and reactions between reinforcement phases and the HA phase;
(3) The low density and the presence of mechanical defects (pores, and cracks). (4) The conventional sintering process can not form net work structure for HA-metal
composites like in WC-Co cermet which are able to effectively increase fracture toughness [Han and Mecholsky, 1990].
The fabrication of HA-metal composites is still a promising approach to enhance the mechanical properties of HA based biomaterials. As discussed above, the improvement of some mechanical properties has been observed however, there are still needs to further improve the mechanical properties by new design and processing, and optimisation of the microstructure.
Chapter 2 Synthetic HA-based biomaterials
22
2.4 New concepts and processing for the development of HA-based biomaterials
Living organisms can produce biological materials with properties that suppress those of the currently produced engineering materials. The study of their structure together with physical and mechanical properties could give information to design and to fabricate technological materials for practical and health applications. Therefore, the implication of biological material structure for the optimisation of HA based biomaterials will be considered in this dissertation. Spark plasma sintering [Shen et al., 2001; Li and Gao, 2003], and microwave sintering [Kutty et al., 2001] are recently used to fabricate HA based biomaterials. Such advanced techniques are fast speed heating rate, short dwell time and high effectiveness which can produce dense HA -based biomaterials, even nanostructured materials without deterioration of the structural stability of HA. Densification at high pressure and temperature has also been applied to prepare C-SiC nanoceramic composities and Zn-SiC metal ceramic composites [Ekimov et al., 2000; Gierlotka et al., 2003; Swiderska-Sroda et al., 2003]. The pressure helps the penetration of one phase into the grain boundary of another phase. Formation of a 3 dimensional network or homogeneously dispersion of toughening phase can greatly improve the mechanical properties of resulting materials. In this dissertation, the microstructure of dental enamel will be investigated and ideas derived from the study of the microstructural characteristics of dental enamel will be applied for the fabrication and tailoring HA metal composites. Consolidation at high temperature and pressure will be carried out with the aim to obtain HA composites mimicking the biological microstructure of dental enamel.
Chapter 3 Experimental methods
23
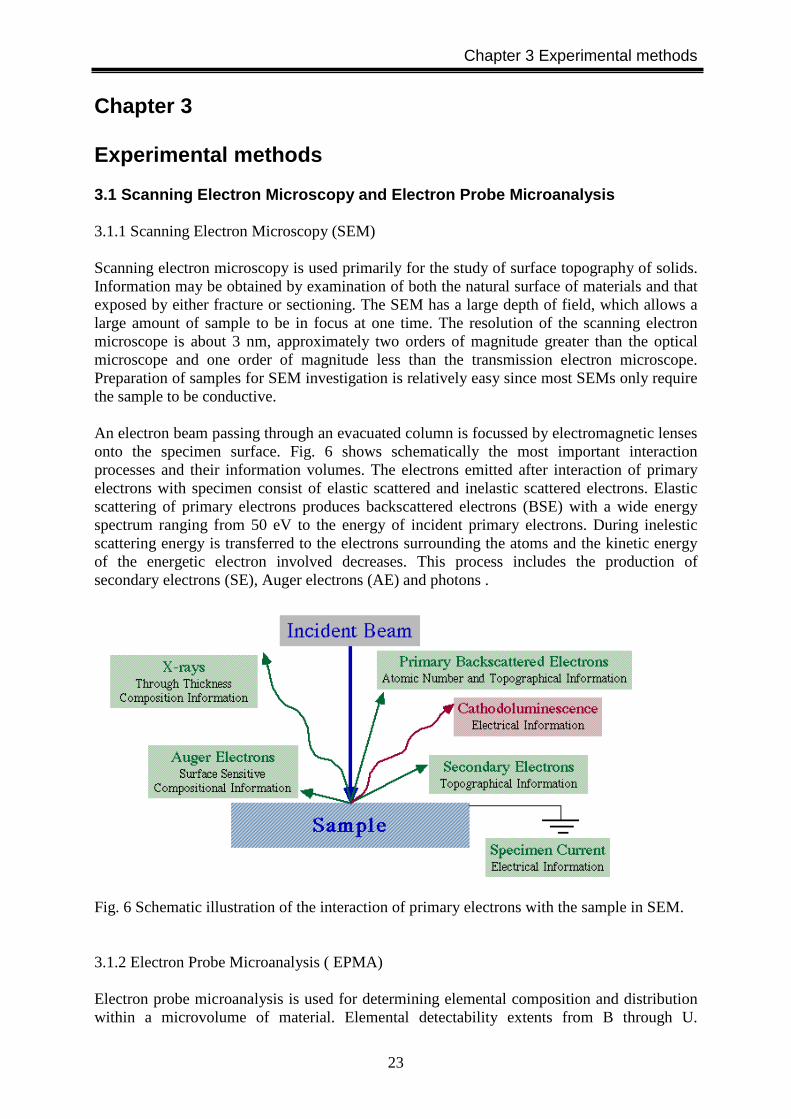
Chapter 3 Experimental methods 3.1 Scanning Electron Microscopy and Electron Probe Microanalysis 3.1.1 Scanning Electron Microscopy (SEM) Scanning electron microscopy is used primarily for the study of surface topography of solids. Information may be obtained by examination of both the natural surface of materials and that exposed by either fracture or sectioning. The SEM has a large depth of field, which allows a large amount of sample to be in focus at one time. The resolution of the scanning electron microscope is about 3 nm, approximately two orders of magnitude greater than the optical microscope and one order of magnitude less than the transmission electron microscope. Preparation of samples for SEM investigation is relatively easy since most SEMs only require the sample to be conductive. An electron beam passing through an evacuated column is focussed by electromagnetic lenses onto the specimen surface. Fig. 6 shows schematically the most important interaction processes and their information volumes. The electrons emitted after interaction of primary electrons with specimen consist of elastic scattered and inelastic scattered electrons. Elastic scattering of primary electrons produces backscattered electrons (BSE) with a wide energy spectrum ranging from 50 eV to the energy of incident primary electrons. During inelestic scattering energy is transferred to the electrons surrounding the atoms and the kinetic energy of the energetic electron involved decreases. This process includes the production of secondary electrons (SE), Auger electrons (AE) and photons .
Fig. 6 Schematic illustration of the interaction of primary electrons with the sample in SEM. 3.1.2 Electron Probe Microanalysis ( EPMA) Electron probe microanalysis is used for determining elemental composition and distribution within a microvolume of material. Elemental detectability extents from B through U.

Chapter 3 Experimental methods
24
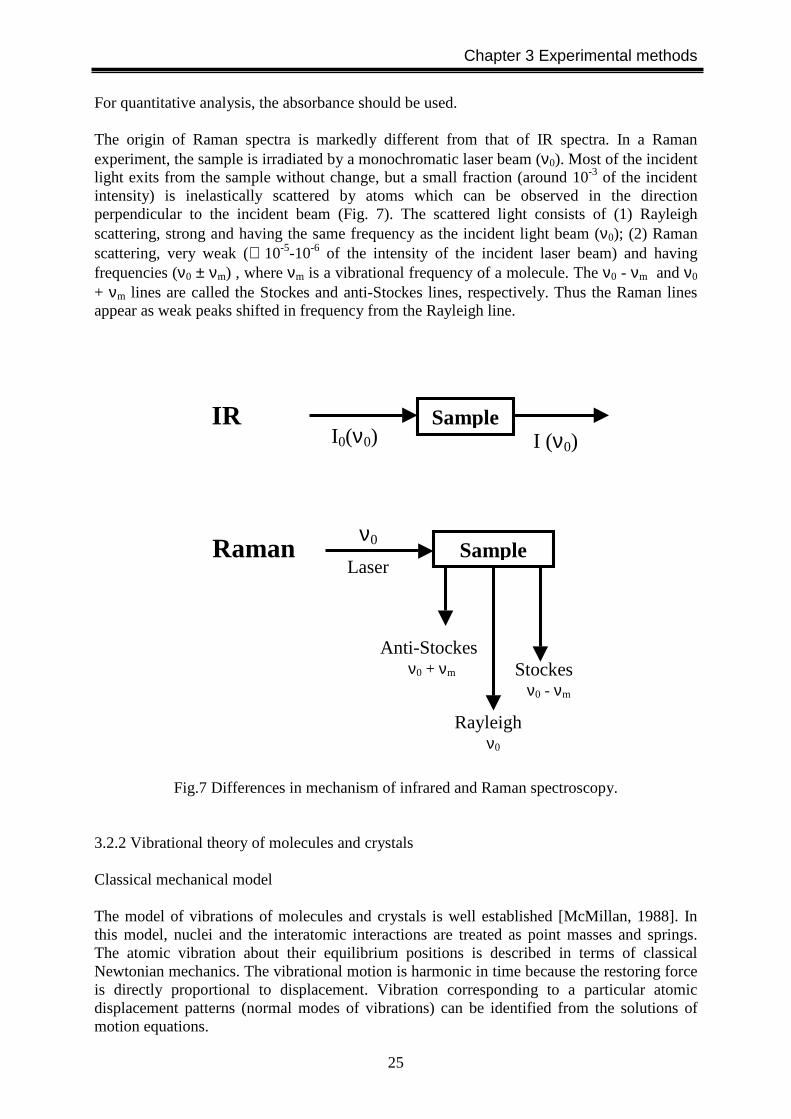
Microprobe analysis is most commonly used in conjunction with SEM imaging and allow analyses to be performed directly on the areas under electron beam observation. When specimens are bombarded by a high energy electron beam characteristic X-ray fluorescence radiation is produced (Fig. 6). By incorporating either energy dispersive or wavelength dispersive spectrometers directly into the instrument, it is possible to obtain X-ray spectra directly on the area as seen by the electron beam and to get qualitative and quantitative elemental data from a volume on the order of 1 µm3. Data can be obtained from an isolated region of the sample (spot mode), along a preselected linear trace (line profiling) or from an area (X-ray distribution mapping). Elemental sensitivity in microprobe analysis is on the order of 100 ppm for wavelength dispersive X-ray analysis and about 1000 ppm for energy dispersive X-ray analysis. 3. 2 Vibrational spectroscopy Vibrational spectroscopy involves the use of electromagnetic radiation to probe the vibrational behaviour of molecular systems via an absorption or a light scattering experiment. The vibrational energy range of molecules and crystals is approximately between 0-5000 cm-1, which corresponds to the infrared region of the electromagnetic spectrum. Infrared spectroscopy (IR) studies the direct absorption of light by molecular vibrations. Raman spectroscopy or Raman scattering studies the energy changes of the incident laser light beam due to the inelastic interaction between the incident light beam and the vibrational excitation. Both, infrared and Raman techniques give rise to a vibrational spectrum containing a set of absorption or scattering peaks as a function of energy. Individual peaks in the spectrum correspond to energies of vibrational transitions within the sample or to the frequencies of its vibrational modes. Vibrational spectroscopy has been qualitatively and quantitatively applied to analyse the structural or molecular group or phase in a sample in chemistry, physics, mineralogy and many other scientific branches. 3.2.1 Origins of infrared and Raman spectroscopy In infrared absorption experiment, infrared radiation with an intensity I0 and frequency ν0 is passed through a sample and the intensity of the transmitted light I is measured as a function of its frequency. Absorption of light at ∆E = hν occurs at frequencies corresponding to the energies of vibrational transitions. According to Beer-Lambert law:
I = I0e-εcd (3.1)
Here, I0 and I denote the intensities of the incident and transmitted beams, respectively, ε is the molecular absorption coefficient, and c and d are the concentration of the sample and the cell length, respectively (Fig. 7). In IR spectroscopy, both the percentage transmission (T) or absorbance (A) are usually plotted versus wave number. The definitions of T and A are:
T (%) = I/I0 × 100 (3.2)
and A = log I0/I = εcd (3.3)
Chapter 3 Experimental methods
25
For quantitative analysis, the absorbance should be used. The origin of Raman spectra is markedly different from that of IR spectra. In a Raman experiment, the sample is irradiated by a monochromatic laser beam (ν0). Most of the incident light exits from the sample without change, but a small fraction (around 10-3 of the incident intensity) is inelastically scattered by atoms which can be observed in the direction perpendicular to the incident beam (Fig. 7). The scattered light consists of (1) Rayleigh scattering, strong and having the same frequency as the incident light beam (ν0); (2) Raman scattering, very weak (∼ 10-5-10-6 of the intensity of the incident laser beam) and having frequencies (ν0 ± νm) , where νm is a vibrational frequency of a molecule. The ν0 - νm and ν0 + νm lines are called the Stockes and anti-Stockes lines, respectively. Thus the Raman lines appear as weak peaks shifted in frequency from the Rayleigh line.
Fig.7 Differences in mechanism of infrared and Raman spectroscopy. 3.2.2 Vibrational theory of molecules and crystals Classical mechanical model The model of vibrations of molecules and crystals is well established [McMillan, 1988]. In this model, nuclei and the interatomic interactions are treated as point masses and springs. The atomic vibration about their equilibrium positions is described in terms of classical Newtonian mechanics. The vibrational motion is harmonic in time because the restoring force is directly proportional to displacement. Vibration corresponding to a particular atomic displacement patterns (normal modes of vibrations) can be identified from the solutions of motion equations.
Sample I0(ν0) I (ν0)
IR
Raman
Rayleigh ν0
Sample Laser
ν0
Stockes ν0 - νm
Anti-Stockes ν0 + νm

Chapter 3 Experimental methods
26
Quantum mechanical models This advanced model describes not only the basic features of vibrational motion but also explains why vibrational spectra are line spectra rather than continuous absorptions and the interaction of vibrations with light. This model is based on the Schoedinger’s wave equation which is constructed in terms of the vibrational displacement coordinates qi and an potential energy function V(qi). A set of vibrational wave function Ψi resolved from the partial differential equations in the vibrational wave equation describes a set of vibrational normal mode, and a set of quantized energy. In a vibrational spectroscopic experiment, a transition between vibrational levels with quantum numbers νi and νj is excited, and light is absorbed or emitted with an energy corresponding to the separations between the levels. Crystal lattice vibration The number of vibrational modes observed for a molecule is equal to 3N-6 or (3N-5 for a linear molecule) determined by the number of degrees of vibrational freedom. In the case of crystal, N is very large, but most of the modes are not observed in infrared and Raman spectroscopy. The reason for this is the translational symmetry of the atoms in the crystal. Crystal lattice vibrations occur in the form of displacement waves travelling through the crystal. These lattice waves can be described longitudinal or transverse depending on the nuclear displacements which are parallel or perpendicular to the wave propagation direction. The displacements of nuclei give rise to an oscillating dipole wave with the frequency equal to the oscillation frequency of individual atoms about their equilibrium positions and wavelength defined by that of the associated lattice vibration. Only the wave length of lattice vibrations is comparable to that of incident light (approximately 5×10⁻⁵-5×10⁻⁶ Å in IR, and usually 10-3 -10-4 Å in Raman spectra), when an interaction of lattice vibration with incident light takes place. In these long wavelength lattice vibrations, the vibrations within adjacent unit cells are essentially in phase, so the number of vibrational modes which may be observed in IR or Raman spectroscopy is equal to 3N-3, where N is the number of atoms in the primitive unit cell. These 3N-3 vibrations are termed the optic modes. The three acoustic branches are responsible for the propagation of sound waves through the lattice. 3.2.3 Selection rules for infrared and Raman spectra Some vibrational modes of a molecule or a crystal are IR - active and not Raman-active or vice versa, and some modes are not observable at all. To determine whether the vibration is active in the IR and Raman spectra the selection rules must be applied to each normal mode. Since the origins of IR and Raman spectra are different, their selection rules are also distinctively different. In the simple model, the selection rules can be retionalized by considering the interaction between the oscillating electric field vector of the light beam and a changing molecular dipole moment associated with the vibration. According to quantum mechanics, a vibration is IR-active if the dipole moment is changed during the direct interaction of light beam with an oscillating molecular dipole. In general, asymmetric vibrations tend to give stronger infrared absorption than symmetric species. Similarly highly polar molecules and crystals have stronger infrared spectra than non-polar samples. In Raman scattering, the light beam induces an instantaneous dipole moment in molecule by deforming its electronic wave function. For a vibration is Raman-active if the polarizability is changed during vibration. In general, molecules containing easily polarizable atoms (such as
Chapter 3 Experimental methods
27
I, S, Ti) have very strong Raman spectra, while similar molecules with less polarizable atoms (Si, C, O) have weaker spectra. Most symmetric modes tend to give the strongest Raman signals as these are associated with the largest changes in polarizability. For more complicated molecules and crystals, IR and Raman activities of vibrational modes can be simplified by use of the molecular or unit cell symmetry, and the method of group theory. 3.2.4 Comparison of infrared and Raman spectroscopy Although IR and Raman spectroscopies are similar in that both techniques provide information on vibrational frequencies. There are many advantages and disadvantages inherent to each spectroscopic technique.
(1) Some vibrations are inherently weak in IR and strong in Raman spectra. Vibrations are generally strong in Raman if the bond is covalent and strong in IR if the bond is ionic.
(2) Depolarisation ratios measured using Raman provide reliable information about the symmetry of a normal vibration which is difficult to obtain by IR.
(3) Laser source of Raman spectroscopy can focus on a spot around 1 µm compared to 20 µm of IR light source, this is a great advantage for small quantity of samples.
(4) Water is a weaker Raman scatterer and stronger IR absorber, Raman is ideal for studies of biological compounds in solutions.
(5) In Raman spectroscopy, the region from 4000-50 cm-1 can be covered by a single recording while in IR grating, beam splitter and detector must be changed to cover the same region.
(6) Local heating or photo decomposition may be caused by high power laser source in Raman spectroscopy and fluorescence occurs in some samples when irradiated by the laser beam.
It should be noted that vibrational spectroscopy is unique in that it is applicable to solid sate, gaseous state and solution. Combination of IR and Raman can provide more information of molecular structures in the sample than other techniques which usually integrates on larger time and length scales. 3.3 X-Ray Analysis 3.3.1 X-ray Powder Diffraction X-ray powder diffraction (XRD) is used to obtain information about the structure, composition and state of polycrystalline materials. The sample may be powders, solids, films. If a monochromatic X-ray beam is directed at a crystalline material one can observes reflection or diffraction of the X-rays at various angles with respect to the primary beam. The well known Bragg equation describes the relationship between the wavelength of the X-ray beam, λ, the angle of the diffraction, 2θ, and the distance between each set of atomic planes of the crystal lattice, d. nλ = 2d sinθ (3.4) where n represents the order of diffraction. From this equation the interplannar distance of the crystalline material can be calculated. The interplannar spacings depend solely on the

Chapter 3 Experimental methods
28
dimension of the crystal’s unit cell while the intensities of the diffracted rays are a function of the placement of the atoms in the unit cell. The X-ray diffraction pattern of a crystalline phase is unique. An unknown phase is identified by comparing the interplannar spacings and intensities of its powder pattern to the patterns in the powder diffraction file. In addition to identify the compounds in a powder, analysis of the diffraction pattern is also used to determine crystalline size, the degree of crystallinity of materials being studied. There are also some specific use of powder XRD, e.g., the study of order-disorder transition using low and high temperature diffractormetry; the determination of precise crystallograhphic lattice constants; structure determination by Rietveld refinement of a whole powder pattern. 3.3.2 X-ray Fluorescence Spectroscopy X-ray fluorescence spectroscopy (XRF) is none destructive method for the analytical determination of elements (both qualitative and quantitative). The XRF technique is based on the principle that if an atom is bombarded with highly energetic photons, some of its electrons are ejected. As other electrons fill the energy levels vacated by the ejected electrons, they emit quanta of radiation characteristic of that particular atom type. Hence, each element has its own set of characteristic emission or X-ray fluorescence lines. The advantage of using synchrotron radiation sources in XRF is that it contains the entire X-ray spectrum. The search for trace elements using synchrotron radiation makes the process up to 1000 times more sensitive than the usual methods of elemental analysis. Furthermore, fluorescence analysis with synchrotron radiation is not limited to the examination of surface, it can also focus on a point less than 1 micrometer in diameter, individual areas of the sample can be analysed separately. 3.4 Measurements of mechanical properties 3.4.1 Microhardness Microhardness testing is a common test method for determining material hardness of a variety of materials. The microindentation test is a reliable, proven way of determining the hardness of small precision parts, thin material or wire, coatings, and performing case depth determinations. There are two different indenters commonly used to determine materials hardness, i.e. Knoop indenter and Vickers indenter. The indenter used in Knoop test is a rhombic-based pyramidal diamond that produces an elongated diamond shaped indent. Knoop tests are mainly done at test forces from 10 g to 1000 g. The Knoop test procedure can be found in ASTM E384. The Vickers (HV) test is also known as the Diamond Pyramid Hardness (DPH) test. The Vickers test has two distinct force ranges, micro (10 g to 1000 g) and macro (1 kg to 100 kg), to cover all testing requirements. The indenter is the same for both ranges therefore Vickers hardness values are continuous over the total range of hardness for metals (typically HV100 to HV1000). With the exception of test forces below 200 g, Vickers values are generally considered test force independent. In other words, if the material tested is uniform, the Vickers values will be the same if tested using a 500 g force or a 50 kg force. Hence, below 200g caution must be used when trying to compare results.
The Vickers test method are defined according the force used in the standards ASTM E 384 for micro force ranges (10 g-1 kg), and ASTM E 92 for macro force ranges (1 kg-100 kg).
Chapter 3 Experimental methods
29
(1) The indenter is pressed into the sample surface by an accurately controlled test force.
(2) The force is maintained for a specific dwell time, normally 10 – 15 seconds.
(3) After the dwell time is complete, the indenter is removed leaving an indent in the sample that appears square shaped on the surface.
(4) The size of the indent is determined optically by measuring the two diagonals of the square indent.
(5) The Vickers hardness number is a function of the test force divided by the surface area of the indent. The average of the two diagonals is used in the following formula to calculate the Vickers hardness.
Hv = F/2a2 (3.5)
Where Hv is the microhardness, F is the load and 2a the length of indent diagonal (Fig. 8)
3.4.2 Fracture toughness Fracture toughness is an important engineering characteristic of solid materials. It is a measure of the degree of resistance of a material when under a load, to its sudden catastrophic failure through crack propagation. The fracture toughness determination with Vickers hardness indentation was proposed by Evans and Charles [Evans and Charles, 1976] and later extended and modified by others [e. g. Anstis et al, 1981]. With this method the fracture toughness is calculated from the length of cracks which develop during a Vickers indentation test and can be measured optically at the specimen surface. Fig. 8 illustrates the development of Vickers indentation cracks. Below the Vickers prymid a deformation zone develops (Fig. 8a). During loading and unloading two perpendicular cracks are initiated starting at the deepest location of the deformation zone (Fig. 8b) and propagate to the specimen surface (Fig. 8c). The final crack is nearly semicircular (Fig. 8d). The crack length at the surface (Fig. 8e) is 2c, the length of indentation diagonal 2a. For materials with a relatively high toughness, e. g. WC-Co materials, a different crack system develops at not too high loads. Directly below the surface, radial shallow cracks occur. These cracks are called Palmqvist cracks. The length of the Palmqvist cracks l is measured from the ends of the impression diagonals (Fig. 8f). Therefore, c = a + l.
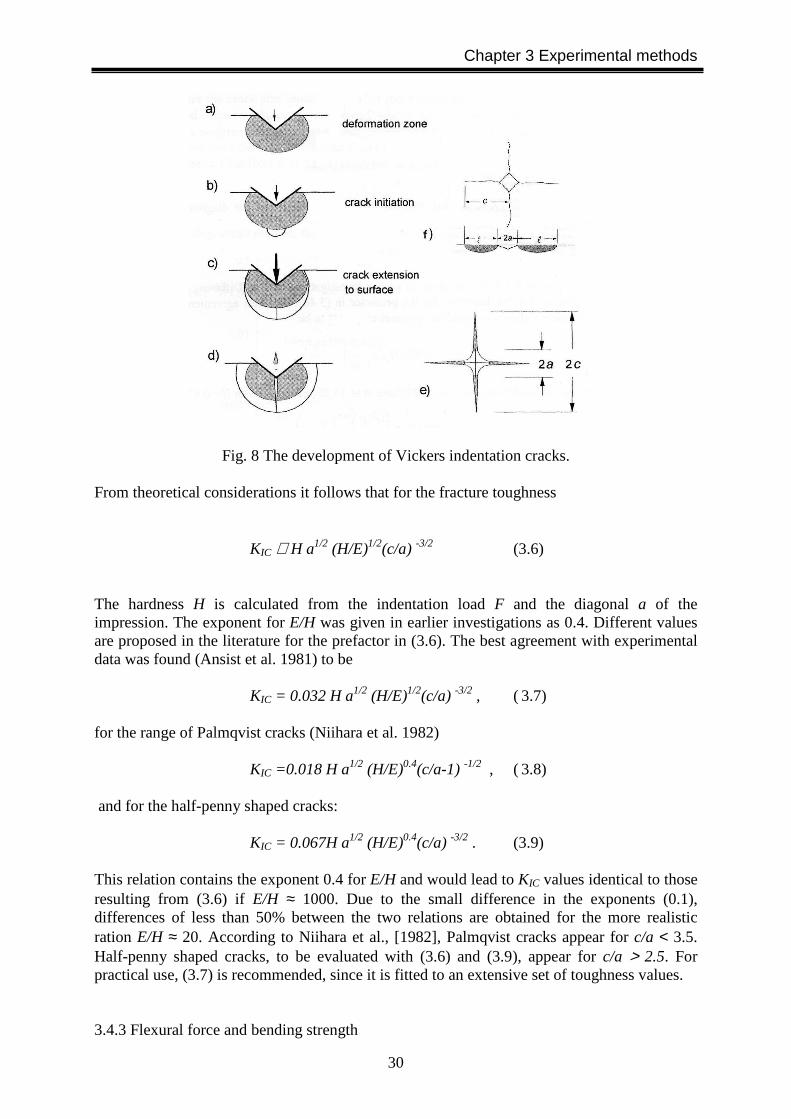
Chapter 3 Experimental methods
30
Fig. 8 The development of Vickers indentation cracks.
From theoretical considerations it follows that for the fracture toughness
KIC ∝ H a1/2 (H/E)1/2(c/a) -3/2 (3.6)
The hardness H is calculated from the indentation load F and the diagonal a of the impression. The exponent for E/H was given in earlier investigations as 0.4. Different values are proposed in the literature for the prefactor in (3.6). The best agreement with experimental data was found (Ansist et al. 1981) to be KIC = 0.032 H a1/2 (H/E)1/2(c/a) -3/2 , ( 3.7) for the range of Palmqvist cracks (Niihara et al. 1982) KIC =0.018 H a1/2 (H/E)0.4(c/a-1) -1/2 , ( 3.8) and for the half-penny shaped cracks: KIC = 0.067H a1/2 (H/E)0.4(c/a) -3/2 . (3.9) This relation contains the exponent 0.4 for E/H and would lead to KIC values identical to those resulting from (3.6) if E/H ≈ 1000. Due to the small difference in the exponents (0.1), differences of less than 50% between the two relations are obtained for the more realistic ration E/H ≈ 20. According to Niihara et al., [1982], Palmqvist cracks appear for c/a < 3.5. Half-penny shaped cracks, to be evaluated with (3.6) and (3.9), appear for c/a > 2.5. For practical use, (3.7) is recommended, since it is fitted to an extensive set of toughness values. 3.4.3 Flexural force and bending strength
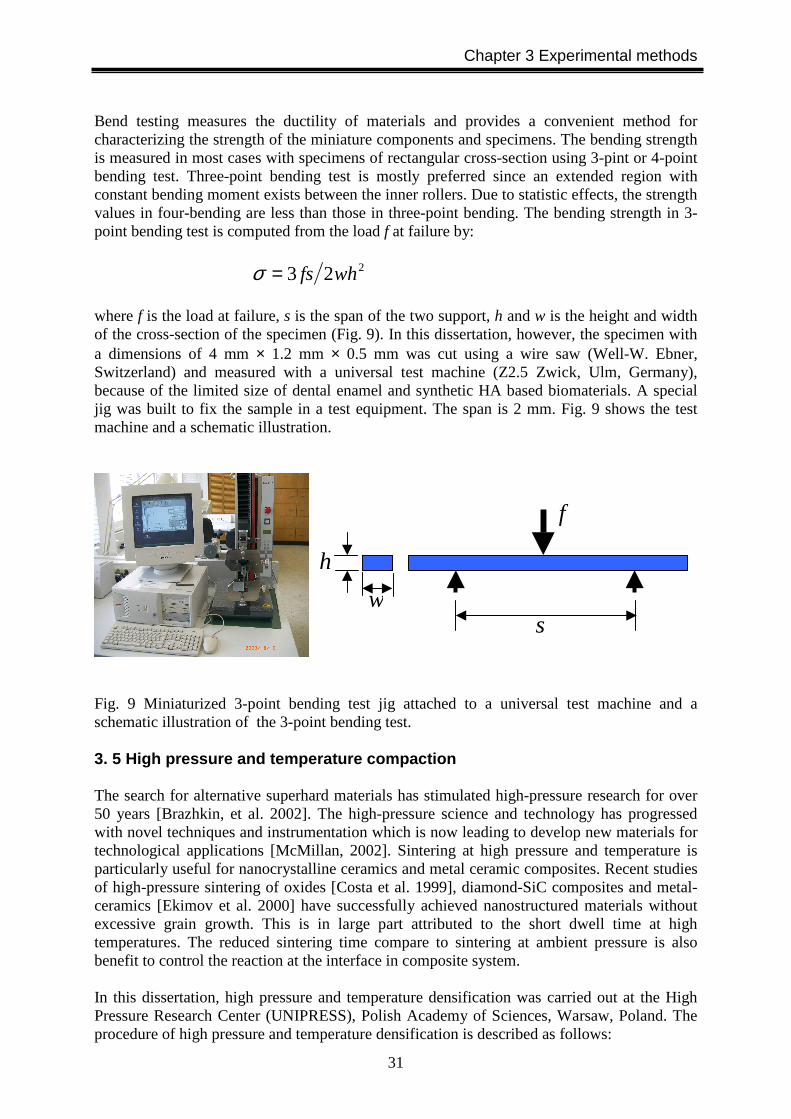
Chapter 3 Experimental methods
31
Bend testing measures the ductility of materials and provides a convenient method for characterizing the strength of the miniature components and specimens. The bending strength is measured in most cases with specimens of rectangular cross-section using 3-pint or 4-point bending test. Three-point bending test is mostly preferred since an extended region with constant bending moment exists between the inner rollers. Due to statistic effects, the strength values in four-bending are less than those in three-point bending. The bending strength in 3-point bending test is computed from the load f at failure by:
where f is the load at failure, s is the span of the two support, h and w is the height and width of the cross-section of the specimen (Fig. 9). In this dissertation, however, the specimen with a dimensions of 4 mm × 1.2 mm × 0.5 mm was cut using a wire saw (Well-W. Ebner, Switzerland) and measured with a universal test machine (Z2.5 Zwick, Ulm, Germany), because of the limited size of dental enamel and synthetic HA based biomaterials. A special jig was built to fix the sample in a test equipment. The span is 2 mm. Fig. 9 shows the test machine and a schematic illustration.
Fig. 9 Miniaturized 3-point bending test jig attached to a universal test machine and a schematic illustration of the 3-point bending test. 3. 5 High pressure and temperature compaction The search for alternative superhard materials has stimulated high-pressure research for over 50 years [Brazhkin, et al. 2002]. The high-pressure science and technology has progressed with novel techniques and instrumentation which is now leading to develop new materials for technological applications [McMillan, 2002]. Sintering at high pressure and temperature is particularly useful for nanocrystalline ceramics and metal ceramic composites. Recent studies of high-pressure sintering of oxides [Costa et al. 1999], diamond-SiC composites and metal-ceramics [Ekimov et al. 2000] have successfully achieved nanostructured materials without excessive grain growth. This is in large part attributed to the short dwell time at high temperatures. The reduced sintering time compare to sintering at ambient pressure is also benefit to control the reaction at the interface in composite system. In this dissertation, high pressure and temperature densification was carried out at the High Pressure Research Center (UNIPRESS), Polish Academy of Sciences, Warsaw, Poland. The procedure of high pressure and temperature densification is described as follows:
s w
h
f
223 whfs=σ
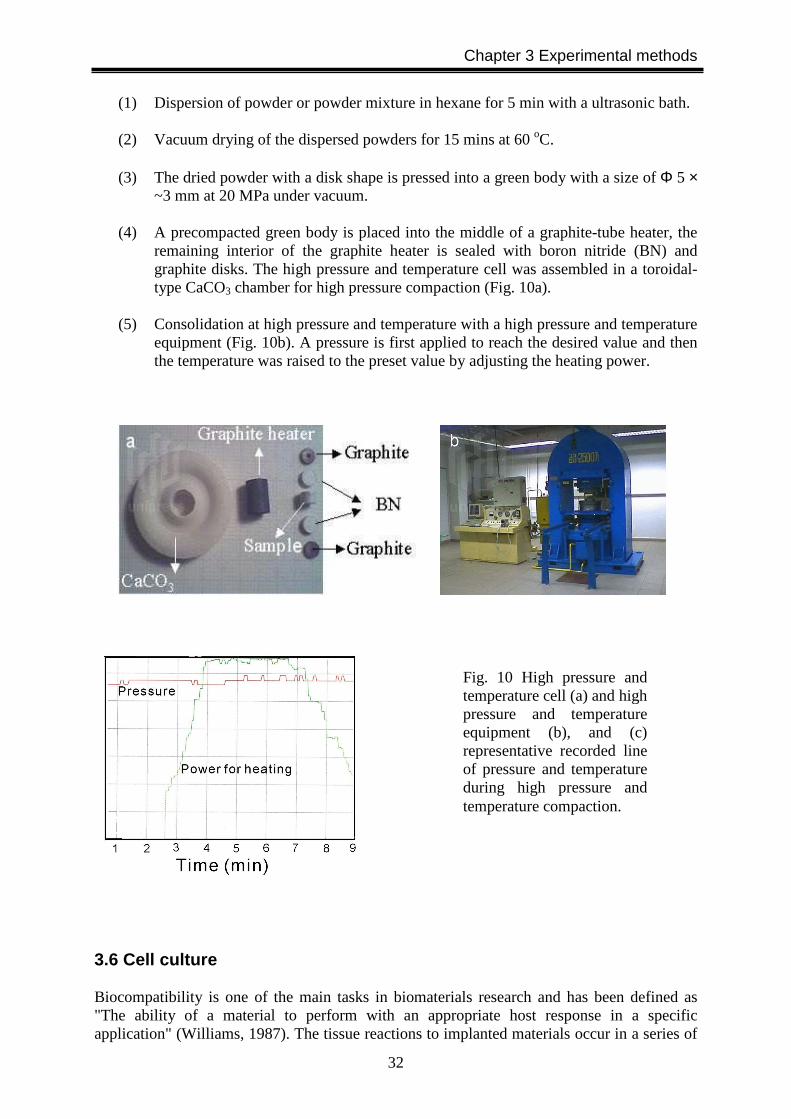
Chapter 3 Experimental methods
32
(1) Dispersion of powder or powder mixture in hexane for 5 min with a ultrasonic bath. (2) Vacuum drying of the dispersed powders for 15 mins at 60 oC. (3) The dried powder with a disk shape is pressed into a green body with a size of Φ 5 ×
~3 mm at 20 MPa under vacuum. (4) A precompacted green body is placed into the middle of a graphite-tube heater, the
remaining interior of the graphite heater is sealed with boron nitride (BN) and graphite disks. The high pressure and temperature cell was assembled in a toroidal-type CaCO3 chamber for high pressure compaction (Fig. 10a).
(5) Consolidation at high pressure and temperature with a high pressure and temperature
equipment (Fig. 10b). A pressure is first applied to reach the desired value and then the temperature was raised to the preset value by adjusting the heating power.
3.6 Cell culture Biocompatibility is one of the main tasks in biomaterials research and has been defined as "The ability of a material to perform with an appropriate host response in a specific application" (Williams, 1987). The tissue reactions to implanted materials occur in a series of
Fig. 10 High pressure and temperature cell (a) and high pressure and temperature equipment (b), and (c) representative recorded line of pressure and temperature during high pressure and temperature compaction.
Chapter 3 Experimental methods
33
numerous and complex responses which often take place over many months. A very sensitive method for testing the unwanted toxicity of biomaterials and their degradation products is the assessment of in vitro toxicity. In vitro cell culture methods have the advantage of relatively well-controlled variables and are generally accepted as a very effective method for biocompatibility testing. Their sensitivity is equal to or even greater than that of in vivo tests and are carried out as follows. Osteoblasts were isolated by sequential trypsin-collagenase digestion on calvaria of neonatal (< 48 h old) Sprague-Dawley rats. In short, the calvaria were excised under aseptic conditions and kept in ice cold phosphate buffered saline (PBS). The fibrous layers of the periostea were mechanically removed. The calvaria were then incubated with Dulbecco’s modified Eagle medium (DMEM) for 2 × 10 min at 37 oC and rinsed 2 × 5 min with PBS. To diminish fibroblastic contamination and cell debris, the calvaria were preincubated for 20 min in enzyme solution (18000 units/ml collagenase I, 0.125% trypsin, 0.004M EDTA and 0.02% Dnase I at 37 oC) and discarded the supernatant. After continuous enzyme treatment (6 × 20 min) the third and fourth supernatants were centrifuged (10 min at 1000 r.p.m.; 250 g). The pellets were resuspended in DMEM containing 10 % fetal bovine serum (FBS) and maintained in a 95 % humidity, 5 % CO2 balanced air incubator at 37 oC. The phenotype and function of the osteoblasts were characterized by the presence of alkaline phophatase and deposition of calcium phosphate mineral in vitro. The disks were sterilized in water vapour and placed in 96-well culture plates. 100 µl of the osteoblast cell suspension with cell density of 2.5 × 10⁵ cells/ml was added into each well and flooded with grow medium RPMI 1640 supplemented with 4% FCS. The culture medium was changed every 2 or 3 days during culture. After 3 or 7 days, the medium was pipetted out from the dishes, and the plates were fixed in glutaraldehydrate for 10 min. Dehydration was carried out in ascending alcohol series of 50 %, 70 %, 96 % and 100 %, each concentration for 3 times with 10 min for each. Then the plates were immersed in alcohol solutions containing 33 %, 50 %, 67 % and 100 % HMDS, respectively, 3 times at each concentration and 10 min for each time. After evaporated in air for 24h, the disks were coated with carbon films and examined using SEM.
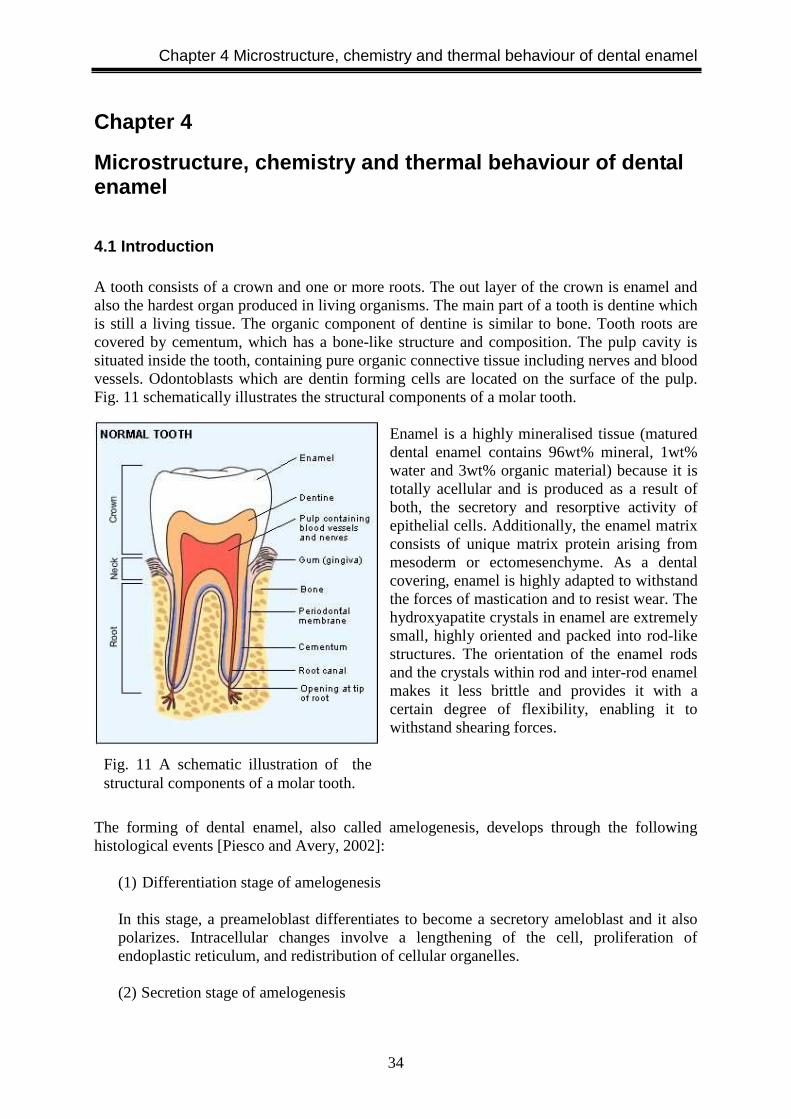
Chapter 4 Microstructure, chemistry and thermal behaviour of dental enamel
34
Chapter 4
Microstructure, chemistry and thermal behaviour of dental enamel
4.1 Introduction A tooth consists of a crown and one or more roots. The out layer of the crown is enamel and also the hardest organ produced in living organisms. The main part of a tooth is dentine which is still a living tissue. The organic component of dentine is similar to bone. Tooth roots are covered by cementum, which has a bone-like structure and composition. The pulp cavity is situated inside the tooth, containing pure organic connective tissue including nerves and blood vessels. Odontoblasts which are dentin forming cells are located on the surface of the pulp. Fig. 11 schematically illustrates the structural components of a molar tooth.
Enamel is a highly mineralised tissue (matured dental enamel contains 96wt% mineral, 1wt% water and 3wt% organic material) because it is totally acellular and is produced as a result of both, the secretory and resorptive activity of epithelial cells. Additionally, the enamel matrix consists of unique matrix protein arising from mesoderm or ectomesenchyme. As a dental covering, enamel is highly adapted to withstand the forces of mastication and to resist wear. The hydroxyapatite crystals in enamel are extremely small, highly oriented and packed into rod-like structures. The orientation of the enamel rods and the crystals within rod and inter-rod enamel makes it less brittle and provides it with a certain degree of flexibility, enabling it to withstand shearing forces.
The forming of dental enamel, also called amelogenesis, develops through the following histological events [Piesco and Avery, 2002]:
(1) Differentiation stage of amelogenesis In this stage, a preameloblast differentiates to become a secretory ameloblast and it also polarizes. Intracellular changes involve a lengthening of the cell, proliferation of endoplastic reticulum, and redistribution of cellular organelles.
(2) Secretion stage of amelogenesis
Fig. 11 A schematic illustration of the structural components of a molar tooth.
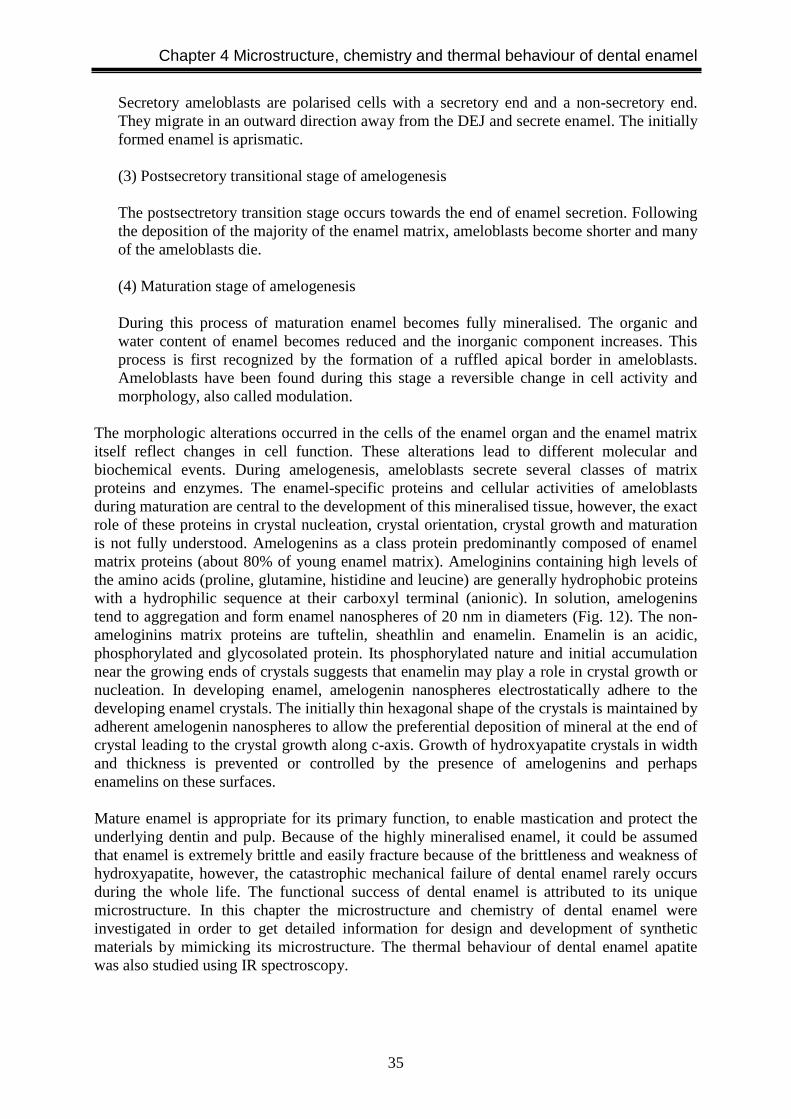
Chapter 4 Microstructure, chemistry and thermal behaviour of dental enamel
35
Secretory ameloblasts are polarised cells with a secretory end and a non-secretory end. They migrate in an outward direction away from the DEJ and secrete enamel. The initially formed enamel is aprismatic. (3) Postsecretory transitional stage of amelogenesis The postsectretory transition stage occurs towards the end of enamel secretion. Following the deposition of the majority of the enamel matrix, ameloblasts become shorter and many of the ameloblasts die. (4) Maturation stage of amelogenesis During this process of maturation enamel becomes fully mineralised. The organic and water content of enamel becomes reduced and the inorganic component increases. This process is first recognized by the formation of a ruffled apical border in ameloblasts. Ameloblasts have been found during this stage a reversible change in cell activity and morphology, also called modulation.
The morphologic alterations occurred in the cells of the enamel organ and the enamel matrix itself reflect changes in cell function. These alterations lead to different molecular and biochemical events. During amelogenesis, ameloblasts secrete several classes of matrix proteins and enzymes. The enamel-specific proteins and cellular activities of ameloblasts during maturation are central to the development of this mineralised tissue, however, the exact role of these proteins in crystal nucleation, crystal orientation, crystal growth and maturation is not fully understood. Amelogenins as a class protein predominantly composed of enamel matrix proteins (about 80% of young enamel matrix). Ameloginins containing high levels of the amino acids (proline, glutamine, histidine and leucine) are generally hydrophobic proteins with a hydrophilic sequence at their carboxyl terminal (anionic). In solution, amelogenins tend to aggregation and form enamel nanospheres of 20 nm in diameters (Fig. 12). The non-ameloginins matrix proteins are tuftelin, sheathlin and enamelin. Enamelin is an acidic, phosphorylated and glycosolated protein. Its phosphorylated nature and initial accumulation near the growing ends of crystals suggests that enamelin may play a role in crystal growth or nucleation. In developing enamel, amelogenin nanospheres electrostatically adhere to the developing enamel crystals. The initially thin hexagonal shape of the crystals is maintained by adherent amelogenin nanospheres to allow the preferential deposition of mineral at the end of crystal leading to the crystal growth along c-axis. Growth of hydroxyapatite crystals in width and thickness is prevented or controlled by the presence of amelogenins and perhaps enamelins on these surfaces. Mature enamel is appropriate for its primary function, to enable mastication and protect the underlying dentin and pulp. Because of the highly mineralised enamel, it could be assumed that enamel is extremely brittle and easily fracture because of the brittleness and weakness of hydroxyapatite, however, the catastrophic mechanical failure of dental enamel rarely occurs during the whole life. The functional success of dental enamel is attributed to its unique microstructure. In this chapter the microstructure and chemistry of dental enamel were investigated in order to get detailed information for design and development of synthetic materials by mimicking its microstructure. The thermal behaviour of dental enamel apatite was also studied using IR spectroscopy.
Chapter 4 Microstructure, chemistry and thermal behaviour of dental enamel
36
Fig. 12 The proposed role of amelogenins in enamel mineralisation.
1. Amelogenins are synthesized by the ameloblasts and secreted extracellularly 2. Amelogenin monomers assemble to generate 20 nm nanospheres with
hydrophilic carboxy terminals externalised 3. Anionic nanospheres initially interact electrostatically with the crystal faces
parallel to the c-axis, preventing crystal-crystal fusions and acting as 20 nm spacers. Enamelysin (proteinase 1) processes the exposed carboxy terminals and progressively reduces their anionic character. Hydrophobic nanospheres assemble and stabilize the matrix containing the initial crystallites, which continue to grow by ion accretion at their exposed ends.
4. Enamel serine protease action degrades the hydrophobic nanospheres (amelogenins), generating smaller amelogenin fragments. Amelogenin fragments and other peptide fragments are resorbed by ameloblasts.
5. Removal of amelogenin nanospheres from the crystal leaves the surface unprotected. This allows the crystals to grow in thickness, interlock, and possibly fuse.
4.2 Materials and methods 4.2.1 Sample preparation Bovine incisors or human premolars without caries were used in this study. The human teeth were extracted due to orthodontic reasons. Thin sections of enamel were cut using a diamond saw and then polished. Enamel powders were ground in an agate mortar with acetone to avoid heating. 4.2.2 Microstructure investigation and chemical analysis For SEM investigation, the polished surface was etched in 37 % phosphoric acid for 60s prior to be coated with gold or carbon films. Elemental distributions of dental enamel was measured using an electron microprobe (CAMECA SX100) on a polished surface. Trace elements in human dental enamel were
Chapter 4 Microstructure, chemistry and thermal behaviour of dental enamel
37
detected using a microscopic synchrotron radiation X-ray fluorescence analysis technique at HASYLAB, DESY. 4.2.3 Infrared spectroscopy For measurements in the region 150 to 650 cm-1 at low temperatures, a conventional far-infrared (FIR) pellet technique [Zhang et al. 1996] was employed. The powdered samples were thoroughly mixed with polyethylene (the sample matrix weight ratio was 1:50). Approximately 100 mg of the mixture was pressed into disc-like pellets of 13 mm diameter at room temperature under vacuum. For in situ mid-infrared (MIR) measurements in the region from 1500 to 5000 cm-1 at high temperatures, a thin section of enamel perpendicular to the tooth axis and a thin section of fluorapatite parallel to its c axis were used, respectively. The thin-sectioned sample was more suitable for recording spectra of hydrous species in mineral under high temperatures as the interfering effects of absorbed water in alkali halide disk and any potential reaction between the sample and media on heating could be avoided. Both thin sections had a thickness of about 100 � m. Dental enamel powders were also annealed form 300 to 1173 K for 1h at each temperature, the annealed powder were mixed with KBr to prepare a pellet under vacuum (the sample matrix weight ration was 1:200). MIR spectra were recorded at room temperature under vacuum (Bruker IFR113v). For IR reflectance spectra, a polished surface was used to record spectra between 400-2000 cm-1 with an infrared microscope (EQINOX 55, Bruker).
4.3 Results and Discussion
4.3.1 Microstructure and chemistry of dental enamel
Microstructure of dental enamel Fig 13 shows an optical micrograph of dental enamel. The enamel rods waved towards the enamel surface are clearly seen. The enamel rods represent the mineralised trails taken by the ameloblasts during amelogenesis. The path taken by ameloblasts during elaboration of enamel is not straight [Piesco and Simmelink 2002]. SEM micrograph (Fig. 14) demonstrates the different orientation of groups of enamel rods cut longitudinally and cross-sectionally. Shifts in rod orientation is also known as Hunter-Schreger bands observed in reflected light. The decussation of enamel rod groups make it more resistant to fracture during the stress of mastication. Fig. 15a shows the enamel rods almost parallelly arranged in a group. The diameter of each enamel rod is about 5 microns. At high magnification, the orientation of individual crystallites in enamel rod is shown in Fig. 15b. Each enamel rod is bundles of crystallites with a diameter of several tens nm. A group of enamel rod cut cross-sectionally is shown in Fig. 15c. Enamel inter-rods are revealed after acid etching to form a network to surround enamel rod. The inter-rod network plays an important role in determination of the mechanical properties of dental enamel. From the above investigation, one can conclude that dental enamel is hierarchically organised from nano-scale to micro-scale. On a micro-scale level, enamel is characterised by a inter-rod network surrounding enamel rods to produce the so-called honey comb appearance.
Chapter 4 Microstructure, chemistry and thermal behaviour of dental enamel
38
Chemistry of dental enamel Dental enamel is an organic and inorganic composites. The inorganic mineral is known as a substituted hydroxyapatite. Several models of enamel apatite unit formula have been proposed based on the available chemical analysis [Elliott,1997], for example,
Ca8.856Mg0.088Na0.292K0.010(PO4)5.312 (HPO4)0.280 (CO3)0.407 (OH)0.702Cl0.0708(CO3)0.050
However, elements in dental enamel are not rather homogeneously distributed. Compositional variations across human dental enamel analyzed using electron microprobe are shown in Fig. 16. It has been previously shown that the major inorganic compounds of human tooth enamel were calcium, phosphate, carbonate, magnesium and sodium [Bodart et al. 1981]. Our analysis is consistent with the other’s results [e. g. Cuy et al., 2002 ]. The concentration of CaO and P2O5 increased on moving from the DEJ to the surface of enamel. MgO, Na2O and K2O displayed an opposite trend with an increase on moving from the surface towards the DEJ. The concentration of Cl was found to be 0.6wt% near the surface while it decreased near the DEJ. The results indicate that the outer part of dental enamel is more mineralised. This is confirmed by the spatial variation of IR spectra recorded at different areas in dental enamel using an IR microscope (Fig. 17 ). The mineral content monitored by the excitations of phosphate groups decreased from the surface to the DEJ. The integrated intensity ratio of carbonate groups between 1178 and 1480 cm-1 to phosphate groups between 900 and 1200 cm-1 reflects the total concentration of carbonate ions in dental enamel. The total amount of carbonate ions in dental enamel increased on moving from the surface to the DEJ. The relative amount of A type carbonate ions (substitute for OH-) to B type carbonate ions (substitute for PO4
3- ) indicates much more A type substitution near the surface and greater B type substitution in the inner parts of enamel [Shi et al., 2002 and 2003a].

Chapter 4 Microstructure, chemistry and thermal behaviour of dental enamel
39
Fig. 13 Light micrograph of dental enamel showing enamel rods waved towards the enamel surface.
Fig. 14 SEM micrograph showing the different orientation of groups of enamel rods: longitudinal (P) and cross-sectional (C).
Fig. 15 SEM micrographs of sectioned enamel rods: (a) longitudinally cut enamel rods parallelly arranged, (b) crystallites organisation within an enamel rod and (c) cross-sectionally cut enamel rods showing a network of enamel inter-rod.
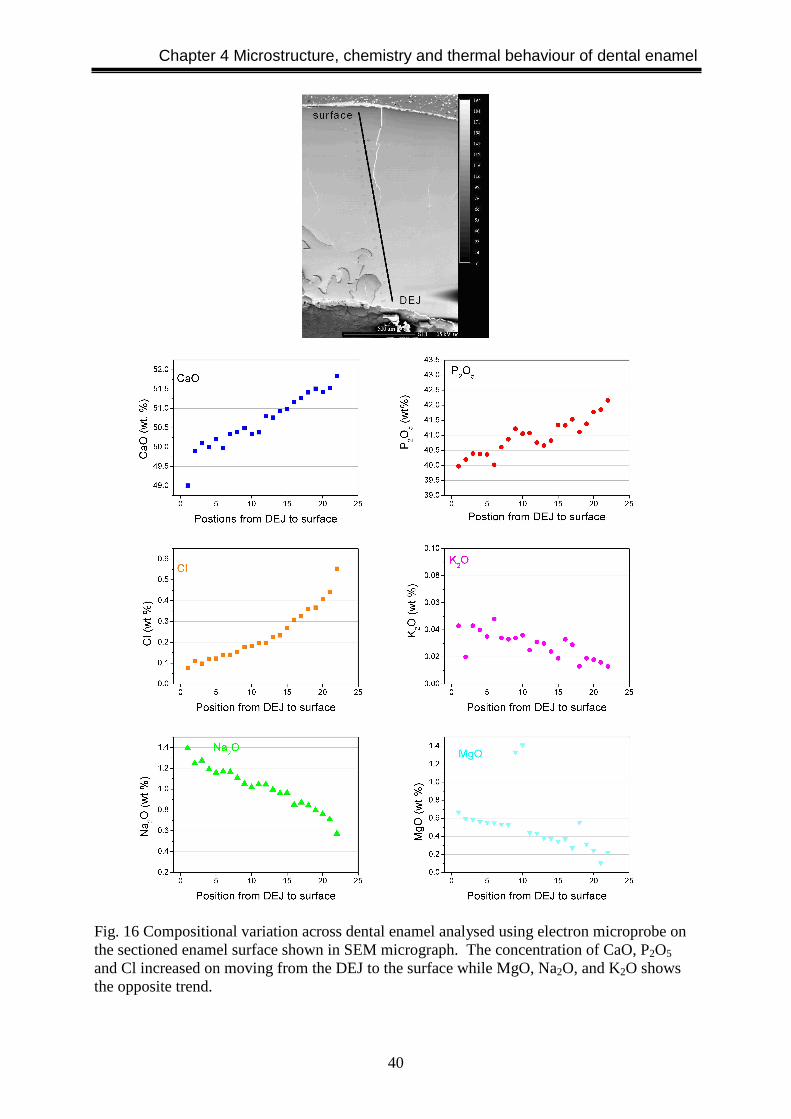
Chapter 4 Microstructure, chemistry and thermal behaviour of dental enamel
40
Fig. 16 Compositional variation across dental enamel analysed using electron microprobe on the sectioned enamel surface shown in SEM micrograph. The concentration of CaO, P2O5 and Cl increased on moving from the DEJ to the surface while MgO, Na2O, and K2O shows the opposite trend.

Chapter 4 Microstructure, chemistry and thermal behaviour of dental enamel
41
Fig. 17 Spatial variation of IR reflectance spectra (b) measured in the different areas of dental enamel shown in (a). (c) IR reflectance spectra of the excitations of carbonate groups in enamel apatite; (d) the distribution of total carbonate groups as a function of measured position; (e) Relative intensity of A type and B type carbonate in enamel apatite. Spot size of IR light source was ca. 100 µm. Trace elements of Sr, Zn, Cu and Ni were identified in dental enamel using SRXRF. The spectra at the point near enamel surface, in the middle and near the DEJ are shown in Fig. 18. The higher concentration of the trace elements near the enamel surface suggests that they might be incorporated from daily foods and drinks after tooth eruption. Fig. 19 shows the distribution of the residual proteins in dental enamel. The Ca (inorganic) peak corresponds to a C (organic) valley suggesting that the organic component is mainly distributed between enamel rods, i.e. in enamel inter-rods. The higher content of organic in inter-rod makes it more fracture resistant as a organic-inorganic composite. As shown in the microstructure (Fig. 15c), enamel inter-rods form a continuous network surrounding enamel rods. The composition of the inter-rod and its network can account for the fact that the
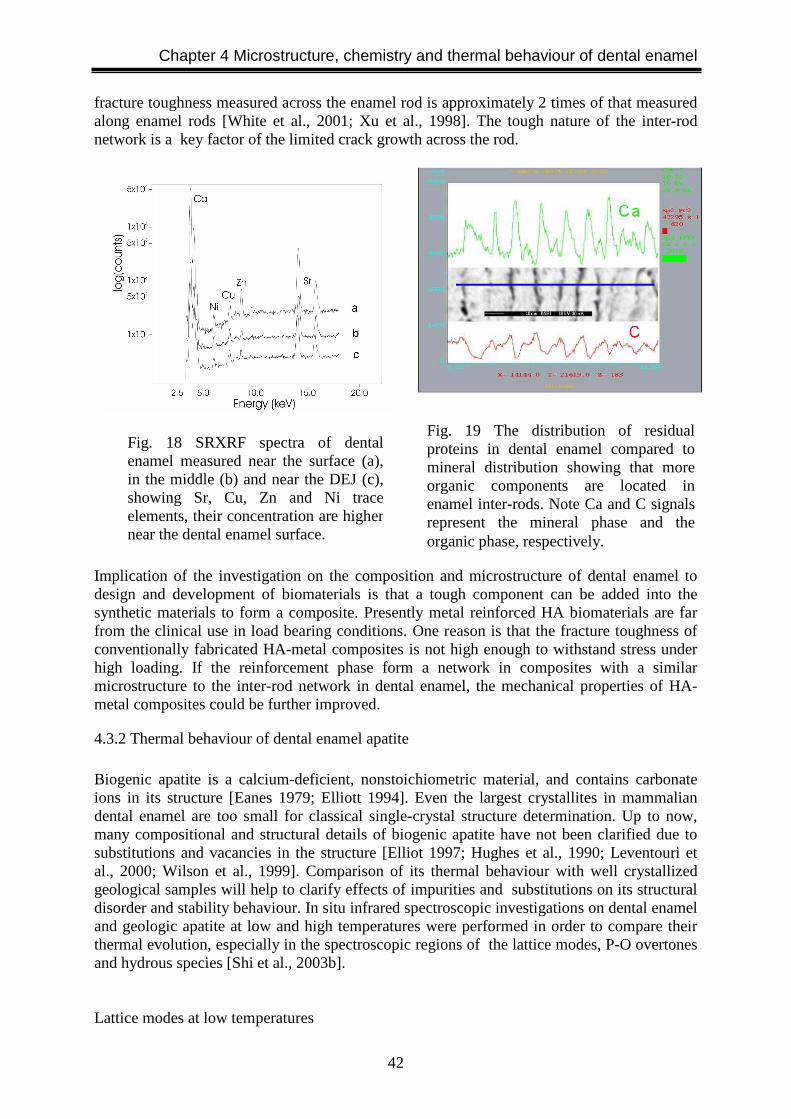
Chapter 4 Microstructure, chemistry and thermal behaviour of dental enamel
42
fracture toughness measured across the enamel rod is approximately 2 times of that measured along enamel rods [White et al., 2001; Xu et al., 1998]. The tough nature of the inter-rod network is a key factor of the limited crack growth across the rod.
Implication of the investigation on the composition and microstructure of dental enamel to design and development of biomaterials is that a tough component can be added into the synthetic materials to form a composite. Presently metal reinforced HA biomaterials are far from the clinical use in load bearing conditions. One reason is that the fracture toughness of conventionally fabricated HA-metal composites is not high enough to withstand stress under high loading. If the reinforcement phase form a network in composites with a similar microstructure to the inter-rod network in dental enamel, the mechanical properties of HA-metal composites could be further improved.
4.3.2 Thermal behaviour of dental enamel apatite
Biogenic apatite is a calcium-deficient, nonstoichiometric material, and contains carbonate ions in its structure [Eanes 1979; Elliott 1994]. Even the largest crystallites in mammalian dental enamel are too small for classical single-crystal structure determination. Up to now, many compositional and structural details of biogenic apatite have not been clarified due to substitutions and vacancies in the structure [Elliot 1997; Hughes et al., 1990; Leventouri et al., 2000; Wilson et al., 1999]. Comparison of its thermal behaviour with well crystallized geological samples will help to clarify effects of impurities and substitutions on its structural disorder and stability behaviour. In situ infrared spectroscopic investigations on dental enamel and geologic apatite at low and high temperatures were performed in order to compare their thermal evolution, especially in the spectroscopic regions of the lattice modes, P-O overtones and hydrous species [Shi et al., 2003b]. Lattice modes at low temperatures
Fig. 19 The distribution of residual proteins in dental enamel compared to mineral distribution showing that more organic components are located in enamel inter-rods. Note Ca and C signals represent the mineral phase and the organic phase, respectively.
Fig. 18 SRXRF spectra of dental enamel measured near the surface (a), in the middle (b) and near the DEJ (c), showing Sr, Cu, Zn and Ni trace elements, their concentration are higher near the dental enamel surface.
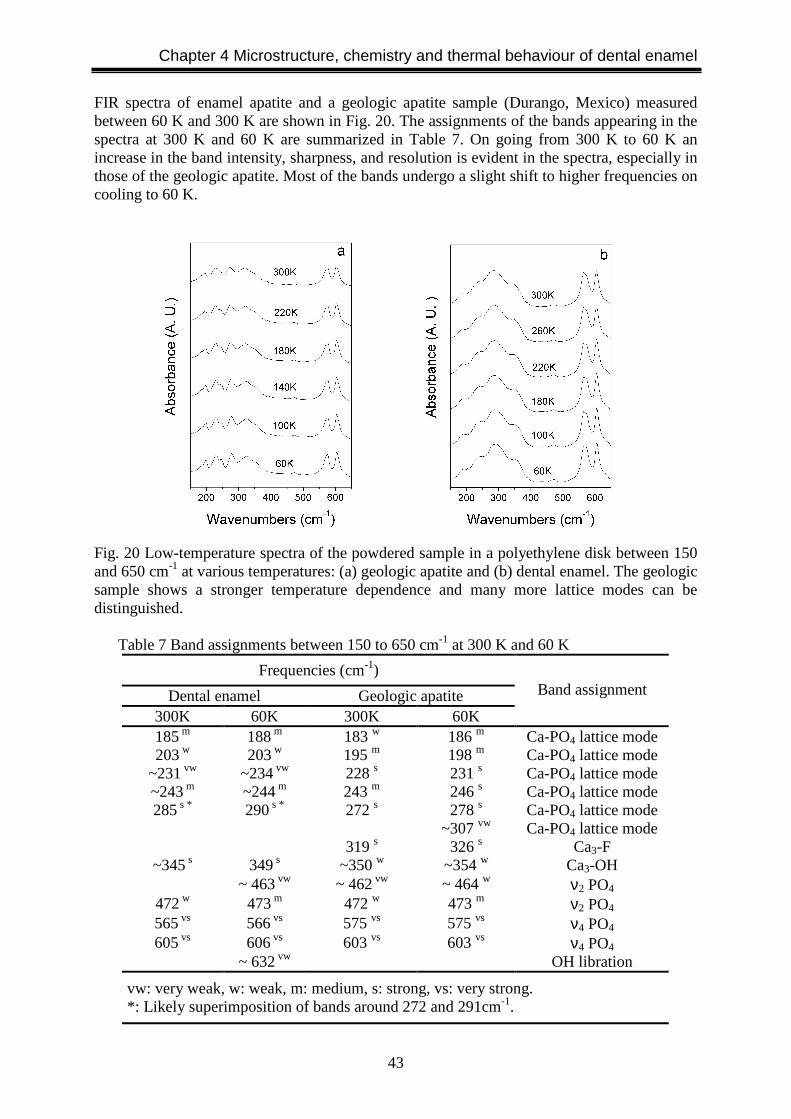
Chapter 4 Microstructure, chemistry and thermal behaviour of dental enamel
43
FIR spectra of enamel apatite and a geologic apatite sample (Durango, Mexico) measured between 60 K and 300 K are shown in Fig. 20. The assignments of the bands appearing in the spectra at 300 K and 60 K are summarized in Table 7. On going from 300 K to 60 K an increase in the band intensity, sharpness, and resolution is evident in the spectra, especially in those of the geologic apatite. Most of the bands undergo a slight shift to higher frequencies on cooling to 60 K.
Fig. 20 Low-temperature spectra of the powdered sample in a polyethylene disk between 150 and 650 cm-1 at various temperatures: (a) geologic apatite and (b) dental enamel. The geologic sample shows a stronger temperature dependence and many more lattice modes can be distinguished.
Table 7 Band assignments between 150 to 650 cm-1 at 300 K and 60 K
Frequencies (cm-1)
Dental enamel Geologic apatite 300K 60K 300K 60K
Band assignment
185 m 188 m 183 w 186 m Ca-PO4 lattice mode 203 w 203 w 195 m 198 m Ca-PO4 lattice mode
~231 vw ~234 vw 228 s 231 s Ca-PO4 lattice mode ~243 m ~244 m 243 m 246 s Ca-PO4 lattice mode 285 s * 290 s * 272 s 278 s Ca-PO4 lattice mode
~307 vw Ca-PO4 lattice mode 319 s 326 s Ca3-F
~345 s 349 s ~350 w ~354 w Ca3-OH ~ 463 vw ~ 462 vw ~ 464 w ν2 PO4
472 w 473 m 472 w 473 m ν2 PO4 565 vs 566 vs 575 vs 575 vs ν4 PO4 605 vs 606 vs 603 vs 603 vs ν4 PO4
~ 632 vw OH libration
vw: very weak, w: weak, m: medium, s: strong, vs: very strong. *: Likely superimposition of bands around 272 and 291cm-1.
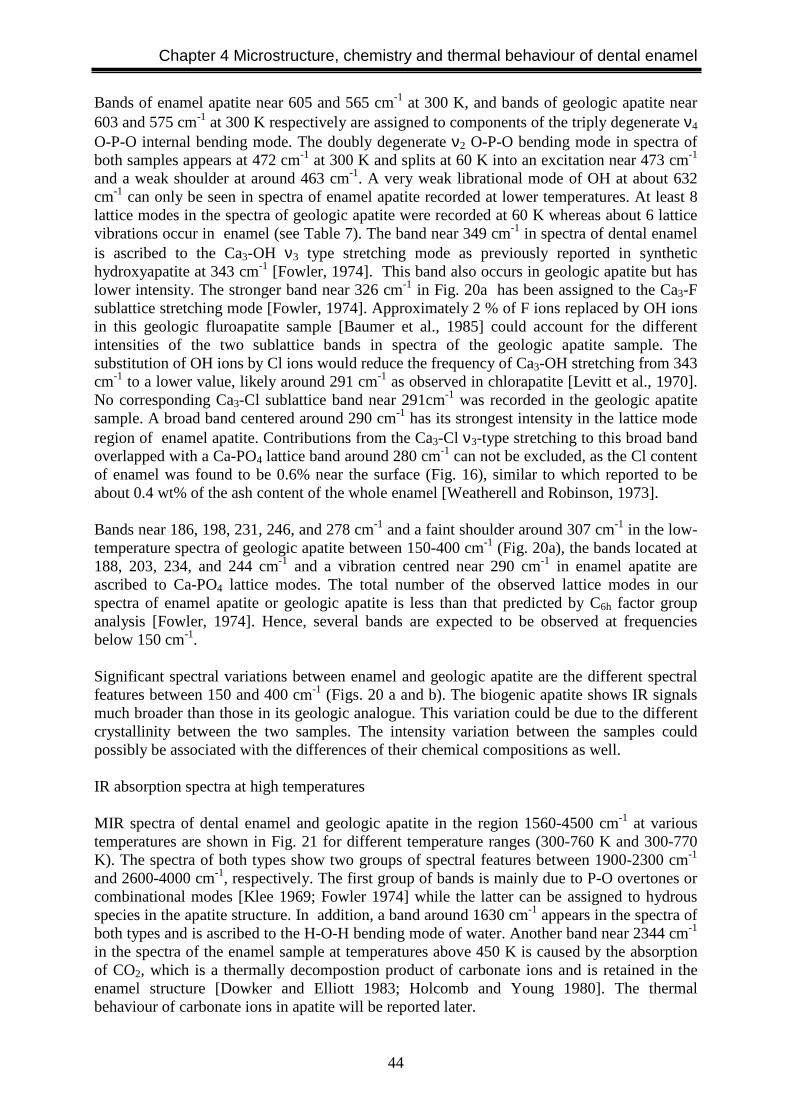
Chapter 4 Microstructure, chemistry and thermal behaviour of dental enamel
44
Bands of enamel apatite near 605 and 565 cm-1 at 300 K, and bands of geologic apatite near 603 and 575 cm-1 at 300 K respectively are assigned to components of the triply degenerate ν4 O-P-O internal bending mode. The doubly degenerate ν2 O-P-O bending mode in spectra of both samples appears at 472 cm-1 at 300 K and splits at 60 K into an excitation near 473 cm-1 and a weak shoulder at around 463 cm-1. A very weak librational mode of OH at about 632 cm-1 can only be seen in spectra of enamel apatite recorded at lower temperatures. At least 8 lattice modes in the spectra of geologic apatite were recorded at 60 K whereas about 6 lattice vibrations occur in enamel (see Table 7). The band near 349 cm-1 in spectra of dental enamel is ascribed to the Ca3-OH ν3 type stretching mode as previously reported in synthetic hydroxyapatite at 343 cm-1 [Fowler, 1974]. This band also occurs in geologic apatite but has lower intensity. The stronger band near 326 cm-1 in Fig. 20a has been assigned to the Ca3-F sublattice stretching mode [Fowler, 1974]. Approximately 2 % of F ions replaced by OH ions in this geologic fluroapatite sample [Baumer et al., 1985] could account for the different intensities of the two sublattice bands in spectra of the geologic apatite sample. The substitution of OH ions by Cl ions would reduce the frequency of Ca3-OH stretching from 343 cm-1 to a lower value, likely around 291 cm-1 as observed in chlorapatite [Levitt et al., 1970]. No corresponding Ca3-Cl sublattice band near 291cm-1 was recorded in the geologic apatite sample. A broad band centered around 290 cm-1 has its strongest intensity in the lattice mode region of enamel apatite. Contributions from the Ca3-Cl ν3-type stretching to this broad band overlapped with a Ca-PO4 lattice band around 280 cm-1 can not be excluded, as the Cl content of enamel was found to be 0.6% near the surface (Fig. 16), similar to which reported to be about 0.4 wt% of the ash content of the whole enamel [Weatherell and Robinson, 1973]. Bands near 186, 198, 231, 246, and 278 cm-1 and a faint shoulder around 307 cm-1 in the low-temperature spectra of geologic apatite between 150-400 cm-1 (Fig. 20a), the bands located at 188, 203, 234, and 244 cm-1 and a vibration centred near 290 cm-1 in enamel apatite are ascribed to Ca-PO4 lattice modes. The total number of the observed lattice modes in our spectra of enamel apatite or geologic apatite is less than that predicted by C6h factor group analysis [Fowler, 1974]. Hence, several bands are expected to be observed at frequencies below 150 cm-1. Significant spectral variations between enamel and geologic apatite are the different spectral features between 150 and 400 cm-1 (Figs. 20 a and b). The biogenic apatite shows IR signals much broader than those in its geologic analogue. This variation could be due to the different crystallinity between the two samples. The intensity variation between the samples could possibly be associated with the differences of their chemical compositions as well. IR absorption spectra at high temperatures MIR spectra of dental enamel and geologic apatite in the region 1560-4500 cm-1 at various temperatures are shown in Fig. 21 for different temperature ranges (300-760 K and 300-770 K). The spectra of both types show two groups of spectral features between 1900-2300 cm-1 and 2600-4000 cm-1, respectively. The first group of bands is mainly due to P-O overtones or combinational modes [Klee 1969; Fowler 1974] while the latter can be assigned to hydrous species in the apatite structure. In addition, a band around 1630 cm-1 appears in the spectra of both types and is ascribed to the H-O-H bending mode of water. Another band near 2344 cm-1 in the spectra of the enamel sample at temperatures above 450 K is caused by the absorption of CO2, which is a thermally decompostion product of carbonate ions and is retained in the enamel structure [Dowker and Elliott 1983; Holcomb and Young 1980]. The thermal behaviour of carbonate ions in apatite will be reported later.
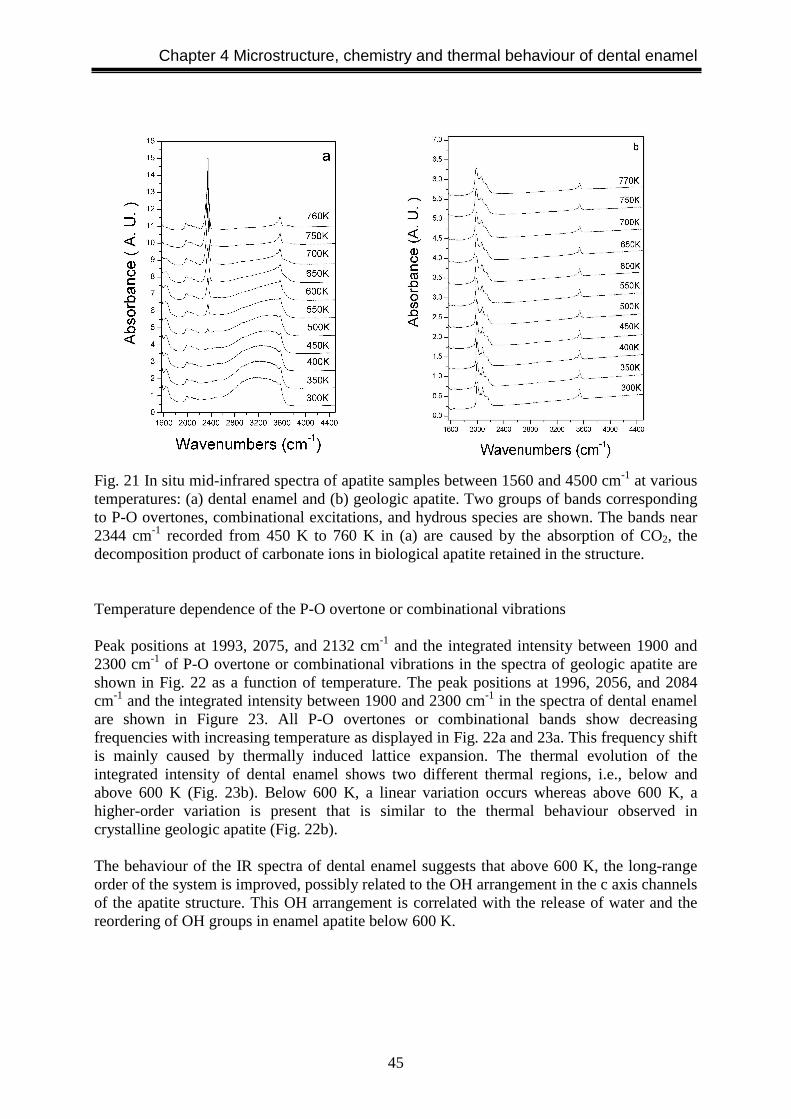
Chapter 4 Microstructure, chemistry and thermal behaviour of dental enamel
45
Fig. 21 In situ mid-infrared spectra of apatite samples between 1560 and 4500 cm-1 at various temperatures: (a) dental enamel and (b) geologic apatite. Two groups of bands corresponding to P-O overtones, combinational excitations, and hydrous species are shown. The bands near 2344 cm-1 recorded from 450 K to 760 K in (a) are caused by the absorption of CO2, the decomposition product of carbonate ions in biological apatite retained in the structure. Temperature dependence of the P-O overtone or combinational vibrations Peak positions at 1993, 2075, and 2132 cm-1 and the integrated intensity between 1900 and 2300 cm-1 of P-O overtone or combinational vibrations in the spectra of geologic apatite are shown in Fig. 22 as a function of temperature. The peak positions at 1996, 2056, and 2084 cm-1 and the integrated intensity between 1900 and 2300 cm-1 in the spectra of dental enamel are shown in Figure 23. All P-O overtones or combinational bands show decreasing frequencies with increasing temperature as displayed in Fig. 22a and 23a. This frequency shift is mainly caused by thermally induced lattice expansion. The thermal evolution of the integrated intensity of dental enamel shows two different thermal regions, i.e., below and above 600 K (Fig. 23b). Below 600 K, a linear variation occurs whereas above 600 K, a higher-order variation is present that is similar to the thermal behaviour observed in crystalline geologic apatite (Fig. 22b). The behaviour of the IR spectra of dental enamel suggests that above 600 K, the long-range order of the system is improved, possibly related to the OH arrangement in the c axis channels of the apatite structure. This OH arrangement is correlated with the release of water and the reordering of OH groups in enamel apatite below 600 K.
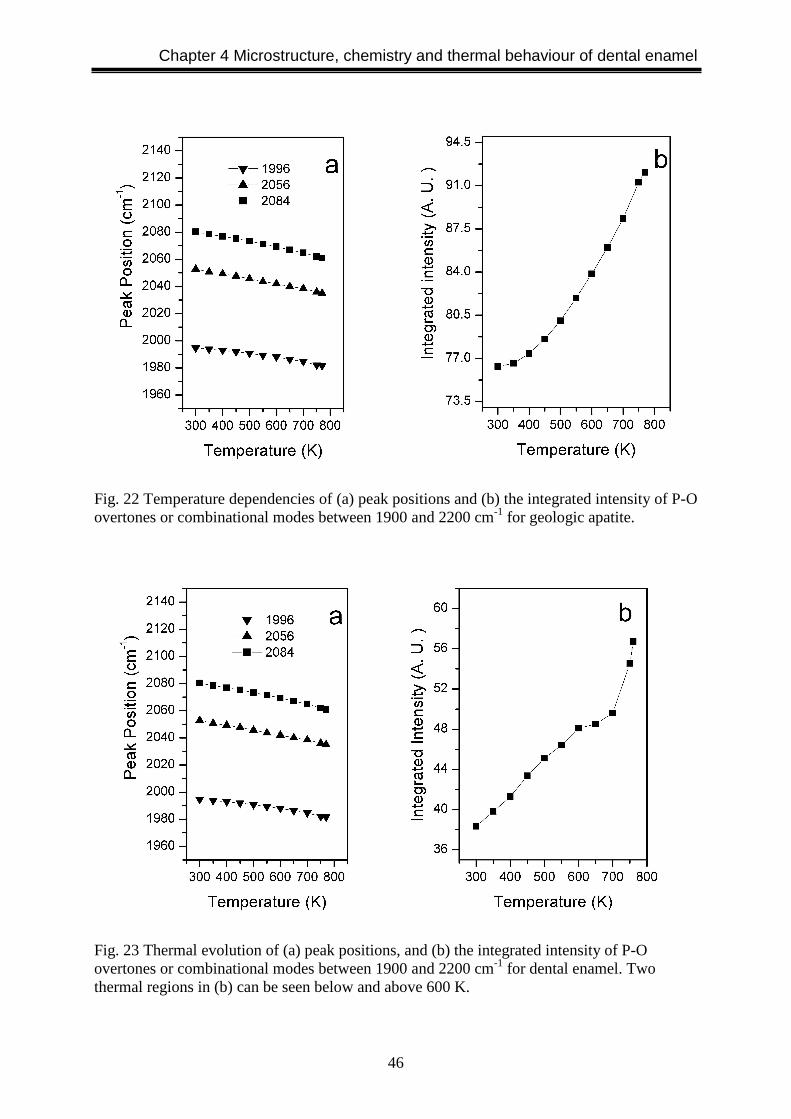
Chapter 4 Microstructure, chemistry and thermal behaviour of dental enamel
46
Fig. 22 Temperature dependencies of (a) peak positions and (b) the integrated intensity of P-O overtones or combinational modes between 1900 and 2200 cm-1 for geologic apatite.
Fig. 23 Thermal evolution of (a) peak positions, and (b) the integrated intensity of P-O overtones or combinational modes between 1900 and 2200 cm-1 for dental enamel. Two thermal regions in (b) can be seen below and above 600 K.

Chapter 4 Microstructure, chemistry and thermal behaviour of dental enamel
47
Temperature dependence of hydrous species The temperature evolution of the infrared spectra of geologic apatite between 2500 and 4000 cm-1 is shown in Fig. 24a for temperatures 300-770 K. All spectra show two OH bands (3538 and 3487 cm-1 at 300 K) and a shift by ca. 2 cm-1 to lower wavenumbers at 770 K. The two OH stretching bands are ascribed to OH groups that are hydrogen-bonded to fluoride ions (F-HO-F) and to chloride ions (Cl-HO), respectively [Dahm and Risnes 1999; Levitt and Condrate 1970]. The height of the band near 3540 cm-1 and the integrated intensity of OH bands in the spectra of geologic apatite were plotted versus temperature (Fig. 25). With increasing temperature the height of the main OH band near 3540 cm-1 and the plotted integrated intensity decrease because of some loss of structural water and OH ions.
Fig. 24 Temperature evolution of hydrous species of geologic apatite (a) and dental enamel (b). The OH bands at 3487 and 3538 cm-1 in (a) show a weak shift to higher wavenumbers and a decrease of intensity. The OH peaks at 3570 and 3498 cm-1 superimposed on a water band in (b) show an intensity increase between 300 K and 600 K. Above 600 K, their intensities decrease and a new shoulder at 3533 cm-1 appears as a high-temperature OH band.
Fig. 25 Peak height (a) of the band near 3540 cm-1
and integrated intensity (b) between 3250 and 3750 cm-1 of geologic apatite as a function of temperature between 300 and 770 K. The line in (b) is a guide for the eye.
Chapter 4 Microstructure, chemistry and thermal behaviour of dental enamel
48
The thermal behaviour of spectra of dental enamel in the region 2500 to 4000 cm-1 is shown in Fig. 24b. The absorbance is characterised by OH bands at 3570 cm-1 and 3498 cm-1 superimposed on a water band (Fig. 24b). The profiles of the water band gradually change with increasing temperature while the OH band absorbance at about 3570 cm-1 shows an increase until 600 K and a decrease at higher temperature (Fig. 26c). Similar results were observed in the spectra of powdered enamel after heat-treatment [Holcomb and Young 1980]. At temperatures above 600 K, the intensities of the two OH bands decrease, a new shoulder at 3533 cm-1 appears, and the intensity increases. The OH band at 3570 cm-1 is assigned to the non-hydrogen bonded OH stretching mode and the other at 3498 cm-1 is due to the OH-Cl bond as previously reported for chlorapatite and dental enamel [Dykes and Elliot 1971]. This additional high-temperature OH band (3533 cm-1) may be caused by the shift of OH ions from their room-temperature positions to other locations during heating. Cant et al. [1971] and Reisner and Klee [1982] observed a similar effect in the high-temperature spectra of synthetic apatite. After cooling to room temperature, the spectra are characterised by two sharpened, intensity-increased OH vibrations near 3497 and 3570 cm-1, which shows that the loss of water due to annealing to 760 K is irreversible. The integrated intensity, the centered position of the feature of hydrous species between 2600 and 4000 cm-1, and the absorbance of OH bands near 3570 cm-1 as a function of temperature are displayed in Fig. 26. Although the centered position of the feature containing complex hydrous species does not have any real meaning in physics, its shift reflects the modification of local atomic configuration on heating. Two thermal regions with nearly linear behaviour are identified in Fig. 26a. One corresponds to a temperature range between 300 and 600 K. Spectra in this temperature region show a release of the adsorbed and part of the lattice water in vacancies of OH (Fig. 24b). This loss of water leads to the shift of the band-centre of the hydrous species to higher wavenumbers (Fig. 26b) and to the increase of the absorbance of structural OH in available OH sites (Fig. 26c). Holcomb and Young proposed [1980] that this phenomenon is caused by a reaction of carbonate ions with water leading to OH ions in the channels of the apatite structure. The other temperature region ranges from 600 K to 760 K, with a relatively rapid decrease of the integrated intensity during heating, This change indicates a loss of lattice water and OH species as the absorbance of OH bands decreases. In this temperature range, the enamel apatite shows a similar thermal evolution to geologic apatite above 300 K (Fig. 25b). The thermal response of hydrous species in dental enamel agrees well with that of P-O overtones as described above (Fig. 23b). Both species show changes in their temperature dependence near 600 K, which indicates some modification of the structure at this temperature. Above 600 K dental enamel shows a similar thermal behaviour to that of geologic apatite above 300 K and it is expected that at this temperature dental enamel apatite becomes ordered after rearrangement of OH groups and most likely includes decomposing and positioning of carbonate ions in the channels of its structure. The atomic rearrangement is basically due to the gradual release of water and to the increase in structural OH species on heating at temperatures below 600 K. The contraction of the a axis dimension observed using XRD after heating enamel powder up to 400 oC [Le Geros 1978] and 300 oC [Holcomb and Young 1980] is in agreement with our analysis of the structural changes. Although decomposition of mature dental enamel powder into whitlockite (tricalcium phosphate, TCP) has been reported by Mayer et al. [1990] after heat treatment at 500 oC for more than 17 h, no non-apatitic phase in the samples during in situ IR measurement from 300 K to 770 K was formed. Using IR and XRD we analysed the enamel powders annealed for 1 h in a temperature range from 300 K to 1193 K at intervals of 100 oC. Results show that no TCP and other non-apatitic phase were detected till 973 K under the annealing condition comparable to our in situ IR measurements. However, the formation of oxygen anions in the anion channels due to the release of H2O from hydroxyl groups can not be excluded. In the electron
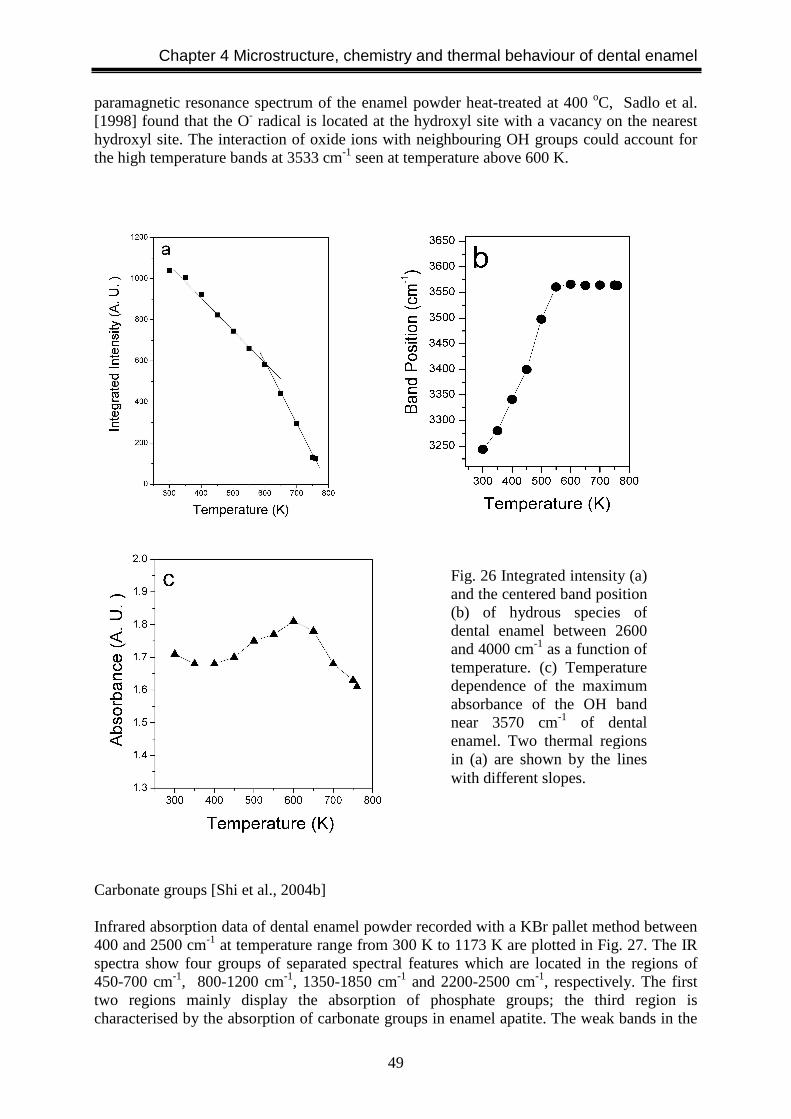
Chapter 4 Microstructure, chemistry and thermal behaviour of dental enamel
49
paramagnetic resonance spectrum of the enamel powder heat-treated at 400 oC, Sadlo et al. [1998] found that the O- radical is located at the hydroxyl site with a vacancy on the nearest hydroxyl site. The interaction of oxide ions with neighbouring OH groups could account for the high temperature bands at 3533 cm-1 seen at temperature above 600 K.
Carbonate groups [Shi et al., 2004b] Infrared absorption data of dental enamel powder recorded with a KBr pallet method between 400 and 2500 cm-1 at temperature range from 300 K to 1173 K are plotted in Fig. 27. The IR spectra show four groups of separated spectral features which are located in the regions of 450-700 cm-1, 800-1200 cm-1, 1350-1850 cm-1 and 2200-2500 cm-1, respectively. The first two regions mainly display the absorption of phosphate groups; the third region is characterised by the absorption of carbonate groups in enamel apatite. The weak bands in the
Fig. 26 Integrated intensity (a) and the centered band position (b) of hydrous species of dental enamel between 2600 and 4000 cm-1 as a function of temperature. (c) Temperature dependence of the maximum absorbance of the OH band near 3570 cm-1 of dental enamel. Two thermal regions in (a) are shown by the lines with different slopes.

Chapter 4 Microstructure, chemistry and thermal behaviour of dental enamel
50
region from 2200 to 2500 cm-1 which appear in some spectra are attributed to the thermal decomposition products from organic and carbonate ions in dental enamel. Because of the different physical nature of the bands in the four regions, the data in different groups were analysed separately. The infrared band positions and their assignments in the spectra recorded at temperatures 300 K, 473 K, 723 K, 973K and 1173 K are summarised in Table 8 based on previous studies [Dowker and Elliott, 1983; Flower, 1974; Koutsopoulos, 2002].
Fig. 27 IR spectra of dental enamel powders heat-treated for 1 h from 300 K to 1173 K. The insert shows the ν1 and ν3 vibrational modes of phosphate excitations at temperatures above 873 K. Absorption bands due to β-TCP are indicated by arrows.
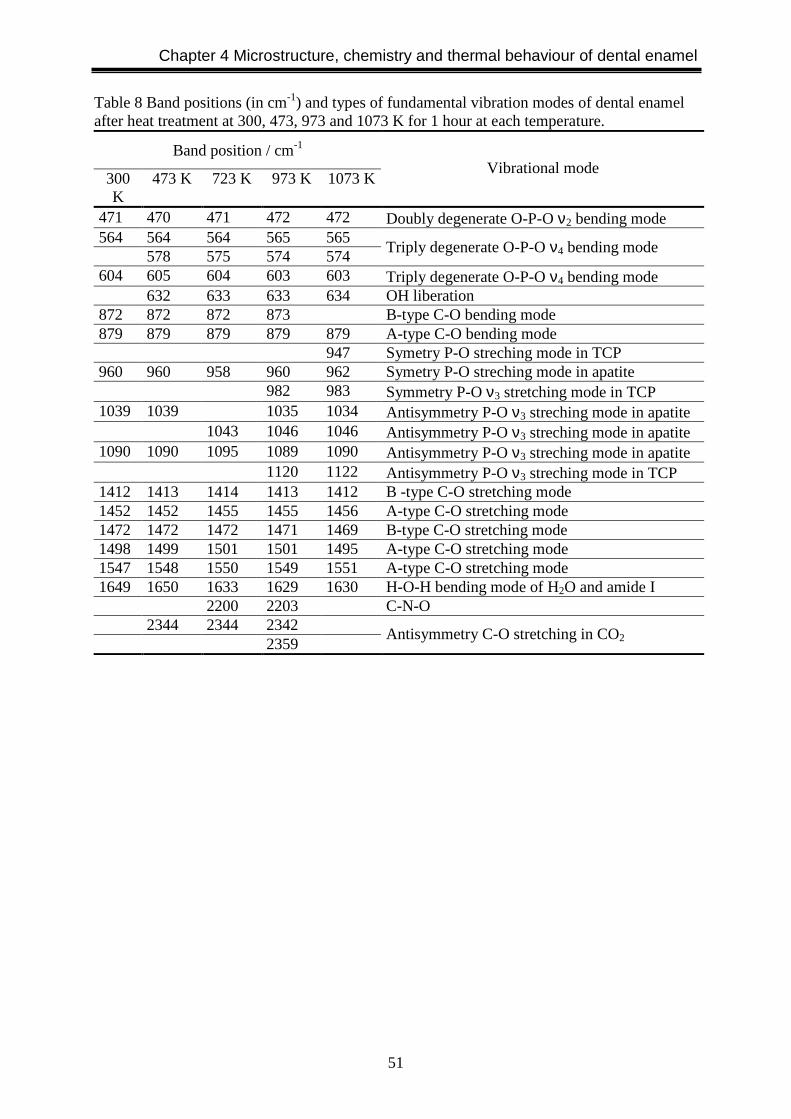
Chapter 4 Microstructure, chemistry and thermal behaviour of dental enamel
51
Table 8 Band positions (in cm-1) and types of fundamental vibration modes of dental enamel after heat treatment at 300, 473, 973 and 1073 K for 1 hour at each temperature.
Band position / cm-1
300 K
473 K 723 K 973 K 1073 K Vibrational mode
471 470 471 472 472 Doubly degenerate O-P-O ν2 bending mode 564 564 564 565 565 578 575 574 574
Triply degenerate O-P-O ν4 bending mode
604 605 604 603 603 Triply degenerate O-P-O ν4 bending mode 632 633 633 634 OH liberation 872 872 872 873 B-type C-O bending mode 879 879 879 879 879 A-type C-O bending mode 947 Symetry P-O streching mode in TCP 960 960 958 960 962 Symetry P-O streching mode in apatite 982 983 Symmetry P-O ν3 stretching mode in TCP 1039 1039 1035 1034 Antisymmetry P-O ν3 streching mode in apatite 1043 1046 1046 Antisymmetry P-O ν3 streching mode in apatite 1090 1090 1095 1089 1090 Antisymmetry P-O ν3 streching mode in apatite 1120 1122 Antisymmetry P-O ν3 streching mode in TCP 1412 1413 1414 1413 1412 B -type C-O stretching mode 1452 1452 1455 1455 1456 A-type C-O stretching mode 1472 1472 1472 1471 1469 B-type C-O stretching mode 1498 1499 1501 1501 1495 A-type C-O stretching mode 1547 1548 1550 1549 1551 A-type C-O stretching mode 1649 1650 1633 1629 1630 H-O-H bending mode of H2O and amide I 2200 2203 C-N-O 2344 2344 2342 2359
Antisymmetry C-O stretching in CO2

Chapter 4 Microstructure, chemistry and thermal behaviour of dental enamel
52
Spectral region: 400-700 cm-1 The band at 474 cm-1 is assigned to the doubly degenerate ν2 O-P-O bending mode; the bands at 564, 578 and 604 cm-1 are assigned to triply degenerate ν4 O-P-O bending modes. An OH librational band occurs at 633 cm-1. All bands in this region show an increase in relative intensity on increasing temperature. The ν4 anti-symmetric bending mode has been used to measure the crystallinity of biological apatite [Surovell and Stiner, 2001]. It has been shown that the excitations at 564 and 604 cm-1
of bone mineral become increasingly separated or split as crystallinity increases [Surovell and Stiner, 2001; Weiner and Bar-Yosef, 1990]. To evaluate the effect of heat treatment on the crystallinity of enamel apatite, the infrared splitting factor (IRSF) of heat-treated dental enamel was calculated according to Weiner and Bar-Yosef [1990] by summing the heights of the 564 and 604 cm-1 bands and dividing this value by the height of the trough between them (Fig. 28a). As shown in Fig. 28b, the IRSF increases on heating.
Spectral region: 800-1350 cm-1 Two bands at 872 and 879 cm-1 are absorptions of the ν2 O-C-O out of plan bending mode in A-type and B-type carbonates, respectively [Rey et al., 1991]. The intensity of the 872 cm-1 signal decreases while the intensity of the band at 879 cm-1 increases with increasing temperature, indicating the transformation of carbonate ions from B-type into A-type. The peak at 960 cm-1 is assigned to the non-degenerated symmetric P-O stretching mode ν1 of the phosphate group in the apatite structure while the peaks at 1032, 1046 and 1090 cm-1 are attributed to triply degenerated asymmetric P-O stretching modes ν3 in apatite structure. New bands at 945, 982 cm-1 appearing at temperatures above 973 K correspond to the P-O stretching modes (ν1) of the phosphate groups in the β-TCP phase whereas the band near 1120 cm-1 is the ν3 asymmetric stretching mode of P-O in β-TCP [Koutsopoulos, 2002]. The appearance of β-TCP bands at 973 K indicates the partial decomposition of enamel apatite into the β-TCP structure. Spectral region: 1350-1800 cm-1
Figure 28 (a) The infrared splitting factor (IRSF). All heights are measured above a linear baseline drawn from approximately 440 to 750 cm-1. (b) IRSF versus temperature for dental enamel, showing increasing crystallinity after heat-treatment.

Chapter 4 Microstructure, chemistry and thermal behaviour of dental enamel
53
The curve fit of the line profiles in the spectral region 1350-1850 cm-1 to the Lorentzian functions revealed six bands as shown in Fig. 29a. The band near 1650 cm-1 is assigned to the H-O-H bending mode of H2O and probably includes the stretching mode of amide because the band shifts to lower wavenumbers at higher temperatures [Sowa and Mantsch, 1994]; the other five bands are due to ν3 asymmetric vibration modes of the O-C-O bond in A-type carbonates (1452-1456, 1495-1500, 1547-1551 cm-1) and B-type carbonate (1412-1414, 1469-1472 cm-1). The shift of the band positions of ν3 carbonate groups may be caused by changes of the local structure and concentration of carbonate in dental enamel after heat treatment. To minimise the effect of powder load in KBr pellets, changes of the carbonate content in dental enamel are estimated from the integrated intensity ratios of carbonate to phosphate groups as shown in Figs. 29b, c and d. Integrated intensities were calculated using a linear base line from the band at 1546 cm-1 for A-type carbonate ions and 1412 cm-1 for B-type carbonate ions respectively. The integrated intensities of total carbonate ions and phosphate ions were calculated using the absorbance near the 1350-1600 cm-1 and 900-1300 cm-1 regions, respectively. The amount of A-type carbonate first decreases with increasing temperature until 573 K and then increases to a maximum at 973 K, thereafter it decreases again. The amounts of the B-type carbonate and the total carbonate ions decrease continuously on heating. At 973 K almost 50 % of the carbonate ions were released from the enamel apatite.
Fig. 29 (a) IR absorbance spectrum of dental enamel between 1350 and 1850 cm-1 fitted using six bands of Lorentzian profile. Integrated intensity ratios of (b) A-type carbonate ions to phosphate ions, (c) B-type carbonate ions to phosphate ions, and (d) total carbonate ions to phosphate ions as a function of temperature (from 300 to 1173 K). Integrated intensities were calculated using a linear base line from the band at 1546 cm-1 for A-type carbonate ions and 1412 cm-
1 for B-type carbonate ions respectively. The integrated intensities of total carbonate ions and phosphate ions were calculated using the absorption from 1350 to 1600 cm-1 and from 900 to 1300 cm-1 regions, respectively.
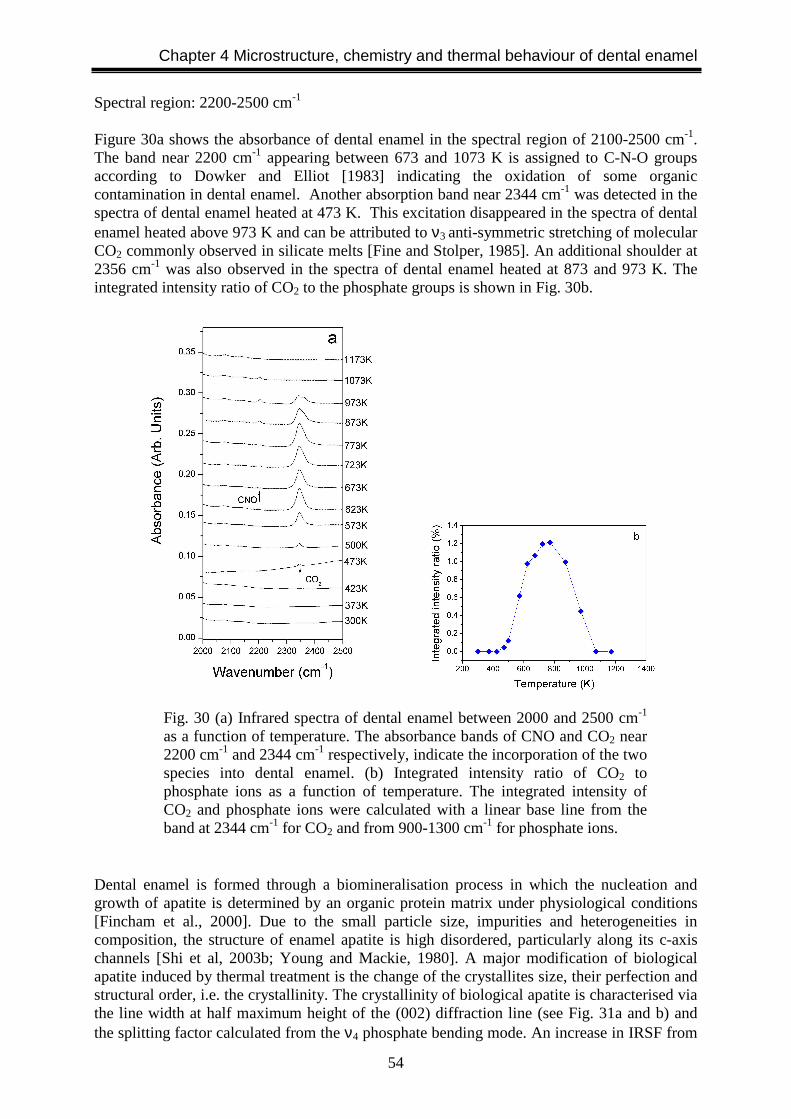
Chapter 4 Microstructure, chemistry and thermal behaviour of dental enamel
54
Spectral region: 2200-2500 cm-1
Figure 30a shows the absorbance of dental enamel in the spectral region of 2100-2500 cm-1. The band near 2200 cm-1 appearing between 673 and 1073 K is assigned to C-N-O groups according to Dowker and Elliot [1983] indicating the oxidation of some organic contamination in dental enamel. Another absorption band near 2344 cm-1 was detected in the spectra of dental enamel heated at 473 K. This excitation disappeared in the spectra of dental enamel heated above 973 K and can be attributed to ν3 anti-symmetric stretching of molecular CO2 commonly observed in silicate melts [Fine and Stolper, 1985]. An additional shoulder at 2356 cm-1 was also observed in the spectra of dental enamel heated at 873 and 973 K. The integrated intensity ratio of CO2 to the phosphate groups is shown in Fig. 30b.
Dental enamel is formed through a biomineralisation process in which the nucleation and growth of apatite is determined by an organic protein matrix under physiological conditions [Fincham et al., 2000]. Due to the small particle size, impurities and heterogeneities in composition, the structure of enamel apatite is high disordered, particularly along its c-axis channels [Shi et al, 2003b; Young and Mackie, 1980]. A major modification of biological apatite induced by thermal treatment is the change of the crystallites size, their perfection and structural order, i.e. the crystallinity. The crystallinity of biological apatite is characterised via the line width at half maximum height of the (002) diffraction line (see Fig. 31a and b) and the splitting factor calculated from the ν4 phosphate bending mode. An increase in IRSF from
Fig. 30 (a) Infrared spectra of dental enamel between 2000 and 2500 cm-1
as a function of temperature. The absorbance bands of CNO and CO2 near 2200 cm-1 and 2344 cm-1 respectively, indicate the incorporation of the two species into dental enamel. (b) Integrated intensity ratio of CO2 to phosphate ions as a function of temperature. The integrated intensity of CO2 and phosphate ions were calculated with a linear base line from the band at 2344 cm-1 for CO2 and from 900-1300 cm-1 for phosphate ions.
Chapter 4 Microstructure, chemistry and thermal behaviour of dental enamel
55
IR spectra corresponding to a reduced density of states broadening [Bismayer, 2000] and a decrease in the width of (002) diffraction peak in XRD patterns indicate an increasing crystallinity on increasing heating temperatures (Figs. 28b and 31b). The librational band at 633 cm-1 of structural OH groups after heat-treatment changes gradually from a weak shoulder under 500 K to a well-developed peak after heating to 1173 K (Fig. 27). This evolution of the line profile with heat-treatment suggests the presence of a high OH occupancy in the c-axis channels of enamel apatite structure. The available OH sites are likely to correspond to the release of water and decomposition of carbonate ions [Holcomb and Young, 1980; Shi et al. 2003b]. The transformation of enamel apatite into β-TCP after heating for 18 hrs at 773 K has been reported earlier in an investigation of the thermal behaviour of developing and mature enamels [Mayer et al., 1990]. The present IR and XRD results show that enamel apatite begins to decompose into β-TCP at a temperatures near 973 K because diffraction peaks of β-TCP in XRD and absorption bands of ν1 and ν3 phosphate groups in β-TCP are detectable after heat treatment at temperature above 973 K for 1 h. Comparison of our findings with the decomposition data of dental enamel reported earlier suggests that the phase transformation of enamel apatite is a time dependent process. Heating enamel apatite with a shorter time period (<1h) can maintain the apatitic structure up to a higher temperatures (around 973 K in this study). Another thermally induced structural change of dental enamel is the decarbonisation during heating. One of the important observations in this study is the different thermal behaviour between the A-type and B-type of CO3 ions. As shown in Fig. 29b, the A-type CO3 ions, which are associated with the OH sites as described earlier, show a weak decrease below 573 K. With further increasing annealing temperature, the signal exhibits a systematic increase up to 973 K. However, the B-type CO3 ions exhibit a continuous decrease in intensity (Fig. 29c). The results put forward some interesting questions regarding the nature of the sites and the reactions, such as why the two types of CO3 ions behave so differently at high temperatures and what happens at the atomic level? The apparent intensity increase of A-type CO3
2- shown in Fig. 29b implies that significant amounts of A-type CO3 ions incorporated into the structure of apatite during thermal treatment. The observed change indicate that between the two types of CO3 ions the A-type is structurally more preferable in the studied temperature region. During high-temperature annealing, thermally induced variations of local environments and dehydration probably cause modifications of the local environments around the OH site, e. g. O2- and vacant OH sites resulting from dehydroxylation. As a result, the CO3 ions can be relatively easily “trapped” into the A-type site (at this stage there is no knowledge on whether a change of the oxidation state takes place during the high-temperature annealing in which CO3 ions act as charge balances). In addition, the structural variations may eventually lower the energy barriers and make carbon-related species migrate along c axis or incorporate into the site. Therefore, the OH site becomes more favourable for CO3 ions in the temperature region. We now discuss the possible role of CO2 in the incorporation of the A-type CO3 ions. As shown in Fig. 30b, the intensity of CO2 band shows a dramatic increase between 473 K and 773 K and a dramatic decrease thereafter. The decrease of CO2 signal starting near 773 K is accompanied by the increase of the A-type CO3 signals (Fig. 29b). The coincidence of spectral changes of these two different types of species implies that the incorporation of A-type CO3 species into the crystal structure is at the expense of the CO2 components. The results suggest that the CO2 components could be the main original resources for the A-type carbonate increase.

Chapter 4 Microstructure, chemistry and thermal behaviour of dental enamel
56
Mature dental enamel contains about 1wt % protein as an organic component. The oxidation of organic component in dental enamel was found at around 623 K by differential thermal analysis in a dynamic air atmosphere [Corcia and Moody, 1974]. This could explain the band which appears at 2200 cm-1 in the IR spectra from 673-1073 K. The occurrence of this species is associated with the burning of the protein at this temperature range and might also exclude the possible contribution of organic oxidation to the CO2 band at lower temperatures.
The chemical stability of dental enamel depends on its crystal structure, crystallinity (i. e. crystallite size, perfection), and chemical composition. Well-crystallized hydroxyapatite is much more stable under physiological conditions than β-TCP [Elliott, 2002]. The carbonate substitution in hydroxyapatite lattice makes it susceptible to bacterial acid-attack. The structure of enamel apatite can be modified without formation of undesired phases such as β-TCP by thermal treatment with a short heating time. The modified structure with improved crystallinity and less carbonate content is believed to be more stable than the thermally untreated one. The implication of this study in dentistry is that the desired chemical and structural modification of dental enamel can be obtained though controlled thermal treatment of dental hard tissue using laser irradiation.
4.3 Conclusions From the investigation of the microstructure, chemistry and the thermal behaviour of dental enamel. The following conclusions can be drawn: (1) Dental enamel is a hierarchically organized and a chemically gradient material. Nanosized
apatite crystallites are approximately parallelly arranged into enamel rods of about 5 microns in diameter. Enamel rods are organized into groups with their orientation almost perpendicular to each other. Two distinctively microstructural features of dental enamel are a nanostructured material and a network of enamel inter-rods which surround enamel rods. These two microstructural features play an important role in determining its unique mechanical properties. Compositional variation was found across dental enamel. The mineral content decreases from the surface to the dentine-enamel junction. Impurities in
Fig. 31 (a) XRD patterns of dental enamel powders after heat treatment for 1 h at different temperatures from 300 K to 1173 K. Diffraction peaks of β-TCP are marked by arrows, other peaks corresponding to hydroxyapatite. (b) line width at half maximum of reflection (002) as a function of temperature.
Chapter 4 Microstructure, chemistry and thermal behaviour of dental enamel
57
enamel apatite are not homogeneously distributed as well. The organic content is mainly concentrated in the inter-rods.
(2) In situ IR spectroscopic analysis of dental enamel reveals two different thermal regions below and above 600 K. The thermal behavior in the region below 600 K corresponds to the loss of adsorbed and lattice water, and combined with an increase of structural OH groups. In the second thermal region (above 600 K), the similarity of the thermal response of enamel and geologic apatite suggests the existence of a highly ordered system in enamel apatite. This may be explained by the former dehydration and atomic rearrangements in the channels of enamel apatite below 600 K.
(3) Infrared spectroscopic study of carbonate groups in enamel apatite indicates the
transformation of carbonate groups from different sites and the decomposition of carbonate groups. The loss of B-type and A-type carbonate ions was observed at 373 K; the amount of B-type carbonate ions and the total carbonate content decrease on heating while the amount of A-type carbonate ions increases from 573 to 973 K. Almost 50 % of the carbonate ions was released from dental enamel after heat treatment at 973 K for 1h. The incorporation of CO2 and CNO species in dental enamel were found in the temperature range 273-973 K and 673-1073 K respectively. The content of CO2 in dental enamel increases from 473 K to a maximum near 773 K and thereafter decreases. The formation of β-tricalcium phosphate was found in samples heated above 973 K for 1h.
Chapter 5 HP and HT compaction of nanostructured HA
58
Chapter 5 High pressure and temperature compaction of nanostructured hydroxyapatite 5.1 Introduction Nanostructured ceramics show enhanced mechanical properties, increased ductility and superplasticity [Ahn et al., 2001; Uematsu et al., 1989; Mishra et al., 1996; Costa et al., 1999]. However, sintering of nanopowders is a challenge due to grain coarsening and ultimate loss of the nanostructure [Ahn et al., 2001; Chen et al., 2000; Shen et al., 2001]. For hydroxyapatite ceramics, densification typically requires high temperatures (> 1000 oC), which results in grain growth and decomposition into undesired phases with poor mechanical and chemical stability [Barralet et al., 2000; Suchanek and Yosimura, 1998]. Sintering at high pressure can suppress diffusion and helps retaining grain size in the nanometer range. For example, nanocrystalline γ-Al2O3 ceramics produced at 4.5 GPa and a temperature up to 565 oC show an improvement in hardness and density [Costa et al., 1999]; fully dense nanocomposites of Zn-SiC, C-SiC were also compacted with a high pressure infiltration method and are characterized by a homogeneous microstructure from nanoscale to microscale [Gierlotka et al., 2003]. The study reported in this chapter describes a method (1) to compact the nanosized HA powders at high pressure and temperature and disclose under which conditions the nanostructured HA ceramics can be produced; (2) to produce nanostructured HA ceramics as a restorative material in dentistry to replace dental enamel. Therefore, the effect of compaction pressures and temperatures on the microstructure were studied and the mechanical properties were evaluated [Shi et al. 2003c and 2004a]. 5.2 Materials and methods In this study commercially available nanosized HA powders (Berkeley Advanced Biomaterial Inc., San Leandro, CA 94577, USA) were used. The powder was first dispersed in hexane for 10 min and dried at 60 oC under vacuum. 100 mg of the dried powder was pressed into a φ 5 mm disk at 20 MPa under vacuum. The precompacted sample was assembled into a high pressure and temperature cell, and then compacted at high pressures and temperatures. Broken pieces of the compacted samples were investigated using SEM (Leo 1525) after coating with a carbon film. The polished surface was used to measure the microhardness with a load of 100 g and a dwell time of 15 s using a Vickers indentation tester (Ernst Leitz GMBH, Wetzlar, Germany). The fracture toughness of each indentation was derived from the developed crack length during the Vickers indentation (see chapter 3). The phase composition and molecular structure of the compacted HA samples were evaluated by powder X-ray diffractometry (Philips Xpert ) and Fourier transform infrared spectroscopy (EQINOX 55, Bruker, Germany). 5.3 Results and discussion 5.3.1 Characterization of powders The SEM micrographs of the HA powders are shown in Fig. 32, and the nanosized HA powders are agglomerated into micron sized particles. High magnification of the powders shows that most of the spherical grains have a size of 20-50 nm. XRD pattern and IR spectra of the powder indicate that this powder is a pure HA phase containing carbonate groups at
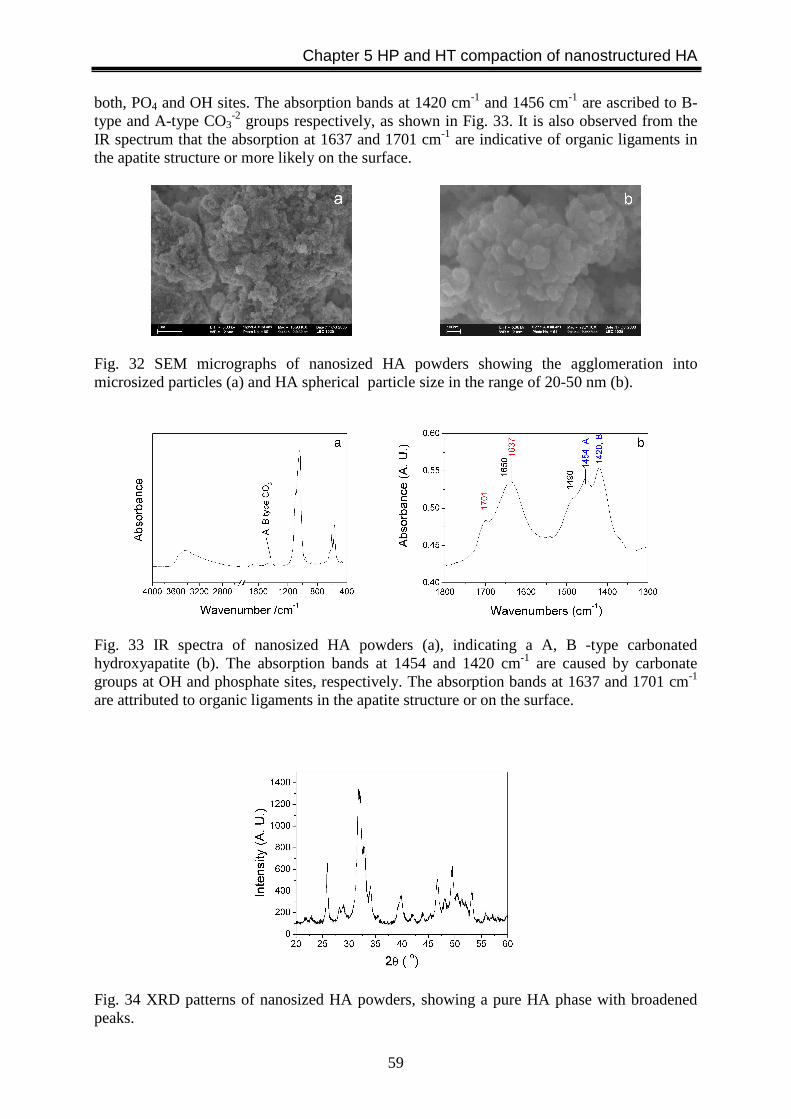
Chapter 5 HP and HT compaction of nanostructured HA
59
both, PO4 and OH sites. The absorption bands at 1420 cm-1 and 1456 cm-1 are ascribed to B-type and A-type CO3
-2 groups respectively, as shown in Fig. 33. It is also observed from the IR spectrum that the absorption at 1637 and 1701 cm-1 are indicative of organic ligaments in the apatite structure or more likely on the surface.
Fig. 32 SEM micrographs of nanosized HA powders showing the agglomeration into microsized particles (a) and HA spherical particle size in the range of 20-50 nm (b).
Fig. 33 IR spectra of nanosized HA powders (a), indicating a A, B -type carbonated hydroxyapatite (b). The absorption bands at 1454 and 1420 cm-1 are caused by carbonate groups at OH and phosphate sites, respectively. The absorption bands at 1637 and 1701 cm-1 are attributed to organic ligaments in the apatite structure or on the surface.
Fig. 34 XRD patterns of nanosized HA powders, showing a pure HA phase with broadened peaks.
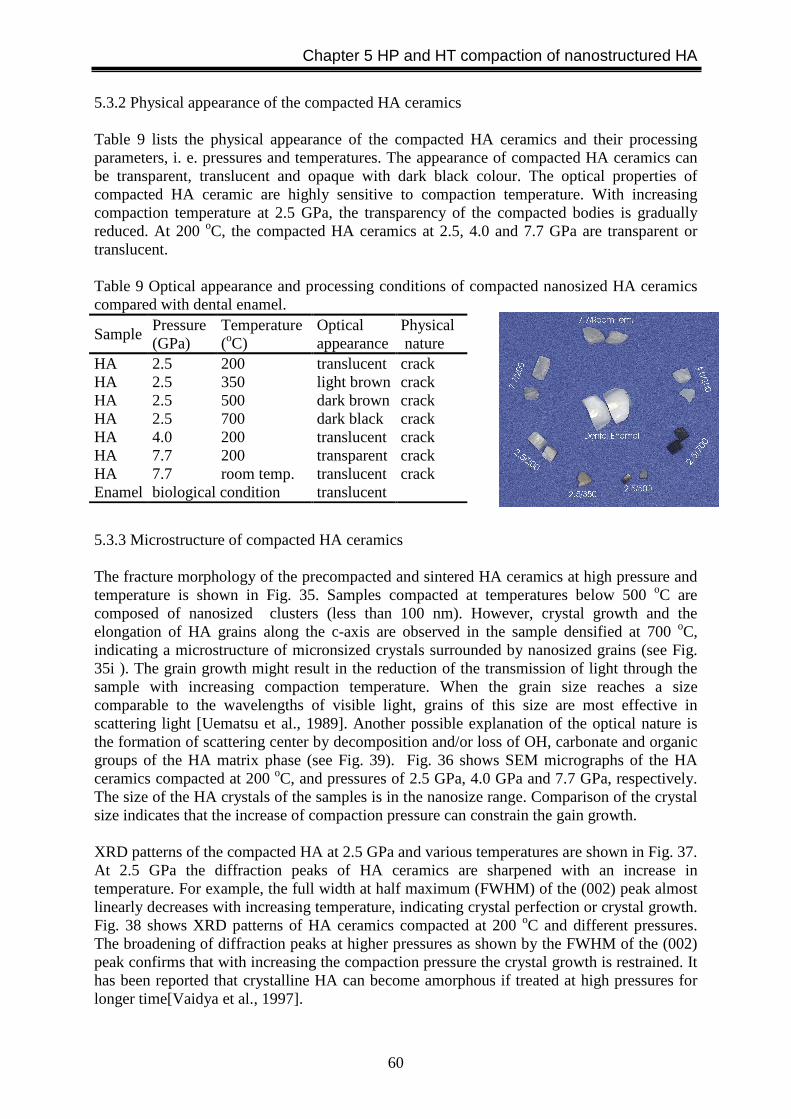
Chapter 5 HP and HT compaction of nanostructured HA
60
5.3.2 Physical appearance of the compacted HA ceramics Table 9 lists the physical appearance of the compacted HA ceramics and their processing parameters, i. e. pressures and temperatures. The appearance of compacted HA ceramics can be transparent, translucent and opaque with dark black colour. The optical properties of compacted HA ceramic are highly sensitive to compaction temperature. With increasing compaction temperature at 2.5 GPa, the transparency of the compacted bodies is gradually reduced. At 200 oC, the compacted HA ceramics at 2.5, 4.0 and 7.7 GPa are transparent or translucent. Table 9 Optical appearance and processing conditions of compacted nanosized HA ceramics compared with dental enamel.
5.3.3 Microstructure of compacted HA ceramics The fracture morphology of the precompacted and sintered HA ceramics at high pressure and temperature is shown in Fig. 35. Samples compacted at temperatures below 500 oC are composed of nanosized clusters (less than 100 nm). However, crystal growth and the elongation of HA grains along the c-axis are observed in the sample densified at 700 oC, indicating a microstructure of micronsized crystals surrounded by nanosized grains (see Fig. 35i ). The grain growth might result in the reduction of the transmission of light through the sample with increasing compaction temperature. When the grain size reaches a size comparable to the wavelengths of visible light, grains of this size are most effective in scattering light [Uematsu et al., 1989]. Another possible explanation of the optical nature is the formation of scattering center by decomposition and/or loss of OH, carbonate and organic groups of the HA matrix phase (see Fig. 39). Fig. 36 shows SEM micrographs of the HA ceramics compacted at 200 oC, and pressures of 2.5 GPa, 4.0 GPa and 7.7 GPa, respectively. The size of the HA crystals of the samples is in the nanosize range. Comparison of the crystal size indicates that the increase of compaction pressure can constrain the gain growth. XRD patterns of the compacted HA at 2.5 GPa and various temperatures are shown in Fig. 37. At 2.5 GPa the diffraction peaks of HA ceramics are sharpened with an increase in temperature. For example, the full width at half maximum (FWHM) of the (002) peak almost linearly decreases with increasing temperature, indicating crystal perfection or crystal growth. Fig. 38 shows XRD patterns of HA ceramics compacted at 200 oC and different pressures. The broadening of diffraction peaks at higher pressures as shown by the FWHM of the (002) peak confirms that with increasing the compaction pressure the crystal growth is restrained. It has been reported that crystalline HA can become amorphous if treated at high pressures for longer time[Vaidya et al., 1997].
Sample Pressure (GPa)
Temperature (oC)
Optical appearance
Physical nature
HA 2.5 200 translucent crack HA 2.5 350 light brown crack HA 2.5 500 dark brown crack HA 2.5 700 dark black crack HA 4.0 200 translucent crack HA 7.7 200 transparent crack HA 7.7 room temp. translucent crack Enamel biological condition translucent
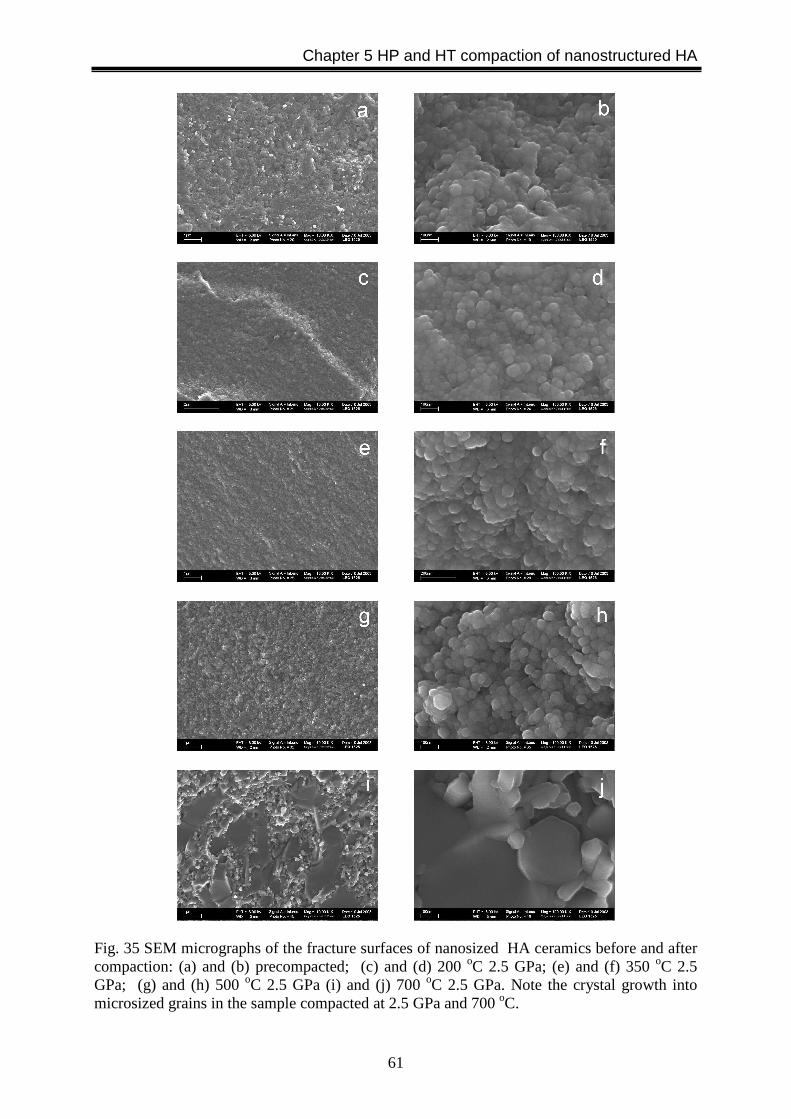
Chapter 5 HP and HT compaction of nanostructured HA
61
Fig. 35 SEM micrographs of the fracture surfaces of nanosized HA ceramics before and after compaction: (a) and (b) precompacted; (c) and (d) 200 oC 2.5 GPa; (e) and (f) 350 oC 2.5 GPa; (g) and (h) 500 oC 2.5 GPa (i) and (j) 700 oC 2.5 GPa. Note the crystal growth into microsized grains in the sample compacted at 2.5 GPa and 700 oC.

Chapter 5 HP and HT compaction of nanostructured HA
62
Fig. 36 SEM micrographs of the fracture surfaces of nanosized HA ceramics compacted at 200 oC: (a) and (b) 2.5GPa; (c) and (d) 4.0 GPa; (e) and (f) 7.7 GPa.
Fig. 37 XRD patterns (a) of the compacted HA ceramics at 2.5 GPa and the full width at the half maximum of the diffraction peak (002) as a function of temperature. The shape change of the diffraction peaks indicates crystal growth and crystal perfection.
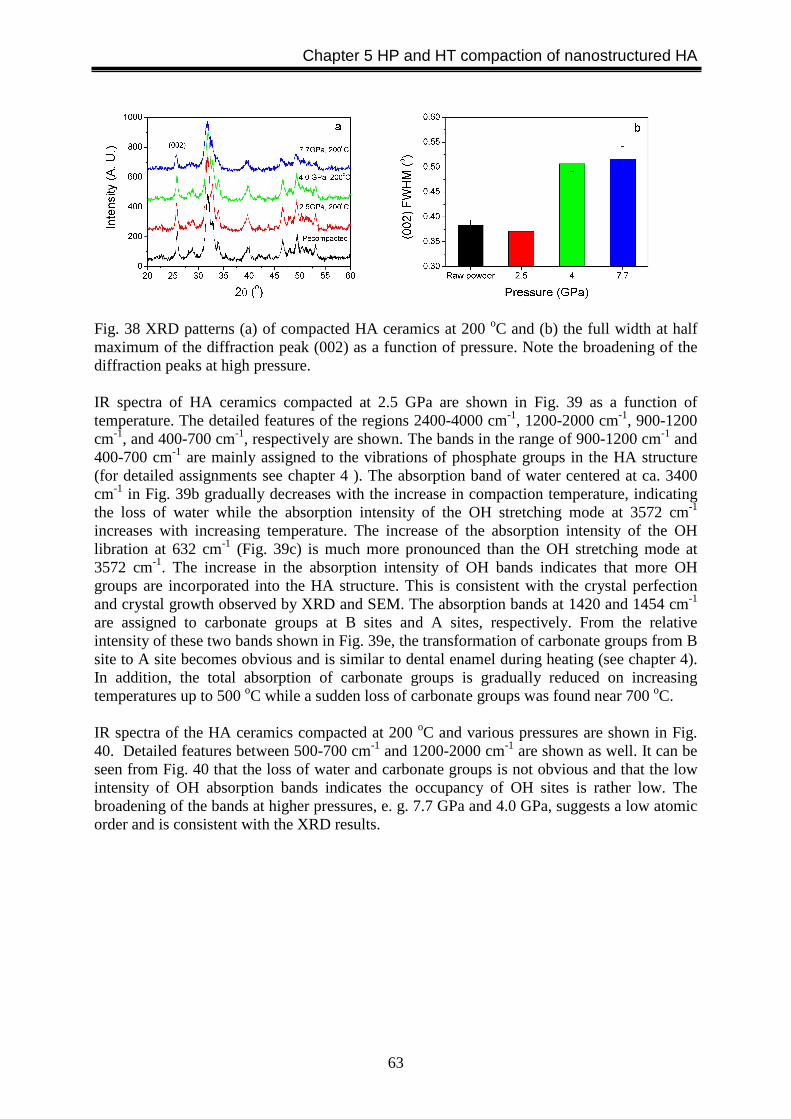
Chapter 5 HP and HT compaction of nanostructured HA
63
Fig. 38 XRD patterns (a) of compacted HA ceramics at 200 oC and (b) the full width at half maximum of the diffraction peak (002) as a function of pressure. Note the broadening of the diffraction peaks at high pressure. IR spectra of HA ceramics compacted at 2.5 GPa are shown in Fig. 39 as a function of temperature. The detailed features of the regions 2400-4000 cm-1, 1200-2000 cm-1, 900-1200 cm-1, and 400-700 cm-1, respectively are shown. The bands in the range of 900-1200 cm-1 and 400-700 cm-1 are mainly assigned to the vibrations of phosphate groups in the HA structure (for detailed assignments see chapter 4 ). The absorption band of water centered at ca. 3400 cm-1 in Fig. 39b gradually decreases with the increase in compaction temperature, indicating the loss of water while the absorption intensity of the OH stretching mode at 3572 cm-1 increases with increasing temperature. The increase of the absorption intensity of the OH libration at 632 cm-1 (Fig. 39c) is much more pronounced than the OH stretching mode at 3572 cm-1. The increase in the absorption intensity of OH bands indicates that more OH groups are incorporated into the HA structure. This is consistent with the crystal perfection and crystal growth observed by XRD and SEM. The absorption bands at 1420 and 1454 cm-1 are assigned to carbonate groups at B sites and A sites, respectively. From the relative intensity of these two bands shown in Fig. 39e, the transformation of carbonate groups from B site to A site becomes obvious and is similar to dental enamel during heating (see chapter 4). In addition, the total absorption of carbonate groups is gradually reduced on increasing temperatures up to 500 oC while a sudden loss of carbonate groups was found near 700 oC. IR spectra of the HA ceramics compacted at 200 oC and various pressures are shown in Fig. 40. Detailed features between 500-700 cm-1 and 1200-2000 cm-1 are shown as well. It can be seen from Fig. 40 that the loss of water and carbonate groups is not obvious and that the low intensity of OH absorption bands indicates the occupancy of OH sites is rather low. The broadening of the bands at higher pressures, e. g. 7.7 GPa and 4.0 GPa, suggests a low atomic order and is consistent with the XRD results.
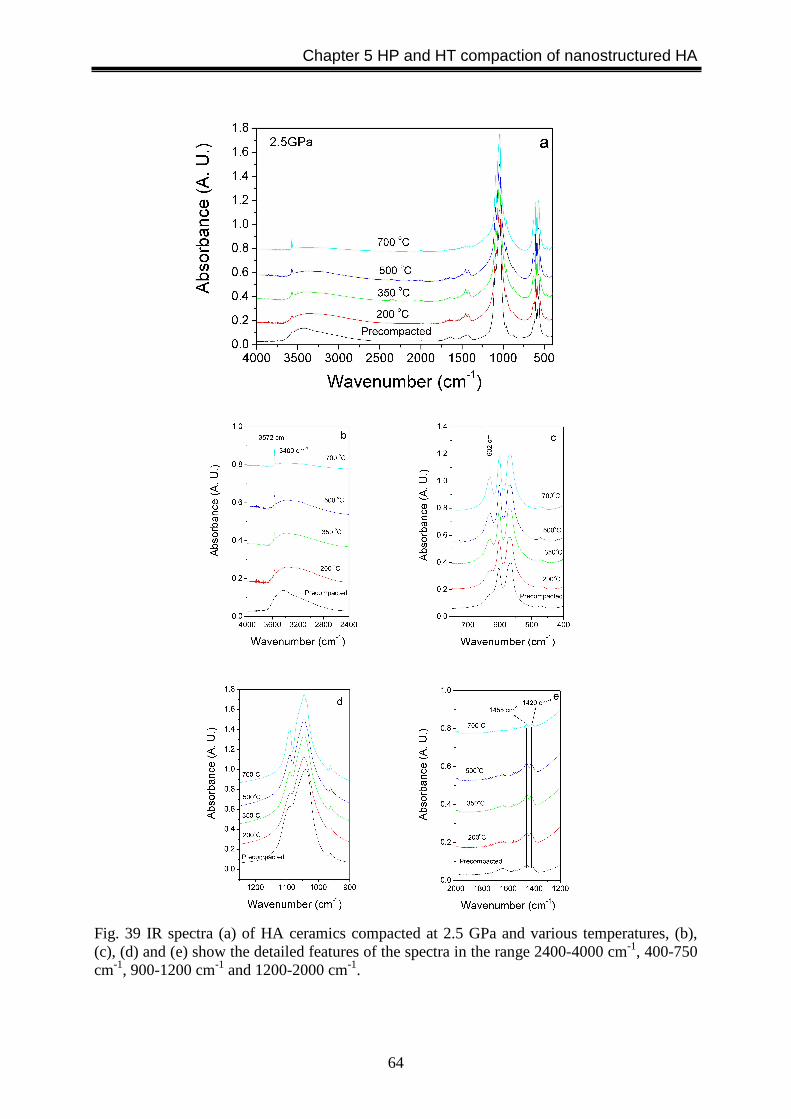
Chapter 5 HP and HT compaction of nanostructured HA
64
Fig. 39 IR spectra (a) of HA ceramics compacted at 2.5 GPa and various temperatures, (b), (c), (d) and (e) show the detailed features of the spectra in the range 2400-4000 cm-1, 400-750 cm-1, 900-1200 cm-1 and 1200-2000 cm-1.

Chapter 5 HP and HT compaction of nanostructured HA
65
Fig. 40 IR spectra of (a) HA ceramics compacted at 200 oC and various pressures, (b) and (c) show details of the spectra in the ranges 1200-2000 cm-1 and 500-700 cm-1. 5.3.4 Mechanical Properties Microhardness and fracture toughness of compacted HA ceramics were measured and calculated using the crack length developed during Vickers indentation. Figs. 41 and 42 show the effects of compaction temperature and pressure on the mechanical properties, respectively. The microhardness of HA ceramics produced at 2.5 GPa and various temperatures does not show obvious differences, the value is about 5.0 GPa. Fracture toughness is in the ranges between 0.6-1.0 MPa•m1/2 , showing a slight increase with increasing temperature. The higher fracture toughness of HA compacted at 700 oC can be explained by its unique microstructure with micron sized HA plates distributed in a nanosized HA matrix. Fig. 42a shows that increasing pressure results in a reduced microhardness. The fracture toughness of the HA

Chapter 5 HP and HT compaction of nanostructured HA
66
ceramics compacted at 200 oC is about 0.6 MPa•m1/2, no obvious difference was observed (Fig. 42b).
Fig. 41 Microhardness (a) and fracture toughness (b) of compacted HA ceramics at 2.5 GPa and various temperatures.
Fig. 42 Microhardness (a) and fracture toughness (b) of compacted HA ceramics at 200 oC and different pressures. The fracture toughness of the sample densified at 2.5 GPa and 700 oC is nearly doubled compared to the other samples. The difference in fracture toughness might be related to the fact that its microstructure developed into a micron sized HA crystals reinforced nanosized HA matrix composite. The grain coarsening into micron scaled crystals plays an important role for the structure. It has been reported that the microhardness of dental enamel is in the range of 3.0 - 4.6 GPa, depending on the testing method and the position on the teeth [Xu et al., 1998; White et al., 2001; Cuy et al., 2002]. The microhardness of nanostructured HA ceramics compacted at high pressures and temperatures in this study is in the range of 3.58 - 5.38 GPa, a range similar to dental enamel. The fracture toughness of dental enamel perpendicular and parallel to the enamel rods is quite different, which shows that dental enamel exhibits anisotropic properties [Xu et al., 1998; White et al., 2001]. The fracture toughness of compacted, nanostructured HA ceramics did not show any difference in mechanical properties with the orientation and position because of its homogeneous nature. Hassen et al. [1981] reported toughness values of molar teeth to be 0.70 ± 0.02 MPa•m1/2, in the cervical region, 0.70 ± 0.07 MPa•m1/2 in the middle region, and 0.76 ± 0.05 MPa•m1/2 in the incisal region. These values were obtained from 4 to 9 indentations at a load of 3 N. The values compare well with the fracture toughness of compacted HA ceramics at high pressures
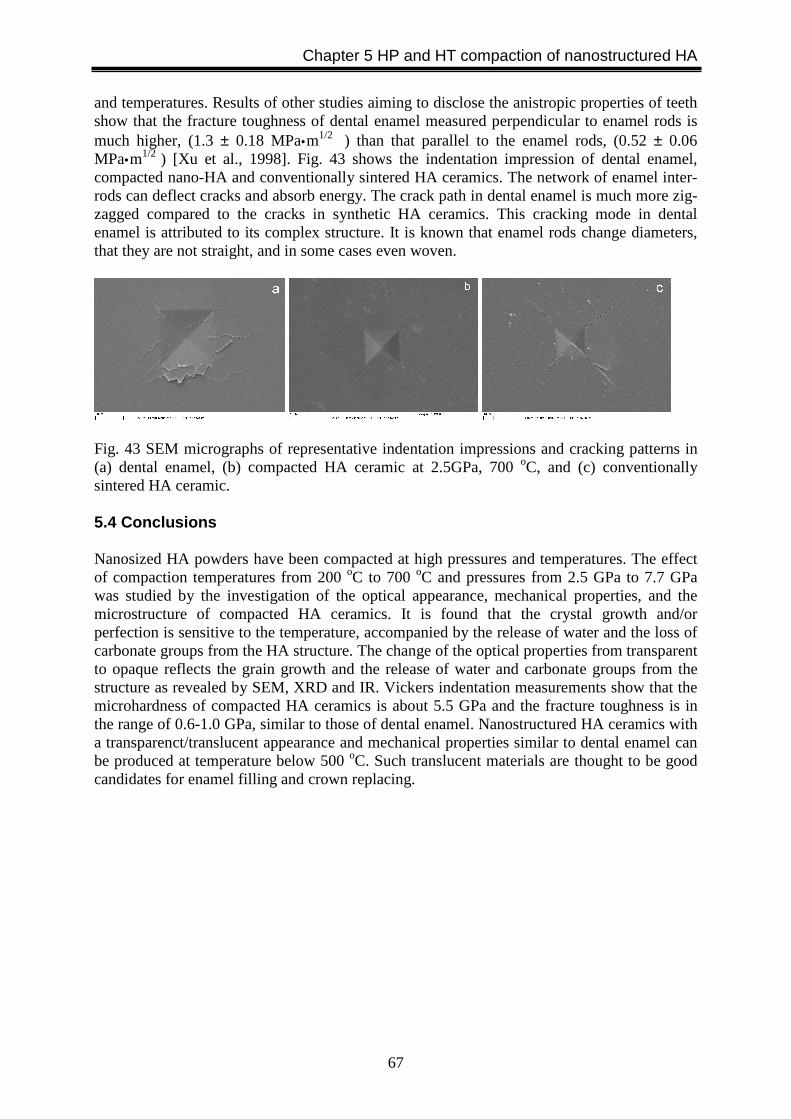
Chapter 5 HP and HT compaction of nanostructured HA
67
and temperatures. Results of other studies aiming to disclose the anistropic properties of teeth show that the fracture toughness of dental enamel measured perpendicular to enamel rods is much higher, (1.3 ± 0.18 MPa•m1/2 ) than that parallel to the enamel rods, (0.52 ± 0.06 MPa•m1/2 ) [Xu et al., 1998]. Fig. 43 shows the indentation impression of dental enamel, compacted nano-HA and conventionally sintered HA ceramics. The network of enamel inter-rods can deflect cracks and absorb energy. The crack path in dental enamel is much more zig-zagged compared to the cracks in synthetic HA ceramics. This cracking mode in dental enamel is attributed to its complex structure. It is known that enamel rods change diameters, that they are not straight, and in some cases even woven.
Fig. 43 SEM micrographs of representative indentation impressions and cracking patterns in (a) dental enamel, (b) compacted HA ceramic at 2.5GPa, 700 oC, and (c) conventionally sintered HA ceramic. 5.4 Conclusions Nanosized HA powders have been compacted at high pressures and temperatures. The effect of compaction temperatures from 200 oC to 700 oC and pressures from 2.5 GPa to 7.7 GPa was studied by the investigation of the optical appearance, mechanical properties, and the microstructure of compacted HA ceramics. It is found that the crystal growth and/or perfection is sensitive to the temperature, accompanied by the release of water and the loss of carbonate groups from the HA structure. The change of the optical properties from transparent to opaque reflects the grain growth and the release of water and carbonate groups from the structure as revealed by SEM, XRD and IR. Vickers indentation measurements show that the microhardness of compacted HA ceramics is about 5.5 GPa and the fracture toughness is in the range of 0.6-1.0 GPa, similar to those of dental enamel. Nanostructured HA ceramics with a transparenct/translucent appearance and mechanical properties similar to dental enamel can be produced at temperature below 500 oC. Such translucent materials are thought to be good candidates for enamel filling and crown replacing.
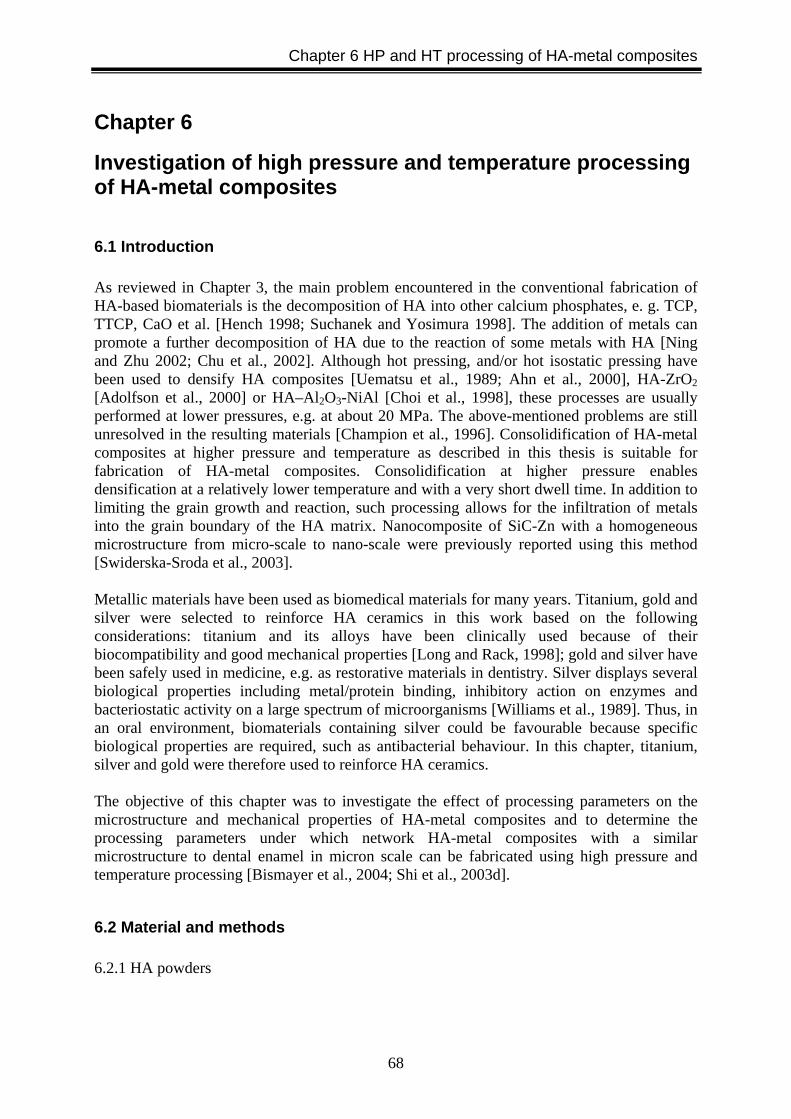
Chapter 6 HP and HT processing of HA-metal composites
68
Chapter 6
Investigation of high pressure and temperature processing of HA-metal composites
6.1 Introduction As reviewed in Chapter 3, the main problem encountered in the conventional fabrication of HA-based biomaterials is the decomposition of HA into other calcium phosphates, e. g. TCP, TTCP, CaO et al. [Hench 1998; Suchanek and Yosimura 1998]. The addition of metals can promote a further decomposition of HA due to the reaction of some metals with HA [Ning and Zhu 2002; Chu et al., 2002]. Although hot pressing, and/or hot isostatic pressing have been used to densify HA composites [Uematsu et al., 1989; Ahn et al., 2000], HA-ZrO2 [Adolfson et al., 2000] or HA–Al2O3-NiAl [Choi et al., 1998], these processes are usually performed at lower pressures, e.g. at about 20 MPa. The above-mentioned problems are still unresolved in the resulting materials [Champion et al., 1996]. Consolidification of HA-metal composites at higher pressure and temperature as described in this thesis is suitable for fabrication of HA-metal composites. Consolidification at higher pressure enables densification at a relatively lower temperature and with a very short dwell time. In addition to limiting the grain growth and reaction, such processing allows for the infiltration of metals into the grain boundary of the HA matrix. Nanocomposite of SiC-Zn with a homogeneous microstructure from micro-scale to nano-scale were previously reported using this method [Swiderska-Sroda et al., 2003]. Metallic materials have been used as biomedical materials for many years. Titanium, gold and silver were selected to reinforce HA ceramics in this work based on the following considerations: titanium and its alloys have been clinically used because of their biocompatibility and good mechanical properties [Long and Rack, 1998]; gold and silver have been safely used in medicine, e.g. as restorative materials in dentistry. Silver displays several biological properties including metal/protein binding, inhibitory action on enzymes and bacteriostatic activity on a large spectrum of microorganisms [Williams et al., 1989]. Thus, in an oral environment, biomaterials containing silver could be favourable because specific biological properties are required, such as antibacterial behaviour. In this chapter, titanium, silver and gold were therefore used to reinforce HA ceramics. The objective of this chapter was to investigate the effect of processing parameters on the microstructure and mechanical properties of HA-metal composites and to determine the processing parameters under which network HA-metal composites with a similar microstructure to dental enamel in micron scale can be fabricated using high pressure and temperature processing [Bismayer et al., 2004; Shi et al., 2003d].
6.2 Material and methods 6.2.1 HA powders
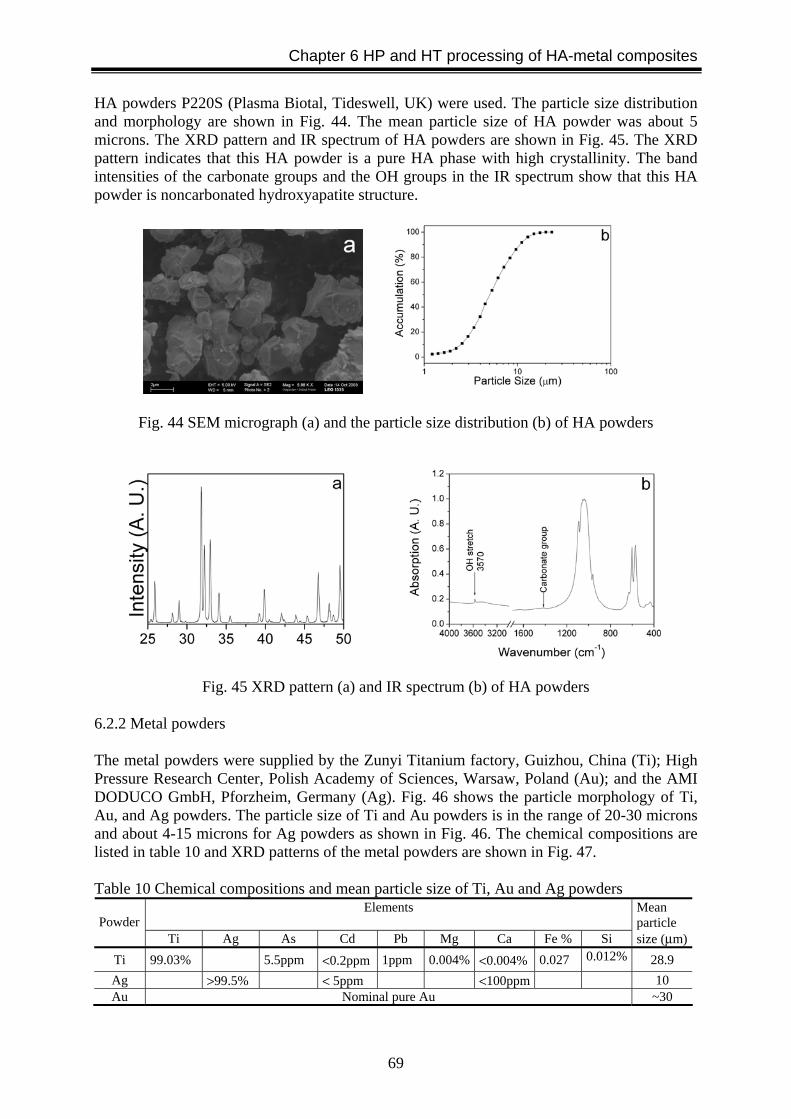
Chapter 6 HP and HT processing of HA-metal composites
69
HA powders P220S (Plasma Biotal, Tideswell, UK) were used. The particle size distribution and morphology are shown in Fig. 44. The mean particle size of HA powder was about 5 microns. The XRD pattern and IR spectrum of HA powders are shown in Fig. 45. The XRD pattern indicates that this HA powder is a pure HA phase with high crystallinity. The band intensities of the carbonate groups and the OH groups in the IR spectrum show that this HA powder is noncarbonated hydroxyapatite structure.
Fig. 44 SEM micrograph (a) and the particle size distribution (b) of HA powders
Fig. 45 XRD pattern (a) and IR spectrum (b) of HA powders 6.2.2 Metal powders The metal powders were supplied by the Zunyi Titanium factory, Guizhou, China (Ti); High Pressure Research Center, Polish Academy of Sciences, Warsaw, Poland (Au); and the AMI DODUCO GmbH, Pforzheim, Germany (Ag). Fig. 46 shows the particle morphology of Ti, Au, and Ag powders. The particle size of Ti and Au powders is in the range of 20-30 microns and about 4-15 microns for Ag powders as shown in Fig. 46. The chemical compositions are listed in table 10 and XRD patterns of the metal powders are shown in Fig. 47. Table 10 Chemical compositions and mean particle size of Ti, Au and Ag powders
Elements Powder
Ti Ag As Cd Pb Mg Ca Fe % Si
Mean particle size (µm)
Ti 99.03% 5.5ppm <0.2ppm 1ppm 0.004% <0.004% 0.027 0.012% 28.9 Ag >99.5% < 5ppm <100ppm 10 Au Nominal pure Au ~30
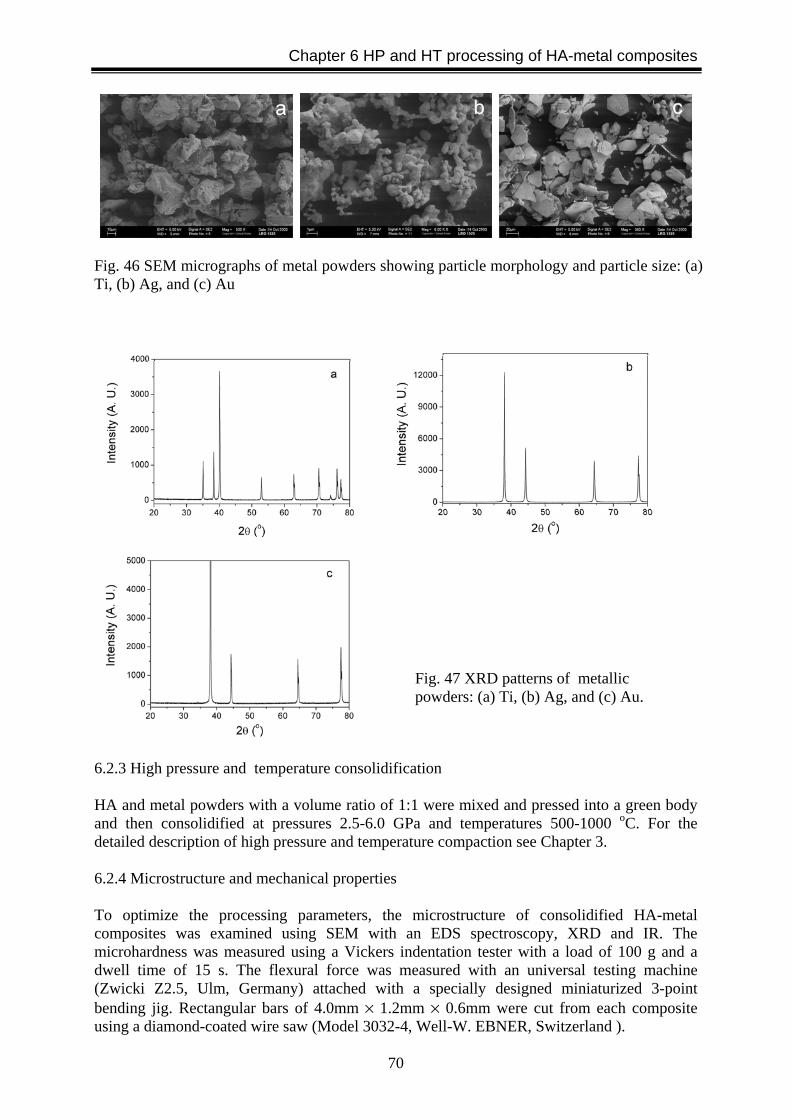
Chapter 6 HP and HT processing of HA-metal composites
70
Fig. 46 SEM micrographs of metal powders showing particle morphology and particle size: (a) Ti, (b) Ag, and (c) Au
6.2.3 High pressure and temperature consolidification HA and metal powders with a volume ratio of 1:1 were mixed and pressed into a green body and then consolidified at pressures 2.5-6.0 GPa and temperatures 500-1000 oC. For the detailed description of high pressure and temperature compaction see Chapter 3. 6.2.4 Microstructure and mechanical properties To optimize the processing parameters, the microstructure of consolidified HA-metal composites was examined using SEM with an EDS spectroscopy, XRD and IR. The microhardness was measured using a Vickers indentation tester with a load of 100 g and a dwell time of 15 s. The flexural force was measured with an universal testing machine (Zwicki Z2.5, Ulm, Germany) attached with a specially designed miniaturized 3-point bending jig. Rectangular bars of 4.0mm × 1.2mm × 0.6mm were cut from each composite using a diamond-coated wire saw (Model 3032-4, Well-W. EBNER, Switzerland ).
Fig. 47 XRD patterns of metallic powders: (a) Ti, (b) Ag, and (c) Au.

Chapter 6 HP and HT processing of HA-metal composites
71
6.3 Results and discussion 6.3.1 HA+50vol% Ti composites Effect of temperature on the microstructure of HA+50vol% Ti composites The fractured surfaces of HA-Ti composites with a volume ratio of 1:1 consolidified at 2.5 GPa and different temperatures are shown in Fig. 48. Pullouts of HA grains occurred at the fracture surfaces. As a result, voids were created on the fractured surfaces and some particles were found to adhere to the fractured surface. Fig. 49 shows XRD patterns of the HA+50% Ti mixed powder, and HA-Ti composites consolidified at 2.5 GPa and 700 oC, 800 oC and 900 oC, respectively. The powder mixture consisted of HA and Ti phases. After consolidification at high temperature, the XRD patterns showed only HA and Ti phases. Reaction products between HA and Ti were not detected by XRD technique. This can be attributed to the short sintering time and relatively low temperature of high pressure and temperature processing.
Fig. 48 SEM micrographs of fractured surfaces of HA+50 vol% Ti composites consolidified at 2.5 GPa and different temperatures: (a) and (b) 700 oC, (c) and (d) 800 oC, (e) and (f) 900 oC
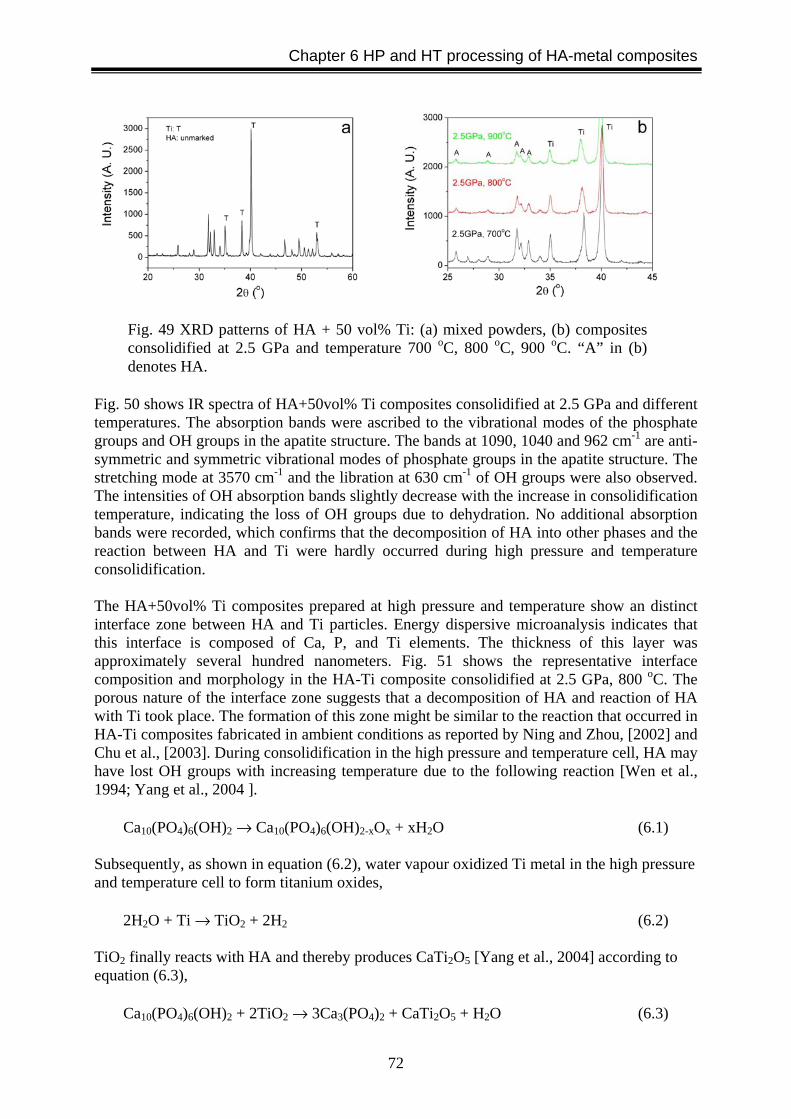
Chapter 6 HP and HT processing of HA-metal composites
72
Fig. 50 shows IR spectra of HA+50vol% Ti composites consolidified at 2.5 GPa and different temperatures. The absorption bands were ascribed to the vibrational modes of the phosphate groups and OH groups in the apatite structure. The bands at 1090, 1040 and 962 cm-1 are anti- symmetric and symmetric vibrational modes of phosphate groups in the apatite structure. The stretching mode at 3570 cm-1 and the libration at 630 cm-1 of OH groups were also observed. The intensities of OH absorption bands slightly decrease with the increase in consolidification temperature, indicating the loss of OH groups due to dehydration. No additional absorption bands were recorded, which confirms that the decomposition of HA into other phases and the reaction between HA and Ti were hardly occurred during high pressure and temperature consolidification. The HA+50vol% Ti composites prepared at high pressure and temperature show an distinct interface zone between HA and Ti particles. Energy dispersive microanalysis indicates that this interface is composed of Ca, P, and Ti elements. The thickness of this layer was approximately several hundred nanometers. Fig. 51 shows the representative interface composition and morphology in the HA-Ti composite consolidified at 2.5 GPa, 800 oC. The porous nature of the interface zone suggests that a decomposition of HA and reaction of HA with Ti took place. The formation of this zone might be similar to the reaction that occurred in HA-Ti composites fabricated in ambient conditions as reported by Ning and Zhou, [2002] and Chu et al., [2003]. During consolidification in the high pressure and temperature cell, HA may have lost OH groups with increasing temperature due to the following reaction [Wen et al., 1994; Yang et al., 2004 ].
Ca10(PO4)6(OH)2 → Ca10(PO4)6(OH)2-xOx + xH2O (6.1) Subsequently, as shown in equation (6.2), water vapour oxidized Ti metal in the high pressure and temperature cell to form titanium oxides,
2H2O + Ti → TiO2 + 2H2 (6.2) TiO2 finally reacts with HA and thereby produces CaTi2O5 [Yang et al., 2004] according to equation (6.3),
Ca10(PO4)6(OH)2 + 2TiO2 → 3Ca3(PO4)2 + CaTi2O5 + H2O (6.3)
Fig. 49 XRD patterns of HA + 50 vol% Ti: (a) mixed powders, (b) composites consolidified at 2.5 GPa and temperature 700 oC, 800 oC, 900 oC. “A” in (b) denotes HA.
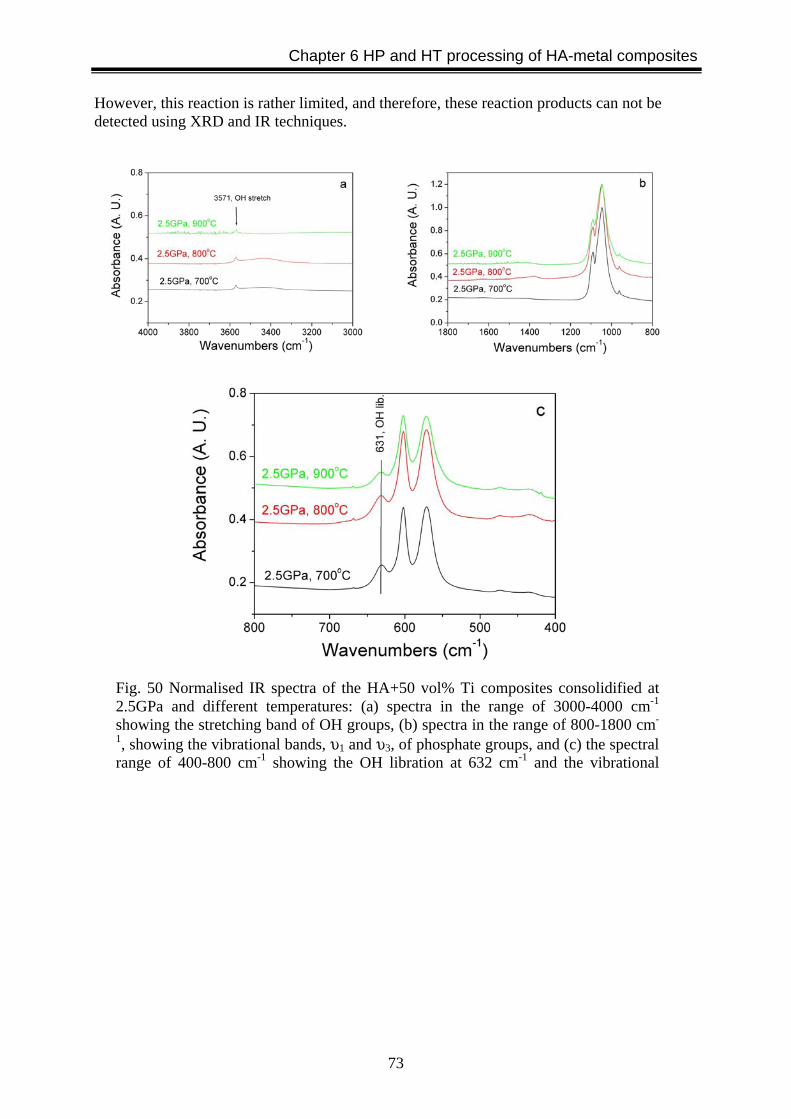
Chapter 6 HP and HT processing of HA-metal composites
73
However, this reaction is rather limited, and therefore, these reaction products can not be detected using XRD and IR techniques.
Fig. 50 Normalised IR spectra of the HA+50 vol% Ti composites consolidified at 2.5GPa and different temperatures: (a) spectra in the range of 3000-4000 cm-1 showing the stretching band of OH groups, (b) spectra in the range of 800-1800 cm-
1, showing the vibrational bands, υ1 and υ3, of phosphate groups, and (c) the spectral range of 400-800 cm-1 showing the OH libration at 632 cm-1 and the vibrational
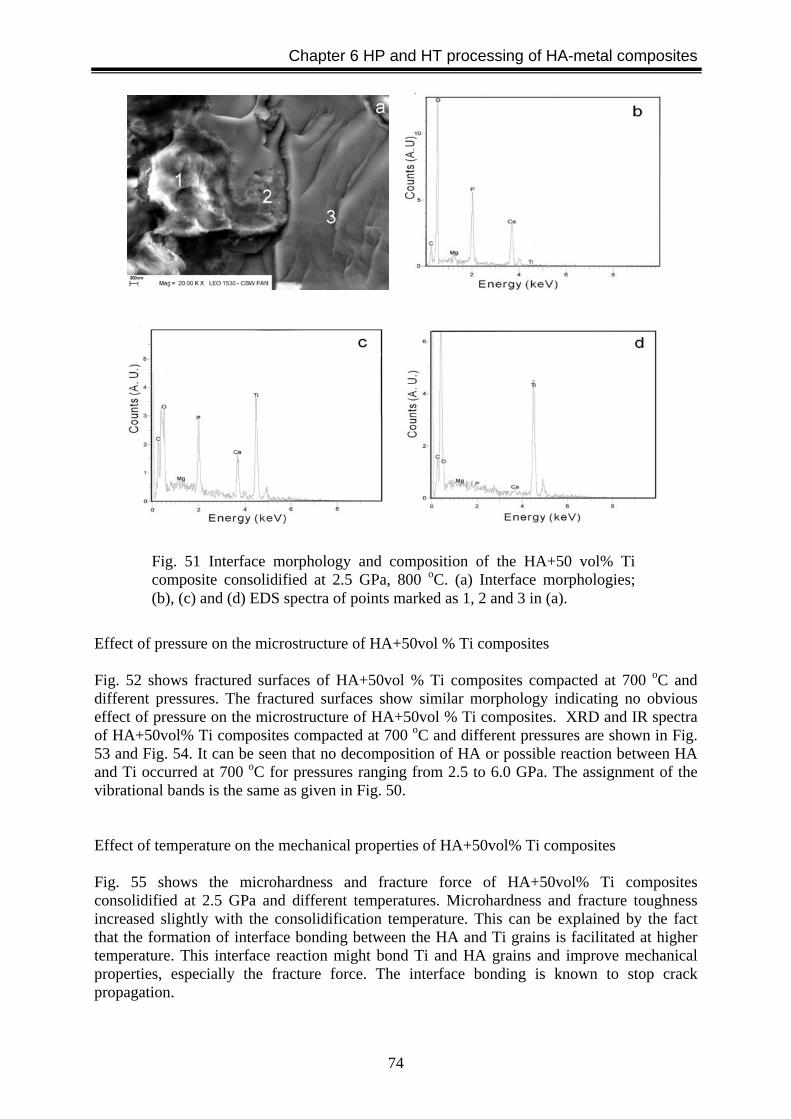
Chapter 6 HP and HT processing of HA-metal composites
74
Effect of pressure on the microstructure of HA+50vol % Ti composites Fig. 52 shows fractured surfaces of HA+50vol % Ti composites compacted at 700 oC and different pressures. The fractured surfaces show similar morphology indicating no obvious effect of pressure on the microstructure of HA+50vol % Ti composites. XRD and IR spectra of HA+50vol% Ti composites compacted at 700 oC and different pressures are shown in Fig. 53 and Fig. 54. It can be seen that no decomposition of HA or possible reaction between HA and Ti occurred at 700 oC for pressures ranging from 2.5 to 6.0 GPa. The assignment of the vibrational bands is the same as given in Fig. 50. Effect of temperature on the mechanical properties of HA+50vol% Ti composites Fig. 55 shows the microhardness and fracture force of HA+50vol% Ti composites consolidified at 2.5 GPa and different temperatures. Microhardness and fracture toughness increased slightly with the consolidification temperature. This can be explained by the fact that the formation of interface bonding between the HA and Ti grains is facilitated at higher temperature. This interface reaction might bond Ti and HA grains and improve mechanical properties, especially the fracture force. The interface bonding is known to stop crack propagation.
Fig. 51 Interface morphology and composition of the HA+50 vol% Ti composite consolidified at 2.5 GPa, 800 oC. (a) Interface morphologies; (b), (c) and (d) EDS spectra of points marked as 1, 2 and 3 in (a).

Chapter 6 HP and HT processing of HA-metal composites
75
Effect of pressure on the mechanical properties of HA+50 vol% Ti composites Fig. 56 shows the microhardness and fracture force of HA+50 vol% Ti composites consolidified at 700 oC and different pressures. There is no obvious difference in microhardness and fracture force for specimens synthesized at different pressure studied. The microhardness is about 5.0 GPa and the fracture force is about 7.5 N. The fracture force is about 2 times compared with that of conventionally sintered HA ceramics. Taking into consideration mechanical properties and microstructure of the HA+50vol% Ti composites fabricated at high pressures and temperatures, there is a relationship between mechanical properties and processing parameters. The microstructure of HA+50vol% Ti composites depends much on the consolidification temperature. As shown in Fig. 55, with
Fig. 52 SEM micrographs of fractured surfaces of HA+50vol% Ti composites compacted at 700 oC and different pressures: (a) and (b) 2.5 GPa, (c) and (d) 4.0 GPa, (e) and (f) 6.0 GPa.
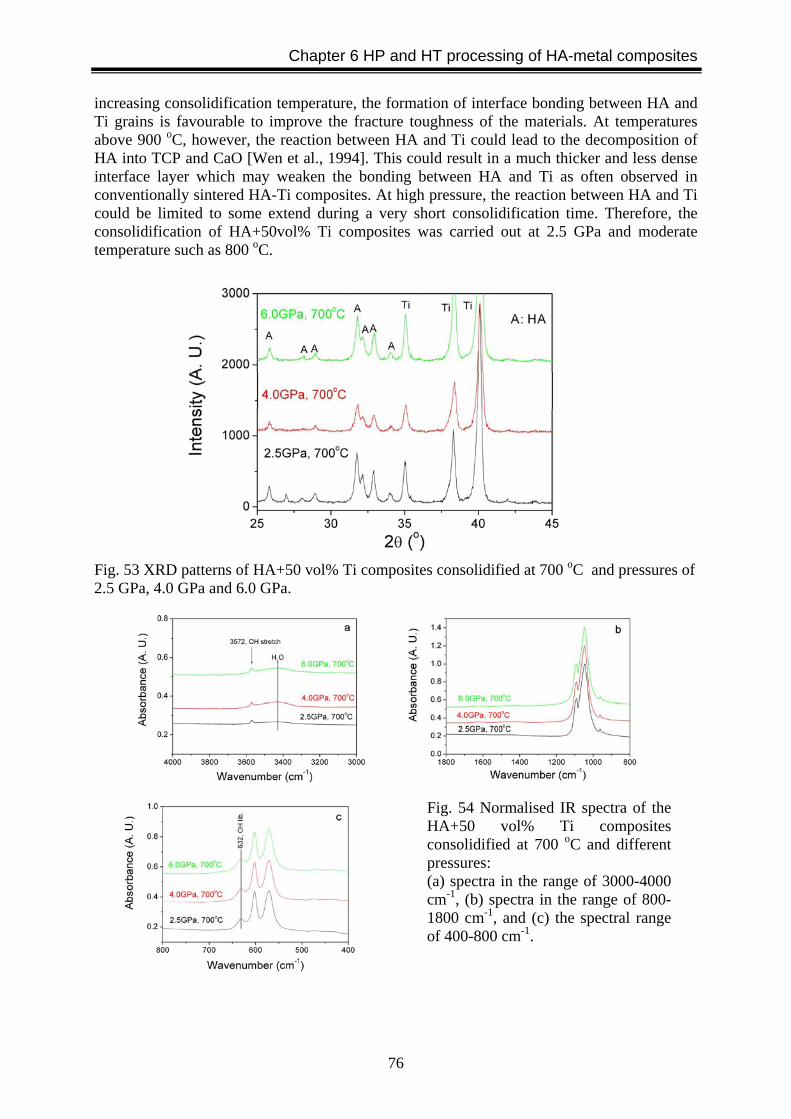
Chapter 6 HP and HT processing of HA-metal composites
76
increasing consolidification temperature, the formation of interface bonding between HA and Ti grains is favourable to improve the fracture toughness of the materials. At temperatures above 900 oC, however, the reaction between HA and Ti could lead to the decomposition of HA into TCP and CaO [Wen et al., 1994]. This could result in a much thicker and less dense interface layer which may weaken the bonding between HA and Ti as often observed in conventionally sintered HA-Ti composites. At high pressure, the reaction between HA and Ti could be limited to some extend during a very short consolidification time. Therefore, the consolidification of HA+50vol% Ti composites was carried out at 2.5 GPa and moderate temperature such as 800 oC.
Fig. 53 XRD patterns of HA+50 vol% Ti composites consolidified at 700 oC and pressures of 2.5 GPa, 4.0 GPa and 6.0 GPa.
Fig. 54 Normalised IR spectra of the HA+50 vol% Ti composites consolidified at 700 oC and different pressures: (a) spectra in the range of 3000-4000 cm-1, (b) spectra in the range of 800-1800 cm-1, and (c) the spectral range of 400-800 cm-1.
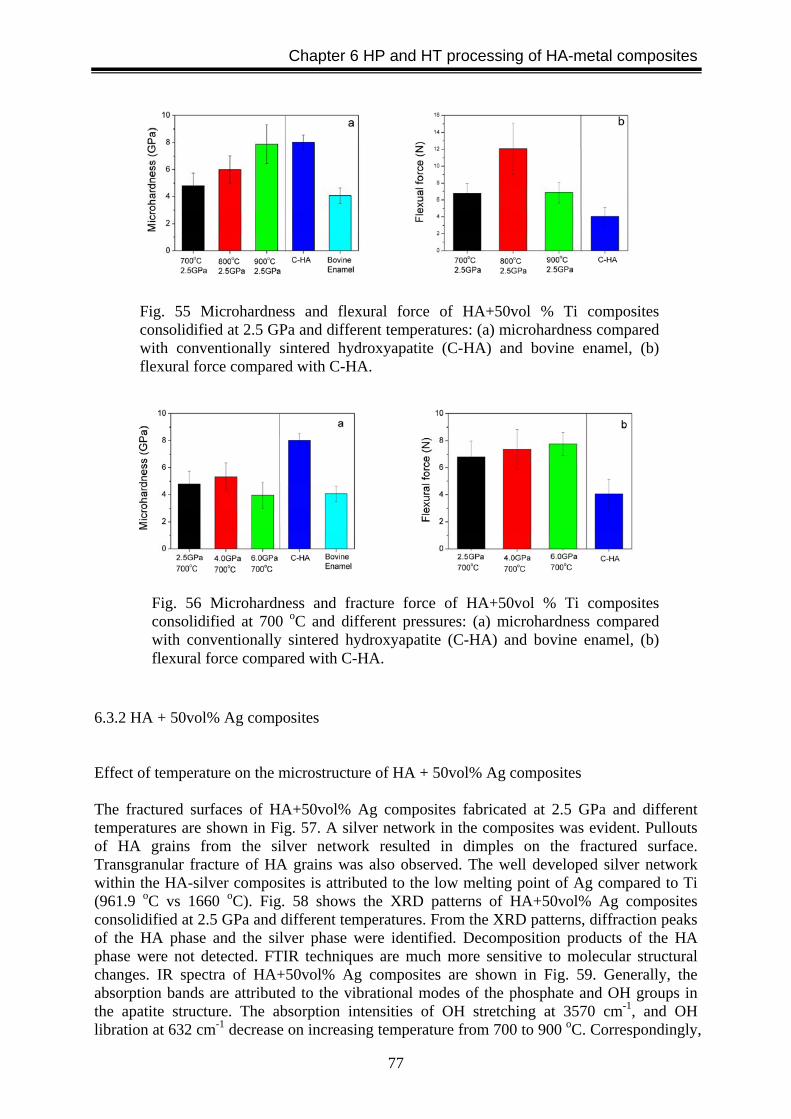
Chapter 6 HP and HT processing of HA-metal composites
77
6.3.2 HA + 50vol% Ag composites Effect of temperature on the microstructure of HA + 50vol% Ag composites The fractured surfaces of HA+50vol% Ag composites fabricated at 2.5 GPa and different temperatures are shown in Fig. 57. A silver network in the composites was evident. Pullouts of HA grains from the silver network resulted in dimples on the fractured surface. Transgranular fracture of HA grains was also observed. The well developed silver network within the HA-silver composites is attributed to the low melting point of Ag compared to Ti (961.9 oC vs 1660 oC). Fig. 58 shows the XRD patterns of HA+50vol% Ag composites consolidified at 2.5 GPa and different temperatures. From the XRD patterns, diffraction peaks of the HA phase and the silver phase were identified. Decomposition products of the HA phase were not detected. FTIR techniques are much more sensitive to molecular structural changes. IR spectra of HA+50vol% Ag composites are shown in Fig. 59. Generally, the absorption bands are attributed to the vibrational modes of the phosphate and OH groups in the apatite structure. The absorption intensities of OH stretching at 3570 cm-1, and OH libration at 632 cm-1 decrease on increasing temperature from 700 to 900 oC. Correspondingly,
Fig. 55 Microhardness and flexural force of HA+50vol % Ti composites consolidified at 2.5 GPa and different temperatures: (a) microhardness compared with conventionally sintered hydroxyapatite (C-HA) and bovine enamel, (b) flexural force compared with C-HA.
Fig. 56 Microhardness and fracture force of HA+50vol % Ti composites consolidified at 700 oC and different pressures: (a) microhardness compared with conventionally sintered hydroxyapatite (C-HA) and bovine enamel, (b) flexural force compared with C-HA.
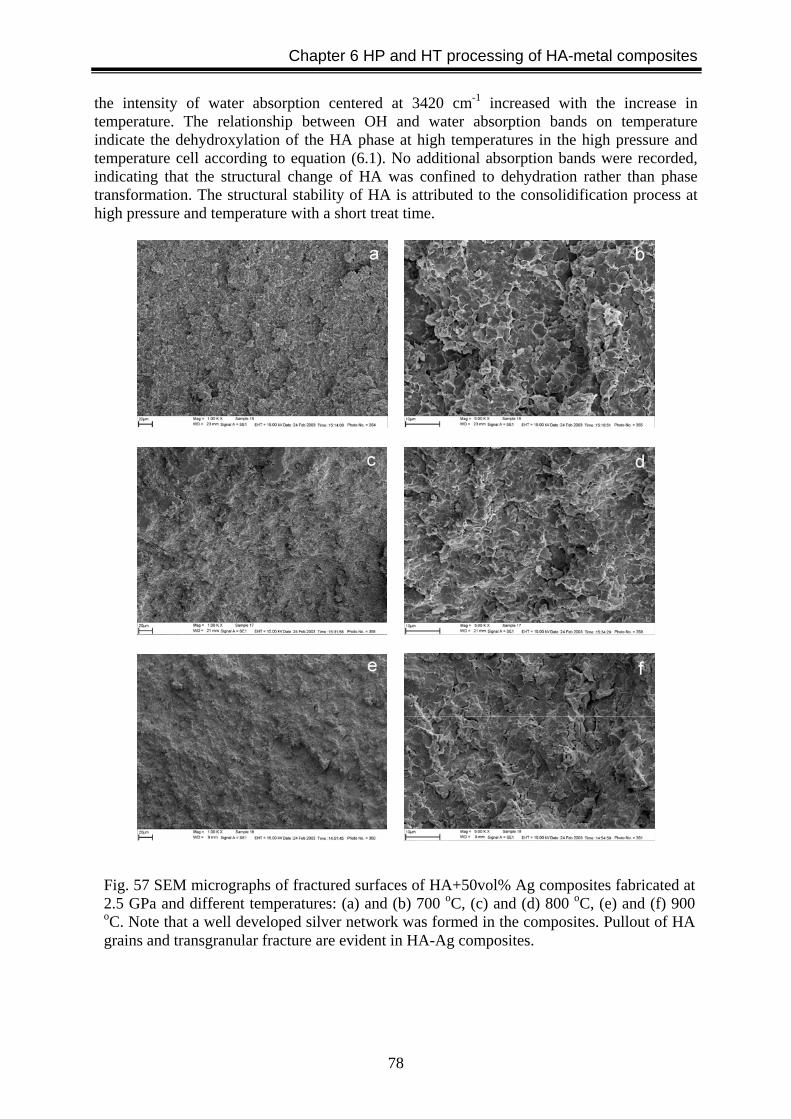
Chapter 6 HP and HT processing of HA-metal composites
78
the intensity of water absorption centered at 3420 cm-1 increased with the increase in temperature. The relationship between OH and water absorption bands on temperature indicate the dehydroxylation of the HA phase at high temperatures in the high pressure and temperature cell according to equation (6.1). No additional absorption bands were recorded, indicating that the structural change of HA was confined to dehydration rather than phase transformation. The structural stability of HA is attributed to the consolidification process at high pressure and temperature with a short treat time.
Fig. 57 SEM micrographs of fractured surfaces of HA+50vol% Ag composites fabricated at 2.5 GPa and different temperatures: (a) and (b) 700 oC, (c) and (d) 800 oC, (e) and (f) 900 oC. Note that a well developed silver network was formed in the composites. Pullout of HA grains and transgranular fracture are evident in HA-Ag composites.
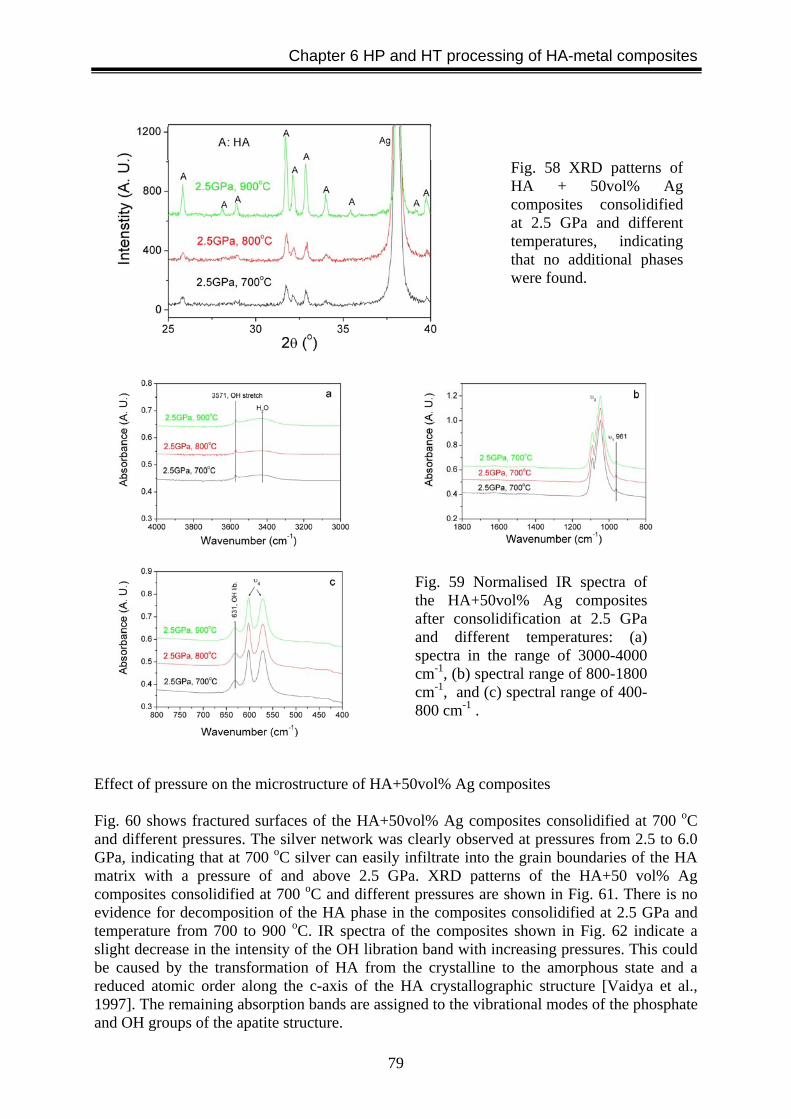
Chapter 6 HP and HT processing of HA-metal composites
79
Effect of pressure on the microstructure of HA+50vol% Ag composites Fig. 60 shows fractured surfaces of the HA+50vol% Ag composites consolidified at 700 oC and different pressures. The silver network was clearly observed at pressures from 2.5 to 6.0 GPa, indicating that at 700 oC silver can easily infiltrate into the grain boundaries of the HA matrix with a pressure of and above 2.5 GPa. XRD patterns of the HA+50 vol% Ag composites consolidified at 700 oC and different pressures are shown in Fig. 61. There is no evidence for decomposition of the HA phase in the composites consolidified at 2.5 GPa and temperature from 700 to 900 oC. IR spectra of the composites shown in Fig. 62 indicate a slight decrease in the intensity of the OH libration band with increasing pressures. This could be caused by the transformation of HA from the crystalline to the amorphous state and a reduced atomic order along the c-axis of the HA crystallographic structure [Vaidya et al., 1997]. The remaining absorption bands are assigned to the vibrational modes of the phosphate and OH groups of the apatite structure.
Fig. 58 XRD patterns of HA + 50vol% Ag composites consolidified at 2.5 GPa and different temperatures, indicating that no additional phases were found.
Fig. 59 Normalised IR spectra of the HA+50vol% Ag composites after consolidification at 2.5 GPa and different temperatures: (a) spectra in the range of 3000-4000 cm-1, (b) spectral range of 800-1800 cm-1, and (c) spectral range of 400-800 cm-1 .
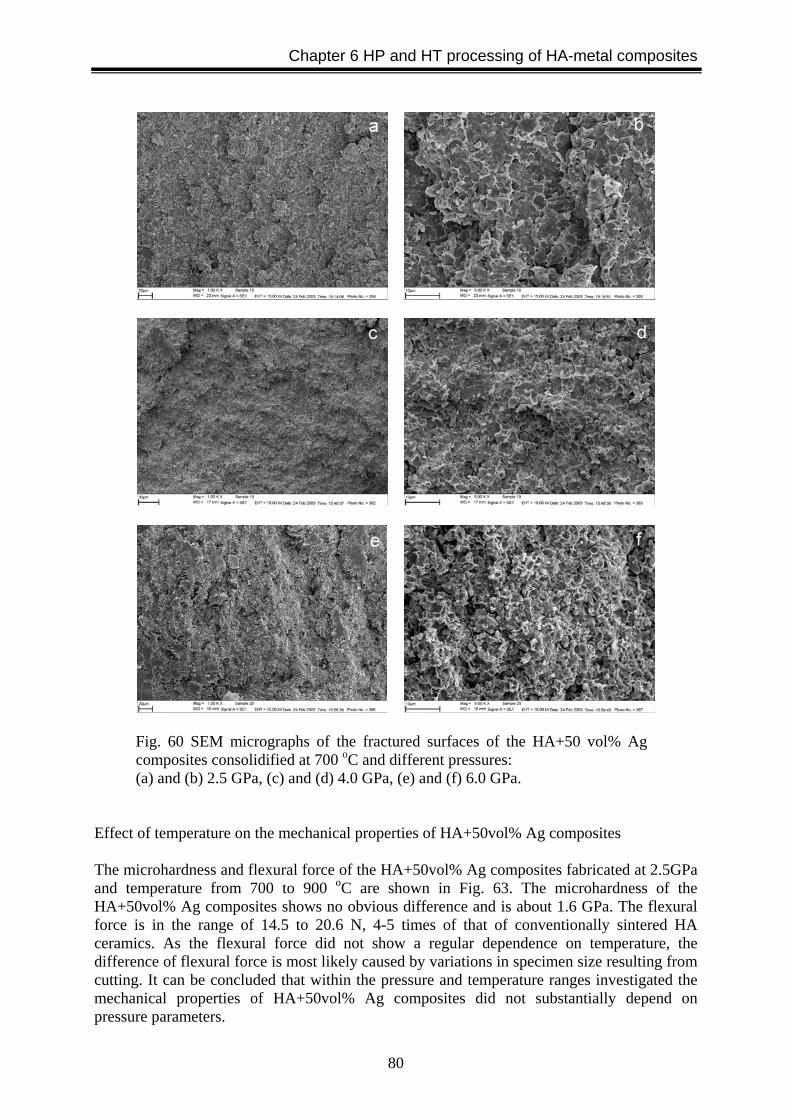
Chapter 6 HP and HT processing of HA-metal composites
80
Effect of temperature on the mechanical properties of HA+50vol% Ag composites The microhardness and flexural force of the HA+50vol% Ag composites fabricated at 2.5GPa and temperature from 700 to 900 oC are shown in Fig. 63. The microhardness of the HA+50vol% Ag composites shows no obvious difference and is about 1.6 GPa. The flexural force is in the range of 14.5 to 20.6 N, 4-5 times of that of conventionally sintered HA ceramics. As the flexural force did not show a regular dependence on temperature, the difference of flexural force is most likely caused by variations in specimen size resulting from cutting. It can be concluded that within the pressure and temperature ranges investigated the mechanical properties of HA+50vol% Ag composites did not substantially depend on pressure parameters.
Fig. 60 SEM micrographs of the fractured surfaces of the HA+50 vol% Ag composites consolidified at 700 oC and different pressures: (a) and (b) 2.5 GPa, (c) and (d) 4.0 GPa, (e) and (f) 6.0 GPa.
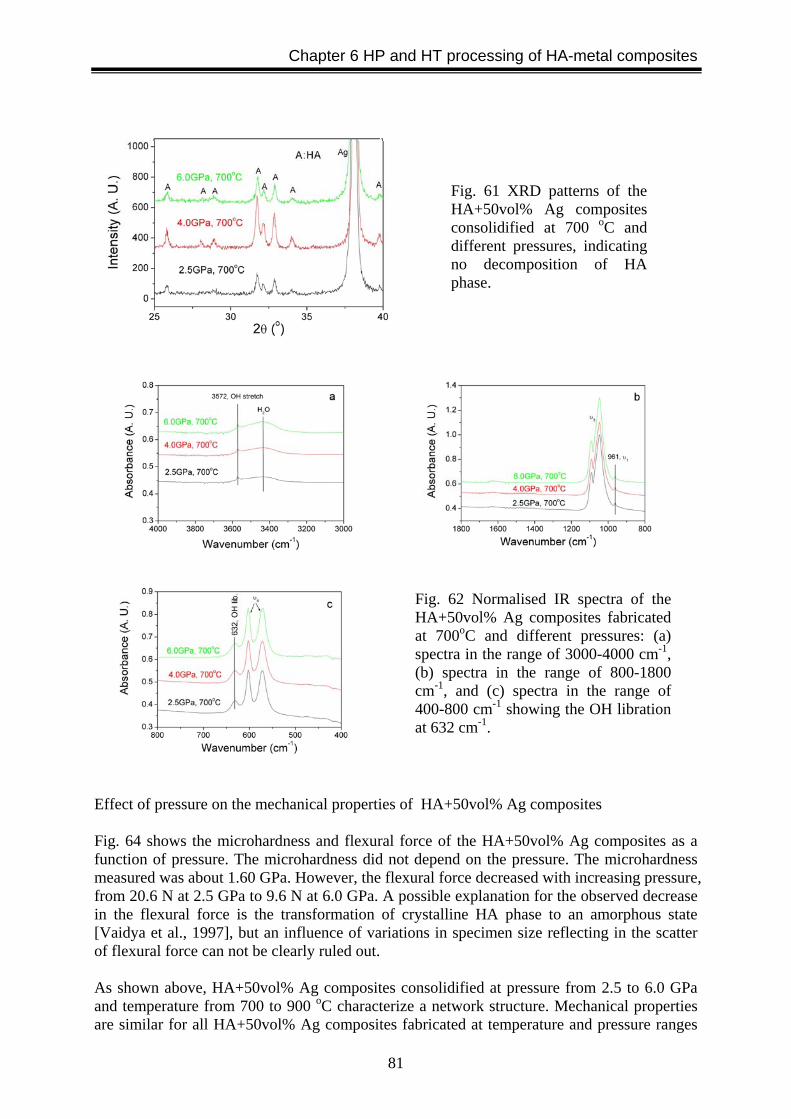
Chapter 6 HP and HT processing of HA-metal composites
81
Effect of pressure on the mechanical properties of HA+50vol% Ag composites Fig. 64 shows the microhardness and flexural force of the HA+50vol% Ag composites as a function of pressure. The microhardness did not depend on the pressure. The microhardness measured was about 1.60 GPa. However, the flexural force decreased with increasing pressure, from 20.6 N at 2.5 GPa to 9.6 N at 6.0 GPa. A possible explanation for the observed decrease in the flexural force is the transformation of crystalline HA phase to an amorphous state [Vaidya et al., 1997], but an influence of variations in specimen size reflecting in the scatter of flexural force can not be clearly ruled out. As shown above, HA+50vol% Ag composites consolidified at pressure from 2.5 to 6.0 GPa and temperature from 700 to 900 oC characterize a network structure. Mechanical properties are similar for all HA+50vol% Ag composites fabricated at temperature and pressure ranges
Fig. 61 XRD patterns of the HA+50vol% Ag composites consolidified at 700 oC and different pressures, indicating no decomposition of HA phase.
Fig. 62 Normalised IR spectra of the HA+50vol% Ag composites fabricated at 700oC and different pressures: (a) spectra in the range of 3000-4000 cm-1, (b) spectra in the range of 800-1800 cm-1, and (c) spectra in the range of 400-800 cm-1 showing the OH libration at 632 cm-1.
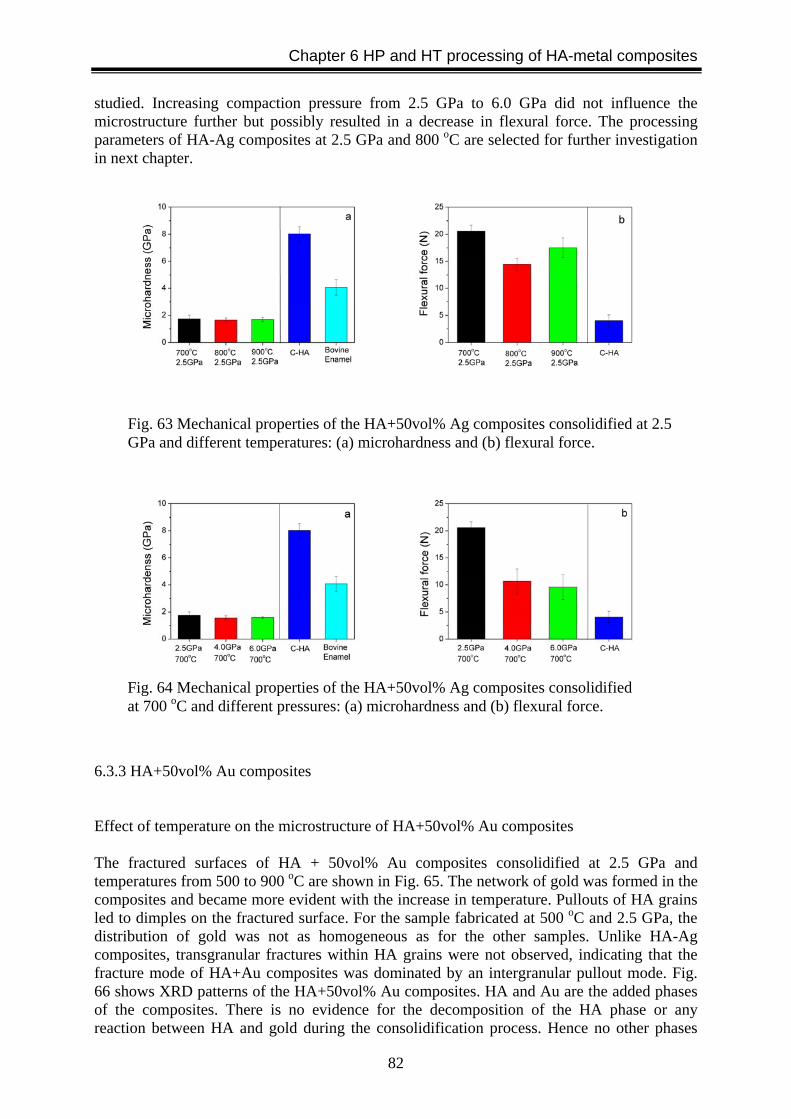
Chapter 6 HP and HT processing of HA-metal composites
82
studied. Increasing compaction pressure from 2.5 GPa to 6.0 GPa did not influence the microstructure further but possibly resulted in a decrease in flexural force. The processing parameters of HA-Ag composites at 2.5 GPa and 800 oC are selected for further investigation in next chapter.
6.3.3 HA+50vol% Au composites Effect of temperature on the microstructure of HA+50vol% Au composites The fractured surfaces of HA + 50vol% Au composites consolidified at 2.5 GPa and temperatures from 500 to 900 oC are shown in Fig. 65. The network of gold was formed in the composites and became more evident with the increase in temperature. Pullouts of HA grains led to dimples on the fractured surface. For the sample fabricated at 500 oC and 2.5 GPa, the distribution of gold was not as homogeneous as for the other samples. Unlike HA-Ag composites, transgranular fractures within HA grains were not observed, indicating that the fracture mode of HA+Au composites was dominated by an intergranular pullout mode. Fig. 66 shows XRD patterns of the HA+50vol% Au composites. HA and Au are the added phases of the composites. There is no evidence for the decomposition of the HA phase or any reaction between HA and gold during the consolidification process. Hence no other phases
Fig. 63 Mechanical properties of the HA+50vol% Ag composites consolidified at 2.5 GPa and different temperatures: (a) microhardness and (b) flexural force.
Fig. 64 Mechanical properties of the HA+50vol% Ag composites consolidified at 700 oC and different pressures: (a) microhardness and (b) flexural force.
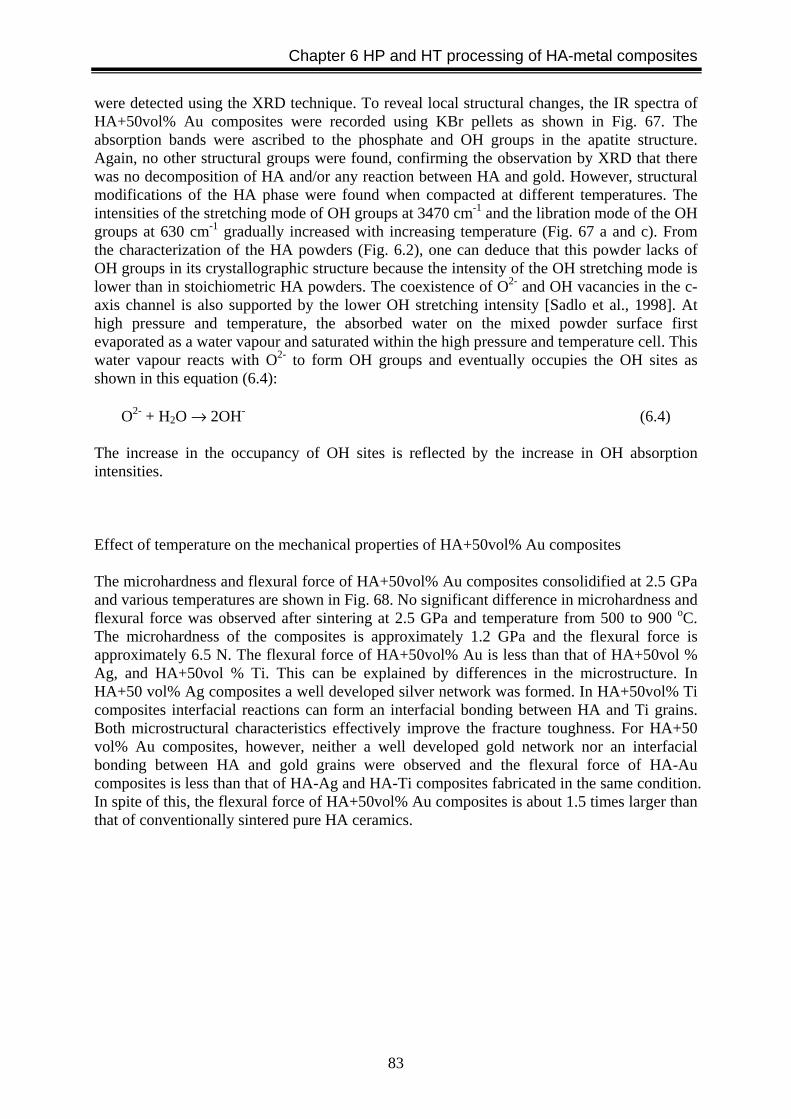
Chapter 6 HP and HT processing of HA-metal composites
83
were detected using the XRD technique. To reveal local structural changes, the IR spectra of HA+50vol% Au composites were recorded using KBr pellets as shown in Fig. 67. The absorption bands were ascribed to the phosphate and OH groups in the apatite structure. Again, no other structural groups were found, confirming the observation by XRD that there was no decomposition of HA and/or any reaction between HA and gold. However, structural modifications of the HA phase were found when compacted at different temperatures. The intensities of the stretching mode of OH groups at 3470 cm-1 and the libration mode of the OH groups at 630 cm-1 gradually increased with increasing temperature (Fig. 67 a and c). From the characterization of the HA powders (Fig. 6.2), one can deduce that this powder lacks of OH groups in its crystallographic structure because the intensity of the OH stretching mode is lower than in stoichiometric HA powders. The coexistence of O2- and OH vacancies in the c-axis channel is also supported by the lower OH stretching intensity [Sadlo et al., 1998]. At high pressure and temperature, the absorbed water on the mixed powder surface first evaporated as a water vapour and saturated within the high pressure and temperature cell. This water vapour reacts with O2- to form OH groups and eventually occupies the OH sites as shown in this equation (6.4):
O2- + H2O → 2OH- (6.4) The increase in the occupancy of OH sites is reflected by the increase in OH absorption intensities. Effect of temperature on the mechanical properties of HA+50vol% Au composites The microhardness and flexural force of HA+50vol% Au composites consolidified at 2.5 GPa and various temperatures are shown in Fig. 68. No significant difference in microhardness and flexural force was observed after sintering at 2.5 GPa and temperature from 500 to 900 oC. The microhardness of the composites is approximately 1.2 GPa and the flexural force is approximately 6.5 N. The flexural force of HA+50vol% Au is less than that of HA+50vol % Ag, and HA+50vol % Ti. This can be explained by differences in the microstructure. In HA+50 vol% Ag composites a well developed silver network was formed. In HA+50vol% Ti composites interfacial reactions can form an interfacial bonding between HA and Ti grains. Both microstructural characteristics effectively improve the fracture toughness. For HA+50 vol% Au composites, however, neither a well developed gold network nor an interfacial bonding between HA and gold grains were observed and the flexural force of HA-Au composites is less than that of HA-Ag and HA-Ti composites fabricated in the same condition. In spite of this, the flexural force of HA+50vol% Au composites is about 1.5 times larger than that of conventionally sintered pure HA ceramics.
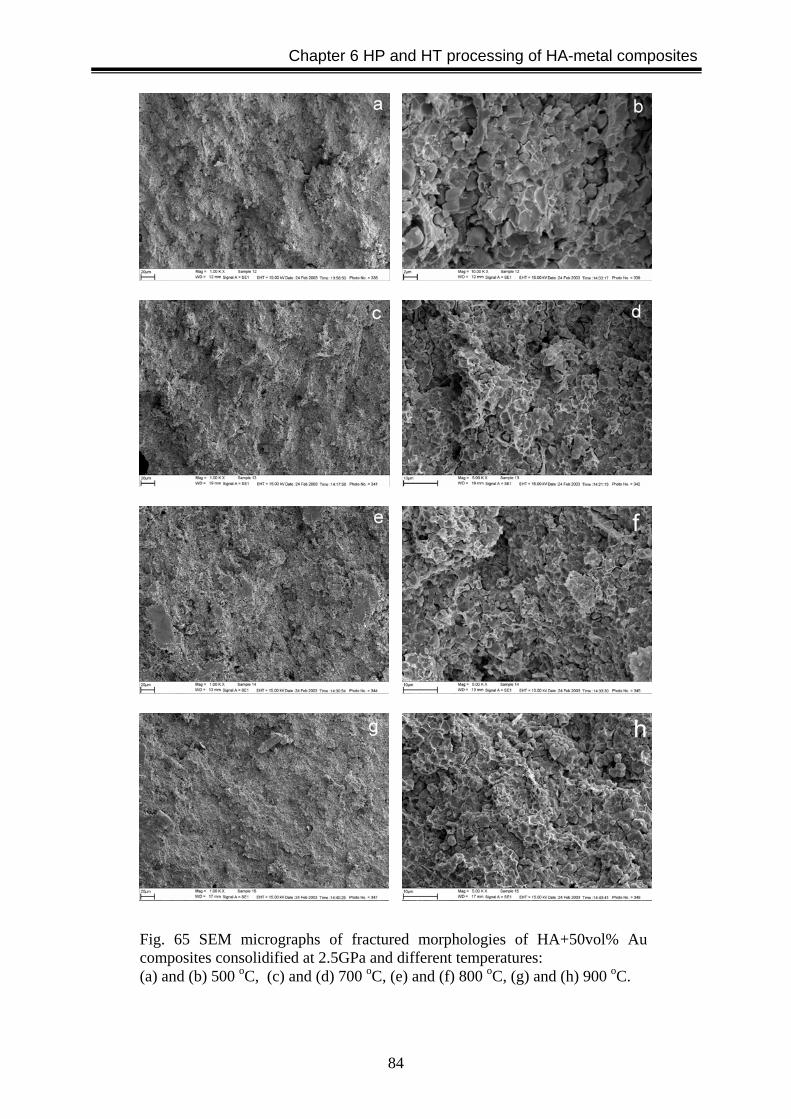
Chapter 6 HP and HT processing of HA-metal composites
84
Fig. 65 SEM micrographs of fractured morphologies of HA+50vol% Au composites consolidified at 2.5GPa and different temperatures: (a) and (b) 500 oC, (c) and (d) 700 oC, (e) and (f) 800 oC, (g) and (h) 900 oC.

Chapter 6 HP and HT processing of HA-metal composites
85
Fig. 66 XRD patterns of the HA+50vol% Au composites consolidified at 2.5 GPa and various temperatures. There is no decomposition of the HA phase.
Fig. 67 Normalised IR spectra of the HA+50vol% Au composites consolidified at 2.5 GPa and various temperatures: (a) spectra in the range of 3000-4000 cm-1, (b) spectra in the range of 800-1800 cm-1, and (c) spectra in the range of 400-800 cm-1 showing the OH libration at 631 cm-1 and the υ4 vibrational modes of phosphate groups.
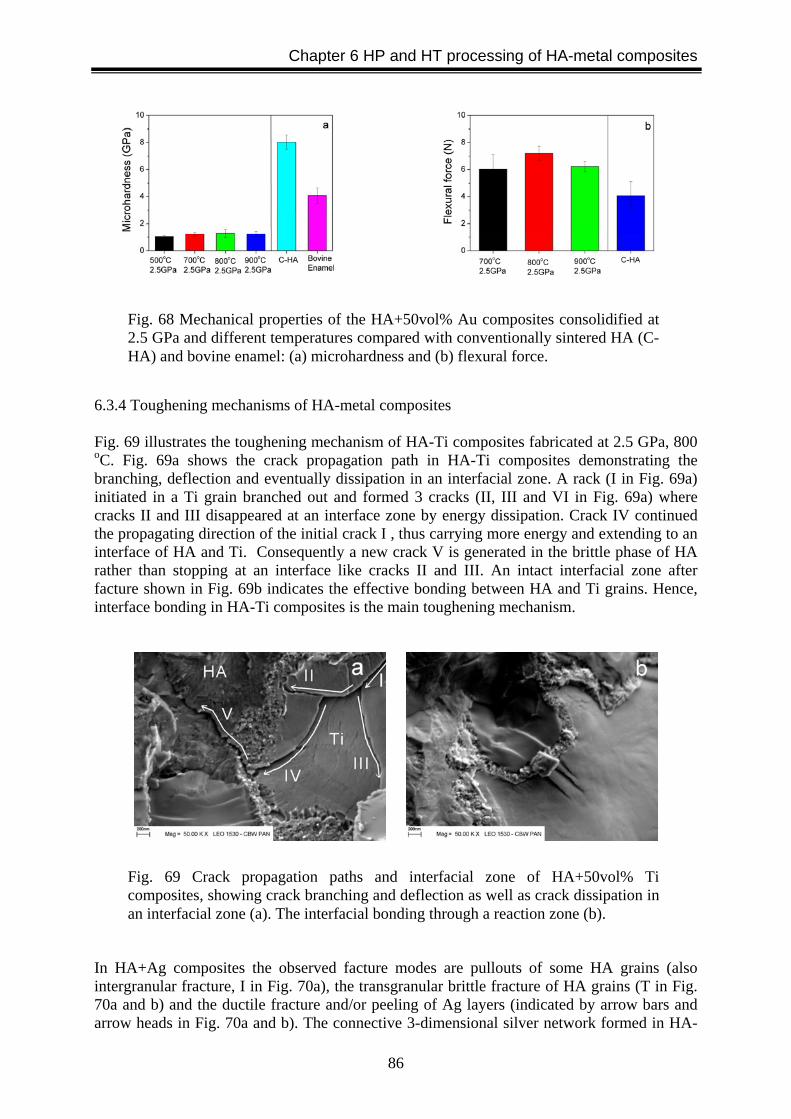
Chapter 6 HP and HT processing of HA-metal composites
86
6.3.4 Toughening mechanisms of HA-metal composites Fig. 69 illustrates the toughening mechanism of HA-Ti composites fabricated at 2.5 GPa, 800 oC. Fig. 69a shows the crack propagation path in HA-Ti composites demonstrating the branching, deflection and eventually dissipation in an interfacial zone. A rack (I in Fig. 69a) initiated in a Ti grain branched out and formed 3 cracks (II, III and VI in Fig. 69a) where cracks II and III disappeared at an interface zone by energy dissipation. Crack IV continued the propagating direction of the initial crack I , thus carrying more energy and extending to an interface of HA and Ti. Consequently a new crack V is generated in the brittle phase of HA rather than stopping at an interface like cracks II and III. An intact interfacial zone after facture shown in Fig. 69b indicates the effective bonding between HA and Ti grains. Hence, interface bonding in HA-Ti composites is the main toughening mechanism.
In HA+Ag composites the observed facture modes are pullouts of some HA grains (also intergranular fracture, I in Fig. 70a), the transgranular brittle fracture of HA grains (T in Fig. 70a and b) and the ductile fracture and/or peeling of Ag layers (indicated by arrow bars and arrow heads in Fig. 70a and b). The connective 3-dimensional silver network formed in HA-
Fig. 68 Mechanical properties of the HA+50vol% Au composites consolidified at 2.5 GPa and different temperatures compared with conventionally sintered HA (C-HA) and bovine enamel: (a) microhardness and (b) flexural force.
Fig. 69 Crack propagation paths and interfacial zone of HA+50vol% Ti composites, showing crack branching and deflection as well as crack dissipation in an interfacial zone (a). The interfacial bonding through a reaction zone (b).

Chapter 6 HP and HT processing of HA-metal composites
87
Ag composites is similar to the inter-rod network of dental enamel. The toughening effect in HA-Ag composites is the result of the formation of the silver network surrounding HA grains. Fig. 71 shows the toughening mechanism in HA-Au composites. No interfacial bonding was observed in HA-Au composites. The penetrating layer of gold is much thicker than in the other metal-HA composites, which indicates that the gold network is not as homogeneous as that in other composites. The toughening mechanism of gold is limited by the pullout of HA grains. Increasing fabrication temperature might improve the distribution of gold and enhance toughening effects, but it might also lead to decomposition of HA.
Fig. 71 Fracture Mechanism and interfacial structure of HA+50vol% Au composites fabricated at 2.5 GPa, 500 oC: (a) fracture mechanism and (b) interface between HA and Au.
Fig. 70 Fracture modes in HA-Ag composites. The pullout of HA grains (I), the transgranular brittle fracture of HA grains (T), ductile fractures and peeling of HA layer (arrow bars and arrow heads) are shown. Penetration of an Ag layer between HA grains (b).
Chapter 6 HP and HT processing of HA-metal composites
88
6.4 Conclusions The effect of consolidation pressures and temperatures on the microstructure and mechanical properties of HA-based composites reinforced with 50vol% Ti, Ag, and Au particles was studied. Main conclusions from the experimental results and analyses can be summarized as follows: (1) The processing parameters studied, i.e. pressures from 2.5 to 6.0 GPa and temperatures
from 700 to 900 oC, do not significantly influence the microstructure and mechanical properties of the HA-metal composites. Processing parameters of 2.5 GPa and 800 oC were chosen for further experiments.
(2) No interfacial interaction zone has been observed in HA-Ag and HA-Au composites,
while an interfacial zone occurs at the HA-Ti interface. The reaction layer is composed of Ca, Ti, and P.
(3) A metallic network within HA-Ag and HA-Au composites is formed when compaction
temperatures above 700 oC. A well developed silver network in the HA-Ag composites makes the microstructure similar to the inter-rod network of dental enamel.
(4) The flexural force of HA-metal composites with a volume ratio of 1:1 is improved
compared to the flexural force of conventionally sintered pure HA ceramics. The highest value of fracture force is achieved in HA-Ag composites which show an improvement by a factor of 4-5. This higher flexural force of the HA-Ag composites is ascribed to their unique microstructure.
(5) XRD and IR analyses do not reveal possible decomposition of the HA phase into other
non-apatitic phases. The reaction at the HA-Ti interface is rather limited and no reaction products can be detected. The structural stability of HA in HA-metal composites in this study is attributed to the short treatment time and relatively lower temperature during consolidification at high pressure.
(6) The operating toughening mechanisms in the HA-metal composites are crack deflection,
crack branching, pullouts of HA grains, plastic stretching or peeling of metal layer and interfacial bonding. The contributions of interfacial bonding, and crack deflection and branching are evident in HA-Ti composites while the pullout of HA grains and the stretching of the metal layers are of important in HA-Ag composites.

Chapter 7 Biocompatibility of HA-metal composites consolidified at HP and HT
89
Chapter 7
Biocompatibility of HA-metal composites consolidified at high pressure and temperature
7.1 Introduction In chapter 6 it was reported that HA-Ti and HA-Ag composites fabricated at high pressure and temperature show substantially improved fracture resistance compared with conventionally sintered HA ceramics. Moreover, the degradation of the structural stability of the HA phase was not seen using XRD and IR techniques, unlike conventionally sintered HA-metal composites in which the decomposition of the HA phase was substantial (Ning and Zhu 2002, Chu et al. 2002). As also described in chapter 6, the mechanical properties of HA-metal composites did not significantly depend on temperatures between 700-900 oC and on pressure between 2.5 - 6.0 GPa. The results of HA-metal composites demonstrated that the consolidification at high pressure and temperature is a suitable process to prepare new HA-metal biomaterials. Prerequirements of potential biomaterials for clinical use are biocompatibility and mechanical integrity to maintain skeletal functions [Oreffo and Triffitt 1999]. Osteoblast cell cultures in vitro enable an evaluation of the cytotoxity or biocompatibility of biomaterials and have improved the assessment of such materials for in vivo use. In general, the biocompatibility and mechanical properties of biocomposites largely depend on their composition, but are influenced by their processing as well. In this chapter, therefore, we report on the effect of the composition, i. e. the metal content in HA-metal composites fabricated at 800 oC and 2.5 GPa on the mechanical properties and biocompatibility of HA-metal composites.
7.2 Materials and methods 7.2.1 Raw materials Powder characteristics such as morphology, particle size, and crystal structure and the supplier of HA, Ti and Ag powders, see chapter 6. 7.2.2 Fabrication of HA-metal composites HA – metal powders containing either Ti or Ag of 10 vol%, 20 vol%, 25 vol%, 40 vol% and 50 vol%, respectively, were thoroughly mixed in a ball milling system. The mixed powders were consolidified at 800 oC and 2.5 GPa according to the steps described in Chapter 3. 7.2.3 Characterization of microstructure and measurement of mechanical properties The microstructure of the HA-metal composites with different metal content was evaluated by SEM, XRD and IR microspectroscopy in reflection mode. Microhardness was measured using a Vickers indentation tester with a load of 100g and a dwell time of 15s. The flexural force of the composites was examined using a miniaturized 3-point bending jig attached to a Zwicki Z2.5 universal testing machine (Zwicki Z2.5, Ulm, Germany). The bending strength was calculated from the recorded force and the specimen size of 4 mm ×1.2 mm × 0.5mm. At least
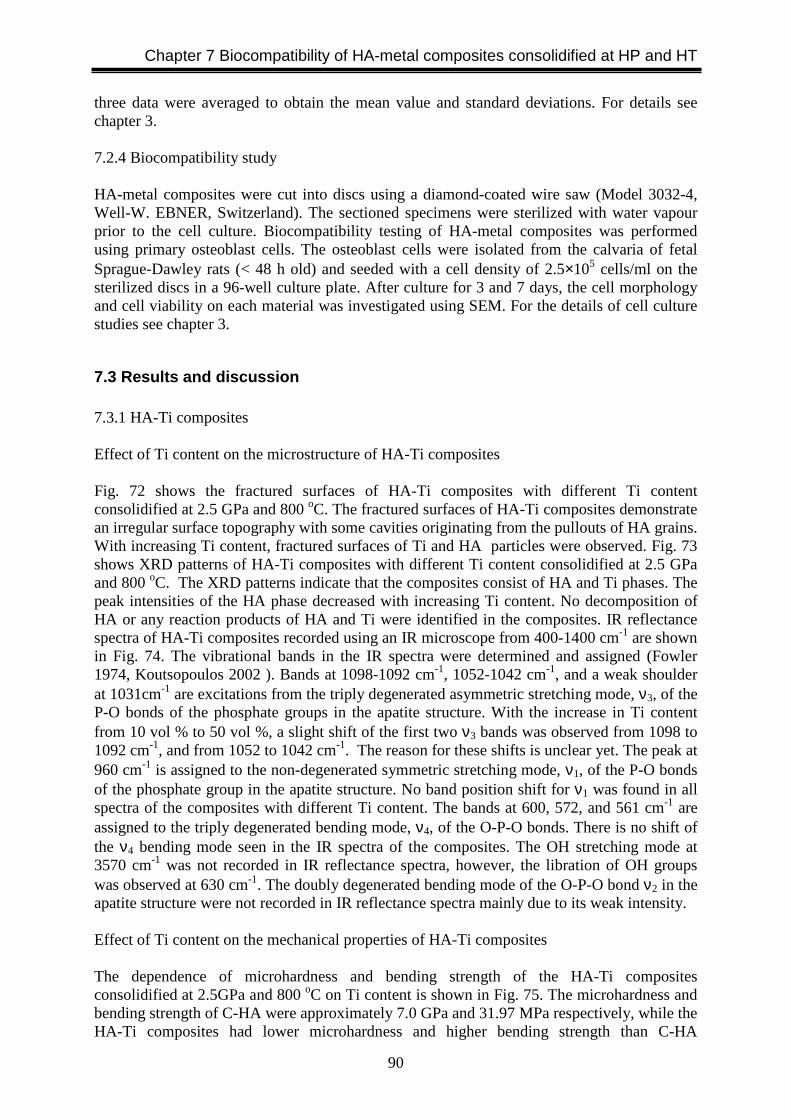
Chapter 7 Biocompatibility of HA-metal composites consolidified at HP and HT
90
three data were averaged to obtain the mean value and standard deviations. For details see chapter 3. 7.2.4 Biocompatibility study HA-metal composites were cut into discs using a diamond-coated wire saw (Model 3032-4, Well-W. EBNER, Switzerland). The sectioned specimens were sterilized with water vapour prior to the cell culture. Biocompatibility testing of HA-metal composites was performed using primary osteoblast cells. The osteoblast cells were isolated from the calvaria of fetal Sprague-Dawley rats (< 48 h old) and seeded with a cell density of 2.5×10⁵ cells/ml on the sterilized discs in a 96-well culture plate. After culture for 3 and 7 days, the cell morphology and cell viability on each material was investigated using SEM. For the details of cell culture studies see chapter 3.
7.3 Results and discussion 7.3.1 HA-Ti composites Effect of Ti content on the microstructure of HA-Ti composites Fig. 72 shows the fractured surfaces of HA-Ti composites with different Ti content consolidified at 2.5 GPa and 800 oC. The fractured surfaces of HA-Ti composites demonstrate an irregular surface topography with some cavities originating from the pullouts of HA grains. With increasing Ti content, fractured surfaces of Ti and HA particles were observed. Fig. 73 shows XRD patterns of HA-Ti composites with different Ti content consolidified at 2.5 GPa and 800 oC. The XRD patterns indicate that the composites consist of HA and Ti phases. The peak intensities of the HA phase decreased with increasing Ti content. No decomposition of HA or any reaction products of HA and Ti were identified in the composites. IR reflectance spectra of HA-Ti composites recorded using an IR microscope from 400-1400 cm-1 are shown in Fig. 74. The vibrational bands in the IR spectra were determined and assigned (Fowler 1974, Koutsopoulos 2002 ). Bands at 1098-1092 cm-1, 1052-1042 cm-1, and a weak shoulder at 1031cm-1 are excitations from the triply degenerated asymmetric stretching mode, ν3, of the P-O bonds of the phosphate groups in the apatite structure. With the increase in Ti content from 10 vol % to 50 vol %, a slight shift of the first two ν3 bands was observed from 1098 to 1092 cm-1, and from 1052 to 1042 cm-1. The reason for these shifts is unclear yet. The peak at 960 cm-1 is assigned to the non-degenerated symmetric stretching mode, ν1, of the P-O bonds of the phosphate group in the apatite structure. No band position shift for ν1 was found in all spectra of the composites with different Ti content. The bands at 600, 572, and 561 cm-1 are assigned to the triply degenerated bending mode, ν4, of the O-P-O bonds. There is no shift of the ν4 bending mode seen in the IR spectra of the composites. The OH stretching mode at 3570 cm-1 was not recorded in IR reflectance spectra, however, the libration of OH groups was observed at 630 cm-1. The doubly degenerated bending mode of the O-P-O bond ν2 in the apatite structure were not recorded in IR reflectance spectra mainly due to its weak intensity. Effect of Ti content on the mechanical properties of HA-Ti composites The dependence of microhardness and bending strength of the HA-Ti composites consolidified at 2.5GPa and 800 oC on Ti content is shown in Fig. 75. The microhardness and bending strength of C-HA were approximately 7.0 GPa and 31.97 MPa respectively, while the HA-Ti composites had lower microhardness and higher bending strength than C-HA
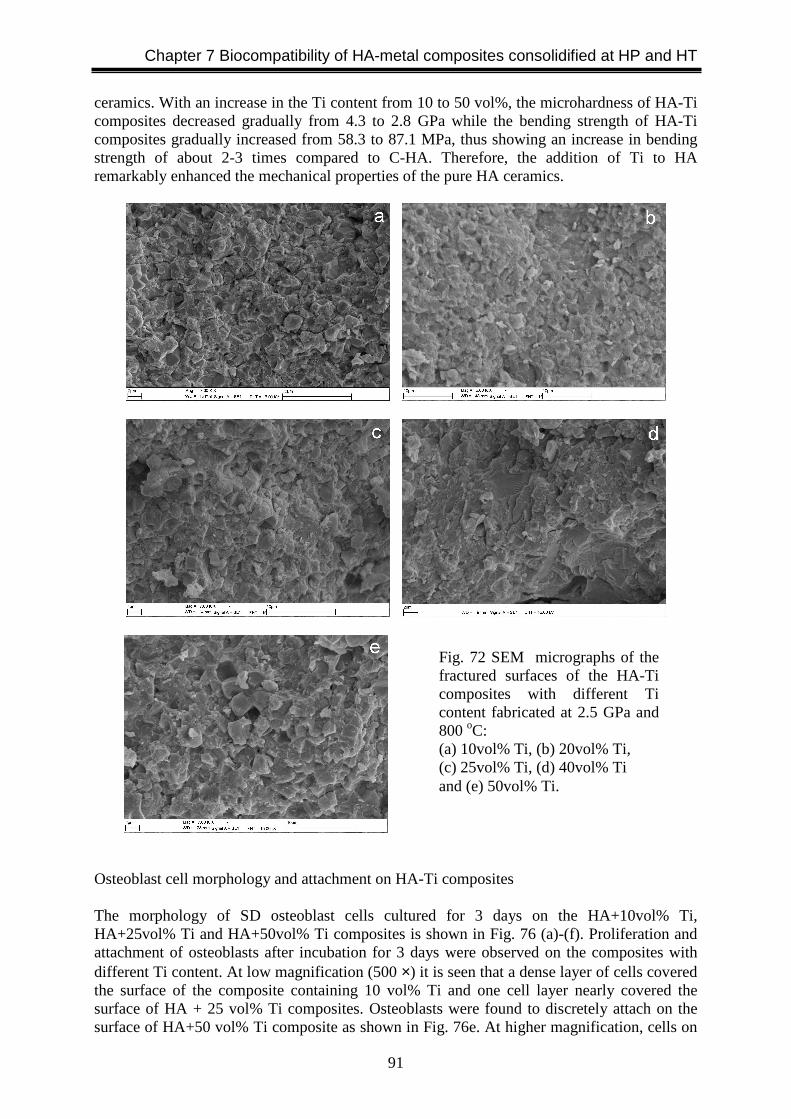
Chapter 7 Biocompatibility of HA-metal composites consolidified at HP and HT
91
ceramics. With an increase in the Ti content from 10 to 50 vol%, the microhardness of HA-Ti composites decreased gradually from 4.3 to 2.8 GPa while the bending strength of HA-Ti composites gradually increased from 58.3 to 87.1 MPa, thus showing an increase in bending strength of about 2-3 times compared to C-HA. Therefore, the addition of Ti to HA remarkably enhanced the mechanical properties of the pure HA ceramics.
Osteoblast cell morphology and attachment on HA-Ti composites The morphology of SD osteoblast cells cultured for 3 days on the HA+10vol% Ti, HA+25vol% Ti and HA+50vol% Ti composites is shown in Fig. 76 (a)-(f). Proliferation and attachment of osteoblasts after incubation for 3 days were observed on the composites with different Ti content. At low magnification (500 ×) it is seen that a dense layer of cells covered the surface of the composite containing 10 vol% Ti and one cell layer nearly covered the surface of HA + 25 vol% Ti composites. Osteoblasts were found to discretely attach on the surface of HA+50 vol% Ti composite as shown in Fig. 76e. At higher magnification, cells on
Fig. 72 SEM micrographs of the fractured surfaces of the HA-Ti composites with different Ti content fabricated at 2.5 GPa and 800 oC: (a) 10vol% Ti, (b) 20vol% Ti, (c) 25vol% Ti, (d) 40vol% Ti and (e) 50vol% Ti.
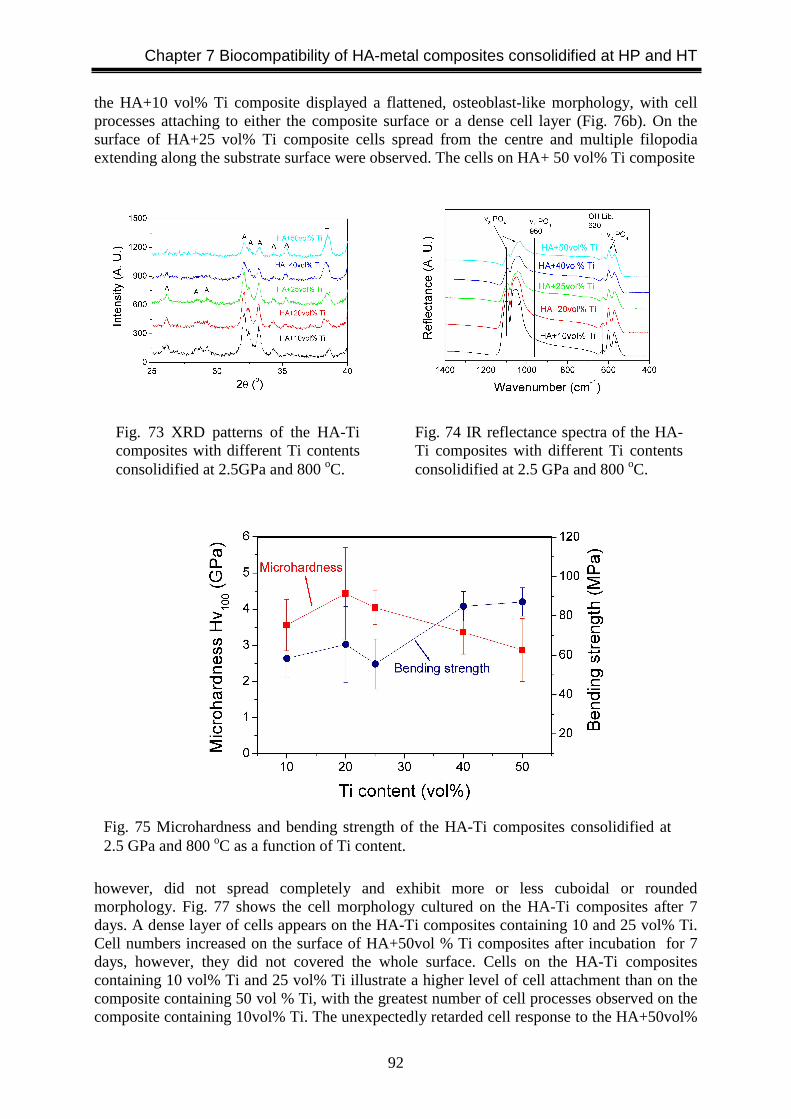
Chapter 7 Biocompatibility of HA-metal composites consolidified at HP and HT
92
the HA+10 vol% Ti composite displayed a flattened, osteoblast-like morphology, with cell processes attaching to either the composite surface or a dense cell layer (Fig. 76b). On the surface of HA+25 vol% Ti composite cells spread from the centre and multiple filopodia extending along the substrate surface were observed. The cells on HA+ 50 vol% Ti composite
however, did not spread completely and exhibit more or less cuboidal or rounded morphology. Fig. 77 shows the cell morphology cultured on the HA-Ti composites after 7 days. A dense layer of cells appears on the HA-Ti composites containing 10 and 25 vol% Ti. Cell numbers increased on the surface of HA+50vol % Ti composites after incubation for 7 days, however, they did not covered the whole surface. Cells on the HA-Ti composites containing 10 vol% Ti and 25 vol% Ti illustrate a higher level of cell attachment than on the composite containing 50 vol % Ti, with the greatest number of cell processes observed on the composite containing 10vol% Ti. The unexpectedly retarded cell response to the HA+50vol%
Fig. 73 XRD patterns of the HA-Ti composites with different Ti contents consolidified at 2.5GPa and 800 oC.
Fig. 74 IR reflectance spectra of the HA-Ti composites with different Ti contents consolidified at 2.5 GPa and 800 oC.
Fig. 75 Microhardness and bending strength of the HA-Ti composites consolidified at 2.5 GPa and 800 oC as a function of Ti content.
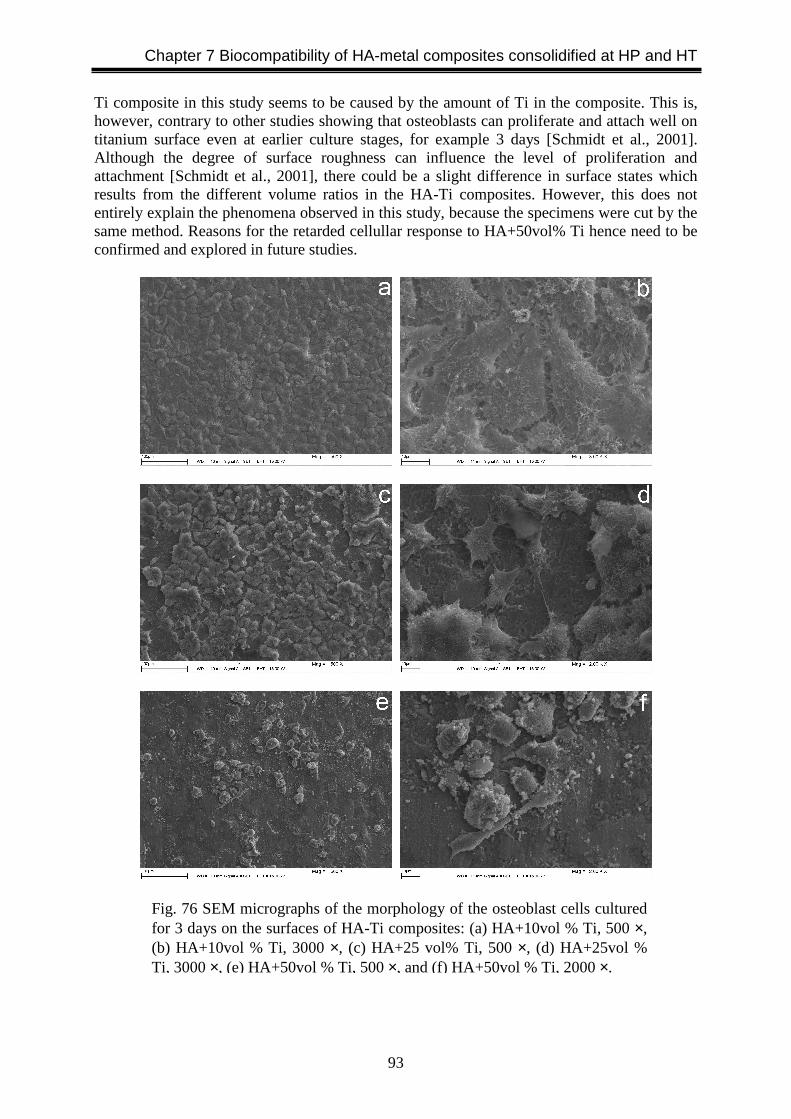
Chapter 7 Biocompatibility of HA-metal composites consolidified at HP and HT
93
Ti composite in this study seems to be caused by the amount of Ti in the composite. This is, however, contrary to other studies showing that osteoblasts can proliferate and attach well on titanium surface even at earlier culture stages, for example 3 days [Schmidt et al., 2001]. Although the degree of surface roughness can influence the level of proliferation and attachment [Schmidt et al., 2001], there could be a slight difference in surface states which results from the different volume ratios in the HA-Ti composites. However, this does not entirely explain the phenomena observed in this study, because the specimens were cut by the same method. Reasons for the retarded cellullar response to HA+50vol% Ti hence need to be confirmed and explored in future studies.
Fig. 76 SEM micrographs of the morphology of the osteoblast cells cultured for 3 days on the surfaces of HA-Ti composites: (a) HA+10vol % Ti, 500 ×, (b) HA+10vol % Ti, 3000 ×, (c) HA+25 vol% Ti, 500 ×, (d) HA+25vol % Ti, 3000 ×, (e) HA+50vol % Ti, 500 ×, and (f) HA+50vol % Ti, 2000 ×.
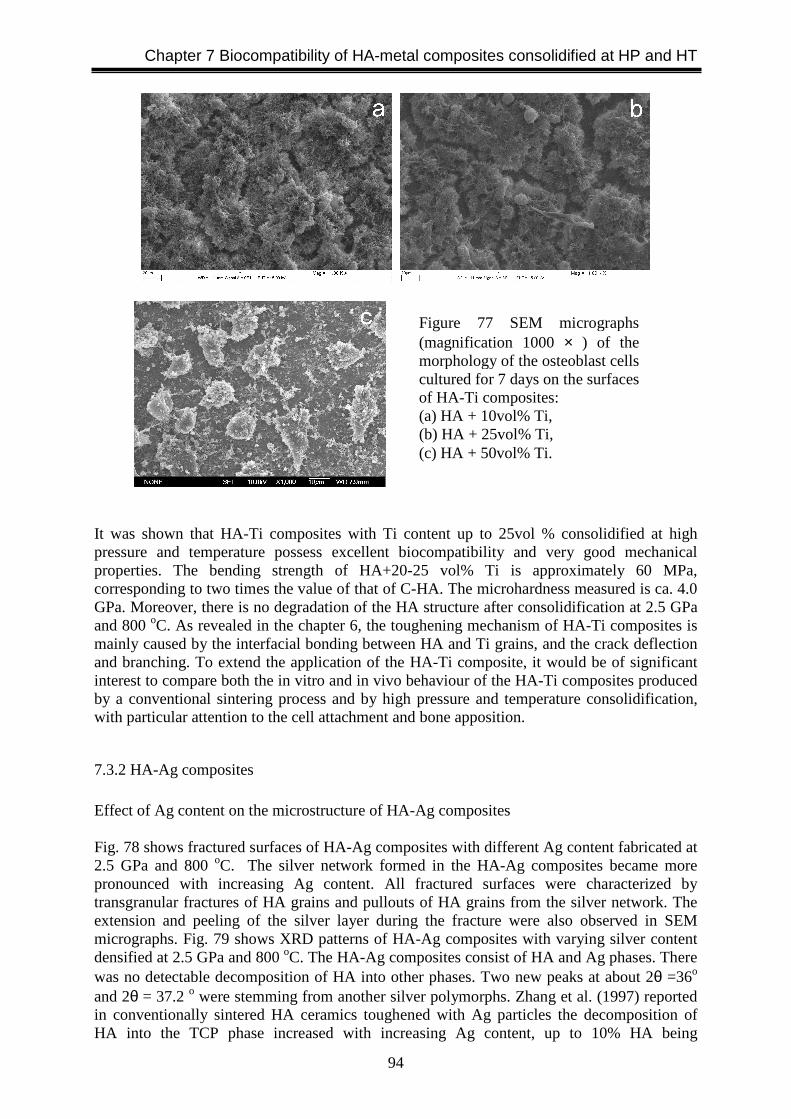
Chapter 7 Biocompatibility of HA-metal composites consolidified at HP and HT
94
It was shown that HA-Ti composites with Ti content up to 25vol % consolidified at high pressure and temperature possess excellent biocompatibility and very good mechanical properties. The bending strength of HA+20-25 vol% Ti is approximately 60 MPa, corresponding to two times the value of that of C-HA. The microhardness measured is ca. 4.0 GPa. Moreover, there is no degradation of the HA structure after consolidification at 2.5 GPa and 800 oC. As revealed in the chapter 6, the toughening mechanism of HA-Ti composites is mainly caused by the interfacial bonding between HA and Ti grains, and the crack deflection and branching. To extend the application of the HA-Ti composite, it would be of significant interest to compare both the in vitro and in vivo behaviour of the HA-Ti composites produced by a conventional sintering process and by high pressure and temperature consolidification, with particular attention to the cell attachment and bone apposition.
7.3.2 HA-Ag composites Effect of Ag content on the microstructure of HA-Ag composites Fig. 78 shows fractured surfaces of HA-Ag composites with different Ag content fabricated at 2.5 GPa and 800 oC. The silver network formed in the HA-Ag composites became more pronounced with increasing Ag content. All fractured surfaces were characterized by transgranular fractures of HA grains and pullouts of HA grains from the silver network. The extension and peeling of the silver layer during the fracture were also observed in SEM micrographs. Fig. 79 shows XRD patterns of HA-Ag composites with varying silver content densified at 2.5 GPa and 800 oC. The HA-Ag composites consist of HA and Ag phases. There was no detectable decomposition of HA into other phases. Two new peaks at about 2θ =36o and 2θ = 37.2 o were stemming from another silver polymorphs. Zhang et al. (1997) reported in conventionally sintered HA ceramics toughened with Ag particles the decomposition of HA into the TCP phase increased with increasing Ag content, up to 10% HA being
Figure 77 SEM micrographs (magnification 1000 × ) of the morphology of the osteoblast cells cultured for 7 days on the surfaces of HA-Ti composites: (a) HA + 10vol% Ti, (b) HA + 25vol% Ti, (c) HA + 50vol% Ti.
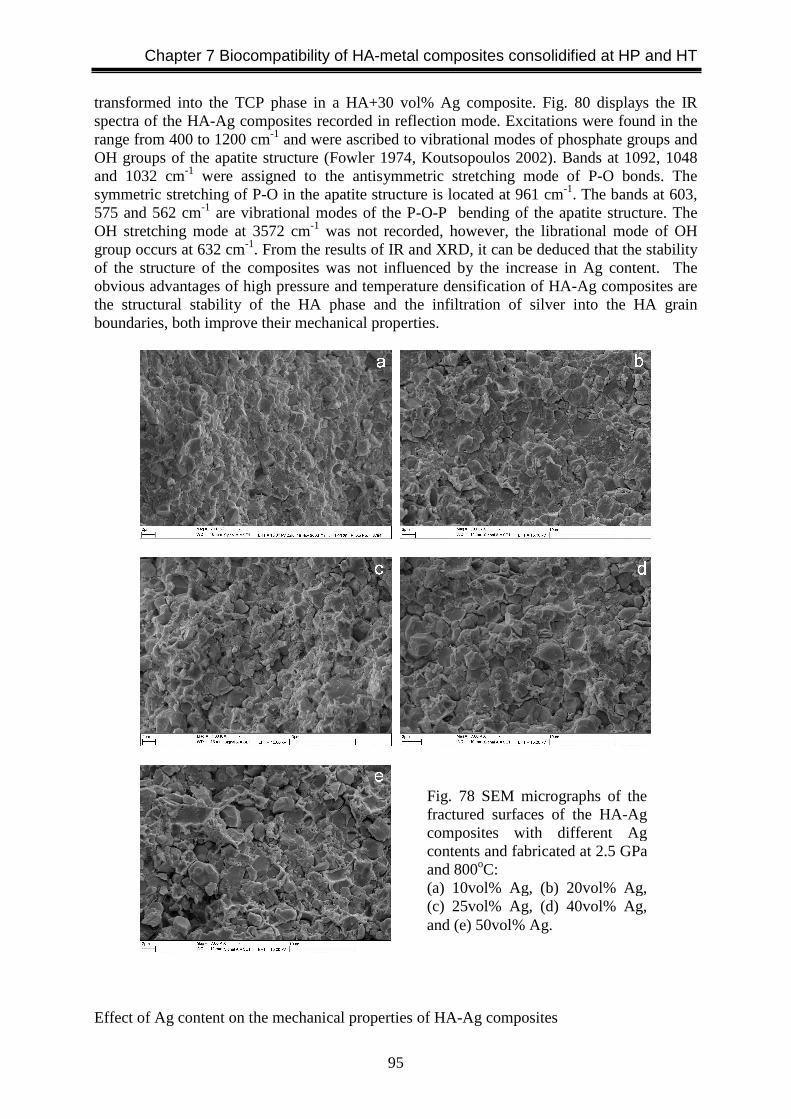
Chapter 7 Biocompatibility of HA-metal composites consolidified at HP and HT
95
transformed into the TCP phase in a HA+30 vol% Ag composite. Fig. 80 displays the IR spectra of the HA-Ag composites recorded in reflection mode. Excitations were found in the range from 400 to 1200 cm-1 and were ascribed to vibrational modes of phosphate groups and OH groups of the apatite structure (Fowler 1974, Koutsopoulos 2002). Bands at 1092, 1048 and 1032 cm-1 were assigned to the antisymmetric stretching mode of P-O bonds. The symmetric stretching of P-O in the apatite structure is located at 961 cm-1. The bands at 603, 575 and 562 cm-1 are vibrational modes of the P-O-P bending of the apatite structure. The OH stretching mode at 3572 cm-1 was not recorded, however, the librational mode of OH group occurs at 632 cm-1. From the results of IR and XRD, it can be deduced that the stability of the structure of the composites was not influenced by the increase in Ag content. The obvious advantages of high pressure and temperature densification of HA-Ag composites are the structural stability of the HA phase and the infiltration of silver into the HA grain boundaries, both improve their mechanical properties.
Effect of Ag content on the mechanical properties of HA-Ag composites
Fig. 78 SEM micrographs of the fractured surfaces of the HA-Ag composites with different Ag contents and fabricated at 2.5 GPa and 800oC: (a) 10vol% Ag, (b) 20vol% Ag, (c) 25vol% Ag, (d) 40vol% Ag, and (e) 50vol% Ag.

Chapter 7 Biocompatibility of HA-metal composites consolidified at HP and HT
96
The microhardness and bending strength of HA-Ag composites with different Ag content and consolidified at 2.5 GPa and 800 oC are shown in Fig. 81. The microhardness and bending strength of C-HA, of about 7.0 GPa and 32 MPa, respectively. The microhardness of HA-Ag composites decrease with increasing Ag content, from 3.88 GPa for HA+10vol% Ag composites to 1.06 GPa for composites containing 50 vol% Ag, while the bending strength increase with increasing Ag content, to 100 MPa for the composite containing 50 vol% Ag. The higher bending strength of HA-Ag composites compared to the corresponding HA-Ti composites can be explained by their microstructure. Inspection of the microstructures (depicted in Fig. 78 and Fig. 72) reveals that the silver network is well developed with increasing metal content, and the presence of cavities originating from pull-out of HA grains which shows the bonding between Ag and HA matrix is weaker than that in HA-Ti composites. The silver network in HA-Ag composites seems to contribute more effectively to the toughening of HA ceramics than the interfacial bonding in HA-Ti composites when consolidified at high pressure and temperature, such as 2.5 GPa and 800 oC.
Fig. 79 XRD patterns of the HA-Ag composites with different silver contents consolidified at 2.5 GPa and 800 oC.
Fig. 80 IR reflectance spectra of the HA-Ag composites with different Ag content consolidified at 2.5 GPa and 800 oC.
Fig. 81 Microhardness and bending strength of the HA-Ag composites consolidified at 2.5 GPa and 800 oC as a function of Ag content.
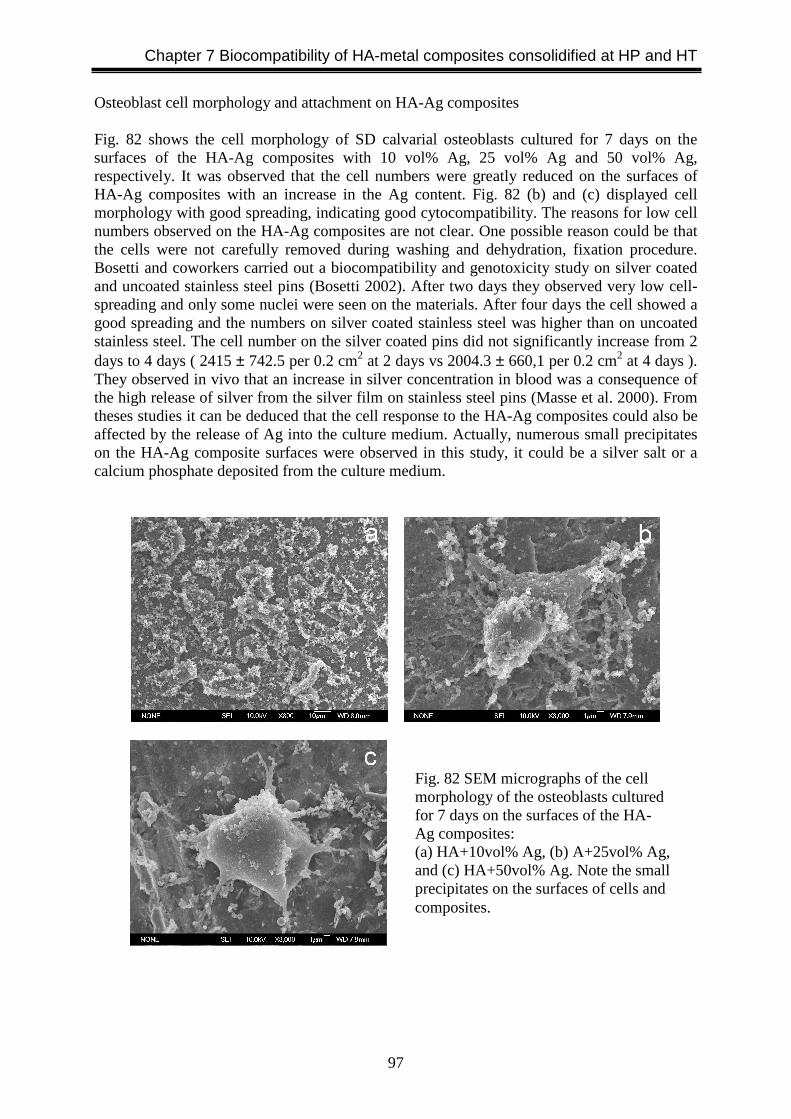
Chapter 7 Biocompatibility of HA-metal composites consolidified at HP and HT
97
Osteoblast cell morphology and attachment on HA-Ag composites Fig. 82 shows the cell morphology of SD calvarial osteoblasts cultured for 7 days on the surfaces of the HA-Ag composites with 10 vol% Ag, 25 vol% Ag and 50 vol% Ag, respectively. It was observed that the cell numbers were greatly reduced on the surfaces of HA-Ag composites with an increase in the Ag content. Fig. 82 (b) and (c) displayed cell morphology with good spreading, indicating good cytocompatibility. The reasons for low cell numbers observed on the HA-Ag composites are not clear. One possible reason could be that the cells were not carefully removed during washing and dehydration, fixation procedure. Bosetti and coworkers carried out a biocompatibility and genotoxicity study on silver coated and uncoated stainless steel pins (Bosetti 2002). After two days they observed very low cell-spreading and only some nuclei were seen on the materials. After four days the cell showed a good spreading and the numbers on silver coated stainless steel was higher than on uncoated stainless steel. The cell number on the silver coated pins did not significantly increase from 2 days to 4 days ( 2415 ± 742.5 per 0.2 cm2 at 2 days vs 2004.3 ± 660,1 per 0.2 cm2 at 4 days ). They observed in vivo that an increase in silver concentration in blood was a consequence of the high release of silver from the silver film on stainless steel pins (Masse et al. 2000). From theses studies it can be deduced that the cell response to the HA-Ag composites could also be affected by the release of Ag into the culture medium. Actually, numerous small precipitates on the HA-Ag composite surfaces were observed in this study, it could be a silver salt or a calcium phosphate deposited from the culture medium.
Fig. 82 SEM micrographs of the cell morphology of the osteoblasts cultured for 7 days on the surfaces of the HA-Ag composites: (a) HA+10vol% Ag, (b) A+25vol% Ag, and (c) HA+50vol% Ag. Note the small precipitates on the surfaces of cells and composites.

Chapter 7 Biocompatibility of HA-metal composites consolidified at HP and HT
98
7.4 Conclusions HA-Ti and HA-Ag composites with different Ti or Ag content were fabricated at 2.5 GPa and 800 oC. Effects of the metal content on the microstructure and mechanical properties were investigated. The biocompatibility of HA-Ti and HA-Ag composites was also evaluated by osteoblast cell cultures. The following conclusions can be drawn:
(1) The mechanical properties of HA-Ti and HA-Ag composites depend on the metal content. For HA-Ti composites with Ti content from 10 vol% to 50 vol%, the microhardness decreased from 4.3 to 2.8 GPa while the bending strength increased from 58.3 to 87.1 MPa. For HA-Ag composites with Ag content from 10 vol % to 50 vol%, the microhardness decreased from 3.88 to 1.06 GPa while the bending strength increased to approximately 100 MPa.
(2) The toughening mechanism in HA-Ti composites fabricated at high pressure and
temperature is assumed to result from the presence of the interfacial zone between HA and Ti. The operating toughening mechanism in HA-Ag composites consolidified at high pressure and temperature is mainly attributed to the silver network formed within the HA-Ag composites. The silver network which formed in HA-Ag composites more effectively toughens the HA ceramics than the interfacial bonding in HA-Ti composites.
(3) HA-Ti and HA-Ag composites consolidified at 2.5 GPa and 800 oC demonstrated
good biocompatibility. The increase in metal content in HA-composites was led to influences the response of the osteoblast cells.
(4) From both, the mechanical and biocompatible aspects up to 25 vol % metal
component can be incorporated in HA-metal composites in order to achieve improved mechanical properties and good biocompatibility.
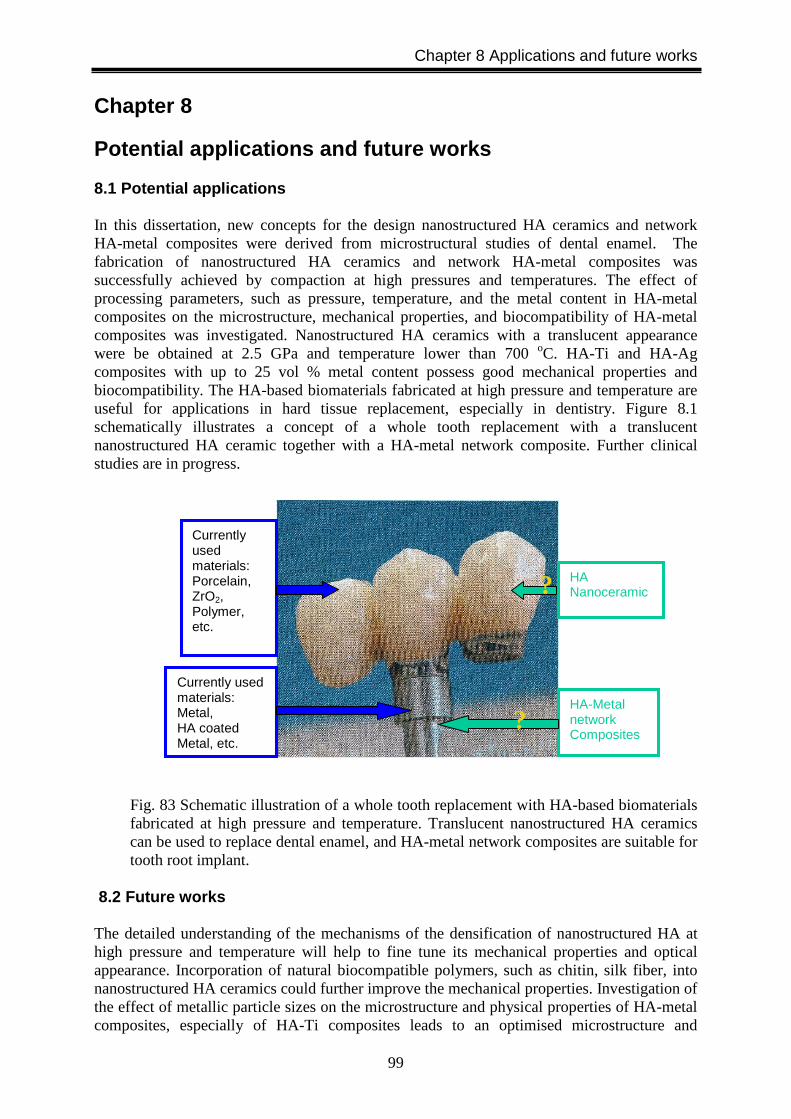
Chapter 8 Applications and future works
99
Chapter 8
Potential applications and future works 8.1 Potential applications In this dissertation, new concepts for the design nanostructured HA ceramics and network HA-metal composites were derived from microstructural studies of dental enamel. The fabrication of nanostructured HA ceramics and network HA-metal composites was successfully achieved by compaction at high pressures and temperatures. The effect of processing parameters, such as pressure, temperature, and the metal content in HA-metal composites on the microstructure, mechanical properties, and biocompatibility of HA-metal composites was investigated. Nanostructured HA ceramics with a translucent appearance were be obtained at 2.5 GPa and temperature lower than 700 oC. HA-Ti and HA-Ag composites with up to 25 vol % metal content possess good mechanical properties and biocompatibility. The HA-based biomaterials fabricated at high pressure and temperature are useful for applications in hard tissue replacement, especially in dentistry. Figure 8.1 schematically illustrates a concept of a whole tooth replacement with a translucent nanostructured HA ceramic together with a HA-metal network composite. Further clinical studies are in progress.
Fig. 83 Schematic illustration of a whole tooth replacement with HA-based biomaterials fabricated at high pressure and temperature. Translucent nanostructured HA ceramics can be used to replace dental enamel, and HA-metal network composites are suitable for tooth root implant.
8.2 Future works The detailed understanding of the mechanisms of the densification of nanostructured HA at high pressure and temperature will help to fine tune its mechanical properties and optical appearance. Incorporation of natural biocompatible polymers, such as chitin, silk fiber, into nanostructured HA ceramics could further improve the mechanical properties. Investigation of the effect of metallic particle sizes on the microstructure and physical properties of HA-metal composites, especially of HA-Ti composites leads to an optimised microstructure and
Currently used materials: Metal, HA coated Metal, etc.
Currently used materials: Porcelain, ZrO2, Polymer, etc.
HA-Metal network Composites
?
HA Nanoceramic ?

Chapter 8 Applications and future works
100
mechanical properties. The bone bonding abilities of the novel network HA-metal composites needs to be evaluated in comparison with currently classic used materials.
References
101
References Ahn S. E., Gleason N. J., Nakahira A., Ying J. Y., (2001), Nanostructure processing of
hydroxyapatite-based bioceramics, Nano Letters, 1: 149 Albee F. H., Morrison H. F., (1920), Studies of bone growth-triple calcium phosphate as a
stimulus to osteogenesis. Ann. Surg., 71: 32 Adolfsson E., Alberius-henning P. and Hermansson L., (2000), Phase analysis and thermal
stability of hot isostatically pressed zirconia-hydroxyapatite composites, J. Am. Ceram. Soc., 83: 2798
Adolfsson E., Nygren M., hermansson L., (1999), Decomposition mechanisms in alumium oxide-apatite systems, J. Am. Ceram. Soc., 82(10): 2909
Anstis G. R., Chantikul P., Lawn B. R., Marschall D. B., (1981), A critical evaluation of indentation techniques for measuring fracture toughness: I, Direct crack measurements, J. Am. Ceram. Soc., 64: 533
Aoki H., Kato K. M., and Ogiso M., (1987), Sintered hydroxyapatite for a percutaneous device and its clinical application, Med. Prog. Technol., 12(3-4): 213
Aoki H., (1991), Science and medical application of hydroxyapatite, JAAS, Tokyo Ban S., Maruno S., (1995), Effect of temperature on electrochemical deposition of calcium
phosphate coatings in a simulated body fluid, Biomaterials, 16: 977 Barralet J. E., Fleming G. J. P., Campion C., Harris J. J., Wright A. J., (2003), Formation of
translucent hydroxyapatite ceramics by sintering in carbon dioxide atmospheres, J. Mater. Sci.: Mater. Med., 38: 3979
Baumer A., Ganteaume M., and Klee W. E., (1985), Determination of OH ions in hydroxyfluorapatites by infrared spectroscopy, Bulletin de Mineralogie, 108: 145
Bauer M., Klee W. E., (1993), The monoclinic-hexagonal phase transition in chlorapatite, Eur. J. Mineral., 5: 307
Bismayer U., (2000), Hard mode spectroscopy of phase transitions. in: Ribbe P. H. (Ed), Reviews in Mineralogy and Geochemistry, The Mineralogical Society of America, Washington, DC, 39: 265
Bismayer U., Shi J., Klocke A., Gierlotka S., Palosz B., (2004), From dental enamel to synthetic hydroxyapatite-metal composites, Key Engineering Materials, in print
Bodart F., Deconninck G., Martin M. T., (1981), Large scale study of tooth enamel, IEEE Trans. Nucl. Sci., NS-28 (2): 1401
Bonfield W., (1988), Hydroxyapatite-reinforced polyethylene as an analogues material for bone replacement, in (Eds) Ducheyne P., Lemons J., Bioceramics: material characteristics versus in vivo behaviour, Annuals of New York Academy of Sciences, 523:173
Boskey A. L., Posner A. S., (1973), Conversion of amorphous calcium phosphate to microcrystalline hydroxyapatite. A pH-dependent, solution-mediated, solid-solid conversion, J. Phy. Chem., 77: 2313
Bosetti, M., Masse A., Tobin E., Cannas M., (2002), Silver coated materials for external fixation devices: in vitro biocompatibility and genotoxicity, Biomaterials, 23: 887
Brazhkin V. V., Lyapin A. G., and Hemely R. J., (2002), Harder than diamond: dreams and reality, Phil. Mag. A, 82: 231
Brown W. E., (1962), Octacalcium phosphates and hydroxyapatite, Nature, 196: 1048 Champion E., Gautier S., Bernache-Assollant D., (1996), Characterization of hot pressed
Al 2O3 –platelet reinforced hydroxyapatite composites, J. Mater. Sci.: Mater. Med., 7: 15 Chen I. W., Wang X. H., (2000), Sintering dense nanocrystalline ceramics without final-stage
grain growth, Nature, 404: 168 Chow L. C., (1991), Development of self-setting calcium phosphate cements, J. Ceram. Soc.
Japan Int. Ed., 99: 927.

References
102
Choi J. W., Kong Y. M., and Kim H. E., (1998), Reinforcement of Hydroxyapatite Bioceramic by Addition of Ni3Al and Al2O3, J. Am. Ceram. Soc., 81: 1743
Chu C., Lin P., Dong Y., Xue X., Zhu J., Yin Z., (2002), Fabrication and characterization of hydroxyapatite reinforced with 20 vol % Ti particles for use as hard tissue replacement, J. Mater. Sci.: Mater. Med., 13: 985
Cant N. W., Bett J. A. S., Wilson G. R., and Hall W. K., (1971), The vibrationsl spectrum of hydroxy1 groups in hydroxyapatites, Spectrochimica Acta, 27A: 425
Corcia J. T., Moody W. E., (1974), Thermal analysis of human dental enamel, J. Dent. Res., 53: 571
Costa T. M. H., Gallas M. R., Benvenutti E., and da Jornada J. A. H., (1999), Study of nanocrystalline γ-Al 2O3 produced by high-pressure compaction, J. Phy. Chem. B, 103: 4278
Curry N. A., Jones D. W., (1971), Crystal structure of brushite, calcium hydrogen orthophosphate dihydrate: a neutron diffraction investigation, J. Chem. Soc. A: 3725
Cuy J. L., Mann A. B., Livi K. J., Teaford M. F., Weihs T. P., (2002), Nanoindentation mapping of the mechanical properties of human molar tooth enamel, Archives of Oral Biology, 47: 281
Dahm S. and Risnes S., (1999), A comparative infrared spectroscopic study of hydroxide and carbonate absorption bands in spectra of shark enameloid, shark dentin, and a geological apatite, Calcified Tissue International, 65: 459
De Groot K., (1981), in Williams D. F., (ed). Biocompatibility of Clinical Implant Materials. Boca Raton, Fla: CRC Press;: 199-222
De Groot K., (1983), Bioceramics of Calcium Phosphate, CRC press, Boca Raton Denissen H. W., de Groot K., (1979), Immediate dental root implants from synthetic dense
calcium hydroxylapatite, J. Prosthet. Dent., 42: 551 De With G. and Corbijn A. J., (1989), Metal fibre reinforced hydroxyapatite ceramics, J.
Mater. Sci., 24: 3411 De With G., Van Dijk, H. J. A., Hattu N., and Prijs K., (1981), Preparation, microstructure
and mechanical properties of dense polycrystalline hydroxyapatite, J. Mater. Sci., 16: 1592
Dickens B., Prince E., Schroeder L. W., Brown W. E., (1973), Ca(H2PO4)2, a crystal structure containing unusual hydrogen bonding, Acta Cryst., B29: 2057
Dickens B., Bowen J. S., (1971), Refinement of the crystal structure of Ca(H2PO4)2·H2O, Acta Cryst., B27: 2247
Dong J., Kojima H., Uemara I., Kikuchi M., Tateishi T., Tanaka J., ( 2001), In vivo evaluation of a novel porous hydroxyapatite to sustain osteogenesis of transplanted bone marrow-derived osteoblastic cells, J. Biomed. Mater. Res. 57: 208
Dorozhkin S. V. and Epple M., (2002), Biological and medical significance of calcium phosphates, Angew. Chem. Int. Ed. 41: 3130
Dowker S. P. E. and Elliot J. C., (1983), Infrared study of trapped carbon dioxide in thermally treated apatites, J. Solid Stat. Chem., 47: 164
Durucan C., Brown P. W., (2000), Low temperature formation of calcium-deficient hydroxyapatite-PLA/PLGA composites, J. Biomed. Mater. Res., 51: 717
Dykes E., and Elliot J. C., (1971), The occurrence of chloride ions in the apatite lattice of Holly Springs hydroxyapatite and dental enamel, Calcified Tissue Research, 7: 241
Eanes E. D., (1979), Enamel apatite: chemistry, structure and properties, J. Dent. Res., 58(B): 829
Ekimov E. A., Gavriliuk, A. G., Palosz B., Gierlotka, S., Dluyewski P., Tatianin E., Kluev Yu, Naletov A. M., Presz A., (2000), High-pressure, high-temperature synthesis of SiC-diamond nanocrystalline ceramics, Applied physics letters., 77: 954
References
103
Elliot J. C., Marckie P. E., Young R. A., (1973), Monoclinic hydroxyapatite, Science, 180: 1055
Elliot J. C., (1994), Structure and chemistry of the apatites and other calcium orthophosphates, Elsevier Science B. V., Amsterdam,
Elliot J. C., (1997), Structure, crystal chemistry and density of enamel apatites, Dental Enamel, Ciba Foundation Symposium 205: 54, Wiley, Chichester.
Elliot J. C., (2002), Calcium phosphate biominerals, in: Kohn M. J., Rakovan J. and Hughes J. M. (Eds), Reviews in Mineralogy and Geochemistry, The Mineralogical Society of America, Washington, DC, 48: 427
Evans A. G., Charles E. A., (1976), Fracture toughness determinations by indentation, J. Am. Ceram. Soc., 59: 371
Fang Y., Agrawal D. K., Roy D. M., Roy R., (1995), Fabrication of transparent hydroxyapatite ceramics by ambient-pressure sintering, Mater. Lett., 23: 147
Fernandez E., Planell J. A., Best S. M., (1999), Precipitation of carbonated apatite in the cement system α-Ca3(PO4)2-Ca(H2PO4)-CaCO3. J. Biomed. Mater. Res., 47: 466
Fincham A. G., Lou W., Moradian-Oldak J., Paine M. L., Snead M. L., Zeichner-David M., (2000), Enamel biomineralization: the assembly and disassembly of the protein extracellular organic matrix, In: Teaford M. F., Smith M. M., Ferguson M. W. J. (Eds), Development, Function and Evolution of Teeth. Cambridge University Press, Cambridge, 37-61
Fine G., Stolper E. M., (1985), The speciation of carbon dioxide in sodium aluminosilicate glasses, Contrib. Mineral. Petrol., 91: 105
Fowler B. O., (1974), Infrared studies of apatites. I. Vibrational assignments for calcium, strontium, and barium hydroxyapatites utilizing isotopic substitution, Inorg. Chem., 13:194
Guo H., Khor K. A.., Boey Y. C., Miao X., (2003), Laminated and functionally graded hydroxyapatite/yttria stabilized tetragonal zirconia composites fabricated by spark plasma sintering, Biomaterials, 24: 667
Gauthier O., Bouler J. M., Aguado E., Legeros R. Z., Pilet P., Daculsi G., (1999), Elaboration conditions influence physicochemical properties and in vivo bioactivity of macroporous biphasic calcium phosphate ceramics, J. Mater. Sci., Mater. in Med., 10: 199
Geesink R. G., de Groot K., Klein C. P. A. T., (1987), Chemical implant fixation using hydroxyapatite coatings. The development of a human total hip prosthesis for chemical fixation to bone using hydroxyapatite coatings on titanium substrates, Clin. Orthop., 225: 147
Gierlotka S., Palosz B. F., Swiderska-Sroda A., Grzanka E., Kalisz G., Stelmakh S., (2003), Synthesis of metal-ceramic nanocomposites by high-pressure infiltration, Abstracts of the EMRS 2003 Fall Meeting, 235
Habibovic P., Barrere F., van Blitterswijk C. A., de Groot K., and Layrolle P., (2002), Biomimetic hydroxyapatite coating on metal implants, J. Am. Ceram. Soc., 85: 517
Han D., Mecholsky J. J., (1990), Fracture analysis of cobalt-bonded tungsten carbide composites, J. Mater. Sci. 25: 4949
Hassan R., Caputo A. A., Bunschah R. F., (1981), Fracture toughness of human enamel, J. Dent. Res., 60: 820
Hench L. L., (1991), Bioceramics: from concept to clinic, J. Am Ceram. Soc. 74: 1487 Hench, L. L., (1998), Bioceramics, J. Am. Ceram. Soc., 81: 1705 Hing K. A., Best S. M., Tanner K. E., Bonfield W., Revell P. A., (1999), Quantification of
bone ingrowth within bone-derived porous hydroxyapatite implants of varying density, J. Mater. Sci.: Mater. Med. 10: 663
References
104
Holcomb D. W. and Young R. A., (1980), Thermal decomposition of human dental enamel, Calcified Tissue International, 31: 189
Hounslow A. W., Chao G. Y., (1968), Monoclinic chlorapatite from Ontario, Can. Mineral., 10: 252
Hu Q., Li B., Wang M., Shen J., (2004), reparation and characterization of biodegradable chitosan/hydroxyapatite nanocomposite rods via in situ hybridization: a potential material as internal fixation of bone fracture, Biomaterials 25: 779
Hughes J. M., Cameron M., Crowley K. D., (1989), Structural variations in natural F, OH, and Cl apatites, Am. Mineral., 74: 870
Hughes J. M., Cameron M., Crowley K. D., (1990), Crystal structures of natural ternary apatties: solid solution in the Ca5(PO4)3X (X = F, OH, Cl) system, Am. Mineral., 75: 295
Hughes J. M., Rakovan J., (2002), The crystal structure of apatite, Ca5(PO4)3(F,OH,Cl), in M. J. Kohn, J. Rakovan and J. M. Hughes (Eds), Phosphates: Geochemical, Geobiological, and Materials Importance. Reviews in mineralogy and geochemistry, 48: 1
Ignjatovic N., Savic V., Najman S., Plavisic M, Uskokovic D, (2001), A study of Hap/PLLA composite as a substitute for bone powder, using FT-IR spectroscopy, Biomaterials, 22: 571
Ioku, K., Nama T., Ishiyawa N., and Yoshimura M., (1990), Hydrothermal sythesis and sintering of hydroxyapatite powders dispersed with Si3N4 whiskers, J. Ceram. Soc. Jpn. Int. Ed., 98: 1348
Ioku K., Somiya S., and Yoshimura M., (1991), Hydroxyapatite ceramics with tetragonal zirconia particle dispersion prepared by HIP post-sintering. J. Ceram. Soc. Jpn. Int. Ed., 99: 191
Ito A., Tateishi T., Tusutsumi S., (1996), In vitro properties of a chitosan-bonded bone filling paste: studies on solubility of calcium phosphate compounds. J. Biomed. Mater. Res. 32: 95
Jarcho, M., Kay J. I., Gummaer R. H., Drobeck H. P., (1977), Tissue, cellular, and subcellular events at a bone-ceramic hydroxyapatite interface, J. Bioeng., 1: 79
Jones D. W., Cruickshank D. W. J., (1961), The crystal structures of two calcium orthophosphates: CaHPO4 and Ca(H2PO4)2·H2O, Z. Krist.; 116: 101
Juang H. Y., Hon M. H., (1994), Fabrication and mechanical properties of hydroxyapatite-alumina composites, Mater. Sci. Eng. C 2: 77
Kay M. I., Young R. A., Posner A. S., (1964), Crystal structure of hydroxyapatite, Nature, 204: 1050
Kasuga T., Yoshida M., Ikushima A. J., Tuchiya, M., Kusakari H., (1992), Bioactivity of zirconia –toughended glass-ceramics, J. Am. Ceram. Soc. 75: 1884
Klee W. E., (1969), The vibrational spectra of the phosphate ions in fluorapatite, Zeitschrift für Kristallographie, 131: 5
Koutsopoulos S., (2002), Synthesis and characterization of hydroxyapatite crystals: a review study on the analytical methods, J. Biomed. Mater. Res., 62: 600
Kukubo T., (1991), Bioactive glass ceramics: properties and applications, Biomaterial, 12: 155
Kutty M. G., Loertscher J., Bhaduri S., Bhaduri S. B., Tinga W. R., (2001), Microwave sintering of nanocrystalline hydroxyapatite, ceramic engineering and science proceedings. 22: 3
Le Geros R. Z., Bonel G. and Legros R., (1978), Types of “H2O” in human enamel and in precipitated apatites, Calcified Tissue Research, 26: 111
Le Geros R. Z., Le Geros J. P., (1984), Phosphate minerals in human tissues, in Nriagu J. O., Moore P. B. (Eds), Phosphate Minerals, Springer-Verlag
References
105
Le Geros R. Z. (1994) in Hydroxyapatite and related materials, Eds: Brown P. W., Constantz B., CRC, Boca Raton, El, pp 3-28
Le Geros R. Z., Le Geros J. P., Daulsi G., Kijkowska R., (1995), Calcium phosphate biomaterials: preparation, properties, and biodegradation. in Encyclopedic handbook of biomaterials and bioengineering. Wise D. L., Tarantalo D. J., Altobelli D. E., Yaszemski M. J., Gresser J. D., Schwartz E. R. (eds) Marcel Dekker, 2: 1429
Le Geros R. Z., and Le Geros J. P., (2003), Calcium phosphate Bioceramics: past, present and future, Key Engineering Materials, Vols. 240-242: 3
Leventorui Th., Moghaddam H. Y., Chakoumakos B. C. and Perdikatsis V., (2000), Powder neutron diffraction studies of a carbonate fluorapatite, J. Mater. Res., 15: 511
Levitt S. R., Blakeslee K. C. and Condrate R. A., (1970), Infrared and laser Raman spectra of several apatites, Memoires de la Societe Royale des Sciences de Liege, 20: 121
Levitt S. R., and Condrate R. A., (1970), The polarised infrared spectra of hydroxyl ion in fluorapatite, Applied Spectroscopy, 24: 288
Li J., Forber S., Hermansson L., (1991), Evaluation of the mechanical properties of hot isostatically pressed titania and titania-calcium phosphate composites, Biomaterials, 12: 438
Liu D. M., (1996), Control of pore geometry on influencing the mechanical property of porous hydroxyapatite bioceramics, J. Mater. Sci. lett., 15: 419
Livingston T. L., Gordon S., Archambault, M., Kadiyala S., McIntosh K., Smith A. ; Peter S. J., (2003), Mesenchymal stem cells combined with biphasic calcium phosphate ceramics promote bone regeneration, J. Mater. Sci. Mater. Med., 14: 211
Li W., Gao L., (2003), Fabrication of HAp–ZrO2 (3Y) nano-composite by SPS, Biomaterials, 24: 937
Long M., and Rack H. J., (1998), Titanium alloys in total joint replacement—a materials science perspective, Biomaterials, 19: 1621
Luo P. and Nieh T. G., (1995), Synthesis of ultrafine hydroxyapatite particles by a spray dry method, Mater. Sci. Eng., C3: 75
Mancini C. E., Berndt C. C., Sun L., Kucuk A., (2001), Porosity determinations in thermally sprayed hydroxyapatite coatings, J. Mater. Sci., 36: 3891
Mann, S., (2001), Biomineralization-principles and concepts in bioinorganic materials chemistry, Oxford University Press.
Mano J. F., Vaz C. M., Mendes S. C., Reis R. L., Cunha A. M., (1999), Dynamic mechanical properties of hydroxyapatite-reinforced and porous starch-based degradable biomaterials, J. Mater. Sci., Mater. Med., 10: 857
Marshall A. F. and Lawless K. R., (1981), TEM study of the central dark line in enamel crystallites, J. Dent. Res., 60: 1773
Masse A., Bruno A., Bosetti M., Biasibetti A., Cannas M., Gallinaro P., (2000), Prevention of pin track infection in external fixation with silver coated pins: Clinical and microbiological results, J. Biomed. Mater. Res. (Appl. Biomater.), 53: 600
Mayer I., Schneider S., Sydney-Zax M., and Deutsch D., (1990), Thermal decomposition of developing enamel, Calcif. Tissue Int., 46: 254
McMillan P. F., Hofmeister A. M., (1988), Infrared and Raman spectroscopy, in Hawthorne F. C., (Ed), Review in Mineralogy, 18: 99
McMillan P. F., (2002), Nature, New materials from high pressure experiments 1: 19 Mishra R. S., Lesher C. E., and Mukherjee A. K., (1996), High-pressure sintering of
nanocrystalline γ-Al2O3, J. Am. Ceram. Soc., 79: 2989 Monroe Z. A. , Votawa W., Bass D. B., McMillen J., (1971), New calcium phosphate
ceramic material for bone and tooth implants, J. Dent. Res., 50: 860 Nakahira A., Tamai M., Sakamoto K., Yamaguchi S., (2000), Sintering and microstructure of
porous hydroxylapatite, J. Ceram. Soc. Japan., 108: 99

References
106
Neo M., Kotani S., Fujita Y., Nakamura Y., Yamamuro T., Bando Y., Ohtsuki C., Kokubo T., (1992), Differences in ceramic-bone interface between surface-active ceramics and resorbable ceramics: A study by scanning and transmission electron microscopy, J. Biomed. Mater. Res., 26: 255
Nery E. B., Lynch K. L. and Hirthe W. M., (1975), Bioceramic implants in surgically produced infrabony defects. J. Periodontol. 46: 328
Niihara K., Morena R., Hasselman D. P. H., (1982), Evaluation of KIc of brittle solids by the indentaion method with low crack-to-indent ratios, J. Mater. Sci. Letters, 1: 13
Ning, C. Q., Zhou, Y., (2002), In vitro bioactivity of a biocomposite fabricated from HA and Ti powders by powder metallurgy method, Biomaterials, 23: 2909
Nonami T., in Multifunctional Materials, edited by Buckley A. J. , Gallagher-Daggitt G., Karasz F. E., and Ulrich D. R., (1990), Mater. Res. Soc. Symp. Proc., Pittsburgh, PA, 175 : 71
Nonami T., Satoh N., (1995), J. Ceram Soc. Jpn, 103: 804 Noma T., Shoji N., Wada S., and Suzuki T., (1993), Preparation of spherical Al 2O3 particle
dispersed hydroxyapatite ceramics, J. Ceram. Soc. Jpn. Int. Ed., 101: 898 Noma T., Shoji N., Wada S., and Suzuki T., (1992), Sintering of hydroxyapatite powders with
SiC platelets dispersion, J. Ceram. Soc. Jpn. 100: 1175 Ogiso M., Yamarmura M., Kuo P. T., Borgeses D., Matsumoto T., (1998), Comparative push-
out test of dense HA implants and HA-coated implants: findings in a canine study, J. Biomed. Mater. Res., 39: 364
Oreffo R. O. C., Triffitt J. T., (1999), In vitro and in vivo methods to determine the interactions of osteogenic cells with biomaterials, J. Mater Sci: Mater. Med., 10: 607
Overgaard S., Lind M., Josephsen K., Maunsbach A. B., Bunger C., Soballe K., (1998), Resorption of hydroxyapatite and fluorapatite ceramic coatings on weight-bearing implants: A quantitative and morphological study in dogs, J. Biomed. Mater. Res., 39: 141
Pan Y., Fleet M. E., (2002), Compositions of the apatite-group minerals: substitution mechanisms and controlling factors. in P. H. Ribbe, J. J. Rosso, (Eds), Reviews in Mineralogy & Geochemcistry, 48: 13
Peelen J. G. J., Rejda B. V., de Groot, (1978), Preparation and properties of sintered hydroxyapatite, Ceram. Intl., 4: 71
Piesco N. P., and Avery J. K., (2002), Development of the teeth and supporting structures, in Avery J. K., Oral Development and Histology, Thieme, Stuttgart, New York, p. 92
Piesco N. P., and Simmelink J., (2002), Histology of enamel, in Avery J. K., Oral Development and Histology, Thieme, Stuttgart, New York, p. 153
Raynaud S., Champion E. and Bernache-Assollant D., (2002), Calcium phosphate apatites with variable Ca/P atomic ratio II. Calcination and sintering, Biomaterials, 23: 1073
Reisner I., and Klee W. E., (1982), Temperature dependence of the ν(OH) bands of hydroxyapatites, Spectrochimica Acta, 38A: 899
Rey C., Renugopalakrishnan V., Collins B., and Glimcher M. J., Fourier transform Infrared spectroscopic study of the carbonate ions in bone mineral during aging, (1991), Calcif. Tissue Int., 49: 251
Rodriguez-Lorenzo L. M. , Vallet-Regi M., Ferreira J. M. F., (2001), Colloidal processing of hydroxyapatite, Biomaterials, 22: 1847
Rootare H. M., Powers J. M., and Craig R. G., (1978), Sintered hydroxyapatite ceramic for wear studies, J. Dent. Res., 57: 777
Roy D., Linnehan S. K., (1974), Hydroxyapatite formed from coral skeletal carbonate by hydrothermal exchange, Nature, 247: 220
Ruys A. J., Wei M., Sorrell C. C., Dickson M. R., Brandwood A., Monticelli G., (1995), Sintering effects on the strength of hydroxyapatite, Biomaterials. 16: 409

References
107
Sadlo J., Callens F., Michalik J., Stachowicz W., Mattys P. and Boesman E., (1998), Electron-nuclear double resonance of human tooth enamel heated at 400 oC, Calcified Tissue International, 63: 409
Schmidt C., Ignatius A. A., Claes L. E., (2001), Proliferation and differentiation parameters of human osteoblasts on titanium and steel surfaces, J. Biomed. Mater. Res., 54: 209
Sedlak J. M., Beebe R. A., (1974), Temperature programmed dehydration of amorphous calcium phosphate, J. Colloid. Interface Sci., 47: 483
Shen Z. J., Adolfsson E., Nygren M, Gao L., Kawaoka H., Niihar K., (2001), Dense hydroxyapatite-zirconia ceramic composites with high strength for biological applications, Adv. Mater., 13: 214
Shi J., Klocke A., Zhang M. and Bismayer U., (2002), Graded mineral content and temperature evolution of hydrous species in human dental enamel, Eur. J. Mineral., Suppl. 14(1): 155
Shi J., Klocke A., Carpenter M., Bismayer U., (2003a), Natural and synthetic biocomposites, Z. Krist., Suppl. 20: 100
Shi J., Klocke A., Zhang M. and Bismayer U., (2003b), Thermal behaviour of dental enamel and geologic apatite: an infrared spectroscopic study, Am. Mineral., 88: 1866
Shi J., Palosz B., Gierlotka, S., Klocke A., Bismayer U., (2003c), Characterization of nanostructured hydroxyapatite ceramics densified at high-pressure and temperature, Abstracts of the EMRS 2003 Fall Meeting, 173
Shi J., Bismayer U., Klocke A., Gierlotka, S., Palosz B., (2003d), Hydroxyapatit-Metall-Verbundwekstoff und ein Verfahren zu dessen Herstellung, German patent applied, No: 103 60 813.3
Shi J., Bismayer U., Klocke A., Gierlotka S., Palosz B., (2004a), High-pressure and –temperature sintering of nanosized hydroxyapatite powders, Key Engineering Materials, in print
Shi J., Klocke A., Zhang M., Bismayer U., (2004b), Thermally induced structural modification of nanocrystalline apatite in dental enamel, Eur. J. Mineral., Suppl. 16(1): 133
Shirkhanzadeh M., Azadegan M., (1993), Hydroxyapatite particles prepared by electrocrystalisation from aqueous electrolytes, Mater. Lett. 15: 392
Slosarczyk A., Stobierska E., Paszkiewicz Z., and Gawlicki M., (1996), Calcium phosphate materials prepared from precipates with various calcium :phosphorus molar ratios, J. Am. Ceram. Soc., 79: 2539
Somiya S., Ioku K., and Yoshimura M., (1988), Mater. Sci. Forum, 34-36: 371 Sowa M. G., Mantsch H. H., (1994), FT-IR photoacoustic depth profiling spectroscopy of
enamel, Calcif. Tissue Int., 54: 461 Suchanek W., Yoshimura M., (1998), Processing and properties of hydroxyapatite-based
biomaterials for use as hard tissue replancement implants, J. Mater. Res., 13: 94 Surovell T.A. and Stiner M.C., (2001), Standardizing infra-red measures of bone mineral
crystallinity: an experimental approach, J. Archaeol. Sci., 28: 633 Swiderska-Sroda A., Koyubowski J., Maranda-Niedbala A., Grzanka E., Palosz B. F., et al.,
(2003), Investigation of the microstructure of SiC-Zn nanocomposites by microscopic methods: SEM, AFM, and TEM. Abstracts of the EMRS 2003 Fall Meeting, 234
Tadic D. and Epple M., (2004), A thorough physicochemical characterisation of 14 calcium phosphate-based bone substitution materials in comparison to natural bone, Biomaterials, 25: 987
Toriyama M., Ravaglioli A., Krajewski A., Celotti G., and Piancastelli A., (1996), Synthesis of hydroxyapatite-based powders by mechano-chemical method and their sintering, J. Eur. Ceram. Soc. 16: 429
References
108
Uematsu K., Takagi M., Honda T., Uchida N., Saito K., (1989), Transparent Hydroxyapatite Prepared by Hot Isostatic Pressing of Filter Cake, J. Am. Ceram. Soc., 72: 1476
Vaidya S. N., Karunakaran C., Pande B. M., Gupta N. M., Iyer R. K., Karweer S. B., (1997), Pressure-induced crystalline to amorphous transition in hydroxylapatite, J. Mater. Sci., 32: 3213
Van Lanuyft P., Li P., Keustermans J. P., Streydio J. M., Delannaz F., (1995), The influence of high sintering temperature on the mechanical properties of hydroxylapatite. J. Mater. Sci. Mater. Med., 6: 8
Vaz L., Loes A. B., Almedia M., (1999), Porosity control of hydroxyapatite implants, J. Mater. Sci.: Mater. Med. 10: 239
Wakai F., Kodama Y., Sakagawa S., and Nonami T., (1990), Supperplasticity of hot isostatically pressed hydroxyapatite, J. Am. Ceram. Soc. 73: 457
Watanabe S., Nakamura T., Shimizu Y., Hitomi S., Ikada Y., (1989), Traumatic sternal segment dislocation in a child, Chest. 96: 684
Weast R. C., (1985-1986), The CRC Handbook of Chemistry and Physics, 66th ed., CRC, Boca Raton, F. L.
Weatherell J. A. and Robinson C., (1973), The inorganic composition of teeth, in Zipkin I. (Ed.), Biological Mineralisation, John Wiley, New York. p. 43
Weiner S. and Bar-Yosef O., (1990), States of preservation of bones from prehistoric sites in the Near East: a survey, J. Archaeol. Sci., 17: 187
Wen, J., Liu, X., Zhang, X., Ji, X., (1994), Thermal decomposition of Hydroxyapatite induced by titanium and its oxides, J. Mater. Sci. Letter, 13: 159
White S. N., Luo W., Paine M. L., Fong H., Sarikaya M., Snead M. L., (2001), Biological organization of hydroxyapatite crystallites into a fibrous continuum toughens and controls anisotropy in human dental enamel, J. Dent. Res., 80: 321
Williams D. F., (1987), Definitions in Biomaterials, Amsterdam: Elsevier Williams R., Doherty P., Vince D., Grashoff G., Williams D., (1989), The biocompatibility of
silver, Crit. Rev. Biocompatibility, 5: 221 Wilson R. M., Elliot J. C., and Dowker S. E. P., (1999), Rietveld refinement of the
crystallographic structure of human dental enamel apatites, American Mineralogist, 84: 1406
Xu H. H. K, Smith D. T., Jahanmir S., Romber E., Kelly J. R., Thompson V. P., Rekow E. D., (1998), Indentation damage and mechanical properties of human enamel and dentin, J. Dent. Res., 77: 472
Xu Y., Wang D., Yang L., Tang H., (2001), Hydrothermal conversion of coral into hydroxyapatite, Mater. Characterization, 47: 83
Yamasaki Y., Yoshida Y., Okazaki M., Shimazu A., Kubo T., Akagawa Y., Uchida T., (2003), Action of FGMgCO3Ap-collagen composite in promoting bone formation, Biomaterials, 24: 4913
Yang Y., Kim K.-H., Agrawal C. M., and Ong J. L., (2003), Influence of Post-deposition Heating Time and the Presence of Water Vapor on Sputter-coated Calcium Phosphate Crystallinity, J. Dent. Res., 82: 833
Yang Y., Kim K.-H., Agrawal C. M., and Ong J. L., (2004), Interaction of hydroxyapatite-titanium at elevated temperature in vacuum environment, Biomaterials, 25: 2927
Young R. A. and Mackie P. E., (1980), Crystallography of human tooth enamel: initial structure refinement, Mater. Res. Bull., 15: 17
Zaremba C. M., Morse D. E., Mann S., Hansama P. K., Stuckz G. D., (1998), Aragonite-Hydroxyapatite Conversion in Gastropod (Abalone) Nacre, Chem. Mater., 10 : 3813
Zhang M., Wruck B., Graeme-Barbar A., Salje E. K. H., and Carpenter M.A., (1996), Phonon-spectroscopy on alkali-feldspars: Phase transitions and solid solutions, American Mineralogist, 81: 94
References
109
Zhang X., Gubbels G. H. M., Terpstra R. A., Metslaar R., (1997), Toughening of calcium hydroxyapatite with silver particles, J. Mater. Sci., 32: 235
Acknowledgements
110
Acknowledgements
This dissertation was developed from Oct. 2001 to Sept. 2004 at the Mineralogisch-
Petrographisches Insitut of the University of Hamburg and supported by the DFG-GK 611
“Design and Characterization of Functional Materials”.
First of all I would like to give my thanks to my supervisor, Prof. Dr. U. Bismayer for his
interest in the research project, his broad knowledge, his wisdom, and his consideration and
support when I was in a difficult situation.
I thank Dr. A. Klocke, University Hospital Eppendorf, for his cooperation, fruitful discussion
and support in my research.
I am also grateful to
Dr. M. Zhang, Prof. Dr. M. Carpenter, Department of Earth Sciences, University of
Cambridge for in situ measurements of IR spectra and Electron Microscope investigation
during my academic visit in Cambridge, UK.
Dr. S. Gierlotka, Prof. Dr. B. Palosz, High Pressure Research Center, Polish Academy of
Sciences, Warsaw, Poland for high pressure and temperature experiments.
Dr. X. Zheng, Prof. Dr. J. Chang, Shanghai Institute of Ceramics, Chinese Academy of
Sciences, China for arrangements of biocompatibility evaluation using cell cultures.
Dr. K. Klaska∗ and Mr J. Ludwig for XRD measurements.
Mrs B. Cornelisen and Prof. Dr. M. Tarkian for microprobe analysis.
Dr. B. Mihailova, Institute of Crystallography and Mineralogy, Bulgarian Academy of
Sciences, for her helpful discussion in IR and Raman spectra.
Mr J. Hartmann from the Institute of Geology; Ms Walter and Dr. Keyser from Zoologisches
Insitut und Museum, University of Hamburg, for investigation using SEM.

Acknowledgements
111
Prof. Dr. H. Schleicher for help in the synchrotron X-ray fluoresce measurement at Hasylab.
Mr. P. Stutz for the preparation of specimens.
Dr. J. Schlüter, Mineralogical Museum of the University of Hamburg for offering geological
samples
AMI DODUCO GmbH, Pforzheim, Germany; Plasma Biotal Ltd., Derbyshire, UK, and
Plasma Spray Lab, Shanghai Institute of Ceramics, Chinese Academy of Sciences, China for
kindly offering free testing materials.
The Graduate School “Design and Characterization of Functional Materials” for offering me
a fellowship to survive in Hamburg.
Reinhardt, Radina, Vera, Melanie, Meike, Dr. Paulmann, Dr. Arikas, Frau Köllner and other
students and staff of the Mineralogisch-Petrographisches Insitut who have created a helpful,
friendly atmosphere during my stay.
My Chinese friends in Hamburg for organising Chinese style activities, preparing Chinese
foods to relax and enjoy life in leisure time.
and those not mentioned here but also help me in my work.
Curriculum Vitae
112
Curriculum Vitae
Family Name: Shi First name: Jianmin Gender: male Marital Status: married and one daughter Date of birth: June 28, 1969 Place of birth: Shandong Province, China Nationality: Chinese Education: 10, 2001-09, 2004 Ph. D student, Graduate School of “Design and Characterisation
of Functional Materials”, University of Hamburg, Germany 09, 1998-03, 2001 M. Sc. in Applied Chemistry, Shanghai Jiao Tong University,
Shanghai, China 07, 1996-08, 1996 Training for plasma spraying and programming of IRB S3 and
S4, Sulzer Metco AG, Wohlen, Switzerland 09, 1985-07, 1990 B. Eng. in Inorganic Materials, Tongji University, China Honors: 10, 2001-09, 2004 DFG-GK Ph. D scholarship
1990 One of the excellent graduates at universities in Shanghai, China 1987 One of the excellent undergraduates at Tongji University, China 1985-1990 First-class scholarship, Tongji University, Shanghai, China
Professional Experiences: 01, 1996-09, 2001 Research Engineer, Shanghai Institute of Ceramics, Chinese
Academy of Sciences, Shanghai, China 07,1993-12, 1995 Engineer, Division of Materials and Energy, Bureau of Applied
Research and Development, Chinese Academy of Sciences, Beijing, China
09,1990-06,1993 Assistant Engineer, Shanghai Institute of Ceramics, Chinese
Academy of Sciences, Shanghai, China
Publications
113
Publications (10. 2001- 09. 2004): Shi J., Bismayer U., (2002), Characterization of biomimetic apatites, Z. Krist., Suppl. 19: 100 Shi J., Bismayer U., Ding C., (2002), Mineralisation of apatite on a surface-modified porous
titanium coating during immersion in a simulated physiological solution, Proc. Materials Week 2002, mw2002_200, ISBN 3-88355-314-X
Shi J., Klocke A., Zhang M. and Bismayer U., (2002), Graded mineral content and
temperature evolution of hydrous species in human dental enamel, Eur. J. Mineral., Suppl. 14(1): 155
Shi J., Klocke A., Carpenter M., Bismayer U., (2003), Natural and synthetic biocomposites, Z.
Krist., Suppl. 20: 100 Shi J., Klocke A., Zhang M. and Bismayer U., (2003), Thermal behaviour of dental enamel
and geologic apatite: an infrared spectroscopic study, Am. Mineral., 88: 1866-1871 Shi J., Palosz B., Gierlotka, S., Klocke A., Bismayer U., (2003), Characterization of
nanostructured hydroxyapatite ceramics densified at high-pressure and temperature, Abstracts of the EMRS 2003 Fall Meeting, 173
Shi J., Bismayer U., Klocke A., Gierlotka, S., Palosz B., (2003), Hydroxyapatit-Metall-
Verbundwekstoff und ein Verfahren zu dessen Herstellung, German patent applied No: 103 60 813.3
Shi J., Klocke A., Zhang M., Bismayer U., (2004), Thermally induced structural modification
of nanocrystalline apatite in dental enamel, Eur. J. Mineral., Suppl. 16(1): 133 Shi J., Bismayer U., Klocke A., Gierlotka S., Palosz B., (2004), High-pressure and –
temperature sintering of nanosized hydroxyapatite powders, Key Engineering Materials, in print
Bismayer U., Shi J., Klocke A., Gierlotka S., Palosz B., (2004), From dental enamel to
synthetic hydroxyapatite-metal composites, Key Engineering Materials, in print Klocke A., Shi J., Kahl-Nieke B., and Bismayer U., (2003) In vitro investigation of indirectly
bonding with a hydropholic primer. Angle Orthodontist, , 73: 445-450 Klocke A., Shi J., Kahl-Nieke B., and Bismayer U., (2003), In Vitro evaluation of a
moisture-active adhesive for indirect bonding, Angle Orthodontist, 73: 697-701 Becker A., Bismayer U., Epple M., Fabritius H., Hasse B., Shi J., and Ziegler A., (2003),
Structural Characterisation of X-ray amorphous calcium carbonate (ACC) in sterndal deposits of the crustacea Porcellio Scaber. The Royal Society of Chemistry, Dalton Transactions., 4: 551-555