

Experimental solidification of an andesitic melt by cooling
13
Research paper Experimental solidification of an andesitic melt by cooling Gianluca Iezzi a,b, ⁎, Silvio Mollo b , Guglielmo Torresi a,c , Guido Ventura b , Andrea Cavallo b , Piergiorgio Scarlato b a Dipartimento DIGAT, Università G. d'Annunzio, Via Dei Vestini 30, I-66013 Chieti, Italy b Istituto Nazionale di Geofisica e Vulcanologia, Via di Vigna Murata 605, 00143 Roma, Italy c Institut für Mineralogie, Universität Hannover, Hannover, Germany abstract article info Article history: Received 22 October 2010 Received in revised form 24 January 2011 Accepted 28 January 2011 Edited: D.B. Dingwell Keywords: Andesitic melt Experimental solidification Nucleation Crystal coarsening Disequilibrium phase Glass-forming ability (GFA) Solidification experiments at (a) five different cooling rates (25, 12.5, 3, 0.5 and 0.125 °C/min) between 1300 and 800 °C, and (b) variable quenching temperatures (1100, 1000, 900 and 800 °C) at a fixed cooling rate of 0.5 °C/min were performed on an andesitic melt (SiO 2 = 58.52 wt.% and Na 2 O+K 2 O = 4.43 wt.%) at air conditions from high superheating temperature. The results show that simultaneous and duplicated experiments with Pt-wire or Pt-capsule produce identical run-products. Preferential nucleation on Pt- containers or bubbles is lacking. Plagioclase and Fe–Ti oxide crystals nucleate firstly from the melt. Clinopyroxene crystals form only at lower cooling rates (0.5 and 0.125 °C/min) and quenching temperatures (900 and 800 °C). At higher cooling rates (25, 12.5 and 3 °C/min) and quenching temperature (1100 °C), plagioclase and Fe–Ti oxide crystals are embedded in a glassy matrix; by contrast, at lower cooling rates (0.5 and 0.125 °C/min) and below 1100 °C they form an intergrowth texture. The crystallization of plagioclase and Fe–Ti oxide starts homogeneously and then proceeds by heterogeneous nucleation. The crystal size distribution (CSD) analysis of plagioclase shows that crystal coarsening increases with decreasing cooling rate and quenching temperature. At the same time, the average growth rate of plagioclases decreases from 2.1 × 10 −6 cm/s (25 °C/min) to 5.7 × 10 −8 cm/s (0.125 °C/min) and crystals tend to be more equant in habit. Plagioclases and Fe–Ti oxides depart from their equilibrium compositions with increasing cooling rate; plagioclases shift from labradorite–andesine to anorthite–bytownite. Therefore, kinetic effects due to cooling significantly change the plagioclase composition with remarkable petrological implications for the solidification of andesitic lavas and dikes. The glass-forming ability (GFA) of the andesitic melt has been also quantified in a critical cooling rate (R c ) of ~ 37 °C/min. This value is higher than those measured for latitic (R c ~ 1 °C/min) and trachytic (R c b 0.125 °C/min) liquids demonstrating that little changes of melt composition are able to significantly shift the initial nucleation behavior of magmas and the following solidification paths. © 2011 Elsevier B.V. All rights reserved. 1. Introduction The transition from a silicate melt to a fully solidified magmatic rock is an important phase transformation occurring on the Earth. The melt to rock transition involves vitrification and/or crystallization, two processes related to the melt composition and to temperature/ pressure variation (Dowty, 1980; Lofgren, 1980; Kirkpatrick, 1981; Cashman, 1991; Lasaga, 1997; Hammer, 2008). Dynamic crystallization experiments carried out to investigate the nucleation behavior of silicate melts mostly concentrated on peridotitic and basaltic liquids (Conte et al., 2006; Hammer, 2006; Pupier et al., 2007; Schiavi et al., 2009 and references therein). Conversely, few data are available for intermediate and evolved compositions (Swanson, 1977; Naney and Swanson, 1980; Couch, 2003; Hammer, 2004; Iezzi et al., 2008); crystallization data for andesitic melts are instead completely lacking (Iezzi et al., 2009). Importantly, recent data on latitic and trachytic liquids demonstrated that small compositional differences have important effects on the nucleation behavior of silicate melts (Iezzi et al., 2008). The aim of this study is to investigate the crystallization behavior of an andesitic melt under dynamic cooling conditions. Experiments were performed under variable cooling rates and final quenching temperatures at the oxygen fugacity of air, which is the appropriate fugacity for magmas at shallowest crustal levels (e.g. dikes; Burgisser and Scaillet, 2007) and emplacing lava flows or domes (Burkhard, 2005a, 2005b). The results allow us to (i) investigate the nucleation and growth of plagioclase and Fe–Ti oxide in the andesitic melts, (ii) obtain information on the ability of such melts to crystallize, (iii) shed light on the textural and compositional (disequilibrium) features observed in the outer portions of aphyric and degassed andesitic lavas and dikes, and (iv) constrain physical models for the emplacement of andesitic magmas. Chemical Geology 283 (2011) 261–273 ⁎ Corresponding author at: Dipartimento DIGAT, Università G. d'Annunzio, Via Dei Vestini 30, I-66013 Chieti, Italy. Tel.: +39 0871 3556147; fax: +39 0871 3556047. E-mail address: [email protected] (G. Iezzi). 0009-2541/$ – see front matter © 2011 Elsevier B.V. All rights reserved. doi:10.1016/j.chemgeo.2011.01.024 Contents lists available at ScienceDirect Chemical Geology journal homepage: www.elsevier.com/locate/chemgeo
-
Upload
independent -
Category
Documents
-
view
0 -
download
0
Transcript of Experimental solidification of an andesitic melt by cooling

Chemical Geology 283 (2011) 261–273
Contents lists available at ScienceDirect
Chemical Geology
j ourna l homepage: www.e lsev ie r.com/ locate /chemgeo
Research paper
Experimental solidification of an andesitic melt by cooling
Gianluca Iezzi a,b,⁎, Silvio Mollo b, Guglielmo Torresi a,c, Guido Ventura b,Andrea Cavallo b, Piergiorgio Scarlato b
a Dipartimento DIGAT, Università G. d'Annunzio, Via Dei Vestini 30, I-66013 Chieti, Italyb Istituto Nazionale di Geofisica e Vulcanologia, Via di Vigna Murata 605, 00143 Roma, Italyc Institut für Mineralogie, Universität Hannover, Hannover, Germany
⁎ Corresponding author at: Dipartimento DIGAT, UniVestini 30, I-66013 Chieti, Italy. Tel.: +39 0871 355614
E-mail address: [email protected] (G. Iezzi).
0009-2541/$ – see front matter © 2011 Elsevier B.V. Aldoi:10.1016/j.chemgeo.2011.01.024
a b s t r a c t
a r t i c l e i n f oArticle history:Received 22 October 2010Received in revised form 24 January 2011Accepted 28 January 2011
Edited: D.B. Dingwell
Keywords:Andesitic meltExperimental solidificationNucleationCrystal coarseningDisequilibrium phaseGlass-forming ability (GFA)
Solidification experiments at (a) five different cooling rates (25, 12.5, 3, 0.5 and 0.125 °C/min) between 1300and 800 °C, and (b) variable quenching temperatures (1100, 1000, 900 and 800 °C) at a fixed cooling rate of0.5 °C/min were performed on an andesitic melt (SiO2=58.52 wt.% and Na2O+K2O=4.43 wt.%) at airconditions from high superheating temperature. The results show that simultaneous and duplicatedexperiments with Pt-wire or Pt-capsule produce identical run-products. Preferential nucleation on Pt-containers or bubbles is lacking. Plagioclase and Fe–Ti oxide crystals nucleate firstly from the melt.Clinopyroxene crystals form only at lower cooling rates (0.5 and 0.125 °C/min) and quenching temperatures(900 and 800 °C). At higher cooling rates (25, 12.5 and 3 °C/min) and quenching temperature (1100 °C),plagioclase and Fe–Ti oxide crystals are embedded in a glassy matrix; by contrast, at lower cooling rates (0.5and 0.125 °C/min) and below 1100 °C they form an intergrowth texture. The crystallization of plagioclase andFe–Ti oxide starts homogeneously and then proceeds by heterogeneous nucleation. The crystal sizedistribution (CSD) analysis of plagioclase shows that crystal coarsening increases with decreasing coolingrate and quenching temperature. At the same time, the average growth rate of plagioclases decreases from2.1×10−6 cm/s (25 °C/min) to 5.7×10⁻⁸ cm/s (0.125 °C/min) and crystals tend to be more equant in habit.Plagioclases and Fe–Ti oxides depart from their equilibrium compositions with increasing cooling rate;plagioclases shift from labradorite–andesine to anorthite–bytownite. Therefore, kinetic effects due to coolingsignificantly change the plagioclase composition with remarkable petrological implications for thesolidification of andesitic lavas and dikes. The glass-forming ability (GFA) of the andesitic melt has beenalso quantified in a critical cooling rate (Rc) of ~37 °C/min. This value is higher than those measured for latitic(Rc ~1 °C/min) and trachytic (Rcb0.125 °C/min) liquids demonstrating that little changes of melt compositionare able to significantly shift the initial nucleation behavior of magmas and the following solidification paths.
versità G. d'Annunzio, Via Dei7; fax: +39 0871 3556047.
l rights reserved.
© 2011 Elsevier B.V. All rights reserved.
1. Introduction
The transition from a silicate melt to a fully solidified magmaticrock is an important phase transformation occurring on the Earth. Themelt to rock transition involves vitrification and/or crystallization,two processes related to the melt composition and to temperature/pressure variation (Dowty, 1980; Lofgren, 1980; Kirkpatrick, 1981;Cashman, 1991; Lasaga, 1997; Hammer, 2008).
Dynamic crystallization experiments carried out to investigate thenucleation behavior of silicate melts mostly concentrated onperidotitic and basaltic liquids (Conte et al., 2006; Hammer, 2006;Pupier et al., 2007; Schiavi et al., 2009 and references therein).Conversely, few data are available for intermediate and evolvedcompositions (Swanson, 1977; Naney and Swanson, 1980; Couch,
2003; Hammer, 2004; Iezzi et al., 2008); crystallization data forandesitic melts are instead completely lacking (Iezzi et al., 2009).Importantly, recent data on latitic and trachytic liquids demonstratedthat small compositional differences have important effects on thenucleation behavior of silicate melts (Iezzi et al., 2008).
The aim of this study is to investigate the crystallization behaviorof an andesitic melt under dynamic cooling conditions. Experimentswere performed under variable cooling rates and final quenchingtemperatures at the oxygen fugacity of air, which is the appropriatefugacity for magmas at shallowest crustal levels (e.g. dikes; Burgisserand Scaillet, 2007) and emplacing lava flows or domes (Burkhard,2005a, 2005b). The results allow us to (i) investigate the nucleationand growth of plagioclase and Fe–Ti oxide in the andesitic melts,(ii) obtain information on the ability of such melts to crystallize,(iii) shed light on the textural and compositional (disequilibrium)features observed in the outer portions of aphyric and degassedandesitic lavas and dikes, and (iv) constrain physical models for theemplacement of andesitic magmas.

Fig. 1. Experimental solidification conditions (Tables 1a and 1b). The star symbolrepresents the experiment quenched at 1300 °C. The straight lines are the five differentcooling rates used (Table 1a). The open circles correspond to the solidificationexperiments quenched at 1100, 1000 and 900 °C (Table 1b).
262 G. Iezzi et al. / Chemical Geology 283 (2011) 261–273
2. Starting material, experimental and analytical methods
Anatural andesitic rock from the Island of Panarea (Aeolian Islands,Italy) was finely ground and ~10 g of powder was loaded in a Ptcrucible and melted two times in air at 1400 °C for 200 min. Theobtained starting material was then analyzed by X-ray powderdiffraction (XRPD) and transmission optic microscope observations,which did not reveal the presence of any crystalline phases. A DeltechDT-31 vertical rapid-quench furnace was used for the preparation ofthe starting glass and for all the high-T solidification experiments; thetemperature was monitored by two thermocouples (Pt87Rh13-Pt,type R) close to (~5 mm) the experimental charges. The samples wereplaced at the center of the furnace into the 2 cm3 uniform hot-zonehaving a thermal gradient b5 °C. The heating rate used for eachexperiment is reported in Fig. 1. At the beginning of cooling, thestarting glassymaterialwas held at 1400 °C for 40min (Fig. 1)which is234 °C above the liquidus temperature (1166 °C) indicated by MELTS(Ghiorso and Sack, 1995). The high degree of superheatingwas chosen
Table 1aSolidification experiments under variable cooling rates (before quenching) and fixed therm
Thermal range (°C)
Run label BC-DPP-0.125 BW-DPP-0.125
Sample container Pt-capsule Pt-wire
Cooling rate (°C/min–°C/h) 0.125–7.5Time duration (minute–hour) 4000–66.7Crystal content (vol.%) 80 (3)
Run label AW-DPP-12.5 BC-DPP-12.5
Sample container Pt-wire Pt-capsule
Cooling rate (°C/min–°C/h) 12.5–750Time duration (minute–hour) 40–0.6Crystal content (vol.%) 20 (3)
Table 1bSolidification experiments under variable quenching temperatures and fixed cooling rate to
Run label DC-DPP-0.5 DW-DPP-0.5
Sample container Pt-capsule Pt-wire
Thermal range (°C) 1300–1100Time duration (minute–hour) 400–6.67Crystal content (vol.%) 13 (1)
to favor the dissolution of submicrometric crystals, equilibrate andhomogenize the melt and remove as much as possible gas bubbles.Successively, temperature was lowered to 1300 °C in 5 min. Below1300 °C, the following conditions were applied (Tables 1a and 1b;Fig. 1): (a) five different cooling rates (25, 12.5, 3, 0.5 and 0.125 °C/min)between1300 and 800 °C (final quenching temperature) and (b) afixedcooling rate of 0.5 °C/minwith variable quenching temperatures (1100,1000, 900 and 800 °C). Set (a) of experiments was designed toinvestigate the role of cooling rate (Table 1a), whereas set (b) wasperformed to follow the crystallization path of the andesitic melt(Table 1b and Fig. 1).
A further experiment was run at 1400 °C (dwell time of 40 min),cooled in 5 min to 1300 °C, and then quenched. The analysis of thisrun-product by electronic microscopy and by XRPD did not revealcrystals; only few bubbles were observed (≤1 vol.%). Thus, we canassume that all the kinetic experiments performed below 1300 °C,sets (a) and (b), initiated from a homogeneous and crystal-freeandesitic melt. The composition of this melt has been considered theinitial one. In wt.%, the melt composition is: SiO2=58.52(±0.7),TiO2=0.59(±0.06), Al2O3=17.24(±0.49), Fe2O3=7.67(±0.35),MnO=0.18(±0.04), MgO=4.14(±0.17), CaO=7.73(±0.33),Na2O=2.46(±0.07), K2O=1.97(±0.01), P2O5=0.15(±0.02).
Experiments were conducted using both Pt-wires (loops 1 mm indiameter) and Pt-capsules (internal diameter of 3 mm). Runs werecarried out simultaneously or separately by applying identical T and tconditions (Tables 1a and 1b). This was necessary to evaluate possibleeffects of the sample container on the nucleation behavior, and toverify the reproducibility of the observed solidification path(Tables 1a and 1b). Each experimental charge contained ~100 mg ofthe starting glass. Quenching was achieved by dropping the sampleinto a water bath at room temperature with a quenching rateN300 °C s−1.
Recovered run-products were mounted in epoxy and then groundand polished to expose both their internal and external parts, speciallythe contact between the Pt-container and silicate material. They wereanalyzed with an Electronic Probe Micro Analysis (EPMA) and a FieldEmission Gun-Scanning Electron Microscopy (SEM) both installed atIstituto Nazionale di Geofisica e Vulcanologia, Roma (Italy). EPMA is aJeol-JXA8200 combined EDS-WDS (five spectrometers with twelvecrystals) and SEM is a Jeol-JSM6500F equipped with an EDS detector.
al range. The number reported in parentheses refers to the standard deviation.
1300-800-quenching
AC-DPP-0.5 AW-DPP-3 BC-DPP-3 BW-DPP-3
Pt-capsule Pt-wire Pt-capsule Pt-wire
0.5–30 3–1801000–16.7 167–2.878 (3) 28 (3)
BW-DPP-12.5 AW-DPP-25 BC-DPP-25 BW-DPP-25
Pt-wire Pt-wire Pt-capsule Pt-wire
25–150020–0.310 (2)
0.5 °C/min. The number reported in parentheses refers to the standard deviation.
EC-DPP-0.5 FC-DPP-0.5 FW-DPP-0.5
Pt-capsule Pt-capsule Pt-wire
1300–1000 1300–900600–10 800–13.3472 (3) 73 (3)

263G. Iezzi et al. / Chemical Geology 283 (2011) 261–273
EPMA allowed us to determine the chemical composition of the run-products over an area of more than some μm2. The analyses wereperformed using an accelerating voltage of 15 kV and an electriccurrent of 10 nA. For glasses, a slightly defocused electronic beamwasused with a counting time of 5 s on background and 15 s on peak. Forcrystals, the beam sizewas 1–2 μmwith a counting time of 20 and 10 son peaks and background, respectively. The following standards wereused: jadeite (Si and Na), corundum (Al), forsterite (Mg), andradite(Fe), rutile (Ti), orthoclase (K), barite (Ba), celestine (S), fluorite (F),apatite (P and Cl) and spessartine (Mn). Sodium and potassium wereanalyzed first to accurately determine their amounts. The crystalanalyses were used only if compositions are 0.96bCa+Na+Kb1.04and 3.96bSi+Alb4.04 a.p.f.u. (calculated on 8 oxygens) for plagio-clases, and 2.97bFe+Mg+Al+Tib3.03 a.p.f.u. (calculated on 4oxygens) for oxides.
SEM images were collected using the back-scattered electron(BSE) mode at 80 to 10,000 magnifications. The accuracy of EDSchemical analysis has been checked on the same chemical standardsused for EPMA; differences in SiO2, Al2O3, Fe2O3, MgO, CaO, Na2O andK2O contents, obtained by EPMA-WDS and SEM-EDS were less than10% relative.
Image analysis was performed using the commercial softwareImage Pro Plus. Two examples of the procedure adopted to obtainphase segmentations and relative binary images of single phases(glass and plagioclase) are reported in Fig. 2 for crystal-poor andcrystal-rich run-products. Plagioclase crystals frequently impinged oneach other limiting the identification of a single crystal; followingPupier et al. (2007), white digital lines were drawn between impingedplagioclases allowing their identification. In the final binary images,plagioclase crystals were automatically counted to obtain theirshortest and longest axes, corresponding to the best-fitting ellipsesof the bi-dimensional crystal sections (Higgins 2006). The crystal sizedistribution (CSD) data for plagioclase populations were calculatedwith the program CSD-Corrections 1.38, that also accounts forstereological corrections, using the 2D longest dimensions ofplagioclases (Higgins 2000, 2006); the crystal habit of plagioclasewere fixed to 1:3:7 (intermediate between the shapes of large andsmall plagioclase crystals, see below); each CSD plot was constructedconsidering about 1000–1500 crystals, discarding those with lengthsb3 μm.
3. Results
Run-products show the following general features: (i) duplicatedexperiments performed in both Pt-capsule and Pt-wire (Tables 1a and1b) have the same textural and compositional features, (ii) iron andalkali loss have never been detected, (iii) preferential crystallizationon Pt-walls of the sample container or near bubble surfaces have notbeen observed (Fig. 3). Notably, bubbles are frequently reportedin crystallization studies performed at atmospheric pressure (Pupieret al. 2007); they nucleate by exsolution of low water amountsretained in nominally anhydrous silicate glasses in response tosuccessive crystallization events (Castro et al., 2008).
3.1. Textural features
Textural features of run-products are displayed in Fig. 3. Glasses,plagioclases, and Fe–Ti oxides are always present, whereas clinopyr-oxenes appear only at lower cooling rates (0.5 and 0.125 °C/min)(Fig. 3a) and quenching temperatures (900 and 800 °C) (Fig. 3b).Plagioclase is themost abundant crystalline phase. The crystal contentof run-products varies as follows (Tables 1a and 1b): (i) run-productssolidified at 25, 12.5, and 3 °C/min have a crystal content ≤28 vol.%(Fig. 3a), (ii) at 0.5 and 0.125 °C/min, the crystal content reaches amaximum value of ~80 vol.% (Fig. 3a); (iii) run-products quenched at1100 °C have ~13 vol.% of crystals (Fig. 3b); and (iv) at lower
temperatures (1000, 900 and 800 °C), the crystal content variesfrom ~70 to ~80 vol.% (Fig. 3b).
Crystals of plagioclase are intergrown in all the run-products(Fig. 3); crystal impingement, agglomeration and coalescence are alsoobserved, mostly at lower cooling rates (0.5 and 0.125 °C/min)(Fig. 3a). The size of plagioclase varies with cooling rates: (i) athigher cooling rates (25 and 12.5 °C/min) (Fig. 3a) and quenchingtemperature (1100 °C) (Fig. 3b), crystals reach a maximum length of~0.2 mm; (ii) at lower cooling rates (0.5 and 0.125 °C/min) (Fig. 3a)and quenching temperatures (1000, 900 and 800 °C) (Fig. 3b), themaximum crystal length is ~0.5 mm; (iii) at 3 °C/min (Fig. 3a), thevalue is ~0.35 mm. Larger crystals (length N20 μm) show equant (2:3)or prismatic (2:5) shapes, whereas smaller crystals (length b20 μm)are acicular (1:10); the latter shape frequently occurs in pools of glasssurrounded by larger crystals, especially at higher cooling rates(Fig. 3a) and quenching temperature of 1100 °C (Fig. 3b). Taking inaccount these observations, we were forced to fix the plagioclasecrystal shape to 1:3:7 (see before) for all the CSD plots; however,checks performed by using other crystal shape (1:2:4 and 1:1:10) didnot significantly affect the CSD results. Some plagioclases with size ofhundreds of μm show irregular and, to a lesser extent, smoothed androunded contours (Fig. 3). Tiny crystals frequently mantle the largerones. Additionally, they do not dispose isotropically around the largercrystals but arrange along preferential directions, i.e. roughly normalor parallel to the edges of large plagioclases. Such spatial arrange-ments produce crystal intergrowths with regular geometries (Fig. 3).Plagioclase develops nearly continuous crystal networks at lowercooling rates (0.5 and 0.125 °C/min) (Fig. 3a) and temperatures(1000, 900 and 800 °C) (Fig. 3b).
Micrometric Fe–Ti oxides have acicular shapes, whereas largercrystals (maximum size of 300 μm) show equant habits (Fig. 3). Theircrystal size increases as the cooling rate and quenching temperaturedecrease. Generally, larger crystals result from the attachment ofsmaller and equant ones (Fig. 3b).
Clinopyroxenes show always acicular shapes and dendritictextures. Their size is of the order of few microns. Notably, theyinvariably occur in pools of glass surrounded by large plagioclasecrystals (Fig. 3).
3.2. Phase compositions
The anorthite (An) content of plagioclase decreases as the coolingrate and quenching temperature decrease (Table 2 and Fig. 4). At 25and 12.5 °C/min, crystal compositions vary from An60 to An90 andcluster in the interval of An80–90. At 0.5 and 0.125 °C/min, they are inthe range of An55–75. At the intermediate cooling rate of 3 °C/min,crystal compositions cover those observed at both higher and lowercooling rates forming two clustered ranges of An85–90 and An60–70. Atthe fixed cooling rate of 0.5 °C/min, plagioclase compositions are inthe range of An65–85, An60–80 and An55–80 for quenching temperaturesof 1100, 1000 and 900 °C, respectively (Fig. 4).
The oxide compositions are plotted in Fig. 5. They are mainly closeto the magnetite and/or Ti-magnetite end-members. However, athigher cooling rates (25 and 12.5 °C) and quenching temperature(1100 °C) some crystals are solid solutions with the spinel s.s. end-member.
Clinopyroxenes were not analyzable by EPMA-WDS because oftheir small size. However, SEM-EDS analyses reveal compositionsranging from pigeonite to augite.
Glass compositions show large variations as a function of the glassproximity (or not) to crystalline phases (Tables 3a and 3b; Fig. 6).Glasses from run-products obtained at lower cooling rates (0.5 and0.125 °C/min) and quenching temperatures (900 and 800 °C) arealways embedded between large plagioclase crystals. At cooling ratesof 0.5 and 0.125 °C/min and quenching temperature of 800 °C, glassesare characterized by a MgO content lower than that of the starting

265G. Iezzi et al. / Chemical Geology 283 (2011) 261–273
andesitic composition, reflecting the crystallization of the clinopyrox-ene at temperaturesb900 °C (Tables 3a and3b; Fig. 6). The progressiveincrease of the crystal content with decreasing cooling rate andquenching temperature produces glasses characterized by lower CaOand Al2O3 and higher SiO2 and K2O amounts (Tables 3a and 3b; Fig. 7).
4. Discussion
4.1. Initial nucleation behavior
It has been frequently reported that variable superliquidus heattreatments and long experimental time durations above the liquidustemperature reduce the nucleation rate and increase the incubationtime of the first crystallizing phase (Tsuchiyama, 1983; Pupier et al.,2007; Hammer, 2008). These effects can be caused by (i) the kineticrearrangement of the melt structural configuration (short-rangeorder) during cooling as a function of superliquidus temperature(Hammer, 2008) and (ii) the presence of microscopic gas bubblesor solid-particles persisting above the liquidus temperature (DeBenedetti, 1995; Davies and Ihinger, 1998; Pupier et al., 2007). Thelatter explanation seems more convincing because relaxation kineticsof themelt is extremely rapid in time (frommilli- tomicro-seconds) atsuperliquidus temperatures (Richet, 2002; Webb, 2005; Dingwell,2006). Accordingly, high and/or prolonged superliquidus heat treat-ments affect successive nucleation events by reducing the amount ofbubbles and possible solid particles.
Basaltic and depolymerised melts nucleate more vigorously and ina shorter time with respect to more evolved and polymerised silicateliquids. The former are also more inclined to nucleate heterogeneous-ly on different foreign substrates, as demonstrated by the highnumber of crystals on the boundary of sample holders or aroundbubbles (Berkebile and Dowty, 1982; Tsuchiyama, 1983; Davis andIhinger, 1998; Pupier et al., 2007). Our experiments show no evidencefor preferential nucleation processes, because the crystals arehomogeneously distributed in the inner, intermediate, and outerportions of sample holders. Additionally, textures of the run-productsare the same for experiments duplicated under identical conditions orperformed by using different sample holders (Fig. 3).
The random occurrence of isolated crystal-rich patches sur-rounded by glass (Fig. 3) at the higher cooling rates (25, 12.5, and3 °C/min) and quenching temperature (1100 °C) indicate that crystalsstart to nucleate homogeneously. Thus, the first nucleation eventinside the andesitic melt is homogeneous and the solidification path(s) can be entirely ascribed to the intrinsic crystallization properties ofthe melt and to the applied cooling conditions (Tables 1a and 1b;Fig. 1). This initial homogeneous nucleation behavior is similar to thatobserved for anhydrous latitic and trachytic melts (Iezzi et al. 2008). Italso extends results from previous experimental studies on watersaturated silicic compositions (SiO2N70 wt.%) indicating the lack ofpreferential crystallization on gas bubbles or sample containers(Swanson, 1977; Fenn, 1977; Naney and Swanson, 1980; Couch,2003; Martel and Schmidt, 2003).
The work of critical cluster formation (Wc) in crystallizing systemsis expressed by (Schmelzer, 2003; Fokin et al., 2006):
Wchet = Wchom × φ ð1Þ
where the superscripts hom and het refer to homogeneous andheterogeneous, and φ is a parameter ranging from 0 to 1. Thisparameter accounts for the substratum chemistry, the composition ofthe melt, and the crystal-chemical similarity between the substratum(bubble and Pt) and the heterogeneous nuclei (Lofgren 1983; Lasaga
Fig. 2. Examples of image analysis performed on highly (left column) and poorly crystalline (variations for glass (blue) and plagioclase (red), phase segmentations after tuning contrastclinopyroxene and Fe–Ti oxide.
1997). On the basis of the above considerations, our results indicatethat φ is very close to 1 for bubble and Pt substrata for this andesiticmelt.
4.2. Crystallization of plagioclase
Textures of plagioclase from our experiments are similar to thosedescribed for basic melts solidified under experimental (Lofgren,1980, 1983; Dunbar et al., 1993, 1995; Burkhard, 2005a; Hammer,2006; Walton and Herd, 2007 and references therein) and natural(Phillpotts et al., 1998) conditions.
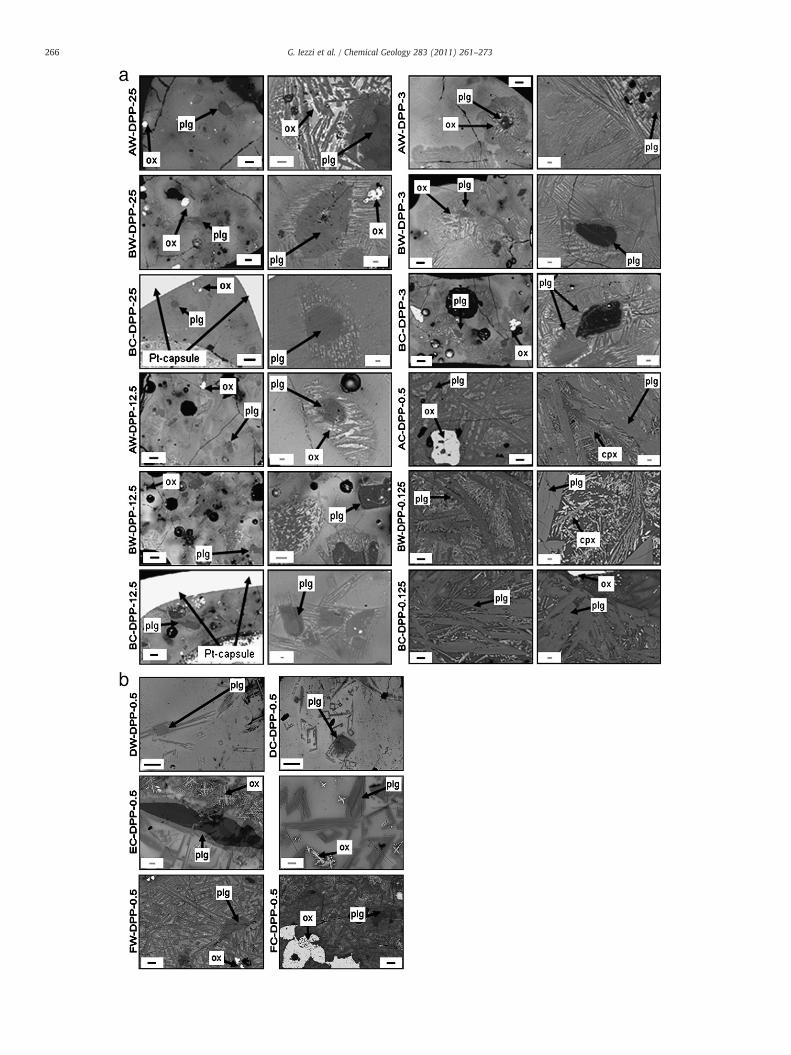
At higher cooling rates (≥3 °C/min) and quenching temperature of1100 °C, the initial nucleation event and successive growth ofplagioclase (and Fe–Ti oxide) are more easily observable becausethe crystallization is at an incipient stage (Figs. 3 and 7a,b,c,d). Thecrystallization sequence can be tracked as follows: (i) after thehomogeneous onset of nucleation, an additional single crystalnucleate and growth along the most energetically favored crystallo-graphic direction [100] (Kostov and Kostov, 1999; Deer et al., 2001),(ii) the next one heterogeneously grow normally to the pre-existingcrystal forming a L-shaped crystal network (Fig. 7a), (iii) U-,rectangular- and sieve-shaped plagioclase networks (Fig. 7a,b,c,d)result from successive and repeated heterogeneous growth events atstep (ii); (iv) large plagioclases grew by agglomeration mechanismsor by single crystal growth (Fig. 7c,d); and (v) finally, smaller andelongated plagioclase crystals preferentially nucleate and, in part,agglomerate on the rims of larger ones (Fig. 7c,d).
At the lower cooling rates (0.5 and 0.125 °C/min) and quenchingtemperatures (1000, 900 and 800 °C), the amount of crystals is high(Tables 1a and 1b). Plagioclases show evident agglomeration orcoalescence textures, as well as heterogeneous nucleation features.The more elongated crystals agglomerate preferentially parallel to the[100] crystallographic direction (the longest dimension) formingcontinuous and self-impinging large crystal networks (Fig. 7e,f). Asuccessive crystallization of tiny Fe–Ti oxides, clinopyroxenes, andplagioclases occurs within the residual melt among the largerplagioclases. Tiny crystals show dendritic textures and form crystalchains disposed along crystallographic directions (epitaxial growth)bridging the edges of larger plagioclases (Figs. 3 and 7e,f). Thisheterogeneous growthmechanism has been recently demonstrated tobe very common for silicate melts solidified in laboratory or for lavas(Hammer et al., 2010).
The plagioclase crystallization process has been quantified throughCSD analysis (Marsh, 1998; Higgins, 2000 and 2006; Zieg and Marsh,2002). CSD has been limited to plagioclase because of the low numberof measurable Fe–Ti oxides and small size of clinopyroxenes. CSDs ofplagioclase crystallized under variable cooling rates and quenchingtemperatures are reported in Fig. 8. For a crystal length b10 μm, theCSDs overlapwith the exception of the curve at 3 °C/min (Fig. 8). CSDshave different slopes at lengths between 10 and 40 μm (Fig. 8). At3 °C/min, the CSD curve displays three different almost log-linearslopes and a downturn at lengths b10 μm (Fig. 8). A similar evolutionis also shown by the CSD curve for the run-product quenched at1000 °C. At cooling rates of 0.5 and 0.125 °C/min and quenchingtemperature of 900 °C, CSDs show slopes with a high value for lengthsb10 μm and a low value for lengths N10 μm (Fig. 8).
In light of the CSD theory and as evidenced by plagioclase textures(Figs. 3a,b and 7), our results indicate that as both the cooling rate andquenching temperature decrease, the crystallization process progres-sively changes from a continuous growth of a single nucleus to a“crystal growth by coarsening”. As observed by CSD studies on naturalvolcanic rocks (e.g., Higgins, 2006; Hammer, 2008), the crystallization
right column) run-products. From top to bottom: untreated BSE-SEM images, gray leveland brightness, binary images for plagioclase and glass. Light gray levels correspond to

Table 2Representative An-rich composition of plagioclase.
Thermal range (°C) 1300-800 1300-800 1300-800 1300-800 1300-800 1300-1100 1300-1000 1300-900
Cooling rate (°C/min) 25 12.5 3 0.5 0.125 0.5 0.5 0.5
SiO2 (wt.%) 48.15 49.64 51.38 51.15 56.65 47.86 51.81 51.70Al2O3 (wt.%) 32.64 31.75 30.96 29.64 26.67 33.21 30.26 29.75Fe2O3 (wt.%) 0.62 0.73 0.58 0.48 0.39 0.49 0.37 0.51CaO (wt.%) 16.45 15.33 13.50 13.45 12.73 15.66 13.84 13.10Na2O (wt.%) 2.02 2.57 2.64 3.56 3.32 2.33 3.16 3.20K2O (wt.%) 0.14 0.26 0.27 0.55 0.74 0.14 0.25 0.60Total (wt.%) 99.62 99.84 99.75 99.58 100.26 99.49 99.87 99.32An (mol.%) 82.80 79.30 71.70 65.30 63.20 76.10 69.80 67.70Ab (mol.%) 16.4 19.30 26.60 32.60 33.20 23.10 28.70 30.40Or (mol.%) 0.80 1.40 1.70 2.10 3.50 0.60 1.50 1.80
Fig. 4. Variation in anorthite content of plagioclase as a function of experimentalconditions. The lines are guide for eye and pass through the representative compositionof plagioclase (see Table 2). The star symbols correspond to the equilibriumcomposition of plagioclase (see text).
Fig. 5. Oxide compositions (wt.%) of all experiments. The two ellipses enclosed theoxide crystals with a significant amount of Al and Mg found only in solidificationexperiments at 25 and 12.5 °C/min between 1300 and 800 °C and at 0.5 °C/minbetween 1300 and 1000 °C.
267G. Iezzi et al. / Chemical Geology 283 (2011) 261–273
is dominated by nucleation at the micrometric crystal size, whereas atlarger sizes, crystal growth processes prevail. Our CSD data show thatat conditions of cooling rate of 3 °C/min and quenching temperatureof 1000 °C (Fig. 8), the CSD peaks at ~10 μm; this supports Ostwaldripening for these two solidification conditions. The increasingpopulation density with decreasing cooling rate at crystal lengthsN10 μm, indicates that “crystal growth by coarsening” is operating(Fig. 8). Such a feature is consistent with ex-situ (Pupier et al., 2007)and in-situ (Schiavi et al., 2009) experimental observations on basalticmelts and with the textural observations on natural rocks (Higgins,1998, 2002; Higgins and Roberge, 2003). The crystal growth bycoarsening also agrees with a successive heterogeneous nucleation ofplagioclase after an initial homogeneous nucleation event. The rate ofcoarsening decreases with increasing cooling rate or quenchingtemperature (Fig. 8), as it is also indicated by plagioclase textures(Fig. 3).
The maximum crystal growth rate (Gmax) calculated as the ratiobetween the largest crystal size and time, shows that the growth ratedecreases as the experimental time increases. At 25, 3, and 0.125 °C/min, the largest crystal sizes are ~200, ~350, and ~500 μm,respectively. Assuming that the crystal growth starts at 1160 °C, i.e.the liquidus temperature computed by MELTS (Ghiorso and Sack,1995), the computed crystal growth rates are 2.1×10⁻⁵ (25 °C/min),4.9×10−6 (3 °C/min), and 3×10⁻⁷ cm/s (0.125 °C/min). These
Fig. 3. BSE-SEM images of the solidified DPP run-products obtained at five different coolinquenching temperatures (1100, 1000, 900 and 800 °C) at the fixed cooling rate of 0.5 °C/m
values resemble those calculated for plagioclase crystals grown inlaboratory (Lasaga, 1997; Pupier et al., 2007) and/or in naturalandesitic rocks (Stewart and Fowler, 2001). According to Zieg andMarsh (2002), the average growth rate (G) of a batch closed systemcan be calculated as:
G = 1 =m × t ð2Þ
where m is the slope of CSD and t is the time of cooling. For theestimate of m, we used the slopes of CSD that approach as much aspossible to a linear trend (Fig. 9). The calculated G values decreasefrom 2.4×10⁻⁶ to 5.7×10⁻⁷ to 6.4×10⁻⁸ cm/s with decreasingcooling rate from 25 to 3 to 0.125 °C/min, respectively. Consistently,the coarsening effect becomes more important at lower cooling rates.Finally, the larger plagioclases result from preferential agglomerationnormal to the [100] crystallographic direction being the largerplagioclases more equant than the smaller ones (see before).
4.3. Disequilibrium chemistry of plagioclase
An important outcome from our cooling experiments concerns thecomposition of plagioclase. Crystals are enriched in anorthite (Fig. 4)relative to the plagioclase composition (An55) computed at thethermodynamic equilibrium at 800 °C by MELTS (Ghiorso and Sack,
g rates (25, 12.5, 3, 0.5 and 0.125 °C/min) between 1300 and 800 °C (a), and variablein (b). The black bars are equal to 100 μm, whereas the gray bars are equal to 10 μm.

Table 3aAverage chemical composition of glass from variable cooling rates. The number reported in parentheses refers to the standard deviation. The iron is calculated all as ferric.
Cooling rate – 0.125 °C/min 0.5 °C/min 3 °C/min
Run label Starting material BC-DPP-0.125 AC-DPP-0.5 AW-DPP-3 BC-DPP-3 BW-DPP-3
Number of point analyses 19 13 14 15 16 15
SiO2 (wt.%) 58.52(0.70) 69.24(2.38) 72.69(1.75) 59.44(0.73) 60.23(1.42) 59.83(1.17)TiO2 (wt.%) 0.59(0.06) 0.94(0.07) 0.24(0.03) 0.61(0.07) 0.65(0.11) 0.72(0.10)Al2O3 (wt.%) 17.24(0.49) 15.20(1.20) 12.86(0.79) 16.15(0.07) 15.99(0.47) 15.32(0.60)Fe2O3 (wt.%) 7.67(0.35) 2.60(0.40) 2.73(0.73) 7.34(0.33) 7.48(0.84) 8.31(0.81)MnO (wt.%) 0.18(0.04) 0.07(0.05) 0.09(0.02) 0.14(0.04) 0.16(0.04) 0.17(0.04)MgO (wt.%) 4.14(0.17) 0.83(0.28) 1.40(0.35) 3.43(0.23) 4.01(0.70) 4.27(0.51)CaO (wt.%) 7.73(0.33) 4.59(0.79) 2.02(0.48) 6.99(0.27) 6.82(0.62) 7.08(0.39)Na2O (wt.%) 2.46(0.07) 2.56(0.25) 2.78(0.03) 2.75(0.08) 2.26(0.22) 2.24(0.15)K2O (wt.%) 1.97(0.10) 3.55(0.63) 4.73(0.24) 2.21(0.12) 2.42(0.43) 2.41(0.35)P2O5 (wt.%) 0.15(0.02) 0.21(0.07) 0.04(0.03) 0.21(0.10) 0.22(0.15) 0.17(0.04)Total (wt.%) 100.64(0.66) 99.79(0.76) 99.62(0.25) 99.36(0.47) 100.24(0.43) 100.52(0.53)
Cooling rate 12.5 °C/min 25 °C/min
Run label AW-DPP-12.5 BW-DPP-12.5 BC-DPP-12.5 AW-DPP-25 BC-DPP-25 BW-DPP-25
Number of point analyses 13 11 12 15 15 15
SiO2 (wt.%) 59.38(1.18) 58.01(0.82) 58.26(1.08) 59.65(1.78) 59.49(0.83) 58.62(1.89)TiO2 (wt.%) 0.64(0.11) 0.65(0.06) 0.59(0.05) 0.60(0.17) 0.60(0.10) 0.59(0.16)Al2O3 (wt.%) 16.19(0.66) 15.43(0.88) 15.35(1.06) 16.22(0.65) 16.09(0.56) 15.58(0.98)Fe2O3 (wt.%) 7.51(0.50) 8.37(1.02) 8.13(0.79) 7.64(1.21) 7.63(0.76) 7.81(1.18)MnO (wt.%) 0.16(0.04) 0.18(0.04) 0.17(0.04) 0.15(0.04) 0.16(0.04) 0.16(0.03)MgO (wt.%) 3.89(0.40) 4.61(0.88) 4.61(0.80) 3.87(0.42) 3.98(0.37) 4.21(1.15)CaO (wt.%) 6.85(0.54) 7.38(0.65) 7.24(0.82) 6.77(0.42) 6.79(0.32) 7.39(0.73)Na2O (wt.%) 2.57(0.13) 2.46(0.22) 2.53(0.24) 2.66(0.15) 2.61(0.16) 2.86(0.33)K2O (wt.%) 2.07(0.20) 2.05(0.22) 2.10(0.27) 2.09(0.20) 2.04(0.13) 1.82(0.32)P2O5 (wt.%) 0.18(0.04) 0.19(0.08) 0.19(0.13) 0.20(0.08) 0.16(0.03) 0.21(0.05)Total (wt.%) 99.43(0.29) 99.37(0.48) 99.19(0.48) 99.86(0.38) 99.56(0.41) 99.27(0.51)
Table 3bAverage chemical composition of glass solidified with a cooling rate of 0.5 °C/min and variable quenching temperatures. The number reported in parentheses refers to the standarddeviation. The iron is calculated all as ferric.
Thermal range 1300–1100 °C 1300–1100 °C 1300–1000 °C 1300–900 °C 1300–900 °C 1300–800 °C
Run label DW-DPP-0.5 DC-DPP-0.5 EC-DPP-0.5 FC-DPP-0.5 FW-DPP-0.5 AC-DPP-0.5
Number of point analyses 10 8 8 13 11 14
SiO2 (wt.%) 60.21(0.72) 60.14(0.60) 61.16(1.92) 62.02(0.99) 62.56(0.96) 72.69(1.75)TiO2 (wt.%) 0.60(0.05) 0.54(0.07) 0.72(0.17) 0.80(0.19) 0.64(0.09) 0.24(0.03)Al2O3 (wt.%) 16.20(0.31) 16.46(0.24) 14.08(1.70) 13.39(2.47) 12.76(0.99) 12.86(0.79)Fe2O3 (wt.%) 7.16(0.28) 6.74(0.33) 7.32(1.17) 7.05(1.83) 8.58(0.82) 2.73(0.73)MnO (wt.%) 0.16(0.04) 0.15(0.03) 0.20(0.04) 0.24(0.01) 0.24(0.05) 0.09(0.02)MgO (wt.%) 3.85(0.32) 3.74(0.17) 4.96(1.09) 5.29(0.41) 5.63(0.46) 1.40(0.35)CaO (wt.%) 6.52(0.32) 6.43(0.07) 5.55(0.45) 5.57(0.38) 4.42(0.21) 2.02(0.48)Na2O (wt.%) 2.86(0.07) 2.71(0.10) 2.33(0.25) 1.95(0.23) 2.38(0.13) 2.78(0.03)K2O (wt.%) 2.25(0.12) 2.38(0.06) 2.81(0.40) 2.64(0.15) 2.81(0.15) 4.73(0.24)P2O5 (wt.%) 0.19(0.04) 0.19(0.03) 0.18(0.05) 0.24(0.07) 0.23(0.06) 0.04(0.03)Total (wt.%) 100.02(0.59) 99.46(0.45) 99.32(0.82) 99.18(0.49) 100.24(0.40) 99.62(0.25)
268 G. Iezzi et al. / Chemical Geology 283 (2011) 261–273
1995). The average crystal compositions progressively depart fromthat of equilibrium as the cooling rate increases or the quenchingtemperature decreases (Fig. 4). However, plagioclases analyzed at3 °C/min show two compositionally distinct populations (An85 andAn65) that resemble thosemeasured at higher and lower cooling rates.This feature highlights that An-rich crystals are the first to nucleatefrom the melt. As a consequence of their formation, Na and Siconcentrations increase into the melt leading to the formation ofrelatively An-poor plagioclases.
The kinetic effects of cooling on crystal compositions have beenscarcely experimentally investigated (Mollo et al., 2010 and 2011 andreferences therein). In general, metastable nucleating crystals have alower energetic barrier to overcome and a relative shorter inductiontime when compared to the thermodynamically stable phases (Kirkpa-
Fig. 6. Chemical composition of glasses obtained at five different cooling rates (25, 12.5, 3temperatures (1100, 1000, 900 and 800 °C) at the fixed cooling rate of 0.5 °C/min (right pa
trick, 1983; Lasaga, 1997). The kinetic control on the formation ofmetastable crystals is predicted qualitatively by the Ostwald step rule(Zhang, 2008). In silicate crystals and liquids, the energetic barrier ofnucleation roughly scales with the number of IVSi–O and to a lesserextent of IVAl–O bonds, i.e. degree of polymerization and average bondstrength. As a consequence, Si–O rich crystals can appear delayed withrespect to the Si–O poor ones, also for the same NBO/T (Naney andSwanson, 1980; Kirkpatrick, 1983; Sunagawa, 1992; Iezzi et al., 2008;Mollo et al., 2011). Since An-rich plagioclases contain less Si, they arefavored to nucleate although all feldspars have tetrahedral frameworkstructures. Metastable nucleation and/or heterogeneous (disequilibri-um) composition are facilitated with increasing cooling rate accordingto a progressive and differential reduction of ionic mobility as the glasstransition region is approached (Roskoszet al., 2005, 2006;Villeneuveet
, 0.5 and 0.125 °C/min) between 1300 and 800 °C (left panel), and variable quenchingnel). Star symbols refer to the starting melt composition.

Fig. 7. BSE-SEM images (a, b, c and d) of run-products with a low crystal content, i.e. DW-DPP-0.5, AW-DPP-25, BC-DPP-25 and AW-DPP-12.5 (scale bars are 10 μm). BSE-SEM images(e and f) of run-products with a high crystal content, i.e. BW-DPP-0.125 and FW-DPP-0.5 (scale bars are 100 μm).
270 G. Iezzi et al. / Chemical Geology 283 (2011) 261–273
al., 2008). Moreover, depolymerized melts favor a more efficientchemical transport of cations and, consequently, a shorter time forcrystals to re-equilibrate with the melt (Dingwell, 2006). Notably, bycomparing the crystallization behavior of andesitic (this study) andlatiticmelts (Iezzi et al., 2008) cooled at the same conditions (i.e., 0.5 and0.125 °C/min) we observe that (i) the plagioclase composition isapproaching that of equilibrium at 800 °C for the andesite, whereasthis donot occur for the latite, and that (ii) the clinopyroxene format theendof crystallization from the andesiticmelt, in contrast it oversteps theplagioclase formation in the latite. Therefore, the chemical disequilib-rium and metastable nucleation mostly affect silicic melts rather thanmafic ones (Naney and Swanson, 1980; Kirkpatrick, 1983; Sharp et al.,1996; Iezzi et al., 2008).
It isworthnothing that the increasingAn-content inplagioclase havebeen addressed to the effect of cooling rate by previous experimental(Kirkpatrick, 1983; Iezzi et al., 2008; Mollo et al., 2011) and natural(Chistyakova and Latypov, 2009) studies. Additionally, our experimentsevidence that also An-poor plagioclases are characterized by disequi-
librium textures. They crystallize from residual pools of silicic meltssurrounded by An-rich crystal networks. An-poor plagioclases have lowabundances, mostly at higher cooling rates. Textural observations alsoindicate that they are partially dissolved if not surrounded by a furtherheterogeneous nucleation of An-rich plagioclases (Fig. 10).
The effect of cooling rate produces disequilibrium compositionsalso for Fe–Ti oxides (Fig. 5). Some oxide crystals with significantamount of Al andMg contents are observed for the two higher coolingrates or at 0.5 °C/min quenched at 1100 °C. This compositionalvariation due to rapid cooling rates has been observed for basaltssolidified in laboratory (Villeneuve et al., 2008) and in naturalconditions (Zhou et al., 2000).
4.4. Glass forming ability of the andesitic melt
The glass-forming ability (GFA) represents the ability of a silicatemelt to persist in a metastable liquid state (or not) at sub-liquidusconditions during cooling (Fokin et al., 2003, 2006; Fan et al., 2007).

Fig. 10. BSE-SEM images of BW-DPP-12.5 (top panel) and DW-DPP-0.5 (bottom panel)run-products, cooled at 12.5 and 0.5 °C/min and quenched at 800 and 1100 °C,respectively. They show different textural and chemical features of coexistingplagioclases with An-rich and An-poor compositions. Scale bars are 100 μm (toppanel) and 10 μm (bottom panel).
Fig. 8. CSD curves of plagioclase from experiments performed at variable cooling rate(top panel) and quenching temperature (bottom panel). The two inserts highlight theCSD plots between 0 and 90 μm.
271G. Iezzi et al. / Chemical Geology 283 (2011) 261–273
The GFA is measured through the critical cooling rate (Rc) which is theminimumvalue at which a liquid can be frozen to a solid glass withoutforming crystals (Fan et al., 2007; Iezzi et al., 2009). The dependenceof the GFA on melt composition is shown in Fig. 11, where the crystalcontents of andesitic (this study), latitic, and trachytic (Iezzi et al.,2008) melts are plotted as a function of the cooling rate andquenching temperature. The andesite crystallizes in a significantshorter time and lower undercooling degree relative to latite andtrachyte. This compositional feature is better represented by the
Fig. 9. CSD of plagioclase crystals and regression lines for the log-linear part of the CSDplots from experiments performed at 25, 3 and 0.125 °C/min. The crystal length rangesand the regression equations are also reported in brackets. The slope (m in Eq. (2)) ofthe fits are used to calculate the average crystal growth rate (G).
reduced glass transition parameter (Trg) which is the ratio betweenthe glass transition temperature (Tg) at a viscosity of 1012 Pa s and themelting temperature (Tm) (Fokin et al., 2003; Fan et al., 2007; Iezziet al., 2009). Notably, glass-forming liquids (silicates, metals, poly-mers, etc.) are significantly affected by variation in Trg and fragility(m); this latter is a measure of the sensitivity of a melt viscosity todeviate from an Arrhenian behavior (Giordano and Dingwell, 2003).On one hand, a lower Trg implies higher nucleation rate (I), a lowerincubation time (τ), and a higher crystal growth (G) at the maximumof nucleation (Fokin et al., 2003, 2005). On the second hand, a lowerTrg and higherm determine higher critical cooling rate and lower GFA(Fan et al., 2007). These relationships constrain the higher facility,intensity, and rapidity of mafic melts to crystallize relative to silicicones (Iezzi et al., 2009).
In Fig. 11, the linear fit between the crystal content and coolingrate of 25, 12.5, and 3 °C/min indicates that the Rc is ~37 °C/min forthe andesite. Iezzi et al. (2008) found that the Rc is b0.125 and ~1 °C/min for the trachyte and latite, respectively. These significant changes,induced by a restricted bulk composition variation, agree with thelogarithmic relationship between Rc and Trg (Iezzi et al., 2009). Thisdemonstrates that little changes in chemical composition are able tosignificantly shift the initial nucleation behavior of silicate liquids andthe following solidification paths.
4.5. Volcanological and petrological implications
Tsuchiyama (1983) demonstrated that textural and compositionalfeatures of natural melts are comparable with those reproduced in

0 10 20 30 400
10
20
30
40
37 ̊ C/min
cooling rate (˚C/min)
0 5 10 15 20 25
crys
tal c
onte
nt (
vol.
%)
0
10
20
30
40
50
60
70
80
90
100
solidification range (˚C)
800 900 1000 1100 1200 1300
0
10
20
30
40
50
60
70
80
90
100
andesite (this study)latite (Iezzi et al., 2008)trachyte (Iezzi et al., 2008)
Fig. 11. Plots of cooling rate vs crystal content (left panel) and quenching temperature vs crystal content (right panel). Data for latite and trachyte are from Iezzi et al. (2008). Theinsert (left panel) shows the linear fit (dotted line) of data from cooling experiments at 3, 12.5 and 25 °C/min; the critical cooling rate calculated for the andesite is ~37 °C/min.
272 G. Iezzi et al. / Chemical Geology 283 (2011) 261–273
laboratory at high superheating conditions. However, the spatialrelevance of cooling rates used in laboratory must be consideredwhen comparing experimental and natural systems. Several studies(Dunbar et al., 1995; Neri, 1998; Xu and Zhang, 2002; Burkhard,2005a; Harris et al., 2005) evidenced that cooling rates decrease fromtens to fractions of °C/min moving from the outermost (fewdecimetres) portions of dikes and lavas towards their innermost(few meters) parts. Therefore, cooling conditions used in ourexperiments are relevant for cooling conditions of natural silicatemelts with thickness of several meters. Textural and chemical featuresof our experiments are similar to those observed in aphyric and thinlava flows (Tamura et al., 2003; Mattioli et al., 2006) characterized by(i) glass and crystal compositions showing a large chemicalvariability, (ii) Al-, Mg-rich oxides, and (iii) An-rich plagioclasescoexisting with silicic residual melts.
Chistyakova and Latypov (2009) studied mafic nearly aphyricdikes and found that centimeter- to meter-sized dikes show, onaverage, An-rich plagioclases at the outer margins, where the coolingrate is higher; conversely, An-poor crystals occur in the inner andcentral parts of dikes, where slower cooling rates develop, inagreement with our experiments.
The andesitic lavas and dikes sampled in the Tonga arc andreported in Hekinian et al. (2008) represent the most pertinentcomparison with our experimental conclusions, since these rockswere emplaced in sub-marine environments where they rapidlycooled. These andesitic rocks have thickness variable from dm to fewmeters. The plagioclase crystals in the groundmass of these lavas havecompositions An65–85, which perfectly overlap the chemical variabil-ity observed in Fig. 4 at variable cooling rates.
It is worth noting that disequilibrium features and time–temperature–spatial scales of our experiments indicate that extremecare should be adopted during the sampling of andesitic rocks forpetrological and geochemical investigations. The occurrence of a widerange of textural and chemical features in the collected samples couldbe interpreted as a result of open magmatic systems (e.g. magmamixing) instead of crystallization under high cooling conditions.Therefore, the analysis of different portions of andesitic lavas or dikesis of fundamental importance to discriminate crystallization processesoccurred in magmatic reservoirs from those developed at subaerial orsubmarine conditions.
Finally, the crystal content of our run-products shows a suddenincrease from 13 to 72 vol.% with decreasing cooling rate from 3 to
0.5 °C/min, respectively (Tables 1a and 1b; Fig. 11). This implies thatthe viscosity of an andesitic magma will be strongly controlled by itscrystal content for cooling rates b3 °C/min. Furthermore, the crystalgrowth rates calculated from our experiments indicate that largecrystals of plagioclase may not form only in intratelluric conditions.The impingement between these crystals will result in the attainmentof the critical crystal fraction (Kerr and Lister, 1991; Costa, 2005) attemperatures between 1100 and 1000 °C (Tables 1a and 1b; Fig. 3b).Therefore, the rheology of andesitic magmas is largely controlled bythe cooling experienced during their emplacement (see also DelGaudio et al., 2010).
Acknowledgements
We are very grateful to the anonymous reviewers and C. Martel fortheir revisions and suggestions; D. Dingwell is warmly acknowledgedfor his editorial handling. We are also very grateful to Prof. D. Dolfi forallowing us to use experimental petrology facilities at the Universitàdegli Studi Roma Tre (Roma). This study has been supported byseveral institutions and programs: (a) Università G. d'Annunzio —
“Fondi Ateneo” to G. Iezzi, (b) Dipartimento della Protezione Civile —
INGV in the frame of the 2004–2006 project to G. Iezzi, and (c) theFIRB — MIUR “Sviluppo Nuove Tecnologie per la Protezione e Difesadel Territorio dai Rischi Naturali” to P. Scarlato, A. Cavallo, and S.Mollo.
References
Berkebile, C.A., Dowty, E., 1982. Nucleation in laboratory charges of basalticcomposition. American Mineralogist 67, 886–899.
Burgisser, A., Scaillet, B., 2007. Redox evolution of a degassing magma rising to thesurface. Nature 445, 194–197.
Burkhard, D.J.M., 2005a. Nucleation and growth rates of pyroxene, plagioclase, and Fe–Ti oxides in basalt under atmospheric conditions. European Journal of Mineralogy17, 675–685.
Burkhard, D.J.M., 2005b. Crystallization and oxidation during emplacement of lavalobes: In: Manga, M., Ventura, G. (Eds.), Geological Society of America, SpecialPaper, 396, pp. 67–80.
Cashman, K.V., 1991. Textural constraints on the kinetics of crystallization of igneousrocks: In: Nicholls, J., Russell, J.K. (Eds.), Reviews in Mineralogy, 24, pp. 259–309.
Castro, J.M., Beck, P., Tuffen, H., Nichols, A.R.L., Dingwell, D.B., Martin, M.C., 2008.Timescales of spherulite crystallization in obsidian inferred from water concen-tration profiles. American Mineralogist 93, 1816–1822.
Chistyakova, S., Latypov, R., 2009. On the development of internal chemical zonation insmall mafic dikes. Geological Magazine 147, 1–12.
273G. Iezzi et al. / Chemical Geology 283 (2011) 261–273
Conte, A., Perinelli, C., Trigila, R., 2006. Cooling kinetics experiments on differentStromboli lavas: effects on crystal morphologies and phase composition. Journal ofVolcanology and Geothermal Research 155, 179–200.
Costa, A., 2005. Viscosity of high crystal content melts: dependence on solid fraction.Geophysical Research Letters 32 (22), 1–5.
Couch, S., 2003. Experimental investigation of crystallization kinetics in a haplogranitesystem. American Mineralogist 10, 1471–1485.
Davis, M.J., Ihinger, P.D., 1998. Heterogeneous crystal nucleation on bubbles in silicatemelts. American Mineralogist 83, 1008–1015.
De Benedetti, P.G., 1995. Metastable Liquids, Concepts and Principles. PrincetonUniversity Press, Princeton, NY.
Deer, W.A., Howie, R.A., Zussman, J., 2001. Framework Silicates: FeldsparsSecondEdition. The Geological Society, London.
Del Gaudio, P., Mollo, S., Ventura, G., Iezzi, G., Taddeucci, J., Cavallo, A., 2010. Coolingrate-induced differentiation in anhydrous and hydrous basalts at 500 MPa:implications for the storage and transport of magmas in dikes. Chemical Geology270, 164–178.
Dingwell, D.B., 2006. Transport properties of magmas: diffusion and rheology. Elements2, 281–286.
Dowty, E., 1980. In: Hargraves, R.B. (Ed.), Crystal Growth and Nucleation Theory andthe Numerical Simulation of Igneous Crystallisation. Princeton University Press,pp. 419–485.
Dunbar, N.W., Riciputi, L.R., Jacobs, G.K., Naney, M.T., Christie, W., 1993. Generation ofrhyolitic melt in an artificial magama: implications for fractional crystallizationprocesses in natural magmas. Journal of Volcanology and Geothermal Research 57,157–166.
Dunbar, N.W., Jacobs, G.K., Naney, M.T., 1995. Crystallization processes in an artificialmagma: variations in crystal shape, growth rate and composition with melt coolinghistory. Contribution to Mineralogy and Petrology 120, 412–425.
Fan, G.J., Choo, H., Liaw, P.K., 2007. A new criterion for the glass-forming ability ofliquidus. Journal of Non-Crystalline Solids 353, 102–107.
Fenn, P.M., 1977. The nucleation and growth of alkali feldspars from hydrous melts. TheCanadian Mineralogist 15, 135–161.
Fokin, V.M., Zanotto, E.D., Schmelzer, J.W.P., 2003. Homogeneous nucleation versusglass transition temperature of silicate glasses. Journal of Non-Crystalline Solids321, 52–65.
Fokin, V.M., Nascimento, M.L.F., Zanotto, E.D., 2005. Correlation between maximumcrystal growth rate and glass transition temperature of silicate glasses. Journal ofNon-Crystalline Solids 351, 789–794.
Fokin, V.M., Zanotto, E.D., Yuritsyn, N.S., Schmelzer, J.W.P., 2006. Homogeneous crystalnucleation in silicate glasses: a 40 years perspective. Journal of Non-CrystallineSolids 352, 2681–2714.
Ghiorso, M.S., Sack, R.O., 1995. Chemical mass-transfer in magmatic processes 4. Arevised and internally consistent thermodynamic model for the interpolation andextrapolation of liquidus-solid equilbria in magmatic systems at elevatedtemperatures and pressures. Contribution to Mineralogy and Petrology 119,197–212.
Giordano, D., Dingwell, D.B., 2003. The kinetic fragility of natural silicate melts. Journalof Physics: Condensed Matter 15, S945–S954.
Hammer, J.E., 2004. Crystal nucleation in hydrous rhyolite: experimental data appliedto classical theory. American Mineralogist 89, 1673–1679.
Hammer, J.E., 2006. Influence of fO2 and cooling rate on the kinetics and energetics ofFe-rich basalt crystallization. Earth and Planetary Science Letters 248, 618–637.
Hammer, J.E., 2008. Experimental studies of the kinetics and energetics of magmacrystallization: In: Putirka, K.D., Tepley, F.J. (Eds.), Reviews in Mineralogy, 69, pp.9–59.
Hammer, J.E., Sharp, T.G., Wessel, P., 2010. Heterogeneous nucleation and epitaxialcrystal growth of magmatic minerals. Geology 38, 367–370.
Harris, A.J.L., Bailey, J., Calvari, S., Dehn, J., 2005. Heat loss measured at a lava channeland its implications for down-channel cooling and rheology: In: Manga, M.,Ventura, G. (Eds.), Geological Society of America, Special Paper, 396, pp. 125–146.
Hekinian, R., Mühe, R., Worthington, T.J., Stoffers, P., 2008. Geology of a submarinevolcanic caldera in the Tonga Arc: dive results. Journal of Volcanology andGeothermal Research 176, 571–582.
Higgins, M.D., 1998. Origin of anorthosite by textural coarsening: quantitativemeasurements of a natural sequence of textural development. Journal of Petrology39, 1307–1323.
Higgins, M.D., 2000. Measurement of crystal size distributions. American Mineralogist85, 1105–1116.
Higgins, M.D., 2002. A crystal size-distribution study of the Kiglapait layered maficintrusion, Labrador, Canada: evidence for textural coarsening. Contribution toMineralogy and Petrology 144, 314–330.
Higgins, M.D., 2006. Quantitative Textural Measurements in Igneous and MetamorphicPetrology. Cambridge University Press, Cambridge.
Higgins, M.D., Roberge, J., 2003. Crystal size distribution of plagioclase and amphibolefrom Soufrière Hills Volcano, Montserrat: evidence for dynamic crystallization-textural coarsening cycles. Journal of Petrology 44, 1401–1411.
Iezzi, G., Mollo, S., Ventura, G., Cavallo, A., Romano, C., 2008. Experimental solidificationof anhydrous latitic and trachytic melts at different cooling rates: the role ofnucleation kinetics. Chemical Geology 253, 91–101.
Iezzi, G., Mollo, S., Ventura, G., 2009. Solidification behaviour of natural silicate meltsand volcanological implications. In: Lewis, N., Moretti, A. (Eds.), Volcanoes:Formation, Eruptions and Modelling. Nova publishers, New York, pp. 127–151.
Kerr, R.C., Lister, J.R., 1991. The effects of shape on crystal settling and on the rheology ofmagmas. Journal of Geology 99, 457–467.
Kirkpatrick, R.J., 1981. Kinetics of crystallization of igneous rocks: In: Lasaga, A.C.,Kirkpatrick, R.J. (Eds.), Reviews in Mineralogy, 8, pp. 321–395.
Kirkpatrick, R.J., 1983. Theory of nucleation in silicate melts. American Mineralogist 68,66–77.
Kostov, I., Kostov, R.I., 1999. Crystal Habits of Minerals. Bulgarian AcademicMonographs, Sophia.
Lasaga, A.C., 1997. Kinetic Theory in the Earth Sciences. Princeton University Press,Princeton, NY.
Lofgren, G., 1980. In: Hargraves, R.B. (Ed.), Experimental Studies on the DynamicCrystallisation of Silicate Melts. Princeton University Press, Princeton, pp. 487–565.
Lofgren, G., 1983. Effect of heterogeneous nucleation on basaltic textures: a dynamiccrystallization study. Journal of Petrology 24, 229–255.
Marsh, B.D., 1998. On the interpretation of crystal size distributions in magmaticsystems. Journal of Petrology 39, 553–599.
Martel, C., Schmidt, B., 2003. Decompression experiments as an insight into ascent ratesof silicic magmas. Contribution to Mineralogy and Petrology 144, 397–415.
Mattioli, M., Renzulli, A., Menna, M., Holm, P.M., 2006. Rapid ascent and contaminationof magmas through the thick crust of the CVZ (Andes, Ollague region): evidencefrom a nearly aphyric high-K andesite with skeletal olivines. Journal of Volcanologyand Geothermal Research 158, 87–105.
Mollo, S., Del Gaudio, P., Ventura, G., Iezzi, G., Scarlato, P., 2010. Dependence ofclinopyroxene composition on cooling rate in basaltic magmas: implications forthermobarometry. Lithos 118, 302–312.
Mollo, S., Putirka, K., Iezzi, G., Del Gaudio, P., Scarlato, P., 2011. Plagioclase-melt (dis)equilibrium due to cooling dynamics: implications for thermometry, barometryand hygrometry. Lithos. doi:10.1016/j.lithos.2011.02.008.
Naney, M.T., Swanson, S.E., 1980. The effect of Fe and Mg on crystallization in graniticsystems. American Mineralogist 65, 639–653.
Neri, A., 1998. A local heat transfer analysis of lava cooling in the atmosphere:application to thermal diffusion-dominated lava flows. Journal of Volcanology andGeothermal Research 81, 215–243.
Phillpotts, A.R., Shi, J., Brustman, C., 1998. Role of plagioclase crystal chains in thedifferentiation of partly crystallised magma. Nature 395, 343–346.
Pupier, E., Duchene, S., Toplis, M.J., 2007. Experimental quantification of plagioclasecrystal size distribution during cooling of a basaltic liquid. Contribution toMineralogy and Petrology 155, 555–570.
Richet, P., 2002. Enthalpy, volume and structural relaxation in glass-forming silicatemelts. Journal of Thermal Analysis and Calorimetry 69, 739–750.
Roskosz, M., Toplis, M.J., Besson, P., Richet, P., 2005. Nucleation mechanisms: a crystalchemical investigation of phases forming in highly supercooled aluminosilicateliquids. Journal of Non-Crystalline Solids 351, 1266–1282.
Roskosz, M., Toplis, M.J., Richet, P., 2006. Kinetic vs. thermodynamic control ofnucleation and growth in molten silicates. J Non-Cryst Solids 352, 180–184.
Schiavi, F., Walte, N., Keppler, H., 2009. First in-situ observation of the crystallizationprocesses in a basaltic–andesitic melt with the moissanite cell. Geology 37,963–966.
Schmelzer, J.W.P., 2003. Kinetic and thermodynamic theories of nucleation. MaterialsPhysics and Mechanics 6, 21–33.
Sharp, T.G., Stevenson, R.J., Dingwell, D.B., 1996. Microlites and “nanolites” in rhyoliticglass: microstructural and chemical characterisation. Bulletin of Volcanology 57,631–640.
Stewart, M.L., Fowler, A.D., 2001. The nature and occurrence of discrete zoning inplagioclase from recently erupted andesitic volcanic rocks, Montserrat. Journal ofVolcanology and Geothermal Research 106, 243–253.
Sunagawa, I., 1992. In situ investigation of nucleation, growth, and dissolution ofsilicate crystals at high temperatures. Annual Review of Earth and PlanetarySciences 20, 113–142.
Swanson, S.E., 1977. Relation of nucleation and crystal-growth rate to the developmentof granitic textures. American Mineralogist 62, 966–977.
Tamura, Y., Yuhara, M., Ishii, T., Irino, N., Shukuno, H., 2003. Andesites and dacites fromDaisen Volcano, Japan: partial-to-total remelting of an andesite magma body.Journal of Petrology 12, 2243–2260.
Tsuchiyama, A., 1983. Crystallization kinetics in the system CaMgSi2O6–CaAl2Si2O8: thedelay in nucleation of diopside and anorthite. American Mineralogist 68, 687–698.
Villeneuve, N., Neuville, D.R., Boivin, P., Bachèlery, P., Richet, P., 2008. Magmacrystallization and viscosity: a study of molten basalts from the Piton de laFournaise volcano (La Réunion island). Chemical Geology 256, 241–250.
Walton, E.L., Herd, C.D.K., 2007. Dynamic crystallization of shock melts in Allan hills77005: implications for melt pocket formation in Martian meteorites. Geochimicaet Cosmochimica Acta 71, 5267–5285.
Webb, S.L., 2005. Silicate melts at extreme conditions: In: Miletich, R. (Ed.), EMU Notesin Mineralogy, 7, pp. 64–95.
Xu, Z., Zhang, Y., 2002. Quench rates in water, air and liquid nitrogen and inference oftemperature in volcanic eruption columns. Earth and Planetary Science Letters 200,315–330.
Zhang, Y., 2008. Geochemical Kinetic. Princeton University Press, Princeton, NY.Zhou, W., Van der Voo, R., Peacor, D.R., Zhang, Y., 2000. Variable Ti-content and grain
size of titanomagnetite as a function of cooling rate in very young MORB. Earth andPlanetary Science Letters 179, 9–20.
Zieg, M.J., Marsh, B.D., 2002. Crystal size distribution and scaling laws in thequantification of igneous textures. Journal of Petrology 43, 85–101.