Real time observation of dendritic solidification in alloys by ...
Upload
independentCategory
view
3download
0
08/15/03
Page 1
In-Situ Observations of Phase Transformations in the Fusion Zone of Ti-6Al-4V Alloy Transient Welds Using Synchrotron Radiation
by:
J. W. Elmer1, T. A. Palmer1, S. S. Babu2, W. Zhang3 and T. DebRoy3
1 Lawrence Livermore National Laboratory, Livermore, CA, 94551, USA
2 Oak Ridge National Laboratory, Oak Ridge, TN, 37831, USA 3 The Pennsylvania State University, University Park, PA, 16802, USA
Abstract Direct observations of fusion zone (FZ) phase transformations were made during gas
tungsten arc (GTA) spot welding of a Ti-6Al-4V alloy using a Time Resolved X-Ray Diffraction
(TRXRD) technique. These in-situ x-ray diffraction experiments were performed at the Stanford
Synchrotron Radiation Laboratory (SSRL) using a 540 µm diameter x-ray beam with 100ms
time resolution to track microstructure evolution in real time. With this technique, changes in
crystal structure were observed during rapid weld heating and cooling as the alloy underwent an
α →β→L→β →α´ phase transformation sequence. The direct observations of the phase
transformation sequences were further coupled with thermodynamic calculations of phase
equilibria and numerical modeling of the weld temperatures. The resulting information shows
that significant superheating is required above the β transus temperature to complete the α→β
transformation on heating, and that the back transformation of β on cooling initiates below the
Ms temperature to produce α´ martensite. Results such as these can be used to aid in the
development of numerical models for predicting weld microstructures and, ultimately, weld
behavior.
08/15/03
Page 2
Introduction
Ti-6Al-4V is a titanium alloy that can be thermo-mechanically treated to produce a
desired amount of equiaxed α and intergranular β with a fine grain size for optimum mechanical
properties [1-3]. However during welding, microstructural changes such as annealing,
recrystallization, and phase transformation to high temperature β phase alter the grain size, phase
ratios and microstructural morphologies in the weld region [4]. The degree to which the
microstructure is altered depends on the weld thermal cycle, which is a function of the weld
location, and the kinetics of the various phase transformations that are taking place. Although
the weld thermal cycles can be calculated with a high degree of confidence, the phase
transformation kinetics are rarely known under actual welding conditions.
Time Resolved X-Ray Diffraction (TRXRD) is used here to directly observe phase
transformations in FZ of Ti-6Al-4V during welding. These data reveal kinetic details about the
microstructural evolution taking place in the weld metal under actual welding temperature
gradients that can not be obtained by other methods. A coupled thermal-fluids model was used
to calculate the weld temperature as a function of time, and computational thermodynamic
software was used to determine equilibrium phase fractions and individual phase compositions as
a function of temperature.
Differences between the measured phase transformation temperatures and those predicted
by thermodynamic equilibrium provided key information about the kinetics of transformations in
Ti-6Al-4V. Of particular interest are the mechanisms for the α →β transformation on heating
and the β →α transformation on cooling under the high heating and cooling rates of welds, and
the role of nucleation in these transformations.

08/15/03
Page 3
Experimental Procedures
Materials and Welding
Ti-6Al-4V ELI (extra low interstitial) was acquired in a 114 mm diameter bar, and
machined to a diameter of 100 mm in preparation for the TRXRD experiments. Chemical
analysis was performed on this material show the following concentration (by wt. percent):
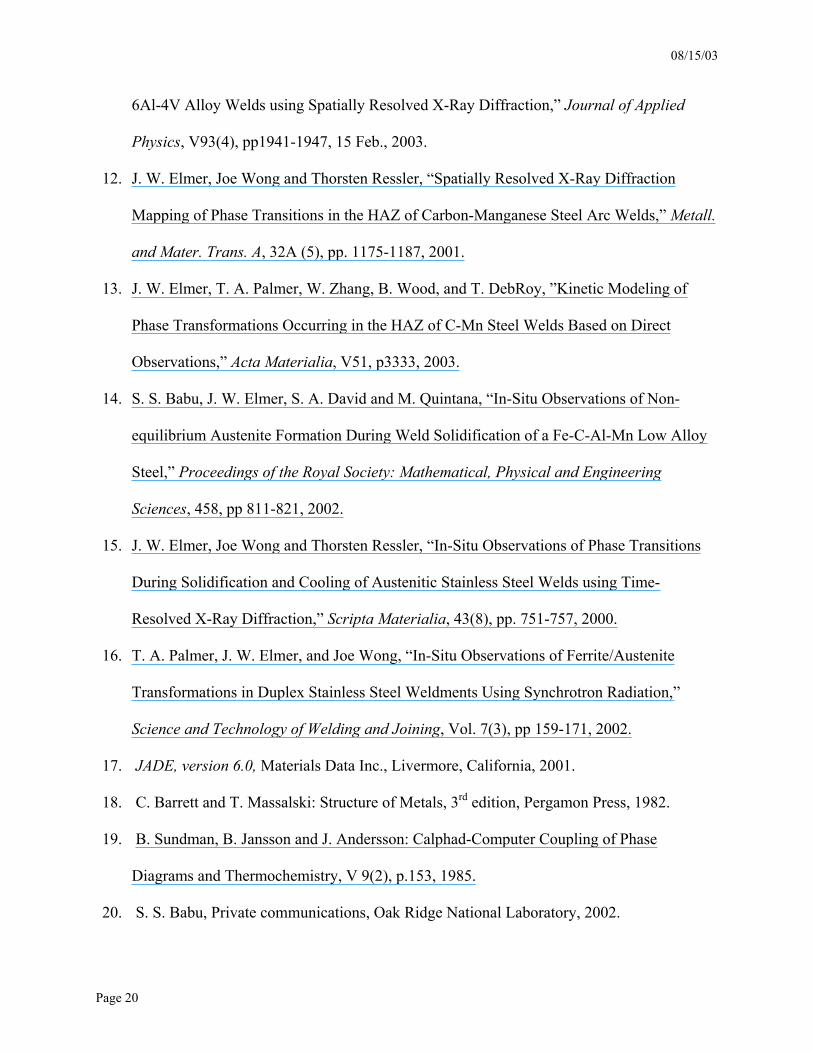
6.0Al, 4.2V, 0.11O, 0.17Fe, 0.0028H, 0.014C, 0.009N, 0.03Si, bal. Ti. Figure 1 shows the
microstructure of the starting material, which contains approximately 12% β distributed
intergranularly around the slightly elongated α grains that form the matrix. The α grains of the
starting material have an aspect ratio of approximately 2:1, with an average grain size of 5.8 µm
across the small dimension of the grains.
Gas tungsten arc spot welds were made on the Ti-6Al-4V alloy bars by striking the arc,
maintaining the arc for a fixed amount of time, then extinguishing the arc to let the weld cool.
TRXRD data was gathered over a period of 60s during welding, allowing both the heating and
cooling cycles to be observed during one weld. The x-ray location was chosen to be 4.5 mm
from the center of the weld, where the temperature-time profile was sufficient to melt and
resolidify the alloy. The welding parameters used were 100 amps at 19 volts with an arc on time
of 25s, and produced weld pools with a diameters just less than 10 mm.
The welds were made inside an environmentally controlled chamber that was backfilled
with high purity helium in order to deliver the x-ray beam with minimal attenuation, and to
prevent the titanium alloy surface from being oxidized. In addition, helium gas was blown
perpendicular to the welding direction at the x-ray beam impingement location to prevent metal
vapors from depositing on the surface where x-ray diffraction was taking place. After the
TRXRD experiments were completed, metallographic inspection was performed by sectioning
08/15/03
Page 4
and polishing the welds using standard metallographic procedures. The samples were then
chemically etched using a solution containing 5 ml HF, 10 mL HNO3, 30 mL lactic acid for
approximately 30s to reveal the base metal microstructure. A Remmington B etchant (10 ml HF,
10 ml glycol) was used for approximately 1 minute to reveal the fusion zone boundary.
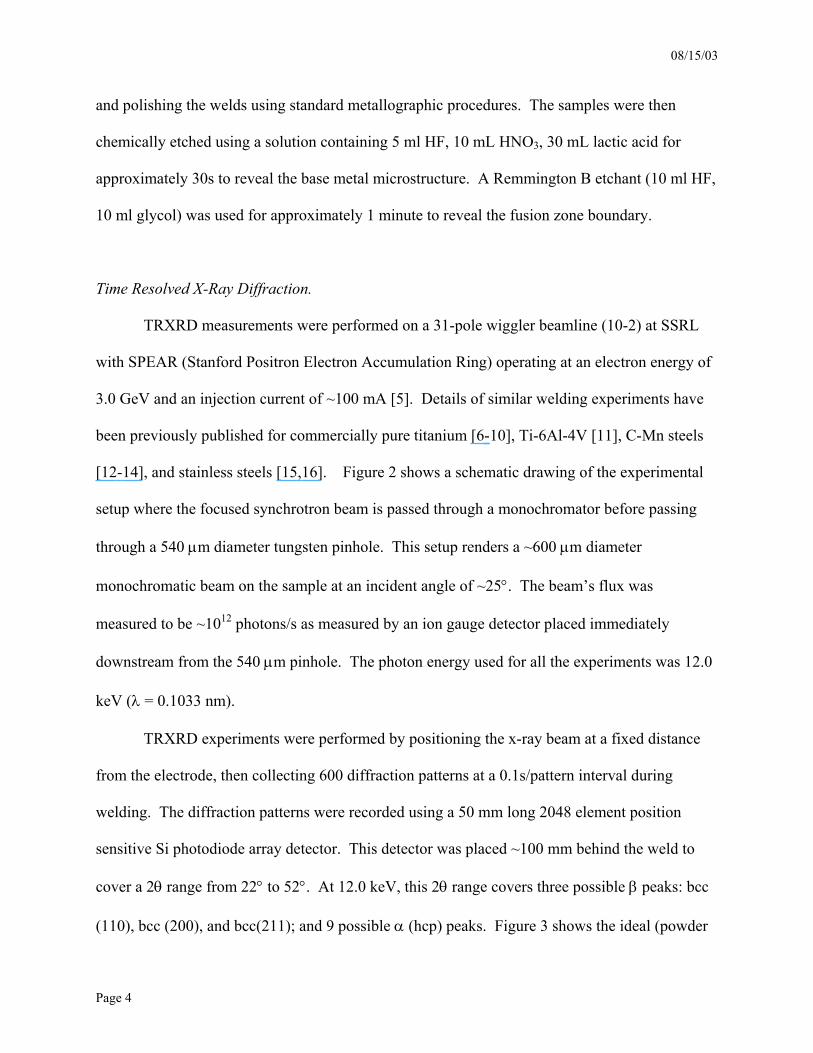
Time Resolved X-Ray Diffraction.
TRXRD measurements were performed on a 31-pole wiggler beamline (10-2) at SSRL
with SPEAR (Stanford Positron Electron Accumulation Ring) operating at an electron energy of
3.0 GeV and an injection current of ~100 mA [5]. Details of similar welding experiments have
been previously published for commercially pure titanium [6-10], Ti-6Al-4V [11], C-Mn steels
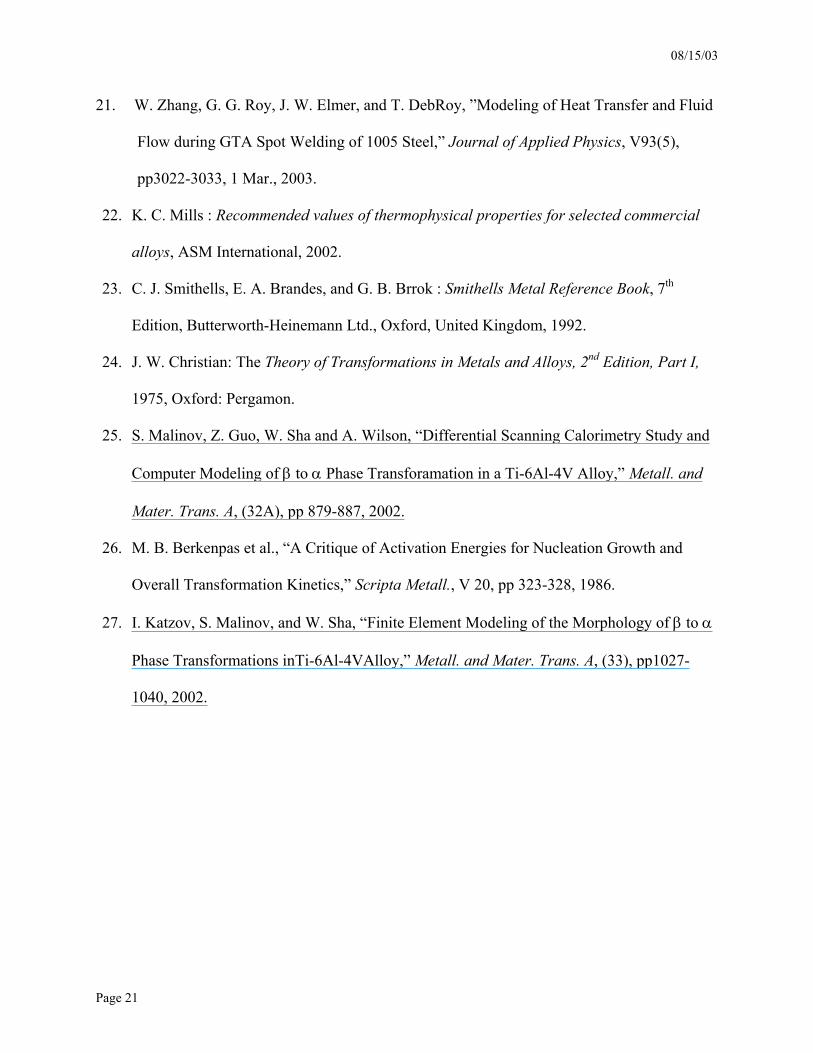
[12-14], and stainless steels [15,16]. Figure 2 shows a schematic drawing of the experimental
setup where the focused synchrotron beam is passed through a monochromator before passing
through a 540 µm diameter tungsten pinhole. This setup renders a ~600 µm diameter
monochromatic beam on the sample at an incident angle of ~25°. The beam’s flux was
measured to be ~1012 photons/s as measured by an ion gauge detector placed immediately
downstream from the 540 µm pinhole. The photon energy used for all the experiments was 12.0
keV (λ = 0.1033 nm).
TRXRD experiments were performed by positioning the x-ray beam at a fixed distance
from the electrode, then collecting 600 diffraction patterns at a 0.1s/pattern interval during
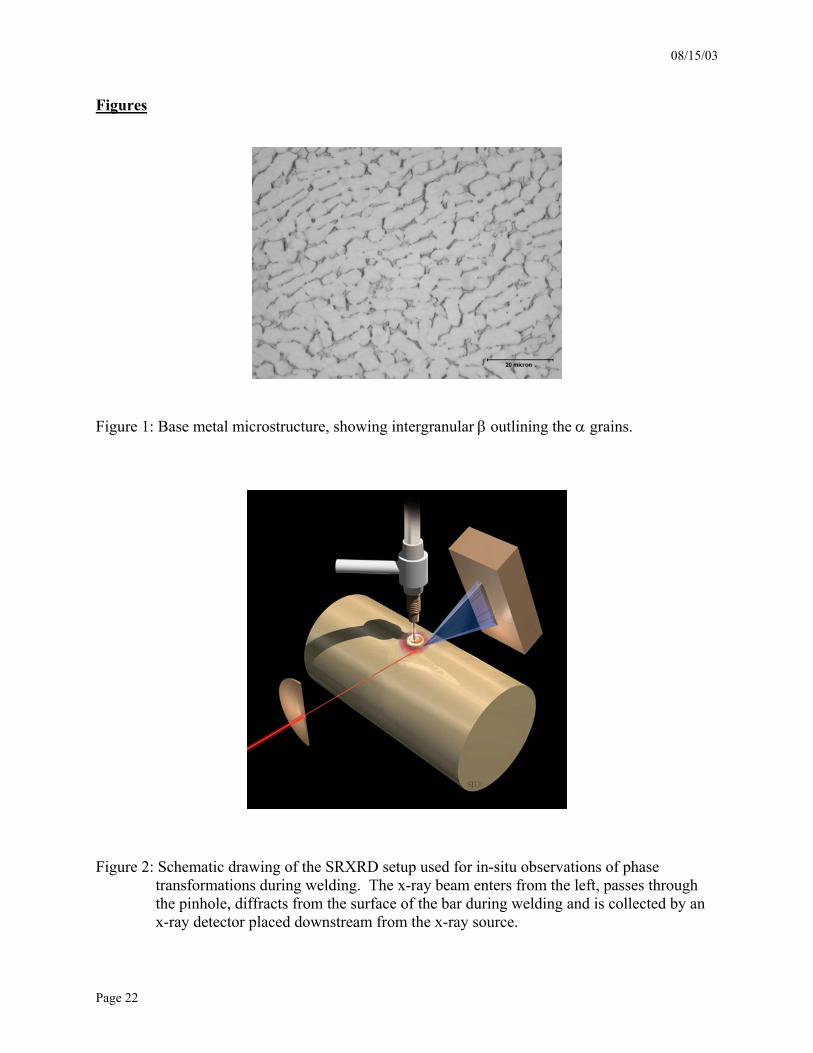
welding. The diffraction patterns were recorded using a 50 mm long 2048 element position
sensitive Si photodiode array detector. This detector was placed ~100 mm behind the weld to
cover a 2θ range from 22° to 52°. At 12.0 keV, this 2θ range covers three possible β peaks: bcc
(110), bcc (200), and bcc(211); and 9 possible α (hcp) peaks. Figure 3 shows the ideal (powder

08/15/03
Page 5
pattern) calculated positions of the peaks in both phases at room temperature [17], using lattice
constants of a=0.33065 nm for β (bcc), and a= 0.29506 nm, c=0.46788 nm for α (hcp) [18], and
compares these peaks with the 2θ range covered by the x-ray detector. These diffraction patterns
estimate the peak positions and intensities of pure titanium at room temperature, assuming each
phase is represented in roughly equal volume fractions. In the actual material, alloying elements
alter the peak positions and alter the phase ratios from the calculated values.
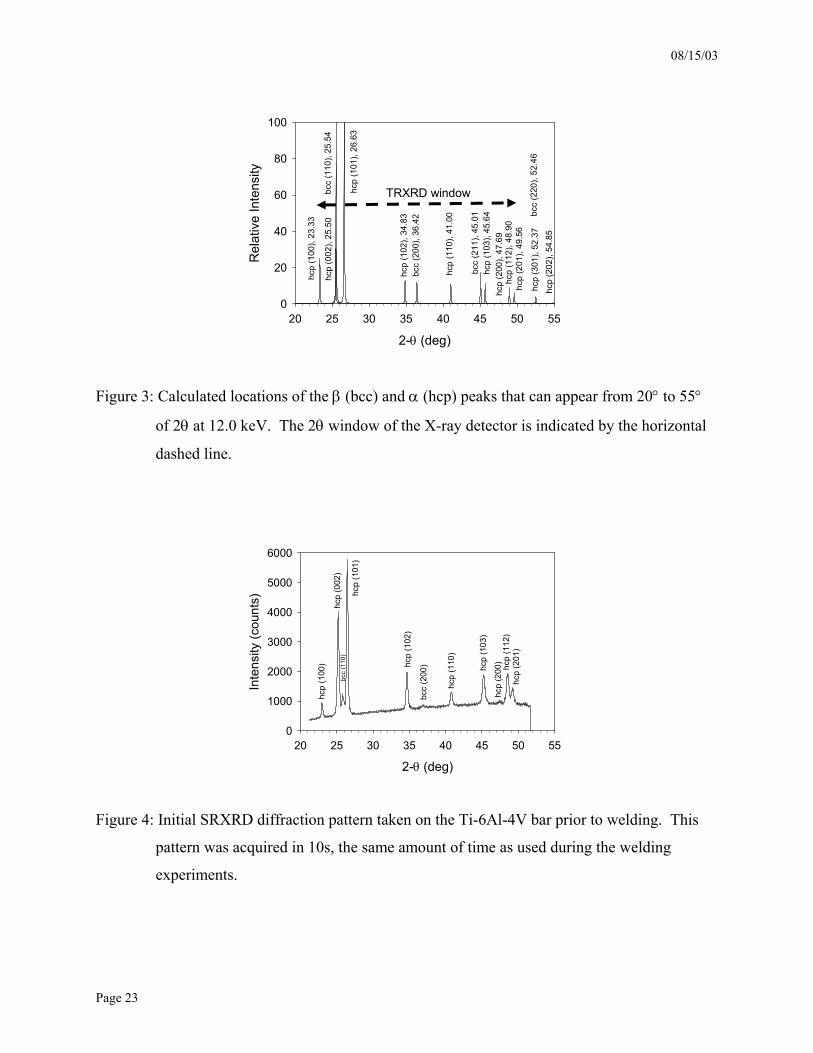
Figure 4 shows one of the TRXRD patterns taken directly on the Ti-6Al-4V bar prior to
welding. Since the alloy contains approximately 88% α at room temperature, the diffraction
pattern is dominated by the hcp α diffraction peaks. All nine hcp peaks are present in the 2θ
window of the detector. The reduced fraction of the β phase in the starting microstructure
diminishes the intensity of the β diffraction peaks, and only two of these peaks, bcc(110) and
bcc(200), can be distinguished in this diffraction pattern at room temperature. The peak
positions have shifted as well from those calculated for pure titanium. In particular, the bcc(110)
appears directly between the hcp(002) and hcp(101) peaks of the SRXRD patterns.
Results
Phase Equilibria
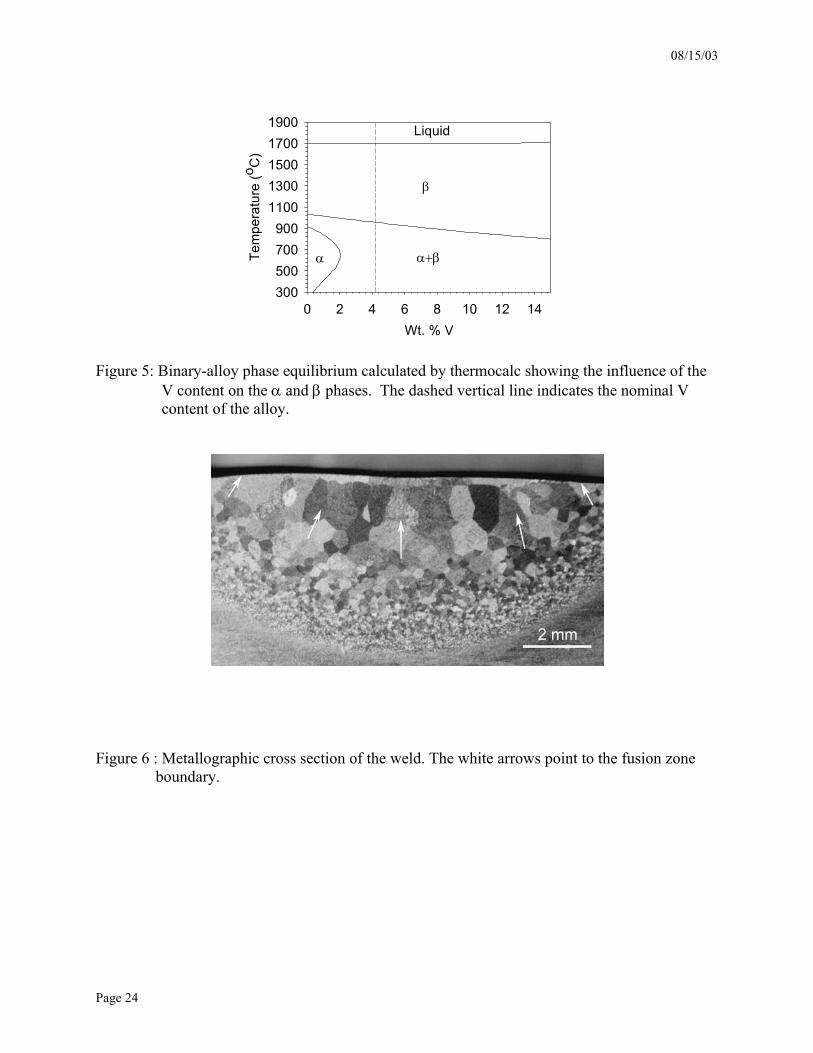
A pseudobinary diagram for the Ti-6Al-4V alloy is shown in Fig. 5, illustrating the
influence of V on the α/β equilibria. These calculations were performed using ThermoCalc[19]
with the Ti-Data data base (Distributed by UES Software), by considering the influence of Ti, V,
Al, Fe and O on the phase equilibria. These results show that V stabilizes the β phase, while
aluminum stabilizes the α phase.
The phase relationships presented in Fig. 5 indicate that the amount of β phase will
08/15/03
Page 6
increase during heating, completely transforming to the β-phase at a temperature of 956°C.
Above this temperature, the β phase is stable up to the solidus temperature of 1693°C, while
complete melting occurs at the liquidus temperature of 1701°C. Under these equilibrium
conditions, the liquid weld pool would be expected to be surrounded by a relatively large region
of β that varies in size in response to varying temperature gradients around the weld pool.
Outside of this single phase β region, the α phase would be expected to coexist with β in varying
amounts during welding, thus providing a transition to the reduced amount of β in the base
metal. Since equilibrium is rarely attained during welding, the microstructures that form are
often considerably different than those expected from the calculated phase diagram.
Furthermore, the evolution of weld microstructures can be difficult to determine in titanium
alloys using conventional techniques since the microstructures that form during heating are
subsequently altered by the subsequent solid state transformations that take place during cooling.
Weld Microstructure
Figure 6 shows a cross section of one of the spot welded samples to demonstrate the
complexity of the Ti-6Al-4V weld microstructure. The FZ is characterized by the appearance of
large columnar grains that solidified as β and subsequently underwent a near complete
transformation to finely dispersed α. The FZ grains grew from the large β grains of the heat
affected zone (HAZ) where it is often difficult to distinguish the FZ and HAZ grains from each
other. In this microstructure the HAZ/FZ boundary was able to be revealed using careful
metallographic preparation techniques and shows up as a dark etching line (identified by the
arrows) running through the columnar grains. It is clear that solidification occurred by epitaxial
regrowth of the large HAZ grains. Outside the fusion zone, there is a gradient of prior β grain
08/15/03
Page 7
sizes extending from the HAZ/FZ boundary to the region of α/β coexistence. This post-weld
characterization is useful in that it illustrates the final weld microstructure, however, it is not
possible to gather any information about the phase transformation kinetics from the post-weld
microstructure alone.
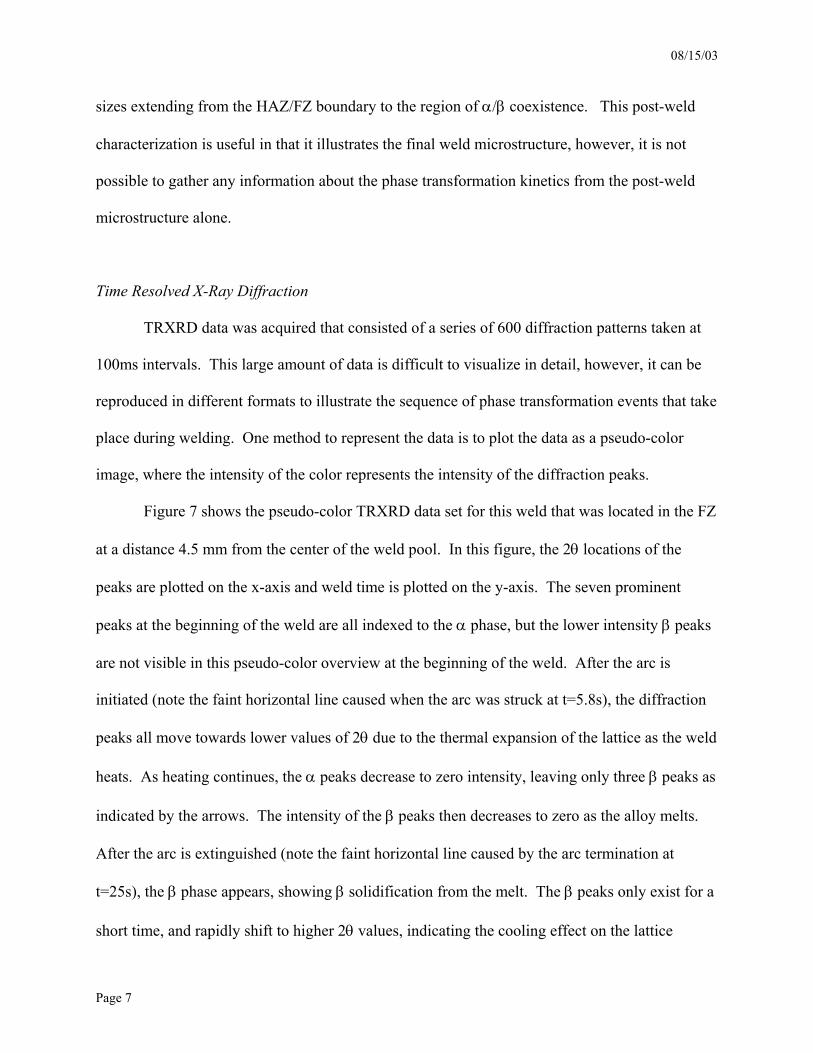
Time Resolved X-Ray Diffraction
TRXRD data was acquired that consisted of a series of 600 diffraction patterns taken at
100ms intervals. This large amount of data is difficult to visualize in detail, however, it can be
reproduced in different formats to illustrate the sequence of phase transformation events that take
place during welding. One method to represent the data is to plot the data as a pseudo-color
image, where the intensity of the color represents the intensity of the diffraction peaks.
Figure 7 shows the pseudo-color TRXRD data set for this weld that was located in the FZ
at a distance 4.5 mm from the center of the weld pool. In this figure, the 2θ locations of the
peaks are plotted on the x-axis and weld time is plotted on the y-axis. The seven prominent
peaks at the beginning of the weld are all indexed to the α phase, but the lower intensity β peaks
are not visible in this pseudo-color overview at the beginning of the weld. After the arc is
initiated (note the faint horizontal line caused when the arc was struck at t=5.8s), the diffraction
peaks all move towards lower values of 2θ due to the thermal expansion of the lattice as the weld
heats. As heating continues, the α peaks decrease to zero intensity, leaving only three β peaks as
indicated by the arrows. The intensity of the β peaks then decreases to zero as the alloy melts.
After the arc is extinguished (note the faint horizontal line caused by the arc termination at
t=25s), the β phase appears, showing β solidification from the melt. The β peaks only exist for a
short time, and rapidly shift to higher 2θ values, indicating the cooling effect on the lattice
08/15/03
Page 8
parameter. Transformation of the β phase occurs rapidly to an hcp titanium phase which is
characterized by eight prominent diffraction peaks that exist for the remainder of the experiment.
Analysis of every peak in each of the diffraction patterns was performed to estimate the
relative fraction of the hcp and bcc titanium phases present as a function of weld time. To do
this, the integrated intensity of each peak in each diffraction pattern was measured using a sum
of one or more Gaussian peak profile fitting functions [8, 16]. The area and FWHM values of
the fitted peaks were then determined using an automated curve-fitting routine developed in Igor
Pro®, Version 4.0 [20]. The relative fraction of β was assumed to be equal to the total area of
the β peaks divided by the combined areas of the β and α peaks. The fraction α was then
calculated by subtracting the fraction β from unity, since only these two phases are present in the
microstructure.
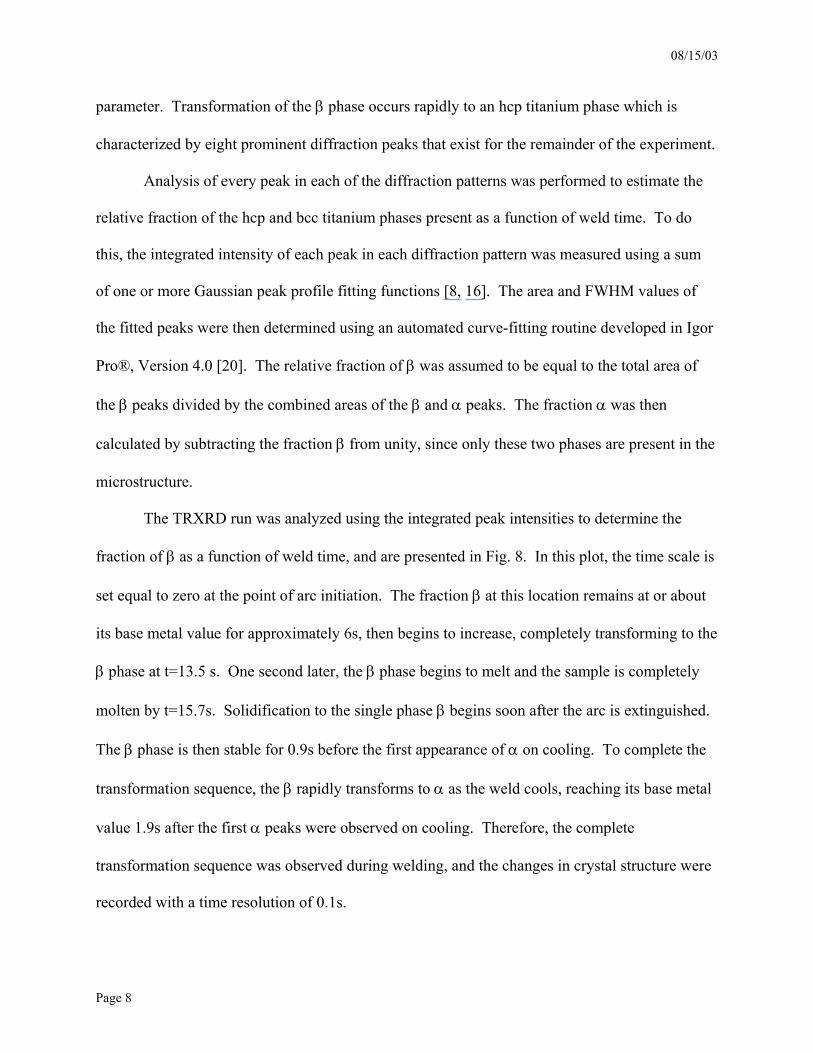
The TRXRD run was analyzed using the integrated peak intensities to determine the
fraction of β as a function of weld time, and are presented in Fig. 8. In this plot, the time scale is
set equal to zero at the point of arc initiation. The fraction β at this location remains at or about
its base metal value for approximately 6s, then begins to increase, completely transforming to the
β phase at t=13.5 s. One second later, the β phase begins to melt and the sample is completely
molten by t=15.7s. Solidification to the single phase β begins soon after the arc is extinguished.
The β phase is then stable for 0.9s before the first appearance of α on cooling. To complete the
transformation sequence, the β rapidly transforms to α as the weld cools, reaching its base metal
value 1.9s after the first α peaks were observed on cooling. Therefore, the complete
transformation sequence was observed during welding, and the changes in crystal structure were
recorded with a time resolution of 0.1s.
08/15/03
Page 9
Coupled Thermal-Fluids Numerical Modeling
Whereas the TRXRD results presented in Figure 8 show changes in the fraction β phase
as a function of time, these data only provide limited information about the transformation
kinetics since weld temperature has not yet been incorporated into the plot. In order to relate
weld time to weld temperature, we use numerical modeling since transient weld temperatures are
extremely difficult to directly measure. The weld model used here is a well tested numerical
heat transfer and fluid flow model in a 3D Cartesian coordinate system as described in detail in
reference [21]. These calculations take into account the electromagnetic, surface tension and
buoyancy driving forces present in the transient weld pool convection. In addition, at the weld
top surface, the convective heat transfer effect of the helium shield gas was taken into account.
Using the weld model, the weld pool boundary was traced using an enthalpy-porosity
technique in a fixed Cartesian coordinate system [21]. For computational accuracy, a very fine
grid system consisting of 130×65×60 grid points was used, and the corresponding computational
domain had dimensions of 64 mm in length, 32 mm in width and 19 mm in depth. Spatially non-
uniform grids were used for maximum resolution of the variables, such that the grid spacing was
refined near the heat source where the temperature gradients are the highest. The minimum grid
spacing along the x and z directions were about 250 µm and 25 µm, respectively. Small time
steps of 10 ms were further required to track the weld pool size and shape under the high heating
and cooling rates produced under the transient welding conditions [21]. The thermophysical
properties used to represent the Ti-6Al-4V alloy in the calculations are given in Table 1 [22, 23].
The cross sectional size and shape of the calculated weld pool at its maximum size
matched the experimental weld cross section shown in Fig. 6a. The temperature distributions,
heating rates, and cooling rates were then calculated as a function of welding time and weld
08/15/03
Page 10
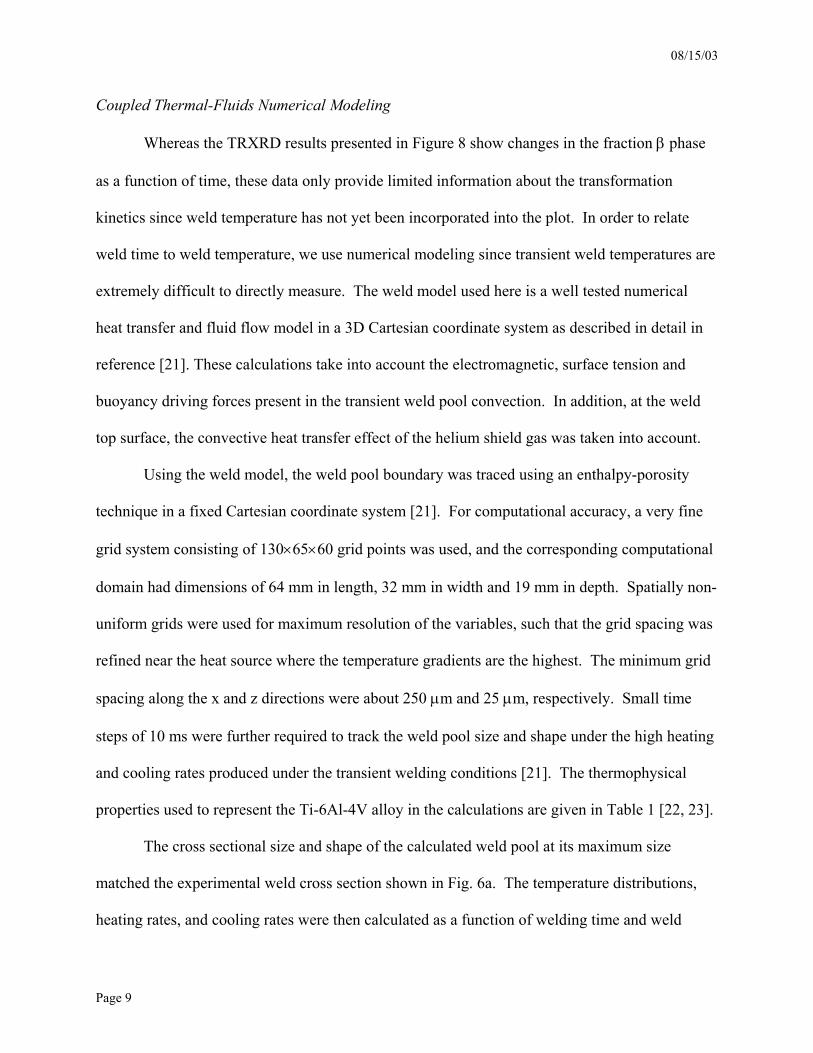
position. Figure 9 plots the thermal profile at the location where the TRXRD data was taken,
and compares the results to the calculated liquidus and β transus temperature of the Ti-6Al-4V
alloy. In this figure, the triangle indicates the time when melting was first observed using
TRXRD and the square represents the time when melting was observed to be complete,
indicating good correlation between the calculated and actual melting time at the TRXRD
location.
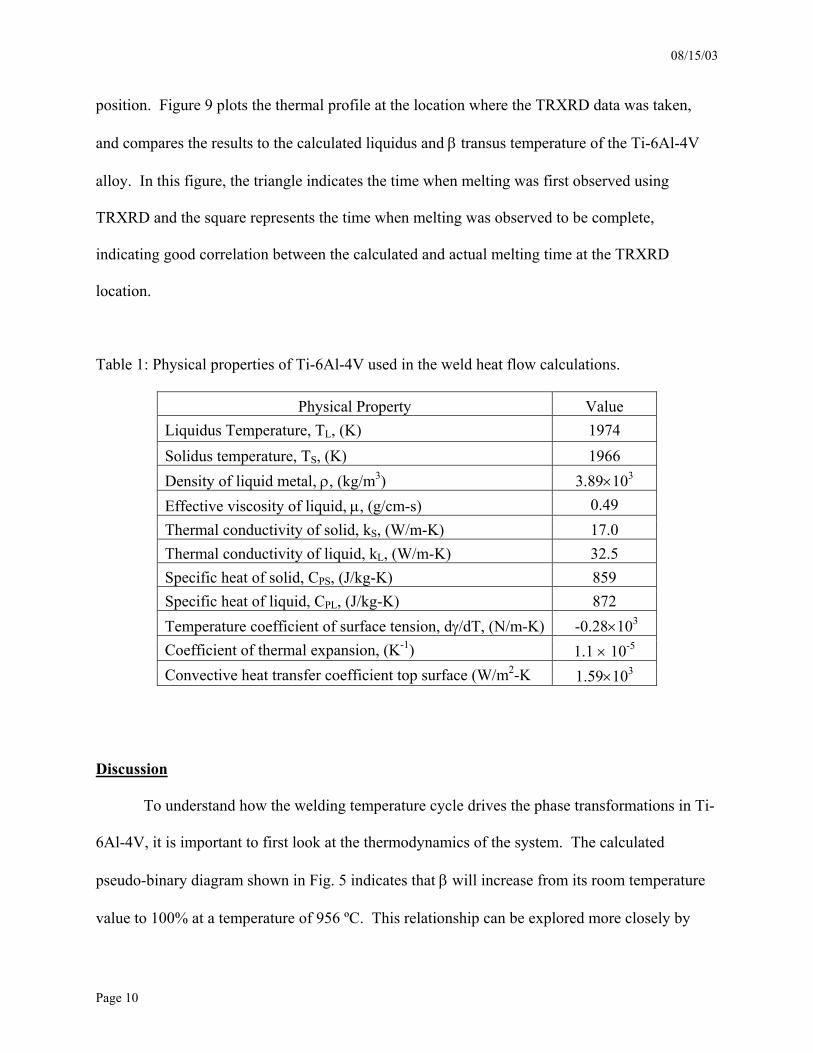
Table 1: Physical properties of Ti-6Al-4V used in the weld heat flow calculations.
Physical Property Value Liquidus Temperature, TL, (K) 1974 Solidus temperature, TS, (K) 1966 Density of liquid metal, ρ, (kg/m3) 3.89×10³ Effective viscosity of liquid, µ, (g/cm-s) 0.49 Thermal conductivity of solid, kS, (W/m-K) 17.0 Thermal conductivity of liquid, kL, (W/m-K) 32.5 Specific heat of solid, CPS, (J/kg-K) 859 Specific heat of liquid, CPL, (J/kg-K) 872
Temperature coefficient of surface tension, dγ/dT, (N/m-K) -0.28×10³
Coefficient of thermal expansion, (K-1) 1.1 × 10⁻⁵ Convective heat transfer coefficient top surface (W/m2-K 1.59×10³
Discussion
To understand how the welding temperature cycle drives the phase transformations in Ti-
6Al-4V, it is important to first look at the thermodynamics of the system. The calculated
pseudo-binary diagram shown in Fig. 5 indicates that β will increase from its room temperature
value to 100% at a temperature of 956 ºC. This relationship can be explored more closely by
08/15/03
Page 11
using computational thermodynamic software to calculate the equilibrium volume fraction of β
as a function of temperature. These calculations are plotted in Fig. 10, which shows that the
fraction β is relatively constant, at about 4%, up to a temperature of approximately 450 ºC. In
fact, the calculations predict a slight dip in the fraction β, due to the retrograde in the α phase
field, as shown in Fig. 5. Above 450 ºC, the β fraction increases at an increasing rate, until
complete transformation occurs at the β transus.
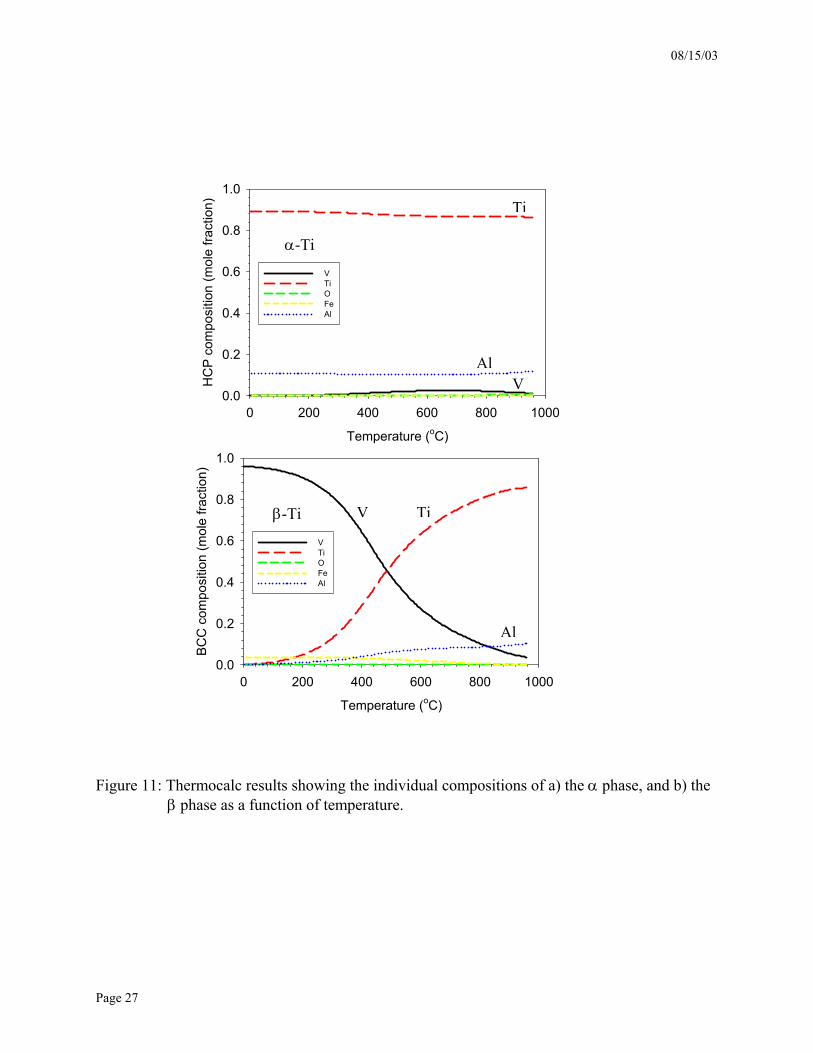
The individual compositions of the α and β phases change as functions of both
temperature and the phase fractions. The computational thermodynamic software was further
used to predict these variations in phase compositions, and these results are plotted in Fig. 11.
These results show that the composition of the α phase changes very little over the entire
temperature range up to the β transus temperature of 956°C. However, the β phase shows a
drastic variation in composition, whereby V concentrates strongly to it as the temperature falls.
The reason for this is behavior is that the solubility of V in the α phase is small and relatively
constant. Therefore, as the alloy transforms from β to α as the temperature decreases, the V
concentration in the remaining β increases dramatically, and does so largely at the expense of
lowered concentration of titanium in the β−Ti phase.
The calculated fraction of β versus temperature shown in Fig.10 is similar to that of the
heating stages of the TRXRD measured values shown in Fig. 8, whereby the β content is
relatively low and constant during the initial stages of heating, but then rapidly increases at
higher temperatures. However, the non-uniform weld heating rate indicated in Fig. 9 needs to be
considered in order to provide a direct comparison of the TRXRD measurements with the
thermodynamic predictions.
08/15/03
Page 12
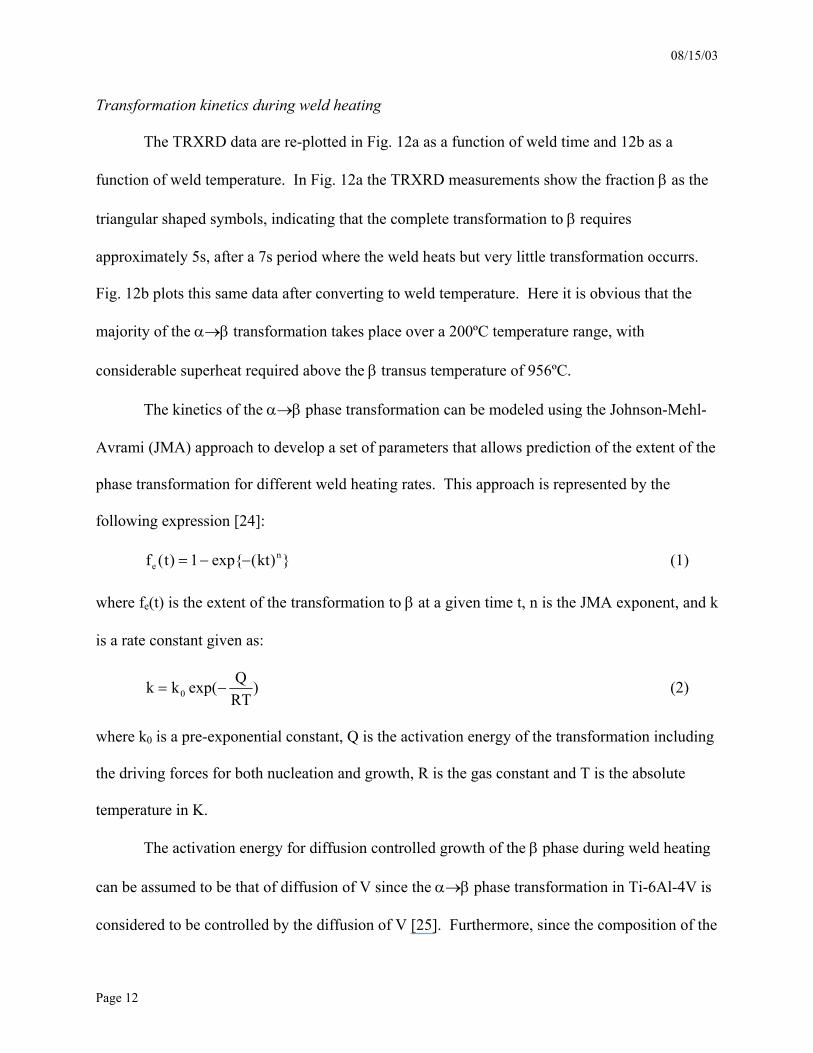
Transformation kinetics during weld heating
The TRXRD data are re-plotted in Fig. 12a as a function of weld time and 12b as a
function of weld temperature. In Fig. 12a the TRXRD measurements show the fraction β as the
triangular shaped symbols, indicating that the complete transformation to β requires
approximately 5s, after a 7s period where the weld heats but very little transformation occurrs.
Fig. 12b plots this same data after converting to weld temperature. Here it is obvious that the
majority of the α→β transformation takes place over a 200ºC temperature range, with
considerable superheat required above the β transus temperature of 956ºC.
The kinetics of the α→β phase transformation can be modeled using the Johnson-Mehl-
Avrami (JMA) approach to develop a set of parameters that allows prediction of the extent of the
phase transformation for different weld heating rates. This approach is represented by the
following expression [24]:
})kt(exp{1)t(f ne −−= (1)
where fe(t) is the extent of the transformation to β at a given time t, n is the JMA exponent, and k
is a rate constant given as:
)RTQexp(kk 0 −= (2)
where k0 is a pre-exponential constant, Q is the activation energy of the transformation including
the driving forces for both nucleation and growth, R is the gas constant and T is the absolute
temperature in K.
The activation energy for diffusion controlled growth of the β phase during weld heating
can be assumed to be that of diffusion of V since the α→β phase transformation in Ti-6Al-4V is
considered to be controlled by the diffusion of V [25]. Furthermore, since the composition of the
08/15/03
Page 13
α is nearly constant up to the β transus temperature, diffusion in the α phase will not be a rate
controlling factor. Rather, the transport of V through the β phase will control the transformation
rate [25]. The diffusion coefficient for V in β can be represented by an Arhennius expression, D
= A exp(-Q/RT), and has been measured to have an activation energy Q=123.9 kJ/mole, with a
pre-exponential of A=1.6x10⁻⁴ cm2s-1 for a binary Ti-V alloy containing 10a/o V [23].
Equations 1 and 2 were discretized and numerically integrated over the non-isothermal
heating profile of the weld following a previously developed procedure whereby transformation
in the α+β two phase field can be taken into account [13]. To do this, the TRXRD data were fit
using the JMA parameters (n, ko and Q), whereby one of the JMA parameters is selected and the
remaining two are calculated through a numerical optimization routine [13].
The first calculation that was performed was one where the activation energy for
diffusion was fixed (Q=123.9 kJ/mole), representing a growth controlled phase transformation
mechanism where nucleation is assumed to not play a significant role. The optimum JMA
parameters for this growth controlled mechanism were then calculated to be n= 21.4 and ln(ko)=
4.4. The results of these calculations are superimposed over the measured fraction β versus time
and temperature plots shown in Fig. 12 by the solid lines. The fit to the data is good, however,
the calculated value of n is much higher than would be expected for a JMA parameter for a
diffusion controlled growth transformation where a value of n=2.0 would be considered to be
more representative [24].
The calculations were then performed using a different set of assumptions where
nucleation and growth would simultaneously occur. This time, a reasonable value of n=4 was
selected for a transformation mechanism that involves a strong nucleation component [24].
Using this assumption, the activation energy was calculated using the JMA approach. The
08/15/03
Page 14
reasoning here is that although the activation energy for growth is temperature independent the
activation energy for nucleation is temperature dependant [25], and therefore the combination of
the two may result in an activation energy different than either one alone. The results of the
JMA numerical model for this case gave a value of Q=214 kJ/mole and a corresponding value of
ln(ko)=11.8. Thus for this assumption, the apparent activation energy was calculated to be
nearly twice as high as that for growth alone. Results of these calculations are plotted in Figure
12a and 12 b as the dashed lines, and are nearly indistinguishable from the previous fit to the
TRXRD experimental data.
To summarize the results of the JMA calculations, two different starting assumptions led
to quite different calculated values for the activation energy for the transformation. Based on
this information alone, a clear mechanism for the α→β phase transformation could not be
established with confidence. The difficulties associated with using the JMA approach to
determine activation energies for transformations involving nucleation and growth have been
observed by other investigators [26], and additional studies will be required to provide more
conclusive evidence for the transformation mechanism during transient weld heating of Ti-6Al-
4V. Nevertheless, the JMA modeling approach did successfully produce sets of parameters that
allow the weld heating transformation rate to be predicted, even though the transformation
mechanism was not definitively established.
Transformation kinetics during weld cooling
Once the arc is extinguished, the weld cools rapidly and the β begins to transform to the
low temperature hcp phase. The transformation on cooling is different than that on heating due
to differences in the heating/cooling rates and starting microstructures. The cooling rate is much
08/15/03
Page 15
more rapid than that on heating, as indicated by the calculated temperature profiles shown in Fig.
9. These calculations indicate that the heating rate at the β transus temperature is approximately
250 ºC/s, whereas the cooling rate is approximately 1000 ºC/s at the liquidus temperature, and
500 ºC/s at the β transus temperature. The second difference relates to the nature of the
microstructure during the time of transformation. Since the material at this location underwent
melting and solidification to β prior to beginning the β→α transformation on cooling, the
microstructure is composed entirely of β having large columnar grains that formed during
solidification. Therefore, nucleation of the α phase is required before the transformation can
begin. If nucleation of the α phase is suppressed, then the transformation can take place by a
martensitic mechanism to the α´ phase, which also has an hcp crystal structure and has similar
lattice parameters to the α phase [2].
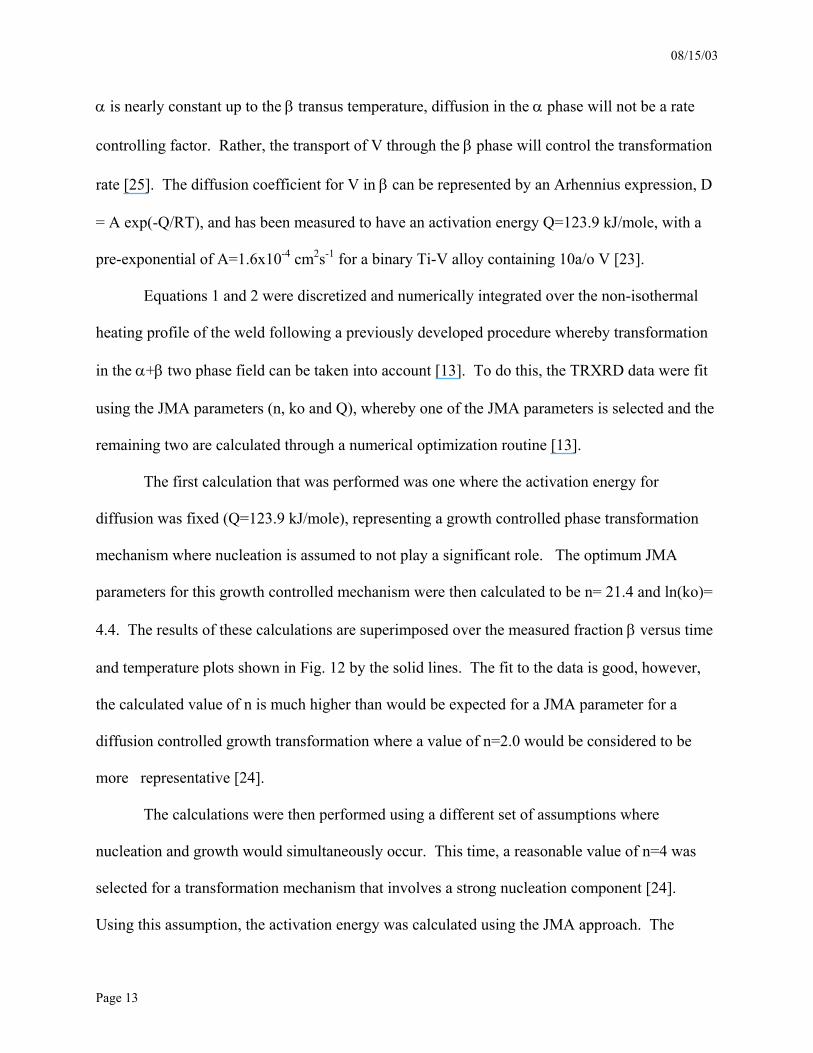
The measured fraction β is plotted as a function of cooling time in Fig. 13a and cooling
temperature in Fig. 13b. In these plots, time equal to zero represents the time when the arc was
extinguished. Fig. 13a shows the fraction β as a function of cooling time, and indicates that the
liquid weld pool is molten for approximately 1s after the arc is extinguished. The as-solidified β
phase exists by itself for approximately 1s before beginning the back transformation to α or α´.
Once the transformation begins, the microstructure transforms nearly completely to α in less
than 2s. This same data is plotted in Fig. 13b as a function of calculated weld temperature rather
than weld cooling time, which shows that the transformation of β begins at 550ºC, which is
below both the β transus temperature and the Ms temperature of 650ºC for this alloy, suggesting
that β transformed to α´ through a martensitic mechanism [2].
08/15/03
Page 16
Experiments and modeling of the β→α phase transformation in Ti-6Al-4V have been
performed to better understand the individual roles of nucleation and growth at different cooling
rates [27]. In this previous work the amount of transformation that occurred at a given
temperature was shown to decrease with increasing cooling rate. These facts were related to the
decrease in the temperature where the peak nucleation rate occurs and to the reduced time for the
β → α phase transformation to take place as the cooling rate was increased. This work was
performed at much lower cooling rates than those experienced by the welds in this investigation,
but the same logic applies here if the phase transformation occurs by the same type of nucleation
and growth mechanism. However, in the FZ of this alloy, the phase transformation conditions
appear to favor the formation of martensite rather than acicular ferrite due to the high cooling
rates and large β grains at the onset of transformation.
The post-weld microstructure is shown at high magnification in Fig. 14 at the same
location as the TRXRD measurements were taken (4.5 mm from the weld center). This
microstructure appears to be composed entirely of α´ martensite, which has a characteristic
needle-shaped morphology [2]. Martensite forms when untransformed β is subjected to
temperatures below the martensite start temperature (Ms) on cooling, which is approximately
650ºC for this alloy [2]. The observed microstructure is consistent with the TRXRD
observations of the transformation starting at or below the Ms temperature. Fig. 14 further
indicates that the microstructure has no obvious signs of retained β, which is also consistent with
the TRXRD results indicating that the transformation of β on cooling occurred nearly completely
at low temperatures via a martensitic mechanism.
08/15/03
Page 17
Conclusions
1. Time resolved x-ray diffraction experiments employing synchrotron radiation were
performed in-situ on GTA welds of Ti-6Al-4V alloys, providing real time observations of
the α →β→L→β →α´ transformations in the weld fusion zone.
2. A 3D transient numerical weld model was successfully used to predict weld temperatures
as a function of weld time and weld location. This model calculated the evolution of
velocity fields and temperatures in the FZ and was validated by comparing the predicted
and experimentally measured geometry of the FZ.
3. During weld heating, the TRXRD measurements showed that the α→β transformation
took place above the β transus temperature with significant superheat required to
complete the transformation due to the rapid heating rate of the weld.
4. The kinetics of the α→β transformation on heating were modeled using a modified JMA
approach using different assumptions about nucleation and growth mechanisms. The
results produced a set of JMA parameters for the prediction of the transformation rate,
but were not successful in determining a definite activation energy for the overall
transformation.
5. During weld cooling, the TRXRD measurements in the FZ showed that the initiation of
the transformation of β began at temperatures at or below the Ms temperature. Once
initiated, the transformation occurred rapidly and nearly completely to α′ martensite in
less than 2s over a temperature range of approximately 200ºC.
Acknowledgments
This work was performed under the auspices of the U. S. Department of Energy,
Lawrence Livermore National Laboratory, under Contract No. W-7405-ENG-48. This
work was supported by DOE, Office of Basic Energy Sciences, Division of Materials
Science. Portions of this research were carried out at the Stanford Synchrotron Radiation
Laboratory, a national user facility operated by Stanford University on behalf of the U.S.
Department of Energy, Office of Basic Energy Sciences. An additional portion of this
research was sponsored by the U.S. Department of Energy Division of Materials Sciences
and Engineering under contract No. DE-AC05-00OR22725 with UT-Battelle, LLC.
The authors express gratitude to Mr. Bob Vallier of LLNL for performing optical
metallography, and Mr. Octavio Cervantes for performing x-ray diffraction simulations
using JADE software.
08/15/03
Page 19
References 1. M. Donachie, Jr.: Titanium A Technical Guide, ASM International, 1989.
2. Material Properties Handbook: Titanium Alloys, ASM International, 1994.
3. ASM Handbook, Volume 6: Welding, Brazing and Soldering, ASM International, 1993.
4. Ø. Grong: Metallurgical Modelling of Welding, The Institute of Materials, London, 1994.
5. V. Karpenko, J.H. Kinney, S. Kulkarni, K. Neufeld, C. Poppe, K.G. Tirsell, Joe Wong, J.
Cerino, T. Troxel, J. Yang, E. Hoyer, M. Green, D. Humpries, S. Marks, and D. Plate: Rev.
Sci. Instrum., 1989, 60, pp. 1451-1460.
6. J. W. Elmer, Joe Wong, M. Fröba, P. A. Waide and E. M. Larson, "Analysis of Heat
Affected Zone Phase Transformations Using In-Situ Spatially Resolved X-Ray Diffraction
With Synchrotron Radiation," Metall. Mater. Trans. A, 27A(3), p. 775, 1996.
7. J. W. Elmer, Joe Wong and Thorsten Ressler, “Spatially Resolved X-Ray Diffraction Phase
Mapping and α→β→α Transformation Kinetics in the HAZ of Commercially Pure
Titanium Arc Welds,” Metall. and Mater. Trans. A, 29A(11), p. 2761, 1998.
8. Thorsten Ressler, Joe Wong and J. W. Elmer, “Investigation of Real-Time Microstructure
Evolution in Steep Thermal Gradients using Spatially Resolved X-ray Diffraction: A Case
Study for Ti Fusion Welds,” J. Phys. Chem. B, 102(52), p. 10724, 1998.
9. Z. Yang, J. W. Elmer, Joe Wong, and T. DebRoy, “Evolution of Titanium Arc Weldment
Macro- and Microstructures – Modeling and Real Time Mapping of Phases,” Welding
Journal, 79(4), p. 97s-112s, 2000.
10. Joe Wong, M. Fröba, J. W. Elmer, and P. A. Waide "In-Situ Phase Mapping and Transition
Study in Fusion Welds," J. Mat. Sc., 32, p. 1493, 1997.
11. J. W. Elmer, T. A. Palmer and Joe Wong, “In-Situ Observations of Phase Transitions in Ti-
08/15/03
Page 20
6Al-4V Alloy Welds using Spatially Resolved X-Ray Diffraction,” Journal of Applied
Physics, V93(4), pp1941-1947, 15 Feb., 2003.
12. J. W. Elmer, Joe Wong and Thorsten Ressler, “Spatially Resolved X-Ray Diffraction
Mapping of Phase Transitions in the HAZ of Carbon-Manganese Steel Arc Welds,” Metall.
and Mater. Trans. A, 32A (5), pp. 1175-1187, 2001.
13. J. W. Elmer, T. A. Palmer, W. Zhang, B. Wood, and T. DebRoy, ”Kinetic Modeling of
Phase Transformations Occurring in the HAZ of C-Mn Steel Welds Based on Direct
Observations,” Acta Materialia, V51, p3333, 2003.
14. S. S. Babu, J. W. Elmer, S. A. David and M. Quintana, “In-Situ Observations of Non-
equilibrium Austenite Formation During Weld Solidification of a Fe-C-Al-Mn Low Alloy
Steel,” Proceedings of the Royal Society: Mathematical, Physical and Engineering
Sciences, 458, pp 811-821, 2002.
15. J. W. Elmer, Joe Wong and Thorsten Ressler, “In-Situ Observations of Phase Transitions
During Solidification and Cooling of Austenitic Stainless Steel Welds using Time-
Resolved X-Ray Diffraction,” Scripta Materialia, 43(8), pp. 751-757, 2000.
16. T. A. Palmer, J. W. Elmer, and Joe Wong, “In-Situ Observations of Ferrite/Austenite
Transformations in Duplex Stainless Steel Weldments Using Synchrotron Radiation,”
Science and Technology of Welding and Joining, Vol. 7(3), pp 159-171, 2002.
17. JADE, version 6.0, Materials Data Inc., Livermore, California, 2001.
18. C. Barrett and T. Massalski: Structure of Metals, 3rd edition, Pergamon Press, 1982.
19. B. Sundman, B. Jansson and J. Andersson: Calphad-Computer Coupling of Phase
Diagrams and Thermochemistry, V 9(2), p.153, 1985.
20. S. S. Babu, Private communications, Oak Ridge National Laboratory, 2002.
08/15/03
Page 21
21. W. Zhang, G. G. Roy, J. W. Elmer, and T. DebRoy, ”Modeling of Heat Transfer and Fluid
Flow during GTA Spot Welding of 1005 Steel,” Journal of Applied Physics, V93(5),
pp3022-3033, 1 Mar., 2003.
22. K. C. Mills : Recommended values of thermophysical properties for selected commercial
alloys, ASM International, 2002.
23. C. J. Smithells, E. A. Brandes, and G. B. Brrok : Smithells Metal Reference Book, 7th
Edition, Butterworth-Heinemann Ltd., Oxford, United Kingdom, 1992.
24. J. W. Christian: The Theory of Transformations in Metals and Alloys, 2nd Edition, Part I,
1975, Oxford: Pergamon.
25. S. Malinov, Z. Guo, W. Sha and A. Wilson, “Differential Scanning Calorimetry Study and
Computer Modeling of β to α Phase Transforamation in a Ti-6Al-4V Alloy,” Metall. and
Mater. Trans. A, (32A), pp 879-887, 2002.
26. M. B. Berkenpas et al., “A Critique of Activation Energies for Nucleation Growth and
Overall Transformation Kinetics,” Scripta Metall., V 20, pp 323-328, 1986.
27. I. Katzov, S. Malinov, and W. Sha, “Finite Element Modeling of the Morphology of β to α
Phase Transformations inTi-6Al-4VAlloy,” Metall. and Mater. Trans. A, (33), pp1027-
1040, 2002.
08/15/03
Page 22
Figures
Figure 1: Base metal microstructure, showing intergranular β outlining the α grains.
Figure 2: Schematic drawing of the SRXRD setup used for in-situ observations of phase
transformations during welding. The x-ray beam enters from the left, passes through the pinhole, diffracts from the surface of the bar during welding and is collected by an x-ray detector placed downstream from the x-ray source.
08/15/03
Page 23
2-θ (deg)
20 25 30 35 40 45 50 55
Rel
ativ
e In
tens
ity
0
20
40
60
80
100
bcc
(110
), 25
.54
bcc
(200
), 36
.42
bcc
(211
), 45
.01 bc
c (2
20),
52.4
6
hcp
(100
), 23
.33
hcp
(002
), 25
.50
hcp
(101
), 26
.63
hcp
(102
), 34
.83
hcp
(110
), 41
.00
hcp
(103
), 45
.64
hcp
(200
), 47
.69
hcp
(112
), 48
.90
hcp
(201
), 49
.56
hcp
(301
), 52
.37
hcp
(202
), 54
.85
Figure 3: Calculated locations of the β (bcc) and α (hcp) peaks that can appear from 20° to 55°
of 2θ at 12.0 keV. The 2θ window of the X-ray detector is indicated by the horizontal
dashed line.
2-θ (deg)
20 25 30 35 40 45 50 55
Inte
nsity
(cou
nts)
0
1000
2000
3000
4000
5000
6000
bcc
(110
)
bcc
(200
)
hcp
(100
)
hcp
(002
)
hcp
(101
)
hcp
(102
)
hcp
(110
)
hcp
(103
)
hcp
(200
)hc
p (1
12)
hcp
(201
)
Figure 4: Initial SRXRD diffraction pattern taken on the Ti-6Al-4V bar prior to welding. This
pattern was acquired in 10s, the same amount of time as used during the welding
experiments.
TRXRD window
08/15/03
Page 24
Wt. % V0 2 4 6 8 10 12 14
Tem
pera
ture
(o C)
300500700900
11001300150017001900 Liquid
β
α+βα
Figure 5: Binary-alloy phase equilibrium calculated by thermocalc showing the influence of the V content on the α and β phases. The dashed vertical line indicates the nominal V content of the alloy.
Figure 6 : Metallographic cross section of the weld. The white arrows point to the fusion zone boundary.
β β β β β β
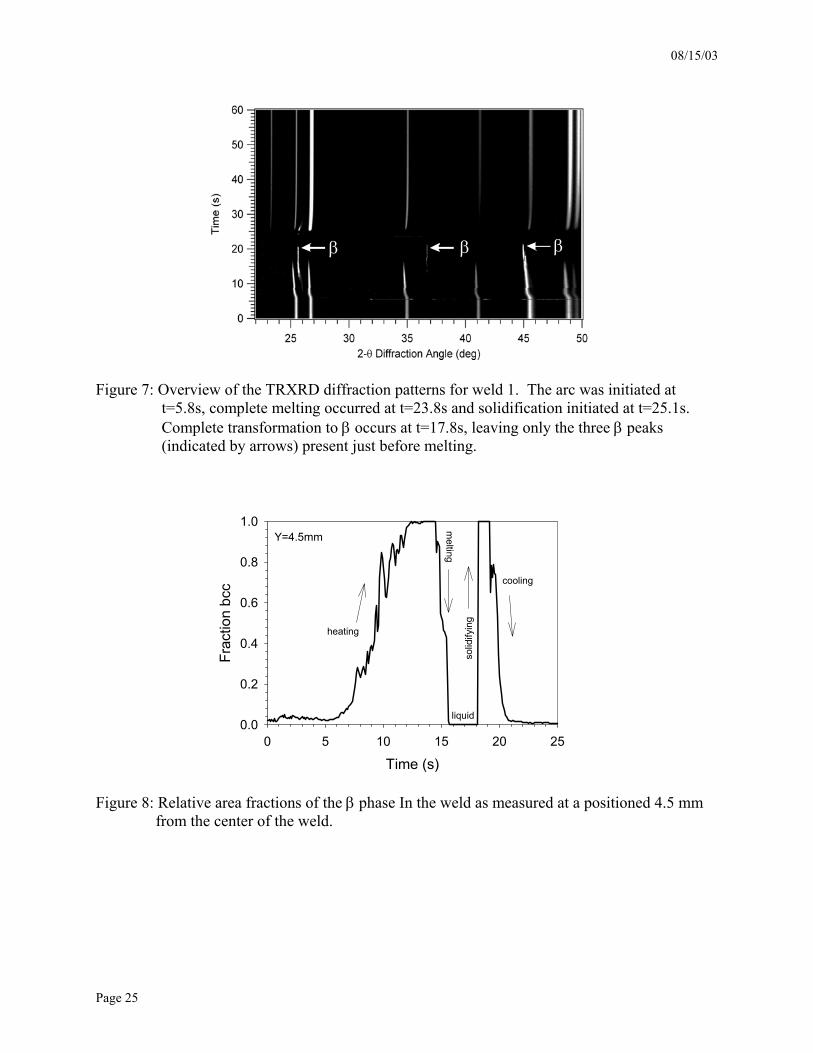
08/15/03
Page 25
β β β
Figure 7: Overview of the TRXRD diffraction patterns for weld 1. The arc was initiated at t=5.8s, complete melting occurred at t=23.8s and solidification initiated at t=25.1s. Complete transformation to β occurs at t=17.8s, leaving only the three β peaks (indicated by arrows) present just before melting.
Time (s)0 5 10 15 20 25
Frac
tion
bcc
0.0
0.2
0.4
0.6
0.8
1.0
heating
cooling
melting
solid
ifyin
g
liquid
Y=4.5mm
Figure 8: Relative area fractions of the β phase In the weld as measured at a positioned 4.5 mm from the center of the weld.
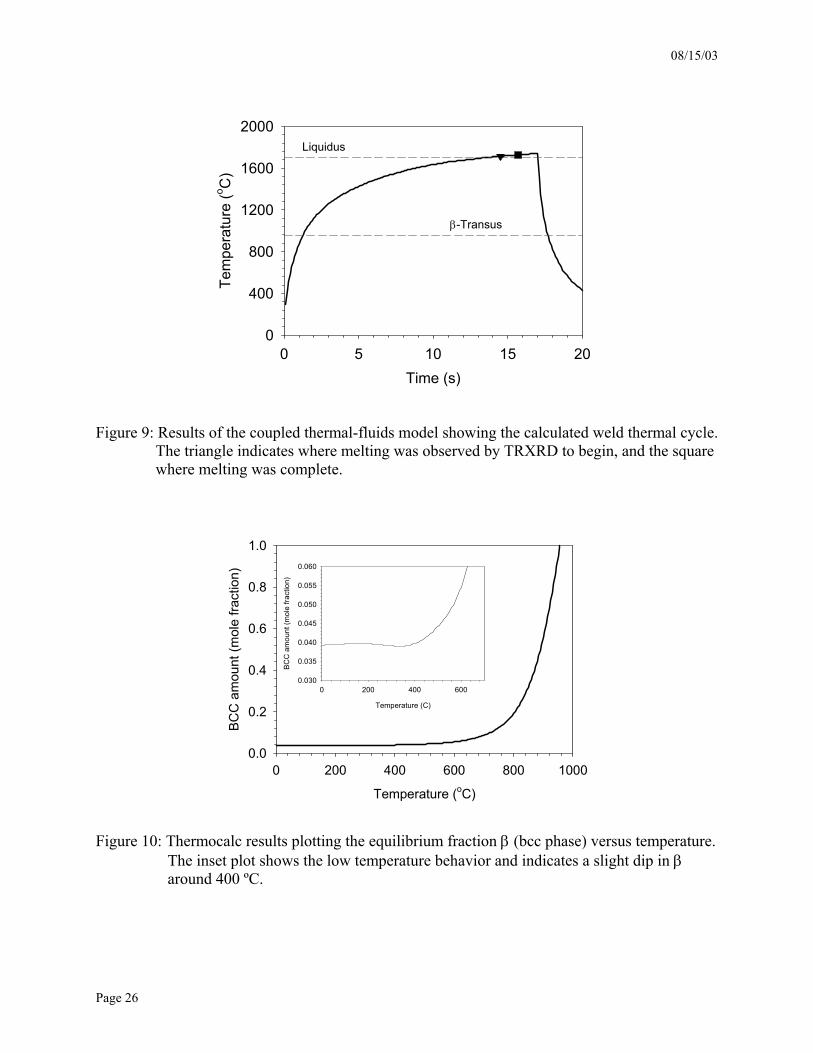
08/15/03
Page 26
Time (s)0 5 10 15 20
Tem
pera
ture
(o C)
0
400
800
1200
1600
2000Liquidus
β-Transus
Figure 9: Results of the coupled thermal-fluids model showing the calculated weld thermal cycle. The triangle indicates where melting was observed by TRXRD to begin, and the square where melting was complete.
Temperature (oC)
0 200 400 600 800 1000
BCC
am
ount
(mol
e fra
ctio
n)
0.0
0.2
0.4
0.6
0.8
1.0
Temperature (C)
0 200 400 600
BC
C a
mou
nt (m
ole
fract
ion)
0.030
0.035
0.040
0.045
0.050
0.055
0.060
Figure 10: Thermocalc results plotting the equilibrium fraction β (bcc phase) versus temperature.
The inset plot shows the low temperature behavior and indicates a slight dip in β around 400 ºC.
08/15/03
Page 27
Figure 11: Thermocalc results showing the individual compositions of a) the α phase, and b) the
β phase as a function of temperature.
Temperature (oC)
0 200 400 600 800 1000
BC
C c
ompo
sitio
n (m
ole
fract
ion)
0.0
0.2
0.4
0.6
0.8
1.0
VTiOFeAl
V Ti
Al
β-Ti
Temperature (oC)
0 200 400 600 800 1000
HC
P c
ompo
sitio
n (m
ole
fract
ion)
0.0
0.2
0.4
0.6
0.8
1.0
VTiOFeAl
V
Ti
Al
α-Ti
08/15/03
Page 28
Time (s)2 4 6 8 10 12 14
Frac
tion
β -Ti
0.0
0.2
0.4
0.6
0.8
1.0
a
heating
Temperature (oC)
1000 1200 1400 1600 1800
Frac
tion
β -Ti
0.0
0.2
0.4
0.6
0.8
1.0
bheating
Figure 12: TRXRD results are plotted as the triangular symbols showing fraction β during the heating cycle of the weld versus a) weld time after arc is on, and b) weld temperature. The solid and dashed lines correspond to the two different JMA fits of the TRXRD data as described in the main text.
08/15/03
Page 29
Cooling Time (s)0 1 2 3 4 5 6
Frac
tion
β -Ti
0.0
0.2
0.4
0.6
0.8
1.0
Liquid
cooling
a
Temperature (oC)
200 300 400 500 600 700 800 900 1000
Frac
tion
β -Ti
0.0
0.2
0.4
0.6
0.8
1.0
cooling
Ms
Figure 13: TRXRD results showing fraction β during the cooling cycle of the weld plotted versus a) weld time after arc is off and b) weld temperature. The vertical dashed lines in b correspond to the α/β transus temperature and the Ms temperature for this alloy.
08/15/03
Page 30
Figure 14: High magnification micrograph taken of the weld microstructure at the location in the FZ where the TRXRD data was taken. The acicular structure of α′ martensite is evident throughout the microstructure.
30 µm
Copyright © 2022 FDOKUMEN