
Effects of mould filling on evolution of the solid–liquid interface during solidification
10
Effects of mould filling on evolution of the solid–liquid interface during solidification Nitin Pathak, Arvind Kumar 1 , Anil Yadav, Pradip Dutta * Department of Mechanical Engineering, Indian Institute of Science, Bangalore 560012, India article info Article history: Received 20 March 2009 Accepted 25 June 2009 Available online 9 July 2009 Keywords: Filling Solidification Residual flow Volume of fluid abstract This work presents a numerical analysis of simultaneous mould filling and phase change for solidification in a two-dimensional rectangular cavity. The role of residual flow strength and temperature gradients within the solidifying domain, caused by the filling process, on the evolution of solidification interface are investigated. An implicit volume of fluid (VOF)-based algorithm has been employed for simulating the free surface flows during the filling process, while the model for solidification is based on a fixed-grid enthalpy-based control volume approach. Solidification modeling is coupled with VOF through User Defined Functions developed in the commercial computational fluid dynamics (CFD) code FLUENT 6.3.26. Comparison between results of the conventional analysis without filling effect and those of the present analysis shows that the residual flow resulting from the filling process significantly influences the progress of the solidification interface. A parametric study is also performed with variables such as cooling rate, filling velocity and filling configuration, in order to investigate the coupled effects of the buoyancy-driven flow and the residual flow on the solidification behavior. Ó 2009 Elsevier Ltd. All rights reserved. 1. Introduction Casting processes involve filling of molten metal in a mould and its solidification by withdrawal of heat. Filling and solidification in- volve rapidly growing metal/air free surface and liquid/solid inter- face within the solidifying domain, which makes the overall process experimentally difficult to visualize. Therefore, use of numerical simulations to analyze and control the solidification parameters related to fluid flow and heat transfer is desirable. However, most of the existing numerical studies deal with filling and solidification process separately i.e. filling stage simulations without phase change effects [1–4] and solidification simulations with an assumption of instantaneous filling [5–10]. Filling of mould is an essential part of a casting process which may have an influence on the heat transfer and solidification char- acteristics. The most important task in the analysis of flow during the filling process is to determine the location of the moving free surface. In literature, numerous computational methodologies have been undertaken to examine the free surface flow during the filling process [1–4]. An extensive review of numerical meth- ods pertaining to the moving interface problem can be found in [2]. Generally, the filling problems are solved either by following the imaginary particles (Marker and Cell method [3]) or by solving the transport equation for the fractional volume function [1]. In this regard, the volume of fluid method (VOF) is perhaps the most widely adopted approach to model the mould filling problems [11,12]. One of the conventional methods to analyze the casting pro- cess is to assume instantaneous filling of molten metal in the mould followed by solidification that actually does not consider the effect of residual flow generated due to filling process. In those methods, the initial conditions are assumed to be a com- pletely filled mould cavity with a uniform temperature within the solidifying domain. By ignoring the filling process, prediction of the temperature distribution within the mould may miss some key events during filling. The temperature distribution is ex- pected to be a function of various parameters such as gating and mould geometry, filling and cooling rate, strength of residual flow and the thermal properties of the mould and metal. How- ever, in most practical cases, both filling and solidification can oc- cur simultaneously and therefore influence each other [13]. When superheat of the molten metal is low or the filling rate is slow, there can be significant cooling and solidification during the fill- ing process, which can affect the filling pattern. Similarly, the fill- ing velocity and the convective effect of the residual flow resulting from the filling process can affect solidification in the mould cavity at an early stage, which can significantly influence the temperature gradients within the solidifying domain and hence evolution of the solidification interface. 1359-4311/$ - see front matter Ó 2009 Elsevier Ltd. All rights reserved. doi:10.1016/j.applthermaleng.2009.06.026 * Corresponding author. Tel.: +91 80 2293325; fax: +91 80 23604536. E-mail address: [email protected] (P. Dutta). 1 Present address: Institut Jean Lamour, Nancy-Université, Ecole des Mines de Nancy - Parc de Saurupt, F-54042 Nancy Cedex, France. Applied Thermal Engineering 29 (2009) 3669–3678 Contents lists available at ScienceDirect Applied Thermal Engineering journal homepage: www.elsevier.com/locate/apthermeng
-
Upload
independent -
Category
Documents
-
view
1 -
download
0
Transcript of Effects of mould filling on evolution of the solid–liquid interface during solidification
Applied Thermal Engineering 29 (2009) 3669–3678
Contents lists available at ScienceDirect
Applied Thermal Engineering
journal homepage: www.elsevier .com/locate /apthermeng
Effects of mould filling on evolution of the solid–liquid interfaceduring solidification
Nitin Pathak, Arvind Kumar 1, Anil Yadav, Pradip Dutta *
Department of Mechanical Engineering, Indian Institute of Science, Bangalore 560012, India
a r t i c l e i n f o a b s t r a c t
Article history:Received 20 March 2009Accepted 25 June 2009Available online 9 July 2009
Keywords:FillingSolidificationResidual flowVolume of fluid
1359-4311/$ - see front matter � 2009 Elsevier Ltd. Adoi:10.1016/j.applthermaleng.2009.06.026
* Corresponding author. Tel.: +91 80 2293325; fax:E-mail address: [email protected] (P. D
1 Present address: Institut Jean Lamour, Nancy-UnNancy - Parc de Saurupt, F-54042 Nancy Cedex, France
This work presents a numerical analysis of simultaneous mould filling and phase change for solidificationin a two-dimensional rectangular cavity. The role of residual flow strength and temperature gradientswithin the solidifying domain, caused by the filling process, on the evolution of solidification interfaceare investigated. An implicit volume of fluid (VOF)-based algorithm has been employed for simulatingthe free surface flows during the filling process, while the model for solidification is based on a fixed-gridenthalpy-based control volume approach. Solidification modeling is coupled with VOF through UserDefined Functions developed in the commercial computational fluid dynamics (CFD) code FLUENT6.3.26. Comparison between results of the conventional analysis without filling effect and those of thepresent analysis shows that the residual flow resulting from the filling process significantly influencesthe progress of the solidification interface. A parametric study is also performed with variables such ascooling rate, filling velocity and filling configuration, in order to investigate the coupled effects of thebuoyancy-driven flow and the residual flow on the solidification behavior.
� 2009 Elsevier Ltd. All rights reserved.
1. Introduction
Casting processes involve filling of molten metal in a mould andits solidification by withdrawal of heat. Filling and solidification in-volve rapidly growing metal/air free surface and liquid/solid inter-face within the solidifying domain, which makes the overallprocess experimentally difficult to visualize. Therefore, use ofnumerical simulations to analyze and control the solidificationparameters related to fluid flow and heat transfer is desirable.However, most of the existing numerical studies deal with fillingand solidification process separately i.e. filling stage simulationswithout phase change effects [1–4] and solidification simulationswith an assumption of instantaneous filling [5–10].
Filling of mould is an essential part of a casting process whichmay have an influence on the heat transfer and solidification char-acteristics. The most important task in the analysis of flow duringthe filling process is to determine the location of the moving freesurface. In literature, numerous computational methodologieshave been undertaken to examine the free surface flow duringthe filling process [1–4]. An extensive review of numerical meth-ods pertaining to the moving interface problem can be found in[2]. Generally, the filling problems are solved either by following
ll rights reserved.
+91 80 23604536.utta).iversité, Ecole des Mines de.
the imaginary particles (Marker and Cell method [3]) or by solvingthe transport equation for the fractional volume function [1]. Inthis regard, the volume of fluid method (VOF) is perhaps the mostwidely adopted approach to model the mould filling problems[11,12].
One of the conventional methods to analyze the casting pro-cess is to assume instantaneous filling of molten metal in themould followed by solidification that actually does not considerthe effect of residual flow generated due to filling process. Inthose methods, the initial conditions are assumed to be a com-pletely filled mould cavity with a uniform temperature withinthe solidifying domain. By ignoring the filling process, predictionof the temperature distribution within the mould may miss somekey events during filling. The temperature distribution is ex-pected to be a function of various parameters such as gatingand mould geometry, filling and cooling rate, strength of residualflow and the thermal properties of the mould and metal. How-ever, in most practical cases, both filling and solidification can oc-cur simultaneously and therefore influence each other [13]. Whensuperheat of the molten metal is low or the filling rate is slow,there can be significant cooling and solidification during the fill-ing process, which can affect the filling pattern. Similarly, the fill-ing velocity and the convective effect of the residual flowresulting from the filling process can affect solidification in themould cavity at an early stage, which can significantly influencethe temperature gradients within the solidifying domain andhence evolution of the solidification interface.
Chilled wall 0== vu
K473=cT
x
y
0=∂∂==
x
Tvu
Riser outlet
atmoutlet pp =
0=∂∂==
y
Tvu
0=∂∂==
y
Tvu
Inlet 10 mm Vinlet = 0.1 m/s Tinlet = 700 K
50 mm
40 mm
10 mm
10 mm
Fig. 1. Problem specification for solidification of pure Pb along with the boundaryconditions.
Nomenclature
aP, a0P coefficient in discretization equation
c specific heat (J kg�1 K�1)C constant related to solidification phase morphology
(kg m�3 s�1)fl weight fraction of liquidfs weight fraction of solidF volume of fluid function~gr acceleration due to gravity vector (m s�2)gl volume fraction of liquidgs volume fraction of solidG�1 inverse of latent heat functionH enthalpy (J kg�1)DH latent enthalpy (J kg�1)k thermal conductivity (W m�1 K�1)L latent heat of fusion (J kg�1)p dynamic pressure (N m�2)S source termt time (s)T temperature (K)u, v velocities in x and y directions (m s�1)~u continuum velocity vector (m s�1)Vinlet filling velocity at the inlet (m s�1)Tinlet inlet temperature of the melt (K)x, y cartesian coordinates
Greek symbolsbT thermal expansion coefficient (K�1)l dynamic viscosity (kg m�1 s�1)q density (kg m�3)w streamfunction
Non-dimensional parametersSte = cmetalðTm�TcÞ
L stefan number
Subscriptsair air phaseatm atmosphericb buoyancyc coldeff effectivei initiall liquid phasem meltingmetal metal phasen iteration levelP node point Ps solid phase
3670 N. Pathak et al. / Applied Thermal Engineering 29 (2009) 3669–3678
In view of this, there have been some recent studies on simulta-neous mould filling and solidification. Lee et al. [11] presented aqualitative analysis of the entire phenomenon. Shepel and Paolucci[12] simulated a permanent mould casting process using a finiteelement algorithm. The main objective of their work was to findan efficient numerical algorithm to model the entire casting pro-cess rather than assessing the effects of filling. Ravindaran and Le-wis [14] presented a finite element algorithm for filling of mouldswhich also models the solidification effects during the filling pro-cess. Additionally, there have been some numerical studies onsimultaneous mould filling and solidification [15,16]. In thesestudies only qualitative explanations have been reported with re-gard to the effects of filling.
To the best of the authors’ knowledge, there are not many studiesexisting on the role of residual flow arising due to filling and the ef-fects of various relevant parameters on the evolution of the solidifi-cation interface. In this respect, two important aspects of thenumerical studies aimed require special attention: (a) suitabletracking of the metal-air interface during filling, and (b) integrationof a macroscopic solidification model in the numerical methodologyfor modeling the phase change process during filling (if any) andafter complete filling. With this viewpoint, the present paper dealswith a numerical model to simulate the casting process consideringfilling and solidification. The present model uses a volume of fluid(VOF) method for tracking the metal-air interface during fillingand an enthalpy-based macro-scale model for the phase change pro-cess. The model is applied to the case of filling and solidification ofpure Pb in a two-dimensional rectangular cavity. The influence ofimportant parameters namely, cooling boundary condition, fillingvelocity and filling configuration on the coupled effects of the buoy-ancy-driven flow and the residual flow are also investigated.
2. Mathematical formulation
2.1. Problem description
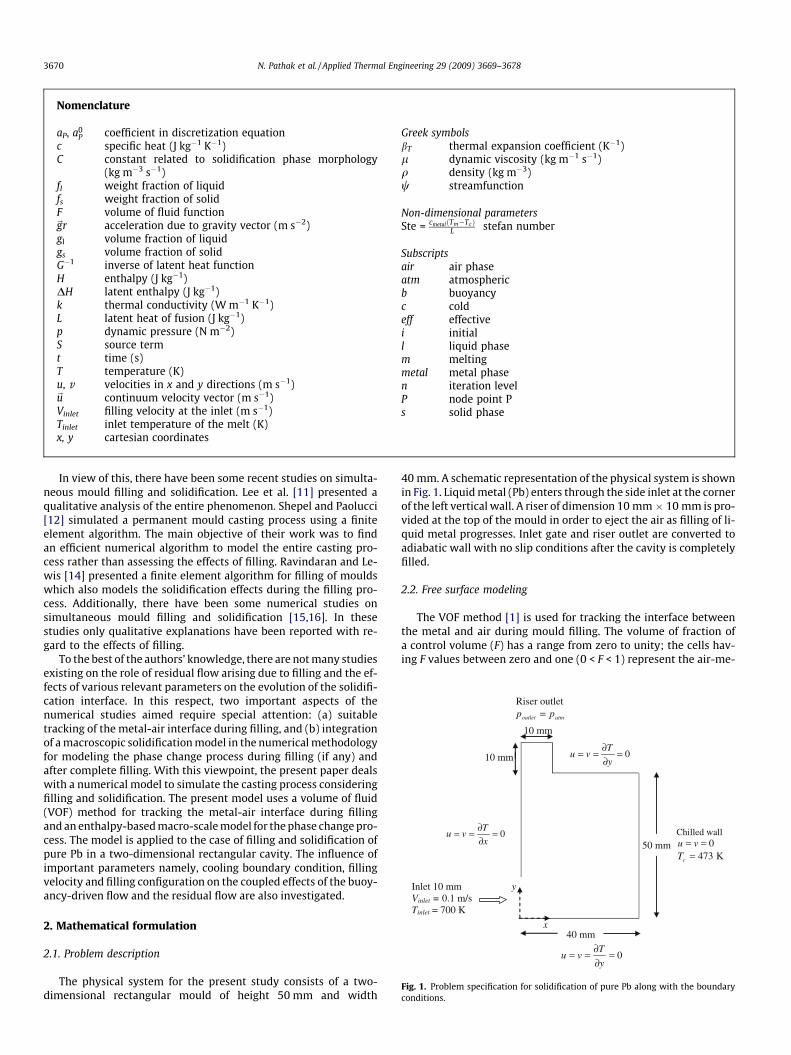
The physical system for the present study consists of a two-dimensional rectangular mould of height 50 mm and width
40 mm. A schematic representation of the physical system is shownin Fig. 1. Liquid metal (Pb) enters through the side inlet at the cornerof the left vertical wall. A riser of dimension 10 mm � 10 mm is pro-vided at the top of the mould in order to eject the air as filling of li-quid metal progresses. Inlet gate and riser outlet are converted toadiabatic wall with no slip conditions after the cavity is completelyfilled.
2.2. Free surface modeling
The VOF method [1] is used for tracking the interface betweenthe metal and air during mould filling. The volume of fraction ofa control volume (F) has a range from zero to unity; the cells hav-ing F values between zero and one (0 < F < 1) represent the air-me-
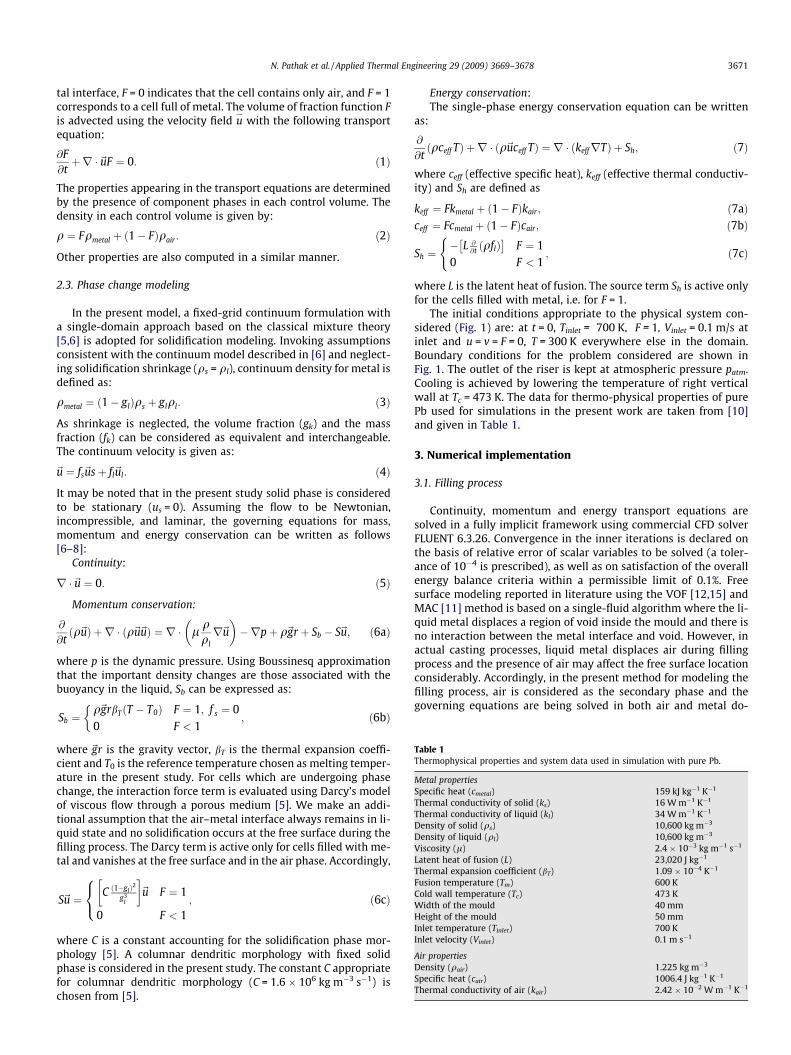
Table 1Thermophysical properties and system data used in simulation with pure Pb.
Metal propertiesSpecific heat (cmetal) 159 kJ kg�1 K�1
Thermal conductivity of solid (ks) 16 W m�1 K�1
Thermal conductivity of liquid (kl) 34 W m�1 K�1
Density of solid (qs) 10,600 kg m�3
Density of liquid (ql) 10,600 kg m�3
Viscosity (l) 2.4 � 10�3 kg m�1 s�1
Latent heat of fusion (L) 23,020 J kg�1
Thermal expansion coefficient (bT) 1.09 � 10�4 K�1
Fusion temperature (Tm) 600 KCold wall temperature (Tc) 473 KWidth of the mould 40 mmHeight of the mould 50 mmInlet temperature (Tinlet) 700 KInlet velocity (Vinlet) 0.1 m s�1
Air propertiesDensity (qair) 1.225 kg m�3
Specific heat (cair) 1006.4 J kg�1 K�1
Thermal conductivity of air (kair) 2.42 � 10�2 W m�1 K�1
N. Pathak et al. / Applied Thermal Engineering 29 (2009) 3669–3678 3671
tal interface, F = 0 indicates that the cell contains only air, and F = 1corresponds to a cell full of metal. The volume of fraction function Fis advected using the velocity field u
*with the following transport
equation:
@F@tþr �~uF ¼ 0: ð1Þ
The properties appearing in the transport equations are determinedby the presence of component phases in each control volume. Thedensity in each control volume is given by:
q ¼ Fqmetal þ ð1� FÞqair : ð2Þ
Other properties are also computed in a similar manner.
2.3. Phase change modeling
In the present model, a fixed-grid continuum formulation witha single-domain approach based on the classical mixture theory[5,6] is adopted for solidification modeling. Invoking assumptionsconsistent with the continuum model described in [6] and neglect-ing solidification shrinkage (qs = ql), continuum density for metal isdefined as:
qmetal ¼ ð1� glÞqs þ glql: ð3Þ
As shrinkage is neglected, the volume fraction (gk) and the massfraction (fk) can be considered as equivalent and interchangeable.The continuum velocity is given as:
~u ¼ fs~usþ fl~ul: ð4Þ
It may be noted that in the present study solid phase is consideredto be stationary (us = 0). Assuming the flow to be Newtonian,incompressible, and laminar, the governing equations for mass,momentum and energy conservation can be written as follows[6–8]:
Continuity:
r �~u ¼ 0: ð5Þ
Momentum conservation:
@
@tðq~uÞ þ r � ðq~u~uÞ ¼ r � l q
qlr~u
� ��rpþ q~gr þ Sb � S~u; ð6aÞ
where p is the dynamic pressure. Using Boussinesq approximationthat the important density changes are those associated with thebuoyancy in the liquid, Sb can be expressed as:
Sb ¼q~grbTðT � T0Þ F ¼ 1; f s ¼ 00 F < 1
�; ð6bÞ
where ~gr is the gravity vector, bT is the thermal expansion coeffi-cient and T0 is the reference temperature chosen as melting temper-ature in the present study. For cells which are undergoing phasechange, the interaction force term is evaluated using Darcy’s modelof viscous flow through a porous medium [5]. We make an addi-tional assumption that the air–metal interface always remains in li-quid state and no solidification occurs at the free surface during thefilling process. The Darcy term is active only for cells filled with me-tal and vanishes at the free surface and in the air phase. Accordingly,
S~u ¼ C ð1�glÞ2
g3l
� �~u F ¼ 1
0 F < 1
8<: ; ð6cÞ
where C is a constant accounting for the solidification phase mor-phology [5]. A columnar dendritic morphology with fixed solidphase is considered in the present study. The constant C appropriatefor columnar dendritic morphology (C = 1.6 � 106 kg m�3 s�1) ischosen from [5].
Energy conservation:The single-phase energy conservation equation can be written
as:
@
@tðqceff TÞ þ r � ðq~uceff TÞ ¼ r � ðkeffrTÞ þ Sh; ð7Þ
where ceff (effective specific heat), keff (effective thermal conductiv-ity) and Sh are defined as
keff ¼ Fkmetal þ ð1� FÞkair; ð7aÞceff ¼ Fcmetal þ ð1� FÞcair; ð7bÞ
Sh ¼� L @
@t ðqflÞ� �
F ¼ 10 F < 1
(; ð7cÞ
where L is the latent heat of fusion. The source term Sh is active onlyfor the cells filled with metal, i.e. for F = 1.
The initial conditions appropriate to the physical system con-sidered (Fig. 1) are: at t = 0, Tinlet = 700 K, F = 1, Vinlet = 0.1 m/s atinlet and u = v = F = 0, T = 300 K everywhere else in the domain.Boundary conditions for the problem considered are shown inFig. 1. The outlet of the riser is kept at atmospheric pressure patm.Cooling is achieved by lowering the temperature of right verticalwall at Tc = 473 K. The data for thermo-physical properties of purePb used for simulations in the present work are taken from [10]and given in Table 1.
3. Numerical implementation
3.1. Filling process
Continuity, momentum and energy transport equations aresolved in a fully implicit framework using commercial CFD solverFLUENT 6.3.26. Convergence in the inner iterations is declared onthe basis of relative error of scalar variables to be solved (a toler-ance of 10�4 is prescribed), as well as on satisfaction of the overallenergy balance criteria within a permissible limit of 0.1%. Freesurface modeling reported in literature using the VOF [12,15] andMAC [11] method is based on a single-fluid algorithm where the li-quid metal displaces a region of void inside the mould and there isno interaction between the metal interface and void. However, inactual casting processes, liquid metal displaces air during fillingprocess and the presence of air may affect the free surface locationconsiderably. Accordingly, in the present method for modeling thefilling process, air is considered as the secondary phase and thegoverning equations are being solved in both air and metal do-
3672 N. Pathak et al. / Applied Thermal Engineering 29 (2009) 3669–3678
mains [17]. The interface treatment is accomplished via a Geomet-ric Reconstruction Scheme detailed in references [1,17].
3.2. Phase change process
The model for combined mould filling and solidification isdeveloped by integrating VOF model and solidification modelthrough User Defined Functions in FLUENT. Various source termssuch as: Sb; S~u; Sh are included in the respective governing equa-tions by writing appropriate user defined subroutines. The govern-ing equations of conservation are discretized using a pressurebased finite volume method according to the SIMPLE algorithm[18]. The liquid fraction (fl) appearing in the governing equationsis calculated using an enthalpy update scheme. The liquid fractionis given as:
fl ¼DHL; ð8Þ
where DH is the latent enthalpy of the cell filled with metal. For anaccurate prediction of the liquid fraction in the present ‘fixed-grid
Fig. 2. Snapshots of filling sequence. The metal/air interface is shown during the
Fig. 3. Residual flow and temperature distributions in the cavity just after complete filisotherms contours (in K).
enthalpy-based’ procedure, the latent heat content of each cell filledwith metal needs to be updated according to the temperature val-ues predicted by the macroscopic conservation equations, in eachiteration within a time step. In the present context, an iterativeupdating scheme [5] is implemented through user defined func-tions, which is of the form
½DHP�nþ1 ¼ ½DHP�n þaP
a0P
k½fhPgn � G�1fDHPgn�: ð9Þ
In Eq. (9), a0p ¼ qDeltaV=Dt, and aP are the coefficient of TP in the dis-
cretization equation of the governing energy equation, k is a relax-ation factor, G�1 is inverse of suitable latent heat functiondepending on the phase change morphology, DV is the volume ofa computational cell centered around the grid point P, Dt is the timestep chosen and hp is the sensible enthalpy appropriate to the nodalpoint P. Guidelines for the choice of appropriate form of G�1 are pre-sented in reference [19]. In case of pure metal, G�1 function is givenas:
G�1½DH� ¼ cmetalTm; ð10Þ
filling process. Gray and white colors represent metal and air, respectively.
ling of the mould (t = 2 s): (a) velocity vectors; (b) streamfunction distribution; (c)

Fig. 4. Velocity vectors superimposed on solidification interface without filling effects. The black color denotes fully solid region and white color denotes fully liquid region.
Fig. 5. Velocity vectors superimposed on solidification interface considering filling effects. The black color denotes fully solid region and white color denotes fully liquidregion. The times shown are after complete filling of the mould which takes approximately 2 s.
N. Pathak et al. / Applied Thermal Engineering 29 (2009) 3669–3678 3673
where cmetal is the specific heat of metal and Tm is the melting tem-perature. Using Eqs. (8) and (10) in Eq. (9) we can write the iterativescheme in terms of fl as
½fl;P�nþ1 ¼ ½fl;P �n þaP
a0P
kcmetal
L½fTPgn � fTm;Pgn�: ð11Þ
It should be noted that since solidification of pure metal is consid-ered in the present manuscript, the temperate of any cell P is themelting temperature Tm for 0 < fl < 1. As suggested in [5,8], a highervalue of Dt may result in divergence of the scheme given by Eq.(11). Sometimes, a relaxation factor (k � 0.3–0.7) is also used inEq. (11) in order to achieve converged and stable solutions. Basedon suggestions provided in [5,8] and also from our own numericaltests we experienced that lower value of Dt leads to faster conver-gence but it also increases the CPU time. Based on our experiencewith similar trial simulations using other time-step, Dt chosen inthe present study (Dt = 0.02 s) allows for reasonable computationalcosts and further refinement in time-step does not change the re-sults appreciably.It may be noted that the air-metal interface is con-sidered to be sharp during the filling process as the interfaceincludes only one cell along the free surface profile. Solidification
is inhibited in the cells having F < 1 by avoiding enthalpy updatein those cells.
4. Results and discussion
Simulations are performed for solidification in the chosengeometry (Fig. 1) for two cases: (1) without filling and (2) with fill-ing process. Case 1 involves initial conditions of uniform tempera-ture and quiescent melt in the mould, while simulations for case 2involve simultaneous filling and phase change.
4.1. Filling process
Fig. 2 describes the filling sequence where the location of free sur-face (metal/air interface) is shown at various times. Initially the li-quid metal flows towards the right wall and impinges on it as seenin Fig. 2. This causes an interaction between the returning flowand the incoming flow from the side inlet. As filling proceeds, thewaviness of the free surface diminishes and at approximately 1.2 s,the free surface becomes almost flat, indicating a smooth mould fill-ing thereafter. The cavity gets completely filled within approxi-
3674 N. Pathak et al. / Applied Thermal Engineering 29 (2009) 3669–3678
mately 2 s of filling, after which the inlet gate is treated as an adia-batic wall in the computational model. Residual flow in the formsof velocity vectors, stream functions and temperature contours justafter filling are shown in Fig. 3. A large circulation is developed dueto the inertia of the incoming liquid metal along with a weak second-ary flow at top and bottom corners of the right wall (Fig. 3a and b).Such flow structures, along with thermally driven convection whichdevelops subsequently due to cooling of liquid metal, are bound to
0
5
10
15
20
25
0 5 10 15 20 25Time (s)
Inte
rface
loca
tion
(mm
)
Without filling
Side filling
(b)
0
5
10
15
20
25
30
0 5 10 15 20 25
Time (s)
Inte
rface
loca
tion
(mm
)
Without filling
Side filling
(c)
0
5
10
15
20
25
30
0 5 10 15 20 25Time (s)
Inte
rface
loc
atio
n (m
m)
Without filling
Side filling
(a)
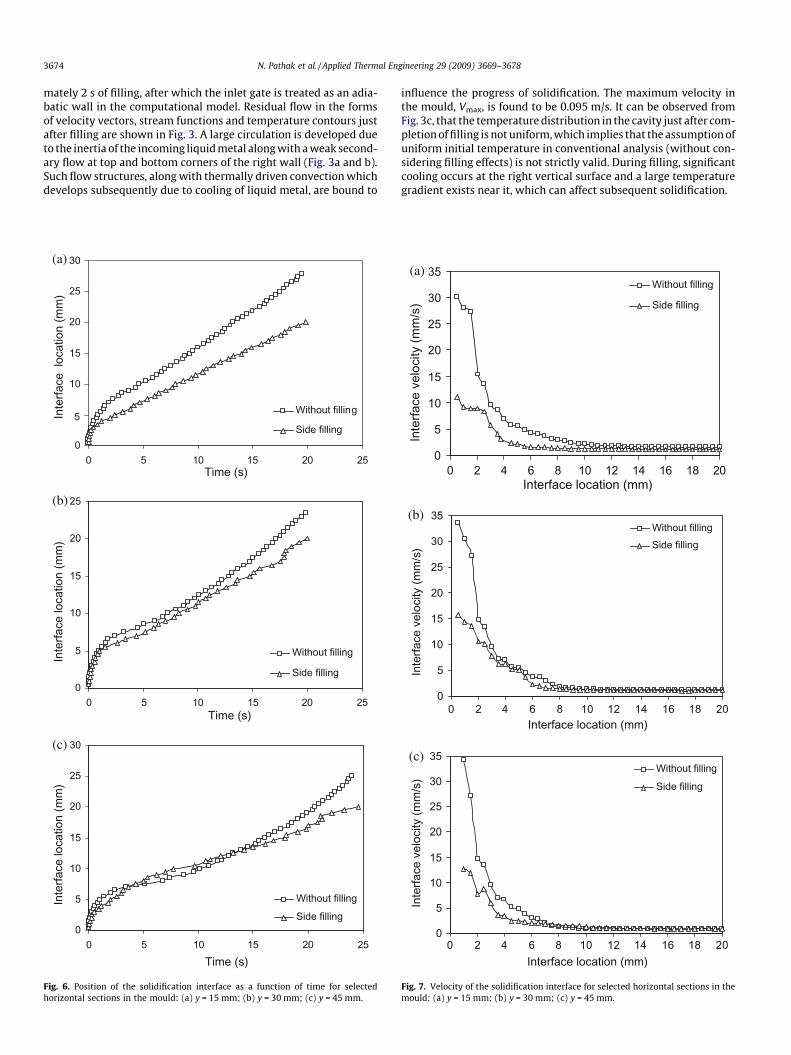
Fig. 6. Position of the solidification interface as a function of time for selectedhorizontal sections in the mould: (a) y = 15 mm; (b) y = 30 mm; (c) y = 45 mm.
influence the progress of solidification. The maximum velocity inthe mould, Vmax, is found to be 0.095 m/s. It can be observed fromFig. 3c, that the temperature distribution in the cavity just after com-pletion of filling is not uniform, which implies that the assumption ofuniform initial temperature in conventional analysis (without con-sidering filling effects) is not strictly valid. During filling, significantcooling occurs at the right vertical surface and a large temperaturegradient exists near it, which can affect subsequent solidification.
0
5
10
15
20
25
30
35
0 2 4 6 8 10 12 14 16 18 20Interface location (mm)
Inte
rface
vel
ocity
(mm
/s)
Without fillingSide filling
(b)
0
5
10
15
20
25
30
35
0 2 4 6 8 10 12 14 16 18 20Interface location (mm)
Inte
rface
vel
ocity
(mm
/s)
Without filling
Side filling
(c)
0
5
10
15
20
25
30
35
0 2 4 6 8 10 12 14 16 18 20Interface location (mm)
Inte
rface
vel
ocity
(mm
/s)
Without filling
Side filling
(a)
Fig. 7. Velocity of the solidification interface for selected horizontal sections in themould: (a) y = 15 mm; (b) y = 30 mm; (c) y = 45 mm.
N. Pathak et al. / Applied Thermal Engineering 29 (2009) 3669–3678 3675
4.2. Phase change process
4.2.1. Evolution of flow field and solidification interfaceThe superimposed velocity vectors and solid fraction plots for
the two cases are shown in Figs. 4 and 5, respectively. For the casewithout filling effects, due to thermally driven convection, cooledmolten alloy descends along the solid–liquid interface while hottermolten metal ascends along the left wall. As a result, the solidifica-tion front advances faster in the bottom half of the cavity.However, for the case with filling effects, the buoyancy inducedflow and the residual flow oppose each other. The residual flowdominates completely during the early stages of solidification(Fig. 5a–c) but its strength diminishes gradually as two secondaryvortices start growing at the top and bottom corners of the cavitynear the right cooling face (Fig. 5a). These secondary vortices recir-culate the liquid metal, causing a delayed growth of solidificationinterface in those regions. The residual flow remains in the solidi-fying cavity for approximately 10 s. By comparing Fig. 4a withFig. 5a, it can be observed that there is an appreciable differencein flow pattern and in the shape of the solidification interface. Att = 13 s, for the case without filling effects (Fig. 4d), the solidifica-tion interface becomes more inclined due to the influence of natu-ral convection. At the same time, for case with filling effects, thenatural convection effect becomes more dominant and a largeclockwise vortex develops (see Fig. 5d). During this period oftransition from residual to thermally dominant flow, the shape of
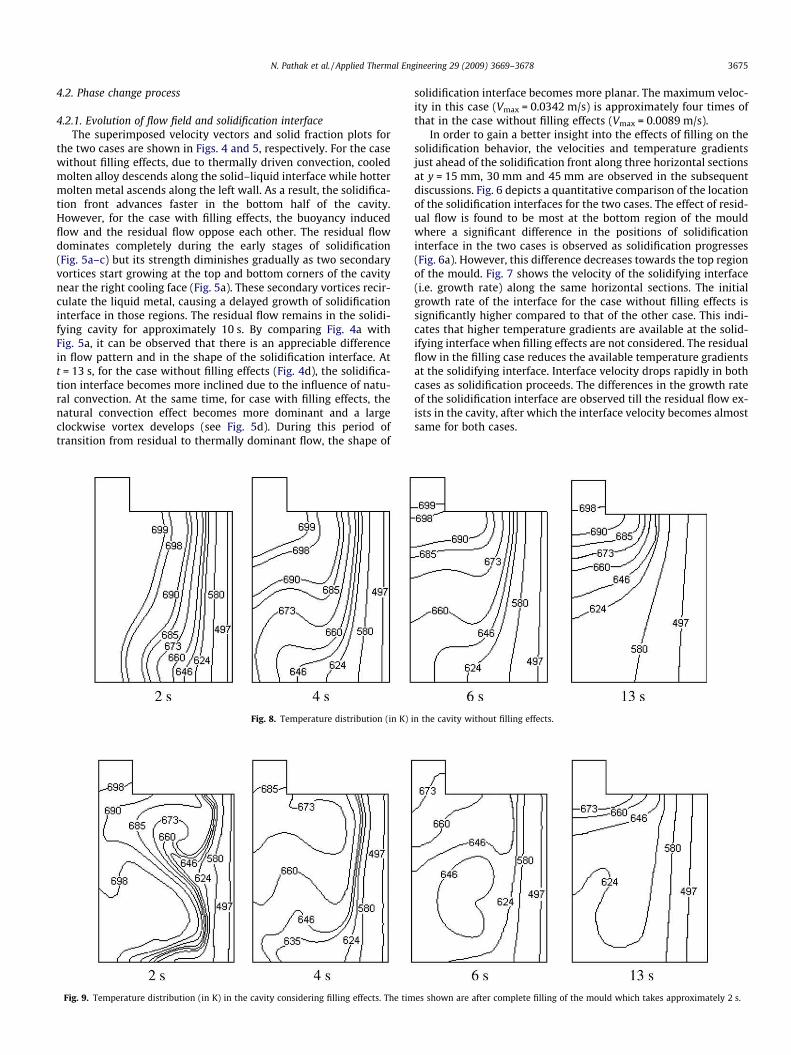
Fig. 8. Temperature distribution (in K) i
Fig. 9. Temperature distribution (in K) in the cavity considering filling effects. The tim
solidification interface becomes more planar. The maximum veloc-ity in this case (Vmax = 0.0342 m/s) is approximately four times ofthat in the case without filling effects (Vmax = 0.0089 m/s).
In order to gain a better insight into the effects of filling on thesolidification behavior, the velocities and temperature gradientsjust ahead of the solidification front along three horizontal sectionsat y = 15 mm, 30 mm and 45 mm are observed in the subsequentdiscussions. Fig. 6 depicts a quantitative comparison of the locationof the solidification interfaces for the two cases. The effect of resid-ual flow is found to be most at the bottom region of the mouldwhere a significant difference in the positions of solidificationinterface in the two cases is observed as solidification progresses(Fig. 6a). However, this difference decreases towards the top regionof the mould. Fig. 7 shows the velocity of the solidifying interface(i.e. growth rate) along the same horizontal sections. The initialgrowth rate of the interface for the case without filling effects issignificantly higher compared to that of the other case. This indi-cates that higher temperature gradients are available at the solid-ifying interface when filling effects are not considered. The residualflow in the filling case reduces the available temperature gradientsat the solidifying interface. Interface velocity drops rapidly in bothcases as solidification proceeds. The differences in the growth rateof the solidification interface are observed till the residual flow ex-ists in the cavity, after which the interface velocity becomes almostsame for both cases.
n the cavity without filling effects.
es shown are after complete filling of the mould which takes approximately 2 s.
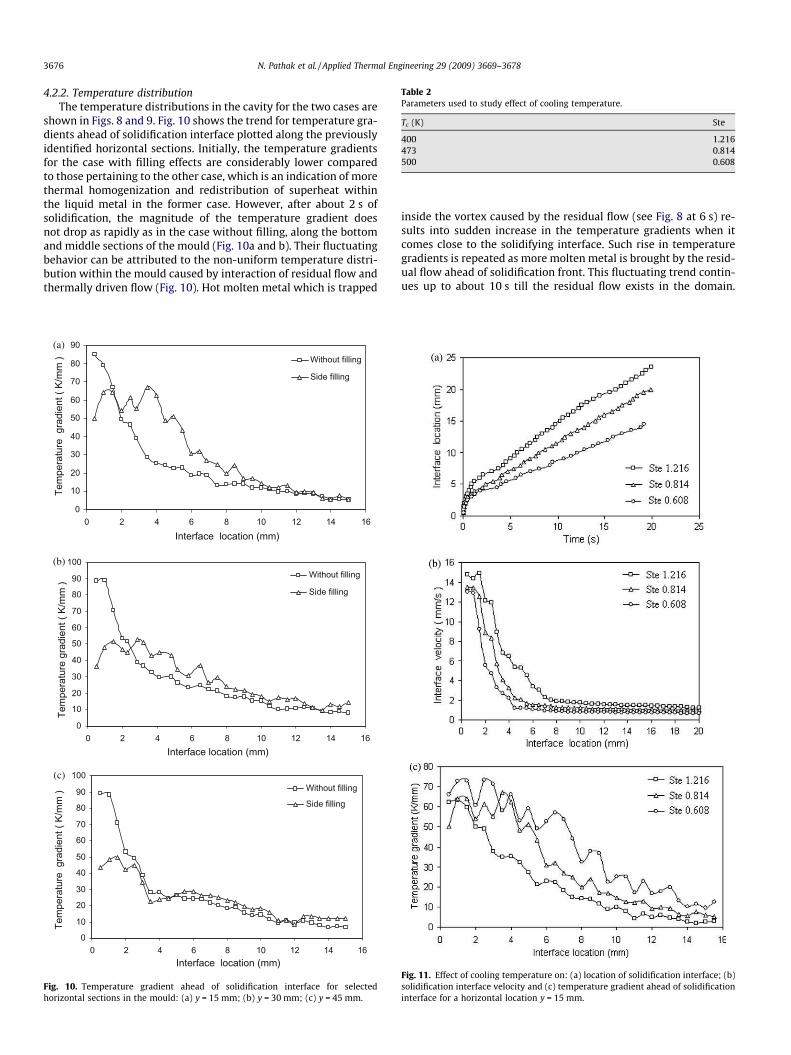
Table 2Parameters used to study effect of cooling temperature.
Tc (K) Ste
400 1.216473 0.814500 0.608
3676 N. Pathak et al. / Applied Thermal Engineering 29 (2009) 3669–3678
4.2.2. Temperature distributionThe temperature distributions in the cavity for the two cases are
shown in Figs. 8 and 9. Fig. 10 shows the trend for temperature gra-dients ahead of solidification interface plotted along the previouslyidentified horizontal sections. Initially, the temperature gradientsfor the case with filling effects are considerably lower comparedto those pertaining to the other case, which is an indication of morethermal homogenization and redistribution of superheat withinthe liquid metal in the former case. However, after about 2 s ofsolidification, the magnitude of the temperature gradient doesnot drop as rapidly as in the case without filling, along the bottomand middle sections of the mould (Fig. 10a and b). Their fluctuatingbehavior can be attributed to the non-uniform temperature distri-bution within the mould caused by interaction of residual flow andthermally driven flow (Fig. 10). Hot molten metal which is trapped
(b)
(c)
(a)
0
10
20
30
40
50
60
70
80
90
0 2 4 6 8 10 12 14 16
Interface location (mm)
Tem
pera
ture
gra
dien
t ( K
/mm
) Without filling
Side filling
0
10
20
30
40
50
60
70
80
90
100
0 2 4 6 8 10 12 14 16Interface location (mm)
Tem
pera
ture
gra
dien
t ( K
/mm
)
Without filling
Side filling
0
10
20
30
40
50
60
70
80
90
100
0 2 4 6 8 10 12 14 16Interface location (mm)
Tem
pera
ture
gra
dien
t ( K
/mm
) Without filling
Side filling
Fig. 10. Temperature gradient ahead of solidification interface for selectedhorizontal sections in the mould: (a) y = 15 mm; (b) y = 30 mm; (c) y = 45 mm.
inside the vortex caused by the residual flow (see Fig. 8 at 6 s) re-sults into sudden increase in the temperature gradients when itcomes close to the solidifying interface. Such rise in temperaturegradients is repeated as more molten metal is brought by the resid-ual flow ahead of solidification front. This fluctuating trend contin-ues up to about 10 s till the residual flow exists in the domain.
Fig. 11. Effect of cooling temperature on: (a) location of solidification interface; (b)solidification interface velocity and (c) temperature gradient ahead of solidificationinterface for a horizontal location y = 15 mm.

N. Pathak et al. / Applied Thermal Engineering 29 (2009) 3669–3678 3677
However, for the case without filling effects, the temperature gra-dients decrease at a nearly uniform rate with small undulations.
Fig. 12. Effect of filling velocity on: (a) location of solidification interface; (b)solidification interface velocity and (c) temperature gradient ahead of solidificationinterface for a horizontal location y = 15 mm.
5. Effects of process parameters
As observed in the previous section, the relative strength of con-vection caused by thermal buoyancy and residual flow governs theflow characteristic in the cavity which ultimately determines theevolution of the solidification interface. The strength and durationof residual flow may depend on various parameters such as fillingvelocity, cooling rate, thermo-physical properties of the metal andgeometrical configuration used for filling. In view of this, a system-atic study with some relevant process parameters is performed toinvestigate their effects on the solidification behavior. The set ofparameters used in the previous section is defined as the base casestudy.
5.1. Effect of cooling rate
In order to assess the effect of cold surface temperature (Tc) onthe evolution of solidification interface, numerical simulations arecarried out for three different cooling temperatures based on non-dimensional parameter, Stefan number, Ste (see Table 2). The otherparameters are kept same as in the base case study. The Stefannumber is defined as:
Ste ¼ cmetalðTm � TcÞL
ð12Þ
Fig. 11 shows plots for interface location, interface velocity andtemperature gradient at the solidifying interface for Ste = 1.216,0.814 and 0.608. The results are shown at the horizontal locationy = 15 mm where the effect of filling is expected to be significant.The results discussed in the previous section (base case) are witha cold surface temperature of 473 K which corresponds toSte = 0.814. With larger Ste values, the interface grows faster(Fig. 11a and b) and fluctuation in temperature gradients reduces(Fig. 11c). This can be attributed to shorter duration of dominanceof residual flow in the cavity for larger Ste. In this case, the higherstrength of thermal convection causes the residual flow to ceasefaster.
5.2. Effect of filling velocity
The effect of filling velocity is assessed by carrying out numer-ical simulations for three different inlet velocities: 0.05 m/s,0.10 m/s, and 0.15 m/s. The results discussed in the previous sec-tion (base case) are with inlet velocity of 0.10 m/s. Fig. 12 showsthe location of the solidification interface, interface velocity andthe corresponding temperature gradients. Higher growth rate isobserved for low inlet velocities (Fig. 12a and b) as the strengthof residual flow is lower. This also results in less fluctuation inthe temperature gradient at the solidifying interface (Fig. 12c).
5.3. Effect of filling configuration
The effect of filling configuration is studied by changing thefilling direction. Instead of horizontal filling (as shown inFig. 1), the mould is now subjected to bottom filling on the leftside, such that the overall direction of residual flow is clockwiseand thus assisting the buoyancy-driven flow. On comparing theside filling (Fig. 4) and the bottom filling (Fig. 13) cases, we ob-serve that the interface shapes are different. In case of bottomfilling, bulge in the shape of the interface at the mid-height issuppressed (Fig. 13a and b) and higher growth rate is observedat the bottom region of the mould.
6. Conclusions
The coupled effect of buoyancy-driven flow and the residualflow, generated by the filling process, on the solidification behavioris illustrated by carrying out a numerical study for simultaneousmould filling and solidification of a pure metal. The numericalmethodology involves volume of fluid method for modeling thefilling process, and a solidification model based on a fixed-gridenthalpy-based approach is integrated into the filling model formodeling the phase change process. Filling process modifies tem-perature distributions and sets up a residual flow in the cavity,which significantly changes the heat transport in the solidifying
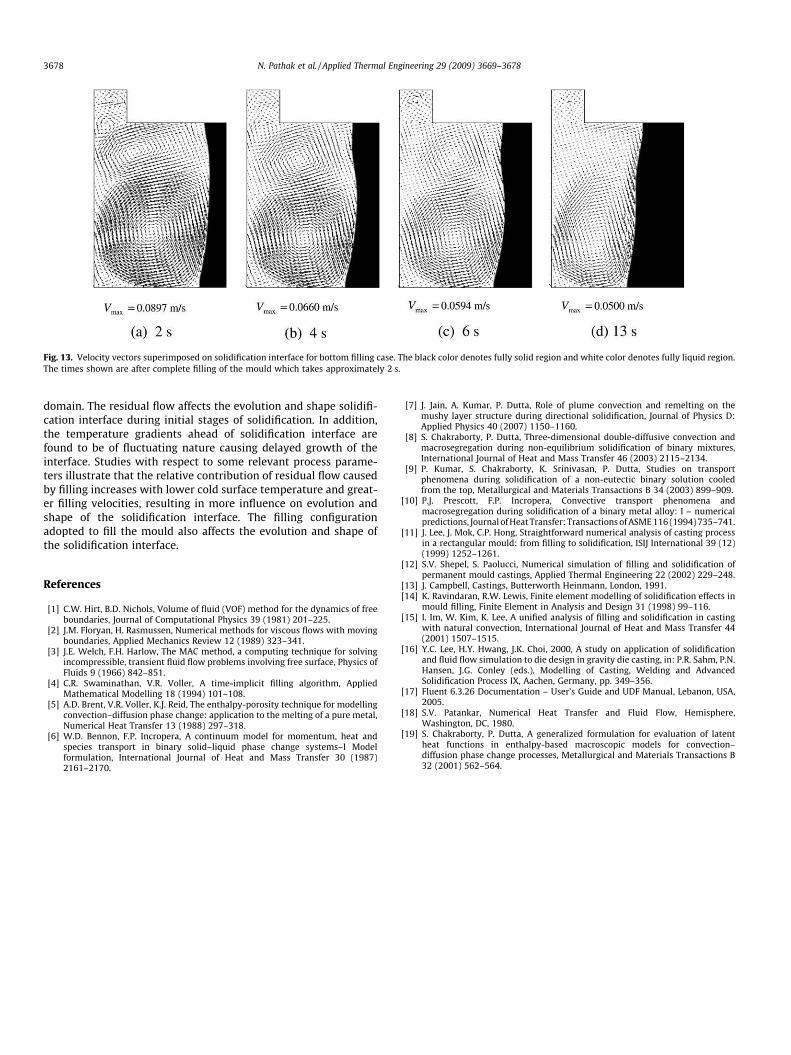
Fig. 13. Velocity vectors superimposed on solidification interface for bottom filling case. The black color denotes fully solid region and white color denotes fully liquid region.The times shown are after complete filling of the mould which takes approximately 2 s.
3678 N. Pathak et al. / Applied Thermal Engineering 29 (2009) 3669–3678
domain. The residual flow affects the evolution and shape solidifi-cation interface during initial stages of solidification. In addition,the temperature gradients ahead of solidification interface arefound to be of fluctuating nature causing delayed growth of theinterface. Studies with respect to some relevant process parame-ters illustrate that the relative contribution of residual flow causedby filling increases with lower cold surface temperature and great-er filling velocities, resulting in more influence on evolution andshape of the solidification interface. The filling configurationadopted to fill the mould also affects the evolution and shape ofthe solidification interface.
References
[1] C.W. Hirt, B.D. Nichols, Volume of fluid (VOF) method for the dynamics of freeboundaries, Journal of Computational Physics 39 (1981) 201–225.
[2] J.M. Floryan, H. Rasmussen, Numerical methods for viscous flows with movingboundaries, Applied Mechanics Review 12 (1989) 323–341.
[3] J.E. Welch, F.H. Harlow, The MAC method, a computing technique for solvingincompressible, transient fluid flow problems involving free surface, Physics ofFluids 9 (1966) 842–851.
[4] C.R. Swaminathan, V.R. Voller, A time-implicit filling algorithm, AppliedMathematical Modelling 18 (1994) 101–108.
[5] A.D. Brent, V.R. Voller, K.J. Reid, The enthalpy-porosity technique for modellingconvection–diffusion phase change: application to the melting of a pure metal,Numerical Heat Transfer 13 (1988) 297–318.
[6] W.D. Bennon, F.P. Incropera, A continuum model for momentum, heat andspecies transport in binary solid–liquid phase change systems–I Modelformulation, International Journal of Heat and Mass Transfer 30 (1987)2161–2170.
[7] J. Jain, A. Kumar, P. Dutta, Role of plume convection and remelting on themushy layer structure during directional solidification, Journal of Physics D:Applied Physics 40 (2007) 1150–1160.
[8] S. Chakraborty, P. Dutta, Three-dimensional double-diffusive convection andmacrosegregation during non-equilibrium solidification of binary mixtures,International Journal of Heat and Mass Transfer 46 (2003) 2115–2134.
[9] P. Kumar, S. Chakraborty, K. Srinivasan, P. Dutta, Studies on transportphenomena during solidification of a non-eutectic binary solution cooledfrom the top, Metallurgical and Materials Transactions B 34 (2003) 899–909.
[10] P.J. Prescott, F.P. Incropera, Convective transport phenomena andmacrosegregation during solidification of a binary metal alloy: I – numericalpredictions, Journal of Heat Transfer: Transactions of ASME 116 (1994) 735–741.
[11] J. Lee, J. Mok, C.P. Hong, Straightforward numerical analysis of casting processin a rectangular mould: from filling to solidification, ISIJ International 39 (12)(1999) 1252–1261.
[12] S.V. Shepel, S. Paolucci, Numerical simulation of filling and solidification ofpermanent mould castings, Applied Thermal Engineering 22 (2002) 229–248.
[13] J. Campbell, Castings, Butterworth Heinmann, London, 1991.[14] K. Ravindaran, R.W. Lewis, Finite element modelling of solidification effects in
mould filling, Finite Element in Analysis and Design 31 (1998) 99–116.[15] I. Im, W. Kim, K. Lee, A unified analysis of filling and solidification in casting
with natural convection, International Journal of Heat and Mass Transfer 44(2001) 1507–1515.
[16] Y.C. Lee, H.Y. Hwang, J.K. Choi, 2000, A study on application of solidificationand fluid flow simulation to die design in gravity die casting, in: P.R. Sahm, P.N.Hansen, J.G. Conley (eds.), Modelling of Casting, Welding and AdvancedSolidification Process IX, Aachen, Germany, pp. 349–356.
[17] Fluent 6.3.26 Documentation – User’s Guide and UDF Manual, Lebanon, USA,2005.
[18] S.V. Patankar, Numerical Heat Transfer and Fluid Flow, Hemisphere,Washington, DC, 1980.
[19] S. Chakraborty, P. Dutta, A generalized formulation for evaluation of latentheat functions in enthalpy-based macroscopic models for convection–diffusion phase change processes, Metallurgical and Materials Transactions B32 (2001) 562–564.